
download vol 9, no 3&4, year 2016 - IARIA Journals
230
-
Upload
khangminh22 -
Category
Documents
-
view
0 -
download
0
Transcript of download vol 9, no 3&4, year 2016 - IARIA Journals


The International Journal on Advances in Software is published by IARIA.
ISSN: 1942-2628
journals site: http://www.iariajournals.org
contact: [email protected]
Responsibility for the contents rests upon the authors and not upon IARIA, nor on IARIA volunteers,
staff, or contractors.
IARIA is the owner of the publication and of editorial aspects. IARIA reserves the right to update the
content for quality improvements.
Abstracting is permitted with credit to the source. Libraries are permitted to photocopy or print,
providing the reference is mentioned and that the resulting material is made available at no cost.
Reference should mention:
International Journal on Advances in Software, issn 1942-2628
vol. 9, no. 3 & 4, year 2016, http://www.iariajournals.org/software/
The copyright for each included paper belongs to the authors. Republishing of same material, by authors
or persons or organizations, is not allowed. Reprint rights can be granted by IARIA or by the authors, and
must include proper reference.
Reference to an article in the journal is as follows:
<Author list>, “<Article title>”
International Journal on Advances in Software, issn 1942-2628
vol. 9, no. 3 & 4, year 2016,<start page>:<end page> , http://www.iariajournals.org/software/
IARIA journals are made available for free, proving the appropriate references are made when their
content is used.
Sponsored by IARIA
www.iaria.org
Copyright © 2016 IARIA

International Journal on Advances in Software
Volume 9, Number 3 & 4, 2016
Editor-in-Chief
Luigi Lavazza, Università dell'Insubria - Varese, Italy
Editorial Advisory Board
Hermann Kaindl, TU-Wien, AustriaHerwig Mannaert, University of Antwerp, Belgium
Editorial Board
Witold Abramowicz, The Poznan University of Economics, PolandAbdelkader Adla, University of Oran, AlgeriaSyed Nadeem Ahsan, Technical University Graz, Austria / Iqra University, PakistanMarc Aiguier, École Centrale Paris, FranceRajendra Akerkar, Western Norway Research Institute, NorwayZaher Al Aghbari, University of Sharjah, UAERiccardo Albertoni, Istituto per la Matematica Applicata e Tecnologie Informatiche “Enrico Magenes” ConsiglioNazionale delle Ricerche, (IMATI-CNR), Italy / Universidad Politécnica de Madrid, SpainAhmed Al-Moayed, Hochschule Furtwangen University, GermanyGiner Alor Hernández, Instituto Tecnológico de Orizaba, MéxicoZakarya Alzamil, King Saud University, Saudi ArabiaFrederic Amblard, IRIT - Université Toulouse 1, FranceVincenzo Ambriola , Università di Pisa, ItalyAndreas S. Andreou, Cyprus University of Technology - Limassol, CyprusAnnalisa Appice, Università degli Studi di Bari Aldo Moro, ItalyPhilip Azariadis, University of the Aegean, GreeceThierry Badard, Université Laval, CanadaMuneera Bano, International Islamic University - Islamabad, PakistanFabian Barbato, Technology University ORT, Montevideo, UruguayPeter Baumann, Jacobs University Bremen / Rasdaman GmbH Bremen, GermanyGabriele Bavota, University of Salerno, ItalyGrigorios N. Beligiannis, University of Western Greece, GreeceNoureddine Belkhatir, University of Grenoble, FranceJorge Bernardino, ISEC - Institute Polytechnic of Coimbra, PortugalRudolf Berrendorf, Bonn-Rhein-Sieg University of Applied Sciences - Sankt Augustin, GermanyAteet Bhalla, Independent Consultant, IndiaFernando Boronat Seguí, Universidad Politecnica de Valencia, SpainPierre Borne, Ecole Centrale de Lille, FranceFarid Bourennani, University of Ontario Institute of Technology (UOIT), CanadaNarhimene Boustia, Saad Dahlab University - Blida, AlgeriaHongyu Pei Breivold, ABB Corporate Research, SwedenCarsten Brockmann, Universität Potsdam, GermanyAntonio Bucchiarone, Fondazione Bruno Kessler, ItalyGeorg Buchgeher, Software Competence Center Hagenberg GmbH, AustriaDumitru Burdescu, University of Craiova, RomaniaMartine Cadot, University of Nancy / LORIA, France

Isabel Candal-Vicente, Universidad del Este, Puerto RicoJuan-Vicente Capella-Hernández, Universitat Politècnica de València, SpainJose Carlos Metrolho, Polytechnic Institute of Castelo Branco, PortugalAlain Casali, Aix-Marseille University, FranceYaser Chaaban, Leibniz University of Hanover, GermanySavvas A. Chatzichristofis, Democritus University of Thrace, GreeceAntonin Chazalet, Orange, FranceJiann-Liang Chen, National Dong Hwa University, ChinaShiping Chen, CSIRO ICT Centre, AustraliaWen-Shiung Chen, National Chi Nan University, TaiwanZhe Chen, College of Computer Science and Technology, Nanjing University of Aeronautics and Astronautics, ChinaPRPo-Hsun Cheng, National Kaohsiung Normal University, TaiwanYoonsik Cheon, The University of Texas at El Paso, USALau Cheuk Lung, INE/UFSC, BrazilRobert Chew, Lien Centre for Social Innovation, SingaporeAndrew Connor, Auckland University of Technology, New ZealandRebeca Cortázar, University of Deusto, SpainNoël Crespi, Institut Telecom, Telecom SudParis, FranceCarlos E. Cuesta, Rey Juan Carlos University, SpainDuilio Curcio, University of Calabria, ItalyMirela Danubianu, "Stefan cel Mare" University of Suceava, RomaniaPaulo Asterio de Castro Guerra, Tapijara Programação de Sistemas Ltda. - Lambari, BrazilCláudio de Souza Baptista, University of Campina Grande, BrazilMaria del Pilar Angeles, Universidad Nacional Autonónoma de México, MéxicoRafael del Vado Vírseda, Universidad Complutense de Madrid, SpainGiovanni Denaro, University of Milano-Bicocca, ItalyNirmit Desai, IBM Research, IndiaVincenzo Deufemia, Università di Salerno, ItalyLeandro Dias da Silva, Universidade Federal de Alagoas, BrazilJavier Diaz, Rutgers University, USANicholas John Dingle, University of Manchester, UKRoland Dodd, CQUniversity, AustraliaAijuan Dong, Hood College, USASuzana Dragicevic, Simon Fraser University- Burnaby, CanadaCédric du Mouza, CNAM, FranceAnn Dunkin, Palo Alto Unified School District, USAJana Dvorakova, Comenius University, SlovakiaLars Ebrecht, German Aerospace Center (DLR), GermanyHans-Dieter Ehrich, Technische Universität Braunschweig, GermanyJorge Ejarque, Barcelona Supercomputing Center, SpainAtilla Elçi, Aksaray University, TurkeyKhaled El-Fakih, American University of Sharjah, UAEGledson Elias, Federal University of Paraíba, BrazilSameh Elnikety, Microsoft Research, USAFausto Fasano, University of Molise, ItalyMichael Felderer, University of Innsbruck, AustriaJoão M. Fernandes, Universidade de Minho, PortugalLuis Fernandez-Sanz, University of de Alcala, SpainFelipe Ferraz, C.E.S.A.R, BrazilAdina Magda Florea, University "Politehnica" of Bucharest, RomaniaWolfgang Fohl, Hamburg Universiy, GermanySimon Fong, University of Macau, Macau SAR

Gianluca Franchino, Scuola Superiore Sant'Anna, Pisa, ItalyNaoki Fukuta, Shizuoka University, JapanMartin Gaedke, Chemnitz University of Technology, GermanyFélix J. García Clemente, University of Murcia, SpainJosé García-Fanjul, University of Oviedo, SpainFelipe Garcia-Sanchez, Universidad Politecnica de Cartagena (UPCT), SpainMichael Gebhart, Gebhart Quality Analysis (QA) 82, GermanyTejas R. Gandhi, Virtua Health-Marlton, USAAndrea Giachetti, Università degli Studi di Verona, ItalyAfzal Godil, National Institute of Standards and Technology, USALuis Gomes, Universidade Nova Lisboa, PortugalDiego Gonzalez Aguilera, University of Salamanca - Avila, SpainPascual Gonzalez, University of Castilla-La Mancha, SpainBjörn Gottfried, University of Bremen, GermanyVictor Govindaswamy, Texas A&M University, USAGregor Grambow, University of Ulm, GermanyCarlos Granell, European Commission / Joint Research Centre, ItalyChristoph Grimm, University of Kaiserslautern, AustriaMichael Grottke, University of Erlangen-Nuernberg, GermanyVic Grout, Glyndwr University, UKEnsar Gul, Marmara University, TurkeyRichard Gunstone, Bournemouth University, UKZhensheng Guo, Siemens AG, GermanyIsmail Hababeh, German Jordanian University, JordanShahliza Abd Halim, Lecturer in Universiti Teknologi Malaysia, MalaysiaHerman Hartmann, University of Groningen, The NetherlandsJameleddine Hassine, King Fahd University of Petroleum & Mineral (KFUPM), Saudi ArabiaTzung-Pei Hong, National University of Kaohsiung, TaiwanPeizhao Hu, NICTA, AustraliaChih-Cheng Hung, Southern Polytechnic State University, USAEdward Hung, Hong Kong Polytechnic University, Hong KongNoraini Ibrahim, Universiti Teknologi Malaysia, MalaysiaAnca Daniela Ionita, University "POLITEHNICA" of Bucharest, RomaniaChris Ireland, Open University, UKKyoko Iwasawa, Takushoku University - Tokyo, JapanMehrshid Javanbakht, Azad University - Tehran, IranWassim Jaziri, ISIM Sfax, TunisiaDayang Norhayati Abang Jawawi, Universiti Teknologi Malaysia (UTM), MalaysiaJinyuan Jia, Tongji University. Shanghai, ChinaMaria Joao Ferreira, Universidade Portucalense, PortugalAhmed Kamel, Concordia College, Moorhead, Minnesota, USATeemu Kanstrén, VTT Technical Research Centre of Finland, FinlandNittaya Kerdprasop, Suranaree University of Technology, ThailandAyad ali Keshlaf, Newcastle University, UKNhien An Le Khac, University College Dublin, IrelandSadegh Kharazmi, RMIT University - Melbourne, AustraliaKyoung-Sook Kim, National Institute of Information and Communications Technology, JapanYoungjae Kim, Oak Ridge National Laboratory, USACornel Klein, Siemens AG, GermanyAlexander Knapp, University of Augsburg, GermanyRadek Koci, Brno University of Technology, Czech RepublicChristian Kop, University of Klagenfurt, AustriaMichal Krátký, VŠB - Technical University of Ostrava, Czech Republic

Narayanan Kulathuramaiyer, Universiti Malaysia Sarawak, MalaysiaSatoshi Kurihara, Osaka University, JapanEugenijus Kurilovas, Vilnius University, LithuaniaPhilippe Lahire, Université de Nice Sophia-Antipolis, FranceAlla Lake, Linfo Systems, LLC, USAFritz Laux, Reutlingen University, GermanyLuigi Lavazza, Università dell'Insubria, ItalyFábio Luiz Leite Júnior, Universidade Estadual da Paraiba,BrazilAlain Lelu, University of Franche-Comté / LORIA, FranceCynthia Y. Lester, Georgia Perimeter College, USAClement Leung, Hong Kong Baptist University, Hong KongWeidong Li, University of Connecticut, USACorrado Loglisci, University of Bari, ItalyFrancesco Longo, University of Calabria, ItalySérgio F. Lopes, University of Minho, PortugalPericles Loucopoulos, Loughborough University, UKAlen Lovrencic, University of Zagreb, CroatiaQifeng Lu, MacroSys, LLC, USAXun Luo, Qualcomm Inc., USAShuai Ma, Beihang University, ChinaStephane Maag, Telecom SudParis, FranceRicardo J. Machado, University of Minho, PortugalMaryam Tayefeh Mahmoudi, Research Institute for ICT, IranNicos Malevris, Athens University of Economics and Business, GreeceHerwig Mannaert, University of Antwerp, BelgiumJosé Manuel Molina López, Universidad Carlos III de Madrid, SpainFrancesco Marcelloni, University of Pisa, ItalyEda Marchetti, Consiglio Nazionale delle Ricerche (CNR), ItalyGerasimos Marketos, University of Piraeus, GreeceAbel Marrero, Bombardier Transportation, GermanyAdriana Martin, Universidad Nacional de la Patagonia Austral / Universidad Nacional del Comahue, ArgentinaGoran Martinovic, J.J. Strossmayer University of Osijek, CroatiaPaulo Martins, University of Trás-os-Montes e Alto Douro (UTAD), PortugalStephan Mäs, Technical University of Dresden, GermanyConstandinos Mavromoustakis, University of Nicosia, CyprusJose Merseguer, Universidad de Zaragoza, SpainSeyedeh Leili Mirtaheri, Iran University of Science & Technology, IranLars Moench, University of Hagen, GermanyYasuhiko Morimoto, Hiroshima University, JapanAntonio Navarro Martín, Universidad Complutense de Madrid, SpainFilippo Neri, University of Naples, ItalyMuaz A. Niazi, Bahria University, Islamabad, PakistanNatalja Nikitina, KTH Royal Institute of Technology, SwedenRoy Oberhauser, Aalen University, GermanyPablo Oliveira Antonino, Fraunhofer IESE, GermanyRocco Oliveto, University of Molise, ItalySascha Opletal, Universität Stuttgart, GermanyFlavio Oquendo, European University of Brittany/IRISA-UBS, FranceClaus Pahl, Dublin City University, IrelandMarcos Palacios, University of Oviedo, SpainConstantin Paleologu, University Politehnica of Bucharest, RomaniaKai Pan, UNC Charlotte, USAYiannis Papadopoulos, University of Hull, UK

Andreas Papasalouros, University of the Aegean, GreeceRodrigo Paredes, Universidad de Talca, ChilePäivi Parviainen, VTT Technical Research Centre, FinlandJoão Pascoal Faria, Faculty of Engineering of University of Porto / INESC TEC, PortugalFabrizio Pastore, University of Milano - Bicocca, ItalyKunal Patel, Ingenuity Systems, USAÓscar Pereira, Instituto de Telecomunicacoes - University of Aveiro, PortugalWilly Picard, Poznań University of Economics, PolandJose R. Pires Manso, University of Beira Interior, PortugalSören Pirk, Universität Konstanz, GermanyMeikel Poess, Oracle Corporation, USAThomas E. Potok, Oak Ridge National Laboratory, USAChristian Prehofer, Fraunhofer-Einrichtung für Systeme der Kommunikationstechnik ESK, GermanyEla Pustułka-Hunt, Bundesamt für Statistik, Neuchâtel, SwitzerlandMengyu Qiao, South Dakota School of Mines and Technology, USAKornelije Rabuzin, University of Zagreb, CroatiaJ. Javier Rainer Granados, Universidad Politécnica de Madrid, SpainMuthu Ramachandran, Leeds Metropolitan University, UKThurasamy Ramayah, Universiti Sains Malaysia, MalaysiaPrakash Ranganathan, University of North Dakota, USAJosé Raúl Romero, University of Córdoba, SpainHenrique Rebêlo, Federal University of Pernambuco, BrazilHassan Reza, UND Aerospace, USAElvinia Riccobene, Università degli Studi di Milano, ItalyDaniel Riesco, Universidad Nacional de San Luis, ArgentinaMathieu Roche, LIRMM / CNRS / Univ. Montpellier 2, FranceJosé Rouillard, University of Lille, FranceSiegfried Rouvrais, TELECOM Bretagne, FranceClaus-Peter Rückemann, Leibniz Universität Hannover / Westfälische Wilhelms-Universität Münster / North-German Supercomputing Alliance, GermanyDjamel Sadok, Universidade Federal de Pernambuco, BrazilIsmael Sanz, Universitat Jaume I, SpainM. Saravanan, Ericsson India Pvt. Ltd -Tamil Nadu, IndiaIdrissa Sarr, University of Cheikh Anta Diop, Dakar, Senegal / University of Quebec, CanadaPatrizia Scandurra, University of Bergamo, ItalyGiuseppe Scanniello, Università degli Studi della Basilicata, ItalyDaniel Schall, Vienna University of Technology, AustriaRainer Schmidt, Munich University of Applied Sciences, GermanyCristina Seceleanu, Mälardalen University, SwedenSebastian Senge, TU Dortmund, GermanyIsabel Seruca, Universidade Portucalense - Porto, PortugalKewei Sha, Oklahoma City University, USASimeon Simoff, University of Western Sydney, AustraliaJacques Simonin, Institut Telecom / Telecom Bretagne, FranceCosmin Stoica Spahiu, University of Craiova, RomaniaGeorge Spanoudakis, City University London, UKCristian Stanciu, University Politehnica of Bucharest, RomaniaLena Strömbäck, SMHI, SwedenOsamu Takaki, Japan Advanced Institute of Science and Technology, JapanAntonio J. Tallón-Ballesteros, University of Seville, SpainWasif Tanveer, University of Engineering & Technology - Lahore, PakistanErgin Tari, Istanbul Technical University, TurkeySteffen Thiel, Furtwangen University of Applied Sciences, Germany

Jean-Claude Thill, Univ. of North Carolina at Charlotte, USAPierre Tiako, Langston University, USABožo Tomas, HT Mostar, Bosnia and HerzegovinaDavide Tosi, Università degli Studi dell'Insubria, ItalyGuglielmo Trentin, National Research Council, ItalyDragos Truscan, Åbo Akademi University, FinlandChrisa Tsinaraki, Technical University of Crete, GreeceRoland Ukor, FirstLinq Limited, UKTorsten Ullrich, Fraunhofer Austria Research GmbH, AustriaJosé Valente de Oliveira, Universidade do Algarve, PortugalDieter Van Nuffel, University of Antwerp, BelgiumShirshu Varma, Indian Institute of Information Technology, Allahabad, IndiaKonstantina Vassilopoulou, Harokopio University of Athens, GreeceMiroslav Velev, Aries Design Automation, USATanja E. J. Vos, Universidad Politécnica de Valencia, SpainKrzysztof Walczak, Poznan University of Economics, PolandYandong Wang, Wuhan University, ChinaRainer Weinreich, Johannes Kepler University Linz, AustriaStefan Wesarg, Fraunhofer IGD, GermanyWojciech Wiza, Poznan University of Economics, PolandMartin Wojtczyk, Technische Universität München, GermanyHao Wu, School of Information Science and Engineering, Yunnan University, ChinaMudasser F. Wyne, National University, USAZhengchuan Xu, Fudan University, P.R.ChinaYiping Yao, National University of Defense Technology, Changsha, Hunan, ChinaStoyan Yordanov Garbatov, Instituto de Engenharia de Sistemas e Computadores - Investigação eDesenvolvimento, INESC-ID, PortugalWeihai Yu, University of Tromsø, NorwayWenbing Zhao, Cleveland State University, USAHong Zhu, Oxford Brookes University, UKQiang Zhu, The University of Michigan - Dearborn, USA

International Journal on Advances in Software
Volume 9, Numbers 3 & 4, 2016
CONTENTS
pages: 154 - 165Tacit and Explicit Knowledge in Software Development Projects: A Combined Model for AnalysisHanna Dreyer, University of Gloucestershire, UKMartin Wynn, University of Gloucestershire, UK
pages: 166 - 177Automatic KDD Data Preparation Using ParallelismYoussef Hmamouche, LIF, FranceChristian Ernst, none, FranceAlain Casali, LIF, France
pages: 178 - 189Business Process Model Customisation using Domain-driven Controlled Variability Management and RuleGenerationNeel Mani, Dublin City University, IrelandMarkus Helfert, Dublin City University, IrelandClaus Pahl, Free University of Bozen-Bolzano, Italy
pages: 190 - 205Automatic Information Flow Validation for High-Assurance SystemsKevin Mueller, Airbus Group, GermanySascha Uhrig, Airbus Group, GermanyFlemming Nielson, DTU Compute, DenmarkHanne Riis Nielson, DTU Compute, DenmarkXimeng Li, Technical University of Darmstadt, GermanyMichael Paulitsch, Thales Austria, AustriaGeorg Sigl, Technical University of Munich, Germany
pages: 206 - 220An Ontological Perspective on the Digital Gamification of Software Engineering ConceptsRoy Oberhauser, Aalen University, Germany
pages: 221 - 236Requirements Engineering in Model Transformation Development: A Technique Suitability Framework forModel Transformation ApplicationsSobhan Yassipour Tehrani, King's College London, U.K.Kevin Lano, King's College London, U.K.
pages: 237 - 246A Computational Model of Place on the Linked Data WebAlia Abdelmoty, Cardiff University, United KingdomKhalid Al-Muzaini, Cardiff University, United Kingdom
pages: 247 - 258A Model-Driven Engineering Approach to Software Tool Interoperability based on Linked DataJad El-khoury, KTH Royal Institute of Technology, SwedenDidem Gurdur, KTH Royal Institute of Technology, SwedenMattias Nyberg, Scania CV AB, Sweden

pages: 259 - 270Unsupervised curves clustering by minimizing entropy: implementation and application to air trafficFlorence Nicol, Ecole Nationale de l'Aviation Civile, FranceStéphane Puechmorel, Ecole Nationale de l'Aviation Civile, France
pages: 271 - 281An Approach to Automatic Adaptation of DAiSI Component InterfacesYong Wang, Department of Informatics, Technical University Clausthal, GermanyAndreas Rausch, Department of Informatics, Technical University Clausthal, Germany
pages: 282 - 302Implementing a Typed Javascript and its IDE: a case-study with XsemanticsLorenzo Bettini, Dip. Statistica, Informatica, Applicazioni, Univ. Firenze, ItalyJens von Pilgrim, NumberFour AG, Berlin, GermanyMark-Oliver Reiser, NumberFour AG, Berlin, Germany
pages: 303 - 321EMSoD — A Conceptual Social Framework that Delivers KM Values to Corporate OrganizationsChristopher Adetunji, University of Southampton, EnglandLeslie Carr, University of Southampton, England
pages: 322 - 332An Integrated Semantic Approach to Content Management in the Urban Resilience DomainIlkka Niskanen, Technical Research Centre of Finland, FinlandMervi Murtonen, Technical Research Centre of Finland, FinlandFrancesco Pantisano, Finmeccanica Company, ItalyFiona Browne, Ulster University, Northern Ireland, UKPeadar Davis, Ulster University, Northern Ireland, UKIvan Palomares, Queen’s University, Northern Ireland, UK
pages: 333 - 345Four Public Self-Service Applications: A Study of the Development Process, User Involvement and Usabilityin Danish public self-service applicationsJane Billestrup, Institute of Computer Science, Aalborg university, DenmarkMarta Larusdottir, Reykjavik University, IcelandJan Stage, Institute of Computer Science, Aalborg university, Denmark
pages: 346 - 357Using CASE Tools in MDA Transformation of Geographical Database SchemasThiago Bicalho Ferreira, Universidade Federal de Viçosa, BrasilJugurta Lisboa-Filho, Universidade Federal de Viçosa, BrasilSergio Murilo Stempliuc, Faculdade Governador Ozanan Coelho, Brasil
pages: 358 - 371Semi-Supervised Ensemble Learning in the Framework of Data 1-D Representations with Label BoostingJianzhong Wang, College of Sciences and Engineering Techonology, Sam Houston State University, USAHuiwu Luo, Faculty of Science and Technology, University of Macau, ChinaYuan Yan Tang, Faculty of Science and Technology, University of Macau, China

154
International Journal on Advances in Software, vol 9 no 3 & 4, year 2016, http://www.iariajournals.org/software/
2016, © Copyright by authors, Published under agreement with IARIA - www.iaria.org
Abstract – The development of new or updated software packages by software companies often involves the specification of new features and functionality required by customers, who may already be using a version of the software package. The on-going development and upgrade of such packages is the norm, and the effective management of knowledge in this process is critical to achieving successful enhancement of the package in line with customer expectations. Human interaction within the software development process becomes a key focus, and knowledge transfer an essential mechanism for delivering software to quality standards and within agreed timescales and budgetary constraints. This article focuses on the role and nature of knowledge within the context of software development, and puts forward a combined conceptual model to aid in the understanding of individual and group tacit knowledge in this business and operational environment.
Keywords – software development; tacit knowledge; explicit knowledge; project management; knowledge management; conceptual model.
I. INTRODUCTION
Knowledge management, and more specifically the relationship between tacit and explicit knowledge, has been the focus of some recent research studies looking specifically at the software development process [1] [2]. Tacit knowledge is difficult to articulate but is, according to Polanyi [3], the root of all knowledge, which is then transformed into explicit, articulated knowledge. The process of tacit to explicit knowledge transformation is therefore a key component of software development projects. This article constructs a model that combines elements from other studies, showing how tacit knowledge is acquired and shared from both a group and an individual perspective. It thus provides a connection between existing theories of tacit and explicit knowledge in the workplace, and suggests a way in which teams can focus on this process for their mutual benefit. McAfee [4] discussed the importance of interpretation within software projects and the dangers of misunderstandings arising from incorrect analysis. Such misconceptions can be explicit as well as tacit, but, generally speaking, in software development, the majority of knowledge is tacit. Ryan [5] states that “knowledge sharing is a key process in developing software products, and since expert knowledge is
mostly tacit, the acquisition and sharing of tacit knowledge …. are significant in the software development process.” When there are several parties involved in a project, with each being an expert in their field, the process and momentum of knowledge sharing and its acquisition for onward development is critical to project success. In addition, de Souza et al. [6] argue that the management of knowledge in a software development project is crucial for its capability to deal with the coordination and integration of several sources of knowledge, while often struggling with budgetary constraints and time pressures. Individual and group knowledge are essential to a project. Individual knowledge within a group is the expertise one can share. Essentially, expert knowledge is mainly tacit, and needs to be shared explicitly within the group to positively influence project outcomes. Polanyi [3] has noted that “we can know more than we can tell,” which makes it more difficult for experts to transfer their knowledge to other project actors. To comprehend the transfer of tacit knowledge within a project group, both individual and group knowledge need to be analysed and evaluated. The study of the main players, and the people they interact with, can identify the key knowledge bases within a group. In a software development project group, this will allow a better understanding and management of how information is shared and transferred. This paper comprises seven sections. The relevant basic concepts that constitute the underpinning theoretical framework are discussed next, and two main research questions are stated. The research methodology is then outlined (Section III), and the main models relevant to this research are discussed and explained in Section IV. Section V then discusses how these models were applied and developed through field research and Section VI combines elements of these models into a framework for understanding the transfer of tacit knowledge from an individual and group perspective. Finally, the concluding section pulls together the main themes discussed in the paper and addresses the research questions.
Tacit and Explicit Knowledge in Software Development. Projects:
A Combined Model for Analysis
Hanna Dreyer Martin Wynn The Business School School of Computing and Technology University of Gloucestershire University of Gloucestershire Cheltenham, UK Cheltenham, UK [email protected] [email protected]
155
International Journal on Advances in Software, vol 9 no 3 & 4, year 2016, http://www.iariajournals.org/software/
2016, © Copyright by authors, Published under agreement with IARIA - www.iaria.org
II. THEORETICAL FRAMEWORK Knowledge helps the understanding of how something works and is, at its core, a collection of meaningful data put into context. There are two strategies to manage knowledge within a company, codification – making company knowledge available through systemizing and storing information – and personalization – centrally storing sources of knowledge within a company, to help gain access to information from experts [7]. This article mainly focuses on personalisation, and on how knowledge is passed on from one source to the next. Knowledge does not have a physical form, but rather remains an intellectual good, which can be difficult to articulate and cannot be touched. Tacit knowledge - non-articulated knowledge - is the most difficult to grasp. According to Berger and Luckmann [8], knowledge is created through social, face-to-face interaction and a shared reality. It commences with individual, expert, tacit knowledge, which can then be made into explicit knowledge. Social interaction is one of the most flourishing environments for tacit knowledge transfer. Through a direct response from the conversation partner, information can be directly put into context by the receiver and processed in order to enrich their individual knowledge. This interplay in social interactions can build group tacit knowledge, making it easier to ensure a common knowledge base. Advocating the conversion of tacit into explicit knowledge, Nonaka and Takeuchi [9] view tacit knowledge as the root of all knowledge. A person’s knowledge base greatly influences the position an actor has within a group during a project. The effectiveness the actor possesses to transform their expert, tacit, knowledge into explicit knowledge determines how central the actor is within the group, and whether the group can work effectively and efficiently. Transferring human knowledge is one of the greatest challenges in today’s society because of its inaccessibility. Being able to transfer tacit knowledge is not a matter of course - how to best conceptualize and formalise tacit knowledge remains a debate amongst researchers. Tacit knowledge is personal knowledge, which is not articulated, but is directly related to one’s performance. Swan et al. [10] argue that “if people working in a group don’t already share knowledge, don’t already have plenty of contact, don’t already understand what insights and information will be useful to each other, information technology is not likely to create it.” Communication within a software development project is thus crucial for its success. Assessing vocalized tacit knowledge remains a field which is yet to be fully explored.
Nonaka and Takeuchi [9] conceptualize knowledge as being a continuous, self-transcending process, allowing individuals as well as groups to alter one’s self into a new self, whose world view and knowledge has grown. Knowledge is information put into context, where the context is crucial to make a meaningful basis. “Without context, it is just information, not knowledge” [9]. Within a software development project, raw information does not aid project success; only when put in a meaningful context and evaluated can it do so. In a corporate context, to achieve competitive advantage, a large knowledge base is often viewed as a key asset. The interplay between individual, group and organizational knowledge allows actors to develop a common understanding. However, according to Schultze and Leidner [11] knowledge can be a double edged sword, where not enough can lead to expensive mistakes and too much to unwanted accountability. By differentiating between tangible and intangible knowledge assets, one can appreciate that there is a myriad of possible scenarios for sharing and transferring knowledge. Emails, briefs, telephone calls or formal as well as informal meetings, all come with advantages and disadvantages relating to the communication, storage, utilization and transfer of the shared knowledge. For the analysis of the roles played by different actors within a group, social network analysis [12] can be used to further understand the relationships formed between several actors. Key actors are central to the understanding of the origin of new ideas or technologies used by a group [13]. Within a software development project, a new network or group is formed in order to achieve a pre-determined goal. The interplay between the different actors is therefore critical to understanding the knowledge flow throughout the project. The Office of Government Commerce defines a project as “a temporary organization that is needed to produce a unique and pre-defined outcome or result, at a pre-specified time, using predetermined resources” [14]. The time restrictions normally associated with all projects limits the time to understand and analyse the explicit and tacit knowledge of the people involved. The clearly defined beginning and ending of a project challenges the transfer of knowledge and the freedom to further explore and evaluate information. Having several experts in each field within a project scatters the knowledge, and highlights the need for a space to exchange and build knowledge within the group. Software development project teams are a group of experts coming together in order to achieve a pre-determined goal. The skills of each group member must complement the others in order to achieve

156
International Journal on Advances in Software, vol 9 no 3 & 4, year 2016, http://www.iariajournals.org/software/
2016, © Copyright by authors, Published under agreement with IARIA - www.iaria.org
project success. Ryan [5] argues that group member familiarity, as well as the communication frequency and volume, are “task characteristics of interdependence, cooperative goal interdependence and support for innovation;” and that these are critical in software development groups in engendering the sharing of tacit knowledge. Faith and comfort in one another is essential to ensure group members transfer personal experience and knowledge with team mates. Tacit knowledge transfer in software development is central to the success of the project [15]. Researchers may argue about how effective the transfer of knowledge may be, but most agree on the importance and impact it has on project outcomes [16]. Communication issues are one of the key causes of project failure, where meaningful knowledge exchange is impaired. Furthermore, once a project is completed, the infrastructure built around a project is usually dismantled, and there is a risk that knowledge produced through it may be degraded or lost altogether. When completing a project, the effective storage and processing of lessons learned throughout the project, as well as the produced knowledge, can act as a platform for improved knowledge exchange and overall outcomes in subsequent projects. A significant amount of knowledge in software development projects is transferred through virtual channels such as e-mails, or virtual message boards, and the flow of knowledge has greatly changed in the recent past. Much of the produced knowledge is not articulated, which can lead to misconceptions and misunderstanding. This can be exacerbated in a software development environment, because of time limitations and the need for quick responses to change requests and software bug fixing. In this context, this research seeks to answer the following research questions (RQs): RQ1: How can tacit and explicit knowledge be recognised and evaluated in software development projects? RQ2: Can tacit and explicit knowledge be better harnessed through the development of a combined model for use in software development projects?
III. METHODOLOGY
This research focuses on the identification of tacit knowledge exchange within a software development project, and aims to understand the interplay between individual and group tacit knowledge. A shared understanding between the main players and stakeholders is essential for a software development project as it is essentially a group activity [17]. Using a case study approach, the research is mainly inductive and exploratory, with a strong qualitative
methodology. Validating the composition of several models, the aim is to understand the tacit knowledge flow in software development projects, and specifically in key meetings. Subjectivism will form the basis of the philosophical understanding, while interpretivism will be the epistemological base. The aim is to show the topic in a new way, albeit building on existing models and concepts. Through data collection and analysis in a specific case study of software development, a model to understand the interplay between individual and group tacit knowledge is developed. The data is largely generated through unstructured interviews, and in project meetings, where the growth of knowledge has been recorded and assessed in great detail. This demands a narrative evaluation of the generated data and is therefore subject to interpretation of the researchers [18]. Participant observation and personal reflection also take part in forming and contextualizing the data. As knowledge is qualitative at its core, textual analysis can also aid in the understanding and interpretation of meetings. Expert knowledge is sometimes worked on between group meetings, to be made explicit and exchanged within meetings. Current models can help in evaluating exchanged knowledge within meetings. As knowledge does not have a physical form, the information generated throughout the meetings needs to be evaluated in a textual form. The data generated from the meetings has helped develop an understanding of tacit knowledge within the software development project and its relationship to individual and group tacit knowledge. Different expert groups can have a major influence in determining the flow of knowledge in a project. The data was collected over a three month period and amounts to approximately 30 hours of meetings. The data collection was project based and focused on the key people involved in the project. In total, there were ten people working on the project (the “project team”) - four core team members who were present at most of the meetings, two executives (one of which was the customer, the other the head of the HR consultancy company) and one programmer. These were the players who had most influence on the project, hence the focus of most of the data was on them. The meetings were “sit downs” - usually between project team members and two of the HR consultants and a software development consultant. During these meetings, programmers joined for certain periods, and there were conference calls with the client and the head of the HR consultancy firm. The topics discussed in the meetings were evaluated and contextualized, in order to analyse the knowledge exchange throughout the meetings. The

157
International Journal on Advances in Software, vol 9 no 3 & 4, year 2016, http://www.iariajournals.org/software/
2016, © Copyright by authors, Published under agreement with IARIA - www.iaria.org
data was evaluated systematically, where first the meetings were transcribed, then ordered according to topic. They were then categorized according to the theories of Nonaka, Ryan and Clarke. The first round of categorization mainly focused on topics discussed during the meetings and whether there was evidence of tacit knowledge surfacing. The second-round assembled related topics and transcribed the conversations. During this process, evidence of constructive learning, group tacit knowledge, individual knowledge, tacit knowledge triggers, as well as decision making, was searched for. The transcribed meetings were then organized in relation to the previously found evidence (constructive learning, group tacit knowledge etc.). Within this categorization, the meetings were still also classified by topic. Finally, during the last round of data evaluation, recall decisions and various triggers (visual, conversational, recall, constructive learning and anticipation) were searched for and identified. Data analysis has supported the construction and testing of a model representing individual and group tacit knowledge. Personal reflection and constant validation of the data aim at eliminating bias in the interpretation of results. In summary, the main elements of the research method and design are: 1. Qualitative exploratory research 2. Inductive research 3. Participant observation 4. Personal reflection 5. Unstructured interviews This approach assumes that it is feasible and sensible to cumulate findings and generalize results to create new knowledge. The data collected is based on one project where knowledge passed from one group member to the other has been evaluated. The concepts of tacit and explicit knowledge are analyzed in a primary research case study. A key assumption is that there is a “trigger” that acts as a catalyst for the recall and transfer of different knowledge elements, and this is examined in the software development project context. These triggers are then related to previous findings in the data. The exchange of tacit knowledge over time, from a qualitative perspective within one project, allows the analysis of group members using previously gained knowledge from one another and its usage within the group.
IV. RELEVANT MODELS IN EXISTING LITERATURE This research focuses on knowledge exchange in software development and aims to help future researchers analyse the impact of knowledge on project outcomes. It attempts to shed light on how
knowledge builds within a group which can aid project success. This is done by creating a framework to represent the knowledge flow, from both an individual and a group perspective; but its foundations are found in existing theory and related models, and this section provides an overview of these. Companies share space and generally reinforce relationships between co-workers, which is the foundation for knowledge creation. These relationships are formed in different scenarios throughout the work day. Some of the knowledge is formed through informal channels, such as a discussion during a coffee break, or more formally through e-mails or meetings. When such exchanges occur, whether knowledge be explicit or tacit, the “Ba” concept developed by Nonaka and Teece [19] provides a useful basis for analysis. “Ba” is conceived of as a fluid continuum where constant change and transformation results in new levels of knowledge. Although it is not tangible, its self-transcending nature allows knowledge evolution on a tacit level. Through social interaction, knowledge is externalized and can be processed by the actors involved. It is not a set of facts and figures, but rather a mental ongoing dynamic process between actors, allied to their capability to transfer knowledge in a meaningful manner. “Ba” is the space for constructive learning, transferred through mentoring, modeling and experimental inputs, which spark and build knowledge. The creation of knowledge is not a definitive end result, but more an ongoing process. Nonaka and Teece [19] differentiate between four different elements of “Ba” - originating, dialoging, systemizing and exercising. Individual and face-to-face interactions are the basis of originating “Ba”. Experience, emotions, feelings, and mental models are shared, hence the full range of physical senses and psycho-emotional reactions are in evidence. These include care, love, trust, and commitment, allowing tacit knowledge to be shared in the context of socialization. Dialoguing “Ba” concerns our collective and face-to-face interactions, which enable mental models and skills to be communicated to others. This produces articulated concepts, which can then be used by the receiver to self-reflect. A mix of specific knowledge and capability to manage the received knowledge is essential to consciously construct, rather than to originate, new knowledge. Collective and virtual interactions are often found in systemising “Ba”. Tools and infrastructure, such as online networks, groupware, documentation and databanks, offer a visual and/or written context for the combination of existing explicit knowledge, whereby knowledge can easily be transmitted to a large number of people.

158
International Journal on Advances in Software, vol 9 no 3 & 4, year 2016, http://www.iariajournals.org/software/
2016, © Copyright by authors, Published under agreement with IARIA - www.iaria.org
Finally, exercising “Ba” allows individual and virtual interaction, which is often communicated through virtual media, written manuals or simulation programs. Nonaka and Teece [19] contrast exercising and dialoguing “Ba” thus: “exercising ‘Ba’ synthesizes the transcendence and reflection that come in action, while dialoguing ‘Ba’ achieves this via thought.” The ongoing, spiraling, process of “Ba” gives co-workers the ability to comprehend and combine knowledge in order to complete the task at hand. Establishing “Ba” as the basis of a combined model provides a secure framework anchored in existing theory, within which knowledge can be classified and understood. From the “Ba” model of knowledge creation, Nonaka and Teece [19] developed the SECI concepts to further understand the way knowledge moves across and is created by organizations. SECI – Socialization, Externalization, Combination and Internalization – are the four pillars of knowledge exchange within an organization (Figure 1). They represent a spiral of knowledge creation, which can be repeated infinitively, enabling knowledge to be expanded horizontally as well as vertically across an organization. This links back to the earlier discussion of tacit and explicit knowledge, as the four sections of the SECI model represent different types of knowledge transfer - tacit to tacit, tacit to explicit, explicit to tacit and explicit to explicit. Socialization is the conversion of tacit to tacit knowledge through shared experiences, normally characterized by learning by doing, rather than consideration of theoretical concepts. Externalization is the process of converting tacit to explicit knowledge, where a person articulates knowledge and shares it with others, in order to create a basis for new knowledge in a group. Combination is the process of converting explicit knowledge sets into more complex explicit knowledge. Internalization is the process of integrating explicit knowledge to make it one’s own tacit knowledge. It is the counter part of socialization, and this internal knowledge base in a person can set off a new spiral of knowledge, where tacit knowledge can be converted to explicit and combined with more complex knowledge. The SECI model suggests that in a corporate environment, knowledge can spiral horizontally (across departments and the organization as a whole) as well as vertically (up and down management hierarchies). As we are focusing mainly on tacit knowledge, combination will not be part of the adopted model, due to its purely explicit knowledge focus. SECI helps us view the general movements of knowledge creation and exchange within companies. Ryan’s Theoretical Model for the Acquisition and Sharing of Tacit Knowledge in Teams (TMTKT) [5]
[20] is also of relevance. Through a quantitative research approach, Ryan analyses the movement of knowledge within a group and the moment of its creation. Beginning with current team tacit knowledge, constructive learning enhances individual knowledge, which can then again be shared within the team in order to build up what Ryan terms the “transactive memory”, which is a combination of specialization, credibility and coordination, resulting in a new amplified team tacit knowledge. This new team knowledge then begins again, in order to elevate the knowledge within the group in a never ending spiral of knowledge generation. When developing the TMTKT, Ryan made several assumptions. First, team tacit knowledge would reflect domain specific practical knowledge, which differentiates experts from novices. Secondly,
Figure 1. The Socialization, Externalization, Combination and
Internalization (SECI) model [19]
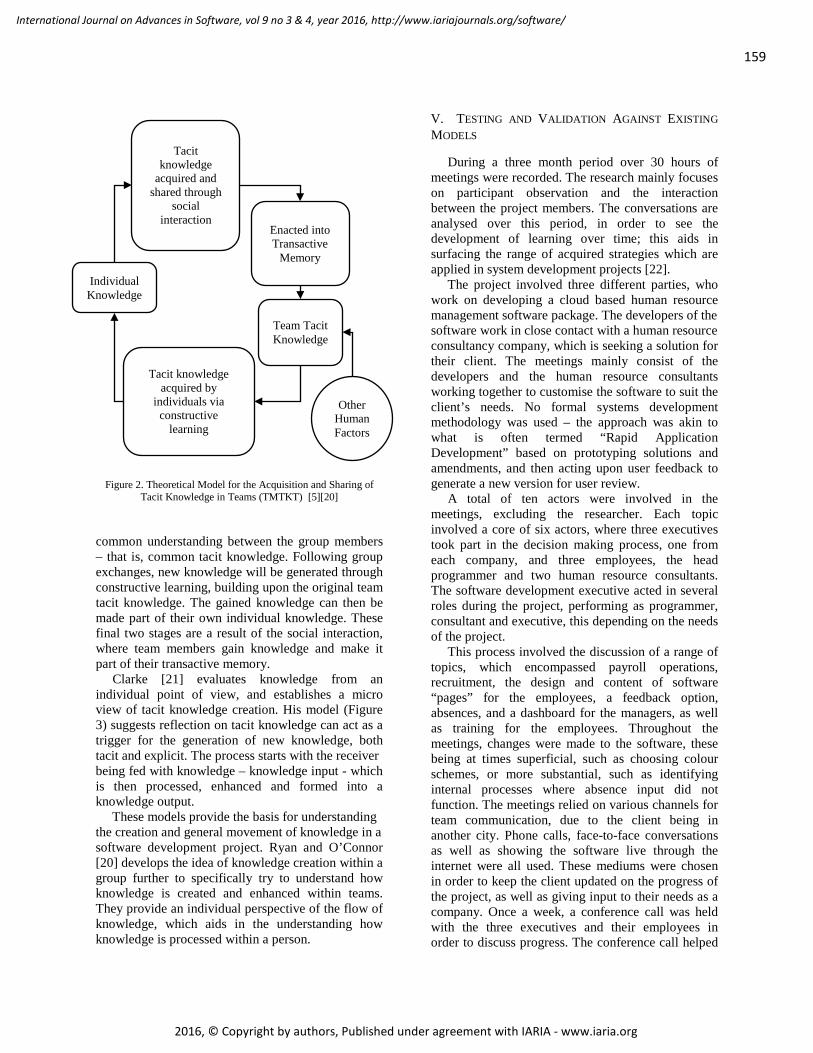
the TMTKT needs to measure the tacit knowledge of the entire team, taking the weight of individual members into account. Finally, only tacit knowledge at the articulate level of abstraction can be taken into account. The model (Figure 2) comprises five main components or stages in the development of tacit knowledge: 1. Team tacit knowledge (existing) 2. Tacit knowledge is then acquired by individuals via constructive learning 3. This then becomes individual tacit knowledge 4. Tacit knowledge is then acquired through social interaction 5. Finally, the enactment of tacit knowledge into the the transactive memory takes place. The starting point for understanding this process is to assess existing team tacit knowledge - this is their own individual tacit knowledge, but also includes any
159
International Journal on Advances in Software, vol 9 no 3 & 4, year 2016, http://www.iariajournals.org/software/
2016, © Copyright by authors, Published under agreement with IARIA - www.iaria.org
Figure 2. Theoretical Model for the Acquisition and Sharing of
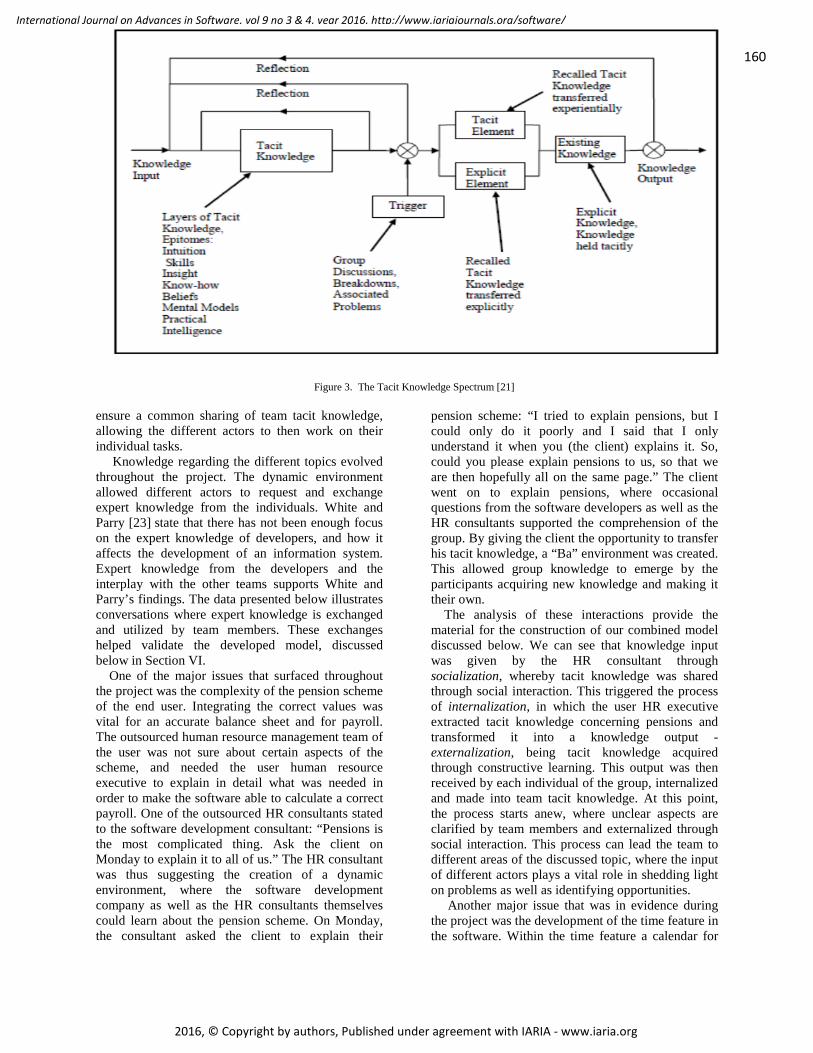
Tacit Knowledge in Teams (TMTKT) [5][20] common understanding between the group members – that is, common tacit knowledge. Following group exchanges, new knowledge will be generated through constructive learning, building upon the original team tacit knowledge. The gained knowledge can then be made part of their own individual knowledge. These final two stages are a result of the social interaction, where team members gain knowledge and make it part of their transactive memory. Clarke [21] evaluates knowledge from an individual point of view, and establishes a micro view of tacit knowledge creation. His model (Figure 3) suggests reflection on tacit knowledge can act as a trigger for the generation of new knowledge, both tacit and explicit. The process starts with the receiver being fed with knowledge – knowledge input - which is then processed, enhanced and formed into a knowledge output. These models provide the basis for understanding the creation and general movement of knowledge in a software development project. Ryan and O’Connor [20] develops the idea of knowledge creation within a group further to specifically try to understand how knowledge is created and enhanced within teams. They provide an individual perspective of the flow of knowledge, which aids in the understanding how knowledge is processed within a person.
V. TESTING AND VALIDATION AGAINST EXISTING MODELS
During a three month period over 30 hours of meetings were recorded. The research mainly focuses on participant observation and the interaction between the project members. The conversations are analysed over this period, in order to see the development of learning over time; this aids in surfacing the range of acquired strategies which are applied in system development projects [22]. The project involved three different parties, who work on developing a cloud based human resource management software package. The developers of the software work in close contact with a human resource consultancy company, which is seeking a solution for their client. The meetings mainly consist of the developers and the human resource consultants working together to customise the software to suit the client’s needs. No formal systems development methodology was used – the approach was akin to what is often termed “Rapid Application Development” based on prototyping solutions and amendments, and then acting upon user feedback to generate a new version for user review. A total of ten actors were involved in the meetings, excluding the researcher. Each topic involved a core of six actors, where three executives took part in the decision making process, one from each company, and three employees, the head programmer and two human resource consultants. The software development executive acted in several roles during the project, performing as programmer, consultant and executive, this depending on the needs of the project. This process involved the discussion of a range of topics, which encompassed payroll operations, recruitment, the design and content of software “pages” for the employees, a feedback option, absences, and a dashboard for the managers, as well as training for the employees. Throughout the meetings, changes were made to the software, these being at times superficial, such as choosing colour schemes, or more substantial, such as identifying internal processes where absence input did not function. The meetings relied on various channels for team communication, due to the client being in another city. Phone calls, face-to-face conversations as well as showing the software live through the internet were all used. These mediums were chosen in order to keep the client updated on the progress of the project, as well as giving input to their needs as a company. Once a week, a conference call was held with the three executives and their employees in order to discuss progress. The conference call helped
Tacit knowledge
acquired and shared through
social interaction
Enacted into Transactive
Memory
Team Tacit Knowledge
Tacit knowledge acquired by
individuals via constructive
learning
Individual Knowledge
Other Human Factors
160
International Journal on Advances in Software, vol 9 no 3 & 4, year 2016, http://www.iariajournals.org/software/
2016, © Copyright by authors, Published under agreement with IARIA - www.iaria.org
ensure a common sharing of team tacit knowledge, allowing the different actors to then work on their individual tasks. Knowledge regarding the different topics evolved throughout the project. The dynamic environment allowed different actors to request and exchange expert knowledge from the individuals. White and Parry [23] state that there has not been enough focus on the expert knowledge of developers, and how it affects the development of an information system. Expert knowledge from the developers and the interplay with the other teams supports White and Parry’s findings. The data presented below illustrates conversations where expert knowledge is exchanged and utilized by team members. These exchanges helped validate the developed model, discussed below in Section VI. One of the major issues that surfaced throughout the project was the complexity of the pension scheme of the end user. Integrating the correct values was vital for an accurate balance sheet and for payroll. The outsourced human resource management team of the user was not sure about certain aspects of the scheme, and needed the user human resource executive to explain in detail what was needed in order to make the software able to calculate a correct payroll. One of the outsourced HR consultants stated to the software development consultant: “Pensions is the most complicated thing. Ask the client on Monday to explain it to all of us.” The HR consultant was thus suggesting the creation of a dynamic environment, where the software development company as well as the HR consultants themselves could learn about the pension scheme. On Monday, the consultant asked the client to explain their
pension scheme: “I tried to explain pensions, but I could only do it poorly and I said that I only understand it when you (the client) explains it. So, could you please explain pensions to us, so that we are then hopefully all on the same page.” The client went on to explain pensions, where occasional questions from the software developers as well as the HR consultants supported the comprehension of the group. By giving the client the opportunity to transfer his tacit knowledge, a “Ba” environment was created. This allowed group knowledge to emerge by the participants acquiring new knowledge and making it their own. The analysis of these interactions provide the material for the construction of our combined model discussed below. We can see that knowledge input was given by the HR consultant through socialization, whereby tacit knowledge was shared through social interaction. This triggered the process of internalization, in which the user HR executive extracted tacit knowledge concerning pensions and transformed it into a knowledge output - externalization, being tacit knowledge acquired through constructive learning. This output was then received by each individual of the group, internalized and made into team tacit knowledge. At this point, the process starts anew, where unclear aspects are clarified by team members and externalized through social interaction. This process can lead the team to different areas of the discussed topic, where the input of different actors plays a vital role in shedding light on problems as well as identifying opportunities. Another major issue that was in evidence during the project was the development of the time feature in the software. Within the time feature a calendar for
Figure 3. The Tacit Knowledge Spectrum [21]

161
International Journal on Advances in Software, vol 9 no 3 & 4, year 2016, http://www.iariajournals.org/software/
2016, © Copyright by authors, Published under agreement with IARIA - www.iaria.org
sick leave, holidays or paternity was added. This was linked to the payroll since it was vital to know how much people get paid during which period. The interaction of the payroll and time in the software was very difficult to program. This part of the software was therefore explained by the programming executive, to make sure all needs of the customer were met. Here, the focus shifted to the HR consultants and the programmers. The end user was not involved in this process, since no expertise was needed and the user’s main requirement was simply for it to work. The software consultant took a step aside, since this was not part of their expertise, and advised the software programmers to make sure the exchanged information was accurate. During the conversation not only were questions asked by the HR consultants, but also from the software development consultants. The programmer explained time and the time sheets, and during this discussion a knowledge exchange between the three parties created a dynamic environment, where group tacit knowledge was created. Programmer: “We only want them to add days into the calendar where they should have been actually working – so that we can calculate the genuine days of holiday or leave. So if they are not due to work on a Monday, you don't want to count this as leave on a Monday. So it will only be inserted according to their working pattern.” Software consultant: “So the time sheet and calendar do the same thing?” Programmer: “Yes, you choose against the service item, if the item should go into the calendar; so what will happen? - it will insert everything into the time sheet but then it will pick and choose which ones go into the calendar and which into the time sheet. So holidays will go into the calendar, but not go into the time sheet.” Software consultant: “You have a calendar in activities, which might show that a person is on holiday from x to y.” HR consultant: “But you might not want someone to know they are on maternity leave.” Software consultant: “But the time sheet is only working days, so you've got both options.” The conversation above demonstrates the process of knowledge input, internalization, output, group tacit knowledge as well as knowledge surfacing through a dynamic knowledge exchange. The programmer explains time sheets, which is then internalized by the software consultant, this then triggers a question, which leads to knowledge output. The programmer internalizes the question and creates a response through socialization. The spiral continues within the dynamic environment, and paves the way
for knowledge to surface and to be used as well as internalized by the members of the team. Throughout the analysis of the data this pattern of knowledge input, internalization and output was in evidence. This points to the significance of knowledge triggers to better understand the overall decision making process.
VI. TOWARDS A COMBINED CONCEPTUAL MODEL Building on the previous section, this section now examines how the theories of Nonaka, Ryan, and Clarke can be utilised in a new combined model which demonstrates how knowledge is created and built upon within a company at a group, as well as individual, level. The “Ba” concepts of Nonaka’s SECI model provide the background framework that defines the dynamic space within which knowledge is created, although as noted above, the combination element is not used here as it deals exclusively with explicit knowledge (Figure 4). We will use the acronym SEI (rather than SECI) in the specific context of the combined model discussed in this section. The SEI concepts demonstrate the movement of knowledge, which can be continuously developed. Ryan’s TMTKT uses elements which overlap with Nonaka’s SECI model. When combining the two an overlap in the processes can be found, although a more detailed view is provided by Ryan. When
Figure 4. Three elements of SECI used in the conceptual model
analysing Nonaka’s SECI, the process of internalization is explained in one step, unlike Ryan, who divides it into two steps rather than one. The internalization process is seen by Ryan as individual knowledge, which is then enacted into transactive memory, representing a deeper conceptualization of how people combine and internalize tacit knowledge. According to the “Ba” concept, continuous knowledge creation is established within a dynamic environment, which supports the development of knowledge as it evolves from one stage to another. Figure 5 depicts how tacit knowledge is created, shared and internalized. Socialization indicates social
Ba Environement
Socialization Externalization
Internalization

162
International Journal on Advances in Software, vol 9 no 3 & 4, year 2016, http://www.iariajournals.org/software/
2016, © Copyright by authors, Published under agreement with IARIA - www.iaria.org
interaction, where knowledge is acquired and shared through social interaction. Internalization entails making the knowledge one’s own and combining it with previous knowledge, it being committed to transactive memory. Finally, externalization is knowledge acquired through constructive learning. Ryan’s model focuses on tacit knowledge from a team perspective. The last elements of the constructed model come from Clarke’s Tacit Knowledge Spectrum [21]. This helps develop Nonaka’s internalization process from a personal perspective. It provides a focus on one member of the team to complement Nonaka and Ryan’s team perspective. Knowledge input commences the process, and different stages of knowledge intake make the knowledge individual knowledge. This focus on individual knowledge is encompassed in the internalization and enacted transactive memory stages of Nonaka’s and Ryan’s models, but it is treated in less detail. Clarke’s tacit knowledge spectrum commences with knowledge input, which is transformed into tacit knowledge. This tacit knowledge is then processed through reflection and at times, due to triggers such as additional information, the reflection process needs to be repeated in order to reveal new layers of tacit knowledge. The tacit and explicit elements permit additional layers of individual knowledge to be revealed, which can be through both explicit and tacit channels. Finally the new knowledge becomes part of the individual’s existing knowledge. Existing knowledge can then once again be transferred into a knowledge output (Figure 3).
Figure 5. Combined elements of “Ba”, SEI and TMTKT models.
Table I notes the main elements of the 3 approaches of Nonaka, Clarke and Ryan that are combined in the model used for case study analysis. At the macro level are Nonaka’s concepts of “Ba”, SEI and the spiral of knowledge. Ryan’s model provides a group tacit knowledge perspective, complemented by Clarke’s focus on the micro, individual knowledge generation process. The internalization and the socialization processes can involve both input and output, depending on the individual’s point of knowledge acquisition – student or teacher.
Nonaka’s concept of “Ba” and its dynamic environment to support the exchange of knowledge provides the basis for a combined model, which we term the Individual and Group Tacit Knowledge Spiral (IGTKS). His theories also outline the different steps of the model, using socialization and externalization as knowledge in-and outputs, and the internalization process which represents individual knowledge. Clarke’s model provides a more detailed view of the internalization process, which has been simplified somewhat in the combined model, concentrating on the trigger points, the reflection process and the enhancement of existing knowledge. Finally, Ryan’s team tacit knowledge creates a point of “common knowledge” between the team members. The combined model (Figure 6) aims to represent the process of continuous knowledge creation and exchange in a software development project team. The internalization process is an edited version of
Nonaka Ryan Clarke Socialization tacit to tacit
Tacit knowledge acquired and shared through social interaction.
Knowledge in- and output.
Externalization tacit to explicit
Tacit knowledge acquired by individuals through constructive learning.
Knowledge in- and output
Internalization explicit to tacit
Individual knowledge / Enacted into transactive memory.
Process of acquiring and processing tacit knowledge (reflection – trigger – tacit and/or explicit element – existing knowledge)
Ba Environement
Socialization Tacit knowledge
acquired and shared through social
interaction.
Externalization Tacit knowledge
acquired by individuals through
constructive learning.
Internalization Individual
knowledge / Enacted into transactive
memory.
TABLE I. ELEMENTS OF THE MODELS OF RYAN, CLARKE AND NONAKA USED IN THE COMBINED IGTKS MODEL
163
International Journal on Advances in Software, vol 9 no 3 & 4, year 2016, http://www.iariajournals.org/software/
2016, © Copyright by authors, Published under agreement with IARIA - www.iaria.org
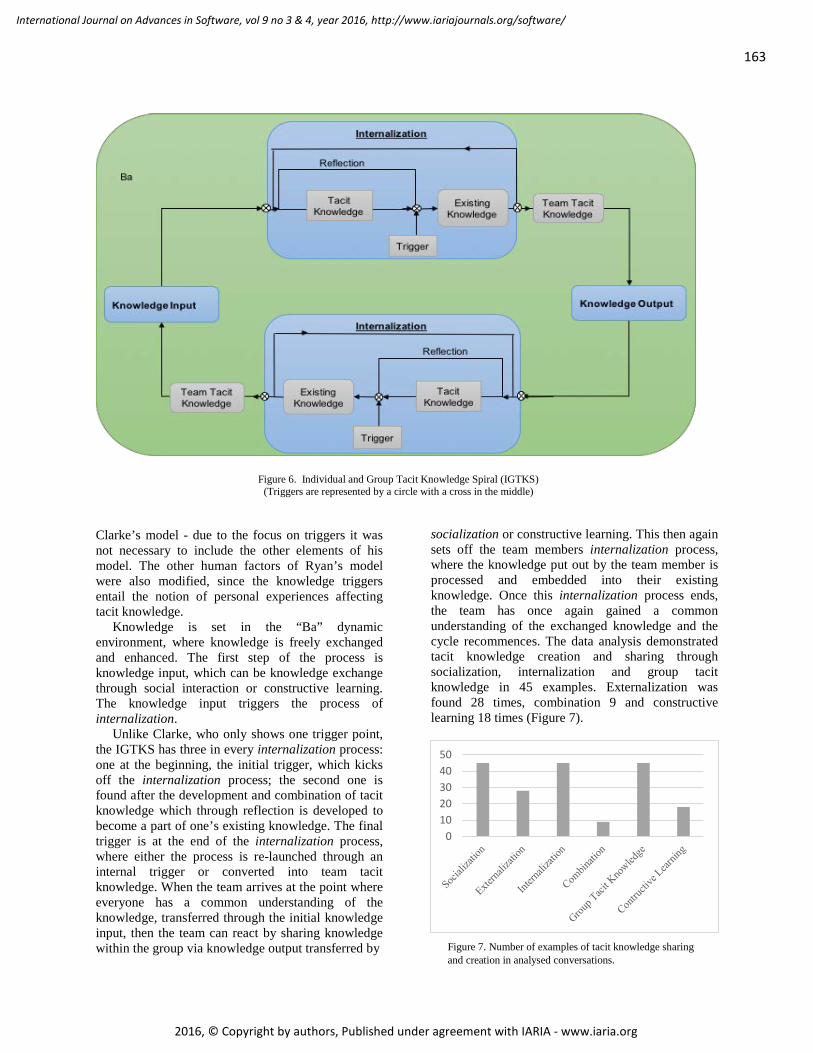
Clarke’s model - due to the focus on triggers it was not necessary to include the other elements of his model. The other human factors of Ryan’s model were also modified, since the knowledge triggers entail the notion of personal experiences affecting tacit knowledge. Knowledge is set in the “Ba” dynamic environment, where knowledge is freely exchanged and enhanced. The first step of the process is knowledge input, which can be knowledge exchange through social interaction or constructive learning. The knowledge input triggers the process of internalization. Unlike Clarke, who only shows one trigger point, the IGTKS has three in every internalization process: one at the beginning, the initial trigger, which kicks off the internalization process; the second one is found after the development and combination of tacit knowledge which through reflection is developed to become a part of one’s existing knowledge. The final trigger is at the end of the internalization process, where either the process is re-launched through an internal trigger or converted into team tacit knowledge. When the team arrives at the point where everyone has a common understanding of the knowledge, transferred through the initial knowledge input, then the team can react by sharing knowledge within the group via knowledge output transferred by
socialization or constructive learning. This then again sets off the team members internalization process, where the knowledge put out by the team member is processed and embedded into their existing knowledge. Once this internalization process ends, the team has once again gained a common understanding of the exchanged knowledge and the cycle recommences. The data analysis demonstrated tacit knowledge creation and sharing through socialization, internalization and group tacit knowledge in 45 examples. Externalization was found 28 times, combination 9 and constructive learning 18 times (Figure 7).
01020304050
Figure 6. Individual and Group Tacit Knowledge Spiral (IGTKS) (Triggers are represented by a circle with a cross in the middle)
Figure 7. Number of examples of tacit knowledge sharing and creation in analysed conversations.

164
International Journal on Advances in Software, vol 9 no 3 & 4, year 2016, http://www.iariajournals.org/software/
2016, © Copyright by authors, Published under agreement with IARIA - www.iaria.org
In addition, the trigger points showed conversations as the main factor in tacit knowledge acquisition and sharing, surfacing in 39 extracts. Visual triggers were shown to help tacit knowledge in 18 incidents, constructive learning 19, recall 7 and anticipation 2 (Figure 8).
The IGTKS (Figure 6) can be used to model and analyze a conversation during a software development meeting, where, for example, team member A commences the meeting by asking a question about X. This question is then internalized by the other team members, B, C and D. A, B, C and D are now all aware that the topic of discussion is X, and understand the issue with it, and at this point the team has a common team tacit knowledge. However, topic X mainly concerns team member C, who therefore answers the question through knowledge output and constructive learning. Once C has explained X, the team again has a common team tacit knowledge. Now the cycle restarts, spirals, and other team members add knowledge within this dynamic knowledge environment. Relating the model to this example, one can see how a conversation commences within the team. This then allows each individual to take the knowledge in, and make it their own tacit knowledge. During the internalization process, several triggers allow the creation of tacit knowledge. One of the triggers can be at the beginning of the internalization process - the unfiltered knowledge passed on by a project member which allows the internalization process to start. Then the knowledge is combined with previously gained knowledge; when newly received knowledge is complex, new thought processes can be triggered. Each individual then gains new tacit knowledge,
which allows a new common group tacit knowledge. When the newly gained knowledge is incomplete, or when the receiver can complete or add to the knowledge, a response is triggered. This then commences the cycle to begin anew. The aim of a meeting is to fill in gaps of knowledge within the project team, which allows teams to work together better. When the core people of a team or the expert within a field are not present, the project comes to a halt, until the knowledge is gained by the people in need of it. The model enables project teams to consider how knowledge is passed within the team. It demonstrates on a team, as well as on an individual level, the knowledge exchange process, and its limitations when key players are not present during a meeting. Utilizing knowledge from group members elevates the knowledge from each individual over time. Each member is needed to give input, and allow tacit knowledge to surface when needed. The process of absorbing knowledge, making it one’s own tacit knowledge, and allowing a common base of group tacit knowledge to develop, can constitute a key influencer of project outcomes.
VII. CONCLUSION Peter Drucker used to tell his students that when intelligent, moral, and rational people make decisions that appear inexplicable, it’s because they see a reality different to the one seen by others [24]. This observation by one of the leading lights of modern management science underscores the importance of knowledge perception and knowledge development. With regard to software projects, McAfee [4] noted that “the coordination, managerial oversight and marshalling of resources needed to implement these systems make a change effort like no other”. Yet, although software project successes and failures have been analysed within a range of analytical frameworks, few studies have focused on knowledge development. Tacit knowledge in particular is one of the more complex and difficult aspects to analyse. Creating a well-functioning project team where knowledge can prosper within each individual is a great challenge, even more so when working within the time constraints of a software development project. Within this dynamic environment, tacit knowledge needs to flourish and evolve throughout the team, so each member can collect and harness information provided by the team to support task and overall project delivery. The comprehension of tacit knowledge processes within a software development project can help future projects enhance communication channels
05
1015202530354045
Figure 8. Number of tacit knowledge triggers identified in analysed conversations.

165
International Journal on Advances in Software, vol 9 no 3 & 4, year 2016, http://www.iariajournals.org/software/
2016, © Copyright by authors, Published under agreement with IARIA - www.iaria.org
within the project to ensure project success. Project outcomes rely on the process of experts sharing their tacit knowledge, and building it up over the course of the project. To return to the RQs noted in Section II, this research concludes that the combined theories of Ryan, Nonaka and Clarke can be used to establish an understanding of tacit knowledge, and provide a framework for recognizing it, in software development projects (RQ1). The analysis of meeting conversations provided the foundation for understanding the flow of knowledge within a software development project. Through the exploration of these conversations, different theories could be tested and applied, which helped to build the IGTKS model, demonstrating the knowledge interplay between different teams and people within the project. It facilitates the analysis of conversations on an individual as well as a group basis, to comprehend when an individual has received and processed information into knowledge. It seeks to demonstrate at what point the team has accepted information or knowledge as common group tacit knowledge, and in which circumstances more information or knowledge needs to be provided by other team members. The combined model presented here can be used to further explore and evaluate knowledge flow on an individual and group level in software development projects. Unless it is rendered ineffective due to an absence of knowledge sharing, the knowledge spiral continues until common group tacit knowledge has been reached. The model allows the practitioner or researcher to pinpoint the moments where external and internal triggers launch the generation of tacit knowledge within an individual. This phenomenon requires further research into the interaction and communication of knowledge within and between project teams and their varying contexts, but this research suggests the combined model can be applied to better exploit tacit and explicit knowledge in the specific context of software development (RQ2). It supports the development of knowledge through a dynamic and open knowledge exchange environment, and suggests a way in which teams can focus on this for their mutual benefit. This can materially impact the software development process, and thus has the potential to significantly enhance the quality and subsequent functioning of the final software products.
REFERENCES [1] H. Dreyer, M. Wynn, and R. Bown, “Tacit and Explicit
Knowledge in a Software Development Project: Towards a Conceptual Framework for Analysis,” The Seventh International Conference on Information, Process and Knowledge Management, Lisbon, Feb 22nd – Feb 27th,
ThinkMind, ISBN: 978-1-61208-386-5; ISSN: 2308-4375; 2015.
[2] F.O. Bjørnson and T. Dingsøyr, “Knowledge management in software engineering: A systematic review of studied concepts, findings and research methods used,” Information and Software Technology, Volume 50, Issue 11, October 2008, Pages 1055-1068, ISSN 0950-5849, http://dx.doi.org/10.1016/j.infsof.2008.03.006. (http://www.sciencedirect.com/science/article/pii/S0950584908000487
[3] M. Polanyi. The tacit dimension. The University of Chicago Press, 1966.
[4] A. McAfee, “When too much IT knowledge is a dangerous thing,” MIT Sloane Management Review, Winter, 2003, pp. 83-89.
[5] S. Ryan. Acquiring and sharing tacit knowledge in software development teams. The University of Dublin, 2012.
[6] K. de Souza, Y. Awazu and P. Baloh, “Managing Knowledge in Global Software Development Efforts: Issues and Practices,” IEEE Software, vol. 23, Issue 5, September, 2006, pp. 30 – 37.
[7] M.T. Hansen, N. Nohria and T. Tierney, “What is your strategy for managing knowledge?”, Harvard Business Review 77 (2), 1999, pp. 106–116.
[8] P. Berger and T. Luckmann, The Social Construction of Reality, Anchor, New York, 1967.
[9] I. Nonaka and H. Takeuchi, The knowledge-creating company: How Japanese companies create the dynamics of innovation. Oxford: Oxford University Press, 1995.
[10] J. Swan, H. Scarbrough and J. Preston, “Knowledge management – the next fad to forget people?”, Proceedings of the Seventh European Conference on Information Systems, 1999, pp. 668–678.
[11] U. Schultze and D.E. Leidner, “Studying knowledge management in information systems research: discourses and theoretical assumptions,” MIS Quarterly, 26, 2002, pp. 213–242.
[12] C. Prell, Social Network Analysis: History, Theory and Methodology, 2012, London: Sage.
[13] T. W. Valente and R. Davies, “Accelerating the diffusion of innovations using opinion leaders,” The Annals of the American Academy of Political and Social Science, vol. 566, 1999, pp. 55-67.
[14] Office of Government Commerce (OGC), Managing Successful Projects with PRINCE2, 2009, London: The Stationery Office/Tso
[15] T. Clancy, The Standish Group Report Chaos, 1996. [16] Z. Erden, G. von Krogh and I. Nonaka, The quality of
group tacit knowledge, 2008. [17] G. Fischer and J. Ostwald, “Knowledge management:
problems, promises, realities, and challenges”, IEEE Intell. Syst., 16, 2001, pp. 60–72.
[18] T. Langford and W. Poteat, “Upon first sitting down to read Personal Knowledge: an introduction,” in Intellect and Hope: Essays in the thought of Michael Polanyi, 1968, pp. 3-18.
[19] I. Nonaka and D.Teece, Managing Industrial Knowledge, 2001, London: Sage.
[20] S. Ryan and R. O'Connor, “Acquiring and Sharing Tacit Knowledge in Software Development Teams: An
Empirical Study,” Information and Software Technology, vol. 55, no. 9, 2013, pp. 1614 -1624.
[21] T. Clarke, The development of a tacit knowledge spectrum based on the interrelationships between tacit and explicit knowledge. 2010, Cardiff: UWIC.
[22] N. Vitalari and G. Dickson, “Problem solving for effective systems analysis: An experiential exploration,” Communications of the Association for Information Systems, 26(11), 1983, pp. 948–956.

166
International Journal on Advances in Software, vol 9 no 3 & 4, year 2016, http://www.iariajournals.org/software/
2016, © Copyright by authors, Published under agreement with IARIA - www.iaria.org
[23] G. White and G. Parry, “Knowledge acquisition in information system development: a case study of system developers in an international bank,” Strategic Change, 25 (1), 2016, pp.81-95.
[24] B. Baker, “The fall of the firefly: An assessment of a failed project strategy,” Project Management Journal, 33 (3), 2002, pp. 53-57.
167
International Journal on Advances in Software, vol 9 no 3 & 4, year 2016, http://www.iariajournals.org/software/
2016, © Copyright by authors, Published under agreement with IARIA - www.iaria.org
Automatic KDD Data Preparation Using Parallelism
Youssef Hmamouche∗, Christian Ernst† and Alain Casali∗∗LIF - CNRS UMR 6166, Aix Marseille Universite, Marseille, France
Email: [email protected]†Email: [email protected]
Abstract—We present an original framework for automatic datapreparation, applicable in most Knowledge Discovery and DataMining systems. It is based on the study of some statisticalfeatures of the target database samples. For each attribute of thedatabase used, we automatically propose an optimized approachallowing to (i) detect and eliminate outliers, and (ii) to identify themost appropriate discretization method. Concerning the former,we show that the detection of an outlier depends on if datadistribution is normal or not. When attempting to discern theappropriated discretization method, what is important is theshape followed by the density function of its distribution law.For this reason, we propose an automatic choice for findingthe optimized discretization method, based on a multi-criteria(Entropy, Variance, Stability) evaluation. Most of the associatedprocessings are performed in parallel, using the capabilitiesof multicore computers. Conducted experiments validate ourapproach, both on rule detection and on time series prediction. Inparticulary, we show that the same discretization method is notthe best when applied to all the attributes of a specific database.
Keywords–Data Mining; Data Preparation; Outliers detectionand cleaning; Discretization Methods, Task parallelization.
I. INTRODUCTION AND MOTIVATION
Data preparation in most of Knowledge and Discovery inDatabases (KDD) systems has not been greatly developed inthe literature. The single mining step is more often emphasized.And, when discussed, data preparation focuses most of thetimes on a single parameter (outlier detection and elimination,null values management, discretization method, etc.). Specificassociated proposals only highlight on their advantages com-paring themselves to others. There is no global nor automaticapproach taking advantage of all of them. But the better dataare prepared, the better results will be, and the faster miningalgorithms will work.
In [1], we presented a global view of the whole datapreparation process. Moreover, we proposed an automatizationof most of the different steps of that process, based on thestudy of some statistical characteristics of the analyseddatabase samples. This work was itself a continuation ofthe one exposed in [2]. In this latter, we proposed a simplebut efficient approach to transform input data into a set ofintervals (also called bins, clusters, classes, etc.). In a furtherstep, we apply specific mining algorithms (correlation rules,etc.) on this set of bins. The very main difference with theformer paper is that no automatization is performed. Theparameters having an impact on data preparation have to bespecified by the end-user before the data preparation processlaunches.
This paper in an extended version of [1]. Main improve-ments concern:
• A simplification and a better structuration of thepresented concepts and processes;
• The use of parallelism in order to choose, whenapplicable, the most appropriate preparation methodamong different available methods;
• An expansion of our previous experiments. The onesconcerning rule detection have been extended, andexperimentations in order to forecast time series havebeen added.
The paper is organized as follows: Section II presentsgeneral aspects of data preparation. Section III and SectionIV are dedicated to outlier detection and to discretizationmethods respectively. Each section is composed of two parts:(i) related work, and (ii) our approach. Section V discussestask parallelization possibilities. Here again, after introducingmulticore programming, we present associated implementationissues concerning our work. In Section VI, we show theresults of expanded experiments. Last section summarizes ourcontribution, and outlines some research perspectives.
II. DATA PREPARATION
Raw input data must be prepared in any KDD systemprevious to the mining step. This is for two main reasons:
• If each value of each column is considered as a singleitem, there will be a combinatorial explosion of thesearch space, and thus very large response times;
• We cannot expect this task to be performed by handbecause manual cleaning of data is time consumingand subject to many errors.
This step can be performed according to differentmethod(ologie)s [3]. Nevertheless, it is generally divided intotwo tasks: (i) Preprocessing, and (ii) Transformation(s). Whendetailing hereafter these two tasks, focus is set on associatedimportant parameters.
A. PreprocessingPreprocessing consists in reducing the data structure by
eliminating columns and rows of low significance [4].a) Basic Column Elimination: Elimination of a column
can be the result of, for example in the microelectronic indus-try, a sensor dysfunction, or the occurrence of a maintenancestep; this implies that the sensor cannot transmit its values tothe database. As a consequence, the associated column willcontain many null/default values and must then be deletedfrom the input file. Elimination should be performed by usingthe Maximum Null Values (MaxNV ) threshold. Furthermore,sometimes several sensors measure the same information, whatproduces identical columns in the database. In such a case, onlya single column should be kept.
168
International Journal on Advances in Software, vol 9 no 3 & 4, year 2016, http://www.iariajournals.org/software/
2016, © Copyright by authors, Published under agreement with IARIA - www.iaria.org
b) Elimination of Concentrated Data and Outliers: Wefirst turn our attention to inconsistent values, such as “outliers”in noisy columns. Detection should be performed throughanother threshold (a convenient value of p when using thestandardization method, see Section III-A). Found outliers areeliminated by forcing their values to Null. Another techniqueis to eliminate the columns that have a small standard deviation(threshold MinStd). Since their values are almost the same,we can assume that they do not have a significant impact onresults; but their presence pollutes the search space and reducesresponse times. Similarly, the number of Distinct Values ineach column should be bounded by the minimum (MinDV )and the maximum (MaxDV ) values allowed.
B. Transformation
a) Data Normalization: This step is optional. It trans-lates numeric values into a set of values comprised between 0and 1. Standardizing data simplifies their classification.
b) Discretization: Discrete values deal with intervalsof values, which are more concise to represent knowledge,so that they are easier to use and also more comprehensivethan continuous values. Many discretization algorithms (seeSection IV-A) have been proposed over the years for this. Thenumber of used intervals (NbBins) as well as the selecteddiscretization method among those available are here againparameters of the current step.
c) Pruning step: When the occurrence frequency ofan interval is less than a given threshold (MinSup), then it isremoved from the set of bins. If no bin remains in a column,then that column is entirely removed.
The presented thresholds/parameters are the ones we usefor data preparation. In previous works, their values were fixedinside of a configuration file read by our software at setup. Themain objective of this work is to automatically determine mostof these variables without information loss. Focus is set in thetwo next sections on outlier and discretization management.
III. DETECTING OUTLIERS
An outlier is an atypical or erroneous value correspondingto a false measurement, an unwritten input, etc. Outlierdetection is an uncontrolled problem because of values thatdeviate too greatly in comparison with the other data. Inother words, they are associated with a significant deviationfrom the other observations [5]. In this section, we presentsome outlier detection methods associated to our approachusing uni-variate data as input. We manage only uni-variatedata because of the nature of our experimental data sets (cf.Section VI).
The following notations are used to describe outliers: X isa numeric attribute of a database relation, and is increasinglyordered. x is an arbitrary value, Xi is the ith value, N is thenumber of values for X , σ its standard deviation, µ its mean,and s a central tendency parameter (variance, inter-quartilerange, . . . ). X1 and XN are respectively the minimum and themaximum values of X . p is a probability, and k a parameterspecified by the user, or computed by the system.
A. Related WorkWe discuss hereafter four of the main uni-variate outlier
detection methods.
Elimination after Standardizing the Distribution: This isthe most conventional cleaning method [5]. It consists in takinginto account σ and µ to determine the limits beyond whichaberrant values are eliminated. For an arbitrary distribution,the inequality of Bienayme-Tchebyshev indicates that theprobability that the absolute deviation between a variable andits average is greater than k is less than or equal to 1
k2 :
P (
∣∣∣∣x− µσ∣∣∣∣ ≥ k) ≤ 1
k2(1)
The idea is that we can set a threshold probability as a functionof σ and µ above which we accept values as non-outliers.For example, with k = 4.47, the risk of considering that x,satisfying
∣∣∣x−µσ ∣∣∣ ≥ k, is an outlier, is bounded by 1k2 = 0.05.
Algebraic Method: This method, presented in [6], uses therelative distance of a point to the “center” of the distribution,defined by: di =
|Xi−µ|σ . Outliers are detected outside of the
interval [µ− k ×Q1, µ+ k ×Q3], where k is generally fixedto 1.5, 2 or 3. Q1 and Q3 are the first and the third quartilesrespectively.Box Plot: This method, attributed to Tukey [7], is based onthe difference between quartiles Q1 and Q3. It distinguishestwo categories of extreme values determined outside the lowerbound (LB) and the upper bound (UB):
LB = Q1 − k × (Q3 −Q1)
UB = Q3 + k × (Q3 −Q1)(2)
Grubbs’ Test: Grubbs’ method, presented in [8], is a statisticaltest for lower or higher abnormal data. It uses the differencebetween the average and the extreme values of the sample. Thetest is based on the assumption that the data have a normaldistribution. The statistic used is: T = max(XN−µ
σ , µ−X1
σ ).The assumption that the tested value (X1 or XN ) is not anoutlier is rejected at significance level α if:
T >N − 1√
n
√β
n− 2β(3)
where β = tα/(2n),n−2 is the quartile of order α/(2n) of theStudent distribution with n− 2 degrees of freedom.
B. An Original Method for Outlier DetectionMost of the existing outlier detection methods assume
that the distribution is normal. However, in reality, manysamples have asymmetric and multimodal distributions, andthe use of these methods can have a significant influence atthe data mining step. In such a case, each “distribution” hasto be processed using an appropriated method. The consideredapproach consists in eliminating outliers in each column basedon the normality of data, in order to minimize the risk ofeliminating normal values.
Many tests have been proposed in the literature to evaluatethe normality of a distribution: Kolmogorov-Smirnov [9],Shapiro-Wilks, Anderson-Darling, Jarque-Bera [10], etc. If theKolmogorov-Smirnov test gives the best results whatever the

169
International Journal on Advances in Software, vol 9 no 3 & 4, year 2016, http://www.iariajournals.org/software/
2016, © Copyright by authors, Published under agreement with IARIA - www.iaria.org
distribution of the analysed data may be, it is neverthelessmuch more time consuming to compute then the others. This iswhy we have chosen the Jarque-Bera test (noted JB hereafter),much more simpler to implement as the others, as shownbelow:
JB =n
6(γ3
2 +γ224) (4)
This test follows a law of χ2 with two degrees of freedom,and uses the Skewness γ3 and the Kurtosis γ2 statistics, definedrespectively as follows:
γ3 = E[(x− µσ
)3] (5)
γ2 = E[(x− µσ
)4]− 3 (6)
If the JB normality test is not significant (the variableis normally distributed), then the Grubbs’ test is used at asignificance level of systematically 5%, otherwise the Box Plotmethod is used with parameter k automatically set to 3 in orderto not to be too exhaustive toward outlier detection.
Figure 1 summarizes the process we chose to detect andeliminate outliers.
JB Normality Test
Normality?
Grubbs’ TestBox Plot
YesNo
Figure 1: The outlier detection process.
Finally, the computation of γ3 and γ2 to evaluate the valueof JB, so as other statistics needed by the Grubb’s test and theBox Plot calculus, are performed in parallel in the mannershown in Listing 1 (cf. Section V). This in order to fastenthe response times. Other statistics used in the next sectionare simultaneously collected here. Because the correspondingalgorithm is very simple (the computation of each statistic isconsidered as a single task), we do not present it.
IV. DISCRETIZATION METHODS
Discretization of an attribute consists in finding NbBinspairwise disjoint intervals that will further represent it in anefficient way. The final objective of discretization methods isto ensure that the mining part of the KDD process generatessubstantial results. In our approach, we only employ directdiscretization methods in which NbBins must be known inadvance (and be the same for every column of the input data).NbBins was in previous works a parameter fixed by the end-user. The literature proposes several formulas as an alternative(Rooks-Carruthers, Huntsberger, Scott, etc.) for computingsuch a number. Therefore, we switched to the Huntsbergerformula, the most fitting from a theoretical point of view [11],and given by: 1 + 3.3× log10(N).
A. Related WorkIn this section, we only highlight the final discretization
methods kept for this work. This is because the other testedmethods have not revealed themselves to be as efficient asexpected (such as Embedded Means Discretization), or are nota worthy alternative (such as Quantiles based Discretization) tothe ones presented. In other words, the approach that we choseand which is discussed in the next sections, barely selectednone of these alternative methods. Thus the methods we useare: Equal Width Discretization (EWD), Equal Frequency-Jenks Discretization (EFD-Jenks), AVerage and STandard devi-ation based discretization (AVST), and K-Means (KMEANS).These methods, which are unsupervised [12] and static [13],have been widely discussed in the literature: see for example[14] for EWD and AVST, [15] for EFD-Jenks, or [16] and [17]for KMEANS. For these reasons, we only summarize theirmain characteristics and their field of applicability in Table I.
TABLE I: SUMMARY OF THE DISCRETIZATION METH-ODS USED.
Method Principle Applicability
EWD This simple to implementmethod creates intervals ofequal width.
The approach cannot be ap-plied to asymmetric or multi-modal distributions.
EFD-Jenks Jenks’ method providesclasses with, if possible, thesame number of values, whileminimizing internal varianceof intervals.
The method is effective fromall statistical points of viewbut presents some complexityin the generation of the bins.
AVST Bins are symmetrically cen-tered around the mean andhave a width equal to the stan-dard deviation.
Intended only for normallydistributed datasets.
KMEANS Based on the Euclidean dis-tance, this method determinesa partition minimizing thequadratic error between themean and the points of eachinterval.
Running time linear inO(N × NbBins × k),where k in the number ofiterations [?]. It is applicableto each form of distribution.
Let us underline that the upper limit fixed by the Hunts-berger formula to the number of intervals to use is not alwaysreached. It depends on the applied discretization method. Thus,EFD-Jenks and KMEANS methods generate most of the timesless than NbBins bins. This implies that other methods, whichgenerate the NbBins value differently for example throughiteration steps, may apply if NbBins can be upper bounded.
Example 1: Let us consider the numeric attribute SX =4.04, 5.13, 5.93, 6.81, 7.42, 9.26, 15.34, 17.89, 19.42, 24.40,25.46, 26.37. SX contains 12 values, so by applying theHuntsberger’s formula, if we aim to discretize this set, wehave to use 4 bins.
Table II shows the bins obtained by applying all thediscretization methods proposed in Table I. Figure 2 showsthe number of values of SX belonging to each bin associatedto every discretization method.
As it is easy to understand, we cannot find two dis-cretization methods producing the same set of bins. As aconsequence, the distribution of the values of SX is differentdepending on the method used.
B. Discretization Methods and Statistical CharacteristicsWhen attempting to find the most appropriate discretization
method for a column, what is important is not the law followed

170
International Journal on Advances in Software, vol 9 no 3 & 4, year 2016, http://www.iariajournals.org/software/
2016, © Copyright by authors, Published under agreement with IARIA - www.iaria.org
TABLE II: SET OF BINS ASSOCIATED TO SAMPLE SX .
Method Bin1 Bin2 Bin3 Bin4
EWD [4.04, 9.62[ [9.62, 15.21[ [15.21, 20.79[ [20.79, 26.37]EFD-Jenks [4.04; 5.94] ]5.94, 9.26] ]9.26, 19.42] ]19.42, 26.37]AVST [4.04; 5.53[ [5.53, 13.65[ [13.65, 21.78[ [21.78, 26.37]KMEANS [4.04; 6.37[ [6.37, 12.3[ [12.3, 22.95[ [22.95, 26.37]
Bin1 Bin2 Bin3 Bin40
1
2
3
4
5
6
7
Popu
latio
n
EWDEFDAVSTKMEANS
Figure 2: Population of each bin of sample SX .
by its distribution, but the shape of its density function. This iswhy we first perform a descriptive analysis of the data in orderto characterize, and finally to classify, each column accordingto normal, uniform, symmetric, antisymmetric or multimodaldistributions. This is done in order to determine what dis-cretization method(s) may apply. Concretely, we perform thefollowing tests, which have to be carried out in the presentedorder:
1) We use the Kernel method introduced in [18] tocharacterize multimodal distributions. The methodis based on estimating the density function of thesample by building a continuous function, and thencalculating the number of peaks using its secondderivative. This function allows us to approximateautomatically the shape of the distribution. The mul-timodal distributions are those having a number ofpeaks strictly greater than 1.
2) To characterize antisymmetric and symmetric dis-tributions in a next step, we use the skewness γ3(see formula (5)). The distribution is symmetric ifγ3 = 0. Practically, this rule is too exhaustive, so werelaxed it by imposing limits around 0 to set a fairlytolerant rule, which allows us to decide whether adistribution is considered antisymmetric or not. Theassociated method is based on a statistical test. Thenull hypothesis is that the distribution is symmetric.Consider the statistic: TSkew = N
6 (γ23). Under the
null hypothesis, TSkew follows a law of χ2 with onedegree of freedom. In this case, the distribution isantisymmetric with α = 5% if TSkew > 3.8415.
3) We use then the normalized Kurtosis, noted γ2 (seeformula (6)), to measure the peakedness of the distri-
bution or the grouping of probability densities aroundthe average, compared with the normal distribution.When γ2 is close to zero, the distribution has anormalized peakedness.A statistical test is used again to automatically decidewhether the distribution has normalized peakednessor not. The null hypothesis is that the distributionhas a normalized peakedness, and thus is uniform.Consider the statistic: TKurto = N
6 (γ22
4 ). Under thenull hypothesis, TKurto follows a law of χ2 with onedegree of freedom. The null hypothesis is rejected atlevel of significance α = 0.05 if TKurto > 6.6349.
4) To characterize normal distributions, we use theJarque-Bera test (see equation (4) and relevant com-ments).
These four successive tests allow us to characterize theshape of the (density function of the) distribution of everycolumn. Combined with the main characteristics of the dis-cretization methods presented in the last section, we get TableIII. This summarizes what discretization method(s) can beinvoked depending on specific column statistics.
TABLE III: APPLICABILITY OF DISCRETIZATIONMETHODS DEPENDING ON THE DISTRIBUTION’SSHAPE.
Normal Uniform Symm- Antisym- Multimodaletric metric
EWD * * *EFD-Jenks * * * * *AVST *KMEANS * * * * *
Example 2: Continuing Example 1, the Kernel DensityEstimation method [18] is used to build the density functionof sample SX (cf. Figure 3).
−30 −20 −10 0 10 20 30 40 50 600.000
0.005
0.010
0.015
0.020
0.025
0.030
0.035
Den
sity
func
tion
Figure 3: Density function of sample SX using Kernel DensityEstimation.
As we can see, the density function has two modes, isalmost symmetric and normal. Since the density function ismultimodal, we should stop at this point. But as shown inTable III, only EFD-Jenks and KMEANS produce interestingresults according to our proposal. For the need of the example,
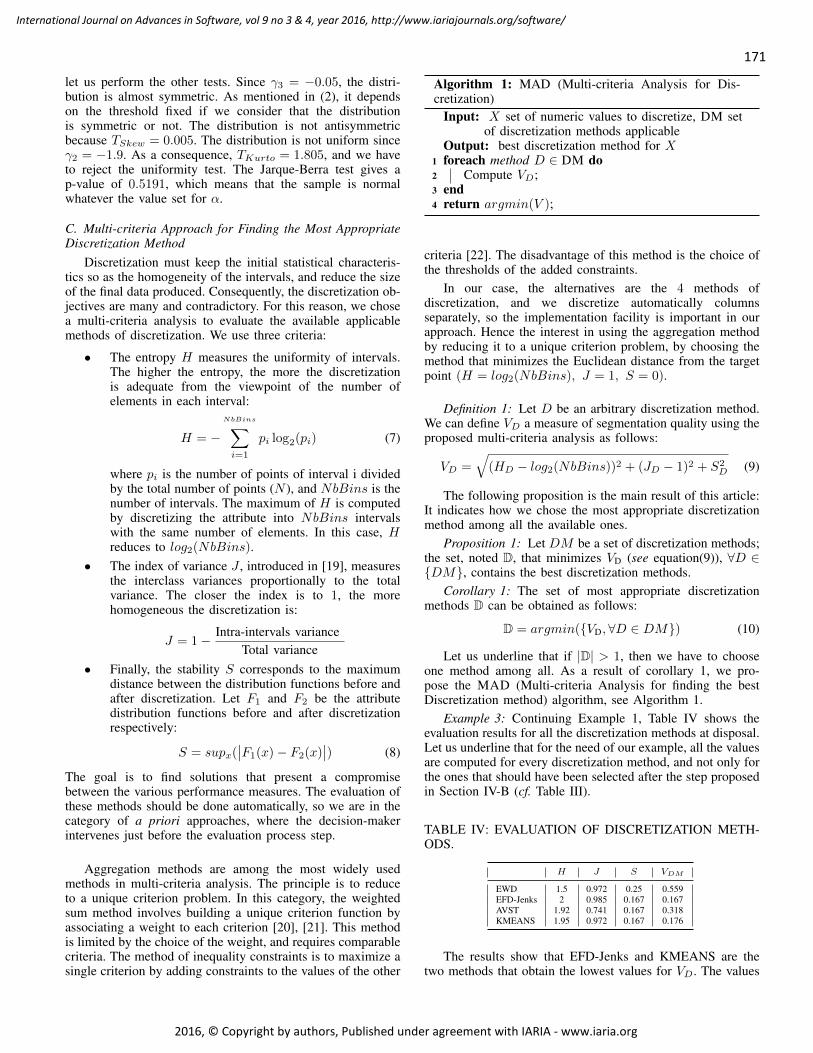
171
International Journal on Advances in Software, vol 9 no 3 & 4, year 2016, http://www.iariajournals.org/software/
2016, © Copyright by authors, Published under agreement with IARIA - www.iaria.org
let us perform the other tests. Since γ3 = −0.05, the distri-bution is almost symmetric. As mentioned in (2), it dependson the threshold fixed if we consider that the distributionis symmetric or not. The distribution is not antisymmetricbecause TSkew = 0.005. The distribution is not uniform sinceγ2 = −1.9. As a consequence, TKurto = 1.805, and we haveto reject the uniformity test. The Jarque-Berra test gives ap-value of 0.5191, which means that the sample is normalwhatever the value set for α.
C. Multi-criteria Approach for Finding the Most AppropriateDiscretization Method
Discretization must keep the initial statistical characteris-tics so as the homogeneity of the intervals, and reduce the sizeof the final data produced. Consequently, the discretization ob-jectives are many and contradictory. For this reason, we chosea multi-criteria analysis to evaluate the available applicablemethods of discretization. We use three criteria:
• The entropy H measures the uniformity of intervals.The higher the entropy, the more the discretizationis adequate from the viewpoint of the number ofelements in each interval:
H = −NbBins∑i=1
pi log2(pi) (7)
where pi is the number of points of interval i dividedby the total number of points (N ), and NbBins is thenumber of intervals. The maximum of H is computedby discretizing the attribute into NbBins intervalswith the same number of elements. In this case, Hreduces to log2(NbBins).
• The index of variance J , introduced in [19], measuresthe interclass variances proportionally to the totalvariance. The closer the index is to 1, the morehomogeneous the discretization is:
J = 1− Intra-intervals varianceTotal variance
• Finally, the stability S corresponds to the maximumdistance between the distribution functions before andafter discretization. Let F1 and F2 be the attributedistribution functions before and after discretizationrespectively:
S = supx(∣∣F1(x)− F2(x)
∣∣) (8)
The goal is to find solutions that present a compromisebetween the various performance measures. The evaluation ofthese methods should be done automatically, so we are in thecategory of a priori approaches, where the decision-makerintervenes just before the evaluation process step.
Aggregation methods are among the most widely usedmethods in multi-criteria analysis. The principle is to reduceto a unique criterion problem. In this category, the weightedsum method involves building a unique criterion function byassociating a weight to each criterion [20], [21]. This methodis limited by the choice of the weight, and requires comparablecriteria. The method of inequality constraints is to maximize asingle criterion by adding constraints to the values of the other
Algorithm 1: MAD (Multi-criteria Analysis for Dis-cretization)
Input: X set of numeric values to discretize, DM setof discretization methods applicable
Output: best discretization method for X1 foreach method D ∈ DM do2 Compute VD;3 end4 return argmin(V );
criteria [22]. The disadvantage of this method is the choice ofthe thresholds of the added constraints.
In our case, the alternatives are the 4 methods ofdiscretization, and we discretize automatically columnsseparately, so the implementation facility is important in ourapproach. Hence the interest in using the aggregation methodby reducing it to a unique criterion problem, by choosing themethod that minimizes the Euclidean distance from the targetpoint (H = log2(NbBins), J = 1, S = 0).
Definition 1: Let D be an arbitrary discretization method.We can define VD a measure of segmentation quality using theproposed multi-criteria analysis as follows:
VD =√(HD − log2(NbBins))2 + (JD − 1)2 + S2
D (9)
The following proposition is the main result of this article:It indicates how we chose the most appropriate discretizationmethod among all the available ones.
Proposition 1: Let DM be a set of discretization methods;the set, noted D, that minimizes VD (see equation(9)), ∀D ∈DM, contains the best discretization methods.
Corollary 1: The set of most appropriate discretizationmethods D can be obtained as follows:
D = argmin(VD,∀D ∈ DM) (10)
Let us underline that if |D| > 1, then we have to chooseone method among all. As a result of corollary 1, we pro-pose the MAD (Multi-criteria Analysis for finding the bestDiscretization method) algorithm, see Algorithm 1.
Example 3: Continuing Example 1, Table IV shows theevaluation results for all the discretization methods at disposal.Let us underline that for the need of our example, all the valuesare computed for every discretization method, and not only forthe ones that should have been selected after the step proposedin Section IV-B (cf. Table III).
TABLE IV: EVALUATION OF DISCRETIZATION METH-ODS.
H J S VDM
EWD 1.5 0.972 0.25 0.559EFD-Jenks 2 0.985 0.167 0.167AVST 1.92 0.741 0.167 0.318KMEANS 1.95 0.972 0.167 0.176
The results show that EFD-Jenks and KMEANS are thetwo methods that obtain the lowest values for VD. The values

172
International Journal on Advances in Software, vol 9 no 3 & 4, year 2016, http://www.iariajournals.org/software/
2016, © Copyright by authors, Published under agreement with IARIA - www.iaria.org
got by the EWD and AVST methods are the worst: This isconsistent with our optimization proposed in Table III, sincethe sample distribution is multimodal.
V. PARALLELIZING DATA PREPARATION
Parallel architectures have become a standard today. Asa result, applications can be distributed on several cores.Consequently, multicore applications run faster given that theyrequire less process time to be executed, even if they mayneed on the other hand more memory for their data. But thislatter inconvenient is minor when compared to the inducedperformances. We present in this section first some novelprogramming techniques, which allow to run easily differenttasks in parallel. We show in a second step how we adapt thesetechniques to our work.
A. New Features in Multicore EncodingMulticore processing is not a new concept, however only
in the mid 2000s has the technology become mainstreamwith Intel and AMD. Moreover, since then, novel softwareenvironments that are able to take advantage simultaneously ofthe different existing processors have been designed (Cilk++,Open MP, TBB, etc.). They are based on the fact that loopingfunctions are the key area where splitting parts of a loopacross all available hardware resources increase applicationperformance.
We focus hereafter on the relevant versions of the Microsoft.NET framework for C++ proposed since 2010. These enhancesupport for parallel programming by several utilities, amongwhich the Task Parallel Library. This component entirely hidesthe multi-threading activity on the cores. The job of spawningand terminating threads, as well as scaling the number ofthreads according to the number of available cores, is doneby the library itself.
The Parallel Patterns Library (PPL) is the correspondingavailable tool in the Visual C++ environment. The PPLoperates on small units of work called Tasks. Each of themis defined by a λ calculus expression (see below). The PPLdefines three kinds of facilities for parallel processing, whereonly templates for algorithms for parallel operations are ofinterest for this presentation.
Among the algorithms defined as templates for initiatingparallel execution on multiple cores, we focus on the paral-lel invoke algorithm used in the presented work (see end ofSections III-B and IV-C). It executes a set of two or moreindependent Tasks in parallel.
Another novelty introduced by the PPL is the use of λexpressions, now included in the C++11 language norm. Theseremove all need for scaffolding code, allowing a “function”to be defined in-line in another statement, as in the exampleprovided by Listing 1. The λ element in the square brackets iscalled the capture specification. It relays to the compiler thata λ function is being created and that each local variable isbeing captured by reference (in our example). The final partis the function body./ / R e t u r n s t h e r e s u l t o f add ing a v a l u e t o i t s e l ft empla te <typename T> T t w i c e ( c o n s t T& t )
re turn t + t ;i n t n = 5 4 ; double d = 5 . 6 ; s t r i n g s = ” H e l l o ” ;
/ / C a l l t h e f u n c t i o n on each v a l u e c o n c u r r e n t l yp a r a l l e l i n v o k e (
[&n ] n = t w i c e ( n ) ; ,[&d ] d = t w i c e ( d ) ; ,[& s ] s = t w i c e ( s ) ;
) ;
Listing 1: Parallel execution of 3 simple tasks
Listing 1 also shows the limits of parallelism. It is widelyagreed that applications that may benefit from using morethan one processor necessitate: (i) Operations that require asubstantial amount of processor time, measured in secondsrather than milliseconds, and (ii), Operations that can bedivided into significant units of calculation, which can beexecuted independently of one another. So the chosen exampledoes not fit parallelization, but is used to illustrate the newfeatures introduced by multicore programming techniques.
More details about parallel algorithms and the λ calculuscan be found in [23], [24].
B. Application to data preparationAs a result of Table IV and of Proposition 1, we define
the POP (Parallel Optimized Preparation of data) method, seeAlgorithm 2.
For each attribute, after constructing Table III, each appli-cable discretization method is invoked and evaluated in orderto keep finally the most appropriate. The content of thesetwo tasks (three when involving the statistics computations)are executed in parallel using the parallel invoke template (cf.previous section).We discuss the advantages of this approach so as the gotresponse times in the next section.
Algorithm 2: POP (Parallel Optimized Preparation ofData)
Input: X set of numeric values to discretize, DM setof discretization methods applicable
Output: Best set of bins for X1 Parallel Invoke For each method D ∈ DM do2 Compute γ2, γ3 and perform Jarque-Bera test;3 end4 Parallel Invoke For each method D ∈ DM do5 Remove D from DM if it does not satisfy the
criteria given in Table III;6 end7 Parallel Invoke For each method D ∈ DM do8 Discretize X according to D;9 VD =√
(HD − log2(NbBins))2 + (JD − 1)2 + S2D;
10 end11 D = argmin(VD,∀D ∈ DM);12 return set of bins obtained in line 8 according to D;
VI. EXPERIMENTAL ANALYSIS
The goal of this section is to validate experimentallyour approach according to two point of views: (i) firstly,we apply our methodology to the extraction of correlationand of association rules; (ii) secondly, we use it to forecast

173
International Journal on Advances in Software, vol 9 no 3 & 4, year 2016, http://www.iariajournals.org/software/
2016, © Copyright by authors, Published under agreement with IARIA - www.iaria.org
time series. These two application fields correspond to thetwo mainstream approaches in data mining, which consistin defining and using descriptive or predictive models. Whatmeans that the presented work can help to solve a great varietyof associated problems.
A. Experimentation on rules detectionIn this section, we present some experimental results by
evaluating five samples. We decided to implement it usingthe MineCor KDD Software [2], but it could have beenwith another one (R Project, Tanagra, etc.). Sample1 andSample2 correspond to real data, representing parameter (inthe sense of attribute) measurements provided by microelec-tronics manufacturers after completion of the manufacturingprocess. The ultimate goal was here to detect correlationsbetween one particular parameter (the yield) and the otherattributes. Sample3 is a randomly generated file that containsheterogeneous values. Sample4 and Sample5 are common datataken from the UCI Machine Learning Repository website[25]. Table V sums up the characteristics of the samples.
TABLE V: CHARACTERISTICS OF THE DATABASESUSED.
Sample Number of columns Number of rows Type
Sample1 (amtel.csv) 8 727 realSample2 (stm.csv) 1281 296 realSample3 (generated.csv) 11 201 generatedSample4 (abalone.csv) 9 4177 realSample5 (auto mpg.csv) 8 398 real
Experiments were performed on a 4 core computer (aDELL Workstation with a 2.8 GHz processor and 12 GbRAM working under the Windows 7 64 bits OS). First,let us underline that we shall not focus in this section onperformance issues. Of course, we have chosen to parallelizethe underdone tasks in order to improve response times. As itis easy to understand, each of the parallel invoke loops hasa computational time closed to the most consuming calculusinside of each loop. Parallelism allows us to compute andthen to evaluate different “possibilities” in order especiallyto chose the most efficient one for our purpose. This isdone without waste of time, when comparing to a single“possibility” processing. Moreover, we can easily add othertasks to each parallelized loop (statistics computations,discretization methods, evaluation criteria). Some physicallimits exist (currently): No more then seven tasks can belaunched simultaneously within the 2010 C++ Microsoft.NET / PPL environment. But each individual described taskdoes not require more than a few seconds to execute, even onthe Sample2 database.
Concerning outlier management, we recall that in theprevious versions of our software (see [2]), we used the singlestandardization method with p set by the user (cf. SectionIII-A). With the new approach presented in Section III-B, wenotice an improvement in the detection of true positive orfalse negative outliers by a factor of 2%.
Figures 4 summarize the evaluation of the methods usedon each of our samples, except on Sample2: we have chosento only show the results for the 10 first columns.
1 2 3 4 5 6 7 8
Columns
0.0
0.2
0.4
0.6
0.8
1.0
1.2
1.4
V D
EWDEFD-JenksAVSTKMEANS
(a) Results for sample 1.
2 4 6 8 10
Columns
0.0
0.2
0.4
0.6
0.8
1.0
1.2
1.4
V D
EWDEFD-JenksAVSTKMEANS
(b) Results for sample 2.
2 4 6 8 10
Columns
0.0
0.5
1.0
1.5
2.0
2.5
V D
EWDEFD-JenksAVSTKMEANS
(c) Results for sample 3.
1 2 3 4 5 6 7
Columns
0.0
0.2
0.4
0.6
0.8
1.0
1.2
V D
EWDEFD-JenksAVSTKMEANS
(d) Results for sample 4.
1 2 3 4 5 6
Columns
0.0
0.2
0.4
0.6
0.8
1.0
V D
EWDEFD-JenksAVSTKMEANS
(e) Results for sample 5.
Figure 4: Discretization experimentations on the five samples.

174
International Journal on Advances in Software, vol 9 no 3 & 4, year 2016, http://www.iariajournals.org/software/
2016, © Copyright by authors, Published under agreement with IARIA - www.iaria.org
For Sample1 and Sample2 attributes, which have symmetricand normal distributions, the evaluation on Figure 4a and 4bshows that the EFD-Jenks method provides generally the bestresults. The KMEANS method is unstable for these kinds ofdistributions, but sometimes provides the best discretization.
For the Sample3 evaluation shown graphically in Figure 4c,the studied columns have relatively dispersed, asymmetric andmultimodal distributions. “Best” discretizations are providedby EFD-Jenks and KMEANS methods. We note also thatthe EWD method is fast, and sometimes demonstrates goodperformances in comparison with the EFD-Jenks or KMEANSmethods.
For Sample4 and Sample5 attributes, which distributionshave a single mode and most of them are symmetric, theevaluation on Figures 4d and 4e shows that the KMEANSmethod provides generally the best results. The results givenby EFD-Jenks method are closed to the ones obtained usingKMEANS.
Finally, Figure 5 summarizes our approach. We have testedit over each column of each dataset. Any of the availablemethods is selected at least once in the dataset of the three firstproposed samples (cf. Table V), which enforces our approach.As expected, EFD-Jenks is the method that is the most oftenkept by our software (' 42%). AVST and KMEANS areselected approximately a bit less than 30% each. EWD is onlyselected a very few times (less than 2%).
EWD
EFD-Jenks
AVST
KMEANS
Figure 5: Global Distribution of DMs in our samples.
We focus hereafter on experiments performed in order tocompare the different available discretization methods still onthe three first samples. Figures 6a, 7a and 8a reference variousexperiments when mining Association Rules. Figures 6b, 7band 8b correspond to experiments when mining CorrelationRules. When searching for Association Rules, the minimumconfidence (MinConf ) threshold has been arbitrarily set to0.5. The different figures provide the number of Associationor of Correlation Rules respectively, while the minimum sup-port (MinSup) threshold varies. Each figure is composed offive curves. One for each of the four discretization methodspresented in Table III, and one for our global method (POP).Each method is individually applied on each column of theconsidered database/dataset.
0.005 0.010 0.015 0.020 0.025 0.030 0.035
MinSup
0
5000
10000
15000
20000
25000
30000
35000
40000
Num
berofRu
les
EWDAVSTEFD-JenksKMEANSPOP
(a) Results for Apriori.
0.12 0.14 0.16 0.18 0.20 0.22
MinSup
10−1
100
101
102
103
Num
berofRu
les
EWDAVSTEFD-JenksKMEANSPOP
(b) Results for MineCor.
Figure 6: Execution on Sample1.
0.15 0.20 0.25 0.30
MinSup
10−1
100
101
102
103
104
105
Num
berofRu
les
EWDAVSTEFD-JenksKMEANSPOP
(a) Results for Apriori.
0.19 0.20 0.21 0.22 0.23 0.24 0.25
MinSup
101
102
103
Num
berofRu
les
EWDAVSTEFD-JenksKMEANSPOP
(b) Results for MineCor.
Figure 7: Execution on Sample2.
Analyzing the Association Rules detection process, exper-iments show that POP gives the best results (few number ofrules), and EWD is the worst. Using real data, the number ofrules is reduced by a factor comprised between 5% and 20%.This reduction factor is even better using synthetic (generated)data and a low MinSup threshold. When mining Correlation
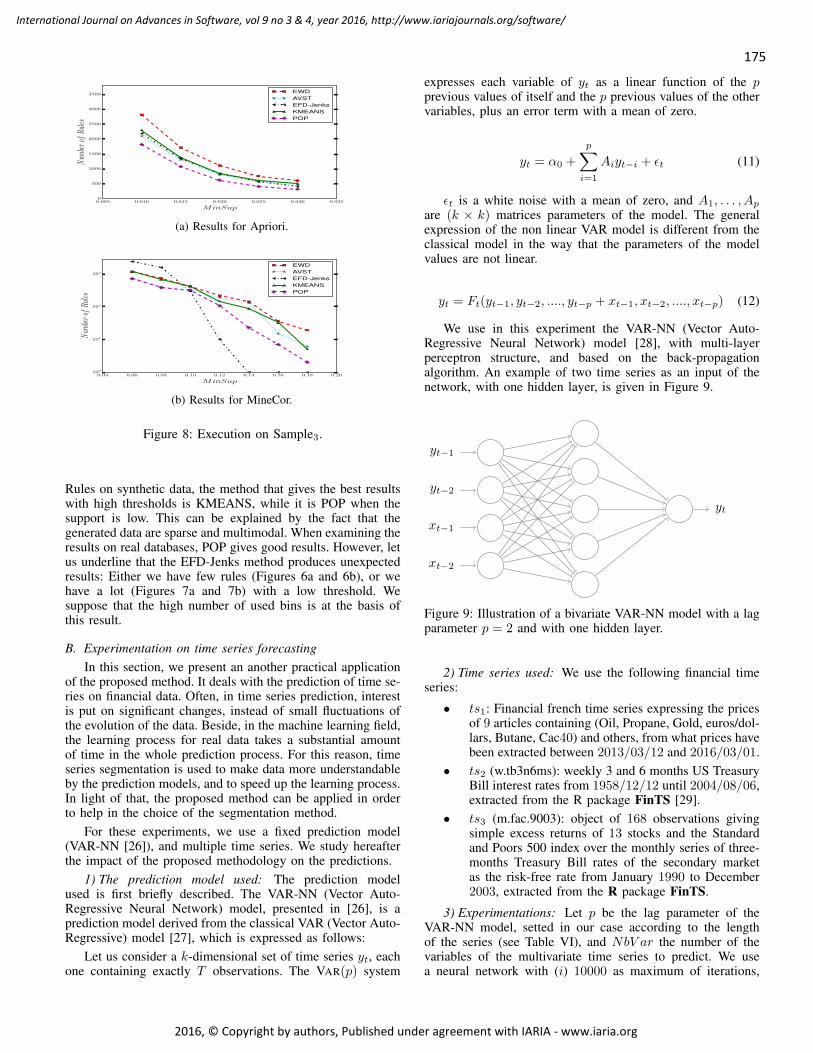
175
International Journal on Advances in Software, vol 9 no 3 & 4, year 2016, http://www.iariajournals.org/software/
2016, © Copyright by authors, Published under agreement with IARIA - www.iaria.org
0.005 0.010 0.015 0.020 0.025 0.030 0.035
MinSup
0
500
1000
1500
2000
2500
3000
3500
Num
berofRu
lesEWDAVSTEFD-JenksKMEANSPOP
(a) Results for Apriori.
0.04 0.06 0.08 0.10 0.12 0.14 0.16 0.18 0.20
MinSup
100
101
102
103
Num
berofRu
les
EWDAVSTEFD-JenksKMEANSPOP
(b) Results for MineCor.
Figure 8: Execution on Sample3.
Rules on synthetic data, the method that gives the best resultswith high thresholds is KMEANS, while it is POP when thesupport is low. This can be explained by the fact that thegenerated data are sparse and multimodal. When examining theresults on real databases, POP gives good results. However, letus underline that the EFD-Jenks method produces unexpectedresults: Either we have few rules (Figures 6a and 6b), or wehave a lot (Figures 7a and 7b) with a low threshold. Wesuppose that the high number of used bins is at the basis ofthis result.
B. Experimentation on time series forecastingIn this section, we present an another practical application
of the proposed method. It deals with the prediction of time se-ries on financial data. Often, in time series prediction, interestis put on significant changes, instead of small fluctuations ofthe evolution of the data. Beside, in the machine learning field,the learning process for real data takes a substantial amountof time in the whole prediction process. For this reason, timeseries segmentation is used to make data more understandableby the prediction models, and to speed up the learning process.In light of that, the proposed method can be applied in orderto help in the choice of the segmentation method.
For these experiments, we use a fixed prediction model(VAR-NN [26]), and multiple time series. We study hereafterthe impact of the proposed methodology on the predictions.
1) The prediction model used: The prediction modelused is first briefly described. The VAR-NN (Vector Auto-Regressive Neural Network) model, presented in [26], is aprediction model derived from the classical VAR (Vector Auto-Regressive) model [27], which is expressed as follows:
Let us consider a k-dimensional set of time series yt, eachone containing exactly T observations. The VAR(p) system
expresses each variable of yt as a linear function of the pprevious values of itself and the p previous values of the othervariables, plus an error term with a mean of zero.
yt = α0 +
p∑i=1
Aiyt−i + εt (11)
εt is a white noise with a mean of zero, and A1, . . . , Apare (k × k) matrices parameters of the model. The generalexpression of the non linear VAR model is different from theclassical model in the way that the parameters of the modelvalues are not linear.
yt = Ft(yt−1, yt−2, ...., yt−p + xt−1, xt−2, ...., xt−p) (12)
We use in this experiment the VAR-NN (Vector Auto-Regressive Neural Network) model [28], with multi-layerperceptron structure, and based on the back-propagationalgorithm. An example of two time series as an input of thenetwork, with one hidden layer, is given in Figure 9.
yt−1
yt−2
xt−1
xt−2
yt
Figure 9: Illustration of a bivariate VAR-NN model with a lagparameter p = 2 and with one hidden layer.
2) Time series used: We use the following financial timeseries:
• ts1: Financial french time series expressing the pricesof 9 articles containing (Oil, Propane, Gold, euros/dol-lars, Butane, Cac40) and others, from what prices havebeen extracted between 2013/03/12 and 2016/03/01.
• ts2 (w.tb3n6ms): weekly 3 and 6 months US TreasuryBill interest rates from 1958/12/12 until 2004/08/06,extracted from the R package FinTS [29].
• ts3 (m.fac.9003): object of 168 observations givingsimple excess returns of 13 stocks and the Standardand Poors 500 index over the monthly series of three-months Treasury Bill rates of the secondary marketas the risk-free rate from January 1990 to December2003, extracted from the R package FinTS.
3) Experimentations: Let p be the lag parameter of theVAR-NN model, setted in our case according to the lengthof the series (see Table VI), and NbV ar the number of thevariables of the multivariate time series to predict. We usea neural network with (i) 10000 as maximum of iterations,
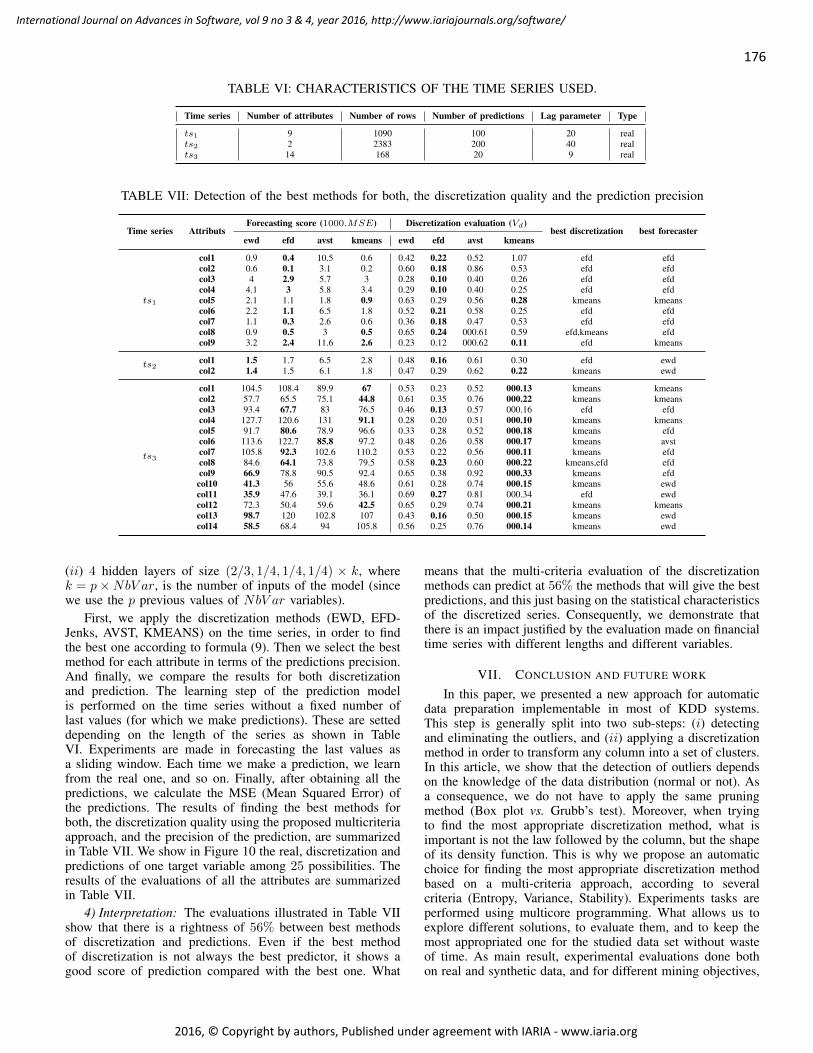
176
International Journal on Advances in Software, vol 9 no 3 & 4, year 2016, http://www.iariajournals.org/software/
2016, © Copyright by authors, Published under agreement with IARIA - www.iaria.org
TABLE VI: CHARACTERISTICS OF THE TIME SERIES USED.
Time series Number of attributes Number of rows Number of predictions Lag parameter Type
ts1 9 1090 100 20 realts2 2 2383 200 40 realts3 14 168 20 9 real
TABLE VII: Detection of the best methods for both, the discretization quality and the prediction precision
Time series AttributsForecasting score (1000.MSE) Discretization evaluation (Vd)
best discretization best forecasterewd efd avst kmeans ewd efd avst kmeans
ts1
col1 0.9 0.4 10.5 0.6 0.42 0.22 0.52 1.07 efd efdcol2 0.6 0.1 3.1 0.2 0.60 0.18 0.86 0.53 efd efdcol3 4 2.9 5.7 3 0.28 0.10 0.40 0.26 efd efdcol4 4.1 3 5.8 3.4 0.29 0.10 0.40 0.25 efd efdcol5 2.1 1.1 1.8 0.9 0.63 0.29 0.56 0.28 kmeans kmeanscol6 2.2 1.1 6.5 1.8 0.52 0.21 0.58 0.25 efd efdcol7 1.1 0.3 2.6 0.6 0.36 0.18 0.47 0.53 efd efdcol8 0.9 0.5 3 0.5 0.65 0.24 000.61 0.59 efd,kmeans efdcol9 3.2 2.4 11.6 2.6 0.23 0.12 000.62 0.11 efd kmeans
ts2col1 1.5 1.7 6.5 2.8 0.48 0.16 0.61 0.30 efd ewdcol2 1.4 1.5 6.1 1.8 0.47 0.29 0.62 0.22 kmeans ewd
ts3
col1 104.5 108.4 89.9 67 0.53 0.23 0.52 000.13 kmeans kmeanscol2 57.7 65.5 75.1 44.8 0.61 0.35 0.76 000.22 kmeans kmeanscol3 93.4 67.7 83 76.5 0.46 0.13 0.57 000.16 efd efdcol4 127.7 120.6 131 91.1 0.28 0.20 0.51 000.10 kmeans kmeanscol5 91.7 80.6 78.9 96.6 0.33 0.28 0.52 000.18 kmeans efdcol6 113.6 122.7 85.8 97.2 0.48 0.26 0.58 000.17 kmeans avstcol7 105.8 92.3 102.6 110.2 0.53 0.22 0.56 000.11 kmeans efdcol8 84.6 64.1 73.8 79.5 0.58 0.23 0.60 000.22 kmeans,efd efdcol9 66.9 78.8 90.5 92.4 0.65 0.38 0.92 000.33 kmeans efdcol10 41.3 56 55.6 48.6 0.61 0.28 0.74 000.15 kmeans ewdcol11 35.9 47.6 39.1 36.1 0.69 0.27 0.81 000.34 efd ewdcol12 72.3 50.4 59.6 42.5 0.65 0.29 0.74 000.21 kmeans kmeanscol13 98.7 120 102.8 107 0.43 0.16 0.50 000.15 kmeans ewdcol14 58.5 68.4 94 105.8 0.56 0.25 0.76 000.14 kmeans ewd
(ii) 4 hidden layers of size (2/3, 1/4, 1/4, 1/4) × k, wherek = p×NbV ar, is the number of inputs of the model (sincewe use the p previous values of NbV ar variables).
First, we apply the discretization methods (EWD, EFD-Jenks, AVST, KMEANS) on the time series, in order to findthe best one according to formula (9). Then we select the bestmethod for each attribute in terms of the predictions precision.And finally, we compare the results for both discretizationand prediction. The learning step of the prediction modelis performed on the time series without a fixed number oflast values (for which we make predictions). These are setteddepending on the length of the series as shown in TableVI. Experiments are made in forecasting the last values asa sliding window. Each time we make a prediction, we learnfrom the real one, and so on. Finally, after obtaining all thepredictions, we calculate the MSE (Mean Squared Error) ofthe predictions. The results of finding the best methods forboth, the discretization quality using the proposed multicriteriaapproach, and the precision of the prediction, are summarizedin Table VII. We show in Figure 10 the real, discretization andpredictions of one target variable among 25 possibilities. Theresults of the evaluations of all the attributes are summarizedin Table VII.
4) Interpretation: The evaluations illustrated in Table VIIshow that there is a rightness of 56% between best methodsof discretization and predictions. Even if the best methodof discretization is not always the best predictor, it shows agood score of prediction compared with the best one. What
means that the multi-criteria evaluation of the discretizationmethods can predict at 56% the methods that will give the bestpredictions, and this just basing on the statistical characteristicsof the discretized series. Consequently, we demonstrate thatthere is an impact justified by the evaluation made on financialtime series with different lengths and different variables.
VII. CONCLUSION AND FUTURE WORK
In this paper, we presented a new approach for automaticdata preparation implementable in most of KDD systems.This step is generally split into two sub-steps: (i) detectingand eliminating the outliers, and (ii) applying a discretizationmethod in order to transform any column into a set of clusters.In this article, we show that the detection of outliers dependson the knowledge of the data distribution (normal or not). Asa consequence, we do not have to apply the same pruningmethod (Box plot vs. Grubb’s test). Moreover, when tryingto find the most appropriate discretization method, what isimportant is not the law followed by the column, but the shapeof its density function. This is why we propose an automaticchoice for finding the most appropriate discretization methodbased on a multi-criteria approach, according to severalcriteria (Entropy, Variance, Stability). Experiments tasks areperformed using multicore programming. What allows us toexplore different solutions, to evaluate them, and to keep themost appropriated one for the studied data set without wasteof time. As main result, experimental evaluations done bothon real and synthetic data, and for different mining objectives,

177
International Journal on Advances in Software, vol 9 no 3 & 4, year 2016, http://www.iariajournals.org/software/
2016, © Copyright by authors, Published under agreement with IARIA - www.iaria.org
0 500 1000 1500 2000
Days
0.0
0.2
0.4
0.6
0.8
1.0
1.2
Nor
mal
ised
pric
es
DiscretizationPredictionsReal
(a) Results of EWD method.
0 500 1000 1500 2000
Days
0.0
0.2
0.4
0.6
0.8
1.0
1.2
Nor
mal
ised
pric
es
DiscretizationPredictionsReal
(b) Results of EFD-Jenks method.
0 500 1000 1500 2000
Days
0.0
0.2
0.4
0.6
0.8
1.0
1.2
Nor
mal
ised
pric
es
DiscretizationPredictionsReal
(c) Results of AVST method.
0 500 1000 1500 2000
Days
0.0
0.2
0.4
0.6
0.8
1.0
1.2
Nor
mal
ised
pric
es
DiscretizationPredictionsReal
(d) Results of KMEANS method.
Figure 10: Predictions, discretized and real values for the target attribut Col2/ts2.
validate our work, showing that it is not always the very samediscretization method that is the best: Each method has itsstrengths and drawbacks. Moreover, experiments performed,on one hand when mining correlation rules, show a significantreduction of the number of produced rules, and, on theother hand when forecasting times series, show a significantimprovement of the predictions obtained. We can concludethat our methodology produces better result in most cases.
For future works, we aim to experimentally validate the re-lationship between the distribution shape and the applicabilityof used methods, to add other discretization methods (Khiops,Chimerge, Entropy Minimization Discretization, etc.) to oursystem, and to understand why our methodology does not givealways the best result in order to improve it.
REFERENCES[1] Y. Hmamouche, C. Ernst, and A. Casali, “Automatic kdd data prepa-
ration using multi-criteria features,” in IMMM 2015, The Fifth Inter-national Conference on Advances in Information Mining and Manage-ment, 2015, pp. 33–38.
[2] C. Ernst and A. Casali, “Data preparation in the minecor kdd frame-work,” in IMMM 2011, The First International Conference on Advancesin Information Mining and Management, 2011, pp. 16–22.
[3] D. Pyle, Data Preparation for Data Mining. Morgan Kaufmann, 1999.
[4] O. Stepankova, P. Aubrecht, Z. Kouba, and P. Miksovsky, “Preprocess-ing for data mining and decision support,” in Data Mining and DecisionSupport: Integration and Collaboration, K. A. Publishers, Ed., 2003, pp.107–117.
[5] C. Aggarwal and P. Yu, “Outlier detection for high dimensional data,”in SIGMOD Conference, S. Mehrotra and T. K. Sellis, Eds. ACM,2001, pp. 37–46.
[6] M. Grun-Rehomme, O. Vasechko et al., “Methodes de detectiondes unites atypiques: Cas des enquetes structurelles ukrainiennes,” in42emes Journees de Statistique, 2010.
[7] J. W. Tukey, “Exploratory data analysis. 1977,” Massachusetts:Addison-Wesley, 1976.
[8] F. E. Grubbs, “Procedures for detecting outlying observations in sam-ples,” Technometrics, vol. 11, no. 1, 1969, pp. 1–21.
[9] H. W. Lilliefors, “On the kolmogorov-smirnov test for normality withmean and variance unknown,” Journal of the American StatisticalAssociation, vol. 62, no. 318, 1967, pp. 399–402.
[10] C. M. Jarque and A. K. Bera, “Efficient tests for normality, homoscedas-
178
International Journal on Advances in Software, vol 9 no 3 & 4, year 2016, http://www.iariajournals.org/software/
2016, © Copyright by authors, Published under agreement with IARIA - www.iaria.org
ticity and serial independence of regression residuals,” EconomicsLetters, vol. 6, no. 3, 1980, pp. 255–259.
[11] C. Cauvin, F. Escobar, and A. Serradj, Thematic Cartography, Cartog-raphy and the Impact of the Quantitative Revolution. John Wiley &Sons, 2013, vol. 2.
[12] I. Kononenko and S. J. Hong, “Attribute selection for modelling,” FutureGeneration Computer Systems, vol. 13, no. 2, 1997, pp. 181–195.
[13] S. Kotsiantis and D. Kanellopoulos, “Discretization techniques: A recentsurvey,” GESTS International Transactions on Computer Science andEngineering, vol. 32, no. 1, 2006, pp. 47–58.
[14] J. W. Grzymala-Busse, “Discretization based on entropy and multiplescanning,” Entropy, vol. 15, no. 5, 2013, pp. 1486–1502.
[15] G. Jenks, “The data model concept in statistical mapping,” in Interna-tional Yearbook of Cartography, vol. 7, 1967, pp. 186–190.
[16] T. Kanungo, D. M. Mount, N. S. Netanyahu, C. D. Piatko, R. Silverman,and A. Y. Wu, “An efficient k-means clustering algorithm: Analysisand implementation,” Pattern Analysis and Machine Intelligence, IEEETransactions on, vol. 24, no. 7, 2002, pp. 881–892.
[17] A. K. Jain, “Data clustering: 50 years beyond k-means,” PatternRecognition Letters, vol. 31, no. 8, 2010, pp. 651–666.
[18] B. W. Silverman, Density estimation for statistics and data analysis.CRC press, 1986, vol. 26.
[19] C. Cauvin, F. Escobar, and A. Serradj, Cartographie thematique. 3.Methodes quantitatives et transformations attributaires. Lavoisier,2008.
[20] P. M. Pardalos, Y. Siskos, and C. Zopounidis, Advances in multicriteriaanalysis. Springer, 1995.
[21] B. Roy and P. Vincke, “Multicriteria analysis: survey and new direc-tions,” European Journal of Operational Research, vol. 8, no. 3, 1981,pp. 207–218.
[22] C. Zopounidis and P. M. Pardalos, Handbook of multicriteria analysis.Springer Science & Business Media, 2010, vol. 103.
[23] A. Casali and C. Ernst, “Extracting correlated patterns on multicorearchitectures,” in Availability, Reliability, and Security in InformationSystems and HCI - IFIP WG 8.4, 8.9, TC 5 International Cross-DomainConference, CD-ARES 2013, Regensburg, Germany, September 2-6,2013. Proceedings, 2013, pp. 118–133.
[24] C. Ernst, Y. Hmamouche, and A. Casali, “Pop: A parallel optimizedpreparation of data for data mining,” in 2015 7th International JointConference on Knowledge Discovery, Knowledge Engineering andKnowledge Management (IC3K), vol. 1. IEEE, 2015, pp. 36–45.
[25] M. Lichman, “UCI machine learning repository,” 2013. [Online].Available: http://archive.ics.uci.edu/ml
[26] D. U. Wutsqa, S. G. Subanar, and Z. Sujuti, “Forecasting performance ofvar-nn and varma models,” in Proceedings of the 2nd IMT-GT RegionalConference on Mathematics, 2006.
[27] D. C. Montgomery, C. L. Jennings, and M. Kulahci, Introduction totime series analysis and forecasting. John Wiley & Sons, 2015.
[28] J. Schmidhuber, “Deep learning in neural networks: An overview,”Neural Networks, vol. 61, 2015, pp. 85–117.
[29] S. Graves, “The fints package,” 2008. [Online]. Available: https://cran.r-project.org/web/packages/FinTS/

179
International Journal on Advances in Software, vol 9 no 3 & 4, year 2016, http://www.iariajournals.org/software/
2016, © Copyright by authors, Published under agreement with IARIA - www.iaria.org
Business Process Model Customisation usingDomain-driven Controlled Variability
Management and Rule Generation
Neel Mani, Markus Helfert
ADAPT Centre for Digital Content TechnologyDublin City University, School of Computing
Dublin, IrelandEmail: [nmani|mhelfert]@computing.dcu.ie
Claus Pahl
Free University of Bozen-BolzanoFaculty of Computer Science
Bolzano, ItalyEmail: [email protected]
Abstract—Business process models are abstract descriptions andas such should be applicable in different situations. In orderfor a single process model to be reused, we need supportfor configuration and customisation. Often, process objects andactivities are domain-specific. We use this observation and allowdomain models to drive the customisation. Process variabilitymodels, known from product line modelling and manufacturing,can control this customisation by taking into account the domainmodels. While activities and objects have already been studied, weinvestigate here the constraints that govern a process execution.In order to integrate these constraints into a process model,we use a rule-based constraints language for a workflow andprocess model. A modelling framework will be presented as adevelopment approach for customised rules through a featuremodel. Our use case is content processing, represented by anabstract ontology-based domain model in the framework andimplemented by a customisation engine. The key contributionis a conceptual definition of a domain-specific rule variabilitylanguage.
Keywords–Business Process Modelling; Process Customisation;Process Constraints; Domain Model; Variability Model; ConstraintsRule Language; Rule Generation.
I. INTRODUCTION
Business process models are abstract descriptions thatcan be applied in different situations and environments. Toallow a single process model to be reused, configuration andcustomisation features help. Variability models, known fromproduct line engineering, can control this customisation. Whileactivities and objects have already been subject of customisa-tion research, we focus on the customisation of constraints thatgovern a process execution here. Specifically, the emergence ofbusiness processes as a services in the cloud context (BPaaS)highlights the need to implement a reusable process resourcetogether with a mechanism to adapt this to consumers [1].
We are primarily concerned with the utilisation of aconceptual domain model for business process management,specifically to define a domain-specific rule language forprocess constraints management. We present a conceptualapproach in order to define a Domain Specification Rule Lan-guage (DSRL) for process constraints [2] based on a VariabilityModel (VM). To address the problem, we follow a feature-based approach to develop a domain-specific rule language,
borrowed from product line engineering. It is beneficial tocapture domain knowledge and define a solution for possiblytoo generic models through using a domain-specific language(DSL). A systematic DSL development approach provides thedomain expert or analyst with a problem domain at a higherlevel of abstraction. DSLs are a favourable solution to directlyrepresent, analyse, develop and implement domain concepts.DSLs are visual or textual languages targeted to specificproblem domains, rather than general-purpose languages thataim at general software problems. With these languages ormodels, some behaviour inconsistencies of semantic propertiescan be checked by formal detection methods and tools.
Our contribution is a model development approach usingof a feature model to bridge between a domain model (herein ontology form) and the domain-specific rule extension of abusiness process to define and implement process constraints.The feature model streamlines the constraints customisation ofbusiness processes for specific applications, bridging betweendomain model and rule language. The novelty lies in the useof software product line technology to customise processes.
We use digital content processing here as a domain contextto illustrate the application of the proposed domain-specifictechnique (but we will also look at the transferability toother domains in the evaluation). We use a text-based contentprocess involving text extraction, translation and post-editingas a sample business process. We also discuss a prototypeimplementation. However, note that a full integration of allmodel aspects is not aimed at as the focus here is on models.The objective is to outline principles of a systematic approachtowards a domain-specific rule language for content processes.
The paper is organised as follows. We discuss the State-of-the-Art and Related Work in Section II. Here, we reviewprocess modelling and constraints to position the paper. InSection III, we introduce content processing from a feature-oriented DSL perspective. Section IV introduces rule languagebackground and ideas for a domain-based rule language. Wethen discuss formal process models into which the rule lan-guage can be integrated. Then, we describe the implementationin Section V and evaluate the solution in Section VI.

180
International Journal on Advances in Software, vol 9 no 3 & 4, year 2016, http://www.iariajournals.org/software/
2016, © Copyright by authors, Published under agreement with IARIA - www.iaria.org
Figure 1. Sample content lifecycle process.
II. STATE-OF-THE-ART AND RELATED WORK
Current open research concerns for process managementinclude customisation of governance and quality policies andthe non-intrusive adaptation of processes to policies. Today,one-size-fits-all service process modelling and deploymenttechniques exist. However, their inherent structural inflexibilitymakes constraints difficult to manage, resulting in significantefforts and costs to adapt to individual domains needs.
A. SPL and Variability ModelingRecently, many researchers have started applying software
product line (SPL) concepts in service-oriented computing[3], [4], [5], [6]. We focus on approaches that used the SPLtechnique for process model configuration. For instance, [7]proposes a BPEL customization process, using a notion ofa variability descriptor for modeling variability points in theprocess layer of service-oriented application.
There are many different approaches of process basedvariability in service compositions, which enable reuse andmanagement of variability and also support Business Processes[8], [9]. Sun [9] proposes an extended version of COVAMOF;the proposed framework is based on a UML profile forvariability modeling and management in web service basedsystems of software product families. PESOA [10] is vari-ability mechanism represented in UML (activity diagram andstate machines) and BPMN for a basic process model, whichhas non-functional characteristics, like maintenance of thecorrectness of a syntactical process. Mietzner et al. [7] proposevariability descriptors that can be used to mark variability inthe process layer and related artifacts of a SaaS application.The SaaS application template allows to customise processes.
B. Dynamic BPEL/BPMN AdaptationThere is related work in the field of constraints and policy
definition and adaptive BPEL processes. While here a notationsuch as BPMN is aimed at, there is more work on WS-BPELin our context. Work can be distinguished into two categories.
• BPEL process extensions designed to realize platform-independence: Work in [11] and [12] allows BPELspecifications to be extended with fault policies, i.e.,rules that deal with erroneous situations. SRRF [13]
generates BPEL processes based on defined handlingpolicies. We do not bind domain-specific policies intobusiness processes directly, as this would not allow tosupport user/domain-specific adaptation adequately.
• Platform-dependent BPEL engines: Dynamo [40] islimited in that BPEL event handlers must be staticallyembedded into the process prior to deployment (recov-ery logic is fixed and can only be customised throughthe event handler). It does not support customisationand adaptation. PAWS [2] extends the ActiveBPELengine to enact a flexible process that can changebehaviour dynamically, according to constraints.
Furthermore, process-centricity is a concern. Recently,business-processes-as-a-service (BPaaS) is discussed. Whilenot addressed here as a cloud technology specifically, this per-spective needs to be further complemented by an architecturalstyle for its implementation [14]. We propose a classificationof several quality and governance constraints elsewhere [15]:authorisation, accountability, workflow governance and quality.This takes the BPMN constraints extensions [16], [11] intoaccount that suggest containment, authorisation and resourceassignment as categories into account, but realises these in aless intrusive process adaptation solution.
The DSRL is a combination of rules and BPMN. Moreover,DSLR process based on BPMN and ECA rules is the mainfocus on the operational part of the DSRL system (i.e., to checkconditions and perform actions based on an event of a BPMNprocess). There is no need for a general purpose language ina DSLR, though aspects are present in the process language.[17], [18], [19] discuss business process variability, though pri-marily from a structural customisation perspective. However,[17] also uses an ontology-based support infrastructure [20].
Several research works related to dynamic adaptation ofservice compositions have tended to implement variabilityconstructs at the language level [21]. For example, VxBPEL[22] is an extension of the BPEL language allowing to capturevariation points and configurations to be defined for a processin a service-centric system. SCENE [23] is also a language forcomposition design which, extends WS-BPEL by defining themain business logic and Event Condition Action (ECA) rulesthat define consequences to guide the execution of binding
181
International Journal on Advances in Software, vol 9 no 3 & 4, year 2016, http://www.iariajournals.org/software/
2016, © Copyright by authors, Published under agreement with IARIA - www.iaria.org
and rebinding self-configuration operations. Rules are used toassociate a WS-BPEL workflow with the declaration of thepolicy to be used during (re)configuration.
C. Configuration Process Models and TemplatesRecent years have resulted in a rising interest in supporting
flexibility for process model activities. Most process designtechniques lead to rigid processes where business policies arehard-coded into the process schema, hence reducing flexibility.Flexible process variants can be configured by using rules toa generic process template. This leads to a split the businesspolicy and control flow. This structure can facilitate processvariant configuration and retrieval [24], [25].
A multi-layered method for configuring process variantsfrom the base layer is presented in [26]. The Provop approach[27] allows a user to manage and design to create processvariants from a base process (i.e., a process template) withvarious options. Mohan et al. [28] discuss the automaticidentification of inconsistencies resulting in the customisationof business process model and configuration procedure. TheMoRE-WS tool [4] activates and deactivates features in avariability model. The changed variability model updates thecomposite models and its services that add and remove afragment of WS-BPEL code at runtime. However, the tooluses services instead of direct code, but the dependency onprogramming and code is always associated with it. Lazoviket al. [29] developed a service-based process-independentlanguage to express different customization options for thereference business processes.
Only a few rule language solutions consider the customiza-tion and configuration of a process model in a domain-specificenvironment. An exception is the work of Akhil and Wen[24] where the authors propose an template and rule fordesign and management of flexible process variant. Therefore,the rule template based configuration can adopt the mostfrequently used process. Since enterprise business processeschange rapidly, the rule-based template cannot be adapted inchanging situations. We need a solution that can be operated bynon-technical domain experts without a semantic gap betweendomain expert design and development. The solution shouldbe flexible, easy to adapt and easy to configure in terms ofusability. Therefore, we have propose a domain-specific rulelanguage, which resolves the domain constraints during thecustomisation process and a framework through which non-technical domain users can customise BPM with the generatedset of domain-specific rules (DSRs).
D. Positioning the ApproachAt the core of our solution is a process model that defines
possible behaviour. This is made up of some frame of referencefor the system and the corresponding attributes used to describethe possible behaviour of the process [30], [31]. The set ofbehaviours constitutes a process referred to as the extensionof the process and individual behaviours in the extension arereferred as instances. Constraints can be applied at states ofthe process to determine its continuing behaviour dependingon the current situation. We use rules to combine a condition(constraint) with a resulting action [32], [33]. The target of ourrule language (DSRL) is a standard business process notation(as in Figure 1). Rules shall thus be applied at the processingstates of the process.
Our application case study is intelligent content processing.Intelligent content is digital content that allows users to create,curate and consume content in a way that satisfies dynamicand individual requirements relating to task design, context,language, and information discovery. The content is stored,exchanged and processed by a Web architecture and data willbe exchanged, annotated with meta-data via web resources.Content is delivered from creators to consumers. Content fol-lows a particular path, which contains different stages such asextraction and segmentation, name entity recognition, machinetranslation, quality estimation and post-editing. Each stage inthe process has its own complexities governed by constraints.
We assume the content processing workflow as in Figure1 as a sample process for the rule-based instrumentation ofprocesses. Constraints govern this process. For instance, thequality of a machine-based text translation decides whetherfurther post-editing is required. Generally, these constraintsare domain-specific, e.g., referring to domain objects, theirproperties and respective activities on them.
III. DOMAIN AND FEATURE MODEL
Conceptual models (CM) are part of the analysis phase ofsystem development, helping to understand and communicateparticular domains [2]. They help to capture the requirementsof the problem domain and, in ontology engineering, a CM isthe basis for a formalized ontology. We utilise a conceptualdomain model (in ontology form) to derive a domain-specificprocess rule language [34]. A domain specific language (DSL)is a programming or specification language that supports aparticular application domain through appropriate notation,grammar and abstractions [35]. DSL development requiresboth domain knowledge and language development expertise.A prerequisite for designing DSLs is an analysis that providesstructural knowledge of the application domain.
A. Feature ModelThe most important result of a domain analysis is a feature
model [36], [37], [38], [39]. A feature model covers both theaspects of software family members, like commonalities andvariabilities, and also reflects dependencies between variablefeatures. A feature diagram is a graphical representation ofdependences between a variable feature and its components.Mandatory features are present in a concept instance if theirparent is present. Optional features may be present. Alternativefeatures are a set of features from which one is present.Groups of features are a set of features from which a subset ispresent if their parent is present. ‘Mutex’ and ‘Requires’ arerelationships that can only exist between features. ‘Requires’means that when we select a feature, the required featuredmust be selected too. ‘Mutex’ means that once we choose afeature the other feature must be excluded (mutual exclusion).
A domain-specific feature model can cover languages,transformation, tooling, and process aspects of DSLs. Forfeature model specification, we propose the FODA (FeatureOriented Domain Analysis) [40] method. It represents all theconfigurations (called instances) of a system, focusing on thefeatures that may differ in each of the configurations [41]. Weapply this concept to constraints customisation for processes.The Feature Description Language (FDL) [42] is a languageto define features of a particular domain. It supports anautomated normalization of feature descriptions, expansion to

182
International Journal on Advances in Software, vol 9 no 3 & 4, year 2016, http://www.iariajournals.org/software/
2016, © Copyright by authors, Published under agreement with IARIA - www.iaria.org
Figure 2. Feature model for intelligent content (note that the darker grey boxes will be detailed further in Figure 3).
disjunctive normal form, variability computation and constraintsatisfaction. It shall be applied to the content processing usecase here. The basis here is a domain ontology called GLOBIC(global intelligent content), which has been developed as partof our research centre. GLOBIC elements are prefixed by ‘gic’.
Feature diagrams are a FODA graphical notation. They canbe used for structuring the features of processes in specificdomains. Figure 2 shows a feature diagram for the GLOBICcontent extraction path, i.e., extraction as an activity thatoperates on content in specified formats. This is the first step ina systematic development of a domain-specific rule language(DSRL) for GLOBIC content processing use case. Here allelements are mandatory. The basic component gic:Contentconsists of a gic:Extraction element, a mandatory feature.A file is a mandatory component of gic:Extraction and itmay either be used for Document or Multimedia elementsor both. The closed triangle joining the lines for documentand multimedia indicates a non-exclusive (more-of) choicebetween the elements. The gic:Text has two mandatory statesSource and Target. Source contains ExtractedText and Targetcan be TranslationText. Furthermore, expanding the featureSentence is also a mandatory component of ExtractedText.The four features Corpora, Phrase, Word and Grammar aremandatory. On the other side of gic:Text, a TranslationText isa mandatory component of Target, also containing a mandatorycomponent Translation. A Translation has three components:TranslationMemory and Model are mandatory features, Qual-ity could also be made an optional feature. A Model may
be used as a TranslationModel or a LanguageModel or bothmodels at same time. An instance of a feature model consists ofan actual choice of atomic features matching the requirementsimposed by the model. An instance corresponds to a textconfiguration of a gic:Text superclass.
The feature model might include for instance duplicate ele-ments, inconsistencies or other anomalies. We can address thissituation by applying consistency rules on feature diagrams.Each anomaly may indicate a different type of problem. Thefeature diagram algebra consists of four set of rules [41]:
• Normalization Rules – rules to simplify the featureexpression by redundant feature elimination and nor-malize grammatical and syntactical anomalies.
• Expansion Rules – a normalized feature expressioncan be converted into a disjunctive normal form.
• Satisfaction Rules – the outermost operator of a dis-junctive normal form is one-of. Its arguments are‘All’ expressions with atomic features as arguments,resulting in a list of all possible configurations.
• Variability Rules – feature diagrams describe systemvariability, which can be quantified (e.g., number ofpossible configurations).
The feature model is important for the construction of therule language (and thus the process customisation) here. Thus,checking internal coherence and providing a normalised formatis important for its accessibility for non-technical domain

183
International Journal on Advances in Software, vol 9 no 3 & 4, year 2016, http://www.iariajournals.org/software/
2016, © Copyright by authors, Published under agreement with IARIA - www.iaria.org
experts. In our setting, the domain model provides the semanticdefinition for the feature-driven variability modelling.
B. Domain ModelSemantic models have been widely used in process man-
agement [43], [44]. This ranges from normal class models tocapture structural properties of a domain to full ontologiesto represent and reason about knowledge regarding the ap-plication domain or also the technical process domain [45],[46]. Domain-specific class diagrams are the next step froma feature model towards a DSL definition. A class is definedas a descriptor of a set of objects with common propertiesin terms of structure, behaviour, and relationships. A classdiagram is based on a feature diagram model and helps tostabilise relationship and behaviour definitions by adding moredetails to the feature model. Note that there is an underlyingdomain ontology here, but we use the class aspects only (i.e.,subsumption hierarchy only).
In the content use case, class diagrams of gic:Contentand its components based on common properties are shownin Figure 3. The class diagram focuses on gic:Text, whichrecords at top level only the presence of source and target.The respective Source and Target text strings are included inthe respective classes. The two major classes are Text (Doc-ument) and Movie files (Multimedia), consisting of differenttype of attributes like content:string, format:string, or frame-rate:int. Figure 3 is the presentation of an extended part of thegic:Content model. For instance, gic:Text is classified into thetwo subclasses Source and Target. One file can map multipletranslated texts or none. gic:Text is multi-language content(source and target content). Extracted Text is text from sourcecontent for the purposes target translation. Translated Text is atext after translation. Corpora is a set of structured texts. It maybe single or multi language. gic:Sentence is a linguistic unitor combination of words with linked grammar. gic:Translationis content generated by a machine from a source languageinto a target language. A Grammar is set of structural rules.gic:QualityAssessment is linguistic assessment of translationin term of types of errors/defects. A Translation Memoryis a linguistic database that continually captures previoustranslations for reuse.
Both domain and feature model feed into the processcustomisation activity, see Figure 4.
IV. CONSTRAINTS RULE LANGUAGE
Rule languages typically borrow their semantics from logicprogramming [47]. A rule is defined in the form of if-thenclauses containing logical functions and operations. A rulelanguage can enhance ontology languages, e.g., by allowingone to describe relations that cannot be described using forinstance description logic (DL) underlying the definition ofOWL (Ontology Web Language). We adopt Event-Condition-action (ECA) rules to express rules on content processingactivities. The rules take the constituent elements of theGLOBIC model into account: content objects (e.g., text) thatare processed and content processing activities (e.g., extractionor translation) that process content objects. ECA rules are thendefined as follows:
• Event: on the occurrence of an event ...• Condition: if a certain condition applies ...
• Action: then an action will be taken.
Three sample ECA rule definitions are:
• On uploading a file from user and if the filetype isvalid, then progress to Extraction.
• On a specific key event and Text is inputted by theuser and if text is valid, then progress Process toSegmentation.
• On a specific key event and a Web URL input isprovided by user and if URL is valid, then progressto Extraction and Segmentation.
The rule model is designed for a generic process. An exampleshall illustrate ECA rules for ‘extraction’ as the activity.Different cases for extraction can be defined using featuremodels to derive customised versions:
• We can customise rules for specific content types (textfiles or multimedia content).
• We can also vary according to processing activities(extraction-only or extraction&translation).
The example below illustrates rule definitions in more concreteXML syntax. Here the rule is that a document must be post-edited before sent for QA-Rating:
<p1:Policy policyId="QA-Rate-policy1" priority="0"><p1:Objects><p1:ObjectsAnyOf><p1:ObjectsAllOf><p1:Activity><Name>QA-Rate crowd-sourced</Name>
</p1:Activity></p1:ObjectsAllOf>
</p1:ObjectsAnyOf></p1:Objects>
<p1:ActivityStates><p1:ActivityState>Validating-Pre</p1:ActivityState>
</p1:ActivityStates>
<p1:Rule priority="0"ruleId="constraintRule-QA-Rate">
<p1:Conditions><p1:ConditionExpression
type="Provenance-Context"><p1:Para>//Document/ID</p1:Para><p1:Expr>constraintRule-QA-Rate-Query</p1:Expr>
</p1:ConditionExpression></p1:Conditions>
<p1:Actions><p1:Pa-Violate><p1:Violation><Type>Functional:Protocol</Type>
</p1:Violation></p1:Pa-Violate>
</p1:Actions>
<p1:FaultHandler><p1:Ca-Log level="5"> </p1:Ca-Log>
</p1:FaultHandler></p1:Rule>
In the example of a rule above, there is one constraint ruleand a fault rule (the fault rule details themselves are skippedin the code). The policy (combination of rules) targets the”QA-Rate crowd-sourced” activity before it is executed. The

184
International Journal on Advances in Software, vol 9 no 3 & 4, year 2016, http://www.iariajournals.org/software/
2016, © Copyright by authors, Published under agreement with IARIA - www.iaria.org
Figure 3. Domain model for intelligent content.
constraint rule has a condition on the provenance context or thedocument history. A parameterized query (e.g., in SPARQL –Semantic Protocol and RDF Query Language) could check ifthe current document (using the document ID as parameter)has NOT been post-edited. If the condition is true, then therule results in a functional:Protocol violation. A fault rule canbe defined for handling the violation. The policy will cancelthe current process, if no remedy action was found in the faultrule for violation handling.
A. Rule Language Basics
We define the rule language as follows using GLOBIC con-cepts in the ECA-format with events, conditions and actions (tobegin with, we use some sample definitions here to illustratekey concepts before providing a more complete definition lateron). The core format of the rule is based on events, conditionsand actions. Events are here specific to the application context,e.g., (file) upload, (text) translation or (information) extraction.
gic:Rule ::= [gic:Event] ‖ [gic:Cond] ‖ [gic:Action]gic:Event::= Upload ‖ Translate ‖ Extract
While the rule syntax is simple, the important aspect is thatthat the syntactic elements refer to the domain model, givingit semantics and indicating variability points. Variability pointsare, as explained, defined in the feature model. The above threeexamples from the beginning of the section can be formalisedusing this notation. Important here is the guidance in definingrules that a domain expert gets through the domain model as ageneral reference framework and the feature model definitionto understand and apply the variability points.
B. Rule Categories for Process CustomizationTo further understand the rule language, looking at prag-
matics such as rule categories is useful. The rules formalised inthe rule language introduced above are a syntactical construct.Semantically, we can distinguish a number of rule categories:
• Control flow rules are used for amending the controlflow of a process model based on validation or casedata. There are several customisation operations, likedeleting, inserting, moving or replacing a task. Inaddition, they are moving or swapping and changingthe relationship between two or more tasks.
• Resource rules depend on resource-based actions orvalidation of processes. They are based on conditionaldata or case data.
• Data rules are associated with properties or attributesof a resource related to a case.
• Authorisation rules and access control rules, i.e., therights and roles defined for users, which is a key com-ponent in secure business processes that encouragestrust for its contributing stakeholders [43].
• An authentication rule expresses the need to verify aclaimed identity in an authentication process.
• Hybrid rules concern the modification of several as-pects of process design. For example, they might alterthe flow of control of a process as well as change theproperties of a resource.
C. Control Flow Rule ExamplesAs an example for the rule language, a few control flow
rules (first category above) shall be given for illustration.
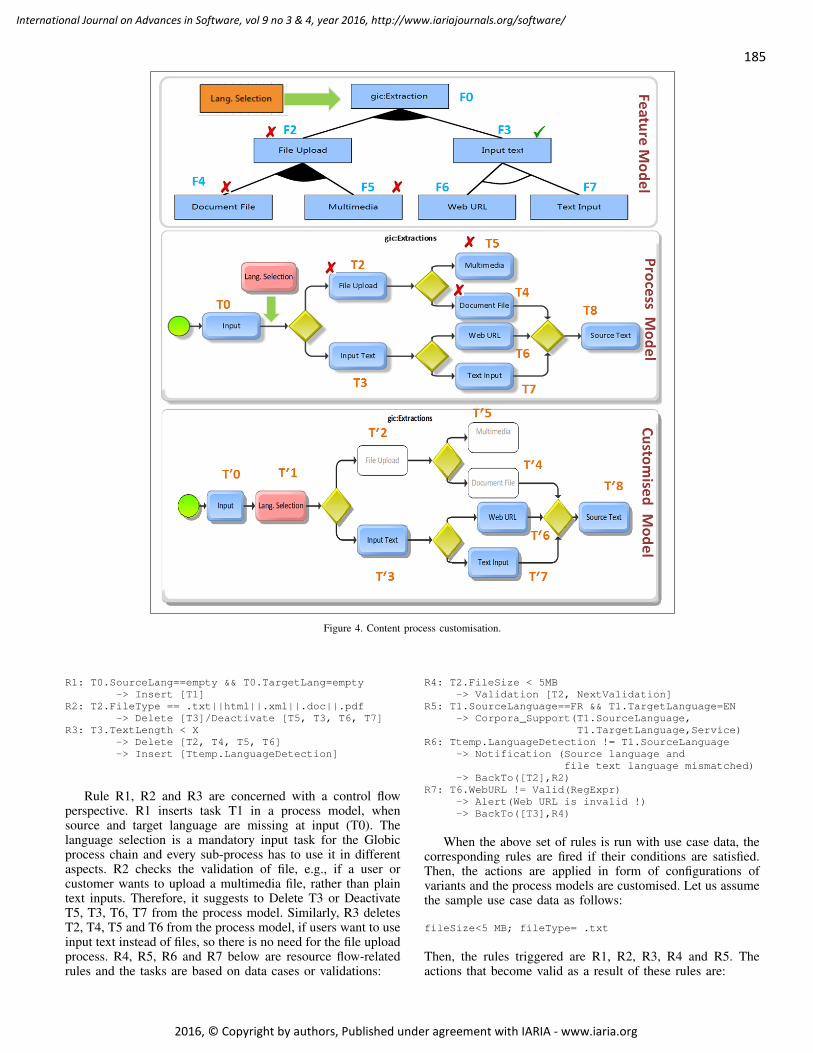
185
International Journal on Advances in Software, vol 9 no 3 & 4, year 2016, http://www.iariajournals.org/software/
2016, © Copyright by authors, Published under agreement with IARIA - www.iaria.org
Figure 4. Content process customisation.
R1: T0.SourceLang==empty && T0.TargetLang=empty-> Insert [T1]
R2: T2.FileType == .txt||html||.xml||.doc||.pdf-> Delete [T3]/Deactivate [T5, T3, T6, T7]
R3: T3.TextLength < X-> Delete [T2, T4, T5, T6]-> Insert [Ttemp.LanguageDetection]
Rule R1, R2 and R3 are concerned with a control flowperspective. R1 inserts task T1 in a process model, whensource and target language are missing at input (T0). Thelanguage selection is a mandatory input task for the Globicprocess chain and every sub-process has to use it in differentaspects. R2 checks the validation of file, e.g., if a user orcustomer wants to upload a multimedia file, rather than plaintext inputs. Therefore, it suggests to Delete T3 or DeactivateT5, T3, T6, T7 from the process model. Similarly, R3 deletesT2, T4, T5 and T6 from the process model, if users want to useinput text instead of files, so there is no need for the file uploadprocess. R4, R5, R6 and R7 below are resource flow-relatedrules and the tasks are based on data cases or validations:
R4: T2.FileSize < 5MB-> Validation [T2, NextValidation]
R5: T1.SourceLanguage==FR && T1.TargetLanguage=EN-> Corpora_Support(T1.SourceLanguage,
T1.TargetLanguage,Service)R6: Ttemp.LanguageDetection != T1.SourceLanguage
-> Notification (Source language andfile text language mismatched)
-> BackTo([T2],R2)R7: T6.WebURL != Valid(RegExpr)
-> Alert(Web URL is invalid !)-> BackTo([T3],R4)
When the above set of rules is run with use case data, thecorresponding rules are fired if their conditions are satisfied.Then, the actions are applied in form of configurations ofvariants and the process models are customised. Let us assumethe sample use case data as follows:
fileSize<5 MB; fileType= .txt
Then, the rules triggered are R1, R2, R3, R4 and R5. Theactions that become valid as a result of these rules are:

186
International Journal on Advances in Software, vol 9 no 3 & 4, year 2016, http://www.iariajournals.org/software/
2016, © Copyright by authors, Published under agreement with IARIA - www.iaria.org
Action 1: Insert [T1]Action 2: Delete [T3]/Deactivate [T5, T3, T6, T7]Action 3: Insert [Ttemp.LanguageDetection]Action 4: Validation [T2, NextValidation]Action 5: Corpora_Support(T1.Source,T1.Target,Service)Action 6: Notification (Exception/Validation message)
D. Rule Language DefinitionNow we go back to the full rule definition. The Domain
Specific Rule Language (DSRL) grammar is defined as fol-lows. We start with a generic skeleton that will then be mappedto the Globic domain model.
<DSRL Rules> ::= <EventsList><RulesList><ProcessModelList>
<EventLists> ::= <Event> | <Event> <EventLists><Event> ::= EVENT <EventName> IF <Expression> |
EVENT <EventName> is INTERN or EXTERN<RulesList> ::= <Rule> | <Rule> <RuleList><Rule> ::= ON<EventName>
IF<Condition>DO<ActionList><ActionList> ::= <ActionName> |
<ActionName>,<ActionList><ProcessModelList> ::= <ProcessModel> |
<ProcessModel>,<ProcessModelList><ProcessModel> ::= PROCESSMODEL <ProcessModelName>
where a named process model PROCESSMODEL is defined by:
[TRANSITION_SEQUENCIAL (DISCARD|DELAY)],[TRANSITION_PARALLEL (DISCARD|DELAY)][INPUTS(<InputList>)] [OUTPUTS(<OutputList>)]
TRANSITION_SEQUENCIAL and TRANSITION_PARAL-LEL are transitions of a workflow.
The description of the DSRL contains lists of events, rulesand workflow states. An event can be internal or external(for rules generated as an action, it may be INTERNAL orEXTERNAL) or be generated when the expression becomestrue. An event name is activated with the ON expression, whichis a Boolean expression to determine the particular conditionsthat apply and the list of actions that have to be performedwhen event and condition are matched or true (preceded by DOexpression). The workflow contains the state name, a certainpolicy to be activated in the workflow when sequential andparallel actions to perform. DISCARD allows discarding all theinstructions, but the current one and DELAY allows delayingall instructions, but the current one.
EVENT gic:FileUpload::BOOL && gic:FileSelect::BOOLIF FileUpload_ONON exists
IF (gic:FileType ==True)DO
ON existsIF (gic:FileSize <5MB)DO gic:Translate(File)ELSE Notification(File size < 5 MB)
ELSE Notification(File format is invalid)
The grammar of the DSRL (in its form specific to theGLOBIC mapping, with events, conditions and actions thatare domain-specific) is defined as follows:
List of Events:
Event_List ::=gic:File->FileUpload, gic:Text->TextEnd,
gic:Text->Parsing, gic:Text->MTStart,gic:Text->MTEnd, gic:Text-> QARating, ...
Expr ::= gic:Content.Attributes
List of Conditions:
<Condition_List>::=<gic:Extraction.Condition>| <gic:Segmentation.Condition>| <gic:MachineTranslation.Condition>| <gic:QualityAssesment>| <gic:PostEdit>
<gic:Extraction.Condition> ::= // EXTRACTIONIF (<gic:File.FileType(X)::=FileList> )| IF (<gic:File.FileSize::=<Y>)| IF (<gic:Text.Length::=<L>)| IF (<Source.Language::=Language_List>)| IF (<Target.Language::=Language_List>)| IF (<MultiLanguageText(gic:Text)::=T|F>)| IF (<SingleLanguageDetect(gic:Text)::=T|F>)
where X is the file type, Y is the size of file (in MB) and Lis the length of the text.
<gic:Segmentation.Condition)>::= // SEGMENTATIONIF (<IsDictionaries(Source.Lang)::=T|F>)| IF (<IsDictionaries(Target.Lang)::=T|F>)| IF (<IsParCorpus(Source.Lang,Target.Lang)::=T|F>)| IF (<IsParLexicon(Source.Lang,Target.Lang)::=T|F>)| IF (<nic:Sentence.WordCount::=<WInteger>)| IF (<IsTreeParsing(nic:Sentence)::=T|F)>)
where WInteger is the word count of the source sentence ortarget sentence.
<gic:Translation.Condition)> ::= // TRANSLATIONIF (<gic:Translation(Source.Lang, Target.Lang,
gic:Text) ::= T|F>)| IF (<gic:Translation.Memory ::= <TM)(Mem Underfl)| IF (<gic:Translation.Memory ::= >TM)(Mem Overfl)| IF (<gic:Translation(gic:TxtSource,Source.Lang)>
gic:Translation(gic:TxtTarget,Target.Lang)>)
<gic:Quality.Condition> ::=IF (<gic:Quality.TER(gic:TextTarget)::=<TERNo>)| IF (<gic:Quality.WER(gic:TextTarget)::=<WERNo>)
where TM is the specific memory size, TERNo is the Trans-lation Error Rate number and WERNo is the Word Error Ratenumber.
Source language and target language are elementsof a language list. We assume a Language_List(L)= L1,L2,L3,,Ln with Source.Language(Ls)∈ Language_List and Target.Language(Lt) ∈Language_List.
Actions can be state-specific constraint validations. Theprocess can move to the next state. Acknowledgementsare notifications messages to the user. The GIC process isembedded in the Provenance context that records Agent,Association and Activity.
List of Actions in the GIC domain:
ActionList ::= <Validation->Validation.Next><Process->Next> ,<Acknowledgement><Process->Provenance>
<Acknowledgement>::= <Ack_Msg>|<Ack_Msg_List>

187
International Journal on Advances in Software, vol 9 no 3 & 4, year 2016, http://www.iariajournals.org/software/
2016, © Copyright by authors, Published under agreement with IARIA - www.iaria.org
< Ack_Msg_List> ::= <Validation.Msg_Display>|<System.Error>|<System.Delay>|<Process.Active>|<Process.Stop>|<Process.Abort>|<Process.End> (Finished)
<Process->Next> ::= <Process->gic:Text.Extraction>|<Process->gic:Text.GrammarCheck>|<Process->gic.Text.Name_Entity_Find>|<Process->gic:Text.Parsing>|<Process-> gic:Text.Segmentation>|<Process->gic:Translation>|<Process->gic:Quality Assessment>|<Process->PostEdit>
<Process->Provenance> ::= <prov:Agent> // PROVENANCE<prov:Association><prov:Activity>
<prov:Agent> ::= <prov:InstantaneousEvent>|<prov:AgentInfluence>|<prov:Influence>|<prov:EntityInfluence>|<prov:Delegation>|<prov:Start>|<prov:End>|<prov:Derivation>|<prov:ActivityInfluence>|<prov:Quotation>|<prov:Generation>|<prov:Revision>
<prov:Association> ::= <prov:Role>| <prov:Invalidation>|<prov:Attribution>
<prov:Activity> ::= <prov:Entity>|<prov:Communication>|<prov:Plan>|<prov:Usage>|<prov:PrimarySource>
The Global Intelligent Content (GIC) semantic model isbased on a abstract model and a content model. The abstractmodel captures the different resource types that are processed.The content model details the possible formats.
Abstract Model:
gic:Domain -> gic:Resourcegic:Resource -> gic:Services |
gic:Information Resource |gic:IdentifiedBy |gic:RefersTo |gic:AnnotatedBy
gic:InformationResource -> gic:Content | gic:Data
Content Model:
gic:Content -> gic:Content | cnt:Contentcnt:Content -> cnt:ContentAsBase64 |
cnt:ContentAsText|cnt:ContentAsXML
cnt:ContentAsBase64-> cnt:Bytescnt:ContentAsText -> cnt:Charscnt:ContentAsXML -> cnt:Rest | cnt:Version |
cnt:LeadingMisc |cnt:Standalone |cnt:DeclaredEncoding |cnt:dtDecl
cnt:dtDecl -> cnt:dtDecl | cnt:DocTypeDecl
cnt:DocTypeDecl -> cnt:DocTypeName |cnt:InternetSubset |cnt:PublicId | cnt:SystemId
V. IMPLEMENTATION
While this paper focuses on the conceptual aspects suchas models and languages, a prototype has been implemented.Our implementation (Figure 5) provides a platform that enablesbuilding configurable processes for content management prob-lems and constraints running in the Activiti (http://activiti.org/)workflow engine. In this architecture, a cloud service layer per-forms data processing using the Content Service Bus (based onthe Alfresco (https://www.alfresco.com/) content managementsystem).
This implementation is the basis of the evaluation that looksat feasibility and transferability – see Evaluation Section VI.We introduce the business models and their implementationarchitecture first, before detailing the evaluation results in thenext section.
A. Business Process ModelsA business process model (BPM) is executed as a process
in a sequential manner to validate functional and operationalbehaviour during the execution. Here, multiple participantswork in a collaborative environment based on Activiti, Alfrescoand the support services. Policy rule services define a processmap of the entire application and its components (e.g., filetype is valid for extraction, quality rating of translation). Thisprocess model consists of a number of content processingactivities such as Extraction & Segmentation, NER, MachineTranslation (MT), Quality estimation and Post-Edit.
One specific constraint, access control, shall be discussedseparately. An access control policy defines the high-levelset of rules according to the access control requirements. Anaccess control model provides the access control/authorizationsecurity policy for accessing the content activities as wellas security rights implemented in BPM services accordingto the user role. Access control mechanism enable low-levelfunctions, which implement the access controls imposed bypolicies and are normally initiated by the model architecture.
Every activity has its own constraints. The flow of entireactivities is performed in a sequential manner so that eachactivity’s output becomes input to the next. The input data isprocessed through the content service bus (Alfresco) and therule policy is applied to deal with constraints. The processeddata is validated by the validation & verification service layer.After validation, processing progresses to the next stage of theActiviti process.
B. ArchitectureThe architecture of the system is based on services and
standard browser thin clients. The application can be hostedon a Tomcat web server and all services could potentially behosted on a cloud-based server. Architecturally, we separateout a service layer, see Figure 5. Reasons to architecturallyseparate a Service Layer from the execution engine includethe introduction of loose coupling and interoperability.
The system has been developed on a 3-tier standard archi-tecture: browser-based front-end thin clients, Tomcat Appli-cation server-based middleware, distributed database serviceas data service platforms. We follow the MVC (Model View

188
International Journal on Advances in Software, vol 9 no 3 & 4, year 2016, http://www.iariajournals.org/software/
2016, © Copyright by authors, Published under agreement with IARIA - www.iaria.org
Figure 5. Prototype implementation architecture.
Controller) architecture. Multiple technologies are used tointegrate each component of the content management solution:
• Common Bus/Hub: Alfresco is providing a commonbus platform for all the activities.
• Application connectivity: Activiti and a cloud servicelayer play an important role to solve connectivityissues in the architecture.
• Data format and transformation: By using web ser-vices and other APIs, we maintain a common formatfor the entire application.
• Integration module: This module connects differentsections of the application: Activiti, data and servicebus, cloud service layer, Alfresco, and databases.
VI. EVALUATION
Explicit variability representation has benefits for the mod-elling stage. The feature and domain models control thevariability, i.e., add dependability to the process design stage.It also allows formal reasoning about families of processes.
In this evaluation, we look at utility, transferability andfeasibility. We balance this discussion by a consideration ofrestrictions and limitations.
A. UtilityThe general utility is demonstrated empirically. The domain
and feature models here specifically support domain experts.Process and Cohort. We have worked with seven experts
in the digital media and language technology space as part of
our research centre. While these were largely researchers, theirbackground was language technology and content managementand all had development experience in that space, some alsoindustrial experience. These experts were also from differentuniversities. Despite being researchers, they act as applicationdomain specialists in our case, being essentially languagetechnology experts, but not business process experts. In total,seven expert have contributed to this process. However, wecounted them as multipliiers as each of them had worked withother researchers, developers and users in industry.
Mechanism. The qualitative feedback, based on the expertinterviews as the mechanism, confirms the need to providea mechanism to customise business processes in a domain-specific way. We asked the participants about their opinion onthe expected benefit of the approach, specifically whether thiswould lead to improved efficicency in the process modellingactivities and whether the approach would be suitable for anon-expert in business modellling, with background in theapplication domain.
Results. The results of the expert interview can be sum-marised as follows:
• The experts confirm with majority (71%) that usingthe feature model, rule templates can be filled usingthe different feature aspects guided by the domainmodel without in-depth modelling expertise.
• The majority of experts (86%) in the evaluation haveconfirmed simplification or significant simplificationin process modelling.
This confirms our hypothesis in this research laid out at thebeginning.
B. TransferabilityIn addition, we looked at another process domain to assess
the transferability of the solution [48]. Learning technology asanother human-centred, domain-specific field was chosen.
Application Domain. In the learning domain, we exam-ined learner interaction with content in a learning technologysystem [49], [50]. Again, the need to provide domain expertsupport to define constraints and rules for these processesbecame evident.
Observations. Here, educators act as process modellers andmanagers [15], specifically managing the educational contentprocessing as an interactive process between learners, educa-tors and content. Having been involved in the developmentof learning technology systems for years, tailoring these tospecific courses and classes is required.
C. Feasibility AnalysisFrom a more technical perspective, we looked at the
feasibility of implementing a production system from theexisting prototype. The feasibility study (analysis of alterna-tives) is used to justify a project. It compares the variousimplementation alternatives based on their economic, technicaland operational feasibility. The steps of creating a feasibilitystudy are as follows [41]:
Determine implementation alternatives. We have discussedarchitectural choices in the Implementation.
Assess the economic feasibility for each alternative. Thebasic question is how well will the software product pay for

189
International Journal on Advances in Software, vol 9 no 3 & 4, year 2016, http://www.iariajournals.org/software/
2016, © Copyright by authors, Published under agreement with IARIA - www.iaria.org
itself? This has been looked at by performing a cost/benefitanalysis. In this case, using open-source components hashelped to reduce and justify the expenses for a researchprototype.
Assess the technical feasibility for each alternative. Thebasic question is the possibility to build the software system.The set of feasible technologies is usually the intersection ofthe aspects implementation and integration. This has beendemonstrated through the implementation with Activiti andAlfresco as core platforms that are widely used in practice.
D. Restrictions, Limitations and ConstraintsThe concerns below explain aspects, which impact on the
specification, design, or implementation of the software sys-tem. These items may also contribute to restrict the scalabilityand performance of the system as well. Because of either thecomplexity or the cost of the implementation, the quality ordelivery of the system may suffer.
Constraints that have impacted on the design of our solu-tion are the following:
• The information and data exchanging between twoactivities during workflow processing.
• User management and security of overall system in-cluding alfresco CMS, workflow engine, rule engineand CNGL2 challenges.
• Validation of different systems at runtime.• Interoperability between features and functions.• Major constraint utilisation of translation memory and
language model through services.• Process acknowledgement or transaction information
sharing between different activities of workflow.• Error tracking and tracing during transaction.
VII. CONCLUSIONS
In presenting a variability and feature-oriented develop-ment approach for a domain-specific rule language for busi-ness process constraints, we have added adaptivity to processmodelling. This benefits as follows:
• Often, business processes take domain-specific objectsand activities into account in the process specifica-tion. Our aim is to make the process specificationaccessible to domain experts. We can provide domainexperts with a set of structured variation mechanismsfor the specification, processing and management ofprocess rules as well as managing frequency changesof business processes along the variability scheme atfor notations like BPMN.
• The technical contribution core is a rule generationtechnique for process variability and customisation.The novelty of our approach is a focus on processconstraints and their rule-based management, advanc-ing on structural variability. The result is flexible cus-tomisation of processes through constraints adaptation,rather than more intrusive process restructuring.
Cloud-based business processes-as-a-service (BPaaS) as anemerging trend signifies the need to adapt resources such asprocesses to different consumer needs (called customisation of
multi-tenant resources in the cloud) [51]. Furthermore, self-service provisioning of resources also requires non-expert tomanage this configuration. BPaaS relies on providing processesas customisable entities. Targeting constraints as the customi-sation point is clearly advantageous compared to customisa-tion through restructuring. For BPaaS, if a generic serviceis provided to external users, the dynamic customisation ofindividual process instances would require the utilisation of acoordinated approach, e.g., through using a coordination model[52], [53]. Other architecture techniques can also be used tofacilitate flexible and lightweight cloud-based provisioning ofprocess instances, e.g., through containerisation [54].
We also see the need for further research that focuses onhow to adapt the DSRL across different domains and how toconvert conceptual models into generic domain-specific rulelanguage, which are applicable to other domains. So far, thistranslation is semi-automatic, but shall be improved with asystem that learns from existing rules and domain models,driven by the feature approach, to result in an automated DSRLgeneration.
ACKNOWLEDGMENT
This material is based upon works supported by the ScienceFoundation Ireland under Grant No. 07/CE/I1142 as part of theCentre for Global Intelligent Content (www.cngl.ie) at DCU.
REFERENCES
[1] N. Mani and C. Pahl, ”Controlled Variability Management for BusinessProcess Model Constraints,” International Conference on Software En-gineering Advances ICSEA’2015, pp. 445-450. 2015.
[2] O. Tanrver and S. Bilgen, ”A framework for reviewing domain specificconceptual models,” CompStand & Interf, vol. 33, pp. 448-464, 2011.
[3] M. Asadi, B. Mohabbati, G. Groner, and D. Gasevic, ”Developmentand validation of customized process models,” Journal of Systems andSoftware, vol. 96, pp. 73-92, 2014.
[4] G. H. Alferez, V. Pelechano, R. Mazo, C. Salinesi, and D. Diaz,”Dynamic adaptation of service compositions with variability models,”Journal of Systems and Software, vol. 91, pp. 24-47, 2014.
[5] J. Park, M. Moon, and K. Yeom, ”Variability modeling to develop flexibleservice-oriented applications,” Journal of Systems Science and SystemsEngineering, vol. 20, pp. 193-216, 2011.
[6] M. Galster and A. Eberlein, ”Identifying potential core assets in service-based systems to support the transition to service-oriented product lines,”in 18th IEEE International Conference and Workshops on Engineeringof Computer Based Systems (ECBS), pp. 179-186. 2011.
[7] R. Mietzner and F. Leymann, ”Generation of BPEL customizationprocesses for SaaS applications from variability descriptors,” in IEEEInternational Conference on Services Computing, pp. 359-366. 2008.
[8] T. Nguyen, A. Colman, and J. Han, ”Modeling and managing variabilityin process-based service compositions,” in Service-Oriented Computing,Springer, pp. 404-420, 2011.
[9] C.-A. Sun, R. Rossing, M. Sinnema, P. Bulanov, and M. Aiello, ”Model-ing and managing the variability of Web service-based systems,” Journalof Systems and Software, vol. 83, pp. 502-516, 2010.
[10] F. Puhlmann, A. Schnieders, J. Weiland, and M. Weske, ”Variabilitymechanisms for process models,” PESOA-Report TR17, pp. 10-61, 2005.
[11] M. L. Griss, J. Favaro, and M. d’Alessandro, ”Integrating featuremodeling with the RSEB,” in International Conference on SoftwareReuse, 1998, pp. 76-85.
[12] D. Beuche, ”Modeling and building software product lines with purevariants,” in International Software Product Line Conference, Volume 2,2012, pp. 255-255.
[13] T. Soininen and I. Niemel, ”Developing a declarative rule language forapplications in product configuration,” in practical aspects of declarativelanguages, ed: Springer, 1998, pp. 305-319.

190
International Journal on Advances in Software, vol 9 no 3 & 4, year 2016, http://www.iariajournals.org/software/
2016, © Copyright by authors, Published under agreement with IARIA - www.iaria.org
[14] S. Van Langenhove, ”Towards the correctness of software behavior inuml: A model checking approach based on slicing,” Ghent Univ, 2006.
[15] C. Pahl and N. Mani. ”Managing Quality Constraints in Technology-managed Learning Content Processes,” In: EdMedia’2014 Conference onEducational Media and Technology. 2014.
[16] K. C. Kang, S. Kim, J. Lee, K. Kim, E. Shin, and M. Huh, ”FORM: Afeature-oriented reuse method with domain-specific reference architec-tures,” Annals of Software Engineering, vol. 5, pp. 143-168, 1998.
[17] M.X. Wang, K.Y. Bandara, and C. Pahl, ”Process as a service dis-tributed multi-tenant policy-based process runtime governance,” IEEEInternational Conference on Services Computing, IEEE, 2010.
[18] Y. Huang, Z. Feng, K. He, and Y. Huang, ”Ontology-based configura-tion for service-based business process model,” In: IEEE InternationalConference on Services Computing, pp. 296303. 2013.
[19] N. Assy, W. Gaaloul, and B. Defude, ”Mining configurable processfragments for business process design,” In: Advancing the Impact ofDesign Science: Moving from Theory to Practice, DESRIST’2014.LNCS 8463, pp. 209224. 2014.
[20] M. Javed, Y. Abgaz and C. Pahl, ”A Pattern-based Framework ofChange Operators for Ontology Evolution,” 4th International Workshopon Ontology Content OnToContent’09. 2009.
[21] C. Pahl, ”A Pi-Calculus based framework for the composition andreplacement of components,” Conference on Object-Oriented Program-ming, Systems, Languages, and Applications OOPSLA’2001 Workshopon Specification and Verification of Component-Based Systems, 2001.
[22] M. Koning, C.-A. Sun, M. Sinnema, and P. Avgeriou, ”VxBPEL:Supporting variability for Web services in BPEL,” Information andSoftware Technology, vol. 51, pp. 258-269, 2009.
[23] M. Colombo, E. Di Nitto, and M. Mauri, ”Scene: A service compositionexecution environment supporting dynamic changes disciplined throughrules,” in Service-Oriented Computing, pp. 191-202. 2006.
[24] A. Kumar and W. Yao, ”Design and management of flexible processvariants using templates and rules,” Computers in Industry, vol. 63, pp.112-130, 2012.
[25] D. Fang, X. Liu, I. Romdhani, P. Jamshidi, and C. Pahl, ”An agility-oriented and fuzziness-embedded semantic model for collaborative cloudservice search, retrieval and recommendation,” Future Generation Com-puter Systems, Volume 56, pp. 11-26. 2016.
[26] M. Nakamura, T. Kushida, A. Bhamidipaty, and M. Chetlur, ”Amulti-layered architecture for process variation management,” in WorldConference on Services-II, SERVICES’09, pp. 71-78, 2009.
[27] A. Hallerbach, T. Bauer, and M. Reichert, ”Capturing variability inbusiness process models: the Provop approach,” Jrnl of Software Main-tenance and Evolution: Research and Practice 22, pp. 519-546, 2010.
[28] R. Mohan, M. A. Cohen, and J. Schiefer, ”A state machine basedapproach for a process driven development of web-applications,” inAdvanced Information Systems Engineering, 2002, pp. 52-66.
[29] A. Lazovik and H. Ludwig, ”Managing process customizability and cus-tomization: Model, language and process,” in Web Information SystemsEngineering, 2007, pp. 373-384.
[30] M. Helfert, ”Business informatics: An engineering perspective on infor-mation systems.” Journal of Information Technology Education 7:223-245. 2008.
[31] P. Jamshidi, M. Ghafari, A. Ahmad, and C. Pahl, ”A frameworkfor classifying and comparing architecture-centric software evolutionresearch,” European Conference on Software Maintenance and Reengi-neering, 2013.
[32] Y.-J. Hu, C.-L. Yeh, and W. Laun, ”Challenges for rule systems on theweb,” Rule Interchange and Applications, 2009, pp. 4-16.
[33] A. Paschke, H. Boley, Z. Zhao, K. Teymourian, and T. Athan, ”ReactionRuleML 1.0” in Rules on the Web: Research and Applications, 2012, pp.100-119.
[34] A. van Deursen, P. Klint, and J. Visser, ”Domain-specific languages: anannotated bibliography,” SIGPLAN Not., vol. 35, pp. 26-36, 2000
[35] M. Mernik, J. Heering, and A. M. Sloane, ”When and how to developdomain-specific languages,” ACM computing surveys, 37:316-344, 2005.
[36] P.-Y. Schobbens, P. Heymans, J.-C. Trigaux, and Y. Bontemps, ”Genericsemantics of feature diagrams,” Computer Networks, vol. 51, pp. 456-479, 2/7/ 2007.
[37] D. Benavides, S. Segura, P. Trinidad, and A. R. Corts, ”FAMA: Toolinga framework for the automated analysis of feature models,” VaMoS,2007.
[38] M. Antkiewicz and K. Czarnecki, ”FeaturePlugin: feature modelingplug-in for Eclipse,” Workshop on Eclipse Techn, 2004, pp. 67-72.
[39] A. Classen, Q. Boucher, and P. Heymans, ”A text-based approach tofeature modelling: Syntax and semantics of TVL,” Science of ComputerProgramming, vol. 76, pp. 1130-1143, 2011.
[40] K. C. Kang, S. G. Cohen, J. A. Hess, W. E. Novak, and A. S.Peterson, ”Feature-oriented domain analysis (FODA) feasibility study,”DTIC. 1990.
[41] A. van Deursen and P. Klint, ”Domain-specific language design requiresfeature descriptions,” Jrnl of Comp and Inf Technology, vol. 10, pp. 1-17,2002.
[42] M. Acher, P. Collet, P. Lahire, and R. B. France, ”A domain-specificlanguage for managing feature models,” in ACM Symp on AppliedComputing, 2011, pp. 1333-1340.
[43] C. Pahl, ”A Formal Composition and Interaction Model for a WebComponent Platform,” Electronic Notes in Theoretical Computer Sci-ence, Volume 66, Issue 4, Pages 67-81, Formal Methods and ComponentInteraction (ICALP 2002 Satellite Workshop), 2002.
[44] C. Pahl, S. Giesecke, and W. Hasselbring, ”Ontology-based Modellingof Architectural Styles,” Information and Software Technology, vol.51(12), pp. 1739-1749, 2009.
[45] C. Pahl, ”An ontology for software component matching,” InternationalJournal on Software Tools for Technology Transfer, vol 9(2), pp. 169-178, 2007.
[46] M.X. Wang, K.Y. Bandara, and C. Pahl, ”Integrated constraint violationhandling for dynamic service composition,” IEEE International Confer-ence on Services Computing, 2009, pp. 168-175.
[47] H. Boley, A. Paschke, and O. Shafiq, ”RuleML 1.0: the overarchingspecification of web rules,” Lecture Notes in Computer Science. 6403,162-178, 2010.
[48] M. Helfert, ”Challenges of business processes management in health-care: Experience in the Irish healthcare sector.” Business Process Man-agement Journal 15, no. 6, 937-952. 2009.
[49] S. Murray, J. Ryan, and C. Pahl. ”A tool-mediated cognitive apprentice-ship approach for a computer engineering course,” 3rd IEEE Conferenceon Advanced Learning Technologies, 2003.
[50] X. Lei, C. Pahl, and D. Donnellan, ”An evaluation technique for contentinteraction in web-based teaching and learning environments,” The 3rdIEEE International Conference on Advanced Learning Technologies2003, IEEE, 2003.
[51] C. Pahl and H. Xiong, ”Migration to PaaS Clouds - Migration Processand Architectural Concerns,” IEEE 7th International Symposium onthe Maintenance and Evolution of Service-Oriented and Cloud-BasedSystems MESOCA’13. IEEE. 2013.
[52] E.-E. Doberkat, W. Franke, U. Gutenbeil, W. Hasselbring, U. Lammers,and C. Pahl, ”PROSET - a Language for Prototyping with Sets,”International Workshop on Rapid System Prototyping, pp. 235-248. 1992.
[53] F. Fowley, C. Pahl, and L. Zhang, ”A comparison framework and reviewof service brokerage solutions for cloud architectures,” 1st InternationalWorkshop on Cloud Service Brokerage (CSB’2013). 2013.
[54] C. Pahl, ”Containerisation and the PaaS Cloud,” IEEE Cloud Comput-ing, 2(3). pp. 24-31, 2015.

191
International Journal on Advances in Software, vol 9 no 3 & 4, year 2016, http://www.iariajournals.org/software/
2016, © Copyright by authors, Published under agreement with IARIA - www.iaria.org
Automatic Information Flow Validation for High-Assurance Systems
Kevin Muller∗, Sascha Uhrig∗, Flemming Nielson†, Hanne Riis Nielson†,Ximeng Li‡†, Michael Paulitsch§ and Georg Sigl¶
∗Airbus Group · Munich, Germany · Email: [Kevin.Mueller|Sascha.Uhrig]@airbus.com†DTU Compute · Technical University of Denmark · Email: [fnie|hrni|ximl]@dtu.dk
‡Technische Universitat Darmstadt · Darmstadt, Germany · Email: [email protected]§Thales Austria GmbH · Vienna, Austria · Email: [email protected]
¶Technische Universitat Munchen · Munich, Germany · Email: [email protected]
Abstract—Nowaydays, safety-critical systems in high-assurancedomains such as aviation or transportation need to considersecure operation and demonstrate its reliable operation bypresenting domain-specific level of evidences. Many tools forautomated code analyses and automated testing exist to ensuresafe and secure operation; however, ensuring secure informationflows is new in the high-assurance domains. The DecentralizedLabel Model (DLM) allows to partially automate, model andprove correct information flows in applications’ source code.Unfortunately, the DLM targets Java applications; hence, it isnot applicable for many high-assurance domains with strong real-time guarantees. Reasons are issues with the dynamic characterof object-oriented programming or the in general uncertainbehaviors of features like garbage collectors of the commonlynecessary runtime environments. Hence, many high-assurancesystems are still implemented in C. In this article, we discussDLM in the context of such high-assurance systems. For this, weadjust the DLM to the programming language C and developeda suitable tool checker, called Cif. Apart from proving thecorrectness of information flows statically, Cif is able to illustratethe implemented information flows graphically in a dependencygraph. We present this power on generic use cases appearingin almost each program. We further investigate use cases fromthe high-assurance domains of avionics and railway to identifycommonalities regarding security. A common challenge is thedevelopment of secure gateways mediating the data transferbetween security domains. To demonstrate the benefits of Cif, weapplied our method to such a gateway implementation. Duringthe DLM annotation of the use case’s C source code, we identifiedissues in the current DLM policies, in particular, on annotatingspecial data-dependencies. To solve these issues, we extend thedata agnostic character of the traditional DLM and present ournew concept on the gateway use case. Even though this paper usesexamples from aviation and railway, our approach can be appliedequally well to any other safety-critical or security-critical system.This paper demonstrates the power of Cif and its capability tographically illustrate information flows, and discusses its utilityon selected C code examples. It also presents extension to theDLM theory to overcome identified shortcomings.
Index Terms—Security; High-Assurance; Information Flow;Decentralized Label Model
I. INTRODUCTION
Safety-critical systems in the domains of aviation, trans-portation systems, automotive, medical applications or indus-trial control have to show their correct implementation with adomain-dependent level of assurance. Due to the changing ITenvironments and the increased connectivity demands in therecent years, these system do not operate isolated anymore.
Moreover, they are subject of attacks that require additionalmeans to protect the security of the systems. The use casesdiscussed by this article are derived by the safety and securitydemands of the avionic and railway domains, both highlyrestricted and controlled domains for high-assurance systems.This article extends our previous contribution [1] on presentinghow security-typed languages can improve the code qualityand the automated assurance of correct implementation ofC programs, with use cases from both mentioned domains.Furthermore, the paper will provide improvements to thetheory of the Decentralized Label Model (DLM); being anonan example for security-typed technologies.
Aviation software [2] and hardware [3] have to follow strictdevelopment processes and require certification by nationalauthorities. Recently, developers of avionics, the electronicson-board of aircrafts, have implemented systems followingthe concepts of Integrated Modular Avionics (IMA) [4] toreduce costs and increase functionality. IMA achieves a systemdesign of safe integration and consolidation of applicationswith various criticality on one hardware platform. The archi-tecture depends on the provision of separated runtime envi-ronments, so called partitions. Targeting security aspects ofsystems, a similar architectural approach has been developedwith the concept of Multiple Independent Levels of Security(MILS) [5]. This architectural approach depends on strict sepa-ration of processing resources and information flow control. ASeparation Kernel [6] is a special certifiable operating systemthat can provide both mentioned properties.
Apart from having such architectural approaches to han-dle the emerging safety and security requirements for highassurance systems, the developers also have to prove thecorrect implementation of their software applications. Forsafety, the aviation industry applies various forms of codeanalysis [7][8][9] in order to evidently ensure correct imple-mentation of requirements. For security, in particular on secureinformation flows, the aviation industry only has limited meansavailable, which are not mandatory yet.
The base for secure or correct information flows in thispaper are security policies for systems that contain rules onflow restrictions from input to outputs of the system, or fine-grained, between variables in a program code. On secureinformation flow, the DLM [10] is a promising approach.

192
International Journal on Advances in Software, vol 9 no 3 & 4, year 2016, http://www.iariajournals.org/software/
2016, © Copyright by authors, Published under agreement with IARIA - www.iaria.org
DLM introduces annotations into the source code. Theseannotations allow to model an information flow policy directlyon source code level, mainly by extending the declaration ofvariables. This avoids additional translations between modeland implementation. Tool support allows to prove the im-plemented information flows and the defined flow policyregarding consistency. In short, DLM extends the type systemof a programming language to assure that a security policymodeled by label annotations of variables is not violated inthe program flow.
Our research challenge here is to apply this model to arecurring generic use case of a gateway application. Afteranalyzing use cases of two high assurance industries, weidentified this use case as a common assurance challengein both, the avionic and railway industry. DLM is currentlyavailable for the Java programming language [11]. Java is arelatively strongly typed language and, hence, appears at firstsight as a very good choice. However, among other aspects thedynamic character of object-oriented languages such as Javaintroduces additional issues for the certification process [12].Furthermore, common features such as the Java RuntimeEnvironment introduces potentially unpredictable and harmfuldelays during execution. For high-criticality applications thisis not acceptable as they require high availability and real-time properties like low response times. Hence, as most high-assurance systems remain to be implemented in C, our firsttask is the adaption of DLM to the C language. Then, weleverage the compositional nature of the MILS architecture todeliver overall security guarantees by combining the evidencesof correct information flow provided by the DLM-certifiedapplication and by the underlying Separation Kernel. Thiscombination of evidences will also help to obtain securitycertifications for such complex systems in the future.
In this article we will discuss the following contributions:
DLM for C language: We propose an extension of the Clanguage in order to express and check information flowpolicies by code annotations; we discuss in Section IVthe challenges in adapting to C rather than Java.
Real Use-Case Annotations: While DLM has been success-fully developed to deal with typical applications writtenin Java, we investigate the extent to which embeddedapplications written in C present other challenges. Tobe concrete we study in Sections V-VI the applicationof the DLM to a real-world use case from the avionicand railway domains, namely a demultiplexer that ispresent in many high security-demanding applications, inparticular in the high assurance gateway being developedas a research demonstrator.
Graphical Representation of Information Flows: To makeinformation flow policies useful for engineers workingin avionics and automotive, we consider it important todevelop a useful graphical representation. To this end wedevelop a graphical format for presenting the informa-tion flows. This helps engineers to identify unspecified
flows and to avoid information leakage due to negligentprogramming.
Improvements to DLM Theory: It turns out that the straightadaptation of DLM to real source code for embedded sys-tems written in C gives rise to some overhead regardingcode size increase. In order to reduce this overhead, wesuggest in Section IX improvements to the DLM so as tobetter deal with the content-dependent nature of policiesas is typical of systems making use of demultiplexers.
This article is structured as follows: Section II discussesrecent research papers fitting to the topic of this paper. InSection III, we introduce the DLM as described by Myersinitially. Our adaptation of DLM to the C language and theresulting tool checker Cif are described in Section IV. In Sec-tion V, we discuss common code snippets and their verificationusing Cif. This also includes the demonstration of the graphicalinformation flow output of our tool. Section VI and Section VIIpresent the security domains inside the aviation and railwayindustry to motivate our use case. Section VIII discusses thishigh assurance use case identified as challenging questionof both domains. The section further connects security-typedlanguages with security design principles, such as MILS.In this chapter, we also assess our approach and identifyshortcomings in the current DLM theory. Section IX uses theprevious assessment and suggests improvements to the DLMtheory. Finally, we conclude our work in Section X.
II. RELATED WORK
Sabelfeld and Myers present in [13] an extensive survey onresearch of security typed languages within the last decades.The content of the entire paper provides a good overview toposition the research contribution of our paper.
The DLM on which this paper is based was proposed byMyers and Liskov [10] for secure information flow in theJava language. This model features decentralized trust relationbetween security principals. Known applications (appearing tobe of mostly academic nature) are:
• Civitas: a secure voting system• JPmail: an email client with information-flow control• Fabric, SIF and Swift: being web applications.
In this paper, we adapt DLM to the C programming language,extending its usage scope to high-assurance embedded systemsadopted in real-world industry.
An alternative approach closely related to ours is the DataFlow Logic (DFL) proposed by Greve in [14]. This featuresa C language extension that augments source code and addssecurity domains to variables. Furthermore, his approach al-lows to formulate flow contracts between domains. Theseannotations describe an information flow policy, which can beanalyzed by a DFL prover. DFL has been used to annotate thesource code of a Xen-based Separation Kernel [15]. WhereasGreve builds largely on Mandatory Access Control, we baseour approach on Decentralized Information Flow Control. Thedecentralized approach introduces a mutual distrust among

193
International Journal on Advances in Software, vol 9 no 3 & 4, year 2016, http://www.iariajournals.org/software/
2016, © Copyright by authors, Published under agreement with IARIA - www.iaria.org
data owners, all having an equal security level. Hence, DLMavoids the automatically given hierarchy of the approaches ofmandatory access control usually relying on at least one superuser.
III. DECENTRALIZED LABEL MODEL (DLM)
The DLM [10] is a language-based technology allowing toprove correct information flows within a program’s sourcecode. Section III-A introduces the fundamentals of the model.The following Section III-B focusses on the information flowcontrol.
A. General Model
The model uses principals to express flow policies. By de-fault a mutual distrust is present between all defined principals.Principals can delegate their authority to other principals and,hence, can issue a trust relation. In DLM, principals owndata and can define read (confidentiality) and write (integrity)policies for other principals in order to allow access to thedata. Consequently, the union of owners and readers or writersrespectively defines the effective set of readers or writers of adata item. DLM offers two special principals:
1) Top Principal *: As owner representing the set of allprincipals; as reader or writer representing the empty setof principals, i.e., effectively no other principal except theinvolved owners of this policy
2) Bottom Principal _: As owner representing the empty setof principals; as reader or writer representing the set ofall principals.
Additional information on this are described in [16]. Inpractice labels, which annotate the source code, express theDLM policies. An example is:
i n t Al ice−>Bob ; Al ice<− x ;i n t ∗−> ; ∗<−∗ y ;
Listing 1. Declaration of a DLM-annotated Variable
This presents a label definition using curly brackets astoken1. In this example the principal Alice owns the datastored in the integer variable x for both the confidentialityand integrity policy. The first part of the label Alice->Bobexpresses a confidentiality policy, also called reader policy. Inthis example the owner Alice allows Bob to read the data. Thesecond part of the label expresses an integrity policy, or writerpolicy. In this example it defines that Alice allows all otherprincipals write access to the variable x. For the declarationof y the reader policy expresses that all principals believe thatall principals can read the data and the writer policy expressesthat all principals believe that no principal has modified thedata. Overall, this variable has low flow restrictions.
In DLM one may also form a conjunction of principals, likeAlice&Bob->Chuck. This confidentiality policy is equiva-lent to Alice->Chuck;Bob->Chuck and means that thebeliefs of Alice and Bob have to be fulfilled [17].
1In the following we will use the compiler technology-based term tokenand the DLM-based term annotation as synonyms.
B. Information Flow Control
Using these augmentations on a piece of source code, astatic checking tool is able to prove whether all beliefs ex-pressed by labels are fulfilled. A data flow from a source to anat least equally restricted destination is a correct informationflow. In contrast an invalid flow is detected if data flows froma source to a destination that is less restricted than the source.A destination is at least as restricted as the source if:
• the confidentiality policy keeps or increases the set ofowners and/or keeps or decreases the set of readers, and
• the integrity policy keeps or decreases the set of ownersand/or keeps or increases the set of writers
i n t Al ice−>Bob ; Al ice<− x = 1 ;
i n t A l i c e&Bob−>∗; A l i ce<− y = 0 ;
y = x ;
Listing 2. Valid Direct Information Flow
i n t Al ice−>Bob ; Al ice<− x = 1 ;
i n t A l i c e&Bob−>∗; A l i ce<− y = 0 ;
i f ( y == 0)x = 0 ;
Listing 3. Invalid Implicit Information Flow
Listing 2 shows an example of a valid direct informationflow from the source variable x to the destination y. Apartfrom these direct assignments, DLM is also able to detectinvalid implicit flows. The example in Listing 3 causes aninfluence on variable x if the condition y == 0 is true.Hence, depending on the value of y the data in variable x getsmodified, i.e., allowing x to observe the status of y. However,y is more restrictive than x, i.e., x is not allowed to observethe value of y. Thus, the flow in Listing 3 is invalid.
To analyse those implicit flows, DLM also examines eachinstruction against the current label of the Program Counter(PC). As in Java Information Flow (Jif) [18], the PC representsthe current context in the program and not the actual programcounter register. A statement is only valid if the PC is no morerestrictive than the involved variables of the statement. The PClabel is calculated for each program block and is re-calculatedat its entrance depending on the condition the block has beenentered.
IV. DECENTRALIZED LABEL MODEL (DLM) FOR CLANGUAGE (CIF)
During our application of the DLM to the C language we runinto several challenges. The following sections provides designchoices and implementation details on our implementation.
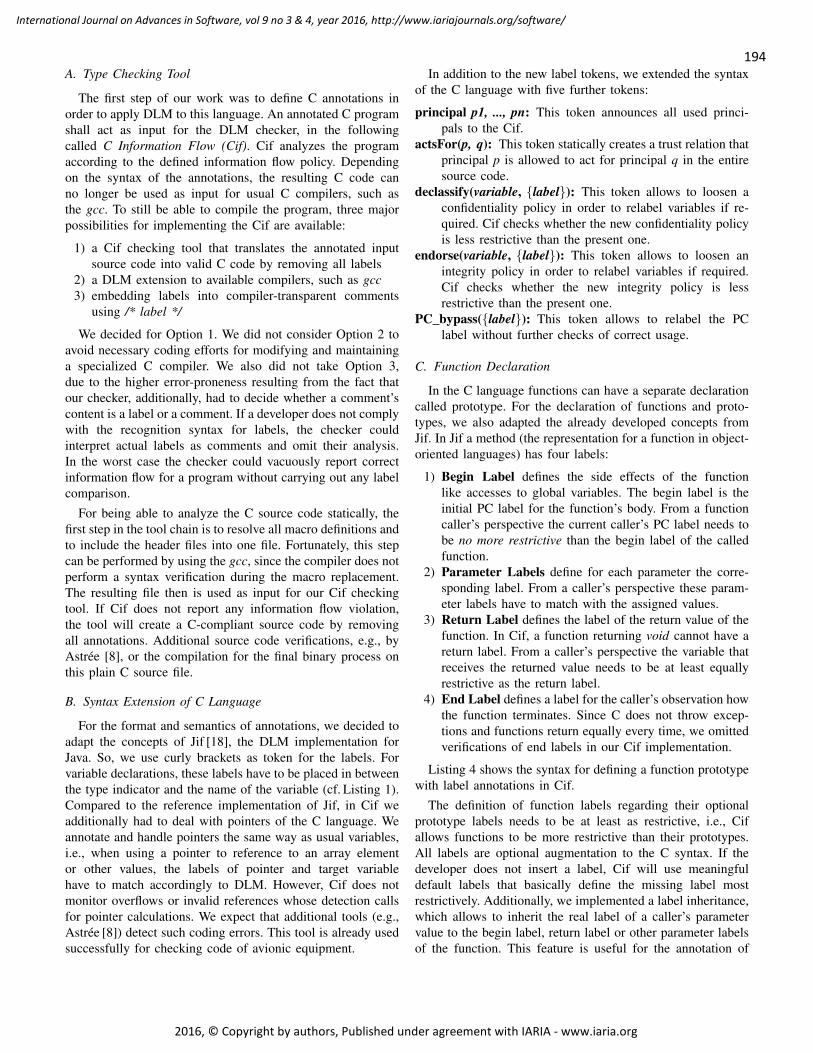
194
International Journal on Advances in Software, vol 9 no 3 & 4, year 2016, http://www.iariajournals.org/software/
2016, © Copyright by authors, Published under agreement with IARIA - www.iaria.org
A. Type Checking Tool
The first step of our work was to define C annotations inorder to apply DLM to this language. An annotated C programshall act as input for the DLM checker, in the followingcalled C Information Flow (Cif). Cif analyzes the programaccording to the defined information flow policy. Dependingon the syntax of the annotations, the resulting C code canno longer be used as input for usual C compilers, such asthe gcc. To still be able to compile the program, three majorpossibilities for implementing the Cif are available:
1) a Cif checking tool that translates the annotated inputsource code into valid C code by removing all labels
2) a DLM extension to available compilers, such as gcc3) embedding labels into compiler-transparent comments
using /* label */
We decided for Option 1. We did not consider Option 2 toavoid necessary coding efforts for modifying and maintaininga specialized C compiler. We also did not take Option 3,due to the higher error-proneness resulting from the fact thatour checker, additionally, had to decide whether a comment’scontent is a label or a comment. If a developer does not complywith the recognition syntax for labels, the checker couldinterpret actual labels as comments and omit their analysis.In the worst case the checker could vacuously report correctinformation flow for a program without carrying out any labelcomparison.
For being able to analyze the C source code statically, thefirst step in the tool chain is to resolve all macro definitions andto include the header files into one file. Fortunately, this stepcan be performed by using the gcc, since the compiler does notperform a syntax verification during the macro replacement.The resulting file then is used as input for our Cif checkingtool. If Cif does not report any information flow violation,the tool will create a C-compliant source code by removingall annotations. Additional source code verifications, e.g., byAstree [8], or the compilation for the final binary process onthis plain C source file.
B. Syntax Extension of C Language
For the format and semantics of annotations, we decided toadapt the concepts of Jif [18], the DLM implementation forJava. So, we use curly brackets as token for the labels. Forvariable declarations, these labels have to be placed in betweenthe type indicator and the name of the variable (cf. Listing 1).Compared to the reference implementation of Jif, in Cif weadditionally had to deal with pointers of the C language. Weannotate and handle pointers the same way as usual variables,i.e., when using a pointer to reference to an array elementor other values, the labels of pointer and target variablehave to match accordingly to DLM. However, Cif does notmonitor overflows or invalid references whose detection callsfor pointer calculations. We expect that additional tools (e.g.,Astree [8]) detect such coding errors. This tool is already usedsuccessfully for checking code of avionic equipment.
In addition to the new label tokens, we extended the syntaxof the C language with five further tokens:
principal p1, ..., pn: This token announces all used princi-pals to the Cif.
actsFor(p, q): This token statically creates a trust relation thatprincipal p is allowed to act for principal q in the entiresource code.
declassify(variable, label): This token allows to loosen aconfidentiality policy in order to relabel variables if re-quired. Cif checks whether the new confidentiality policyis less restrictive than the present one.
endorse(variable, label): This token allows to loosen anintegrity policy in order to relabel variables if required.Cif checks whether the new integrity policy is lessrestrictive than the present one.
PC bypass(label): This token allows to relabel the PClabel without further checks of correct usage.
C. Function Declaration
In the C language functions can have a separate declarationcalled prototype. For the declaration of functions and proto-types, we also adapted the already developed concepts fromJif. In Jif a method (the representation for a function in object-oriented languages) has four labels:
1) Begin Label defines the side effects of the functionlike accesses to global variables. The begin label is theinitial PC label for the function’s body. From a functioncaller’s perspective the current caller’s PC label needs tobe no more restrictive than the begin label of the calledfunction.
2) Parameter Labels define for each parameter the corre-sponding label. From a caller’s perspective these param-eter labels have to match with the assigned values.
3) Return Label defines the label of the return value of thefunction. In Cif, a function returning void cannot have areturn label. From a caller’s perspective the variable thatreceives the returned value needs to be at least equallyrestrictive as the return label.
4) End Label defines a label for the caller’s observation howthe function terminates. Since C does not throw excep-tions and functions return equally every time, we omittedverifications of end labels in our Cif implementation.
Listing 4 shows the syntax for defining a function prototypewith label annotations in Cif.
The definition of function labels regarding their optionalprototype labels needs to be at least as restrictive, i.e., Cifallows functions to be more restrictive than their prototypes.All labels are optional augmentation to the C syntax. If thedeveloper does not insert a label, Cif will use meaningfuldefault labels that basically define the missing label mostrestrictively. Additionally, we implemented a label inheritance,which allows to inherit the real label of a caller’s parametervalue to the begin label, return label or other parameter labelsof the function. This feature is useful for the annotation of

195
International Journal on Advances in Software, vol 9 no 3 & 4, year 2016, http://www.iariajournals.org/software/
2016, © Copyright by authors, Published under agreement with IARIA - www.iaria.org
Fig. 1. Legend for Flow Graphs
return label︷ ︸︸ ︷ inherited begin label︷ ︸︸ ︷ parameter label︷ ︸︸ ︷ end label︷ ︸︸ ︷i n t Al ice−>Bob f unc param ( i n t Al ice−>∗ param ) : Al ice −>∗;
Listing 4. Definition of a function with DLM annotations in Cif.
system library functions, such as memcpy(...) that are usedby callers with divergent parameter labels and can have sideeffects on global variables. At this stage Cif does not supportthe full inheritance of parameter labels to variable declarationsinside the function’s body.
D. Using System Libraries
Developers use systems libraries in their applications notonly for convenience (e.g., to avoid reimplementation of com-mon functionality) but also to perform necessary interactionwith the runtime environment and the underlying operatingsystem.
Hence, the system library provides an interface to theenvironment of the application, which mostly is not under theassurance control of the application’s programmer. However,the code executed by library functions can heavily affectand also violate an application’s information flow policy.Consequently, a system library needs to provide means forits functions to express the applied information flow policyand evidences to fully acknowledge this policy internally. Inthe best case, these evidences are also available by using ourDLM approach. For Jif, the developers have annotated parts ofthe Java system library with DLM annotations that provide themajor data structures and core I/O operations. Unfortunately,these annotations and its checks applied to all library functionsdemand many working hours and would exceed the availableresource of many C development projects and, in particular,this research study. Luckily, other methods are conceivable,e.g., to gain evidences by security certification efforts of theenvironment. For our use case, the system software (a specialSeparation Kernel) was under security certification at the timeof this study. Assuming the certification will be successful,we can assume its internals behave as specified. Furthermore,the research community worked on the formal specificationand verification of Separation Kernels intensively, allowing usto trust the kernel if such methods have been applied [19],[20], [21]. However, we still had to create a special versionof the system library’s header file. This header file containsDLM-annotated prototype definitions of all functions of theSeparation Kernel’s system library. The Cif checker takes thisfile as optional input.
V. USE CASES
This section demonstrates the power of Cif by explainingusually appearing code snippets. For all examples Cif verifiesthe information flow modeled with the code annotations. If theinformation flow is valid according to the defined policy, Cifwill output an unlabeled version of the C source code and agraphical representation of the flows in the source code. Theformat of this graphical representation is “graphml”, hence,capable of further parsing and easy to import into other tools aswell as documentation. Figure 1 shows the used symbols andtheir interpretations in these graphs. In general, the # symboland its following number indicates the line of the command’sor flow’s implementation in the source code.
A. Direct Assignment
Listing 5 presents the first use case with a sequence ofnormal assignments.
1 p r i n c i p a l Al i ce , Bob , Chuck ;23 void main −> ;∗<−∗ ( )4 5 i n t Al ice−>Bob , Chuck x = 0 ;6 i n t Al ice−>Bob y ;7 i n t Al ice−>∗ z ;89 y = x ;
10 z = y ;11 z = x ;12
Listing 5. Sequence of Valid Direct Flows
In this example x is the least restrictive variable, y the secondmost restrictive variable and z the most restrictive variable.Thus, flows from x → y, y → z and x → z are valid. Cifverifies this source code successfully and create the graphicalflow representation depicted in Figure 2.
B. Indirect Assignment
Listing 6 shows an example of invalid indirect informationflow. Cif reports an information flow violation, since all flowsin the compound environment of the true if statement need tobe at least as restrictive as the label of the decision variable
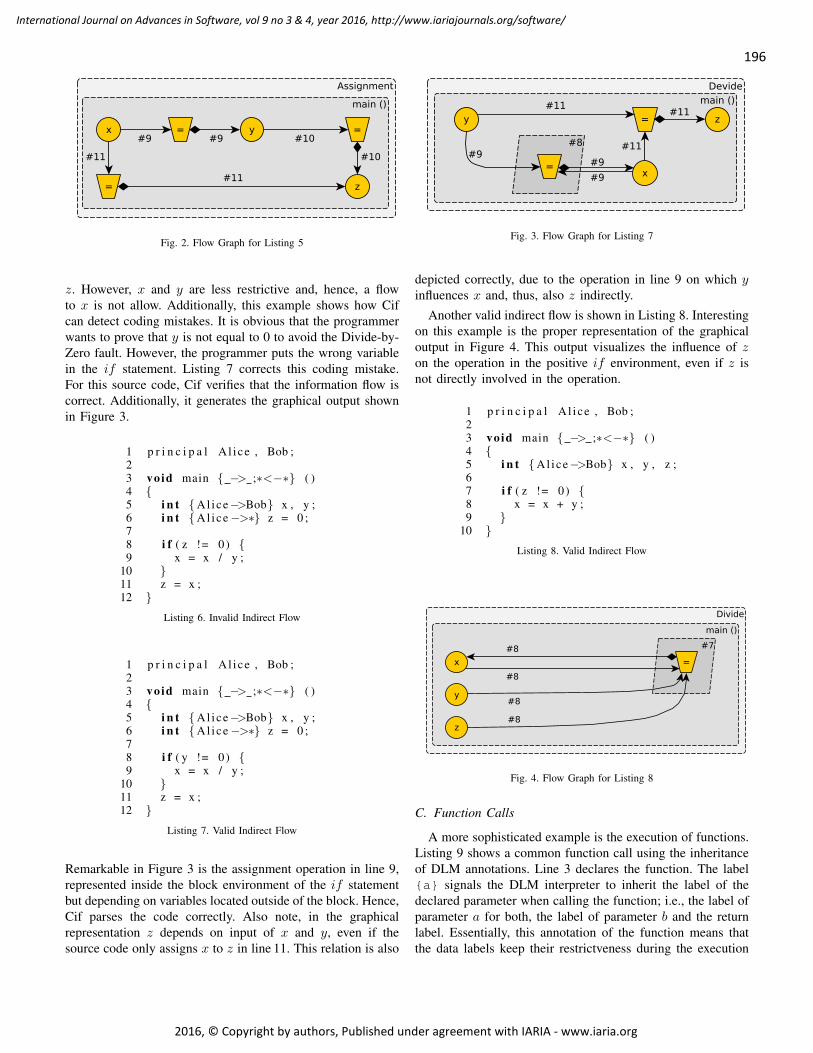
196
International Journal on Advances in Software, vol 9 no 3 & 4, year 2016, http://www.iariajournals.org/software/
2016, © Copyright by authors, Published under agreement with IARIA - www.iaria.org
Fig. 2. Flow Graph for Listing 5
z. However, x and y are less restrictive and, hence, a flowto x is not allow. Additionally, this example shows how Cifcan detect coding mistakes. It is obvious that the programmerwants to prove that y is not equal to 0 to avoid the Divide-by-Zero fault. However, the programmer puts the wrong variablein the if statement. Listing 7 corrects this coding mistake.For this source code, Cif verifies that the information flow iscorrect. Additionally, it generates the graphical output shownin Figure 3.
1 p r i n c i p a l Al i ce , Bob ;23 void main −> ;∗<−∗ ( )4 5 i n t Al ice−>Bob x , y ;6 i n t Al ice−>∗ z = 0 ;78 i f ( z != 0) 9 x = x / y ;
10 11 z = x ;12
Listing 6. Invalid Indirect Flow
1 p r i n c i p a l Al i ce , Bob ;23 void main −> ;∗<−∗ ( )4 5 i n t Al ice−>Bob x , y ;6 i n t Al ice−>∗ z = 0 ;78 i f ( y != 0) 9 x = x / y ;
10 11 z = x ;12
Listing 7. Valid Indirect Flow
Remarkable in Figure 3 is the assignment operation in line 9,represented inside the block environment of the if statementbut depending on variables located outside of the block. Hence,Cif parses the code correctly. Also note, in the graphicalrepresentation z depends on input of x and y, even if thesource code only assigns x to z in line 11. This relation is also
Fig. 3. Flow Graph for Listing 7
depicted correctly, due to the operation in line 9 on which yinfluences x and, thus, also z indirectly.
Another valid indirect flow is shown in Listing 8. Interestingon this example is the proper representation of the graphicaloutput in Figure 4. This output visualizes the influence of zon the operation in the positive if environment, even if z isnot directly involved in the operation.
1 p r i n c i p a l Al i ce , Bob ;23 void main −> ;∗<−∗ ( )4 5 i n t Al ice−>Bob x , y , z ;67 i f ( z != 0) 8 x = x + y ;9
10 Listing 8. Valid Indirect Flow
Fig. 4. Flow Graph for Listing 8
C. Function Calls
A more sophisticated example is the execution of functions.Listing 9 shows a common function call using the inheritanceof DLM annotations. Line 3 declares the function. The labela signals the DLM interpreter to inherit the label of thedeclared parameter when calling the function; i.e., the label ofparameter a for both, the label of parameter b and the returnlabel. Essentially, this annotation of the function means thatthe data labels keep their restrictveness during the execution
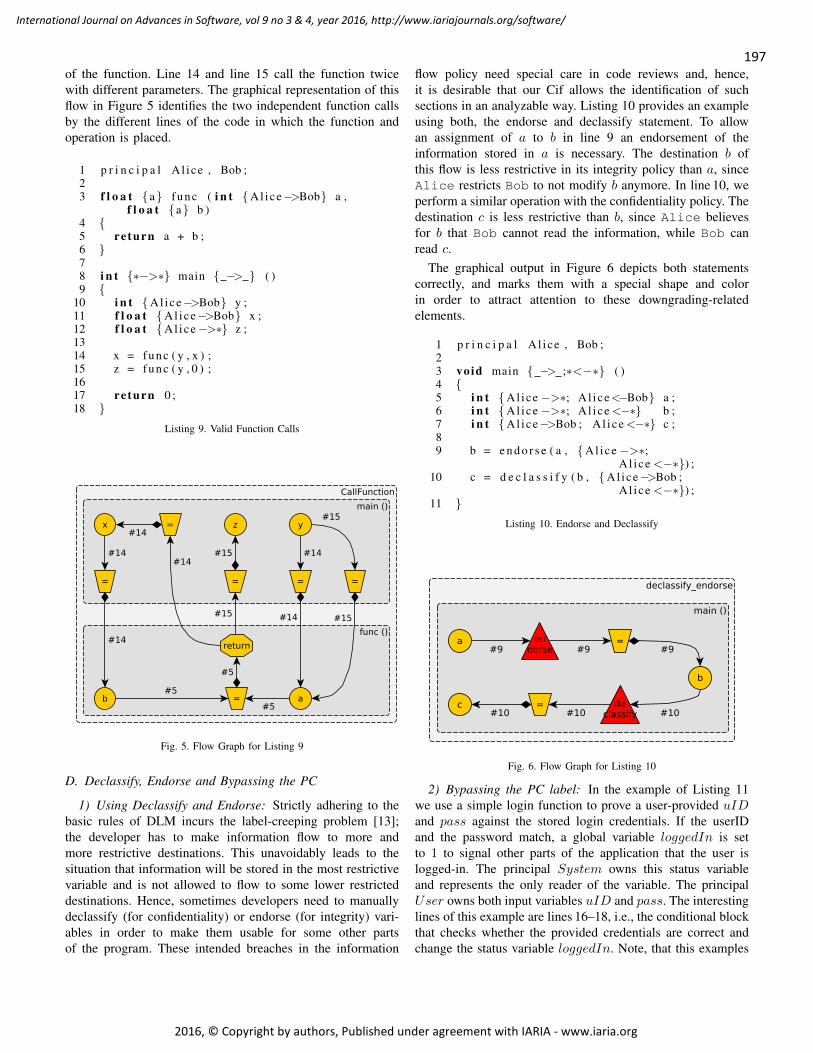
197
International Journal on Advances in Software, vol 9 no 3 & 4, year 2016, http://www.iariajournals.org/software/
2016, © Copyright by authors, Published under agreement with IARIA - www.iaria.org
of the function. Line 14 and line 15 call the function twicewith different parameters. The graphical representation of thisflow in Figure 5 identifies the two independent function callsby the different lines of the code in which the function andoperation is placed.
1 p r i n c i p a l Al i ce , Bob ;23 f l o a t a f unc ( i n t Al ice−>Bob a ,
f l o a t a b )4 5 re turn a + b ;6 78 i n t ∗−>∗ main −> ( )9
10 i n t Al ice−>Bob y ;11 f l o a t Al ice−>Bob x ;12 f l o a t Al ice−>∗ z ;1314 x = func ( y , x ) ;15 z = func ( y , 0 ) ;1617 re turn 0 ;18
Listing 9. Valid Function Calls
Fig. 5. Flow Graph for Listing 9
D. Declassify, Endorse and Bypassing the PC
1) Using Declassify and Endorse: Strictly adhering to thebasic rules of DLM incurs the label-creeping problem [13];the developer has to make information flow to more andmore restrictive destinations. This unavoidably leads to thesituation that information will be stored in the most restrictivevariable and is not allowed to flow to some lower restricteddestinations. Hence, sometimes developers need to manuallydeclassify (for confidentiality) or endorse (for integrity) vari-ables in order to make them usable for some other partsof the program. These intended breaches in the information
flow policy need special care in code reviews and, hence,it is desirable that our Cif allows the identification of suchsections in an analyzable way. Listing 10 provides an exampleusing both, the endorse and declassify statement. To allowan assignment of a to b in line 9 an endorsement of theinformation stored in a is necessary. The destination b ofthis flow is less restrictive in its integrity policy than a, sinceAlice restricts Bob to not modify b anymore. In line 10, weperform a similar operation with the confidentiality policy. Thedestination c is less restrictive than b, since Alice believesfor b that Bob cannot read the information, while Bob canread c.
The graphical output in Figure 6 depicts both statementscorrectly, and marks them with a special shape and colorin order to attract attention to these downgrading-relatedelements.
1 p r i n c i p a l Al i ce , Bob ;23 void main −> ;∗<−∗ ( )4 5 i n t Al ice−>∗; A l i ce<−Bob a ;6 i n t Al ice−>∗; A l i ce <−∗ b ;7 i n t Al ice−>Bob ; Al ice <−∗ c ;89 b = e n d o r s e ( a , Al ice−>∗;
A l i ce <−∗) ;10 c = d e c l a s s i f y ( b , Al ice−>Bob ;
Al ice <−∗) ;11
Listing 10. Endorse and Declassify
Fig. 6. Flow Graph for Listing 10
2) Bypassing the PC label: In the example of Listing 11we use a simple login function to prove a user-provided uIDand pass against the stored login credentials. If the userIDand the password match, a global variable loggedIn is setto 1 to signal other parts of the application that the user islogged-in. The principal System owns this status variableand represents the only reader of the variable. The principalUser owns both input variables uID and pass. The interestinglines of this example are lines 16–18, i.e., the conditional blockthat checks whether the provided credentials are correct andchange the status variable loggedIn. Note, that this examples

198
International Journal on Advances in Software, vol 9 no 3 & 4, year 2016, http://www.iariajournals.org/software/
2016, © Copyright by authors, Published under agreement with IARIA - www.iaria.org
also presents Cif’s treatment of pointers on the strcmpfunction. Due to the variables in the boolean condition ofthe if statement, the PC label inside the following blockis System-> & User->. However, this PC is not morerestrictive than the label of loggedIn labeled with System->.Hence, Cif would report an invalid indirect information flowon this line. To finally allow this light and useful violationof the information flow requirement, the programmer needsto manually downgrade or bypass the PC label as shownin line 17. In order to identify such manual modifications ofthe information flow policy, Cif also adds this information inthe generated graphical representation by using a red triangleindicating the warning (see Figure 7). This shall enable codereviewers to identify the critical sections of the code to performtheir (manual) review on these sections intensively.
1 p r i n c i p a l User , System ;23 i n t System−>∗ l o g g e d I n = 0 ;45 i n t ∗−>∗ s t r c mp ∗−>∗
( c o n s t char ∗−>∗ ∗ s t r 1 ,c o n s t char ∗−>∗ ∗ s t r 2 )
6 7 f o r ( ; ∗ s t r 1 ==∗ s t r 2 && ∗ s t r 1 ; s t r 1 ++ ,
s t r 2 ++) ;8 re turn ∗ s t r 1 − ∗ s t r 2 ;9
1011 void checkUser System−>∗
( c o n s t i n t User−>∗ uID ,c o n s t char User−>∗ ∗ c o n s t p a s s )
12 13 c o n s t i n t System−>∗ regUID = 1 ;14 c o n s t char System−>∗ c o n s t
r e g P a s s [ ] = ” ” ;1516 i f ( regUID == uID &&
! s t r c mp ( r e g P a s s , p a s s ) ) 17 PC bypass ( System−>∗) ;18 l o g g e d I n = 1 ;19 20
Listing 11. Login Function
VI. USE-CASE: THE AVIONICS SECURITY DOMAINS
Due to their diversity in functions and criticality on theaircraft’s safety, on-board networks are divided into securitydomains. The ARINC standards (ARINC 664 [22] and AR-INC 811[23]) define four domains also depicted in Figure 8:
1. Aircraft Control: The most critical domain hosting sys-tems that support the safe operation of the aircraft, suchas cockpit displays and system for environmental orpropulsion control. This domain provides information toother (lower) domains but does not depend on them.
2. Airline Information Services: This domain acts as secu-rity perimeter between the Aircraft Control Domain and
Fig. 7. Flow Graph for Listing 11
lower domains. Among others it hosts systems for crewinformation or maintenance.
3. Passenger Information and Entertainment Services:While being the most dynamic on-board domainregarding software updates, this domain hosts systemsrelated to the passenger’s entertainment and otherservices such as Internet access.
4. Passenger-owned Devices: This domain hosts mobile sys-tems brought on-board by the passengers. They may con-nect to aircraft services via an interface of the PassengerInformation and Entertainment Services Domain.
To allow information exchange between those domains,additional security perimeters have to be in place to controlthe data exchange. Usually, information can freely flow fromhigher critical domains to lower critical domains. However,information sent by lower domains and processed by higherdomains need to be controlled. This channel is more and moredemanded, e.g., by the use case of the maintenance interfacethat is usually hosted within the Airline Information ServiceDomain but also should be used for updating the AircraftControl Domain. For protecting higher domains from the threatof vulnerable data a security gateway can be put in servicein order to assure integrity of the higher criticality domains.This security gateway examines any data exchange and assuresintegrity of the communication data and consequently of thehigh integrity domain. Since this gateway is also a highlycritical system, it requires similar design and implementationassurances regarding safety and security as the systems itprotects.
VII. USE-CASE: THE RAILWAY SECURITY DOMAINS
The railway industry needs to protect the integrity and avail-ability of their control network, managing signals, positionsof trains and driving parameters of trains. Hence, also the

199
International Journal on Advances in Software, vol 9 no 3 & 4, year 2016, http://www.iariajournals.org/software/
2016, © Copyright by authors, Published under agreement with IARIA - www.iaria.org
AIRCRAFT SECURITY DOMAINS
CLOSED PRIVATE PUBLIC
Controls the Aircraft Operates the Aircraft Informs/Entertains the Passengers
Passenger Informationand EntertainmentServices Domain
In-Flight Entertainment
On-Board Web Access
Passenger Device Interface
Passenger Internet
Air-GroundNetwork Interface
Airline InformationServices Domain
Administrative Functions
Flight Support
Cabin Support
Maintenance Support
Air-GroundNetwork Interface
Aircraft ControlDomain
Flight and EmbeddedControl Systems
Cabin Core Systems
Air-GroundNetwork Interface
Passenger-ownedDevices
Wireless Devices(PDAs, Mobile Phones)
Gaming Devices(PSP, ...)
...
Computing Devices(Notebooks, PC, ...)
Fig. 8. Avonic Security Domains as defined by ARINC 664 [22] and ARINC 811 [23].
railway industry has categorized their systems and interfacesinto security domains.
Railway control consists of several domains from controlcenters over interlocking systems to field elements all inter-acting in one way or the other with onboard systems. Forinterlocking, DIN VDE V 0831-104 [24] defines a typical ar-chitecture from a security zone perspective, which is depictedin Figure 9.
For interlocking, Figure 9 shows that different levels ofmaintenance and diagnosis are needed. Local maintenanceinteracts via a gateway (demilitarized zone) with controlelements interlocking logic, operator computers and field ele-ments Considering in this example the diagnosis information,the diagnosis database needs a method for data acquisitionwithout adding risks of propagating data into the interlockingzone. To implement this, a simple diode-based approach isdeemed sufficient. Remote diagnosis is more complicated withaccess to diagnosis as well as the interlocking zone, butagain using gateways to access control elements (interlocking,operator, and field element computers).
This example of accessing interlocking for diagnosis andmaintenance purposes reflects the potential need for securitygateways. In case of operation centers where many interlock-ings are controlled and monitored remotely, similar securitymeasure are to be taken if connected via open networks.Similarly if within different interlockings communication runsover open networks, encryption and potentially also gatewayapproaches may be needed.
In current and future signalling, control and train protectionsystems such as European Train Control System (ETCS)level 2 or higher security aspects need to consider aspectsof wireless communication and – similarly to approachesdescribed above – need to protect different system componentsand systems.
Fig. 9. Railway Security Zones [24]
VIII. THE MILS GATEWAY
The avionic and railway use case share one major common-ality regarding security. Both industries elaborated securityclassifications for their systems; depending on the criticalityand users systems are categorized into security domains.However, systems of these security domains mostly cannotoperate independent but often demand data from systems ofother domains. For example, services of the avionic PassengerInformation and Entertainment Services domain need datafrom systems of the Aircraft Control domain, such as thealtitude and position of the aircraft for enabling or disablingthe on-board WiFi network due to regulations by governmentalauthorities. In railway an example for data exchange is theexternal adjustment of the maximum allowed train speed,triggered by the train network operator. To still protect adomain against invalid accesses or malicious data, controlinstances such as Secure Network Gateways are deployed.These gateways mediate and control the data exchange on

200
International Journal on Advances in Software, vol 9 no 3 & 4, year 2016, http://www.iariajournals.org/software/
2016, © Copyright by authors, Published under agreement with IARIA - www.iaria.org
the domain borders and filter the data according to a definedinformation flow policy.
In previous work we have introduced a Secure NetworkGateway [25] based on the MILS approach.
The MILS architecture, originally introduced in [26] andfurther refined in [5], is based on the concept of spatialand temporal separation connected with controlled informationflow. These properties are provided by a special operatingsystem called a Separation Kernel. MILS systems enable oneto run applications of different criticality integrated togetheron one hardware platform.
Leveraging these properties the gateway is decomposed intoseveral subfunctions that operate together in order to achievethe gateway functionality. Figure 10a shows the partitionedsystem architecture. The benefit of the decomposition is theability to define local security policies for the different gatewaycomponents. The system components themselves run isolatedamong each other within the provided environments of aSeparation Kernel. Using a Separation Kernel as a founda-tional operating system guarantees non-interference betweenthe identified gateway subfunctions except when an interactionis granted. Hence, the Separation Kernel provides a coarseinformation flow control in order to prove which componentis allowed to communicate to which other component. How-ever, within the partition’s boundaries the Separation Kernelcannot control the correct implementation of the defined localinformation flow policy. This paper presents a new concept ofconnecting MILS with the DLM in order to fill this gap andto provide system-wide evidence of correct information flows.
In comparison to our unidirectional gateway of [25] com-prising just two partitions to perform information flow controlon very basic protocols only, our improved gateway is com-posed of four major logical components (cf. also Figure 10a):
1) The Receiver Compo-nents
2) Filter Component(s)*3) The Transmitter Compo-
nents4) Health Monitoring and
Audit Component** (not depicted in Figure 10a)
Figure 10b extracts the internal architecture of the ReceiverComponent being a part of our gateway system. The task ofthis component is to receive network packets from a physicalnetwork adapter, to decide whether the packet contains TCP orUDP data, and to parse and process the protocols accordingly.Hence, this component is composed of three subfunctionshosted in three partitions2 of the Separation Kernel:
1) DeMux: Receiving network packets from the physicalnetwork adapter, and analyzing and processing the datatraffic on lower network protocol levels (i.e., Ethernet/-MAC and IPv43)
2A partition is a runtime container in a Separation Kernel that guaranteesnon-interfered execution. A communication channel is an a priori definedmeans of interaction between a source partition and one or more destinationpartitions.
3For the following we assume our network implements Ethernet and IPv4,only.
2) TCP Decoder: Analysing and processing of identifiedTCP packets
3) UDP Decoder: Analysing and processing of identifiedUDP packets
The advantage of this encapsulation of subfunctionality intothree partitions is the limitation of possible attack impacts andfault propagation. Generally, implementations of TCP stacksare considered more vulnerable to attacks than UDP stacks,due to the increased functionality of the TCP protocol com-pared to the UDP protocol. Hence, the TCP stack implementedin the TCP Decoder can be assumed as more vulnerable. Apossible attack vector to a gateway application is to attackthe TCP stack in order to circumvent or to perform denial-of-service on the gateway. If all three subfunctions run inside onepartition, the entire Receiver Component would be affectedby a successful attack on the TCP stack. However, in thisdistributed implementation using the separation property of theSeparation Kernel only the TCP Decoder would be affectedby a successful attack. A propagation of the attack impact (orfault) to the UDP Decoder or DeMux is limited due to thesecurity properties of the Separation Kernel.
Further developing the gateway example, the strength ofusing DLM is to assure a correct implementation of thedemultiplexer running in the DeMux partition. Considering theC code in Listing 12 the essential part of the demultiplexerrequires the following actions:
• Line 2 and line 3 define the prototypes of the functionsthat send the data to the subsequent partitions using eitherchannel TCP data or channel UDP data of Figure 10b.
• Line 5 defines the structure of the configuration arraycontaining an integer value and a function-pointer to oneof the previously defined functions.
• The code snippet following line 11 configures the demul-tiplexer by adding tuples for the TCP and UDP handlersto the array. The integer complies with the RFC of theIPv4 identifying the protocol on the transport layer.
• Line 29 implements the selection of the correct handlerby iterating to the correct element of the configurationarray and comparing the type field of the input packetwith the protocol value of the configuration tuples. Notethat the loop does not contain any further instructions dueto the final ‘;’.
• The appropriate function is finally called by line 32.
A. DLM Applied to the Gateway Use Case
We consider again the use case presented in Figure 10b. Inorder to use DLM for the DeMux of the Receiver Componentan annotation of Listing 12 is needed. Listing 13 shows thisannotated version. The graphical representation is depicted inFigure 11.
• Line 1 announces all used principals of this code segmentto the Cif checker.
• In line 3 and line 4 we label the begin label and the dataparameter of the two prototype declarations with labels
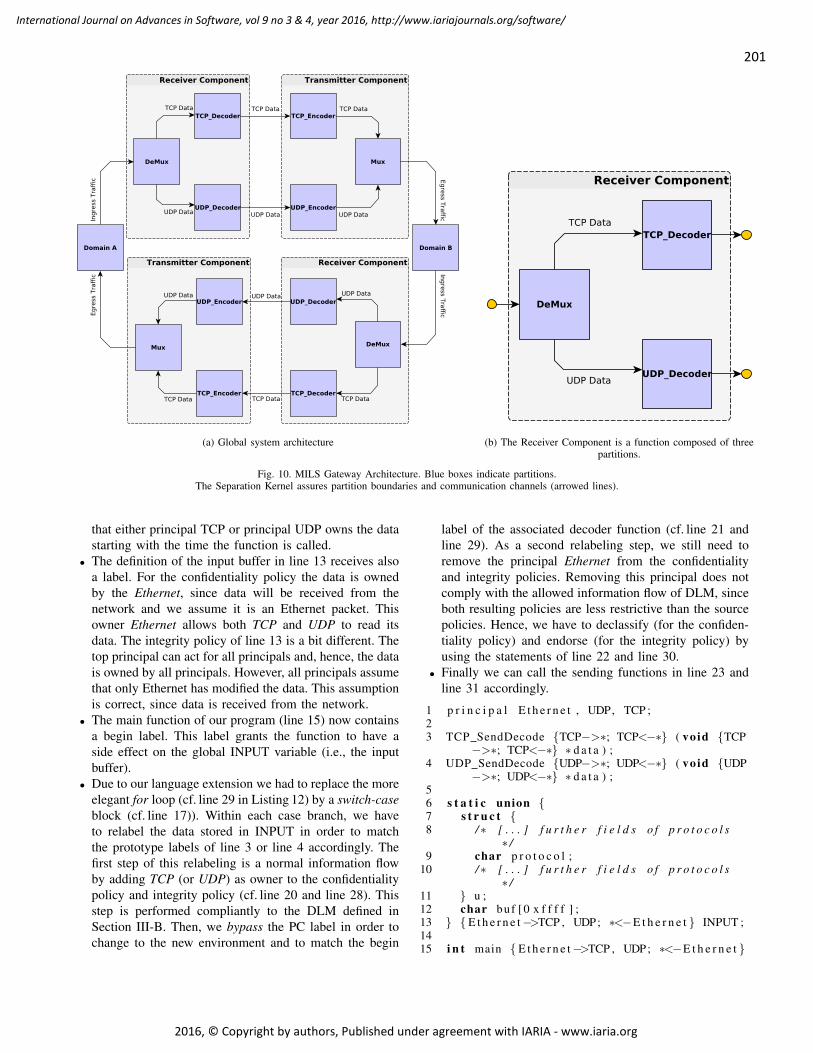
201
International Journal on Advances in Software, vol 9 no 3 & 4, year 2016, http://www.iariajournals.org/software/
2016, © Copyright by authors, Published under agreement with IARIA - www.iaria.org
(a) Global system architecture (b) The Receiver Component is a function composed of threepartitions.
Fig. 10. MILS Gateway Architecture. Blue boxes indicate partitions.The Separation Kernel assures partition boundaries and communication channels (arrowed lines).
that either principal TCP or principal UDP owns the datastarting with the time the function is called.
• The definition of the input buffer in line 13 receives alsoa label. For the confidentiality policy the data is ownedby the Ethernet, since data will be received from thenetwork and we assume it is an Ethernet packet. Thisowner Ethernet allows both TCP and UDP to read itsdata. The integrity policy of line 13 is a bit different. Thetop principal can act for all principals and, hence, the datais owned by all principals. However, all principals assumethat only Ethernet has modified the data. This assumptionis correct, since data is received from the network.
• The main function of our program (line 15) now containsa begin label. This label grants the function to have aside effect on the global INPUT variable (i.e., the inputbuffer).
• Due to our language extension we had to replace the moreelegant for loop (cf. line 29 in Listing 12) by a switch-caseblock (cf. line 17)). Within each case branch, we haveto relabel the data stored in INPUT in order to matchthe prototype labels of line 3 or line 4 accordingly. Thefirst step of this relabeling is a normal information flowby adding TCP (or UDP) as owner to the confidentialitypolicy and integrity policy (cf. line 20 and line 28). Thisstep is performed compliantly to the DLM defined inSection III-B. Then, we bypass the PC label in order tochange to the new environment and to match the begin
label of the associated decoder function (cf. line 21 andline 29). As a second relabeling step, we still need toremove the principal Ethernet from the confidentialityand integrity policies. Removing this principal does notcomply with the allowed information flow of DLM, sinceboth resulting policies are less restrictive than the sourcepolicies. Hence, we have to declassify (for the confiden-tiality policy) and endorse (for the integrity policy) byusing the statements of line 22 and line 30.
• Finally we can call the sending functions in line 23 andline 31 accordingly.
1 p r i n c i p a l E t h e r n e t , UDP, TCP ;23 TCP SendDecode TCP−>∗; TCP<−∗ ( void TCP
−>∗; TCP<−∗ ∗ d a t a ) ;4 UDP SendDecode UDP−>∗; UDP<−∗ ( void UDP
−>∗; UDP<−∗ ∗ d a t a ) ;56 s t a t i c union 7 s t r u c t 8 /∗ [ . . . ] f u r t h e r f i e l d s o f p r o t o c o l s
∗ /9 char p r o t o c o l ;
10 /∗ [ . . . ] f u r t h e r f i e l d s o f p r o t o c o l s∗ /
11 u ;12 char buf [0 x f f f f ] ;13 E t h e r n e t−>TCP , UDP; ∗<−E t h e r n e t INPUT ;1415 i n t main E t h e r n e t−>TCP , UDP; ∗<−E t h e r n e t

202
International Journal on Advances in Software, vol 9 no 3 & 4, year 2016, http://www.iariajournals.org/software/
2016, © Copyright by authors, Published under agreement with IARIA - www.iaria.org
1 /∗ DECLARATION ∗ /2 TCP SendDecode ( void ∗ d a t a ) ;3 UDP SendDecode ( void ∗ d a t a ) ;45 t y p e d e f s t r u c t 6 char p r o t o c o l ;7 void (∗ f unc ) ( void ∗ d a t a ) ;8 DeMux ;9
10 /∗ CONFIGURATION ∗ /11 s t a t i c DeMux h a n d l e r [ ] = 12 0x06 , &TCP SendDecode , / / 0 x06
i n d i c a t e s TCP i n IPv413 0x11 , &UDP SendDecode , / / 0 x11
i n d i c a t e s UDP i n IPv414 0x00 , 0 / / f i n a l e n t r y15 ;1617 union s t r u c t 18 /∗ [ . . . ] f u r t h e r f i e l d s o f p r o t o c o l s
∗ /19 char p r o t o c o l ;20 /∗ [ . . . ] f u r t h e r f i e l d s o f p r o t o c o l s
∗ /21 u ;22 char buf [0 x f f f f ] ;23 INPUT ;2425 i n t main ( ) 26 /∗ [ . . . ] l oad da ta from ne twork i n t o
INPUT ∗ /27 /∗ PROCESSING ∗ /28 DeMux∗ i t r = 0 ;29 f o r ( i t r = h a n d l e r ; i t r −>p r o t o c o l != 0 &&30 i t r −>p r o t o c o l != INPUT . u . p r o t o c o l ; i t r
++) ;31 i f ( i t r −>f unc != 0)32 (∗ i t r −>f unc ) ( INPUT ) ;33 e l s e34 E r r o r ( ) ;35
Listing 12. Demultiplexer of the Receiver Component
( ) 16 /∗ [ . . . ] l oad da ta from ne twork i n t o
INPUT ∗ /17 sw i t ch ( INPUT . u . p r o t o c o l ) 18 case 0x06 : /∗ 0 x06 i n IPv4 i n d i c a t e s
TCP ∗ /19 20 void E t h e r n e t & TCP−>∗; TCP<−
E t h e r n e t ∗ p t r = INPUT . buf ;21 PC bypass (TCP−>∗; TCP<−∗) ;22 void TCP−>∗; TCP<−∗ ∗ t c p = e n d o r s e
( d e c l a s s i f y ( p t r , TCP−>∗; TCP<−E t h e r n e t ) , TCP−>∗; TCP<−∗) ;
23 TCP SendDecode ( t c p ) ;24 break ;25 26 case 0x11 : /∗ 0 x11 i n IPv4 i n d i c a t e s
UDP ∗ /27 28 void E t h e r n e t & UDP−>∗; UDP<−
E t h e r n e t ∗ p t r = INPUT . buf ;
29 PC bypass (UDP−>∗; UDP<−∗) ;30 void UDP−>∗; UDP<−∗ ∗udp = e n d o r s e
( d e c l a s s i f y ( p t r , UDP−>∗; UDP<−E t h e r n e t ) , UDP−>∗; UDP<−∗) ;
31 UDP SendDecode ( udp ) ;32 break ;33 34 d e f a u l t :35 36 E r r o r ( ) ;37 38 39
Listing 13. Annotated Receiver Component
Clearly, Figure 11 indicated six warnings inside the sourcecode by the red triangle. The bypass of the PC label inline line:cif-tcp-bypass and line line:cif-udp-bypass reason twoof these warnings. The remaining four warnings are dueto the endorse and declassification (two each) of the DLMinformation flow policy in order to allow the assignmentsin line 22 and line 30. As DLM provides information flowassurance, code reviewers just need to concentrate on theseindicated sections of the code to perform manual validation.The remaining source code is validated thanks to the DLM
Using the presented technology we also annotate other criti-cal gateway components hosted in other partitions of the MILSsystem. The Cif tool is able to process all needed C languagefeatures of our implementation, e.g., loops, decision branches,switch-case blocks, function calls, pointer arithmetics, and alsofunction pointers as long as their DLM policy is homogeneous(cf. Section IX). Since the tool does not report informationflow violations of the local defined policies, we gain addi-tional evidence of the correct implementation of the gateway’scomponents. Together with the defined MILS information flowpolicy ensured by the Separation Kernel we can assure acorrect implementation of the system-wide information flow.Currently, we have still had to map both evidences manuallyfor developing the prove of concept. Future planning of ourimplementation involves to automatically combine both steps.
IX. ENHANCING THE DECENTRALIZED LABEL MODEL
A. Assessment of DLM applied to the Gateway Use Case
The application of DLM to the gateway use case identifiedsome advantages and disadvantages. The advantages are oneasing the assurance process and on the improved identifica-tion of code flaws, being more detailed:
Automatic Proof of Correct Information Flows: The pre-sented source code in Listing 13 complies with a formallyproven information flow model, the DLM. The proof ofthis properties of complient information flows could beachieved automatically with tool support. Hence, it can beconsidered as highly assured that the present informationflows are correct. The graphical representatio clearlyidentifies code sections that endorsing or declassifying themodeled information flow policy. This allows to reduce

203
International Journal on Advances in Software, vol 9 no 3 & 4, year 2016, http://www.iariajournals.org/software/
2016, © Copyright by authors, Published under agreement with IARIA - www.iaria.org
#20 #20
#22
#22 #22 #22 #22
#30
#30 #30 #30 #30
#35
#27
#17
#28#28
Fig. 11. DLM Information Flows in the Demultiplexer of the MILS Gateway implemented by Listing 13.
efforts for code reviews, as the reviewers can focus onthese parts of the code. In contrast, all the code inListing 12 requires detailed and manual code review inorder to provide the same level of assurances.
Increased Robustness against Coding Flaws: Compared toListing 12, the DLM-inducted code snippet of Listing 13is more robust against coding flaws. Imagine a distractedprogrammer swaps the two function pointers in the con-figuration array of Listing 12. This modification willresult in a probably hardly debugable runtime error, sinceUDP traffic will now be sent to the TCP Decoder and theother way around. In contrast, if swapping the functioncalls of line 23 and line 31 of Listing 13 the Cif checkerwill raise an information flow breach due to the invalidlabels of the function call and the labels of the parameter.Hence, this DLM allows detection of possible runtimeerrors before compilation.
Contrary, the following disadvantages have been identified:
Larger Code Size: Comparing both demultiplexer imple-mentations of Listing 12 and Listing 13 it is obviousthat the DLM-inducted version increases the code sizedue to the different employed programming styles. Inthe former, we use a table-based programming tech-nique (see the for loop) whereas in the latter we usea code-based programming technique (see the switchstatement). Another reasons for the bigger foot print isthe relabeling directives within the case blocks. Thisrelabeling introduces new variables and statements thatare only required for inducting DLM. From a programcontrol flow perspective, those statements are useless and(hopefully) detected and removed by the compiler duringoptimization.
Reduced Readability: The label annotations of DLM itselfform another disadvantage. Their introduction may re-duce readability of the code due to the unusuality oftheir use. However, using DLM increases the level of
automation in providing assurance, and thus, the need ofmanual code review. The best case avoids manual codereading entirely.
Considering the identified disadvantages, we elaborate on asolution to reduce the code size by extending DLM to allowexpressing DLM policies on the table-based programmingtechnique of Listing 12.
B. Extensions to the DLM
Based on [27], [28] we will now describe a possible exten-sion of Cif intended to overcome the shortcoming. Listing 14displays the resulting code. It should be clear that it is ratherclose to that of Listing 12; a similar version could be developedfor Listing 13.
1 /∗ DECLARATION ∗ /2 p r i n c i p a l E t h e r n e t , UDP, TCP ;34 p o l i c y GatewayHandler5 = ( s e l f . p r o t o c o l ==0x06 =>6 s e l f . f unc ==TCP−>∗; TCP<−∗ ( void TCP−>∗;
TCP<−∗ ∗ ) )7 && ( s e l f . p r o t o c o l ==0x11 =>8 s e l f . f unc ==UDP−>∗; UDP<−∗ ( void UDP−>∗;
UDP<−∗ ∗ ) ) ;9
10 p o l i c y Gateway11 = ( s e l f . p r o t o c o l ==0x06 => s e l f ==TCP−>∗;
TCP<−∗)12 && ( s e l f . p r o t o c o l ==0x11 => s e l f ==UDP−>∗;
UDP<−∗) ;1314 TCP SendDecode TCP−>∗; TCP<−∗ ( void TCP
−>∗; TCP<−∗ ∗ d a t a ) ;15 UDP SendDecode UDP−>∗; UDP<−∗ ( void UDP
−>∗; UDP<−∗ ∗ d a t a ) ;1617 t y p e d e f s t r u c t 18 char p r o t o c o l ;19 void (∗ f unc ) ( void ∗ d a t a ) ;20 GatewayHandler DeMux ;
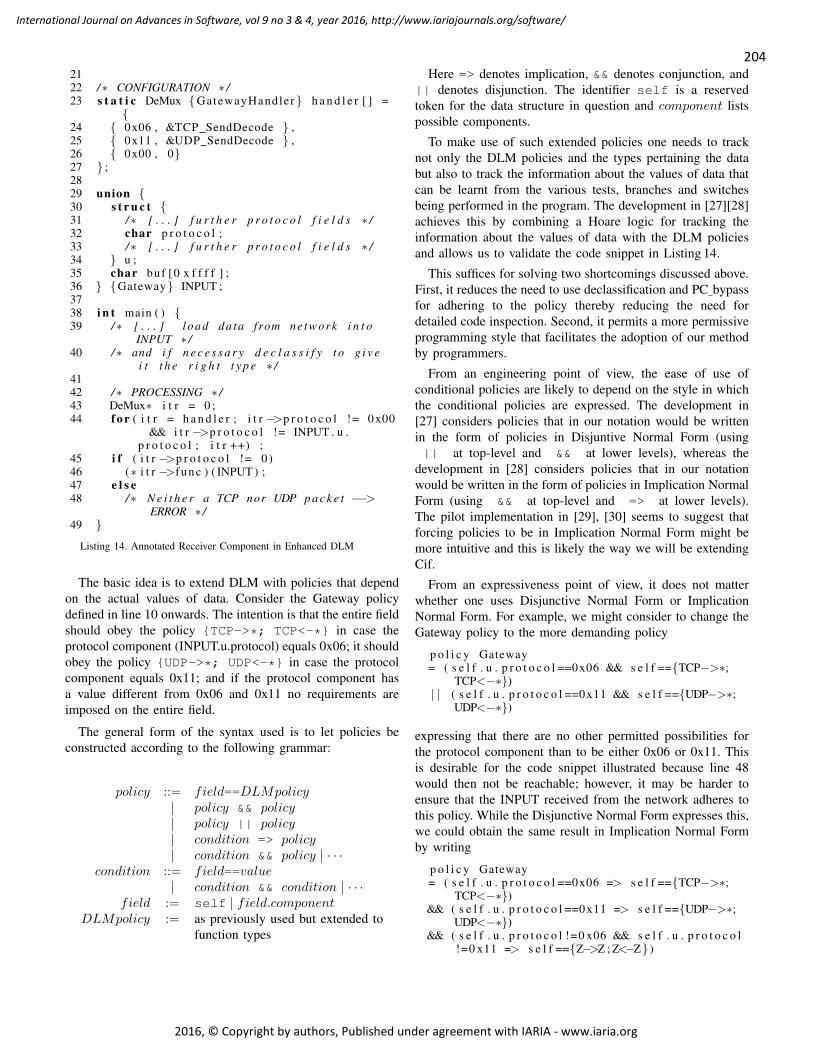
204
International Journal on Advances in Software, vol 9 no 3 & 4, year 2016, http://www.iariajournals.org/software/
2016, © Copyright by authors, Published under agreement with IARIA - www.iaria.org
2122 /∗ CONFIGURATION ∗ /23 s t a t i c DeMux GatewayHandler h a n d l e r [ ] =
24 0x06 , &TCP SendDecode ,25 0x11 , &UDP SendDecode ,26 0x00 , 027 ;2829 union 30 s t r u c t 31 /∗ [ . . . ] f u r t h e r p r o t o c o l f i e l d s ∗ /32 char p r o t o c o l ;33 /∗ [ . . . ] f u r t h e r p r o t o c o l f i e l d s ∗ /34 u ;35 char buf [0 x f f f f ] ;36 Gateway INPUT ;3738 i n t main ( ) 39 /∗ [ . . . ] l oad da ta from ne twork i n t o
INPUT ∗ /40 /∗ and i f n e c e s s a r y d e c l a s s i f y t o g i v e
i t t h e r i g h t t y p e ∗ /4142 /∗ PROCESSING ∗ /43 DeMux∗ i t r = 0 ;44 f o r ( i t r = h a n d l e r ; i t r −>p r o t o c o l != 0x00
&& i t r −>p r o t o c o l != INPUT . u .p r o t o c o l ; i t r ++) ;
45 i f ( i t r −>p r o t o c o l != 0 )46 (∗ i t r −>f unc ) ( INPUT ) ;47 e l s e48 /∗ N e i t h e r a TCP nor UDP p a c k e t −−>
ERROR ∗ /49
Listing 14. Annotated Receiver Component in Enhanced DLM
The basic idea is to extend DLM with policies that dependon the actual values of data. Consider the Gateway policydefined in line 10 onwards. The intention is that the entire fieldshould obey the policy TCP->*; TCP<-* in case theprotocol component (INPUT.u.protocol) equals 0x06; it shouldobey the policy UDP->*; UDP<-* in case the protocolcomponent equals 0x11; and if the protocol component hasa value different from 0x06 and 0x11 no requirements areimposed on the entire field.
The general form of the syntax used is to let policies beconstructed according to the following grammar:
policy ::= field==DLMpolicy| policy && policy| policy || policy| condition => policy| condition && policy | · · ·
condition ::= field==value| condition && condition | · · ·
field := self | field.componentDLMpolicy := as previously used but extended to
function types
Here => denotes implication, && denotes conjunction, and|| denotes disjunction. The identifier self is a reservedtoken for the data structure in question and component listspossible components.
To make use of such extended policies one needs to tracknot only the DLM policies and the types pertaining the databut also to track the information about the values of data thatcan be learnt from the various tests, branches and switchesbeing performed in the program. The development in [27][28]achieves this by combining a Hoare logic for tracking theinformation about the values of data with the DLM policiesand allows us to validate the code snippet in Listing 14.
This suffices for solving two shortcomings discussed above.First, it reduces the need to use declassification and PC bypassfor adhering to the policy thereby reducing the need fordetailed code inspection. Second, it permits a more permissiveprogramming style that facilitates the adoption of our methodby programmers.
From an engineering point of view, the ease of use ofconditional policies are likely to depend on the style in whichthe conditional policies are expressed. The development in[27] considers policies that in our notation would be writtenin the form of policies in Disjuntive Normal Form (using|| at top-level and && at lower levels), whereas the
development in [28] considers policies that in our notationwould be written in the form of policies in Implication NormalForm (using && at top-level and => at lower levels).The pilot implementation in [29], [30] seems to suggest thatforcing policies to be in Implication Normal Form might bemore intuitive and this is likely the way we will be extendingCif.
From an expressiveness point of view, it does not matterwhether one uses Disjunctive Normal Form or ImplicationNormal Form. For example, we might consider to change theGateway policy to the more demanding policy
p o l i c y Gateway= ( s e l f . u . p r o t o c o l ==0x06 && s e l f ==TCP−>∗;
TCP<−∗)| | ( s e l f . u . p r o t o c o l ==0x11 && s e l f ==UDP−>∗;
UDP<−∗)
expressing that there are no other permitted possibilities forthe protocol component than to be either 0x06 or 0x11. Thisis desirable for the code snippet illustrated because line 48would then not be reachable; however, it may be harder toensure that the INPUT received from the network adheres tothis policy. While the Disjunctive Normal Form expresses this,we could obtain the same result in Implication Normal Formby writing
p o l i c y Gateway= ( s e l f . u . p r o t o c o l ==0x06 => s e l f ==TCP−>∗;
TCP<−∗)&& ( s e l f . u . p r o t o c o l ==0x11 => s e l f ==UDP−>∗;
UDP<−∗)&& ( s e l f . u . p r o t o c o l !=0 x06 && s e l f . u . p r o t o c o l
!=0 x11 => s e l f ==Z−>Z ; Z<−Z )

205
International Journal on Advances in Software, vol 9 no 3 & 4, year 2016, http://www.iariajournals.org/software/
2016, © Copyright by authors, Published under agreement with IARIA - www.iaria.org
where Z is an otherwise unused principal and hence the policy= Z → Z;Z ← Z is unattainable.
A final problem that would need to be overcome is how tointerface the checking of conditions to the programmer. In thepilot implementation reported in [29][30] it is demanded thatthe programmer provides invariants for all while loops (sincein general this is undecidable).
We are therefore experimenting with ways of using theresults of the powerful static analyser Astree to provide therequired invariants and possibly to use the abstract propertiesof Astree in expressing the policies. Current results [31]suggest that this approach to be very promising, which wouldmake it a strong candidate for inclusion into Cif.
X. CONCLUSION
In this article, we presented C Information Flow (Cif), astatic verification tool to check information flows modeleddirectly in C source code. Cif is an implementation of theDecentralized Label Model (DLM) [10] for the programminglanguage C. To the best of our knowledge, we applied DLMto the C language for the first time. During the application ofDLM to C, we tried to stick to the reference implementationof Java/Jif. However, we had to solve some language-specificissues, such as pointer arithmetic or the absence of exceptions.Additionally, we added the possibility of defining annotationsto function prototypes only, in case a library’s source code isnot available for public access. Then, we also introduced rulesfor differing annotations of function prototypes compared tofunction implementations.
In various code snippets, we discussed information flowsas they appear commonly in C implementations. Cif is ableto verify all of these examples successfully. In case of validinformation flows through the entire source code, Cif generatesa graphical representation of the occurring flows and depen-dencies — a distinguishing feature not possessed by Jif. Thisgraphical representation covers direct assignments of variables,logical and arithmetic operations, indirect dependencies dueto decision branches and function calls. Cif allows the pro-grammer to make declassifications and endorsements as inDLM, and additionally marks the places where flow policiesare loosened with declassifications and endorsements in thegraphical representation. Since DLM-annotated source codeshall reduce the efforts of manual code reviews, these graphicalindications allow to identify critical parts of the source code.Such parts usually require then special investigation duringcode reviews.
Further on, we presented how the security-typed languagesystem [13] of the DLM can be connected to Multiple Inde-pendent Levels of Security (MILS) systems. MILS [26] is asystem architecture to build high-assurance systems [5]. Var-ious industrial domains require such high-assurance systemsto fulfill special safety and security demands. MILS bases onthe properties of separation and controlled information flow,both provided by a special kind of operating system, called
a Separation Kernel. Such kernels provide separated runtimeenvironments to host applications and to assure a configurableinformation flow policy among those environments. However,the Separation Kernel is not able to control the internals ofthese runtime environments. Security-typed languages such asthe DLM can fill this gap.
In our use case, we target the example of a gatewayapplication. In our study, we have identified this use caseas a common implementation challenge for high assurancesystems from the avionics and railway industry; however,our approach is not limited to those two industries but isalso conceivable for other industries such as smart meters orautomotive. This gateway supervises the information exchangebetween security domains, either on-board aircraft or betweena train and its railway operational control network. Architec-turally, the gateway follows the design principles of MILS. Tocontrol the system’s information flows we connected the coarseinformation flows assured by the Separation Kernel with theapplication-dependent information flows, expressed by DLM-annotated C source code of the gateway’s implementation.Compared to other security-typed languages for C, e.g., asproposed by Greve [14] using a mandatory access control-based approach, we used a decentralized approach for assuringcorrect information flow. This has the advantage of revealingsubtler unwwanted dependencies in code, and explicating themutual distrust between different software components. Thelatter also provides more flexibility in modeling the informa-tion flow policy.
We applied DLM annotations to a typical security functionfor high assurance systems: a demultiplexer which is part ofthe MILS-based gateway application. Using our developed Cif,we are able to ensure secure information flows within thegateway’s components according to the defined informationflow policy. Particularly, the visualization of indirect flows,e.g., Listing 7 or Listing 8, and function calls, e.g., Listing 9,were very useful during the evaluation of the use case. Addi-tionally, this activity showed that Cif is able to cover largerprojects, too. Connecting DLM proofs with the informationflow assurance of the Separation Kernel provides system-wide evidences of correct implementation, e.g., as requiredby high Evaluation Assurance Levels of Common Criteriacertifications. However, to annotate source code using thecurrent model of DLM implemented by our Cif requiredto change parts of the source code. Using the presentedtechnology we annotated further critical parts of our gatewayto prove their correct implementation.
Additionally, we evaluated the benefits and drawbacks ofapplying DLM to C. While the benefits are clearly in theautomation of gaining assurances of correct code and the re-duction of manual code review, the drawbacks are the usabilityand increased code’s footprint. Both disadvantages are criticalfor the future developer’s acceptance of our approach and willfinally decide on whether this DLM assurance can be success-ful in a wider field of application. To improve usability, weproposed an enhancement to the DLM, theoretically rooted in

206
International Journal on Advances in Software, vol 9 no 3 & 4, year 2016, http://www.iariajournals.org/software/
2016, © Copyright by authors, Published under agreement with IARIA - www.iaria.org
[27], that removes the need of the presented code modification.We implemented a proof-of-concept checker [29] in parallelto Cif, to assure correct information flows within this newDLM-aware theory. Compared with Cif, this prototype checkerdoes not support rich language features or the generation ofgraphical representations at the current stage.
As future work, we will evaluate on merging the featuresof Cif with the extended assurance of this prototyped imple-mentation.
ACKNOWLEDGMENT
This work was supported by the ARTEMiS Project SeSaMo,the European Union’s 7th Framework Programme projectEURO-MILS (ID: ICT-318353), the German BMBF projectSiBASE (ID: 01IS13020) and the project EMC2 (grantagreement No 621429, Austrian Research Promotion Agency(FFG) project No 84256,8 and German BMBF project ID01IS14002). We also thank Kawthar Balti, Tomasz Maciazekand Andre Ryll for their input.
REFERENCES
[1] K. Muller, S. Uhrig, M. Paulitsch, and S. Uhrig, “Cif: A StaticDecentralized Label Model (DLM) Analyzer to Assure CorrectInformation Flow in C,” in Proc. of the 10th InternationalConference on Software Engineering Advances (ICSEA 2015).Barcelona, Spain: IARIA, Nov. 2015, pp. 369–375. [Online].Available: http://www.thinkmind.org/index.php?view=article&articleid=icsea 2015 14 20 10272
[2] EUROCAE/RTCA, “ED-12C/DO-178C: Software Considerations inAirborne Systems and Equipment Certification,” European Organisationfor Civil Aviation Equipment / Radio Technical Commission for Aero-nautics, Tech. Rep., 2012.
[3] ——, “ED-80/DO-254, Design Assurance Guidance for Airborne Elec-tronic Hardware,” European Organisation for Civil Aviation Equipment/ Radio Technical Commission for Aeronautics, Tech. Rep., 2000.
[4] H. Butz, “The Airbus Approach to Open Integrated Modular Avionics(IMA): Technology, Methods, Processes and Future Road Map,” Ham-burg, Germany, March 2007.
[5] J. Rushby, “Separation and Integration in MILS (The MILS Constitu-tion),” SRI International, Tech. Rep. SRI-CSL-08-XX, Feb. 2008.
[6] J. Alves-Foss, W. S. Harrison, P. W. Oman, and C. Taylor, “The MILSArchitecture for High-Assurance Embedded Systems,” Tech. Rep., 2006.
[7] K. J. Hayhurst, D. S. Veerhusen, J. J. Chilenski, and L. K.Rierson, “A Practical Tutorial on Modified Condition/DecisionCoverage,” NASA, Tech. Rep. May, 2001. [Online]. Available: http://shemesh.larc.nasa.gov/fm/papers/Hayhurst-2001-tm210876-MCDC.pdfhttp://dl.acm.org/citation.cfm?id=886632
[8] D. Kastner, S. Wilhelm, S. Nenova, P. Cousot, R. Cousot, J. Feret,A. Mine, X. Rival, L. Mauborgne, A. Angewandte, I. Gmbh, S. Park,and D. Saarbrucken, “Astree: Proving the Absence of Runtime Errors,”in Proc. of the Embedded Real Time Software and Systems (ERTS2’10),Toulouse, France, 2010, pp. 1–9.
[9] J. C. King, “Symbolic Execution and Program Testing,” Communicationsof the ACM, vol. 19, no. 7, pp. 385–394, Jul. 1976. [Online]. Available:http://dl.acm.org/citation.cfm?id=360248.360252
[10] A. C. Myers and B. Liskov, “A Decentralized Model for InformationFlow Control,” in Proc. of the 16th ACM symposium on Operatingsystems principles (SOSP’97), no. October. Saint-Malo, France: ACM,1997, pp. 129–142. [Online]. Available: http://www.pmg.lcs.mit.edu/papers/iflow-sosp97.pdf
[11] A. C. Myers, “JFlow: Practical Mostly-Static Information FlowControl,” in Proc. of the 26th ACM Symposium on Principles ofProgramming Languages (POPL’99), no. January. San Antonio, Texas,USA: ACM, Jan. 1999. [Online]. Available: http://www.cs.cornell.edu/andru/papers/popl99/popl99.pdf
[12] EASA, “Notification of a Proposal to Issue a Certification Memorandum:Software Aspects of Certification,” EASA, Tech. Rep., Feb. 2011.
[13] A. Sabelfeld and A. C. Myers, “Language-Based Information-FlowSecurity,” IEEE Journal on Selected Areas in Communications, vol. 21,Jan. 2003.
[14] D. Greve, “Data Flow Logic: Analyzing Information Flow Propertiesof C Programs,” in Proc. of the 5th Layered Assurance Workshop(LAW’11). Orlando, Florida, USA: Rockwell Collins, Researchsponsored by Space and Naval Warfare Systems Command ContractN65236-08-D-6805, Dec. 2011. [Online]. Available: http://fm.csl.sri.com/LAW/2011/law2011-paper-greve.pdf
[15] D. Greve and S. Vanderleest, “Data Flow Analysis of a Xen-basedSeparation Kernel,” in Proc. of the 7th Layered Assurance Workshop(LAW’13), no. December. New Orleans, Louisiana, USA: RockwellCollins, Research sponsored by Space and Naval Warfare SystemsCommand Contract N66001-12-C-5221, Dec. 2013. [Online]. Available:http://www.acsac.org/2013/workshops/law/files/LAW-2013-Greve.pdf
[16] S. Chong and A. C. Myers, “Decentralized Robustness,” in Proc. ofthe 19th IEEE Computer Security Foundations Workshop (CSFW’06).Washington, D.C, USA: IEEE, Jul. 2006, pp. 242–253. [Online].Available: http://dl.acm.org/citation.cfm?id=1155681
[17] L. Zheng and A. C. Myers, “End-to-End Availability Policies andNoninterference,” in Proc. of the 18th IEEE Computer SecurityFoundations Workshop (CSFW’05). IEEE, Jun. 2005, pp. 272–286.[Online]. Available: http://www.cs.cornell.edu/andru/papers/avail.pdf
[18] S. Chong, A. C. Myers, K. Vikram, and L. Zheng, Jif Reference Man-ual, http://www.cs.cornell.edu/jif/doc/jif-3.3.0/manual.html, Feb 2009,jif Version: 3.3.1.
[19] T. Murray, D. Matichuk, M. Brassil, P. Gammie, T. Bourke, S. Seefried,C. Lewis, X. Gao, and G. Klein, “sel4: From general purpose to a proofof information flow enforcement,” in Proc. of the IEEE Symposium onSecurity and Privacy (SP) 2013, May 2013, pp. 415–429.
[20] F. Verbeek, J. Schmaltz, S. Tverdyshev, O. Havle, H. Blasum,B. Langenstein, W. Stephan, A. Feliachi, Y. Nemouchi, and B. Wolff,“Formal Specification of a Generic Separation Kernel,” Apr. 2014.[Online]. Available: http://dx.doi.org/10.5281/zenodo.47299
[21] H. Blasum, O. Havle, S. Tverdyshev, B. Langenstein, W. Stephan,Feliachi, A. Y. Nemouch, B. Wolff, C. Proch, F. Verbeek,and J. Schmaltz, “EURO-MILS: Used Formal Methods,” 2015.[Online]. Available: http://www.euromils.eu/downloads/Deliverables/Y2/2015-EM-UsedFormalMethods-WhitePaper-October2015.pdf
[22] Aeronautical Radio Incorporated (ARINC), “Aircraft Data Network Part5: Network Domain Characteristics and Interconnection,” Apr. 2005.
[23] ——, “ARINC 811: Commercial Aircraft Information Security Conceptsof Operation and Process Framework,” 2005.
[24] Deutsche Kommission Elektrotechnik Elektronik Informationstechnikim DIN und VDE, “Electric signalling systems for railways - Part 104:IT Security Guideline based on IEC 62443,” Sep. 2014.
[25] K. Muller, M. Paulitsch, S. Tverdyshev, and H. Blasum, “MILS-Related Information Flow Control in the Avionic Domain: AView on Security-Enhancing Software Architectures,” in Proc. ofthe 42nd International Conference on Dependable Systems andNetworks Workshops (DSN-W), Jun. 2012. [Online]. Available:http://ieeexplore.ieee.org/xpl/articleDetails.jsp?arnumber=6264665
[26] J. Rushby, “Design and Verification of Secure Systems,” in Proc. of the8th ACM Symposium on Operating Systems Principles. Pacific Grove,California, USA: ACM, Dec. 1981.
[27] H. R. Nielson, F. Nielson, and X. Li, “Hoare Logic for DisjunctiveInformation Flow,” in Programming Languages with Applications toBiology and Security - Essays Dedicated to Pierpaolo Degano on theOccasion of His 65th Birthday, ser. Lecture Notes in Computer Science,vol. 9465. Springer, 2015, pp. 47–65.
[28] H. R. Nielson and F. Nielson, “Content Dependent InformationFlow Control,” in J.Log. Algebraic Methods Program, 2016. [Online].Available: http://dx.doi.org/10.1016/j.jlamp.2016.09.005
[29] T. Maciazek, “Content-Based Information Flow Verification for C,” MScthesis, Technical University of Denmark, 2015.
[30] T. Maciazek, H. R. Nielson, and F. Nielson, “Content-DependentSecurity Policies in Avionics,” in Proc. of 2nd International Workshopon MILS: Architecture and Assurance for Secure Systems, 2016,2016. [Online]. Available: http://mils-workshop.euromils.eu/downloads/hipeac literature 2016/07-Article.pdf
[31] P. Vasilikos, “Static Analysis for Content Dependent Information FlowControl,” MSc thesis, Technical University of Denmark, 2016.

207
International Journal on Advances in Software, vol 9 no 3 & 4, year 2016, http://www.iariajournals.org/software/
2016, © Copyright by authors, Published under agreement with IARIA - www.iaria.org
An Ontological Perspective on the Digital Gamification of Software Engineering Concepts
Roy Oberhauser Computer Science Dept.
Aalen University Aalen, Germany
Abstract - Software engineering (SE), because of its abstract nature, faces awareness, perception, and public image challenges that affect its ability to attract sufficient secondary school (high school) age students to its higher education programs. This paper presents an edutainment approach called Software Engineering for Secondary Education (SWE4SE), which combines short informational videos and a variety of simple digital games to convey certain SE concepts in an entertaining way without necessitating or intending any skill development such as programming. Our realization mapped various SE concepts to seven digital games and these are described using the Software Engineering Body of Knowledge (SWEBOK) and game elements ontologies. We also investigated the maturity of ontologies for concepts in this area to determine the feasibility for a methodological mapping of SE concepts to game element and game logic to further automation. Results of SWE4SE with secondary students showed a significant improvement in the perception, attractiveness, and understanding of SE can be achieved within just an hour of play, suggesting such an edutainment approach is economical, effective, and efficient for reaching and presenting SE within secondary school classrooms. Our ontological investigation showed significant gaps towards formalizing or automating the approach.
Keywords - software engineering education; software engineering games; educational computer games; digital game-based learning; digital games; ontologies.
I. INTRODUCTION This paper is an extended version of a paper presented at
the Tenth International Conference on Software Engineering Advances (ICSEA 2015) [1].
As digitalization sweeps through society, the demand for software engineers appears insatiable. As attractive as a software development career may appear in the media or press, computer science (CS) faculties and the software engineering (SE) discipline in particular appear to be steadily challenged in attracting and supplying sufficient students to fulfill the job market demand.
To each higher education institution and country, it may appear to be only a local or regional problem, yet the challenge may indeed be more common and broader in nature. Statistics for SE are not as readily available as those for CS. Since SE can be viewed as being a subset of CS, and not all CS faculties offer a separate SE degree or concentration (but may include applicable SE courses and
electives in their curriculum), we focus on available statistics for CS majors and assume they correlate to SE in this paper. For example, in the United States in 2005, after a boom beginning around 2000, a 60% decrease over 4 years in the number of freshmen specifying CS as a major was observed [2]. And US bachelor degrees in CS in 2011 were roughly equivalent to that seen in 1986 both in total number (~42,000) and as a percentage of 23 year olds (~1%) [3]. As another example, Germany also observed a negative trend from a record number of CS students in 2000, and one 2009 news article [4] blamed the negative image of CS among the young generation. While the number of starting CS undergrads in Germany has since increased, roughly 33,000 software developer positions in Germany remain unfilled in 2014 [5]. In addition, the demographic effects forecast for various industrial countries imply a decreasing younger population, reducing the overall supply and thus increasing the competition between disciplines to attract students and eventually qualified workers. Thus, it remains a worldwide issue to attract young women and men to study SE.
Concerning SE's image, according to D. Parnas [6] there is apparently confusion in higher education institutions as to the difference between CS and SE, and we assert this affects secondary education as well. The CS equivalent term in Germany, informatics, is much more publically known and marketed as a discipline or field of study than is SE. Thus, SE programs struggle in the overall competition between disciplines to attract secondary students for this critical area to society, since SE must first raise awareness about its field.
The concepts inherent in SE are exemplified in the SWEBOK [7]. The objectives of the SWEBOK include promoting a consistent view of SE, clarifying the bounds of and characterizing the contents of SE with respect to other disciplines, and providing a topical access to the SE Body of Knowledge. Knowledge areas (KAs) have a common structure, including a subclassification of topics, topic descriptions with references. The KAs with the abbreviations used in this paper are shown in Table I and Related Disciplines and shown in Table II. These KAs tend themselves to be abstract and to deal with abstractions. Thus, they are difficult to convey, especially to secondary school students who have not significantly dealt with such abstractions, and cannot thus practically imagine what they mean. Furthermore, secondary school teachers and institutions are challenged in teaching CS, and have likely themselves not been introduced to SE.
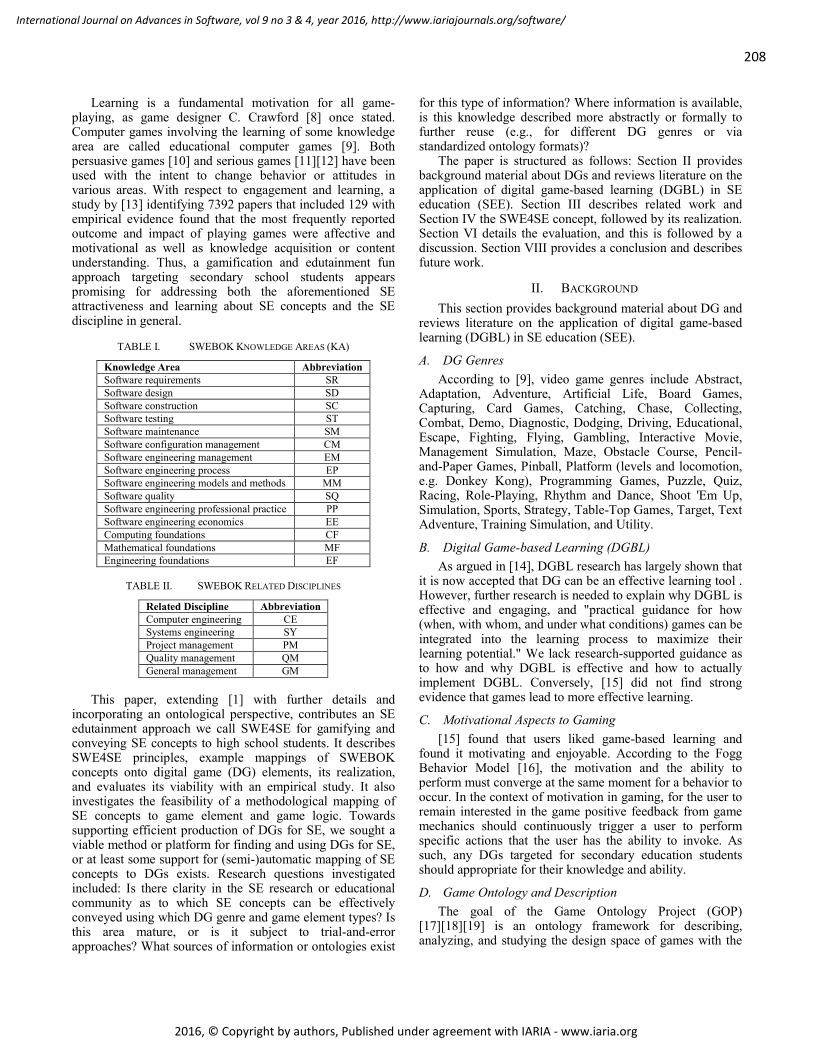
208
International Journal on Advances in Software, vol 9 no 3 & 4, year 2016, http://www.iariajournals.org/software/
2016, © Copyright by authors, Published under agreement with IARIA - www.iaria.org
Learning is a fundamental motivation for all game-playing, as game designer C. Crawford [8] once stated. Computer games involving the learning of some knowledge area are called educational computer games [9]. Both persuasive games [10] and serious games [11][12] have been used with the intent to change behavior or attitudes in various areas. With respect to engagement and learning, a study by [13] identifying 7392 papers that included 129 with empirical evidence found that the most frequently reported outcome and impact of playing games were affective and motivational as well as knowledge acquisition or content understanding. Thus, a gamification and edutainment fun approach targeting secondary school students appears promising for addressing both the aforementioned SE attractiveness and learning about SE concepts and the SE discipline in general.
TABLE I. SWEBOK KNOWLEDGE AREAS (KA)
Knowledge Area Abbreviation Software requirements SR Software design SD Software construction SC Software testing ST Software maintenance SM Software configuration management CM Software engineering management EM Software engineering process EP Software engineering models and methods MM Software quality SQ Software engineering professional practice PP Software engineering economics EE Computing foundations CF Mathematical foundations MF Engineering foundations EF
TABLE II. SWEBOK RELATED DISCIPLINES
Related Discipline Abbreviation Computer engineering CE Systems engineering SY Project management PM Quality management QM General management GM
This paper, extending [1] with further details and
incorporating an ontological perspective, contributes an SE edutainment approach we call SWE4SE for gamifying and conveying SE concepts to high school students. It describes SWE4SE principles, example mappings of SWEBOK concepts onto digital game (DG) elements, its realization, and evaluates its viability with an empirical study. It also investigates the feasibility of a methodological mapping of SE concepts to game element and game logic. Towards supporting efficient production of DGs for SE, we sought a viable method or platform for finding and using DGs for SE, or at least some support for (semi-)automatic mapping of SE concepts to DGs exists. Research questions investigated included: Is there clarity in the SE research or educational community as to which SE concepts can be effectively conveyed using which DG genre and game element types? Is this area mature, or is it subject to trial-and-error approaches? What sources of information or ontologies exist
for this type of information? Where information is available, is this knowledge described more abstractly or formally to further reuse (e.g., for different DG genres or via standardized ontology formats)?
The paper is structured as follows: Section II provides background material about DGs and reviews literature on the application of digital game-based learning (DGBL) in SE education (SEE). Section III describes related work and Section IV the SWE4SE concept, followed by its realization. Section VI details the evaluation, and this is followed by a discussion. Section VIII provides a conclusion and describes future work.
II. BACKGROUND This section provides background material about DG and
reviews literature on the application of digital game-based learning (DGBL) in SE education (SEE).
A. DG Genres According to [9], video game genres include Abstract,
Adaptation, Adventure, Artificial Life, Board Games, Capturing, Card Games, Catching, Chase, Collecting, Combat, Demo, Diagnostic, Dodging, Driving, Educational, Escape, Fighting, Flying, Gambling, Interactive Movie, Management Simulation, Maze, Obstacle Course, Pencil-and-Paper Games, Pinball, Platform (levels and locomotion, e.g. Donkey Kong), Programming Games, Puzzle, Quiz, Racing, Role-Playing, Rhythm and Dance, Shoot 'Em Up, Simulation, Sports, Strategy, Table-Top Games, Target, Text Adventure, Training Simulation, and Utility.
B. Digital Game-based Learning (DGBL) As argued in [14], DGBL research has largely shown that
it is now accepted that DG can be an effective learning tool . However, further research is needed to explain why DGBL is effective and engaging, and "practical guidance for how (when, with whom, and under what conditions) games can be integrated into the learning process to maximize their learning potential." We lack research-supported guidance as to how and why DGBL is effective and how to actually implement DGBL. Conversely, [15] did not find strong evidence that games lead to more effective learning.
C. Motivational Aspects to Gaming [15] found that users liked game-based learning and
found it motivating and enjoyable. According to the Fogg Behavior Model [16], the motivation and the ability to perform must converge at the same moment for a behavior to occur. In the context of motivation in gaming, for the user to remain interested in the game positive feedback from game mechanics should continuously trigger a user to perform specific actions that the user has the ability to invoke. As such, any DGs targeted for secondary education students should appropriate for their knowledge and ability.
D. Game Ontology and Description The goal of the Game Ontology Project (GOP)
[17][18][19] is an ontology framework for describing, analyzing, and studying the design space of games with the

209
International Journal on Advances in Software, vol 9 no 3 & 4, year 2016, http://www.iariajournals.org/software/
2016, © Copyright by authors, Published under agreement with IARIA - www.iaria.org
focus on gameplay. Its top-level concepts are Goals, Interfaces, Rules, Entity Manipulation, and Entities, whereby Entities are not further developed. GOP borrows concepts and methods from prototype theory [20] as well as grounded theory [21]. In contrast to gaming patterns [22], it provides the ability to identify and describe key structural elements rather than focusing on well-known solutions to recurring game design problems that have been codified as patterns. GOP concepts will be used to describe the realization of various games; however, it lacks the specification of genre and game logic. Other work on game ontologies includes [23], who investigated using Resource Description Framework (RDF) and Web Ontology Language (OWL) models to represent the knowledge within a role-playing DG.
[24] proposed the Video Game Description Language (VGDL) to be able to classify and describe the game logic, features, and mechanics of a game for the purposes of human and software agent understanding, as well as for automatic game generation from such a description. They focused on arcade games.
E. Literature Review of DGs Applied to SE Rather than using the SWEBOK KAs, [13] used and
extended the ISO/IEC 12207 to classify the SE process areas that were gamified in certain studies. Most of them focus on SD, and to a lesser extent SR, PM, and other support areas. Gamification elements employed by the primary studies were primarily points (14), badges (7), rankings (4), social reputation (4), voting (3), levels (2), visual metaphor (2), and otherwise quests, dashboard, betting, and awards.
Not all of the aforementioned studies explicitly differentiate on the axis of digital game (DG) from other serious game types, nor differentiate serious vs. fun games. Also, we noted that sometimes games were classified as pertaining to project management, but the work did not specifically focus on software project management.
Table III provides a summary of certain DG (based primarily on [13][25][26]) listing its genre with our own interpretation of the SWEBOK KA or SE-related concepts conveyed by various SE DG, extended with additional games. Our interpretation of the KA involved in certain games in [25] and [26] differ. If a paper provided no screenshot and no further evidence was found, then it is assumed not necessarily to be a digital game and was not included. If the game is not specifically focused on SE, then it was excluded. Note that while the [13] study appears to broadly cover SE gamification, for our purposes only 3 of the 29 cited primary papers, namely Trogon, HALO, and iThink, actually deal with digital games (have screenshots) that are focused on topics linked somewhat with SE.
[15] found that most common game genres in research were simulations (43), action games (14), puzzles (11), role-playing (8), strategy (6), and adventure (5). Only 1 of the 129 papers (that of Papastergiou) addressed a computing subject directly and only 3 of the 43 simulation game types were focused on entertainment as an intention, the rest were learning or serious games. This indicates that the simulation genre is most widespread in game research but entertainment is an uncommon intention for this genre. This correlates with
our findings in Table III that simulation is a popular SE game genre in literature, and the likely intention of these games is primarily learning and not entertainment.
TABLE III. SELECTED EXAMPLES OF DIGITAL GAMES AND THE SE CONCEPTS THEY ATTEMPT TO CONVEY
Digital Game Reference Genre SE Concepts Conveyed
Serious-AV (AVuSG) Shabanah [27] Simulation CF
SimjavaSP Shaw & Dermoudy [28] Simulation EM; PM
The Incredible Manager Barros et al. [29] Simulation EM; PM
SimVBSE Jain & Boehm [30] Simulation EM; PM
SimSoft Caulfield et al. [31] Simulation EM; PM
Therefore iManage Collofello [32] Simulation EM; EP; PM; EP
SESAM (Software Engineering Simulation by Animated Models)
Drappa & Ludewig [33] Simulation EM; EP; PM;
EP
SimSE Navarro & van der Hoek [34] Simulation
EM; PM; EP; SR; EP; EM; PM
DesigMPS Chaves et al. [35] Simulation EP MO-SEProcess (SimSE in Second Life)
Wang & Zhu [36] Simulation & Virtual Reality
EP; EM; PM
Trogon Ašeriškis & Damaševičius [37]
Collaborative Simulation PM
Pex4Fun Xie et al. [38] Social interactive coding
SC
- Knauss et al. [39] Simulation SR
- Hainey et al. [40] Collaborative, Avatar SR
iThink Fernandes [41] Simulation SR CIRCE, Production Cell, SummerSun, Quality Certification
Sharp & Hall [42] Simulation SR; SD; SC; SQ
HALO Bell et al. [43] Social quest SD, ST Unlisted are the plethora of software programming
educational games or tools focused on teaching programming to kids, such as CodeCombat, CodeMonkey, CodinGame, Swift Playgrounds, Scratch, Alice, etc. However, our intent is not to teach a skill such as programming but to create an understanding and awareness about a SE topic. One reason for this is that we consider learning a skill (rather than learning about a skill) as requiring significantly more time investment for a DG user. Furthermore, programming overlaps with CS and does not help us to differentiate SE from CS.
Table III also shows that the most common KAs (10 of the 16) games listed are EM, PM, or EP and that a broader coverage of the 15 SWEBOK KAs with DGs is not apparent, be it any single game nor across multiple games.
F. SE Ontology Concepts [44] and [45] provide an overview of the usage of various
ontologies in SE.

210
International Journal on Advances in Software, vol 9 no 3 & 4, year 2016, http://www.iariajournals.org/software/
2016, © Copyright by authors, Published under agreement with IARIA - www.iaria.org
Work on SWEBOK ontologies in particular include [46], which performed an almost literal transcription, identifying over 4000 concepts, 400 relationships, 1200 facts, and 15 principles. While other work has also been done on a SWEBOK ontology, we were unable to access a any substantial SWEBOK ontology.
As far as utilizing the SWEBOK for SE education, [47] discusses modeling such an ontology.
III. RELATED WORK Beyond the related work in Section II, studies concerning
the perception and attractiveness among secondary students of choosing CS as a college major, the study by [48] of 836 High School students from 9 schools in 2 US states concluded that the vast majority of High School students had no idea what CS is or what CS majors learn. This conclusion can most likely be transposed to the lesser known discipline of SE. The number one positive influence towards a major in CS for males was interest in computer games and for females, gaming was third. Among females, the primary positive motivator was the desire to use CS in another field, while this factor was third for males.
Serious games [12] have an explicit educational focus and tend to simulate real-world situations with intended audiences beyond secondary education. With regard to the use of gaming within the SE education field, [25] performed a literature search of games-based learning in SE and "found a significant dearth of empirical research to support this approach." They examine issues in teaching the abstract and complex domain of requirements collection and analysis and, more generally, SE. A systematic survey on SE games by [26] analyzed 36 papers, all of which had targeted primarily undergraduate or graduates. A more recent study [13] carried out a systematic mapping to characterize the state of SE gamification, analyzing 29 primary studies from 2011-2014. It concluded that the and the application of gamification in SE is still in an initial stage, research in this area is quite preliminary, there is little sound evidence of its impact, and scarce empirical evidence.
Approaches for creating DGs include SimSYS [49], a model-driven engineering (MDE) based approach that integrates traditional entertainment game design elements, pedagogical content, and software engineering methodologies. Starting with informal models, it organizes games by acts, scenes, screens, and challenges and, using IBM Rhapsody, generates formal UML executable state chart models and XML for the SimSYS gameplay engine. However, this work does not describe which SE concepts map well to which game genres or game elements, nor does it attempt to utilize ontologies. [27] details game specifications, game genres, and game design, but is focused on the relatively narrow area of algorithm learning and visualization.
We were unable to find work related to the combination of SE or SWEBOK and DG ontologies or any more concrete method or mapping of SE concepts to game elements or game logic.
SWE4SE is targeted not towards higher education, but rather secondary school students with an explicit non-serious
game approach. In secondary education, whereas initiatives for teaching programming are more common, conveying SE concepts in general and gamifying SE as a non-serious games has not hitherto been extensively studied, nor has the educational value of explicitly "non-serious" (or fun) games for this population stratum. While we study a secondary education population as does [48], our results go further in showing that an edutainment approach can improve the perception and attractiveness of SE. Compared to other learning game approaches, it explicitly makes the tradeoff to value entertainment more and education less in order to retain student engagement and enjoyment. It also explicitly includes short informational and entertaining video sequences to enhance the experience beyond gaming alone. Furthermore, it attempts to explicitly describe the mapping of SE concepts to various DGs and game elements.
IV. SWE4SE CONCEPT SWE4SE consists of a hybrid mix of short informational
and entertaining videos and a variety of relatively simple digital games. Our solution is necessarily based on certain assumptions and constraints. For instance, we assumed that the players may not only be playing in a compulsory classroom setting, but may play voluntarily on their own time, meaning that they could choose to stop playing if it becomes boring or frustrating and discard the game for some more interesting game. Thus, the edutainment is considered to be "competing" with available pure entertainment options. However, we expect that the game may be promoted to secondary school teachers where they would introduce students to the game, meaning that our concept must not necessarily compete solely with commercial products and other entertainment. We also assumed that the motivational factors for students in the SWE4SE are curiosity, exploration, discovering different games, and finding fun areas.
Based on the motivational aspect of gaming discussed in Section II, since our target behavior is interest in the subject matter of SE, for our target audience of secondary students lacking SE knowledge a typical SE DG that requires pre-knowledge of SE concepts will not motivate since they are lacking the skills to achieve the target behavior. This implies a SEE DG for our target audience should avoid the direct use of SE concepts in order to play the game.
A. Design Principles Web-browser Principle (P:Web): To broadly reach the
target audience (secondary students ages 12-18), we chose to focus our initial design and implementation on a web-based game solution and avoid the installation of components on game or various OS platforms. This constrains the available game options, but increases the reachable population.
Engagement / Enjoyment Principle (P:En): We want to keep the students engaged and to emotionally enjoy the experience. To reduce the likelihood of a player discontinuing due to lack of fun, we chose to value and prioritize the fun aspect more than pushing the learning of SE educational concepts. We are thus aware of the fact that less of the SE material may be conveyed and retained, but by

211
International Journal on Advances in Software, vol 9 no 3 & 4, year 2016, http://www.iariajournals.org/software/
2016, © Copyright by authors, Published under agreement with IARIA - www.iaria.org
retaining engagement over a longer timeframe, further possibilities for SE concept conveyance result.
Game Reuse Principle (P:GR): Leverage known games and game concepts (repurposing) when possible, such as those in [50]. Players may thus already know the basics of how the original game works - reducing the time to become proficient, and they may find the new twist involving SE concepts interesting. Also, more time and cognitive capacity may be available for the mapping of SE concepts to the game elements when compared with completely unfamiliar games.
Simple Game Principle (P:SG): Utilize relatively simple games when not utilizing already known games (cp. P:GR). This reduces the overall effort required to acquire game proficiency and to acquire the SE concepts.
SE Concept Reinforcement via Game Action Principle (P:GA): during the games, immediate feedback messages that reinforce game associations to SE concepts are given, e.g., "Correct, the quality was OK" or "Oops, the component was released with quality defects" for a software quality control (SQC) game. This makes it more transparent how choices and actions are reflected in SE concepts.
Lower Bloom's Taxonomy Focus (P:BT): due to the limited time and attention for conveying SE concepts in the secondary school environment, the DGBL SE content and questions focus primarily on the lower levels of the cognitive domain: remembering (in the revised Bloom taxonomy [51]) or knowledge and comprehension (in the original Bloom taxonomy [52]). Note that the older 2004 version of the SWEBOK utilized the Bloom taxonomy to classify its knowledge content for educational purposes.
The aforementioned solution design principles are summarized in Table IV.
TABLE IV. SUMMARY OF SOLUTION DESIGN PRINCIPLES
Principle Abbrev. Web-browser Principle P:Web Engagement / Enjoyment Principle P:En Game Reuse Principle P:GR Simple Game Principle P:SG SE Concept Reinforcement via Game Action Principle P:GA Lower Bloom's Taxonomy Focus P:BT
B. Edutainment Elements and SE Concept Mappings We believe that certain aspects of SE cannot be conveyed
well solely with games and should thus be supplemented. Text components: a brief amount of onscreen text was
used to introduce the topic area, relevant SE concepts, and the game objective and major game elements. Such a short text that can be clicked away does not overly interfere with the experience, and can be read or skimmed rather quickly. Using these, later bonus-level text questions can reference some prior text or video as a way to verify comprehension.
Video components: a short 5-minute informational video described how prevalent code is, society's dependence on software, and how important software development and software engineers are. The ability to include relevant videos, and the ability for users to explore and discover such videos, adds to the "adventure".
Game components: Various concepts from the SWEBOK were chosen, with the selection subjectively constrained by our project resources, technical and game engine constraints, and how well a concept might map to a game concept. The selection, mapping, and prioritization of what to realize was subjectively reflected and decided on as a team, as summarized in Table V and detailed in Section V.
TABLE V. SE CONCEPT TO GAME MAPPING
SE Concept SWEBOK KA
SWE4SE Game Variant
Analogous Common
Game Processes EP, SC ProcMan Pac-Man
Quality control SQ Q-Check Pinball Requirements SR ReqAbdeck Tower Defense
Testing ST, SD Angry Nerds Angry birds Construction SC Reverse Angry Nerds Angry birds
Defect remediation SM, CF Bug Invaders Space invaders Project
management EM, PM Path Management Maze
The mapping should be interpreted as exploratory and
not prescriptive; our intention here is rather to demonstrate the possibilities for conveying SE concepts such an edutainment approach provides.
V. SWE4SE REALIZATION To develop the web-based games, Scirra Construct 2 was
used, an HTML5 and JavaScript 2D game visual editor with a behavior-based logic system. Layouts and Event sheets were used, and each game object type is given properties with certain states and behavior. Sounds and music were integrated. The web browser requires HTML5 and Javascript support. Text components were initially German because we did not want language barriers for secondary students to affect our evaluation results, but the game text could be readily internationalized.
In the following description of each game, the entire upper levels of the SWEBOK ontology of the KA are also provided so that the actual SE concepts conveyed can be considered in context relative to other topics that were not conveyed. Since there was significant overlap in the GOP ontological game concepts used among the various games, these are presented at the end of the section.
A. Conveying SE Concepts in the Various Games For each game, we describe how the analogous common
games and their game concepts were mapped to corresponding SE concepts.
1) ProcMan: this game is analogous to the well-known Pac-Man game (see Figure 1), which has the highest brand awareness of U.S. consumers (94%) of any video game character [53].
a) Game Play: As in Pac-Man, the player controls the ProcMan traveling within a maze. Points are scored by eating the yellow pac-dots and bonus points are given if the cherries are eaten while shown just below the center. Starting with three lives, if during play one of the four chasing ghosts manages to touch the ProcMan a life is lost.

212
International Journal on Advances in Software, vol 9 no 3 & 4, year 2016, http://www.iariajournals.org/software/
2016, © Copyright by authors, Published under agreement with IARIA - www.iaria.org
In our variant there is a twist that, whereas in PacMan one got points by traveling everywhere in the maze in any order, the goal here for the player is to follow a given SE process sequence by having ProcMan consume the distributed initial letter standing for each phase in the expected order while also avoiding the enemy ghosts.
Figure 1. ProcMan game conveys SE processes (screenshot).
b) SE Concept: SE Processes. To convey an engineering process, we chose to introduce the activities common to almost any SE process. Based on the sequential waterfall process, these were Analysis, Design, Implementation, Testing, and Operations (ADITO, or equivalently AEITB in German). We also provided a test-driven development (TDD) variant where the Testing occurs before Implementation (ADTIO).
c) SE Ontology Elements: within the EP KA, the SE concepts of Software Life Cycle Models and Software Process Adaptation are conveyed (see Figure 2).
Figure 2. SWEBOK EP KA concepts (in bold) conveyed by ProcMan.
Within the SC KA, the SE concept of Test-First Programming is conveyed (see Figure 3).
Figure 3. SWEBOK SC KA concepts (in bold) conveyed by ProcMan.
2) Q-Check: this game is loosely analogous to pinball (see Figure 4).
Figure 4. Q-Check game conveys SE quality control (screenshot).
a) Game Play: Software components (SoCos) portrayed as colored shapes spin and drop into a funnel, while a cannon (blue on the left) automatically shoots them individually after a certain time transpires (indicated via a decreasing green bar on the cannon). The player's goal is to

213
International Journal on Advances in Software, vol 9 no 3 & 4, year 2016, http://www.iariajournals.org/software/
2016, © Copyright by authors, Published under agreement with IARIA - www.iaria.org
select the process (tunnel on the right) that matches the SoCo type currently in the cannon based on both color and shape, or reject it for rework (yellow) if it is defective, improving the future error rate.
b) SE Concept: Software quality control (SQC). Quality expectations differ based on the type of software component being inspected (e.g., GUI, database, business logic). Quality awareness and attention to detail matter, and the appropriate quality process, tools, and testing procedures must be chosen dependent on the assessed object.
c) SE Ontology Elements: within the SQ KA, the SE concept of Software Quality Management Processes is conveyed as shown in Figure 5.
Figure 5. SWEBOK concepts (in bold) conveyed by Q-Check.
3) ReqAbdeck: ("Abdeckung" in German means "coverage") this game is analogous to the popular game Tower Defense (see Figure 6).
Figure 6. ReqAbdeck conveys SE requirement coverage (screenshot).
a) Game Play: waves of "reqs" (requirements as colored triangles) flow from left to right, and towers in
various colors that cover (fire) only at their requirement color must be dragged to the appropriate vicinity before the "reqs" reach the gate. The towers disappear after a short time indicated on their border. Thus, one is not covering critical requirements in time with the matching implementation, ignoring or forgetting a requirement, or not dropping via a gate those requirements without business value (denoted by black circles). One example action message here is "Great, requirement was covered by a suitable realization.
b) SE Concept: Software requirements. ReqAbdeck concerns itself with the SE concept of requirements coverage, for instance not overlooking a requirement, determining which requirements to fulfill how and when (different requirement types need different specialized competencies), which requirements to jettison (e.g., due to insufficient business value).
c) SE Ontology Elements: within the SR KA, the SE concepts of Requirements Process Quality and Improvement and Requirements Classification are conveyed as shown in Figure 7.
Figure 7. SWEBOK concepts (in bold) conveyed by ReqAbdeck.
4) Angry Nerds: this game is loosely analogous to the popular game Angry Birds (see Figure 8).

214
International Journal on Advances in Software, vol 9 no 3 & 4, year 2016, http://www.iariajournals.org/software/
2016, © Copyright by authors, Published under agreement with IARIA - www.iaria.org
Figure 8. AngryNerds conveys SE testing (screenshot).
a) Game Play: we chose to depict hardware-like testing here of children's blocks, since it was not obvious to us how to quickly convey code-based testing in an obvious manner without necessitating extra explanations about programming. The player's goal in this case is to test a given construct of slabs surrounding PCs by determining where and how hard to throw a mouse at it to knock it completely over. They realize that multiple tests are necessary to discover its weaknesses.
b) SE Concept: Software testing. The SE focus of this game is to convey the objectives of testing (finding deficiencies and building confidence in one's construct) determining where to test to find deficiencies in some software construct.
c) SE Ontology Elements: within the ST KA, the SE concept of Objectives of Testing is conveyed as shown in Figure 9.
Figure 9. SWEBOK ST concepts (in bold) conveyed by Angry Nerds.
Within the KA SD, the SE concept of Quality Analysis and Evaluation Techniques is conveyed as shown in Figure 10.
Figure 10. SWEBOK SD concepts (in bold) conveyed by Angry Nerds.
5) Reverse Angry Nerds: this game actually becomes available in the bonus level of the previous game, but the gameplay is different, in that it reverses the role as shown in Figure 11.
Figure 11. Reverse AngryNerds game conveys SE construction
(screenshot).
a) Game Play: the player must now try to build a resilient construct by dragging and placing slabs in such a way that it withstands the automated testing (that being a cannonball shot at the construct).
b) SE Concept: Software construction. The point of this exercise is to construct something (analogous to software) such that it exhibits resiliency.
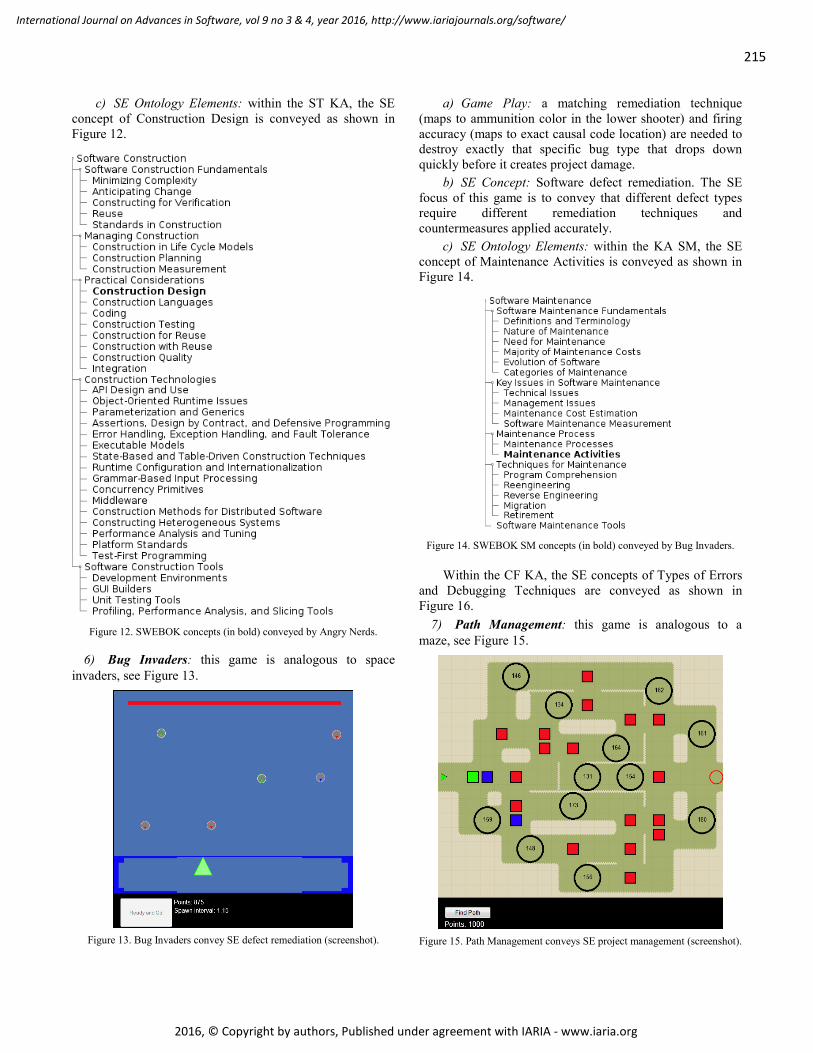
215
International Journal on Advances in Software, vol 9 no 3 & 4, year 2016, http://www.iariajournals.org/software/
2016, © Copyright by authors, Published under agreement with IARIA - www.iaria.org
c) SE Ontology Elements: within the ST KA, the SE concept of Construction Design is conveyed as shown in Figure 12.
Figure 12. SWEBOK concepts (in bold) conveyed by Angry Nerds.
6) Bug Invaders: this game is analogous to space invaders, see Figure 13.
Figure 13. Bug Invaders convey SE defect remediation (screenshot).
a) Game Play: a matching remediation technique (maps to ammunition color in the lower shooter) and firing accuracy (maps to exact causal code location) are needed to destroy exactly that specific bug type that drops down quickly before it creates project damage.
b) SE Concept: Software defect remediation. The SE focus of this game is to convey that different defect types require different remediation techniques and countermeasures applied accurately.
c) SE Ontology Elements: within the KA SM, the SE concept of Maintenance Activities is conveyed as shown in Figure 14.
Figure 14. SWEBOK SM concepts (in bold) conveyed by Bug Invaders.
Within the CF KA, the SE concepts of Types of Errors and Debugging Techniques are conveyed as shown in Figure 16.
7) Path Management: this game is analogous to a maze, see Figure 15.
Figure 15. Path Management conveys SE project management (screenshot).

216
International Journal on Advances in Software, vol 9 no 3 & 4, year 2016, http://www.iariajournals.org/software/
2016, © Copyright by authors, Published under agreement with IARIA - www.iaria.org
Figure 16. SWEBOK CF concepts (in bold) conveyed by Bug Invaders.
a) Game Play:.a player must manage a starting budget in points efficiently. From the project start (green triangle) a path selection is made to take it to the end (red circle). Red blocks depict possible steps, blue steps the currently available choices, and green the current position. Each step costs 100 points, while randomly generated problems (black circles) add to the planned costs.
b) SE Concept: software project management. The SE concept conveyed is that multiple choices towards optimizing project costs exist, and the process is planned and resources allocated considering various risks. With appropriate planning, the project goal can be reached with the allotted resources, despite unexpected problems (risk transition) that must be overcome but nevertheless result in unplanned additional resource costs.
c) SE Ontology Elements: within the KA of EM, the concepts of Process Planning;, Effort, Schedule, and Cost Estimation; Resource Allocation; and Risk Management are conveyed, see Figure 17.
Figure 17. SWEBOK concepts (in bold) conveyed by Path Management.
B. Realization of the Game World SE Exploration Concept To tie the various DGs together, the realization includes a
SE universe to navigate to and discover various SE planets. Figure 18 shows the spaceship navigating in two dimensions. A shield level, reduced when colliding with asteroids, is shown as a colored line next to the ship. The game ends when the shields are lost or on collision with the sun. The bottom right of the screen shows a navigation map with the location of all planets (red first, green when visited, and violet for the home planet, and the spaceship as an arrow.
When arriving at a planet (Figure 19), a short text about SE concepts that relates to the game is shown, which when
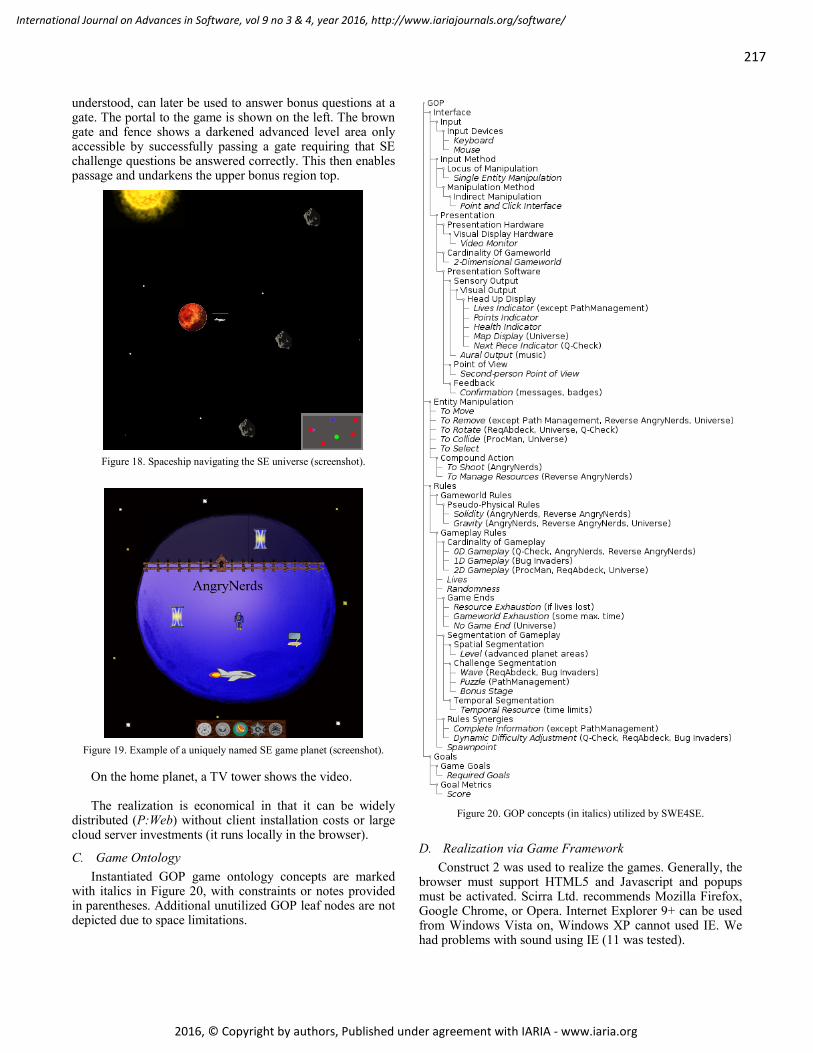
217
International Journal on Advances in Software, vol 9 no 3 & 4, year 2016, http://www.iariajournals.org/software/
2016, © Copyright by authors, Published under agreement with IARIA - www.iaria.org
understood, can later be used to answer bonus questions at a gate. The portal to the game is shown on the left. The brown gate and fence shows a darkened advanced level area only accessible by successfully passing a gate requiring that SE challenge questions be answered correctly. This then enables passage and undarkens the upper bonus region top.
Figure 18. Spaceship navigating the SE universe (screenshot).
Figure 19. Example of a uniquely named SE game planet (screenshot).
On the home planet, a TV tower shows the video. The realization is economical in that it can be widely
distributed (P:Web) without client installation costs or large cloud server investments (it runs locally in the browser).
C. Game Ontology Instantiated GOP game ontology concepts are marked
with italics in Figure 20, with constraints or notes provided in parentheses. Additional unutilized GOP leaf nodes are not depicted due to space limitations.
Figure 20. GOP concepts (in italics) utilized by SWE4SE.
D. Realization via Game Framework Construct 2 was used to realize the games. Generally, the
browser must support HTML5 and Javascript and popups must be activated. Scirra Ltd. recommends Mozilla Firefox, Google Chrome, or Opera. Internet Explorer 9+ can be used from Windows Vista on, Windows XP cannot used IE. We had problems with sound using IE (11 was tested).

218
International Journal on Advances in Software, vol 9 no 3 & 4, year 2016, http://www.iariajournals.org/software/
2016, © Copyright by authors, Published under agreement with IARIA - www.iaria.org
VI. SWE4SE EVALUATION The convenience sampling technique [54], common in
educational settings, was selected to evaluate our SE edutainment approach due to various constraints otherwise inhibiting direct access to a larger random population sample of the target population stratum. These constraints include logistical and marketing effort and budget, privacy issues, and acquiring parental consent for school age children.
A. Evaluation Setting Two teachers at two different public university
preparatory (secondary) schools in different cities in the local German region gave us access for 90 minutes to 20 total students that attend their informatics interest groups. Setting A using an alpha version of the software tested with a group of 8 males, and a later setting B using a beta version in a different city with 6 females and 6 males students. Figure 21 shows the age and gender distribution, and Figure 22 indicates their current game usage frequency.
0123456789
15 16 17 18
Num
ber o
f stu
dent
s
Age
females
males
Figure 21. Student age and gender distribution.
01234567
Veryfrequently
Frequently Sometimes Hardly Never
Num
ber o
f stu
dent
s
Game usage
females
males
Figure 22. Prior game usage frequency distribution.
B. Evaluation Method While we considered utilizing the GEQ [55], it appeared
more appropriate for more immersive games rather than our game genres. Due to factors such as the player ages, the limited time they had for playing multiple different short games (7 games in one hour), and the limited time, attention, and incentives for filling out pre- and post-questionnaires (10 minutes respectively), only a few questions about their state before and after with regard to negative or positive affect were included. They were asked but not compelled to answer all questions, so some fields were left blank by some students, which could be interpreted to mean they did not understand the question, or did not know how to answer, or
did not care to answer the question. Blank answers were thus omitted.
The empirical evaluation consisted of 90-minute sessions held in two different settings A and B. The first 5 minutes consisted of a short introduction as to the purpose of our visit and what to expect, involving no teaching. Students were then given 10 minutes to fill out anonymous printed questionnaires in German that provided us with initial basic data. When all were done, they began their one-hour edutainment experience. In the 10 minutes directly thereafter, monitors were turned off and they completed the second part of their questionnaire, which focused on their experience and understanding, after which we held a 5-minute group feedback session.
C. Evaluation Results We observed that all students were engaged with
SWE4SE for the entire hour and appeared to enjoy the experience (P:En), and occasionally interacted excitedly with fellow students. Table VI provides our analysis of the questionnaire results. Unless otherwise indicated, averages were based on a scale of 1 to 5 (1 being very good, 5 bad):
TABLE VI. USER EXPERIENCE
Factor Rating Relates to Overall experience 2.1 P:En Game enjoyment 2.0 P:En Helpful conveying several SE concepts via different games
Yes (16) No (1) P:SG, P:GR
Success rate recalling the SE concepts associated with each named gamea
62% P:GA Text Components
Watched the video attentively Yes (20) Video and its quality Good (20)
Video length of 5 minutes Keep (19) Lengthen (1)
a. Open answers. The game names in the questions could serve as a hint, but these did not include the complete and explicit SE concept nor was the game accessible.
Table VII shows the change in perception, attractiveness, and understanding of SE after the experience.
TABLE VII. CHANGE IN SE PERCEPTIONS
Change in responses Before After Improvement Importance of SE for societya 1.7 1.2 33% Attractiveness of SE as a personal career pathb 3.3 2.7 16%
Ability to define what SE isc 2.9 2.3 20% a. Scale of 1 to 3 (1=very important, 3=not important); 2 wrote "don't know" in the prequestionnaire. b. Scale of 1 to 5 (1=very attractive, 5=not attractive) c. Answer graded (1 excellent, 2 very good, 3 satisfactory, 4 sufficient) for B group only.
As to interpreting the results, a convenience sample can obviously contain a number of biases, including under- or overrepresentation. Our supervision of the evaluation process and physically observing that the software was actually used for an hour by each of the students separately, and that each questionnaire was individually filled out, removed certain other kinds of threats to validity.

219
International Journal on Advances in Software, vol 9 no 3 & 4, year 2016, http://www.iariajournals.org/software/
2016, © Copyright by authors, Published under agreement with IARIA - www.iaria.org
VII. DISCUSSION We now discuss our evaluation results and findings.
A. Evaluation Our evaluation showed that the SWE4SE approach can
be effective: because students in this age group had previous familiarity with gaming, they had no difficulty rapidly discovering and playing the games intuitively without training or help, they understood the intended mapping of SE concepts onto game elements, and the perception, attractiveness, and understanding of SE improved significantly without discernable gender differences. It was efficient in achieving these effects in the relatively short span of an hour of usage. An edutainment approach with short videos, short text components, and a variety of simple games appears promising for effectively and efficiently improving the awareness about and image SE, at least for our target population stratum.
B. Ontologies and Methods supporting DGBL in SE In our investigation of which types of SE concepts lend
themselves to being conveyed with which game genres, elements, and gameplay or logic we noticed various difficulties with regard to achieving clarity or more formalization as to a method for mapping SE educational concepts to game genres or elements. This was due to a number of reasons, such as a lack of additional information to more precisely categorize the concepts from various viewpoints, and lack of accessibility of standardized ontologies in standard formats.
For instance, while we were able to categorize the SWEBOK knowledge being conveyed at a relatively coarse granularity in its taxonomy, we found it to be missing additional ontological relations or properties. For one, Bloom's taxonomy has now been removed from the SWEBOK, making it more difficult to automatically or quickly assess the type of knowledge. E.g., if we are only interested in the remembering level of knowledge we cannot easily cull this from the rest.
From the DG standpoint, we were able to describe the various low-level game elements with the GOP. However, we lacked the ability to describe the gameplay logic. For instance, does the game involve sequencing, or differentiating objects, constructing, destroying, analysis, or planning?
A method for mapping we could conceive of would be that any SE concept of the type process could perhaps be mapped to a DG that involves sequencing, or SE concept of the type analysis could utilize a DG that involves differentiation.
C. State of DGBL in SE Our literature review of DG in SE did not find a broad
coverage of KAs. For the purpose of conveying SE concepts specifically in the secondary education this may not be necessary, but it does perhaps indicate that DG have concentrated in certain more obvious areas and that other SE areas for applying DGs have perhaps not been sufficiently explored.
Other than programming games, there appears to be little commercial interest or incentive to provide professional DG to the SE educational community. It is our opinion that DGBL for SE is currently in a relatively immature state, that developed DGs are typically analogous to islands in an uncharted sea and not readily discoverable, accessible, and reusable. We thus suggest that the SE community develop a common SE DG platform that would provide convenient access to such DGs, broadening their discovery and reuse, supporting their open source evolution, and providing feedback. If the community had a categorization utilizing the SWEBOK or similar SE ontology and linked available DGs that address these, then DGBL reuse could be furthered for conveying SE concepts.
VIII. CONCLUSION AND FUTURE WORK We described SWE4SE, an edutainment approach for
gamifying and conveying software engineering concepts to secondary school students. Various principles used of the edutainment approach were elucidated, and it was shown from an ontological perspective how various SE concepts could be mapped and realized with various digital game concepts and elements.
As an indicator of the economic realizability of SWE4SE, our DG realization was done by two students in a 10 credit project in one semester, equivalent to approximately 600 hours workload.
The evaluation showed that an edutainment approach, combining short videos and text elements, and a variety of simple digital games, can be promising for improving SE awareness in our target population stratum. Since this target age group is already familiar with gaming and utilizes gaming relatively frequently, the approach appears reasonable for reaching a larger populace. A challenge remains in making secondary students aware of the availability the edutainment and motivating them to utilize it on a direct or individual basis. While social networks appear feasible for raising awareness, in the face of the abundance of entertainment and game options available, we believe that the most promising approach will likely be informational publicity campaigns towards informatics teachers in secondary schools where groups (i.e., interest groups or classrooms) utilize the software together in a structured setting.
As to further development, refinement, and evolution of such an SWE4SE or similar game development approach, we believe ontologies to be promising for more formally conveying knowledge concepts for the SE domain and for describing various game concepts. However, our investigation determined that a severe gap and immaturity exists in this area that prevents the (semi-)automated inclusion and mapping of SE concepts to game objects or gameplay logic (e.g., via game description languages). This area should thus be further investigated, developed, and formalized to more effectively support DGBL and DG reuse and know-how for SEE and move this area from a trail-and-error experimental craft to more professional engineering.
Future work includes investigating the integration both game and SE domain ontologies into game engines and
220
International Journal on Advances in Software, vol 9 no 3 & 4, year 2016, http://www.iariajournals.org/software/
2016, © Copyright by authors, Published under agreement with IARIA - www.iaria.org
description languages, a longitudinal study on motivational effect retention and other interfering or conflicting influences, and integrated game and web analytics to provide further insights into game playing behavior.
ACKNOWLEDGMENT The author thanks Carsten Lecon, Christian Wilhelm,
Flamur Kastrati, and Lisa Philipp for their assistance with the concepts, realization, and graphics.
REFERENCES [1] R. Oberhauser, "Gamifying and Conveying Software
Engineering Concepts for Secondary Education: An Edutainment Approach," In: Proc. of the Tenth International Conf. on Software Engineering Advances (ICSEA 2015). IARIA XPS Press, 2015. pp. 432-437, ISBN: 978-1-61208-367-4.
[2] J. Vegso, "Interest in CS as a Major Drops Among Incoming Freshmen," Computing Research News, vol. 17, no.3, 2005.
[3] B. Schmidt, "How are college majors changing?" [Online]. Available from: http://benschmidt.org/Degrees/
[4] U. Hanselmann, "Die große Kraft," Engl: "The major force," Die Zeit, No. 22, 2009. [Online]. Available from: http://www.zeit.de/2009/22/C-Faecherportraet-Informatik/ komplettansicht.
[5] Bitkom, "In Deutschland fehlen 41.000 IT-Experten," 2014. [Online]. Available from: https://www.bitkom.org/Presse/ Presseinformation/Pressemitteilung_1704.html.
[6] D. Parnas, "Software engineering programs are not computer science programs," IEEE Software, 16(6), 1999, pp. 19-30.
[7] P. Bourque and R. Fairley, "Guide to the Software Engineering Body of Knowledge (SWEBOK (R)): Version 3.0," IEEE Computer Society Press, 2014.
[8] C. Crawford, The art of computer game design. McGraw-Hill/Osborne Media, 1984.
[9] M. Wolf, The medium of the video game. University of Texas Press, 2002.
[10] I. Bogost, Persuasive games: The expressive power of videogames. The MIT Press, 2007.
[11] D.R. Michael and S.L. Chen, , Serious games: Games that educate, train, and inform. Muska & Lipman/Premier-Trade. 2005.
[12] C. Abt, "Serious Games," The Viking Press, 1970. [13] O. Pedreira, F. García, N. Brisaboa, and M. Piattini,.
"Gamification in software engineering–A systematic mapping," Information and Software Technology, 57, 2015, pp.157-168.
[14] Van Eck, R., 2006. Digital game-based learning: It's not just the digital natives who are restless. EDUCAUSE review, 41(2), p.16.
[15] T. M. Connolly, E. A. Boyle, E. MacArthur T. Hainey, J. M. Boyle, "A systematic literature review of empirical evidence on computer games and serious games," Computers & Education, 59, Elsevier Ltd., 2012, pp. 661–686.
[16] B. J. Fogg, "A behavior model for persuasive design," In Proceedings of the 4th international Conference on Persuasive Technology, ACM, 2009. pp. 40-46.
[17] The Game Ontology Project. [Online]. Available from: http://www.gameontology.com
[18] J. P. Zagal and A. Bruckman, "The game ontology project: supporting learning while contributing authentically to game studies," in Proc. 8th International conference for the learning sciences (ICLS '08), Vol. 2, International Society of the Learning Sciences, 2008, pp. 499-506.
[19] J.P. Zagal, Ludoliteracy: Defining, Understanding, and Supporting Games Education. ETC Press, 2011.
[20] G. Lakoff, Women, Fire, and Dangerous Things: What Categories Reveal About the Mind. The University of Chicago Press, Chicago, 1987.
[21] B. Glaser and A. Strauss, The Discovery of Grounded Theory: Strategies for Qualitative Research. Aldine, Chicago, 1967.
[22] D. Ašeriškis and R. Damaševičius, "Gamification Patterns for Gamification Applications," in Proc. of the 6th international conference on Intelligent Human Computer Interaction (IHCI 2014), Procedia Computer Science, Vol. 39, 2014, pp.83-90.
[23] J. T. Chan and W. Y. Yuen, "Digital Game Ontology: Semantic Web Approach on Enhancing Game Studies," In Proceedings of 2008 IEEE 9th International Conference on Computer-Aided Industrial Design & Conceptual Design, Vol. 1, 2008.
[24] M. Ebner et al., "Towards a video game description language," In: Artificial and Computational Intelligence in Games, Dagstuhl Follow-ups, 6. Dagstuhl Publishing, Wadern, 2013, pp. 85-100, ISBN 9783939897620.
[25] T. Connolly, M. Stansfield, and T. Hainey, "An application of games-based learning within software engineering," British Journal of Educational Technology, 38(3), 2007, pp. 416-428.
[26] C. Caulfield, J. Xia, D. Veal, and S. Maj, "A systematic survey of games used for software engineering education," Modern Applied Science, 5(6), 2011, pp. 28-43.
[27] S. Shabanah, "Computer Games for Algorithm Learning," In Handbook of Research on Improving Learning and Motivation through Educational Games: Multidisciplinary Approaches, ed. Patrick Felicia, 2011, pp. 1036-1063.
[28] K. Shaw and J. Dermoudy, "Engendering an Empathy for Software Engineering," In Proceedings of the 7th Australasian conference on Computing education-Volume 42. Australian Computer Society, Inc., 2005, pp. 135-144.
[29] M. d. O. Barros, A. R. Dantas, G. O. Veronese, and C. M. L. Werner, "Model-Driven Game Development: Experience and Model Enhancements in Software Project Management Education," in Software Process: Improvement and Practice. 11(4), 2006, pp. 411–421, doi:10.1002/spip.279.
[30] A. Jain and B. Boehm, "SimVBSE: Developing a Game for Value-Based Software Engineering," In Proceedings of the 19th Conference on Software Engineering Education & Training (CSEET'06), IEEE, 2006, pp. 103-114, doi:10.1109/cseet.2006.31.
[31] C. W. Caulfield, D. Veal, and S. P. Maj, "Teaching software engineering management–issues and perspectives," International Journal of Computer Science and Network Security, 11(7), 2011, pp.50-54.
[32] J. S. Collofello, "University/industry collaboration in developing a simulation-based software project management training course," IEEE Transactions on Education, 43(4), IEEE, 2000, pp.389-393.
[33] A. Drappa and J. Ludewig, “Simulation in software engineering training,” in Proceedings of the 22nd International Conference on Software Engineering, 2000, pp. 199–208.
[34] E. O., Navarro and A. van der Hoek, "Multi-Site Evaluation of SimSE," Proceedings of The 40th ACM Technical Symposium on Computer Science Education, (SIGCSE '09). ACM, 2009, pp. 326-330, doi:10.1145/1508865.1508981.
[35] R. O. Chaves et al., "Experimental evaluation of a serious game for teaching software process modeling," IEEE Transactions on Education, 58(4), 2015, pp.289-296.
[36] T. Wang and Q. Zhu, "A Software Engineering Education Game in a 3-D Online Virtual Environment," Proceedings of The First International Workshop on Education Technology

221
International Journal on Advances in Software, vol 9 no 3 & 4, year 2016, http://www.iariajournals.org/software/
2016, © Copyright by authors, Published under agreement with IARIA - www.iaria.org
and Computer Science, Vol. 2. IEEE, 2009. pp. 708-710, doi:10.1109/ETCS.2009.418.
[37] D. Ašeriškis and R. Damaševičius, "Gamification of a project management system," in Proc. of Int. Conf. on Advances in Computer-Human Interactions (ACHI2014), 2014, pp. 200-207.
[38] T. Xie, N. Tillmann, and J. De Halleux, "Educational software engineering: Where software engineering, education, and gaming meet," In Proceedings of the 3rd International Workshop on Games and Software Engineering: Engineering Computer Games to Enable Positive, Progressive Change. IEEE Press, 2013, pp. 36-39.
[39] E. Knauss, K. Schneider, K., and K. Stapel, "A Game for Taking Requirements Engineering More Seriously," Proceedings of The Third International Workshop on Multimedia and Enjoyable Requirements Engineering - Beyond Mere Descriptions and with More Fun and Games. IEEE, 2008, pp. 22-26, doi:10.1109/MERE.2008.1.
[40] T. Hainey, T. J. Connelly, M. Stansfield, and E. A. Boyle, "Evaluation of a Game to Teach Requirements Collection and Analysis in Software Engineering at Tertiary Education Level," Computers & Education, 56(1), 2010, pp. 21–35, doi: 10.1016/j.compedu.2010.09.0.
[41] J. Fernandes et al., "iThink: A Game-Based Approach Towards Improving Collaboration and Participation in Requirement Elicitation," in Proc. of the 4th International Conference on Games and Virtual Worlds for Serious Applications (VS-GAMES’12). Procedia Computer Science, vol. 15, 2012, pp. 66-77, doi:10.1016/j.procs.2012.10.059.
[42] H. Sharp and P. Hall, "An Interactive Multimedia Software House Simulation for Postgraduate Software Engineers," in Proceedings of the 22nd International Conference on Software Engineering. ACM, 2000, pp. 688-691.
[43] J. Bell, S. Sheth, S., and G. Kaiser, "Secret ninja testing with HALO software engineering," In Proceedings of the 4th international workshop on social software engineering. ACM, 2011, pp. 43-47.
[44] C. Calero, F. Ruiz, and M. Piattini, M. (eds.), Ontologies for software engineering and software technology. Springer Science & Business Media, 2006.
[45] M. P. S. Bhatia, A. Kumar, and R. Beniwal, "Ontologies for Software Engineering: Past, Present and Future," Indian Journal of Science and Technology, 9(9), 2016, pp. 1-16.
[46] O. Mendes and A. Abran, "Issues in the development of an ontology for an emerging engineering discipline," In Proceedings of the 17th International Conference on Software Engineering and Knowledge Engineering (SEKE'2005), 2005, pp. 139-144.
[47] C. Wille, R. R. Dumke, A. Abran, and J. M. Desharnais, "E-learning infrastructure for software engineering education: Steps in ontology modeling for SWEBOK," In IASTED International Conf. on Software Engineering, 2004, pp. 520-525.
[48] L. Carter, "Why students with an apparent aptitude for computer science don't choose to major in computer science," SIGCSE Bulletin, ACM, vol. 38, no. 1, Mar. 2006, pp. 27-31.
[49] K. M. Cooper and C. S. Longstreet, "Model-driven Engineering of Serious Educational Games: Integrating Learning Objectives for Subject Specific Topics and Transferable Skills," In Computer Games and Software Engineering (1st ed.), K. M. Cooper and W. Scacchi, Eds. Chapman & Hall/CRC, 2015, pp. 59-90.
[50] S. Kent, The Ultimate History of Video Games. Three Rivers Press, 2001.
[51] Anderson, L., Krathwohl, David R, & Bloom, Benjamin S. (2001). A taxonomy for learning, teaching, and assessing : A
revision of Bloom's taxonomy of educational objectives. New York: Longman.
[52] Bloom, B. S.; Engelhart, M. D.; Furst, E. J.; Hill, W. H.; Krathwohl, D. R. (1956). Taxonomy of educational objectives: The classification of educational goals. Handbook I: Cognitive domain. New York: David McKay Company.
[53] Davie Brown Entertainment, "Davie Brown Celebrity Index: Mario, Pac-Man Most Appealing Video Game Characters Among Consumers". PR Newswire, 2008. [Online]. Available from: http://www.prnewswire.com/news-releases/davie-brown-celebrity-index-mario-pac-man-most-appealing-video-game-characters-among-consumers-57256317.html
[54] L. Given (Ed.), The Sage encyclopedia of qualitative research methods. Sage Publications, 2008.
[55] W. IJsselsteijn, K. Poels, and Y. De Kort, "The Game Experience Questionnaire: Development of a self-report measure to assess player experiences of digital games," TU Eindhoven, Eindhoven, The Netherlands, 2008.

222
International Journal on Advances in Software, vol 9 no 3 & 4, year 2016, http://www.iariajournals.org/software/
2016, © Copyright by authors, Published under agreement with IARIA - www.iaria.org
Requirements Engineering in Model Transformation Development: A Technique
Suitability Framework for Model Transformation Applications
Sobhan Yassipour Tehrani, Kevin LanoDepartment of Informatics, King’s College London, London WC2R 2LS, U.K.
E-mail: sobhan.yassipour tehrani, [email protected]
Abstract—Model transformations (MTs) are central to model-driven engineering (MDE). They can be used for a range ofpurposes, including to improve the quality of models, to refactormodels, to migrate or translate models from one representationto another, and to generate code or other artifacts from models.At present, the development of model transformation is mainlyfocused on the specification and implementation phases, whereasthere is a lack of support in other phases including: requirements,analysis, design and testing. Furthermore, there is a lack of co-hesive support for transformations including: notations, methodsand tools within all phases during the development process,which makes the maintenance and understandability of thetransformation code problematic. One of the main hindrances fornot using a systematic Requirements Engineering (RE) process,the initial phase of the software development life-cycle wheresoftware’s specifications are declared, before starting the develop-ment, could be the false assumption that it is a waste of time/costand would delay implementation. The goal of this paper is toevaluate model transformation technology from a requirementsengineering process point of view. Moreover, we identify criteriafor selecting appropriate requirements engineering techniques,and we propose a framework for this selection process.
Index Terms—model transformations; requirements engineer-ing; requirements engineering framework; model transformationcase study; RE technique framework
I. INTRODUCTION
Requirements engineering (RE) has been a relatively ne-glected aspect of model transformation (MT) developmentbecause the emphasis in transformation development hasbeen upon specifications and implementations. The failureto explicitly identify requirements may result in developedtransformations, which do not satisfy the needs of the usersof the transformation. Problems may arise because implicitly-assumed requirements have not been explicitly stated; forinstance, that a migration or refactoring transformation shouldpreserve the semantics of its source model in the target model,or that a transformation is only required to operate on arestricted range of input models. Without thorough require-ments elicitation, important requirements may be omitted fromconsideration, resulting in a developed transformation, whichfails to achieve its intended purpose.
In [1] we reviewed the current practice of RE for MT andidentified a framework for an improved RE process. In thispaper we extend [1] with more details of the framework,and we give extracts from a large-scale application of theframework to a C code generator.
We use the 4-phase RE process model proposed by Som-merville [2] and adapt it according to our specific needs.
This process model is widely accepted by researchers andprofessional experts. The model defines the following asthe most important phases of RE, which should be applied:domain analysis and requirements elicitation, evaluation andnegotiation, specification and documentation, validation andverification.
In Section II we describe related work. Section III gives abackground on requirements engineering for model transfor-mations as well as transformation semantics and its nature. Wealso identify how formalised requirements can be validated andcan be used to guide the selection of design patterns for thedevelopment of the transformation. In Section IV we examineRE techniques and identify how these can be applied to MTdevelopment. In Section V we present a framework for an REprocess and RE technique selection for MT. In Section VI wegive a case study to evaluate the application of our framework.
II. RELATED WORK
The increasing complexity and size of today’s softwaresystems has resulted in raising the complexity and size ofmodel transformations. Although there have been differenttransformation tools and languages, most of them are focusedon the specification and implementation phases. Accordingto [3], most of the transformation languages proposed byModel Driven Engineering (MDE), a software developmentmethodology, are only focused towards the implementationphase and are not integrated in a unified engineering process. Itcould be said that at the moment, the transformation process isperformed in an ad-hoc manner; defining the problem and thendirectly beginning the implementation process. At present, thedevelopment of model transformation is mainly focused onthe specification and implementation phases, whereas thereis a lack of support in other phases including: requirements,analysis, design and testing. Furthermore, there is a lackof cohesive support for transformations including: notations,methods and tools within all phases during the developmentprocess, which makes the maintenance and understandabilityof the transformation code problematic [3].
As Selic [4] argues, “we are far from making the writing ofmodel transformations an established and repeatable technicaltask”. The software engineering of model transformations hasonly recently been considered in a systematic way, and mostof this work [5][6] is focussed upon design and verificationrather than upon requirements engineering. The work on re-quirements engineering in transML is focused upon functional
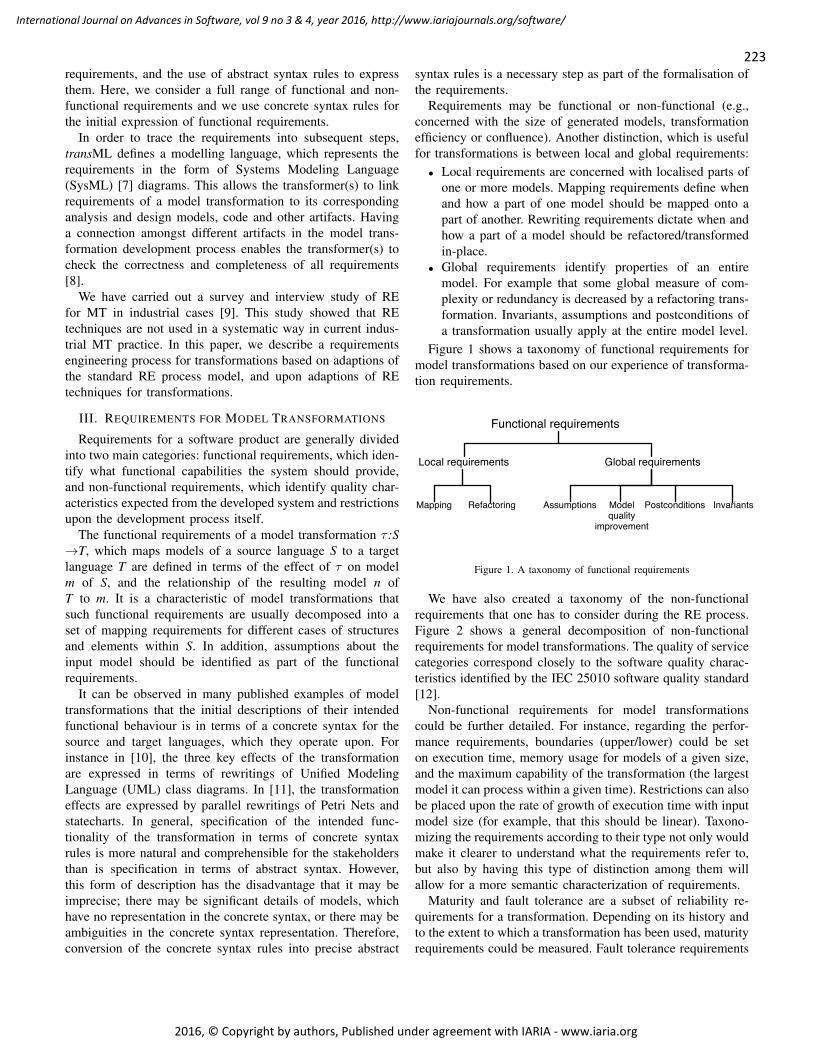
223
International Journal on Advances in Software, vol 9 no 3 & 4, year 2016, http://www.iariajournals.org/software/
2016, © Copyright by authors, Published under agreement with IARIA - www.iaria.org
requirements, and the use of abstract syntax rules to expressthem. Here, we consider a full range of functional and non-functional requirements and we use concrete syntax rules forthe initial expression of functional requirements.
In order to trace the requirements into subsequent steps,transML defines a modelling language, which represents therequirements in the form of Systems Modeling Language(SysML) [7] diagrams. This allows the transformer(s) to linkrequirements of a model transformation to its correspondinganalysis and design models, code and other artifacts. Havinga connection amongst different artifacts in the model trans-formation development process enables the transformer(s) tocheck the correctness and completeness of all requirements[8].
We have carried out a survey and interview study of REfor MT in industrial cases [9]. This study showed that REtechniques are not used in a systematic way in current indus-trial MT practice. In this paper, we describe a requirementsengineering process for transformations based on adaptions ofthe standard RE process model, and upon adaptions of REtechniques for transformations.
III. REQUIREMENTS FOR MODEL TRANSFORMATIONS
Requirements for a software product are generally dividedinto two main categories: functional requirements, which iden-tify what functional capabilities the system should provide,and non-functional requirements, which identify quality char-acteristics expected from the developed system and restrictionsupon the development process itself.
The functional requirements of a model transformation τ :S→T, which maps models of a source language S to a targetlanguage T are defined in terms of the effect of τ on modelm of S, and the relationship of the resulting model n ofT to m. It is a characteristic of model transformations thatsuch functional requirements are usually decomposed into aset of mapping requirements for different cases of structuresand elements within S. In addition, assumptions about theinput model should be identified as part of the functionalrequirements.
It can be observed in many published examples of modeltransformations that the initial descriptions of their intendedfunctional behaviour is in terms of a concrete syntax for thesource and target languages, which they operate upon. Forinstance in [10], the three key effects of the transformationare expressed in terms of rewritings of Unified ModelingLanguage (UML) class diagrams. In [11], the transformationeffects are expressed by parallel rewritings of Petri Nets andstatecharts. In general, specification of the intended func-tionality of the transformation in terms of concrete syntaxrules is more natural and comprehensible for the stakeholdersthan is specification in terms of abstract syntax. However,this form of description has the disadvantage that it may beimprecise; there may be significant details of models, whichhave no representation in the concrete syntax, or there may beambiguities in the concrete syntax representation. Therefore,conversion of the concrete syntax rules into precise abstract
syntax rules is a necessary step as part of the formalisation ofthe requirements.
Requirements may be functional or non-functional (e.g.,concerned with the size of generated models, transformationefficiency or confluence). Another distinction, which is usefulfor transformations is between local and global requirements:• Local requirements are concerned with localised parts of
one or more models. Mapping requirements define whenand how a part of one model should be mapped onto apart of another. Rewriting requirements dictate when andhow a part of a model should be refactored/transformedin-place.
• Global requirements identify properties of an entiremodel. For example that some global measure of com-plexity or redundancy is decreased by a refactoring trans-formation. Invariants, assumptions and postconditions ofa transformation usually apply at the entire model level.
Figure 1 shows a taxonomy of functional requirements formodel transformations based on our experience of transforma-tion requirements.
Functional requirements
Local requirements Global requirements
Mapping Refactoring Assumptions Modelquality
improvement
Postconditions Invariants
Figure 1. A taxonomy of functional requirements
We have also created a taxonomy of the non-functionalrequirements that one has to consider during the RE process.Figure 2 shows a general decomposition of non-functionalrequirements for model transformations. The quality of servicecategories correspond closely to the software quality charac-teristics identified by the IEC 25010 software quality standard[12].
Non-functional requirements for model transformationscould be further detailed. For instance, regarding the perfor-mance requirements, boundaries (upper/lower) could be seton execution time, memory usage for models of a given size,and the maximum capability of the transformation (the largestmodel it can process within a given time). Restrictions can alsobe placed upon the rate of growth of execution time with inputmodel size (for example, that this should be linear). Taxono-mizing the requirements according to their type not only wouldmake it clearer to understand what the requirements refer to,but also by having this type of distinction among them willallow for a more semantic characterization of requirements.
Maturity and fault tolerance are a subset of reliability re-quirements for a transformation. Depending on its history andto the extent to which a transformation has been used, maturityrequirements could be measured. Fault tolerance requirements

224
International Journal on Advances in Software, vol 9 no 3 & 4, year 2016, http://www.iariajournals.org/software/
2016, © Copyright by authors, Published under agreement with IARIA - www.iaria.org
Non-functional requirements
Quality of servive Suitability Developmentconstraint
Architecturalconstraint
Compliance
Performance Reliability Accuracy Interface
Time Space Maturity Faulttolarance
Correctness Completeness Userinteraction
Softwareinteroperability
Effectiveness,Development
effort, etc.
Cost Deadline Variability Maintainability Installation Distribution Conformityto standard
Figure 2. A taxonomy of non-functional requirements for MT
can be quantified in terms of the proportion of executionerrors, which are successfully caught by an exception handlingmechanism, and in terms of the ability of the transformationto detect and reject invalid input models.
As depicted in the above figure, the accuracy characteristicincludes two sub-characteristics: correctness and complete-ness. Correctness requirements can be further divided into thefollowing forms [13]:• Syntactic correctness: a transformation τ is syntactically
correct when a valid input model m from source languageS is transformed to target language T, then (if τ termi-nates) it produces a valid result, in terms of conformationto the T’s language constraints.
• Termination: a transformation τ will always terminate ifapplied to a valid S model.
• Confluence: all result models produced by transformationτ from a single source model are isomorphic.
• Model-level semantic preservation: a transformation τis preserved model-level semantically, if m and n haveequivalent semantics under semantics-assigning mapsSemS on models of S and SemT on models of T.
• Invariance: some properties Inv should be preserved astrue during the entire execution of transformation τ [13].
An additional accuracy property that can be considered isthe existence of invertibility in a transformation σ : T → S,which inverts the effect of τ . Given a model n derived fromm by τ , σ applied to n produces a model m′ of S isomorphicto m. A related property is change propagation, which meansthat small changes to a source model can be propagated tothe target model without re-executing the transformation onthe entire source model. A further property of verifiability isimportant for transformations, which is part of a business-critical or safety-critical process. This property identifies howeffectively a transformation can be verified. Size, complexity,abstraction level and modularity are contributory factors tothis property. The traceability property is the requirementthat an explicit trace between mapped target model elementsand their corresponding source model elements should bemaintained by the transformation, and be available at itstermination. Under interface are requirements categories ofUser interaction (subdivided into usability and convenience)and software interoperability. Usability requirements can bedecomposed into aspects, such as understandability, learnabil-
ity and attractiveness [14]. Software interoperability can bedecomposed into interoperability capabilities of the systemwith each intended environment and software system, withwhich it is expected to operate.
Based on [14], we define suitability as the capability ofa transformation approach to provide an appropriate meansto express the functionality of a transformation problem at anappropriate level of abstraction, and to solve the transformationproblem effectively and with acceptable use of resources(developer time, computational resources, etc.). In [10] weidentified the following subcharacteristics for the suitabilityquality characteristic of model transformation specifications:abstraction level, size, complexity, effectiveness and develop-ment effort.
Requirements of single transformations can be documentedusing the SysML notation adopted in [3], but with a widerrange of requirement types represented. Use case diagramscan be used to describe the requirements of a system oftransformations. Each use case represents an individual trans-formation, which may be available as a service for externalusers, or which may be used internally within the system asa subtransformation of other transformations.
We have investigated a specific functional requirementstaxonomy according to the characteristic of model transforma-tions (Table I). All types of functional requirements for modeltransformations including: mapping, assumptions and post-conditions requirements could be formalized as predicates ordiagrams at the concrete and abstract syntax levels. Concretesyntax is often used at the early stages (RE stages) in thedevelopment cycle in order to validate the requirements bystakeholders since the concrete syntax level is more conve-nient, whereas abstract syntax rule, is often used in the im-plementation phase for developers. However, there should bea direct correspondence between the concrete syntax elementsin the informal/semi-formal expression of the requirements,and the abstract syntax elements in the formalised versions.
IV. APPLICATION OF RE IN MT
In model transformation, requirements and specificationsare very similar and sometimes are considered as the sameelement. Requirements determine what is needed and whatneeds to be achieved while taking into account the different
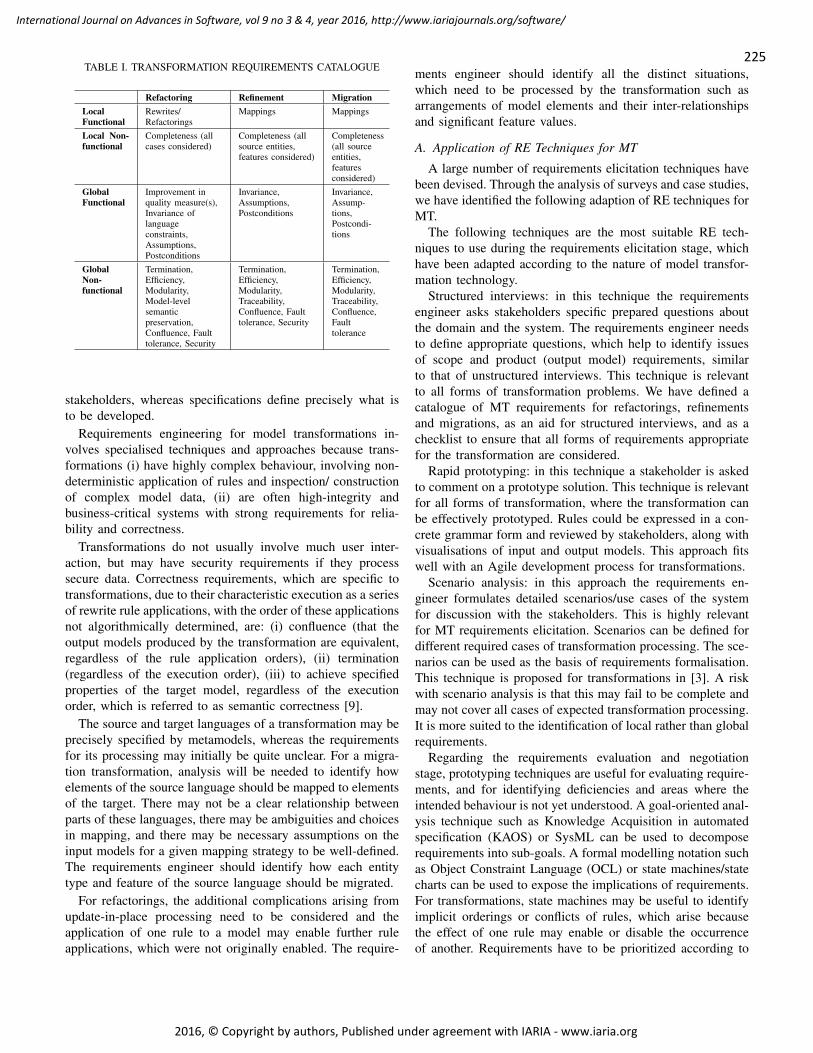
225
International Journal on Advances in Software, vol 9 no 3 & 4, year 2016, http://www.iariajournals.org/software/
2016, © Copyright by authors, Published under agreement with IARIA - www.iaria.org
TABLE I. TRANSFORMATION REQUIREMENTS CATALOGUE
Refactoring Refinement MigrationLocalFunctional
Rewrites/Refactorings
Mappings Mappings
Local Non-functional
Completeness (allcases considered)
Completeness (allsource entities,features considered)
Completeness(all sourceentities,featuresconsidered)
GlobalFunctional
Improvement inquality measure(s),Invariance oflanguageconstraints,Assumptions,Postconditions
Invariance,Assumptions,Postconditions
Invariance,Assump-tions,Postcondi-tions
GlobalNon-functional
Termination,Efficiency,Modularity,Model-levelsemanticpreservation,Confluence, Faulttolerance, Security
Termination,Efficiency,Modularity,Traceability,Confluence, Faulttolerance, Security
Termination,Efficiency,Modularity,Traceability,Confluence,Faulttolerance
stakeholders, whereas specifications define precisely what isto be developed.
Requirements engineering for model transformations in-volves specialised techniques and approaches because trans-formations (i) have highly complex behaviour, involving non-deterministic application of rules and inspection/ constructionof complex model data, (ii) are often high-integrity andbusiness-critical systems with strong requirements for relia-bility and correctness.
Transformations do not usually involve much user inter-action, but may have security requirements if they processsecure data. Correctness requirements, which are specific totransformations, due to their characteristic execution as a seriesof rewrite rule applications, with the order of these applicationsnot algorithmically determined, are: (i) confluence (that theoutput models produced by the transformation are equivalent,regardless of the rule application orders), (ii) termination(regardless of the execution order), (iii) to achieve specifiedproperties of the target model, regardless of the executionorder, which is referred to as semantic correctness [9].
The source and target languages of a transformation may beprecisely specified by metamodels, whereas the requirementsfor its processing may initially be quite unclear. For a migra-tion transformation, analysis will be needed to identify howelements of the source language should be mapped to elementsof the target. There may not be a clear relationship betweenparts of these languages, there may be ambiguities and choicesin mapping, and there may be necessary assumptions on theinput models for a given mapping strategy to be well-defined.The requirements engineer should identify how each entitytype and feature of the source language should be migrated.
For refactorings, the additional complications arising fromupdate-in-place processing need to be considered and theapplication of one rule to a model may enable further ruleapplications, which were not originally enabled. The require-
ments engineer should identify all the distinct situations,which need to be processed by the transformation such asarrangements of model elements and their inter-relationshipsand significant feature values.
A. Application of RE Techniques for MT
A large number of requirements elicitation techniques havebeen devised. Through the analysis of surveys and case studies,we have identified the following adaption of RE techniques forMT.
The following techniques are the most suitable RE tech-niques to use during the requirements elicitation stage, whichhave been adapted according to the nature of model transfor-mation technology.
Structured interviews: in this technique the requirementsengineer asks stakeholders specific prepared questions aboutthe domain and the system. The requirements engineer needsto define appropriate questions, which help to identify issuesof scope and product (output model) requirements, similarto that of unstructured interviews. This technique is relevantto all forms of transformation problems. We have defined acatalogue of MT requirements for refactorings, refinementsand migrations, as an aid for structured interviews, and as achecklist to ensure that all forms of requirements appropriatefor the transformation are considered.
Rapid prototyping: in this technique a stakeholder is askedto comment on a prototype solution. This technique is relevantfor all forms of transformation, where the transformation canbe effectively prototyped. Rules could be expressed in a con-crete grammar form and reviewed by stakeholders, along withvisualisations of input and output models. This approach fitswell with an Agile development process for transformations.
Scenario analysis: in this approach the requirements en-gineer formulates detailed scenarios/use cases of the systemfor discussion with the stakeholders. This is highly relevantfor MT requirements elicitation. Scenarios can be defined fordifferent required cases of transformation processing. The sce-narios can be used as the basis of requirements formalisation.This technique is proposed for transformations in [3]. A riskwith scenario analysis is that this may fail to be complete andmay not cover all cases of expected transformation processing.It is more suited to the identification of local rather than globalrequirements.
Regarding the requirements evaluation and negotiationstage, prototyping techniques are useful for evaluating require-ments, and for identifying deficiencies and areas where theintended behaviour is not yet understood. A goal-oriented anal-ysis technique such as Knowledge Acquisition in automatedspecification (KAOS) or SysML can be used to decomposerequirements into sub-goals. A formal modelling notation suchas Object Constraint Language (OCL) or state machines/statecharts can be used to expose the implications of requirements.For transformations, state machines may be useful to identifyimplicit orderings or conflicts of rules, which arise becausethe effect of one rule may enable or disable the occurrenceof another. Requirements have to be prioritized according to

226
International Journal on Advances in Software, vol 9 no 3 & 4, year 2016, http://www.iariajournals.org/software/
2016, © Copyright by authors, Published under agreement with IARIA - www.iaria.org
TABLE II. REQUIREMENTS PRIORITY FOR DIFFERENTTRANSFORMATIONS
Category Primary requirement Secondaryrequirement
Refactoring
Model quality improvementModel-level semantic preservation InvarianceSyntactic correctness ConfluenceTermination
MigrationSyntactic correctness InvertibilityModel-level semantic preservation ConfluenceTermination Traceability
Refinement
Syntactic correctness
TraceabilityModel-level semantic preservationConfluenceTermination
their importance and the type of transformation. For instance,in a refinement transformation, the semantics of the source andtarget model have to be equivalent as the primary requirementand to have a traceability feature as a secondary requirement.Also, there should be no conflict among the requirements. Forinstance, there is often a conflict between the time, quality andbudget of a project. The quality of the target model shouldbe satisfactory with respect to the performance (time, costand space) of the transformation. Several RE techniques exist,which could be applicable to MT during the requirementsspecification phase in which business goals are represented interms of functional and non-functional requirements. In TableII, requirements have been categorised according to the typeof the transformation.
Techniques for requirements specification and documenta-tion stage include: UML and OCL, structured natural lan-guage, and formal modelling languages. At the initial stagesof requirements elicitation and analysis, the intended effect ofa transformation is often expressed by sketches or diagramsusing the concrete grammar of the source and target languagesconcerned (if such grammars exist), or by node and linegraphs if there is no concrete grammar. A benefit of concretegrammar rules is that they are directly understandable bystakeholders with knowledge of the source and target languagenotations. They are also independent of specific MT languagesor technologies. Concrete grammar diagrams can be mademore precise during requirements formalisation, or refinedinto abstract grammar rules. An informal mapping/refactoringrequirement of the form of
“For each instance e of entity type E, that satisfiescondition Cond, establish Pred ”
can be formalised as a use case postcondition such as:E::Cond′ ⇒ Pred′
where Cond′ formalises Cond, and Pred′ formalises Pred.For requirements verification and validation stage, the for-
malised rules can be checked for internal correctness prop-erties such as definedness and determinacy, which shouldhold for meaningful rules. A prototype implementation can
be generated, and its behaviour on a range of input modelscovering all of the scenarios considered during requirementselicitation can be checked. When a precise expression of thefunctional and non-functional requirements has been defined,it can be validated with the stakeholders to confirm that itdoes indeed accurately express the stakeholders intentionsand needs for the system. The formalised requirements ofa transformation τ : S → T can also be verified to checkthat they are consistent; the functional requirements must bemutually consistent. The assumptions and invariant of τ , andthe language constraints of S must be jointly consistent. Theinvariant and postconditions of τ , and the language constraintsof T must be jointly consistent. Each mapping rule Left-HandSide (LHS) must be consistent with the invariant, as must eachmapping rule Right-Hand Side (RHS).
These consistency properties can be checked using toolssuch as Z3 or Alloy, given suitable encodings [15], [16].Model-level semantics preservation requirements can in somecases be characterised by additional invariant properties, whichthe transformation should maintain. For each functional andnon-functional requirement, justification should be given as towhy the formalised specification satisfies these requirements.For example, to justify termination, some variant quantity Q:Integer could be identified, which is always non-negative andwhich is strictly decreased by each application of a mappingrule [13]. Formalised requirements in temporal logic couldthen be checked for particular implementations using model-checking techniques, as in [17].
V. RE TECHNIQUE FRAMEWORK FOR MT
There are several methods and techniques proposed by therequirements engineering community, however selecting anappropriate set of requirements engineering techniques for aproject is a challenging issue. Most of these methods andtechniques were designed for a specific purpose and nonecover the entire RE process. Researchers have classified REtechniques and categorised them according to their character-istics. For instance, Hickey et al. [18] proposed a selectionmodel of elicitation techniques, Maiden et al. [19] came upwith a framework for requirements acquisition methods andtechniques. However, lack of support for selecting the mostappropriate set of techniques for a software project has maderequirements engineering one of the most complex parts ofsoftware engineering process. At the moment, RE techniquesare selected mainly based on personal preference rather thancharacteristics and specifications of a project. In the followingsections, we analyse the attributes of requirements engineeringtechniques and organizations in which the project is deliveredand the actual type of project, in order to select a suitable setof RE techniques for specific projects.
A. RE Attribute Analysis
In general, a project is assigned to an organization in orderto be developed. Usually the software developing organizationis selected according to the type of project. Classification ofRE techniques have a direct relation with the type of the

227
International Journal on Advances in Software, vol 9 no 3 & 4, year 2016, http://www.iariajournals.org/software/
2016, © Copyright by authors, Published under agreement with IARIA - www.iaria.org
proposed project, the organization and the internal attributes ofa specific technique. In this section, we analyse the attributesof techniques, the project and the organization in order toidentify the most well-suited set of techniques for a particulartype of project.
1) Technique Attribute: As mentioned earlier, multipletechniques exist in requirements engineering. Each techniquehas some attributes that could be used in choosing REtechniques. Identifying the technique attributes could be veryuseful as they allow us to compare different techniques. Wehave identified 33 attributes from which 23 were defined by[20]. These attributes are categorized according to the REphase (Kotonya and Sommerville model) that they belongto. These attributes are selected based on characteristics ofRE techniques as well as other researchers’ criteria andframeworks [19], [21], [2]. For instance, some RE techniquesare well-suited for identifying non-functional requirements.Therefore if non-functional requirements in a particular projecthave high priority then the attribute of ability to help identifynon-functional requirements is important and applying theappropriate RE technique to find non-functional requirementswould be necessary (such as the NFR framework). In Table IIIwe have adapted the attributes of [20] to make them specificfor MT.
2) Transformation Project Attribute: A transformationproject’s attribute is also an important factor in order to selectRE techniques. Each project has a set of attributes and thepriority of its attributes may vary based on the characteristicsof a project. For instance, the category of a project thatit belongs to is an attribute, therefore RE techniques for acategory of safety-critical system may vary from a non-criticalsystem. In this research, we have identified nine attributes,which shall be analysed in more detail relevant to a project.In Table IV, we have explained the selected transformationattributes in more detail.
3) Organization Attribute: Every software developing or-ganization applies the RE process in a different manner.This difference is caused by the behaviour of developersand stakeholders involved in the project. This behaviour isinfluenced by different factors of the organization such as:size, culture, policy and complexity. These factors have a directeffect on the way the RE process is performed. For instance,in a small organization, new technologies and expensive REtechniques may not be the first choice due to the high cost of it,whereas in a large and complex organization more flexible anddisciplined techniques are required to do RE tasks. Althoughthere is no limit to the attributes of an organization we haveidentified the following:
• Ability to support customer/client involvement• Ability to classify requirements based on different stake-
holders• Ability to predict and manage sudden requirements mod-
ifications by stakeholders• Ability to assure stakeholders about their confidentiality
and privacy.
B. Technique Framework
Our overall procedure for selecting RE techniques for a MTproject involves:• The set all suitable RE techniques (e.g. interview, pro-
totype) in each category (i.e. elicitation, negotiation,specification, verification) is identified.
• For each requirement identified within the project, eachRE technique t is assigned a value RA(t) (for Require-ment Attribute) representing the suitability of applyingt to fulfil this requirement, based on the technique’sattributes. Tables (III, V, VI, VII, VIII) give examplesof these adapted attribute measures.
• For each requirement identified within the project, eachRE technique t is assigned a value PD(t) (for ProjectDescription) representing the suitability of applying t tofulfil this requirement, based on the project’s descriptions.
• Evaluating the degree E (for Experience) of experience/-expertise regarding the RE technique t available in thedevelopment team. E(t) represents the level of experienceand practical and theoretical knowledge of the developerregarding t.
• Using S(t), the overall suitability score of a particular REtechnique (t ∈ T) can be calculated, and hence it wouldbe possible to define a ranking of techniques t based ontheir suitability scores S(t) for use in the project. S(t)is defined as:
S(t) = RA(t)× PD(t)× E(t)
See the Appendix for more details.In the following sections, we will discuss the techniques
and their attributes in more detail, we will consider onlythose types of RE techniques that are most relevant to MTdevelopment (according to our survey of industrial cases, andfrom expert experience).
VI. EVALUATION
In this section of the paper, we will evaluate the frameworkby applying it to a real industrial case study. This case studyconcerns the development of a code generator for the UML-Rigorous Systems Design Support (UML-RSDS) [22] dialectof UML. UML-RSDS is a model transformation tool, whichis able to manufacture software systems in an automatedmanner which takes as input a text representation of a classdiagram and use cases conforming to the UML-RSDS designmetamodels, and produces as output text files in valid ANSI C,as defined in the current ANSI standard. Given a valid UML-RSDS model, the translator should produce a C applicationwith the same semantics. The target code should be structuredin the standard C style with header and code files andstandard C libraries may be used. The produced code shouldbe of comparable efficiency to hand-written code. The codegeneration process should not take longer than 1 minute forclass diagrams with fewer than 100 classes.
The identified stakeholders included: (i) the UML-RSDSdevelopment team; (ii) users of UML-RSDS who require C

228
International Journal on Advances in Software, vol 9 no 3 & 4, year 2016, http://www.iariajournals.org/software/
2016, © Copyright by authors, Published under agreement with IARIA - www.iaria.org
TABLE III. RE TECHNIQUE ATTRIBUTES AND CLASSIFICATIONS [20]
ID Categories Attributes of techniques1 Ability to elicit MT requirements2 Ability to facilitate communication3 Ability to help understand social issues4 Ability to help getting domain knowledge5 Elicitation Ability to help getting implicit knowledge6 Ability to help identifying MT stakeholders7 Ability to help identifying non-functional requirements8 Ability to help identifying viewpoints9 Ability to help model and understand requirements10 Ability to analyse and model requirements with
relevant MT notations11 Ability to help analyse non-functional requirements12 Evaluation & Negotiation Ability to facilitate negotiation with customers13 Ability to help prioritizing requirements according to
stakeholders need14 Ability to help prioritizing requirements according to the
transformation15 Ability to help identify accessibility of the transformation16 Ability to help model interface requirements17 Ability to help re-usability of MT requirements18 Ability to represent MT requirements19 Ability to help requirements verification20 Completeness of the semantics of the notation21 Specification & Documentation Ability to help write precise requirements using
MT notation22 Ability to help write complete requirements23 Ability to help with requirements management24 Ability to help design highly modular systems25 Implementability of the notation used26 Ability to help identify ambiguous requirements27 Validation & Verification Ability to help identify inconsistency and conflict28 Ability to help identify incomplete requirements29 Ability to support MT language30 Maturity of supporting tool31 Other aspects Learning curve (Introduction cost)32 Application cost33 Complexity of technique
code for embedded or limited resource systems; (iii) end-users of such systems. Direct access was only possible tostakeholders (i). Access to other stakeholders was substitutedby research into the needs of such stakeholders. According toour RE technique framework, an initial phase of requirementselicitation for this system used document mining (research intothe ANSI C language and existing UML to C translators) and asemi-structured interview with the principal stakeholder. Thisproduced an initial set of requirements, with priorities.
The translator has the high-level functional (F) requirement:F1: Translate UML-RSDS designs (class diagrams,OCL, activities and use cases) into ANSI C code.
The functional requirement was decomposed into five high-priority subgoals, each of which is the responsibility of aseparate subtransformation including:• F1.1: Translation of types• F1.2: Translation of class diagrams• F1.3: Translation of OCL expressions• F1.4: Translation of activities• F1.5: Translation of use casesEach translation in this list is dependent upon all of the
preceding translations. In addition, the translation of opera-tions of classes depends upon the translation of expressions
and activities. The development was therefore organised intofive iterations, one for each translator part, and each iterationwas given a maximum duration of one month. Other high-priority requirements identified for the translator were thefollowing functional and non-functional (NF) system (product)requirements:
• NF1: Termination: given correct input• F2: Syntactic correctness: given correct input, a valid C
program will be produced• F3: Model-level semantic preservation: the semantics of
the source and target models are equivalent• F4: Traceability: a record should be maintained of the
correspondence between source and target elements
Medium-level priority requirements were:
• F5: Bidirectionality between source and target• NF2: Efficiency: input models with 100 classes and 100
attributes should be processed within 30 seconds• NF3: Modularity of the transformation
Low-priority requirements were:
• F6: Confluence• NF4: Flexibility: ability to choose different C interpreta-
tions for UML elements
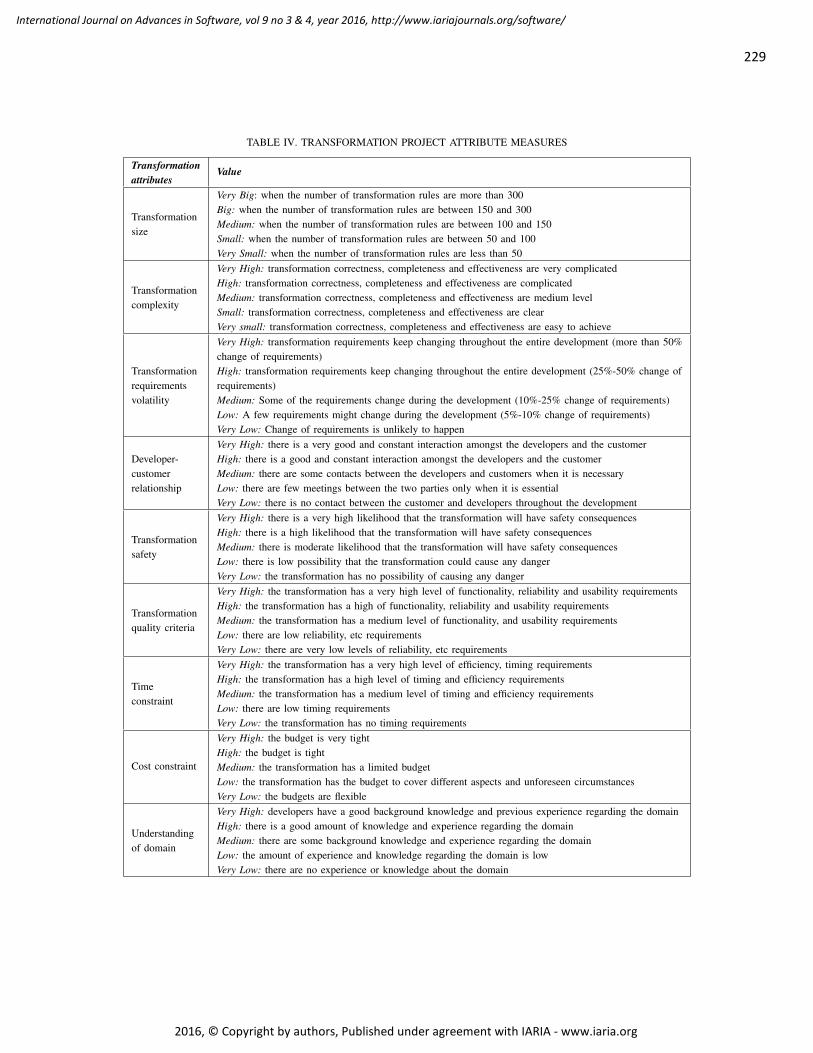
229
International Journal on Advances in Software, vol 9 no 3 & 4, year 2016, http://www.iariajournals.org/software/
2016, © Copyright by authors, Published under agreement with IARIA - www.iaria.org
TABLE IV. TRANSFORMATION PROJECT ATTRIBUTE MEASURES
Transformationattributes
Value
Transformationsize
Very Big: when the number of transformation rules are more than 300Big: when the number of transformation rules are between 150 and 300Medium: when the number of transformation rules are between 100 and 150Small: when the number of transformation rules are between 50 and 100Very Small: when the number of transformation rules are less than 50
Transformationcomplexity
Very High: transformation correctness, completeness and effectiveness are very complicatedHigh: transformation correctness, completeness and effectiveness are complicatedMedium: transformation correctness, completeness and effectiveness are medium levelSmall: transformation correctness, completeness and effectiveness are clearVery small: transformation correctness, completeness and effectiveness are easy to achieve
Transformationrequirementsvolatility
Very High: transformation requirements keep changing throughout the entire development (more than 50%change of requirements)High: transformation requirements keep changing throughout the entire development (25%-50% change ofrequirements)Medium: Some of the requirements change during the development (10%-25% change of requirements)Low: A few requirements might change during the development (5%-10% change of requirements)Very Low: Change of requirements is unlikely to happen
Developer-customerrelationship
Very High: there is a very good and constant interaction amongst the developers and the customerHigh: there is a good and constant interaction amongst the developers and the customerMedium: there are some contacts between the developers and customers when it is necessaryLow: there are few meetings between the two parties only when it is essentialVery Low: there is no contact between the customer and developers throughout the development
Transformationsafety
Very High: there is a very high likelihood that the transformation will have safety consequencesHigh: there is a high likelihood that the transformation will have safety consequencesMedium: there is moderate likelihood that the transformation will have safety consequencesLow: there is low possibility that the transformation could cause any dangerVery Low: the transformation has no possibility of causing any danger
Transformationquality criteria
Very High: the transformation has a very high level of functionality, reliability and usability requirementsHigh: the transformation has a high of functionality, reliability and usability requirementsMedium: the transformation has a medium level of functionality, and usability requirementsLow: there are low reliability, etc requirementsVery Low: there are very low levels of reliability, etc requirements
Timeconstraint
Very High: the transformation has a very high level of efficiency, timing requirementsHigh: the transformation has a high level of timing and efficiency requirementsMedium: the transformation has a medium level of timing and efficiency requirementsLow: there are low timing requirementsVery Low: the transformation has no timing requirements
Cost constraint
Very High: the budget is very tightHigh: the budget is tightMedium: the transformation has a limited budgetLow: the transformation has the budget to cover different aspects and unforeseen circumstancesVery Low: the budgets are flexible
Understandingof domain
Very High: developers have a good background knowledge and previous experience regarding the domainHigh: there is a good amount of knowledge and experience regarding the domainMedium: there are some background knowledge and experience regarding the domainLow: the amount of experience and knowledge regarding the domain is lowVery Low: there are no experience or knowledge about the domain
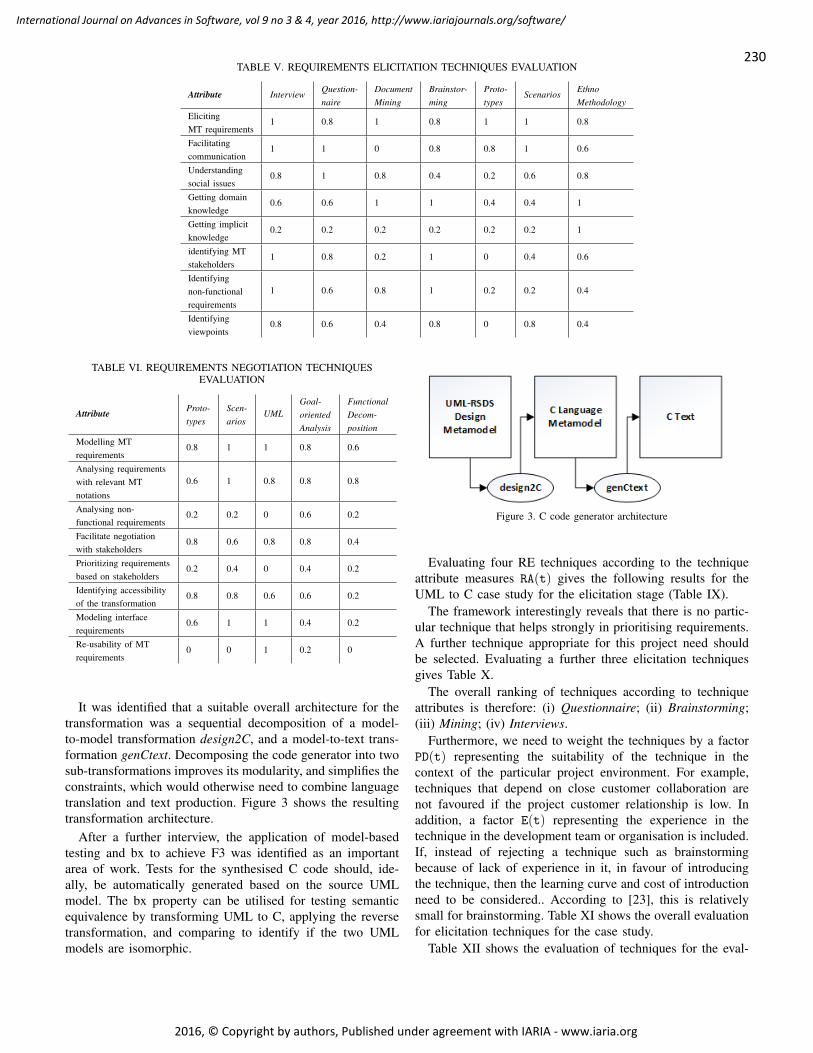
230
International Journal on Advances in Software, vol 9 no 3 & 4, year 2016, http://www.iariajournals.org/software/
2016, © Copyright by authors, Published under agreement with IARIA - www.iaria.org
TABLE V. REQUIREMENTS ELICITATION TECHNIQUES EVALUATION
Attribute Interview Question-naire
DocumentMining
Brainstor-ming
Proto-types
Scenarios EthnoMethodology
ElicitingMT requirements
1 0.8 1 0.8 1 1 0.8
Facilitatingcommunication
1 1 0 0.8 0.8 1 0.6
Understandingsocial issues
0.8 1 0.8 0.4 0.2 0.6 0.8
Getting domainknowledge
0.6 0.6 1 1 0.4 0.4 1
Getting implicitknowledge
0.2 0.2 0.2 0.2 0.2 0.2 1
identifying MTstakeholders
1 0.8 0.2 1 0 0.4 0.6
Identifyingnon-functionalrequirements
1 0.6 0.8 1 0.2 0.2 0.4
Identifyingviewpoints
0.8 0.6 0.4 0.8 0 0.8 0.4
TABLE VI. REQUIREMENTS NEGOTIATION TECHNIQUESEVALUATION
Attribute Proto-types
Scen-arios
UMLGoal-orientedAnalysis
FunctionalDecom-position
Modelling MTrequirements
0.8 1 1 0.8 0.6
Analysing requirementswith relevant MTnotations
0.6 1 0.8 0.8 0.8
Analysing non-functional requirements
0.2 0.2 0 0.6 0.2
Facilitate negotiationwith stakeholders
0.8 0.6 0.8 0.8 0.4
Prioritizing requirementsbased on stakeholders
0.2 0.4 0 0.4 0.2
Identifying accessibilityof the transformation
0.8 0.8 0.6 0.6 0.2
Modeling interfacerequirements
0.6 1 1 0.4 0.2
Re-usability of MTrequirements
0 0 1 0.2 0
It was identified that a suitable overall architecture for thetransformation was a sequential decomposition of a model-to-model transformation design2C, and a model-to-text trans-formation genCtext. Decomposing the code generator into twosub-transformations improves its modularity, and simplifies theconstraints, which would otherwise need to combine languagetranslation and text production. Figure 3 shows the resultingtransformation architecture.
After a further interview, the application of model-basedtesting and bx to achieve F3 was identified as an importantarea of work. Tests for the synthesised C code should, ide-ally, be automatically generated based on the source UMLmodel. The bx property can be utilised for testing semanticequivalence by transforming UML to C, applying the reversetransformation, and comparing to identify if the two UMLmodels are isomorphic.
Figure 3. C code generator architecture
Evaluating four RE techniques according to the techniqueattribute measures RA(t) gives the following results for theUML to C case study for the elicitation stage (Table IX).
The framework interestingly reveals that there is no partic-ular technique that helps strongly in prioritising requirements.A further technique appropriate for this project need shouldbe selected. Evaluating a further three elicitation techniquesgives Table X.
The overall ranking of techniques according to techniqueattributes is therefore: (i) Questionnaire; (ii) Brainstorming;(iii) Mining; (iv) Interviews.
Furthermore, we need to weight the techniques by a factorPD(t) representing the suitability of the technique in thecontext of the particular project environment. For example,techniques that depend on close customer collaboration arenot favoured if the project customer relationship is low. Inaddition, a factor E(t) representing the experience in thetechnique in the development team or organisation is included.If, instead of rejecting a technique such as brainstormingbecause of lack of experience in it, in favour of introducingthe technique, then the learning curve and cost of introductionneed to be considered.. According to [23], this is relativelysmall for brainstorming. Table XI shows the overall evaluationfor elicitation techniques for the case study.
Table XII shows the evaluation of techniques for the eval-

231
International Journal on Advances in Software, vol 9 no 3 & 4, year 2016, http://www.iariajournals.org/software/
2016, © Copyright by authors, Published under agreement with IARIA - www.iaria.org
TABLE VII. REQUIREMENTS SPECIFICATION TECHNIQUES EVALUATION
Attribute SysML KAOSStructuredlanguagetemplate
SADT EvolutionaryPrototypes
UML
Representing MTrequirements
0.8 0.8 0.8 0.6 0.8 1
Requirements verification 1 1 0 0.4 0.8 0.8Semantics completeness 0.8 1 0.4 0.6 0.2 0.8Representing requirementsusing MT notations
0.6 0.4 0.4 0.4 0.2 1
Writing completerequirements
0.8 0.8 0.6 0.6 0.4 0.8
Requirements management 0.8 0.4 0.6 1 0 0.8Designing highlymodular systems
0.8 0.6 0 0 0 0.8
Implementability ofthe notation(s)
1 1 0 0 0.8 0.8
TABLE VIII. REQUIREMENTS VALIDATION TECHNIQUESEVALUATION
Attribute Inspection Desk-Checks
RapidPrototyping
Checklist
Identifying ambiguousrequirements
0.4 0 0.4 0
Identifying inconsistencyand conflict
0.4 1 0.8 1
Identifying incompleterequirements
0.8 0.8 0.8 0.8
TABLE IX. ELICITATION TECHNIQUE EVALUATION FOR UML TO CCASE (1)
Attribute Brainstorming Interviews Mining ScenariosElicit domain knowledge 1 0.6 1 0.4Identify non-functionalrequirements
1 1 0.8 0.2
Requirements prioritisation 0 0 0 0.4Totals RA(t): 2 1.6 1.8 1
uation and negotiation stage.Specific to MT is the ability to represent local and global
functional requirements. The overall ranking of techniquesis then: (i) UML; (ii) Prototypes; (iii) Scenarios. As withelicitation, factors PD(t) and E(t) need also to be consideredto give an overall selection.
The most appropriate specification and documentation tech-niques are shown in Table XIII. The overall ranking fortechniques is: (i) SysML; (ii) UML; (iii) Natural language.Figure 4 shows part of the requirements refinement and goaldecomposition using SysML.
Validation and verification techniques are shown in TableXIV. The overall ranking for techniques is: (i) SysML; (ii)UML; (iii) Prototypes.
In the following subsections we present the application ofthe selected RE techniques on the case study.
A. F1.1: Type Translation
This iteration was divided into three phases: detailed re-quirements analysis; specification; testing. Detailed require-ments elicitation used structured interviews to identify (i) the
TABLE X. ELICITATION TECHNIQUE EVALUATION FOR UML TO CCASE (2)
Attribute Questionnaire Prototypes ObservationElicit domain knowledge 0.6 0.4 1Identify non-functionalrequirements
0.6 0.2 0.4
Requirements prioritisation 1 0.2 0Totals RA(t): 2.2 0.8 1.4
TABLE XI. ELICITATION TECHNIQUE SELECTION FOR UML TO CCASE
Measure Brainstorming Interviews Mining ScenariosRA(t) 2 1.6 1.8 1PD(t) X 0.66 0.68 0.66E(t) 0 1 0.6 1Totals S(t): 0 1.056 0.734 0.66
source language; (ii) the mapping requirements; (iii) the targetlanguage; (iv) other functional and non-functional require-ments for this sub-transformation. Scenarios and test caseswere prepared.
Using goal decomposition, the requirements were decom-posed into specific mapping requirements, these are the localfunctional requirements F1.1.1 to F1.1.4 in Figure 4. TableXV shows the informal scenarios for these local mappingrequirements, based on the concrete metaclasses of Type andthe different cases of instances of these metaclasses. Theschematic concrete grammar is shown for the C elementsrepresenting the UML concepts. As a result of requirementsevaluation and negotiation with the principal stakeholder, usingexploratory prototyping, it was determined that all these localrequirements are of high priority except for the mapping F1.1.2of enumerations (medium priority). The justification for this isthat enumerations are not an essential UML language element.Bidirectionality was considered a high priority for this sub-transformation. It was identified that to meet this requirement,all source model Property elements must have a definedtype, and specifically that elements representing many-valuedassociation ends must have some CollectionType representing

232
International Journal on Advances in Software, vol 9 no 3 & 4, year 2016, http://www.iariajournals.org/software/
2016, © Copyright by authors, Published under agreement with IARIA - www.iaria.org
<<requirement>>F1
id = F1text = map UML to Ckind = functionalscope = global
<<requirement>>F1.1
id = F1.1text = map Type to Ckind = functionalscope = global
<<requirement>>F1.2
id = F1.2text = map Class diagram to Ckind = functionalscope = global
<<requirement>>F1.3
id = F1.3text = map Expressions to Ckind = functionalscope = global
<<requirement>>F1.4
id = F1.4text = map Activities to Ckind = functionalscope = global
<<requirement>>F1.5
id = F1.5text = map Use Cases to Ckind = otherscope = global
<<requirement>>F1.1.1
id = F1.1.1text = map PrimitiveType to Ckind = functionalscope = local
<<requirement>>F1.1.2
id = F1.1.2text = map Enumeration to Ckind = functionalscope = local
<<requirement>>F1.1.3
id = F1.1.3text = map Entity to Ckind = functionalscope = local
<<requirement>>F1.2.2
id = F1.2.2text = map Class to Ckind = functionalscope = local
<<requirement>>F1.2.1
id = F1.2.1text = map Diagram to Ckind = functionalscope = local
<<requirement>>F1.2.3
id = F1.2.3text = map Property to Ckind = functionalscope = local
<<requirement>>F1.2.4
id = F1.2.4text = map Operation to Ckind = functionalscope = local
<<requirement>>F1.2.5
id = F1.2.5text = map Generalization to Ckind = functionalscope = local
Figure 4. Functional requirements decomposition in SysML
TABLE XII. EVALUATION/NEGOTIATION TECHNIQUE EVALUATIONFOR UML TO C CASE
Attribute Prototypes State machines UML ScenariosRepresent MTrequirements
0.8 0.4 1 1
Identify incompleterequirements
0.8 0 0.4 0.2
Identify ambiguousrequirements
0.4 0.6 0.6 0.4
Facilitate negotiation 0.8 0.4 0.8 0.4Totals RA(t): 2.8 1.4 2.8 2
TABLE XIII. SPECIFICATION/DOCUMENTATION TECHNIQUEEVALUATION FOR UML TO C CASE
Attribute Naturallanguage
UML SysML
Write unambiguousand precise specication
0.6 0.8 1
Write completerequirements
0.6 0.8 0.8
Modularity 0 0.8 0.8Totals RA(t): 1.2 2.4 2.6
their actual type. A limitation of the proposed mapping isthat mapping collections of primitive values (integers, doubles,booleans) to C is not possible, because there is no means toidentify the end of the collection in C (NULL is used as theterminator for collections of objects and collections of strings).
TABLE XIV. VALIDATION AND VERIFICATION TECHNIQUEEVALUATION FOR UML TO C CASE
Attribute Prototypes Scenarios UML SysMLImplementability/executability
0.8 0.4 0.8 1
Requirementsverification
0.8 0.6 0.8 1
Notation 0.2 0.6 1 0.6Totals RA(t): 1.8 1.6 2.6 2.6
TABLE XV. INFORMAL SCENARIOS FOR TYPES2C
Scenario UML element C representation e’F1.1.1.1F1.1.1.2F1.1.1.3
String typeint, long, double types,boolean type
char*same-named C typesunsigned char
F1.1.2 Enumeration type C enumF1.1.3 Entity type E struct E* type
F1.1.4.1F1.1.4.2
Set(E) typeSequence(E) type
struct E** (array of E,without duplicates)struct E** (array of E,possibly with duplicates)
B. F1.2: Translation of Class Diagram
This iteration also used a three-phase approach, to de-fine a subtransformation classdiagram2C. The class diagramelements Property, Operation, Entity, Generalization wereidentified as the input language. Exploratory prototyping wasused for requirements elicitation and evaluation. During re-

233
International Journal on Advances in Software, vol 9 no 3 & 4, year 2016, http://www.iariajournals.org/software/
2016, © Copyright by authors, Published under agreement with IARIA - www.iaria.org
TABLE XVI. INFORMAL SCENARIOS FOR THE MAPPING OF UMLCLASS DIAGRAMS TO C
Scenario UML element e C representation e’F1.2.1 Class diagram D C program with D’s name
F1.2.2 Class E
struct E ...;Global variable struct E** e instances;Global variable int e size;struct E* createE() operationstruct E** newEList() operation
F1.2.3.1Property p : T(not principal identityattribute)
Member T‘ p; of the struct for p‘s owner,where T‘ represents TOperations T‘ getE p(E‘ self )and setE p(E‘ self, T‘ px)
F1.2.3.2Principal identityattribute p : String ofclass E
Operationstruct E* getEByPK(char* v)Key member char* p; of the struct for E
F1.2.4 Operation op(p : P) :T of E
C operationT’ op(E’ self, P’ p)with scope = entity
F1.2.5 Inheritance of A by B Member struct A* super;of struct B
quirements evaluation and negotiation it was agreed that themetafeatures isStatic, isReadOnly, isDerived, isCached wouldnot be represented in C, nor would addOnly, aggregation,constraint or linkedClass. This means that aggregations, asso-ciation classes and static/constant features are not specificallyrepresented in C. Interfaces are not represented. Only singleinheritance is represented.
The scenarios of the local mapping requirements for classdiagram elements are shown in Table XVI.
C. F1.3: Translation of OCL Expressions
In this iteration, the detailed requirements for mapping OCLexpressions to C are identified, then this subtransformation,expressions2C, is specified and tested. There are many cases toconsider in the mapping requirements, so we divided these intofour subgroups: (i) mapping of basic expressions; (ii) mappingof logical expressions; (iii) mapping of comparitor, numericand string expressions; (iv) mapping of collection expressions.These were considered the natural groupings of operations andoperators, and these follow in part the metaclass organisationof UML expressions.
1) Basic Expressions: The basic expressions of OCL gen-erally map directly to corresponding C basic expressions.Table XVII shows the mapping for these. These mappingrequirements are grouped together as requirement F1.3.1.
2) Logical Expressions: Table XVIII shows the mappingof logical expressions and operators to C. These mappings aregrouped together as requirement F1.3.2.
3) Comparitor, Numeric and String Expressions: TableXIX lists the comparitor operators and their mappings to C.These mappings are grouped as requirement 1.3.3. Numericoperators for integers and real numbers are shown in TableXX. The types int, double and long are not guaranteed tohave particular sizes in C. All operators take double values asarguments except mod and Integer.subrange, which have intparameters.
TABLE XVII. MAPPING SCENARIOS FOR BASIC EXPRESSIONS
OCL expression e C representation e’self self as an operation parameterVariable vor v[ind]
vv[ind - 1]
Data feature fwith no objectRefData feature fof instance ex
self → f
ex’ → f
Operation call op(e1,...,en)or obj.op(e1,...,en)
op(self, e1’, ..., en’)op(obj’, e1’, ..., en’)
Attribute fof collection exs
getAllE f (exs’)(duplicate values preserved)
Single-valued role r : Fof collection exs
getAllE r(exs’) defined by(struct F ∗∗) collectE(exs’, getE r)
col [ind]ordered collection col
(col’)[ind-1]
E[v]v single-valuedE[vs]vs collection-valued
getEByPK(v’)
getEByPKs(vs’)
E.allInstances e instancesvalue of enumerated type,numeric or string value
value
boolean true, false TRUE, FALSE
TABLE XVIII. MAPPING SCENARIOS FOR LOGICAL EXPRESSIONS
OCL expression e C representation e’A =>BA & BA or Bnot(A)
!A’ ‖ B’A’ && B’A’ ‖ B’!A’
E->exists(P)e->exists(P)
existsE(e instances,fP) fP evaluates PexistsE(e’,fP)
E->exists1(P)e->exists1(P)
exists1E(e instances,fP) fP evaluates Pexists1E(e’,fP)
E->forAll(P)e->forAll(P)
forAllE(e instances,fP) fP evaluates PforAllE(e’,fP)
Other math operators directly available in C are: log10, tanh,cosh, sinh, asin, acos, atan. These are double-valued functionsof double-valued arguments. cbrt is missing and needs to beimplemented as pow(x, 1.0/3).
4) Collection Expressions: Table XXII shows the valuesand operators that apply to sets and sequences, and their Ctranslations. Some operators (unionAll, intersectAll, symmet-ricDifference, subcollections) were considered a low priority,because these are infrequently used, and were not translated.The requirements are grouped as F1.3.6. After evaluationand negotiation, it was decided that full implementation ofdelete should be deferred, because of the complex seman-tics of data deletion in C. In addition, prototyping revealedthat compiler differences made the use of qsort impractical,and instead a custom sorting algorithm, treesort, was imple-mented. This has the signature (void** treesort(void* col[],int (*comp)(void*, void*)) and the translation of x→sort() isthen: (rt) treesort((void∗∗) x’, comp) for the appropriate resulttype rt and comparitor function comp. Table XXI shows thetranslation of select and collect operators. These mappings aregrouped as requirement F1.3.7.

234
International Journal on Advances in Software, vol 9 no 3 & 4, year 2016, http://www.iariajournals.org/software/
2016, © Copyright by authors, Published under agreement with IARIA - www.iaria.org
TABLE XIX. MAPPING SCENARIOS FOR COMPARITOREXPRESSIONS
OCL expression e C representation e’x : EE entity typex : ss collection
isIn((void∗ x’, (void ∗∗) e instances)
isIn((void∗) x’, (void ∗∗) s’)
s->includes(x)s collection
Same as x : s
x / : EE entity typex / : ss collection
!isIn((void∗) x’, (void ∗∗) e instances)
!isIn((void∗) x’, (void ∗∗) s’)
s->excludes(x)s collection
Same as x / : s
x = yNumerics, BooleansStringsObjectsSetsSequences
x’== y’
strcmp(x’, y’) == 0x’== y’equalsSet((void ∗∗) x’, (void ∗∗) y’)equalsSequence((void ∗∗) x’, (void ∗∗) y’)
x <yNumericsStrings
x’<y’
strcmp(x’, y’) <0Similarly for >, <=, >=,/=
>, <=, >=,! =
s <: ts, t collections
containsAll ((void ∗∗) t’, (void ∗∗) s’)
t->includesAll(s) Same as s <: tt->excludesAll(s) disjoint((void∗∗) t’, (void∗∗) s’)
TABLE XX. MAPPING SCENARIOS FOR NUMERIC EXPRESSIONS
OCL expression e Representation in C-x -x’x + y x’ + y’numbersx - y x’ - y’x* y x’ * y’x / y x’ / y’x mod y x’ % y’x.sqr (x’ * x’)x.sqrt sqrt(x’)x.floor oclFloor(x’) defined as: ((int) floor(x’))x.round oclRound(x’)x.ceil oclCeil(x’) defined as: ((int) ceil(x’))x.abs fabs(x’)x.exp exp(x’)x.log log(x’)x.pow(y) pow(x’,y’)x.sin, x.cos, x.tan sin(x’), cos(x’), tan(x’)Integer.subrange(st,en) intSubrange(st’,en’)
Unlike the types and class diagram mappings, a recursivedescent style of specification is needed for the expressionsmapping (and for activities). This is because the subordinateparts of an expression are themselves expressions. Thus it isnot possible in general to map all the subordinate parts ofan expression by prior rules: even for basic expressions, the
TABLE XXI. SCENARIOS FOR THE MAPPING OF SELECTION ANDCOLLECTION EXPRESSIONS
UML expression e C translation e’s->select(P) selectE(s’, fP) fP evaluates Ps->select( x | P ) as aboves->reject(P) rejectE(s’, fP)s->reject( x | P ) as aboves->collect(e) (et’∗) collectE(s’, fe)e of type et fe evaluates e’s->collect( x | e ) as aboves->selectMaximals(e) -s->selectMinimals(e) -
parameters may be general expressions. In contrast, the ele-ment types of collection types cannot themselves be collectiontypes or involve subparts that are collection types, so it ispossible to map all element types before considering collectiontypes. A recursive descent style of mapping specification usesoperations of each source entity type to map instances of thattype, invoking mapping operations recursively to map subpartsof the instances.
D. Activities Translation
In this iteration, UML-RSDS activities are mapped to Cstatements by a subtransformation statements2C. UML-RSDSstatements correspond closely to those of C. Table XXIIIshows the main cases of the mapping of UML activities toC statements.
E. Use case Translation
In this iteration, the mapping usecases2C of use casesis specified and implemented. A large part of this iterationwas also taken up with integration testing of the completetransformation.
F1.5.1: A use case uc is mapped to a C operation withapplication scope, and with parameters corresponding to thoseof uc. Its code is given by the C translation of the activityclassifierBehaviour of uc.
F1.5.2: Included use cases are also mapped to operations,and invoked from the including use case.
F1.5.3: Operation activities are mapped to C code for thecorresponding COperation.
F1.5.1 is formalised as:
UseCase::COperation->exists( cop | cop.name = name &cop.scope = "application" &cop.isQuery = false &cop.code = classifierBehaviour.mapStatement() &cop.parameters = parameters.mapExpression() &cop.returnType = CType[returnType.typeId] )
Similarly for the activities of UML operations.This case study is the largest transformation, which has
been developed using UML-RSDS, in terms of the numberof rules (over 150 rules/operations in 5 subtransformations).By using a systematic requirements engineering and agiledevelopment approach, we were able to effectively modularisethe transformation and to organise its structure and manage its

235
International Journal on Advances in Software, vol 9 no 3 & 4, year 2016, http://www.iariajournals.org/software/
2016, © Copyright by authors, Published under agreement with IARIA - www.iaria.org
TABLE XXII. SCENARIOS FOR THE TRANSLATION OFCOLLECTION OPERATORS
Expression e C translation e’Set newEList()Sequence newEList()Setx1, x2, ... , xn insertE(... insertE(newEList(), x1’), ..., xn’)Sequencex1, x2, ..., xn appendE(... appendE(newEList(), x1’), ..., xn’)s->size() length((void∗∗) s’)s->including(x) insertE(s’,x’) or appendE(s’,x’)s->excluding(x) removeE(s’,x’)s - t removeAllE(s’,t’)s->prepend(x) -s->append(x) appendE(s’,x’)s->count(x) count((void∗) x’, (void∗∗) s’)s->indexOf(x) indexOf((void*) x’, (void**) s’)x∨y unionE(x’,y’)x∧y intersectionE(x’,y’)x_ y concatenateE(x’,y )x->union(y) unionE(x’,y’)x->intersection(y) intersectionE(x’, y’)x->unionAll(e) -x->intersectAll(e) -x->symmetricDifference(y) -x->any() x’[0]x->subcollections() -x->reverse() reverseE(x’)x->front() subrangeE(x’,1,length((void**) x’)-1)x->tail() subrangeE(x’,2,length((void**) x’))x->first() x’[0]x->last() x’[length((void∗∗) x’)-1]
x->sort() qsort((void∗∗) x’, length((void∗∗) x’),sizeof(struct E∗), compareToE)
x->sortedBy(e)qsort((void∗∗) x’, length((void∗∗) x’),sizeof(struct E∗), compare)compare defines e-order
x->sum() sumString(x’), sumint(x’), sumlong(x’),sumdouble(x’)
x->prd() prdint(x’), prdlong(x’), prddouble(x’)
Integer.Sum(a,b,x,e) sumInt(a’,b’,fe), sumDouble(a’,b’,fe)fe computes e’(x’)
Integer.Prd(a,b,x,e) prdInt(a’,b’,fe), prdDouble(a’,b’,fe)
x->max() maxInt(x’), maxLong(x’), maxDouble(x’),maxString(x’)
x->min() minInt(x’), minLong(x’), minDouble(x’),minString(x’)
x->asSet() asSetE(x’)x->asSequence() x’s->isUnique(e) isUniqueE(s’,fe)x->isDeleted() killE(x’)
requirements. Despite the complexity of the transformation, itwas possible to use patterns to enforce bx and other properties,and to effectively prove these properties.
VII. CONCLUSION AND FUTURE WORK
We have identified ways in which requirements engineer-ing can be applied systematically to model transformations.Comprehensive catalogues of functional and non-functionalrequirements categories for model transformations have been
TABLE XXIII. SCENARIOS FOR MAPPING OF STATEMENTS TO C
Requirement UML activity st C statement st’
F1.4.1 Creation statement x : TdefaultT’ is default value of T’
T’ x = defaultT’;
F1.4.2 Assign statement v := e v’ = e’;F1.4.3 Sequence statement st1 ; ... ; stn st1’ ... stn’
F1.4.4 Conditional statement if ethen st1 else st2
if e’ st1’ else st2’
F1.4.5 Return statement return e return e’;F1.4.6 Break statement break break;
F1.4.7Bounded loop for (x : e) do ston object collection e of entityelement type E
int i = 0;for ( ; i <length((void**)e’); i++) struct E* x = e’[i]; st’ New index variable i
F1.4.8 Unbounded loop while e do st while (e’) st’ F1.4.9 Operation call ex.op(pars) op(ex’,pars’)
defined. We have examined a case study, which is typical ofthe current state of the art in transformation development,and identified how formal treatment of functional and non-functional requirements can benefit such developments. In thispaper we have identified the need for a systematic require-ments engineering process for model transformations. We haveproposed such a process, and identified RE techniques thatcan be used in this process. Moreover, we have identified arequirements engineering process for model transformations,and requirements engineering techniques that can be used inthis process. The process can be used to develop specificationsin a range of declarative and hybrid MT languages. We haveevaluated the process and techniques on a real industrial casestudy, UML to C translation, with positive results.
In future work, we will construct tool support for recordingand tracing transformation requirements, which will help toensure that developers systematically consider all necessaryrequirements and that these are all formalised, validated andverified correctly. We are currently carrying out research intoimproving the requirements engineering process in modeltransformation. We will investigate formal languages to ex-press the requirements, as formalised rules can be checked forinternal correctness properties, such as definedness and de-terminacy, which should hold for meaningful rules. Temporallogic can be used to define the specialised characteristics ofparticular transformation and to define transformation require-ments in a formal but language-independent manner languagesas model transformation systems necessarily involve a notionof time. Finally, we will be evaluating large case studies inorder to compare results with and without RE process.
APPENDIX
The procedure for selecting RE techniques for a MT projectin more detail involves:
1) The set T of all suitable RE techniques (e.g. interview,prototype) in each category (i.e. elicitation, negotiation,specification, verification) is identified.
2) For each requirement identified within the project, eachRE technique t ∈ T is assigned a value RA(t) (for

236
International Journal on Advances in Software, vol 9 no 3 & 4, year 2016, http://www.iariajournals.org/software/
2016, © Copyright by authors, Published under agreement with IARIA - www.iaria.org
Requirement Attribute) representing the suitability ofapplying t to fulfil this requirement, based on therequirement’s attributes. The function RA : T 7−→ [0, 1]is defined as:
RA(t) =
∑ax∈A
I(ax)× V(ax, t)
|A|where:• The set of all technique attributes (e.g. facilitating
communication, identifying MT stakeholders) is A
(Table III). For instance, A = Eliciting MT require-ments, facilitating communication, . . . , identifyingincomplete requirements.
• I(ax) which is in [0, 1], represents the importance ofan attribute ax ∈ A for a specific requirement of theproject. A low I(ax) value for an attribute ax ∈ A
means ax is not important for the requirement ofthe MT project and a high value represents highimportance. The assignment of I(ax) to each ax ∈ A
is done by MT developers.• V(ax, t) is a function V : T×A 7−→ [0, 1] which given
a technique attribute and an RE technique, assigns a[0, 1] value. These values are based on the techniqueattribute measures of [23] as well as others that areidentified in this research. Tables (V, VI, VII, VIII)give examples of these adapted attribute measures.
3) For each requirement identified within the project, eachRE technique t ∈ T is assigned a value PD(t) (forProject Description) representing the suitability of ap-plying t to fulfil this requirement, based on the project’sdescriptions. The function PD : T 7−→ [0, 1] is definedas:
PD(t) = Πdx∈D
1− W(dx) if dx ∈ IDt
W(dx) otherwise
where:• The set of all project descriptors (e.g. size, complex-
ity) is D. For instance, in this thesis, we are consid-ering D = size, complexity, volatility, relationship,safety, quality, time, cost, domain understanding.
• W(dx) is a function W : D 7−→ [0, 1] which representsthe magnitude of a specific descriptor in the project.For example, for d = cost, a high value representsthat the budget of the project is tight, while a lowvalue indicates that the budget is flexible. Thenfor d = size, a high value means that the projectinvolves a large number of transformation ruleswhile a low value indicates a small number of rulesinvolved.
• IDt ⊆ D is a set containing all descriptors withinverse impact for a specific RE technique t. Morespecifically, for each d ∈ IDt, the higher the valueof W(dx) the more negative the impact of applying
t in that project. An example of such a descriptorfor technique “interview” is time, where the higherthe value of W(time) in a specific project, the morenegative the effectiveness of interviewing as a tech-nique to fulfil a requirement in this project.
4) Evaluating the degree E (for Experience) of experience/-expertise regarding the RE technique t available in thedevelopment team. E : T 7−→ [0, 1] is a function whereE(t) represents the level of experience and practical andtheoretical knowledge of the developer regarding t.
5) Using S(t), the overall suitability score of a particularRE technique (t ∈ T) can be calculated, and hence itwould be possible to define a ranking of techniquest based on their suitability scores S(t) for use in theproject. S(t) is defined in terms of the requirement at-tribute score RA(t), the project description score PD(t),and the experience score E(t) of RE technique t asfollows:
S(t) = RA(t)× PD(t)× E(t)
REFERENCES
[1] S. Yassipour Tehrani and K. Lano, “Model transformation applicationsfrom requirements engineering perspective,” in The 10th InternationalConference on Software Engineering Advances, 2015.
[2] I. Sommerville and G. Kotonya, Requirements engineering: processesand techniques. John Wiley & Sons, Inc., 1998.
[3] E. Guerra, J. De Lara, D. S. Kolovos, R. F. Paige, and O. M. dos Santos,“transml: A family of languages to model model transformations,” inModel Driven Engineering Languages and Systems. Springer, 2010,pp. 106–120.
[4] B. Selic, “What will it take? a view on adoption of model-based methodsin practice,” Software & Systems Modeling, vol. 11, no. 4, 2012, pp.513–526.
[5] K. Lano and S. Kolahdouz-Rahimi, “Model-driven development ofmodel transformations,” in Theory and practice of model transforma-tions. Springer, 2011, pp. 47–61.
[6] K. Lano and S. Rahimi, “Constraint-based specification of model trans-formations,” Journal of Systems and Software, vol. 86, no. 2, 2013, pp.412–436.
[7] S. Friedenthal, A. Moore, and R. Steiner, A practical guide to SysML:the systems modeling language. Morgan Kaufmann, 2014.
[8] T. Yue, L. C. Briand, and Y. Labiche, “A systematic review of trans-formation approaches between user requirements and analysis models,”Requirements Engineering, vol. 16, no. 2, 2011, pp. 75–99.
[9] S. Y. Tehrani, S. Zschaler, and K. Lano, “Requirements engineering inmodel-transformation development: An interview-based study,” in Inter-national Conference on Theory and Practice of Model Transformations.Springer, 2016, pp. 123–137.
[10] S. Kolahdouz-Rahimi, K. Lano, S. Pillay, J. Troya, and P. Van Gorp,“Evaluation of model transformation approaches for model refactoring,”Science of Computer Programming, vol. 85, 2014, pp. 5–40.
[11] P. Van Gorp and L. M. Rose, “The petri-nets to statecharts transformationcase,” arXiv preprint arXiv:1312.0342, 2013.
[12] I. Iso, “Iec 25010: 2011,,” Systems and Software EngineeringSystemsand Software Quality Requirements and Evaluation (SQuaRE)Systemand Software Quality Models, 2011.
[13] K. Lano, S. Kolahdouz-Rahimi, and T. Clark, “Comparing verificationtechniques for model transformations,” in Proceedings of the Workshopon Model-Driven Engineering, Verification and Validation. ACM, 2012,pp. 23–28.
[14] I. O. F. S. E. Commission et al., “Software engineering–product quality–part 1: Quality model,” ISO/IEC, vol. 9126, 2001, p. 2001.
[15] K. Anastasakis, B. Bordbar, and J. M. Kuster, “Analysis of model trans-formations via alloy,” in Proceedings of the 4th MoDeVVa workshopModel-Driven Engineering, Verification and Validation, 2007, pp. 47–56.

237
International Journal on Advances in Software, vol 9 no 3 & 4, year 2016, http://www.iariajournals.org/software/
2016, © Copyright by authors, Published under agreement with IARIA - www.iaria.org
[16] L. de Moura and N. Bjørner, “Z3–a tutorial,” 2006.[17] S. Yassipour Tehrani and K. Lano, “Temporal logic specification and
analysis for model transformations,” in Verification of Model Transfor-mations, VOLT 2015, 2015.
[18] A. M. Hickey and A. M. Davis, “Requirements elicitation and elicitationtechnique selection: model for two knowledge-intensive software devel-opment processes,” in System Sciences, 2003. Proceedings of the 36thAnnual Hawaii International Conference on. IEEE, 2003, pp. 10–pp.
[19] N. Maiden and G. Rugg, “Acre: selecting methods for requirementsacquisition,” Software Engineering Journal, vol. 11, no. 3, 1996, pp.183–192.
[20] L. Jiang, A. Eberlein, B. H. Far, and M. Mousavi, “A methodologyfor the selection of requirements engineering techniques,” Software &Systems Modeling, vol. 7, no. 3, 2008, pp. 303–328.
[21] L. Macaulay, “Requirements for requirements engineering techniques,”in Requirements Engineering, 1996., Proceedings of the Second Inter-national Conference on. IEEE, 1996, pp. 157–164.
[22] K. Lano, “The uml-rsds manual,” 2014.[23] L. Jiang, A framework for the requirements engineering process devel-
opment. University of Calgary, 2005.

238
International Journal on Advances in Software, vol 9 no 3 & 4, year 2016, http://www.iariajournals.org/software/
2016, © Copyright by authors, Published under agreement with IARIA - www.iaria.org
A Computational Model of Place on the Linked Data Web
Alia I Abdelmoty, Khalid O. Al-Muzaini
School of Computer Science & Informatics, Cardiff University, Wales, UKEmail: A.I.Abdelmoty, [email protected]
Abstract—The Linked Data Web (LDW) is an evolution ofthe traditional Web from a global information space of linkeddocuments to one where both documents and data are linked.A significant amount of geographic information about places iscurrently being published on this LDW. These are used to qualifythe location of other types of datasets. This paper examinesthe limitations in the nature of location representation in sometypical examples of these Resource Description Framework (RDF)resources, primarily resulting from the simplified geometricrepresentation of location and the incomplete and random useof spatial relationships to link place information. The paperproposes a qualitative model of place location that enforces anordered representation of relative spatial relationships betweenplaces. This work further explores how semantic properties ofplace can be included to derive meaningful location expressions.The model facilitates the application of qualitative spatial reason-ing on places to extract a potentially large percentage of implicitlinks between place resources, thus allowing place information tobe linked and to be explored more fully and more consistentlythan what is currently possible. The paper describes the modeland presents experimental results demonstrating the effectivenessof the model on realistic examples of geospatial RDF resources.
Keywords–qualitative place models; spatial reasoning; geospa-tial web.
I. INTRODUCTION
One of the ‘Linked Data Principles’ is to include linksto connect the data to allow the discovery of related things.However, identifying links between data items remains aconsiderable challenge that needs to be addressed [1], [2], [3].A key research task in this respect is identity resolution, i.e.,to recognise when two things denoted by two URIs are thesame and when they are not. Automatic linking can easilycreate inadequate links, and manual linking is often too timeconsuming [4]. Geo-referencing data on the LDW can addressthis problem [5], whereby links can be inferred between dataitems by tracing their spatial (and temporal) footprints. Forexample, the BBC uses RDF place gazetteers as an anchor torelate information on weather, travel and local news [6].
Yet, for geospatial linked data to serve its purpose, linkswithin and amongst the geographic RDF resources need them-selves to be resolved. That is to allow place resources to beuniquely identified and thus a place description in one datasetcan be matched to another describing the same place in adifferent dataset. A scheme that allows such links betweenplace resources to be discovered would be a valuable steptowards the realisation of the LDW as a whole.
In this paper, location is used as a key identifier for placeresources and the question to be addressed is how locationcan be used to define a linked place model that is sufficient toenable place resources to be uniquely identified on the LDW.
Several challenges need to be addressed, namely, 1) locationrepresentation of RDF place resources is simple; defined aspoint coordinates in some resources, detailed; defined withextended geometries in others, and sometimes missing alltogether, 2) coordinates of locations may not match exactlyacross data sources, where volunteered data mapped by in-dividuals is mashed up with authoritative map datasets, 3)non-standardised vocabularies for expressing relative locationis used in most datasets, e.g., in DBpedia, properties suchas dbp:location, dbp-ont:region and dbp-ont:principalarea areused to indicate that the subject place lies inside the objectplace.
Towards addressing this problem, a linked place model isproposed that uses qualitative spatial relationships to describeunique place location profiles, as presented in [1]. The profilesdon’t rely on the provision of exact geometries and hence canbe used homogeneously with different types of place resources.They can be expressed as RDF statements and can thus beintegrated directly with the resource descriptions. The rationalebehind the choice of links to be modelled is primarily twofold:to allow for a sensible unique description of place location andto support qualitative spatial reasoning over place resources.
The model is further adapted to consider semantic aspectsof place location definition. In particular, the notion of salienceof place is used to scope the type of relationships used in thelocation expressions in the defined place profiles. It is shownhow the proposed representation scheme is flexible to allowfor the encoding of relevant location expressions, whilst alsoretaining the power of spatial reasoning within the frameworkproposed.
The value of the linked place model is illustrated bymeasuring its ability to make the underlying RDF graph ofgeographic place resources browsable. Samples of realisticgeographic linked datasets are used in the experiments pre-sented and results demonstrate significant potential value ofthe methods proposed.
The paper is structured as follows. An overview of relatedwork on the representation and manipulation of place resourceson the LDW is given in section II, In section III the proposedrelative location model, as well its adaptation to includesemantic aspects of place definition, are described. In sectionIV, application of the models proposed is evaluated on twodifferent realistic datasets. Conclusions and an overview offuture work is given in section VI.
II. RELATED WORK
Here related work on the topics of representing placeresources and reasoning with them on the LDW are reviewed.

239
International Journal on Advances in Software, vol 9 no 3 & 4, year 2016, http://www.iariajournals.org/software/
2016, © Copyright by authors, Published under agreement with IARIA - www.iaria.org
A. Representing RDF place Resources on the LDW
Sources of geographic data on the LDW are either volun-teered (crowdsourced) resources, henceforth denoted Volun-teered Geographic Information (VGI), created by individualswith only informal procedures for validating the content,or authoritative resources produced by mapping organiza-tions, henceforth denoted Authoritative Geographic Informa-tion (AGI). Example of VGIs are DBpedia (dbpedia.org),GeoNames (geonames.org), and OpenSreetMaps (linkedgeo-data.org) [7] and examples of AGIs are the Ordnance Surveylinked data [8] and the Spanish linked data [9]. Data collectedfrom users on the Social Web, e.g., on Twitter and Foursquare,can also be considered as VGIs [10].
The volume of VGI resources is increasing steadily, provid-ing a wealth of information on geographic places and creatingdetailed maps of the world. DBpedia contains hundreds ofthousands of place entities, whose locations are represented aspoint geometry. GeoNames is a gazetteer that collects both spa-tial and thematic information for various place names aroundthe world. In both datasets, place location is represented by asingle point coordinates. While DBpedia does not enforce anyconstraints on the definition of place location (e.g., coordinatesmay be missing in place resources), reference to some relativespatial relationships, and in particular to represent containmentwithin a geographic region, is normally maintained. A detailedanalysis of the spatial data content of DBpedia can be foundin [11], [12]. GeoNames places are also interlinked with eachother by defining associated parent places.
In [13], the LinkedGeoData effort is described whereOpenStreetMap (OSM) data is transformed into RDF andmade available on the Web. OSM data is represented witha relatively simple data model that captures the underlyinggeometry of the features. It comprises three basic types,nodes (representing points on Earth and have longitude andlatitude values), ways (ordered sequences of nodes that forma polyline or a polygon) and relations (groupings of multiplenodes and/or ways). Furthermore, [14] presented methods todetermine links between map features in OSM and equivalentinstances documented in DBpedia, as well as between OSMand Geonames. Their matching is based on a combinationof the Jaro-Winkler string distance between the text of therespective place names and the geographic distance betweenthe entities. Example of other work on linking geodata on theSemantic Web is [15], which employs the Hausdorff distanceto establish similarity between spatially extensive linear orpolygonal features.
In contrast to VGI resources that manages geographicresource as points (represented by a coordinate of latitude andlongitude), AGI resources deal with more complex geometriesas well, such as line strings. AGIs tend to utilise well-defined standards and ontologies for representing geographicfeatures and geometries. Ordnance Survey linked data alsodemonstrates the use of qualitative spatial relations to describespatial relationships in its datasets. Two ontologies, the Ge-ometry Ontology and the Spatial Relations Ontology, are usedto provide geospatial vocabulary. These ontologies describeabstract geometries and topological relations (equivalent toRCC8 [16]) respectively.
In summary, the spatial representation of place resources inVGI datasets is generally limited to point representation, and
is managed within simple ontologies that encode non-spatialsemantics and in some cases limited spatial relationships. Onthe other hand, place data provided as AGI tend to presentmore structured and detailed spatial representations, but is alsolimited to specific types and scales of representation. Use ofsome qualitative spatial relationships has been demonstratedfor capturing the spatial structure in some example datasets.The model proposed in this paper offers a systematic andhomogenous representation of place location that can be con-sistently applied to VGIs or AGIs and demonstrates the valueof heterogenous qualitative spatial relations in representingplace information on the LDW.
B. Manipulating and Querying RDF place resources on theLDW
Recently, much work has been done on extending RDFfor representing geospatial information through defining andutilising appropriate vocabularies encoded in ontologies torepresent space and time. The work capitalises on specificationof standards, defined by the Open Geospatial Consortium(OGC)(opengeospatial.org), for modeling core concepts relatedto geospatial data. Prominent examples are the geographicquery language for RDF (GeoSPARQL), an OGC standard[17] and stRDF/stSPARQL (st stands for spatiotemporal) [18].Both proposals provide vocabulary (classes, properties, andfunctions) that can be used in RDF graphs and SPARQLqueries to represent and query geospatial data, for examplegeo:SpatialObject, which has as instances everything thatcan have a spatial representation and geo:Geometry as thesuperclass of all geometry classes. In addition, geometricfunctions and topological functions are offered for performingcomputations, such as geof:distance and for asserting topo-logical relations between spatial objects, e.g., dbpedia:Cardiffgeo:sfWithin dbpedia:Wales.
Qualitative spatial representation and reasoning (QSRR)are established areas of research [19], [20], whose results haveinfluenced the definition of models of spatial relationships ininternational standards, e.g., the OGC models, and commercialspatial database systems (for example, in the Oracle DBsystem). RCC8, a QSRR model, has been recently adoptedby GeoSPARQL [17], and there is an ever increasing interestin coupling QSR techniques with Linked Geospatial Datathat are constantly being made available [18]. On the otherhand, Semantic Web reasoning engines have been extendedto support qualitative spatial relations, e.g., Racerpro [21]and PelletSpatial [22]. Scalability of the spatial reasoning isrecognised and reported challenge. Scalable implementationsof constraint network algorithms for qualitative and quantita-tive spatial constraints are needed, as RDF stores supportingLinked Geospatial Data are expected to scale to billions oftriples [18]. Lately, promising results have been reported by[23], who proposed an approach for removing redundancy inRCC8 networks and by [24], who examined graph-partitioningtechniques as a method for coping with large networks; inboth cases leading to more effective application of spatial rea-soning mechanisms. Finally, qualitative methods were used tocomplement existing quantitative methods for representing thegeometry of spatial locations. In [25], heterogenous reasoningmethods are proposed that combine calls between a spatialdatabase system and a spatial reasoning engine implementedin OWL2 RL to check the consistency of place ontologies.

240
International Journal on Advances in Software, vol 9 no 3 & 4, year 2016, http://www.iariajournals.org/software/
2016, © Copyright by authors, Published under agreement with IARIA - www.iaria.org
In [26], Younis et al described query plans that make useof a combination of qualitative spatial relationships associatedwith place resources in DBpedia and detailed representationsof geometry maintained in a spatially indexed database foranswering complex queries. In both cases, qualitative reason-ing was limited by the fragmented and scarce availabilityof spatial relationships to work on. The qualitative schemeof representation of place location proposed in this paperaddresses this issue and provides a novel method for definingspatial relationships that is designed to support and facilitatethe effective use of qualitative spatial reasoning on the LDW.
III. A LINKED PLACE MODEL FOR THE LINKED DATAWEB
A Relative Location model (RelLoc) is proposed here tocapture a qualitative representation of the spatial structureof place location. Two types of spatial relations are used asfollows.
1) Containment relationships, to record that a parentplace directly contains a child place; i.e., one stephierarchy. For example, for three places representinga district, a city and a country, the model will explic-itly record the relationships: inside(district, city) andinside(city, country), but not inside(district, country).
2) Direction-proximity relationships, to record for everyplace the relative direction location of its nearestneighbour places. The direction frame of referencecan be selected as appropriate. For example, for a4-cardinal direction frame of reference, a place willrecord its relative direction relation with its nearestneighbour in four directions.
For a given set of places Pl, let DirPr be the set of alldirection-proximity relations between instances of places in Plas defined above, and let Con be the set of containment rela-tions between instances of places in Pl as defined above. Then,RelLoc(Pl) is defined as a tuple RelLoc(Pl) := (Pl,D,C),where: D ∈ DirPr and C ∈ Con. Rnn(x, y) is used to denotethat x is the nearest neighbour from the direction R to objecty. For example, Nnn(pl1, pl2) indicates that pl1 is the nearestneighbour from the north direction to pl2, etc.
To illustrate the model, consider the scene in Figure 1 thatconsists of a set of places, a to f , with a 4-cardinal directionframe of reference overlaid for some places in the scenes.A representative point is used to define the place location.It is further known that places represented as points a, b, c, eare inside d and places d, f are inside g. The full set ofrelationships used to model the scene are given in the tablein Figure 1(b). Note that in some cases, no relation can befound, e.g., there are no neighbours for object c from the westdirection in Figure 1(a).
A. Spatial Reasoning with the Relative Location ModelWe can reason over the relative location model to in-
fer more of the implicit spatial structure of place location.Qualitative spatial reasoning (QSR) tools can be utilisedto propagate the defined relationships and derive new onesbetween places in the scene. QSR takes advantage of thetransitive nature of the partial or total ordering of the quan-tity space in order to infer new information from the rawinformation presented. In particular, the transitive nature of
(a)Set of spatial relations to model relative locationNnn(d, a), Snn(b, a), Wnn(c, a), Enn(e, a)Nnn(g, d), Snn(a, d), Wnn(c, d), Enn(e, d)Nnn(g, c), Snn(b, c), Enn(a, c)Nnn(a, b), Enn(f, b)Nnn(a, f), Wnn(b, f)Nnn(g, e), Snn(b, e), Wnn(d, e)Snn(d, g)in(a, d), in(b, d), in(c, d), in(e, d),in(d, g), in(f, g)
(b)
Figure 1. (a) An example map scene with a set of places represented aspoints.(b) Set of direction, proximity and containment relations chosen to
representative relative location in the proposed model.
TABLE I. COMPOSITION TABLE FOR 4-CARDINAL DIRECTIONRELATIONSHIPS.
N E S W
N N N ∨ E All N ∨ WE N ∨ E E S ∨ E AllS All S ∨ E S S ∨ WW W ∨ N All W ∨ S W
some spatial relationships can be used to directly infer spatialhierarchies, for example, containment and cardinal directionrelations. The scope of the model is deliberately focussedon general containment relationships and ignores other pos-sible topological relations, such as overlap or touch. Hence,building containment hierarchies is straightforward using thetransitivity rules: inside(a, b) ∧ inside(b, c) → inside(a, c)and contains(a, b) ∧ contains(b, c)→ contains(a, c).
In the case of direction relationships, more detailed spatialreasoning can be applied using composition tables. Table Ishows the composition table for a 4-cardinal direction frameof reference between point representations of spatial objects.In considering the entries of the composition tables, some ofthose entries provide definite conclusions of the compositionoperation, i.e., the composition result is only one relationship(emboldened in the table), other entries are indefinite andresult in a disjunctive set of possible relationships, e.g., thecomposition: N(a, b) ∧ E(b, c)→ N(a, c) ∨ E(a, c).
Spatial reasoning can be applied on the linked place model
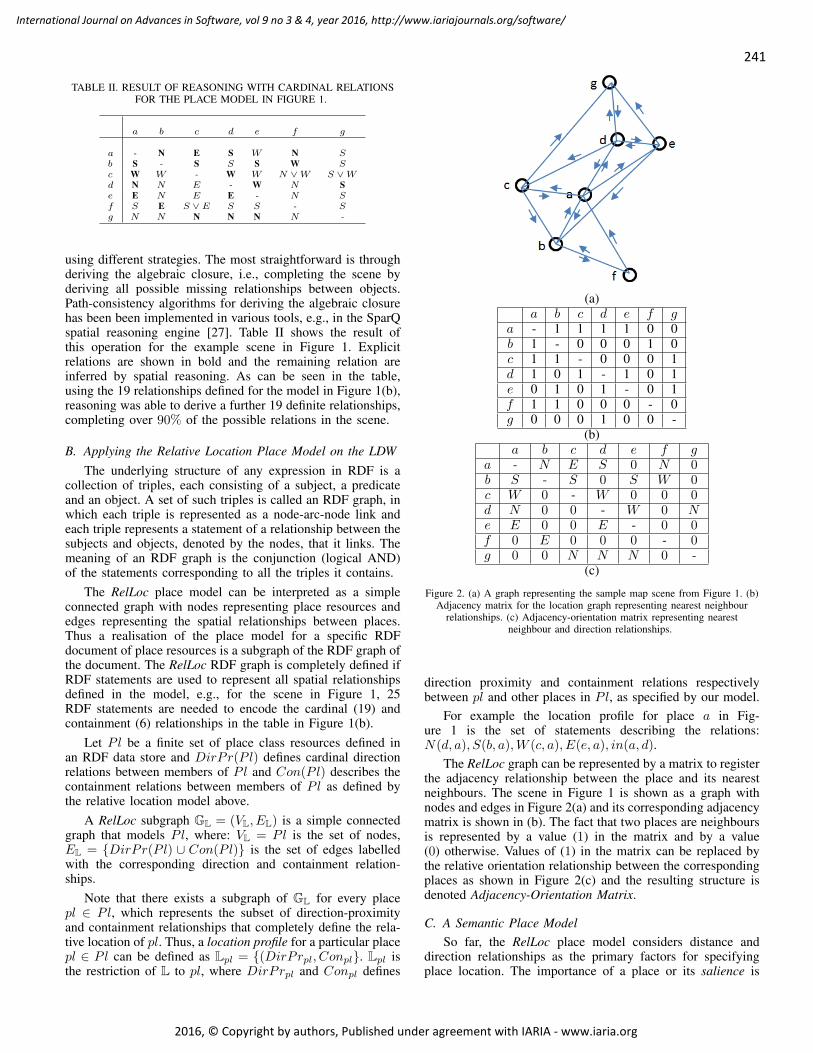
241
International Journal on Advances in Software, vol 9 no 3 & 4, year 2016, http://www.iariajournals.org/software/
2016, © Copyright by authors, Published under agreement with IARIA - www.iaria.org
TABLE II. RESULT OF REASONING WITH CARDINAL RELATIONSFOR THE PLACE MODEL IN FIGURE 1.
a b c d e f g
a - N E S W N Sb S - S S S W Sc W W - W W N ∨ W S ∨ Wd N N E - W N Se E N E E - N Sf S E S ∨ E S S - Sg N N N N N N -
using different strategies. The most straightforward is throughderiving the algebraic closure, i.e., completing the scene byderiving all possible missing relationships between objects.Path-consistency algorithms for deriving the algebraic closurehas been been implemented in various tools, e.g., in the SparQspatial reasoning engine [27]. Table II shows the result ofthis operation for the example scene in Figure 1. Explicitrelations are shown in bold and the remaining relation areinferred by spatial reasoning. As can be seen in the table,using the 19 relationships defined for the model in Figure 1(b),reasoning was able to derive a further 19 definite relationships,completing over 90% of the possible relations in the scene.
B. Applying the Relative Location Place Model on the LDWThe underlying structure of any expression in RDF is a
collection of triples, each consisting of a subject, a predicateand an object. A set of such triples is called an RDF graph, inwhich each triple is represented as a node-arc-node link andeach triple represents a statement of a relationship between thesubjects and objects, denoted by the nodes, that it links. Themeaning of an RDF graph is the conjunction (logical AND)of the statements corresponding to all the triples it contains.
The RelLoc place model can be interpreted as a simpleconnected graph with nodes representing place resources andedges representing the spatial relationships between places.Thus a realisation of the place model for a specific RDFdocument of place resources is a subgraph of the RDF graph ofthe document. The RelLoc RDF graph is completely defined ifRDF statements are used to represent all spatial relationshipsdefined in the model, e.g., for the scene in Figure 1, 25RDF statements are needed to encode the cardinal (19) andcontainment (6) relationships in the table in Figure 1(b).
Let Pl be a finite set of place class resources defined inan RDF data store and DirPr(Pl) defines cardinal directionrelations between members of Pl and Con(Pl) describes thecontainment relations between members of Pl as defined bythe relative location model above.
A RelLoc subgraph GL = (VL, EL) is a simple connectedgraph that models Pl, where: VL = Pl is the set of nodes,EL = DirPr(Pl) ∪ Con(Pl) is the set of edges labelledwith the corresponding direction and containment relation-ships.
Note that there exists a subgraph of GL for every placepl ∈ Pl, which represents the subset of direction-proximityand containment relationships that completely define the rela-tive location of pl. Thus, a location profile for a particular placepl ∈ Pl can be defined as Lpl = (DirPrpl, Conpl. Lpl isthe restriction of L to pl, where DirPrpl and Conpl defines
(a)a b c d e f g
a - 1 1 1 1 0 0b 1 - 0 0 0 1 0c 1 1 - 0 0 0 1d 1 0 1 - 1 0 1e 0 1 0 1 - 0 1f 1 1 0 0 0 - 0g 0 0 0 1 0 0 -
(b)a b c d e f g
a - N E S 0 N 0b S - S 0 S W 0c W 0 - W 0 0 0d N 0 0 - W 0 Ne E 0 0 E - 0 0f 0 E 0 0 0 - 0g 0 0 N N N 0 -
(c)
Figure 2. (a) A graph representing the sample map scene from Figure 1. (b)Adjacency matrix for the location graph representing nearest neighbour
relationships. (c) Adjacency-orientation matrix representing nearestneighbour and direction relationships.
direction proximity and containment relations respectivelybetween pl and other places in Pl, as specified by our model.
For example the location profile for place a in Fig-ure 1 is the set of statements describing the relations:N(d, a), S(b, a),W (c, a), E(e, a), in(a, d).
The RelLoc graph can be represented by a matrix to registerthe adjacency relationship between the place and its nearestneighbours. The scene in Figure 1 is shown as a graph withnodes and edges in Figure 2(a) and its corresponding adjacencymatrix is shown in (b). The fact that two places are neighboursis represented by a value (1) in the matrix and by a value(0) otherwise. Values of (1) in the matrix can be replaced bythe relative orientation relationship between the correspondingplaces as shown in Figure 2(c) and the resulting structure isdenoted Adjacency-Orientation Matrix.
C. A Semantic Place ModelSo far, the RelLoc place model considers distance and
direction relationships as the primary factors for specifyingplace location. The importance of a place or its salience is
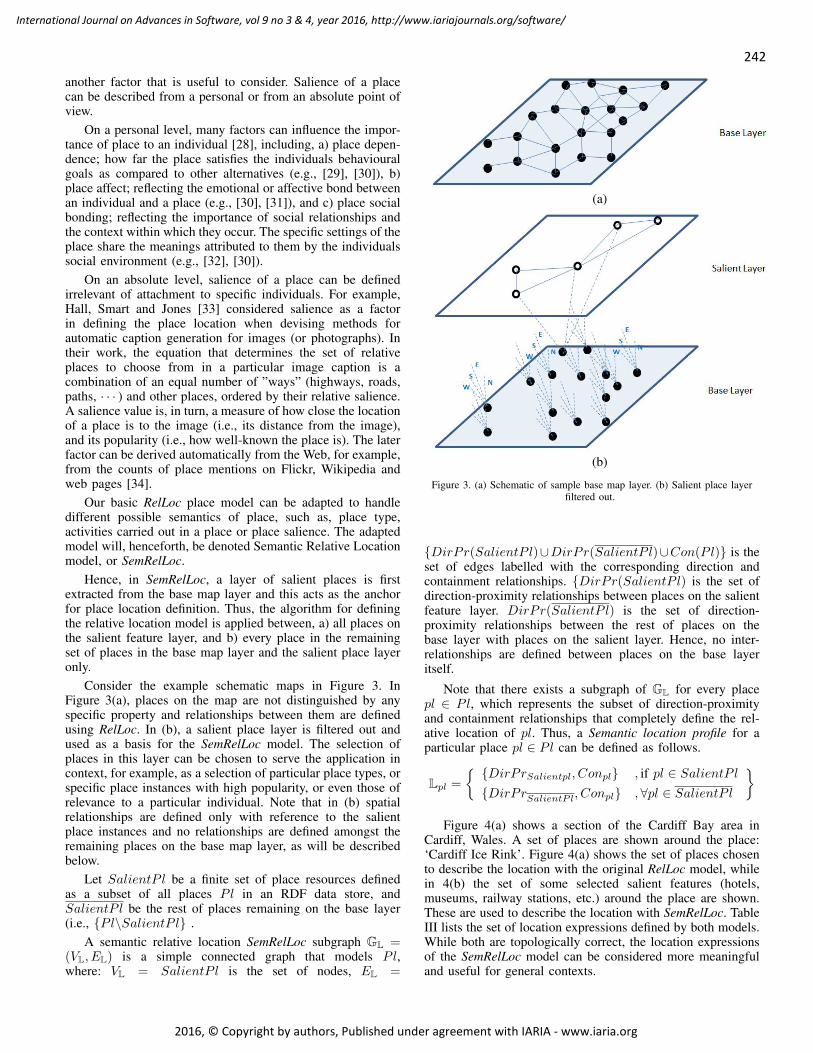
242
International Journal on Advances in Software, vol 9 no 3 & 4, year 2016, http://www.iariajournals.org/software/
2016, © Copyright by authors, Published under agreement with IARIA - www.iaria.org
another factor that is useful to consider. Salience of a placecan be described from a personal or from an absolute point ofview.
On a personal level, many factors can influence the impor-tance of place to an individual [28], including, a) place depen-dence; how far the place satisfies the individuals behaviouralgoals as compared to other alternatives (e.g., [29], [30]), b)place affect; reflecting the emotional or affective bond betweenan individual and a place (e.g., [30], [31]), and c) place socialbonding; reflecting the importance of social relationships andthe context within which they occur. The specific settings of theplace share the meanings attributed to them by the individualssocial environment (e.g., [32], [30]).
On an absolute level, salience of a place can be definedirrelevant of attachment to specific individuals. For example,Hall, Smart and Jones [33] considered salience as a factorin defining the place location when devising methods forautomatic caption generation for images (or photographs). Intheir work, the equation that determines the set of relativeplaces to choose from in a particular image caption is acombination of an equal number of ”ways” (highways, roads,paths, · · · ) and other places, ordered by their relative salience.A salience value is, in turn, a measure of how close the locationof a place is to the image (i.e., its distance from the image),and its popularity (i.e., how well-known the place is). The laterfactor can be derived automatically from the Web, for example,from the counts of place mentions on Flickr, Wikipedia andweb pages [34].
Our basic RelLoc place model can be adapted to handledifferent possible semantics of place, such as, place type,activities carried out in a place or place salience. The adaptedmodel will, henceforth, be denoted Semantic Relative Locationmodel, or SemRelLoc.
Hence, in SemRelLoc, a layer of salient places is firstextracted from the base map layer and this acts as the anchorfor place location definition. Thus, the algorithm for definingthe relative location model is applied between, a) all places onthe salient feature layer, and b) every place in the remainingset of places in the base map layer and the salient place layeronly.
Consider the example schematic maps in Figure 3. InFigure 3(a), places on the map are not distinguished by anyspecific property and relationships between them are definedusing RelLoc. In (b), a salient place layer is filtered out andused as a basis for the SemRelLoc model. The selection ofplaces in this layer can be chosen to serve the application incontext, for example, as a selection of particular place types, orspecific place instances with high popularity, or even those ofrelevance to a particular individual. Note that in (b) spatialrelationships are defined only with reference to the salientplace instances and no relationships are defined amongst theremaining places on the base map layer, as will be describedbelow.
Let SalientP l be a finite set of place resources definedas a subset of all places Pl in an RDF data store, andSalientP l be the rest of places remaining on the base layer(i.e., Pl\SalientP l .
A semantic relative location SemRelLoc subgraph GL =(VL, EL) is a simple connected graph that models Pl,where: VL = SalientP l is the set of nodes, EL =
(a)
(b)
Figure 3. (a) Schematic of sample base map layer. (b) Salient place layerfiltered out.
DirPr(SalientP l)∪DirPr(SalientP l)∪Con(Pl) is theset of edges labelled with the corresponding direction andcontainment relationships. DirPr(SalientP l) is the set ofdirection-proximity relationships between places on the salientfeature layer. DirPr(SalientP l) is the set of direction-proximity relationships between the rest of places on thebase layer with places on the salient layer. Hence, no inter-relationships are defined between places on the base layeritself.
Note that there exists a subgraph of GL for every placepl ∈ Pl, which represents the subset of direction-proximityand containment relationships that completely define the rel-ative location of pl. Thus, a Semantic location profile for aparticular place pl ∈ Pl can be defined as follows.
Lpl =
DirPrSalientpl, Conpl , if pl ∈ SalientP l
DirPrSalientP l, Conpl ,∀pl ∈ SalientP l
Figure 4(a) shows a section of the Cardiff Bay area in
Cardiff, Wales. A set of places are shown around the place:‘Cardiff Ice Rink’. Figure 4(a) shows the set of places chosento describe the location with the original RelLoc model, whilein 4(b) the set of some selected salient features (hotels,museums, railway stations, etc.) around the place are shown.These are used to describe the location with SemRelLoc. TableIII lists the set of location expressions defined by both models.While both are topologically correct, the location expressionsof the SemRelLoc model can be considered more meaningfuland useful for general contexts.

243
International Journal on Advances in Software, vol 9 no 3 & 4, year 2016, http://www.iariajournals.org/software/
2016, © Copyright by authors, Published under agreement with IARIA - www.iaria.org
(a)
(b)
Figure 4. Sample map scene with places defining the location of ”Cardiff IceRink”: a) with RelLoc model, and b) with SemRelLoc.
SemRelLoc offers two potential advantages over RelLoc;a) more meaningful place location expressions, using selectedrelevant place instances, and b) potentially a more economicaldata model to manage and reason with. The number of pre-defined relationships remains constant, as every place will havea set of statements defining its proximity and direction relation-ships. However, spatial reasoning with the semantic locationgraph can be more efficient with the reduction of the varietyof modelled edges between places. In the following section,the effectiveness of spatial reasoning with SemRelLoc willbe compared against the basic RelLoc model.
IV. APPLICATION AND EVALUATION
The main goals of the Linked Place model is to providea representation of place location on the LDW that allows
TABLE III. Location expressions defining the place ”Cardiff Ice Rink” inboth the RelLoc and SemRelLoc models
RelLoc Model
Wharf Disused N Cardiff Ice RinkSlipway NE Cardiff Ice RinkBT Data Centre Cardiff Bay E Cardiff Ice RinkWatkiss Way SE Cardiff Ice RinkPlanet Ice Cardiff Arena SW Cardiff Ice RinkWeighbridge W Cardiff Ice RinkCardiff Bay Yacht Club NW Cardiff Ice Rink
SemRelLoc Model
Dingle Road railway station N Cardiff Ice RinkCogan railway station NE Cardiff Ice RinkCopthorne Hotel Cardiff E Cardiff Ice RinkCardiff Athletics Stadium SE Cardiff Ice RinkCardiff Central railway station S Cardiff Ice RinkSt Davids Hotel and Spa SW Cardiff Ice RinkCardiff Bay Barrage W Cardiff Ice Rink
Figure 5. Components of the developed system to implement the linkedplace model.
for place information to be linked effectively and consistently.The effectiveness of the proposed model can be evaluatedwith respect to two main aspects; whether it provides a sounddefinition of place location, that is to test the correctness ofthe place location profiles, and whether it provides a completedefinition of place location, that is whether a complete relativelocation graph can be derived using the individual placelocation profiles.
The soundness of the location profiles is assumed as itessentially relies on the validity of the computation of thespatial relationships. Issues related to the complexity of thisprocess are discussed in the next section.
Here, we evaluate the completeness aspect of the model.An individual place location profile defined using the modelrepresents a finite set of spatial relationships between a placeand its nearest neighbours and direct parent. Completeness ofthe model can be defined as the degree to which these individ-ual profiles can be used to derive implicit links between placesnot defined by the model. The model is entirely complete if afull set of links between places can be derived using automaticspatial reasoning, i.e., the model can produce a complete graph,where there is a defined spatial relationship between everyplace in the dataset and every other place.
A system was developed that implements the Linked Placemodel and further builds an enriched model using spatialreasoning for evaluation purposes as shown in Figure 5.
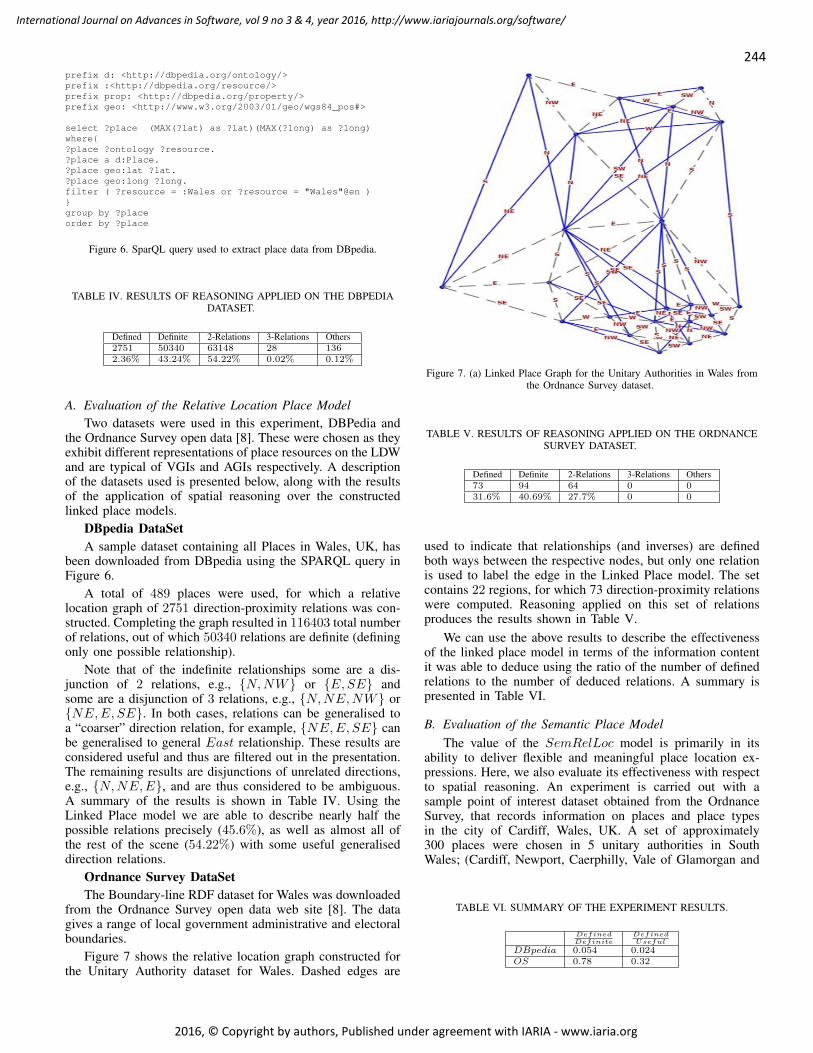
244
International Journal on Advances in Software, vol 9 no 3 & 4, year 2016, http://www.iariajournals.org/software/
2016, © Copyright by authors, Published under agreement with IARIA - www.iaria.org
prefix d: <http://dbpedia.org/ontology/>prefix :<http://dbpedia.org/resource/>prefix prop: <http://dbpedia.org/property/>prefix geo: <http://www.w3.org/2003/01/geo/wgs84_pos#>
select ?place (MAX(?lat) as ?lat)(MAX(?long) as ?long)where?place ?ontology ?resource.?place a d:Place.?place geo:lat ?lat.?place geo:long ?long.filter ( ?resource = :Wales or ?resource = "Wales"@en )group by ?placeorder by ?place
Figure 6. SparQL query used to extract place data from DBpedia.
TABLE IV. RESULTS OF REASONING APPLIED ON THE DBPEDIADATASET.
Defined Definite 2-Relations 3-Relations Others2751 50340 63148 28 1362.36% 43.24% 54.22% 0.02% 0.12%
A. Evaluation of the Relative Location Place ModelTwo datasets were used in this experiment, DBPedia and
the Ordnance Survey open data [8]. These were chosen as theyexhibit different representations of place resources on the LDWand are typical of VGIs and AGIs respectively. A descriptionof the datasets used is presented below, along with the resultsof the application of spatial reasoning over the constructedlinked place models.
DBpedia DataSetA sample dataset containing all Places in Wales, UK, has
been downloaded from DBpedia using the SPARQL query inFigure 6.
A total of 489 places were used, for which a relativelocation graph of 2751 direction-proximity relations was con-structed. Completing the graph resulted in 116403 total numberof relations, out of which 50340 relations are definite (definingonly one possible relationship).
Note that of the indefinite relationships some are a dis-junction of 2 relations, e.g., N,NW or E,SE andsome are a disjunction of 3 relations, e.g., N,NE,NW orNE,E, SE. In both cases, relations can be generalised toa “coarser” direction relation, for example, NE,E, SE canbe generalised to general East relationship. These results areconsidered useful and thus are filtered out in the presentation.The remaining results are disjunctions of unrelated directions,e.g., N,NE,E, and are thus considered to be ambiguous.A summary of the results is shown in Table IV. Using theLinked Place model we are able to describe nearly half thepossible relations precisely (45.6%), as well as almost all ofthe rest of the scene (54.22%) with some useful generaliseddirection relations.
Ordnance Survey DataSetThe Boundary-line RDF dataset for Wales was downloaded
from the Ordnance Survey open data web site [8]. The datagives a range of local government administrative and electoralboundaries.
Figure 7 shows the relative location graph constructed forthe Unitary Authority dataset for Wales. Dashed edges are
Figure 7. (a) Linked Place Graph for the Unitary Authorities in Wales fromthe Ordnance Survey dataset.
TABLE V. RESULTS OF REASONING APPLIED ON THE ORDNANCESURVEY DATASET.
Defined Definite 2-Relations 3-Relations Others73 94 64 0 031.6% 40.69% 27.7% 0 0
used to indicate that relationships (and inverses) are definedboth ways between the respective nodes, but only one relationis used to label the edge in the Linked Place model. The setcontains 22 regions, for which 73 direction-proximity relationswere computed. Reasoning applied on this set of relationsproduces the results shown in Table V.
We can use the above results to describe the effectivenessof the linked place model in terms of the information contentit was able to deduce using the ratio of the number of definedrelations to the number of deduced relations. A summary ispresented in Table VI.
B. Evaluation of the Semantic Place ModelThe value of the SemRelLoc model is primarily in its
ability to deliver flexible and meaningful place location ex-pressions. Here, we also evaluate its effectiveness with respectto spatial reasoning. An experiment is carried out with asample point of interest dataset obtained from the OrdnanceSurvey, that records information on places and place typesin the city of Cardiff, Wales, UK. A set of approximately300 places were chosen in 5 unitary authorities in SouthWales; (Cardiff, Newport, Caerphilly, Vale of Glamorgan and
TABLE VI. SUMMARY OF THE EXPERIMENT RESULTS.
DefinedDefinite
DefinedUseful
DBpedia 0.054 0.024OS 0.78 0.32
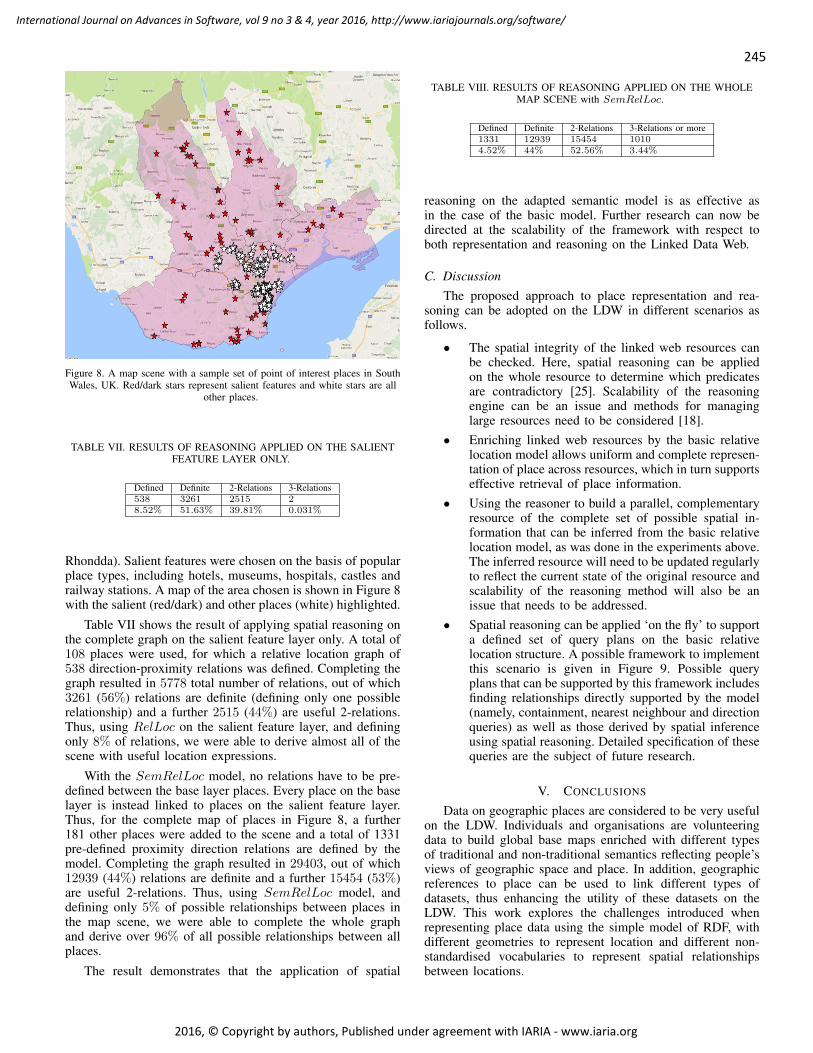
245
International Journal on Advances in Software, vol 9 no 3 & 4, year 2016, http://www.iariajournals.org/software/
2016, © Copyright by authors, Published under agreement with IARIA - www.iaria.org
Figure 8. A map scene with a sample set of point of interest places in SouthWales, UK. Red/dark stars represent salient features and white stars are all
other places.
TABLE VII. RESULTS OF REASONING APPLIED ON THE SALIENTFEATURE LAYER ONLY.
Defined Definite 2-Relations 3-Relations538 3261 2515 28.52% 51.63% 39.81% 0.031%
Rhondda). Salient features were chosen on the basis of popularplace types, including hotels, museums, hospitals, castles andrailway stations. A map of the area chosen is shown in Figure 8with the salient (red/dark) and other places (white) highlighted.
Table VII shows the result of applying spatial reasoning onthe complete graph on the salient feature layer only. A total of108 places were used, for which a relative location graph of538 direction-proximity relations was defined. Completing thegraph resulted in 5778 total number of relations, out of which3261 (56%) relations are definite (defining only one possiblerelationship) and a further 2515 (44%) are useful 2-relations.Thus, using RelLoc on the salient feature layer, and definingonly 8% of relations, we were able to derive almost all of thescene with useful location expressions.
With the SemRelLoc model, no relations have to be pre-defined between the base layer places. Every place on the baselayer is instead linked to places on the salient feature layer.Thus, for the complete map of places in Figure 8, a further181 other places were added to the scene and a total of 1331pre-defined proximity direction relations are defined by themodel. Completing the graph resulted in 29403, out of which12939 (44%) relations are definite and a further 15454 (53%)are useful 2-relations. Thus, using SemRelLoc model, anddefining only 5% of possible relationships between places inthe map scene, we were able to complete the whole graphand derive over 96% of all possible relationships between allplaces.
The result demonstrates that the application of spatial
TABLE VIII. RESULTS OF REASONING APPLIED ON THE WHOLEMAP SCENE with SemRelLoc.
Defined Definite 2-Relations 3-Relations or more1331 12939 15454 10104.52% 44% 52.56% 3.44%
reasoning on the adapted semantic model is as effective asin the case of the basic model. Further research can now bedirected at the scalability of the framework with respect toboth representation and reasoning on the Linked Data Web.
C. DiscussionThe proposed approach to place representation and rea-
soning can be adopted on the LDW in different scenarios asfollows.
• The spatial integrity of the linked web resources canbe checked. Here, spatial reasoning can be appliedon the whole resource to determine which predicatesare contradictory [25]. Scalability of the reasoningengine can be an issue and methods for managinglarge resources need to be considered [18].
• Enriching linked web resources by the basic relativelocation model allows uniform and complete represen-tation of place across resources, which in turn supportseffective retrieval of place information.
• Using the reasoner to build a parallel, complementaryresource of the complete set of possible spatial in-formation that can be inferred from the basic relativelocation model, as was done in the experiments above.The inferred resource will need to be updated regularlyto reflect the current state of the original resource andscalability of the reasoning method will also be anissue that needs to be addressed.
• Spatial reasoning can be applied ‘on the fly’ to supporta defined set of query plans on the basic relativelocation structure. A possible framework to implementthis scenario is given in Figure 9. Possible queryplans that can be supported by this framework includesfinding relationships directly supported by the model(namely, containment, nearest neighbour and directionqueries) as well as those derived by spatial inferenceusing spatial reasoning. Detailed specification of thesequeries are the subject of future research.
V. CONCLUSIONS
Data on geographic places are considered to be very usefulon the LDW. Individuals and organisations are volunteeringdata to build global base maps enriched with different typesof traditional and non-traditional semantics reflecting people’sviews of geographic space and place. In addition, geographicreferences to place can be used to link different types ofdatasets, thus enhancing the utility of these datasets on theLDW. This work explores the challenges introduced whenrepresenting place data using the simple model of RDF, withdifferent geometries to represent location and different non-standardised vocabularies to represent spatial relationshipsbetween locations.

246
International Journal on Advances in Software, vol 9 no 3 & 4, year 2016, http://www.iariajournals.org/software/
2016, © Copyright by authors, Published under agreement with IARIA - www.iaria.org
Figure 9. A framework for the implementation of the proposed approach.
A linked place model is proposed that injects certaintypes of spatial semantics into the RDF graph underlyingthe place data. Specific types of spatial relationships betweenplace nodes are added to the graph to allow the creationof individual place location profiles that fully describe therelative spatial location of a place. It is further shown how theenriched relative location graph can allow spatial reasoning tobe applied to derive implicit spatial links to produce even morericher place descriptions. Salience of place is introduced as ameans of scoping out relevant and meaningful place locationexpressions. The representation scheme is adapted to allow forthe flexible choice of place instances to be used in the model.
The results obtained from the evaluation experimentsdemonstrate possible significant value in the proposed model.Further work need to be done to explore the potential utilityof the proposal. Some of the interesting issues that we aim toexplore in the future are described below.
• Simple methods and assumptions were used to com-pute the direction relationships between places. Fur-ther study need to be carried out to evaluate whethermore involved representations are useful [35].
• Applications of spatial reasoning need to be consid-ered further. Describing the complete graph is not apractical (nor a useful) option. Can spatial reasoningbe selectively applied, for example, as part of queryprocessing on the location graph?
• The application of the approach on other types of datasets on the LDW as individual as well as combinedresources.
APPENDIX
Follows is a sample set of relationships defining the loca-tion of ”Techniquest”: an educational charity in The CardiffBay area, Wales, UK, resulting from the application of spatialreasoning on the salient features in the map in Figure 8.
(Techniquest (sw) Bastion_Road)
(Techniquest (sw) Barry_Power_Station)(Techniquest (sw) Barry_Docks_railway_station)(Techniquest (sw) Barry_Island_railway_station)(Techniquest (sw) Barry_Dock_Lifeboat_Station)(Techniquest (sw w) Cowbridge_railway_station)(Techniquest (sw w) Llantwit_Major_Roman_Villa)(Techniquest (sw) Barry_railway_station)(Techniquest (sw w) Aberthaw_power_stations)(Techniquest (sw w) Aberthaw_High_Level_railway_station)(Techniquest (sw w) Aberthaw_Low_Level_railway_station)(Techniquest (ne) Celtic_Manor_Resort)(Techniquest (ne) Kingsway_Shopping_Centre)(Techniquest (ne) Allt-yr-yn)(Techniquest (ne) Caerleon_railway_station)(Techniquest (n nw) Caerphilly_Castle)(Techniquest (n nw) Argoed_railway_station)(Techniquest (n nw) Brithdir_railway_station)(Techniquest (n nw) Aberbargoed_Hospital)(Techniquest (n nw) Aber_Bargoed_railway_station)(Techniquest (n ne) Crosskeys_railway_station)(Techniquest (sw w) Atlantic_College_Lifeboat_Station)(Techniquest (nw) Coed_Ely_railway_station)(Techniquest (n nw) Bargoed_railway_station)(Techniquest (n nw) Cefn_Eglwysilan)(Techniquest (nw) Church_Village)(Techniquest (nw) Church_Village_Halt_railway_station)(Techniquest (nw) Sardis_Road)(Techniquest (nw) Cross_Inn_railway_station)(Techniquest (nw) Aberdare_Low_Level_railway_station)(Techniquest (nw) Aberdare_railway_station)(Techniquest (nw) Coed-Ely)(Techniquest (n nw) Cilfynydd)(Techniquest (n nw) Abercynon_railway_station)(Techniquest (n nw) Abertysswg_railway_station)(Techniquest (n nw) Darran_and_Deri_railway_station)(Techniquest (nw) Dinas_Rhondda_railway_station)(Techniquest (n nw) Abercynon_North_railway_station)(Techniquest (n nw) Bute_Town)(Techniquest (nw) Mynydd_William_Meyrick)(Techniquest (nw) Clydach_Vale)(Techniquest (nw) Lluest-wen_Reservoir)(Techniquest (n nw) Abercwmboi_Halt_railway_station)(Techniquest (n nw) Abernant_railway_station)(Techniquest (nw) Athletic_Ground_Aberdare)(Techniquest (nw) Aberaman_railway_station)(Techniquest (n nw) Cwmbach_railway_station)(Techniquest (nw) Beddau_Halt_railway_station)(Techniquest (n) Abercarn_railway_station)(Techniquest (s) Alberta_Place_Halt_railway_station)(Techniquest (w) St_Fagans_National_History_Museum)(Techniquest (sw) Dinas_Powys_railway_station)(Techniquest (e) Pierhead_Building)(Techniquest (e) Mermaid_Quay)(Techniquest (n nw) Caerphilly_railway_station)(Techniquest (n ne) Ruperra_Castle)(Techniquest (n nw) Birchgrove_railway_station)(Techniquest (n nw) National_Museum_Cardiff)(Techniquest (ne) Bassaleg_Junction_railway_station)(Techniquest (ne) RAF_Pengam_Moors)(Techniquest (n) Childrens_Hospital_for_Wales)(Techniquest (w) Aberthin_Platform_railway_station)(Techniquest (n nw) Abertridwr_railway_station)(Techniquest (n) Cefn_Onn_Halt_railway_station)(Techniquest (nw) Creigiau_railway_station)(Techniquest (nw) Efail_Isaf_railway_station)(Techniquest (n nw) Aber_railway_station)(Techniquest (nw) Castell_Coch)(Techniquest (nw) Whitchurch_Hospital)(Techniquest (n nw) Hilton_Cardiff)(Techniquest (w) St_Fagans_Castle)(Techniquest (sw) Eastbrook_railway_station)(Techniquest (w) Cardiff_International_Sports_Stadium)(Techniquest (s) Cardiff_Bay_Barrage)(Techniquest (sw w) Dyffryn_Gardens)(Techniquest (n) University_Hospital_of_Wales)
REFERENCES
[1] A. Abdelmoty and K. Al-Muzaini, “Reasoning with place informationon the linked data web,” in The Second International Conference onBig Data, Small Data, Linked Data and Open Data- ALLDATA 2016,V. Gudivada, D. Roman, M. di Buono, and M. Monteleone, Eds., 2016,pp. 48–53.

247
International Journal on Advances in Software, vol 9 no 3 & 4, year 2016, http://www.iariajournals.org/software/
2016, © Copyright by authors, Published under agreement with IARIA - www.iaria.org
[2] T. Berners-Lee. Linked data. http://www.w3.org/DesignIssues/LinkedData.html. Accessed: 2016-11-30.
[3] C. Bizer, T. Heath, and T. Berners-Lee, “Linked data - the story sofar,” International Journal on Semantic Web and Information Systems,vol. 5, no. 3, pp. 1–22, 2009.
[4] J. Goodwin, C. Dolbear, and G. Hart, “Geographical linked data:The administrative geography of great britain on the semantic web,”Transactions in GIS, vol. 12, pp. 19–30, 2008.
[5] G. Hart and C. Dolbear, Linked Data: A Geographic Perspective. CRCBooks, 2013.
[6] C. Henden, P. Rissen, and S. Angeletou. Linked geospatial data, andthe bbc. http://www.w3.org/2014/03/lgd/papers/lgd14 submission 28.Accessed: 2016-11-30.
[7] M. Hackley, “How good is volunteered geographical information? acomparative study of openstreetmap and ordnance survey datasets,”Environment and Planning B, vol. 37, no. 4, pp. 682–703, 2010.
[8] Ordnance survey linked data platform. http://data.ordnancesurvey.co.uk/. Accessed: 2016-11-30.
[9] Geolinkeddata.es. http://linkeddata.es/. Accessed: 2016-11-30.
[10] S. Mohamed and A. Abdelmoty, “Uncovering user profiles in locationbased social networks,” in The Eighth International Conference onAdvanced Geographic Information Systems, GEOProcessing 2016, C.-P. Rckemann and Y. Doytsher, Eds., 2016, p. 1421.
[11] E. Younis, “Hybrid geo-spatial query processing on the semantic web,”Ph.D. dissertation, Cardiff University, Cardiff Univeristy, 2013.
[12] E. M. Younis, C. Jones, V. Tanasescu, and A. Abdelmoty, “Hybrid geo-query methods on the semantic web with a spatially enhanced index ofdbpedia,” in 7th International Conference on Geographic InformationScience, GIScience, 2012, N. Xiao, M.-P. Kwan, M. Goodchild, andS. Shekhar, Eds., vol. LNCS 7478, 2012, pp. 340–353.
[13] S. Auer, J. Lehmann, and S. Hellmann, “Linkedgeodata- adding a spatialdimension to the web of data,” in Proc. of 7th International SemanticWeb Conference (ISWC), vol. LNCS 5823. Springer, 2009, pp. 731–746.
[14] C. Stadler, J. Lehmann, K. Hffner, and S. Auer, “Linkedgeodata: A corefor a web of spatial open data,” Semantic Web Journal, vol. 3, no. 4,pp. 333–354, 2012.
[15] J. Salas and A. Harth, “Finding spatial equivalences accross multiple rdfdatasets,” in Terra Cognita Workshop,co-located with ISWC, R. Grtter,D. Kolas, M. Koubarakis, and D. Pfoser, Eds., 2011, pp. 114–126.
[16] A. Cohn, B. Bennett, J. Gooday, and N. Gotts, “Qualitative spatialrepresentation and reasoning with the region connection calculus,”Geoinformatica, vol. 1, pp. 1–44, 1997.
[17] Geosparql - a geographic query language for rdf data. http://www.opengeospatial.org/standards/geosparql. Accessed: 2016-11-30.
[18] M. Koubarakis, M. Karpathiotakis, K. Kyzirakos, C. Nikolaou, andM. Sioutis, “Data Models and Query Languages for Linked GeospatialData,” in Reasoning Web. Semantic Technologies for Advanced QueryAnswering,Invited tutorial at the 8th Reasoning Web Summer School2012 (RW 2012), T. Eiter and T. Krennwallner, Eds., vol. LNCS 7487.Springer, 2012, pp. 290–328.
[19] A. G. Cohn and J. Renz, Qualitative Spatial Representation andReasoning, ser. Handbook of Knowledge Representation. Elsevier,2008, pp. 551–596.
[20] B. Gottfried, “Reasoning about intervals in two dimensions,” in IEEEInt. Conf. on Systems, Man and Cybernetics, W. e. a. Thissen, Ed.,2004, pp. 5324–5332.
[21] What is racerpro. http://www1.racer-systems.com/products/racerpro/index.phtml. Accessed: 2016-11-30.
[22] M. Stocker and E. Sirin, “Pelletspatial: A hybrid rcc-8 and rdf/owlreasoning and query engine,” in 6th Intern. Workshop on OWL: Ex-periences and Directions (OWLED2009). Springer-Verlag, 2009, pp.2–31.
[23] M. Sioutis, S. Li, and J.-F. Condotta, “On redundancy in linkedgeospatial data,” in 2nd Workshop on Linked Data Quality (LDQ),ser. CEUR Workshop Proceedings, A. Rula, A. Zaveri, M. Knuth,and D. Kontokostas, Eds., no. 1376, 2015. [Online]. Available:http://ceur-ws.org/Vol-1376/#paper-05
[24] C. Nikolaou and M. Koubarakis, “Fast consistency checking of verylarge real-world rcc-8 constraint networks using graph partitioning,”in Proceedings of the 28th AAAI Conference on Artificial Intelligence,2014, pp. 2724–2730.
[25] A. Abdelmoty, P. Smart, and B. El-Geresy, “Spatial reasoning with placeinformation on the semantic web,” International Journal on ArtificialIntelligence Tools, vol. 23, no. 5, p. 1450011, 2014.
[26] E. Younis, C. Jones, V. Tanasescu, and A. Abdelmoty, “Hybrid geo-spatial query methods on the semantic web with a spatially-enhancedindex of dbpedia,” in Geographic Information Science, ser. LectureNotes in Computer Science, N. Xiao, M.-P. Kwan, M. Goodchild, andS. Shekhar, Eds., vol. 7478. Springer Berlin Heidelberg, 2012, pp.340–353.
[27] D. Wolter and J. Wallgrn, “Qualitative spatial reasoning for applications:New challenges and the sparq toolbox,” in Qualitative Spatio-TemporalRepresentation and Reasoning: Trends and Future Directions, S. Haz-arika, Ed., 2012, pp. 336–362.
[28] G. Kyle, A. Graefe, and M. R., “Testing the dimensionality of placeattachment in recreational settings,” Environment and Behavior, vol. 37,no. 2, pp. 153–177, 2005.
[29] G. Brown and C. Raymond, “The relationship between place attach-ment and landscape values toward mapping place attachment,” AppliedGeography, vol. 27, no. 1, pp. 89–111, 2007.
[30] G. Kyle, K. Bricker, A. Graefe, and T. Wickham, “An examinationof recreationists relationships with activities and settings.” LeisureSciences, vol. 26, no. 2, pp. 123–142, 2004.
[31] B. Jorgensen and R. Stedman, “Sense of place as an attitude: Lakeshoreowners attitudes toward their properties.” Journal of EnvironmentalPsychology, vol. 21, pp. 233–248, 2001.
[32] H. Gu and C. Ryan, “Place attachment, identity and community impactsof tourism the case of a beijing hutong.” Tourism Management, vol. 29,no. 4, pp. 637–647, 2008.
[33] M. Hall, P. Smart, and C. Jones, “Interpreting spatial language in imagecaptions,” Cognitive Processing, vol. 12, no. 1, pp. 67–94, 2011.
[34] M. Hall, “Modelling and reasoning with quantitative representations ofvague spatial language used in photographic image captions,” Ph.D.dissertation, Cardiff University, Cardiff Univeristy, 2011.
[35] X. Yao and J.-C. Thill, “How far is too far? a statistical approach tocontext-contingent proximity modeling,” Transactions in GIS, vol. 9,no. 2, pp. 157–178, 2005.
248
International Journal on Advances in Software, vol 9 no 3 & 4, year 2016, http://www.iariajournals.org/software/
2016, © Copyright by authors, Published under agreement with IARIA - www.iaria.org
A Model-Driven Engineering Approach to Software Tool Interoperability based on
Linked Data
Jad El-khoury, Didem Gurdur
Department of Machine Design
KTH Royal Institute of Technology
Stockholm, Sweden
email:jad, [email protected]
Mattias Nyberg
Scania CV AB
Södertälje, Sweden
email: [email protected]
Abstract—Product development environments need to shift
from the current document-based, towards an information-
based focus, in which the information from the various
engineering software tools is well integrated and made digitally
accessible throughout the development lifecycle. To meet this
need, a Linked Data approach to software tool interoperability
is being adopted, specifically through the Open Services for
Lifecycle Collaboration (OSLC) interoperability standard. In
this paper, we present a model-driven engineering approach to
toolchain development that targets the specific challenges faced
when adopting the technologies, standards and paradigm
expected of Linked Data and the OSLC standard. We propose
an integrated set of modelling views that supports the early
specification phases of toolchain development, as well as its
detailed design and implementation phases. An open-source
modelling tool was developed to realize the proposed modelling
views. The tool includes a code generator that synthesizes a
toolchain model into almost-complete OSLC-compliant code.
The study is based on a case study of developing a federated
OSLC-based toolchain for the development environment at the
truck manufacturer Scania AB.
Keywords-Linked data modelling; OSLC; resource shapes;
tool integration; tool interoperability, information modelling.
I. INTRODUCTION
This article is an extended version of [1], in which we expand the earlier focus on the specification phase, to present a more complete development approach to software tool interoperability. The new approach includes a tighter incorporation of the later phases of design and implementation of tool interfaces. Based on additional work on the case study, further refinements of the proposed models and supporting tools are also reflected in this article.
The heterogeneity and complexity of modern industrial products requires the use of many engineering software tools, needed by the different engineering disciplines (such as mechanical, electrical, embedded systems and software engineering), and throughout the entire development life cycle (requirements analysis, design, verification and validation, etc.). Each engineering tool handles product information that focuses on specific aspects of the product, yet such information may well be related or dependent on information handled by other tools in the development environment [2]. It is also the case that a tool normally manages its product information internally as artefacts stored
on a file system or a database using a tool-specific format or schema. Therefore, unless interoperability mechanisms are developed to connect information across the engineering tools, isolated “islands of information” may result within the overall development environment. This in turn leads to an increased risk of inconsistencies, given the natural distribution of information across the many tools and data sources involved.
As an example from the automotive industry, the functional safety standard ISO 26262:2011 [3] mandates that requirements and design components are to be developed at several levels of abstraction; and that clear trace links exist between requirements from the different levels, as well as between requirements and system components. Such a demand on traceability implies that these development artifacts are readily and consistently accessible, even if they reside across different development tools. Naturally, the current industry practice, in which development artefacts are handled as text-based documentation, renders such traceability ineffective – if not impossible. The ongoing trend of adopting the Model-Driven Engineering (MDE) approach to product development is a step in the right direction, by moving away from text-based artefacts, towards models that are digitally accessible. This leads to an improvement in the quality and efficient access to product and process information. However, while MDE is more accepted in the academic research community, its complete adoption in an industrial context remains somewhat limited, where MDE is typically constrained to a subset of the development lifecycle [22]. Moreover, even where MDE is adopted, mechanisms are still needed to connect the artefacts being created by the various engineering tools, in order to comply with the standard.
In summary, current development practices need a faster shift from the localized document-based handling of artefacts, towards an Information-based Development Environment (IDE), where the information from all development artefacts is made accessible, consistent and correct throughout the development phases, disciplines and tools.
One can avoid the need to integrate the information islands, by adopting a single platform (such as PTC Integrity [4] or MSR-Backbone [5]) through which product data is centrally managed. However, large organizations have specific development needs and approaches (processes,

249
International Journal on Advances in Software, vol 9 no 3 & 4, year 2016, http://www.iariajournals.org/software/
2016, © Copyright by authors, Published under agreement with IARIA - www.iaria.org
tools, workflow, in-house tools, etc.), which lead to a wide landscape of organization-specific and customized development environments. Moreover, this landscape needs to evolve organically over time, in order to adjust to future unpredictable needs of the industry. Contemporary platforms, however, offer limited customization capabilities to tailor for the organization-specific needs, requiring instead the organization to adjust itself to suite the platform. So, while they might be suitable at a smaller scale, such centralized platforms cannot scale to handle the complete heterogeneous set of data sources normally found in a large organization.
A more promising integration approach is to acknowledge the existence of distributed and independent data sources within the environment. To this end, OASIS OSLC [6] is an emerging interoperability open standard (see Section II for further details) that adopts the architecture of the Internet and its standard web technologies to integrate information from the different engineering tools - without relying on a centralized integration platform. This leads to low coupling between tools, by reducing the need for one tool to understand the deep data of another. Moreover – like the web – the approach is technology-agnostic, where tools can differ in the technologies they use to internally handle their data. That is, both the data as well as the technology is decentralized. Such an approach lends itself well to the distributed and organic nature of the IDE being desired - a Federated IDE (F-IDE), where the information from all development artefacts – across the different engineering tools – is made accessible, consistent and correct throughout the development phases, disciplines and tools.
In this paper, we advocate the use of OSLC and the Linked Data principles as a basis for such an F-IDE. Yet, when developing such a federated OSLC-based F-IDE for parts of the development environment at the truck manufacturer Scania AB, certain challenges were encountered that needed to be addressed. Put generally, there is an increased risk that one loses control over the overall product data structure that is now distributed and interrelated across the many tools. This risk is particularly aggravated if one needs to maintain changes in the F-IDE over time.
We here propose a model-driven engineering approach to F-IDE development that tries to deal with this risk. That is, how can a distributed architecture – as promoted by the Linked Data approach – be realized, while maintaining a somewhat centralized understanding and management of the overall information model handled within the F-IDE?
In the next section, we will first give some background information on Linked Data and the OASIS OSLC standard. We then present the case study that has driven and validated this work in Section III. Section IV then elaborates on the challenges experienced during our case study, before detailing the modelling approach taken to solve these challenges in Section V. Details on the modelling views, as well as their realisation in an open-source tool, are presented. Reflections on applying the modelling approach on the case study are then discussed in Section VI, followed by a discussion of related work. The article is then concluded in Section VIII.
II. LINKED DATA AND THE OASIS OSLC STANDARD
Linked Data is an approach for publishing structured data on the web, such that data from different sources can be connected, resulting in more meaningful and useful information. Linked Data builds upon standard web technologies such as HTTP, URI and the RDF family of standards. The reader is referred to [7] for Tim Berners-Lee's four principles of Linked Data.
OASIS OSLC is a standard that targets the integration of heterogeneous software tools, with a focus on the linking of data from independent sources. It builds upon the Linked Data principles, and its accompanying standards, by defining common mechanisms and patterns to access, manipulate and query resources managed by the different tools in the toolchain. In particular, OASIS OSLC is based on the W3C Linked Data Platform (LDP) [8], and it follows the Representational State Transfer (REST) architectural pattern.
This Linked Data approach to tool interoperability promotes a distributed architecture, in which each tool autonomously manages its own product data, while providing – at its interface - RESTful services through which other tools can interconnect. Figure 1 illustrates a typical architecture of an OSLC tool interface, and its relation to the tool it is interfacing. With data exposed as RESTful services, such an interface is necessarily an “OSLC Server”, with the connecting tool defined as an “OSLC Client”. Following the REST architectural pattern, an OSLC server allows for the manipulation of artefacts – once accessed through the services - using the standard HTTP methods C.R.U.D. to Create, Read, Update and Delete. In OSLC, tool artefacts are represented as RDF resources, which can be represented using RDF/XML, JSON, or Turtle. A tool interface can be provided natively by the tool vendor, or through a third-party as an additional adaptor. In either case, a mapping between the internal data and the exposed RDF resources needs to be done. Such mapping needs to deal with the differences in the technologies used. In addition, a mapping between the internal and external vocabulary is needed, since the vocabulary of the resources being exposed is not necessarily the same as the internal schema used to manage the data.
OSLC
Server
Mapping Tool
Instance
Resources & services
OSLC
Technological
Space
Tool
Technological
Space
Change Request Foaf:Person
bug1
Bug2
AssignedTo
Figure 1. Typical tool architecture, with an OSLC Server

250
International Journal on Advances in Software, vol 9 no 3 & 4, year 2016, http://www.iariajournals.org/software/
2016, © Copyright by authors, Published under agreement with IARIA - www.iaria.org
III. CASE STUDY DESCRIPTION
Typical of many industrial organizations, the development environment at the truck manufacturer Scania consists of standard engineering tools, such as issue-tracking and computer-aided design (CAD) tools; as well as a range of proprietary tools that cater for specific needs in the organization. Moreover, much product information is managed as generic content in office productivity tools, such as Microsoft Word and Excel.
To comply with the ISO 26262 standard, the current development environment needs to improve in its management of vehicle architectures and requirement specifications, in order to provide the expected traceability between them. This in turn necessitates a better integration of the tools handling the architecture and requirements artefacts to allow for such traceability. To this end, five proprietary tools and data sources were to be integrated using OSLC:
1. Code Repository – A tool that defines the vehicle software architecture through parsers that analyze all software code to reconstruct the architecture, defining entities such as software components and their communication channels [9]. The analyzed software code resides in a typical version-control system. When defining the architecture, the tool references artefacts – defined in other external tools - dealing with communication and the hardware architecture.
2. Communication Specifier – A tool that centrally defines the communication network and the messages sent between components of all vehicle architectures.
3. ModArc – A CAD tool that defines the electrical components, including all hardware entities and their interfaces such as communication ports.
4. Diagnostics Tool - A tool that specifies the diagnostics functionality of all vehicle architectures, including communication messages of relevance to the diagnostics functionality.
5. Requirements Specifier - A proprietary tool that allows for the semi-formal specification of system requirements [10]. Requirements are specified at different levels of abstraction. By anchoring the specifications on different parts of the system architecture, the tool helps the developer define correct requirements that can only reference appropriate product artefacts within the system architecture.
As a first step, it was necessary to analyze the data that needed to be communicated between the tools. This was captured using a Class Diagram (Figure 2), as is the current state-of-practice at Scania for specifying a data model. For the purpose of this paper, it is not necessary to have full understanding of the data artefacts. It is worth highlighting that color-codes were initially used to define which tool managed which data artefact. Yet, this appeared to be a non-trivial task since an artefact might be used in multiple tools, with no clear agreement on the originating source tool. For example, a Signal can be found in both the Code Repository as well as the Communication Specifier tool. Given that there exists no data integration between the two tools to keep the artefact synchronized, different developers may have a different perspective over which of the two tools holds the
source and correct Signal information, from which the other tool needs to be – manually – updated.
In addition, it is important to note that the model focuses on the data to be communicated between the tools, and not necessarily all data available internally within each tool.
IV. IDENTIFIED NEEDS AND SHORTCOMINGS
In this paper, we focus on the initial development stages of specifying and architecting the desired OSLC-based F-IDE, as well as its design and implementation. The latter verification and validation phases are not yet covered in the case study, yet there is naturally recognition of the need to support them in the near future. Based on the case study, we here elaborate on the needs and shortcomings experienced by the toolchain architects and developers during these stages:
Information specification – There is a need to specify an information model that defines the types of artefacts or resources to be communicated between the tools across the toolchain. For pragmatic reasons, a UML class diagram was initially adopted by the Scania toolchain architects to define the entities being communicated and their relationships. Clearly, the created model does not comply with the semantics of the class diagram, since the entities being modelled are not objects in the object-oriented paradigm, but resources according to the Resource Description Framework (RDF) graph data model. Since the information model is to be maintained over time, and is intended for communication among developers, using a class diagram - while implying another set of semantics – may lead to misunderstandings. A specification that is semantically compatible with the intended implementation technology (of Linked Data, and specifically the OSLC standard) is necessary. However, the initial experience from using the class diagram helped identify the necessary requirements on any appropriate solution. First, graphical models are essential to facilitate the communication of the models among the different stakeholders. It is also beneficial to – wherever possible - borrow or reuse graphical representations from common modelling frameworks (such as UML) in order to reduce the threshold of learning a new specification language. For example, adopting a hollow triangle shape to represent class inheritance (as defined in UML) would be recommended in RDF modelling as well.
Domain ownership – It is necessary to structure the information model specification into domains (such as requirements engineering, software, testing, etc.). Domains can be generic in nature. Alternatively, such domain grouping can reflect the organization units that are responsible to manage specific parts of the information model. For example, the testing department may be responsible to define and maintain the testing-related resources, while the requirements department manages the definition of the requirements resources. This is particularly relevant in an organization where different departments are responsible for their own tools and processes, and where it no longer becomes feasible to expect the information model to be centrally defined. Dependencies between the responsible departments can then be easily identified through the dependencies in the information models.

251
International Journal on Advances in Software, vol 9 no 3 & 4, year 2016, http://www.iariajournals.org/software/
2016, © Copyright by authors, Published under agreement with IARIA - www.iaria.org
message
name: String
priority: String
sourceAddress : String
destinationAddress : String
period : String
timeout : String
message_type : String
signal
name: String
bit_start : int
bit_length : int
offset : String
factor: String
communication interface
id : int
segment: String
ECUSoftware
family : String
generation : String
version : String ? Nullable
releaseDate: String
changeRequests: ChangeRequest[]
SoftwareComponent
name: String
description: String
hierarchy: String
RtdbVariable
name: String
description: String
dataType: String
unit: String
io_port
name : String
type : String
pin_type : String
direction : String
CalibrationParameter
name: String
dataType: String
diagnostic communication interface
type : String
Common ID
ID: String
session: String
isOperationalData: Bool
isFreezeFrame: Bool
range
min
max
step
KeyValuePair
name: String
description: String
value: Number
has_signal 0...*
is_gatewayed 0...*
has_message 0...*
has_interface 1...*
hasSubcomponent
hasSoftwareComponent 1...*
owns
owns 0...*
associates_with 0...*has_io_port 1...*
associates_with 0...1
uses_port
Reads/Owns 0..*
Reads/Owns 0..*
has_interface 1...*
has_CID 0...*
associates_with 0...*
allowedRange 0...*
allowedValues 0...*
allowedValues 0...*
Figure 2. A UML class diagram of the resources shared in the desired F-IDE.
Tool ownership – Orthogonal to domain ownership, it is also necessary to clearly identify the data source (or authoring tool) that is expected to manage each defined resource being shared in the F-IDE. That is, while representations of a resource may be freely shared between the tools, changes or creations of such a resource can only occur via its owning tool. Assuming a Linked Data approach also implies that a resource is owned by a single source, to which other resources link. In practice, it is not uncommon for data to be duplicated in multiple sources, and hence mechanisms to synchronize data between tools are needed. For example, resources of type Communication Interface may be used in both Communication Specifier and ModArc, with no explicit decision on which of the tools defines it. To simplify the case study, we chose to ignore the ModArc source, but in reality, one needs to synchronize between the two sources, as long as it is not possible to make one of them redundant.
That is, in architecting an F-IDE, there is a need to support the data specification using Linked Data semantics, while covering the two ownership aspects of tools (ownership from the tool deployment perspective) and domains (ownership from the organizational perspective).
Avoid mega-meta-modelling – Information specifications originate from various development phases and/or development units in the organization. The resulting information models may well overlap, and would hence need to be harmonized. Hence, there is a need to harmonize the information models – while avoiding a central information model. Earlier attempts at information modeling normally resulted in large models that can easily become harder to maintain over time. The research project CESAR presents in [11] a typical interoperability approach in which such a large common meta-model is proposed. It is anticipated that the Linked Data approach would reduce the need to have such a single centralized mega information model. The correct handling of information through Domain and Tool Ownership (see above) ought to also help in that direction.
Development support – Similar to the challenge faced in general software development, there is a need to maintain the information specification and desired architecture harmonious with the eventual design and implementation of the F-IDE and its components. The current use of a class diagram works well as an initial specification, and for documentation purposes. However, there is no mechanism in place to ensure the model is updated relative to changes later performed during the development. Especially when

252
International Journal on Advances in Software, vol 9 no 3 & 4, year 2016, http://www.iariajournals.org/software/
2016, © Copyright by authors, Published under agreement with IARIA - www.iaria.org
adopting an agile development approach, the specification and architecture are expected to change over time, and hence the implementations of individual adaptors need to capture such eventual changes. Likewise, feedback from the design and implementation phases may lead to necessary changes in the specification and architecture.
Appropriate tool support is needed to make the specification models an integral part of development. This can take the form of a Software Development Kit (SDK), code generators, graphical models, analysis tools, etc. Such tool support should also help lower the threshold of learning as well as adopting OSLC, since implementing OSLC-compliant tools entails competence in a number of additional technologies such as RESTful web services and the family of RDF standards.
V. MODELLING SUPPORT
We take an MDE approach to F-IDE development, in which we define a graphical modelling language that supports the toolchain architects and developers with the needs identified in the previous section.
The language is designed to act as a digital representation of the OASIS OSLC standard. This ensures that any defined toolchain complies with the standard. Such a graphical representation also helps lower the threshold of learning as well as implementing OSLC-compliant toolchains.
The language is structured into a set of views, in which each view focuses on a specific need, stakeholder and or aspect of development. The analysis of the needs from Section IV leads to the following three views:
• Domain Specification View – for the specification of the information to be shared across the F-IDE, with support for the organizational needs.
• Resource Allocation View – for the specification of information distribution and ownership across the F-IDE architecture.
• Adaptor Design View – for the detailed design and implementation of the tool interfaces of the F-IDE.
The next subsection presents further details of the OSLC standard, which then leads to its reflection by the proposed meta-model. Based on this OSLC meta-model, three views are then derived in Section V.B. The proposed graphical notation of each view is presented through examples from the use case of Section III. Finally, Section V.C details the open-source modelling tool developed to realize the proposed approach.
A. The Meta-model
The OASIS OSLC standard consists of a Core Specification and a set of Domain Specifications. The OSLC Core Specification [12] defines the set of resource services that can be offered by a tool. Figure 3 illustrates the structure of an OSLC interface and its services. A Service Provider is the central organizing entity of a tool, under which artefacts are managed. Typical examples of a Service Provider are project, module, product, etc. It is within the context of such an organizing concept that artefacts are managed (created, navigated, changed, etc.). For a given Service Provider, OSLC allows for the definition of two Services (Creation
Factory & Query Capability) that provide other tools with the possibility to create and query artefacts respectively. In addition, OSLC defines Delegated UI (Selection and Creation) services that allow other tools to delegate the user interaction with an external artefact to the Service Provider under which the artefact is managed. The structure of Figure 3 allows for the discoverability of the services provided by each Service Provider, starting with a Service Provider Catalog, which acts as a catalog listing all available Service Providers exposed by a tool.
OASIS OSLC also defines Domain Specifications, which include domain vocabularies (or information models) for specific lifecycle domains. For example, the Quality Management Specification [13] defines resources and properties related to the verification phase of development such as test plans, test cases, and test results. The standardized Domain Specifications are minimalistic, focusing on the most common concepts within a particular domain, while allowing different implementations to extend this common basis.
Figure 3. OSLC Core Specification concepts and relationships [12]
Using EMF [18], we define the meta-model that reflects the structure and concepts of the OASIS OSLC standard, as illustrated in Figure 4. A Toolchain consists of (1) a set of AdaptorInterfaces and (2) a set of DomainSpecifications (for legacy reasons grouped under a Specification element):
• An AdaptorInterface represents a tool’s OSLC interface, and reflects the Core standard structure as illustrated in Figure 3.
• A DomainSpecification reflects how an OSLC Domain Specification defines vocabularies. It models the resources types, their properties and relationships, based on the Linked Data constraint language of Resource Shapes [14]. Resource Shapes is a mechanism to define the constraints on RDF resources, whereby a Resource Shape defines the properties that are allowed and/or required of a type of resource; as well as each property’s cardinality, range, etc.
B. The Modelling Views
Based on the OSLC meta-model, we define the following three views:

253
International Journal on Advances in Software, vol 9 no 3 & 4, year 2016, http://www.iariajournals.org/software/
2016, © Copyright by authors, Published under agreement with IARIA - www.iaria.org
Figure 4. The underlying meta-model of the OASIS OSLC standard, reflecting the Core and Domain Specifications.
Domain Specification View From this perspective, the toolchain architect defines an information model that details the types of resources, their properties and relationships, using mechanisms compliant with the OSLC Core Specification [12] and the Resource Shape constraint language [14]. Figure 5 exemplifies the proposed graphical notation of the Domain Specification view for the resources needed in our case study.
The top-level container, DomainSpecification, groups related Resources and Resource Properties. Such grouping can be associated with a common topic (such as requirements or test management), or reflects the structure of the organization managing the F-IDE. This view ought to support standard specifications, such as Friend of a Friend (FOAF) [15] and RDF Schema (RDFS) [16], as well as proprietary ones. In Figure 5, three Domain Specifications are defined: Software, Communication and Variability, together with a subset of the standard domains of Dublin Core and RDF.
As required by the OSLC Core, a specification of a Resource type must provide a name and a Type URI. The Resource type can then also be associated with its allowed and/or required properties. These properties could belong to the same or any other DomainSpecification. A Resource Property is in turn defined by specifying its cardinality, optionality, value-type, allowed-values, etc. Figure 6
illustrates an example property specification highlighting the available constraints that can be defined. A Literal Property is one whose value-type is set to one of the predefined literal types (such as string or integer); while a Reference Property is one whose value-type is set to either “resource” or “local resource”. In the latter case, the range property can then be used to suggest the set of resource types the Property can refer to.
In RDF, Resource Properties are defined independently, and may well be associated with multiple Resource types (Unlike, for example UML Classes, where a class attribute is defined within the context of a single class). For this reason, Resource Properties are graphically represented as first-class elements in the diagram. So, borrowing from the typical notation used to represent RDF graphs, Resource types are represented as ellipses, while Properties are represented as rectangles (A Reference Property is represented with an ellipse within the rectangle.).
The association between a Resource type and its corresponding Properties is represented by arrows for Reference Properties, while Literal Properties are listed graphically within the Resource ellipse. Such a representation renders the diagram almost similar – visually - to the UML class diagram of Figure 2. This makes the diagram intuitive and familiar for the modeler, yet with the more appropriate Linked Data semantics behind the view.
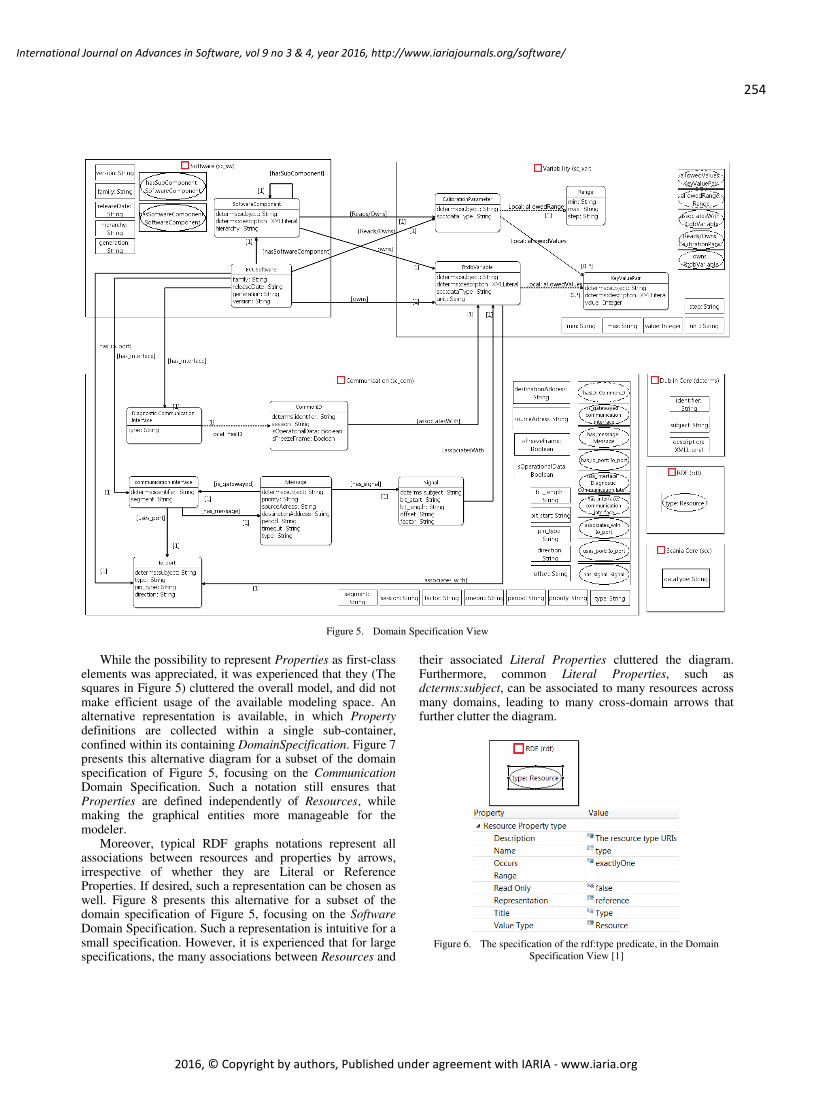
254
International Journal on Advances in Software, vol 9 no 3 & 4, year 2016, http://www.iariajournals.org/software/
2016, © Copyright by authors, Published under agreement with IARIA - www.iaria.org
Figure 5. Domain Specification View
While the possibility to represent Properties as first-class elements was appreciated, it was experienced that they (The squares in Figure 5) cluttered the overall model, and did not make efficient usage of the available modeling space. An alternative representation is available, in which Property definitions are collected within a single sub-container, confined within its containing DomainSpecification. Figure 7 presents this alternative diagram for a subset of the domain specification of Figure 5, focusing on the Communication Domain Specification. Such a notation still ensures that Properties are defined independently of Resources, while making the graphical entities more manageable for the modeler.
Moreover, typical RDF graphs notations represent all associations between resources and properties by arrows, irrespective of whether they are Literal or Reference Properties. If desired, such a representation can be chosen as well. Figure 8 presents this alternative for a subset of the domain specification of Figure 5, focusing on the Software Domain Specification. Such a representation is intuitive for a small specification. However, it is experienced that for large specifications, the many associations between Resources and
their associated Literal Properties cluttered the diagram. Furthermore, common Literal Properties, such as dcterms:subject, can be associated to many resources across many domains, leading to many cross-domain arrows that further clutter the diagram.
Figure 6. The specification of the rdf:type predicate, in the Domain
Specification View [1]

255
International Journal on Advances in Software, vol 9 no 3 & 4, year 2016, http://www.iariajournals.org/software/
2016, © Copyright by authors, Published under agreement with IARIA - www.iaria.org
Figure 7. An alternative Domain Specification View, with Property definitions collected within a single sub-container.
The three alternative representations of Resource Properties and their associations with Resources are made available through filtering mechanisms to suite the preferences of the modeler. It is important to recall that these alternatives are semantically similar, and are based on the same meta-model of Figure 4.
Resource Allocation View provides the overall architecture of the F-IDE, where the toolchain architect allocates resources to data sources. It gives the architect an overview of where the resources are available in the F-IDE, and where they are consumed. For each data source, the architect defines the set of Resources it exposes; as well as those it consumes. These Resources are graphically represented as “provided” and “required” ports on the edge of the AdaptorInterface element, as illustrated in Figure 9 for our case study. For example, the Communication Specifier interface exposes the Message resource, which is then consumed by the Requirements Specifier.
Figure 8. An alternative Domain Specification View, representing all
associations between resources and properties by arrows.
In the Resource Allocation view, the interaction between a provider and consumer of a given resource is presented as a solid edge between the corresponding ports. In addition, any dependencies between resources that are managed by two different data sources are also represented in this model – as a dotted edge. For example, the resource ECUSoftware, managed by the Code Repository, has a property has_io_port that is a reference to resource IO_port (which is in turn managed through the data source Modarc). Hence, for a consumer of ECUSoftware, it is beneficial to identify the indirect dependency on the Modarc tool, since any consumption of an ECUSoftware resource, is likely to lead to the need to communicate with Modarc in order to obtain further information about the property has_io_port.
Figure 9. Resource Allocation View

256
International Journal on Advances in Software, vol 9 no 3 & 4, year 2016, http://www.iariajournals.org/software/
2016, © Copyright by authors, Published under agreement with IARIA - www.iaria.org
Adaptor Design View is where the toolchain architect (or the tool interface developer) designs the internal details of the tool interface – according to the OSLC standard. This can be performed for any of the Tool entities in the Resource Allocation view. The Adaptor Design view is a realization of the OSLC interface structure of Figure 3. Sufficient information is captured in this view, so that an almost complete interface code, which is compliant with the OSLC4J software development kit (SDK) can be generated, based on the Lyo code generator [17] (See next subsection for further details.).
An example of the proposed notation from our case study is presented in Figure 10, in which the Core Repository provides query capabilities and creation factories on all three resources. The Adaptor Design view also models its consumed resources (In Figure 10, no consumed resources are defined.). Note that the provided and required resources - as defined in this view - remain synchronized with those at the interface of the Tool entity in the Resource Allocation view.
Figure 10. Adaptor Design View [1]
There is no particular ordering of the above views, and in practice, the three views can be developed in parallel. Consistency between the views is maintained since they all refer to the same model. For example, if the toolchain architect removes a resource from the Adaptor Design view, the same resource is also removed from the Resource Allocation view.
C. Architecture of Modelling Tool
An open-source Eclipse-based modelling tool was developed to realize the proposed approach, whose main components are presented in Figure 11. Central in the architecture is the Toolchain Meta-model component that realizes the meta-model of Figure 4, based on the Eclipse Modeling Framework (EMF) [18]. The Graphical Modelling Editor then allows the end-user to graphically design a toolchain based on the three views presented in Section V.B. (The figures presented in that section are snapshots of the graphical editor.) A toolchain design model is ultimately an instance of the toolchain meta-model. This model can then be inputted into the Lyo Code Generator [17] to generate almost-complete code for each of the tool interfaces in the toolchain.
Lyo OSLC4J SDK
Technology-specific Generators
SQL
4OSLC
Toolchain Meta-model
… EMF
4OSLC Graphical
Modelling
Editor
Lyo Code Generator
Figure 11. The layered architecture of the modelling tool, building upon
the Lyo OSLC4J SDK, to provide a model-based development approach.
The Lyo code generator runs as a separate Eclipse project, and assumes a minimal set of plug-in dependencies. It is based on Acceleo [19], which implements the OMG MOF Model-to-Text Language (MTL) standard [20]. The code generator is designed to be independent of the Graphical Modelling Editor, and hence its input tool meta-model instance can be potentially created by any other EMF mechanism. This facilitates the extension of the generator with additional components as later described in this section.
The code generator builds upon the OSLC4J Software Development Kit (SDK) from the Lyo [21] project. While the OSLC4J SDK targets the implementation phase of adaptor implementation, our tool complements it with a model-based development approach, which allows one to work at a higher level of abstraction, with models used to specify the adaptor design, without needing to deal with all the technical details of the OSLC standard (such as Linked Data, RDF, etc.).
The generator produces OSLC4J-compliant Java code. Once generated, the java code has no dependencies to either the code generator, or the input toolchain model. The generated code can be further developed – as any OSLC4J adaptor – with no further connections to the generator.
Moreover, it is possible to modify the toolchain model and re-generate its code, without the loss of any code manually introduced between generations. For example, a JAX-RS class method may need to perform some additional business logic before - or after - the default handling of the designated web service. The generator ensures that such manual code remains intact after subsequent changes in the model and code generations. This promotes the incremental development of the toolchain, where the specification model and implementation can be gradually developed.
Upon generation, an adaptor is – almost – complete and ready-to-run, and needs not be modified nor complemented with additional manual code. Only a set of methods that communicate with the source tool to access its internal data need to be implemented (the dotted arrows in Figure 1). This communication is reduced to a simple set of methods to (a) get (b) create (c) search and (d) query each serviced resource. This manual code is packaged into a single class,
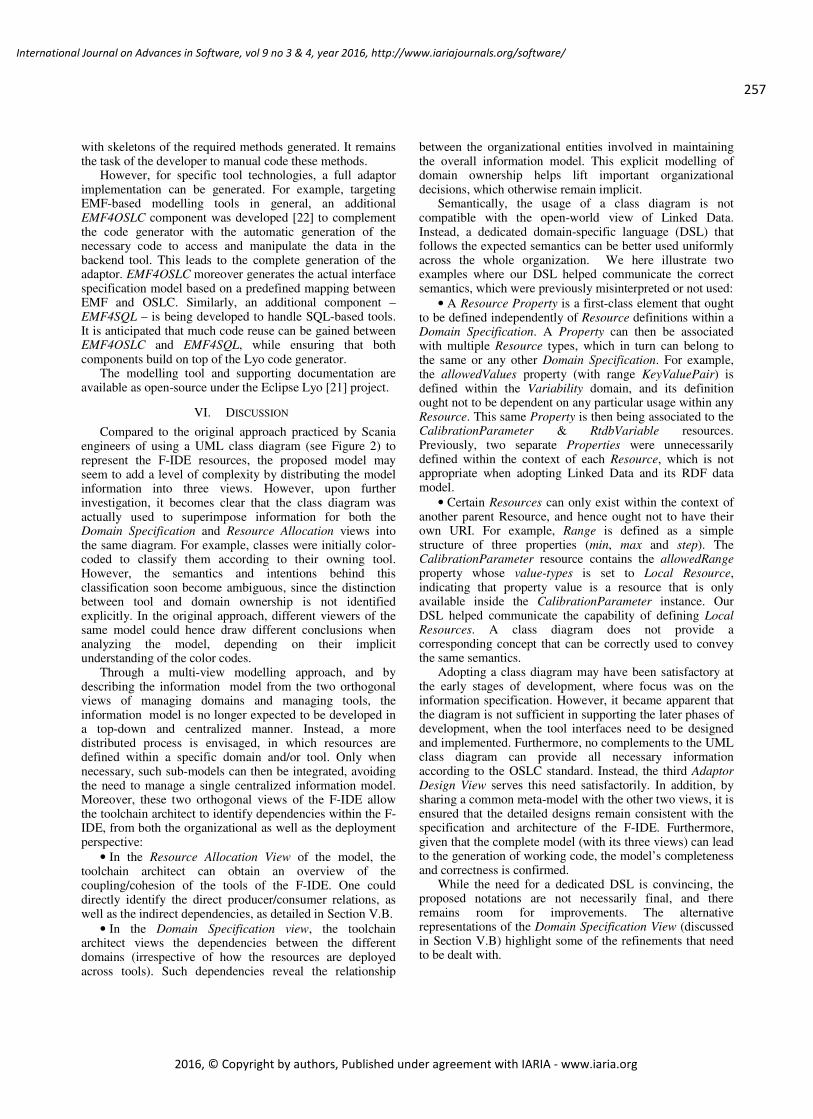
257
International Journal on Advances in Software, vol 9 no 3 & 4, year 2016, http://www.iariajournals.org/software/
2016, © Copyright by authors, Published under agreement with IARIA - www.iaria.org
with skeletons of the required methods generated. It remains the task of the developer to manual code these methods.
However, for specific tool technologies, a full adaptor implementation can be generated. For example, targeting EMF-based modelling tools in general, an additional EMF4OSLC component was developed [22] to complement the code generator with the automatic generation of the necessary code to access and manipulate the data in the backend tool. This leads to the complete generation of the adaptor. EMF4OSLC moreover generates the actual interface specification model based on a predefined mapping between EMF and OSLC. Similarly, an additional component – EMF4SQL – is being developed to handle SQL-based tools. It is anticipated that much code reuse can be gained between EMF4OSLC and EMF4SQL, while ensuring that both components build on top of the Lyo code generator.
The modelling tool and supporting documentation are available as open-source under the Eclipse Lyo [21] project.
VI. DISCUSSION
Compared to the original approach practiced by Scania engineers of using a UML class diagram (see Figure 2) to represent the F-IDE resources, the proposed model may seem to add a level of complexity by distributing the model information into three views. However, upon further investigation, it becomes clear that the class diagram was actually used to superimpose information for both the Domain Specification and Resource Allocation views into the same diagram. For example, classes were initially color-coded to classify them according to their owning tool. However, the semantics and intentions behind this classification soon become ambiguous, since the distinction between tool and domain ownership is not identified explicitly. In the original approach, different viewers of the same model could hence draw different conclusions when analyzing the model, depending on their implicit understanding of the color codes.
Through a multi-view modelling approach, and by describing the information model from the two orthogonal views of managing domains and managing tools, the information model is no longer expected to be developed in a top-down and centralized manner. Instead, a more distributed process is envisaged, in which resources are defined within a specific domain and/or tool. Only when necessary, such sub-models can then be integrated, avoiding the need to manage a single centralized information model. Moreover, these two orthogonal views of the F-IDE allow the toolchain architect to identify dependencies within the F-IDE, from both the organizational as well as the deployment perspective:
• In the Resource Allocation View of the model, the toolchain architect can obtain an overview of the coupling/cohesion of the tools of the F-IDE. One could directly identify the direct producer/consumer relations, as well as the indirect dependencies, as detailed in Section V.B.
• In the Domain Specification view, the toolchain architect views the dependencies between the different domains (irrespective of how the resources are deployed across tools). Such dependencies reveal the relationship
between the organizational entities involved in maintaining the overall information model. This explicit modelling of domain ownership helps lift important organizational decisions, which otherwise remain implicit.
Semantically, the usage of a class diagram is not compatible with the open-world view of Linked Data. Instead, a dedicated domain-specific language (DSL) that follows the expected semantics can be better used uniformly across the whole organization. We here illustrate two examples where our DSL helped communicate the correct semantics, which were previously misinterpreted or not used:
• A Resource Property is a first-class element that ought to be defined independently of Resource definitions within a Domain Specification. A Property can then be associated with multiple Resource types, which in turn can belong to the same or any other Domain Specification. For example, the allowedValues property (with range KeyValuePair) is defined within the Variability domain, and its definition ought not to be dependent on any particular usage within any Resource. This same Property is then being associated to the CalibrationParameter & RtdbVariable resources. Previously, two separate Properties were unnecessarily defined within the context of each Resource, which is not appropriate when adopting Linked Data and its RDF data model.
• Certain Resources can only exist within the context of another parent Resource, and hence ought not to have their own URI. For example, Range is defined as a simple structure of three properties (min, max and step). The CalibrationParameter resource contains the allowedRange property whose value-types is set to Local Resource, indicating that property value is a resource that is only available inside the CalibrationParameter instance. Our DSL helped communicate the capability of defining Local Resources. A class diagram does not provide a corresponding concept that can be correctly used to convey the same semantics.
Adopting a class diagram may have been satisfactory at the early stages of development, where focus was on the information specification. However, it became apparent that the diagram is not sufficient in supporting the later phases of development, when the tool interfaces need to be designed and implemented. Furthermore, no complements to the UML class diagram can provide all necessary information according to the OSLC standard. Instead, the third Adaptor Design View serves this need satisfactorily. In addition, by sharing a common meta-model with the other two views, it is ensured that the detailed designs remain consistent with the specification and architecture of the F-IDE. Furthermore, given that the complete model (with its three views) can lead to the generation of working code, the model’s completeness and correctness is confirmed.
While the need for a dedicated DSL is convincing, the proposed notations are not necessarily final, and there remains room for improvements. The alternative representations of the Domain Specification View (discussed in Section V.B) highlight some of the refinements that need to be dealt with.

258
International Journal on Advances in Software, vol 9 no 3 & 4, year 2016, http://www.iariajournals.org/software/
2016, © Copyright by authors, Published under agreement with IARIA - www.iaria.org
VII. RELATED WORK
There exists a large body of research that in various ways touches upon information modeling and tool integration. (See for example [2] and [23]). Our work - and the related work of this section - is delimited to the Linked Data paradigm, and its graphical modelling.
The most relevant work found in this area is the Ontology Definition Metamodel (ODM) [24]. ODM is an OMG specification that defines a family of Meta-Object Facility (MOF) metamodels for the modelling of ontologies. ODM also specifies a UML Profile for RDFS [16] and the Web Ontology Language (OWL) [25], which can be realized by UML-based tools, such as Enterprise Architect's ODM diagrams [26]. However, as argued in [14], OWL and RDFS are not suitable candidates to specify and validate constraints, given that they are designed for another purpose - namely for reasoning engines that can infer new knowledge. The work in this paper builds upon the Resource Shape constraint language suggested in [14], by providing a graphical model to specify such constraints on RDF resources. The constraint language is part of the OSLC standard, making for its easy adoption within our work. On the other hand, SHACL [27] is an evolving W3C working draft for a very similar constraint language, which can also be supported in the future.
Earlier work by the authors has also resulted in a modelling approach to toolchain development [28]. In this earlier work, even though the information was modelled targeting an OSLC implementation, the models were directly embedded in the specific tool adaptors, and no overall information model is readily available. The models did not support the tool and domain ownership perspectives identified in this paper.
In general, there are inspiring works done for defining a visual language for the representation of ontologies. Even if ontologies are not directly suitable for the specification of constraints, such languages can be used as inspiration for the graphical notation presented in this paper. One example is the Visual Notation for OWL Ontologies (VOWL) [29] that is based on only a handful of graphical primitives forming the alphabet of the visual language. In this visual notation, classes are represented as circles that are connected by lines and arrowheads representing the property relations. Property labels and datatypes are shown as rectangles. Information on individuals and data values is displayed either in the visualization itself or in another part of the user interface. VOWL also uses a color scheme complementing the graphical primitives. It defines colors for the visual elements to allow for an easy distinction of different types of classes and properties. In addition to the shapes and colors, VOWL also introduces dashed lines, dashed borders and double borders for visualizing class, relation or data properties.
OWLGrEd [30] is another graphical OWL editor that extends the UML class diagram to allow for OWL visualization. The work argues that the most important feature for achieving readable graphical OWL notation is the maximum compactness. The UML class diagram is used to present the core features of OWL ontologies. To overcome
the difference between UML’s closed-world assumption and OWL’s open-world assumption, the authors changed the semantics of the UML notation and added new symbols. OWLGrEd introduces a colored background frame for the relatively autonomous sub-parts of the ontology. Furthermore, the editor contains a number of additional services to ease ontology development and exploration, such as different layout algorithms for automatic ontology visualization, search facilities, zooming, and graphical refactoring. Finally, GrOWL [31] is a visual language that attempts to accurately visualize the underlying description logic semantics of OWL ontologies, without exposing the complex OWL syntax.
Lanzenberger et al. [32] summarize the results of their literature study on tools for visualizing ontologies as: “A huge amount of tools exist for visualizing ontologies, however, there are just a few for assisting with viewing multiple ontologies as needed for ontology alignment. … Finally, in order to support an overview and detail approach appropriately, multiple views or distortion techniques are needed.” We identified the need to support multiple views in this study, in order to support the different stakeholders of the same language.
VIII. CONCLUSION
In this paper, an MDE approach to F-IDE development based on Linked Data and the OSLC standard is presented. The proposed set of modelling views supports the toolchain architect with the early phases of toolchain development, with a particular focus on the specification of the information model and its distribution across the tools of the toolchain. Additionally, such views are tightly integrated with a design view supporting the detailed design of the tool interfaces. The modelling views are designed to be a digital representation of the OASIS OSLC standard. This ensures that any defined toolchain complies with the standard. It also helps lower the threshold of learning as well as implementing OSLC-compliant toolchains.
An open-source modelling tool was developed to realize the proposed modelling views. The tool includes an integrated code generator that can synthesis the specification and design models into a running implementation. This allows one to work at a higher level of abstraction, without needing to deal with all the technical details of the OSLC standard (such as Linked Data, RDF, etc.). The Eclipse-based modelling tool and supporting documentation are available as open-source under the Eclipse Lyo project.
It is envisaged that the modelling support will be extended to cover the complete development lifecycle, specifically supporting the requirements analysis phase, as well as automated testing. The current focus on data integration needs to be also extended to cover other aspects of integration, in particular control integration [33].
REFERENCES
[1] J. El-Khoury, D. Gürdür, F. Loiret, M. Törngren, D. Zhang, and M. Nyberg, "Modelling Support for a Linked Data Approach to Tool Interoperability," The Second International

259
International Journal on Advances in Software, vol 9 no 3 & 4, year 2016, http://www.iariajournals.org/software/
2016, © Copyright by authors, Published under agreement with IARIA - www.iaria.org
Conference on Big Data, Small Data, Linked Data and Open Data, ALLDATA 2016, pp. 42-47.
[2] M. Törngren, A. Qamar, M. Biehl, F. Loiret, and J. El-khoury, "Integrating viewpoints in the development of mechatronic products," Mechatronics (Oxford), vol. 24, nr. 7, 2014, pp. 745-762.
[3] Road vehicles - functional safety, ISO standard 26262:2011, 2011.
[4] (2016, Nov.) PTC Integrity. [Online]. Available: http://www.ptc.com/application-lifecycle-management/integrity/
[5] B. Weichel and M. Herrmann, "A backbone in automotive software development based on XML and ASAM/MSR," SAE Technical Papers, 2004, doi:10.4271/2004-01-0295.
[6] (2016, Nov.) OASIS OSLC. [Online]. Available: http://www.oasis-oslc.org/
[7] T. Berners-Lee. (2016, Nov.) Linked data design issues. [Online]. Available: http://www.w3.org/DesignIssues/LinkedData.html
[8] Linked Data Platform 1.0, W3C Recommendation, 2015.
[9] X. Zhang, M. Persson, M. Nyberg, B. Mokhtari, A. Einarson, H. Linder, J. Westman, D. Chen, and M. Törngren, "Experience on Applying Software Architecture Recovery to Automotive Embedded Systems," IEEE Conference on Software Maintenance, Reengineering, and Reverse Engineering, CSMR-WCRE 2014, pp. 379-382.
[10] J. Westman, M. Nyberg, and O. Thyden, "CPS Specifier - A Specification Tool for Safety-Critical Cyber-Physical Systems," Sixth Workshop on Design, Modeling and Evaluation of Cyber Physical Systems, CyPhy'16, 2016
[11] A. Rossignol, "The reference technology platform" in CESAR - Cost-efficient methods and processes for safety-relevant embedded systems, A. Rajan and T. Wahl, Eds. Dordrecht: Springer, pp. 213-236, 2012.
[12] OSLC Core Specification, OSLC standard v2.0, 2013.
[13] OSLC Quality Management Specification, OSLC standard v2.0, 2011.
[14] A. G. Ryman, A. Le Hors, and S. Speicher, "OSLC resource shape: A language for defining constraints on linked data," CEUR Workshop Proceedings, Vol.996, 2013.
[15] (2016, Nov.) FOAF Vocabulary Specification. [Online]. Available: http://xmlns.com/foaf/spec/
[16] RDF Schema 1.1, W3C Recommendation, 2014.
[17] J. El-Khoury, "Lyo Code Generator: A Model-based Code Generator for the Development of OSLC-compliant Tool Interfaces," SoftwareX, 2016.
[18] (2016, Nov.) Eclipse EMF. [Online]. Available: https://eclipse.org/modeling/emf/
[19] (2016, Nov.) Eclipse Acceleo. [Online]. Available: https://www.eclipse.org/acceleo/
[20] MOF Model to Text Transformation Language (MOFM2T), 1.0, OMG standard, document number: formal/2008-01-16, 2008.
[21] (2016, Nov.) Eclipse Lyo. [Online]. Available: https://www.eclipse.org/lyo/
[22] J. El-Khoury, C. Ekelin, and C. Ekholm, “Supporting the Linked Data Approach to Maintain Coherence Across Rich EMF Models,” Modelling Foundations and Applications: 12th European Conference, ECMFA 2016, pp. 36-47.
[23] R. Basole, A. Qamar, H. Park, C. Paredis, and L. Mcginnis, "Visual analytics for early-phase complex engineered system design support," IEEE Computer Graphics and Applications, vol. 35, nr. 2, 2015, pp. 41-51.
[24] Ontology Definition Metamodel, OMG standard, document number: formal/2014-09-02, 2014.
[25] OWL 2 Web Ontology Language, W3C Recommendation, 2012.
[26] (2016, Nov.) Enterprise Architect ODM MDG Technology. [Online]. Available: http://www.sparxsystems.com/enterprise_architect_user_guide/9.3/domain_based_models/mdg_technology_for_odm.html
[27] Shapes Constraint Language (SHACL), W3C Working Draft, 2016.
[28] M. Biehl, J. El-khoury, F. Loiret, and M. Törngren, "On the modeling and generation of service-oriented tool chains," Software & Systems Modeling, vol. 13, nr 2, 2014, pp. 461-480.
[29] S. Lohmann, S. Negru, F. Haag, and T. Ertl, “Visualizing Ontologies with VOWL,” Semantic Web, vol 7, nr 4, 2016, pp. 399-419.
[30] J. Bārzdiņš, G. Bārzdiņš, K. Čerāns, R. Liepiņš, and A. Sproģis, "UML style graphical notation and editor for OWL 2," International Conference on Business Informatics Research, Springer Berlin, 2010.
[31] S. Krivov, F. Villa, R. Williams, and X. Wu, "On visualization of OWL ontologies," Semantic Web, Springer US, 2007, pp 205-221.
[32] M. Lanzenberger, J. Sampson and M. Rester, "Visualization in Ontology Tools," International Conference on Complex, Intelligent and Software Intensive Systems, 2009, pp. 705-711.
[33] A. I. Wasserman, "Tool integration in software engineering environments," the international workshop on environments on Software engineering environments, 1990, pp. 137-149.
260
International Journal on Advances in Software, vol 9 no 3 & 4, year 2016, http://www.iariajournals.org/software/
2016, © Copyright by authors, Published under agreement with IARIA - www.iaria.org
Unsupervised curves clustering by minimizingentropy: implementation and application to air traffic
Florence Nicol
Universite Federale de ToulouseEcole Nationale de l’Aviation Civile
F-31055 Toulouse FRANCEEmail: [email protected]
Stephane Puechmorel
Universite Federale de ToulouseEcole Nationale de l’Aviation Civile
F-31055 Toulouse FRANCEEmail: [email protected]
Abstract—In many applications such as Air Traffic Management(ATM), clustering trajectories in groups of similar curves isof crucial importance. When data considered are functional innature, like curves, dedicated algorithms exist, mostly basedon truncated expansion on Hilbert basis. When additional con-straints are put on the curves, as like in applications relatedto air traffic where operational considerations are to be takeninto account, usual procedures are no longer applicable. Anew approach based on entropy minimization and Lie groupmodeling is presented here and its implementation is discussedin detail, especially the computation of the curve system densityand the entropy minimization by a gradient descent algorithm.This algorithm yields an efficient unsupervised algorithm suitablefor automated traffic analysis. It outputs cluster centroids withlow curvature, making it a valuable tool in airspace designapplications or route planning.
Keywords–curve clustering; probability distribution estimation;functional statistics; minimum entropy; Lie group modeling; airtraffic management.
I. INTRODUCTION
Clustering aircraft trajectories is an important problem inAir Traffic Management (ATM). It is a central question inthe design of procedures at take-off and landing, the so calledsid-star (Standard Instrument Departure and Standard TerminalArrival Routes). In such a case, one wants to minimizethe noise and pollutants exposure of nearby residents whileensuring runway efficiency in terms of the number of aircraftmanaged per time unit.
The same question arises with cruising aircraft, this timethe mean flight path in each cluster being used to opti-mally design the airspace elements (sectors and airways).This information is also crucial in the context of future airtraffic management systems where reference trajectories willbe negotiated in advance so as to reduce congestion. A specialinstance of this problem is the automatic generation of safe andefficient trajectories, but in such a way that the resulting flightpaths are still manageable by human operators. Clustering isa key component for such tools: major traffic flows must beorganized in such a way that the overall pattern is not toofar from the current organization, with aircraft flying alongairways. The classification algorithm has thus not only tocluster similar trajectories but at the same time makes themas close as possible to operational trajectories. In particular,straightness of the flight segments must be enforced, along with
a global structure close to a graph with nodes correspondingto merging/splitting points and edges the airways. Moreover,the clustering procedure has to deal with trajectories that arevery similar in shape but are oriented in opposite directions.These flight paths should be sufficiently separate in order toprevent hazardous encounters. Using the approach developedin [1], a Lie group modeling is proposed to take into accountthe direction and the position of the aircraft trajectories. Themain computational complexity of such a clustering algorithmfocuses on the computation of the curve system density. Thiscomputational cost can be reduced by choosing appropriatekernel functions.
This paper is organized as follows. First, previous relatedworks is presented. Next, in Section III, the notion of spatialcurve density and the related entropy are introduced for dealingwith curve systems. Then, the modeling of trajectories with aLie group approach and the statistical estimation of Lie groupdensities are presented. In Section IV, the unsupervised entropyclustering approach developed in [2] is extended to the newsetting of Lie group modeling. In Section V, a discussion onfast implementation and algorithms presented in [1] is detailed.Finally, results on synthetic examples and real trajectory dataare given and a conclusion is drawn.
II. PREVIOUS RELATED WORK
Several well established algorithms may be used for per-forming clustering on a set of trajectories, although only a fewof them were eventually applied to air traffic analysis. Thespectral approach relies on trajectories modeling as vectorsof samples in a high dimensional space, and uses randomprojections as means of reducing the dimensionality. The hugecomputational cost of the required singular values decompo-sition is thus alleviated, allowing use on real recorded trafficover several months. It was applied in a study conducted by theMitre corporation on behalf of the Federal Aviation Authority(FAA) [3]. The most important limitation of this approach isthat the shape of the trajectories is not taken into accountwhen applying the clustering procedure unless a resamplingprocedure based on arclength is applied: changing the timeparametrization of the flight paths will induce a change inthe classification. Furthermore, there is no means to put aconstraint on the mean trajectory produced in each cluster:curvature may be quite arbitrary even if samples individuallycomply with flight dynamics.

261
International Journal on Advances in Software, vol 9 no 3 & 4, year 2016, http://www.iariajournals.org/software/
2016, © Copyright by authors, Published under agreement with IARIA - www.iaria.org
Another approach is taken in [4], with an explicit use of anunderlying graph structure. It is well adapted to road traffic asvehicles are bound to follow predetermined segments. A spatialsegment density is computed then used to gather trajectoriessharing common parts. For air traffic applications, it may be ofinterest for investigating present situations, using the airwaysand beacons as a structure graph, but will misclassify aircraftfollowing direct routes which is quite a common situation,and is unable to work on an unknown airspace organization.This point is very important in applications since trajectorydatamining tools are mainly used in airspace redesign. Asimilar approach is taken in [5] with a different measure ofsimilarity. It has to be noted that many graph-based algorithmsare derived from the original work presented in [6], andexhibit the aforementioned drawbacks for air traffic analysisapplications.
An interesting vector fieldbased algorithm is presented in[7]. A salient feature is the ability to distinguish between closetrajectories with opposite orientations. Nevertheless, puttingconstraints on the geometry of the mean path in a clusteris quite awkward, making the method unsuitable for ourapplication.
Due to the functional nature of trajectories, that are basi-cally mappings defined on a time interval, it seems more appro-priate to resort to techniques based on times series as surveyedin [8], [9], or functional data statistics, with standard references[10], [11]. In both approaches, a distance between pairs oftrajectories or, in a weaker form, a measure of similarity mustbe available. The algorithms of the first category are based onsequences, possibly in conjunction with dynamic time warping[12], while in functional data analysis, samples are assumedto come from an unknown underlying function belonging to agiven Hilbert space. However, it has to be noticed that apartfrom this last assumption, both approaches yield similar endalgorithms, since functional data revert for implementationto usual finite dimensional vectors of expansion coefficientson a suitable truncated basis. For the same reason, model-based clustering may be used in the context of functional dataeven if no notion of probability density exists in the originalinfinite dimensional Hilbert space as mentioned in [13]. A niceexample of a model-based approach working on functionaldata is funHDDC [14].
III. DEALING WITH CURVE SYSTEMS: A PARADIGMCHANGE
When working with aircraft trajectories, some specificcharacteristics must be taken into account. First of all, flightpaths consist mainly of straight segments connected by arcsof circles, with transitions that may be assumed smooth up toat least the second derivative. This last property comes fromthe fact that pilot’s actions result in changes on aerodynamicforces and torques and a straightforward application of theequations of motion. When dealing with sampled trajectories,this induces a huge level of redundancy within the data, therelevant information being concentrated around the transitions.Second, flight paths must be modeled as functions from atime interval [a, b] to R3 which is not the usual setting forfunctional data statistics: most of the work is dedicated toreal valued mappings and not vector ones. A simple approachwill be to assume independence between coordinates, so thatthe problem falls within the standard case. However, even
with this simplifying hypothesis, vertical dimension must betreated in a special way as both the separation norms andthe aircraft maneuverability are different from those in thehorizontal plane.
Finally, being able to cope with the initial requirement ofcompliance with the current airspace structure in airways isnot addressed by general algorithms. In the present work, anew kind of functional unsupervised classifier is introduced,that has in common with graph-based algorithms an esti-mation of traffic density but works in a continuous setting.For operational applications, a major benefit is the automaticbuilding of a route-like structure that may be used to infer newairspace designs. Furthermore, smoothness of the mean clustertrajectory, especially low curvature, is guaranteed by design.Such a feature is unique among existing clustering procedures.Finally, our Lie group approach makes easy the separationbetween neighboring flows oriented in opposite directions.Once again, it is mandatory in air traffic analysis where sucha situation is common.
A. The entropy of a system of curvesConsidering trajectories as mappings γ : [t0, t1] → R3
induces a notion of spatial density as presented in [15]. As-suming that after a suitable registration process all flight pathsγi, i = 1, . . . , N , are defined on the same time interval [0, 1] toΩ a domain of R3, one can compute an entropy associated withthe system of curves using the approach presented in [16]. Leta system of curves γ1, . . . , γN be given, its entropy is definedto be:
E(γ1, . . . , γN ) = −∫
Ω
d(x) log(d(x)
)dx,
where the spatial density d is computed according to:
d : x 7→∑Ni=1
∫ 1
0K (‖x− γi(t)‖) ‖γ′i(t)‖dt∑N
i=1 li. (1)
In the last expression, li is the length of the curve γi and Kis a kernel function similar to those used in nonparametricestimation. A standard choice is the Epanechnikov kernel:
K : x 7→ C(1− x2
)1[−1,1](x),
with a normalizing constant C chosen so as to have a unitintegral of K on Ω. In multivariate density estimation, acommon practice is to build a multivariate kernel functionby means of an univariate kernel K composed with a norm,denoted by ‖.‖. The resulting mapping, x 7→ K(‖x‖) enjoyssome important properties:
• Translation invariance.• Rotational symmetry.
In Section V, the translation invariance will be used to cut thecomputational cost of kernel evaluation.
Since the entropy is minimal for concentrated distributions,it is quite intuitive to figure out that seeking for a curve system(γ1, . . . , γN ) giving a minimum value for E(γ1, . . . , γN ) willinduce the following properties:
• The images of the curves tend to get close one toanother.

262
International Journal on Advances in Software, vol 9 no 3 & 4, year 2016, http://www.iariajournals.org/software/
2016, © Copyright by authors, Published under agreement with IARIA - www.iaria.org
• The individual lengths will be minimized: it is a directconsequence of the fact that the density has a term inγ′ within the integral that will favor short trajectories.
Using a standard gradient descent algorithm on the entropyproduces an optimally concentrated curve system, suitable foruse as a basis for a route network. In Section V, this algorithmis applied on a curve system produced by an automatedtrajectory planner.
The displacement field for trajectory j is oriented at eachpoint along the normal vector to the trajectory, with norm givenby:∫
Ω
γj(t)− x‖γj(t)− x‖
∣∣∣∣NK ′ (‖γj(t)− x‖) log
(d(x)
)dx‖γ′j(t)‖
(2)
−(∫
Ω
K (‖γj(t)− x‖) log(d(x)
)dx
)γ′′j (t)
‖γ′j(t)‖
∣∣∣∣∣N
(3)
+
(∫Ω
d(x) log(d(x))dx
)γ′′j (t)
‖γ′j(t)‖
∣∣∣∣∣N
, (4)
where the notation v|N stands for the projection of the vectorv onto the normal vector to the trajectory. An overall scalingconstant of:
1∑Ni=1 li
,
where li is the length of trajectory i, has to be put in front of theexpression to get the true gradient of the entropy. In practice,it is not needed since algorithms will adjust the size of the steptaken in the gradient direction. Another formulation using thescaled arclength in the entropy can be found in [2]. Whilebeing equivalent to the one presented above, since it relies ona reparametrization, only the term related to the kernel gradientremains in the final expression. As a consequence, there is noneed to project moves onto the normal to the curves. However,it introduces a constraint that must be taken into account innumerical implementations. So far, the principle retained isto resample the curves after the update so as to ensure thatthe defining property (constant velocity) of the arclength ispreserved.
B. A Lie group modeling
While satisfactory in terms of traffic flows, the previousapproach suffers from a severe flaw when one considers flightpaths that are very similar in shape but are oriented in oppositedirections. Since the density is insensitive to direction reversal,flight paths will tend to aggregate while the correct behaviorwill be to ensure a sufficient separation in order to preventhazardous encounters. Taking aircraft headings into account inthe clustering process is then mandatory when such situationshave to be considered.
This issue can be addressed by adding a penalty termto neighboring trajectories with different headings but theimportant theoretical property of entropy minimization will belost in the process. A more satisfactory approach will be to takeheading information directly into account and to introduce anotion of density based on position and velocity.
Since the aircraft dynamics is governed by a second orderequation of motion of the form:(
γ′(t)γ′′(t)
)= F
(t;
γ(t)γ′(t)
),
it is natural to take as state vector:(γ(t)γ′(t)
).
The initial state is chosen here to be:(0de1
),
with e1 the first basis vector, and 0d the origin in Rd. It isequivalent to model the state as a linear transformation:
0d ⊗ e1 7→ T (t)⊗A(t)(0d ⊗ e1) = γ(t)⊗ γ′(t),
where T (t) is the translation mapping 0d to γ(t) and A(t) isthe composite of a scaling and a rotation mapping e1 to γ′(t).Considering the vector (γ(t), 1) instead of γ(t) allows a matrixrepresentation of the translation T (t):(
γ(t)1
)=
(Id γ(t)0 1
)(0d1
).
From now, all points will be implicitly considered as havingan extra last coordinate with value 1, so that translations areexpressed using matrices. The origin 0d will thus stand for thevector (0, . . . , 0, 1) in Rd+1. Gathering things yields:(
γ(t)γ′(t)
)=
(T (t) 0
0 A(t)
)(0de1
). (5)
The previous expression makes it possible to represent atrajectory as a mapping from a time interval to the matrix Liegroup G = Rd×Σ×SO(d), where Σ is the group of multiplesof the identity, SO(d) the group of rotations and Rd the groupof translations. Please note that all the products are direct. TheA(t) term in the expression (5) can be written as an elementof Σ ⊗ SO(d). Starting with the defining property A(t)e1 =γ′(t), one can write A(t) = ‖γ′(t)‖U(t) with U(t) a rotationmapping e1 ∈ Sd−1 to the unit vector γ′(t)/‖γ′(t)‖ ∈ Sd−1.For arbitrary dimension d, U(t) is not uniquely defined, as itcan be written as a rotation in the plane P = span(e1, γ
′(t))and a rotation in its orthogonal complement P⊥. A commonchoice is to let U(t) be the identity in P⊥ which corresponds infact to a move along a geodesic (great circle) in Sd−1. This willbe assumed implicitly in the sequel, so that the representationA(t) = Λ(t)U(t) with Λ(t) = ‖γ′(t)‖Id becomes unique.
The Lie algebra g of G is easily seen to be Rd × R ×Asym(d) with Asym(d) is the space of skew-symmetric d × dmatrices. An element from g is a triple (u, λ,A) with anassociated matrix form:
M(u, λ,A) =
0 u0 0
0
0 λId+A
. (6)
The exponential mapping from g to G can be obtained in astraightforward manner using the usual matrix exponential:
exp((u, λ,A)) = exp(M(u, λ,A)).

263
International Journal on Advances in Software, vol 9 no 3 & 4, year 2016, http://www.iariajournals.org/software/
2016, © Copyright by authors, Published under agreement with IARIA - www.iaria.org
The matrix representation of g may be used to derive ametric:
〈(u, λ,A), (v, µ,B)〉g = Tr(M(u, λ,A)tM(v, µ,B)
).
Using routine matrix computations and the fact that A,B beingskew-symetric have vanishing trace, it can be expressed as:
〈(u, λ,A), (v, µ,B)〉g = nλµ+ 〈u, v〉+ Tr(AtB
). (7)
A left invariant metric on the tangent space TgG at g ∈ Gis derived from (7) as:
〈〈X,Y, 〉〉g = 〈g−1X, g−1Y 〉g,
with X,Y ∈ TgG. Please note that G is a matrix group actinglinearly so that the mapping g−1 is well defined from TgG tog. Using the fact that the metric (7) splits, one can check thatgeodesics in the group are given by straight segments in g: ifg1, g2 are two elements from G, then the geodesic connectingthem is:
t ∈ [0, 1] 7→ g1 exp(t log
(g−1
1 g2
)),
where log is a determination of the matrix logarithm. Finally,the geodesic length is used to compute the distance d(g1, g2)between two elements g1, g2 in G. Assuming that the transla-tion parts of g1, g2 are respectively u1, u2, the rotations U1, U2
and the scalings exp(λ1), exp(λ2) then:
d(g1, g2)2 = (λ1 − λ2)2
+ (8)
Tr(
log(U t1U2
)log(U t1U2
)t)+ ‖u1 − u2‖2. (9)
An important point to note is that the scaling part of anelement g ∈ G will contribute to the distance by its logarithm.
Based on the above derivation, a flight path γ with statevector (γ(t), γ′(t)) will be modeled in the sequel as a curvewith values in the Lie group G:
Γ: t ∈ [0, 1] 7→ Γ(t) ∈ G,
with:Γ(t).(0d, e1) = (γ(t), γ′(t)).
In order to make the Lie group representation amenableto statistical thinking, we need to define probability densitieson the translation, scaling and rotation components that areinvariant under the action of the corresponding factor of G.
C. Nonparametric estimation on GSince the translation factor in G is the additive group Rd, a
standard nonparametric kernel estimator can be used. It turnsout that it is equivalent to the spatial density estimate of (1),so that no extra work is needed for this component.
As for the rotation component, a standard parametrizationis obtained recursively starting with the image of the canonicalbasis of Rd under the rotation. If R is an arbitrary rotation ande1, . . . , ed is the canonical basis, there is a unique rotationRe1 mapping e1 to Re1 and fixing e2, . . . , ed. It can berepresented by the point Re1 = r1 on the sphere Sd−1.Proceeding the same way for Re2, . . . Red, it is finally possibleto completely parametrized R by a (d−1)-uple (r1, . . . , rd−1)where ri ∈ Si−1, i = 1, . . . , d. Finding a rotation invariantdistribution amounts thus to construct such a distribution on thesphere. In directional statistics, when we consider the spherical
polar coordinates of a random unit vector u ∈ Sd−1, we dealwith spherical data (also called circular data or directionaldata) distributed on the unit sphere. For d = 3, a unit vectormay be described by means of two random variables θ and ϕwhich respectively represent the co-latitude (the zenith angle)and the longitude (the azimuth angle) of the points on thesphere. Nonparametric procedures, such as the kernel densityestimation methods are sometimes convenient to estimate theprobability distribution function (p.d.f.) of such kind of databut they require an appropriate choice of kernel functions.
Let X1, . . . , Xn be a sequence of random vectors takingvalues in Rd. The density function f of a random d-vector maybe estimated by the kernel density estimator [17] as follows:
f(x) =1
n
n∑i=1
KH (x−Xi) , x ∈ Rd,
where KH(x) =| H |−1 K(H−1x), K denotes a multivariatekernel function and H represents a d-dimensional smoothingmatrix, called bandwidth matrix. The kernel function K is a d-dimensional p.d.f. such as the standard multivariate Gaussiandensity K(x) = (2π)d/2 exp
(− 1
2xTx)
or the multivariateEpanechnikov kernel. The resulting estimation will be the sumof “bumps” above each observation, the observations closedto x giving more important weights to the density estimate.The kernel function K determines the form of the bumpswhereas the bandwidth matrix H determines their width andtheir orientation. Thereby, bandwidth matrices can be used toadjust for correlation between the components of the data.Usually, an equal bandwidth h in all dimensions is chosen,corresponding to H = hId where Id denotes the d×d identitymatrix. The kernel density estimator then becomes:
f(x) =1
nhd
n∑i=1
K(h−1(x−Xi)
), x ∈ Rd.
In certain cases when the spread of data is different ineach coordinate direction, it may be more appropriate to usedifferent bandwidths in each dimension. The bandwidth matrixH is given by the diagonal matrix in which the diagonal entriesare the bandwidths h1, . . . , hd.
In directional statistics, a kernel density estimate on Sd−1
is given by adopting appropriate circular symmetric kernelfunctions such as von Mises-Fisher, wrapped Gaussian andwrapped Cauchy distributions. A commonly used choice is thevon Mises-Fisher (vMF) distribution on Sd−1 which is denotedM(m,κ) and given by the following density expression [18]:
KVMF (x;m,κ) = cd(κ) eκmT x, κ > 0, x ∈ Sd−1, (10)
where
cd(κ) =κd/2−1
(2π)d/2Id/2−1(κ)(11)
is a normalizing constant with Ir(κ) denoting the modifiedBessel function of the first kind at order r. The vMF kernelfunction is an unimodal p.d.f. parametrized by the unit mean-direction vector µ and the concentration parameter κ thatcontrols the concentration of the distribution around the mean-direction vector. The vMF distribution may be expressed bymeans of the spherical polar coordinates of x ∈ Sd−1 [19].

264
International Journal on Advances in Software, vol 9 no 3 & 4, year 2016, http://www.iariajournals.org/software/
2016, © Copyright by authors, Published under agreement with IARIA - www.iaria.org
Given the random vectors Xi, i = 1, . . . , n, in Sd−1, theestimator of the spherical distribution is given by:
f(x) =1
n
n∑i=1
KVMF (x;Xi, κ) (12)
=cd(κ)
n
n∑i=1
eκXTi x, κ > 0, x ∈ Sd−1. (13)
The quantity x−Xi which appears in the linear kernel densityestimator is replaced by XT
i x which is the cosine of theangles between x and Xi, so that more important weightsare given on observations close to x on the sphere. Theconcentration parameter κ is a smoothing parameter that playsthe role of the inverse of the bandwidth parameter as definedin the linear kernel density estimation. Large values of κimply greater concentration around the mean direction and leadto undersmoothed estimators whereas small values provideoversmoothed circular densities [20]. Indeed, if κ = 0,the vMF kernel function reduces to the uniform circulardistribution on the hypersphere. Note that the vMF kernelfunction is convenient when the data is rotationally symmetric.
The vMF kernel function is a convenient choice for ourproblem because this p.d.f. is invariant under the action onthe sphere of the rotation component of the Lie group G.Moreover, this distribution has properties analogous to thoseof multivariate Gaussian distribution and is the limiting caseof a limit central theorem for directional statistics. Othermultidimensional distributions might be envisaged, such as thebivariate von Mises, the Bingham or the Kent distributions[18]. However, the bivariate von Mises distribution being aproduct kernel of two univariate von Mises kernels, it is moreappropriate for modeling density distributions on the torus andnot on the sphere. The Bingham distribution is bimodal andsatisfies the antipodal symmetry property K(x) = K(−x).This kernel function is used for estimating the density ofaxial data and is not appropriate for our clustering approach.Finally, the Kent distribution is a generalization of the vMFdistribution, which is used when we want to take into accountthe spread of data. However, the rotation-invariance propertyof the vMF distribution is lost.
As for the scaling component of G, the usual kernelfunctions such as the Gaussian and the Epanechnikov kernelfunctions are not suitable for estimating the radial distributionof a random vector in Rd. When distributions are defined overa positive support (here in the case of non-negative data), thesekernel functions cause a bias in the boundary regions becausethey give weights outside the support. An asymmetrical kernelfunction on R+ such as the log-normal kernel function isa more convenient choice. Moreover, this p.d.f. is invariantby change of scale. Let R1, . . . , Rn be univariate randomvariables from a p.d.f. which has bounded support on [0; +∞[.The radial density estimator may be defined by means of a sumof log-normal kernel functions as follows:
g(r) =1
n
n∑i=1
KLN (r; lnRi, h), r ≥ 0, h > 0, (14)
where
KLN (x;µ, σ) =1√
2πσxe−
(ln x−µ)2
2σ2 (15)
is the log-normal kernel function and h is the bandwidthparameter. The resulting estimate is the sum of bumps de-fined by log-normal kernels with medians Ri and variances(eh
2 −1)eh2
R2i . Note that the log-normal (asymmetric) kernel
density estimation is similar to the kernel density estimationbased on a log-transformation of the data with the Gaussiankernel function. Although the scale-change component of G isthe multiplicative group R+, we can use the standard Gaussiankernel estimator and the metric on R.
IV. UNSUPERVISED ENTROPY CLUSTERING
The first thing to be considered is the extension of theentropy definition to curve systems with values in G. Startingwith expression from (1), the most important point is thechoice of the kernel involved in the computation. As thegroup G is a direct product, choosing K = Kt.Ks.Ko withKt, Ks, Ko functions on respectively the translation, scalingand rotation part will yield a G-invariant kernel provided theKt, Ks, Ko are invariant on their respective components.Since the translation part of G is modeled after Rd, theEpanechnikov kernel is a suitable choice. As for the scalingand rotation, the choice made follows the conclusion of SectionIII-C: a log-normal kernel and a von-Mises one will be usedrespectively. Finally, the term ‖γ′(t)‖ in the original expressionof the density, that is required to ensure invariance under re-parametrization of the curve, has to be changed accordingto the metric in G and is replaced by 〈〈γ′(t), γ′(t)〉〉1/2γ(t). Thedensity at x ∈ G is thus:
dG(x)) =
∑Ni=1
∫ 1
0K (x, γi(t)) 〈〈γ′i(t), γ′i(t)〉〉
1/2γi(t)
dt∑Ni=1 li
(16)
where li is the length of the curve in G, that is:
li =
∫ 1
0
〈〈γ′i(t), γ′i(t)〉〉1/2γi(t)
dt. (17)
The expression of the kernel evaluation K (x, γi(t)) is splitinto three terms. In order to ease the writing, a point x in G willbe split into xr, xs, xo components where the exponent r, s, tstands respectively for translation, scaling and rotation. Giventhe fact that K is a product of component-wise independentkernels it comes:
K (x, γi(t)) = Kt
(xt, γti (t)
)Ks (xs, γsi (t))Ko (xo, γoi (t))
where:
Kt(xt, γti (t)) =
2
πep(‖xt − γti (t)‖
)(18)
Ks(xs, γsi (t)) =
1
xsσ√
2πexp
(− (log xs − log γsi (t))
2
2σ2
)(19)
Ko(xo, γoi (t)) = C(κ) exp
(κTr
(xoT γoi (t)
))(20)
with ep : x ∈ R+ 7→ (1 − x2)1[0,1](x) and C(κ) the normal-izing constant making the kernel of unit integral. Please notethat the expression given here is valid for arbitrary rotations,but for the application targeted by the work presented here, itboils down to a standard von-Mises distributions on Sd−1:
Ko(xo, γoi (t)) = C(κ) exp
(κxoT γoi (t)
)

265
International Journal on Advances in Software, vol 9 no 3 & 4, year 2016, http://www.iariajournals.org/software/
2016, © Copyright by authors, Published under agreement with IARIA - www.iaria.org
with normalizing constant as given in (11). In the general case,it is also possible, writing the rotation as a sequence of moveson spheres Sd−1,Sd−2, . . . and the distribution as a product ofvon-Mises on each of them, to have a vector of parameters κ:it is the approach taken in [21] and it may be applied verbatimhere if needed.
The entropy of the system of curves is obtained from thedensity in G:
E(dG) = −∫GdG(x) log dG(x)dµG(x) (21)
with dµG the left Haar measure. Using again the fact that G is adirect product group, dµ is easily seen to be a product measure,with dxt, the usual Lebesgue measure on the translation part,dxs/xs on the scaling part and dxo on Sd−1 for the rotationpart. It turns out that the 1/xs term in the expression of dxs/xsis already taken into account in the kernel definition, due to thefact that it is expressed in logarithmic coordinates. The sameis true for the von-Mises kernel, so that in the sequel only the(product) Lebesgue measure will appear in the integrals.
Finding the system of curves with minimum entropy re-quires a displacement field computation as detailed in [16].For each curve γi, such a field is a mapping ηi : [0, 1]→ TGwhere at each t ∈ [0, 1], ηi(t) ∈ TGγi(t). Compare to theoriginal situation where only spatial density was considered,the computation must now be conducted in the tangent spaceto G. Even for small problems, the effort needed becomesprohibitive. In Section V, we will present in detail an efficientimplementation of this algorithm. First, note that the structureof the kernel involved in the density can help in cutting theoverall computations needed. Since it is a product, and thetranslation part is compactly supported, being an Epanechnikovkernel, one can restrict the evaluation to points belonging to itssupport. Density computation will thus be made only in tubesaround the trajectories. Second, for the target application thatis to cluster the flight paths into a route network and is of purespatial nature, there is no point in updating the rotation andscaling part when performing the moves: only the translationpart must change, the other two being computed from thetrajectory. The initial optimization problem in G may thusbe greatly simplified. Finally, binning techniques [22] willbe used to reduce the computational cost of the translation,rotation and scale components in the kernel K.
Let ε be an admissible variation of curve γi, that is asmooth mapping from [0, 1] to TG with ε(t) ∈ Tγi(t)G andε(0) = ε(1) = 0. We assume furthermore that ε has only atranslation component. The derivative of the entropy E(dG)with respect to the curve γi is obtained from the first orderterm when γi is replaced by γi + ε. First of all, it has to benoted that dG is a density and thus has unit integral regardlessof the curve system. When computing the derivative of E(dG),the term
−∫GdG(x)
∂γidG(x)
dG(x)dµG(x) = −
∫G∂γidG(x)dµG(x)
will thus vanish. It remains:
−∫G∂γidG(x) log dG(x)dµG(x).
The density dG is a sum on the curves, and only the i-th termhas to be considered. Starting with the expression from (16),
one term in the derivative will come from the denominator. Itcomputes the same way as in [16] to yield:
γt′′i (t)
〈〈γ′i(t), γ′i(t)〉〉G
∣∣∣∣NE(dG) (22)
Please note that the second derivative of γi is considered onlyon its translation component, but the first derivative makes useof the complete expression. As before, the notation |N standsfor the projection onto the normal component to the curve.
The second term comes from the variation of the numerator.Using the fact that the kernel is a product KtKsKo and thatall individual terms have a unit integral on their respectivecomponents, the expression becomes very similar to the caseof spatial density only and is:
−(∫GK (x, γi(t)) log dG(x)dµG(x)
)γt′′i (t)
〈〈γ′i(t), γ′i(t)〉〉1/2G
∣∣∣∣∣N
(23)
+
∫Rde(t)Kt′ (xt, γti (t)) log dG(x)〈〈γ′i(t), γ′i(t)〉〉
1/2G dxt
(24)
with:e(t) =
γti (t)− xt
‖γti (t)− xt‖
∣∣∣∣N.
V. IMPLEMENTATION
Two computational bottlenecks are associated with theimplementation of the clustering algorithm. The first one is thecomputation of the curve system density and the second one isthe entropy minimization, which relies on gradient iterations.These two aspects will be separately treated in the sequel.Please note that the algorithms introduced are mainly tailoredfor the application in air traffic and may not be adequate toproblems with different state spaces.
A. Density evaluationAssuming that the original trajectories are planar, the
overall dimension of the Lie group G is 4. The method requiresthe evaluation of the integral
E(dG) = −∫GdG(x) log dG(x)dµG(x) (25)
that has potentially a very high computational cost. However,as mentioned in Section III-B, G is a direct product, so that theHaar measure µG splits into three terms: one that is the usualLebesgue measure on R2, the second one that is the Lebesguemeasure on the unit circle and the last being of the form ds/s.Let a point x in G be represented as (x1, x2, θ, s) with (x1, x2)the spatial component in R2, θ be the angle giving the positionon the unit circle (with the usual identification 2π = 0) and sbe the scale factor. The integral (25) becomes:
E(dG) = (26)
−∫R2
∫ 2π
0
∫R+
dG(x1, x2, θ, s) (27)
log dG(x1, x2, θ, s)dx1dx2dθds
s(28)
In computer implementation, multi-dimensional integralscan be evaluated either using polynomial approximations on

266
International Journal on Advances in Software, vol 9 no 3 & 4, year 2016, http://www.iariajournals.org/software/
2016, © Copyright by authors, Published under agreement with IARIA - www.iaria.org
a discrete grid [23] or Monte-Carlo methods when the di-mensionality of the problem induces an intractable computa-tional cost. In the present case, where the integration has tobe conveyed in four dimensions, grid based approaches canstill be applied. Extension to trajectories with values in R3
will increase the dimension to 6 which mandates the use ofstochastic approximations. In any case, it must be noted that ahigh accuracy in the result is not needed, so that randomizedalgorithms may be used without impairing the convergence ofthe subsequent gradient iteration.
The computation of the density itself is more constrainingas its original definition involves for each point where its valueis needed a summation of integrals over all trajectories whichmay quickly become prohibitive. In a previous work [16]where the density was two-dimensional, a grid based approachwas selected, which allows a very simple discrete convolutionformulation. Here, due to the higher dimensionality, a crudeextension of the method seems to yield an unacceptableincrease of both the computational cost and memory footprint.However, it turns out that the problem is less complex thanexpected as a result of the product form of the kernel. Startingwith the expression (16), the critical point in the evaluation ofthe density at a given point x = (x1, x2, θ, s) is the sum:
N∑i=1
∫ 1
0
K (x, γi(t)) 〈〈γ′i(t), γ′i(t)〉〉1/2γi(t)
dt. (29)
Using any classical quadrature formula, the integral may bereduced to a finite sum, yielding a double sum:
N∑i=1
Mi∑j=1
wijK (x, γi(tij)) 〈〈γ′i(tij), γ′i(tij)〉〉1/2γi(tij)
(30)
where Mi is the number of sample points tij chosen ontrajectory i and the wij are the quadrature weights. Theexpression (30) is fully general, but a simpler choice is madein practice: the sampling points tij are selected to be evenlyspaced and the weights all equal to 1. It is nothing but therectangle quadrature formula, whose accuracy is sufficient forthe application in mind. Switching to a higher order formulais straightforward. In (30), the evaluation of the kernel has thehighest cost since the norm 〈〈γ′i(tij), γ′i(tij)〉〉
1/2γi(tij)
does notdepend on x and can be computed once for all. To compute thedensity at a single point, the total number of kernel evaluationsis∑Ni=1Mi, with typical values of N = 100,Mi = 20 for the
analysis of a control sector to N = 10000,Mi = 100 in thecase of a country sized airspace. While acceptable in the firstcase, a direct application of the formula is not efficient enoughin the second.
Recalling that the kernel K is a product of three elementarykernels K = KtKoKs, it is clear that K will vanish outsideof the support of any of the three. As mentioned before, Kt isselected to be an Epanechnikov kernel which is compactlysupported, so that K itself will vanish when the distancebetween the translation components of x and γi(tij) is largeenough. The sum (30) will thus have almost all terms vanishingif the bandwidth of Kt is adequately selected. Finally, usingthe t superscript to denote the translation part of the points:
Kt(xt, γti (tij)) =
2
πep(‖xt − γti (tij)‖
)
with ep : x ∈ R+ 7→ (1− x2)1[0,1](x).The final step towards efficient evaluation of the density
is to reduce the computation to points located on a evenlyspaced grid. This procedure is known in the non-parametricstatistics community as binning [22]. First of all, the domainof interest in the translation component is assume to be of theform [a1, b1]× [a2, b2], which fits almost all possible cases in areal world application. For the air traffic clustering problem, itis a box covering the investigated airspace. Letting L1, L2 bethe respective number of grid points desired in each direction,an evenly spaced grid is constructed by taking as vertices thepoints:
xtk,l =
(a1 +
k(b1 − a1)
L1 − 1, a2 +
l(b2 − a2)
L2 − 1
)with k ∈ 0, . . . L1−1, l ∈ 0, . . . , L2−1 and L1 > 1, L2 >1. Please note that the vertices xk,l define implicitly bins thatare rectangular cells [xk,l, xk+1,l]× [xk,l, xk,l+1]. The densitywill be evaluated at the vertices of the grid only, resultingin a final approximation made of L1 × L2 discrete values.Furthermore, sample points γi(tij) will be considered equalto the grid vertex xk,l that is closest to it (the case of ties upto machine precision is unlikely to appear, but can be solved byeither randomly drawing the vertex among those equally closeor splitting the observation between ex-aequo vertices). Dueto this approximation, the norm ‖xt−γti (tij)‖ can only take afinite number of values, namely the distances between any pairof vertices and can thus be precomputed. Furthermore, sincethe kernel Kt is compactly supported, the number of non-zerosvalues is in practice much lower than the size of the grid.
Binning is used also for the rotation and scale componentswith respective kernels Ko and Ks. In both cases, the supportof the kernel is identical to the domain of variation itself, sothat cutting the computation cost using the previous trick isquite difficult. For the specific application to air traffic analysis,two remarks can be made:
• Within the frame of the current airspace organization,aircraft are bound to follow quite narrow paths. Evenin the future, a complete free flight cannot be imaginedunless humans are removed from the loop, which isnot intended. As a consequence, one can assume aquite small bandwidth for the von-Mises kernel Ko.
• The main use of the rotation and scale componentsis to disambiguate between flows that are spatiallyclosed, but with otherwise very different behaviors:opposite headings, different speed categories. In thesescases, a fine representation of the rotation and scalecomponents is not needed, as the observed values areexpected to be well separated.
Gathering things together, a coarse grid was selected forbinning the rotation and scale components. In the experimentsconducted so far, a 10× 10 was enough to ensure the desiredbehavior. Since the translation component is discretized on a100×100, the overall bins number is 1e6, which is well withinacceptable limits for memory footprint (around 10MB withcurrent implementation).
In the first of the complete density computation algorithm,the density grid is created as a block matrix M of size m1 ×m2, where m1,m2 are the respective number of bins desiredin each component and each block is of size p×q, with p (resp.

267
International Journal on Advances in Software, vol 9 no 3 & 4, year 2016, http://www.iariajournals.org/software/
2016, © Copyright by authors, Published under agreement with IARIA - www.iaria.org
q) the number of bins in the rotation (resp. scale) component.The domain of variation for the translation component is arectangle [a1, b1]× [a2, b2], the interval [0, 2π] for the rotationand [s1, s2] for the scale. An elementary cell in the grid wherea given point (x1, x2, θ, s) lies can be determined using thefollowing procedure:
• The block coordinates (i, j) is found from the couple(x1, x2) as:
i = (m1 − 1)x1 − a1
b1 − a1, j = (m2 − 1)
x2 − a2
b2 − a2.
• Within the block Mi,j , the respective rotation andscale indices (k, l) are obtained pretty much by thesame way:
k = (p− 1)θ
2π, l = (q − 1)
s− s1
s2 − s1.
Please note that all indices are zero-based, so thatM0,0 is thefirst block in the matrixM. Actual elements inM are referredto using quadruples (i, j, p, q), with the first two componentsdesigning the block and the remaining two locating the elementin the block.
As mentioned above, a benefit of the binning procedureis the ability to pre-compute the kernel values, since thedifference between any two grid points is known. As anexample, for the translation component, the value for the kernelKt can be stored as a m1m2 ×m1m2 matrix Kt with entriesKt(i,j),(k,l) = Kt
(d(i,j),(k,l)
)and:
d(i,j),(k,l) =
√(k − ib1 − a1
)2
+
(l − jb2 − a2
)2
.
The storage size is m21 × m2
2 and seems prohibitive, but itturns out that most of the element values are redundant. It isassumed that the matrix Kt is stored in a lexicographic order,that is couples (i, j) are stored in increasing i then increasingj order. Kt is clearly symmetric, and all the elements on thediagonal have the same value Kt(0). Furthermore, since thedistance d(i,j),(k,l) is based only on the differences k − i andl − j, it is invariant if the same shift (p, q) is applied to bothcouples. It implies that the matrix Kt has a block structure thatis represented as:
A0 A1 . . . . . . Am2
A1 A0 . . . . . . Am2−1
......
......
...Am2 . . . . . . A1 A0
.
Each block Ai is symmetric and within a given block, all thediagonals are equal, thanks again to the integer shift invarianceproperty. Therefore, the storage really required is just m1×m2
that is no more than the number of grid points. Please note thatit is due entirely to the shift invariance property, that comesfrom the translation invariance of the distance: using moregeneral kernels that do not exhibit invariance properties willrequire storing the full Kt matrix: in practical implementations,it is thus highly desirable to stick to distance based kernels.
A further reduction of complexity comes from the fact thatKt is compactly supported: for distance greater than a giventhreshold, Kt will be identically 0. It means that only a subsetof the blocks Ai will not vanish. Within the blocks themselves,
when the bandwidth parameter is low enough, only a subsetof the diagonals will be non zero. As a consequence, the realneeded storage is only a fraction of the original one and iswell below m1 ×m2. In practice, the most convenient way isto store data in a u× v matrix Kt with entries:
Ktij = Kt
√( i
b1 − a1
)2
+
(j
b2 − a2
)2 .
The size of Kt is of course depending on the kernel bandwidth,but is generally in the order of one tenth to one fifth of thesize of M in each coordinates.
On the rotation and scale components, there is no particularvanishing property that can be used. Except when dealingwith very small bandwidths, there is no interest in having lesskernel values stored that possible distances. In the sequel, thecorresponding vectors will be denoted as Ko (resp. Ks) withsize p (resp. q).
The density computation can then be performed using theAlgorithm 1. On completion, the block matrix M containsas entries the density up to a scalar. Normalizing it so thatall its elements sum to 1 yields the final density estimate.In practical implementations, the matrix M will have all itselements stored contiguously.
Algorithm 1 Density computation
1: M← 02: for i = 0 . . . N − 1 do3: for j = 0 . . .Mi − 1 do4: x← γti (tj)5: (k, l,m, n)← coordinate of cell containing x6: UPDATE(k,l,m,n)7: end for8: end for9: procedure UPDATE(k,l,m,n)
10: for i = −u . . . u do11: if k + i ≥ 0|k + i < N then12: for j = −v . . . u do13: if l + j ≥ 0|l + j < Mi then14: kt← Kt
|i||j|15: UPDATEINNERBLOCK(kt, k+i,l+j,m,n)16: end if17: end for18: end if19: end for20: end procedure21: procedure UPDATEINNERBLOCK(kt, k,l,m,n)22: for i = 0 . . . p do23: ir ← (m+ i) mod p24: kθ ← Kθ
ir25: for j = 0 . . . q do26: js← n+ j27: if js < q then28: ks← Ks
js29: Mk,l,ir,js ←Mk,l,ir,js + kt ∗ kθ ∗ ks30: end if31: end for32: end for33: end procedure
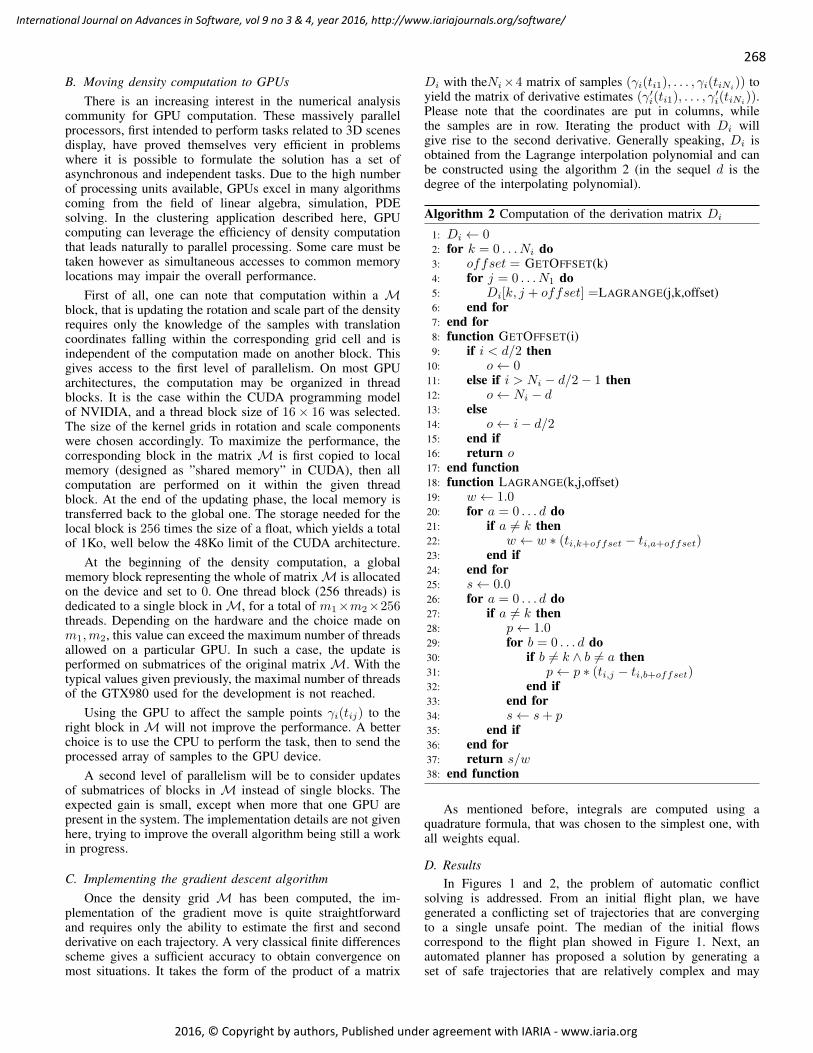
268
International Journal on Advances in Software, vol 9 no 3 & 4, year 2016, http://www.iariajournals.org/software/
2016, © Copyright by authors, Published under agreement with IARIA - www.iaria.org
B. Moving density computation to GPUsThere is an increasing interest in the numerical analysis
community for GPU computation. These massively parallelprocessors, first intended to perform tasks related to 3D scenesdisplay, have proved themselves very efficient in problemswhere it is possible to formulate the solution has a set ofasynchronous and independent tasks. Due to the high numberof processing units available, GPUs excel in many algorithmscoming from the field of linear algebra, simulation, PDEsolving. In the clustering application described here, GPUcomputing can leverage the efficiency of density computationthat leads naturally to parallel processing. Some care must betaken however as simultaneous accesses to common memorylocations may impair the overall performance.
First of all, one can note that computation within a Mblock, that is updating the rotation and scale part of the densityrequires only the knowledge of the samples with translationcoordinates falling within the corresponding grid cell and isindependent of the computation made on another block. Thisgives access to the first level of parallelism. On most GPUarchitectures, the computation may be organized in threadblocks. It is the case within the CUDA programming modelof NVIDIA, and a thread block size of 16× 16 was selected.The size of the kernel grids in rotation and scale componentswere chosen accordingly. To maximize the performance, thecorresponding block in the matrix M is first copied to localmemory (designed as ”shared memory” in CUDA), then allcomputation are performed on it within the given threadblock. At the end of the updating phase, the local memory istransferred back to the global one. The storage needed for thelocal block is 256 times the size of a float, which yields a totalof 1Ko, well below the 48Ko limit of the CUDA architecture.
At the beginning of the density computation, a globalmemory block representing the whole of matrixM is allocatedon the device and set to 0. One thread block (256 threads) isdedicated to a single block inM, for a total of m1×m2×256threads. Depending on the hardware and the choice made onm1,m2, this value can exceed the maximum number of threadsallowed on a particular GPU. In such a case, the update isperformed on submatrices of the original matrix M. With thetypical values given previously, the maximal number of threadsof the GTX980 used for the development is not reached.
Using the GPU to affect the sample points γi(tij) to theright block in M will not improve the performance. A betterchoice is to use the CPU to perform the task, then to send theprocessed array of samples to the GPU device.
A second level of parallelism will be to consider updatesof submatrices of blocks in M instead of single blocks. Theexpected gain is small, except when more that one GPU arepresent in the system. The implementation details are not givenhere, trying to improve the overall algorithm being still a workin progress.
C. Implementing the gradient descent algorithmOnce the density grid M has been computed, the im-
plementation of the gradient move is quite straightforwardand requires only the ability to estimate the first and secondderivative on each trajectory. A very classical finite differencesscheme gives a sufficient accuracy to obtain convergence onmost situations. It takes the form of the product of a matrix
Di with theNi×4 matrix of samples (γi(ti1), . . . , γi(tiNi)) toyield the matrix of derivative estimates (γ′i(ti1), . . . , γ′i(tiNi)).Please note that the coordinates are put in columns, whilethe samples are in row. Iterating the product with Di willgive rise to the second derivative. Generally speaking, Di isobtained from the Lagrange interpolation polynomial and canbe constructed using the algorithm 2 (in the sequel d is thedegree of the interpolating polynomial).
Algorithm 2 Computation of the derivation matrix Di
1: Di ← 02: for k = 0 . . . Ni do3: offset = GETOFFSET(k)4: for j = 0 . . . N1 do5: Di[k, j + offset] =LAGRANGE(j,k,offset)6: end for7: end for8: function GETOFFSET(i)9: if i < d/2 then
10: o← 011: else if i > Ni − d/2− 1 then12: o← Ni − d13: else14: o← i− d/215: end if16: return o17: end function18: function LAGRANGE(k,j,offset)19: w ← 1.020: for a = 0 . . . d do21: if a 6= k then22: w ← w ∗ (ti,k+offset − ti,a+offset)23: end if24: end for25: s← 0.026: for a = 0 . . . d do27: if a 6= k then28: p← 1.029: for b = 0 . . . d do30: if b 6= k ∧ b 6= a then31: p← p ∗ (ti,j − ti,b+offset)32: end if33: end for34: s← s+ p35: end if36: end for37: return s/w38: end function
As mentioned before, integrals are computed using aquadrature formula, that was chosen to the simplest one, withall weights equal.
D. ResultsIn Figures 1 and 2, the problem of automatic conflict
solving is addressed. From an initial flight plan, we havegenerated a conflicting set of trajectories that are convergingto a single unsafe point. The median of the initial flowscorrespond to the flight plan showed in Figure 1. Next, anautomated planner has proposed a solution by generating aset of safe trajectories that are relatively complex and may

269
International Journal on Advances in Software, vol 9 no 3 & 4, year 2016, http://www.iariajournals.org/software/
2016, © Copyright by authors, Published under agreement with IARIA - www.iaria.org
fail to be manageable by air traffic controllers. In Figure 2,the minimization entropy criterion has deformed the proposedflight paths and produced straighten trajectories with route-like behavior. The median of the initial and the final flows arerepresented in Figures 1 and 2.
Figure 1. Initial flight plan.
Figure 2. Entropy minimal curve system from the initial flight plan.
However, because the spatial density is not sensitive to thedirectional information, the entropy based procedure will tendto aggregate flight paths that should be sufficiently separatedsuch that trajectories with opposite directions. The Lie groupmodeling will take into account the direction and the positionof the curves and the algorithm works as expected, avoidinggoing too close to trajectories with opposite directions asindicated on Figure 3. Note that using the Lie approachproperly separates the two left flight paths that have similarshape but opposite directions.
In a more realistic setting, arrivals and departures atToulouse Blagnac airport were analyzed. The dataset used wasa a record of approximately 1700 trajectories between ParisOrly and Toulouse Blagnac. The projection used focuses onBlagnac and exaggerates the lateral deviation to enlighten thefluxes separation. The algorithm performs well as indicatedon Figure 4. Four clusters are identified, with mean linesrepresented through a spline smoothing between landmarks.It is quite remarkable that all density-based algorithms wereunable to separate the two clusters located at the right sideof the picture, while the present one clearly show a standard
Figure 3. Clustering using the Lie approach.
approach procedure and a short one.
Figure 4. Mean cluster trajectories at Toulouse airport (nautical miles). Redarrivals and grey departures.
An important issue still to be addressed with the extendedalgorithm is the increase in computation time that reaches 20times compared to the approach using only spatial density en-tropy. In the current implementation, the time needed to clusterthe traffic presented in Figure 3 is in the order of 0.01s on aXEON 3Ghz machine and with a pure java implementation.For the case of Figure 4, 5 minutes are needed on the samemachine for dealing with the set of 1784 trajectories.
Finally, a similar procedure was used to obtain the so-calledbundled traffic. Here the purpose of the algorithm is not tocluster flight paths, but instead simplify the picture so that anoperator is able to extract quickly the interesting features. Theheading information was not used in the experiments, sincethe main goal was to extract the major flows followed by theaircraft so as to dimension the airspace sectoring. One picturerepresents one day of recorded traffic over France, with all lowaltitude flights removed: they correspond to general aviationand are not to be considered in the design of the airspace.Roughly 8000 trajectories are processed for one day. Sincethere is no heading information, the execution time is greatlyreduced. Furthermore, the software was implemented here inC++, resulting in a total processing time of 5 seconds on thesame machine as above.

270
International Journal on Advances in Software, vol 9 no 3 & 4, year 2016, http://www.iariajournals.org/software/
2016, © Copyright by authors, Published under agreement with IARIA - www.iaria.org
Figure 5. Recorded trajectories for one day traffic over France.
Figure 6. Bundled trajectories.
VI. CONCLUSION AND FUTURE WORK
The entropy associated with a system of curves has proveditself efficient in unsupervised clustering application whereshape constraints must be taken into account. For using it inaircraft route design, heading and velocity information must beadded to the state vector, inducing an extra level of complexity.In our algorithm, we cannot enforce the regulatory separationnorms, just construct clusters with low interactions. Please notethat we can consider the current algorithm as a preprocessingphase. In a second step, we could imagine running an algorithmbased on, for instance, optimal control in order to keep in linewith the minimum separation norms. The present work relieson a Lie group modeling as an unifying approach to staterepresentation. It has successfully extended the notion of curvesystem entropy to this setting, allowing the heading/velocity tobe added in a intrinsic way. The method seems promising, asindicated by the results obtained on simple synthetic situations,
but extra work needs to be dedicated to algorithmic efficiencyin order to deal with the operational traffic datasets, in theorder of tens of thousand of trajectories.
Moreover, the choice of the kernel bandwidth parametersshould be explored in the next step of this work. Indeed, asit is noted in [2], kernel bandwidth values will influence theeffect of the minimization entropy procedure on the curvestraightening: straightening is preeminent for low values, whilegathering dominates at high bandwidths. An automatic proce-dure in the choice of bandwidth parameter is then desirable andan adaptive bandwidth procedure may be of some interest.
Generally speaking, introducing a Lie group approach todata description paves the way to new algorithms dedicatedto data with a high level of internal structuring. Studies areinitiated to address several issues in high dimensional dataanalysis using this framework.
REFERENCES
[1] F. Nicol and S. Puechmorel, “Unsupervised aircraft trajectories cluster-ing: a minimum entropy approach,” in ALLDATA 2016, The SecondInternational Conference on Big Data, Small Data, Linked Data andOpen Data. Lisbon, Portugal: IARIA, 2016.
[2] S. Puechmorel and F. Nicol, “Entropy minimizing curves withapplication to flight path design and clustering,” Entropy, vol. 18,no. 9, 2016, p. 337. [Online]. Available: http://www.mdpi.com/1099-4300/18/9/337
[3] M. Enriquez, “Identifying temporally persistent flows in the terminalairspace via spectral clustering,” in ATM Seminar 10, FAA-Eurocontrol,Ed., 06 2013.
[4] M. El Mahrsi and F. Rossi, “Graph-based approaches to clusteringnetwork-constrained trajectory data,” in New Frontiers in Mining Com-plex Patterns, ser. Lecture Notes in Computer Science, A. Appice,M. Ceci, C. Loglisci, G. Manco, E. Masciari, and Z. Ras, Eds. SpringerBerlin Heidelberg, 2013, vol. 7765, pp. 124–137.
[5] J. Kim and H. S. Mahmassani, “Spatial and temporal characterizationof travel patterns in a traffic network using vehicle trajectories,”Transportation Research Procedia, vol. 9, 2015, pp. 164 – 184, papersselected for Poster Sessions at The 21st International Symposium onTransportation and Traffic Theory Kobe, Japan, 5-7 August, 2015.
[6] M. Ester, H. P. Kriegel, J. Sander, and X. Xu, “A density-basedalgorithm for discovering clusters in large spatial databases with noise.”AAAI Press, 1996, pp. 226–231.
[7] N. Ferreira, J. T. Klosowski, C. E. Scheidegger, and C. T. Silva, “Vectorfield k-means: Clustering trajectories by fitting multiple vector fields,”in Computer Graphics Forum, vol. 32, no. 3pt2. Blackwell PublishingLtd, 2013, pp. 201–210.
[8] T. W. Liao, “Clustering of time series data - a survey,” PatternRecognition, vol. 38, 2005, pp. 1857–1874.
[9] S. Rani and G. Sikka, “Recent techniques of clustering of time seriesdata: A survey,” International Journal of Computer Applications, vol. 52,no. 15, August 2012, pp. 1–9, full text available.
[10] F. Ferraty and P. Vieu, Nonparametric Functional Data Analysis: Theoryand Practice, ser. Springer Series in Statistics. Springer, 2006.
[11] J. Ramsay and B. Silverman, Functional Data Analysis, ser. SpringerSeries in Statistics. Springer New York, 2006.
[12] W. Meesrikamolkul, V. Niennattrakul, and C. Ratanamahatana, “Shape-based clustering for time series data,” in Advances in KnowledgeDiscovery and Data Mining, ser. Lecture Notes in Computer Science,P.-N. Tan, S. Chawla, C. Ho, and J. Bailey, Eds. Springer BerlinHeidelberg, 2012, vol. 7301, pp. 530–541.
[13] A. Delaigle and P. Hall, “Defining probability density for a distributionof random functions,” The Annals of Statistics, vol. 38, no. 2, 2010,pp. 1171–1193.
[14] C. Bouveyron and J. Jacques, “Model-based clustering of time seriesin group-specific functional subspaces,” Advances in Data Analysis andClassification, vol. 5, no. 4, 2011, pp. 281–300.

271
International Journal on Advances in Software, vol 9 no 3 & 4, year 2016, http://www.iariajournals.org/software/
2016, © Copyright by authors, Published under agreement with IARIA - www.iaria.org
[15] S. Puechmorel, “Geometry of curves with application to aircraft trajec-tory analysis.” Annales de la faculte des sciences de Toulouse, vol. 24,no. 3, 07 2015, pp. 483–504.
[16] S. Puechmorel and F. Nicol, “Entropy minimizing curves with applica-tion to automated flight path design,” in GSI 2015, Second InternationalConference, Palaiseau, France, October 28-30, 2015. Springer, 2015.
[17] D. Scott, Multivariate Density Estimation: Theory, Practice, and Visu-alization, ser. A Wiley-interscience publication. Wiley, 1992.
[18] K. Mardia and P. Jupp, Directional Statistics, ser. Wiley Series inProbability and Statistics. Wiley, 2009.
[19] K. V. Mardia, “Statistics of directional data,” Journal of the RoyalStatistical Society. Series B (Methodological), vol. 37, no. 3, 1975, pp.349–393.
[20] E. Garcıa-Portugues, R. M. Crujeiras, and W. Gonzalez-Manteiga,“Kernel density estimation for directional–linear data,” Journal ofMultivariate Analysis, vol. 121, 2013, pp. 152–175.
[21] P. E. Jupp and K. V. Mardia, “Maximum likelihood estimators for thematrix von mises-fisher and bingham distributions,” Ann. Statist., vol. 7,no. 3, 05 1979, pp. 599–606.
[22] M. P. Wand, “Fast computation of multivariate kernel estimators,”Journal of Computational and Graphical Statistics, vol. 3, no. 4, 1994,pp. 433–445.
[23] G. Dahlquist and A. Bjorck, Numerical Methods in ScientificComputing: Volume 1, ser. SIAM e-books. Society forIndustrial and Applied Mathematics, 2008. [Online]. Available:https://books.google.fr/books?id=qy83gXoRps8C
272
International Journal on Advances in Software, vol 9 no 3 & 4, year 2016, http://www.iariajournals.org/software/
2016, © Copyright by authors, Published under agreement with IARIA - www.iaria.org
An Approach to Automatic Adaptation of DAiSI Component Interfaces
Yong Wang and Andreas Rausch
Department of Informatics
Technical University Clausthal
Clausthal-Zellerfeld, Germany
e-mail: yong.wang, [email protected]
Abstract— The Dynamic Adaptive System Infrastructure (DA-
iSI) is a platform which supports dynamic adaptive system.
DAiSI can change its behavior at runtime. Behavioral changes
can be caused by user’s needs, or based on context information
if the system environment changes. It is a run-time infrastruc-
ture that operates on components that comply with a DAiSI-
specific component model. The run-time infrastructure can
integrate components into the system that were not known at
design-time. Communication between components in DAiSI is
supported by services. Services of components are described by
domain interfaces, which have to be specified by the compo-
nent developer. Components can use services of other compo-
nents, if the respective required and provided domain interfac-
es of components are compatible. However, sometimes services
that have been developed by different developers can do the
same thing, e.g., provide the same data or operations, but they
are represented by different syntactic. Therefore, in a previous
article, we present an approach which enables the use of syn-
tactically incompatible service by using an ontology-based
adapter that connects services, which provide the same data in
different format. In this paper we use an existing ontology to
semantically describe interfaces of components and present an
improved algorithm using SPARQL and reasoning to discover
interfaces in triplestore. In addition, we propose to use the
historical data to predict the best suitable interface.
Keywords—component models; self-adaptation; dynamic
adaptive systems; ontology.
I. INTRODUCTION
An increasing interest in dynamic adaptive systems could be observed in the last two decades. A platform for such systems has been developed in our research group for more than ten years. It is called Dynamic Adaptive System Infra-structure (DAiSI). DAiSI is a component based platform that can be used in self-managed systems. Components can be integrated into or removed from a dynamic adaptive system at run-time without causing a complete application to fail. To meet this requirement, each component can react to changes in its environment and adapt its behavior accordingly.
Components are developed with a specific use-case in mind. Thus, the domain interfaces describing the provided and required services tend to be customized to very specific requirements of an application. This effect limits the re-use of existing components in new applications. The re-use of existing components is one key aspect in software engineer-ing for minimize re-developing existing components. One measure to aspect is to increase reusability. However, re-using components in other application contexts than they
have been originally developed for is still a big challenge. This challenge gets even bigger, if such components should be integrated into dynamic adaptive systems at run-time.
A valid approach to tackle this challenge is adaptation. Because of the nature of DAiSI platform, in DAiSI applica-tions, DAiSI components are considered as black boxes. Capabilities and behavior of DAiSI components are specified by interfaces that describe required and provided services. In this approach, we suggest a solution to couple provided and required services that are syntactically incompatible but semantically compatible. To be able to utilize specific pro-vided services that offer the needed data or operations on a semantical level, we suggest constructing an adapter that enables interaction between services that are only compatible on some semantical level [1].
The goal of an adapter is to enable communication be-tween two formerly incompatible components. In order to achieve a common understanding between components, a common knowledge-base is needed. In this work we use ontology as the common knowledge-base to represent ser-vices and the schema of data. Ontology and run-time infor-mation represented by an ontology language are stored in triplestore. Required interfaces can discover/map the repre-sentation of provided interfaces in the database by using a Query Engine. To illustrate that this approach is suitable for adaptive systems, we extend our DAiSI infrastructure by an ontology-based adapter engine for service adaptation.
To strengthen the dynamic adaptive nature of the DAiSI, we generate these adapters at run-time. We argue that these adapters cannot be generated at compile time, because the different components that should interact with each other are not known at compile time, but only at integration time, which is the same requirement just like dynamic adaptive systems.
In this work, we improve the algorithm for discovery of the provided interfaces with using semantic query language and reasoning. Programming interfaces with semantic nota-tion are translated firstly into triplestore readable semantic format and then stored into the triplestore. Required interfac-es can discover the required interfaces with help of their semantic description and relation of used ontologies. As opposed to by discovery one-to-one relation of entities of function, input- and output parameters between provided and required interfaces in OWL file, discovery of provide inter-faces is supported by using SPARQL, which can represent the entire required interface based on the graph pattern in-cluding filter function. Especially, in this work, we use the

273
International Journal on Advances in Software, vol 9 no 3 & 4, year 2016, http://www.iariajournals.org/software/
2016, © Copyright by authors, Published under agreement with IARIA - www.iaria.org
historical data of output parameters of interface to predicate and filter for discovered provided interfaces.
To illustrate this approach, we use a parking space exam-ple to show how to create an adapter to enable interaction between semantical identical components that have been developed by different developers or for different applica-tions.
The rest of this paper is structured as follows: In Section II, we describe the already sketched problem in more detail. Section III gives an overview of relevant related work. In Section IV, we give a short overview of the DAiSI compo-nent model and a few hints for further reading. Section V explains structure of the adapter engine and adaptation pro-cesses. In Section VI, we show Interface description with using ontology layer. Section VII explains the discovery process of provided services based on query engine and triplestore, before the paper is wrapped up by a short conclu-sion in Section VIII.
II. PROBLEM DESCRIPTION
Specifications of interfaces between the components in a dynamic adaptive application are mostly the early stage of developing process. Specified interfaces could not be changed, whenever a dynamic adaptive application is devel-oped. They are very domain specific and their definition is driven by the use cases of the future application in mind. To ensure many applications run in a shared context with other applications from different domains, all specified interfaces are centrally managed in a library that is so called interface pool.
It is a tedious task to harmonize one large interface pool among different developers from different vendors that oper-ate in different domains. It often causes results in a slow standardization process. This slows the development process down and, especially in dynamic adaptive systems, dimin-ishes the chances for the development of new applications. Developers will in those cases often start their own interface pool. This, on the other hand, reduces the chances to re-use existing components from other domains.
Additionally, the management of one central interface pool in a distributed system does not scale well. One way to mitigate this issue would be a de-centralization of manage-ment of interfaces. To tackle these challenges, we propose to keep the domain interfaces in de-centralization and allow the domain interfaces between different domains un-harmonized.
To be able to harmonize services across domains, every interface pool is required to use ontology. By either merging these ontologies later, or by using distributed ontologies we ensure that interfaces from different interface pools base on a common knowledge. Based on common knowledge, on-the-fly generated adapters enable to interaction syntactically incompatible services across domains.
Services of components can be provided by implement-ing domain interfaces, so called provided services. Desired services of components can be specified by other domain interfaces, so called required services. In this case, required and provided interfaces could not be the same domain inter-face. In order to build communication between provided and
required services, they must stand in relation to each other, mapping between provided and required services are neces-sary. In the graphical notation of DAiSI components, provid-ed services are marked as filled circles, required services are noted as semi-circles (similar to the UML lollipop notation [2]) and the relation between those two services are depicted by interfaces notations in domain area and across the DAiSI components linking interface for provided and required ser-vices (cf. Figure 1).
Domain
<<interface>>RequiredService
<<interface>>ProvidedService
Component development
config 1
config 2
config 1
Figure 1. DAiSI components and domain specific interface definitions.
We propose that services that are semantically compati-
ble, but lack compatibility on a syntactical level, should be usable. For example, an application wants to use parking spaces information, which is supported by different system providers. Each provider has its own service, they are mostly not compatible. The lack of compatibility can be covered by the following three types of incompatibility: Different Nam-ing, Different Data Structure, and Different Control Struc-ture. Adapters between the different services can be generat-ed. We believe that we can connect all semantically compat-ible but syntactically incompatible services using adaptation based on these three types. We illustrate the three types of incompatibility below with parking use case.
A. Different Naming
By “Different Naming” we denote cases in which the names of interfaces describing services or names of functions do not match. While they are syntactically different, their names share the same semantics and could be used synony-mous.
Figure 2. Example of two interfaces with Different Naming.
<<Interface>> ParkingSpaceInterface
getParkingSpaces (): ParkingSpace []
<<Interface>> ParkingSlotInterface
getParkingSlots (): ParkingSpace []

274
International Journal on Advances in Software, vol 9 no 3 & 4, year 2016, http://www.iariajournals.org/software/
2016, © Copyright by authors, Published under agreement with IARIA - www.iaria.org
The first example, depicted in Figure 2, shows two inter-
faces: ParkingSlotInterface and Parking-
SpaceInterface. Each of them defines one of the fol-
lowing methods: getParkingSlots, and get-
ParkingSpaces respectively. The names of their input- and output parameter of the methods are identical. They are named differently, but offer the same service.
B. Different Data Structure
In this type of incompatibility, the names of the interfac-es and their functions are the same. However, the parameters differ in their data types. Moreover, the encapsulated data is similar and the data structures can be mapped to each other. In Figure 3, in the Different Data Structure example an inter-
face ParkingSpaceInterfacePV is depicted. It con-
tains a function getParkingSlots which returns a
parameter of the type ParkingSpace. In the interface
ParkingSpaceInterfaceCS, there is a function get-
ParkinSlots, with the same name but different output
parameter ParkingSlot.
Figure 3. Example of two interfaces with a Different Data Structure.
C. Different Control Structure
In this case, the functions between provided interface and required interface have not one to one relation. One function could be mapped to many functions. To obtain valid results, the control structure has to be modified. In the example in
Figure 4, two interfaces ParkingSpaceInterface and
ParkingSpaceInterfaceTUC are given. By defini-tion, an opening hour should be composed of the start– and
the end time name of a parking space. As such, the two func-
tions getParkingSpaceOpenHour and get-
ParkingSpaceClosedHour from the Parking-
SpaceInterfaceTUC interface in comparison provide
the same information as getParkingSpaceOpening-
Hour from the ParkingSpaceInterface interface. Therefore, workflow of functions as a composite process is needed. A composite process specifies control structure of functions involved in the composition, in this example, a
sequence control workflow is need for getParking-
SpaceOpenHour and getParkingSpace-
ClosedHour to provide an integrated result to get-ParkingSpaceOpeningHour.
Figure 4. Example of two interface requiring Different Control Structures.
To enable the mapping between interfaces, a common
knowledge-base is needed. Because of the issues stated earli-er, it should not be mandatory that both sets of interface definitions are of the same domain. A common knowledge base defined by ontologies can be generated using merging or other integration mechanisms on classical ontology lan-guages or by using a distributed ontology language. Both interfaces do not need to contain information on how to interpret the data of each other. That means that interfaces can be developed independently, without knowing anything about a possible re-use in another system.
III. RELATED WORK
A dynamic adaptive system is a system that adjusts its structure and behavior according to the user’s needs or to a change in its system context at run-time. The DAiSI is one example of an infrastructure for dynamic adaptive systems [3][4][5][6]. It has been developed over more than a decade by a number of researchers. This work is based on DAiSI and extends the current run-time infrastructure.
According to a publication of M. Yellin and R. Storm, challenges regarding behavioral differences of components have been tackled by many researchers [7]. The behavior of the interface of a component can be described by a protocol with the help of state-machines. The states of two involved components are stored and managed by an adapter. In further steps of this method, ontology is used as a language library to describe a component’s behavior. To automate the adapta-tion of services, a semi-automated method has been devel-
<<Interface>> ParkingSpaceInterfacePV
getParkingSlots(ParkCity:String): ParkingSpace[]
<<class>> ParkingLocation
+ city : String
<<class>> ParkingSpace
+ parkingLocation : ParkingLocation + actualOccupancyStatus: boolean
<<Interface>> ParkingSpaceInterfaceCS
getParkingSlots(ParkCity:String): ParkingSlot[]
<<Interface>> ParkingSpaceInterface
getParkingSpaceOpeningHour (): OpeningHour
<<Interface>> ParkingSpaceInterfaceTUC
getParkingSpaceOpenHour (): dateTime getParkingSpaceClosedHour(): dateTime
<<class>> ParkingSlot
+ city : String + actualOccupancyStatus: boolean

275
International Journal on Advances in Software, vol 9 no 3 & 4, year 2016, http://www.iariajournals.org/software/
2016, © Copyright by authors, Published under agreement with IARIA - www.iaria.org
oped to generate adapters with the analysis of a possible behavioral mismatch [8][9].
Another solution for the connection of semantically in-compatible services is presented in [8]. They use buffers for the asynchronous communication between services and translate the contents of those buffers to match the syntacti-cal representations of the involved services. The behavioral protocols of services can automatically be generated with a tool that is based on synthesis– and testing techniques [10]. Ontologies are used in their method to describe the behavior of components and to create a tool for automated adaptation [11]. Mapping-driven synthesis focuses on mapping of ac-tions of the interfaces of services. Interfaces are identified by correspondence between actions of the interface of compo-nent based on the ontology and reasoning [12]. The data mapping is still not considered in this approach. All Ap-proaches mentioned above are based on state-machine. However, some components require a very complex state-machine; the development of which can easily become very expensive. Thus, in this work, we present another way that does not rely on the consideration of dependencies within the behavior or the involved interfaces.
The method of transformation of an ontology into inter-faces is already integrated into Corba Ontolingua [13]. With this tool an ontology can be transformed into the interface definition language (IDL). A. Kalyanpur [14] has developed a method which allows automatic mapping from Web Ontol-ogy Language (OWL) to Java. The Object Management Group (OMG) [15] has defined how to transform the Unified Markup Language (UML) into ontology. With their method, UML classes are first converted into a helper class and then transformed into ontology [16]. G. Söldner [17] has shown how to transform the UML itself into ontology. A downside of the above methods: The interface and the ontology have a strong relation. If a developer changes the ontology, all inter-faces which are linked to this ontology have to be modified. In this work, we decouple this strong relation. Alternating a part of the ontology now only affects the interfaces directly linked to the specific part.
Another approach for semantically described Web ser-vice is pressed in [18][19]. Web Service Modeling Ontology (WSMO) is ontology that can be used to describe various aspect related to semantic Web Services. Web Ontology Language for Services (OWL-S) is an ontology for describ-ing Web services. It consists of three elements, ServicePro-file, ServiceModel, and ServiceGrounding. Because of the similar structure of Web service and program interface, we consider OWL-S useful for semantic representation of pro-gramming interface of DAiSI components.
Matching and merging existing ontologies is still a big challenge regarding speed and accuracy. To simplify this, many application interfaces (APIs) have been developed, e.g., Agreement Maker [20] and Blooms [21]. Most of them follow a survey approach [22], or use data available on the Internet [23]. Many methods are used to match entities to determine an alignment, like testing, heuristics, etc. To im-prove accuracy, many of them use third-party vocabularies such as WordNet or Wikipedia. However, we simply use
ontology merging in our approach and we did not conduct further research on the challenges mentioned.
IV. THE DAISI COMPONENT MODEL
The DAiSI component model can best be explained with a sketch of a DAiSI component. Figure 5 shows a DAiSI component. The blue rectangle in the background represents the component itself. The provided and required services are depicted with full– and semi circles, as stated earlier. The dependencies between these two kinds of services are de-picted by the yellow bars. They are called component con-figurations. At run-time, only one component configuration can be active. Being active means that all connected, re-quired services are present and consumed (the dependencies could be resolved), and the provided services are being pro-duced. To avoid conflicts, the component configurations are sorted by quality with the best component configuration noted at the top (Conf1 in Figure 5) and the least favorable one noted at the bottom (Conf2 in our example). The follow-ing paragraphs explain the DAiSI component model, depict-ed in Figure 5.
Conf2
comp1
Conf1
Figure 5. A DAiSI component.
The component model is the core of DAiSI and has been
covered in much more detail in [24]. The component config-urations (yellow bars) are represented by class with the same
name. It is associated to a RequiredServiceRefer-
enceSet, which is called a set to account for cardinalities in required services. The provided services are represented
by the ProvidedService class. Interface roles, repre-
sented by InterfaceRole, allow the specification of additional constraints for the compatibility of interfaces that use run-time information, bound services and the internal state of a component, and are covered.
To be able to narrow the structure of a dynamic adaptive system down, blueprints of possible system configurations
can be specified. The classes Application, Template,
RequiredTemplateInterface, and ProvidedTem-
plateInterface are the building blocks in the compo-nent model that are used to realize application architecture
conformance. One Application contains a number of
Templates, each specifying a part of the possible applica-
tion. A Template defines (needs and offers) Re-
quiredTemplateInterfaces and ProvidedTem-
plateInterfaces which refer to DomainInterfac-
es and thus form a structure which can be filled with actual services and components by the infrastructure. More details
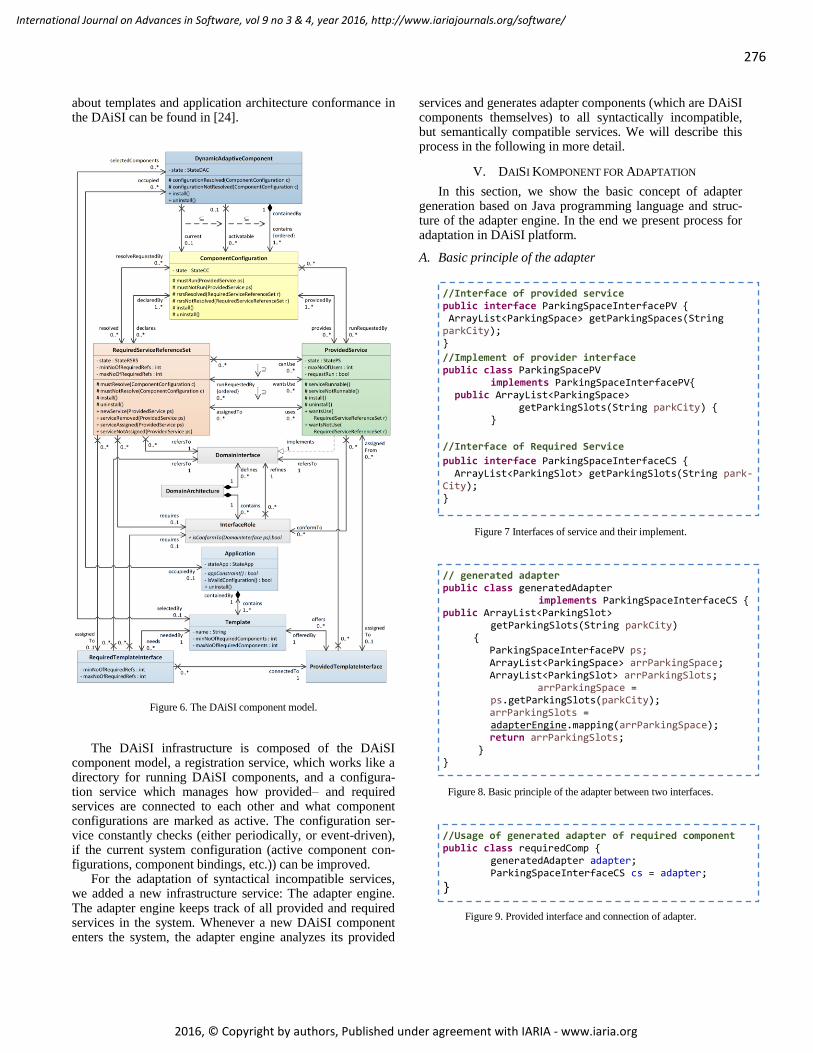
276
International Journal on Advances in Software, vol 9 no 3 & 4, year 2016, http://www.iariajournals.org/software/
2016, © Copyright by authors, Published under agreement with IARIA - www.iaria.org
about templates and application architecture conformance in the DAiSI can be found in [24].
Figure 6. The DAiSI component model.
The DAiSI infrastructure is composed of the DAiSI
component model, a registration service, which works like a directory for running DAiSI components, and a configura-tion service which manages how provided– and required services are connected to each other and what component configurations are marked as active. The configuration ser-vice constantly checks (either periodically, or event-driven), if the current system configuration (active component con-figurations, component bindings, etc.)) can be improved.
For the adaptation of syntactical incompatible services, we added a new infrastructure service: The adapter engine. The adapter engine keeps track of all provided and required services in the system. Whenever a new DAiSI component enters the system, the adapter engine analyzes its provided
services and generates adapter components (which are DAiSI components themselves) to all syntactically incompatible, but semantically compatible services. We will describe this process in the following in more detail.
V. DAISI KOMPONENT FOR ADAPTATION
In this section, we show the basic concept of adapter generation based on Java programming language and struc-ture of the adapter engine. In the end we present process for adaptation in DAiSI platform.
A. Basic principle of the adapter
Figure 7 Interfaces of service and their implement.
Figure 8. Basic principle of the adapter between two interfaces.
Figure 9. Provided interface and connection of adapter.
//Interface of provided service public interface ParkingSpaceInterfacePV ArrayList<ParkingSpace> getParkingSpaces(String parkCity);
//Implement of provider interface public class ParkingSpacePV
implements ParkingSpaceInterfacePV public ArrayList<ParkingSpace> getParkingSlots(String parkCity)
//Interface of Required Service
public interface ParkingSpaceInterfaceCS ArrayList<ParkingSlot> getParkingSlots(String park-City);
// generated adapter public class generatedAdapter
implements ParkingSpaceInterfaceCS public ArrayList<ParkingSlot>
getParkingSlots(String parkCity)
ParkingSpaceInterfacePV ps; ArrayList<ParkingSpace> arrParkingSpace; ArrayList<ParkingSlot> arrParkingSlots;
arrParkingSpace = ps.getParkingSlots(parkCity);
arrParkingSlots = adapterEngine.mapping(arrParkingSpace);
return arrParkingSlots;
//Usage of generated adapter of required component public class requiredComp generatedAdapter adapter; ParkingSpaceInterfaceCS cs = adapter;

277
International Journal on Advances in Software, vol 9 no 3 & 4, year 2016, http://www.iariajournals.org/software/
2016, © Copyright by authors, Published under agreement with IARIA - www.iaria.org
Adapter is a DAiSI component, which uses provided in-terface of provided component and implements required interface for required component to manage communications between provided interface and required interface. Required interface of required component uses provided interface of adapter to access provided interface of provided component. Figure 8 shows an example adapter component. The provid-
ed service of the adapter component class generate-
dAdapter implements the required interface Parking-
SpaceInterfaceCS that is shown in Figure 7. The im-
plementation of function getParkingSlots of provied
interface in the adapter calls the function get-
ParkingSlots, which provided by provided interface of
provided component. The return of function get-
ParkingSlots of required interface are mapped to func-tion of required interface the through the function adapter Engine mapping. Fehler! Verweisquelle konnte nicht ge-funden werden. shows connection of the adapter and the component with required interface.
B. Structure of the adapter engine
Figure 10 shows the structure of the adapter engine. The task of adapter engine is generating adapter based on seman-tic description of provided and required interfaces at run-time.
The information collector aggregates the information from provided– and required services (e.g., interface, meth-ods, parameters, and return types) and then translates into knowledge representation language such as Resource De-scription Framework (RDF) and Web Ontology Language (OWL). In this approach, semantic descriptions of interfaces and related ontology are managed by a central triplestore which is a database for storage RDF triples.
The component Service Discovery discovers provided in-terfaces for a required interface in triplestore through SPARQL queries and screen out best candidates.
The component Mapper compares the discovered re-quired and provided interface based on sematic descriptions of both interfaces and exports an assignment list, which maps the information from provided services to required services. Mapping of many-to-many relationship of functions is not supported by this work.
Figure 10. Structure of the adapter engine.
The Service Generator receives the assignment lists from the Mapper and generates a new DAiSI component, which
can use the provided interface and implements the required interface. The Adapter Manager is a DAiSI component. It keeps track of the lifecycle of every DAiSI component adapter. Whenever a DAiSI component (provided or re-quired) leaves the system, the adapter Manager destroys all generated adapters related to the DAiSI component and thereby removes them from the system.
C. Adaptation of DAiSi component
Figure 11 shows the process for involved DAiSI compo-
nent. The component comp.b contains a configuration config1, which requires an interface A. The configuration
config1 of component comp.b runs at state NOT_RESOLVED as long as it cannot find an interface with same syntax or semantically compatible interface in the
system. When the component comp.a enters the system, semantic descriptions of provided services are registered into the knowledge-base, this means, the description of service B can be found in the knowledge-base. After this, the service B is provided in the system. Adapter engine can now discover description of service B in triplestore. If service B and ser-vice A is syntactically and/or semantically compatible, the adapter engine could check another candidate, which wants
to use service B, if number of components which service B can only serve are limit. As long as a free place is provided by service B, thus, it generates an adapter – a DAiSI compo-
nent called adapter, which requires the service B and pro-
vides service A. The DAiSI configuration service connects
comp.b to adapter and adapter to comp.a. The dependen-
cy of comp.b could be resolved.
Figure 11. Adaptation process with adapter engine.
VI. SEMANTIC DESCRIPTION OF DAISI COMPONENTS
INTERFACE
Description of a machine-readable interface with all relevant semantical information is a key aspect of our concept. In this section we show how to describe a interface semantically.
There are two abstract semantic levels in our system, software level, which contains programming code and in-stance of parameter (data), semantic level, which provides semantic representation of programming code and data. Required Interface can discover provided interface in triple-

278
International Journal on Advances in Software, vol 9 no 3 & 4, year 2016, http://www.iariajournals.org/software/
2016, © Copyright by authors, Published under agreement with IARIA - www.iaria.org
store based on his semantic representations. Figure 12 shows interface GetParkingSlot noted with Parking Ontology is represented by ParkingSpace Interface in T-Box. Instances of parameters of interface GetParkingSlot is descripted in A-Box with TUCParkSSE, which link to ParkingSpaceInterface in T-Box.
For our system, we use a four-layer ontolgy structure for the construction of the knowledge-base. The four layers are part of two groups A-Box and T-Box. T-Box describes the concepts of domain in terms of controlled vocabularies, e.g., classes, properties and relationship of classes. A-Box con-tains the knowledge of instance of domain concepts, e.g., instance of classes. The basic knowledge is defined in the T-Box group. Such knowledge can be divided in different up-per ontologies. Corresponding of ontologies can be merged, if different dynamic adaptive systems are being associated. Merging ontologies is a different research area on which we do not focus, however, the available results are sufficient for our work.
Figure 12. Overview of relation of semantic level and software level.
Figure 13 shows the four-layer ontology structure. The
Basic Thing and Domain independent Ontologie, called Upperontolgoy layer, define the basic knowledge, which can be widely used in different domains and has already got agreement by many committees, such as OWL-S, schema.org, Dbpedia, etc. Domain ontology describes the domain related vocabularies. Every application or domain can define its own domain ontology. In the Domain Ontology, which is the second, or middle layer, all necessary definitions can be found that are relevant for an application. In our approach, we develop a parking ontolgoy for our application to extentent the vocabularies for the parking relevant services. The layer of the Application dependent ontology is the lowest level in T-Box. It represents the code of domain interfaces, more precisely their names, methods, parameters and return types. The domain dependent and independant ontology could be used in the application ontology in order to enriche the represention of services. This three-layer ontology in T-Box has the main advantage that every part can be developed separately. Every fragment of a layer can be merged with other fragments using ontolgy-merging and ontolgy-mapping. In addition, data, e.g., instance of java class or vaule of parameter, can be semantically represented in the A-Box.
Figure 13. Layers ontology structure.
Figure 14. Data structure of the example.
Figure 14 shows the layout of the ontologies for the
parking use case. We used upmost ontologies, OWL-S, Dbpedia and Schema.org. The Parking ontolgoy is delevoped based on the Dbpedia and schema.org. To describe interfaces, OWL-S is needed to define relations for representation of the interfaces, like methods, relation between parameters and methods. Paramter and return tpyes are created as new ontolgoy and directly mapped to the existing ontolgoy like Parking Ontolgoy, Dbpedia, etc. Represention of interface has no limit to usage of ontologies. Every information in any of the ontologies can be used in any interface. Semantic description of interface and java Interface can be bi-directional translated. Each description of interface could have an ontology item, in order to facilitate management of the ontology data in datastore such as updata, remove, modification. Run-time information such as instance of input and output parameters, so called datatyp object, could be descripted with owl instance of owl class, which can be found in T-Box. In our approach, we use historical datatyp objects to increase accuracy of services discovery. The fol-lowing examples show how the Ontology is defined.
A. Domain independent ontology
Domain independent ontologies could be used for differ-ent domains. They are independent on domains and com-monly are upper ontology to define basic vocabularies and

279
International Journal on Advances in Software, vol 9 no 3 & 4, year 2016, http://www.iariajournals.org/software/
2016, © Copyright by authors, Published under agreement with IARIA - www.iaria.org
data schema, e.g., schema.org, which is schemas for struc-tured data on the Internet, Semantic Sensor Network Ontolo-gy (SSN), which can be used to describe sensor, observations and related concepts. In our approach, Domain independent ontology can be used to directly describe interface and to link to the domain dependent ontology. Especially, OWL-S is an important part for description of interfaces.
OWL-S is one ontology for describing Web services. The essence of semantic Web Servic description is to realize automatic web Service discovery, which shares the same goals of automatic adaptation of DAiSI components in our approach. Three elements of OWL-S, ServiceProfile, ProcessModel and ServiceGrounding, can be well mapped to DAiSI services. ServiceProfile uses for publishing and discovering services. ProcessModel describes in detail for the operation of a service. ServiceGrounding provides details of how the message service interoperability. In particular, because of similarity of ServiceProfile and interface, ServiceProfile can be used to describe programming interface.
Figure 15 shows relation of OWL-S and programming interface. Interface name can be descripted with Ontology Serviceprofile, which are depicted by anelliptical shape. Function name corresponds to process and input and output parameter corresponds to process:input and process:ouput.
<<Interface>>interfacename
functionname(InputParameter): OutParameter
Process
&process:#Input
&process;#Output
Service Profile
hasInput
hasOutput
hasProcess
Figure 15. Relationship of programming interface and process in OWL-S.
B. Application Ontology Parking Ontolgoy
Unfortunately, domain independent ontology cannot cov-er requirements of vocabularies in every individual domain. We need to develop domain ontologies to meet the demand. Domain ontology can use the independent domain ontology to increase its reusability.
In our approach, we define a Parking Ontology. Parking Ontology is an ontology, which describes Parking space relevant issues, such as location, usage, ticket, opening hours, etc. Figure 16 shows a fragment of Parking Ontology, which contains relevant parts for the example in this paper. ParkingSpace is the main part, it relates to ParkingLocation with OWL objectproperty parkingLocation and Sta-tusOfParkingSpot with statusOfParkingSport. ParkingLoca-tion is static information.Static means, the information is not modified in run-time, mostly the value is stored in database or local in device. StatusOfParkingSpot is run-time infor-mation, which’s value can be changed at run-time.
ps:EVChargingStation xsd:booleanps:ADASpaces xsd:booleanps:usageForVehicleType ps:VehicleTypeOfUsageps:suitedVehicleType gs:VehicleType
ps: ParkingSpace
ps:ParkingLocation
Ps:centralPositon schema:GeoCoordinatesPs:city dbpedia:CityPs:street rdfs:LIteral
Ps:parkingLocationps:statusOfParkingSpot
ps:StatusOfParkingSpot
ps:actualState gs:ActualStateOfParkingSpotps:LastOccupancyStateChange xsd:dateTime
ps:LastChangeTime xsd:dateTime
Figure 16. Relationship of programming interface and process in OWL-S.
C. Descrption of Interface
To semantically understand programming interfaces, they should be translated into semantic technology supported data format. In fact, the chosen sematic language has big influ-ence for interface discovery. On the one hand, translation between semantic data formats is supported mostly only in one direction, e.g., JSON-LD can be translated into RDF/XML, but it is difficult to translate it back to its original format. On the other hand, format of results of the transla-tions from different language of same programming interface are usually not identical. Therefore, in our approach, we use only semantic Language RDF/XML, so that the system is kept more harmonious.
In this work, we use OWL-S (implemented in RDF/XML) to descript an interface. The descriptions are separated into 3 parts, description interface, description function, description parameters.
1) Interface description Figure 17 shows an interface description. An interface
contains many methods, which are described by processes. In this example, an interface is described by the process GetParkingProcess with Service:describedBy.
Figure 17. interface description.
2) Function description Figure 18 shows the structure of a method description. A
method is described by AtomicProcess and constants of input and output parameters. The parameter can use existing
ontology, e.g., for input ParkingCity use Ontology from
Ddpeida db;#City, or use self-defining parameter THIS;#ParkingSlot, which we will show below.
<service:Service rdf:ID="ParkingSlotService">
<service:presents
rdf:resource="&Parking_profile;#Profile_Parkin
gSlot_Service"/>
<service:describedBy
rdf:resource="&Parking_process;#GetParkingProc
ess"/> </service:Service>
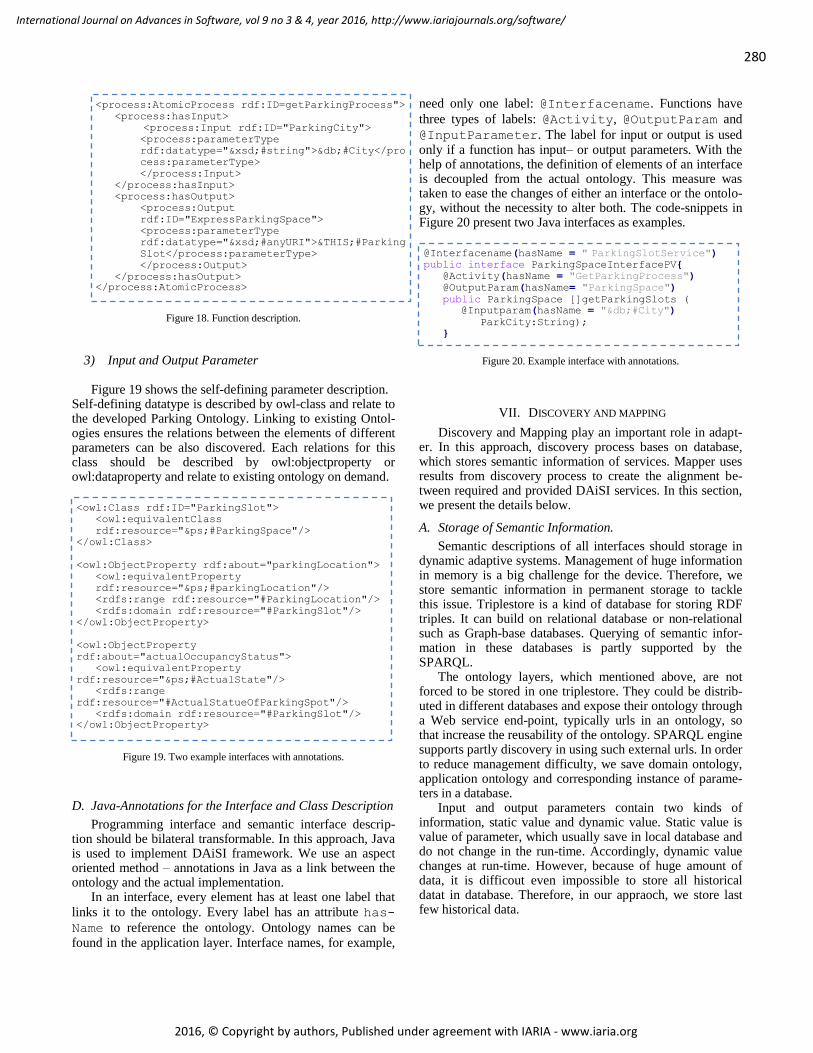
280
International Journal on Advances in Software, vol 9 no 3 & 4, year 2016, http://www.iariajournals.org/software/
2016, © Copyright by authors, Published under agreement with IARIA - www.iaria.org
Figure 18. Function description.
3) Input and Output Parameter Figure 19 shows the self-defining parameter description.
Self-defining datatype is described by owl-class and relate to the developed Parking Ontology. Linking to existing Ontol-ogies ensures the relations between the elements of different parameters can be also discovered. Each relations for this class should be described by owl:objectproperty or owl:dataproperty and relate to existing ontology on demand.
Figure 19. Two example interfaces with annotations.
D. Java-Annotations for the Interface and Class Description
Programming interface and semantic interface descrip-tion should be bilateral transformable. In this approach, Java is used to implement DAiSI framework. We use an aspect oriented method – annotations in Java as a link between the ontology and the actual implementation.
In an interface, every element has at least one label that
links it to the ontology. Every label has an attribute has-
Name to reference the ontology. Ontology names can be found in the application layer. Interface names, for example,
need only one label: @Interfacename. Functions have
three types of labels: @Activity, @OutputParam and
@InputParameter. The label for input or output is used only if a function has input– or output parameters. With the help of annotations, the definition of elements of an interface is decoupled from the actual ontology. This measure was taken to ease the changes of either an interface or the ontolo-gy, without the necessity to alter both. The code-snippets in Figure 20 present two Java interfaces as examples.
Figure 20. Example interface with annotations.
VII. DISCOVERY AND MAPPING
Discovery and Mapping play an important role in adapt-er. In this approach, discovery process bases on database, which stores semantic information of services. Mapper uses results from discovery process to create the alignment be-tween required and provided DAiSI services. In this section, we present the details below.
A. Storage of Semantic Information.
Semantic descriptions of all interfaces should storage in dynamic adaptive systems. Management of huge information in memory is a big challenge for the device. Therefore, we store semantic information in permanent storage to tackle this issue. Triplestore is a kind of database for storing RDF triples. It can build on relational database or non-relational such as Graph-base databases. Querying of semantic infor-mation in these databases is partly supported by the SPARQL.
The ontology layers, which mentioned above, are not forced to be stored in one triplestore. They could be distrib-uted in different databases and expose their ontology through a Web service end-point, typically urls in an ontology, so that increase the reusability of the ontology. SPARQL engine supports partly discovery in using such external urls. In order to reduce management difficulty, we save domain ontology, application ontology and corresponding instance of parame-ters in a database.
Input and output parameters contain two kinds of information, static value and dynamic value. Static value is value of parameter, which usually save in local database and do not change in the run-time. Accordingly, dynamic value changes at run-time. However, because of huge amount of data, it is difficout even impossible to store all historical datat in database. Therefore, in our appraoch, we store last few historical data.
<process:AtomicProcess rdf:ID=getParkingProcess">
<process:hasInput>
<process:Input rdf:ID="ParkingCity">
<process:parameterType
rdf:datatype="&xsd;#string">&db;#City</pro
cess:parameterType>
</process:Input>
</process:hasInput>
<process:hasOutput>
<process:Output
rdf:ID="ExpressParkingSpace">
<process:parameterType
rdf:datatype="&xsd;#anyURI">&THIS;#Parking
Slot</process:parameterType>
</process:Output>
</process:hasOutput> </process:AtomicProcess>
<owl:Class rdf:ID="ParkingSlot">
<owl:equivalentClass
rdf:resource="&ps;#ParkingSpace"/>
</owl:Class>
<owl:ObjectProperty rdf:about="parkingLocation">
<owl:equivalentProperty
rdf:resource="&ps;#parkingLocation"/>
<rdfs:range rdf:resource="#ParkingLocation"/>
<rdfs:domain rdf:resource="#ParkingSlot"/>
</owl:ObjectProperty>
<owl:ObjectProperty
rdf:about="actualOccupancyStatus">
<owl:equivalentProperty
rdf:resource="&ps;#ActualState"/>
<rdfs:range
rdf:resource="#ActualStatueOfParkingSpot"/>
<rdfs:domain rdf:resource="#ParkingSlot"/>
</owl:ObjectProperty>
@Interfacename(hasName = " ParkingSlotService") public interface ParkingSpaceInterfacePV
@Activity(hasName = "GetParkingProcess")
@OutputParam(hasName= "ParkingSpace")
public ParkingSpace []getParkingSlots (
@Inputparam(hasName = "&db;#City")
ParkCity:String);

281
International Journal on Advances in Software, vol 9 no 3 & 4, year 2016, http://www.iariajournals.org/software/
2016, © Copyright by authors, Published under agreement with IARIA - www.iaria.org
B. Discovery
SPARQL is a set of specifications that define a query language for RDF data, concerning explicit object and prop-erty relations, along with protocols for querying, and seriali-zation formats for the results. Reasoner can infer new triples by applying rules on the data, e.g., RDFS reasoner, OWL reasoner, transitive reasoner and general purpose rule engine. By using reasoner more required information can be found, e.g., equivalent classes, classes with parents relation, etc. SPARQL engine can use reasoner in forward chaining, which proceed to add any inferred triples to data set in data store, and backward chaining, which reasoning between a SPARQL endpoint and the data store. Backward chaining is used when ontologies are constantly updated. DAiSI is an adaptive system, components frequently enter and discharge a system, this issue causes regularly addition of new ontolo-gies for service of components in data store. Hereby, change backward chaining is most suitable for DAiSI.
Discovery has two steps, first step is discovery with defi-nition of interface’s information, that means only with inter-face name, input and output parameter name; second step is using static instance information of class to filter results. E.g., application wants to look for services, which could provide parking space in Clausthal in Germany. In the first step, all semantic compatible interfaces, which could provide parking spaces in different locations, are found. Locations of parking spaces are static information which saved mostly in database. Such location information can be used to filter the mount of discovered interfaces to find interfaces which can provide parking spaces in Clausthal. Using static information avoids accessing each interface, so that it avoids the side effect, -component state changed with calling function.
Figure 21. Example SPARQL query.
Figure 21 shows the SPARQL query example. To find
interface we need description required input and output pa-rameters in query. Query could be created directly from semantic noted programming interface.
C. Mapping
Discovery result is the interface name of component. In order to create an adapter we need create details relation between required and provide interface. Mapping of each parameter in input and output parameter can be restructured with help of his sematic annotation. According to the results of mapping, an adapter (new DAiSI component) will be created.
VIII. CONCLUSION
This paper is an extended version of the work published in [1]. In first approach, we presented the enhancement to the DAiSI: A new infrastructure service. Syntactically incompat-ible services can be connected with the help of generated adapters, which are created by the adapter engine. The adapter engine is prototypically implemented with Java. Re-use of component across different domains is enabled with this approach. In this paper, we extend our previous work by detail of the layered structure of ontologies, an improved discovery process based on SPARQL and triplestore. The new layer structure supports description of instance of pa-rameters and it increases the re-use of ontology. By using triplestore and SPARQL, it facilitates discovery service in a huge number of components. Semantic description hat still strength influence on discovery results. In further steps, we will reduce the closed related relation between semantic description and discovery.
IX. ACKNOWLEDGEMENT
This work is supported by BIG IoT (Bridging the Inter-operability Gap of the Internet of Things) project funded by the European Union’s Horizon 2020 research and innovation programme under grant agreement No. 688038
REFERENCES
[1] Y. Wang, D. Herrling, P. Stroganov, and A. Rausch, “Ontology-based Automatic Adaptation of Component Interfaces in Dynamic Adaptive Systems,” in Proceeding of ADAPTIVE 2016, The Eighth Intermational conference on Adaptive and Self-Adaptive Systems and Application, 2016, pp. 51-59.
[2] OMG, OMG Unified Modeling Language (OMG UML) Superstructure, Version 2.4.1, Object Management Group Std., August 2011, http://www.omg.org/spec/UML/2.4.1, [Online], retrieved: 06.2015.
[3] H. Klus and A. Rausch, “DAiSI–A Component Model and Decentralized Configuration Mechanism for Dynamic Adaptive Systems,” in Proceedings of ADAPTIVE 2014, The Sixth International Conference on Adaptive and Self-Adaptive Systems and Applications,Venice, Italy, 2014, pp. 595–608.
[4] H. Klus, “Anwendungsarchitektur-konforme Konfiguration selbstorganisierender Softwaresysteme,” (Application arch-itecture conform configuration of self-organizing software-systems), Clausthal-Zellerfeld, Technische Universität Clausthal, Department of Informatics, Dissertation, 2013.
[5] D. Niebuhr, “Dependable Dynamic Adaptive Systems: Approach, Model, and Infrastructure,” Clausthal-Zellerfeld, Technische Universität Clausthal, Department of Informatics, Dissertation, 2010.
[6] D. Niebuhr and A. Rausch, “Guaranteeing Correctness of Component Bindings in Dynamic Adaptive Systems based on Run-time Testing,” in Proceedings of the 4th Workshop on Services Integration in Pervasive Environments (SIPE 09) at the International Conference on Pervasive Services 2009, (ICSP 2009), 2009, pp. 7–12.
[7] D. M. Yellin and R. E. Strom, “Protocol Specifications and Component Adaptors,” ACM Transactions on Programming Languages and Systems, vol. 19, 1997, pp. 292–333.
select ?interface
where
?interface <process#hasInput> ?var
?var <process#paramterTyp> “dbpedia#City”
?interface <process#hasOutput> ?var2
?var2 <process#paramterTyp> “this#ParkingSlotApp”
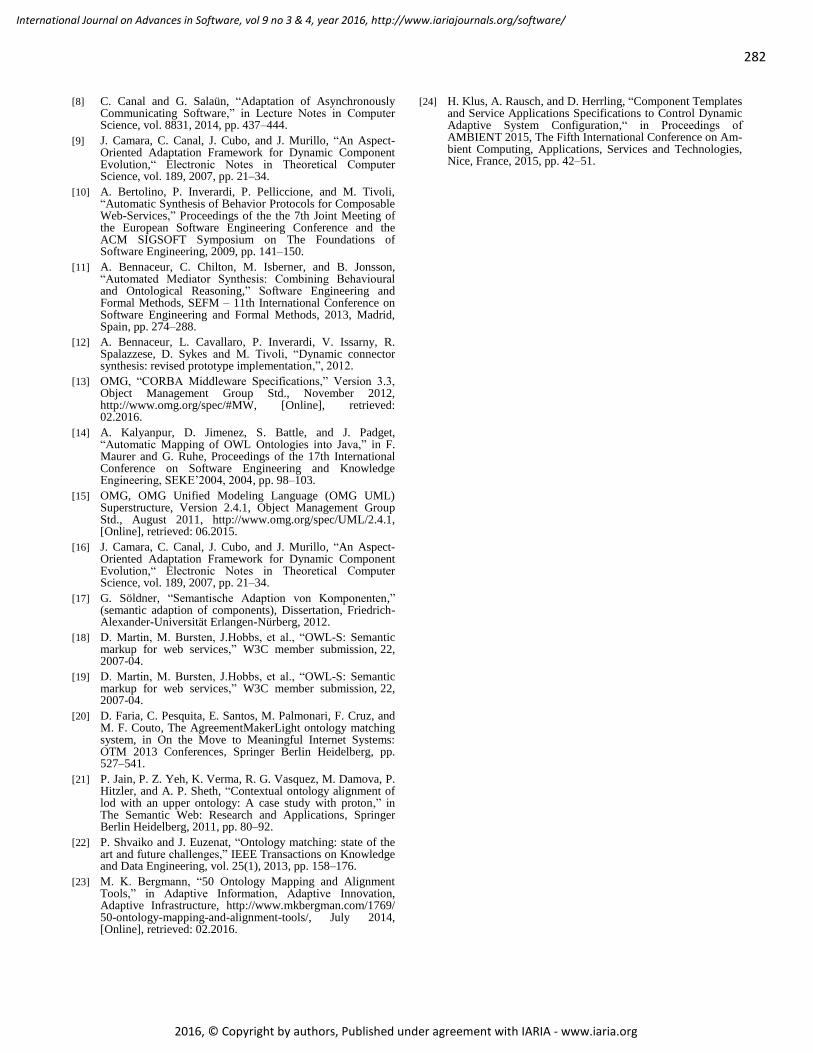
282
International Journal on Advances in Software, vol 9 no 3 & 4, year 2016, http://www.iariajournals.org/software/
2016, © Copyright by authors, Published under agreement with IARIA - www.iaria.org
[8] C. Canal and G. Salaün, “Adaptation of Asynchronously Communicating Software,” in Lecture Notes in Computer Science, vol. 8831, 2014, pp. 437–444.
[9] J. Camara, C. Canal, J. Cubo, and J. Murillo, “An Aspect-Oriented Adaptation Framework for Dynamic Component Evolution,“ Electronic Notes in Theoretical Computer Science, vol. 189, 2007, pp. 21–34.
[10] A. Bertolino, P. Inverardi, P. Pelliccione, and M. Tivoli, “Automatic Synthesis of Behavior Protocols for Composable Web-Services,” Proceedings of the the 7th Joint Meeting of the European Software Engineering Conference and the ACM SIGSOFT Symposium on The Foundations of Software Engineering, 2009, pp. 141–150.
[11] A. Bennaceur, C. Chilton, M. Isberner, and B. Jonsson, “Automated Mediator Synthesis: Combining Behavioural and Ontological Reasoning,” Software Engineering and Formal Methods, SEFM – 11th International Conference on Software Engineering and Formal Methods, 2013, Madrid, Spain, pp. 274–288.
[12] A. Bennaceur, L. Cavallaro, P. Inverardi, V. Issarny, R. Spalazzese, D. Sykes and M. Tivoli, “Dynamic connector synthesis: revised prototype implementation,”, 2012.
[13] OMG, “CORBA Middleware Specifications,” Version 3.3, Object Management Group Std., November 2012, http://www.omg.org/spec/#MW, [Online], retrieved: 02.2016.
[14] A. Kalyanpur, D. Jimenez, S. Battle, and J. Padget, “Automatic Mapping of OWL Ontologies into Java,” in F. Maurer and G. Ruhe, Proceedings of the 17th International Conference on Software Engineering and Knowledge Engineering, SEKE’2004, 2004, pp. 98–103.
[15] OMG, OMG Unified Modeling Language (OMG UML) Superstructure, Version 2.4.1, Object Management Group Std., August 2011, http://www.omg.org/spec/UML/2.4.1, [Online], retrieved: 06.2015.
[16] J. Camara, C. Canal, J. Cubo, and J. Murillo, “An Aspect-Oriented Adaptation Framework for Dynamic Component Evolution,“ Electronic Notes in Theoretical Computer Science, vol. 189, 2007, pp. 21–34.
[17] G. Söldner, “Semantische Adaption von Komponenten,” (semantic adaption of components), Dissertation, Friedrich-Alexander-Universität Erlangen-Nürberg, 2012.
[18] D. Martin, M. Bursten, J.Hobbs, et al., “OWL-S: Semantic markup for web services,” W3C member submission, 22, 2007-04.
[19] D. Martin, M. Bursten, J.Hobbs, et al., “OWL-S: Semantic markup for web services,” W3C member submission, 22, 2007-04.
[20] D. Faria, C. Pesquita, E. Santos, M. Palmonari, F. Cruz, and M. F. Couto, The AgreementMakerLight ontology matching system, in On the Move to Meaningful Internet Systems: OTM 2013 Conferences, Springer Berlin Heidelberg, pp. 527–541.
[21] P. Jain, P. Z. Yeh, K. Verma, R. G. Vasquez, M. Damova, P. Hitzler, and A. P. Sheth, “Contextual ontology alignment of lod with an upper ontology: A case study with proton,” in The Semantic Web: Research and Applications, Springer Berlin Heidelberg, 2011, pp. 80–92.
[22] P. Shvaiko and J. Euzenat, “Ontology matching: state of the art and future challenges,” IEEE Transactions on Knowledge and Data Engineering, vol. 25(1), 2013, pp. 158–176.
[23] M. K. Bergmann, “50 Ontology Mapping and Alignment Tools,” in Adaptive Information, Adaptive Innovation, Adaptive Infrastructure, http://www.mkbergman.com/1769/ 50-ontology-mapping-and-alignment-tools/, July 2014, [Online], retrieved: 02.2016.
[24] H. Klus, A. Rausch, and D. Herrling, “Component Templates and Service Applications Specifications to Control Dynamic Adaptive System Configuration,“ in Proceedings of AMBIENT 2015, The Fifth International Conference on Am-bient Computing, Applications, Services and Technologies, Nice, France, 2015, pp. 42–51.

283
International Journal on Advances in Software, vol 9 no 3 & 4, year 2016, http://www.iariajournals.org/software/
2016, © Copyright by authors, Published under agreement with IARIA - www.iaria.org
Implementing a Typed Javascript and its IDE:
a case-study with Xsemantics
Lorenzo Bettini
Dip. Statistica, Informatica, ApplicazioniUniversita di Firenze, Italy
Email: [email protected]
Jens von Pilgrim, Mark-Oliver Reiser
NumberFour AG,Berlin, Germany
Email: jens.von.pilgrim,[email protected]
Abstract—Developing a compiler and an IDE for a programminglanguage is time consuming and it poses several challenges,even when using language workbenches like Xtext that providesEclipse integration. A complex type system with powerful typeinference mechanisms needs to be implemented efficiently, other-wise its implementation will undermine the effective usability ofthe IDE: the editor must be responsive even when type inferencetakes place in the background, otherwise the programmer willexperience too many lags. In this paper, we will present a real-world case study: N4JS, a JavaScript dialect with a full-featuredJava-like static type system, including generics, and present someevaluation results. We will describe the implementation of its typesystem and we will focus on techniques to make the type systemimplementation of N4JS integrate efficiently with Eclipse. For theimplementation of the type system of N4JS we use Xsemantics,a DSL for writing type systems, reduction rules and in generalrelation rules for languages implemented in Xtext. Xsemantics isintended for developers who are familiar with formal type systemsand operational semantics since it uses a syntax that resemblesrules in a formal setting. This way, the implementation of formallydefined type rules can be implemented easier and more directlyin Xsemantics than in Java.
Keywords–DSL; Type System; Implementation; Eclipse.
I. INTRODUCTION
In this paper, we present N4JS, a JavaScript dialect imple-mented with Xtext, with powerful type inference mechanisms(including Java-like generics). In particular, we focus on theimplementation of its type system. The type system of N4JS isimplemented in Xsemantics, an Xtext DSL to implement typesystems and reduction rules for DSLs implemented in Xtext.
The type system of N4JS drove the evolution of Xseman-tics: N4JS’ complex type inference system and the fact that ithas to be used in production with large code bases forced usto enhance Xsemantics in many parts. The implementation ofthe type system of N4JS focuses both on the performance ofthe type system and on its integration in the Eclipse IDE.
This paper is the extended version of the conferencepaper [1]. With respect to the conference version, in this paperwe describe more features of Xsemantics, we provide a fulldescription of the main features of N4JS and we describe itstype system implementation in more details. Motivations, re-lated work and conclusions have been extended and enhancedaccordingly.
The paper is structured as follows. In Section II weintroduce the context of our work and we motivate it; we alsodiscuss some related work. We provide a small introduction toXtext in Section III and we show the main features of Xseman-tics in Section IV. In Section V, we present N4JS and its mainfeatures. In Section VI, we describe the implementation of thetype system of N4JS with Xsemantics, with some performancebenchmarks related to the type system. Section VII concludesthe paper.
II. MOTIVATIONS AND RELATED WORK
Integrated Development Environments (IDEs) help pro-grammers a lot with features like syntax aware editor, compilerand debugger integration, build automation and code comple-tion, just to mention a few. In an agile [2] and test-drivencontext [3] the features of an IDE like Eclipse become essentialand they dramatically increase productivity.
Developing a compiler and an IDE for a language is usuallytime consuming, even when relying on a framework likeEclipse. Implementing the parser, the model for the AbstractSyntax Tree (AST), the validation of the model (e.g., typechecking), and connecting all the language features to theIDE components require lot of manual programming. Xtext,http://www.eclipse.org/Xtext, [4], [5] is a popularEclipse framework for the development of programming lan-guages and Domain-Specific Languages (DSLs), which easesall these tasks.
A language with a static type system usually featuresbetter IDE support. Given an expression and its static type,the editor can provide all the completions that make sensein that program context. For example, in a Java-like methodinvocation expression, the editor should propose only themethods and fields that are part of the class hierarchy of thereceiver expression, and thus, it needs to know the static typeof the receiver expression. The same holds for other typicalIDE features, like, for example, navigation to declaration andquickfixes.
The type system and the interpreter for a language imple-mented in Xtext are usually implemented in Java. While thisworks for languages with a simple type system, it becomesa problem for an advanced type system. Since the latter isoften formalized, a DSL enabling the implementation of atype system similar to the formalization would be useful. This
284
International Journal on Advances in Software, vol 9 no 3 & 4, year 2016, http://www.iariajournals.org/software/
2016, © Copyright by authors, Published under agreement with IARIA - www.iaria.org
would reduce the gap between the formalization of a languageand its actual implementation.
Besides functional aspects, implementing a complex typesystem with powerful type inference mechanisms poses sev-eral challenges due to performance issues. Modern IDEs andcompilers have defined a high standard for performance ofcompilation and responsiveness of typical user interactions,such as content assist and immediate error reporting. At thesame time, modern statically-typed languages tend to reducethe verbosity of the syntax with respect to types by imple-menting type inference systems that relieve the programmerfrom the burden of declaring types when these can be inferredfrom the context. In order to be able to cope with these highdemands on both type inference and performance, efficientlyimplemented type systems are required.
In [6] Xsemantics, http://xsemantics.sf.net,was introduced. Xsemantics is a DSL for writing rules forlanguages implemented in Xtext, in particular, the static se-mantics (type system), the dynamic semantics (operationalsemantics) and relation rules (subtyping). Given the typesystem specification, Xsemantics generates Java code that canbe used in the Xtext implementation. Xsemantics specificationshave a declarative flavor that resembles formal systems (see,e.g., [7], [8]), while keeping the Java-like shape. This makes itusable both by formal theory people and by Java programmers.
Originally, Xsemantics was focused on easy implemen-tation of prototype languages. While the basic principles ofXsemantics were not changed, Xsemantics has been improveda lot in order to make it usable for modern full-featuredlanguages and real-world performance requirements [9]. Inthat respect, N4JS drove the evolution of Xsemantics. Infact, N4JS’ complex type inference system and its usagein production with large code bases forced us to enhanceXsemantics in many parts. The most relevant enhanced parts inXsemantics dictated by N4JS can be summarized as follows:
• Enhanced handling of the rule environment, simplify-ing implementation of type systems with generics.
• Fields and imports, simplifying the use of Java utilityclass libraries from within an Xsemantics systemdefinition.
• The capability of extending an existing Xsemanticssystem definition, improving the modularization oflarge systems.
• Improved error reporting customization, in order toprovide the user with more information about errors.
• Automatic caching of results of rule computations,increasing performance.
Xsemantics itself is implemented in Xtext, thus it is com-pletely integrated with Eclipse and its tooling. From Xseman-tics we can access any existing Java library, and we can evendebug Xsemantics code. It is not mandatory to implementthe whole type system in Xsemantics: we can still implementparts of the type system directly in Java, in case some tasksare easier to implement in Java. In an existing languageimplementation, this also allows for an easy incremental orpartial transition to Xsemantics. All these features have beenused in the implementation of the type system of N4JS.
A. Related work
In this section we discuss some related work concerningboth language workbenches and frameworks for specifyingtype systems.
Xsemantics can be considered the successor of Xtypes [10].With this respect, Xsemantics provides a much richer syntaxfor rules that can access any existing Java library. This impliesthat, while with Xtypes many type computations could notbe expressed, this does not happen in Xsemantics. Moreover,Xtypes targets type systems only, while Xsemantics deals withany kind of rules.
XTS [11] (Xtext Type System) is a DSL for specifyingtype systems for DSLs built with Xtext. The main differencewith respect to Xsemantics is that XTS aims at expressionbased languages, not at general purpose languages. Indeed, itis not straightforward to write the type system for a Java-likelanguage in XTS. Type systems specifications are less verbosein XTS, since it targets type systems only, but XTS does notallow introducing new relations as Xsemantics, and it doesnot target reductions rules. Xsemantics aims at being similarto standard type inference and semantics rules so that anyonefamiliar with formalization of languages can easily read a typesystem specification in Xsemantics.
OCL (Object Constraint Language) [12], [13] allows thedeveloper to specify constraints in metamodels. While OCLis an expression language, Xsemantics is based on rules.Although OCL is suitable for specifying constraints, it mightbe hard to use to implement type inference.
Neverlang [14] is based on the fact that programminglanguage features can be plugged and unplugged, e.g., you can“plug” exceptions, switch statements or any other linguisticconstructs into a language. It also supports composition ofspecific Java constructs [15]. Similarly, JastAdd [16] sup-ports modular specifications of extensible compiler tools andlanguages. Eco [17], [18] is a language composition editorfor defining composed languages and edit programs of suchcomposed languages. The Spoofax [19] language workbenchprovides support for language extensions and embeddings.Polyglot [20] is a compiler front end for Java aiming at Javalanguage extensions. However, it does not provide any IDEsupport for the implemented extension. Xtext only providessingle inheritance mechanisms for grammars, so differentgrammars can be composed only linearly. In Xsemantics asystem can extend an existing one (adding and overridingrules). These extensibility and compositionality features are notas powerful as the ones of the systems mentioned above, butwe think they should be enough for implementing pluggabletype systems [21].
There are other tools for implementing DSLs and IDEtooling (we refer to [22], [23], [24] for a wider com-parison). Tools like IMP (The IDE Meta-Tooling Plat-form) [25] and DLTK (Dynamic Languages Toolkit),http://www.eclipse.org/dltk, only deal with IDEfeatures. TCS (Textual Concrete Syntax) [26] aims at providingthe same mechanisms as Xtext. However, with Xtext it is easierto describe the abstract and concrete syntax at once. Morever,Xtext is completely open to customization of every part of thegenerated IDE. EMFText [27] is similar to Xtext. Instead ofderiving a metamodel from the grammar, the language to be

285
International Journal on Advances in Software, vol 9 no 3 & 4, year 2016, http://www.iariajournals.org/software/
2016, © Copyright by authors, Published under agreement with IARIA - www.iaria.org
implemented must be defined in an abstract way using an EMFmetamodel.
The Spoofax [19], language workbench mentioned above,relies on Stratego [28] for defining rule-based specifications forthe type system. In [29], Spoofax is extended with a collectionof declarative meta-languages to support all the aspects oflanguage implementation including verification infrastructureand interpreters. These meta-languages include NaBL [30] forname binding and scope rules, TS for the type system andDynSem [31] for the operational semantics. Xsemantics shareswith these systems the goal of reducing the gap between theformalization and the implementation. An interesting futureinvestigation is adding the possibility of specifying scopingrules in an Xsemantics specification as well. This way, also theXtext scope provider could be easily generated automaticallyby Xsemantics.
EriLex [32] is a software tool for generating supportcode for embedded domain specific languages and it supportsspecifying syntax, type rules, and dynamic semantics of suchlanguages but it does not generate any artifact for IDE tooling.
An Xsemantics specification can access any Java type,not only the ones representing the AST. Thus, Xsemanticsmight also be used to validate any model, independently fromXtext itself, and possibly be used also with other languageframeworks like EMFText [27]. Other approaches, such as,e.g., [33], [34], [35], [36], [37], [32], [14], instead require theprogrammer to use the framework also for defining the syntaxof the language.
The importance of targeting IDE tooling when implement-ing a language was recognized also in older frameworks,such as Synthesizer [38] and Centaur [33]. In both cases, theuse of a DSL for the type system was also recognized (thelatter was using several formalisms [39], [40], [41]). Thus,Xsemantics enhances the usability of Xtext for developingprototype implementations of languages during the study ofthe formalization of languages.
We just mention other tools for the implementation ofDSLs that are different from Xtext and Xsemantics for themain goal and programming context, such as, e.g., [42], [43],[44], which are based on language specification preprocessors,and [45], [46], which target host language extensions andinternal DSLs.
Xsemantics does not aim at providing mechanisms forformal proofs for the language and the type system and itdoes not produce (like other frameworks do, e.g., [47], [29]),versions of the type system for proof assistants, such asCoq [48], HOL [49] or Isabelle [50]. However, Xsemanticscan still help when writing the meta-theory of the language.An example of such a use-case, using the traces of the appliedrules, can be found in [9].
We chose Xtext since it is the de-facto standard frame-work for implementing DSLs in the Eclipse ecosystem, itis continuously supported, and it has a wide community,not to mention many applications in the industry. Xtext iscontinuously evolving, and the main new features introduced inrecent versions include the integration in other IDEs (mainly,IntelliJ), and the support for programming on the Web (i.e., anXtext DSL can be easily ported on a Web application).
Finally, Xtext provides complete support for typical Javabuild tools, like Maven and Gradle. Thus, Xtext DSLs alsoautomatically support these build tools. In that respect, Xse-mantics provides Maven artifacts so that Xsemantics filescan be processed during the Maven build in a ContinuousIntegration system.
III. XTEXT
In this section we will give a brief introduction to Xtext. InSection III-A we will also briefly describe the main features ofXbase, which is the expression language used in Xsemantics’rules.
It is out of the scope of the paper to describe Xtext andXbase in details. Here we will provide enough details to makethe features of Xsemantics understandable.
Xtext [5] is a language workbench (such as MPS [51]and Spoofax [19]): Xtext deals not only with the compilermechanisms but also with Eclipse-based tooling. Starting froma grammar definition, Xtext generates an ANTLR parser [52].During parsing, the AST is automatically generated by Xtext asan EMF model (Eclipse Modeling Framework [53]). Besides,Xtext generates many other features for the Eclipse editor forthe language that we are implementing: syntax highlighting,background parsing with error markers, outline view, codecompletion.
Most of the code generated by Xtext can already beused as it is, but other parts, like type checking, have tobe customized. The customizations rely on Google-Guice, adependency injection framework [54].
In the following we describe the two complementarymechanisms of Xtext that the programmer has to implement.Xsemantics aims at generating code for both mechanisms.
Scoping is the mechanism for binding the symbols (i.e.,references). Xtext supports the customization of binding withthe abstract concept of scope, i.e., all declarations that areavailable (visible) in the current context of a reference. Theprogrammer provides a ScopeProvider to customize thescoping. In Java-like languages the scoping will have todeal with types and inheritance relations, thus, it is strictlyconnected with the type system. For example, the scope formethods in the context of a method invocation expressionconsists of all the members, including the inherited ones, ofthe class of the receiver expression. Thus, in order to computethe scope, we need the type of the receiver expression.
Using the scope, Xtext will automatically resolve crossreferences or issue an error in case a reference cannot beresolved. If Xtext succeeds in resolving a cross reference,it also takes care of implementing IDE mechanisms likenavigating to the declaration of a symbol and content assist.
All the other checks that do not deal with symbol res-olutions, have to be implemented through a validator. In aJava-like language most validation checks typically consist inchecking that the program is correct with respect to types. Thevalidation takes place in background while the user is writingin the editor, so that an immediate feedback is available.
Scoping and validation together implement the mechanismfor checking the correctness of a program. This separation into

286
International Journal on Advances in Software, vol 9 no 3 & 4, year 2016, http://www.iariajournals.org/software/
2016, © Copyright by authors, Published under agreement with IARIA - www.iaria.org
two distinct mechanisms is typical of other approaches, suchas [38], [47], [16], [30], [29], [55].
A. Xbase
Xbase [56] is a reusable expression language that integratescompletely with Java and its type system. Xbase also imple-ments UI mechanisms that mimic the ones of the Eclipse JavaDevelopment Tools (JDT).
The syntax of Xbase is similar to Java with less “syntacticnoise” (e.g., the terminating semicolon “;” is optional) andsome advanced linguistic constructs. Although its syntax isnot the same as Java, Xbase should be easily understood byJava programmers.
In this section we briefly describe the main features ofXbase, in order to make Xsemantics rules shown in the papereasily understandable for the Java programmers.
Variable declarations in Xbase are defined using val orvar, for final and non-final variables, respectively. The typeis not mandatory if it can be inferred from the initializationexpression.
A cast expression in Xbase is written using the infixkeyword as, thus, instead of writing “(C) e” we write“e as C”.
Xbase provides extension methods, a syntactic sugar mech-anism: instead of passing the first argument inside the paren-theses of a method invocation, the method can be called withthe first argument as its receiver. It is as if the method wasone of the argument type’s members. For example, if m(E)is an extension method, and e is of type E, we can writee.m() instead of m(e). With extension methods, calls canbe chained instead of nested: e.g., o.foo().bar() ratherthan bar(foo(o)).
Xbase also provides lambda expressions, which have theshape [param1, param2, ... | body]. The types ofthe parameters can be omitted if they can be inferred from thecontext. Xbase automatically compiles lambda expressions intoJava anonymous classes; if the runtime Java library is version8, then Xbase automatically compiles its lambda expressionsinto Java 8 lambda expressions.
All these features of Xbase allow the developer to easilywrite statements and expressions that are much more readablethan in Java, and that are also very close to formal specifica-tions. For example, a formal statement of the shape
“∃x ∈ L . x 6= 0”
can be written in Xbase like
“L.exists[ x | x != 0 ]”.
This helped us a lot in making Xsemantics close to formalsystems.
IV. XSEMANTICS
Xsemantics is a DSL (written in Xtext) for writing typesystems, reduction rules and in general relation rules forlanguages implemented in Xtext. Xsemantics is intended fordevelopers who are familiar with formal type systems and
judgments type |− Expression expression : output Type
error "cannot type " + expressionsubtype |− Type left <: Type right
error left + " is not a subtype of " + right
Figure 1. An example of judgment definitions in Xsemantics.
operational semantics since it uses a syntax that resemblesrules in a formal setting (e.g., [7], [57], [8]).
A system definition in Xsemantics is a set of judgments,that is, assertions about the properties of programs, and a setof rules. Rules can be seen as implications between judgments,i.e., they assert the validity of certain judgments, possibly onthe basis of other judgments [7]. Rules have a conclusion anda set of premises. Typically, rules act on the EMF objectsrepresenting the AST, but in general they can refer to anyJava class. Starting from the definitions of judgments and rules,Xsemantics generates Java code that can be used in a languageimplemented in Xtext for scoping and validation.
A. Judgments
An Xsemantics judgment consists of a name, a judgmentsymbol (which can be chosen from some predefined symbols)and the parameters of the judgment. Parameters are separatedby relation symbols (which can be chosen from some prede-fined symbols).
Currently, Xsemantics only supports a predefined set ofsymbols, in order to avoid possible ambiguities with expressionoperators in the premises of rules.
Judgment symbols are
||- |- ||∼ |∼ ||= |= ||> |>
Relation symbols are
<! !> <<! !>> <∼! !∼>: <: :> << >> ∼∼<| |> <∼ ∼> \/ /\
All these symbols aim at mimicking the symbols that aretypically used in formal systems.
Two judgments must differ for the judgment symbol or forat least one relation symbol. The parameters can be either inputparameters (using the same syntax for parameter declarationsas in Java) or output parameters (using the keyword outputfollowed by the Java type). For example, the judgment def-initions for an hypothetical Java-like language are shown inFigure 1: the judgment type takes an Expression as inputparameter and provides a Type as output parameter. Thejudgment subtype does not have output parameters, thusits output result is implicitly boolean. Judgment definitionscan include error specifications (described in Section IV-F),which are useful for generating informative error information.
B. Rules
Rules implement judgments. Each rule consists of a name,a rule conclusion and the premises of the rule. The conclusion
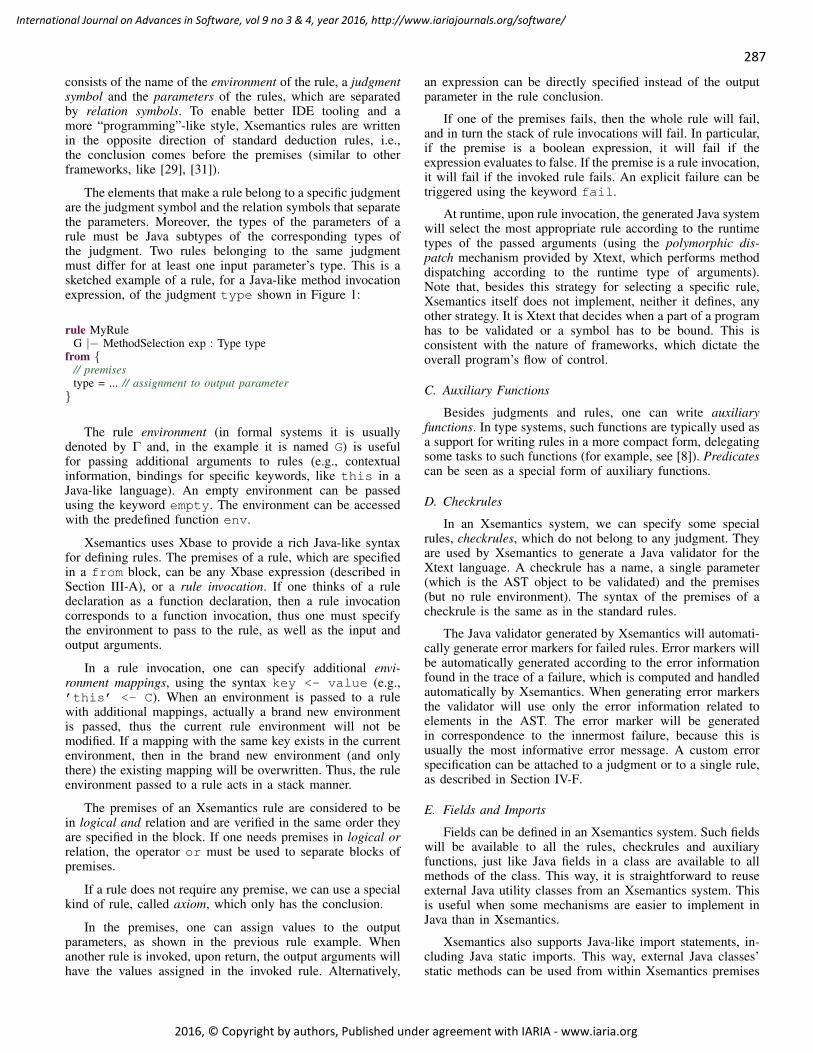
287
International Journal on Advances in Software, vol 9 no 3 & 4, year 2016, http://www.iariajournals.org/software/
2016, © Copyright by authors, Published under agreement with IARIA - www.iaria.org
consists of the name of the environment of the rule, a judgmentsymbol and the parameters of the rules, which are separatedby relation symbols. To enable better IDE tooling and amore “programming”-like style, Xsemantics rules are writtenin the opposite direction of standard deduction rules, i.e.,the conclusion comes before the premises (similar to otherframeworks, like [29], [31]).
The elements that make a rule belong to a specific judgmentare the judgment symbol and the relation symbols that separatethe parameters. Moreover, the types of the parameters of arule must be Java subtypes of the corresponding types ofthe judgment. Two rules belonging to the same judgmentmust differ for at least one input parameter’s type. This is asketched example of a rule, for a Java-like method invocationexpression, of the judgment type shown in Figure 1:
rule MyRuleG |− MethodSelection exp : Type type
from // premisestype = ... // assignment to output parameter
The rule environment (in formal systems it is usuallydenoted by Γ and, in the example it is named G) is usefulfor passing additional arguments to rules (e.g., contextualinformation, bindings for specific keywords, like this in aJava-like language). An empty environment can be passedusing the keyword empty. The environment can be accessedwith the predefined function env.
Xsemantics uses Xbase to provide a rich Java-like syntaxfor defining rules. The premises of a rule, which are specifiedin a from block, can be any Xbase expression (described inSection III-A), or a rule invocation. If one thinks of a ruledeclaration as a function declaration, then a rule invocationcorresponds to a function invocation, thus one must specifythe environment to pass to the rule, as well as the input andoutput arguments.
In a rule invocation, one can specify additional envi-ronment mappings, using the syntax key <- value (e.g.,’this’ <- C). When an environment is passed to a rulewith additional mappings, actually a brand new environmentis passed, thus the current rule environment will not bemodified. If a mapping with the same key exists in the currentenvironment, then in the brand new environment (and onlythere) the existing mapping will be overwritten. Thus, the ruleenvironment passed to a rule acts in a stack manner.
The premises of an Xsemantics rule are considered to bein logical and relation and are verified in the same order theyare specified in the block. If one needs premises in logical orrelation, the operator or must be used to separate blocks ofpremises.
If a rule does not require any premise, we can use a specialkind of rule, called axiom, which only has the conclusion.
In the premises, one can assign values to the outputparameters, as shown in the previous rule example. Whenanother rule is invoked, upon return, the output arguments willhave the values assigned in the invoked rule. Alternatively,
an expression can be directly specified instead of the outputparameter in the rule conclusion.
If one of the premises fails, then the whole rule will fail,and in turn the stack of rule invocations will fail. In particular,if the premise is a boolean expression, it will fail if theexpression evaluates to false. If the premise is a rule invocation,it will fail if the invoked rule fails. An explicit failure can betriggered using the keyword fail.
At runtime, upon rule invocation, the generated Java systemwill select the most appropriate rule according to the runtimetypes of the passed arguments (using the polymorphic dis-patch mechanism provided by Xtext, which performs methoddispatching according to the runtime type of arguments).Note that, besides this strategy for selecting a specific rule,Xsemantics itself does not implement, neither it defines, anyother strategy. It is Xtext that decides when a part of a programhas to be validated or a symbol has to be bound. This isconsistent with the nature of frameworks, which dictate theoverall program’s flow of control.
C. Auxiliary Functions
Besides judgments and rules, one can write auxiliaryfunctions. In type systems, such functions are typically used asa support for writing rules in a more compact form, delegatingsome tasks to such functions (for example, see [8]). Predicatescan be seen as a special form of auxiliary functions.
D. Checkrules
In an Xsemantics system, we can specify some specialrules, checkrules, which do not belong to any judgment. Theyare used by Xsemantics to generate a Java validator for theXtext language. A checkrule has a name, a single parameter(which is the AST object to be validated) and the premises(but no rule environment). The syntax of the premises of acheckrule is the same as in the standard rules.
The Java validator generated by Xsemantics will automati-cally generate error markers for failed rules. Error markers willbe automatically generated according to the error informationfound in the trace of a failure, which is computed and handledautomatically by Xsemantics. When generating error markersthe validator will use only the error information related toelements in the AST. The error marker will be generatedin correspondence to the innermost failure, because this isusually the most informative error message. A custom errorspecification can be attached to a judgment or to a single rule,as described in Section IV-F.
E. Fields and Imports
Fields can be defined in an Xsemantics system. Such fieldswill be available to all the rules, checkrules and auxiliaryfunctions, just like Java fields in a class are available to allmethods of the class. This way, it is straightforward to reuseexternal Java utility classes from an Xsemantics system. Thisis useful when some mechanisms are easier to implement inJava than in Xsemantics.
Xsemantics also supports Java-like import statements, in-cluding Java static imports. This way, external Java classes’static methods can be used from within Xsemantics premises

288
International Journal on Advances in Software, vol 9 no 3 & 4, year 2016, http://www.iariajournals.org/software/
2016, © Copyright by authors, Published under agreement with IARIA - www.iaria.org
without the fully qualified name. In particular, the XsemanticsEclipse editor supports automatic insertion of imports duringcode completion. This mimics what the Eclipse Java editordoes. Both fields and static imports can be further decoratedwith the extension specification. This will enable the exten-sion methods mechanism of Xbase (described in Section III-A)making Xsemantics code less verbose and more compact.
F. Error Information
Custom error information can be specified on judgments,rules and auxiliary functions. This can be used for providingerror information that is useful in specific scenarios.
When specifying a custom error information, using thekeyword error followed by a string describing the error,the developer can also specify the source element in theprogram that will be marked with error. Additional data canbe attached to the error information that can be later reused incase of custom error handling.
Moreover, when using the explicit failure keyword fail,a custom error information can be specified as well. This useof fail is useful together with or blocks to provide moreinformation about the error.
For example, consider the boolean premise
args.size() == params.size()
that checks that the number of arguments is equal to thenumber of parameters in a Java-like method invocation. If thatpremise fails, the default error message will show the originalexpression text, specifying that it failed. This would not beuseful for the user (it would show an error with implementationdetails). To generate a better error message we can write
args.size() == params.size()orfail error "expected " + params.size() +" arguments, but was " + args.size()
There might be cases when we want to show errorscontaining more information about the cause that made a ruleinvocation fail, especially when the failure took place becauseof a rule invocation that is deep in the rule invocation stack.For such cases, the implicit variable previousFailure isavailable. This is automatically handled by Xsemantics at run-time: in case of a rule failure, it provides the developer withall the problems that took place when applying the rule. Thisallows us to build informative error messages as shown inSection VI-A.
G. Caching
In a language implemented with Xtext, types are used inmany places by the framework, e.g., in the scope provider,in the validator and in the content assist. Besides that, sometype computation rules, some subtyping checks and someauxiliary functions are also used more than once from thetype system implementation itself. For example, the subtypingrelation between the same two classes can be checked by manycheckrules for the same sources.
For the above reasons, the results of type computationsshould be cached to improve the performance of the compilerand, most of all, the responsiveness of the Eclipse editor.However, caching usually introduces a few levels of complex-ity in implementations, and, in the context of an IDE thatperforms background parsing and checking, we also need tokeep track of changes that should invalidate the cached values.Xsemantics provides automatic caching mechanisms that canbe enabled in a system specification. These mechanisms inter-nally use at run-time a cache that stores its values in the scopeof a resource (a resource is an abstraction of a source file).The cached values will be automatically discarded as soon asthe contents of the program changes. When caching is enabledin an Xsemantics system specification, then Xsemantics willgenerate Java code that automatically uses the cache, hidingthe details from the programmer.
The programmer can enable caching, using the keywordcached on a per-judgment basis. The rationale behind thisgranularity is that caching should be enabled with care, other-wise it could decrease the performance. In fact, the caching isbased on the Java hashing features, thus it makes sense onlywhen used with actual object instances, not with references. Infact, in the AST of a program there might be many differentreferences to the same object, and using such references ascache keys will only lead to many cache misses. Thus, itis responsibility of the programmer to be aware of whichjudgments and auxiliary functions to cache, depending on thenature of the involved input parameters.
The use of caching for the implementation of the N4JS’type system is described in Section VI-B.
H. Extensions
When defining a system in Xsemantics it is also possibleto extend another Xsemantics system, using extends. Justlike in Java class inheritance, an extended system implicitlyinherits from the “super system” all judgments, rules, checkrules and auxiliary functions. In the extended system onecan override any such element; the overriding follows thesame Java overriding rules (e.g., the types of input parametersmust be the same and the types of output parameters canbe subtypes). For example, an axiom in a super system canbe turned into a rule in the extended system and vice versa.Similarly, we can override a judgment of the super systemchanging the names of parameters and error specifications.Since an Xtext grammar can inherit from another grammar,Xsemantics system extensions can be used when the languagewe inherit from already implements a type system usingXsemantics. Moreover, we used system extension to quicklytest possible modifications/improvements to an existing typesystem, e.g., for testing that caching features do not break thetype system implementation.
V. N4JS—A TYPED JAVASCRIPT
We have used Xsemantics to implement the type systemof a real-world programming language called N4JS. In thissection, we give an overview of the syntax and semantics ofN4JS, before presenting the Xsemantics-based implementationof the N4JS type system in Section VI.
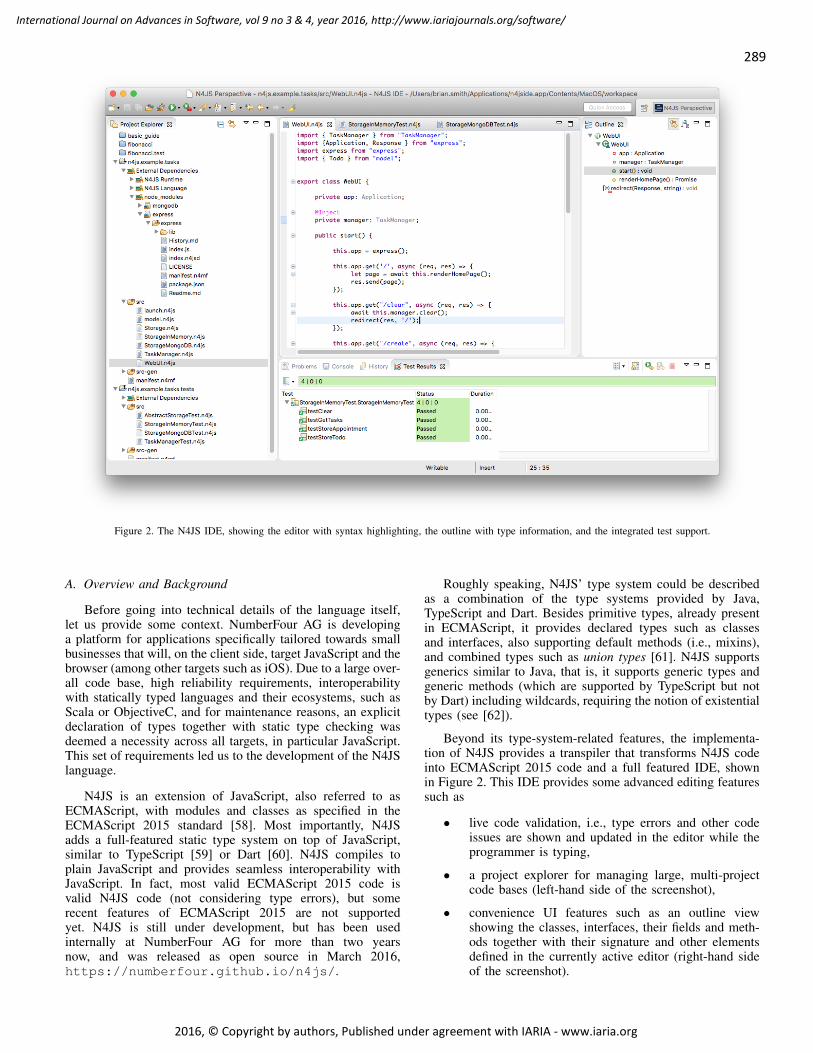
289
International Journal on Advances in Software, vol 9 no 3 & 4, year 2016, http://www.iariajournals.org/software/
2016, © Copyright by authors, Published under agreement with IARIA - www.iaria.org
Figure 2. The N4JS IDE, showing the editor with syntax highlighting, the outline with type information, and the integrated test support.
A. Overview and Background
Before going into technical details of the language itself,let us provide some context. NumberFour AG is developinga platform for applications specifically tailored towards smallbusinesses that will, on the client side, target JavaScript and thebrowser (among other targets such as iOS). Due to a large over-all code base, high reliability requirements, interoperabilitywith statically typed languages and their ecosystems, such asScala or ObjectiveC, and for maintenance reasons, an explicitdeclaration of types together with static type checking wasdeemed a necessity across all targets, in particular JavaScript.This set of requirements led us to the development of the N4JSlanguage.
N4JS is an extension of JavaScript, also referred to asECMAScript, with modules and classes as specified in theECMAScript 2015 standard [58]. Most importantly, N4JSadds a full-featured static type system on top of JavaScript,similar to TypeScript [59] or Dart [60]. N4JS compiles toplain JavaScript and provides seamless interoperability withJavaScript. In fact, most valid ECMAScript 2015 code isvalid N4JS code (not considering type errors), but somerecent features of ECMAScript 2015 are not supportedyet. N4JS is still under development, but has been usedinternally at NumberFour AG for more than two yearsnow, and was released as open source in March 2016,https://numberfour.github.io/n4js/.
Roughly speaking, N4JS’ type system could be describedas a combination of the type systems provided by Java,TypeScript and Dart. Besides primitive types, already presentin ECMAScript, it provides declared types such as classesand interfaces, also supporting default methods (i.e., mixins),and combined types such as union types [61]. N4JS supportsgenerics similar to Java, that is, it supports generic types andgeneric methods (which are supported by TypeScript but notby Dart) including wildcards, requiring the notion of existentialtypes (see [62]).
Beyond its type-system-related features, the implementa-tion of N4JS provides a transpiler that transforms N4JS codeinto ECMAScript 2015 code and a full featured IDE, shownin Figure 2. This IDE provides some advanced editing featuressuch as
• live code validation, i.e., type errors and other codeissues are shown and updated in the editor while theprogrammer is typing,
• a project explorer for managing large, multi-projectcode bases (left-hand side of the screenshot),
• convenience UI features such as an outline viewshowing the classes, interfaces, their fields and meth-ods together with their signature and other elementsdefined in the currently active editor (right-hand sideof the screenshot).
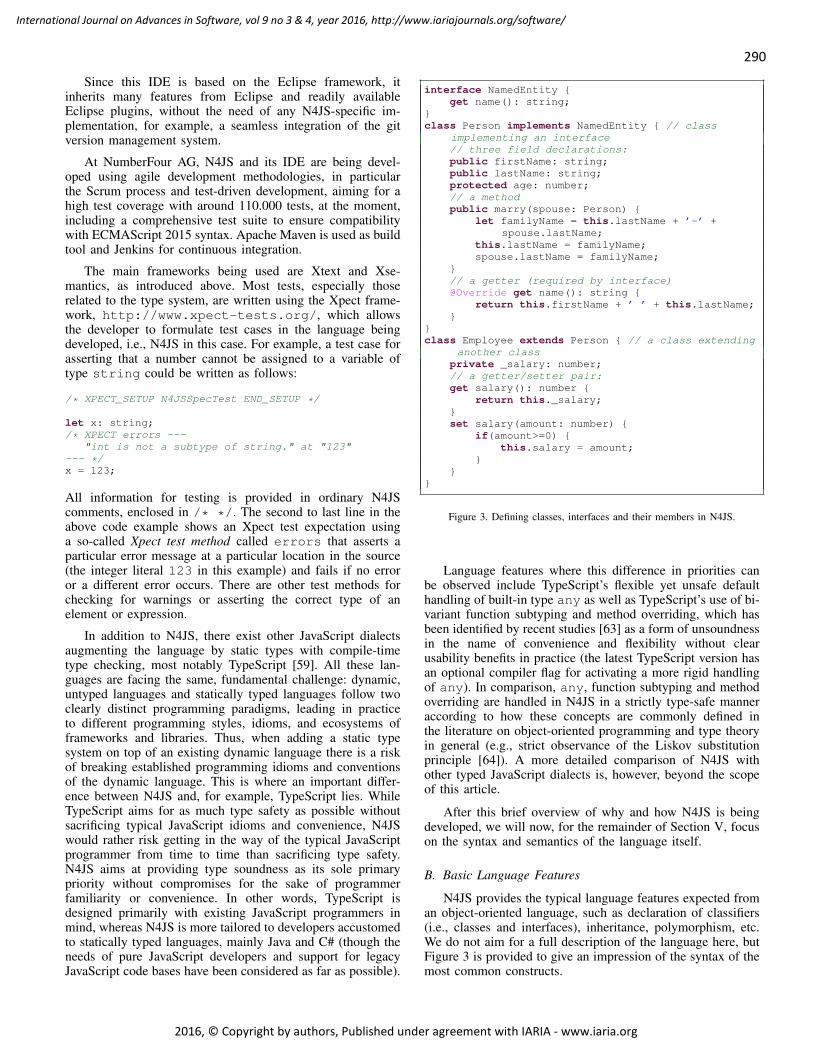
290
International Journal on Advances in Software, vol 9 no 3 & 4, year 2016, http://www.iariajournals.org/software/
2016, © Copyright by authors, Published under agreement with IARIA - www.iaria.org
Since this IDE is based on the Eclipse framework, itinherits many features from Eclipse and readily availableEclipse plugins, without the need of any N4JS-specific im-plementation, for example, a seamless integration of the gitversion management system.
At NumberFour AG, N4JS and its IDE are being devel-oped using agile development methodologies, in particularthe Scrum process and test-driven development, aiming for ahigh test coverage with around 110.000 tests, at the moment,including a comprehensive test suite to ensure compatibilitywith ECMAScript 2015 syntax. Apache Maven is used as buildtool and Jenkins for continuous integration.
The main frameworks being used are Xtext and Xse-mantics, as introduced above. Most tests, especially thoserelated to the type system, are written using the Xpect frame-work, http://www.xpect-tests.org/, which allowsthe developer to formulate test cases in the language beingdeveloped, i.e., N4JS in this case. For example, a test case forasserting that a number cannot be assigned to a variable oftype string could be written as follows:
/* XPECT_SETUP N4JSSpecTest END_SETUP */
let x: string;/* XPECT errors ---
"int is not a subtype of string." at "123"--- */x = 123;
All information for testing is provided in ordinary N4JScomments, enclosed in /* */. The second to last line in theabove code example shows an Xpect test expectation usinga so-called Xpect test method called errors that asserts aparticular error message at a particular location in the source(the integer literal 123 in this example) and fails if no erroror a different error occurs. There are other test methods forchecking for warnings or asserting the correct type of anelement or expression.
In addition to N4JS, there exist other JavaScript dialectsaugmenting the language by static types with compile-timetype checking, most notably TypeScript [59]. All these lan-guages are facing the same, fundamental challenge: dynamic,untyped languages and statically typed languages follow twoclearly distinct programming paradigms, leading in practiceto different programming styles, idioms, and ecosystems offrameworks and libraries. Thus, when adding a static typesystem on top of an existing dynamic language there is a riskof breaking established programming idioms and conventionsof the dynamic language. This is where an important differ-ence between N4JS and, for example, TypeScript lies. WhileTypeScript aims for as much type safety as possible withoutsacrificing typical JavaScript idioms and convenience, N4JSwould rather risk getting in the way of the typical JavaScriptprogrammer from time to time than sacrificing type safety.N4JS aims at providing type soundness as its sole primarypriority without compromises for the sake of programmerfamiliarity or convenience. In other words, TypeScript isdesigned primarily with existing JavaScript programmers inmind, whereas N4JS is more tailored to developers accustomedto statically typed languages, mainly Java and C# (though theneeds of pure JavaScript developers and support for legacyJavaScript code bases have been considered as far as possible).
interface NamedEntity get name(): string;
class Person implements NamedEntity // class
implementing an interface// three field declarations:public firstName: string;public lastName: string;protected age: number;// a methodpublic marry(spouse: Person)
let familyName = this.lastName + ’-’ +spouse.lastName;
this.lastName = familyName;spouse.lastName = familyName;
// a getter (required by interface)@Override get name(): string
return this.firstName + ’ ’ + this.lastName;
class Employee extends Person // a class extending
another classprivate _salary: number;// a getter/setter pair:get salary(): number
return this._salary;set salary(amount: number)
if(amount>=0) this.salary = amount;
Figure 3. Defining classes, interfaces and their members in N4JS.
Language features where this difference in priorities canbe observed include TypeScript’s flexible yet unsafe defaulthandling of built-in type any as well as TypeScript’s use of bi-variant function subtyping and method overriding, which hasbeen identified by recent studies [63] as a form of unsoundnessin the name of convenience and flexibility without clearusability benefits in practice (the latest TypeScript version hasan optional compiler flag for activating a more rigid handlingof any). In comparison, any, function subtyping and methodoverriding are handled in N4JS in a strictly type-safe manneraccording to how these concepts are commonly defined inthe literature on object-oriented programming and type theoryin general (e.g., strict observance of the Liskov substitutionprinciple [64]). A more detailed comparison of N4JS withother typed JavaScript dialects is, however, beyond the scopeof this article.
After this brief overview of why and how N4JS is beingdeveloped, we will now, for the remainder of Section V, focuson the syntax and semantics of the language itself.
B. Basic Language Features
N4JS provides the typical language features expected froman object-oriented language, such as declaration of classifiers(i.e., classes and interfaces), inheritance, polymorphism, etc.We do not aim for a full description of the language here, butFigure 3 is provided to give an impression of the syntax of themost common constructs.

291
International Journal on Advances in Software, vol 9 no 3 & 4, year 2016, http://www.iariajournals.org/software/
2016, © Copyright by authors, Published under agreement with IARIA - www.iaria.org
In addition to fields and methods, classifiers may haveso-called getters and setters members, which are similar tomethods but are invoked as if the containing classifier had afield of that name. For example, the getter/setter pair salaryof class Employee in Figure 3 would be invoked as follows:
let e = new Employee();e.salary = 42;console.log(e.salary);
Line 2 invokes setter salary with a value of 42 asargument and line 3 invokes the getter. Providing only either agetter or setter amounts to a read-only / write-only field fromoutside the type.
For the remainder of this section we focus on languagefeatures of N4JS that are less common and are most relevantfrom a type system perspective.
C. Union and Intersection Types
As a first advanced feature, N4JS allows the programmerto combine two or more existing types to form a new typethat represents the union or intersection of the combined types.Given types T1, ...,Tn, the union U of these types is a supertypeof another type T ′ if and only if T ′ is a subtype of at leastone of the combined types and is a subtype of T ′ if and onlyif T ′ is a subtype of all the combined types.
More formally, given types T1, ...,Tn and the union U ofthese types, for all types T ′ we have
T ′ <: U ⇐⇒ T ′ <: T1∨ ...∨T ′ <: Tn (1)U <: T ′⇐⇒ T1 <: T ′∧ ...∧Tn <: T ′ (2)
In N4JS source code, the union of two types A and B iswritten as A|B. The following N4JS code snippet provides anexample:
function foo(param: string | number) let str: string;str = param; // ERROR
foo(’hello’); // okfoo(42); // ok
Function foo can be invoked with strings and with num-bers as argument, because string is a subtype of the unionstring|number and also number is a subtype of thisunion. However, the assignment inside function foo fails,because union string|number is not a subtype of string(and also not a subtype of number).
Intersection types are defined accordingly: the intersectionis a subtype of all its combined types. The notation for theintersection of two types A and B in N4JS source code isA&B.
Intersection types are actually more common in mainstreamlanguages than union types. Java has support for intersectiontypes, but they can only be used in very few places, forexample, when declaring the upper bound of a type parameter:
public interface I public interface J public class G<T extends I & J>
/* ... */
Here, type parameter T has the intersection type I & J as itsupper bound; Java developers often view this as parameter Thaving two upper bounds I and J.
From a practical point of view, union types are particu-larly important in N4JS, because N4JS—just as ECMAScript2015—does not allow method overloading. So, union types area means to provide methods than can handle different typesof arguments in much the same way as done in Java usingmethod overloading.
D. Nominal and Structural Typing
The fundamental notion for reasoning about types is thesubtype relation. According to the Liskov substitution princi-ple [64], given two types S,T we call S a subtype of T if andonly if every property that can be observed from the outsidefor T , does also apply to S, and we can thus use instances ofS wherever instances of T are expected.
One of the primary responsibilities of a type system is todecide whether a given type is, in the above sense, a subtypeof another type. N4JS provides support for different strategiesof checking whether two types are subtypes of one another,namely nominal and structural typing [8]. Additionally, itprovides certain variations of structural typing to supporttypical use cases of ECMAScript.
In the context of a programming language, a type S is asubtype of type T if, roughly speaking, a value of type S maybe used as if it were a value of type T . Therefore, if type Sis a subtype of T , denoted as S <: T , a value that is knownto be of type S may, for example, be assigned to a variableof type T or may be passed as an argument to a functionexpecting an argument of type T . There are two major classesof type systems that differ in how they decide on such typecompatibility:
• Nominal type systems, as known from most object-oriented programming languages, e.g., Java, C#.
• Structural type systems, as more common in typetheory and functional programming languages.
Since N4JS provides both forms of typing, we brieflyintroduce each approach in the following sections before weshow how they are combined in N4JS.
1) Nominal Typing: In a nominal, or nominative, typesystem, two types are deemded to be the same if they havethe same name and a type S is deemed to be an (immediate)subtype of a type T if and only if S is explicitly declared tobe a subtype of T .
In the following example, Employee is a subtype ofPerson because it is declared as such using keywordextends within its class declaration. Conversely, Productis not a subtype of Person because it lacks such an “extends”declaration.
class Person public name: string;
class Employee extends Person public salary: number;
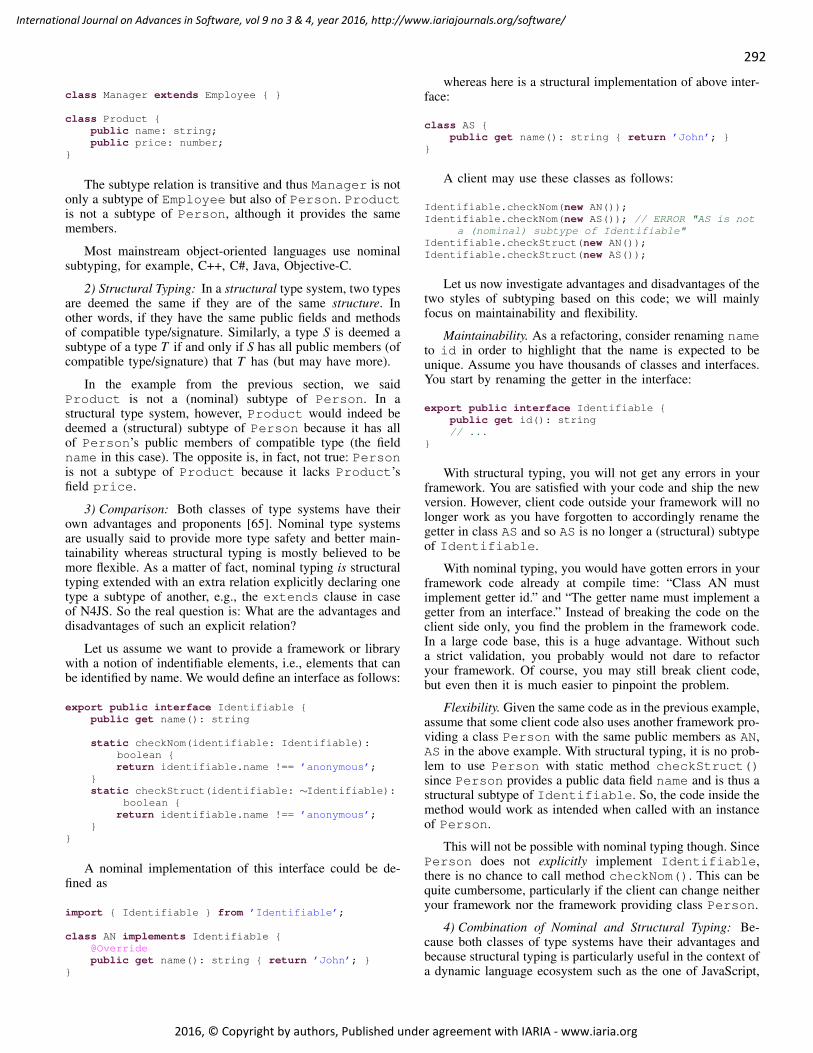
292
International Journal on Advances in Software, vol 9 no 3 & 4, year 2016, http://www.iariajournals.org/software/
2016, © Copyright by authors, Published under agreement with IARIA - www.iaria.org
class Manager extends Employee
class Product public name: string;public price: number;
The subtype relation is transitive and thus Manager is notonly a subtype of Employee but also of Person. Productis not a subtype of Person, although it provides the samemembers.
Most mainstream object-oriented languages use nominalsubtyping, for example, C++, C#, Java, Objective-C.
2) Structural Typing: In a structural type system, two typesare deemed the same if they are of the same structure. Inother words, if they have the same public fields and methodsof compatible type/signature. Similarly, a type S is deemed asubtype of a type T if and only if S has all public members (ofcompatible type/signature) that T has (but may have more).
In the example from the previous section, we saidProduct is not a (nominal) subtype of Person. In astructural type system, however, Product would indeed bedeemed a (structural) subtype of Person because it has allof Person’s public members of compatible type (the fieldname in this case). The opposite is, in fact, not true: Personis not a subtype of Product because it lacks Product’sfield price.
3) Comparison: Both classes of type systems have theirown advantages and proponents [65]. Nominal type systemsare usually said to provide more type safety and better main-tainability whereas structural typing is mostly believed to bemore flexible. As a matter of fact, nominal typing is structuraltyping extended with an extra relation explicitly declaring onetype a subtype of another, e.g., the extends clause in caseof N4JS. So the real question is: What are the advantages anddisadvantages of such an explicit relation?
Let us assume we want to provide a framework or librarywith a notion of indentifiable elements, i.e., elements that canbe identified by name. We would define an interface as follows:
export public interface Identifiable public get name(): string
static checkNom(identifiable: Identifiable):boolean return identifiable.name !== ’anonymous’;
static checkStruct(identifiable: ∼Identifiable):
boolean return identifiable.name !== ’anonymous’;
A nominal implementation of this interface could be de-fined as
import Identifiable from ’Identifiable’;
class AN implements Identifiable @Overridepublic get name(): string return ’John’;
whereas here is a structural implementation of above inter-face:
class AS public get name(): string return ’John’;
A client may use these classes as follows:
Identifiable.checkNom(new AN());Identifiable.checkNom(new AS()); // ERROR "AS is not
a (nominal) subtype of Identifiable"Identifiable.checkStruct(new AN());Identifiable.checkStruct(new AS());
Let us now investigate advantages and disadvantages of thetwo styles of subtyping based on this code; we will mainlyfocus on maintainability and flexibility.
Maintainability. As a refactoring, consider renaming nameto id in order to highlight that the name is expected to beunique. Assume you have thousands of classes and interfaces.You start by renaming the getter in the interface:
export public interface Identifiable public get id(): string// ...
With structural typing, you will not get any errors in yourframework. You are satisfied with your code and ship the newversion. However, client code outside your framework will nolonger work as you have forgotten to accordingly rename thegetter in class AS and so AS is no longer a (structural) subtypeof Identifiable.
With nominal typing, you would have gotten errors in yourframework code already at compile time: “Class AN mustimplement getter id.” and “The getter name must implement agetter from an interface.” Instead of breaking the code on theclient side only, you find the problem in the framework code.In a large code base, this is a huge advantage. Without sucha strict validation, you probably would not dare to refactoryour framework. Of course, you may still break client code,but even then it is much easier to pinpoint the problem.
Flexibility. Given the same code as in the previous example,assume that some client code also uses another framework pro-viding a class Person with the same public members as AN,AS in the above example. With structural typing, it is no prob-lem to use Person with static method checkStruct()since Person provides a public data field name and is thus astructural subtype of Identifiable. So, the code inside themethod would work as intended when called with an instanceof Person.
This will not be possible with nominal typing though. SincePerson does not explicitly implement Identifiable,there is no chance to call method checkNom(). This can bequite cumbersome, particularly if the client can change neitheryour framework nor the framework providing class Person.
4) Combination of Nominal and Structural Typing: Be-cause both classes of type systems have their advantages andbecause structural typing is particularly useful in the context ofa dynamic language ecosystem such as the one of JavaScript,

293
International Journal on Advances in Software, vol 9 no 3 & 4, year 2016, http://www.iariajournals.org/software/
2016, © Copyright by authors, Published under agreement with IARIA - www.iaria.org
N4JS provides both kinds of typing and aims to combine themin a seamless way.
N4JS uses nominal typing by default, but allows theprogrammer to switch to structural typing by means of specialtype constructors using the tilde symbol. The switch can bedone with either of the following:
• Globally when defining a type. This then applies toall uses of the type throughout the code, referred toas definition-site structural typing
• Locally when referring to an existing nominal type,referred to as use-site structural typing.
For the latter we have already seen an example in the signatureof static method checkStruct(). For its parameter elemwe used a (use-site) structural type by prefixing the typereference with a ∼ (tilde), which means we are allowed, wheninvoking checkStruct(), to pass in an instance of ASor Person even though they are not nominal subtypes ofIdentifiable.
This way, N4JS provides the advantages of nominal typing(which is the default form of typing) while granting many ofthe advantages of structural typing, if the programmer decidesto use it. Additionally, if you rename name to id, the tildewill tell you that there may be client code calling the methodwith a structural type.
The full flexibility of a purely structurally typed language,however, cannot be achieved with this combination. For exam-ple, the client of an existing function or method that is declaredto expect an argument of a nominal type N is confined tonominal typing. They cannot choose to invoke this functionwith an argument that is only a structural subtype of N (itwould be a compile time error). This could possibly be exactlythe intention of the framework’s author in order to enableeasier refactoring later.
5) Field Structural Typing: N4JS provides some variants ofstructural types. Usually two structural types are compatible, ifthey provide the same properties, or in case of classes, publicmembers. In ECMAScript we often only need to access thefields. In N4JS, we can use ∼∼ to refer to the so-called fieldstructural type. Two field structural types are compatible, ifthey provide the same public fields. Methods are ignored inthese cases. Actually, N4JS provides even more options. Thereare several modifiers to further filter the properties or membersto be considered:
• ∼r∼ only considers getters and data fields,
• ∼w∼ only considers setters and data fields,
• ∼i∼ is used for initializer parameters: for every setteror (non-optional) data field in the type, the ∼i∼-typeneeds to provide a getter or (readable) data field.
E. Parameterized Types
Generics in N4JS are a language feature that allows forgeneric programming. They enable a function, class, interface,or method to operate on the values of various (possiblyunknown) types while preserving compile-time type safety.There are some differences with respect to Java generics, whichwe shall describe below.
1) Motivation: Several language elements may be declaredin a generic form; we will start with focusing on classes,generic methods will be discussed after that.
The standard case, of course, is a non-generic class. Takethe following class, for example, that aggregates a pair of twostrings:
export public class PairOfString first: string;second: string;
This implementation is fine as long as all we ever wantto store are strings. If we wanted to store numbers, we wouldhave to add another class:
export public class PairOfNumber first: number;second: number;
Following this pattern of adding more classes for new typesto be stored obviously has its limitations. We would soon endup with a multitude of classes that are basically serving thesame purpose, leading to code duplication, bad maintainabilityand many other problems.
One solution could be having a class that stores two valuesof type any (in N4JS, any is the so-called top type, thecommon supertype of all other types).
export public class PairOfWhatEver first: any;second: any;
Now the situation is worse off than before. We have lostthe certainty that within a single pair, both values will alwaysbe of the same type. When reading a value from a pair, wehave no clue what its type might be.
2) Generic Classes and Interfaces: The way to solve ourprevious conundrum using generics is to introduce a typevariable for the class. We will then call such a class a genericclass. A type variable can then be used within the classdeclaration just as any other ordinary type.
export public class Pair<T> first: T;second: T;
The type variable T, declared after the class name in anglebrackets, now represents the type of the values stored in thePair and can be used as the type of the two fields.
Now, whenever we refer to the class Pair, we will providea type argument, in other words a type that will be usedwherever the type variable T is being used inside the classdeclaration.
import Pair from ’Pair’;
let myPair = new Pair<string>();myPair.first = ’1st value’;myPair.second = ’2nd value’;

294
International Journal on Advances in Software, vol 9 no 3 & 4, year 2016, http://www.iariajournals.org/software/
2016, © Copyright by authors, Published under agreement with IARIA - www.iaria.org
By using a type variable, we have not just allowed anygiven type to be used as value type, we have also stated thatboth values, first and second, must always be of the same type.We have also given the type system a chance to track the typesof values stored in a Pair:
import Pair from ’Pair’;
let myPair2 = new Pair<string>();myPair2.first = ’1st value’;myPair2.second = 42; // error: ’int is not a subtype
of string.’
console.log(myPair2.first.charAt(2));// type system will know myPair2.first is of type
string
The error in line 3 shows that the type checker will makesure we will not put any value of incorrect type into the pair.The fact that we can access method charAt() (available onstrings) in the last line indicates that when we read a valuefrom the pair, the type system knows its type and we can useit accordingly.
Generic interfaces can be declared in exactly the same way.
3) Generic Functions and Methods: With the above, wecan now avoid introducing a multitude of classes that arebasically serving the same purpose. It is still not possible,however, to write code that manipulates such pairs regardlessof the type of its values may have. For example, a functionfor swapping the two values of a pair and then return the newfirst value would look like this:
import PairOfString from ’PairOfString’;
function swapStrings1(pair: PairOfString): string let backup = pair.first; // inferred type of ’
backup’ will be stringpair.first = pair.second;pair.second = backup;return pair.first;
The above function would have to be copied for every valuetype to be supported. Using the generic class Pair<T> doesnot help much:
import Pair from ’Pair’;
function swapStrings2(pair: Pair<string>): string let backup = pair.first; // inferred type of ’
backup’ will be stringpair.first = pair.second;pair.second = backup;return pair.first;
The solution is not only to make the type being manipulatedgeneric (as we have done with class Pair<T> above) but tomake the code performing the manipulation generic:
import Pair from ’Pair’;
function <T> swap(pair: Pair<T>): T let backup = pair.first; // inferred type of ’
backup’ will be Tpair.first = pair.second;pair.second = backup;
return pair.first;
We have introduced a type variable for function swap()in much the same way as we have done for class Pair inthe previous section (we then call such a function a genericfunction). Similarly, we can use the type variable in thisfunction’s signature and body.
It is possible to state in the declaration of the functionswap() above that it will return something of type T whenhaving obtained a Pair<T> without even knowing what typethat might be. This allows the type system to track the type ofvalues passed between functions and methods or put into andtaken out of containers, and so on.
Generic methods can be declared just as generic functions.There is one caveat, however: Only if a method introducesits own new type variables it is called a generic method. Ifit is merely using the type variables of its containing classor interface, it is an ordinary method. The following exampleillustrates the difference:
export public class Pair<T>
public foo(): T public <S> bar(pair: Pair2<S>): void /*...*/
The first method foo is a non generic method, while thesecond one bar is.
A very interesting application of generic methods is whenusing them in combination with function type arguments:
class Pair<T>
<R> merge(merger: function(T,T): R): R return merger(this.first, this.second);
var p = new Pair<string>();/* ... */var i = p.merge( (f,s)=> f.length+s.length )
You will notice that N4JS can infer the correct types for thearguments and the return type of the arrow expression. Also,the type for i will be automatically computed.
4) Differences to Java: Important differences betweengenerics in Java and N4JS include:
• Primitive types can be used as type arguments inN4JS.
• There are no raw types in N4JS. Whenever a genericclass or interface is referenced, a type argument has tobe provided - possibly in the form of a wildcard. Forgeneric functions and methods, an explicit definitionof type arguments is optional if the type system caninfer the type arguments from the context.
F. Use-site and Definition-Site Variance
In the context of generic types, the “variance of a generictype G〈T1, ...,Tn〉 in Ti, i∈ 1, ...,n,” tells how G behaves with
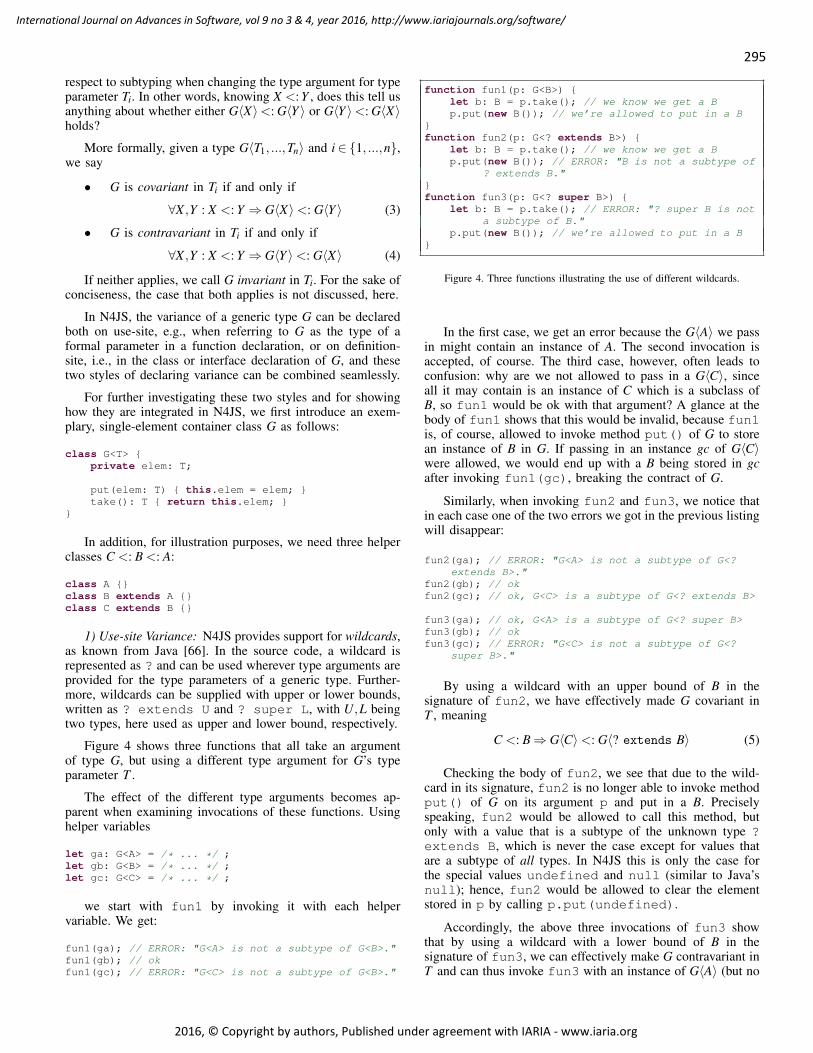
295
International Journal on Advances in Software, vol 9 no 3 & 4, year 2016, http://www.iariajournals.org/software/
2016, © Copyright by authors, Published under agreement with IARIA - www.iaria.org
respect to subtyping when changing the type argument for typeparameter Ti. In other words, knowing X <: Y , does this tell usanything about whether either G〈X〉<: G〈Y 〉 or G〈Y 〉<: G〈X〉holds?
More formally, given a type G〈T1, ...,Tn〉 and i ∈ 1, ...,n,we say
• G is covariant in Ti if and only if
∀X ,Y : X <: Y ⇒ G〈X〉<: G〈Y 〉 (3)
• G is contravariant in Ti if and only if
∀X ,Y : X <: Y ⇒ G〈Y 〉<: G〈X〉 (4)
If neither applies, we call G invariant in Ti. For the sake ofconciseness, the case that both applies is not discussed, here.
In N4JS, the variance of a generic type G can be declaredboth on use-site, e.g., when referring to G as the type of aformal parameter in a function declaration, or on definition-site, i.e., in the class or interface declaration of G, and thesetwo styles of declaring variance can be combined seamlessly.
For further investigating these two styles and for showinghow they are integrated in N4JS, we first introduce an exem-plary, single-element container class G as follows:
class G<T> private elem: T;
put(elem: T) this.elem = elem; take(): T return this.elem;
In addition, for illustration purposes, we need three helperclasses C <: B <: A:
class A class B extends A class C extends B
1) Use-site Variance: N4JS provides support for wildcards,as known from Java [66]. In the source code, a wildcard isrepresented as ? and can be used wherever type arguments areprovided for the type parameters of a generic type. Further-more, wildcards can be supplied with upper or lower bounds,written as ? extends U and ? super L, with U,L beingtwo types, here used as upper and lower bound, respectively.
Figure 4 shows three functions that all take an argumentof type G, but using a different type argument for G’s typeparameter T .
The effect of the different type arguments becomes ap-parent when examining invocations of these functions. Usinghelper variables
let ga: G<A> = /* ... */ ;let gb: G<B> = /* ... */ ;let gc: G<C> = /* ... */ ;
we start with fun1 by invoking it with each helpervariable. We get:
fun1(ga); // ERROR: "G<A> is not a subtype of G<B>."fun1(gb); // okfun1(gc); // ERROR: "G<C> is not a subtype of G<B>."
function fun1(p: G<B>) let b: B = p.take(); // we know we get a Bp.put(new B()); // we’re allowed to put in a B
function fun2(p: G<? extends B>)
let b: B = p.take(); // we know we get a Bp.put(new B()); // ERROR: "B is not a subtype of
? extends B."function fun3(p: G<? super B>)
let b: B = p.take(); // ERROR: "? super B is nota subtype of B."
p.put(new B()); // we’re allowed to put in a B
Figure 4. Three functions illustrating the use of different wildcards.
In the first case, we get an error because the G〈A〉 we passin might contain an instance of A. The second invocation isaccepted, of course. The third case, however, often leads toconfusion: why are we not allowed to pass in a G〈C〉, sinceall it may contain is an instance of C which is a subclass ofB, so fun1 would be ok with that argument? A glance at thebody of fun1 shows that this would be invalid, because fun1is, of course, allowed to invoke method put() of G to storean instance of B in G. If passing in an instance gc of G〈C〉were allowed, we would end up with a B being stored in gcafter invoking fun1(gc), breaking the contract of G.
Similarly, when invoking fun2 and fun3, we notice thatin each case one of the two errors we got in the previous listingwill disappear:
fun2(ga); // ERROR: "G<A> is not a subtype of G<?extends B>."
fun2(gb); // okfun2(gc); // ok, G<C> is a subtype of G<? extends B>
fun3(ga); // ok, G<A> is a subtype of G<? super B>fun3(gb); // okfun3(gc); // ERROR: "G<C> is not a subtype of G<?
super B>."
By using a wildcard with an upper bound of B in thesignature of fun2, we have effectively made G covariant inT , meaning
C <: B⇒ G〈C〉<: G〈? extends B〉 (5)
Checking the body of fun2, we see that due to the wild-card in its signature, fun2 is no longer able to invoke methodput() of G on its argument p and put in a B. Preciselyspeaking, fun2 would be allowed to call this method, butonly with a value that is a subtype of the unknown type ?extends B, which is never the case except for values thatare a subtype of all types. In N4JS this is only the case forthe special values undefined and null (similar to Java’snull); hence, fun2 would be allowed to clear the elementstored in p by calling p.put(undefined).
Accordingly, the above three invocations of fun3 showthat by using a wildcard with a lower bound of B in thesignature of fun3, we can effectively make G contravariant inT and can thus invoke fun3 with an instance of G〈A〉 (but no
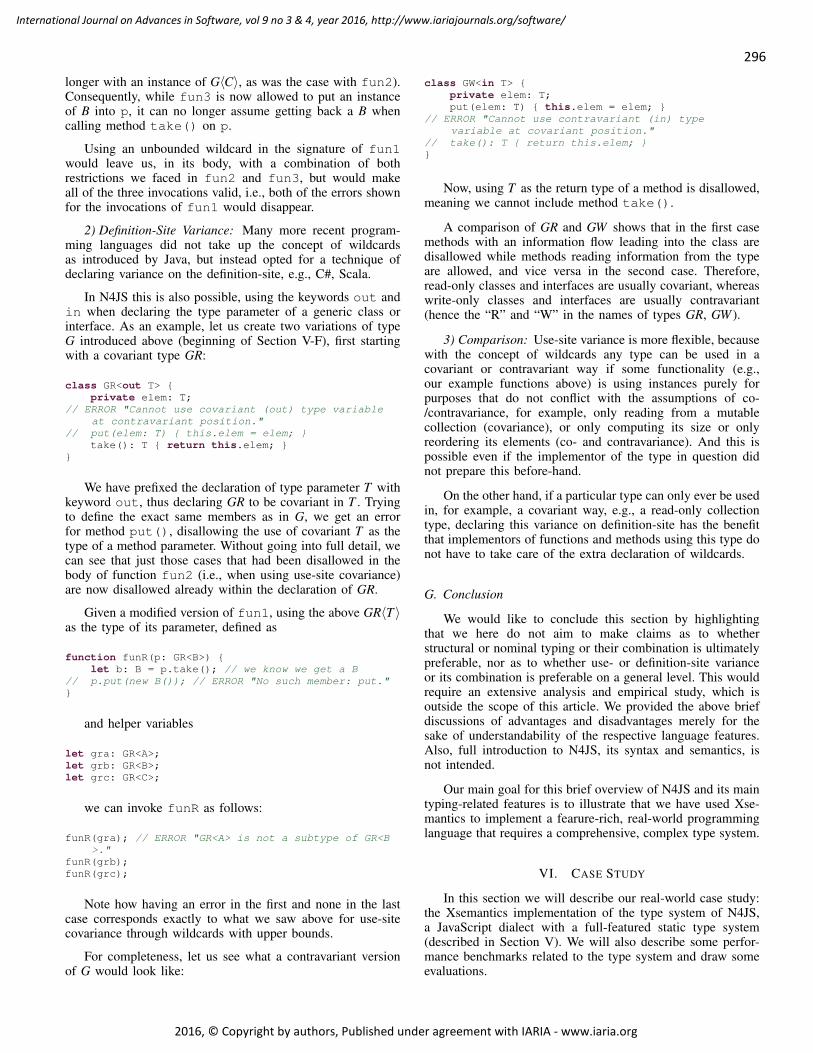
296
International Journal on Advances in Software, vol 9 no 3 & 4, year 2016, http://www.iariajournals.org/software/
2016, © Copyright by authors, Published under agreement with IARIA - www.iaria.org
longer with an instance of G〈C〉, as was the case with fun2).Consequently, while fun3 is now allowed to put an instanceof B into p, it can no longer assume getting back a B whencalling method take() on p.
Using an unbounded wildcard in the signature of fun1would leave us, in its body, with a combination of bothrestrictions we faced in fun2 and fun3, but would makeall of the three invocations valid, i.e., both of the errors shownfor the invocations of fun1 would disappear.
2) Definition-Site Variance: Many more recent program-ming languages did not take up the concept of wildcardsas introduced by Java, but instead opted for a technique ofdeclaring variance on the definition-site, e.g., C#, Scala.
In N4JS this is also possible, using the keywords out andin when declaring the type parameter of a generic class orinterface. As an example, let us create two variations of typeG introduced above (beginning of Section V-F), first startingwith a covariant type GR:
class GR<out T> private elem: T;
// ERROR "Cannot use covariant (out) type variableat contravariant position."
// put(elem: T) this.elem = elem; take(): T return this.elem;
We have prefixed the declaration of type parameter T withkeyword out, thus declaring GR to be covariant in T . Tryingto define the exact same members as in G, we get an errorfor method put(), disallowing the use of covariant T as thetype of a method parameter. Without going into full detail, wecan see that just those cases that had been disallowed in thebody of function fun2 (i.e., when using use-site covariance)are now disallowed already within the declaration of GR.
Given a modified version of fun1, using the above GR〈T 〉as the type of its parameter, defined as
function funR(p: GR<B>) let b: B = p.take(); // we know we get a B
// p.put(new B()); // ERROR "No such member: put."
and helper variables
let gra: GR<A>;let grb: GR<B>;let grc: GR<C>;
we can invoke funR as follows:
funR(gra); // ERROR "GR<A> is not a subtype of GR<B>."
funR(grb);funR(grc);
Note how having an error in the first and none in the lastcase corresponds exactly to what we saw above for use-sitecovariance through wildcards with upper bounds.
For completeness, let us see what a contravariant versionof G would look like:
class GW<in T> private elem: T;put(elem: T) this.elem = elem;
// ERROR "Cannot use contravariant (in) typevariable at covariant position."
// take(): T return this.elem;
Now, using T as the return type of a method is disallowed,meaning we cannot include method take().
A comparison of GR and GW shows that in the first casemethods with an information flow leading into the class aredisallowed while methods reading information from the typeare allowed, and vice versa in the second case. Therefore,read-only classes and interfaces are usually covariant, whereaswrite-only classes and interfaces are usually contravariant(hence the “R” and “W” in the names of types GR, GW ).
3) Comparison: Use-site variance is more flexible, becausewith the concept of wildcards any type can be used in acovariant or contravariant way if some functionality (e.g.,our example functions above) is using instances purely forpurposes that do not conflict with the assumptions of co-/contravariance, for example, only reading from a mutablecollection (covariance), or only computing its size or onlyreordering its elements (co- and contravariance). And this ispossible even if the implementor of the type in question didnot prepare this before-hand.
On the other hand, if a particular type can only ever be usedin, for example, a covariant way, e.g., a read-only collectiontype, declaring this variance on definition-site has the benefitthat implementors of functions and methods using this type donot have to take care of the extra declaration of wildcards.
G. Conclusion
We would like to conclude this section by highlightingthat we here do not aim to make claims as to whetherstructural or nominal typing or their combination is ultimatelypreferable, nor as to whether use- or definition-site varianceor its combination is preferable on a general level. This wouldrequire an extensive analysis and empirical study, which isoutside the scope of this article. We provided the above briefdiscussions of advantages and disadvantages merely for thesake of understandability of the respective language features.Also, full introduction to N4JS, its syntax and semantics, isnot intended.
Our main goal for this brief overview of N4JS and its maintyping-related features is to illustrate that we have used Xse-mantics to implement a fearure-rich, real-world programminglanguage that requires a comprehensive, complex type system.
VI. CASE STUDY
In this section we will describe our real-world case study:the Xsemantics implementation of the type system of N4JS,a JavaScript dialect with a full-featured static type system(described in Section V). We will also describe some perfor-mance benchmarks related to the type system and draw someevaluations.
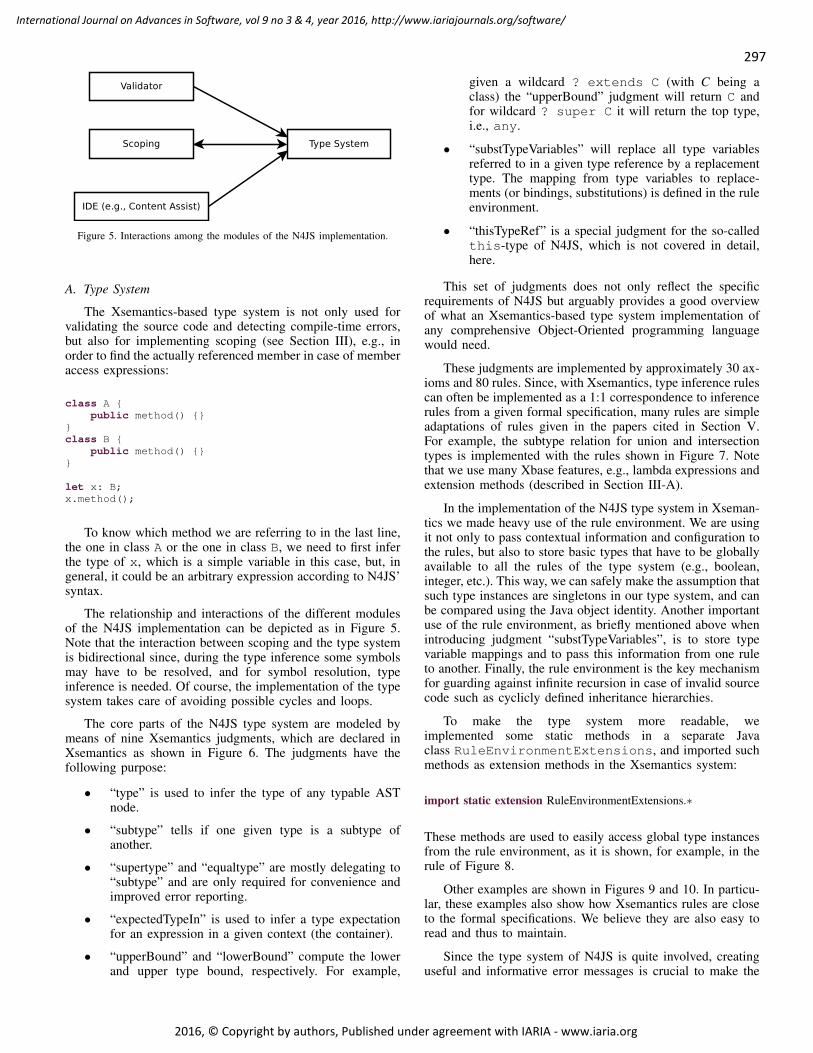
297
International Journal on Advances in Software, vol 9 no 3 & 4, year 2016, http://www.iariajournals.org/software/
2016, © Copyright by authors, Published under agreement with IARIA - www.iaria.org
Figure 5. Interactions among the modules of the N4JS implementation.
A. Type System
The Xsemantics-based type system is not only used forvalidating the source code and detecting compile-time errors,but also for implementing scoping (see Section III), e.g., inorder to find the actually referenced member in case of memberaccess expressions:
class A public method()
class B
public method()
let x: B;x.method();
To know which method we are referring to in the last line,the one in class A or the one in class B, we need to first inferthe type of x, which is a simple variable in this case, but, ingeneral, it could be an arbitrary expression according to N4JS’syntax.
The relationship and interactions of the different modulesof the N4JS implementation can be depicted as in Figure 5.Note that the interaction between scoping and the type systemis bidirectional since, during the type inference some symbolsmay have to be resolved, and for symbol resolution, typeinference is needed. Of course, the implementation of the typesystem takes care of avoiding possible cycles and loops.
The core parts of the N4JS type system are modeled bymeans of nine Xsemantics judgments, which are declared inXsemantics as shown in Figure 6. The judgments have thefollowing purpose:
• “type” is used to infer the type of any typable ASTnode.
• “subtype” tells if one given type is a subtype ofanother.
• “supertype” and “equaltype” are mostly delegating to“subtype” and are only required for convenience andimproved error reporting.
• “expectedTypeIn” is used to infer a type expectationfor an expression in a given context (the container).
• “upperBound” and “lowerBound” compute the lowerand upper type bound, respectively. For example,
given a wildcard ? extends C (with C being aclass) the “upperBound” judgment will return C andfor wildcard ? super C it will return the top type,i.e., any.
• “substTypeVariables” will replace all type variablesreferred to in a given type reference by a replacementtype. The mapping from type variables to replace-ments (or bindings, substitutions) is defined in the ruleenvironment.
• “thisTypeRef” is a special judgment for the so-calledthis-type of N4JS, which is not covered in detail,here.
This set of judgments does not only reflect the specificrequirements of N4JS but arguably provides a good overviewof what an Xsemantics-based type system implementation ofany comprehensive Object-Oriented programming languagewould need.
These judgments are implemented by approximately 30 ax-ioms and 80 rules. Since, with Xsemantics, type inference rulescan often be implemented as a 1:1 correspondence to inferencerules from a given formal specification, many rules are simpleadaptations of rules given in the papers cited in Section V.For example, the subtype relation for union and intersectiontypes is implemented with the rules shown in Figure 7. Notethat we use many Xbase features, e.g., lambda expressions andextension methods (described in Section III-A).
In the implementation of the N4JS type system in Xseman-tics we made heavy use of the rule environment. We are usingit not only to pass contextual information and configuration tothe rules, but also to store basic types that have to be globallyavailable to all the rules of the type system (e.g., boolean,integer, etc.). This way, we can safely make the assumption thatsuch type instances are singletons in our type system, and canbe compared using the Java object identity. Another importantuse of the rule environment, as briefly mentioned above whenintroducing judgment “substTypeVariables”, is to store typevariable mappings and to pass this information from one ruleto another. Finally, the rule environment is the key mechanismfor guarding against infinite recursion in case of invalid sourcecode such as cyclicly defined inheritance hierarchies.
To make the type system more readable, weimplemented some static methods in a separate Javaclass RuleEnvironmentExtensions, and imported suchmethods as extension methods in the Xsemantics system:
import static extension RuleEnvironmentExtensions.∗
These methods are used to easily access global type instancesfrom the rule environment, as it is shown, for example, in therule of Figure 8.
Other examples are shown in Figures 9 and 10. In particu-lar, these examples also show how Xsemantics rules are closeto the formal specifications. We believe they are also easy toread and thus to maintain.
Since the type system of N4JS is quite involved, creatinguseful and informative error messages is crucial to make the

298
International Journal on Advances in Software, vol 9 no 3 & 4, year 2016, http://www.iariajournals.org/software/
2016, © Copyright by authors, Published under agreement with IARIA - www.iaria.org
judgments
type |− TypableElement element : output TypeReferror "cannot type " + element?.eClass?.name + " " + stringRep(element)source element
subtype |− TypeArgument left <: TypeArgument righterror stringRep(left) + " is not a subtype of " + stringRep(right)
supertype |− TypeArgument left :> TypeArgument righterror stringRep(left) + " is not a super type of " + stringRep(right)
equaltype |− TypeArgument left ∼∼ TypeArgument righterror stringRep(left) + " is not equal to " + stringRep(right)
expectedTypeIn |− EObject container |> Expression expression : output TypeRef
upperBound |∼ TypeArgument typeArgument /\ output TypeRef
lowerBound |∼ TypeArgument typeArgument \/ output TypeRef
substTypeVariables |− TypeArgument typeArg ∼> output TypeArgument
thisTypeRef |∼ EObject location ∼> output TypeRef
Figure 6. Declarations of Xsemantics judgments from the N4JS type system.
rule subtypeUnion LeftG |− UnionTypeExpression U <: TypeRef S
from U.typeRefs.forall[T|
G |− T <: S]
rule subtypeUnion RightG |− TypeRef S <: UnionTypeExpression U
from U.typeRefs.exists[T|
G |− S <: T]
rule subtypeIntersection LeftG |− IntersectionTypeExpression I <: TypeRef S
from I.typeRefs.exists[T|
G |− T <: S]
rule subtypeIntersection RightG |− TypeRef S <: IntersectionTypeExpression I
from I.typeRefs.forall[T|
G |− S <: T]
Figure 7. N4JS union and intersection types implemented with Xsemantics.
rule typeUnaryExpressionG |− UnaryExpression e: TypeRef T
from switch (e.op)
case UnaryOperator.DELETE: T= G.booleanTypeRef()case UnaryOperator.VOID: T= G.undefinedTypeRef()case UnaryOperator.TYPEOF: T= G.stringTypeRef()case UnaryOperator.NOT: T= G.booleanTypeRef()default: // INC, DEC, POS, NEG, INV
T = G.numberTypeRef()
Figure 8. Typing of unary expression.
rule typeConditionalExpressionG |− ConditionalExpression expr : TypeRef T
from G |− expr.trueExpression : var TypeRef leftG |− expr.falseExpression : var TypeRef rightT = G.createUnionType(left, right)
Figure 9. Typing of conditional expression.
language usable, especially in the IDE. We have 3 main levelsof error messages in the implementation:
1) default error messages defined on judgment declara-tion,

299
International Journal on Advances in Software, vol 9 no 3 & 4, year 2016, http://www.iariajournals.org/software/
2016, © Copyright by authors, Published under agreement with IARIA - www.iaria.org
rule typeArrayLiteralG |− ArrayLiteral al : TypeRef T
from val elementTypes = al.elements.map[
elem |G |− elem : var TypeRef elementType;elementType;
]
T = G.arrayType.createTypeRef(G.createUnionType(elementTypes))
Figure 10. Typing of array literal expression.
Figure 11. The N4JS IDE and error reporting.
2) custom error messages using fail,3) customized error messages due to failed nested judg-
ments using previousFailure (described in Sec-tion IV-F).
Custom error messages are important especially whenchecking subtyping relations. For example, consider checkingsomething like A<string> <: A<number>. The declaredtypes are identical (i.e., A), so the type arguments have to bechecked. If we did not catch and change the error message pro-duced by the nested subtype checks string <: numberand number <: string, then the error message would bevery confusing for the user, because it only refers to the typearguments. In cases where the type arguments are explicitlygiven, this might be rather obvious, but that is not the casewhen the type arguments are only defined through type variablebindings or can change due to considering the upper/lowerbound. Some examples of error messages due to subtypingare shown in Figure 11.
Figure 12 shows an excerpt of the subtype rule for pa-rameterized type references, in order to illustrate how suchcomposed error messages can be implemented. The excerptshows the part of the rule that checks the type argumentsgiven on left and right side for compatibility. If one of thesesubtype checks fails, it creates an error message composedfrom the original error message of the failed nested subtypecheck (obtained via special property “previousFailure”) and an
additional explanation including the index of the incompatibletype argument. Note that such a composed error message isonly created in certain cases, in this example only if there are atleast two type arguments. Otherwise the default error messageof judgment “subtype” (Figure 6) is being issued automaticallyby using the keyword fail.
The Xsemantics code in Figure 12 also shows that when-ever some more involved special handling is required andthe special, declarative-style syntax provided by Xsemanticsis not suitable, all ordinary, imperative programming languageconstructs provided by Xbase can be integrated seamlessly intoan Xsemantics rule.
B. Performance
N4JS is used to develop large scale ECMAScript ap-plications. For this purpose, N4JS comes with a compiler,performing all validations and eventually transpiling the codeto plain ECMAScript. We have implemented a test suite inorder to measure the performance of the type system. Sincewe want to be able to measure the effect on performanceof specific constructs, we use synthetic tests with configuredscenarios. In spite of being artifical, these scenarios mimictypical situations in Javascript programming. There are severalconstructs and features that are performance critical, as theyrequire a lot of type inference (which means a lot of rules areto be called). We want to discuss three scenarios in detail,Figure 13 summarizes the important code snippets used inthese scenarios.
Function Expression: Although it is possible to specify thetypes of the formal parameters and the return type of functions,this is very inconvenient for function expressions. The functiondefinition f (Figure 13) is called in the lines below thedefinition. Function f takes a function as argument, whichitself requires a parameter of type C and returns an A element.Both calls (below the definition) use function expressions. Thefirst call uses a fully typed function expression, while thesecond one relies on type inference. Generic Method Calls:As in Java, it is possible to explicitly specify type argumentsin a call of a generic function. Similar to type expressions,it is more convenient to let the type system infer the typearguments, which actually is a typical constraint resolutionproblem. The generic function g (Figure 13) is called one timewith explicitly specified type argument, and one time withouttype arguments. Variable Declarations: The type of a variablecan either be explicitly declared, or it is inferred from thetype of the expression used in an assignment. This scenariodemonstrates why caching is so important: without caching,the type of x1 would be inferred three times. Of course, thisis not the case if the type of the variable is declared explicitly.
Table I shows some performance measurements, using thedescribed scenarios to set up larger tests. That is, test files aregenerated with 250 or more usages of function expressions,or with up to 200 variables initialized following the patterndescribed above. In all cases, we run the tests with and withoutcaching enabled. Also, for all scenarios we used two variants:with and without declared types. We measure the time requiredto execute the JUnit tests.
There are several conclusions, which could be drawn fromthe measurement results. First of all, caching is only worth in

300
International Journal on Advances in Software, vol 9 no 3 & 4, year 2016, http://www.iariajournals.org/software/
2016, © Copyright by authors, Published under agreement with IARIA - www.iaria.org
rule subtypeParameterizedTypeRefG |− ParameterizedTypeRef left <: ParameterizedTypeRef right
from // ...or
left.declaredType == right.declaredType// so, we have a situation like A<X> <: B<Y> with A==B,// continue checking X, Y for compatibility ...
val len = Math.min(Math.min(left.typeArgs.size, right.typeArgs.size), right.declaredType.typeVars.size);for(var i=0;i<len;i++)
val leftArg = left.typeArgs.get(i)val rightArg = right.typeArgs.get(i)val variance = right.declaredType.getVarianceOfTypeVar(i)
G |∼ leftArg /\ var TypeRef leftArgUpperG |∼ leftArg \/ var TypeRef leftArgLowerG |∼ rightArg /\ var TypeRef rightArgUpperG |∼ rightArg \/ var TypeRef rightArgLower
// require leftArg <: rightArg, except we have contravarianceif(variance!==Variance.CONTRA)
G2 |− leftArgUpper <: rightArgUpper// require rightArg <: leftArg, except we have covarianceif(variance!==Variance.CO)
G2 |− rightArgLower <: leftArgLoweror
if(len>1 && previousFailure.isOrCausedByPriorityError) fail error stringRep(left) + " is not a subtype of " + stringRep(right)
+ " due to incompatibility in type argument #" + (i+1) + ": "+ previousFailure.compileMessage
data PRIORITY ERROR else
fail // with default messageor// ...
Figure 12. Implementing advanced, composed error messages in Xsemantics.
some cases, but these cases can make all the difference. Thefirst two scenarios do not gain much from caching, actuallythe overhead for managing the cache even slightly decreasesperformance in case of generic methods calls. In many cases,types are to be computed only once. In our example, the typesof the type arguments in the method call are only used forthat particular call. Thus, caching the arguments there does notmake any sense. Things are different for variable declarations.As described above, caching the type of a variable, whichis used many times, makes a lot of sense. Increasing theperformance by the factor of more than 100 is not only aboutspeeding up the system a little bit—it is about making it work
at all for larger programs. Even if all types are declared, typeinference is still required in order to ensure that the inferredtype is compatible with the declared type. This is why insome cases the fully typed scenario is even slower than thescenario which uses only inferred types. While in some cases(scenario 1 and 3) the performance increases linearly withthe size, this is not true for scenario 2, the generic methodcall. This demonstrates a general problem with interpretingabsolute performance measurements: it is very hard to pinpointthe exact location in case of performance problems, as manyparts, such as the parser, the scoping system and the typesystem are involved. Therefore, we concentrate on relative

301
International Journal on Advances in Software, vol 9 no 3 & 4, year 2016, http://www.iariajournals.org/software/
2016, © Copyright by authors, Published under agreement with IARIA - www.iaria.org
// Scenario 1: function expressionfunction f (function (C): A func) ... ;// typedf( function (C p): A return p.getA() || new A();
)// inferredf( function (p) return p.getA() || new A(); )
// Scenario 2: generic method callfunction <T> g (T p): T ... // typedvar s1 = <string>g("");// inferredvar s2 = g("");
// Scenario 3: variable declarations and references// typedvar number y1 = 1;var number y2 = y1; ...// inferredvar x1 = 1;var x2 = x1; var x3 = x2; ...
Figure 13. Scenario snippets used in performance tests
TABLE I. PERFORMANCE MEASUREMENTS (RUNTIME IN MS)
Scenario without caching with cachingsize typed inferred typed inferred
Function Expressions250 875 865 772 804500 1,860 1,797 1,608 1,676
1000 4,046 3,993 3,106 3,2222000 9,252 9,544 8,143 8,204
Generic Method Calls250 219 273 223 280500 566 644 548 654
1000 1,570 1,751 1,935 1,7032000 6,143 6,436 6,146 6,427
Variable Declarations50 19 580 18 39
100 27 3,848 26 102200 44 31,143 36 252
performance between slightly modified versions of the typesystem implementation (while leaving all other subsystemsunchanged).
We observe that it is not feasible to compare, on a moreglobal level, the overall performance of N4JS to other lan-guages implemented with more traditional approaches (withoutthe use of Xsemantics), because there are too many factorsthat should be taken into consideration, starting from thecomplexity of the type system and its type inference up tothe specific programming language and frameworks used fortheir compiler’s implementation.
Summarizing, we learned that different scenarios must betaken into account when working on performance optimization,in order to make the right decision about whether using cachingor not. Surely, when type information is reused in other parts ofthe program over and over again, like in the variable scenario,caching optimization is crucial. Combining the type systemwith control flow analysis, leading to effect systems, may make
caching dispensable in many cases. Further investigation in thisdirection is ongoing work.
VII. CONCLUSION
In this paper, we presented the implementation in Xseman-tics of the type system of N4JS, a statically typed JavaScript,with powerful type inference mechanisms, focusing both onthe performance of the type system and on its integration inthe Eclipse IDE. The N4JS case study proved that Xsemanticsis mature and powerful enough to implement a complex typesystem of a real-world language, where types do not need to bedeclared, thus requiring involved type inference mechanisms.
Thanks to Xtext, Xsemantics offers a rich Eclipse tooling;in particular, thanks to Xbase, Xsemantics is also completelyintegrated with Java. For example, from the Xsemantics editorwe can navigate to Java types and Java method definitions,see Java type hierarchies, and other features that are presentin the Eclipse Java editor (see, e.g., Figure 14). This also holdsthe other way round: from Java code that uses code generatedfrom a Xsemantics definition we can navigate directly to theoriginal Xsemantics method definition.
Most importantly, the Xsemantics IDE allows the developerto debug the original Xsemantics system source code, besidesthe generated Java code. Figure 15 shows a debug sessionof the N4JS type system: we have set a break point inthe Xsemantics file, and when the program hits Xsemanticsgenerated Java code the debugger automatically switches tothe original Xsemantics code (note the file names in the threadstack, the “Breakpoint” view and the “Variables” view).
With respect to manual implementations of type systems inJava, Xsemantics specifications are more compact and closer toformal systems. We also refer to [67] for a wider discussionabout the importance of having a DSL for type systems inlanguage frameworks. In particular, Xsemantics integrationwith Java allows the developers to incrementally migrateexisting type systems implemented in Java to Xsemantics [68].
Xsemantics has been developed with Test DrivenDevelopment technologies, with almost 100% codecoverage, using Continuous Integration systems andcode quality tools, such as SonarQube (a report canbe found at http://www.lorenzobettini.it-/2014/09/dealing-with-technical-debt-with--sonarqube-a-case-study-with-xsemantics).
ACKNOWLEDGMENT
We want to thank Sebastian Zarnekow, Jorg Reichert andthe colleagues at NumberFour, in particular Jakub Siberski andTorsten Kramer, for feedback and for implementing N4JS withus.
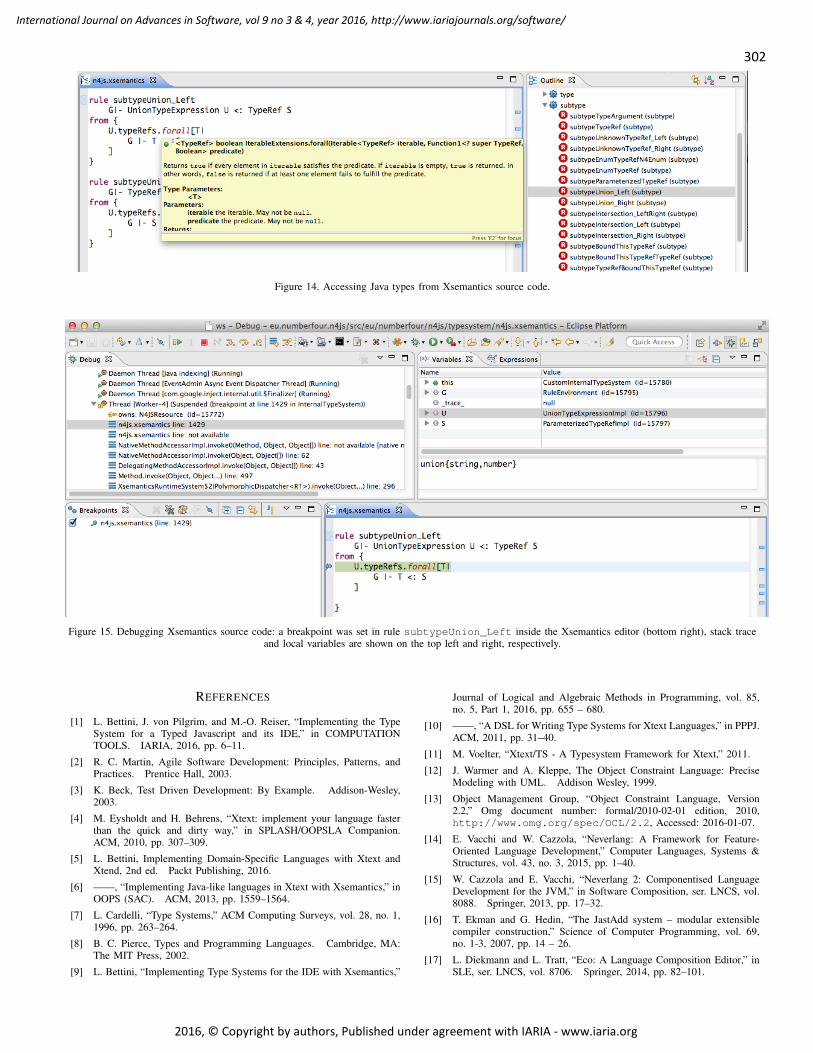
302
International Journal on Advances in Software, vol 9 no 3 & 4, year 2016, http://www.iariajournals.org/software/
2016, © Copyright by authors, Published under agreement with IARIA - www.iaria.org
Figure 14. Accessing Java types from Xsemantics source code.
Figure 15. Debugging Xsemantics source code: a breakpoint was set in rule subtypeUnion_Left inside the Xsemantics editor (bottom right), stack traceand local variables are shown on the top left and right, respectively.
REFERENCES
[1] L. Bettini, J. von Pilgrim, and M.-O. Reiser, “Implementing the TypeSystem for a Typed Javascript and its IDE,” in COMPUTATIONTOOLS. IARIA, 2016, pp. 6–11.
[2] R. C. Martin, Agile Software Development: Principles, Patterns, andPractices. Prentice Hall, 2003.
[3] K. Beck, Test Driven Development: By Example. Addison-Wesley,2003.
[4] M. Eysholdt and H. Behrens, “Xtext: implement your language fasterthan the quick and dirty way,” in SPLASH/OOPSLA Companion.ACM, 2010, pp. 307–309.
[5] L. Bettini, Implementing Domain-Specific Languages with Xtext andXtend, 2nd ed. Packt Publishing, 2016.
[6] ——, “Implementing Java-like languages in Xtext with Xsemantics,” inOOPS (SAC). ACM, 2013, pp. 1559–1564.
[7] L. Cardelli, “Type Systems,” ACM Computing Surveys, vol. 28, no. 1,1996, pp. 263–264.
[8] B. C. Pierce, Types and Programming Languages. Cambridge, MA:The MIT Press, 2002.
[9] L. Bettini, “Implementing Type Systems for the IDE with Xsemantics,”
Journal of Logical and Algebraic Methods in Programming, vol. 85,no. 5, Part 1, 2016, pp. 655 – 680.
[10] ——, “A DSL for Writing Type Systems for Xtext Languages,” in PPPJ.ACM, 2011, pp. 31–40.
[11] M. Voelter, “Xtext/TS - A Typesystem Framework for Xtext,” 2011.
[12] J. Warmer and A. Kleppe, The Object Constraint Language: PreciseModeling with UML. Addison Wesley, 1999.
[13] Object Management Group, “Object Constraint Language, Version2.2,” Omg document number: formal/2010-02-01 edition, 2010,http://www.omg.org/spec/OCL/2.2, Accessed: 2016-01-07.
[14] E. Vacchi and W. Cazzola, “Neverlang: A Framework for Feature-Oriented Language Development,” Computer Languages, Systems &Structures, vol. 43, no. 3, 2015, pp. 1–40.
[15] W. Cazzola and E. Vacchi, “Neverlang 2: Componentised LanguageDevelopment for the JVM,” in Software Composition, ser. LNCS, vol.8088. Springer, 2013, pp. 17–32.
[16] T. Ekman and G. Hedin, “The JastAdd system – modular extensiblecompiler construction,” Science of Computer Programming, vol. 69,no. 1-3, 2007, pp. 14 – 26.
[17] L. Diekmann and L. Tratt, “Eco: A Language Composition Editor,” inSLE, ser. LNCS, vol. 8706. Springer, 2014, pp. 82–101.
303
International Journal on Advances in Software, vol 9 no 3 & 4, year 2016, http://www.iariajournals.org/software/
2016, © Copyright by authors, Published under agreement with IARIA - www.iaria.org
[18] E. Barrett, C. F. Bolz, L. Diekmann, and L. Tratt, “Fine-grainedLanguage Composition: A Case Study,” in ECOOP, ser. LIPIcs, vol. 56.Dagstuhl LIPIcs, 2016, pp. 3:1–3:27.
[19] L. C. L. Kats and E. Visser, “The Spoofax language workbench. Rulesfor declarative specification of languages and IDEs,” in OOPSLA.ACM, 2010, pp. 444–463.
[20] N. Nystrom, M. R. Clarkson, and A. C. Myers, “Polyglot: An ExtensibleCompiler Framework for Java,” in Compiler Construction, ser. LNCS,vol. 2622. Springer, 2003, pp. 138–152.
[21] G. Bracha, “Pluggable Type Systems,” in Workshop on Revival ofDynamic Languages, 2004.
[22] M. Voelter et al, DSL Engineering - Designing, Implementing and UsingDomain-Specific Languages, 2013.
[23] M. Pfeiffer and J. Pichler, “A comparison of tool support for textualdomain-specific languages,” in Proc. DSM, 2008, pp. 1–7.
[24] S. Erdweg, T. van der Storm, M. Volter, L. Tratt, R. Bosman, W. R.Cook, A. Gerritsen, A. Hulshout, S. Kelly, A. Loh, G. Konat, P. J.Molina, M. Palatnik, R. Pohjonen, E. Schindler, K. Schindler, R. Solmi,V. Vergu, E. Visser, K. van der Vlist, G. Wachsmuth, and J. van derWoning, “Evaluating and comparing language workbenches: Existingresults and benchmarks for the future,” Computer Languages, Systems& Structures, vol. 44, Part A, 2015, pp. 24–47.
[25] P. Charles, R. Fuhrer, S. Sutton Jr., E. Duesterwald, and J. Vinju,“Accelerating the creation of customized, language-Specific IDEs inEclipse,” in OOPSLA. ACM, 2009, pp. 191–206.
[26] F. Jouault, J. Bezivin, and I. Kurtev, “TCS: a DSL for the specificationof textual concrete syntaxes in model engineering,” in GPCE. ACM,2006, pp. 249–254.
[27] F. Heidenreich, J. Johannes, S. Karol, M. Seifert, and C. Wende,“Derivation and Refinement of Textual Syntax for Models,” in ECMDA-FA, ser. LNCS, vol. 5562. Springer, 2009, pp. 114–129.
[28] M. Bravenboer, K. T. Kalleberg, R. Vermaas, and E. Visser, “Stratego/XT 0.17. A language and toolset for program transformation,” Scienceof Computer Programming, vol. 72, no. 1–2, 2008, pp. 52–70.
[29] E. Visser et al, “A Language Designer’s Workbench: A One-Stop-Shopfor Implementation and Verification of Language Designs,” in Onward!ACM, 2014, pp. 95–111.
[30] G. Konat, L. Kats, G. Wachsmuth, and E. Visser, “Declarative NameBinding and Scope Rules,” in SLE, ser. LNCS, vol. 7745. Springer,2012, pp. 311–331.
[31] V. A. Vergu, P. Neron, and E. Visser, “DynSem: A DSL for DynamicSemantics Specification,” in RTA, ser. LIPIcs, vol. 36. SchlossDagstuhl - Leibniz-Zentrum fuer Informatik, 2015, pp. 365–378.
[32] H. Xu, “EriLex: An Embedded Domain Specific Language Generator,”in TOOLS, ser. LNCS, vol. 6141. Springer, 2010, pp. 192–212.
[33] P. Borras et al, “CENTAUR: the system,” in Software EngineeringSymposium on Practical Software Development Environments, ser.SIGPLAN. ACM, 1988, vol. 24, no. 2, pp. 14–24.
[34] M. Fowler, “A Language Workbench in Action - MPS,”http://martinfowler.com/articles/mpsAgree.html,2008, accessed: 2016-01-07.
[35] M. G. J. V. D. Brand, J. Heering, P. Klint, and P. A. Olivier, “Compilinglanguage definitions: the ASF+SDF compiler,” ACM TOPLAS, vol. 24,no. 4, 2002, pp. 334–368.
[36] A. Dijkstra and S. D. Swierstra, “Ruler: Programming Type Rules,” inFLOPS, ser. LNCS, vol. 3945. Springer, 2006, pp. 30–46.
[37] M. Felleisen, R. B. Findler, and M. Flatt, Semantics Engineering withPLT Redex. The MIT Press, 2009.
[38] T. Reps and T. Teitelbaum, “The Synthesizer Generator,” in SoftwareEngineering Symposium on Practical Software Development Environ-ments. ACM, 1984, pp. 42–48.
[39] G. Kahn, B. Lang, B. Melese, and E. Morcos, “Metal: A formalism tospecify formalisms,” Science of Computer Programming, vol. 3, no. 2,1983, pp. 151–188.
[40] E. Morcos-Chounet and A. Conchon, “PPML: A general formalism tospecify prettyprinting,” in IFIP Congress, 1986, pp. 583–590.
[41] T. Despeyroux, “Typol: a formalism to implement natural semantics,”INRIA, Tech. Rep. 94, Mar. 1988.
[42] D. Batory, B. Lofaso, and Y. Smaragdakis, “JTS: Tools for Implement-ing Domain-Specific Languages,” in ICSR. IEEE, 1998, pp. 143–153.
[43] M. Bravenboer, R. de Groot, and E. Visser, “MetaBorg in Action:Examples of Domain-Specific Language Embedding and AssimilationUsing Stratego/XT,” in GTTSE, ser. LNCS, vol. 4143. Springer, 2006,pp. 297–311.
[44] H. Krahn, B. Rumpe, and S. Volkel, “Monticore: a framework for com-positional development of domain specific languages,” STTT, vol. 12,no. 5, 2010, pp. 353–372.
[45] T. Clark, P. Sammut, and J. Willans, Superlanguages, DevelopingLanguages and Applications with XMF, 1st ed. Ceteva, 2008.
[46] L. Renggli, M. Denker, and O. Nierstrasz, “Language Boxes: Bendingthe Host Language with Modular Language Changes,” in SLE, ser.LNCS, vol. 5969. Springer, 2009, pp. 274–293.
[47] P. Sewell, F. Z. Nardelli, S. Owens, G. Peskine, T. Ridge, S. Sarkar, andR. Strnisa, “Ott: Effective tool support for the working semanticist,” J.Funct. Program, vol. 20, no. 1, 2010, pp. 71–122.
[48] Y. Bertot and P. P. Casteran, Interactive theorem proving and programdevelopment: Coq’Art: the calculus of inductive constructions, ser. Textsin theoretical computer science. Springer, 2004.
[49] M. Gordon, “From LCF to HOL: a short history,” in Proof, Language,and Interaction: Essays in Honour of Robin Milner. The MIT Press,2000, pp. 169–186.
[50] L. C. Paulson, Isabelle: A Generic Theorem Prover, ser. LNCS.Springer, 1994, vol. 828.
[51] M. Voelter, “Language and IDE Modularization and Composition withMPS,” in GTTSE, ser. LNCS, vol. 7680. Springer, 2011, pp. 383–430.
[52] T. Parr, The Definitive ANTLR Reference: Building Domain-SpecificLanguages. Pragmatic Programmers, 2007.
[53] D. Steinberg, F. Budinsky, M. Paternostro, and E. Merks, EMF: EclipseModeling Framework, 2nd ed. Addison-Wesley, 2008.
[54] D. R. Prasanna, Dependency Injection: Design Patterns Using Springand Guice, 1st ed. Manning, 2009.
[55] P. Neron, A. P. Tolmach, E. Visser, and G. Wachsmuth, “A Theory ofName Resolution,” in ESOP, ser. LNCS, vol. 9032. Springer, 2015,pp. 205–231.
[56] S. Efftinge et al, “Xbase: Implementing Domain-Specific Languages forJava,” in GPCE. ACM, 2012, pp. 112–121.
[57] J. R. Hindley, Basic Simple Type Theory. Cambridge University Press,1987.
[58] ECMA, “ECMAScript 2015 Language Specification,”ISO/IEC, International Standard ECMA-262, 6th Edition,Jun. 2015, accessed: 2016-01-07. [Online]. Available:http://www.ecma-international.org/publications/-files/ECMA-ST/Ecma-262.pdf
[59] A. Hejlsberg and S. Lucco, TypeScript Language Specification, 1st ed.,Microsoft, Apr. 2014.
[60] Dart Team, Dart Programming Language Specification, 1st ed., Mar.2014.
[61] A. Igarashi and H. Nagira, “Union types for object-oriented program-ming,” Journal of Object Technology, vol. 6, no. 2, 2007, pp. 47–68.
[62] N. Cameron, E. Ernst, and S. Drossopoulou, “Towards an ExistentialTypes Model for Java Wildcards,” in Formal Techniques for Java-likePrograms (FTfJP), July 2007, pp. 1–17.
[63] G. Mezzetti, A. Møller, and F. Strocco, “Type Unsoundness in Practice:An Empirical Study of Dart,” in DLS. ACM, 2016, pp. 13–24.
[64] B. Liskov, “Keynote address – data abstraction and hierarchy,” ACMSIGPLAN Notices, vol. 23, no. 5, 1987, pp. 17–34.
[65] D. Malayeri and J. Aldrich, “Integrating Nominal and Structural Sub-typing,” in ECOOP, ser. LNCS, vol. 5142. Springer, 2008, pp. 260–284.
[66] A. Igarashi and M. Viroli, “On Variance-Based Subtyping for ParametricTypes,” in ECOOP, ser. LNCS, vol. 2374. Springer, 2002, pp. 441–469.
[67] L. Bettini, D. Stoll, M. Volter, and S. Colameo, “Approaches and Toolsfor Implementing Type Systems in Xtext,” in SLE, ser. LNCS, vol. 7745.Springer, 2012, pp. 392–412.
[68] A. Heiduk and S. Skatulla, “From Spaghetti to Xsemantics - Practicalexperiences migrating typesystems for 12 languages,” XtextCon, 2015.

304
International Journal on Advances in Software, vol 9 no 3 & 4, year 2016, http://www.iariajournals.org/software/
2016, © Copyright by authors, Published under agreement with IARIA - www.iaria.org
EMSoD — A Conceptual Social Framework that DeliversKM Values to Corporate Organizations
Christopher Adetunji, Leslie CarrWeb Science Institute
School of Electronics and Computer ScienceUniversity of Southampton
Southampton, EnglandEmail: ca6g14, [email protected]
Abstract—As social software is becoming increasingly disruptiveto organizational structures and processes, Knowledge Manage-ment (KM) initiatives that have hitherto taken the form of a‘knowledge repository’ now need redefining. With the emergenceof Social Media (SM) platforms like Twitter, the hierarchicalboundaries within the organization are broken down and a lateralflow of information is created. This has created a peculiar kindof tension between KM and SM, in which one is perceived asthreatening the continued relevance of the other. Particularly,with the advances of social media and social software, KM is morein need of delivering measurable value to corporate organizations,if it is to remain relevant in the strategic planning and positioningof organizations. In view of this, this paper presents EMSoD— Enterprise Mobility and Social Data — a conceptual socialframework which mediates between KM and SM to deliveractionable knowledge and employee engagement. Meanwhile, giventhat the main objective of this research is in the delivery ofKM value to corporate organizations, this paper devises somemechanisms for measuring actionable knowledge and employeeengagement, both as parameters of KM value.
Keywords—social-media; tacit-knowledge; actionable-knowledge; twitter; SMEs; employee-engagement; enterprise-mobility; social-network-analysis; folksonomy.
I. INTRODUCTION
Social media have become viable sources of data fromwhich corporate organizations can discover knowledge andinsights for their strategic competitive advantage. In [1], acase of a medium-sized enterprise that lacks a significantsocial media presence, is explored with regards to how publicTwitter data is exploited to discover actionable knowledgethat propels the enterprise’s strategic competitive advantage.The work utilises text analysis techniques to make sense ofthe unstructured social media data harvested through Twitter’sStreaming API.
The work in [1] is a cascading of our original researchexploring the question of how social media platforms likeTwitter can deliver Knowledge Management (KM) values tocorporate organizations. As a form of social machinery thatfacilitates human interaction on the Web, social media enablepeople to create new knowledge by sharing and synthesizingknowledge from various sources [2]. Using this social infras-tructure as leverage for corporate knowledge management isthe main objective of the framework presented in this paper.
In this paper, we discuss our motivation for exploringthe question of how social media platforms like Twitter candeliver KM values to corporate organizations. We present
the Enterprise Mobility and Social [media] Data (EMSoD)framework, our proposed conceptual social framework, withKM value at its core. We provide an overview of our previouswork that culminates in an important measure of KM value— actionable knowledge — upon which a significant businessdecision is made by a case study organization. This is un-derpinned by the fact that the real essence of knowledge is itsactionability, especially when it contributes to the advancementof a proposed undertaking [3]. Measuring the value of suchcontributions has been one of the main issues of disagreementin Knowledge Management, which is why we devised amechanism for measuring the KM value which our frameworkhelps in delivering to corporate organizations.
Moreover, our framework identifies another important mea-sure of KM values, which is employee engagement. Includedin this paper therefore, is a report on a social network analysisof @unisouthampton, the Twitter handle for the University ofSouthampton, with the aim of examining the impact of thestructure of the network on employee engagement.
The rest of this paper is organized as follows: Sections IIand III provide some background to this study, with the aim ofsetting out the research motivation for our framework. SectionIV presents the EMSoD social framework, describes its basicelements and discusses the central position of KnowledgeManagement Value (KMV) as the cynosure around which otherbasic components of the framework revolves, as well as its(KM value) measurement. In Section V we re-present ourprevious work on knowledge discovery that culminates in ac-tionable knowledge as a measure of KM value. Also includedin this section are further insights from recent data on the samesubject. Sections VI and VII discuss actionable knowledge andemployee engagement as a measures of KM value, respectively,with their measurement mechanisms. Section VIII concludesthe paper with recommendation for corporate organizations anddiscusses indications for future work.
II. BACKGROUND AND RESEARCH MOTIVATION
KM within organizations has traditionally been through atop-down, process approach [4, p.7][5] which precludes em-ployees from collaborating and/or participating in the processof creating and sharing valuable knowledge that are relevantfor the organizations competitive advantage. In making KM apart of everyone’s job [6, p.107], the top-down approach to KMis being broken down by current and emerging Web technolo-gies like microblogs (e.g., Twitter), social media/networking(e.g., YouTube/Facebook), and multimedia chat platforms (e.g.,

305
International Journal on Advances in Software, vol 9 no 3 & 4, year 2016, http://www.iariajournals.org/software/
2016, © Copyright by authors, Published under agreement with IARIA - www.iaria.org
Skype) [7]. These are pervasive technologies, and are mostprofound in their capabilities to, in the words of Mark Weiserof Xerox Lab in [8], weave themselves into the fabrics ofeveryday life until they are indistinguishable from it, thanksto the ubiquity (and consumerization) of mobile devices liketablets and smartphones.
In recent times, these devices have woven themselvesaround us in so much so that employees are compulsively usingthem to keep in touch with friends and families even while atwork. Many organizations have therefore, already subscribedto the theory and practice of enterprise mobility on thegrounds that, allowing employees to access corporate systemsand data over these devices (BYOD) enhances productivitywhile also helping to maintain work and life balances [9].It also enhances knowledge sharing within the organizationin its capacity for fostering discussions over documents andthereby enabling organizations to build social environment orcommunities of practice necessary for facilitating the sharingof tacit knowledge [10] [6, p.26].
Tacit knowledge is usually in the domain of subjective,cognitive and experiential learning; it is highly personal anddifficult to formalise [11, p.478], which is why Polanyi [12]classifies it as one class of knowledge for which we cannottell as much as we know. How then do we capture and/orengineer this tacit knowledge being inadvertently generatedby employees in the enterprise mobility and social mediaspace? This paper answers this question from a big socialdata perspective, drawing insights from the literature, using aconceptual social framework - EMSoD. Moreover, a vision ofa knowledge social machine is encapsulated in this framework,which leverages the flow of tacit knowledge on existing socialinteractions within the boundary of the organization as definedby its enterprise mobility strategies. This social machine hasthe organizations workforce as its user base, using their owndevices (BYOD) or using the company-owned devices thathave been personally enabled for them (COPE). The socialmachine produces company-relevant insights and knowledgeas output, taking its input from a combination of internaldata (enterprise social media, transactional data, system/weblogs, etc.) and open/public data, together with the activeparticipation of the employees in the process of knowledgemanagement, as illustrated in Figure 1.
Meanwhile, the traditional top-down approach to KM men-tioned earlier has also resulted in KM becoming a lacklustreconcept, considering the perceived lack of maturity and thegeneral state of apathy in the field, as evidenced in a recentKnowledge Management Observatory survey referenced in[13] and the 2015 follow up of same report [14]. More so,there is hardly any sector in which organizations have notembarked on a Knowledge Management program or project toimprove on their organization practice; research has shown thatknowledge-oriented management has a significant influence onperformance, in spite of the image problem suffered by KMdue to its overselling by vendors and consultants in the 1990s[15].
To shake off this image problem and to douse the per-ceived tension between KM and social media [16], participantsin a recent massive survey into the future of KM by theGlobal Knowledge Research Network (GKRN - Network ofResearchers sharing an interest in undertaking joint research
Figure 1: Tacit Knowledge Flow
on knowledge management) published in [15], regard socialsoftware as an advancement of the KM field. The research sug-gestion in this regard, places clear emphasis on the economic,organizational and human context factors related to the use andimplementation of this new social software technologies. Thisorganizational and human context factor is what culminates inthe concept of Enterprise Social Networking, fondly referredto as Enterprise 2.0 - another concept made possible by theadvances in social media . Although, some of the proponents ofKnowledge Management were initially hostile towards the newconcept of Enterprise 2.0 as propagated by [17], describingit as a new wine in an old bottle, Davenport’s [18] earliercomment in a HBR (Harvard Business Review) blog post isworth noting:
“If E2.0 can give KM a mid-life kicker, so muchthe better. If a new set of technologies can bringabout a knowledge-sharing culture, more power tothem. Knowledge Management was getting a littletired anyway.”
These new sets of technologies that can bring about aknowledge sharing culture has been found in social media andtheir social networking capabilities, as enabled and popularisedby the consumerization of mobile devices. KM can therefore,be repositioned within these innovative technological trends ofenterprise mobility and social media analytics, which can beexploited for rejuvenating the concept and practice of KM, inconsonance with Delic and Riley’s [19] assertion that,
“The field of knowledge management, having passedseveral hypes and disappointments, has yet anotherchance of reappearing in totally new technologicaland social circumstances.”
The overarching issue recognised in the GKRN researchmentioned above is the challenge for KM in being able todeliver measurable value for businesses. The conceptual socialframework (see Figure 3) presented in this paper places thevalue proposition of KM at the centre of organizational knowl-edge management processes. To the best of our knowledge,this is the first framework of its kind that seeks to use the
306
International Journal on Advances in Software, vol 9 no 3 & 4, year 2016, http://www.iariajournals.org/software/
2016, © Copyright by authors, Published under agreement with IARIA - www.iaria.org
convergence of enterprise mobility and social (media) data asleverage for corporate knowledge management in such a waythat corporate organizations can derive KM value from thesynergy. Meanwhile, we did not arrive at this framework onthe fly. The core elements of the framework have emanatedfrom a rigorous review of relevant literature, the process ofwhich is described in Section III.
III. THE MAKING OF THE SOCIAL FRAMEWORK
With regards to the image problem suffered by KM inthe 1990s [15], there has been an increasing effort by KMconsultants and academics, since the 2000s, to explore howthe growing trends of enterprise mobility — as manifest in thesurge in mobile devices and applications — can be exploitedfor corporate Knowledge Management. This is evident inKnowledge Management literature, which abounds with issuesand concerns about Enterprise Mobility.
Figure 2: A Word Cloud for Mobilization from the Literature
For this research, about 160 KM literature materials pub-lished between 2004 and 2016 were examined. These includebooks, book sections, conference papers, journal articles, re-ports, thesis and web pages. The term, ‘mobilization’ — withvariants of mobile, mobility, mobilize — is topmost in the listof Top 50 most frequently used words in these KM literature(see Figure 2).
IV. EMSOD — THE CONCEPTUAL SOCIAL FRAMEWORK
Enterprise Mobility and Social [media] Data (EMSoD) isa conceptual social framework that exploits the convergenceof enterprise mobility and social media data as leverage forcorporate Knowledge Management. The proposed frameworkis presented cyclically in Figure 3 to emphasize the inter-dependence of its five core elements — Managed Platform,Social Media, Knowledge Discovery, Tacit Knowledge and,KM Values. The cyclical illustration of the framework alsoemphasizes that changing one element has an impact on otherelements and on the capability for the framework to deliver theintended KM value at its core. Each of the five core elementsare examined in this section.
A. Managed Platform
This framework supports the vision of a knowledge socialmachine, which serves as a leverage for the flow and conver-sion of tacit knowledge, on existing social interactions withinthe boundary of the organization, as defined by its enterprisemobility strategies. This social machine has the organizationsworkforce as its user base, using their own devices (BYOD
- Bring Your Own Devices) or using the Company-Owneddevices that have been Personally-Enabled for them (COPE).With BYOD for example, the choice of the brand, functionalityand installed apps are entirely that of the employee and, whenthese devices are allowed to be used in accessing the corporatedata from anywhere the employee may be located, it exposesthe organization to the risk of compromise of the privacy andsecurity of its corporate data. Also, because there are as manydifferent devices as there are employees, the organization isfaced with the challenge of how to integrate these disparatedevices into a platform for ease of support and interoperability.To mitigate against these constraints of privacy, security andinteroperability, there is need for the organization’s enterprisemobility strategy and social media data to be contained withina managed platform.
Enterprise Mobility Strategies
“Given the plethora of devices, operating systems,solution providers and overall mobility commoditi-zation, how will technology leaders meet their em-ployees needs and offer mobile access to corporatesystem, data and information they crave, in orderto maximise the potential for productivity and thecompetitive advantage that follows?”
The above quote is from Mihaela Biti, the ProgrammeDirector of Enterprise Mobility Exchange, in her Foreward onthe Global State of Enterprise Mobility [20] as reported by thecompany, following a global survey. The report shows that thebulk of the respondents are IT, Mobility and Technology work-ers, an industry where mobility is already widely embraced.Also, about 30.1% of the respondents have their operationsglobally, which presupposes they would have to mobilize any-way. Nonetheless, the mobility agenda for these enterprises arelargely for automation aimed at operational performances andnot for the facilitation of social interactions among employees.For example, when UPS successfully introduced the handheldDelivery Information Acquisition mobile Device (DIAD) fortheir drivers in 1991 [21], the question arose as to whether thenext move was for customers to be able to quickly look andsee real-time location of their driver and contact them directly.An answer to this question is FEDEX Mobile Solutions whichallows customers to conveniently track their shipments, find thenearest FedEx station or drop-box, etc. An enterprise mobilitystrategy that is geared towards simple automation with mobiledevices is good for enhancing operational efficiency of anenterprise. Of course, this is a source of competitive advantage,but only up to the point where they are unique to the companyand as such, cannot easily be replicated (e.g., the WalmartSatelite investment [22]).
However, the consumerization of mobile devices has meantthat the competitive advantage that a company derives, if any,from automation or implementation of mobile solutions willsoon erode when competitors have adopted the same or similarsolutions. In essence, a true competitive advantage is attainablewhen businesses and organizations proceed to the second - andthird - order of organizational change, which are to informateand transform as highlighted in [23].
Therefore, the focus of this research is on mobile appli-cations and devices that facilitate social interaction among

307
International Journal on Advances in Software, vol 9 no 3 & 4, year 2016, http://www.iariajournals.org/software/
2016, © Copyright by authors, Published under agreement with IARIA - www.iaria.org
Figure 3: EMSoD - A Conceptual Social Framework for Corporate Knowledge Management
employees from which organizational knowledge could begained. Such mobile devices as smart phones and tablets aswell as the mobile applications like social media that theyenable, which are in turn, enablers of social interaction withinthe organization.
KM based on the management and facilitation of thesesocial interactions is potentially able to propel organizationto strategic competitive advantage, especially in this era ofknowledge economy where social media is playing a crucialrole.
Technically, custom-made mobile devices for single ap-plications like those used in the FEDEX and UPS examplescan not be integrated with social interaction as the limitationof their design and capabilities precludes this. Therefore,employees cannot be expected to bring their own (BYOD),neither could they be expected to choose (CYOD) or personallyenable (COPE) their own devices. Nonetheless, the newer tech-nological trends of smart phones are already been used for thesame functions, which means, delivery drivers can track andmanage their delivery on their smart phones while also usingthe smart phones to interact with their colleagues on socialmedia. They can, for example, tweet their locations or askfor direction and get immediate response from colleagues. Onthe same smart phone, they could make/receive calls to/fromfriends, family or colleagues or even interact with friends andfamily through social media on the smart phones. These arehealthy for work life balances which results in a satisfied workforce that is motivated to engage in social interaction andas such, knowledge sharing. This is altogether a function ofthe flexibility of the enterprise mobility management strategyadopted by the organization. If the organization’s mobilitystrategy is aimed only at operational efficiency without thefacilitation of social interaction, then the organization may
not be able to reap the benefits in employee insights andknowledge for its strategic competitive advantage.
B. Tacit Knowledge
Inherent in humans is a tacit power by which all knowledgeis discovered, and this propels an active shaping of experienceperformed in the pursuit of knowledge [12]. Our frameworkplaces more emphasis on the externalization of tacit knowl-edge, which, we believe, has become the dominant element ofthe widely known Nonaka’s model of knowledge conversion(see Figure 4). This is due to the impact of the current trendsof mobile devices and social media which allow an uninhibitedexternalization of thoughts even at the spur of the moment [10]except where the inhibiting factor is the individual motivation.
1) ‘Externalization’ Driven by Individual Motivation
The distinction between data and information is a given,from Computer Science and Information Systems perspec-tives. However, Information is often used interchangeably withKnowledge, albeit erroneously. [24] have gone a step further inattempting to create an understanding of data and informationas necessary tools [or resources] for knowledge, discarding thenotion that knowledge is data or information. [25, pp. 170-172], [26] and [27] all agree on a DIKW pyramid, whichdescribes the configuration of data, information, knowledgeand wisdom while [28] attempts to highlight the importantdifferences between Knowledge Management and InformationManagement. It is because of the explicit nature of informationthat it has often been used interchangeably with knowledgewhereas, explicit knowledge is only one side of the coin toknowledge. The other side of the coin is tacit knowledge,which people have in their minds and are not represented in anexplicit way [29] because it is highly personal and difficult to
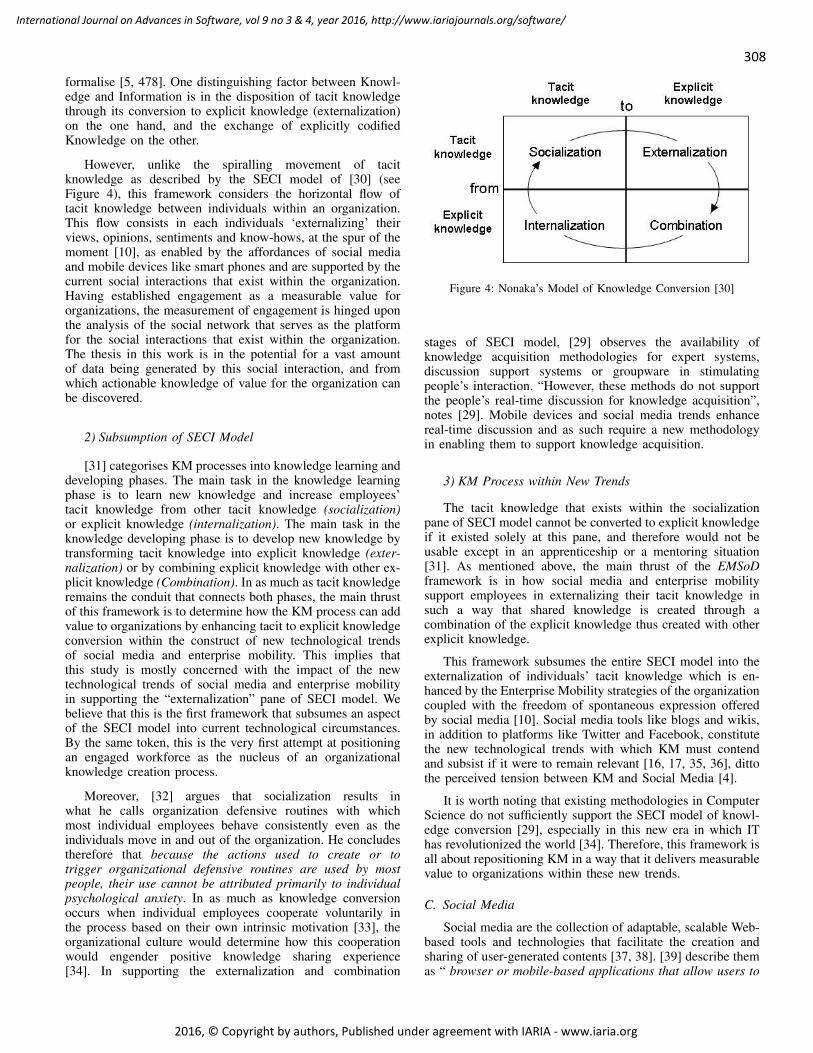
308
International Journal on Advances in Software, vol 9 no 3 & 4, year 2016, http://www.iariajournals.org/software/
2016, © Copyright by authors, Published under agreement with IARIA - www.iaria.org
formalise [5, 478]. One distinguishing factor between Knowl-edge and Information is in the disposition of tacit knowledgethrough its conversion to explicit knowledge (externalization)on the one hand, and the exchange of explicitly codifiedKnowledge on the other.
However, unlike the spiralling movement of tacitknowledge as described by the SECI model of [30] (seeFigure 4), this framework considers the horizontal flow oftacit knowledge between individuals within an organization.This flow consists in each individuals ‘externalizing’ theirviews, opinions, sentiments and know-hows, at the spur of themoment [10], as enabled by the affordances of social mediaand mobile devices like smart phones and are supported by thecurrent social interactions that exist within the organization.Having established engagement as a measurable value fororganizations, the measurement of engagement is hinged uponthe analysis of the social network that serves as the platformfor the social interactions that exist within the organization.The thesis in this work is in the potential for a vast amountof data being generated by this social interaction, and fromwhich actionable knowledge of value for the organization canbe discovered.
2) Subsumption of SECI Model
[31] categorises KM processes into knowledge learning anddeveloping phases. The main task in the knowledge learningphase is to learn new knowledge and increase employees’tacit knowledge from other tacit knowledge (socialization)or explicit knowledge (internalization). The main task in theknowledge developing phase is to develop new knowledge bytransforming tacit knowledge into explicit knowledge (exter-nalization) or by combining explicit knowledge with other ex-plicit knowledge (Combination). In as much as tacit knowledgeremains the conduit that connects both phases, the main thrustof this framework is to determine how the KM process can addvalue to organizations by enhancing tacit to explicit knowledgeconversion within the construct of new technological trendsof social media and enterprise mobility. This implies thatthis study is mostly concerned with the impact of the newtechnological trends of social media and enterprise mobilityin supporting the “externalization” pane of SECI model. Webelieve that this is the first framework that subsumes an aspectof the SECI model into current technological circumstances.By the same token, this is the very first attempt at positioningan engaged workforce as the nucleus of an organizationalknowledge creation process.
Moreover, [32] argues that socialization results inwhat he calls organization defensive routines with whichmost individual employees behave consistently even as theindividuals move in and out of the organization. He concludestherefore that because the actions used to create or totrigger organizational defensive routines are used by mostpeople, their use cannot be attributed primarily to individualpsychological anxiety. In as much as knowledge conversionoccurs when individual employees cooperate voluntarily inthe process based on their own intrinsic motivation [33], theorganizational culture would determine how this cooperationwould engender positive knowledge sharing experience[34]. In supporting the externalization and combination
Figure 4: Nonaka’s Model of Knowledge Conversion [30]
stages of SECI model, [29] observes the availability ofknowledge acquisition methodologies for expert systems,discussion support systems or groupware in stimulatingpeople’s interaction. “However, these methods do not supportthe people’s real-time discussion for knowledge acquisition”,notes [29]. Mobile devices and social media trends enhancereal-time discussion and as such require a new methodologyin enabling them to support knowledge acquisition.
3) KM Process within New Trends
The tacit knowledge that exists within the socializationpane of SECI model cannot be converted to explicit knowledgeif it existed solely at this pane, and therefore would not beusable except in an apprenticeship or a mentoring situation[31]. As mentioned above, the main thrust of the EMSoDframework is in how social media and enterprise mobilitysupport employees in externalizing their tacit knowledge insuch a way that shared knowledge is created through acombination of the explicit knowledge thus created with otherexplicit knowledge.
This framework subsumes the entire SECI model into theexternalization of individuals’ tacit knowledge which is en-hanced by the Enterprise Mobility strategies of the organizationcoupled with the freedom of spontaneous expression offeredby social media [10]. Social media tools like blogs and wikis,in addition to platforms like Twitter and Facebook, constitutethe new technological trends with which KM must contendand subsist if it were to remain relevant [16, 17, 35, 36], dittothe perceived tension between KM and Social Media [4].
It is worth noting that existing methodologies in ComputerScience do not sufficiently support the SECI model of knowl-edge conversion [29], especially in this new era in which IThas revolutionized the world [34]. Therefore, this framework isall about repositioning KM in a way that it delivers measurablevalue to organizations within these new trends.
C. Social Media
Social media are the collection of adaptable, scalable Web-based tools and technologies that facilitate the creation andsharing of user-generated contents [37, 38]. [39] describe themas “ browser or mobile-based applications that allow users to

309
International Journal on Advances in Software, vol 9 no 3 & 4, year 2016, http://www.iariajournals.org/software/
2016, © Copyright by authors, Published under agreement with IARIA - www.iaria.org
easily create, edit, access and link to content and/or to otherindividuals.”. “Perhaps the best definition of social media,though, is content that has been created by its audience”, posits[40]. They include blogs, wikis and other social networkingplatforms like Facebook and Twitter [7, 16, 17, 35, 36],collaborative platforms like Myspace,Wikipedia, Ushahidi andGalaxy Zoo [2, 41]. Although, their origin can be traced backto the era of “weblog” which coincided with the creation of“Open Diary” which brought together online diary writers intoone community in the sixties, they have become a populartrend that should be of interest to any company today [41].Wikis are good for preserving the organization’s memory whilesocial networks like Facebook and micro-blogs like Twitter arehelpful in expertise identification and location within the orga-nization [42]. When it comes to including customer insight inan organization’s social media strategies as suggested by [10],forums and message boards are probably the most commonplatform for questions and answers about products and brands[43], and can as well be included as a constituent source ofexternal (public) social media that serve as external data sourceto the social data within the organization’s managed platform.
1) Social Interactions on Social Media
Despite the media richness and “lifelike immersive world”that some social media platforms like Second Life provides,interactions on social media still cannot be as effective asface-to-face interactions [16], which has traditionally been themeans of knowledge creation and transfer [44, pp. 7]. In fact,there has been a number of criticism with regards to theauthenticity of the interaction and communication exchangeover social media. One example pit forward by [45] is the storyof a daughter who attempted suicide while in an actual stateof distress whereas, she was at the same time using smilingemoticons and positive expressions to communicate a state ofhappiness to her mother. Perhaps this is why [46] believesthat social media allows “individuals to put on masks andhold up shields”. Yet the common denominator between all theWeb-based social media tools and platforms is their ability tofacilitate social interactions and conversations between people[17, 37, 39, 47, 48]. Moreover, it is not unusual for this onlinesocial interactions to extend even to face-face interaction, asit is found in [37] where an Informant comments that:
“ ...A lot of these people I have engaged in anonline fashion have become part of our offline socialfunctions and I formed real relationships with many.Hundreds of people: my network exploded it grewexponentially and it’s through Twitter. It’s throughconnecting with people. They find me. They reachout to me or I find them. I reach out to them. Andwe engage in ongoing conversations online, meetingup sometimes offline. These are real relationships.”
.
In understanding the nature of social interaction on socialmedia, [48] have aptly and succinctly provided some opera-tional definitions of the following terms, which are reproducedhere, with kind permission from the publishers (EmeraldInsights):
1) Sociability
The ability to interact with others, or to socialize...Websites use features, design standards ortechnologies to encourage sociability. For example,an online dating website uses profiles to encourageusers to interact with other users. Or, a blog withuser comments allows readers to respond to a topicand socialize with both the author and other readers.
2) Social network theoryAn interdisciplinary theoretical lens that emphasizesthe relationships between actors (or users) within thenetwork. The structure of the network is understoodto be more important than the individual users...Social network theory, also called social networkanalysis (SNA), examines how the structure of anetwork affects users within the network.
3) Social networking sitesWebsites that encourage social interaction throughprofile-based user accounts. Social networkingsites are commonly defined as Web 2.0..., meaningthey mimic desktop applications. Popular socialnetworking sites include Facebook and MySpace.
4) Social websitesWebsites and web technologies that promote social-ization online. This term encompasses social net-working sites as well as more traditional socialweb technologies including bulletin boards, messageboards or web-based chat rooms. This will be theprimary term used in this paper to describe socialnetworking websites.
2) Folksonomy
Folksonomy is a term coined [49] as a linguistic contractionof folk, which informally refers to “people in general”; and tax-onomy, which, as a formal system of structured classificationof things and concepts, arose as a solution to the paramountproblem in information management and retrieval: lack oforganization [50]. Folksonomy is a practice in which individualusers save/define Web contents as bookmarks/keyword in asocial environment by attaching annotations in form of tags[51].
While taxonomy is a structured, top-down tagging systemwhich the organization or a content creator imposed on thecontent for ease of retrieval and organization, folksonomy isan informal bottom-up approach to tagging where the userassigns tags to contents depending on the system. These tagsare often used to create aggregated informal classifications (or,folksonomy), and as a navigational/discovery method.
3) Social Network Analysis
“A social network is a social structure comprised of typesof interdependency between nodes. Nodes are most commonlyindividuals or organizations. The configuration of individualnodes into a larger web of interdependency creates a socialnetwork”, explained [48], who also identify the two majortypes of interaction that exists within the social Web as:
1) People focused, which emphasizes social interactionthrough user-driven personal content centred around
310
International Journal on Advances in Software, vol 9 no 3 & 4, year 2016, http://www.iariajournals.org/software/
2016, © Copyright by authors, Published under agreement with IARIA - www.iaria.org
a personal individual profile (e.g., Facebook, Twitter).2) Activity focused, which emphasizes social interac-
tion through site-specific content centred around athematic focus for a website with users providingtheir own contributions to that specific theme (e.g.,Youtube and Flickr for video and photo themes,respectively).
According to the authors [48], this analysis of the socialweb examines people focused websites and their strategies toencourage sociability. It also entails studying the structure ofthe connections and relationships within a social network likeTwitter with regards to the further depths and insights theyprovide towards the pieces of knowledge discovered from thenetwork as suggested in [1].
D. Knowledge Discovery
Frawley et al. [52] describe knowledge discovery as anontrivial extraction of implicit, previously unknown, andpotentially useful information from data. The word, ’nontriv-ial’ in the definition implies that a significant organizationaleffort must come to bear on a knowledge discovery initiative.Knowledge discovery has been a cause of significant concernfor corporate organizations since the 1980s when the totalnumber of databases in the world was an estimated five million[52]. Nowadays, with the proliferation of mobile devices andthe social interactions enabled by them, there has been anexponential increase in the amount of data being produced— an amount that dwarfs the figure mentioned above.
As a result, corporate organizations are increasingly explor-ing and exploiting insights from the big (social) data beinggenerated, for their competitive advantage [1]. Not only isthere a need for organizations to focus on knowledge discoveryfrom their private/corporate data, there are potential knowledgeand insights to be gained from public social data as thiswould help organizations know their industry trends, knowtheir environments and know their customers better [10].
Therefore, knowledge discovery efforts must be gearedtowards exploring and exploiting both public and pri-vate/corporate data, using big (social) data analytics techniques
E. KM Value
A couple of decades ago, “discounted cash flow value”may have been the best measure of value creation available[53]. Recently however, organizations have not only beenregarding value in terms of the Returns on Investments, butthey have also been giving considerations to intangible as-sets like organizational knowledge, patent and trademarks asmeasure of an organization’s true value [54]. These indirectassets, according to [54], include employee morale, customersatisfaction and innovation; and, they are poised to “transformthe nature of business transactions by establishing the realvalue of enterprises for all stakeholders”.
Knowledge Managers and/or CIOs have often struggledto justify IT expenditure, especially, since when IT has beenviewed from a cost centre perspective. This has often resultedin intangible field of practice like KM taking the hits frombudget cuts as a result of a lack of measurable value [55].However, since each process of Nonaka’s SECI model (from
socialization through internalization), “is positively associatedwith perceived knowledge satisfaction”, [56] argue that organi-zations should focus more on perceived knowledge satisfactionrather than an objective measure of knowledge effectiveness.This is corroborated by “the Microsoft and Netscapes of theworld...” which, according to [54, p. 6], show that, “evenwithout a common yardstick for measuring Intellectual Capital,the recognition of its presence by informed observers willestablish a value for a firm that dwarfs its balance sheet”.
Moreover, with regards to value being defined as outcomesrelative to cost, cost reduction without regard to the outcomeachieved is dangerous and self-defeating, according to [57],who concludes that, outcomes, which are the numerator of thevalue equation, are inherently condition-specific and multidi-mensional. This position is strengthened by the NAO’s defi-nition of Value for Money (VFM): “Good value for money isthe optimal use of resources to achieve the intended outcomes”[58]. What are these intended outcomes by which KM valuecan be measured and how can social media (the resources)be optimally used to achieve them? These are some of theissues encapsulated in the motivation for this research and thequestion this paper attempts to answer.
Based on the above premises, this paper identifies twointended outcomes from which knowledge satisfaction can beperceived, and by which we assert our measure of KM valueto organizations: (i) the generation of actionable knowledgeand, (ii) the facilitation of employee engagement.
Although many organizations have turned to storytellingand anecdotal success stories to show the value of their KMinvestments, there is an increasing need for businesses to showthe business value of KM in terms of normalised quantitativemeasures in developing a case for Return on Investments[59]. This is what business managers and accountants, whoseperception of realities is largely in terms of numbers, arelooking for when they criticise KM for a want of measurablevalues. The EMSoD social framework proposed in this paperdoes not only deliver the KM value but also proffers solutionfor the measurement.
Meanwhile, “Metrics fulfil the fundamental activities ofmeasuring (evaluating how we are doing), educating (sincewhat we measure is what is important; what we measureindicates how we intend to deliver value to our customers),and directing (potential problems are flagged by the size ofthe gaps between the metrics and the standard)” [60]. It isworth noting that the topic of metrics is viewed differentlyfrom both Management and Academics, as Melnyk and others[60] observe:
“The academic is more concerned with the validityand generalisability beyond the original context, ofthe results from such measurements that are defined,adapted and validated in addressing specific researchquestions. The manager, on the other hand, is morethan willing to use a befitting measure if it canquickly provide useful information.”
In view of this, we devised a simple measurement mecha-nism which, we believe, satisfies both academic and manage-ment concerns. This is denoted by the formula:
KMV = AK ×EW (1)

311
International Journal on Advances in Software, vol 9 no 3 & 4, year 2016, http://www.iariajournals.org/software/
2016, © Copyright by authors, Published under agreement with IARIA - www.iaria.org
where
KMV = KM Value,AK = Actionable KnowledgeEW = Engaged Work f orce.
Having laid out the EMSoD Framework, the next sectionproceeds with an overview of our work on Knowledge Dis-covery from Social Media Data... [1], with some additionalinsights that strengthen the work. This, we hope, would helpthe reader in making the connection between the backgroundand our strong cases for actionable knowledge and employeeengagement as measures of KM value, and the practicalapplication of the above Formula (1) in measuring the valuederived from KM through the EMSoD framework.
V. KNOWLEDGE DISCOVERY FROM SOCIAL MEDIA DATA
In [1], we demonstrate the discovery of actionable knowl-edge from social media data with a case of Twitter data forsmall and medium-sized enterprises (SMEs). This is not onlybecause SMEs are drivers of sustainable economic develop-ment [61], but also because their role within an Economy isso crucial that even the World Bank commits hugely to thedevelopment of the sector as a significant part of its efforts inpromoting employment and economic growth [62].
Liaise Loddon is a medium-sized enterprise with about 220employees, providing residential social care for adults withautism and learning disabilities in Hampshire, United King-dom. As typical in this sector, operational procedures resultin an enormous amount of documentation arising from dailydiaries, incident/activity reports and several other reporting incompliance with regulatory requirements, analytical purposesand decision making. Although the company has recentlydeployed an enterprise mobility suite of mobile devices andapplications to replace the existing paper-based documentationsystem, the research experiment explores how this enterprisemobility agenda could be hardened with knowledge sharingand knowledge extraction from the mass of social data freelyavailable on Twitter, for example, in such a way as it supportsthe organization at the second level of organizational change.This highlights the people dimension of a socio-technicalsystem [23, p.35-38].
As such, a total of 149,501 tweets based on categoricalkeyword, autism, is harvested from Twitter streaming API.Using textual analysis technique, extraneous elements arefiltered out in order to reduce the data, as it is in data miningwhere one solution to the challenges of handling vast volumesof data is to reduce the data for mining [63]. We narrowedthe investigation down to only the tweets emanating from theUnited Kingdom and in English language, out of which wediscovered 1473 tweets containing meaningful contents withinour research context. The contents, as categorised in Table I,are outlined in Subsection V-A below.
A. An Outline of Knowledge Contents from the Case Data
Despite the data collection being based on domain-specifickeywords of interest to the paper’s case study, the research isan exploratory study in which there was not a preconceivedidea of the insights/knowledge inherent in the data. Out of
Table I: CONTENT CLASSIFICATION OF TWEET DATA
Contents No. of Tweets(Including RTs)
Impact of Technology on Disability 15Information Gathering 10
Political Opinions (#votecameronout) 132Social Welfare Benefits 327
Living with Autism 989Total Tweets 1473
an enormous amount of data, only a handful may containthe valuable and actionable knowledge that propels anorganization towards strategic competitive advantage [63,p.5]. As such, the bulk of the contents as seen in Table I, arelargely re-tweets (RT) of the original messages and so, maybe regarded as extraneous amplification of the original tweets.Therefore, this section describes the categories observed inthe data and the next section follows with a discussion on thevalue and actionability of the knowledge so discovered:
1) Impact of Technology on Disability
“RT @BILD tweets: Helping to unlock the secrets ofautism - a project using innovative technology aims tochange how we address autism http:...”
The above tweet provides an insight into a project usinginnovative technology to change how we address autism. Asthis paper’s case study organization is in the business of autismsupport and also currently implementing mobile technologiesto enhance its operational performance, it is worth exploringthis piece of insight further.
Figure 5: Original Tweet with Link to Project on Innovative Technol-ogy
Although the link to the actual URL of the story aboutthe project is missing from the tweet, we can easily follow upwith the original source of the tweet, as the above is a RT(Re-Tweet) of @BILD tweets, which is the Twitter handlefor BILD (British Institute of Learning Disabilities). BILDactually tweeted that piece of content on the 29th of April,which is a day before our data capture began, as can be seen inFigure 5. This explains why the original tweet was not capturedin our twitter streaming data capture of 30th April to 6th May.From this original tweet, we have been able to extract the URLlink (bit.ly/1JRNhV0) to the story about the project on inno-vative technology. This is about the National Autism Project,which “aims to create a more strategic approach to addressingthe challenges of the condition”. This project highlights theimpact of iPads, picture dictionaries and interactive scheduleson the improvements of communication and vocabulary ofautistic people. Strategic competitive advantage requires analignment/tagging along with this project. Below are samplesof other tweets related to this content of Technology’s impact

312
International Journal on Advances in Software, vol 9 no 3 & 4, year 2016, http://www.iariajournals.org/software/
2016, © Copyright by authors, Published under agreement with IARIA - www.iaria.org
Figure 6: Retracted Study Linking Vaccine to Autism
on disability while its pertinence, as an actionable piece ofknowledge, is discussed further in Section VI. Meanwhile, wehave derived further insights from Twitter data, that helps instrengthening the position of this knowledge item (Impact ofTechnology on Disability). This is discussed in Section V-B
“tech reducing the impact of disability - or are the lat-est gadgets too pricey? Watch @SkyNewsSwipe at 2130http://t.co/iHtX1spOqQ”
“Technology limits impact of disability but is it affordable?@TwitterUser GT http://t.co/Az3nJejO32”
2) Information Gathering
Below is the first tweet about vaccines causing autism inthis category, which is a request for information.
“@TwitterUser @BBCNewsUS @BBCWorld Please directme to this research, the thing about vaccines causingautism was admitted to be a fraud.”
Just as an enterprise micro-blogging tool could be usedwithin the organizational social network, public micro-blogging tools like Twitter provide the platform to quickly seekinformation, knowledge and/or ideas from a heterogeneousaudience defying the constraints of space, time and location.Thus, the above tweet was almost instantly replied to by theone below:
“@TwitterUser Here’s the original study that said thatvaccines cause autism, from a respected, peer-reviewedjournal: http://t.co/cmVVKpLQgh”
Even though the original study is from a ‘respected, peer-reviewed journal’, as claimed by the sender of the abovetweet, we know from the link provided that the publicationof the research has been retracted as shown in Figure 6. Theability for anyone to search, gather and distribute informationseamlessly in this manner provides an interesting dimension ofsocial media as “relatively inexpensive and widely accessibleelectronic tools that enable anyone to publish and accessinformation...”[64].
Meanwhile, the following two tweets provide link to furtherinformation that could help drive home the knowledge that theresearch study in question has actually been rebuffed:
“RT @TwitterUser: @SB277FF vaccines do not causeautism. They don’t. But if they did, what would you prefer?Autism or incurable smallpox/po”
“RT @BILD tweets: There is ‘no link between MMR andautism’, major study concludes. http://t.co/Re9L8fPfGVvia the @guardian #autism”
In as much as Twitter allows for an almost spontaneousexpression of opinions by anyone, it offers a good platformfor healthy debate on topical issues from which knowledgecould be mined, as exemplified by the question of preferencebetween autism and incurable smallpox posed by one of thetweets above.
Moreover, the following tweet with a URL link toLearning Disability Census is an example in knowledgediscovery (of an official census and regional data on LearningDisabilities), which when actioned in conjunction with theenterprise resource planning, could have an impact on thecompany’s strategic planning:
“RT @dmarsden49: Learning disability census withregional stats is out. Check http://t.co/Ja3tk7ZRDZ”
3) Political Opinions (#votecameronout)
The role of public opinion cannot be over-emphasizedinsofar as it shapes and is shaped by government policies.A recent and relevant example is the UK tax credits row[65], which has seen the planned tax credit cuts, at the timeof writing this report, suspended by government because thescheme proved unpopular to the public and thus defeatedin the House of Commons. Social media, especially Twitter,provides a means of capturing and measuring the sentimentsand opinions of the electorate.
It is therefore, no coincidence that political opinions thathave been expressed, are included in the Twitter data gatheredover autism and disability keywords:
“#votecameronout Because he wants to get rid of HumanRights Act which will affect: Maternity Rights; Workersrights; Disability Rights”
“For the harassment of people struggling on sick &disability benefits... #VoteCameronOut”
“5 more years of the Tories we will lose Social Care, NHS,Human Rights, Workers Rights, Unions, Disability support.#VoteCameronOut”
Using the hashtag #votecameronout in the run up to the UKGeneral Elections of 2015, the above tweets represent an activecampaign against the then incumbent Tory-led governmentin which David Cameron is Prime Minister. It is interestingto note that the bulk (129) of the political tweets in thisexperiment’s Twitter data are a proliferated re-tweets (RT) ofthe above 3 original tweets. The correlation between publicsentiments on social media and elections results and/or on gov-ernment policies, is another growing area of interest in socialmedia research. In politics meanwhile, it is not uncommon foropponents to whip up public sentiments by whatever meanspossible. Social Welfare issues are quintessentially core, andoften politicised, concerns in the UK. A parallel category oftweets in this work is that of social welfare benefits, which isdescribed in the next section. Although this research’s data-setis based, as stated earlier, on categorical keywords that define

313
International Journal on Advances in Software, vol 9 no 3 & 4, year 2016, http://www.iariajournals.org/software/
2016, © Copyright by authors, Published under agreement with IARIA - www.iaria.org
Figure 7: Public Spending on Benefits in the UK
the business of the case study organization, the infiltratedpolitical opinions cannot be ignored in as much as these arepublic opinions that shape political trends which potentiallyimpacts on businesses in terms of government policies. Akinto this is the category on social welfare benefits, described inthe next section.
4) Social Welfare Benefits
Social Welfare simply implies the “Well being of the entiresociety” [66], which promotes inclusivity for the disabled,the sick, the elderly/pensioner, the unemployed and even thelow income earners. As this is the hallmark of an egalitariansociety, the UK government renders financial assistance tothese categories of people in form of a range of SocialWelfare Benefit payments. Figure 7 provides an insight intopublic spending on social welfare benefits in the UK [67].As indicated in the preceding section, social welfare issuesaffect the fabrics of the society and any proposed significantcut in social welfare benefits is a natural invitation for publicdissent. This category of tweets from this work representsgenuine sentiments and opinion of those expressing them,without political motivations like the preceding category:
“Uproar at thought of @Conservatives cutting childbenefits if elected - I wish there was same media outrageover disability cuts #GE2015”
“@George Osborne If only I could live until pensionableage. You‘ve reduced my disability benefit well below livingstandards!”
“39 yo woman killed herself after Department Workand Pensions threats to cut off disability benefitshttp://t.co/TkVQF2UYki...”
Again, the above are a few samples of sentiments andopinions about Child Benefits and Disability Benefits, whichprovide an initial understanding to the unassuming, thatsocial welfare benefits are not a one-size-fits-all affair but are
multifarious (see Figure 7), with some being exclusively non-means tested (e.g, Child Benefit). These tweets provide someinsights into public sentiments towards government policies.Since any of such social welfare benefit cuts would directlyand/or indirectly impact the service users and providers ofsocial care, it can be inferred that the case study organizationwould also share these public sentiments.
5) Living with Autism
Autism is defined as a life-long neurodevelopmental condi-tion interfering with the person’s ability to communicate andrelate to others [68]. How can this definition be juxtaposedwith one of the myths surrounding autism [69, item 8] thatautistic people do not interact? This myth is however, dispelledby the tweet below, which is a re-tweet of an original tweet byan actual autistic blogger who attempts to use his blog poststo connect with the general public:
“@matt diangelo RT? It would be trulyamazing if u could view my blog about livingwith Autism&OCD. Would mean a lot-http://t.co/JCGBBZz8fJ”
This category constitutes the bulk of the Twitter data forthis work as it contains multiple unique re-tweet of the sametweet — over 900 times (see Table I). This is an indication ofthe public interest/curiosity and positive sentiment towards thesubject of autism in general, and towards the autistic bloggerin particular. Despite the National Health Service (NHS)’sattempts at educating the general public by diffusing someof the myth surrounding the subject of Autism [70], amongseveral Autism Awareness initiatives, the story of autism as toldby an autistic person appears to garner more public supportand understanding. Measuring public opinion and sentimentsthrough social media impact, reach and networks is anotherinteresting research area in social media research towardswhich this work can potentially be extended.
B. Further Insights from Twitter Data
As it has been over one year since we gathered thedata used for our previous study in [1] using the categoricalkeyword of autism, we decided to do a quick check on thecurrent public conversation on the subject. We gathered 6118tweets mentioning the categorical search keyword of autismfor just one day on the 5th of August, 2016. Of this, 3,290are original posts by Twitter users, 2828 are a Re-tweets of theoriginal posts while the rest are replies-to. Although the dayopens with a tweet containing a pleasant human story aboutthe cure of autism (Figure 8), we found it pleasantly surprisingthat some top issues as discovered from our data of over a yearago, are still currently leading the conversations on the subject,as shown in Figure 9. Considering (A) and (B) from Figure9, the following tweet content, as tweeted by the CNN, ledthe conversation at different times of the day, with 111 and 93reactions, respectively:
“How pokemon go helps kids with autismhttps://t.co/DZatqTX4sc #PokemonGo”
It is worth recalling that the theme of the impact of tech-nology on disability, which was the most pertinent knowledge

314
International Journal on Advances in Software, vol 9 no 3 & 4, year 2016, http://www.iariajournals.org/software/
2016, © Copyright by authors, Published under agreement with IARIA - www.iaria.org
Figure 8: Tweet about Cure for Autism
item from our previous data, did inform a significant corporatedecision by the case study organization, as asserted in [1].The above tweet on how the new Pokemon Go game helpsautistic kids, is an indication of the fact that the theme ofthe impact of technology on disability, dominates the conver-sations on the subject of autism for the second year running.Although, not directly related to our actionable knowledgegains, another issue that gained prominence in our previousdata was the debate over the causal relationship between vac-cines and autism. The same debate still reappears prominentlyin the recent newer data on the subject of autism as shown inFigure 9 (C). The next section proceeds with a discussion onactionable knowledge and presents our proposed mechanismfor placing a weighted measurement for KM value.
VI. ACTIONABLE KNOWLEDGE
Everyone agrees that Knowledge entails true belief [71],but this is not always the case. Using the man, the job andthe coin analogy, Gettier [72] argues that it is possible for aperson to be justified in believing a proposition that is in fact,false. This brings about the question of what actually counts asknowledge. In light of our data, we shall examine this questionin our discussion on actionable knowledge, next.
A. Discussion on Actionable Knowledge
According to [73], propositions that are actionable arethose that actors can use to implement effectively their in-tentions. A case in point is the enterprise mobility agenda ofthe case study organization as presented in Section V. Theoutcomes from an organization’s KM efforts cannot adequatelybe measured from the report card perspective and indicator sys-tems used in schools, for example. These systems, according to[74], contribute far less than they could to school improvement.Posner [74] highlights the following as the reasons for thisassertion:
1) Their purposes and intended audiences are oftendiffuse or ill-defined.
2) They tend to focus too much on ranking and notenough on exemplary practices and models for action.
3) Many data sets are overly tied to consumer choiceand not enough to citizen engagement.
4) Despite vast improvements, research remains inacces-sible to many people, bringing knowledge online butnot infusing it into capitols, classrooms and kitchen-table problem-solving
[74] therefore, suggests that information must be craftedaround organising and action, citing [75], who says, “Action-able Knowledge is not only relevant to the world of practice,it is the knowledge that people use to create that world”. Theaction triggered by knowledge is of the essence in determiningthe value that KM delivers to an organization. In fact, the real
essence of knowledge is its actionability, especially when itcontributes to the advancement of a proposed undertaking [3].
Each of the knowledge items discovered from the tweetdata, as highlighted in Section V-A, is capable of provid-ing significant insights that informs decision making, whichimpacts company’s proposed undertakings at one point oranother. However, as stated in [1], the first item, Impact ofTechnology on Disability (No.1), is more pertinent to theenterprise mobility agenda by which the company deploysmobile application and devices to its operations. For example,one of the shortened URLs contained in one of the tweets(http://t.co/Az3nJejO32), leads to a Sky News supplement onHow Tech is Helping with Struggle of Disability.
We assert therefore that, to aspire to a leadership position inthe health and social care sector, the case study organizationcannot afford to be oblivious to such reports as this, whichcould potentially shape the industry trends and direction. Thisknowledge, coupled with the insights gained from the useof iPads and pictorial dictionary mentioned in the Projecton Innovative Technology, resulted in an official resolutionby the company to extend the use of mobile devices to itsservice users as well, and not only to help staff in operationalperformances. It is worth noting that, although the piece ofactionable knowledge regarding the impact of technology ondisability was on the news prior to the extraction of datafor that research, it was neither known nor acted upon bythe company until the above decision was driven through apresentation made by the authors of this paper.
Meanwhile, we also discovered further insights from recentdata, as discussed in Section V-B, which indicates that thetheme of the impact of technology on autism is still leadingthe conversations on autism for the second year running. Wehad earlier alluded to the criticism of Knowledge Managementas a field of practice, in spite of the gains — albeit intangible— from Knowledge Management and knowledge discoveryefforts. This is due, in part, to the lack of a measurable valueof those gains. With Equation (1) in Section IV-E, this paperproposes a measurement mechanism for KM Value deliveredby our EMSoD framework, which is the main objective ofthis paper. The next section proceeds with a measurementmechanism for actionable knowledge.
B. Value Measurement Mechanism for Actionable Knowledge(AK)
The main objective of this paper is the delivery of KMvalue to corporate organizations which, we believe, our EM-SoD framework helps to deliver. We had earlier identifiedactionable knowledge as a measure of KM value, in whichactionable knowledge is denoted as AK for measurementpurposes (see Equation 1 in Section IV-E).
To find the numerical value of (AK) in the equation(KMV = AK ×EW ), we devise a simple measurement mech-anism as denoted in Equation (2):
∑n Weightnn×MaxWeight
(2)
where

315
International Journal on Advances in Software, vol 9 no 3 & 4, year 2016, http://www.iariajournals.org/software/
2016, © Copyright by authors, Published under agreement with IARIA - www.iaria.org
Figure 9: Top Issues from Newer Twitter Data
Table II: KNOWLEDGE CONTENTS AND THEIR WEIGHTS
Content WeightImpact of Technology on Disability 5
Information Gathering 2Political Opinions (#votecameronout) 2
Social Welfare Benefits 3Living with Autism 2
n = total content itemsMaxWeight = maximum assignable weight
As an example, we consider our knowledge content itemsfrom our previous work as outlined in Subsection V-A anddisplayed in Table I. The total content items (n) is 5 andeach one of them is given a weight of 2, 3 or 5, whichrepresent low, medium or high value, respectively. Please notethat the weights have nothing to do with the No. of Tweetsas displayed in the second column of Table I. However, theweights represent the pertinence of the knowledge item tothe matter or issue at hand within the organization, wherethe maximum weight (MaxWeight) of 5 represents a highpertinence, 3 represents medium pertinence and the weight of 2represents a low pertinence. High to low pertinence is directlymappable to high to low value, respectively. We acknowledgethe probability and freedom for subjectivity in assigning theseweights. However, in order to reduce the level of subjectivity,we recommend for this measurement activity to be carriedout only after the KM activity/event in question has beenconcluded. In our example, the knowledge discovery fromsocial media data has been completed and we know which ofthe knowledge items has had a high impact on management’sdecision making for us to assign a high weight of 5; and,medium weight of 3 and low weight of 2 to items we considerof medium and low values, respectively, as shown in Table II.
The item with the maximum weight (MaxWeight) of 5,Impact of Technology on Disability, is of a high pertinence tothe enterprise mobility agenda by which the company deploysmobile application and devices to its operations.
Therefore, going by Equation (2), the maximum value is25, being a product of the total number of content items (n,which in this case, is 5) and the maximum weight (5). Thetotal number of content items (n) could be any whole number,which allows for AK to be representative of every knowledgecontent item or categories that is considered relevant forinclusion in the value measurement. Also, with the numeratorbeing a sum of all the Weightsn, the value of AK from Equation(1) is given thus:
KMV = 0.56×EW (3)
A Note on Weights and Values Assignment
One may ask why the Impact of Technology on Disabilityreceives the maximum weight of 5? As stated earlier, it isbecause of being of more pertinence to the enterprise mobilityagenda by which the company deploys mobile application anddevices to its operations? For example, one of the shortenedURLs from the tweets (http://t.co/Az3nJejO32) leads to a SkyNews supplement on ‘How Tech is Helping with Struggle ofDisability’. To aspire to a leadership position in the health andsocial care sector, the case study organization cannot afford tobe oblivious to such reports as this, which could potentiallyshape the industry trends and direction. This knowledge,coupled with the insights gained from the use of iPads andpictorial dictionary mentioned in the ‘Project on InnovativeTechnology’ resulted in an official resolution by the companyto extend the use of mobile devices to its service users as well,and not only to help staff in operational performances. It isworth noting that, although the piece of actionable knowledgeregarding the impact of technology on disability was on thenews prior to the extraction of data for that research work, itwas neither known nor acted upon by the company until theabove decision was driven through a presentation made by theauthors of this paper.
The EMSoD framework presented in this paper is pred-icated upon the capability of social media in delivering ac-tionable knowledge to corporate organizations. We have thus,

316
International Journal on Advances in Software, vol 9 no 3 & 4, year 2016, http://www.iariajournals.org/software/
2016, © Copyright by authors, Published under agreement with IARIA - www.iaria.org
been able to place a measurable value on actionable knowledge(AK). This is ordinarily sufficient as a measure of KM valuederived from such insights from social media data. However,our framework — and the KM value it delivers to corporateorganizations — is further strengthened by an additionalmeasure of the KM value, which is employee engagement,denoted as EW (Engaged Workforce) in Equation (1). Thenext section discusses employee engagement in the light of thesocial network that exists within the organization, the impactof the structure of the network on employee engagement andknowledge sharing as well as a measurement mechanism forthe KM value of employee engagement.
VII. EMPLOYEE ENGAGEMENT
It is worth reiterating our assertion of employee engagementas a measure of KM value for business, given that “the level ofemployee engagement is one of the most important indicatorsof the likelihood of an organization succeeding financially anddelivering to its vision and mission statements” [76]. Also,research has shown that, having a highly engaged workforcenot only maximises a companys investment in human capitaland improves productivity, but it can also significantly reducecosts (such as turnover) that directly impacts the bottom line[77].
Thus, the organization’s Enterprise Mobility Management(see Managed Platform in Section IV-A) defines the organi-zational boundary within which employees’ contributions aregathered as a measure of their engagement and as a referencepoint for the organizations Social Network Analysis, whichcan serve as knowledge input to the organizations Intellectualcapital.
Based on the above premises, this work posits the preva-lence of knowledge creation and knowledge sharing culture inan organization with a truly engaged workforce. How then,does the social network facilitate employee engagement? Howdoes the structure of the connections and relationships within asocial network provide further depth and insights to knowledgediscovered from such networks [1]? We explore this questionfurther, first in the light of the power of social networks andan anatomy of the social network of an engaged workforce.
A. Power to Know, Power to Tell
“I shall reconsider human knowledge by starting from thefact that we can know more than we can tell”, writes MichaelPolanyi [12], whose writings and philosophical thoughts pro-vide an impetuous theoretical background for many scholarsand practitioners of Knowledge Management. This lends cre-dence to Turban and others [11, p.478]’ idea of the difficultyin formalising tacit knowledge. Embroiled in informationoverload due to a deluge of data and exponential growthin information systems, technologies and infrastructures, theability to know or tell as much as we know is limited by ourhuman cognitive capabilities. However, the same informationsystems and technologies, which were not in existence duringthe times of Polanyi, allow us to offload our cognition on tothem [78]. Such technologies (e.g., the Web) are enablers ofonline social networks, which does not only allow us to offloadour cognition onto them but also allow us to benefit fromthe problem-solving and decision-making situations offered
through the ”wisdom of the crowd” [79] amazed through thecognition offloaded by several other individuals.
With several actors within a social network offloading theircognition onto the social network through explicit expression[10], a wealth of tacit knowledge is inadvertently built up,albeit explicitly converted. This wealth of knowledge is, ofcourse, too massive for an individual to tell. It might evenbe impossible for one individual to be expected to know ofthe existence and/or extent of such knowledge, due in part, tothe limitations in human cognitive capabilities, as mentionedearlier. It must be noted however, that this is only a limitationapplicable to a single individual, but not to a corporate organi-zation. With the affordances of social network analysis (SNA),a corporate organization is empowered to know more about,and exploit, the wealth of knowledge that is built up within itsenterprise social network. The organization can tell, throughvisualisation and network analysis, the structure of the socialnetwork and its impact on employee engagement that propelsexternalization of tacit knowledge. In essence, we can assumethat, if Polanyi [12] were to reconsider human knowledgewithin the context of social networking trends today, he wouldprobably say that, “we can tell as much as we can know.”
B. Social Network Analysis
Social Network Analysis (SNA) is described as a detailedexamination of the structure of a network and its effect onusers (actors) within the network, wherein the structure of thenetwork is understood to be more important than the individualusers [48]. A core component of our EMSoD framework isSocial Media (see Section IV-C), which serve as platformsfor social interactions on the Web. With peculiar exampleof Twitter, these social interactions are explained by therelationship types of ‘mentions’, ‘replies to’ and just, ‘tweets’.A mentions relationship exist when a message on Twittertweet mentions another user (@Username) while a replies torelationship exist when a tweet is in reply to another user’stweet by preceding the tweet with the other user’s TwitterID (@Username). When a tweet is neither a reply to - orcontain a mention of - another Twitter user, the tweet createsa relationship type of tweet, which exist as a self loop andis indicated on a network visualisation as a node with anarrow that projects and returns unto itself. These relationshipsdevelop into a network of connections.
In SNA, the connections between people are consideredas the units of analysis that reveal the flow of informationand how these connections define the structure of the net-work, which also refers to the presence of regular patterns inrelationship [80]. Gaining insights towards the understandingof the components and structure of a social network requiresa vocabulary and techniques provided by Social NetworkAnalysis (SNA) and Visualisation [81]. This vocabulary andtechniques are described in our examination of two differentkinds of networks identified by Rossi and Magnani [82] as, (i)the topical network, which is made up of relationships createdthrough tweets/activities that are aggregated over a topic or the#hashtag and, (ii) the Twitter network, which is made up of allthe relationships between the users (followers and friends). Webelieve that the relationship between the Twitter [structural]network and the topical network can be likened to that of the

317
International Journal on Advances in Software, vol 9 no 3 & 4, year 2016, http://www.iariajournals.org/software/
2016, © Copyright by authors, Published under agreement with IARIA - www.iaria.org
Figure 10: Influencers Engagement Network Graph
physical and logical topologies of a communications networkinfrastructure.
C. Understanding the Topical Network
A topical network is created when users are connectedby common topical issues, where individuals save/define Webcontents as bookmarks/keyword in a social environment byattaching annotations in form of tags [51], normally precededby the hash symbol on most keyboards (#). The hashtag can besaid to be the democratic manifestation of taxonomic principlesin the social media era (see Section IV-C). Trant (2009) [83]highlights the description of such tags as publicly shared usergenerated keywords, which have been suggested for use asa trivial mechanism for further improving the description ofonline information resources and their access through broaderindexing.
An example of the topical network is shown in the Influ-encers Engagement Network Graph presented in Figure 10.This network has been aggregated over the search keywordand hashtag of #autism, as found in our recent data on thesubject (see Section V-B). Both this topical network study andthe study that results in further insights on our previous studyfrom recent data, were performed on the University’s accounton the Pulsal Platform — an audience intelligence analyticplatform for social media.
D. Limitation of the Topical Network
The EMSoD social framework proposed in this researchoperates within a managed platform (Section IV-A), whichdefines the organizational boundary. Although the hashtagphenomenon has been successful in aggregating online topicaldiscussions without boundaries, the relationships created overmutual hash-tagged conversation is ephemeral [82], and sois the network created. Unless the hashtag can be tamed, itsuse on a public Twitter account can be so widespread that itcompromises the need, if there were, to keep the conversationswithin the organizational boundary. Even with the use ofenterprise Twitter’s alternative like Yammer, aggregating eventsand conversation over the hashtag cannot but include Yammer-wide conversations and events from outside the organizationalboundary.
To illustrate, when one takes a look at the topical networkcreated over our recent data on the subject of autism in Figure10. The nodes are not defined within a single geographicalboundary. The nodes in yellow colour represent those fromthe United Kingdom. The location information for the nodesin blue is unavailable. This means that users from variouscountries other than the UK are aggregated over this topic.In fact, the two most engaged influencers’s networks (CNNand genevassky) are not from the UK. This may be good inthat it provides further reach and depth around the topic but notfor classified organizational conversation that needs to be keptwithin the boundary of the organization’s network, assumingthe UK was a corporate entity in the business sense.
Specifying network boundaries in terms of hashtag orkeywords that connect people together in this manner ismore akin to the normalist approach of specifying a network,which is based on the theoritical concerns of the researcher[80], whereas the actors may not even know one another.Contrarily, Wasserman and Faust [80] also describe a secondway of specifying network boundaries, the realist approach,wherein the actors know one another, since membership ofsuch network is as perceived and acknowledged by membersthemselves. In essence, employees would readily acknowledgeand engage with fellow colleagues as members of the samenetwork. The realist approach aligns with the Twitter networkas identified by Rossi and Magnani [82]. The next sectionattempts to create an understanding of the Twitter network.
E. Understanding the Twitter Network
Considering its perceived ease of use and a broad coverageof SNA metrics and visualisation features [84], we usedNodeXL — a network analysis and visualisation packagedesigned for the analysis of online social media on MicrosoftExcel [85] — to examine the egocentric network [86] ofrelationships that develop over a one month period from26/07/2016 to 25/08/2016. As stated earlier, relationshipsemerge when a user (the source) mentions or replies to anotheruser (the destination) in their tweet. For example, the followingtweet of 29/07/2016, in which @unisouthampton mentions@nature — the Twitter handle for the International WeeklyJournal of Science — creates a relationship (mentions) betweenthe two entities:
“Our #research places us top 50 globallyand 4th in the UK, in @nature IndexRising Stars: https://t.co/XwXKR9N8Azhttps://t.co/VGQDxPE74y”
A relationship also emerges when a tweet is self sufficientwithout mentioning or replying to any other tweet by includingor preceding with another Twitter @username, respectively.These are regarded as self loop and is indicated in Figure11 by the red arrow proceeding and returning to the source(@unisouthampton). As can be expected that a user couldtweet without having to mention or reply to any other user,there are 68 such self loops, 102 unique Edges and 129 Vertices(Nodes) within the network so generated (see Table III). Theconnections made through the ‘replies to’ relationships arerepresented with Edges (connections lines) of 60% opacitythan the connections made through the mentions relationship,which are represented by Edges of 20% opacity.

318
International Journal on Advances in Software, vol 9 no 3 & 4, year 2016, http://www.iariajournals.org/software/
2016, © Copyright by authors, Published under agreement with IARIA - www.iaria.org
Figure 11: A Directed Network Graph of @unisouthampton
Meanwhile, the network graph in Figure 11 is a directedgraph, or digraph for short, which represents directional re-lations comprised of a set of nodes representing the actors inthe network and a set of arcs [lines] directed between pairs ofnodes representing directed ties between nodes [80]. A socialnetwork graph is formally represented by a graph G = (V,E), where V is the set of nodes (vertices) and E is the setof edges (ties) [87]. However, a cursory look at the networkgraph in Figure 11 would reveal that the @unisouthamptonaccount, represented with the large icon of the University ofSouthampton logo, has only an Out-Degree connection with upto the 129 nodes and 1 In-Degree connection, which is the selfloop unto itself. The directed relations through In- and Out-Degree connections define the asymmetric relationship modelof ‘following’ in Twitter, which allows one to keep up withthe tweets of any other user without the need for the other userto reciprocate [88].
Table III: GRAPH METRICS FOR FIGURE 11
Vertices 129
Unique Edges 102
Edges WithDuplicates 163
Total Edges 265
Self Loops 68
According to [80], “the concept of a network emphasizesthe fact that each individual has ties to other individuals, eachof whom in turn is tied to a few, some or many others. Thephrase, “social network” refers to the set of actors and theties among them. The network analyst would seek to modelthese relationships to depict the structure of a group. One couldthen study the impact of this structure on the functioning ofthe group and/or the influence of this structure on individualswithin the group”.
However, the network as it is presented in Figure 11 isnot an ideal network that encourages knowledge sharing andengagement among the actors. The three relationships thatdevelop were initiated by @unisouthampton’s tweets in whichother users were mentioned or replied to or in which the tweetswere sent wholly to create a tweet relationship. QueryingNodeXL with only the Twitter ID of a corporate or individual’sTwitter account, as we did with @unisouthampton, would onlyresult in a visualisation of the list of connections, as Figure11 reveals. Moreover, with over 40,000 nodes, a meaningfulvisible visualisation of a network of such magnitude as the@unisouthampton’s can be difficult because of the inherentcomplexity of the relationships and limited screen space [89].According to Wasserman and Faust [80], “The restriction to afinite set or sets of actors is an analytic requirement.”
Therefore, we identified 93 Twitter users (Vertices orNodes) within the University of Southampton and examinethe network of connections that evolves around them. TableIV presents the overall graph metrics.
Table IV: GRAPH METRICS FOR THE NETWORK GRAPH OF93 VERTICES
Graph Metric Value Graph Metric Value
Graph Type Directed ConnectedComponents 9
Vertices 93 Single-VertexConnected Components 8
Unique Edges 303 Maximum Vertices in aConnected Component 85
Edges withDuplicates 15925 Maximum Edges in a
Connected Component 15758
Total Edges 16228 Maximum,GeodesicDistance (Diameter) 3
Self-Loops 13628 Average GeodesicDistance 1.962102
ReciprocatedVertex Pair Ratio 0.221206581 Graph,Density 0.078073866
ReciprocatedEdge Ratio 0.362275449 NodeXL
Version 1.0.1.355
1) Grouping the Network on the Basis of Node Importance
Various metrics (Degree centrality, eigenvector centrality,pagerank, etc) capture various ways in which each individualnode (user) acts as a centre of attraction through whichknowledge and information propagates within the network.Sorting by Betweenness Centrality for example, sorts peoplewho have the quality of most broadly connecting across thenetwork to the top while Clustering coefficient measures howclosely connected each users connections connected to oneanother [90]. As this work is focused on measuring and seekingto facilitate employee engagement, we have used BetweenessCentrality (BC) as our measure of ranking for node importancebased on the potential of such central points for bindingthe network together by coordinating the activities of otherpoints, albeit, they may be viewed as structurally central tothe extent that they stand between others and can thereforefacilitate, impede or bias the transmission of messages [91].Moreover, measuring proximities can help to characterise theglobal structure of a network by showing how closely coupledit is [92]

319
International Journal on Advances in Software, vol 9 no 3 & 4, year 2016, http://www.iariajournals.org/software/
2016, © Copyright by authors, Published under agreement with IARIA - www.iaria.org
Table V: Groups of Vertices with Metrics
Group Vertices UniqueEdges
Edgeswith
Duplicates
TotalEdges
SelfLoops
MAX.GeodesicDistance
AVG.GeodesicDistance
GraphDensity
G1 41 90 7415 7505 6972 4 2.083 0.115G2 21 1 2112 2113 2113 0 0.000 0.000G3 19 2 2759 2761 2751 1 0.240 0.012G4 12 21 2151 2172 1792 2 1.194 0.462
Accordingly, the 93 nodes (users, also referred to asvertices) in the network are ranked and grouped on the basisof their Betweeness Centrality, with each group disc sizedaccording to the number of nodes that make up the range ofmeasures for the group, as visualised in Figure 12 and thegroup metrics in Table V.
2) Decomposing the Network Group of 93 Nodes
The smallest group in the network graph presented inFigure 12 (Light Green, G4:12) is a group of 12 nodes withthe highest Betweeness Centrality ranging from 115.194 to2494.640 (see Table VI), although the node with the highestBetweeness Centrality (2494.640) is @unisouthampton, andunderstandably with over 40,000 followers compared to only558 followers of the next highest Betweeness Centrality node,@sotonwsi (at BC score of 522.543), and 2390 followers for@lescarr (with a betweeness centrality score of 425.512), inthat order.
The largest group (Dark Blue, G1 : 41) is comprisedof 41 nodes (vertices) with the second highest BetweenessCentrality ranging from 11.408 to 99.715, with the highestbeing @garethpbeeston (99.715), @lisaharris (94.079) and@mark weal (93.573) in that order. Group 3 (Dark Green,G3:19) is composed of nodes with the third highest betweenesscentrality ranging from 1.067 to 8.627.
Groups 4, 3 and 1 are subgroups of this directed graph, asdemonstrated by the direction of the arrows on all sides, andas such, potentially represent an engaged network that couldpossibly facilitate knowledge sharing. Group 2 (Light Blue,G2:21) may be considered negligible as 16 out of the 21 nodeshave not a single score for Betweeness Centrality, and thus,they would have little or no impact on the network. Expandingthe graph to show the nodes in each group (see Figure 13reveals some of the nodes in group 2 (light green dots) areactually outliers that have no tie with the network at all as theyhave not engaged in any relationship with any other memberof the network, either by mentioning or replying to, other thanthemselves by way of tweeting (self loop), hence, they haveeach scored zero in the betweeness centrality measurement. Wecan even spot 2 of them that have never tweeted within thetime-frame and as such, do not have the arrow-edged ring ofself loop (tweet) but are standing aloof. The top 20 nodes arelabelled 1 through 20 in order of their Betweeness Centralitywhile the top 12 are colour coded light green. Essentially, thegroups are examples of subgroups in a one-mode network,in which measurement is based on just a single set of actors[80], albeit grouped according to their individual attributes ofBetweeness Centrality.
Meanwhile, the chart in Figure 14 reveals that the Red,Dark Green and Green bars are in the top echelons of nodeswith the highest Betweeness Centrality (a total of 23 nodes)while the bulk of the nodes in the entire graph - that is, a
Figure 12: Network graph of 93 Vertices Grouped According toBetweenness Centrality
Figure 13: Expanded Group of Nodes According to BetweenessCentrality
total of 70 nodes represented as Dark Blue bar on the chart- are with the lower range of Betweeness Centrality. Withthe highest Betweeness Centrality of 2,494.64 (Colour red onthe far right), the node representing the egocentric networkof @Unisouthampton, which is the official Twitter accountof the University of Southampton, has over 40,000 followers.However, the measure of a node’s Betweeness Centrality isnot based on the number of followers but on the numberof shortest paths from all nodes to all other nodes that passthrough that node [91]. This explains why the node with only558 followers (@sotonwsi) has the second highest betweenesscentrality (522.543). Although it could be argued that both@unisouthampton and @sotonwsi are non-personal accounts,it must be noted that the node with the next highest betweenesscentrality of 425.512 (@lescarr) has more follower count(2390) than the previous (@sotonwsi). The top 20 nodes bybetweeness centrality can be visualised in the network graphin Figure 13 (with each node labelled 1 through 20) whileTable VI presents the individual metrics for 12 of the top 20nodes (users), according to betweeness centrality, within thenetwork. The Individual Node Metrics in Table VI provides

320
International Journal on Advances in Software, vol 9 no 3 & 4, year 2016, http://www.iariajournals.org/software/
2016, © Copyright by authors, Published under agreement with IARIA - www.iaria.org
Table VI: TOP 12 INDIVIDUAL NODE METRICS
No. Node BetweenessCentrality
EigenvectorCentrality
PageRank
ClusteringCoefficient
1 unisouthampton 2494.640 0.038 4.644 0.0922 sotonwsi 522.543 0.037 2.764 0.1983 lescarr 425.512 0.031 2.520 0.1864 ecsuos 349.333 0.028 2.308 0.1915 suukii 325.737 0.019 1.756 0.1656 susanjhalford 206.940 0.029 2.065 0.2277 damewendydbe 179.074 0.028 1.852 0.2848 hughdavis 164.789 0.019 1.538 0.2339 iliadsoton 150.258 0.015 1.646 0.17410 webscidtc 146.866 0.026 1.784 0.26811 richardgomer 134.370 0.14 1.321 0.18012 sotonwais 115.194 0.015 1.176 0.233
another interesting aspect, which is that, another metric or acombination of metrics may be used depending on the intendedpurposes, although we have ranked these 12, out of 20 nodes,according to their scoring highest in Betweeness Centrality.For example, if the nodes were ranked in accordance withtheir Eigenvector Centrality, @susanjhalfod (No.6) would haveranked higher than @suukii (No.5). Eigenvector is a centralitymeasure that considers the value of a node, not in termsof its connections but in terms of the value of centrality ofsuch connections [87]. In essence, the ranking of a node isbased on the importance and/or ranking of the nodes it isconnected to, which means @suukii may serve as bridge topropagate knowledge among a vast number of people than@susanjhalford; the connections in themselves are not asstrong and vital within the network.
Figure 14: A Chart of Betweeness Centrality Spread among the 93Vertices
F. Determination of an Engaged Workforce
With reference to our Knowledge Management Value mea-surement in Formula (1), where KMV = AK ×EW (see KMValue in Section IV-E), we hereby devise a mechanism todetermine the value of an engaged workforce (EW ). We haveestablished that the interactions that create the user networkis based on users’ activities in tweeting and/or mentioningor replying-to another user within their own tweets, therebycreating the relationships known as Edges in Table V. Eachnode in the network has been assigned to the groups in Table Vbased on individual node’s measure of Betweenness Centrality.Table V also includes the graph density for each group. A sum
of all the groups’ graph densities equals 0.59, which indicatesa sparse graph, owing that a dense graph is always equals to1.
Graph density is an indicator of connectedness of a net-work, given as the number of connections in a graph divided bythe maximum number of connections [93]. This connectednessis also a function of the interactions that create the relationshipsupon which the network is formed, as mentioned earlier. Wetherefore, measure engagement in terms of graph density.Whatever value we get for AK is either maintained or negatedby the value of EW depending on whether the network is denseor sparse, respectively. This allows for the determination ofKnowledge Management Value (KMV ) to be inclusive of bothvalues from AK and EW as indicated in Equation (4).
KMV = 0.56×0.59 = 0.33 (4)
This method can be used to compare Knowledge Man-agement values derived from different KM activities/events orexpressed in percentage to determine the return on investmentson such activities/events.
VIII. CONCLUSION
This paper has presented EMSoD, a conceptual socialframework that mediates between KM and SM, with the aimof delivering KM values to corporate organizations. The paperidentifies actionable knowledge and employee engagement asparameters of KM values that the EMSoD framework helpsin delivering. As KM has suffered an image problem due,in part, to the lack of measurable value, the paper devises amechanism for measurement of the KM value delivered by theEMSoD social framework. Meanwhile, the paper has adoptedvery simple approaches, making it easy for any organization ofany size to replicate the methods, not only for delivering KMvalue, but also for measuring and evaluating the KM valuesso delivered. Thus, the paper serves as basis and initial inputfor integration and operationalization of the EMSoD socialframework within a corporate social software platform. Tothis end, it is important to, first, consider the interdependenceand interactions between the core elements of the framework(as emphasized by the cyclical presentation of the EMSoDframework in Figure 3) as an iterative process that results inKM value for organizations, within the construct of socialmedia. Then, the framework can further be modelled intoentity relationship for database and software developers tooperationalize by defining Entity classes that are independentof a database structure and then, map the core elements tothe tables and associations of the database. This provides asuggestion for future direction to which this paper could beextended.
REFERENCES
[1] C. Adetunji and L. Carr, “Knowledge Discovery from Social Media Data: A Case of Public Twitter Data for SMEs,” in 8th International Con-ference on Information, Process and Knowledge Management (eKnow),no. c. Venice: IARIA XPS Press, 2016, pp. 119–125.
[2] P. R. Smart and N. R. Shadbolt, “Social Machines,” in Encyclopedia ofInformation Science and Technology, M. Khosrow-Pour, Ed. Pennsyl-vania: IGI Global, Aug. 2014.

321
International Journal on Advances in Software, vol 9 no 3 & 4, year 2016, http://www.iariajournals.org/software/
2016, © Copyright by authors, Published under agreement with IARIA - www.iaria.org
[3] R. Cross and L. Sproull, “More Than an Answer: Information Relation-ships for Actionable Knowledge,” Organization Science, vol. 15, no. 4,Aug. 2004, pp. 446–462.
[4] D. P. Ford and R. M. Mason, “A Multilevel Perspective of TensionsBetween Knowledge Management and Social Media,” Journal of Orga-nizational Computing and Electronic Commerce, vol. 23, no. 1-2, Jan.2013, pp. 7–33.
[5] E. Turban, R. Sharda, and D. Delen, Decision Support and BusinessIntelligence Systems, 9th ed. Dorling Kindersly (India) Pvt, Ltd., 2011.
[6] T. H. Davenport and L. Prusak, Working Knowledge: How OrganizationsManage what They Know, Part 247. Boston: Harvard Business Press,1998.
[7] L. Razmerita, K. Kirchner, and T. Nabeth, “Social Media in Orga-nizations: Leveraging Personal and Collective Knowledge Processes,”Journal of Organizational Computing and Electronic Commerce, vol. 24,no. 1, Jan. 2014, pp. 74–93.
[8] C. Sorensen, “Enterprise Mobility,” Work and Globalization Series,Palgrave, 2011.
[9] C. Sørensen, A. Al-Taitoon, J. Kietzmann, D. Pica, G. Wiredu,S. Elaluf-Calderwood, K. Boateng, M. Kakihara, and D. Gibson,“Exploring enterprise mobility: Lessons from the field - Information,Knowledge, Systems Management - Volume 7, Number 1-2 / 2008 -IOS Press,” Information, Knowledge, Systems Management, vol. 7, no.1-2, 2008, pp. 243–271.
[10] P. Zikopoulos, C. Eaton, D. DeRoos, T. Deutsch, and G. Lapis, Un-derstanding Big Data: Analytics for Enterprise Class Hadoop andStreaming Data. New York: McGraw Hill, 2012.
[11] E. Turban, N. Bolloju, and T.-P. Liang, “Enterprise SocialNetworking: Opportunities, Adoption, and Risk Mitigation,” Journal ofOrganizational Computing and Electronic Commerce, vol. 21, no. 3,Jul. 2011, pp. 202–220.
[12] M. Polanyi, The Tacit Dimension. University of Chicago Press, 2009.[13] D. Griffiths and B. Moon, “The state of knowledge management A
survey suggests ways to attain more satisfied users.” 2011. [Online].Available: http://goo.gl/2bqHLB [Last Accessed 17 November 2016].
[14] D. Griffiths, A. Jenkins, and Z. Kingston-Griffiths, “The 2015 GlobalKnowledge Management Observatory c⃝ Report,” Juran Benchmarking,Tech. Rep., 2015.
[15] E. Bolisani and M. Handzic, Eds., Advances in Knowledge Management- Celebrating Twenty Years of Research and Practice. SpringerInternational Publishing, 2015.
[16] D. P. Ford and R. M. Mason, “Knowledge Management and SocialMedia: The Challenges and Benefits,” Journal of OrganizationalComputing and Electronic Commerce, vol. 23, no. 1-2, Jan. 2013, pp.1–6.
[17] A. P. McAfee, “Enterprise 2 . 0 : The Dawn of Emergent Collaboration,”MIT Sloan Management Review, vol. 47, no. 3, 2006, pp. 21–28.
[18] T. Davenport, “Enterprise 2.0: The New, New KnowledgeManagement?” 2008. [Online]. Available: https://hbr.org/2008/02/enterprise-20-the-new-new-know/ [Last Accessed: 17 November 2016].
[19] K. A. Delic and J. A. Riley, “Enterprise Knowledge Clouds:Next Generation KM Systems?” 2009 International Conference onInformation, Process, and Knowledge Management, Feb. 2009, pp.49–53.
[20] “Global State of Enterprise Mobility 2016,” Enterprise MobilityExchange, London, Tech. Rep., 2016. [Online]. Available: http://eu.enterprisemobilityexchange.com/media/1001912/59471.pdf [LastAccessed 17 November 2016].
[21] L. Mallis, “Birth of the DIAD — upside Blog,” 2009.[Online]. Available: http://blog.ups.com/2009/12/07/birth-of-the-diad/[Last Accessed 15 March 2016].
[22] D. Dalmeyer and K. Tsipis, Heaven and Earth:Vol. 16, USAS:CivilianUses of Near-Earth Space. Kluwer Law International, 1997.
[23] G. Piccoli, Information Systems for Managers: Texts & Cases. Hoboken:John Wiley & Sons, 2008.
[24] T. H. Davenport and L. Prusak, “Working knowledge: How organizationsmanage what they know,” Ubiquity, vol. 2000, no. August, 2000.
[25] R. L. Ackoff, Wiley: Ackoff’s Best: His Classic Writings on Management- Russell L. Ackoff. Wiley, 1999.
[26] R. Schumaker, “From Data to Wisdom: The Progression ofComputational Learning in Text Mining.” Communications of theIIMA, vol. 11, no. 1, 2011, pp. 1–14.
[27] G. Bellinger, D. Castro, and A. Mills, “Data, Information, Knowledge,& Wisdom,” 2004. [Online]. Available: http://www.systems-thinking.org/dikw/dikw.htm [Last Accessed 15 March 2016].
[28] J. Terra and T. Angeloni, “Understanding the difference between
information management and knowledge management,” KM Advantage,2003, pp. 1–9.
[29] Y. Hijikata, T. Takenaka, Y. Kusumura, and S. Nishida, “Interactiveknowledge externalization and combination for SECI model,” in Pro-ceedings of the 4th international conference on Knowledge capture -K-CAP ’07. New York, New York, USA: ACM Press, Oct. 2007, p.151.
[30] I. Nonaka and H. Takeuchi, The Knowledge-creating Company: HowJapanese Companies Create the Dynamics of Innovation. OxfordUniversity Press, 1995.
[31] T.-C. Chou, “Internal learning climate, knowledge management processand perceived knowledge management satisfaction,” Journal of Informa-tion Science, vol. 31, no. 4, 2005, pp. 283–296.
[32] C. Argyris, “Seeking truth and actionable knowledge: How the scientificmethod inhibits both,” Philosophica, vol. 40, 1987, pp. 5–21.
[33] M. Bohringer and A. Richter, “Adopting social software to theintranet: a case study on enterprise microblogging,” in ProceedingsMensch und Computer 2009, Oldenbourg, Berlin, 2009, pp. 1–10.[Online]. Available: http://citeseerx.ist.psu.edu/viewdoc/download?doi=10.1.1.520.9286&rep=rep1&type=pdf [Last Accessed 18 November2016].
[34] N. Sousa, C. J. Costa, and M. Aparicio, “IO-SECI: A conceptual modelfor knowledge management,” in Proceedings of the Workshop on OpenSource and Design of Communication - OSDOC ’13. New York,New York, USA: ACM Press, Jul. 2013, pp. 9–17. [Online]. Available:http://dl.acm.org/citation.cfm?id=2503848.2503850
[35] I. Guy, U. Avraham, D. Carmel, S. Ur, M. Jacovi, and I. Ronen, “Miningexpertise and interests from social media,” Proceedings of the 22ndinternational conference on World Wide Web, 2013, pp. 515–526.
[36] F. Sousa, M. Aparicio, and C. J. Costa, “Organizational wiki as a knowl-edge management tool,” in Proceedings of the 28th ACM InternationalConference on Design of Communication - SIGDOC ’10. New York,New York, USA: ACM Press, Sep. 2010, p. 33.
[37] E. Fischer and A. R. Reuber, “Social interaction via new socialmedia: (How) can interactions on Twitter affect effectual thinking andbehavior?” Journal of Business Venturing, vol. 26, no. 1, Jan. 2011, pp.1–18.
[38] M. Kleek and K. O’Hara, “The Future of Social is Personal:The Potential of the Personal Data Store.” [Online]. Available:http://eprints.soton.ac.uk/363518/1/pds.pdf [Last Accessed 19 November2016].
[39] F. Cabiddu, M. D. Carlo, and G. Piccoli, “Social media affordances:Enabling customer engagement,” Annals of Tourism Research, vol. 48,2014, pp. 175–192.
[40] J. Comm, Twitter Power 2.0: How to Dominate Your Market One Tweetat a Time. Hoboken: John Wiley & Sons, Inc., 2010.
[41] A. M. Kaplan and M. Haenlein, “Users of the world, unite! The chal-lenges and opportunities of Social Media,” Business Horizons, vol. 53,no. 1, 2010, pp. 59–68.
[42] M. Miller, A. Marks, M. DeCoulode, J. Hagel, J. S. Brown,and D. Kulasooriya, “Social software for business performance Themissing link in social software: Measurable business performanceimprovements,” Deloitte Center for the Edge, 2011.
[43] J. Falls, “Why Forums May Be the Most Powerful Social Media Channelfor Brands,” 2012. [Online]. Available: http://www.entrepreneur.com/article/223493
[44] M. Alavi, “Knowledge Management Systems: Issues, Chanllenges andBenefits.” Communications of the Association for Information Systems,vol. 1, no. 7, 1999, pp. 1–37.
[45] S. Tardanico, “Is Social Media SabotagingReal Communication? - Forbes,” 2012. [On-line]. Available: http://www.forbes.com/sites/susantardanico/2012/04/30/is-social-media-sabotaging-real-communication/#366347a04fd8 [LastAccessed 19 November 2016].
[46] T. White, “Why Social Media Isn’t Social,” 2013.[Online]. Available: http://www.huffingtonpost.com/thomas-white/why-social-media-isnt-social b 3858576.html [Last Accessed 19November 2016].
[47] M. A. Zeng, “The Contribution of Different Online Communities inOpen Innovation Projects,” Proceedings of The International Symposiumon Open Collaboration - OpenSym ’14, 2014, pp. 1–9.
[48] A. Keenan and A. Shiri, “Sociability and social interaction on socialnetworking websites,” Library Review, vol. 58, no. 6, Jun. 2009, pp.438–450.
[49] T. V. Wal, “Folksonomy Coinage and Definition,” 2007. [Online].

322
International Journal on Advances in Software, vol 9 no 3 & 4, year 2016, http://www.iariajournals.org/software/
2016, © Copyright by authors, Published under agreement with IARIA - www.iaria.org
Available: http://vanderwal.net/folksonomy.html [Last Accessed 19November 2016].
[50] Delphi Group, “Information Intelligence: Content Classification and theEnterprise Taxonomy Practice,” Boston, Tech. Rep., 2004. [Online].Available: http://inei.org.br/inovateca/estudos-e-pesquisas-em-inovacao/InformationIntelligence-taxonomy-Delphi-2004.pdf [Last Accessed 19November 2016].
[51] A. Zubiaga, “”Harnessing folksonomies for resource classification” byArkaitz Zubiag with Danielle H. Lee as coordinator,” ACM SIGWEBNewsletter, no. Summer, Jul. 2012, pp. 1–2.
[52] W. J. Frawley, G. Piatetsky-shapiro, and C. J. Matheus, “KnowledgeDiscovery in Databases : An Overview,” AI Magazine, vol. 13, no. 3,1992, pp. 57–70.
[53] T. Koller, “What is value-based management?” The McKinsey Quarterly,no. 3, Jun. 1994, pp. 87–102.
[54] L. Edvinsson and M. Malone, Intellectual Capital: Realizing YourCompany’s True Value by Finding Its Hidden Brainpower. Collins,1997.
[55] G. Gruman, “IT Value Metrics: How to Communi-cate ROI to the Business — CIO,” 2007. [On-line]. Available: http://www.cio.com/article/2437929/it-organization/it-value-metrics--how-to-communicate-roi-to-the-business.html [LastAccessed 19 November 2016].
[56] I. Becerra-Fernandez and S. Rajiv, “Organizational Knowledge Manage-ment: A Contingency Perspective,” Journal of Management InformationSystems, vol. 18, no. June, 2001, pp. 23–55.
[57] M. E. Porter, “What Is Value in Health Care?” New England Journal ofMedicine, 2010, pp. 2477–2481.
[58] National Audit Office, “Analytical framework for assessing Value forMoney,” National Audit Office, Tech. Rep. Step 6, 2010. [Online].Available: http://www.bond.org.uk/data/files/National Audit OfficeAnalytical framework for assessing Value for Money.pdf [Last Ac-cessed 25 November 2016].
[59] W. Vestal, “Measuring Knowledge Management,” in Symposium: AQuarterly Journal In Modern Foreign Literatures. APQC, 2002, pp.1–6.
[60] S. A. Melnyk, D. M. Stewart, and M. Swink, “Metrics and performancemeasurement in operations management: dealing with the metrics maze,”Journal of Operations Management, vol. 22, no. 3, 2004, pp. 209–218.
[61] R. Blundel, “Is small still beautiful?: Exploring the role of SMEs inemerging visions of a green’ economy,” Middlesex University, London,Tech. Rep., 2016. [Online]. Available: http://oro.open.ac.uk/46768/(Accessed 2 Aug., 2016).
[62] M. Ayyagari, T. Beck, and A. Demirguc-Kunt, “Small and MediumEnterprises Across the Globe,” Small Business Economics, vol. 29,no. 4, 2007, pp. 415–434.
[63] T. W. Liao and E. Triantaphyllou, Recent Advances in Data Mining ofEnterprise Data: Algorithms and Applications. World Scientific, 2008.[Online]. Available: http://www.worldscientific.com/worldscibooks/10.1142/6689 [Last Accessed 19 November 2016].
[64] D. Murthy, Twitter: Social Communication in theTwitter Age. Cambridge: Polity Press, 2013. [Online].Available: http://www.lehmanns.de/shop/sozialwissenschaften/27894960-9780745665108-twitterhttp://wiley-vch.e-bookshelf.de/products/reading-epub/product-id/3973642/title/Twitter.html?lang=en
[65] “Tax Credits Row What Will Happen Now After GovernmentDefeat?” 2015. [Online]. Available: https://uk.news.yahoo.com/tax-credits-row-happen-now-100031983.html [Last Accessed 29February 2016].
[66] “What is social welfare? definition and meaning.” [Online]. Available:http://www.businessdictionary.com/definition/social-welfare.html [LastAccessed 03 March 2016].
[67] S. Rogers, “UK welfare spending: how much does each benefitreally cost?” 2013. [Online]. Available: http://www.theguardian.com/news/datablog/2013/jan/08/uk-benefit-welfare-spending [Last Accessed30 April 2016].
[68] M. Elsabbagh, G. Divan, Y.-J. Koh, Y. S. Kim, S. Kauchali, C. Marcın,C. Montiel-Nava, V. Patel, C. S. Paula, C. Wang, M. T. Yasamy,and E. Fombonne, “Global prevalence of autism and other pervasivedevelopmental disorders.” Autism research : official journal of theInternational Society for Autism Research, vol. 5, no. 3, Jun. 2012, pp.160–79.
[69] J. Baldock, “World Autism Awareness Day 2015: 16 autism mythsdebunked,” Apr. 2015. [Online]. Available: http://metro.co.uk/2015/04/02/autism-sixteen-myths-debunked-5123051/ [Last Accessed 19November 2016].
[70] NHS Choices, “Autism spectrum disorder - NHS Choices.” [Online].Available: http://www.nhs.uk/Conditions/Autistic-spectrum-disorder/Pages/Introduction.aspx
[71] D. Pritchard, “KNOWLEDGE,” in Central Issues of Philosophy,J. Shand, Ed. Oxford: Wiley - Blackwell, 2009, pp. 1–16.
[72] E. Gettier, “Is Justified True Belief Knowledge?” Analysis, vol. 23, no. c,1963, pp. 444–446.
[73] C. Argyris, Actionable Knowledge, C. Knudsen and H. Tsoukas,Eds. Oxford University Press, Mar. 2005. [Online].Available: http://www.oxfordhandbooks.com/view/10.1093/oxfordhb/9780199275250.001.0001/oxfordhb-9780199275250-e-16 [Last Ac-cessed 19 November 2016].
[74] L. Posner, “Actionable Knowledge: Putting Research to Workfor School Community Action,” 2009. [Online]. Available: http://www.idra.org/resource-center/actionable-knowledge/ [Last Accessed19 November 2016].
[75] C. Argyris, Knowledge for action: a guide to overcoming barriersto organizational change. Jossey-Bass, 1993. [Online]. Available:http://eric.ed.gov/?id=ED357268 [Last Accessed 19 November 2016].
[76] B. Marr, “Employee Engagement Level,” in 25 Need-to-Know KeyPerformance Indicators, 1st ed. Harlow: Pearson Education Ltd., 2014,ch. 22, pp. 151 – 157.
[77] Harvard Business Review, “The Impact of Employee Engagementon Performance,” Harvard Business Review, Tech. Rep., 2013.[Online]. Available: https://hbr.org/resources/pdfs/comm/achievers/hbrachievers report sep13.pdf [Last Accessed 19 November 2016].
[78] L. Carr and S. Harnad, “Offloading cognition onto the Web,” IEEEIntelligent Systems, Jan. 2011.
[79] S. K. M. Yi, M. Steyvers, M. D. Lee, and M. J. Dry, “The Wisdomof the Crowd in Combinatorial Problems,” Cognitive Science, vol. 36,no. 3, Apr. 2012, pp. 452–470.
[80] S. Wasserman and K. Faust, Social Network Analysis: Methods andApplications. Cambridge University Press, 2012.
[81] A. Gruzd and C. Haythornthwaite, “Enabling Community ThroughSocial Media,” Journal of Medical Internet Research, vol. 15, no. 10,Oct. 2013.
[82] L. Rossi and M. Magnani, “Conversation practices and network structurein Twitter,” Proceedings of the Sixth International AAAI Conference onWeblogs and Social Media, 2012, p. 4.
[83] J. Trant, “Studying social tagging and folksonomy: A review andframework,” Journal of Digital Information, vol. 10, no. 1, 2009, pp.1–44.
[84] D. L. Hansen, D. Rotman, E. Bonsignore, N. Milic-Frayling, E. M.Rodrigues, M. Smith, and B. Shneiderman, “Do you know the wayto SNA’: A process model for analyzing and visualizing social medianetwork data,” in Proceedings of the 2012 ASE International Conferenceon Social Informatics, SocialInformatics 2012. IEEE Explore DigitalLibrary, 2013, pp. 304–313.
[85] D. Hansen, B. Shneiderman, and M. A. Smith, “Analyzing Social MediaNetworks with NodeXL: Insights from a Connected World,” GraduateJournal of Social Science, vol. 8, no. 3, 2011, p. 284.
[86] J. Golbeck, Introduction to Social Media Investigation - A Hands-OnApproach. Waltham: Elsevier Inc. (Syngress), 2015.
[87] B. Ruhnau, “Eigenvector-centrality a node-centrality?” Social Networks,vol. 22, 2000, pp. 357–365.
[88] M. A. Russell, Mining the Social Web, 2nd Edition. O’Reilly Media,2013.
[89] C. Dunne and B. Shneiderman, “Motif Simplification: ImprovingNetwork Visualization Readability with Fan, Connector, and CliqueGlyphs,” CHI ’13: Proc. 2013 international conference on HumanFactors in Computing Systems, 2013, pp. 3247–3256.
[90] M. A. Smith, L. Raine, B. Shneiderman, and I. Himel-boim, “How we analyzed Twitter social media net-works with NodeXL,” Pew Research Center, Tech. Rep.,2014. [Online]. Available: http://www.pewinternet.org/files/2014/02/How-we-analyzed-Twitter-social-media-networks.pdf [Last Accessed19 November 2016].
[91] L. C. Freeman, “A Set of Measures of Centrality Based onBetweenness,” Sociometry, vol. 40, no. 1, Mar. 1977, pp. 35–41.
[92] Y. Koren, S. C. North, and C. Volinsky, “Measuring and extractingproximity graphs in networks,” ACM Transactions on KnowledgeDiscovery from Data, vol. 1, no. 3, Dec. 2007, pp. 12–es.
[93] D. G. Lorentzen, “Polarisation in political Twitter conversations,” AslibJournal of Information Management, vol. 66, no. 3, May. 2014, pp.329–341.
323
International Journal on Advances in Software, vol 9 no 3 & 4, year 2016, http://www.iariajournals.org/software/
2016, © Copyright by authors, Published under agreement with IARIA - www.iaria.org
An Integrated Semantic Approach to Content Management in the Urban Resilience Domain
Ilkka Niskanen, Mervi Murtonen Technical Research Centre of Finland
Oulu/Tampere, Finland [email protected], [email protected]
Fiona Browne, Peadar Davis School of Computing and Mathematics
Ulster University Jordanstown, Northern Ireland, UK
[email protected], [email protected]
Francesco Pantisano Smart System Infrastructures
Finmeccanica Company Genova, Italy
Ivan Palomares School of Electronics, Electrical Engineering and Computer
Science Queen’s University
Belfast, Northern Ireland, UK [email protected]
Abstract— Content Management refers to the process of gaining control over the creation and distribution of information and functionality. Although there are several content management systems available they often fail in addressing the context specific needs of end-users. To enable more task specific and personalized support we present a content management solution developed for the domain of urban resilience. The introduced content management system is extended with a semantic layer that aims to support the management of heterogeneous and large content repository with domain specific annotation and categorization capabilities. In addition, the applied semantic intelligence allows better understanding of content items, linkages between unstructured information and tools, and provides more sophisticated answers to users’ various needs.
Keywords- content management; semantic technologies; heterogeneous data repository
I. INTRODUCTION The field of Content Management (CM) refers to the
process of gaining control over the creation and distribution of information and functionality. Concisely, an effective Content Management System (CMS) aims at getting the right information to the right people in the right way. Usually, CM is divided into three main phases namely collecting, managing, and publishing of content. The collection phase encompasses the creating or acquiring information from an existing source. This is then aggregated into a CMS by editing it, segmenting it into components, and adding appropriate metadata. The managing phase includes creating a repository that consists of database containing content components and administrative data (data on the system’s users, for example). Finally, in the publishing stage the content is made available for the target audience by extracting components out of the repository and releasing the content for use in the most appropriate way [1] [2].
Currently, there are several commercial and open-source technologies available that are applied to address different content management needs across various industries including healthcare [3], and education [4], for example. However, the standard versions of the existing solutions are not always capable of supporting end-users in their specified context to reach their particular goals in an effective, efficient and satisfactory way [5]. For instance, the included content retrieval mechanisms are often implemented using traditional keyword based search engines that are not adapted to serve any task specific needs [6][7][8].
One of the main issues to be resolved is how to convert existing and new content that can be understood by humans into semantically-enriched content that can be understood by machines [9]. The human-readable and unstructured content is usually difficult to automatically process, relate and categorize, which hinders the ability to extract value from it [10]. Additionally, it results in the restriction of development of more intelligent search mechanisms [9]. To address some of the above described deficiencies, semantic technologies are being increasingly used in CM. In particular, the utilization of domain specific vocabularies and taxonomies in content analysis enables accurate extraction of meaningful information, and supports task-specific browsing and retrieval requirements compared to traditional approaches [9]. Furthermore, semantic technologies facilitate creating machine-readable content metadata descriptions, which allows, for example, software agents to automatically accomplish complex tasks using that data. Moreover, semantically enhanced metadata helps search engines to better understand what they are indexing and providing more accurate results to the users [11].
In this paper, we introduce the HARMONISE platform, developed in the FP7 EU HARMONISE [12] project. This paper is an extended version of work published in [1], where a semantic layer implemented on top of the HARMONISE
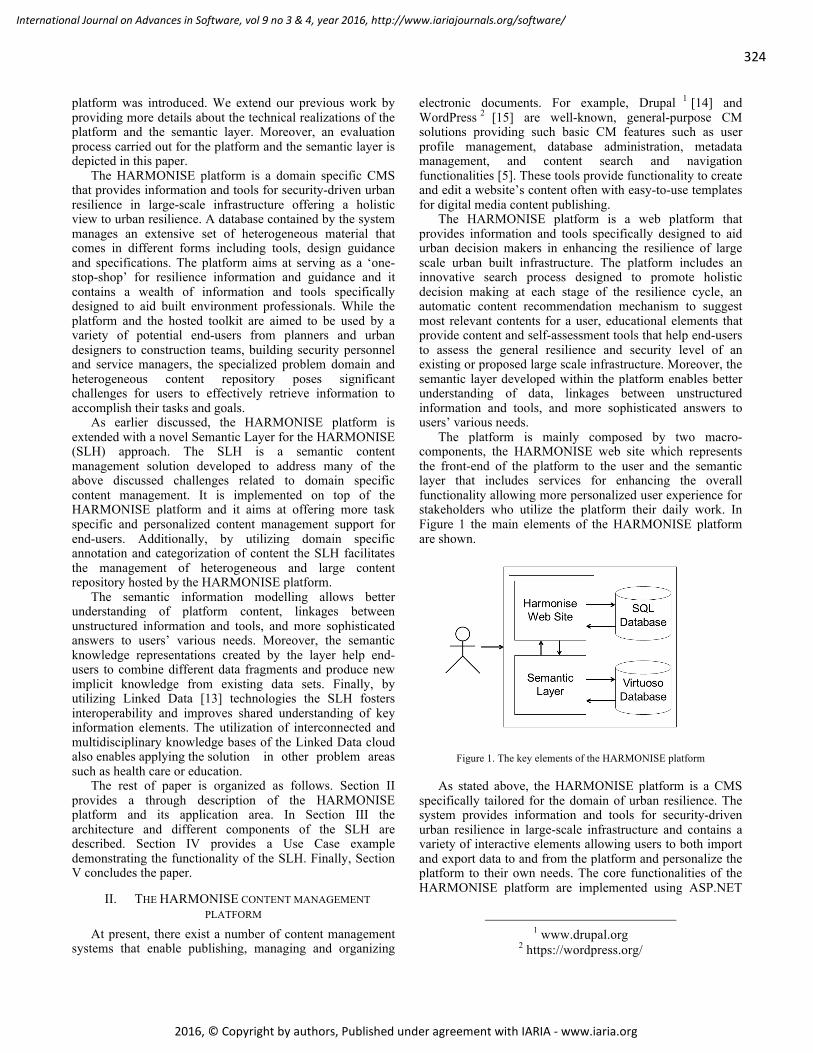
324
International Journal on Advances in Software, vol 9 no 3 & 4, year 2016, http://www.iariajournals.org/software/
2016, © Copyright by authors, Published under agreement with IARIA - www.iaria.org
platform was introduced. We extend our previous work by providing more details about the technical realizations of the platform and the semantic layer. Moreover, an evaluation process carried out for the platform and the semantic layer is depicted in this paper.
The HARMONISE platform is a domain specific CMS that provides information and tools for security-driven urban resilience in large-scale infrastructure offering a holistic view to urban resilience. A database contained by the system manages an extensive set of heterogeneous material that comes in different forms including tools, design guidance and specifications. The platform aims at serving as a ‘one-stop-shop’ for resilience information and guidance and it contains a wealth of information and tools specifically designed to aid built environment professionals. While the platform and the hosted toolkit are aimed to be used by a variety of potential end-users from planners and urban designers to construction teams, building security personnel and service managers, the specialized problem domain and heterogeneous content repository poses significant challenges for users to effectively retrieve information to accomplish their tasks and goals.
As earlier discussed, the HARMONISE platform is extended with a novel Semantic Layer for the HARMONISE (SLH) approach. The SLH is a semantic content management solution developed to address many of the above discussed challenges related to domain specific content management. It is implemented on top of the HARMONISE platform and it aims at offering more task specific and personalized content management support for end-users. Additionally, by utilizing domain specific annotation and categorization of content the SLH facilitates the management of heterogeneous and large content repository hosted by the HARMONISE platform.
The semantic information modelling allows better understanding of platform content, linkages between unstructured information and tools, and more sophisticated answers to users’ various needs. Moreover, the semantic knowledge representations created by the layer help end-users to combine different data fragments and produce new implicit knowledge from existing data sets. Finally, by utilizing Linked Data [13] technologies the SLH fosters interoperability and improves shared understanding of key information elements. The utilization of interconnected and multidisciplinary knowledge bases of the Linked Data cloud also enables applying the solution in other problem areas such as health care or education.
The rest of paper is organized as follows. Section II provides a through description of the HARMONISE platform and its application area. In Section III the architecture and different components of the SLH are described. Section IV provides a Use Case example demonstrating the functionality of the SLH. Finally, Section V concludes the paper.
II. THE HARMONISE CONTENT MANAGEMENT PLATFORM
At present, there exist a number of content management systems that enable publishing, managing and organizing
electronic documents. For example, Drupal 1 [14] and WordPress 2 [15] are well-known, general-purpose CM solutions providing such basic CM features such as user profile management, database administration, metadata management, and content search and navigation functionalities [5]. These tools provide functionality to create and edit a website’s content often with easy-to-use templates for digital media content publishing.
The HARMONISE platform is a web platform that provides information and tools specifically designed to aid urban decision makers in enhancing the resilience of large scale urban built infrastructure. The platform includes an innovative search process designed to promote holistic decision making at each stage of the resilience cycle, an automatic content recommendation mechanism to suggest most relevant contents for a user, educational elements that provide content and self-assessment tools that help end-users to assess the general resilience and security level of an existing or proposed large scale infrastructure. Moreover, the semantic layer developed within the platform enables better understanding of data, linkages between unstructured information and tools, and more sophisticated answers to users’ various needs.
The platform is mainly composed by two macro-components, the HARMONISE web site which represents the front-end of the platform to the user and the semantic layer that includes services for enhancing the overall functionality allowing more personalized user experience for stakeholders who utilize the platform their daily work. In Figure 1 the main elements of the HARMONISE platform are shown.
Figure 1. The key elements of the HARMONISE platform
As stated above, the HARMONISE platform is a CMS specifically tailored for the domain of urban resilience. The system provides information and tools for security-driven urban resilience in large-scale infrastructure and contains a variety of interactive elements allowing users to both import and export data to and from the platform and personalize the platform to their own needs. The core functionalities of the HARMONISE platform are implemented using ASP.NET
1 www.drupal.org
2 https://wordpress.org/

325
International Journal on Advances in Software, vol 9 no 3 & 4, year 2016, http://www.iariajournals.org/software/
2016, © Copyright by authors, Published under agreement with IARIA - www.iaria.org
web application framework and it utilizes Microsoft SQL 2012 database to store content items.
The main features and functionalities are divided between three user profile categories defined for the HARMONISE platform. To begin with, a standard registered user can navigate through the different sections of the platform excluding the upload section, use the search functionalities and view all the platform contents. However, he cannot upload or edit any content. In contrast, an uploader who has been granted permission by the administrator can access the upload section and upload contents in addition to the functionalities available for the standard user. Moreover, the uploader can edit/delete the content he has uploaded. In order to become an uploader user has to insert a special password (i.e., uploader password) provided by the platform administrator. Finally, the administrator of the platform can edit/delete the content uploaded by an uploader. Moreover, he can manage the user assignment to a specific group and generate the uploader passwords. The main functionalities enabled for each user category are depicted in Figure 2.
Figure 2. The user profiles and main features of the platform
An important part of the HARMONISE content
management platform is the Thematic Framework [16] that was created to structure information within the platform and to guide end-users through an innovative step-by-step search process. The Thematic Framework is set out in Figure 3.
By unpacking resilience into a number of key layers the Thematic Framework provides the necessary taxonomy needed for realizing effective domain-specific content annotation and categorizing functionalities, as later discussed. The objective of the domain-specific annotation is to allow users to easily identify and access information and
tools within the platform, and to search the platform according to their unique needs or interests.
Figure 3. The Thematic Framework (adopted from [16])
III. THE SEMANTIC LAYER The HARMONISE content management platform hosts a
large portfolio of urban resilience related content. However, finding relevant information and tools from such a knowledge base with conventional information retrieval methods is usually both tedious and time consuming, and tends to become a challenge as the amount of content increases [9]. Often users have difficulties in grouping together related material or finding the content that best serve their information needs, especially when content is stored in multiple formats [17].
In general, the existing CMSs usually lack consistent and scalable content annotation mechanisms that allow them to deal with the highly heterogeneous domains that information architectures for the modern knowledge society demand [18]. The semantic layer described in this study aims at addressing the above mentioned challenges by integrating semantic data modelling and processing mechanisms to the core HARMONISE platform functionalities. For example, the application of semantic mark-up based tagging of web content enables expressively describing entities found in the content, and relations between them [9]. Moreover, by utilizing the Linked Data Cloud links can be set between different and heterogeneous content elements and therefore connect these elements into a single global data space, which further facilitates interoperability and machine-readable understanding of content [19].
The main features of the SLH are divided to four parts. First, the metadata enrichment part produces information-rich metadata descriptions of the content by enhancing content with relevant semantic metadata. Second, the semantic metadata repository implements the necessary means for storing and accessing the created metadata. The third component of the SLH realizes a semantic search feature. In more detail the search service aims at returning more meaningful search results to the user by utilizing both keyword-based semantic search and “Search by theme” filtering algorithm that restricts the searchable space by enabling users to select certain categories from the Thematic Framework. The final part, content recommendation, combines information about users’ preferences and profile to find a target user neighborhood, and proactively
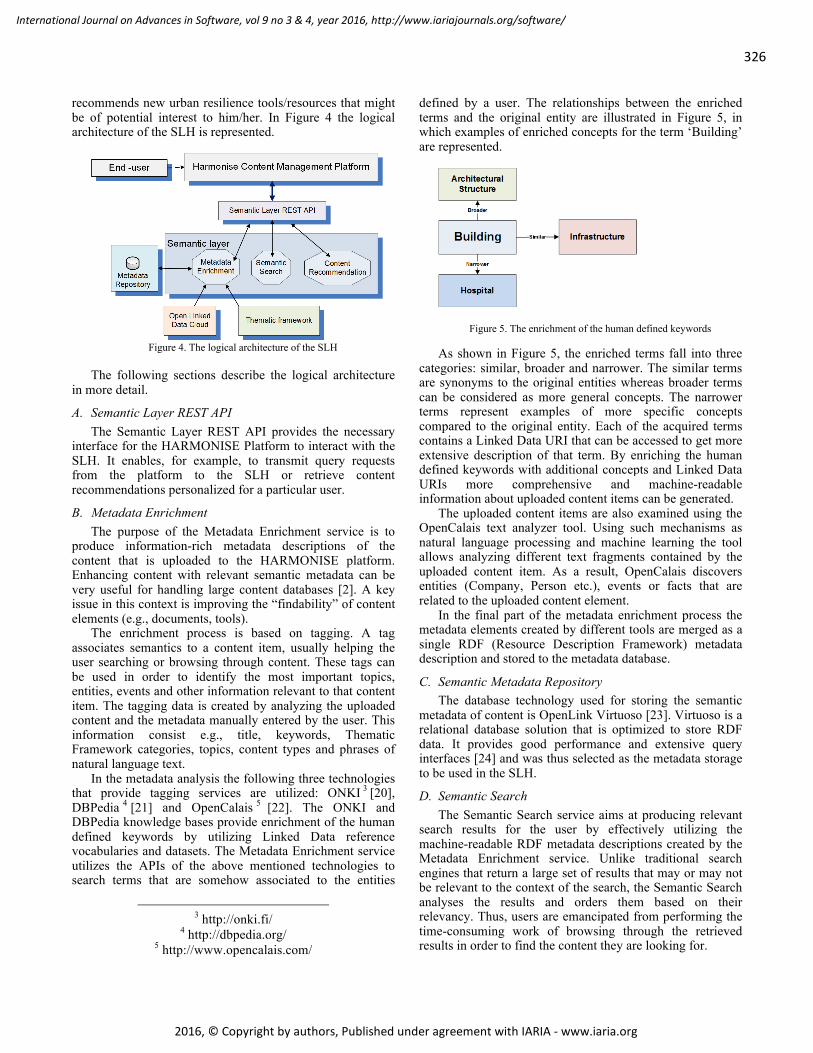
326
International Journal on Advances in Software, vol 9 no 3 & 4, year 2016, http://www.iariajournals.org/software/
2016, © Copyright by authors, Published under agreement with IARIA - www.iaria.org
recommends new urban resilience tools/resources that might be of potential interest to him/her. In Figure 4 the logical architecture of the SLH is represented.
Figure 4. The logical architecture of the SLH
The following sections describe the logical architecture
in more detail.
A. Semantic Layer REST API The Semantic Layer REST API provides the necessary
interface for the HARMONISE Platform to interact with the SLH. It enables, for example, to transmit query requests from the platform to the SLH or retrieve content recommendations personalized for a particular user.
B. Metadata Enrichment The purpose of the Metadata Enrichment service is to
produce information-rich metadata descriptions of the content that is uploaded to the HARMONISE platform. Enhancing content with relevant semantic metadata can be very useful for handling large content databases [2]. A key issue in this context is improving the “findability” of content elements (e.g., documents, tools).
The enrichment process is based on tagging. A tag associates semantics to a content item, usually helping the user searching or browsing through content. These tags can be used in order to identify the most important topics, entities, events and other information relevant to that content item. The tagging data is created by analyzing the uploaded content and the metadata manually entered by the user. This information consist e.g., title, keywords, Thematic Framework categories, topics, content types and phrases of natural language text.
In the metadata analysis the following three technologies that provide tagging services are utilized: ONKI 3 [20], DBPedia 4 [21] and OpenCalais 5 [22]. The ONKI and DBPedia knowledge bases provide enrichment of the human defined keywords by utilizing Linked Data reference vocabularies and datasets. The Metadata Enrichment service utilizes the APIs of the above mentioned technologies to search terms that are somehow associated to the entities
3 http://onki.fi/
4 http://dbpedia.org/ 5 http://www.opencalais.com/
defined by a user. The relationships between the enriched terms and the original entity are illustrated in Figure 5, in which examples of enriched concepts for the term ‘Building’ are represented.
Figure 5. The enrichment of the human defined keywords
As shown in Figure 5, the enriched terms fall into three categories: similar, broader and narrower. The similar terms are synonyms to the original entities whereas broader terms can be considered as more general concepts. The narrower terms represent examples of more specific concepts compared to the original entity. Each of the acquired terms contains a Linked Data URI that can be accessed to get more extensive description of that term. By enriching the human defined keywords with additional concepts and Linked Data URIs more comprehensive and machine-readable information about uploaded content items can be generated.
The uploaded content items are also examined using the OpenCalais text analyzer tool. Using such mechanisms as natural language processing and machine learning the tool allows analyzing different text fragments contained by the uploaded content item. As a result, OpenCalais discovers entities (Company, Person etc.), events or facts that are related to the uploaded content element.
In the final part of the metadata enrichment process the metadata elements created by different tools are merged as a single RDF (Resource Description Framework) metadata description and stored to the metadata database.
C. Semantic Metadata Repository The database technology used for storing the semantic
metadata of content is OpenLink Virtuoso [23]. Virtuoso is a relational database solution that is optimized to store RDF data. It provides good performance and extensive query interfaces [24] and was thus selected as the metadata storage to be used in the SLH.
D. Semantic Search The Semantic Search service aims at producing relevant
search results for the user by effectively utilizing the machine-readable RDF metadata descriptions created by the Metadata Enrichment service. Unlike traditional search engines that return a large set of results that may or may not be relevant to the context of the search, the Semantic Search analyses the results and orders them based on their relevancy. Thus, users are emancipated from performing the time-consuming work of browsing through the retrieved results in order to find the content they are looking for.
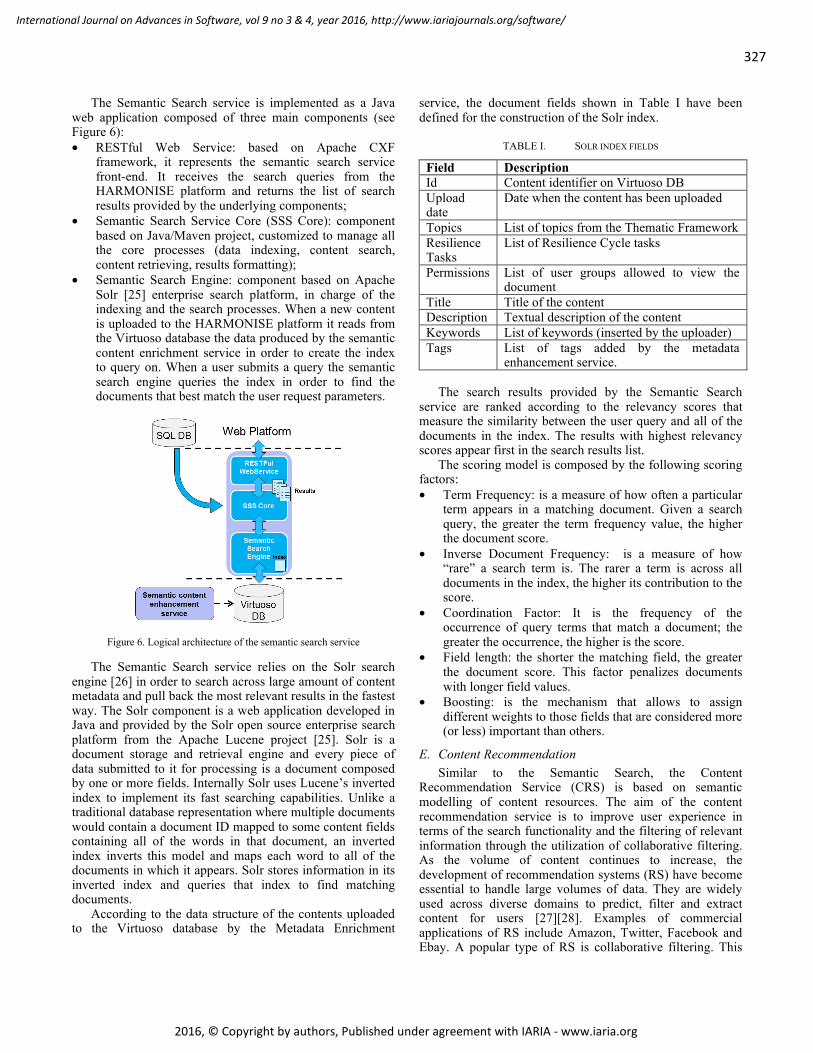
327
International Journal on Advances in Software, vol 9 no 3 & 4, year 2016, http://www.iariajournals.org/software/
2016, © Copyright by authors, Published under agreement with IARIA - www.iaria.org
The Semantic Search service is implemented as a Java web application composed of three main components (see Figure 6): • RESTful Web Service: based on Apache CXF
framework, it represents the semantic search service front-end. It receives the search queries from the HARMONISE platform and returns the list of search results provided by the underlying components;
• Semantic Search Service Core (SSS Core): component based on Java/Maven project, customized to manage all the core processes (data indexing, content search, content retrieving, results formatting);
• Semantic Search Engine: component based on Apache Solr [25] enterprise search platform, in charge of the indexing and the search processes. When a new content is uploaded to the HARMONISE platform it reads from the Virtuoso database the data produced by the semantic content enrichment service in order to create the index to query on. When a user submits a query the semantic search engine queries the index in order to find the documents that best match the user request parameters.
Figure 6. Logical architecture of the semantic search service
The Semantic Search service relies on the Solr search engine [26] in order to search across large amount of content metadata and pull back the most relevant results in the fastest way. The Solr component is a web application developed in Java and provided by the Solr open source enterprise search platform from the Apache Lucene project [25]. Solr is a document storage and retrieval engine and every piece of data submitted to it for processing is a document composed by one or more fields. Internally Solr uses Lucene’s inverted index to implement its fast searching capabilities. Unlike a traditional database representation where multiple documents would contain a document ID mapped to some content fields containing all of the words in that document, an inverted index inverts this model and maps each word to all of the documents in which it appears. Solr stores information in its inverted index and queries that index to find matching documents.
According to the data structure of the contents uploaded to the Virtuoso database by the Metadata Enrichment
service, the document fields shown in Table I have been defined for the construction of the Solr index.
TABLE I. SOLR INDEX FIELDS
Field Description Id Content identifier on Virtuoso DB Upload date
Date when the content has been uploaded
Topics List of topics from the Thematic Framework Resilience Tasks
List of Resilience Cycle tasks
Permissions List of user groups allowed to view the document
Title Title of the content Description Textual description of the content Keywords List of keywords (inserted by the uploader) Tags List of tags added by the metadata
enhancement service. The search results provided by the Semantic Search
service are ranked according to the relevancy scores that measure the similarity between the user query and all of the documents in the index. The results with highest relevancy scores appear first in the search results list.
The scoring model is composed by the following scoring factors: • Term Frequency: is a measure of how often a particular
term appears in a matching document. Given a search query, the greater the term frequency value, the higher the document score.
• Inverse Document Frequency: is a measure of how “rare” a search term is. The rarer a term is across all documents in the index, the higher its contribution to the score.
• Coordination Factor: It is the frequency of the occurrence of query terms that match a document; the greater the occurrence, the higher is the score.
• Field length: the shorter the matching field, the greater the document score. This factor penalizes documents with longer field values.
• Boosting: is the mechanism that allows to assign different weights to those fields that are considered more (or less) important than others.
E. Content Recommendation Similar to the Semantic Search, the Content
Recommendation Service (CRS) is based on semantic modelling of content resources. The aim of the content recommendation service is to improve user experience in terms of the search functionality and the filtering of relevant information through the utilization of collaborative filtering. As the volume of content continues to increase, the development of recommendation systems (RS) have become essential to handle large volumes of data. They are widely used across diverse domains to predict, filter and extract content for users [27][28]. Examples of commercial applications of RS include Amazon, Twitter, Facebook and Ebay. A popular type of RS is collaborative filtering. This

328
International Journal on Advances in Software, vol 9 no 3 & 4, year 2016, http://www.iariajournals.org/software/
2016, © Copyright by authors, Published under agreement with IARIA - www.iaria.org
type of RS analyses information on users’ preferences and predicts content to present to users based on their similarity to other users of the system [29]. Due to the information stored for users in their user profile, collaborative filtering was a natural selection to predict content to users based on similarities in their profiles. The developed CRS utilizes user profiles which are created and maintained by the HARMONISE platform
An overview of the CRS algorithm is provided in Figure 7. Figure 7 illustrates how user preference and user profile similarity are fused together along with a weighted sum to provide a ranked list of recommendation tailored to the user.
Figure 7. Overview of the CRS Algorithm Figure 7 details the various stages of the recommendation
process which includes the extraction of user details from the HARMONISE system through to the list of recommendations presented to the user at the end. A detailed overview of the CRS algorithm can be found in [30]. The user profiles contain information about user’s preferences and favorite content. It also includes the content item IDs that have been already recommended for that particular user. This information is then utilized when content recommendations are created for different users. The CRS is triggered by the HARMONISE platform through the ‘get recommendation’ method provided by the Semantic Layer REST API. The ID of the user is transmitted as a method parameter. Once the recommendation service receives the ID, it retrieves the user profile of the user from the database and analyses the information it contains. Various pieces of information are stored in the profiles such as topics of interest, group membership, languages, lines of investigation. Furthermore, content that the user has marked as favorite is stored as user preferences. The CRS then combines all the information about users’ preferences and profile information to find a target user neighborhood, and recommend new urban resilience tools/resources that might be of potential interest to him/her. To do this, firstly the ordered weighted average and uniform aggregation operators are applied to fuse user information and obtain global degrees of similarity between them using the formula below:
𝑠𝑖𝑚!!,! = 𝑂𝑊𝐴!(𝑠𝑖𝑚!
!,! , 𝑠𝑖𝑚!!,! , 𝑠𝑖𝑚!
!,!) profile between users 𝑖 and 𝑗 , and 𝑠𝑖𝑚! , 𝑠𝑖𝑚! , 𝑠𝑖𝑚! are the profiles line of investigation, interests and groups respectively which are aggregated using ordered weighted sum.
The similarity between the preferences of users 𝑢! and 𝑢! as 𝑠𝑖𝑚!
!,! ∈ [0,1] is also calculated using the Jaccard index 𝐽!!,! = 𝐽(𝐹! ,𝐹!) among the sets 𝐹! ,𝐹! ⊂ 𝐼 where 𝐼 are the
items marked favorite by 𝑢! and 𝑢! .This is schematically presented in Figure 8 from [30] below.
Figure 8. Schematic overview of User Preferences approach from [30]
When the profile similarity and preference similarity
between users have been calculated, these are then fused together resulting in a global degree of similarity between the target user 𝑢! and the rest of users in the system. We apply a uniform aggregation function to obtain the global similarity 𝑠𝑖𝑚!,! ∈ [0,1] between 𝑢! and 𝑢!.
The actual recommendation generation process is carried out by comparing the user profile data with the semantic content metadata descriptions. Similarly as in the search algorithm described in the previous section, the content items whose metadata is associated with e.g., terms, topics or research areas as contained by the user profile are included to the initial recommendation results. Of course, the content items that have already been recommended for the user are excluded from the results list. Subsequently, the recommendation results are analyzed using the ranking model introduced by the Semantic Search. Using K-nearest neighbors, the content items that gets the highest score is returned to the platform as the most highly recommended content item. This involves the generation of a recommendation list 𝑅! = 𝐶! ,… ,𝐶! consisting of content 𝐶 of size ℎ ∈ ℕ, ℎ ≪ 𝑛 is presented to users on the HARMONISE interface as illustrated in Figure 9. This list contains items 𝐶! = 𝑖! ∈ 𝐼 with the highest values for 𝑝(𝑢! , 𝑖!). This results in the user receiving a list of content ordered by rating value.
IV. USE CASE EXAMPLE The functionality of the SLH is demonstrated with a Use
Case example in which a user uploads a document into the HARMONISE content management platform and tries to retrieve it with the search functionality. Additionally, the recommendation service is verified by creating a user profile that is interested in topics relevant to the uploaded content. The content item used in the Use Case example is an electronic manual that presents tools to help assess the

329
International Journal on Advances in Software, vol 9 no 3 & 4, year 2016, http://www.iariajournals.org/software/
2016, © Copyright by authors, Published under agreement with IARIA - www.iaria.org
performance of buildings and infrastructure against terrorist threats and to rank recommended protective measures. This kind of guidance document is a typical representative of a content item managed by the HARMONISE platform.
Once the user has provided necessary input in the upload form the content description is transmitted to the Metadata Enrichment component that processes the collected data and forms an RDF metadata description of the content. It was noted that the returned semantic content metadata contained five keywords that are enriched with 81 broader or narrower and 26 similar terms. Moreover, the content is annotated with several categories defined by the Thematic Framework.
Once the enriched metadata is stored to the Semantic Metadata Repository, and indexed by the Semantic Search service, it can be tried to be retrieved with the search functionality. The content retrieval is tested with the ‘Resilience Search Wizard’ feature provided by the SLH. The wizard allows to define keywords and to select those categories from the Thematic Framework that are considered as relevant to the uploaded content. The utilized search parameters are shown in the search wizard screenshot illustrated in Figure 9.
Figure 9. Search parameter definition
As earlier explained, the search functionality is able to
sort the results based on their relevancy. Figure 10 represents the most highly ranked search results returned by the search service. As can be seen, the applied ranking algorithm identified the uploaded electronic manual document as the second relevant search result for the given search query. In total, the search functionality found 24 results with the defined search parameters.
In the final phase of the use case example, the Content Recommendation service is tested by creating a user profile and obtaining personalized recommendations. The user profile was created with 6 topics of interests of interest from a total of 13 topics namely: Point of Intervention, Management and Operation, Infrastructure type, Commercial Center, Hazard Type and Man Made Hazard. The user then marked 10 items of favorite content from a total of 156 items in the database.
Figure 10. The ranking of search results
These included content such as “Tools of Regional
Governance” and “Flood management in Linares Town”. For the first step in the recommendation algorithm, Jaccard index is utilized to compute the degree of similarity between the favourite content and profile information of the user entered and all the users of the HARMONISE system. In the second step, a KNN algorithm is applied to identify the 5 most similar neighbors. Based on neighbor users, we compute for each item not marked as a favorite by the user, a predicted rating. This is used to construct an ordered recommendation list to the target user, which in this case study was a list of 5 recommendations including documents based on “Key issues of Urban Resilience”, “Building urban resilience Details” and “Resilience: how to build resilience in your people and your organization”.
V. A REVIEW OF EQUIVALENT TOOLS AND APPROACHES As earlier discussed, at present there exist no similar
content management tools that would address the special requirements set by the domain of urban resilience. However, over the past few years approaches that provide equivalent functionalities as the HARMONISE platform and the SLH have been delivered by research community. Although these tools are designed for different application areas, they have many similar end-user requirements and technological characteristics. In this chapter a selection of these tools are being reviewed and analyzed.
To start with, [31] introduces a platform for curation technologies that is intended to enable human experts to get a grasp and understand the contents of large and heterogeneous document collections in an efficient way so that they can curate, process and further analyze the collection according to their sector-specific needs. Furthermore, the platform aims at automating such tasks as looking for information related to and relevant for the domain, learning the key concepts, selecting the most relevant parts and preparing the information to be used. As in the HARMONISE project, the platform is extended with a semantic web-layer that provides linguistic analysis and discourse information on top of digital content.
The target audience of the platform for curation technologies is knowledge workers who conduct research in specific domains with the goal of, for example, preparing museum exhibitions or writing news articles. Currently, the focus in the platform is on written documents but in future the aim is to improve the platform by improving its abilities
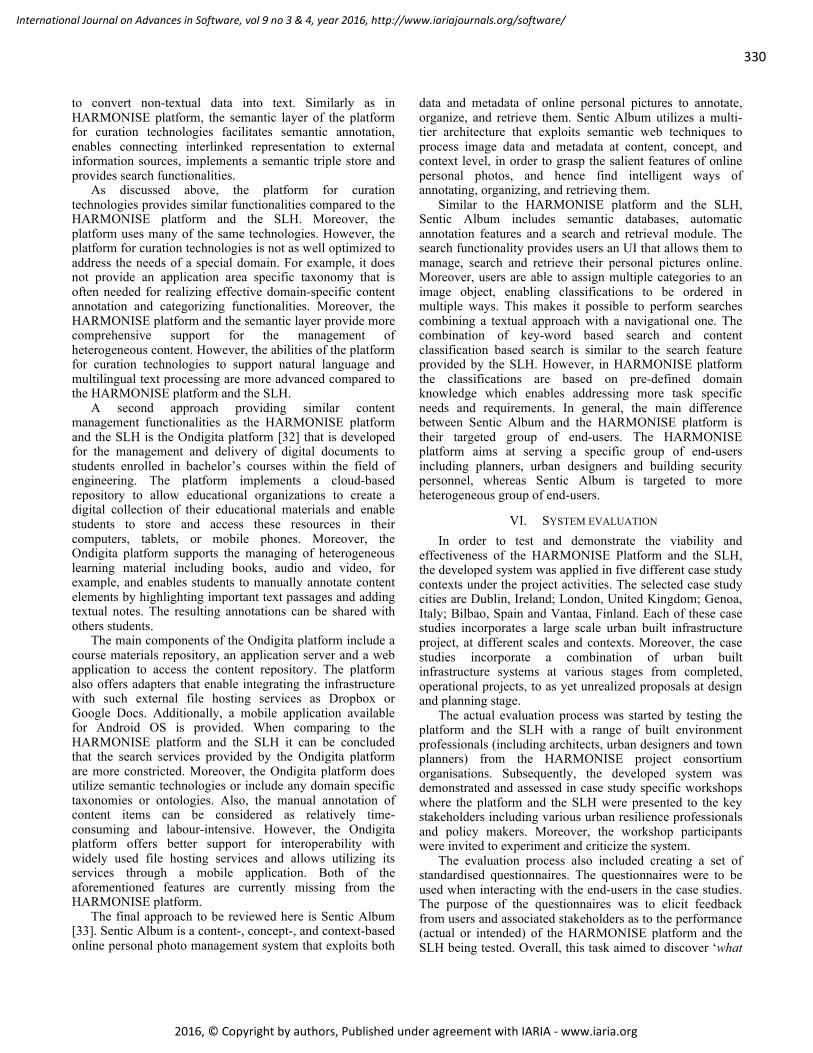
330
International Journal on Advances in Software, vol 9 no 3 & 4, year 2016, http://www.iariajournals.org/software/
2016, © Copyright by authors, Published under agreement with IARIA - www.iaria.org
to convert non-textual data into text. Similarly as in HARMONISE platform, the semantic layer of the platform for curation technologies facilitates semantic annotation, enables connecting interlinked representation to external information sources, implements a semantic triple store and provides search functionalities.
As discussed above, the platform for curation technologies provides similar functionalities compared to the HARMONISE platform and the SLH. Moreover, the platform uses many of the same technologies. However, the platform for curation technologies is not as well optimized to address the needs of a special domain. For example, it does not provide an application area specific taxonomy that is often needed for realizing effective domain-specific content annotation and categorizing functionalities. Moreover, the HARMONISE platform and the semantic layer provide more comprehensive support for the management of heterogeneous content. However, the abilities of the platform for curation technologies to support natural language and multilingual text processing are more advanced compared to the HARMONISE platform and the SLH.
A second approach providing similar content management functionalities as the HARMONISE platform and the SLH is the Ondigita platform [32] that is developed for the management and delivery of digital documents to students enrolled in bachelor’s courses within the field of engineering. The platform implements a cloud-based repository to allow educational organizations to create a digital collection of their educational materials and enable students to store and access these resources in their computers, tablets, or mobile phones. Moreover, the Ondigita platform supports the managing of heterogeneous learning material including books, audio and video, for example, and enables students to manually annotate content elements by highlighting important text passages and adding textual notes. The resulting annotations can be shared with others students.
The main components of the Ondigita platform include a course materials repository, an application server and a web application to access the content repository. The platform also offers adapters that enable integrating the infrastructure with such external file hosting services as Dropbox or Google Docs. Additionally, a mobile application available for Android OS is provided. When comparing to the HARMONISE platform and the SLH it can be concluded that the search services provided by the Ondigita platform are more constricted. Moreover, the Ondigita platform does utilize semantic technologies or include any domain specific taxonomies or ontologies. Also, the manual annotation of content items can be considered as relatively time-consuming and labour-intensive. However, the Ondigita platform offers better support for interoperability with widely used file hosting services and allows utilizing its services through a mobile application. Both of the aforementioned features are currently missing from the HARMONISE platform.
The final approach to be reviewed here is Sentic Album [33]. Sentic Album is a content-, concept-, and context-based online personal photo management system that exploits both
data and metadata of online personal pictures to annotate, organize, and retrieve them. Sentic Album utilizes a multi-tier architecture that exploits semantic web techniques to process image data and metadata at content, concept, and context level, in order to grasp the salient features of online personal photos, and hence find intelligent ways of annotating, organizing, and retrieving them.
Similar to the HARMONISE platform and the SLH, Sentic Album includes semantic databases, automatic annotation features and a search and retrieval module. The search functionality provides users an UI that allows them to manage, search and retrieve their personal pictures online. Moreover, users are able to assign multiple categories to an image object, enabling classifications to be ordered in multiple ways. This makes it possible to perform searches combining a textual approach with a navigational one. The combination of key-word based search and content classification based search is similar to the search feature provided by the SLH. However, in HARMONISE platform the classifications are based on pre-defined domain knowledge which enables addressing more task specific needs and requirements. In general, the main difference between Sentic Album and the HARMONISE platform is their targeted group of end-users. The HARMONISE platform aims at serving a specific group of end-users including planners, urban designers and building security personnel, whereas Sentic Album is targeted to more heterogeneous group of end-users.
VI. SYSTEM EVALUATION In order to test and demonstrate the viability and
effectiveness of the HARMONISE Platform and the SLH, the developed system was applied in five different case study contexts under the project activities. The selected case study cities are Dublin, Ireland; London, United Kingdom; Genoa, Italy; Bilbao, Spain and Vantaa, Finland. Each of these case studies incorporates a large scale urban built infrastructure project, at different scales and contexts. Moreover, the case studies incorporate a combination of urban built infrastructure systems at various stages from completed, operational projects, to as yet unrealized proposals at design and planning stage.
The actual evaluation process was started by testing the platform and the SLH with a range of built environment professionals (including architects, urban designers and town planners) from the HARMONISE project consortium organisations. Subsequently, the developed system was demonstrated and assessed in case study specific workshops where the platform and the SLH were presented to the key stakeholders including various urban resilience professionals and policy makers. Moreover, the workshop participants were invited to experiment and criticize the system.
The evaluation process also included creating a set of standardised questionnaires. The questionnaires were to be used when interacting with the end-users in the case studies. The purpose of the questionnaires was to elicit feedback from users and associated stakeholders as to the performance (actual or intended) of the HARMONISE platform and the SLH being tested. Overall, this task aimed to discover ‘what

331
International Journal on Advances in Software, vol 9 no 3 & 4, year 2016, http://www.iariajournals.org/software/
2016, © Copyright by authors, Published under agreement with IARIA - www.iaria.org
works’ on the ground in practice and learn about the user focussed process of implementation (what users want).
The survey was designed to focus on both the technical aspects of the platform as well as on the usability of the system. Importantly, the adopted approach incorporated a balance between quantitative and qualitative feedback. The results from this survey were to be used as feedback to designers so that improvements can be made to the platform.
The actual evaluation was divided into two phases: In phase 1 (between March and April 2015) a workshop was held in each case study area, led by the Case Study Leads (CSL’s). The purpose of these workshops was to present the HARMONISE concept and the platform to key stakeholders and to gather feedback on the work-in-progress version of the platform. Furthermore, the phase 2 (between mid-October and early December 2015) a second workshop was held in each case study area. During these second workshops, an improved version of the platform was presented to stakeholders.
For the first testing phase, the created questionnaires were circulated to each CSL’s in advance of the case study workshops as an online survey link. The survey was designed to be self-completed by the end user so each CSL then requested that all case study workshop participants complete this online questionnaire in their own time following the event. The survey was opened for responses for a period of one month following the workshop held in the case study location.
However, in some cases more emphasis was placed on gathering feedback within the context of the stakeholder workshops (rather than using the online questionnaire after the workshop). As such, feedback was gathered in two ways:
-‐ During the stakeholder workshops only – In this case, some questions from the online questionnaire were used to stimulate discussion among the stakeholders. The discussion was then recorded by the HARMONISE facilitators in a manner which closely matched the format of the questionnaire (to ensure that feedback could be analyzed in a relatively consistent manner).
- During the stakeholder workshops and using the online questionnaire – In this case, stakeholders reported their ‘first thoughts’ during the workshops, with some also choosing to report more detailed feedback after the event through the use of the online questionnaire
Following the completion of phase 1 of the testing process, many CSL’s reported that they had received the richest feedback during discussions as part of the workshops, with less feedback provided through the online survey. Indeed, many CSL’s reported that some stakeholders felt that the online survey was too lengthy, a factor which discouraged them from inputting feedback in a detailed manner. As a result, the testing approach for the second phase of testing was adjusted in two minor ways – 1. The questionnaire survey was further edited (with stakeholders encouraged to focus on providing qualitative comments) 2. A soft copy version of the survey was circulated to each workshop participant during the various workshops – with a
request for them to complete the survey during the workshop.
As discussed above, the evaluation was divided into two phases. In both parts questionnaires and end-user discussions were used to collect information about the abilities of the system to support urban resilience professionals and policy makers. The questionnaire included questions, for example, about perceived ease-of-use and perceived usefulness of the tool. Perceived usefulness that is defined as "the degree to which a person believes that using a particular system would enhance their job performance" and perceived ease-of-use that is defined as "the degree to which a person believes that using a particular system would be free from effort" were considered as important factors as they can determine whether people will accept or reject an emerging information technology [34].
The questionnaire used a five-level grading system where “Strongly agree” was the best and “Strongly disagree” the worst grade, with “Neither agree nor disagree” being average. Figure 11 summarizes the feedback on the platform, as gathered during evaluation phase 1.
Figure 11. Questionnaire results from the first evaluation stage.
In general, the first evaluation was useful and revealed
some extremely interesting points about the constructed system and enhanced the discovery of which features users find useful and easy to use, and which parts of the application still need to be improved. As depicted by the questionnaire results presented above, the usability and graphical user interface of the system was found to require improvements. Moreover, it was perceived as difficult to navigate through the platform. The search feature was also identified as deficient. In general, the first evaluation stage indicated that the platform and the SLH still require further development to reach its full potential.
The knowledge and experience gained from the first evaluation stage was utilized in the subsequent development of the HARMONISE platform and the SLH. The major improvements included, for example, re-designing the visual appearance, user interface and navigation of the platform. Moreover, the metadata management services of the SLH were completely redeveloped and optimized to better support the requirements set by the search feature. Finally, the

332
International Journal on Advances in Software, vol 9 no 3 & 4, year 2016, http://www.iariajournals.org/software/
2016, © Copyright by authors, Published under agreement with IARIA - www.iaria.org
utilized search algorithm was improved and integrated with the Thematic Framework based content classification mechanism.
The new versions of the HARMONISE platform and the SLH were tested in the second evaluation phase. Again, the actual testing was carried out in workshop sessions were end-users were allowed to test the system and fill in a questionnaire. Additionally, verbal feedback was collected from the workshop participants. Figure 12 summarizes the results from the second evaluation round.
Figure 12. Questionnaire results from the second evaluation stage. It should be noted that the chart for testing period 2 is not
directly comparable with the results of testing period 1 as most of the test participants were already somewhat familiar with the system in test period 2. Nevertheless, the chart for test period 2 provide a useful indication of progress in meeting stakeholder expectations of the platform, and in addressing some of the stakeholder concerns raised during testing stage 1. In more detail, the stakeholder feedback from testing stage 2 illustrates far greater user satisfaction with the various elements of the platform than was recorded during testing stage 1 – shown by the far higher percentage of stakeholders who ‘somewhat agreed’ or ‘strongly agreed’ with some of the key stated aims for the platform functionality.
VII. CONCLUSION In this work, we introduce a content management
platform for the domain of urban resilience. The platform aims at serving as a ‘one-stop-shop’ for resilience information and guidance offering a holistic view to urban resilience. Furthermore, the platform contains information and tools specifically designed to aid decision makers in enhancing the resilience of large scale urban built infrastructure.
The developed content management platform is extended with an additional information processing layer that utilizes semantic technologies to manage an extensive set of heterogeneous material that comes in different forms including tools, design guidance documentation and
specifications. Moreover, the developed semantic layer enables the creation of machine-understandable and machine-process able descriptions of content items. This has resulted in an improved shared understanding of information elements and interoperability.
With the effective utilization of Linked Data based analysis tools and domain specific content annotation mechanisms, the semantic layer offers task specific and personalized content management support for end-users. The enhanced intelligence has provided better understanding of urban resilience content, linkages between unstructured information and tools, and more sophisticated answers to users’ various needs. Furthermore, the recommendation service provides the functionality to predict relevant content to the user of the system using our collaborative filtering approach. This approach is able to avail of the rich user data available in terms of profile information and also content preference information resulting in a set of recommendations tailored to individual users.
The developed HARMONISE platform and the SLH have been tested by HARMONISE project partners and other invited domain specialists. Additionally, several case study stakeholders have evaluated the system in terms of usability, perceived usefulness and the relevancy of received search and recommendation results. The performed evaluations have provided valuable information about the deficiencies and strengths of the HARMONISE platform and SLH.
The future work includes further refining the HARMONISE platform and the SLH on the basis of the feedback received from the evaluation process. Additionally, the graphical appearance of the platform’s user interface as well as the usability of individual components will be improved.
REFERENCES [1] I. Niskanen, M Murtonen, F Browne, P. Davis and F.
Pantisano, "A Semantic Layer for Urban Resilience Content Management," 8th International Conference on Information, Process, and Knowledge Management (eKNOW 2016), Venice, Italy, April 24-28, 2016.
[2] B. Boiko, Content management bible, John Wiley & Sons, 2005.
[3] S. Das, L. Girard, T. Green, L. Weitzman, A. Lewis-Bowen, and T. Clark, “Building biomedical web communities using a semantically aware content management system,” Briefings in bioinformatics, 10(2), pp. 129-138, 2009.
[4] N. W. Y Shao, S. J. H Yang, and A. Sue, "A content management system for adaptive learning environment," Multimedia Software Engineering, Proceedings. Fifth International Symposium on, IEEE, 2003.
[5] N. Mehta, Choosing an Open Source CMS: Beginner's Guide, Packt Publishing Ltd, 2009.
[6] D. Dicheva and D. Christo, "Leveraging Domain Specificity to Improve Findability in OER Repositories," Research and Advanced Technology for Digital Libraries. Springer Berlin Heidelberg, pp. 466-469, 2013.
[7] S. K. Patel, V. R. Rathod, and S. Parikh, "Joomla, Drupal and WordPress-a statistical comparison of open source CMS," Trendz in Information Sciences and Computing (TISC), 3rd International Conference on. IEEE, 2011.

333
International Journal on Advances in Software, vol 9 no 3 & 4, year 2016, http://www.iariajournals.org/software/
2016, © Copyright by authors, Published under agreement with IARIA - www.iaria.org
[8] C. Dorai and S. Venkatesh, "Bridging the semantic gap in content management systems," Media Computing. Springer US, pp. 1-9, 2002.
[9] J. L. Navarro-Galindo and J. Samos, "The FLERSA tool: adding semantics to a web content management system," International Journal of Web Information Systems 8.1: pp. 73-126, 2012.
[10] A. Kohn, F. Bry, and A. Manta, "Semantic search on unstructured data: explicit knowledge through data recycling," Semantic-Enabled Advancements on the Web: Applications Across Industries, 194, 2012.
[11] D. R. Karger and D. Quan, "What would it mean to blog on the semantic web?," The Semantic Web–ISWC 2004. Springer Berlin Heidelberg, pp. 214-228, 2004.
[12] The HARMONISE project (Available online at: http://harmonise.eu/) [accessed: 13.4.2016]
[13] Linked Data (Available online at: http://linkeddata.org/) [accessed: 13.4.2016]
[14] Drupal (Available online at: https://www.drupal.org/) [accessed: 13.4.2016]
[15] WordPress (Available online at: https://wordpress.org/) [accessed: 13.4.2016]
[16] S. Purcell, W. Hynes, J. Coaffee, M. Murtonen, D. Davis, and F. Fiedrich, “The drive for holistic urban resilience,” 9th Future Security, Security Research Conference, Berlin Sep. 16- 18, 2014.
[17] A Vailaya, M. A. Figueiredo, A. K. Jain, and H. J. Zhang, “Image classification for content-based indexing,” Image Processing, IEEE Transactions on, 10(1), pp. 117-130, 2001.
[18] R. García, J. M. Gimeno, F. Perdrix, R. Gil, and M. Oliva, “The rhizomer semantic content management system,” In Emerging Technologies and Information Systems for the Knowledge Society pp. 385-394, Springer Berlin Heidelberg, 2008.
[19] M. Hausenblas, “Exploiting linked data to build web applications," IEEE Internet Computing 4, pp. 68-73, 2009.
[20] ONKI - Finnish Ontology Library Service (Available online at: http://onki.fi/) [accessed: 13.4.2016]
[21] DBpedia (Available online at: http://dbpedia.org/) [accessed: 13.4.2016]
[22] OpenCalais (Available online at: http://www.opencalais.com/) [accessed: 13.4.2016]
[23] Virtuoso Universal Server (Available online at: http://semanticweb.org/wiki/Virtuoso) [accessed: 13.4.2016]
[24] O. Erling and I. Mikhailov. "RDF Support in the Virtuoso DBMS," Networked Knowledge-Networked Media. Springer Berlin Heidelberg, pp. 7-24, 2009.
[25] Solr (Available online at: http://lucene.apache.org/solr/) [accessed: 13.4.2016]
[26] Apache Lucene Core (Available online at: https://lucene.apache.org/core/) [accessed: 13.4.2016]
[27] F. Ricci, L. Rokach, and B. Shapira, Introduction to recommender systems handbook, Springer, 2011.
[28] G. Adomavicius and Y. Kwon, “New recommendation techniques formulticriteria rating systems,” IEEE Intelligent Systems, vol. 22, no. 3, pp. 48–55, 2007.
[29] M. Ekstrand, J. Riedl, and J. Konstan, “Collaborative filtering recommender systems,” Human-Computer Interaction, vol. 4, no. 2, pp. 81–173, 2010.
[30] I. Palomares, F. Browne, H. Wang, and P. Davis, “A collaborative filtering recommender system model using owa and uninorm aggregation operators,” in Intelligent Systems and Knowledge Engineering (ISKE), 2015 10th International Conference on, 2015, pp. 382–388.
[31] F. Sasaki and A. Srivastava, “Towards a Platform for Curation Technologies: Enriching Text Collections with a Semantic-Web Layer,” The Semantic Web: ESWC 2016 Satellite Events, Heraklion, Crete, Greece, May 29–June 2, 2016, Revised Selected Papers, 9989, 65.
[32] R. Mazza, A. Baldassari and R. Guidi, “Ondigita: A Platform for the Management and Delivery of Digital Documents,” International Association for Development of the Information Society, 2013.
[33] E. Cambria and A. Hussain, “Sentic album: content-, concept, and context-based online personal photo management system,” Cognitive Computation, vol. 4, no. 4, pp. 477-496, 2012.
[34] F.D. Davis, “Perceived usefulness, perceived ease of use, and user acceptance of information technology,” MIS quarterly, 13 (3), pp. 319-340, 1989.

334
International Journal on Advances in Software, vol 9 no 3 & 4, year 2016, http://www.iariajournals.org/software/
2016, © Copyright by authors, Published under agreement with IARIA - www.iaria.org
Four Public Self-Service Applications: A Study of the Development Process, User Involvementand Usability in Danish Public Self-Service Applications
Jane Billestrup, Jan StageInstitute of Computer Science
Aalborg UniversityAalborg, Denmark
jane,[email protected]
Marta LarusdottirSchool of Computer Science
Reykjavik UniversityReykjavik, Iceland
Abstract— This paper presents a case study of four softwarecompanies in Denmark developing self-service applications forthe same self-service area. This study outlines the process ofhow the four companies developed their self-serviceapplications and a usability study of the completed softwaresolutions. In this study, we have analysed the customer andend-user involvement and compared these results to the resultsof the usability evaluations. The main findings show that theusability varied in the four cases, and the ones who had themost customer involvement from case workers showed thehighest number of usability problems in the self-servicesolutions for the citizens. We discuss the user-centred designapproaches used, the drawbacks and benefits of customer anduser involvement, and case workers acting as citizenrepresentation during the development process of the software.
Keywords-Case Study; Self-Service Applications; Usability;Development Process; User-Centred Design; SoftwareDevelopment
I. INTRODUCTION
This paper is an extended version of the paper “A casestudy of four IT companies developing usable public self-service solutions” [1].
European countries are currently developing digital self-service solutions for their citizens. These efforts are beinglaunched to improve citizens' self-services and to reducecosts [2]. Though public self-services have been on theagenda in many countries for years, getting the end-users touse these applications is not easily achieved. For citizens toaccept public digital services and websites, these sites needto have a high degree of usability for the citizens to acceptthe public digital services and websites [3]. Wangpipatwonget al. found that public digital websites in Thailand lackusability due to poor design and they recommend focusingmore on the needs of the citizens to ensure that they will usethese websites continuously [4].
The Digital Economy and Society Index (DESI)describes the level of digitalisation of the countries in EU[2]. The digitalisation level is measured in five areas,connectivity, human capital, use of the Internet, integrationof digital technology, and digital public services, respectively[2]. The level of digitalisation varies in the countries in EU,from Romania, Bulgaria and Greece at the bottom toSweden, Finland, and Denmark at the top [2]. Denmark isone of the top 3 countries in regards to all digitalisation areas
in EU and is one of the leading countries in the world inregards to the level of digitalisation [2].
Denmark has a population of 5.6 million people and isdivided into 98 municipalities as a single point of contact forcitizens in regards to the public sector [5]. In 2012, adigitalisation process was launched with the goal that by theend of 2015, 80% of all communication between citizens andthe municipalities should be conducted digitally. Thisdigitalisation also included digital public self-serviceapplications [6].
Until 2012, a contract based approach was used fordeveloping digital public services, where the softwarecompanies competed by bidding. As of 2012, the softwarecompanies no longer had to put in a bid. Instead, they haveto compete with other companies about selling their self-service applications to the municipalities. For the individualmunicipalities, it means that they can choose betweencompeting designs for each digitalisation area for the citizenself-service applications.
To support the Danish initiative, the joint IT organisationof the municipalities in Denmark developed two set of usercentred guidance materials in 2012, to help the self-serviceproviders in developing user-friendly self-serviceapplications for the citizens [7]. Similar initiatives have beentaken in other countries like the United States, UnitedKingdom, and South Africa [8] [9] [10].
Development of self-service applications for all citizensinvolves a broad array of different stakeholders, includingcitizens, public institutions such as municipalities, supportorganisations like the joint IT organisation of themunicipalities, IT companies that produce the applicationsand third party purveyors that the public institutions use toprovide services to the citizens. In Denmark, the joint ITorganisation of the municipalities has created guidelines toensure that public digital self-service applications andwebsites are usable for all citizens [6].
From the self-service providers' point of view, focus onusability will increase the price of the product, making thedeveloped solution harder to sell [11]. But studies show thatthe quality of the software and the cost are complementary,e.g., [12] [13]. To get public self-service providers to focuson usability, it has to be made a requirement. Both Jokela etal. [14] and Mastrangelo [15] describe the importance ofusability being specified in the requirements specificationdocument. Mastrangelo describes that public administrationneeds guidelines and guidance to get usability placed in therequirements to get the intended impact [15].
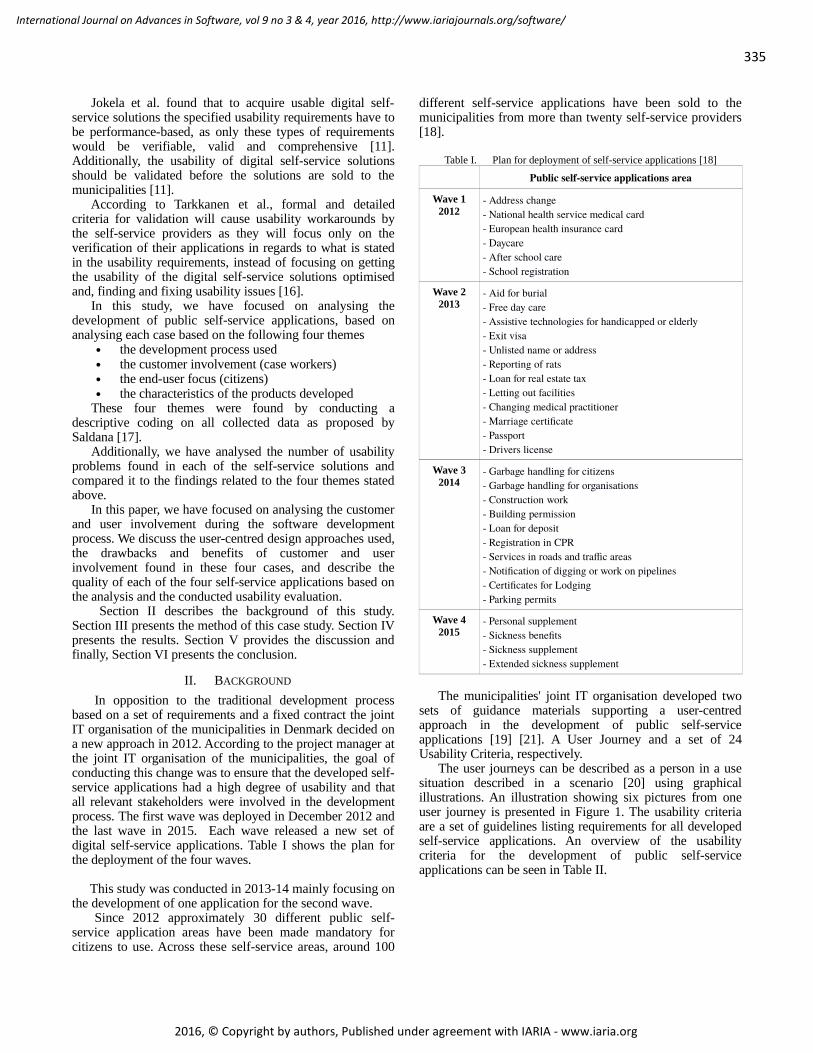
335
International Journal on Advances in Software, vol 9 no 3 & 4, year 2016, http://www.iariajournals.org/software/
2016, © Copyright by authors, Published under agreement with IARIA - www.iaria.org
Jokela et al. found that to acquire usable digital self-service solutions the specified usability requirements have tobe performance-based, as only these types of requirementswould be verifiable, valid and comprehensive [11].Additionally, the usability of digital self-service solutionsshould be validated before the solutions are sold to themunicipalities [11].
According to Tarkkanen et al., formal and detailedcriteria for validation will cause usability workarounds bythe self-service providers as they will focus only on theverification of their applications in regards to what is statedin the usability requirements, instead of focusing on gettingthe usability of the digital self-service solutions optimisedand, finding and fixing usability issues [16].
In this study, we have focused on analysing thedevelopment of public self-service applications, based onanalysing each case based on the following four themes
the development process used the customer involvement (case workers) the end-user focus (citizens) the characteristics of the products developed
These four themes were found by conducting adescriptive coding on all collected data as proposed bySaldana [17].
Additionally, we have analysed the number of usabilityproblems found in each of the self-service solutions andcompared it to the findings related to the four themes statedabove.
In this paper, we have focused on analysing the customerand user involvement during the software developmentprocess. We discuss the user-centred design approaches used,the drawbacks and benefits of customer and userinvolvement found in these four cases, and describe thequality of each of the four self-service applications based onthe analysis and the conducted usability evaluation.
Section II describes the background of this study.Section III presents the method of this case study. Section IVpresents the results. Section V provides the discussion andfinally, Section VI presents the conclusion.
II. BACKGROUND
In opposition to the traditional development processbased on a set of requirements and a fixed contract the jointIT organisation of the municipalities in Denmark decided ona new approach in 2012. According to the project manager atthe joint IT organisation of the municipalities, the goal ofconducting this change was to ensure that the developed self-service applications had a high degree of usability and thatall relevant stakeholders were involved in the developmentprocess. The first wave was deployed in December 2012 andthe last wave in 2015. Each wave released a new set ofdigital self-service applications. Table I shows the plan forthe deployment of the four waves.
This study was conducted in 2013-14 mainly focusing onthe development of one application for the second wave.
Since 2012 approximately 30 different public self-service application areas have been made mandatory forcitizens to use. Across these self-service areas, around 100
different self-service applications have been sold to themunicipalities from more than twenty self-service providers[18].
Table I. Plan for deployment of self-service applications [18]
Public self-service applications area
Wave 12012
- Address change- National health service medical card- European health insurance card- Daycare - After school care - School registration
Wave 22013
- Aid for burial- Free day care- Assistive technologies for handicapped or elderly - Exit visa- Unlisted name or address- Reporting of rats- Loan for real estate tax- Letting out facilities - Changing medical practitioner- Marriage certificate- Passport- Drivers license
Wave 32014
- Garbage handling for citizens- Garbage handling for organisations- Construction work- Building permission- Loan for deposit- Registration in CPR- Services in roads and traffic areas- Notification of digging or work on pipelines- Certificates for Lodging- Parking permits
Wave 42015
- Personal supplement- Sickness benefits- Sickness supplement- Extended sickness supplement
The municipalities' joint IT organisation developed twosets of guidance materials supporting a user-centredapproach in the development of public self-serviceapplications [19] [21]. A User Journey and a set of 24Usability Criteria, respectively.
The user journeys can be described as a person in a usesituation described in a scenario [20] using graphicalillustrations. An illustration showing six pictures from oneuser journey is presented in Figure 1. The usability criteriaare a set of guidelines listing requirements for all developedself-service applications. An overview of the usabilitycriteria for the development of public self-serviceapplications can be seen in Table II.

336
International Journal on Advances in Software, vol 9 no 3 & 4, year 2016, http://www.iariajournals.org/software/
2016, © Copyright by authors, Published under agreement with IARIA - www.iaria.org
Figure 1. Six pictures from one user journey [19]
Table II. 24 usability criteria [21]Language and text
1 Texts should be short and precise without containing legalised or technical terms
2 Text should be action-oriented and guide the citizens to fill out the form
3 Citizens should be informed of which information will be needed, before filling out the form
4 Citizens can access additional information if needed when filling out the form
5 If an error is made it should be made very clear to the citizens what they did wrong
6 Error messages should be in DanishProgress and flow
7 The form should be organised in logical steps
8 Before filling out the form, the extent of the form should be clear to the citizens
9 When filling out the form, the citizen knows the progress made and how many steps are left
10 A receipt should be made after finishing filling out the form
11 The receipt should also be sent by email to the citizens
12 After submitting the form, the next steps should be clear to the citizen Data and information
13 If login is required, NemLogin (National Danish Identity Service) should be used
14 Existing data should be reused as much as possible; citizens should not provide the same information more than once
15 A summary is shown before submitting the form
16 Submitting a form should only be possible if all required information is provided
17 The solution should validate the information provided by the citizens when possible
18 The solution should adapt questions to prior answers given, when possible Design and accessibility
19 It should be made clear to the citizens when are beginning to fill out a form
20 There should be a clear distinction between buttons like yes/no, forward/backwards, and the positioning should be continuous through the form
21 The authority behind the form should be clear
22 Navigating in the form should be possible both using mouse and keyboard
23 The form should be filled out by citizens who does not possess a high degreeof IT skills
24 The solution meet relevant accessibility criteria for self-service solutions
The overall purpose of these materials was to provide theIT self-service providers with tools to keep a focus on thecitizens and their needs to ensure that the developed self-service applications were usable for all citizens. The joint ITorganisation of the municipalities functioned in a supportingrole during the development process. All interested ITcompanies could decide which specific services they wantedto develop. The services were developed and made availablefor all of the 98 municipalities in Denmark. Themunicipalities buy individual solutions and are not bound byone self-service provider but can choose freely between alldeveloped solutions in each area.
III. METHOD
We have conducted an empirical study of four competingIT development companies implementing usable digital self-service solutions for the same application area. Next, the fourcases are presented, and the data collection and analysis aredescribed in more detail.
A. The Cases
Below, the four companies are described. The companieshave developed similar solutions and are competitorsregarding the 98 municipalities in Denmark who are thepotential customers. The SME scale (small and mediumscale enterprise) [22] has been used to categorise the size ofthe four companies involved in this case study, in regards tothe number of employees and turnover. The SME scale isshown in Table III.
Table III. SME Scale [22]
The four companies were chosen because they were theonly companies developing applications for this particularself-service area, and the companies and their developedself-service solutions were different in terms of maturity ofthe company and if the company was developing a newsolution or was optimising an existing solution. Theapplications for this self-service area had some degree ofcomplexity, and the self-service area would be relevant to alltypes of citizens, though mainly older citizens. Next, the fourcompanies are categorised.
Case A is a micro/small company in regards to the SMEscale and the turnover and number of employees. Thecompany has not previously developed other public digitalself-service solutions, so it is categorised as immature. Theirdigital self-service solution is categorised as new for thesame reason. This company is an independent consulting andsoftware company.
Case B is a large company in regards to the SME scale.The company is categorised as mature in regards to digitalself-service solutions in general as they have developedseveral public digital self-service solutions previously. This

337
International Journal on Advances in Software, vol 9 no 3 & 4, year 2016, http://www.iariajournals.org/software/
2016, © Copyright by authors, Published under agreement with IARIA - www.iaria.org
self-service solution is categorised as new, though theyalready have an existing solution, as they redid both theanalysis and design phase, before developing this solution.This company has departments all over Scandinavia andcreates and sells software solutions to several differentmarkets.
Case C is a large company on the SME scale. Thecompany is described as both immature and mature inregards to digital self-service solutions, as they areexperienced in regards to developing self-serviceapplications. This area of application is relatively new tothem, though having an existing solution in this self-servicearea. This company has departments all over Scandinaviaand creates and sells software solutions to different markets.Case D is a large company on the SME scale. The companyis described as mature in regards to digital self-servicesolutions and has developed digital self-service applicationsfor years. For this self-service area, their self-service solutionis an optimisation of an existing self-service application. Thiscompany is an independent consulting and softwarecompany. Table IV shows the placement of the four cases inregards to maturity and if the digital self-service solution wasnew or an optimisation of an existing solution.
Table IV. Categorisation of the four companies and self-solutions inregards to maturity of the company and if the self-service solution is new or
an optimisation
We have defined the organisation's maturity according totheir experience developing self-service applications ingeneral. We defined the self-service application as new if theorganisation had no existing self-service solution in this areaor had an existing solution, but the problem area was re-analysed before redesigning the system. Otherwise, the self-service solution was defined as an optimisation of an existingself-service application.
The data used for this categorisation was collected fromeach of the companies by the conducted interviews describedin the following section.
B. Data Collection
This section describes the process of the data collection.The first sub-section describes how we collected the data thatwas analysed to determine the scope of this study in regardsto which self-service area to focus on, and which companiesit would be relevant to include in the study. The second sub-section describes the data collection for this study, which isthe results documented in this paper.
1) Exploratory PreparationAll data was gathered over a period of one year.
Qualitative interviews were conducted by phone with projectmanagers from 11 of 12 identified digital self-serviceproviders for all self-service providers identified for the
second wave at this time. The primary objective was to learnhow self-service providers were accepting and using theuser-centred materials and learn about each company andtheir development approach [23]. Additional data wasgathered on how the user-centred requirements were used,and how existing requirements were redesigned [24]. Allinterviews were transcribed and analysed by coding, usingDedoose [25].
This analysis leads to narrowing the focus on one publicself-service area with four identified self-service providers.
2) Gathering the DataFor this case study, we had one half-day meeting with
each of the four companies. The people present at the firstmeeting had the following job titles; for case A; CEO,Project Manager, and Usability Expert. For case B; ProductOwner. For case C, Business Developer and, SeniorManager. For case D; Chief Consultant and, Chief ProductOwner. The agenda for these meetings was an introduction tothis study including a discussion of their gain ofparticipating, as we offered inputs on their self-servicesolution and conducting a usability evaluation at the end ofthe process. The results of these activities would be usable toimprove the four companies self-service applications.
Before the meetings, we had identified the roles of thepeople we would like to interview, as these functions werenamed differently in each company and some people wouldhave more than one of these roles. The identified roles werethe following; project manager, developer, interface designer,and the person responsible for the user experience andusability of the public self-service application. These roleswere chosen to ensure to get different views of thedevelopment process and end-product, in relation to the userfocus and involvement.
After the introduction the interviewee presented his/hercompany overall and, more specifically, how thepractitioners were developing this chosen self-serviceapplication, including describing the development processand method, collaboration with stakeholders and end-userinvolvement. The product owner or project manager alsogave a demonstration of the self-service application in itscurrent state and handed over relevant internal documentsdescribing their development process and showing designdocuments. Lastly, it was discussed which people theysuggested for further interviews in the next part of our studyto ensure we would cover all perspectives. At the meetings,we conducted a list of people covering the following rolespreviously described. We interviewed 14 people distributedacross the four companies.
The purpose of the interviews was to determine currentpractice at each of the four companies in regards to customerand citizen involvement, and how the end-users were takeninto consideration during the design and developmentprocess. We found that interviewing people with differentroles and responsibilities would provide us with more dataon different perspectives and areas of expertise inside eachcompany. All interviews were conducted as semi-structuredqualitative interviews as described by Kvale [26]. Theinterviews were conducted by phone and transcribedafterwards.

338
International Journal on Advances in Software, vol 9 no 3 & 4, year 2016, http://www.iariajournals.org/software/
2016, © Copyright by authors, Published under agreement with IARIA - www.iaria.org
Table V shows the number of people involved in thisstudy, from each of the four companies.
Table V. Number of participants from each company in each phase
The number of participants from each company is shownfor all phases of this study. The number in () represents newpeople, who were not part of the previous step, e.g., case Dhad two people present at the preparation meeting, and fiveemployees were interviewed. Of these five people, threewere not present at the preparation meeting. At the workshopwith case D, two people were present, of these two, one hadnot been present at the preparation meeting and was notinterviewed.
Table VI. Shows the data collection process of the exploratory preparation and for this study
The workshops were used to discuss the results from theinterviews in regards to their user-centred approach and howthe user-centred materials developed materials from the jointIT organisation of the municipalities were used during thedevelopment process, and to clarify our results from theinterviews and preparation meetings.
3) Usability Evaluation of ProductsTo evaluate if the development process had resulted in
usable self-service applications for the citizens, a usabilityevaluation of these four self-service solutions wasconducted. This evaluation was conducted as a think-aloudusability evaluation in a usability laboratory, with eight testpersons. For the evaluations, all test persons received thesame instructions explaining what they were meant to doduring the evaluation, e.g., conduct a set of tasks and thinkaloud during the evaluation. All participants received thesame tasks, and evaluated all four systems, but evaluatedthem in a different order to even out any bias.
The test persons were chosen to represent a user segmentas large as possible. Our test persons ranged in age and haddifferent educational backgrounds. The test persons variedin skill level and experience with computers, though all usethe Internet on a regular basis. Most test persons hadexperience with other public digital self-service areas but
not this specific area. An overview of the test persons can befound in Table VII.
All test persons received a small gift after participating inthe evaluation. After conducting the evaluations, the data wasanalysed using the method Instant Data Analysis, as thismethod is also used på practitioners (IDA) [27]. Theusability problems were categorised after the criteriadescribed in Table 8. The problems were categorised inregards to levels of confusion and frustration of theparticipants, and whether they were able to fill out the formscorrectly. These criteria and categorisations were describedfurther by Skov and Stage [28].
Table VII. Overview of the demography of the test persons
Testperson
Gender Age Education Experience withpublic services
TP1 F 44 High school degree(early retirement because of health issues)
Yes, also for this application type, and done digitally
TP2 F 31 PhD-student inSocial science
Yes, for other service areas, and done digitally
TP3 M 52 Accountant Yes, for other service areas, and done digitally
TP4 F 64 Retired school teacher
Yes, for other service areas, but not digitally
TP5 F 66 Technical Assistant Yes, also for this servicearea, and done digitally
TP6 M 30 Msc. Engineering Yes, for other service areas, and done digitally
TP7 M 65 Retired computer assistant
Yes, for other service areas, and done digitally
TP8 M 22 Bachelor student in computer science
No experience
Table VIII. Defining the Severity of the Usability Problems in the DigitalSelf-Service Solutions [28]
Slowed down
Understanding Frustration or confusion
Test monitor
Critical Hindered in solving the task
Does not understand how the information in the system can be used for solving the task
Extensive levelof frustration orconfusion – canlead to a full stop
Receives substantial assistance, could not have solved the task without it
Serious Delayed in solving the task
Does not understand how a specific functionality operates or is activated
Is clearly annoyed by something that cannot be done or remembered or something illogical that one must do
Receives a hint,and can solve the task afterwards
Cosmetic Delayed slightly in solving the task
Do actions without being able to explain why (you just have to do it)
Only small signs of frustration or confusion
Is asked a question that makes him come up with the solution

339
International Journal on Advances in Software, vol 9 no 3 & 4, year 2016, http://www.iariajournals.org/software/
2016, © Copyright by authors, Published under agreement with IARIA - www.iaria.org
C. Data Analysis
The data was analysed with regard to the differentperspectives of each interviewee and their job function to getan idea of what each company did during the developmentprocess.
The aim of these activities was to study the developmentprocess of the four companies developing the digital self-service solutions in this specific self-service area, into moredetail. The cases were analysed exploratively.
We completed a content analysis of relevant documentsfrom the companies. Both, interviews and documents wereanalysed using descriptive coding [17], and Dedoose [25] asa tool. All coding was conducted by one researcher andcategories were discussed and verified by another researcher.
IV. RESULTS
In this section, we present our results. Our findings aredivided into four subsections for each case, focusing on thedevelopment process, customer involvement, end-user focusand the final product, then the results are compared betweenthe four cases for each focus area. All results are reportedfrom the perspectives of the companies and their interviewedemployees and the documents we got from them.
A. Case A
1) Development ProcessCompany A uses an agile development method and
primarily in accordance with Scrum [29]. They describe theirdevelopment process as flexible. “Our development methodis agile, primarily Scrum. We use a pragmatic approach anda flexible model, meaning we can add features quite late inthe process.” They describe choosing this approach as itmakes the development process easier and more dynamic,also, needing fewer people working on each project, e.g.,they primarily have a project manager involved in thedevelopment process, who is also the designer and thedeveloper. This is doable because they can make changesquite late in the process and they feel that correcting errorsare not a big deal. “We are not afraid of making mistakes; wedon't have a great need to get everything right the firsttime”. One municipality was involved giving the company agreater understanding of the entire field of application.
2) Customer InvolvementThe company collaborated with one municipality as a
customer and stakeholder. It was insisted that the involvedpersonnel should be case workers who understood their ownand the citizens' needs and not necessarily people with ITskills. From the case workers, they have learned about thefield of application. “We held a new workshop with themunicipality every couple of weeks; here we created mock-ups that we used to design a new prototype, which wasevaluated and redesigned at the next workshop, [...] until wewere satisfied with the final prototype”. The Intervieweeswere confident that they had developed a solution that livesup to the wishes and needs of their on-site customer but isless confident that their solution is covering the needs ofother municipalities. “We have discussed if we should havecreated a standardised solution covering the needs of as
many municipalities as possible.” It was described as aproblem as they were not aware of the fact that theinterpretations of legislation are not the same in allmunicipalities.
3) End-User FocusThe citizens are not involved in the development process,
but the company describes taking them into consideration byensuring that the procedures for sending an application are assimple as possible. “We have created the solution so itshould be understandable for all types of people. We have agood feeling here and our self-service application have beenverified several times (by case workers)”. They have built anapplication that in the simple cases can send a decision backto the applicant right away without a case worker having togo through the application first. One interviewee alsodescribed that their primary focus is on the customer and notthe citizens. “We have been focusing on the customers'needs and work procedures; it has been important for us tounderstand what they wanted the citizens to do”. Thisperspective was chosen because the municipalities are thepaying customers and not the citizens.
4) ProductsIt was perceived as a strength that they have developed a
“whole solution” covering both the necessities for the caseworkers and the citizens. “Our solution has a good flow forthe citizens with understandable screen displays. It is notheavy on wording, and we only ask for information that isrelevant for the municipalities to keep things as simple aspossible.”
The company also identified some weaknesses in regardsto their digital self-service application. They described thatthe fact that they only collaborated with one municipalitymight have been an issue, although they did not see it as areal option for them to have involved 3-5 municipalities inthe development process. The company also recognises thatthere might be usability issues in the digital self-serviceapplication but argues that this is substantiated in what themunicipalities are willing to pay for. “Reality is just differentthan theory. If you want to pay for it, you can get the greatsolutions focused on usability, but that is not what themunicipalities want to pay for”. One interviewee describedthat if the customers do not care about usability they will notfocus on that either.
B. Case B
1) Development ProcessCompany B uses Scrum [29] as their development
method, and they use an adjusted version of the projectmanagement method PRINCE2 [30].
One interviewee described that the company developsone solution to fit all municipalities. “Our aim is to makeone solution to fit all, [...] We only create products were wekeep the property rights [...], so we can sell the same productto several customers”. All digital self-service applicationsare built in a module-based platform. This approach ischosen to give a certain amount of flexibility in regards tochanging the design during the development process or whenthe system is tested by municipalities. Municipalities areinvolved early in the process.

340
International Journal on Advances in Software, vol 9 no 3 & 4, year 2016, http://www.iariajournals.org/software/
2016, © Copyright by authors, Published under agreement with IARIA - www.iaria.org
2) Customer InvolvementThe primary focus of the digital self-service application is
on the back-end of the system, and to ease the workload ofthe case workers. “Our primary focus is to simplify theworking procedures for the case workers. Otherwise, thiswould never be a priority for the municipalities”. Beforedeveloping this solution, the company hosted workshopswith five municipalities that are already customers, with thepurpose of analysing the working procedures, used forcreating a specification of requirements and a business case.“On the first workshop we are not presenting anything,typically we say – we don't know anything, tell us about yourwork […] we use these workshops to learn how we digitallycan support the digital workflow.” This information is usedin the development phase, where the first iteration isdeveloped, and a prototype is created. The prototype waspresented at the next workshop to case workers from themunicipalities involved in the development process. Theprototype shows the mapping when a citizen fills in a formand until it lands with the case worker. One interviewee alsodescribed sending emails to all municipalities that areexisting customers, asking the case workers to answerquestions in regards to their workflow.
3) End-User FocusThe company does not involve citizens in the
development process, but two interviewees describedinvolving the municipalities and case workers as arepresentation of the citizens' needs. “The municipalitiesgive us feedback in regards to what is not working for thecitizens, e.g., parts of the application that citizensconsistently fill out wrong”. Though the focus is not directlyon the citizens, it was stated by one interviewee that anoptimisation of the back-end also brings value to the citizensas this will give a better flow with the handling of theirapplications. It was stated that focusing on accessibility ofthe system is more important than focusing on usability forthe citizens.
Two interviewees did describe testing the applicationwith users before launching the digital self-serviceapplication. “We have some pilot municipalities […] theyare part of a test phase where we assemble data forstatistics”. For the municipalities and case workers, thefocus is on improving the efficiency of the workflows.
4) ProductsThe company perceives it as a strength of their digital
self-service application that different kinds of professionalswere involved in the development process. It was stated thatthe role of the product owner creates more value as he or shealso has to ensure that the digital self-service applicationfollows the legislations even if it changes. Two intervieweesshowed confidence in that they were ensuring to developusable and intuitive digital self-service applications.
Late changes are described as being possible because theapplication is built in modules making changes lessexpensive. A perceived weakness is creating one solution tofit all needs. This approach was chosen as updating or testingwould be too expensive if municipalities wanted somethingchanged.
C. Case C
1) Development ProcessCompany C uses its own process, which is not a name
given development method. “We use our own method whichis built on several different methods. It also varies if we workagile, it depends on the project and the customers and if theywish to be and have the skills to be involved in thedevelopment process. In regards to the public self-servicesolutions, we are not working agile”. The digital self-serviceapplications are developed by the company without text anddescriptions in the form the citizens are filling in. Themunicipalities have to write that information themselves.This approach was chosen to give the case workers at themunicipalities the flexibility to get the information they thinkthey need in a digital self-service application from theircitizens and to be able to sell the same solution to allmunicipalities. The thought behind this is that allmunicipalities have different needs.“There is a greatdifference between designing a solution for a largemunicipality or if it is a very small one. There is a greatdifference in usage and working procedures”. Oneinterviewee described that providing each municipality withthe flexibility for adjusting as a key element in regards to thedigital self-service applications they are developing.
2) Customer InvolvementThe focus of the company is creating a solution that all
municipalities can use. “It makes a very big difference if youare designing something for a large or small municipality.There is a very big difference in relation to how things aredone or used.” One interviewee described developing anapplication that fits all types of municipalities, by developinga blank form that the municipalities can set up as they wishto get the citizens' to provide the information that eachmunicipality finds important. This also means that eachmunicipality buying this solution has to write all the textgoing into this digital self-service application.
Case workers at the municipalities are involved in thedevelopment process by a forum for the exchange ofexperience that the company is hosting for the municipalitiesthat are existing customers. These workshops are hostedseveral times a year. “In regards to this specific solution wealready have a solution that the citizens can access to fill outother applications or to get an overview of their ownrecords, so this new application will be developed to be partof this existing system.” Existing customers have beeninvolved through these previously held workshops, but nocustomers are directly involved in the development of thisdigital self-service application.
3) End-User FocusThe company does not involve citizens in the
development process. Two interviewees described creating asystem that the municipalities can change to fit their needs.“We have structured it so the municipalities can makeadjustments where and if they see fit, e.g., in regards torewriting phrasings or functions that can be added orremoved”. The municipalities and case workers wereinvolved before the design and development phase. Thedesign and workflow were designed at workshops held
341
International Journal on Advances in Software, vol 9 no 3 & 4, year 2016, http://www.iariajournals.org/software/
2016, © Copyright by authors, Published under agreement with IARIA - www.iaria.org
before the redesign of this digital self-service application.The company focuses on usability by having usabilityspecialists hired.
4) ProductsIt is perceived as a strength of their digital self-service
application that they have developed a solution where thecitizens can do everything in one place. “The citizens neverleave their medical file when they need to fill in the self-service application”. Two interviewees also perceive it as astrength that they have tried to cover all aspects of the needsthat both citizens and case workers have. A perceived weakness is that an interviewee feels they mightnot have spent enough time on usability when developing thedigital self-service application for the citizens. “The self-service application might be kind of crude. People need tohave prior knowledge to be able to use it.” The intervieweesalso raised a concern about if less IT skilled citizens wouldbe able to fill out the application.
D. Case D
1) Development ProcessCompany D use a staged development method but have
implemented some agile techniques in the past years. Theydescribed involving customers as much as possible in thedevelopment process. “We use agile processes evolvingaround the customers. If we involve customers earlier in theprocess, we will learn earlier if there are processes wehaven't understood”. One interviewee did describe that thisapproach has been implemented in recent years and that thecompany earlier had the philosophy that they were theexperts and not the customers.
The company have a department of User ExperienceDesigners who are involved in designing and testing thefront-end of the systems. Though they are isolated from thedevelopment teams and are mainly involved at the end of thedevelopment process by conducting summative usabilityevaluations.
The municipalities are involved several times during thedevelopment process, by conducting online meetingsdiscussing prototypes. Two interviewees find this valuable asthe company are developing one solution to fit all. The datacollected from involving the municipalities are used forcreating user-stories. “We always start by creating user-stories. [...] The user-stories are primarily used when thesystem has been developed”. The company described usingthe user-stories to check if the developed system lives up tothe needs specified in the user-stories.
2) Customer InvolvementThe primary focus of this company is on the back-end of
the digital self-service application. The company hasinvolved municipalities by conducting a workshop withpeople from municipalities who are already customers.Representatives from six municipalities participated as on-site customers. The company hosted a workshop to learnabout the number of applications and generating of ideas. Atthe end of this workshop, a specification of requirements wasgenerated.
The case workers from the municipalities were involvedseveral times during the development process but mainly
through online meetings or email. This approach was chosenas a consideration for the employees. “Every time we have topull the employees away from doing their regular job in themunicipalities [...] Online meetings still gives them theability to provide inputs. [...] Whenever we have a questionwe send an email asking if we are doing the right thing.”One interviewee described that involving the customersduring the development process is a relatively new procedureand that they now see this as best practice as it means theycan do changes during the development process as changeslate in the process are expensive and complicated.
3) End-User FocusFor this digital self-service solution, two interviewees
described focusing on the citizens' needs and their flowthrough the application. “We know that this system isdeveloped mainly for senior citizens, meaning that thissystem needs to be as simple as possible. This includes thatall descriptions and wordings need to be easilyunderstandable”. One interviewee described that there hadbeen a discussion about if they spent too much time on thecitizen angle. “The end-user is not the one buying ourproduct, it is the municipalities, [...] what matters is if theythink our self-service solution is good”. The digital self-service application is described as being part of a largerhealth care system, where citizens will have access to, e.g.,former applications and the municipality will haveeverything in regards to one citizen in one record. For thisdigital self-service application, senior citizens without muchexperience with computers, have been involved in filling outa digital self-service application. In regards to the caseworkers and municipalities, they described focusing on fullautomatic digital self-service applications when possible.
4) ProductsIt was described as a perceived strength that they had
integrated this application in their general healthcare recordsolution. “The citizens can see the full catalogue of theservices the municipality offers and, after they have appliedfor something once, it is possible to make a reorder withoutstarting over with the application.” One intervieweedescribed that they have simplified processes that otherwisemight be difficult for less IT skilled citizens. For the caseworkers the solution is perceived as a strength in regards to,when an application ends up with the case worker, thesystem has already validated that the citizens are entitled towhat they have applied for.
It is perceived as both a strength and weakness that theyalways make applications that follow the legislation thoughsome municipalities might have other requests. It isperceived as a weakness that they have been bound by anexisting design on the general healthcare record solution.They feel this application might lack usability and that somewritten information might be too small for the application.
E. Summary of Results
1) Development ProcessCase A and B describes using a module-based platform as
this provides flexibility to make changes, also late in thedevelopment process. Case D tries to avoid late changes byinvolving the customers early in the process. The cases A, B,

342
International Journal on Advances in Software, vol 9 no 3 & 4, year 2016, http://www.iariajournals.org/software/
2016, © Copyright by authors, Published under agreement with IARIA - www.iaria.org
and D finds customer involvement to be a key element. CaseC only work agile and involve customers if they find itrelevant. Case B, C, and D describe making one solution tofit all municipalities, though case C describes developing asolution that is flexible so the municipalities can set it up asthey wish, in regards to getting the information eachmunicipality needs from the citizens.
2) Customer InvolvementCases A, B and D asked on-site customers to participate
during both design and development process. Cases A and Bheld continuously design workshops, where case D held oneat the beginning and later primarily had remote access to theinvolved municipalities. Case C gathered information fromworkshops before the design phase but had no customerinvolvement besides that. Cases B and D stated that theymainly focused on the back-end of the system to be used bythe case workers. Cases B, C, and D all stated that they wereaware of that the municipalities have different needs as itdepends on the size of the municipality and theirinterpretation of legislation. Case A described that theylearned eventually that the municipalities have differentneeds, though learning this quite late in the process.
3) End-User InvolvementNeither of the companies has citizens directly involved in
the design or development process, although cases B and Ddescribed testing their developed public self-serviceapplication on citizens after the development has beencompleted. Cases A and D implemented automatic decisionswhen possible, benefiting for both citizens and case workers.Cases A, B, C, and D all described that focusing on the needsof the citizens has not been made a priority, only the needs ofthe municipalities as customers. Case D described that theyneeded to focus less on the citizens and more on themunicipalities as customers.
Cases A and D have mainly focused on the target user-group in regards to keeping the design simple for thecitizens. Case B focused primarily on the flow of the end-users in their solution, and case C has used usabilityspecialists to check if the design was usable for the citizens.
4) ProductsCases A and D highlight simplified processes as strengths
in regards to their public self-service applications. Cases Band D find the fact that they focus on developingapplications that follow the legislation as a strength. Cases Cand D both describe it as a strength that the self-serviceapplication is integrated into one healthcare solution for allpublic healthcare applications. Cases A, C, and D believethat a weakness of the citizen-centred self-serviceapplications is lacking usability. Usability has not been madea priority by the companies as it was not a priority for themunicipalities.
The applications from Case C and to some extent Case Dwere significantly smaller and less complex than theapplications developed by cases A and B, e.g., theapplication from case C was created as a paper application.
F. Usability of the self-service Solutions
In the previous sections, we have focused on how thefour self-service applications have been developed and how
it was ensured that these applications were usable for thecitizens, and would save time for the caseworkers. In thissection we look at the state of the finished self-serviceapplications and whether these applications are usable forcitizens.
Of the identified problems, 11 were found across all fourdigital public self-solutions. Among these general problemswas a lack of understanding of the purpose and flow of theself-service solutions, problems with attaching files. Also,test persons getting annoyed or confused by not being able tounderstand helping texts and the descriptions of the rules andregulations of the application area, leading to test personsfilling in the wrong information in the text fields. And,misunderstanding data fields, also leading to the test personsfilling in the wrong information in the text fields. Anoverview of the usability problems is shown in Table IX.
Table IX. Usability Problems in Each Digital Self-Service Solution
Company A Company B Company C Company D
Critical 2 5 0 1
Serious 17 18 11 15
Cosmetic 17 14 6 13
Total 36 37 17 29
The self-service applications developed by case A and Bwere much more comprehensive than the applicationsdevelop by cases C and D. The self-service applications fromcases C and D were both part of a larger healthcare system,meaning that less information had to be filled out manuallyby the participants. Especially the self-service applicationfrom case C was very simple compared to the self-serviceapplications developed by cases A and B.
Two critical problems were found in the self-serviceapplication from case A. one was about test persons notunderstanding which information to put in where and endingup writing the wrong information at the wrong place. Theother critical problem was about file attachment. The testpersons experienced problems because the helping text wasnot optimised for the browser and when they tried followingthe written steps the test persons got confused and stopped aswhat they read did not match the options they had.
Five critical problems were found in the self-serviceapplication from case B. Examples of these problems couldbe in regards to file attachment, as the test persons do notrealise when a file has been attached. Another problem isabout test persons not understanding the search function andhow to enter search parameters.
No critical problems were found in the self-serviceapplication from case C, and one critical problem was foundin the public self-service application from case D. With thisproblem the test persons got into a full stop. They had toclick a drop-down menu on the left side of the screen at alltest persons experienced a lot of trouble trying to figure outwhat to do. Test persons mainly figured out what to do whenthey started clicking different menu options and then got theright one.

343
International Journal on Advances in Software, vol 9 no 3 & 4, year 2016, http://www.iariajournals.org/software/
2016, © Copyright by authors, Published under agreement with IARIA - www.iaria.org
V. DISCUSSION
In this section, the results are discussed. First, the resultsare discussed for each case, and then the user-centredapproach is discussed.
A. Discussing the results for each case
For supporting the discussion of the results from eachcase, we have made an overview of the results from the fourcases in Table X.
1) Case AIn case A, the company is micro/small in the SME
classification and considered immature, since this is the firsttime they developed public self-service applications. Theproduct is classified as new since the company does not haveother existing products to base this product on. Their productis module based, so it is easy to make changes quite quicklyto the product if needed. Their key features are that theyfrequently collaborated with one municipality throughworkshops and evaluating prototypes gathering informationon the needs and getting feedback from case workers (thecustomer), but not the citizens (the end-users). The result ofthe usability evaluation showed 36 usability problems, butonly two serious problems.
The high number of usability problems could be becausethe development team has not gained experience indeveloping products for this kind of customers. Anotherissue could be that they only involved one singlemunicipality in their process, though having 98municipalities as potential customers.
Table X. An overview of the four companies in regards to the focus areas.
The company focused on easing the work process of thecase workers and therefore involved the caseworkers asmuch as possible in the development process. This was doneunder the assumption that the caseworkers understood thecitizens and their needs, but the high number of usabilityproblems indicate that this is not the case, which means thatcitizens have to be involved in the development process torepresent themselves and their own needs.
2) Case BIn contrast, to case A, case B is a large company and
mature in developing public self-service applications, thoughthis application is classified as new. Their product is modulebased on making it easy to conduct changes quite quickly tothe product if needed. In case B, the developers collaboratedwith five municipalities through workshops, prototypes andemails, but did not collaborate with the citizens, althoughtesting was done with citizens in pilot releases. The self-service application from case B had 37 usability problems,which was the highest amount of usability problems found ineach of the four self-service applications. This self-serviceapplication also had the highest number of critical usabilityproblems. This is surprising since it is a large, maturecompany and collaborated with several municipalities. Likein case A, case B also developed a solution focused onmaking the case workers activities more efficient. The factthat case B collaborated with five municipalities andexperienced approximately the same amount of usabilityproblems in their self-service application indicate that it isnot the number of municipalities, and case workers involvedthat makes a difference.

344
International Journal on Advances in Software, vol 9 no 3 & 4, year 2016, http://www.iariajournals.org/software/
2016, © Copyright by authors, Published under agreement with IARIA - www.iaria.org
It also indicates that citizens should be involved in thedevelopment process, as stated in the previous section.
3) Case CCase C is a large company developing a solution that is
an optimisation of existing software. They are grouped asmature since they have been developing self-serviceapplications, but also as immature since this area ofapplication is new to them. They involved all existingcustomers while developing this solution but also hiredspecialists for gathering feedback on their solution. Theirsolution showed 17 usability problems, which was the lowestof the four evaluated self-service applications. None of theusability problems were critical problems. The reason couldbe the specialist's advice, and involvement made the solutionusable. Another reason could be that the solution is morelimited than the solution from case A and B as thisapplication is part of a larger healthcare system, meaning thatmuch less information has to be put in when filling in thisapplication. Also, it was decided to make the solution fromcase C very simple, with actually little support for thecaseworkers, so they still had to do some activities manually.Where case A and B are trying to optimise workflows andactivities, which also makes the self-service applicationsmore complex for the citizens and raises the risk of usabilityproblems than transforming paper applications into digitalself-service applications.
4) Case DCase D is also a large company developing a solution
that is an optimisation of existing software. It is grouped asmature since the company has been developing public self-service applications for years. They involved sixmunicipalities in the development, did some testing withcitizens and hired specialists to give advice. Still, there were29 usability problems found, but only one critical problem.This might be the biggest surprise in the results since thiscompany is using user-centred design processes and isexperienced. This system is part of a larger healthcaresystem, meaning that much less information has to be filledin when filling in this application. So the solution is ratherlimited, but still, contains many usability problems. In case Dusability professionals are a bit isolated from thedevelopment team and are mostly involved in a summativeevaluation at the end of the development. This approachcould have resulted in higher number of usability problemsin the solution than if the usability professionals had beenmore integrated into the development process. But this alsoindicate that it is not a matter of how many municipalities,caseworkers or usability specialist's that is involved in thedevelopment process, but it might make a difference ifcitizens are involved in the development process.
B. Discussing the User-Centred Approaches used
The Danish digitalisation effort has been launched tosupport the development process and provide eachmunicipality with more digital self-service solutions tochoose from, and enhancing usability in these solutions. Forthis purpose, two sets of guidance materials were created, auser journey and a set of 24 usability criteria, respectively.The aim was that this approach would facilitate competition
between the self-service providers, resulting in better andmore user-centred self-service applications for the citizens.All four companies involved the municipalities in the designprocess both in regards to the back-end of the system meantfor the case workers and in regards to the self-serviceapplications meant for the citizens. Two of the companiesdescribed involving citizens quite late in the process fortesting of the features, either by going live in a few “pilot-municipalities” or conducting a usability evaluation.
Though a user-centred approach has been taken, ourresults correspond with the findings of Wangpipatwong etal. who found that e-government websites are lackingusability due to poor design and non-employment of user-centred design methodologies [7]. The reason for this is thatthe municipalities according to the companies are onlyfocusing on this to a small extent and are not willing to paymore than the bare minimum. This shows a mismatchbetween what the joint IT organisation of the municipalitiesand the municipalities are trying to achieve. The public self-service providers are focusing on what the municipalitiesare willing to pay for and want the citizens to do and nottaking the user-centred approach with a citizens' perspectiveunless this is being requested by the municipalities. If theuser-centred approach should be a success, it is important toinvolve the municipalities as well. They need to understandthat quality and cost are complementary [12][13] and whyusability needs to be a focus area and why a usable systemwill be a sound investment though it might be a bit moreexpensive to develop. Bruun and Stage have found thatredesigning a digital self-service application focusing onusability, can reduce the amount of time the case worker hasto spend on each application, with more than 50% [31].
Jokela et al. [11] and Mastrangelo [15] describe theimportance of usability being specified in the requirements.It is questionable whether this approach will be successfulunless the municipalities learn the values of theserequirements and get the understanding that focusing onusability will reduce cost over time. The municipalities havesome responsibility in this whole process also. If they aredemanding that their solutions are assisting caseworkers indoing their job digitally in a fast and easy process, thesoftware companies have more motivation for focusing onusability. The companies will not focus much on usabilityunless the municipalities are demanding usable products.
As described in Section IV.f we found 11 usabilityproblems across self-service applications from differentcompanies; this shows that self-service providers haveproblems understanding the end-users needs in general,though usability has been on the agenda for more thantwenty years. If we compare the general problems we foundwith Nielsen's usability heuristics from 1995, we found thatthe self-service providers have violated three of theseheuristics. Number 2, Match between the system and thereal world. Number 6, Recognition rather than recall. And,number 10, Help and documentation [32]. This lack ofunderstanding shows that the self-service providers havetrouble understanding the basics of usability theory, andeven more trouble understanding the needs of the end-usersin general.

345
International Journal on Advances in Software, vol 9 no 3 & 4, year 2016, http://www.iariajournals.org/software/
2016, © Copyright by authors, Published under agreement with IARIA - www.iaria.org
C. Benefits and Drawbacks of Customer and User Involvement
This paper documents the development process of fourdifferent self-service solutions and shows the use of threedifferent approaches to digitalise self-service applications.
One approach used by case A and B was having caseworkers from the municipalities as onsite customers torepresent both their own and the citizen's needs. This lead toself-service solutions that tried to simplify the caseworkerswork processes and thereby ease their workload.
The second approach used by case C was not having anonsite customer but involving the caseworkers beforestarting the development process. This lead to a self-servicesolution less focused on easing the workload of the caseworkers, and this self-service application was closer to beinga simple digitalised version of the paper applications used inthe past.
The third approach used by case D was not having adirect onsite customer but involving caseworkers when itwas felt to be needed. This approach leads to a self-servicesolution that was simple in some aspects but also trying tosolve some tasks to ease the workload of the caseworkers.
From a citizen's point of view, the self-service solutionfrom case C would be the most usable of these four, with 17documented usability problems. Where the self-servicesolutions from case D had 29 documented usabilityproblems, and the self-service solutions from case A and Bhad 36 and 37 usability problems, respectively. But lookingat this from a caseworkers point of view, the self-servicesolution from case C would not be the optimal choice as thiswill not in any way ease their work processes or workload.Though it can be an argument that neither does the self-service solutions from case A, B or D at this time, as citizensexperiencing problems filling out, self-service applicationswill mean that they are making mistakes. These mistakes willhave to be corrected by the caseworkers later in the process,as documented by Bruun and Stage [31].
Both case A and B, and, partly case D all usedcaseworkers as onsite customers. Our results show that thisapproach is not sufficient when developing self-servicesolutions for the citizens, with the purpose of easing theworkload of the caseworkers. The caseworkers simply do notunderstand the needs of the citizens to a degree where thisapproach would be sufficient. This means that to get anunderstanding of citizen's needs, citizen's have to beinvolved.
VI. CONCLUSION
In this study, we focused on analysing the customer anduser involvement during the software development process,and the characteristics of the four products developed, andthe results of usability evaluations thereof. We havediscussed user-centred design approaches used, thedrawbacks and benefits of customer and user involvementfound in these four cases.
Our results show that citizens were not involved in thedevelopment process and that case workers were expectedto represent and understand the citizen's interests. We
conclude that this approach has not been successful as ourusability evaluation of the four self-service applicationshowed 17 – 37 usability problems experienced by the testpersons. Several problems leading to a full stop or a highlevel of frustration for the test persons.
This lead us to conclude that case workers are notsuitable for citizen's representation and if the goal is to easethe workload of the case workers, citizens have to beinvolved in the development process too.
We recognise that it is a limitation that four companieswere involved, in regards to drawing conclusions in a broadterm about the entire development process of self-servicesolutions. As future work, it would be interesting to learnthe perspectives of the municipalities from themselves, andnot only through the self-service providers. And if the focuswas contrasted to more structured opinions coming fromdevelopers side. As future work, accessibility could also bea focus area.
ACKNOWLEDGEMENT
We would like to thank the four companies whoparticipated in this study and the joint IT organisation of themunicipalities. We would also like to thank Infinit, forsupporting this research, and the test persons participating inthe usability evaluations.
REFERENCES
[1] J. Billestrup, J. Stage, and M. Larusdottir, “A case study offour IT companies developing usable public self-servicesolutions,” Proceedings of ACHI, 2016.
[2] DESI Index,https://ec.europa.eu/digital-agenda/en/scoreboard/[retrieved: November, 2016]
[3] T. Clemmensen and D. Katre, “Adapting e-gov usabilityevaluation to cultural contexts,” Usability of e-governmentsystems, Boston: Morgan Kaufmann, 2012, pp. 331-344.
[4] S. Wangpipatwong, W. Chutimaskul, and, B. Papastratorn,“Understanding citizen's continuance intention to use e-government website: A composite view of technologyacceptance model and computer self-efficiency,” TheElectronic Journal of e-Government, vol. 6, nr. 1 2008, pp.55-64
[5] The Danish ministry of health. Reform of the municipalities.http://www.sum.dk/Aktuelt/Publikationer/Publikationer_IN/~/media/FilerPublikationerIN/Kommunalreformen/2005/Kommunalreformenkortfortalt/kommunalreformenkortforta lt.ashx[retrieved: November, 2016]
[6] Organisation of the Municipalities in Denmark, http://www.kl.dk/Administration-og-digitalisering/Lov-om-obligatorisk-digital-selvbetjening-og-digital-post-er-vedtaget-id105354/[retrieved: November, 2016]
[7] Kombit, For self-service providers, http://www.kombit.dk/indhold/leverand%C3%B8rer [retrieved: November, 2016]
[8] M. Pretorius and A. Calitz, “The South African userexperience maturity status for website design in provincialgovernments,” Proceedings of the 12th European Conferenceon eGovernment, 2012 pp. 589-599,
[9] B. Soufi and M. Maguire, “Achieving usability within e-government websites illustrated by a case study evaluation,”Proceedings of Human Interface, Springer-Verlag, 2007 partII, pp. 777-784.
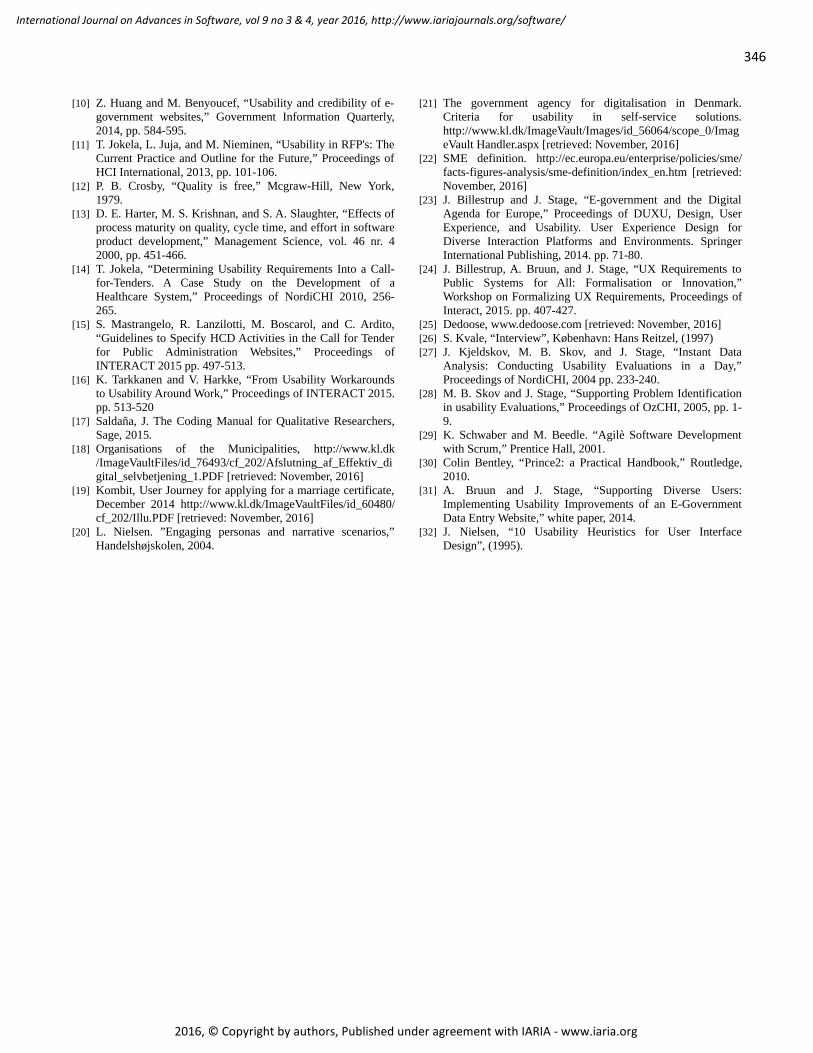
346
International Journal on Advances in Software, vol 9 no 3 & 4, year 2016, http://www.iariajournals.org/software/
2016, © Copyright by authors, Published under agreement with IARIA - www.iaria.org
[10] Z. Huang and M. Benyoucef, “Usability and credibility of e-government websites,” Government Information Quarterly,2014, pp. 584-595.
[11] T. Jokela, L. Juja, and M. Nieminen, “Usability in RFP's: TheCurrent Practice and Outline for the Future,” Proceedings ofHCI International, 2013, pp. 101-106.
[12] P. B. Crosby, “Quality is free,” Mcgraw-Hill, New York,1979.
[13] D. E. Harter, M. S. Krishnan, and S. A. Slaughter, “Effects ofprocess maturity on quality, cycle time, and effort in softwareproduct development,” Management Science, vol. 46 nr. 42000, pp. 451-466.
[14] T. Jokela, “Determining Usability Requirements Into a Call-for-Tenders. A Case Study on the Development of aHealthcare System,” Proceedings of NordiCHI 2010, 256-265.
[15] S. Mastrangelo, R. Lanzilotti, M. Boscarol, and C. Ardito,“Guidelines to Specify HCD Activities in the Call for Tenderfor Public Administration Websites,” Proceedings ofINTERACT 2015 pp. 497-513.
[16] K. Tarkkanen and V. Harkke, “From Usability Workaroundsto Usability Around Work,” Proceedings of INTERACT 2015.pp. 513-520
[17] Saldaña, J. The Coding Manual for Qualitative Researchers,Sage, 2015.
[18] Organisations of the Municipalities, http://www.kl.dk/ImageVaultFiles/id_76493/cf_202/Afslutning_af_Effektiv_digital_selvbetjening_1.PDF [retrieved: November, 2016]
[19] Kombit, User Journey for applying for a marriage certificate,December 2014 http://www.kl.dk/ImageVaultFiles/id_60480/cf_202/Illu.PDF [retrieved: November, 2016]
[20] L. Nielsen. ”Engaging personas and narrative scenarios,”Handelshøjskolen, 2004.
[21] The government agency for digitalisation in Denmark.Criteria for usability in self-service solutions.http://www.kl.dk/ImageVault/Images/id_56064/scope_0/ImageVault Handler.aspx [retrieved: November, 2016]
[22] SME definition. http://ec.europa.eu/enterprise/policies/sme/facts-figures-analysis/sme-definition/index_en.htm [retrieved:November, 2016]
[23] J. Billestrup and J. Stage, “E-government and the DigitalAgenda for Europe,” Proceedings of DUXU, Design, UserExperience, and Usability. User Experience Design forDiverse Interaction Platforms and Environments. SpringerInternational Publishing, 2014. pp. 71-80.
[24] J. Billestrup, A. Bruun, and J. Stage, “UX Requirements toPublic Systems for All: Formalisation or Innovation,”Workshop on Formalizing UX Requirements, Proceedings ofInteract, 2015. pp. 407-427.
[25] Dedoose, www.dedoose.com [retrieved: November, 2016][26] S. Kvale, “Interview”, København: Hans Reitzel, (1997)[27] J. Kjeldskov, M. B. Skov, and J. Stage, “Instant Data
Analysis: Conducting Usability Evaluations in a Day,”Proceedings of NordiCHI, 2004 pp. 233-240.
[28] M. B. Skov and J. Stage, “Supporting Problem Identificationin usability Evaluations,” Proceedings of OzCHI, 2005, pp. 1-9.
[29] K. Schwaber and M. Beedle. “Agilè Software Developmentwith Scrum,” Prentice Hall, 2001.
[30] Colin Bentley, “Prince2: a Practical Handbook,” Routledge,2010.
[31] A. Bruun and J. Stage, “Supporting Diverse Users:Implementing Usability Improvements of an E-GovernmentData Entry Website,” white paper, 2014.
[32] J. Nielsen, “10 Usability Heuristics for User InterfaceDesign”, (1995).

347
International Journal on Advances in Software, vol 9 no 3 & 4, year 2016, http://www.iariajournals.org/software/
2016, © Copyright by authors, Published under agreement with IARIA - www.iaria.org
Using CASE Tools in MDA Transformation of Geographical Database Schemas
Thiago Bicalho Ferreira, Jugurta Lisboa-Filho
Departamento de Informática
Universidade Federal de Viçosa
Viçosa, Minas Gerais, Brazil
e-mail: [email protected], [email protected]
Sergio Murilo Stempliuc
Faculdade Governador Ozanan Coelho (FAGOC)
Ubá, Minas Gerais, Brazil
e-mail: [email protected]
Abstract— GeoProfile is a Unified Modeling Language (UML)
profile proposed to standardize the conceptual modeling of
geographic databases (GDB). GeoProfile can be used along with
the Model Driven Architecture (MDA) added with integrity
restrictions specified through the Object Constraint Language
(OCL). Several Computer-Aided Software Engineering (CASE)
tools provide support to those computational artifacts already
consolidated by the UML infrastructure. Some CASE tools can
be configured to automate the transformation of schemas at
different levels of the MDA approach. The transformations in
those tools occur from the Platform-Independent Model (PIM)
abstraction level until to the generation of Structured Query
Language (SQL) source codes. This study aimed to describe the
evaluation process of a set of CASE tools with support to UML
Profile technology based on specific requirements to use MDA
approach, OCL restrictions, and other elements that aid in
conceptual GDB modeling. This paper also describes an
experience in using GeoProfile with one of the CASE tools
evaluated, taking into account the tool’s transformation
language to allow for automated transformations among the
different levels of the MDA approach.
Keywords- CASE tools; Enterprise Architect; MDA
transformations; OCL; Geographical Database.
I. INTRODUCTION
Based on the study developed in [1], this paper describes
the assessment of CASE tools and the steps to reach vertical
interoperability among schemas in the UML GeoProfile at the
different levels of the Model Driven Architecture (MDA).
GeoProfile is a Unified Modeling Language (UML) profile
proposed by [2], employed in the conceptual modeling of
Geographic Databases (GDB), which can use all of UML’s
infrastructure, which includes Object Constraint Language
(OCL) to define integrity constraints and MDA for the
transformation between its different abstraction levels [2][3].
Moreover, one of the advantages of using a UML profile is
that it can be used in different CASE tools. However, not all
tools offer the same features, making difficult to choose one.
Examples of CASE tools with UML support include
Enterprise Architect, Papyrus, StarUML, Visual Paradigm,
and IBM Rational Software Architect.
In order to compare these tools and in the context of this
study, some characteristics or features were prioritized such
as the support to the UML Profile definition, validation of
OCL constraints, and application of the MDA approach. The
key aspect is that the tools need to allow models to be created
using UML GeoProfile, the transformation among the
different levels established by the MDA approach, the
syntactic and semantic validation of spatial OCL constraints,
and that the models should be implemented from scripts
generated for a selected database management system.
This paper aims to describe the evaluation of a set of
CASE tools considering important requirements from the
conceptual project to the implementation of the geographical
database. This paper also reports on an experience of using
the CASE Enterprise Architect tool, which had the best result,
and on the challenges of the development of a vertical
transformation mechanism for geographic databases using
UML GeoProfile.
The remaining of the paper is structured as follows.
Section II briefly explains the representation of geographical
data, the UML GeoProfile, the MDA approach and the syntax
to specify OCL expressions and the Oracle Spatial
Geographic Database Management System (GDBMS).
Section III presents a description of each CASE tool analyzed
according to the goal of this study. Section IV shows the
requirements, the methodology and the result of the tool
evaluations. Section V presents the MDA transformation
applied to GeoProfile in the CASE Enterprise Architect tool.
Section VI describes the SQL code generation step in the
Enterprise Architect tool for the Oracle Spatial GDBMS.
Section VII presents the conclusions and future works.
II. GEOGRAPHICAL DATABASE MODELING CONCEPTS
This section presents a literature review identifying the
main concepts that contribute to the conceptual GDB
modeling.
A. Representing Geographical Information in Computers
The representation of geographical space in computers is
a challenge faced by researchers. According to Longley et al.
[4], the world is infinitely complex and computing systems
are finite, thus, it is up to the designer to limit the amount of
details to be captured from the environment mapped. The two
main approaches on computing are the continuous (fields)
and discrete (objects) representations. Another representation
also employed is in the form of networks, which takes into
account graph theory.

348
International Journal on Advances in Software, vol 9 no 3 & 4, year 2016, http://www.iariajournals.org/software/
2016, © Copyright by authors, Published under agreement with IARIA - www.iaria.org
Figure 1 shows part of a city with a sports center and
represents part of this city focusing on the roads and the
stadium. The GDB of Figure 1(b) must be conceptually
modeled containing all structures of interest in the system
while leaving aside other information such as the type of
vegetation, vacant plots, terrain, and other characteristics that
may be abstracted from Figure 1(a).
In order to design the conceptual data schema, first the
vector structures used to represent the boundaries of each
geographic entity must be understood, which is normally
specified through basic geometric shapes: point, line and
polygon (area) [5]. Figure 1(b) presents the use of these three
types of vector structures. For instance, the stadium may be
spatially represented as a point or as a polygon (multiple
spatial representation); the main east road, as a line; and the
sports center, as a polygon.
Additionally, presenting the structures, Figure 1(b)
illustrates the relationship among the vector objects, which
shows the stadium “is within” the sports center, the sports
center “touches” the road to the stadium, the main west road
“is near” the sports center, but does not “touch” it.
Such relationships are known as topological relationships
and have been discussed by [6] and [7] and used by [8].
Figure 1. (a) Photograph of part of a city with a sports center between
roads. (b) Spatial representation of this area. Source: Adapted from [9].
B. Model-Driven Architecture (MDA)
According to Kleppe et al. [10], MDA is a framework
standardized by the [11] for the development of software
employing a Model-Driven Development (MDD) view.
The MDA approach consists of three abstraction levels,
namely, CIM, PIM and PSM. Computation-Independent
Model (CIM) does not show details of the system’s structure,
but rather the environment in which the system will operate.
Platform-Independent Model (PIM) is an independent model
of any implementation technology containing the software
requirements. Platform-Specific Model (PSM) specifies
details about the platform in which it will be implemented.
The artifacts produced by the MDA approach are formal
models that can be processed by computers and, after
undergoing transformations, will get to a final source-code
step (top-down approach) or to high levels of abstraction
(bottom-up approach). Figure 2 illustrates the action of
transformation tools at MDA levels.
Figure 2. Use of transformation tools in the MDA approach. Source:
Adapted from [10].
C. Object Constraint Language (OCL)
Conceptual modeling makes the problem easier to be
understood through abstraction, thus enabling risk
management and contributing to error correction early in the
project, which minimizes the cost of maintenance [12].
However, Warmer and Kleppe [13] state that conceptual
models may not be able to represent all requirements, resulting
in problems to those who interpret them.
The OCL, adopted by OMG [14] since version 2.0, was
defined as a formal language to complement the conceptual
modeling using UML. Using OCL ambiguity-free integrity
constraints can be created, which makes it possible to specify
the data consistency wanted in the system at a high level of
abstraction. Since it is a formal language, it can be processed
by CASE tools until the source-code generation, which
enables more powerful and satisfactory data consistency [13].
OCL is currently at version 2.4 [15].
The OCL expressions represent constraints that are needed
in the system and not how they should be implemented. The
evaluation of a constraint on the data always yields a Boolean
value [13]. The syntax of a typical expression in OCL that
represents a condition has the format presented by Code in
Figure 3.
Figure 3. Syntax of a typical expression in OCL.
Code in Figure 4 illustrates a hypothetical example of
OCL constraint that specifies that a Brazilian municipality
must be larger than 3,000 km² (note: The smallest Brazilian
municipality, Santa Cruz de Minas, MG, is 3,565 km²). A
detailed specification of the OCL can be found in [13] [15].
Figure 4. Hypothetical example of the use of OCL restrictions.
<context> inv:<expression>
context Municipality
inv:self.area > 3000

349
International Journal on Advances in Software, vol 9 no 3 & 4, year 2016, http://www.iariajournals.org/software/
2016, © Copyright by authors, Published under agreement with IARIA - www.iaria.org
D. UML GeoProfile
In order to provide elements for specific domains without becoming excessively complex, UML has an extension mechanism called Profile. A UML Profile consists of: a metamodel; a set of stereotypes presented through texts in the form of <<text>> or through graphical icons called pictograms; tagged values; and constraints; all grouped in a stereotyped package called <<profile>>, thus formalizing the UML builder extension [16].
GeoProfile is a UML profile proposed for the geographical data modeling comprising the main characteristics of the existing models in the field [17]. GeoProfile is employed at the CIM and PIM levels of the MDA approach, using OCL constraints as a resource to validate the conceptual scheme generated by the designer [18].
The GeoProfile stereotypes are extensions of the Association and Class metaclasses. The stereotypes extended from the Class metaclass allow representing the geographic space in the discrete view (e.g., points, lined and polygons), in the continuous view (e.g., large cells and triangular networks), and through networks (nodes and arcs). The temporal aspects can also be represented with the stereotypes made up of tagged values that store instant and range values. The extended stereotypes of the Association metaclass allow representing topological relationships (e.g., touches and within) among the geographical stereotypes, and the temporal relationship (Temporal) among the temporal objects.
For the extended stereotypes of the Class metaclass, the abstracted stereotypes have been defined: <<Network>>, to group network stereotypes; <<GeoObject>>, to group the discrete view stereotypes; <<GeoField>>, to group the continuous view stereotypes; and <Arc>>, to group the <<UnidirectionalArc>> and <<BidirecionalArc>> stereotypes that represent the possible links between the nodes of a network.
E. Oracle Spatial
Oracle Spatial is a database management system by
Oracle Corporation that supports geographic information
through the Spatial module. According to [9], Oracle
supports three primitive geometry types (point, line, and
polygon) and a collection made up of other primitive
geometries. Figure 5 presents an example of Structured
Query Language (SQL) involving the creation of tables with
support to spatial data.
Figure 5. Table creation with spatial data support.
Unlike a conventional table, the code shown in Figure 5
has a geom attribute with the SDO_GEOMETRY data type.
According to [9], this data type is exclusive to Oracle
GDBMS and is formed by five attributes that specify the
geometry of the piece of data to be stored at the moment of
its insertion, namely: SDO_GTYPE, SDO_SRID,
SDO_POINT, SDO_ORDINATES, and
SDO_ELEM_INFO. Further details on the use of each type
of attribute can be obtained in [9].
III. CASE TOOLS ANALYZED
The tools analyzed in this study were chosen according to the ease of access to the software and documentation. These tools are open source and commercial with some support to the UML profile and are well known by the software development community. The sub-sections below describe the results of the analysis made on the following CASE tools, exploring the resources they offer compared to the GeoProfile: Enterprise Architect (EA) version 12.0, Papyrus UML2 Modeler (Papyrus) version 1.12.3, StarUML–UML/MDA Platform (StarUML) version 5.0.2.1570, Visual Paradigm for UML (VP) version 10.2 and IBM Rational Software Architect (RSA) version 9.0.
A. Enterprise Architect (EA)
Enterprise Architect (EA) [19] is a commercial CASE tool licensed by Sparx Systems that allows the visual creation of UML profiles and insertion with syntactic validation of OCL expressions. EA does not offer resources for semantic validation of OCL expressions.
Additionally, being a modeling tool, it acts as an MDA transformation tool, with its own language for transformation between the model levels. This language can be modified so that the users are able to reach the last MDA approach level, the source code [20]. Since the modeling in this paper refers to GDB, the last MDA step is the Data Definition Language (DDL) source code, which EA is able to generate.
The GeoProfile stereotypes in the EA tool can be
represented graphically or textually <<point>>. The tool also offers resources for multiple stereotype representation, e.g., depending on the scale, a city may be modeled as a point or a polygon <<point, polygon>>.
The advantage at using EA is that it makes possible to specify some constraints. For example, it does not allow the insertion of extended stereotypes of the Class metaclass in Association elements and vice versa. The problem is that it allows the use of abstract stereotypes in conceptual models, e.g. the abstract GeoProfile stereotypes: <<Arc>>, <<GeoField>>, <<GeoObject>>, <<Network>> and <<NetworkObj>>.
B. Papyrus UML2 Modeler
Papyrus UML2 Modeler [21] is an open-source tool based on the Eclipse environment and licensed by Eclipse (Eclipse Public License). It has a visual environment to insert UML profiles, thus providing support to insertion and syntactic validation of OCL constraints. However, it does not semantically validate these constraints.
CREATE TABLE <table name>
attribute_1 NUMBER,
attribute_2 VARCHAR (25),
geom SDO_GEOMETRY
;

350
International Journal on Advances in Software, vol 9 no 3 & 4, year 2016, http://www.iariajournals.org/software/
2016, © Copyright by authors, Published under agreement with IARIA - www.iaria.org
Adding graphical icons to the stereotypes is possible. Thus, a class or association can be represented by stereotypes as follows: only text, only graphical icon, or graphical icon and text. The Papyrus tool allows multiple representation to be specified through stereotypes, but, in case the graphical representation is used, only the first stereotype used by the designer is presented.
Additionally, restricting the use of abstract GeoProfile stereotypes in conceptual models, in this CASE tool other GeoProfile stereotypes can only be used with correct UML elements, i.e., an extended stereotype of the Association metaclass cannot be used in a class defined by the Class metaclass.
The Papyrus tool does not support the MDA approach, the transformation language and DDL code generation.
C. StarUML
StarUML [22] is an open-source tool whose profile insertion is done through an Extensible Markup Language (XML) document. This tool does not support OCL and, despite being considered MDA, the features offered are incomplete. What it allows is transforming a model (PIM) into source code without going through the PSM. The source codes can be generated for the languages Java, C++ and C#. StarUML does not have a transformation language and the conceptual models produced from GeoProfile cannot be transformed into DDL source code.
Although multiple stereotype representation is not supported by the tool, the designer can choose between graphical and text representation, but only text is supported in associations. Therefore, the possible class stereotype representations are: textual, graphical, and textual and graphical. The tool can also restrict the use of abstract stereotypes at the same time that the others can be properly used with UML elements.
D. Visual Paradigm for UML (VP)
With an intuitive modeling environment, the commercial tool Visual Paradigm for UML [23] supports the visual creation of UML profiles. The stereotypes can be presented graphically or textually, with support for multiple representation with the graphical ones.
The tool does not allow the use of extended stereotypes of different metaclasses, as described in Section III.A, however, it does allow abstract GeoProfile stereotypes to be used during conceptual modeling.
The tool allows incomplete MDA approach, transforming PIM straight into source code. Nevertheless, it does not support DDL code generation from UML class diagrams, just only from those created through the ER model. Thus, the GeoProfile conceptual models cannot be transformed into DDL code.
Also, this tool does not support the syntactic and semantic validation of OCL constraints on conceptual models created from GeoProfile.
E. Rational Software Architect (RSA)
RSA [24] is a commercial CASE tool licensed by IBM that allows the visual creation of UML profiles. This tool supports
the use of profiles and is designed to allow syntactic and semantic validation of OCL constraints applied to UML diagrams.
The representations by the stereotypes in an association or class may take place as follows: only textual stereotype, only graphical stereotype, and representation by the textual and graphical stereotypes. However, the multiple representation by the stereotypes can take place in two ways: All stereotypes applied to the class or association must be in textual format or the first stereotype applied takes on the graphical format and the others on textual format.
The tool does not allow inserting extended stereotypes of the Class metaclass in association elements and vice versa, and the stereotypes defined as abstract in GeoProfile cannot be used in the UML elements.
RSA has incomplete support to MDA since it does not natively allow DDL source-code generation. Although there is a transformation mechanism in which the origin, target, and some settings regarding the mapping in the transformation from model into source code can be determined, RSA does not have an MDA transformation language. Therefore, with RSA’s native features and mechanisms, these transformations cannot be performed on models created from the GeoProfile.
IV. RESULTS OF THE CASE TOOLS COMPARISON
This section initially presents a set of requirements the CASE tools must meet to support conceptual GDB modeling based on the GeoProfile. Next, it presents the method used in the evaluation, the results and the final classification of the CASE tools analyzed.
This method originally proposed by Rosario and Santos Neto [25] was used in exploratory research involving software project management tools. This method was also applied by Câmara et al. [26] on comparison of development environments for systems of Volunteered Geographic Information (VGI).
A. Requirements Survey
Based on the literature and on the descriptions of each CASE tool, this paper proposes requirements to evaluate which tool has the greatest number of features to support the GeoProfile use, aiming the transformation of data models at the different MDA levels and to specify integrity constraints at conceptual level using OCL. Table I lists these requirements.
B. Evaluation Method of CASE Tools
In the context of this study, the requirements were classified as follows:
Requirements that are Essentials: Weight 3;
Requirements that are Important: Weight 2;
Requirements that are Desirable: Weight 1. Additionally, to the weight attributed to requirements, a
scale must be defined for how well the tools satisfy each one. They may not satisfy (NS), partially satisfy (PS), or satisfy (S) a requirement. Therefore, the following scales can be attributed:
Does not satisfy the requirement: A scale with value 0 is attributed;

351
International Journal on Advances in Software, vol 9 no 3 & 4, year 2016, http://www.iariajournals.org/software/
2016, © Copyright by authors, Published under agreement with IARIA - www.iaria.org
Partially satisfies the requirement: A scale with value 1 is attributed;
Satisfies the requirement: A scale with value 2 is attributed.
Based on this evaluation, the classification of each tool was calculated by adding up the products of the importance weight (W) and the satisfaction scale (S) for each requirement (n), represented in Figure 6. Access [25] for more details for this method.
Figure 6. Formula used to calculate and sort CASE tools.
TABLE I. REQUIREMENTS TO EVALUATE CASE TOOLS
Requirement description
Rq 01 Correct attribution of GeoProfile stereotypes in the UML
elements
Rq 02 Restriction to the use of abstract stereotypes in elements of
the model
Rq 03 Support to syntactic validation of OCL constraints
Rq 04 Support to semantic validation of OCL constraints
Rq 05 Support to MDA transformations
Rq 06 Support to transformation language
Rq 07 Support to graphical exhibition of profile stereotypes
Rq 08 Support to multiple representation through stereotypes
Rq09 Support to visual profile creation
Rq 10 Support to DDL code generation
Rq 11 Open-source tool
C. Evaluation of the CASE Tools
In order to evaluate each CASE tool and its practical capacity regarding the theoretical functionalities predicted for a UML profile, particularly GeoProfile, the requirements presented in Table I were classified according to the following criteria:
The requirements considered essential are those that support MDA;
Requirements that aid in transformations between MDA models are considered important;
Requirements that care for quality of the GDB models are considered important;
Requirements that facilitate understanding and contribute to the adoption of the tool are considered desirable.
Table II presents the classification of the requirements regarding their importance level, which are Essential, Important or Desirable. Table III presents the way each CASE
tool satisfies the requirements of Table I. At the end, the summary of the evaluation based on Formula (4) is presented using the data from Tables II and III.
TABLE II. CLASSIFICATION OF THE REQUIREMENTS BASED ON THE
IMPORTANCE LEVEL.
Importance Requirements
Essential Rq05
Important Rq 01, Rq 03, Rq 04, Rq 06, Rq 08, Rq 10
Desirable Rq 02, Rq 07, Rq 09, Rq 11
Table III shows the level of satisfaction for each of the
CASE tools analyzed, considering each of the 11 requirements. A CASE tool may or may not support a requirement, or provide partial support. For example, EA offers full support for Rq 01. The assigned scale for this level of satisfaction is 2. Meanwhile, Rq 01 was classified as “important” in Table II, therefore receiving weight 2. So, when Formula (3) is applied, the sum of (scale x weight) is calculated for all requirements. Thus, the total sum for EA is 30. The same method was used for all the other tools.
An analysis of Table III shows that the Enterprise Architect tool was the one that best satisfied the requirements for the transformation of conceptual models so that the OCL constraints can be used in the tool. Since it has a customizable transformation language, the OCL constraints can be transformed into integrity constraints along with the SQL code generated in the last MDA level.
Another situation that can be observed in Table III is that the CASE tool RSA provides the best features to use the OCL constraints since it allows for both syntactic and semantic validations.
V. MDA TRANSFORMATION APPLIED TO
GEOPROFILE IN THE CASE ENTERPRISE ARCHITECT
TOOL
Based on the evaluation described in the previous section
and using the Enterprise Architect (EA) CASE tool version
11.0.1106, this study sought to reproduce the different
abstraction levels specified by the MDA approach. Although GeoProfile, in its definition, works with the
modeling of a CIM, the transformations from CIM into PIM were considered unnecessary for this research since, during the creation of the diagrams, abstract and specific concepts were found to mix in the EA tool. The diagram created with GeoProfile in that tool can be considered a CIM due to the abstraction and use of textual stereotypes, while it can be considered a PIM for allowing the specification of the types of data of the class attributes. By classifying its diagrams as PIM, in Figure 7, the classes City and Deposit are polygon spatial objects. The CoalMine class has multiple spatial representations as a point and polygon, however, only one stereotype can be represented graphically. The CoalCompany class is a class with no geographic representation.
𝑋 = σ 𝑆𝑖. 𝑊𝑖𝑛𝑖 = 1
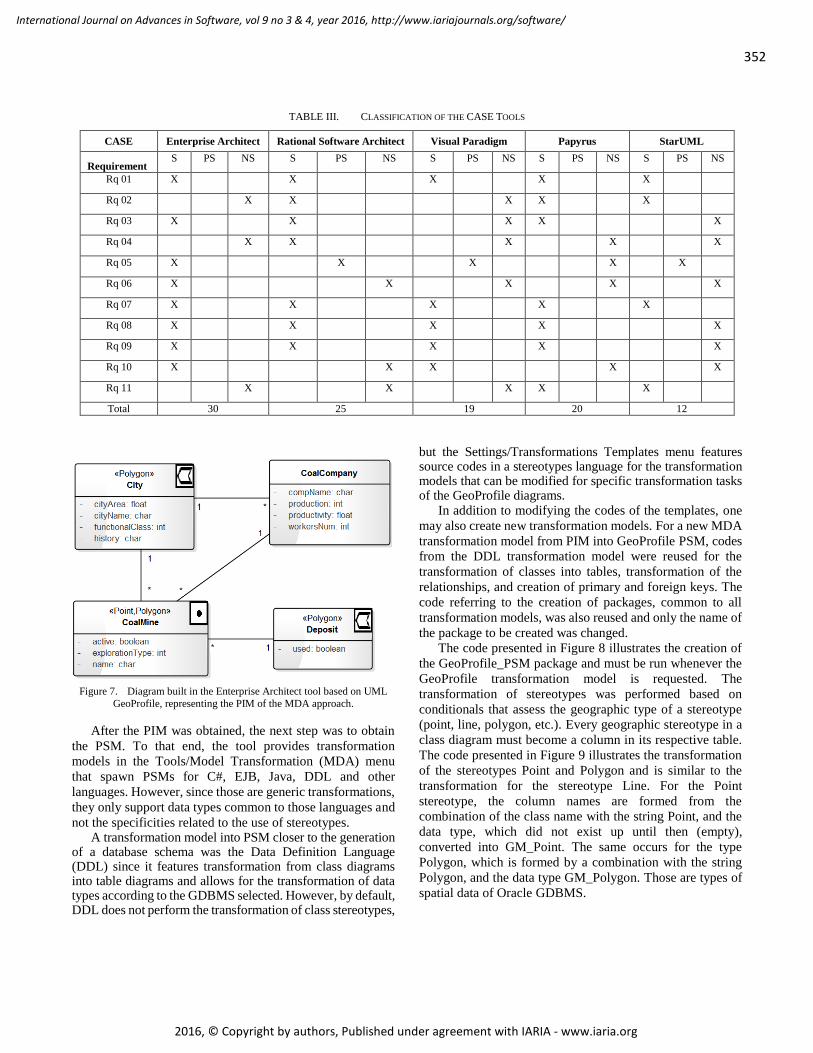
352
International Journal on Advances in Software, vol 9 no 3 & 4, year 2016, http://www.iariajournals.org/software/
2016, © Copyright by authors, Published under agreement with IARIA - www.iaria.org
TABLE III. CLASSIFICATION OF THE CASE TOOLS
CASE Enterprise Architect Rational Software Architect Visual Paradigm Papyrus StarUML
Requirement S PS NS S PS NS S PS NS S PS NS S PS NS
Rq 01 X
X
X
X
X
Rq 02
X X
X X
X
Rq 03 X
X
X X
X
Rq 04
X X
X
X
X
Rq 05 X
X
X
X
X
Rq 06 X
X
X
X
X
Rq 07 X
X
X
X
X
Rq 08 X
X
X
X
X
Rq 09 X
X
X
X
X
Rq 10 X
X X
X
X
Rq 11
X
X
X X
X
Total 30 25 19 20 12
Figure 7. Diagram built in the Enterprise Architect tool based on UML
GeoProfile, representing the PIM of the MDA approach.
After the PIM was obtained, the next step was to obtain
the PSM. To that end, the tool provides transformation
models in the Tools/Model Transformation (MDA) menu
that spawn PSMs for C#, EJB, Java, DDL and other
languages. However, since those are generic transformations,
they only support data types common to those languages and
not the specificities related to the use of stereotypes. A transformation model into PSM closer to the generation
of a database schema was the Data Definition Language (DDL) since it features transformation from class diagrams into table diagrams and allows for the transformation of data types according to the GDBMS selected. However, by default, DDL does not perform the transformation of class stereotypes,
but the Settings/Transformations Templates menu features source codes in a stereotypes language for the transformation models that can be modified for specific transformation tasks of the GeoProfile diagrams.
In addition to modifying the codes of the templates, one
may also create new transformation models. For a new MDA
transformation model from PIM into GeoProfile PSM, codes
from the DDL transformation model were reused for the
transformation of classes into tables, transformation of the
relationships, and creation of primary and foreign keys. The
code referring to the creation of packages, common to all
transformation models, was also reused and only the name of
the package to be created was changed.
The code presented in Figure 8 illustrates the creation of
the GeoProfile_PSM package and must be run whenever the
GeoProfile transformation model is requested. The
transformation of stereotypes was performed based on
conditionals that assess the geographic type of a stereotype
(point, line, polygon, etc.). Every geographic stereotype in a
class diagram must become a column in its respective table.
The code presented in Figure 9 illustrates the transformation
of the stereotypes Point and Polygon and is similar to the
transformation for the stereotype Line. For the Point
stereotype, the column names are formed from the
combination of the class name with the string Point, and the
data type, which did not exist up until then (empty),
converted into GM_Point. The same occurs for the type
Polygon, which is formed by a combination with the string
Polygon, and the data type GM_Polygon. Those are types of
spatial data of Oracle GDBMS.
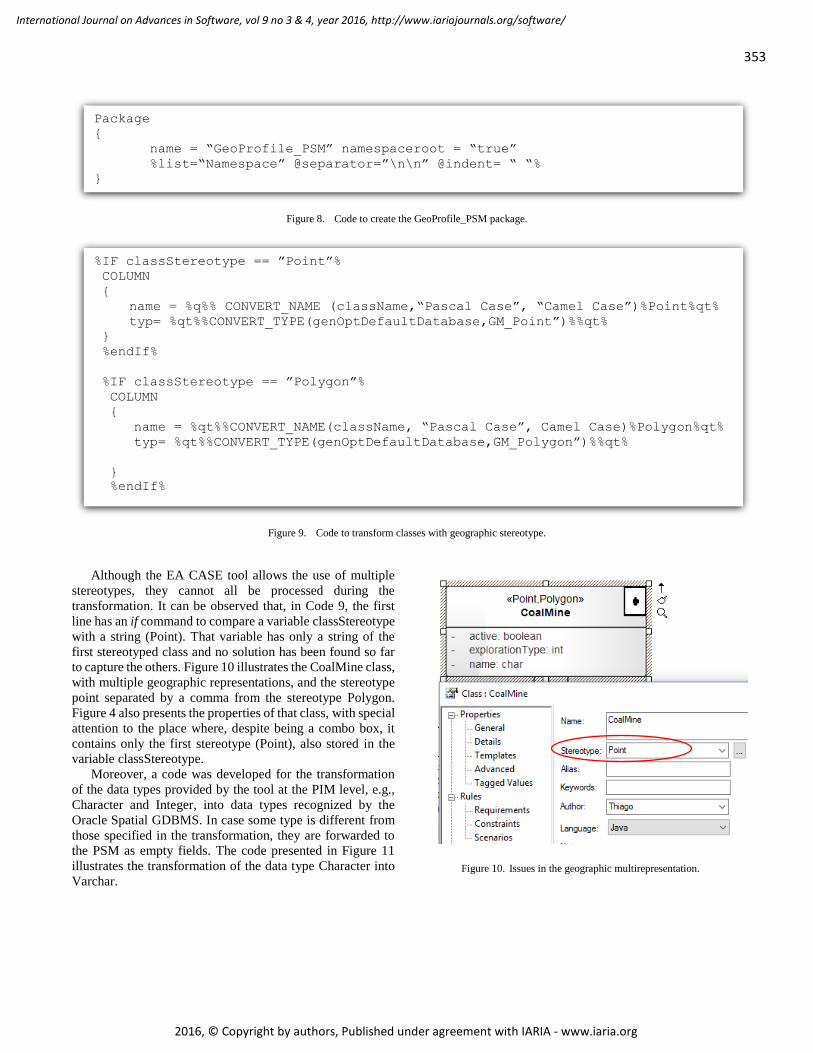
353
International Journal on Advances in Software, vol 9 no 3 & 4, year 2016, http://www.iariajournals.org/software/
2016, © Copyright by authors, Published under agreement with IARIA - www.iaria.org
Figure 8. Code to create the GeoProfile_PSM package.
Figure 9. Code to transform classes with geographic stereotype.
Although the EA CASE tool allows the use of multiple
stereotypes, they cannot all be processed during the
transformation. It can be observed that, in Code 9, the first
line has an if command to compare a variable classStereotype
with a string (Point). That variable has only a string of the
first stereotyped class and no solution has been found so far
to capture the others. Figure 10 illustrates the CoalMine class,
with multiple geographic representations, and the stereotype
point separated by a comma from the stereotype Polygon.
Figure 4 also presents the properties of that class, with special
attention to the place where, despite being a combo box, it
contains only the first stereotype (Point), also stored in the
variable classStereotype.
Moreover, a code was developed for the transformation
of the data types provided by the tool at the PIM level, e.g.,
Character and Integer, into data types recognized by the
Oracle Spatial GDBMS. In case some type is different from
those specified in the transformation, they are forwarded to
the PSM as empty fields. The code presented in Figure 11
illustrates the transformation of the data type Character into
Varchar.
Figure 10. Issues in the geographic multirepresentation.
Package
name = “GeoProfile_PSM” namespaceroot = “true”
%list=“Namespace” @separator=”\n\n” @indent= “ “%
%IF classStereotype == ”Point”%
COLUMN
name = %q%% CONVERT_NAME (className,“Pascal Case”, “Camel Case”)%Point%qt%
typ= %qt%%CONVERT_TYPE(genOptDefaultDatabase,GM_Point”)%%qt%
%endIf%
%IF classStereotype == ”Polygon”%
COLUMN
name = %qt%%CONVERT_NAME(className, “Pascal Case”, Camel Case)%Polygon%qt%
typ= %qt%%CONVERT_TYPE(genOptDefaultDatabase,GM_Polygon”)%%qt%
%endIf%

354
International Journal on Advances in Software, vol 9 no 3 & 4, year 2016, http://www.iariajournals.org/software/
2016, © Copyright by authors, Published under agreement with IARIA - www.iaria.org
Figure 11. Issues in the geographic multirepresentation.
However, there was no need to develop a code to attribute
field sizes such as Varchar2(30) and Number(8,2) since the
tool can be pre-configured to attribute values to those data
types, as shown in Figure 12.
Figure 12. Customization of the data types of the attributes used during the
transformation from PIM into PSM.
After following the steps (see the tutorial on the
GeoProfile project’s site
<http://www.dpi.ufv.br/projetos/geoprofile>) for its
incorporation into the EA tool and the concepts that have
been presented so far, the Tools/Model Transformation
(MDA) menu can be used and the GeoProfile_PSM
transformation can be selected so that the PSM of Figure 13
can be generated from the PIM of Figure 7.
After following the steps described for PSM generation
and comparing the diagram illustrated in Figure 7 (PIM) with
the diagram in Figure 13 (PSM), it can be seen that, for
semantic relationships, i.e., those that do not involve
topological relationships among the geographic objects, the
foreign keys are automatically created in the classes. For
example, for the semantic relationship between the classes
City and CoalMine, the foreign key cityID was created in the
last class.
The relational model today no longer poses great
challenges regarding the transformation between the PIM and
PSM models. However, the spatial characteristics, which
involve new data types and topological relationships, add
difficulties during this transformation, which requires the
investigation of an extension of the rule set for the relational
model. Another difficulty is the lack of standardization
concerning the implementation of those data types and
relationships in the different GDBMSs.
Consequently, it is helpful that the new transformation
rules can be specified in the CASE tools, which is available
in the EA tool from the possibility of customizing or creating
a new transformation language. Figure 12 shows that new
data types can be created during the transformation into a
particular GDBMS type, which helps specify spatial
attributes. Nonetheless, some complications can occur when
the types temporal, network, and field view are taken into
account since the concept itself is different from the
conventional types.
Furthermore, the transformation of topological
relationships into PSM is also more complex since they
specify integrity restrictions among the spatial types involved
and such task cannot simply be performed by creating foreign
keys.
Column
%TRANSFORM_CURRENT(“type”,stereotype”),“collection”,“constant”,“containment”,
“ordered”,“static”, “volatile”)%
$type1 = %attType%
%if $type1 == “Character”
%Type = %qt%%
CONVERT_TYPE(genOptDefaultDatabase,“Varchar2”)%%qt%
%endIf%
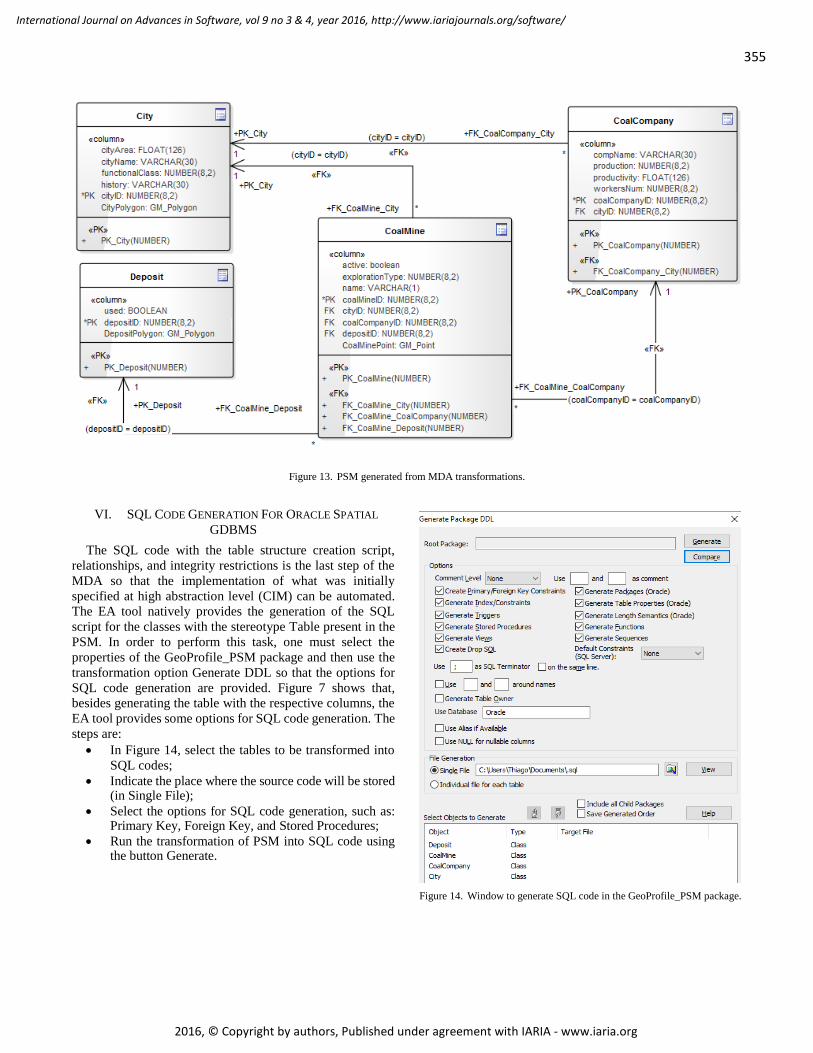
355
International Journal on Advances in Software, vol 9 no 3 & 4, year 2016, http://www.iariajournals.org/software/
2016, © Copyright by authors, Published under agreement with IARIA - www.iaria.org
Figure 13. PSM generated from MDA transformations.
VI. SQL CODE GENERATION FOR ORACLE SPATIAL
GDBMS
The SQL code with the table structure creation script,
relationships, and integrity restrictions is the last step of the
MDA so that the implementation of what was initially
specified at high abstraction level (CIM) can be automated.
The EA tool natively provides the generation of the SQL
script for the classes with the stereotype Table present in the
PSM. In order to perform this task, one must select the
properties of the GeoProfile_PSM package and then use the
transformation option Generate DDL so that the options for
SQL code generation are provided. Figure 7 shows that,
besides generating the table with the respective columns, the
EA tool provides some options for SQL code generation. The
steps are:
In Figure 14, select the tables to be transformed into
SQL codes;
Indicate the place where the source code will be stored (in Single File);
Select the options for SQL code generation, such as: Primary Key, Foreign Key, and Stored Procedures;
Run the transformation of PSM into SQL code using the button Generate.
Figure 14. Window to generate SQL code in the GeoProfile_PSM package.

356
International Journal on Advances in Software, vol 9 no 3 & 4, year 2016, http://www.iariajournals.org/software/
2016, © Copyright by authors, Published under agreement with IARIA - www.iaria.org
Figures 15 and 16 show the SQL codes generated in the
EA tool as the last artifact of the MDA approach. Both the
code presented in Figure 15 and the one presented in Figure
16 originate in the PSM presented in Figure 13, however,
they have been separated for better understanding and
adequacy to the present study.
Figure 15 presents the SQL script responsible for the
creation of the database tables, in this case, Oracle Spatial.
Figure 15. DDL code for table creation.
The code presented in Figure 16 shows the changes made
to the tables created for the inclusion of Primary Keys and
Foreign Keys.
Figure 16. DDL code for table alteration.
As shown in Figure 7 (representing the PIM), Figure 13
(representing the PSM), and by codes 15 and 16 (representing
the SQL source code), the MDA transformation can be
performed in the PIM, PSM, and spatial SQL source code
steps using GeoProfile in the EA tool. However, the tool
enforces some restrictions; in the example at hand, the
transformation of the multiple geographic representation of
USE DATABASE Oracle;
DROP TABLE Deposit CASCADE CONSTRAINTS;
DROP TABLE CoalMine CASCADE CONSTRAINTS;
DROPTABLE CoalCompany CASCADE CONSTRAINTS;
DROP TABLE City CASCADE CONSTRAINTS;
CREATE TABLE Deposit
(
used BOOLEAN,
depositID NUMBER(8,2) NOT NULL,
DepositPolygon GM_Polygon
);
CREATE TABLE CoalMine
(
Active BOOLEAN,
explorationType NUMBER(8,2),
name VARCHAR(1),
coalMineID NUMBER(8,2) NOT NULL,
cityID NUMBER(8,2),
coalCompanyID NUMBER(8,2),
depositID NUMBER(8,2),
CoalMinePoint GM_Point
);
CREATE TABLE CoalCompany
(
compName VARCHAR(30),
production NUMBER(8,2),
productivity FLOAT(126),
workersNum NUMBER(8,2),
coalCompanyID NUMBER(8,2) NOT NULL,
cityID NUMBER(8,2)
);
CREATE TABLE City
(
cityArea FLOAT(126),
cityName VARCHAR(30),
functionalClass NUMBER(8,2),
history VARCHAR(30),
cityID NUMBER(8,2) NOT NULL,
CityPolygon GM_Polygon
);
ALTER TABLE Deposit
ADD CONSTRAINT PK_Deposit
PRIMARY KEY (depositID)
USING INDEX ;
ALTER TABLE CoalMine
ADD CONSTRAINT PK_CoalMine
PRIMARY KEY (coalMineID)
USING INDEX;
ALTER TABLE CoalCompany
ADD CONSTRAINT PK_CoalCompany
PRIMARY KEY (coalCompanyID)
USING INDEX;
ALTER TABLE City
ADD CONSTRAINT PK_City
PRIMARY KEY (cityID)
USING INDEX;
ALTER TABLE CoalMine
ADD CONSTRAINT FK_CoalMine_City
FOREIGN KEY (cityID)
REFERENCES City (cityID);
ALTER TABLE CoalMine
ADD CONSTRAINT
FK_CoalMine_CoalCompany
FOREIGN KEY
(coalCompanyID)
REFERENCES
CoalCompany(coalCompanyID);
ALTER TABLE CoalMine
ADD CONSTRAINT
FK_CoalMine_Deposit
FOREIGN KEY
(depositID)
REFERENCES Deposit (depositID);
ALTER TABLE CoalCompany
ADD CONSTRAINT
FK_CoalCompany_City
FOREIGN KEY (cityID)
REFERENCES City (cityID);

357
International Journal on Advances in Software, vol 9 no 3 & 4, year 2016, http://www.iariajournals.org/software/
2016, © Copyright by authors, Published under agreement with IARIA - www.iaria.org
the CoalMine class. Since the SQL code is generated from
the PSM model presented in Figure 6, the CoalMine table
does not have the spatial features Polygon and Point initially
specified in the PIM model. Despite this hurdle, the tool is
able to generate an SQL code for implementation in the
Oracle Spatial GDBMS.
The source code can be generated in the EA tool in several
ways, however, the DDL model provides no customization
option either for the PSM or SQL code generation.
Customization for PSM generation was only achieved by
using customizable templates, but, for now, SQL code
generation used only direct transformation of the tool through
the option Generate DDL.
It is evident that the option in the Settings/Code
Generation Templates menu will also provide customizable
languages and even the possibility of developing a new
specific language to transform the PSM diagram of
GeoProfile into a text file with the SQL source code for
database creation.
VII. CONCLUSIONS AND FUTURE WORK
From this paper, it is possible to observe that the tools
evaluated do not have features to meet all the theoretical
needs of UML, mainly regarding the use of profiles, MDA
and OCL. However, they all support conceptual GDB
modeling using GeoProfile.
The results of the comparison show that at the time this
paper was written the EA could be considered the best CASE
tool regarding transformations at the different MDA levels of
models created using the GeoProfile. The RSA can be
considered the tool that best supports OCL constraints due to
its semantic validation, which makes the conceptual models
less prone to errors. Among the free-software tools, Papyrus
stood out compared to StarUML for supporting the
GeoProfile.
Based on the results in this paper, a designer intending to
use GeoProfile can know which CASE tool currently best
meets the needs of the GDB project. However, it is important
to point out that all tools analyzed are being constantly
improved, which can change the results of this comparison at
any moment.
This study also showed that diagrams created based on
GeoProfile in the CASE Enterprise Architect tool can be
subjected to MDA transformations from the PIM up to the
SQL source code using customizable transformation
languages. Despite some momentary issues, such as a lack of
resources for the transformation of multiple stereotypes into
a class, the tool provides interesting resources to automate the
generation of all models of the MDA approach, which
ensures higher fidelity between what is specified at a high
level and what is actually implemented in the GDBMS.
The method employed, originally proposed by Paranhos
and Santos Neto [33], can be used for different comparisons
so that designers can establish their own requirements and
assign importance weights and satisfaction scales to each one.
Proposals for future works include enhancing the
transformation language presented to enable the
transformation of all GeoProfile stereotypes, which included
the temporal, network, field view, and topological
relationships aspects. In addition, it must be observed that,
from the PSM model, the transformation must consider the
data types used by the different GDBMSs both for the
conventional attributes and geographic and temporal ones.
Other work to be developed involves studies which are
being done and aim to reach interoperability of conceptual
geographical data models created from different conceptual
metamodels specific for geographical databases, whose
transformation base is the GeoProfile metamodel.
ACKNOWLEDGEMENTS
Project partially funded by the Brazilians agencies FAPEMIG and CAPES. We also thank the support of Faculdade Governador Ozanan Coelho (FAGOC) and CEMIG.
REFERENCES
[1] T. B. Ferreira, J. Lisboa and S. M. Stempliuc, “Evaluation of CASE Tools with UML Profile Support for Geographical Database Design,” Proc. of Geoprocessing, Venice, Italy, 2016, pp. 1-6.
[2] G. B. Sampaio, F. R. Nalon, and J. Lisboa-Filho, “GeoProfile-UML Profile for Conceptual Modeling of Geographic Databases,” Proc. Int. Conf. on Enterprise Information Systems (ICEIS), Funchal-Madeira, Portugal, 2013, pp. 409-412.
[3] F. R. Nalon, J. Lisboa-Filho, K. A. V. Borges, J. L. Braga, and M. V. A. Andrade, “Using MDA and a UML Profile integrated with International Standards to Model Geographic Databases,” Proc. Brazilian Symposium on Geoinformatics (GeoInfo), 2010, pp. 146-157.
[4] P. A. Longley, M. F. Goodchild, D. J. Maguire, and D. W. Rhind, Geographic Information Science and Systems, Danvers: Wiley, 2010.
[5] G. Câmara, “Computational representation of spatial data,” In: M. A. Casanova, G. Câmara, C. A. Davis Jr., L. Vinhas, and G. R. Queiroz (Org.), “Bancos de Dados Geográficos”. Curitiba: EspaçoGeo, cap. 1, 2005, pp. 1-44. (in Portuguese)
[6] E. Clementini, P. Di Felice, and P. Oosterom, “A Small Set of Formal Topological Relationships Suitable for End-User Interaction,” Proc. Int. Symposium on Advances in Spatial Databases, 1993, p. 277-295.
[7] M. J. Egenhofer and R. D. Franzosa, “Point-set topological spatial relations,” International Journal of Geographic Information Systems, vol. 5, no. 2, 1991, pp. 161-174.
[8] A. A. A. Ribeiro, S. M. Stempliuc, and J. Lisboa-Filho, J., “Extending OCL to specify and validate integrity constraints in UML-GeoFrame conceptual data model,” Proc. Int. Conf. on Enterprise Information Systems (ICEIS), Angers Loire Valley, France, 2013, pp. 329-336.
[9] R. Kothuri, A. Godfrind, and E. Beinat, Pro Oracle Spatial for Oracle Database 11g, USA: Apress, 2007.
[10] A. Kleppe, J. Warmer, and W. Bast, MDA Explained: The Model Driven Architecture: Practice and Promise, Boston: Addison-Wesley, 2nd ed., 2003.
[11] OMG., MDA Guide, OMG Document formal/2003-06-01 edition, Needham, MA, USA, Version 1.0.1, 2003.
[12] G. Booch, J. Rumbaugh, and I. Jacobson, UML: user guide, Elsevier. Rio de Janeiro, 2nd ed., 2005.
[13] J. Warmer and A. Kleppe, The Object Constraint Language: Getting Your Models Ready for MDA, Boston: Addison Wesley, 2nd ed., 2003.

358
International Journal on Advances in Software, vol 9 no 3 & 4, year 2016, http://www.iariajournals.org/software/
2016, © Copyright by authors, Published under agreement with IARIA - www.iaria.org
[14] OMG., Object Constraint Language, OMG Document formal/2006-05-01 edition, Needham, MA, USA. Version 2.0, 2006.
[15] OMG., Object Constraint Language, OMG Document formal/2014-02-03 edition, Needham, MA, USA. Version 2.4, 2014.
[16] H. Eriksson, et al., “UML 2 Toolkit”, Wiley Publishing. Indianapolis. 552p, 2004.
[17] J. Lisboa Filho, G. B. Sampaio, F. R. Nalon, and K. A. V. Borges, “A UML profile for conceptual modeling,” Proc. Int. Workshop on Domain Engineering (DE@CAISE), 2010, pp. 18-31.
[18] F. R. Nalon, J. Lisboa-Filho, J. L. Braga, K. A. V. Borges, and M V. A. Andrade, “Applying the model driven architecture approach for geographic database design using a UML Profile and ISO standards,” Journal of Information and Data Management, vol. 2, no. 2, 2011, pp. 171-180.
[19] Sparx Systems, Enterprise Architect 12.1. [Online]. Available from: http://www.sparxsystems.com.au/ 2016.04.13
[20] T. B. Ferreira, S. M. Stempliuc, and J. Lisboa-Filho, “Data Modeling with UML Profile GeoProfile and Transformations in MDA tool Enterprise Architect,” Actas. Conferencia Ibérica de Sistemas y
Tecnologías de Informacion (CISTI), Barcelona, AISTI | ISEGI, 2014, pp. 603-608.
[21] Eclipse Foundation, Papyrus Modeling Environment. [Online]. Available from: http://www.eclipse.org/papyrus/ 2016.04.13
[22] Star UML, StarUML 2: A sophisticated software modeler. [Online]. Available from: http://staruml.io/ 2016.04.13
[23] Visual Paradigm International, Visual Paradigm, [Online]. Available from: https://www.visual-paradigm.com/ 2016.04.13
[24] IBM, Rational Software Modeler. Rational Software Architect Family. [Online]. Available from: http://www-03.ibm.com/software/products/en/rational-software-architect-family 2016.04.13
[25] R. D. D. Paranhos and I. Santos Neto, Comparative study of change control tools in the software development process, Salvador: Universidade Católica do Salvador, 2009.
[26] J. H. S. Câmara, T. Almeida, D. R. Carvalho, et al., “A comparative analysis of development environments for voluntary geographical information Web systems,” Proc. of Brazilian Symposium Geoinformatics (GEOINFO), 2014, pp. 130-141

359
International Journal on Advances in Software, vol 9 no 3 & 4, year 2016, http://www.iariajournals.org/software/
2016, © Copyright by authors, Published under agreement with IARIA - www.iaria.org
Semi-Supervised Ensemble Learning in the Framework of Data 1-D Representations
with Label Boosting
Jianzhong Wang
College of Sciences andEngineering Techonology
Sam Houston State UniversityHuntsville, TX 77341-2206, USA
Email: [email protected]
Huiwu Luo, Yuan Yan Tang
Faculty of Science and TechnologyUniversity of Macau, Macau, China
Email: [email protected]@umac.mo
Abstract—The paper introduces a novel ensemble method forsemi-supervised learning. The method integrates the regularizedclassifier based on data 1-D representation and label boosting ina serial ensemble. In each stage, the data set is first smoothlysorted and represented as a 1-D stack, which preserves the datalocal similarity. Then, based on these stacks, an ensemble labeleris constructed by several 1-D regularized weak classifiers. The1-D ensemble labeler extracts a newborn labeled subset from theunlabeled set. United with this subset, the original labeled set isboosted and the enlarged labeled set is utilized into the next semi-supervised learning stage. The boosting process is not stoppeduntil the enlarged labeled set reaches a certain size. Finally, a 1-Densemble labeler is applied again to construct the final classifier,which labels all unlabeled samples in the data set. Taking theadvantage of ensemble, the method avoids the kernel trick that isthe core in many current popular semi-supervised learning meth-ods such as Transductive Supported Vector Machine and Semi-Supervised Manifold Learning. Because the proposed algorithmonly employs relatively simple semi-supervised 1-D classifiers, itis stable, effective, and applicable to data sets of various types.The validity and effectiveness of the method are confirmed by theexperiments on data sets of different types, such as handwrittendigits and hyperspectral images. Comparing to several otherpopular semi-supervised learning methods, the results of theproposed one are very promising and superior to others.
Keywords–Data smooth sorting; one-dimensional embedding;regularization; label boosting; ensemble classification; semi-supervised learning.
I. INTRODUCTION
In this paper, we introduce a novel ensemble method forsemi-supervised learning (SSL) based on data 1-D represen-tation and label boosting, which is abbreviated to ESSL1dLB.A preliminary discussion of the topic has been present in theconference presentation [1]. The purpose of this paper is toprovide an extension with some new developments.
A standard SSL problem can be briefly described as fol-lows: Assume that the samples (or members, points) of a givendata set X = ~xini=1 ⊂ Rm belong to c classes and B =b1, · · · , bc is the class-label set. Let the labels of the samplesin X be y1, y2, · · · , yn, respectively. When X is observed, onlythe samples of a subset, say, X` = ~x1, ~x2, · · · , ~xn0
⊂ Xhave the known labels Y` = y1, y2, · · · , yn0
⊂ B, whilethe labels of the samples in its complementary set Xu =~xn0+1, ~xn0+2, · · · , ~xn = X \X` are unknown. A function
f : X → B is called a classifier (or labeler) if it predicts thelabels for all samples in Xu. The classification error usuallyis measured by the number of the misclassified samples:
E(f) = |~xi ∈ X| f(~xi) 6= yi, 1 ≤ i ≤ n| ,
where |S| denotes the cardinality of a set S. Then, the qualityof a classifier is measured by the classification error rate(CErrRate) E(f)/|X|. The task of SSL is to find a classifierf with the CErrRate as small as possible.
In a SSL problem, if the samples of X only belong totwo classes, say, Class A and Class B, it is called a binaryclassification problem. In this case, we may assign the sign-labels 1 and −1 to Classes A and B, respectively. In abinary classification problem, the error of a classifier f canbe estimated by the `0 error:
E(f) =
n∑k=1
sign(|f(~xi)− yi|).
It is worth to point out that the binary classification isessential in SSL. When the samples of X belong to morethan two classes, we can recursively apply binary classificationtechnique to achieve multi-classification [2], [3]. In a binaryclassification model, the classifier f on X usually is designedto a continuous real-valued function. The sign f(~x) then givesthe class label of ~x so that the decision boundary is determinedby the level-curve f(~x) = 0
SSL models make use some assumptions. The main oneis the smoothness assumption, which asserts that the samplesin the same class are similar while those in different classesare dissimilar. It enables us to design classifiers in a smoothfunction space, say, Soblev space. Its special case is thecluster assumption, which asserts that the data tend to formdiscrete clusters, and points in the same cluster are mostlikely in the same class. Clustering models are based on thisassumption. When the dimension of data is high, due to thecurse of dimensionality [4], [5], most computations on the databecome inaccurate and unstable. According to the manifoldassumption, the high-dimensional data lie approximately on amanifold of much lower dimension. Therefore, the dimension-ality reduction technique should be utilized in SSL models.
Many statistical and machine learning methods for SSLwere proposed in the last two decades. The monograph [6]

360
International Journal on Advances in Software, vol 9 no 3 & 4, year 2016, http://www.iariajournals.org/software/
2016, © Copyright by authors, Published under agreement with IARIA - www.iaria.org
and the survey paper [7] gave a comprehensive review ofvarious SSL methods. Geometrically, the main difficult inSSL is the nonlinearity of the decision boundary. In gen-eral, it is a combination of several disjoint surfaces in Rm.To overcome the difficult, many popular methods, such astransductive support vector machines, manifold regularization,and various graph-based methods, utilize so-called kernel trickto linearize the decision boundary [8], [9]. That is, in sucha model, with the help of a kernel function, one constructsa reproducing kernel Hilbert space (RKHS) [10], where theclassifier is a linear function so that it can be constructedby a regularization method. The success of a kernel-basedmethod strongly depends on the exploration of data structureby the kernel. However, it is often difficult to design suitablekernels, which precisely explore the data features. Therefore,recently researchers try to establish new SSL models, in whichclassifiers are constructed without kernel technique. Thesemodels include the data-tree based method [11], [12], SSLusing Gaussian fields [13], and others.
In most of the models above, a single classifier is con-structed for a given SSL task. However, when a data sethas a complicate intrinsic structure, a single classifier usuallycannot complete the task satisfactorily. The multiple classifiersystems (MCSs) offer alternatives. The ensemble methodologyin MCSs builds a single strong classifier by integrating severalweak classifiers. Although each weak classifier is slightlycorrelated with the true classification, the strong classifier iswell-correlated with the true one. MCSs perform informa-tion fusion at different levels to overcome the limitations ofthe traditional methods [14]–[16]. In MCSs two canonicaltopologies, parallel and serial ones, are employed in theensemble (see Fig. 4 in [15]). In the parallel topology, allweak classifiers are built on the same data set and the strongclassifier is made by a combination of their outputs. On theother hand, in the serial topology, the weak classifiers areapplied in sequence, such that the output of the predecessorturns to be the input of the successor, and the final labelprediction comes from the last weak classifier. Originally,ensemble algorithms are developed for supervised learning. Awell-known parallel ensemble algorithm is bagging (bootstrapaggregating) [14], [17]. Boosting algorithms, such as AdaBoost[18], LPBoost, LSBoost, RobustBoost, and GentleBoost, applyserial ensemble. Due to the flexibility, MCSs open a wide doorfor developing various ensemble SSL algorithms.
The novelty of the introduced ensemble SSL method is thefollowing: It adopts the framework of data 1-D representation,in which the data set is represented by several different 1-D sequences, then a labeler is constructed as an ensembleof several weak classifiers, which are built on these 1-Dsequences. Here, we are partial to data 1-D models because 1-D decision boundary reduces to a set of points on a line, whichhas the simplest topological structure. As a result, the weakclassifiers can be easily constructed by standard 1-D regular-ization methods without using kernel trick. Furthermore, thesimplicity of 1-D models makes the algorithm more reliableand stable. Hence, the core of our method is an ensemblebinary classification algorithm for SSL, whose architecture andtechnological process are described in the following.
1) Making data 1-D (shortest path) representation.The data set X first is smoothly sorted and mapped toseveral 1-D sets T iki=1, of which each preserves the
local similarity of members in X . Correspondingly,the couple X`, Xu is mapped to T i` , T iu suchthat T i` ∪ T iu = T i. The 1-D sets T iki=1 providea framework of our method.
2) Constructing ensemble labeler in the 1-D frame-work. Based on T i, a weak classifier gi on X isconstructed by a 1-D regularization method. Then anensemble labeler is built from these weak classifiers.From the unlabeled set Xu, the labeler extracts afeasibly confident subset L, which contains the sam-ples, whose predicted labels are accurate with highconfidence.
3) Developing label boosting algorithm. A label se-lection function is constructed to select the newbornlabeled subset S from the feasibly confident subsetL to reduce the misclassification error. It computesclass weights of the members of L for selectiondecision. Then, the initial labeled set X` is boostedto Xnew
` = X` ∪ S. The process is repeated and notterminated until the boosted labeled set Xnew
` reachesa certain size.
4) Building the final (strong) classifier. Finally, severalweak classifiers gi are constructed based on the finalupdated labeled set Xnew
` . The final classifier f isdefined as the mean of these weak classifiers.
Our strategy in the binary classification algorithm above adoptsModel-guided Instance Selection approach to boosting [14].But it is slightly different from the standard boosting algo-rithms [19] in the sense that they boost the misclassifiedweights on Xu, while our method boosts the labeled subset X`.The preliminary work of the proposed method can be foundin [20]–[23].
In this paper, we employ the well-known One-Against-Allstrategy [2] to deal with multi-classification using a combina-tion of binary classifications.
The paper is organized as follows: In Section II, weintroduce our ensemble SSL method in details and presentthe corresponding ESSL1DLB algorithm. In Section III, wedemonstrate the validity of our method in examples and givethe comparison of our results with those obtained by severalpopular methods. The conclusion is given in Section IV.
II. ENSEMBLE SSL METHOD IN FRAMEWORK OF DATA1-D REPRESENTATION WITH LABEL BOOSTING
In this section, we introduce the novel ensemble SSLmethod based on data 1-D representation and label boosting.The main steps of the method has been introduced in the previ-ous section. We now introduce the method and correspondingalgorithm in details.
A. Data 1-D representations by shortest path sortingAssume that the data set X is initially arranged in a stack
x = [~x1, · · · , ~xn]. Let w(~x, ~y) be a distance-type weightfunction on X × X that measures the dissimilarity betweenthe samples ~x and ~y. Let π be an index permutation of theindex sequence [1, 2, · · · , n], which induces a permutation Pπon the initial stack x, yielding a stack of X headed by ~xπ(1):xπ = Pπx = [~xπ(1), · · · , ~xπ(n)]. We denote the set of allpermutations of X with the head ~x` by
P` = Pπ; π(1) = `.

361
International Journal on Advances in Software, vol 9 no 3 & 4, year 2016, http://www.iariajournals.org/software/
2016, © Copyright by authors, Published under agreement with IARIA - www.iaria.org
According to [24], the shortest-path sorting of X headedby ~x` is the stack xπ that minimizes the path startingfrom ~x` and though all points in X , i.e., xπ = Pπx =[~xπ(1), ~xπ(2), · · · , ~xπ(n)], where
Pπ = arg minP∈P`
n−1∑j=1
w((Px)j , (Px)j+1). (1)
Define the 1-D sequence t = [t1, · · · , tn] by
t1 = 0, tj+1 − tj =w(~xπ(j), ~xπ(j+1))∑n−1k=1 w(~xπ(k), ~xπ(k+1))
. (2)
Then, the 1-D stack t provides the 1-D (shortest-path) rep-resentation of X headed by ~x`. We call the function h` :X → [0, 1], h`(~xπ(j)) = tj the (isometric) 1-D embedding ofX headed by ~x`. When the index ` is not stressed, we willsimplify h` to h.
The sorting problem (1) essentially is a traveling salesmanproblem, which has NP computational complexity. To reducethe complexity, approximations of Pπ in (1) are adopted.For instance, a greedy algorithm for the approximation wasdeveloped in [24] for sorting all patches in an image. In thispaper, we slightly modify the algorithm in [24] so that it worksfor data sets that are represented by weighted data graphs. Wefirst see how to construct weighted graphs for two populartypes of data sets:
1) The data set forms a point cloud X ⊂ Rm
equipped with a metric. To construct a weightedgraph [X,E,W ] on X , we identify a point ~x witha node in the graph so that X can be considered asa set of nodes in the graph. By the metric on X ,we derive a distance-type weight function d(~x, ~y) onX×X , which measures the dissimilarity between thesamples in X . For any ~x ∈ X , the k nearest neighbors(kNN) of the node ~x is denoted by N~x ⊂ X . Assumethat |X| = n, and set I = 1, 2, · · ·n. Then the edgeset in the graph is E = (i, j) ∈ I × I; ~xj ∈ N~xi.Finally, we define the weight matrix W = [wij ]
ni,j=1,
where wi,j = d(~xi, ~xj).2) The data set is a hyperspectral image (HSI) rep-
resented as an imaginary cube X ∈ Rm×n×s. Inthe cube, the (i, j)-pixel, X(i, j, :), is a spectralvector; and the spatial neighbors of X(i, j, :) usuallyis defined as the pixel-square centered by X(i, j, :):N(i,j) = X(k, l, :); |k − i| ≤ q, |l − j| ≤ q,where q is a preset positive integer. For a given HSIcube X , we construct the weighted graph [X,E,W ]as follows: We first map the double index (i, j) tothe single one k = i + (j − 1)m. Then we write~xk = X(i, j, :) and convert the 2-D neighborhoodto the 1-D one: N~xk = N(i,j), which defines theedge set E. For a HSI data set, there are variousways to define the distance-type weights on edges.We propose the spectral-spatial weights introducedin the paper [22]. Similar to the first case, the nodeset X = ~xk; 1 ≤ k ≤ nm, the edge set E and theweight set W form a weight graph [X,E,W ] on theHSI cube X .enumerate
Note that the edge set E in the graph [X,E,W ] induces anindex neighbor set from a node neighbor. For instance, the
index set Nk = j; (k, j) ∈ E is corresponding to theneighbor set N~xk . Using index neighbors to replace the nodeneighbors can simplify code writing. If the graph [X,E,W ]is complete, then the neighbor set of each node ~x is the setX\~x, which leads to the global search scheme in the greedyalgorithm.
Adopting weighted data graph [X,E,W ] as the input ofthe greedy sorting algorithm enables us to apply the algorithmto various data sets. For instance, it can be applied to thedata set X , whose samples cannot be digitally represented byvectors, but the similarity between them can be measured. Forthis type of data, although X is not digitized, the algorithmworks. Many data sets obtained by social survey are in thiscategory.
The pseudocode of our data 1-D (shortest-path) representa-tion (1dSPR) algorithm is presented at Algorithm 1, in whichε is called the path selection parameter. Since the algorithmis a slight modification of that one in [24], we omit the detailsof the explanation of the parameter settings here.
Algorithm 1 1dSPR Algorithm
Require: Data graph [X,E,W ]; probability vector p =[p1, p2, · · · , pn], where pi ∈ (0, 1), and n = |X|.
1: Initialization of Output: π: empty index stack; t: n-dimensional zero vector.
2: Set π(1)← j, j: random index; and set t1 = 0.3: Define I = 1, 2, · · · , n.4: for k = 1, 2, · · · , n− 2 do5: • set N c
π(k) = Nπ(k)\π; Ic = I\π6: • if |N c
π(k)| = 17: — π(k + 1)← j ∈ N c
π(k)8: • else9: — if |N c
π(k)| ≥ 210: * Find j1 ∈ N c
π(k) such that ~xj1 is the nearestneighbor to ~xπ(k) in N c
~xπ(k)
11: * Find j2 ∈ N cπ(k) such that ~xj2 is the second nearest
neighbor to ~xπ(k) in N c~xπ(k)
12: — elseif |N ck | = 0
13: * Find j1 ∈ I\π such that, in all nodes with indicesin I\π, ~xj1 is the nearest node to ~xπ(k)
14: * Find j2 ∈ I\π such that, in all nodes with indicesin I\π, ~xj2 is the second nearest node to ~xπ(k)
15: — endif16: • endif17: Compute qk:
qk =1
1 + exp(w(~xπ(k),~xj1 )−w(~xπ(k),~xj2 )
ε
) (3)
18: Set π(k + 1) =
j2 if qk < pπ(k)
j1 otherwise.19: Set tk+1 = tk + w(~xπ(k), ~xπ(k+1)).20: end for21: Set π(n)← j ∈ I\π, tn = tn−1 + w(~xπ(n−1), ~xπ(n)).22: Normalize vector t: tj ← tj/tnEnsure: t; π.
Because sorting scheme is a serial process, it is a bias in thesense of smoothness. That is, in general the difference ∆tj =

362
International Journal on Advances in Software, vol 9 no 3 & 4, year 2016, http://www.iariajournals.org/software/
2016, © Copyright by authors, Published under agreement with IARIA - www.iaria.org
tj+1 − tj is increasing with respect to j, i.e., earlier selectedadjacent pairs are more similar than the later selected ones.This bias impacts cluster preserving when X is representedby T .
Enlightened by the spinning technique [25], we introducemultiple 1-D embedding of X to reduce the sorting dias. Let~xj1 , ~xj2 , · · · , ~xjk be a subset of X selected at random, andhi be the 1-D embedding headed by ~xji . We call k the spinningnumber and the vector-valued function ~h = [h1, h2, · · · , hk]a k-ple 1-D embedding of X . Then ~h(X) gives a k-ple 1-Drepresentation of X .
B. Construction of ensemble labeler from weak classifiers ondata multiple 1-D representation
Let h be a (single) 1-D embedding of X (with |X| = n).We write T` = h(X`) and Tu = h(Xu). Then, T` is a labeledset and Tu is an unlabeled set, and a labeler on T induces alabeler on X . Since T is a 1-D set, its class decision boundaryis reduced to a point set in the line segment [0, 1]. Therefore, nokernel trick is needed for constructing a labeler on T . Instead,a simple regularization scheme works.
As we mentioned above, a single 1-D representation maynot truly preserve the data similarity because the sorting bias.In the proposed method, we create a multiple 1-D represen-tation of X , and construct a weak labeler based on each ofthem. Then, from these weak labelers, we build an ensemblelabeler (1dEL), which better predicts the labels of the samplesin the unlabeled set Xu. The following is the details of 1dELAlgorithm.
Let ~h = [h1, · · · , hk] be a k-ple 1-D embedding of X withthe head stack [~xj1 , ~xj2 , · · · , ~xjk ]. Let Pi be the permutationoperator corresponding to hi and xπi = Pix. The embeddinghi produces a 1-D representation of X: ti = hi(xπi), and anyfunction f on X through hi derives a function si = f h−1ion ti. Equivalently, f = si hi, which given the relation ofa labeler on ti and a labeler on X . Since ti is a discreteset, we can represent the function si on ti in the vector formsi = [si1, · · · , sin], where sij = s(tij).
To construct the labelers on ti, we define the first-orderdifference of si (at tij) by ∆sij = s(tij+1)−s(tij), and the first-order difference quotient by Dsj = (s(tij+1)− s(tij))/(tij+1−tij). Inductively, we define the kth-order difference of si (at tij)by ∆ksij = ∆k−1sij+1−∆k−1sij and the kth-order differencequotient by Dksij = (Dk−1sij+1−Dk−1sij)/(t
ij+k− tij). They
describe various smoothness of sj . Let T i` = hi(X`) and T iu =hi(Xu). As we have mentioned, a weak labeler gi on X canbe constructed as the composition gi = qi hi, where qi is alabeler on ti. We construct qi using one of the following 1-Dregularization models:
1. Least-square regularization. Let qi be the solution ofthe following unconstrained minimization problem:
qi = arg min1
n0
n0∑j=1
(si(hi(~xj))− yj
)2+λ
2
n−1∑j=1
(Dsij)2, (4)
where λ is the standard regularization parameter. We denoteby In0
the n×n diagonal matrix, in which only (πi(j), πi(j))-entries are 1, 1 ≤ j ≤ n0, but others are 0. Set w0 = wn =
0, wj = 1/(tij+1 − tij)2, and denote by D = [Di,j ] the n× nthree-diagonal matrix, in which
Dj,j = wj−1 + wj 1 ≤ j ≤ n,Dj,j+1 = Dj+1,j = −wj 1 ≤ j ≤ n− 1,
Then, the vector representation of qi on the stack ti is
qi = (In0+ n0λD)
−1~y. (5)
Assume that the class distribution on Xu is the same as onX`. Let M = 1
n0
∑n0
j=1 yj . Then we may add the constraint
1
n
n∑j=1
si(tij) = M
to the minimization problem (4). Correspondingly, the solution(5) is modified to
qi = (In0 + n0λD)−1
(~y + µ~1) (6)
with
µ =M − E
((In0 + n0λD)−1~y
)E(
(In0+ n0λD)−1~1
) ,
where ~1 denotes the vector whose all entries are 1 and E(~v)the mean value of the vector ~v.
Remark: In the Least-square regularization model (4), thedifference quotient term (Dsij)
2 may also be replaced by thedifference term (∆sij)
2. This replacement is equivalent to usingthe equal-distance sequence ti in (4).
2. Regularization by interpolation. Let qi be the solutionof the following constrained minimization problem:
qi = arg min
n−2∑j=1
(D2sij)2 (7)
subject tosi(hi(~xj)) = yj , 1 ≤ j ≤ n0. (8)
Write tj = hi(~xj). Then qi is the cubic spline that has thenodes at tjn0
j=1 and takes the values as in (8).Let i run through 1 to k. Then we obtained k 1-D labelers
q1, · · · , qk. They further derive k weak labelers gi = qi h−1i , 1 ≤ i ≤ k, on X . We will use [g1, · · · , gk] in two cases.Firstly, in the label boosting precess, they are used to constructthe feasibly confident subset. Recall that each gi predicts thelabel sign(gi(~x)) for ~x ∈ Xu. Let
g(~x) =1
k
k∑i=1
sign(gi(~x)), ~x ∈ Xu, (9)
and define
L+ = ~x ∈ Xu; g(~x) = 1, L− = ~x ∈ Xu; g(~x) = −1.
Then we call L+ the feasibly confident subset of Class A, L−the feasibly confident subset of Class B, and L = L+∪L− thefeasibly confident subset. In a great chance, a sample in L+ isin Class A, while a sample in L− in Class B. For convenience,we denote the set operator that create the feasibly confidentsubset L from Xu by G : G(Xu) = L.

363
International Journal on Advances in Software, vol 9 no 3 & 4, year 2016, http://www.iariajournals.org/software/
2016, © Copyright by authors, Published under agreement with IARIA - www.iaria.org
Secondly, we use [g1, · · · , gk] to construct the final classi-fier f in the last step of our algorithm as follows:
f(~x) =1
k
k∑i=1
gi(~x), ~x ∈ Xu. (10)
C. Label boosting
To further eliminate the misclassification in L+ and L−,we will construct a subset S+ ⊂ L+ and a subset S− ⊂ L− asfollows: Let X+
` ⊂ X` be the subset that contains all Class-Amembers and X−` ⊂ X` the subset that contains all Class-Bmembers. For each ~x ∈ L, define
w+(~x) =
∑~y∈X+
`w(~x, ~y)
|X+` |
and
w−(~x) =
∑~y∈X−
`w(~x, ~y)
|X−` |.
We now create the class weight function by
w(~x) =w+(~x)
w+(~x) + w−(~x).
It is obvious that a greater value of w(~x) indicates that ~x isnearer the points in X−` . Therefore, it is more likely in ClassB. Let the set S+ contain the half of members of L+ with thesmallest class weights and S− contain the half of membersin L− with the greatest class weights. We call S = S+ ∪ S−the newborn labeled subset, call the operator S : S(L) = Sa newborn labeled subset selector, and call the compositionM= S G a newborn labeled subset generater. Therefore,we have the newborn labeled set S = S(L) = S(G(Xu)) =M(Xu).
The Label Boosting Algorithm iteratively adds the newbornlabeled subset to the original labeled set so that the labeled setis cumulatively boosted. In detail, let the initial labeled set x`and the unlabeled set X − u be re-written as X0
` and X0u, re-
spectively. We apply the newborn labeled subset generater M1
on X0u to create a newborn labeled set S1 = M1(X0
u), whichis united with X0
` to produce X1` = X0
` ∪ S1. Meanwhile, weset X1
u = X0u \ S1. Repeating the procedure for N times, the
labeled set will be cumulatively boosted to a enlarged labeledset
XN` = X0
`
N⋃j=1
Sj , Sj = Mj(Xj−1u ). (11)
We set a boosting-stop parameter p, 0 < p < 1. The processwill not be terminated until the labeled set XN
` reaches thesize |XN
` | ≥ p|X|. We call N the label boosting times.
D. Construction of the final classifier
Finally, we apply 1dEL algorithm on the coupleXN
` , XNu to construct the final classifier f by (10). Then
each ~x ∈ X is labeled by sign f(~x).
The whole algorithm that creates the final classifier f iscalled ESSL1dLB.
E. One-Against-All strategy for multi-classificationMany strategies are proposed in literature for handling
multi-classification using binary ones [26]–[29]. We apply thewell-known One-Against-All strategy for multi-classificationtasks [2], [30], [31]. In the paper, we choose the simplest one,which is briefly described in the following:
Assume that X consists of c-classes (c > 2): Class 1to Class c. Using ESSL1dLB, we create c binary classifierf1, f2, · · · , fc , where fi classifies two classes: Class A isidentical with Class i, and Class B contains all of other classes,as we described above. A simple one-vs-all classificationstrategy is the following: Let f be the multi-classifier. Then
f(~x) = arg max1≤i≤c
fi(~x).
III. EXPERIMENTS ON HYPERSPECTRAL IMAGES
In this section, we evaluate our ensemble SSL method inthe experiments on hyperspectral images. An earlier method inthe ensemble SSL framework for the classification of hyper-spectral images has been reported in [22], where we used theinterpolation splines as 1-D weak labelers (see (7)) and adoptedthe following simpler label boosting method: Choosing thenewborn labeled subset at random. The obtained results arestill very promising and superior over many other popularmethods. In this section, we apply ESSL1dLB algorithm forthe multi-classification of hyperspectral images. There are twomain differences between ESSL1dLB and the algorithm usedin [22]: Firstly, the ESSL1dLB algorithm uses Least-squareregularization for the construction of weak labelers (see (4)).Secondly, it uses the class-weight method for label boosting.
In this section, we first introduce the data formats and themetrics of the data sets used in our experiments. Then we tunethe parameters in the ESSL1dLB algorithm. Finally, we reportthe results of the experiments and comparisons.
(a) (b)
1−Alfalfa
2−Corn−notill
3−Corn−mintill
4−Corn
5−Grass−pasture
6−Grass−trees
7−Grass−pasture−mowed
8−Hay−windrowed
9−Oats
10−Soybean−notill
11−Soybean−mintill
12−Soybean−clean
13−Wheat
14−Woods
15−Buildings−Grass−Trees−Drives
16−Stone−Steel−Towers
(c)
Figure 1. RGB composition and classification map for AVIRIS Indian Pines1992 scenario. (a) Pseudocolor image. (b) Ground truth map. (c) Class
labels.
A. Data Collection and Experiment DesignAll of the data sets used in the experiments are published
for research usage only. Three hyperspectral images are chosenfor our experiments, which are particularly designed.
1) Data sets: The first data set used in our experimentsis the AVIRIS Indian Pines 1992, which was gathered by theNational Aeronautics and Space Administration’s (NASA) Air-borne Visible/Infrared Imaging Spectrometer (AVIRIS) sensorover the northwestern Indian Pines test site in 1992. The rawcalibrated data are available on-line from [32] with the ground-truth class map. This data set consists of 145 × 145 pixelsand 224 spectral reflectance bands in the wavelength range

364
International Journal on Advances in Software, vol 9 no 3 & 4, year 2016, http://www.iariajournals.org/software/
2016, © Copyright by authors, Published under agreement with IARIA - www.iaria.org
(a) (b)
1−Brocoli8green8weeds81
2−Brocoli8green8weeds82
3−Fallow
4−Fallow8rough8plow
5−Fallow8smooth
6−Stubble
7−Celery
8−Grapes8untrained
9−Soil8vinyard8develop
10−Corn8senesced8green8weeds
11−Lettuce8romaine84wk
12−Lettuce8romaine85wk
13−Lettuce8romaine86wk
14−Lettuce8romaine87wk
15−Vinyard8untrained
16−Vinyard8vertical8trellis
(c)
Figure 2. RGB composition and classification map for Salinas scenario. (a)Pseudocolor image. (b) Ground truth map. (c) Class labels.
(a) (b)
1−Asphalt
2−Meadows
3−Gravel
4−Trees
5−Painted8metal8sheets
6−Bare8Soil
7−Bitumen
8−Self−Blocking8Bricks
9−Shadows
(c)
Figure 3. RGB composition and classification map for Pavia University scenescenario. (a) Pseudocolor image. (b) Ground truth map. (c) Class labels.
0.4 × 10⁻⁶ ∼ 0.6 × 10⁻⁶ meters, representing a vegetation-classification scenario. Among all pixels, two thirds are agri-culture and one third is forest and other natural perennialvegetation. The image also contains two major dual lanehighways, a rail line, some houses and other buildings withlow density, and a few local roads. These objects are treatedas background so that they will not be classified. When theimage was captured, the main crops of soybean and cornare in their early stage of growing. We use the no-till, min-till, and clean-till denote the different growing status of thecrops. The water absorption bands (104-108, 150-163, 220) areremoved before experiment since they are useless bands for theclassification. Hence, the exact 204 spectral bands are used. Inthe experiments, totally 10,249 (labeled) pixels are employedto form the data set X , in which about 10% are selected inthe labeled set X` and the remains form the unlabeled setXu in the test. The ground truth image contains 16 classes.Fig. 1 consists of three sub-images: (a) the pseudocolor imageof Indian Pines; (b) the ground true map of the classifications;and (c) the color bar of 16 classes.
The second data set used in our experiments is the AVIRISSalinas scenario, which was captured by the AVIRIS sensorover Salinas Valley, California, USA, with a spatial resolutionof 3.7 meter per pixels. This data set has totally 224 bandsof size 512 × 217. The 20 watered absorption bands (108-112, 154-167, 224) are excluded in experiment. Moreover,this scene was available only as at-sensor radiance data. Itincludes vegetables, bare soils, and vineyard fields. Totally 16
classes are included in this data set. Fig. 2 shows (a) the colorcomposite of the Salinas image, (b) the ground truth map, and(c) the color bar of 16 classes.
The third data set Pavia University scene was captured bythe Reflective Optics System Imaging Spectrometer (ROSIS-03) optical satellite sensor, which provides 115 bands HSI dataduring a flight campaign over the Pavia of the northern Italy.The size of Pavia University scene is 610×340 with 115 bands.In the experiment, 12 polluted bands are removed since theyhave no contribution for the classification. Likewise, some ofthe samples are treated as background since they are not inthe classes we need to determine. The geometric resolution ofthe scenes is 1.3 meters per pixel, covering the wave rangesfrom 0.43 µm to 0.86 µm. The pixels of the HSI image cover 9classes excluding the background. Fig. 3 shows the pixels usedin the experiment in (a) pseudo-color image, (b) the groundtruth map, and (c) the class bar of all classes, respectively.
2) Metrics on the data sets: It is a common sense thatthe performance of a classification scheme for HSI images isheavily relied on the quality of metric on HSI data [33]. Manyexperiences show that the standard Euclidean distance betweenthe spectral vectors (pixels) of a HSI image may not representthe exact similarity. The main reason is that the spectral vectorsin the HSI image are departed from their truthes by the noise.Note that a pixel in the spatial neighborhood of a pixel ~x ismost likely in the same class as ~x. Since the spatial positions ofpixels are not impacted by noise, merging the spatial distanceinto the spectral one can correct the derivation caused by noise.In this paper, we adopt the following spectral-spatial affinitymetric:
wij(~xi, ~xj) = wrij(~xi, ~xj) + µwsij(~xi, ~xj), (12)
where wrij and wsij are radian weight (or spectral distance)and spatial weight (a distance-type weight), respectively, and0 ≤ µ ≤ 1/2 is the weight balance parameter that measuresthe strength of the spatial prior.(in the paper, we set µ = 1/2).
The radian weight wrij is defined by the following:
wrij(~xi, ~xj) = 1− exp
(−‖~xi − ~xj‖
2
ρiρj
)(13)
where ρi denotes the local scaling parameter with respect to~xi defined by
ρi = ‖~xi − ~xsi‖, (14)
where ‖∗‖ denotes the l2 norm, ~xsi is the s-th nearest neighborof ~xi, and s is a preset positive odd integer (in our experiment,s = 5), called spectral-weight parameter. The distance in (13)is call a diffusion distance. It is more consistent of the manifoldstructure of data. More details on the spectral distance designare refer to [34].
The spatial weight in the paper is defined as follows: Wefirst construct a spatial neighborhood system on HSI. Let ~xiand ~xj have the 2D index i = (i1, i2) and j = (j1, j2) in theHSI image X , respectively. Let r > 0 be the size of a spatialneighborhood system on X . (In this paper, we fix r = 2.) Wedefine the spatial neighborhood of ~xi by
Ni = j; max(|i1 − j1|, |i2 − j2|) ≤ r, j 6= i
Aid with the neighborhood system, we formulate the spatial(distance-type) weight between two pixels ~xi and ~xj as the

365
International Journal on Advances in Software, vol 9 no 3 & 4, year 2016, http://www.iariajournals.org/software/
2016, © Copyright by authors, Published under agreement with IARIA - www.iaria.org
following:
wsij =
−1, if j ∈ Ni0. otherwise
(15)
Note that we use spatial weight −1 for the pixel in theneighborhood to shorten the spectral-spatial distance betweenneighbored pixels.
3) Optimization of parameters in the algorithm: The pro-cess for optimizing the free parameters in ESSL1dLB algo-rithm is very similar to that for the SS1DME one in [22].For shortening the length of the paper, we only give a briefdescription of the process. The following parameters are testedand optimized: (a) regularization parameter λ in (4), (b) weightbalance parameter µ in (12), (c) path selection parameter εin (3), (d) the spinning number K in (9), and (e) the labelboosting times N in (11).
The regularization parameter λ balances the fidelity termand smoothness one in the regularization algorithm. It can belearned in a standard way. The tuning process shows that itis insensitive in the range [0.3, 5]. We fix it to 0.5 in allexperiments. The weight balance parameter µ impacts thedefinition of similarity between pixels. Its selection should notbe dependent on an individual SSL method. The experimentsshow that it can be chosen in the range [0.3, 0.7]. The quanti-tative analysis for µ can bo found in Fig. 12-13 in [22].
The path selection parameter ε impacts the approximationquality of the greedy method presented in Algorithm 1. It isuniform for all SLL methods based on data 1-D representation,but possibly dependent on the data set. Fortunately, althoughdifferen data sets have different optimal ε, it is an insensitiveparameter. The parameter tuning experiment results almostare similar when ε is selected in a very wide range, say in[50, 500] (see Fig. 14 in [22]). Hence, the values used in [22]can also be applied to the proposed method in the paper. Inour experiments, we choose ε = 100.
To investigate how the spinning number K impacts theclassification output. We use the HSI image “AVIRIS IndianPines”in the parameter tuning experiments, where other pa-rameters are fixed as following: λ = 0.5, µ = 0.5, ε = 100,and the boosting number N = 5; but the values of K arechosen in the integer range [3, 10]. The experiment is repeated5 times for each value of K, and the average scores of OA,AA, and κ are reported. Their meanings are explained in thenext subsection. The results are shown in Fig. 4 and Tab. I.We observe that the spinning parameter K in (9) is relativelyinsensitive too. In our experiments, we will set K = 7.
Finally, we test the effectiveness of the number of labelboosting times N , which determines the enlargement of thelabeled set. A greater number of the boosting times usuallyyields a larger size of the boosted set XN
` at the last step in theconstruction of the final classifier. Again, we use the HSI image“AVIRIS Indian Pines”as the train set, where other parametersare fixed as following: λ = 0.5, µ = 0.5, ε = 100,K = 7,but the number of label boosting times N is chosen in theinteger range [4, 10]. The experiment is repeated 5 times foreach value of N , and the average scores of OA, AA, and κ arereported in Fig. 5 and Tab. II. The experiment results indicatethat the number of label boosting times can be chosen fromthe integer range N ≥ 4.
All of the tests above indicate the stability and reliability ofthe ESSL1dLB algorithm: Although the algorithm is a multi-parametric one, all of parameters are relatively insensitive sothat each of them can be chosen in a wide range without greatdeviation.
B. Measurements of performances of experimentsThe maps of the thematic land covering, which are gen-
erated by different classification methods, are used in a va-riety of applications for data analysis. In this paper, eachexperiment contains five repeated tests at random using thesame parameter settings. The quality of the output of theexperiment is evaluated in the standard way commonly used inthe classification of HSI images [35]. That is, the performancewill be measured by overall accuracy (OA), average accuracy(AA), and Kappa coefficient (κ) of the five tests. As theirnames indicate, OA, one of the simplest and most popularaccuracy, measures the accuracy of the classification weightedby the proportion of testing samples of each class in the totaltraining set, AA measures the average accuracy of all classes,and Kappa measures the agreement of the tests, of which eachclassifies n samples into C mutually exclusive classes.
C. Experiment comparison settingsSimilar to [22], three widely used hyperspectral data sets,
the Indian Pines 1992 scene, the Salinas scene, and theUniversity of Pavia scene are used in experiments to evaluatethe classification performance. The pseudocolor images, theground truth maps, and the class label bar of these HSI imagesare shown in Fig. 1–3, respectively. For comparison, we assessour proposed ESSL1dLB algorithm with several spectral-based and spectral-spatial extended methods, LDA [36], LDAwith multi-logistic prior (LDA-MLL) [37], SVM [38], [39],Laplacian SVM (LapSVM) [40], SVM with component kernel(SVMCK) [41], orthogonal matching pursuit (OMP) [42], si-multaneous OMP (SOMP) [43], MLRsub [37], MLRsub-MLL[37], semiMLR-MLL [44], WT-EMP [45] for hyperspectralimage classification. These methods are well established in thehypersepctral remotely sensing community. In the comparison,we also add SS1DME [22], which was an earlier work in theensemble SSL framework developed by the author and hiscolleagues.
In all of the mentioned methods, the LapSVM and thesemiMLR-MLL approaches are usually considered to be thereference benchmarks for semi-supervised learning in hyper-spectral image classification, as summarized in [44], [46], [47].
For fair comparison, five experiments with different ran-domly sampled data are carried out for each data set to enhancethe statistical significance. In the comparison, the experimentresults of other methods are either directly obtained from theauthors’ papers, or obtained by running the code providedby the authors with the optimal parameters. In all of thefollowing experiments, we use the unconstraint 1-D least-square regularization model, set λ = µ = 0.5, ε = 100, N = 5,and choose the spinning number K = 7 in the label boostingprocess and set K = 10 in the last spinning for producing thefinal classifier.
D. Experiment 1– AVIRIS Indian Pines Data SetThe first experiment is conducted on the AVIRIS Indian
Pines data set, whose format and data structure information

366
International Journal on Advances in Software, vol 9 no 3 & 4, year 2016, http://www.iariajournals.org/software/
2016, © Copyright by authors, Published under agreement with IARIA - www.iaria.org
TABLE I. THE RESULTS OF VARIOUS SPINNING NUMBERS USED IN THE EXPERIMENT FOR CLASSIFICATION OF AVIRIS INDIAN PINES. IN THEEXPERIMENT λ = 0.5, µ = 0.5, ε = 100 AND N = 5 ARE FIXED, BUT K ARE SELECTED IN THE INTEGER RANGE [3, 10].
K 3 4 5 6 7 8 9 10OA mean(%) 99.10 99.11 98.83 99.08 99.22 99.14 98.89 99.08
OA std 0.32 0.21 0.29 0.18 0.17 0.21 0.23 0.25AA mean(%) 99.33 99.40 99.17 99.32 99.46 99.34 99.13 99.36
AA std 0.24 0.11 0.14 0.11 0.09 0.14 0.13 0.12κ(%) 98.97 98.98 99.17 98.95 99.11 99.02 98.73 98.95κ std 0.36 0.24 0.33 0.20 0.20 0.24 0.27 0.29
TABLE II. THE RESULTS OF VARIOUS SPINNING NUMBERS USED IN THE EXPERIMENT FOR CLASSIFICATION OF AVIRIS INDIAN PINES. IN THEEXPERIMENT, λ = 0.5, µ = 0.5, ε = 100, AND K = 7 ARE FIXED, BUT N ARE CHOSEN FROM THE INTEGER RANGE [4, 10].
N 4 5 6 7 8 9 10OA mean(%) 99.04 99.20 99.14 99.02 99.23 98.94 99.05
OA std 0.35 0.20 0.24 0.25 0.21 0.23 0.30AA mean(%) 99.14 99.43 99.36 99.26 99.46 99.27 99.35
AA std 0.38 0.11 0.12 0.11 0.12 0.22 0.21κ(%) 98.89 99.10 98.95 98.89 99.11 98.93 98.89κ std 0.51 0.20 0.33 0.30 0.20 0.22 0.31
TABLE III. NUMBER OF TRAINING AND TEST SAMPLES FOR THREE HSIS.
ID Indian Pines Salinas University of PaviaClass Name Train Test Class Name Train Test Class Name Train Test
1 Alfalfa 20 26 Brocoli Green Weeds 1 144 1865 Asphalt 553 60782 Corn-notill 134 1294 Brocoli Green Weeds 2 200 3526 Meadows 1161 17488
3 Corn-mintill 75 755 Fallow 151 1825 Gravel 304 17954 Corn 44 193 Fallow Rough Plow 135 1259 Trees 328 27365 Grass-pasture 49 434 Fallow Smooth 159 2519 Painted metal sheets 261 10846 Grass-trees 56 674 Stubble 209 3750 Bare Soil 440 45897 Grass-pasture-mowed 17 11 Celery 192 3387 Bitumen 263 10678 Hay-windrowed 59 419 Grapes Untrained 404 10867 Self-Blocking Bricks 379 3303
9 Oats 11 9 Soil Vinyard Develop 282 5921 Shadows 232 71510 Soybean-notill 95 877 Corn Senesced Green Weeds 179 309911 Soybean-mintill 209 2246 Lettuce-Romaine-4wk 121 94712 Soybean-clean 65 528 Lettuce-Romaine-5wk 150 177713 Wheat 29 176 Lettuce-Romaine-6wk 118 79814 Woods 104 1161 Lettuce-Romaine-7wk 129 94115 Buildings-Grass-Trees-Drives 37 349 Vinyard Untrained 289 697916 Stone-Steel-Towers 20 73 Vinyard Vertical Trellis 138 1669
Total 1024 9225 Total 3000 51129 Total 3921 38855
TABLE IV. CLASSIFICATION ACCURACIES OBTAINED BY DIFFERENT METHODS FOR AVIRIS INDIAN PINE SCENE (%).
Class Name LDALDA-MLL SVM LapSVM SVMCK OMP SOMP MLRsub
MLRsub-MLL
semiMLR-MLL WT-EMP SS1DME ESSL1dLB
Alfalfa 100.00 96.43 89.29 82.62 100.00 45.95 81.25 85.19 81.48 100.00 92.52 100.00 100.00Corn-notill 61.21 92.61 69.92 78.70 92.07 56.13 92.09 65.09 89.15 86.20 90.30 99.30 99.34
Corn-mintill 56.80 77.97 57.78 66.69 97.30 56.33 89.20 47.56 99.87 76.05 93.15 98.68 99.12Corn 71.72 100.00 71.43 76.91 100.00 44.74 96.65 72.78 99.40 82.13 79.76 99.48 98.92
Grass-pasture 91.76 94.85 90.39 91.54 97.88 84.46 92.65 87.85 93.69 91.41 94.79 96.31 98.22Grass-trees 94.95 98.33 94.52 97.49 98.80 89.73 98.67 94.81 97.47 98.35 98.04 100.00 100.00
Grass-pasture-mowed 92.31 100.00 85.71 95.83 100.00 63.64 75.00 61.54 100.00 100.00 94.46 90.91 100.00Hay-windrowed 96.80 100.00 96.98 98.56 98.33 95.81 100.00 99.29 100.00 99.53 96.83 100.00 100.00
Oats 100.00 100.00 88.89 98.89 100.00 50.00 44.44 77.78 100.00 100.00 97.78 100.00 100.00Soybean-notill 59.07 82.08 75.17 77.61 91.72 69.15 87.53 65.32 95.96 83.72 87.68 99.54 98.16
Soybean-mintill 65.21 98.63 84.57 83.79 95.67 75.15 97.16 69.04 96.87 92.24 92.58 99.33 99.46Soybean-clean 68.30 74.63 74.95 82.18 87.29 50.00 87.09 73.85 97.23 91.89 88.73 98.30 98.08
Wheat 98.87 99.44 97.16 99.45 99.44 95.12 100.00 99.31 100.00 99.42 98.25 100.00 100.00Woods 91.47 92.47 96.62 94.70 99.22 91.50 99.74 93.05 98.03 96.43 98.01 99.91 99.72
Buildings-Grass-Trees-Drives 62.28 100.00 54.94 68.75 95.93 41.42 99.71 52.08 97.42 89.41 89.92 99.43 99.70Stone-Steel-Towers 95.77 85.33 93.65 89.33 100.00 90.54 98.61 83.87 100.00 84.29 98.61 100.00 100
OA (mean) 71.54 91.98 80.74 84.11 94.94 71.38 94.42 73.64 94.95 89.32 92.80 99.05 99.13OA (std) 0.25 0.15 0.62 0.37 0.66 0.32 0.18 0.37 0.50 0.95 0.19 0.13 0.24
AA (mean) 79.53 87.63 83.83 86.44 96.21 67.13 91.65 75.42 95.09 86.48 93.21 98.72 99.36AA (std) 1.10 0.33 0.38 0.65 0.53 1.29 2.09 2.02 1.97 3.22 0.78 0.95 0.17κ (mean) 67.62 90.76 78.03 81.81 94.22 67.32 93.62 69.78 94.18 93.77 91.78 98.92 99.00κ (std) 0.38 0.17 0.70 0.43 0.75 0.38 0.20 0.42 0.58 2.76 0.21 0.15 0.28

367
International Journal on Advances in Software, vol 9 no 3 & 4, year 2016, http://www.iariajournals.org/software/
2016, © Copyright by authors, Published under agreement with IARIA - www.iaria.org
Figure 4. Sensitivity analysis of the spinning number K.
Figure 5. Sensitivity analysis of the label boosting times N .
are given in Subsection III-A. The number of training samplesand test samples are given in Tab. III. Figure 6 shows theclassification pseudo-color maps that are obtained by differentmethods along with the corresponding OA score. Among allof the methods, LDA-MLL, SVMCK, SOMP, MLRsubMLL,semiMLR-MLL, WT-EMP, SS1DME, and ESSL1dLB yieldhigh accuracy. Comparing with the all other methods method,the proposed ESSL1dLB method wins the best performancein all of OA, AA, and Kappa coefficient. We note that theclassification accuracies of ESSL1dLB exceeds 98% for allof 16 classes.
Remark. In the Fig. 6, the OA score is slightly differentfrom that in Tab. III. Because the OA score in Tab. III isthe average of 5 experiments, while Fig. 6 is for one of theexperiments selected at random. The same remark is also validfor the following two experiments.
E. Experiment 2—AVIRIS Salinas Data Set
The second experiment was performed on the AVIRISSalinas hyperspectral image. The number of training andtesting samples for the image are given in Tab. III, where thetraining set contains about 5.25% of all the labeled samples,chosen at random. Because the image size is too large to betreated on a Laptop, we divide the data set into 8 blocksin the experiment. A visual perspective of these methods arepresented in Fig. 7. The quantitative results are presented inTab. V. Similar to the AVIRIS Indian Pines image, it canbe seen that the proposed ESSL1dLB beats the classificationperformances of other methods in terms of OA, AA and Kappacoefficient.
F. Experiment 3—ROSIS University of Pavia Data SetThe third experiment is conducted on the data set of ROSIS
University of Pavia scene. In this experiment, we use the ran-domly chosen 3,921 labeled samples for training, which countabout 8.4% of all labeled pixels, while the remains are usedfor testing. Detailed numbers for training and testing can befound in Tab. III. Because the data set has 512×217 = 111104pixels, this size is too large to be treated on a Laptop too.Hence, we divide it into 8 disjoint blocks, then apply theproposed algorithm on each block. The classification mapsobtained by different methods and the associated OA scores arepresented in Fig. 8. Meanwhile, the quantitative results (meansand standard deviations over the experiments on randomlyselected five different training sets) are listed in Tab. VI.It can be observed that the proposed ESS1DLB algorithmagain performs better than other methods significantly in bothof quantitative results and visual qualities. For example, ouralgorithm obtains more than 99% accuracy for all classes.Particularly, for the Gravel, Trees, Self-BlockingBricks classes, the classification accuracies obtained by mostmethods are not very satisfactory, but our method still producesa super result.
IV. EXPERIMENTS ON HANDWRITTEN DIGITS
In this section, we evaluate our ensemble SSL method inthe experiments on handwritten digits. We use two benchmarkdatabases of handwritten digits, MNIST [48] and USPS [49]in the experiments to present the validity and effectivenessof the proposed method. In the literature of machine learning,MNIST is often used to test the error rate of classifiers obtainedby supervised learning. The best result for the error rate up to2012 was 0.23%, reported in [50] by using the convolutional

368
International Journal on Advances in Software, vol 9 no 3 & 4, year 2016, http://www.iariajournals.org/software/
2016, © Copyright by authors, Published under agreement with IARIA - www.iaria.org
(a) LDA, OA=72.78 (b) LDA-MLL, OA=92.24 (c) SVM, OA=80.82 (d) LapSVM, OA=84.82 (e) SVMCK , OA=95.56 (f) OMP, OA=71.76
(g) SOMP, OA=94.65 (h) MLRsub, OA=73.90 (i) MLRsubMLL,OA=96.20 (j) semiMLR-MLL,OA=90.27 (k) WT-EMP, OA=92.99 (l) ESSL1dLB, OA=99.13
Figure 6. Classification pseudocolor map obtained by different methods for the AVIRIS Indian Pines data set, where the value of OA is given in percent.
(a) LDA, OA=89.66 (b) LDA-MLL, OA=98.91 (c) SVM, OA=92.76 (d) LapSVM, OA=92.60 (e) SVMCK, OA=97.96 (f) OMP, OA=91.22
(g) SOMP, OA=98.44 (h) MLRsub, OA=76.54 (i) MLRsubMLL, OA=92.98 (j) semiMLR-MLL, OA=97.13 (k) WT-EMP, OA=97.31 (l) ESSL1dLB, OA=99.56
Figure 7. Classification pseudocolor map obtained by different methods for the AVIRIS Salinas hyperspectral image, where the value of OA is given in percent.
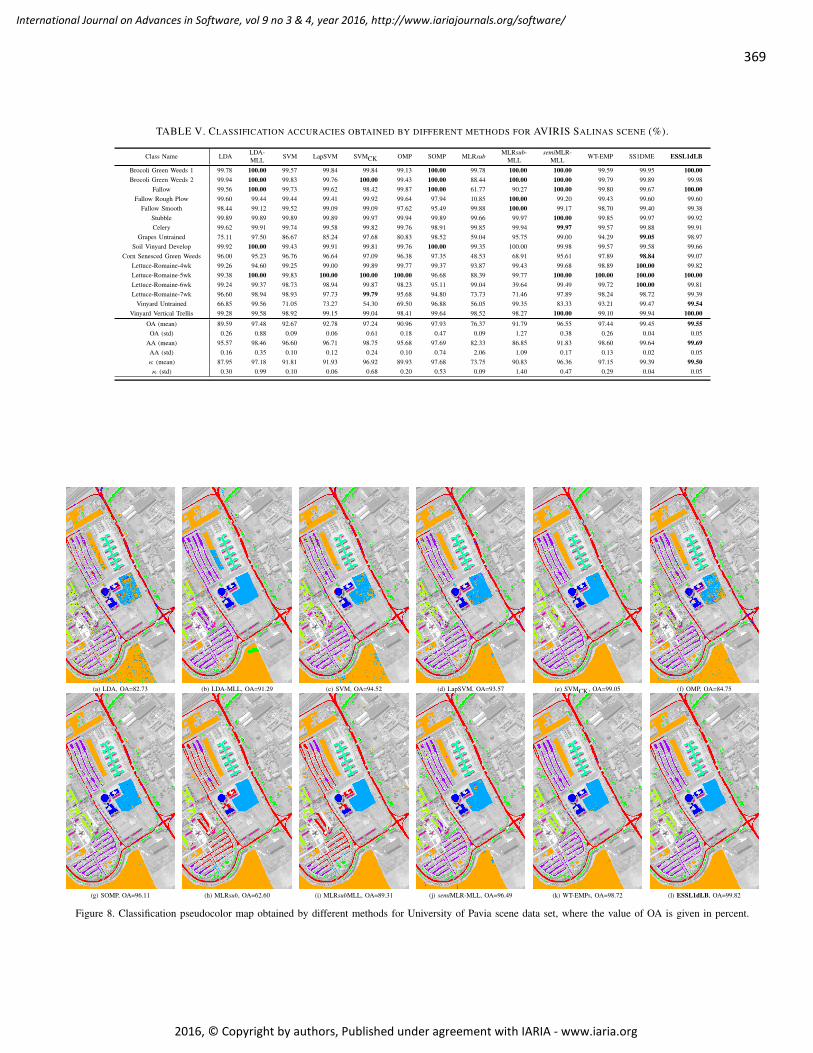
369
International Journal on Advances in Software, vol 9 no 3 & 4, year 2016, http://www.iariajournals.org/software/
2016, © Copyright by authors, Published under agreement with IARIA - www.iaria.org
TABLE V. CLASSIFICATION ACCURACIES OBTAINED BY DIFFERENT METHODS FOR AVIRIS SALINAS SCENE (%).
Class Name LDALDA-MLL SVM LapSVM SVMCK OMP SOMP MLRsub
MLRsub-MLL
semiMLR-MLL WT-EMP SS1DME ESSL1dLB
Brocoli Green Weeds 1 99.78 100.00 99.57 99.84 99.84 99.13 100.00 99.78 100.00 100.00 99.59 99.95 100.00Brocoli Green Weeds 2 99.94 100.00 99.83 99.76 100.00 99.43 100.00 88.44 100.00 100.00 99.79 99.89 99.98
Fallow 99.56 100.00 99.73 99.62 98.42 99.87 100.00 61.77 90.27 100.00 99.80 99.67 100.00Fallow Rough Plow 99.60 99.44 99.44 99.41 99.92 99.64 97.94 10.85 100.00 99.20 99.43 99.60 99.60
Fallow Smooth 98.44 99.12 99.52 99.09 99.09 97.62 95.49 99.88 100.00 99.17 98.70 99.40 99.38Stubble 99.89 99.89 99.89 99.89 99.97 99.94 99.89 99.66 99.97 100.00 99.85 99.97 99.92Celery 99.62 99.91 99.74 99.58 99.82 99.76 98.91 99.85 99.94 99.97 99.57 99.88 99.91
Grapes Untrained 75.11 97.50 86.67 85.24 97.68 80.83 98.52 59.04 95.75 99.00 94.29 99.05 98.97Soil Vinyard Develop 99.92 100.00 99.43 99.91 99.81 99.76 100.00 99.35 100.00 99.98 99.57 99.58 99.66
Corn Senesced Green Weeds 96.00 95.23 96.76 96.64 97.09 96.38 97.35 48.53 68.91 95.61 97.89 98.84 99.07Lettuce-Romaine-4wk 99.26 94.60 99.25 99.00 99.89 99.77 99.37 93.87 99.43 99.68 98.89 100.00 99.82Lettuce-Romaine-5wk 99.38 100.00 99.83 100.00 100.00 100.00 96.68 88.39 99.77 100.00 100.00 100.00 100.00Lettuce-Romaine-6wk 99.24 99.37 98.73 98.94 99.87 98.23 95.11 99.04 39.64 99.49 99.72 100.00 99.81Lettuce-Romaine-7wk 96.60 98.94 98.93 97.73 99.79 95.68 94.80 73.73 71.46 97.89 98.24 98.72 99.39
Vinyard Untrained 66.85 99.56 71.05 73.27 54.30 69.50 96.88 56.05 99.35 83.33 93.21 99.47 99.54Vinyard Vertical Trellis 99.28 99.58 98.92 99.15 99.04 98.41 99.64 98.52 98.27 100.00 99.10 99.94 100.00
OA (mean) 89.59 97.48 92.67 92.78 97.24 90.96 97.93 76.37 91.79 96.55 97.44 99.45 99.55OA (std) 0.26 0.88 0.09 0.06 0.61 0.18 0.47 0.09 1.27 0.38 0.26 0.04 0.05
AA (mean) 95.57 98.46 96.60 96.71 98.75 95.68 97.69 82.33 86.85 91.83 98.60 99.64 99.69AA (std) 0.16 0.35 0.10 0.12 0.24 0.10 0.74 2.06 1.09 0.17 0.13 0.02 0.05κ (mean) 87.95 97.18 91.81 91.93 96.92 89.93 97.68 73.75 90.83 96.36 97.15 99.39 99.50κ (std) 0.30 0.99 0.10 0.06 0.68 0.20 0.53 0.09 1.40 0.47 0.29 0.04 0.05
(a) LDA, OA=82.73 (b) LDA-MLL, OA=91.29 (c) SVM, OA=94.52 (d) LapSVM, OA=93.57 (e) SVMCK, OA=99.05 (f) OMP, OA=84.75
(g) SOMP, OA=96.11 (h) MLRsub, OA=62.60 (i) MLRsubMLL, OA=89.31 (j) semiMLR-MLL, OA=96.49 (k) WT-EMPs, OA=98.72 (l) ESSL1dLB, OA=99.82
Figure 8. Classification pseudocolor map obtained by different methods for University of Pavia scene data set, where the value of OA is given in percent.
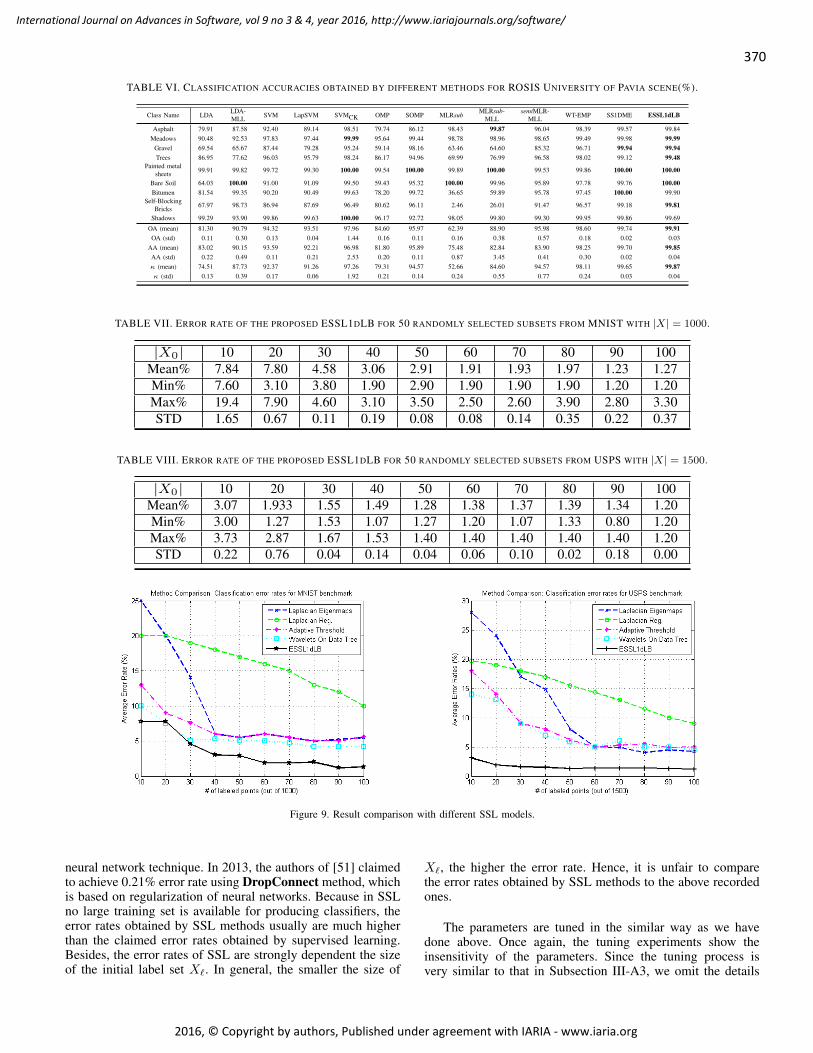
370
International Journal on Advances in Software, vol 9 no 3 & 4, year 2016, http://www.iariajournals.org/software/
2016, © Copyright by authors, Published under agreement with IARIA - www.iaria.org
TABLE VI. CLASSIFICATION ACCURACIES OBTAINED BY DIFFERENT METHODS FOR ROSIS UNIVERSITY OF PAVIA SCENE(%).
Class Name LDALDA-MLL SVM LapSVM SVMCK OMP SOMP MLRsub
MLRsub-MLL
semiMLR-MLL WT-EMP SS1DME ESSL1dLB
Asphalt 79.91 87.58 92.40 89.14 98.51 79.74 86.12 98.43 99.87 96.04 98.39 99.57 99.84Meadows 90.48 92.53 97.83 97.44 99.99 95.64 99.44 98.78 98.96 98.65 99.49 99.98 99.99
Gravel 69.54 65.67 87.44 79.28 95.24 59.14 98.16 63.46 64.60 85.32 96.71 99.94 99.94Trees 86.95 77.62 96.03 95.79 98.24 86.17 94.96 69.99 76.99 96.58 98.02 99.12 99.48
Painted metalsheets 99.91 99.82 99.72 99.30 100.00 99.54 100.00 99.89 100.00 99.53 99.86 100.00 100.00
Bare Soil 64.03 100.00 91.00 91.09 99.50 59.43 95.32 100.00 99.96 95.89 97.78 99.76 100.00Bitumen 81.54 99.35 90.20 90.49 99.63 78.20 99.72 36.65 59.89 95.78 97.45 100.00 99.90
Self-BlockingBricks 67.97 98.73 86.94 87.69 96.49 80.62 96.11 2.46 26.01 91.47 96.57 99.18 99.81
Shadows 99.29 93.90 99.86 99.63 100.00 96.17 92.72 98.05 99.80 99.30 99.95 99.86 99.69
OA (mean) 81.30 90.79 94.32 93.51 97.96 84.60 95.97 62.39 88.90 95.98 98.60 99.74 99.91OA (std) 0.11 0.30 0.13 0.04 1.44 0.16 0.11 0.16 0.38 0.57 0.18 0.02 0.03
AA (mean) 83.02 90.15 93.59 92.21 96.98 81.80 95.89 75.48 82.84 83.90 98.25 99.70 99.85AA (std) 0.22 0.49 0.11 0.21 2.53 0.20 0.11 0.87 3.45 0.41 0.30 0.02 0.04κ (mean) 74.51 87.73 92.37 91.26 97.26 79.31 94.57 52.66 84.60 94.57 98.11 99.65 99.87κ (std) 0.13 0.39 0.17 0.06 1.92 0.21 0.14 0.24 0.55 0.77 0.24 0.03 0.04
TABLE VII. ERROR RATE OF THE PROPOSED ESSL1DLB FOR 50 RANDOMLY SELECTED SUBSETS FROM MNIST WITH |X| = 1000.
|X0| 10 20 30 40 50 60 70 80 90 100Mean% 7.84 7.80 4.58 3.06 2.91 1.91 1.93 1.97 1.23 1.27Min% 7.60 3.10 3.80 1.90 2.90 1.90 1.90 1.90 1.20 1.20Max% 19.4 7.90 4.60 3.10 3.50 2.50 2.60 3.90 2.80 3.30STD 1.65 0.67 0.11 0.19 0.08 0.08 0.14 0.35 0.22 0.37
TABLE VIII. ERROR RATE OF THE PROPOSED ESSL1DLB FOR 50 RANDOMLY SELECTED SUBSETS FROM USPS WITH |X| = 1500.
|X0| 10 20 30 40 50 60 70 80 90 100Mean% 3.07 1.933 1.55 1.49 1.28 1.38 1.37 1.39 1.34 1.20Min% 3.00 1.27 1.53 1.07 1.27 1.20 1.07 1.33 0.80 1.20Max% 3.73 2.87 1.67 1.53 1.40 1.40 1.40 1.40 1.40 1.20STD 0.22 0.76 0.04 0.14 0.04 0.06 0.10 0.02 0.18 0.00
Figure 9. Result comparison with different SSL models.
neural network technique. In 2013, the authors of [51] claimedto achieve 0.21% error rate using DropConnect method, whichis based on regularization of neural networks. Because in SSLno large training set is available for producing classifiers, theerror rates obtained by SSL methods usually are much higherthan the claimed error rates obtained by supervised learning.Besides, the error rates of SSL are strongly dependent the sizeof the initial label set X`. In general, the smaller the size of
X`, the higher the error rate. Hence, it is unfair to comparethe error rates obtained by SSL methods to the above recordedones.
The parameters are tuned in the similar way as we havedone above. Once again, the tuning experiments show theinsensitivity of the parameters. Since the tuning process isvery similar to that in Subsection III-A3, we omit the details

371
International Journal on Advances in Software, vol 9 no 3 & 4, year 2016, http://www.iariajournals.org/software/
2016, © Copyright by authors, Published under agreement with IARIA - www.iaria.org
here. In all of our experiments, the balance parameter in theleast-square regularization is set to λ = 0.5. The spin numberK = 3 is used for constructing 1DEL algorithm, while K = 20is chosen for building the final classifier. The boosting-stopparameter p is set to 0.7, which yields 6 times of label boostingin most cases.
For comparison, we choose the same data setting as in [12]:In MINST, for each of the digits 3, 4, 5, 7, 8, 200 samplesare selected at random so that the cardinality of the data setis |X| = 1000, where the digit 8 is assigned to Class A, andothers belong to Class B. In USPS, for each of the digits 0−9,150 samples are selected at random so that |X| = 1500, wherethe digits 2 and 5 are assigned to Class A, and others belongto Class B. In all experiments, the initial labeled set X0 ispreset to 10 various sizes of 10, 20, · · · , 100, respectively, andthe labeled digits are distributed evenly on each chosen digit.
Note that a vector ~x ∈ X is originally represented by ac× c matrix [xi,j ]
ci,j=1, where c = 20 for MNIST and c = 16
for USPS. To reduce the shift-variance, we define the 1-shiftdistance between two digit images [1]:
d(~x, ~y) = min|i′−i|≤1|j′−j|≤1
√√√√c−1∑i=2
c−1∑j=2
(xi,j − yi′,j′)2.
In the first experiment, we run our ESSL1dLB algorithm on50 subsets, of which each has with 1000 members, randomlychosen from the MNIST database, where the regularizationparameter λ in (4) is chosen to be 0.5. The experiment resultsare shown in Table VII, where the first row is the number ofsamples in X`, and the 2nd−5th rows are the mean, minimum,maximum, and standard deviation of the classification errorrates of the 50 tests, respectively.
In the second experiment, we run our ESSL1dLB algo-rithm for USPS in a similar way: 50 subsets, of which eachhas 1500 members, are randomly chosen from USPS database.The test results are shown in Tab. VIII.
Tab. VII and Tab. VIII show that the standard deviations ofthe error rates are quite small. This indicates the high stabilityof the proposed algorithm.
In Fig. 9, we give the comparison of the average error rates(of 50 tests) of our 1-D based ensemble method ESSL1dLB toLaplacian Eigenmaps (Belkin & Niyogi, 2003 [8]), LaplacianRegularization (Zhu et al., 2003 [13]), Laplacian Regulariza-tion with Adaptive Threshold (Zhou and Belkin, 2011 [52]),and Haar-Like Multiscale Wavelets on Data Trees (Gavish etal., 2011 [12]) on the subsets randomly chosen from MNISTand USPS databases, respectively.
The results show that our method achieves competitiveresults comparing to others.
V. CONCLUSION
We propose a new ensemble SSL method (ESSL1dLB)based on data 1-D representations and label boosting, whichenables us to construct ensemble classifiers assembled fromseveral weak-classifiers for the same data set using classical1-D regularization technique. Furthermore, a label boostingtechnique is applied for robustly enlarging the labeled setto a certain size so that the final classifier is built basedon the boosted labeled set. The experiments show that the
performance of the proposed method is superior to manypopular SSL methods. The method also exhibits a clear ad-vantage for learning the classifier when only a small labeledset is given. Because the method is independent of the datadimensionality, it can be applied to various types of data.Since the algorithm in the proposed method only employs1-D regularization technique, avoiding the complicate kerneltrick, they are simple and stable. The experiments also indicatethat the parameters in the algorithm is relatively insensitivethat makes the algorithm more controllable and reliable. Thealgorithm has been tested on various types of data sets, such ashandwritten digits and hyperspectral images. The experimentalresults are very promising, showing that our method is superiorto other existent methods. It can be expected that the created 1-D framework in this paper will be applied to the developmentof more machine learning methods for different purposes. Inthe algorithm, the most time-consuming step is data (shortestpath) sorting. In the future work, we will study how to accel-erate the sorting algorithm in 1-D embedding and consider tointegrate the data-driven wavelets with the proposed method.
ACKNOWLEDGMENT
In this work, the first author was supported by SHSU-2015 ERG Grant-250711. The second and third authors weresupported by the Research Grants of MYRG2015-00049-FST,MYRG2015-00050-FST, RDG009/FST-TYY/2012, 008-2014-AMJ from Macau; and the National Natural Science Founda-tion of China 61672114.
The authors would like to thank the anonymous reviewersfor their highly insights and helpful suggestions.
REFERENCES
[1] J. Wang, “Semi-supervised learning in the framework of data multiple1-d representation,” IMMM 2016, The Sixth International Conferenceon Advances in Information Mining and Management, 2016, pp. 1–5.
[2] R. K. Eichelberger and V. S. Sheng, “Does one-against-all or one-against-one improve the performance of multiclass classifications?” inProceedings of the Twenty-Seventh AAAI Conference on ArtificialIntelligence, Bellevue, Wash, USA, 2013.
[3] C. Yu, L. Jinxu, Z. Fudong, B. Ran, and L. Xia, “Comparative studyon face recognition based on SVM of one-against-one and one-against-rest methods,” in Future Generation Communication and Networking(FGCN), 2014 8th International Conference on, Dec 2014, pp. 104–107.
[4] R. Bellman, Adaptive Control Processes: A Guided Tour. Princeton:Princeton University Press, 1961.
[5] J. Wang, Geometric Structure of High-Dimensional Data and Dimen-sionality Reduction. Higher Education Press and Springer, 2012.
[6] O. Chapelle, B. Scholkopf, and A. Zien, Semi-supervised learning.MIT press Cambridge, 2006.
[7] X. Zhu, “Semi-supervised learning literature survey,” University ofWisconsin-Madison, Computer Sciences TR-1530, July 2008.
[8] M. Belkin and P. Niyogi, “Using manifold structure for partially labeledclassification,” Advances in Neural Information Processing Systems,vol. 15, 2003, pp. 929–936.
[9] T. Joachims, “Transductive learning via spectral graph partitioning,” inProceedings of ICML-03, 20th International Conference on MachineLearning, 2003, pp. 290–297.
[10] V. Vapnik, Statistical Learning Theory. Wiley-Interscience, New York,1998.
[11] R. Coifman and M. Gavish, “Harmonic analysis of digital data bases,”Applied and Numerical Harmonic Analysis (Special issue on Waveletsand Multiscale Analysis), 2011, pp. 161–197.

372
International Journal on Advances in Software, vol 9 no 3 & 4, year 2016, http://www.iariajournals.org/software/
2016, © Copyright by authors, Published under agreement with IARIA - www.iaria.org
[12] M. Gavish, B. Nadler, and R. R. Coifman, “Multiscale wavelets ontrees, graphs and high dimensional data: Theory and applications tosemi supervised learning,” in Proceedings of the 27th InternationalConference on machine Learning, 2010.
[13] X. Zhu, Z. Ghahramani, and J. Lafferty, “Semi-supervised learningusing Gaussian fields and harmonic functions,” in Proceedings of the20th International Conference on Machine Learning, 2003.
[14] L. Rokach, “Ensemble-based classifiers,” Artif. Intell. Rev., vol. 33,2010, pp. 1–39.
[15] M. Wozniak, M. Grana, and E. Corchado, “A survey of multipleclassifier systems as hybrid systems,” Information Fusion, vol. 16, 2014,pp. 3–17.
[16] Z.-H. Zhou, J. Wu, and W. Tang, “Ensembling neural networks: Manycould be better than all,” Artificial Intelligence, vol. 137, 2002, pp.239–263.
[17] Breiman, “Bagging predictors,” Machine Learning, vol. 24, no. 2, 1996,pp. 123–140.
[18] Y. Freund and R. E. Schapire, “A short introduction to boosting,” Journalof Japanese Society for Artificial Intelligence, vol. 14, no. 5, 1999, pp.771–780.
[19] D. Z. Li, W. Wang, and F. Ismail, “A selective boosting technique forpattern classification,” Neurocomputing, vol. 156, 2015, pp. 186–192.
[20] J. Wang, “Semi-supervised learning using multiple one-dimensional em-bedding based adaptive interpolation,” International Journal of Wavelets,Multiresolution and Information Processing (Special Issue on Semi-Supervised Learning and Data Processing in the Framework of DataMultiple One-Dimensional Representation), vol. 14, no. 2, February2016, pp. 1 640 002: 1–11.
[21] ——, “Semi-supervised learning using ensembles of multiple 1d-embedding-based label boosting,” International Journal of Wavelets,Multiresolution and Information Processing (Special Issue on Semi-Supervised Learning and Data Processing in the Framework of DataMultiple One-Dimensional Representation), vol. 14, no. 2, 2016, pp.164 001: 1–33.
[22] H. Luo, Y. Y. Tang, Y. Wang, J. Wang, C. Li, and T. Hu, “Hyperspectralimage classification based on spectral-spatial 1-dimensional manifold,”submitted to IEEE Transaction of Geoscience and Remote Sensing.
[23] Y. Wang, Y. Y. Tang, L. Li, and J. Wang, “Face recognition viacollaborative representation based multiple one-dimensional embed-ding,” International Journal of Wavelets, Multiresolution and Infor-mation Processing (Special Issue on Semi-Supervised Learning andData Processing in the Framework of Data Multiple One-DimensionalRepresentation), vol. 14, no. 2, 2016, pp. 1 640 003: 1–15.
[24] I. Ram, M. Elad, and I. Cohen, “Image processing using smoothordering of its patches,” IEEE Trans. on Image Processing, vol. 22,no. 7, July 2013, pp. 2764–2774.
[25] ——, “Image denoising using nl-means via smooth patch ordering,”in Acoustics, Speech and Signal Processing (ICASSP), 2013 IEEEInternational Conference on, May 2013, pp. 1350–1354.
[26] T. Hastie and R. Tibshirani, “Classification by pairwise coupling,” TheAnnals of Statistics, vol. 26, 1998, pp. 451–471.
[27] E. Allwein, R. Schapire, and Y. Singer, “Reducing multiclass tobinary: A unifying approach for margin classifiers,” Journal of MachineLearning Research, vol. 1, 2000, pp. 113–141.
[28] T. Hamamura, H. Mizutani, and B. Irie, “A multiclass classificationmethod based on multiple pairwise classifiers,” in International Con-ference on Document Analysis and Recognition, August 3-6 2003, pp.809–813.
[29] D. Lu and Q. Weng, “A survey of image classification methods andtechniques for improving classification performance,” Int. J. RemoteSens., vol. 28, no. 5, 2007, pp. 823–870.
[30] J. Li, X. Huang, P. Gamba, J. Bioucas-Dias, L. Zhang, J. Atli Benedik-tsson, and A. Plaza, “Multiple feature learning for hyperspectral imageclassification,” IEEE Trans. Geosci. Remote Sens., vol. 53, no. 3, March2015, pp. 1592–1606.
[31] Z. Ye, H. Li, Y. Song, J. Wang, and Jon, “A novel semi-supervisedlearning framework for hyperspectral image classification,” InternationalJournal of Wavelets, Multiresolution, vol. 14, no. 2, February 2016, pp.164 005–1–17.
[32] Aviras databases. Acceptable on November 17, 2016. [Online].Available: https://engineering.purdue.edu/ biehl/MultiSpec/
[33] Y. Gu and K. Feng, “Optimized laplacian svm with distance metriclearning for hyperspectral image classification,” IEEE J. Sel. TopicsAppl. Earth Observ., vol. 6, no. 3, June 2013, pp. 1109–1117.
[34] M. Sugiyama, “Dimensionality reduction of multimodal labeled data bylocal fisher discriminant analysis,” J. Mach. Learn. Res., vol. 8, May2007, pp. 1027–1061.
[35] C. Liu, P. Frazier, and L. Kumar, “Comparative assessment of themeasures of thematic classification accuracy,” Remote Sens. Environ.,vol. 107, no. 4, 2007, pp. 606 – 616.
[36] T. Bandos, L. Bruzzone, and G. Camps-Valls, “Classification of hy-perspectral images with regularized linear discriminant analysis,” IEEETrans. Geosci. Remote Sens., vol. 47, no. 3, March 2009, pp. 862–873.
[37] J. Li, J. Bioucas-Dias, and A. Plaza, “Spectral-spatial hyperspectralimage segmentation using subspace multinomial logistic regression andMarkov random fields,” IEEE Trans. Geosci. Remote Sens., vol. 50,no. 3, March 2012, pp. 809–823.
[38] G. Mercier and M. Lennon, “Support vector machines for hyperspectralimage classification with spectral-based kernels,” in Geoscience andRemote Sensing Symposium, 2003. IGARSS ’03. Proceedings. 2003IEEE International, vol. 1, July 2003, pp. 288–290 vol.1.
[39] F. Melgani and L. Bruzzone, “Classification of hyperspectral remotesensing images with support vector machines,” IEEE Trans. Geosci.Remote Sens., vol. 42, no. 8, Aug 2004, pp. 1778–1790.
[40] M. Belkin, P. Niyogi, and V. Sindhwani, “Manifold regularization: Ageometric framework for learning from labeled and unlabeled exam-ples.” J. Mach. Learn. Res., vol. 7, 2006, pp. 2399–2434.
[41] G. Camps-Valls, L. Gomez-Chova, J. Munoz-Mari, J. Vila-Frances,and J. Calpe-Maravilla, “Composite kernels for hyperspectral imageclassification,” IEEE Geosci. Remote Sens. Lett., vol. 3, no. 1, Jan2006, pp. 93–97.
[42] Y. Chen, N. Nasrabadi, and T. Tran, “Sparsity-based classification ofhyperspectral imagery,” in Geoscience and Remote Sensing Symposium(IGARSS), 2010 IEEE International, July 2010, pp. 2796–2799.
[43] ——, “Hyperspectral image classification using dictionary-based sparserepresentation,” IEEE Trans. Geosci. Remote Sens., vol. 49, no. 10, Oct2011, pp. 3973–3985.
[44] J. Li, J. Bioucas-Dias, and A. Plaza, “Semisupervised hyperspectralimage segmentation using multinomial logistic regression with activelearning,” IEEE Trans. Geosci. Remote Sens., vol. 48, no. 11, Nov2010, pp. 4085–4098.
[45] P. Quesada-Barriuso, F. Arguello, and D. Heras, “Spectral-spatialclassification of hyperspectral images using wavelets and extendedmorphological profiles,” IEEE J. Sel. Topics Appl. Earth Observ., vol. 7,no. 4, April 2014, pp. 1177–1185.
[46] W. Kim and M. Crawford, “Adaptive classification for hyperspectralimage data using manifold regularization kernel machines,” IEEE Trans.Geosci. Remote Sens., vol. 48, no. 11, Nov 2010, pp. 4110–4121.
[47] H. Yang and M. Crawford, “Spectral and spatial proximity-based man-ifold alignment for multitemporal hyperspectral image classification,”IEEE Trans. Geosci. Remote Sens., vol. 54, no. 1, Jan 2016, pp. 51–64.
[48] Y. LeCun, C. Cortes, and C. J. C. Burges. The mnist database ofhandwritten digits. Accepted November 17, 2016. [Online]. Available:http://yann.lecun.com/exdb/mnist/
[49] Usps handwritten digit data. Accepted November 17, 2016. [Online].Available: http://www.gaussianprocess.org/gpml/data/ fide
[50] C. Dan, U. Meier, and J. Schmidhuber, “Multi-column deep neuralnetwork for image classification,” 2012, pp. 3642–3649.
[51] W. Li, M. Zeiler, S. Zhang, Y. L. Cun, and R. Fergus, “Regularizationof neural networks using dropconnect,” Journal of Machine LearningResearch, vol. 28, no. 3, 2013, pp. 1058–1066.
[52] X. Zhou and M. Belkin, “Semi-supervised learning by higher orderregularization,” in Proceedings of the 14th International Conference onArtificial Intelligence and Statistics (AISTATS). Fort Lauderdale, FL,USA: W&CP, 2011, pp. 892–900, volume 15 of JMLR.

www.iariajournals.org
International Journal On Advances in Intelligent Systems
issn: 1942-2679
International Journal On Advances in Internet Technology
issn: 1942-2652
International Journal On Advances in Life Sciences
issn: 1942-2660
International Journal On Advances in Networks and Services
issn: 1942-2644
International Journal On Advances in Security
issn: 1942-2636
International Journal On Advances in Software
issn: 1942-2628
International Journal On Advances in Systems and Measurements
issn: 1942-261x
International Journal On Advances in Telecommunications
issn: 1942-2601