Download PDF -
93
VOLUME NO. 6 (2016), ISSUE NO. 09 (SEPTEMBER) ISSN 2231-1009 A Monthly Double-Blind Peer Reviewed (Refereed/Juried) Open Access International e-Journal - Included in the International Serial Directories Indexed & Listed at: Ulrich's Periodicals Directory ©, ProQuest, U.S.A., EBSCO Publishing, U.S.A., Cabell’s Directories of Publishing Opportunities, U.S.A., Google Scholar, Open J-Gage, India [link of the same is duly available at Inflibnet of University Grants Commission (U.G.C.)], Index Copernicus Publishers Panel, Poland with IC Value of 5.09 & number of libraries all around the world. Circulated all over the world & Google has verified that scholars of more than 5000 Cities in 187 countries/territories are visiting our journal on regular basis. Ground Floor, Building No. 1041-C-1, Devi Bhawan Bazar, JAGADHRI – 135 003, Yamunanagar, Haryana, INDIA http://ijrcm.org.in/
-
Upload
khangminh22 -
Category
Documents
-
view
2 -
download
0
Transcript of Download PDF -

VOLUME NO. 6 (2016), ISSUE NO. 09 (SEPTEMBER) ISSN 2231-1009
A Monthly Double-Blind Peer Reviewed (Refereed/Juried) Open Access International e-Journal - Included in the International Serial Directories Indexed & Listed at:
Ulrich's Periodicals Directory ©, ProQuest, U.S.A., EBSCO Publishing, U.S.A., Cabell’s Directories of Publishing Opportunities, U.S.A., Google Scholar,
Open J-Gage, India [link of the same is duly available at Inflibnet of University Grants Commission (U.G.C.)],
Index Copernicus Publishers Panel, Poland with IC Value of 5.09 & number of libraries all around the world.
Circulated all over the world & Google has verified that scholars of more than 5000 Cities in 187 countries/territories are visiting our journal on regular basis.
Ground Floor, Building No. 1041-C-1, Devi Bhawan Bazar, JAGADHRI – 135 003, Yamunanagar, Haryana, INDIA
http://ijrcm.org.in/

VOLUME NO. 6 (2016), ISSUE NO. 09 (SEPTEMBER) ISSN 2231-1009
INTERNATIONAL JOURNAL OF RESEARCH IN COMPUTER APPLICATION & MANAGEMENT A Monthly Double-Blind Peer Reviewed (Refereed/Juried) Open Access International e-Journal - Included in the International Serial Directories
http://ijrcm.org.in/
ii
CONTENTS
Sr. No.
TITLE & NAME OF THE AUTHOR (S)
Page No.
1. AN ASSESSMENT OF THE LEVEL OF e-COMMERCE ADOPTION AND BENEFITS DERIVED BY SMALL AND MEDIUM ENTERPRISES (SMEs) IN ZIMBABWE DR. B. NGWENYA & F. SINYOLO
1
2. RETURNS DOMINATE THE MARKETING OF RISK COVERAGE IN POSTAL LIFE INSURANCE SECTOR: A STUDY WITH REFERENCE TO CHHATTISGARH POSTAL CIRCLE ASHA RAMTEKE, SS KHANUJA & OP CHANDRAKAR
4
3. A STUDY ON FACTOR INFLUENCING OF THE CONSUMER BUYING BEHAVIOR OF TWO WHEELER MOTOR CYCLES - WITH REFERENCE TO CHITTOOR DISTRICT, ANDHRA PRADESH DELLI KUMAR. KOTI & DR. P. BALAJI PRASAD
8
4. FACTORS INFLUENCING INVESTMENT IN MUTUAL FUND: A STUDY REGARDING INVESTORS BEHAVIOUR DR. HITESH VYAS & AUM DAVE
13
5. CSR REPORTING IN THE LIGHT OF THE EUROPEAN UNION DIRECTIVES RYSZARD KAMIŃSKI
16
6. A STUDY ON THE INVESTORS AWARENESS TOWARDS HEALTH INSURANCE POLICY IN TAMILNADU DR. P. RAMAN
20
7. WEATHER INDEX BASED CROP INSURANCE ASSESSMENT: TECHNOLOGICAL ADVANTAGES IN INDIA G. KOTRESHWAR & V.GURUSIDDARAJU
27
8. CRM IN RETAILING DR. NARINDER TANWAR
32
9. LIBRARY AUTOMATION: AN OVERVIEW P. SEKAR & DR. K.C. ABDUL MAJEED
36
10. IMPACT OF STRESS ON MENTAL HEALTH OF SCHOOL TEACHERS IN RANCHI: A SOCIO - PSYCHOLOGICAL STUDY BINDA KUMARI
39
11. SMART CITIES – CHALLENGES AND IMPLEMENTATION APPROACHES: COMPARISON PERSPECTIVE IN INDIA, UAE AND SINGAPORE RAMAMURTHY VENKATESH, CHINTAN VADGAMA & MADHAVI DAMLE
44
12. IMPACT OF TRAINING PROGRAMMES OF CENTRAL BOARD FOR WORKERS EDUCATION ON THE LABOUR FORCE OF KERALA SHEEBA JOSEPH
53
13. ONLINE BUYING BEHAVIOUR AMONG TEENAGERS - AN INDIAN PERSPECTIVE ABHINAV GUPTA
56
14. WEST BENGAL - A TOURIST DESTINATION: COMPARATIVE ANALYSIS OF BENGAL TOURISM BUSINESS MODEL WITH KERALA & GUJARAT SANJANA MONDAL
58
15. e-COMMERCE IN INDIA: A BOON OR BANE DR. GURINDER KAUR
63
16. CHALLENGES OF E-SERVICE ADOPTION AND IMPLEMENTATION IN ALLAHABAD DR. AARTI ARORA & AMIT KUMAR
66
17. EFFECTS OF TEACHING FACILITIES AND LEARNING RESOURCES ON THE PERFORMANCE OF SCIENCE IN PRIMARY SCHOOLS IN KENYA GRACE AKINYI OYUGI
73
18. IMPACT OF LIBERALISATION ON WORKING OF APMC: A CASE STUDY OF DHARWAD DISTRICT DR. VIJAYAKUMAR MANE
75
19. A STUDY ON THE CUSTOMER PERCEPTION TOWARDS PASSENGER CARS WITH SPECIAL REFERENCE TO MALAPPURAM DISTRICT IN KERALA SHAHIBA.EC
78
20. COLLECTIVE BARGAINING: A GENERAL PERSPECTIVE BRAJESH KUMAR PARASHAR
81
REQUEST FOR FEEDBACK & DISCLAIMER 85
VOLUME NO. 6 (2016), ISSUE NO. 09 (SEPTEMBER) ISSN 2231-1009
INTERNATIONAL JOURNAL OF RESEARCH IN COMPUTER APPLICATION & MANAGEMENT A Monthly Double-Blind Peer Reviewed (Refereed/Juried) Open Access International e-Journal - Included in the International Serial Directories
http://ijrcm.org.in/
iii
CHIEF PATRON PROF. K. K. AGGARWAL
Chairman, Malaviya National Institute of Technology, Jaipur (An institute of National Importance & fully funded by Ministry of Human Resource Development, Government of India)
Chancellor, K. R. Mangalam University, Gurgaon Chancellor, Lingaya’s University, Faridabad
Founder Vice-Chancellor (1998-2008), Guru Gobind Singh Indraprastha University, Delhi Ex. Pro Vice-Chancellor, Guru Jambheshwar University, Hisar
FOUNDER PATRON
LATE SH. RAM BHAJAN AGGARWAL Former State Minister for Home & Tourism, Government of Haryana
Former Vice-President, Dadri Education Society, Charkhi Dadri Former President, Chinar Syntex Ltd. (Textile Mills), Bhiwani
FORMER CO-ORDINATOR
DR. S. GARG Faculty, Shree Ram Institute of Business & Management, Urjani
ADVISORS
PROF. M. S. SENAM RAJU Director A. C. D., School of Management Studies, I.G.N.O.U., New Delhi
PROF. S. L. MAHANDRU Principal (Retd.), Maharaja Agrasen College, Jagadhri
EDITOR
PROF. R. K. SHARMA Professor, Bharti Vidyapeeth University Institute of Management & Research, New Delhi
EDITORIAL ADVISORY BOARD
DR. RAJESH MODI Faculty, Yanbu Industrial College, Kingdom of Saudi Arabia
PROF. PARVEEN KUMAR Director, M.C.A., Meerut Institute of Engineering & Technology, Meerut, U. P.
PROF. H. R. SHARMA Director, Chhatarpati Shivaji Institute of Technology, Durg, C.G.
PROF. MANOHAR LAL Director & Chairman, School of Information & Computer Sciences, I.G.N.O.U., New Delhi
PROF. ANIL K. SAINI Chairperson (CRC), Guru Gobind Singh I. P. University, Delhi
PROF. R. K. CHOUDHARY Director, Asia Pacific Institute of Information Technology, Panipat
DR. ASHWANI KUSH Head, Computer Science, University College, Kurukshetra University, Kurukshetra

VOLUME NO. 6 (2016), ISSUE NO. 09 (SEPTEMBER) ISSN 2231-1009
INTERNATIONAL JOURNAL OF RESEARCH IN COMPUTER APPLICATION & MANAGEMENT A Monthly Double-Blind Peer Reviewed (Refereed/Juried) Open Access International e-Journal - Included in the International Serial Directories
http://ijrcm.org.in/
iv
DR. BHARAT BHUSHAN
Head, Department of Computer Science & Applications, Guru Nanak Khalsa College, Yamunanagar
DR. VIJAYPAL SINGH DHAKA Dean (Academics), Rajasthan Institute of Engineering & Technology, Jaipur
DR. SAMBHAVNA Faculty, I.I.T.M., Delhi
DR. MOHINDER CHAND Associate Professor, Kurukshetra University, Kurukshetra
DR. MOHENDER KUMAR GUPTA Associate Professor, P. J. L. N. Government College, Faridabad
DR. SHIVAKUMAR DEENE Asst. Professor, Dept. of Commerce, School of Business Studies, Central University of Karnataka, Gulbarga
DR. BHAVET Faculty, Shree Ram Institute of Engineering & Technology, Urjani
ASSOCIATE EDITORS
PROF. ABHAY BANSAL Head, Department of Information Technology, Amity School of Engineering & Technology, Amity University, Noida
PROF. NAWAB ALI KHAN Department of Commerce, Aligarh Muslim University, Aligarh, U.P.
ASHISH CHOPRA Sr. Lecturer, Doon Valley Institute of Engineering & Technology, Karnal
FORMER TECHNICAL ADVISOR
AMITA Faculty, Government M. S., Mohali
FINANCIAL ADVISORS
DICKIN GOYAL Advocate & Tax Adviser, Panchkula
NEENA Investment Consultant, Chambaghat, Solan, Himachal Pradesh
LEGAL ADVISORS
JITENDER S. CHAHAL Advocate, Punjab & Haryana High Court, Chandigarh U.T.
CHANDER BHUSHAN SHARMA Advocate & Consultant, District Courts, Yamunanagar at Jagadhri
SUPERINTENDENT
SURENDER KUMAR POONIA

VOLUME NO. 6 (2016), ISSUE NO. 09 (SEPTEMBER) ISSN 2231-1009
INTERNATIONAL JOURNAL OF RESEARCH IN COMPUTER APPLICATION & MANAGEMENT A Monthly Double-Blind Peer Reviewed (Refereed/Juried) Open Access International e-Journal - Included in the International Serial Directories
http://ijrcm.org.in/
v
CALL FOR MANUSCRIPTS We invite unpublished novel, original, empirical and high quality research work pertaining to the recent developments & practices in the areas of Com-puter Science & Applications; Commerce; Business; Finance; Marketing; Human Resource Management; General Management; Banking; Economics; Tourism Administration & Management; Education; Law; Library & Information Science; Defence & Strategic Studies; Electronic Science; Corporate Gov-ernance; Industrial Relations; and emerging paradigms in allied subjects like Accounting; Accounting Information Systems; Accounting Theory & Practice; Auditing; Behavioral Accounting; Behavioral Economics; Corporate Finance; Cost Accounting; Econometrics; Economic Development; Economic History; Financial Institutions & Markets; Financial Services; Fiscal Policy; Government & Non Profit Accounting; Industrial Organization; International Economics & Trade; International Finance; Macro Economics; Micro Economics; Rural Economics; Co-operation; Demography: Development Planning; Development Studies; Applied Economics; Development Economics; Business Economics; Monetary Policy; Public Policy Economics; Real Estate; Regional Economics; Political Science; Continuing Education; Labour Welfare; Philosophy; Psychology; Sociology; Tax Accounting; Advertising & Promotion Management; Management Information Systems (MIS); Business Law; Public Responsibility & Ethics; Communication; Direct Marketing; E-Commerce; Global Business; Health Care Administration; Labour Relations & Human Resource Management; Marketing Research; Marketing Theory & Applications; Non-Profit Or-ganizations; Office Administration/Management; Operations Research/Statistics; Organizational Behavior & Theory; Organizational Development; Pro-duction/Operations; International Relations; Human Rights & Duties; Public Administration; Population Studies; Purchasing/Materials Management; Re-tailing; Sales/Selling; Services; Small Business Entrepreneurship; Strategic Management Policy; Technology/Innovation; Tourism & Hospitality; Transpor-tation Distribution; Algorithms; Artificial Intelligence; Compilers & Translation; Computer Aided Design (CAD); Computer Aided Manufacturing; Computer Graphics; Computer Organization & Architecture; Database Structures & Systems; Discrete Structures; Internet; Management Information Systems; Mod-eling & Simulation; Neural Systems/Neural Networks; Numerical Analysis/Scientific Computing; Object Oriented Programming; Operating Systems; Pro-gramming Languages; Robotics; Symbolic & Formal Logic; Web Design and emerging paradigms in allied subjects.
Anybody can submit the soft copy of unpublished novel; original; empirical and high quality research work/manuscript anytime in M.S. Word format after preparing the same as per our GUIDELINES FOR SUBMISSION; at our email address i.e. [email protected] or online by clicking the link online submission as given on our website (FOR ONLINE SUBMISSION, CLICK HERE).
GUIDELINES FOR SUBMISSION OF MANUSCRIPT
1. COVERING LETTER FOR SUBMISSION:
DATED: _____________
THE EDITOR
IJRCM
Subject: SUBMISSION OF MANUSCRIPT IN THE AREA OF .
(e.g. Finance/Mkt./HRM/General Mgt./Engineering/Economics/Computer/IT/ Education/Psychology/Law/Math/other, please
specify)
DEAR SIR/MADAM
Please find my submission of manuscript titled ‘___________________________________________’ for likely publication in one of
your journals.
I hereby affirm that the contents of this manuscript are original. Furthermore, it has neither been published anywhere in any language
fully or partly, nor it is under review for publication elsewhere.
I affirm that all the co-authors of this manuscript have seen the submitted version of the manuscript and have agreed to inclusion of
their names as co-authors.
Also, if my/our manuscript is accepted, I agree to comply with the formalities as given on the website of the journal. The Journal has
discretion to publish our contribution in any of its journals.
NAME OF CORRESPONDING AUTHOR :
Designation/Post* :
Institution/College/University with full address & Pin Code :
Residential address with Pin Code :
Mobile Number (s) with country ISD code :
Is WhatsApp or Viber active on your above noted Mobile Number (Yes/No) :
Landline Number (s) with country ISD code :
E-mail Address :
Alternate E-mail Address :
Nationality :
* i.e. Alumnus (Male Alumni), Alumna (Female Alumni), Student, Research Scholar (M. Phil), Research Scholar (Ph. D.), JRF, Research Assistant, Assistant
Lecturer, Lecturer, Senior Lecturer, Junior Assistant Professor, Assistant Professor, Senior Assistant Professor, Co-ordinator, Reader, Associate Profes-
sor, Professor, Head, Vice-Principal, Dy. Director, Principal, Director, Dean, President, Vice Chancellor, Industry Designation etc. The qualification of
author is not acceptable for the purpose.

VOLUME NO. 6 (2016), ISSUE NO. 09 (SEPTEMBER) ISSN 2231-1009
INTERNATIONAL JOURNAL OF RESEARCH IN COMPUTER APPLICATION & MANAGEMENT A Monthly Double-Blind Peer Reviewed (Refereed/Juried) Open Access International e-Journal - Included in the International Serial Directories
http://ijrcm.org.in/
vi
NOTES:
a) The whole manuscript has to be in ONE MS WORD FILE only, which will start from the covering letter, inside the manuscript. pdf.
version is liable to be rejected without any consideration.
b) The sender is required to mention the following in the SUBJECT COLUMN of the mail:
New Manuscript for Review in the area of (e.g. Finance/Marketing/HRM/General Mgt./Engineering/Economics/Computer/IT/
Education/Psychology/Law/Math/other, please specify)
c) There is no need to give any text in the body of the mail, except the cases where the author wishes to give any specific message
w.r.t. to the manuscript.
d) The total size of the file containing the manuscript is expected to be below 1000 KB.
e) Only the Abstract will not be considered for review and the author is required to submit the complete manuscript in the first
instance.
f) The journal gives acknowledgement w.r.t. the receipt of every email within twenty-four hours and in case of non-receipt of
acknowledgment from the journal, w.r.t. the submission of the manuscript, within two days of its submission, the corresponding
author is required to demand for the same by sending a separate mail to the journal.
g) The author (s) name or details should not appear anywhere on the body of the manuscript, except on the covering letter and the
cover page of the manuscript, in the manner as mentioned in the guidelines.
2. MANUSCRIPT TITLE: The title of the paper should be typed in bold letters, centered and fully capitalised.
3. AUTHOR NAME (S) & AFFILIATIONS: Author (s) name, designation, affiliation (s), address, mobile/landline number (s), and email/al-
ternate email address should be given underneath the title.
4. ACKNOWLEDGMENTS: Acknowledgements can be given to reviewers, guides, funding institutions, etc., if any.
5. ABSTRACT: Abstract should be in fully Italic printing, ranging between 150 to 300 words. The abstract must be informative and eluci-
dating the background, aims, methods, results & conclusion in a SINGLE PARA. Abbreviations must be mentioned in full.
6. KEYWORDS: Abstract must be followed by a list of keywords, subject to the maximum of five. These should be arranged in alphabetic
order separated by commas and full stop at the end. All words of the keywords, including the first one should be in small letters, except
special words e.g. name of the Countries, abbreviations etc.
7. JEL CODE: Provide the appropriate Journal of Economic Literature Classification System code (s). JEL codes are available at www.aea-
web.org/econlit/jelCodes.php. However, mentioning of JEL Code is not mandatory.
8. MANUSCRIPT: Manuscript must be in BRITISH ENGLISH prepared on a standard A4 size PORTRAIT SETTING PAPER. It should be free
from any errors i.e. grammatical, spelling or punctuation. It must be thoroughly edited at your end.
9. HEADINGS: All the headings must be bold-faced, aligned left and fully capitalised. Leave a blank line before each heading.
10. SUB-HEADINGS: All the sub-headings must be bold-faced, aligned left and fully capitalised.
11. MAIN TEXT:
THE MAIN TEXT SHOULD FOLLOW THE FOLLOWING SEQUENCE:
INTRODUCTION
REVIEW OF LITERATURE
NEED/IMPORTANCE OF THE STUDY
STATEMENT OF THE PROBLEM
OBJECTIVES
HYPOTHESIS (ES)
RESEARCH METHODOLOGY
RESULTS & DISCUSSION
FINDINGS
RECOMMENDATIONS/SUGGESTIONS
CONCLUSIONS
LIMITATIONS
SCOPE FOR FURTHER RESEARCH
REFERENCES
APPENDIX/ANNEXURE
The manuscript should preferably be in 2000 to 5000 WORDS, But the limits can vary depending on the nature of the manuscript.

VOLUME NO. 6 (2016), ISSUE NO. 09 (SEPTEMBER) ISSN 2231-1009
INTERNATIONAL JOURNAL OF RESEARCH IN COMPUTER APPLICATION & MANAGEMENT A Monthly Double-Blind Peer Reviewed (Refereed/Juried) Open Access International e-Journal - Included in the International Serial Directories
http://ijrcm.org.in/
vii
12. FIGURES & TABLES: These should be simple, crystal CLEAR, centered, separately numbered & self-explained, and the titles must be
above the table/figure. Sources of data should be mentioned below the table/figure. It should be ensured that the tables/figures are
referred to from the main text.
13. EQUATIONS/FORMULAE: These should be consecutively numbered in parenthesis, left aligned with equation/formulae number placed
at the right. The equation editor provided with standard versions of Microsoft Word may be utilised. If any other equation editor is
utilised, author must confirm that these equations may be viewed and edited in versions of Microsoft Office that does not have the
editor.
14. ACRONYMS: These should not be used in the abstract. The use of acronyms is elsewhere is acceptable. Acronyms should be defined
on its first use in each section e.g. Reserve Bank of India (RBI). Acronyms should be redefined on first use in subsequent sections.
15. REFERENCES: The list of all references should be alphabetically arranged. The author (s) should mention only the actually utilised
references in the preparation of manuscript and they may follow Harvard Style of Referencing. Also check to ensure that everything
that you are including in the reference section is duly cited in the paper. The author (s) are supposed to follow the references as per
the following:
All works cited in the text (including sources for tables and figures) should be listed alphabetically.
Use (ed.) for one editor, and (ed.s) for multiple editors.
When listing two or more works by one author, use --- (20xx), such as after Kohl (1997), use --- (2001), etc., in chronologically ascending
order.
Indicate (opening and closing) page numbers for articles in journals and for chapters in books.
The title of books and journals should be in italic printing. Double quotation marks are used for titles of journal articles, book chapters,
dissertations, reports, working papers, unpublished material, etc.
For titles in a language other than English, provide an English translation in parenthesis.
Headers, footers, endnotes and footnotes should not be used in the document. However, you can mention short notes to elucidate
some specific point, which may be placed in number orders before the references.
PLEASE USE THE FOLLOWING FOR STYLE AND PUNCTUATION IN REFERENCES:
BOOKS
Bowersox, Donald J., Closs, David J., (1996), "Logistical Management." Tata McGraw, Hill, New Delhi.
Hunker, H.L. and A.J. Wright (1963), "Factors of Industrial Location in Ohio" Ohio State University, Nigeria.
CONTRIBUTIONS TO BOOKS
Sharma T., Kwatra, G. (2008) Effectiveness of Social Advertising: A Study of Selected Campaigns, Corporate Social Responsibility, Edited
by David Crowther & Nicholas Capaldi, Ashgate Research Companion to Corporate Social Responsibility, Chapter 15, pp 287-303.
JOURNAL AND OTHER ARTICLES
Schemenner, R.W., Huber, J.C. and Cook, R.L. (1987), "Geographic Differences and the Location of New Manufacturing Facilities,"
Journal of Urban Economics, Vol. 21, No. 1, pp. 83-104.
CONFERENCE PAPERS
Garg, Sambhav (2011): "Business Ethics" Paper presented at the Annual International Conference for the All India Management Asso-
ciation, New Delhi, India, 19–23
UNPUBLISHED DISSERTATIONS
Kumar S. (2011): "Customer Value: A Comparative Study of Rural and Urban Customers," Thesis, Kurukshetra University, Kurukshetra.
ONLINE RESOURCES
Always indicate the date that the source was accessed, as online resources are frequently updated or removed.
WEBSITES
Garg, Bhavet (2011): Towards a New Gas Policy, Political Weekly, Viewed on January 01, 2012 http://epw.in/user/viewabstract.jsp

VOLUME NO. 6 (2016), ISSUE NO. 09 (SEPTEMBER) ISSN 2231-1009
INTERNATIONAL JOURNAL OF RESEARCH IN COMPUTER APPLICATION & MANAGEMENT A Monthly Double-Blind Peer Reviewed (Refereed/Juried) Open Access International e-Journal - Included in the International Serial Directories
http://ijrcm.org.in/
1
AN ASSESSMENT OF THE LEVEL OF e-COMMERCE ADOPTION AND BENEFITS DERIVED BY SMALL AND MEDIUM ENTERPRISES (SMEs) IN ZIMBABWE
DR. B. NGWENYA DEAN
FACULTY OF BUSINESS SOLUSI UNIVERSITY
ZIMBABWE
F. SINYOLO STUDENT
SOLUSI UNIVERSITY ZIMBABWE
ABSTRACT
The purpose of this study was to assess the extent and benefit of use of e-Commerce by SMEs in Zimbabwe. A group of SMEs were targeted out of whom; they gave their personal views on the extent and benefits of use of e-Commerce in their businesses. Data was collected by the use of a well- designed Likert scale questionnaire, which was administered to hundred and fifty (150) SMEs owners and management representatives. The questionnaire consisted of 71items questions covering e-Commerce factors such as technology and human interface, adequate computer systems, internet connectivity, information communication technology, infor-mation processing and online business transactions as independent variables. While reduced operational cost, improved customer service, increased sales and profitability reflected independent variables. A software package for Social Sciences (SPSS) version 16.0 was used to analyse the data through quantitative and descriptive methods. The results of the study were that SMEs in Zimbabwe are using e-Commerce in their operations and they are benefitting in terms of reduced operational costs, improved customer service, increased sales, and profitability. These costs include transactional cost, operational, distribution, communication, delivery, advertising, administrative and management. The findings also show that those SMEs who are using e-Commerce in their operations tend to have higher annual revenues than those that do not.
KEYWORDS e-Commerce, SMEs, sales revenues, customer service, profitability, operational costs, internet connectivity.
INTRODUCTION lectronic commerce (e-Commerce) has changed and is still changing the way business is conducted around the world. The Commercialization through internet has driven e-Commerce to become one of the most promising channels for inter-organizational business processes. It can be in the form of e-Advertising, e-Payment system, e-Marketing, e-Customer support services and e-Order and delivery (Sharma, 2002). The emergence of e-Commerce is
redefining the way business is conducted. It offers organizations new ways to expand the markets, in which they compete, streamlines their corporate business processes to deliver products and services more efficiently, attracts and retains customers in new and innovative ways, and reduces costs of operations. E-com-merce is transforming the way customers, employees, and suppliers are relating to one another. These changes are forcing organizations to craft new strategies and adopt new methods of implementation (Denning, 2012). Like in any other part of the world, many Small and Medium sized Enterprises (SMEs) in Zimbabwe are investing more and more in the internet communication platform. In order to survive in today’s challenging and competitive environment, it is imperative that SMEs become competitive and resilient. The growth of e-Commerce is one of the most important recent environmental changes and developments of interest in the business fraternity today. The emergence of e-Commerce in recent years has enabled organizations to trade globally. However, SMEs seem to be aware of environmental changes and the corresponding defensive measures but no significant growth is visible. Over a decade now, SMEs in Zimbabwe were formed following the creation of the Ministry of Small-to- Medium Enterprises and Co-operatives Development by the Government of Zimbabwe with the vision; ‘to be the “nerve” centre for growth, empowerment and the development of SMEs in Zimbabwe’. On the other hand, financial institutions had been throwing their weight on these SMEs providing loans and the Small-to- Medium Enterprise Development Corporation (SEDCO) is still abundantly supporting qualifying SMEs, technically and financially.
NEED FOR THE STUDY According to MacEwan (2013), there are about 10 000 SMEs in Zimbabwe controlling about 65 percent of the total corporate purchasing power. Small and medium sized firms dominate both developed and developing economies in terms of employment and number of companies, yet their full potential remains untapped. The Zimbabwe National Association of Small-to- Medium Sized Enterprises (ZNASMEs) confirms this number as registered with the Association. These cover all the sectors of the industry (Green, 2007). In Zimbabwe SMEs are best identified by the number of employees, that is, of between 1 and 75 as suggested by (Green, 2007). However, many of these have since transformed in one way or the other and others severally. The purpose of a business is to grow and the SMEs continu-ously evolve as stimulus response to environmental changes. Regardless of strategic and material assistance given at national level, most of these still remain ‘life-style’ businesses to provide owner-manager with acceptable income at ‘comfort-level’ of activity (MacEwan, 2013) rather than aiming to grow. This perspective exposes SMEs to the view that they are traditionally businesses owned by an uneducated, unskilled poor immigrant with an ethnic background (Green, 2007) and who seeks upward social mobility. Regardless of the above benefits that they can derive from implementing e-Commerce in their operations, few SMEs seem to be keen to adopt it maybe it is because of lack of knowledge and resources. This study therefore sought to unroll the extent to which SMEs have adopted the use of e-Commerce in their business operation in Zimbabwe and also to find out the extent of benefits they can derive by using e-Commerce in their business opera-tions.
STATEMENT OF THE PROBLEM According to literature, there are so many benefits or advantages that the SMEs can derive by adopting e-Commerce in their operations, these include the reduced costs and improved customer service in addition to increased sales and profitability. These costs include transactional, operational, distribution, communication, delivery, advertising, administrative and management (Wilson and Abbel, 2002). According to the Ministry of Small and Medium Enterprises few SMEs in Zimbabwe have managed to adopt e-Commerce regardless of many advantages and benefits they can get from it. The study therefore sought to find out to what extent have SMEs in Zimbabwe adopted and benefited from the use of e-Commerce in their business operations.
OBJECTIVES OF THE STUDY 1. To assess the extent to which SMEs in Zimbabwe have adopted e-Commerce. 2. To determining whether there are any benefits that have accrued to SMEs in Zimbabwe from adopting use of e-Commerce in their businesses.
E

VOLUME NO. 6 (2016), ISSUE NO. 09 (SEPTEMBER) ISSN 2231-1009
INTERNATIONAL JOURNAL OF RESEARCH IN COMPUTER APPLICATION & MANAGEMENT A Monthly Double-Blind Peer Reviewed (Refereed/Juried) Open Access International e-Journal - Included in the International Serial Directories
http://ijrcm.org.in/
2
METHODOLOGY The researchers used quantitative research design and administered a total of 150 questionnaires to collect data. Questionnaires were issued out to SMEs owners and SMEs managers of various SMEs industrial sectors. The questionnaires were distributed on door to door basis using judgmental sampling and random sampling techniques. The questionnaires were collected as soon as the respondents had completed them.
LITERATURE REVIEW Small-to-Medium Sized Enterprises (SMEs): In Zimbabwe, the Ministry of SMEs (2000) defines a small enterprise as a business that employs not more than 50 people while operating as a registered entity and a medium sized enterprise is one that employees up to 75 to 100 people. The Small Enterprises Development Corporation (SEDCO) (2010) does not differentiate between the small and medium sized entities but defines a small and medium sized enterprise as a form that has not more than 100 employees and above. E-commerce: Refers to a wide range of online business activities for products and services. It also pertains to any form of business transaction in which the parties interact electronically rather than by the physical exchange or direct physical contact. A more complete definition is that e-Commerce is the use of electronic communications and digital information processing technology in business transactions to create, transform, and redefine relationships for value creation between or among the organizations, and between organizations and individuals (Chang, 2002). Technology and Infrastructure Support: The rapid changes taking place in technological environment brought about major changes in the way organisations operate. Porter (2008) suggests that infrastructure and technology of any organisation depends on the financial strengths of that organisation. It is a prerequisite for entrepreneurs to have proper budgets in order to take care of the infrastructure and technology requirements of an organization. Identification of sources of technologies appropriate to their specific activities and procurement of cost effective technology is very crucial for effective running of an enterprises. Often most of SMEs are always struggling to produce required documents whether by banks or government authorities, these documents may include simple financial state-ments, business plans, budgets or balance sheets, while a good system can assist them in this regard. Benefits and Advantages of e-Commerce on SMEs: Using e-Commerce, organizations can expand their markets to national and international markets with mini-mum capital investments. An organization can easily locate more customers, best suppliers and suitable business partners across the globe. E-commerce helps organization to reduce the cost to create process, distribute, retrieve and manage the paper based information by digitalizing the information. E-commerce im-proves the brand image of the company and helps organization to provide better customer services. E-commerce offers numerous benefits including reduced costs and improved customer service. These costs include transactional cost, operational, distribution, communication, delivery, advertising, administrative and management (Wilson and Abbel, 2002). Reduced Operational Costs: E-Commerce offers numerous benefits including reduced costs and improved customer service. These costs include transactional cost, operational, distribution, communication, delivery, advertising, administrative and management (Wilson and Abbel, 2002). E-Commerce is used as low cost product advertising and marketing tool, and the medium works well since it can overcome time and geographic limitations (Sharma, 2002). E-Commerce is signif-icantly reshaping manufacturing organizations. It is changing manufacturing systems from mass production to demand-driven, possible just-in-time manufacturing systems. The internet as an enabling force for improved supply chain management, offers efficiency and cost reduction to business processes across industries and nations (Lancioni, 2003). By adopting e-Commerce, business growth can be achieved either by boosting top line or revenue of business with greater product sales or service income or by increasing bottom line or profitability of the operation by minimizing costs (Sharma, 2002). Improved Customer Service: E-Commerce improves the flow of organizational information. It is especially useful at gathering intelligence on customers, compet-itors, and potential markets. It increases the organization’s ability to sense and respond to the market needs by collecting and disseminating market information throughout the organization. Strategic flexibility enables an organization to provide customers with personalized products while returning the economic ad-vantages of mass production. With the information, the organization could accurately assess or stimulate market demand and search for new markets (Chang, 2002). Increased Sales: E-Commerce allows organizations to quickly respond to customer needs through reduction of the time to the market, the time to produce, the time to deliver and the time to service, and this will result in the organization providing excellent customer service that meets the customers’ needs and expecta-tions, the customers will then recommend your products and services to others which will increase your sales (Riely, 2006). Profitability: The use of e-Commerce can assist the business to operate profitably. Instead of business making several trips and shopping around for raw materials, a few mouse clicks can assist the business in identifying the suitable supplier while in the office. This will save the costs of travelling and time spent. Reduced operational costs will therefore increase the profitability of the SMEs.
ANALYSIS OF THE STUDY TABLE 1: EXTENT TO WHICH SMEs USE E-COMMERCE IN THEIR BUSINESS
Variables N Minimum Maximum Mean Standard Deviation
Technology and Human Interface 150 1.00 5.00 3.2800 1.24605
Adequate Computer Systems 150 1.00 5.00 3.1600 1.20136
Internet Connectivity 150 1.00 5.00 3.3400 0.98167
Information Communication Technology Skills 150 1.00 5.00 3.4400 1.01338
Information Processing and Online Business Transactions 150 1.00 5.00 3.5600 0.99304
Table1 above depicts the responses to the question on use of e-Commerce by SMEs. The statistics reflects an indifferent attitude by SMEs on the issue of technology and Human Interface, with an overall mean score of 3.2800 and the standard deviation of 1.24605; adequate computer systems, with an overall mean score of 3.1600 and standard deviation of 1.20136; internet connectivity, with an overall mean score of 3.3400 and standard deviation of 0.98167; information communi-cation technology skills, with an overall mean score of 3.4400 and standard deviation of 1.01338, and information processing and online business transactions, with an overall mean score of 3.5600 and standard deviation of 0.99304. E-Commerce adoption by SMEs is at its early and infant stages; however the more systems they have the more they have institutionalised e-Commerce in their operations. The SMEs with highly skilled ICT personnel are better placed in dealing with ever changing technological environment. This facilitates the use of e-Commerce in the business operations of the SMEs. The statistics reflects strong evidence of information processing and online business transactions being processed online. This reflects the level of adoption, institutionalisation and diffusion of e-Com-merce in the business operations of SMEs in Zimbabwe.
TABLE 2: THE EXTENT OF BENEFIT FROM USE OF e-COMMERCE
Variables N Minimum Maximum Mean Standard Deviation
Reduced Operational Costs 150 1.00 5.00 3.6400 1.04511
Improved Customer Service 150 1.00 5.00 3.7800 0.99571
Increased Sales 150 1.00 5.00 3.6800 1.03884
Profitability 150 1.00 5.00 4.1000 1.14731
Table 2 above shows the statistical results on the positive attitude of the respondents towards the benefits derived from use of e-Commerce. The respondents acknowledged that the following benefits accrue to SMEs as result of using e-Commerce in their business operations: reduction of operational costs (mean score, 3.6400, standard deviation 1.04511; improved customer service (mean score, 3.7800, standard deviation 0.99571; increased sales (mean score, 3.6800, standard deviation 1.03884 and profitability (mean score, 4.1000, standard deviation 1.14731.The operational costs include transactional cost, distribution, communication, delivery, advertising, administrative and management (Wilson and Abbel, 2002).

VOLUME NO. 6 (2016), ISSUE NO. 09 (SEPTEMBER) ISSN 2231-1009
INTERNATIONAL JOURNAL OF RESEARCH IN COMPUTER APPLICATION & MANAGEMENT A Monthly Double-Blind Peer Reviewed (Refereed/Juried) Open Access International e-Journal - Included in the International Serial Directories
http://ijrcm.org.in/
3
TABLE 3: DESCRIPTIVE STATISTICS
Variables N Mean Standard Deviation
Increased Sales 50 3.6533 .87017
Technology and Human Interface 50 3.3267 .95829
Computer Systems 50 3.3533 .92192
Improved Customer Service 50 3.4267 .86515
Information Communication Technology 50 3.2867 .84652
Improved Perceived Profits 50 3.4800 .73179
Table 3 above depicts the descriptive statistics indicating the respondents’ positive perceptions of increased sales; improved profits, reduced operational costs and improved customer service as a result of e-Commerce adoption (technology and human interface, computer systems and information communication tech-nology). The statistics significantly affirms the perceived relationship amongst the variables of the phenomenon under study.
TABLE 4: DESCRIPTIVE STATISTICS
Variables N Mean Standard Deviation
Perceived Profits 50 3.9467 .92915
Technology and Human Interface 50 3.3267 .95829
Computer Systems 50 3.3533 .92192
Improved Customer Service 50 3.4267 .86515
Information Communication Technology 50 3.2867 .84652
Information Processing 50 3.4800 .73179
Table 4 above depicts the descriptive statistics indicating the respondents’ positive perceptions of improved profits, improved customer service as a result of e-Commerce adoption (technology and human interface, computer systems, information communication technology and information processing). The statistics significantly affirms the perceived relationship amongst the variables of the phenomenon under study.
FINDINGS AND SUGGESTIONS The above results indicate that SMEs in Zimbabwe are using e-Commerce in their operations and they are benefitting in terms of reduced operational costs. These costs include transactional cost, operational, distribution, communication, delivery, advertising, administrative and management. They are also realising significant increases in sales revenues. Suggestion 1: The research findings show that SMEs were positive about the use of e-commerce in their operations in Zimbabwe. This was shown by the mean score of 3.2800 on Technology and Human Interface, 3.1600 on Adequate Computer System, 3.3400 on Internet Connectivity and 3.4400 on Information Commu-nication Technology Skills. Suggestion 2: The research findings also showed that SMEs were benefiting in terms of reduced operational costs with a mean score of 3.6400, improved customer service 3.7800, increased sales 3.6800 and perceived profits with 4.1000. This meant that the SMEs were positive on the above as benefits of use of e-commerce. Suggestion 3: The findings also show that there is significant relationship between adoption of e-commerce and reduced operational costs, improved customer service, increased sales and improved profits.
REFERENCES 1. Chang, K. (2002). E-commerce and Corporate Strategy: An Executive Perspective, Information and Management, New Dehli: Prentice Hall. 2. Denning, B. (2012). E-commerce and Business use of Internet. M2 Presswire. M2 Communication Ltd. 3. Green, J. (2007). How to Grow Your Small Business Rapidly Online, How to books. 4. Johnson, G. (2006). Exploring Corporate Strategy, Seventh Enhanced Media Edition published 2006. 5. Lancioni, R. (2003). Internet Impact on Supply Chain Management, Industrial Marketing Management, Houghton Mifflin Company. 6. MacEwan, T. (2013). Alternative Paths for the Growth of e-commerce. Singapore College Publishing. 7. Porter M.E. (2008). Competitive Advantage: Creating and Sustaining Super Performance, (1st ed), Prentice Hall. 8. Riley, B. R. (2006). Change and Crisis Management: Teach Yourself in association with The Telegraph Business Club. 9. Sharma, A. (2002). Trends in internet-based business to business marketing, Industrial Marketing Management, Houghton Mifflin Company. 10. Wilson, S & Abbel, Y. (2002). So You Want to Get Involved in e-commerce: Industrial Marketing Management, Houghton Mifflin Company.

VOLUME NO. 6 (2016), ISSUE NO. 09 (SEPTEMBER) ISSN 2231-1009
INTERNATIONAL JOURNAL OF RESEARCH IN COMPUTER APPLICATION & MANAGEMENT A Monthly Double-Blind Peer Reviewed (Refereed/Juried) Open Access International e-Journal - Included in the International Serial Directories
http://ijrcm.org.in/
4
RETURNS DOMINATE THE MARKETING OF RISK COVERAGE IN POSTAL LIFE INSURANCE SECTOR: A STUDY WITH REFERENCE TO CHHATTISGARH POSTAL CIRCLE
ASHA RAMTEKE
ASST. PROFESSOR DEPARTMENT OF COMMERCE
GOVERNMENT MATA KARMA GIRLS COLLEGE MAHASAMUND
SS KHANUJA PRINCIPAL
DURGA MAHAVIDYALAYA RAIPUR
OP CHANDRAKAR
PRINCIPAL GOVERNMENT SATGURU GHASIDAS P.G. COLLEGE
KURUD
ABSTRACT Postal Life Insurance (PLI) is a very good and reliable low premium cost with high bonus yield Insurance sector and investment tool for the working population of civil and military personnel of the central and state governments, local bodies, and government aided educational institutions, universities, nationalized banks, many autonomous and financial institutions, and public sector undertakings of the central and state governments of India. In present study a comparative study is carried out for five financial years during 2009 to 2014 between the two insurance policies of PLI sector in Chhattisgarh Postal Circle, namely Whole Life Assurance (WLA/Suraksha) which provides the whole life risk coverage in a nominal premium and Endowment Assurance (EDA/Santosh) which provide the survival benefit after maturity, and risk coverage get turn off. A statistically significant difference (p = <0.001) is found in the selling of both policies within five financial years with the highest selling of Endowment Assurance policy than the Whole Life Assurance. The paid premium for the both policies during five financial years of study is also significantly high (p = <0.001) in Endowment policies than the Whole Life Assurance. The results seem that a policy having returns during the survival period dominates the marketing of other policy which have Whole life risk coverage but no survival benefits in Postal Life Insurance Sector. The work signifies as a tool to observe the consumer behavior and make a proper tactic in the marketing of life insurance sector.
KEYWORDS endowment assurance, PLI, suraksha, santosh, whole life assurance.
INTRODUCTION he Postal Service of India is a huge and widely distributed postal network in the whole world with 155,333 post offices serving in the each and every corner of the country (Anand et. al. 2013). The Chhattisgarh Postal Circle came in existence on 12 November 2001 is one of the most important postal circle out of 23 Postal Circles in which the whole of India is divided. Chhattisgarh Postal Circle has a vast network of 3122 Post Offices out of which 223 are serving in
urban areas while 2899 are serving in rural areas of the state. The Postal Circle Headquarter is headed by the Chief Postmaster General at the state capital; Raipur (http://www.postallifeinsurance.gov.in; 9 April 2016, 14:00 hr). In the Indian market there are lots of investment options providing by the public and private sector banks, Life Insurance Corporation and different private companies with different plans of savings as well as life coverage schemes. However, the savings and insurance schemes provided by the Post offices are very reliable and highly profitable especially in context of Postal Life Insurance (PLI) schemes which are exclu-sively introduced for the employees of State and Central Govt. as well as reputed enterprises, educational institutes, Defense and other central and state forces. But in the other hand earlier reports seem that the Postal Saving Scheme has not gained much importance yet, and the changing digital environment presents a big challenge for traditional postal business. (Gupta and Gupta, 2012). Postal Life Insurance (PLI) was introduced on 1st February 1884 with the express approval of the Secretary of State (for India) to Her Majesty, the Queen Empress of India. Earlier it was a welfare scheme for the Postal employees extended to the Telegraph department later on in 1888. In 1894, PLI extended insurance cover to female employees of P & T Department at a time when no other insurance company covered female lives. It is the oldest Life insurer in this country. In the beginning, the upper limit of life insurance was only Rs 4000 which has now increased to Rs 50 Lacs. It now covers employees of Central and State Governments, Central and State Public Sector Undertakings, Universities, Government aided Educational institutions, Nationalized Banks, Local bodies, autonomous bodies, joint ventures having a minimum of 10% Govt./PSU stake, credit co-operative societies etc. PLI also extends the facility of insurance to the officers and staff of the Defense services and Para-Military forces. PLI is an exempted insurer under Section 118 (c) of the Insurance Act of 1938. It is also exempted under Section 44 (d) of LIC Act, 1956 (http://www.postallifeinsurance.gov.in; 9 April 2016, 13:00 hr). PLI offers 6 (Six) types of plans: 1. Whole Life Assurance (SURAKSHA) 2. Convertible Whole Life Assurance (SUVIDHA) 3. Endowment Assurance (SANTOSH) 4. Anticipated Endowment Assurance (SUMANGAL) 5. Joint Life Assurance (YUGAL SURAKSHA) 6. Children Policy (BAL JEEVAN BIMA) (Source: http://www.postallifeinsurance.gov.in., 18 April 2016, 16:00 Hrs).
REVIEW OF LITERATURE The beginning of life insurance in India reported at 1818 as a means to provide financial security for English widows (Tripathy and Pal, 2005). Many researchers and marketers have focused on customer evaluations of services to find ways to improve quality of service however only few studies have examined customer perceptions of service quality in postal services in the Indian context (Rajeshwari and Sunmista, 2011). Very recently we have reported the dominance of survival benefits over the risk coverage in Rural Postal Life Insurance (Ramteke et al., 2016). A significant impact on the attitude towards obtaining insurance is depends on available quality of service. (Qamar Furqan, 2003). However, the management performance is positively correlated with the success rate of implementation of
T

VOLUME NO. 6 (2016), ISSUE NO. 09 (SEPTEMBER) ISSN 2231-1009
INTERNATIONAL JOURNAL OF RESEARCH IN COMPUTER APPLICATION & MANAGEMENT A Monthly Double-Blind Peer Reviewed (Refereed/Juried) Open Access International e-Journal - Included in the International Serial Directories
http://ijrcm.org.in/
5
enterprise mobilization in the life insurance industry to the of external aspects like providing increased customer satisfaction (Luarn, 2003). Few analytical reports on postal schemes are published by the Anand et al., 2013. The functions and the services of post offices are bounded to government norms but the recognition of customer’s perceptions and availability of the options for the beneficiary of customer will increase the satisfaction (Rajeshwari and Sunmista 2011).
OBJECTIVES OF THE STUDY In present research an attempt has been made to check the hypothesis whether the working population of Chhattisgarh Postal Circle have prefer the whole Life Risk coverage or the survival maturity returns.
MATERIALS AND METHODS Two basic insurance policies of Postal Life Insurance (PLI) were selected for the compilation of the objectives of this study. First one is Whole Life Assurance (WLA) commonly known as Suraksha and other one is Endowment Assurance (EDA) which is also called as Sasntosh. Suraksha provides the whole life risk coverage for the insurer in very nominal premium, but it does not have any survival benefits. It means after completion of a stipulated time period, premium paying will stop but the policy will continue throughout the life of the insurer and after the death of the insurer a good amount of sum assurance with the bonus given to the nominees. After 80 years of age an option to stop the policy and claim for maturity is also available in this scheme. However, in other one that is Santosh, the policy continues till the predefined premium paying term. If the insurer dies in between the predefined term the nominees provided by the Sum assure amount with accrued bonus. But if the insurer survives till the term, the maturity amount of sum assurance with accrued bonus can claim by the insurer themselves and the risk coverage of policy is turn off after taking the maturity amount. The whole comparison is based on the secondary Data of sales and the paid premium of the above mentioned two policies for five financial years from 2008-09 to 2013-14. The secondary data was obtained from the Postal Life Insurance Section of the Circle Head Post Office, Raipur. The amount of paid premium was also obtained for the same five financial years. The excel software is used for the calculation of the percentage of selling and paid premium. ANOVA test is used for Statistical analysis performed by the COSTAT software, and Duncan’s multiple range test is used to show the significance level of the variables.
RESULTS AND DISCUSSION The results show a significant difference between the selling percentage of both PLI policies Whole Life Assurance (Suraksha) and Endowment Assurance (Santosh) within all five financial year of consideration (Table 1). In financial year 2009-2010 the Suraksha has contributed only 0.42% of selling (Table 1) among the all PLI policies however the Santosh policy contributed 95.72 % of the selling (Table 1) among the all PLI policies. Similarly, in financial year 2010-2011, the Suraksha policy contributed only 0.07 % while the Santosh contributed 96.43 % among the all PLI policies (Table 1). In 2011-2012 the scenario was same that Suraksha was 0.28 % and Santosh was 96.66 % however in 2012-2013 and 2013 -2014 the ratio of Suraksha was 0.19 % and 0.38 % and Santosh ratio was 97.28% and 97.00 % consecutively (Table 1) among the all PLI policies which clearly shows a significant greater contribution of Santosh policy than the Suraksha. A statistically significant difference (< 0.001) is found with 0.0001 p value (F value 122.01, df –1,8) (Table 1) during all financial year with consolidated highest mean of selling of Endowment Assurance Policy (mean value 5608.2a) than the Whole Life Assurance (mean value 14.6 b) within all five financial years of consideration (Figure 1).
FIGURE-1: DUNCAN’S MULTIPLE RANGE TEST SUMMARY WITHIN 5 % SIGNIFICANCE LEVEL FOR CONSOLIDATED SALES OF FIVE FINANCIAL YEARS FOR SANTOSH (EDA) AND SURAKSHA (WLA) POLICIES
TABLE-1: COMPARATIVE STATISTICS OF SELLING OF WHOLE LIFE ASSURANCE (SURAKSHA) AND ENDOWMENT ASSURANCE (SANTOSH) PLAN OF POSTAL LIFE
INSURANCE (PLI) FOR FIVE FINANCIAL YEARS
Financial Year
Total No. of Sold Policies*
Selling Performance of Whole Life Assur-ance policies (Suraksha)*
Selling Performance of Endowment Assurance poli-cies (Santosh)*
ANOVA Sum-mary
Total No. of Sold Policies % Contribution Total No. of Sold Policies % Contribution
2009-2010 4282 18 0.42 % 4099 95.72 %
df: 1, 8 F: 122.01 p : <0.001
2010-2011 7511 06 0.07 % 7243 96.43 %
2011-2012 6064 17 0.28 % 5862 96.66 %
2012-2013 5718 11 0.19 % 5563 97.28 %
2013-2014 5437 21 0.38 % 5274 97.00 %
(* Data is obtained from Postal Life Insurance (PLI) section of Circle Head Post Office of Chhattisgarh Postal Circle, Raipur)
0
1000
2000
3000
4000
5000
6000
7000
8000
EDA WLA
5608.2
14.6EDA
WLA
a
b

VOLUME NO. 6 (2016), ISSUE NO. 09 (SEPTEMBER) ISSN 2231-1009
INTERNATIONAL JOURNAL OF RESEARCH IN COMPUTER APPLICATION & MANAGEMENT A Monthly Double-Blind Peer Reviewed (Refereed/Juried) Open Access International e-Journal - Included in the International Serial Directories
http://ijrcm.org.in/
6
TABLE-2: COMPARATIVE STATISTICS OF PAID PREMIUM OF WHOLE LIFE ASSURANCE (SURAKSHA) AND ENDOWMENT ASSURANCE (SANTOSH) PLAN OF POSTAL LIFE INSURANCE (PLI) FOR FIVE FINANCIAL YEARS
Financial Year
Total Amount of Paid Pre-mium in Rupees *
Premium Performance of Whole Life Assurance policies (Suraksha)*
Premium Performance of Endowment Assur-ance policies (Santosh)*
ANOVA Sum-mary
Total Amount of Paid Premium in Rupees
% Contribu-tion
Total Amount of Paid Pre-mium in Rupees
% Contribu-tion
2009-2010 3635297 23313 0.64 % 3495728 96.16 %
df: 1, 8 F: 58.60 p : <0.001
2010-2011 7615357 4235 0.05 % 7360807 96.65 %
2011-2012 7510668 19466 0.26 % 7296687 97.15 %
2012-2013 7888135 23293 0.29 % 7667313 97.20 %
2013-2014 9106489 19251 0.21 % 8842510 97.10 %
(* Data is obtained from Postal Life Insurance (PLI) section of Circle Head Post Office of Chhattisgarh Postal Circle, Raipur)
FIGURE-2: DUNCAN’S MULTIPLE RANGE TEST SUMMARY WITHIN 5 % SIGNIFICANCE LEVEL FOR CONSOLIDATED AMOUNT OF PAID PREMIUM FOR FIVE FINANCIAL YEARS FOR SANTOSH (EDA) AND SURAKSHA (WLA) POLICIES
The year wise paid premium for both policies of PLI is also significantly high in Santosh policy than the Suraksha policy. Table 2 show a significantly high difference in the percentage contribution of paid premium in both the said policies during the five financial years of consideration. In financial year 2009-2010 the Suraksha policy collect 23313 rupees which is only 0.64% of the whole premium about 3.6 million rupees collected by the whole policies of PLI while the Santosh policy collect about 3.5 million rupees and contribute 96.16 % premium among the whole policies of PLI. Further in 2010-11, 2011-12 and 2012-13 the Suraksha policy collects only 0.05, 0.26 and 0.29 % of the total premium about 7.5 to 7.8 million rupees collected by all PLI policies during these financial years, however the Santosh policy collects 96.65, 97.15 and 97.20 % consecutively of the total premium which is in between 7.2 to 7.6 million rupees collected by all PLI policy. Further in the financial year 2013-14, highest total premium about 9.1 million rupees collected by the all PLI policies in which the share of Suraksha was 19251 rupees only with 0.21% contribution however the share of Santosh policy was about 8.85 million rupees with 97.10 % contribution among the all PLI policies (Table 2). A statistically significant (< 0.001) difference between the consolidated paid premium amount of both policies was found with a p value 0.0001, F value 58.60, df -1, 8 (Table 2). A significantly high mean amount of premium within the said five financial years (mean value 6932609a in Rupees) was collected by the Santosh policy (EDA) than the Suraksha (WLA) policy (mean value 17911.6b in Rupees) (Figure 2). Performances of Indian Postal Services are reported by few researchers in context of all services providing by Indian Postal Department with reference to the annual reports of national statistics (Anand et. al., 2013) however we have documented the Individual policy wise details of selling and premium collection within a Postal Circle to understand the customer preference towards the policies of specific nature. A report on slow growth of public sector marketing according to the market demands is published and showed options to betterment these by using the Cooperative systems (Thakor, 2016) and our results are more often realistic to this. There is a report on customer preference and level of satisfaction of PLI customers in context of a single district in the Assam state (Dutta, 2014), however in our case we have compare the data of a whole Postal Circle which cover the all parts of Chhattisgarh state and documented a specific choice of customers towards the earlier returns than the long lasting life coverage.
CONCLUSION However the Whole Life Insurance (Suraksha) policy provide the risk coverage for the insurer throughout the life (or a option of 80 years) in minimal premium amount but due to the lacking of earlier returns or non survival benefits the working people of Chhattisgarh Postal Circles were not took more interests in this policy, however Endowment policy (Santosh) have earlier returns with survival benefit including risk coverage in any mishappenings, therefore the working popu-lation took much interest to buy this policy as shown in the results. Therefore, it can be concluded that the returns dominate the marketing of risk coverage in the working population of Chhattisgarh Postal Circle.
ACKNOWLEDGEMENTS Our humble acknowledgements to Mr. Harish Mahawar, Divisional Manager, Postal Life Insurance Section, Head Post Office, Raipur for providing the secondary data.
REFERENCES 1. Anand, M.B., Srinivas, D.L., Ramesh H.H. (2013). Performances of Indian Postal Services, Innovare Journal of Business Management, 1 (2), 5-10. 2. Dutta, P. (2014). A Study on Customer Preference and Level of Satisfaction of Postal Life Insurance, Tactful Management Research Journal, 2 (11), 1-4. 3. Gupta, M. K. and Gupta, N. (2012). A Study of Customer Satisfaction in Special Reference to Services Provided by Banks and Post-Offices in N.C.R. Zenith;
International Journal of Multidisciplinary Research, 2 (2), 222-239. 4. Luarn, (2003). Customer satisfaction in Life Insurance: An empirical study. International Journal of Retail and Distribution Management, 30 (6), 315-322. 5. Qamar, F. (2003), Saving Behaviour and Investment Preference among Average Urban Households. The Indian Journal of Commerce, 56 (1), 25-30.
10000
2010000
4010000
6010000
8010000
10010000
EDA WLA
6932609
17911.6
EDA
WLA
b
a

VOLUME NO. 6 (2016), ISSUE NO. 09 (SEPTEMBER) ISSN 2231-1009
INTERNATIONAL JOURNAL OF RESEARCH IN COMPUTER APPLICATION & MANAGEMENT A Monthly Double-Blind Peer Reviewed (Refereed/Juried) Open Access International e-Journal - Included in the International Serial Directories
http://ijrcm.org.in/
7
6. Rajeshwari, K. and Sunmista, K.J. (2011). Perceptions of Customers on Service Quality of Post Offices – A Comparative Study. IJEMR 1 (7), 1-7. 7. Ramteke, A., Khanuja, S.K., Chandrakar, O.P. and Gupta, T. (2016). Survival Benefits Dominate the Whole Life Risk Coverage among the Rural Population of
Raipur Postal Division of Chhattisgarh State. International Journal of Research Science & Management, 3 (5), 23-27. 8. Thakor, C. P. (2016). “The Study on Cooperative: Panic and Defy from Rural India Outlook”. Paripex- Indian Journal of Research, 5 (2), 331-333. 9. Tripathy, N. P. and Pal, P. (2005). Insurance Theory and Practice Prentice-Hall of India Pvt.Ltd. Eastern Economy Edition: New Delhi. WEBSITES 10. http://www.indiapost.gov.in 11. http://www.postallifeinsurance.gov.in

VOLUME NO. 6 (2016), ISSUE NO. 09 (SEPTEMBER) ISSN 2231-1009
INTERNATIONAL JOURNAL OF RESEARCH IN COMPUTER APPLICATION & MANAGEMENT A Monthly Double-Blind Peer Reviewed (Refereed/Juried) Open Access International e-Journal - Included in the International Serial Directories
http://ijrcm.org.in/
8
A STUDY ON FACTOR INFLUENCING OF THE CONSUMER BUYING BEHAVIOR OF TWO WHEELER MOTOR CYCLES - WITH REFERENCE TO CHITTOOR DISTRICT, ANDHRA PRADESH
DELLI KUMAR. KOTI RESEARCH SCHOLAR
DEPARTMENT OF MANAGEMENT STUDIES SVU COLLEGE OF COMMERCE MANAGEMENT & COMPUTER SCIENCES
S. V. UNIVERSITY TIRUPATI
DR. P. BALAJI PRASAD
VICE PRINCIPAL & RESEARCH SUPERVISOR DEPARTMENT OF MANAGEMENT STUDIES
SVU COLLEGE OF COMMERCE MANAGEMENT AND COMPUTER SCIENCES S.V. UNIVERSITY
TIRUPATI
ABSTRACT This study is based to identify the factors that influence the buying behavior of two wheelers in Chittoor district in Andhra Pradesh. To empirically prove that there are factors influence in a purchase decision for two wheelers; mean and standard deviation has been used in this study. In the last five years, the Indian two wheeler industry has seen spectacular growth as majority of Indians especially youngsters prefer these as most convenient means of transport. The objective of two wheeler industry is to sustain market share through satisfying customer needs and expectations. The manufacturers therefore, have to understand the real needs, wants, belief and attitude of customer towards the product and after sales service. A strong understanding of consumer buying behavior is required for sustenance and growth of the business. To get a first hand input I have taken response of customers (actual & potential two wheeler buyers) in the questionnaire. The analysis of data was done using chi-square test and ANOVA. I am hopeful the present study will positively contribute to two wheeler industry to understand the attributes of the product that customer expect from the company.
KEYWORDS customer satisfaction, factor influencing, consumer buying behavior, two wheeler motorcycles.
INTRODUCTION he two wheeler industry in India is one of the largest in the world and one of the fastest growing globally. India is the second largest producer of the two-wheelers. The two wheeler segments contribute the largest volume amongst all the segments in automobile industry. The country stands next to China and Japan in terms of production and sales respectively. The industry is growing at 30 % annually. It consists of three segments viz. scooters, motorcycles
and moped. Majority of Indians, especially the youngsters prefer motorbikes rather than cars. Capturing a large share in the two-wheeler industry, bikes and scooters cover a major segment. Bikes are considered to be the favorite among the youth generation, as they help in easy commutation. The field of consumer buying behaviour studies how individuals, groups, and organizations select, buy, use, and dispose of goods, services, ideas, or experiences to satisfy their needs and desires. Understanding consumer behaviour and “knowing customers “is never simple. Customer may say one but do another. They may not be in touch with their deeper motivations. They may respond to influences that change their mind at the last minute. The study of consumer behaviour is the study of how individuals make decision to spend their available resources (time, money efforts) on consumption related items. It includes the study of what they buy, why they buy it, when they buy it, where they buy it, how often they it, and how often they use it.
REVIEW OF LITERATURE Strebel, J., K. O’Donnell, and J.G Myers (2004), proposes that the probability of making a decision is significantly lower when consumers are frustrated with the pace of technological change. Sawant (2007) stated that maintenance and mileage were the two important deciding factors in the purchase decision process. It is also clear that the respondents found a big difference in price, suitability for women, mileage and resale value amongst various models available in the market. R. Amsaveni, R. Kokila (2014) An organization should place emphasis on introducing new model in the society and manufacture vehicles that give a good mileage. Kumar (2006) identified that a majority of the rural consumers give more preference to the quality of the product in his research at rural India, which showed that the income level of the rural consumer is increasing, which also generates more consumption and purchasing power for the consumers. Laldinliana (2012), The prominence of promotion effort made by the marketers/ Producers of these durable products is captured by the ranking of choicest buying factors, especially so with two wheelers as seen from the responses of more than a third of the household sample, pointing out promotion to be the main factor influencing their purchase. Soni and Soni (2012) found that friends and spouses play a major role while making a purchase decision regarding the purchase of a two wheeler. (Syed Arish Abbas, 2012) The consumers buying behaviour towards motorcycles is affected by host of variables
OBJECTIVES OF THE STUDY 1. To identify the consumer’s choice of preference while purchasing the two wheelers in the study area. 2. To know the customer satisfaction and factors influencing the customers while purchasing a two wheeler.
RESEARCH METHODOLOGY RESEARCH DESIGN AND SOURCES OF DATA The study is descriptive in nature. It is based on both primary and secondary data. The primary data was collected by using a well structured questionnaire from 200 respondents residing in and around Chittoor district only, by using the convenience random sampling method. Secondary data were collected from books, journals, magazines and from websites. TOOLS USED FOR ANALYSIS The collected data were processed with the help of SPSS, Chi-Square Tests & ANOVA.
T

VOLUME NO. 6 (2016), ISSUE NO. 09 (SEPTEMBER) ISSN 2231-1009
INTERNATIONAL JOURNAL OF RESEARCH IN COMPUTER APPLICATION & MANAGEMENT A Monthly Double-Blind Peer Reviewed (Refereed/Juried) Open Access International e-Journal - Included in the International Serial Directories
http://ijrcm.org.in/
9
ANALYSIS AND INTERPRETATIONS In this study, a number of statistical techniques like Mean and Standard deviation have been used in order to study the objectives.
TABLE 1: ONE-SAMPLE STATISTICS
N Mean Std. Deviation Std. Error Mean
Colleagues 200 3.01 1.408 .057
Friends 200 2.94 1.414 .058
Family members 200 3.08 1.374 .056
Advertisement on Television 200 3.05 1.436 .059
Advertisement on Newspaper 200 3.02 1.416 .058
Promotional offers 200 2.01 1.377 .056
Employer giving financial benefit 200 2.90 1.398 .057
Descriptive statistics for the factors involved in influencing the purchase decision of an individual have provided characteristics of the respondents. The respond-ent’s estimations indicate that there is influence of Colleagues is prominent as the mean value is “3.01” and the standard deviation is “1.408”. The respondent’s estimations indicate that there is less influence of Friends as the mean value is “2.94” and the standard deviation is “1.414”. The respondent’s estimations indicate that there is influence of Family members is prominent as the mean value is “3.08” and the standard deviation is “1.374”. The respondent’s estimations indicate that there is influence of Advertisement on Television is noticeable as the mean value is “3.05” and the standard deviation is “1.436”. The respondent’s estimations indicate that there is influence of Advertisement on Newspaper is slightly less than Tv with mean value of “3.02” and the standard deviation is “1.416”. The respondent’s estimations indicate that there is very less influence of Promotional offers as the mean value is “2.01” and the standard deviation is “1.377”. The respondent’s estimations indicate that there is influence of Employer giving financial benefit is prominent enough as indicated by the mean value is “2.90” and the standard deviation is “1.398”. The ranges falling above 3 are good as most of the respondents in the data have voted for Neither agree nor disagree, Agree, strongly agree. HYPOTHESIS 1 The selection of motorcycle based on performance and style is not biased.
TABLE 2: SEX * ACCELERATION PICKUP CROSS TABULATION
Acceleration Pickup Total
Strongly disagree Disagree Neither agree nor disagree Agree strongly agree
Sex female 11 13 14 12 14 64
Male 31 22 24 27 32 136
Total 42 35 38 39 46 200
The influence of Acceleration pickup is prominent as the estimated data collected from the respondents have been shown that around 42% of the customers agree to it and 19% of the customers have taken a neutral stance regarding the influence of the colleagues in buying of the motorcycle.
CHART 1
TABLE 3: SEX * BODY STYLING OF MOTOR VEHICLE CROSS TABULATION
Body Styling of motor vehicle Total
Strongly disagree Disagree Neither agree nor disagree Agree strongly agree
Sex female 14 11 14 13 12 64
Male 24 28 33 25 26 136
Total 38 39 47 38 38 200
The influence of Body Styling of motor vehicle is prominent as the estimated data collected from the respondents have been shown that around 37% of the customers agree to it and 23% of the customers have taken a neutral stance regarding the influence of the colleagues in buying of the motorcycle.

VOLUME NO. 6 (2016), ISSUE NO. 09 (SEPTEMBER) ISSN 2231-1009
INTERNATIONAL JOURNAL OF RESEARCH IN COMPUTER APPLICATION & MANAGEMENT A Monthly Double-Blind Peer Reviewed (Refereed/Juried) Open Access International e-Journal - Included in the International Serial Directories
http://ijrcm.org.in/
10
CHART 2
TABLE 4: ANOVA
Sum of Squares Df Mean Square F Sig.
Body Styling of motor vehicle B/w Groups 167.050 8 6.682 3.794 .000
W/in Groups 1010.943 191 1.761
Total 1177.993 199
Performance B/w Groups 8.992 8 .360 .852 .674
W/in Groups 242.286 191 .422
Total 251.278 199
HYPOTHESIS 2 The selection of motorcycle based on colour, Engine Performance and fuel economy is biased.
TABLE 5: SEX *COLOUR CROSS TABULATION
Colour Total
Strongly disagree Disagree Neither agree nor disagree Agree strongly agree
Sex female 2 6 11 25 20 64
Male 5 7 23 54 47 136
Total 7 13 34 79 67 200
The influence of colour is prominent as the estimated data collected from the respondents have been shown that around 70% of female and 74% of male customers agree to it and 17% of the customers have taken a neutral stance regarding the influence of the colleagues in buying of the Motorcycle.
CHART 3

VOLUME NO. 6 (2016), ISSUE NO. 09 (SEPTEMBER) ISSN 2231-1009
INTERNATIONAL JOURNAL OF RESEARCH IN COMPUTER APPLICATION & MANAGEMENT A Monthly Double-Blind Peer Reviewed (Refereed/Juried) Open Access International e-Journal - Included in the International Serial Directories
http://ijrcm.org.in/
11
TABLE 6: SEX * ENGINE PERFORMANCE CROSS TABULATION
Engine Performance Total
Strongly disagree Disagree Neither agree nor disagree Agree strongly agree
Sex female 6 2 16 18 22 64
Male 13 19 26 44 34 136
Total 19 21 42 62 56 200
The influence of Engine performance is prominent as the estimated data collected from the respondents have been shown that around 68% of the customers agree to it and 18% of the customers have taken a neutral stance regarding the influence of the colleagues in buying of the motorcycle.
CHART 4
TABLE 7: SEX * FUEL ECONOMY CROSS TABULATION
Fuel Economy Total
Strongly disagree Disagree Neither agree nor disagree Agree strongly agree
Sex female 8 5 9 24 18 64
Male 17 16 25 34 44 136
Total 25 21 34 58 62 200
The influence of Fuel Economy is prominent as the estimated data collected from the respondents have been shown that around 67% of the customers agree to it and 20% of the customers have taken a neutral stance regarding the influence of the colleagues in buying of the motorcycle.
TABLE 6: CHI-SQUARE TESTS
Value Df Asymp. Sig. (2-sided)
Pearson Chi-Square 5.557a 4 .235
Likelihood Ratio 5.610 4 .230
Linear-by-Linear Association 1.755 1 .185
N of Valid Cases 200
a. 0 cells (0.0%) have expected count less than 5. The minimum expected count is 8.64.
These results indicate that there is no statistically significant relationship between the variables (chi-square with two degrees of freedom = 5.557, p = 0.235).The variable are independent to each other.
CHART 5

VOLUME NO. 6 (2016), ISSUE NO. 09 (SEPTEMBER) ISSN 2231-1009
INTERNATIONAL JOURNAL OF RESEARCH IN COMPUTER APPLICATION & MANAGEMENT A Monthly Double-Blind Peer Reviewed (Refereed/Juried) Open Access International e-Journal - Included in the International Serial Directories
http://ijrcm.org.in/
12
TABLE 7: ANOVA
Sum of Sq Df Mean Sq F Sig.
Fuel Economy B/w Groups 86.498 8 3.460 2.774 .000
W/in Groups 715.842 191 1.247
Total 802.340 199
Colour B/w Groups 78.342 8 3.134 2.938 .000
W/in Groups 612.158 191 1.066
Total 690.500 199
Engine Performance B/w Groups 31.997 8 1.280 .929 .565
W/in Groups 790.796 191 1.378
Total 822.793 199
SUGGESTIONS AND CONCLUSION Customers should be provided with better sales follow up, more service centers should be opened and companies can introduce new and special discount schemes for students. The result shows that the Factors influencing the consumer buying behavior of two wheelers in Chittor district. It was found that region have strong influence on Better look &style, Good mileage, Pickup and speed, after sales service, Price and new models of consumer buying behaviours. When making a two wheeler purchase decision, the personal factors and product characteristics are important for consumers in the region. It can be concluded that our analysis provides important insight on the consumers’ two wheeler users. Their two-wheeler purchases are driven by different factors such as after sales and service, Price and new models, etc. “Specifically satisfaction from the product of today will create a favorable confidence in future.
REFERENCES 1. R. Amsaveni, R.Kokila (2014), a study on satisfaction level of working women towards two wheelers in Coimbatore, Indian journal of marketing Pp. 44-54 2. Kumar (2006), RuralMarketing for FMCGs rural retailing in India, Journal of Arts, Science and commerce, 3(2), Pp81-84 3. Strebel, J., K.O’Donnell, and J.GMyers(2004),Exploring the connection between frustration and consumer choice behavior in a dynamic decision environment,
Psychology and marketing. Volume 21, issue12, Pp1059-76 4. Sawant, S.V(2007), Buying Two Wheeler: a changing scenario. The ICFAI Journal of consumer behavior, 2(3), Pp52-57 5. Laldinliana (2012), consumer behavior towards two wheelers and foru wheelerws: a study on rural and urban Mizoram, Indian journal of Marketing, Vol 42,
Pp54-58 6. Soni, S. and Soni, A, (2012), ‘Consumer behavior towards two-wheeler bikes – A comparativestudy of rural and urban consumers of Jodhpur District of
Rajastan’, Global Research Analysis, 1(7), pp. 91-92. 7. Syed Arish Abbas (2012), “An analytical study of consumer behaviour while buying motor cycle “, Skyline business school, February 8. BOOKS 8. Gupta.S.L., Sumitra Pal, (2011), “Consumer behaviour- An Indian perspective, Text and cases “, Sultan chand& sons, NewDelhi. 9. Sumathi.S., Saravanavel.P. “Marketing Research and consumer behaviour “, Vikas publishing house Pvt.ltd. 10. Ramanuj Majumder, (2010), “Consumer Behavior”, PHI Learning private limited, New Delhi. 11. Business standard, Saturday, July13, 2013 WEBSITES 12. Articles. Times of india.indiatimes.com 13. www.hindustantimes.com/india.news/

VOLUME NO. 6 (2016), ISSUE NO. 09 (SEPTEMBER) ISSN 2231-1009
INTERNATIONAL JOURNAL OF RESEARCH IN COMPUTER APPLICATION & MANAGEMENT A Monthly Double-Blind Peer Reviewed (Refereed/Juried) Open Access International e-Journal - Included in the International Serial Directories
http://ijrcm.org.in/
13
FACTORS INFLUENCING INVESTMENT IN MUTUAL FUND: A STUDY REGARDING INVESTORS BEHAVIOUR
DR. HITESH VYAS HEAD
DEPARTMENT OF BUSINESS MANAGEMENT M. J. COLLEGE OF COMMERCE
VIDYA NAGAR
AUM DAVE RESEARCH STUDENT
MAHARAJA KRISHNKUMARSINHJI BHAVNAGAR UNIVERSITY BHAVNAGAR
ABSTRACT
Mutual funds have emerged as an important segment of financial markets and so far have delivered value to the investors, Proper mechanism of mutual fund would help towards making the Indian mutual fund industry more vibrant and competitive. This study is based on the formulation of the following hypotheses: Hypothesis 1: In the case of male investors average investment and education are two independent attribute. Hypothesis 2: In the case of female investors average investment and education are two independent attribute. In order to study the factors influencing the retail investors to prefer investment in mutual funds in Gujarat, analysis of one-way variance.
KEYWORDS mutual fund, retail investors, factors influence to selection of mutual funds, variables influencing investors decision.
INTRODUCTION Mutual Fund (henceforth MF) is an investment tool that allows small investors access to a well-diversified portfolio, it includes securities like as equities, bonds. Each shareholder participates in the gain or liable for losses of the fund. Units are issued and can be redeemed as demanded. The most common feature of the mutual fund is diversification of funds. Thus, MF industry has moved from offering a handful of schemes like equity, debt or balance of equity
and debt funds, money market, sector specific funds, index funds and gilt edged funds. SEBI (Mutual Funds) Regulations act 1993, define Mutual Fund as follows (as given by Jayadev. M (1995)) “A fund established in the form of a trust by a sponsor to raise monies by the trustees through the sale of units to the public under one or more schemes for investing in securities in accordance with these regulations”. Frank Reilly defines, Mutual Funds “as financial intermediaries which bring a wide variety of securities within the reach of the most modest investors”.
LITERATURE REVIEW Giridhari Mohanta & Dr. Sathya Swaroop Debasish (2011) studied that investors invest in different investment avenues for fulfilling financial, social and psycho-logical need. Badrinath, S.G & Gubellini, S (2011) have evaluated the return performance of long-short, market-neutral and bear mutual funds using multi-factor models and a conditional CAPM. Cao, Ghysels & Hatheway (2011) have stuied global funds and specialized domestic equity fund and found that risk and return characteristics of these two groups of funds are significantly different from funds employing derivatives sparingly or not at all. Agarwal, R. et al. (1981) have reviewed that since long the performance of mutual funds has been receiving a great deal of attention from both practitioners and academics.
NEED FOR THE STUDY The study is an attempt to know about the profile of the individual investor and the variables influencing to invest on mutual funds. The study also revels the influence of demographic factors like gender, age and education on investment of the investor.
OBJECTIVES OF THE STUDY 1. To develop a profile of Indian individual investor in terms of their demographic. 2. To know the investment behavior of the individual investor. 3. To know the dependence/independence of demographic factors (education) of the investor and their investment behavior.
METHODOLOGY On the responses of the questionnaire analyses have been carried out. Various statistical tools like one-way ANOVA have been carried out. In the present study, we took a sample size of 256 investors in this survey. We classified investor’s education into five groups. Education groups details are given in table-1.
TABLE 1: EDUCATION GROUP DETAIL
Name of Age Group Category Comments
HS dropout 1 Did not complete high school
HS grad 2 Completed high school
Some College 3 Attended some college
College grad 4 Graduated from college
Degree + 5 Master’s degree & Ph.D.
The demographic attributes of the investors like gender, age, education level, with the help of the graphs. GRAPH 1 (AVAILABLE AT THE END AS ANNEXURE)
Sex: It shows that in the demographic the male investors are dominating female investors in their contribution in total investment. GRAPH 2(A) & 2(B) (AVAILABLE AT THE END AS ANNEXURE)
Age & Investment: In both Male and Female investors, it was found that age group of 30-45 has the maximum investment which clearly depicts that the youngsters are keen to invest in the mutual fund market.
GRAPH 2(C) & 2(D) (AVAILABLE AT THE END AS ANNEXURE) Age Group & Investors: In both cases, age groups of 18-30, 30-45 have the maximum number of investor’s. In case of Male, age group 45-60 has minimum number of investor’s while in case of Female, age group over 60 has minimum number of investor’s.
A

VOLUME NO. 6 (2016), ISSUE NO. 09 (SEPTEMBER) ISSN 2231-1009
INTERNATIONAL JOURNAL OF RESEARCH IN COMPUTER APPLICATION & MANAGEMENT A Monthly Double-Blind Peer Reviewed (Refereed/Juried) Open Access International e-Journal - Included in the International Serial Directories
http://ijrcm.org.in/
14
The length of the error bars (standard errors) shows that age groups have approximately the same spread. GRAPH 3(A) & 3(B) (AVAILABLE AT THE END AS ANNEXURE)
Personal income: These graphs show Personal income per month and their Education Group among Male & Female Investors. Degree + male investors were most able to invest some part of their salary for the investment in mutual fund while degree + and some college education group of female investors were most able to invest in mutual fund.
GRAPH 4(A) & 4(B) (AVAILABLE AT THE END AS ANNEXURE) Level of education & Investors: These Graphs shows Level of Education among the Male & Female Investors. HS drop out and college graduate two education group have maximum number of Investors in the case of female investors, while some college and college graduate two education group have maximum number of Investors in the case of Male investors. For Female, education group Degree +. Education group HS drop out have minimum number of maleInvestors.
GRAPH 4(C) & 4(D) (AVAILABLE AT THE END AS ANNEXURE) Level of education & Investment: These Graphs shows the relation between Personal investment per month and their Education Group among Male & Female Investors. These graphs Shows that for different education group investment of male investors have different the length of error bar. It shows they have different standard error. Highest portion of the investment among both (male & female) investors are of degree+ investors and least part is of HS dropout investors. Some college female and graduate male groups are second highest in female investors and male investors respectively.
GRAPH 5(A) (AVAILABLE AT THE END AS ANNEXURE) Square root of Personal investment & Education: These Graphs shows the relation between Square root of Personal investment per month and their Education Group among Male Investors. If we take the square root of each investment value, there is less difference in length among the error bars (Standard deviations). It shows that there is less variability among the standard deviations, and the relation between the means and standard deviations is weaker after transformation. The transformation aids in eliminating the dependency between the group and the standard deviation.
HYPOTHESIS TESTING Hypothesis 1: Education of the male investor and Average investment are two independent attributes of the investors. The ANOVA table-1 is obtained using the transformed investment of male investors as the dependent variable and five education groups of male investors as category variable. Table-2 suggests a significant difference among the four means of education groups of male investors with p value=0 (p-value < 0.0005). It was found that Education group is significant at 5% level of significant. Thus, at least one of the Education group differs from the others with respect to investment.
GRAPH-6(A) (AVAILABLE AT THE END AS ANNEXURE) Shows the average value (least square mean) of the transformed male investment for each level of the Education group of male investors. The Graph-6 (a) reveals that education group some college and college graduate amoung male investors have similar average investment in mutual fund and Degree + education group has maximum average investment in mutual fund. In the recent study it was found that Education plays a vital role where investments of male is concerned. Hypothesis 2: Average investment and education are 2 independent attribute of the Female investors. The ANOVA table-2 is obtained using the transformed investment of female investors as the dependent variable and five education groups of female investors as category variable. F-ratio is the Mean-Square for Education group divided by the Mean-Square for Error. The Education group effect on investment of female is not significant (p-value >0.0005). Average investment and education are two independent attribute of the Female investors.
GRAPH-6(B) (AVAILABLE AT THE END AS ANNEXURE) Shows the average value (least square mean) of the transformed female investment for each level of the Education group of female investors. The Graph- 6 (b) shows that female investors having different education group have different average investment in mutual fund. Same like as male, female investors with Degree + education group has maximum average investment in mutual fund.
LIMITATIONS Mutualfund investments are affected by several factors such as level of income, past investment experiences, expert and other investors’ opinions and financial stability and demogrphical and physological factors, whereas the present study is confied to the demogrphical factors only.
CONCLUSION The present study looks at the perception level of the investors towards investment in mutual funds. Presently, more and more funds are entering the industry and their survival depends on strategic marketing choices of mutual fund companies, to survive and thrive in this highly promising industry, in the face of such cutthroat competition. Therefore, the mutual fund industry today needs to develop products to fulfill customer needs and their education.
REFERENCES 1. Aggarwal, R. 1981. Exchange rates and stock prices: case study U.S capital markets under floating exchange rates. Akron Business and Economic Review, 12:
7-12. 2. Badrinath, S.G & Gubellini, S, July (2011) “On the characteristics and performance of long-short, market-neutral and bear mutual funds” Journal of Banking
& Finance, Vol. 35 Issue 7, p1762-1776. 3. Cao, Charles; Ghysels, Eric & Hatheway, Frank, July (2011) “Derivatives do affect mutual fund returns: Evidence from the financial crisis of 1998”, Journal of
Futures Markets, Vol. 31 Issue 7, pp. 629-658. 4. Giridhari Mohanta & Dr. Sathya Swaroop Debasish (2011) “A Study on Investment Preferences among Urban Investors in Orissa” Prerna Journal of Manage-
ment Thought and Practice, ISSN: 0974-908X volume: 3 Issue: 1 March 2011, pp 1-9. 5. Jayadev. M. Investment Policy and performance of Mutual Funds, Kanishka Publishers Distributors, New Delhi.
ANNEXURE ▼ANOVA
TABLE 1: HYPOTHESIS TESTS (MALE)
▼ ANOVA TABLE 2: HYPOTHESIS TESTS (FEMALE)
Source SS df Mean Squares F-ratio p-value
Between education Groups (Female Investors)
4399.949 4 1099.987 5.011 0.001
Within education Groups (Female Investors)
32267.338 147 219.506
Source SS df Mean Squares F-ratio p-value
Between education Groups (Male Investors) 6862.358 4 1715.590 7.854 0.000
Within education Groups (Male Investors) 21625.649 99 218.441

VOLUME NO. 6 (2016), ISSUE NO. 09 (SEPTEMBER) ISSN 2231-1009
INTERNATIONAL JOURNAL OF RESEARCH IN COMPUTER APPLICATION & MANAGEMENT A Monthly Double-Blind Peer Reviewed (Refereed/Juried) Open Access International e-Journal - Included in the International Serial Directories
http://ijrcm.org.in/
15
GRAPH (1): SEX AMONG THE INVESTMENT GRAPH 4 (A): LEVEL OF EDUCATION AMONG THE MALE
INVESTORS.
GRAPH 4 (B): LEVEL OF EDUCATION AMONG THE FEMALE INVESTORS.
GRAPH 2 (A): PERSONAL INVESTMENT PER MONTH AND
THEIR AGE GROUP AMONG MALE INVESTORS.
GRAPH 2 (B): PERSONAL INVESTMENT PER MONTH AND
THEIR AGE GROUP AMONG FEMALE INVESTORS.
GRAPH 4 (C): PERSONAL INVESTMENT PER MONTH AND
THEIR EDUCATION GROUP AMONG MALE INVESTORS.
GRAPH 4 (D): PERSONAL INVESTMENT PER MONTH AND
THEIR EDUCATION GROUP AMONG FEMALE INVESTORS.
GRAPH 2 (C): AGE AMONG THE MALE INVESTORS.
GRAPH 2 (D): AGE AMONG THE FEMALE INVESTORS.
GRAPH 5 (A): SQUARE ROOT OF PERSONAL INVESTMENT PER
MONTH AND THEIR EDUCATION GROUP AMONG MALE
INVESTORS.
GRAPH 5 (B): SQUARE ROOT OF PERSONAL INVESTMENT PER MONTH
AND THEIR EDUCATION GROUP AMONG FEMALE INVESTORS.
GRAPH 3 (A): PERSONAL INCOME PER MONTH AND THEIR
EDUCATION GROUP AMONG MALE INVESTORS.
GRAPH 3 (B): PERSONAL INCOME PER MONTH AND THEIR EDUCATION
GROUP AMONG FEMALE INVESTORS.
GRAPH 6 (A): LEAST SQUARE MEANS OF SQUARE ROOT OF
INVESTMENT OF FIVE DIFFERENT EDUACTAION GROUP OF MALE
INVESTORS.
GRAPH 6 (B): LEAST SQUARE MEANS OF SQUARE ROOT OF INVESTMENT OF FIVE DIFFERENT EDUACTAION GROUP OF FEMALE INVESTORS.

VOLUME NO. 6 (2016), ISSUE NO. 09 (SEPTEMBER) ISSN 2231-1009
INTERNATIONAL JOURNAL OF RESEARCH IN COMPUTER APPLICATION & MANAGEMENT A Monthly Double-Blind Peer Reviewed (Refereed/Juried) Open Access International e-Journal - Included in the International Serial Directories
http://ijrcm.org.in/
16
CSR REPORTING IN THE LIGHT OF THE EUROPEAN UNION DIRECTIVES
RYSZARD KAMIŃSKI PROFESSOR
FACULTY OF LAW AND ADMINISTRATION ADAM MICKIEWICZ UNIVERSITY
POLAND
ABSTRACT This paper focuses on the Corporate Social Responsibility (CSR) reporting system as an element of a broadly understood system of communication of a company with its environment. The aim of this paper is to present the system of CSR reporting (including environmental and social awareness) and to evaluate these systems. This paper focuses, in particular, on the European Union (EU) regulation developments that have occurred as a consequence of the changing conditions of the activity of companies. The general conclusion formulated in the paper is that in the future, CSR reporting system should take into account the reporting information the users actually demand, and provide information needed in the modern market economy and in the competitive environment. Trends in the development of CSR reporting outlined by international organizations and the EU should be given credit for moving in the correct direction. Drafts of new regulations and the recently adopted ones take into account the current trends in the development of enterprises and the current needs of local communities and governments. However, further successful development of a CSR reporting system requires cooperation of many actors involved in the creation of this system. This means that the development of EU rules on the reporting of CSR should be based on the cooperation of all stakeholders involved in the formation of this system.
KEYWORDS corporate social responsibility, reporting standards, stakeholders, UE regulations.
1. INTRODUCTION oday stakeholders expect information to be extensive, faster, and more detailed on the key areas of the company’s business and operations, including projections about the future. For reports on environmental subjects, projections for future Corporate Social Responsibility (CSR) areas are very important. Companies that want to be socially responsible should incorporate environmental and social issues in their objective reporting. The contemporary financial
reporting model is evolving due to the growing importance of information on the non-financial activities of companies. Among them, the greatest attention is focused on the aspects of CSR. In this paper, corporate social responsibility is recognized as a multifaceted area of theoretical reflection and practical activities for a number of disciplines, including enterprise reporting. The observed search for CSR reporting concepts has inspired the writing of this article. The aim of this paper is to present and evaluate the system of CSR reporting in the European Union (EU), as well as changes in this area. This paper will determine the content and sequence of the main CSR issues. These include: 1. Characteristics of the concept of corporate social responsibility. 2. Presentation of changes in regulations regarding CSR in the EU. 3. Presentation of EU regulations on CSR reporting. The study included companies obliged to prepare statements in accordance with EU regulations. The provisions quoted in the paper are the provisions in force as of 31 December 2015. The primary source material used in the work were the rules and standards (mandatory and optional) on companies reporting. The work methods used include descriptive analysis method and a comparative method.
2. THE ESSENCE OF CORPORATE SOCIAL RESPONSIBILITY The concept of corporate social responsibility appeared in 1929 through an address delivered at Northwestern University by the then Dean of Harvard Business School, Wallace B. Donham. He said “Business started long centuries before the dawn of history, but business as we now know it is new – new in its broadening scope, new in its social significance. Business has not learned how to handle these changes, nor does it recognize the magnitude of its responsibilities for the future of civilization” (Asongu 2007). Indeed, corporate social responsibility is a balancing act where organizations thread the line between economic sustainability and social responsibilities. By definition, CSR refers to the "voluntary integration of corporate social and environmental concerns in their commercial operations and in their relations with the parties concerned,” according to The Green Book of the European Commission "Promoting a European framework for Corporate Social Responsibility" (COM 2001, 681 final). The Green Book further states that organizations must also go beyond meeting judicial obligations by investing in human capital, in the environment and in the relations with the related parties. Corporate social responsibility is a voluntary activity by companies focused on the needs of different groups of stakeholders and a respect for the natural environ-ment. These activities go beyond the minimum legal requirements but are considered important aspects of a company’s planning strategy. The social responsibility of business is treated as a management strategy which, through a social dialogue at the local level, contributes to the competitiveness of a company on a global level. At the same time, it helps to improve relations with various groups of stakeholders and to maintain sustainable economic and social development. However, sometimes the practice of CSR is controversial. Critics argue that CSR distracts from the fundamental economic role of businesses, while others argue that it is nothing more than superficial “window dressing”. Acting in accordance with the principles of CSR, enterprises can achieve many benefits. These include: 1) Increase in the interest of investors who pay attention not only to financial results, but also to the quality of management; investors often assess the com-
pany's financial credibility with its social credibility. 2) Increase in customer and stakeholders’ loyalty. 3) Improved relations with the community and local authorities. 4) Increase in competitive advantage especially in developed markets, where expectations that companies are socially responsible are becoming increasingly
common. 5) Promotion of a positive image of the company among employees, which is an important element of an intangible motivation system, promotion of pro-social
activities of the company, respecting ethical principles, and caring for the environment improves the company's image in the eyes of employees. Corporate Social Responsibility and similar concepts have become more and more important during the last decades as a response to a loss of public trust in individual companies (e.g. the cases of Enron, Parmalat, etc.) and in the whole economic system (e.g. anti-globalization movement). During the last years, a number of international initiatives have tried to improve perceptions of businesses and rebuild public trust in businesses by touting the positive environmental and societal impacts that many businesses are making. As the leading organization in collecting, publishing and analyzing CSR reports, Corporate Register has collected more than 30.000 reports from about 7.500 companies worldwide. (Martinuzzi, Krumay & Pisano). Corporations have become increasingly aware of the shareholders’ consideration of CSR initiatives and performances to be supplementary to traditional financial criteria for investment decision-making. Such shareholders’ consciousness on CSR is called social investment. They typically inject the interest of social and envi-ronmental concerns into investment activities so that their commercial behaviors can influence business practices while making adequate profits. By implementing social investment practices, shareholders (or investors) can put pressure on firms to operate reasonably and ethically in order to ensure business continuity.
T

VOLUME NO. 6 (2016), ISSUE NO. 09 (SEPTEMBER) ISSN 2231-1009
INTERNATIONAL JOURNAL OF RESEARCH IN COMPUTER APPLICATION & MANAGEMENT A Monthly Double-Blind Peer Reviewed (Refereed/Juried) Open Access International e-Journal - Included in the International Serial Directories
http://ijrcm.org.in/
17
Due to the lack of clear, universally accepted legal definition of corporate social responsibility used in practice, a CSR report depends on the expectations of key stakeholders, the tradition of the company, its ideology, as well as the characteristic values for the society, its culture and ethical standards. Companies use different approaches to social reporting. In practice there are three variants in reporting CRS: 1) Separate presentation of information on the social and environmental commitment of a company and its financial reports; 2) Integration of the two systems by taking into account how information in the financial statements affects actions in the field of sustainable development; 3) Replacement of financial reporting by a comprehensive report which highlights the costs and benefits of the initiatives taken in the area of corporate
responsibility (Śnieżek 2014). An important role in presenting information on CSR can be played by a management report, which is part of the annual report. It contains a commentary on the relevant information of assets and the company’s financial position, including the evaluation of the effects and the identification of risk factors with described threats. This also contains non-financial data, including information on environmental issues and employment. Non-financial information, covering, among other things the achievements in the field of corporate social responsibility, can also be disclosed in the notes to the financial statements. Lack of information disclosed by companies on corporate social responsibility often prevents stakeholders from making decisions based on that particular area. This problem is exacerbated by the voluntary nature of CSR reports and by the fact that companies are free to decide what information to disclose and how to do it. Therefore, they often avoid presenting this information, which is not completely positive and try to present them in the best possible light. CSR reports are quite often used as an opportunity to promote public relations (United Nations Conference on Trade and Development 2011). In order to improve the quality and increase the comparability of reporting on corporate social responsibility during the 1970s, work commenced on the imple-mentation of accounting standards in the field of CSR. Unfortunately, to date, there has been no widely accepted standard. For this reason, in practice, there are different standards, recommendations, and guidelines for accounting in CSR. Therefore, companies can base their CRS reporting on a variety of proposals devel-oped by many organizations. Among them are proposals from the following organisations: - The United Nations Global Compact, - The Organization for Economic Co-operation and Development, - The International Labour Organization, - The Global Reporting Initiative, - Standards and certifications: AccountAbility's AA1000 Standards and ISO 26000.
3. CRS REPORTING UNDER EU REGULATIONS The European Union’s policy in the field of corporate social responsibility has been practically reflected - as mentioned before - in the 2001 publication, the European Commission's “Green Paper: Promoting framework for Corporate Social Responsibility” (COM (2001) 366 final). This document states that socially re-sponsible business is when "companies voluntarily take into account social and environmental aspects of its business activities and in relations with its stakehold-ers." The EC Green Paper contains internal and external CSR issues. Among the internal issues are: human resources management, health and safety, the ability to adapt to changes, and environmental management. The issues of an external environment regulated by the Green Paper are: cooperation with the local com-munity and business partners, human rights, and environmental problems. Work undertaken in the development of the Green Paper was continued, and, as a result, a new document was issued on the strategy of implementation and dissemination of corporate social responsibility, the so-called White Paper (COM (2002) 347 final), addressed to the European institutions, Member States, social partners, business organisations, consumers, and enterprises. The White Paper complemented the contents of the Green Paper in those areas concerned with the solving of problems related to CSR. These are: education, exchange of experience and good practices, the development of corporate social responsibility instru-ments, launching the European Multi Stakeholder Forum on CSR, and the inclusion of CSR issues in all EU policies (employment, economic, environmental, con-sumer, external, public administration), (European Multi Stakeholders Forum on CSR 2004). Environmental information and information relating to social activities, or other non-financial aspects of companies operating in the EU could, of course, have already been disclosed prior to the adoption of the Green and White Paper on the basis of the Fourth Directive on the annual financial statements. However, this possibility was rarely used. Therefore, the European Union adopted a new strategy for 2011-2014 on corporate social responsibility in order to support the development and coordination of Member States' policies on CSR (COM (2011) 681 final). Following this, in 2011, the European Commission issued a statement in which it introduced a new definition of corporate social responsibility. The Commission defined CSR as “the responsibility of enterprises for their impacts on society”, which is consistent with international instruments (OECD Guidelines for Multinational Enterprises, ISO 26000 and the UN Guiding Principles on Business and Human Rights), (DG Enterprise & Industry 2014). In addition, EU formulated a plan for the development of good practices in the area of CSR in the Member States, which was put forth in the “European Commission Communication on CSR 2011: Implementation table” (Ec.europa.eu 2011). One of the objectives of the adopted plan was to improve the quality of reporting of environmental and social issues. Valuable guidelines for reporting on CSR have become recognized standards for the United Nationals Global Compact, the OECD Guidelines, ISO 26000 and the Tripartite Declaration of the International Labour Organization. In 2014 the European Commission conducted a review of activities over the last several years, to serve as the framework for the next EU policy on CSR. This review process started with a comprehensive public consultation, which was open from April until August 2014. The results of the consultation will be used for the development of the successor strategy, to run from 2015 to 2020 (DG Enterprise & Industry 2014). The results were presented at the Multi Stakeholder Forum on Corporate Social Responsibility in Brussels on 3-4 February 2015. The aim of the forum was to gather input from all relevant stakeholders – businesses, public authorities and civil society organisations – in anticipation of the drafting of the Commission’s renewed CSR strategy for the period 2015-2020. The Forum also addressed the issue of CSR reporting issues. It was found that European companies need to look to global initiatives, in particular the UN guiding principles on business and human rights, the OECD guidelines on multinational enterprises, and the concept of Integrated Reporting. They were reminded the proposal of the UN General Secretary Ban Ki Moon, who said “All countries should consider requiring companies to undertake mandatory economic, environmental, social and governance reporting, accompanied by regulatory changes that ensure that investor incentives are aligned with sustainable development goals” (Business-human rights 2015). An important conclusion derived in the course of the discussion was that “To be credible, the responsibility for CSR is not confined to companies. It also encompasses politicians, media and civil society. It was agreed that sustainable reporting boosts transparency if done comprehensively and correctly. We therefore need to take into consideration issues of transparency and accountability, and education and governance, for a number of stakeholder groups” (ACCA Think Ahead 2015). The next important step in the subject of CRS reporting was the adoption in 2013 of Directive 2013/34 / EU, which affects disclosure information on environmental issues, social and employment issues, including the protection of human rights, anti-fraud and corruption, and respecting the principle of diversity management (Official Journal UE L 182/19 2013). Directive 2013/34 / EU provides for the obligation of reporting information related to of corporate social responsibility by large public interest companies, having more than 500 employees, in the form chosen by the company, either in the annual financial report or in a separate report. This principle of disclosure of CSR information nevertheless leaves companies free to design and implement strategies in this area. It also gives them a certain degree of freedom in determining the information to be disclosed. CSR reports are to be drawn with respect for the principle of comply or explain, that means, the need to explain the reasons for non-disclosure of certain information. The above rules apply only to entities considered to be public interest entities, such as, companies listed on the stock exchanges, insurers, banks and companies recognised by the EU Member States as socially important because of the nature of their business. There are about 6,000 companies of this kind (Banking and Finance 2014). Directive 2013/34/EU as regards disclosure of non-financial (including CSR) and diversity information by certain large undertakings and groups was amended by the Directive 2014/95/EU (Official Journal UE, L 330/1 2014). According to new Directive a non-financial report, or “statement”, should contain information relating to, at a minimum: - A brief description of the undertaking's business model, - A description of the policies pursued by the undertaking in relation to those matters, including due diligence processes implemented,
VOLUME NO. 6 (2016), ISSUE NO. 09 (SEPTEMBER) ISSN 2231-1009
INTERNATIONAL JOURNAL OF RESEARCH IN COMPUTER APPLICATION & MANAGEMENT A Monthly Double-Blind Peer Reviewed (Refereed/Juried) Open Access International e-Journal - Included in the International Serial Directories
http://ijrcm.org.in/
18
- The outcome of those policies, - The principal risks related to those matters linked to the undertaking's operations including, where relevant and proportionate, its business relationships,
products or services which are likely to cause adverse impacts in those areas, and how the undertaking manages those risks, - Non-financial key performance indicators relevant to the particular business. According to the preamble to Directive 2014/95UE the report should contain a non-financial statement that discloses: - Environmental matters, such as, health and safety, use of renewable and/or non-renewable energy, greenhouse gas emissions, water use, and air pollution, - Social and employee-related matters, including gender equality, implementation of fundamental conventions of the International Labour Organization, work-
ing conditions, social dialogue, respect for the right of workers to be informed and consulted, respect for trade union rights, health and safety at work and the dialogue with local communities, and/or the actions taken to ensure the protection, and the development of those communities,
- Human rights matters, such as, information on the prevention of human rights abuses, anti-corruption and bribery matters, and information on instruments in place to fight corruption and bribery.
This statement should include a description of the policies, outcomes and risks related to these aforementioned matters and should be included in the manage-ment report of the undertaking concerned. The non-financial statement should also include information on the due diligence processes implemented by the undertaking, also regarding, where relevant and proportionate, its supply and subcontracting chains, in order to identify, prevent and mitigate existing and poten-tial adverse impacts. There is significant flexibility for companies to disclose relevant information (including reporting in a separate report), in that they can use international, European or national guidelines (e.g. the Eco-Management and Audit Scheme (EMAS), the UN Global Compact, the OECD Guidelines for Multina-tional Enterprises, ISO 26000, etc.). The European Commission has launched a public survey on the non-binding guidelines of the methodology for reporting non-financial information following article 2 of Directive 2014/95/EU on disclosure of non-financial and diversity information by certain large undertakings and groups. The purpose of this public survey is to collect views from stakeholders. EU Member States should transpose the rules on non-financial reporting into national legislation by 06.12.2016. In this context, the European Commission is organizing transposition workshops to assist national authorities. Therefore, from 2017 onwards, European companies will be re-quired to report on their CSR activities including their social, human rights, environmental, anti-corruption and bribery impacts and thus track their performance on social and sustainability metrics, not just financial ones. By increasing the quantity and quality of CSR reporting, the Directive represents a “paradigm shift” in enterprise reporting (Spießhofer & Eccles 2014)1. However, in most cases, the reporting of CSR has not yet reached the quality used for other types of reporting. This deficit is related to inter alia, the difficulty of measurement standards for CSR reporting. It is difficult to measure the quality of a company's reputation, the satisfaction of its employees and customers, or the company’s effect on the quality of local community life. Thus, the ratios calculated on the basis of these measurements cause doubt about their credibility. Hence, the idea of verification of corporate social responsibility reports by independent, specialized auditors. This is justified especially when the CSR report constitutes a part of an integrated report for a company. Directive 2014/95/UE and the new CSR definition have proven controversial within the European business community. Many core features of the approach devel-oped in the early 2000s still remain in place. Mandatory reporting laws do not introduce any binding mandates on companies to limit environmental pollution, increase labor standards or introduce quotas for female representation on corporate boards. The emphasis is still clearly on voluntary action such as stakeholder engagement, transparency, and learning through the development of best practice and common norms of responsibility. There are also questions concerning the implementation of the directive into practice: How have European firms engaged with the CSR agenda promoted by the EU and the reporting requirements identified by the new Directive? Is there evidence that European firms are learning to implement better CSR practice through this engagement? To address these questions, A. Favotto and K. Kollman conducted a content analysis of CSR reports published by firms in Western Europe. The study included the reports published by 20 corporations in 2012/2013 from EU member states. They found that at present, the level of CSR disclosure varies significantly across the reporting areas identified by the EU Directive. Large corporations in Europe tend to provide higher quality information on environmental matters, compared to labor and human rights matters. The vast majority of firms have ad-hoc policies for an array of environmental issues and assesses performance quantitatively, which can be read as a part of a wider environmental strategy, entailing long-term commitments and objectives (Favotto & Kollman 2015). According to these authors, this analysis indicates that large transnational corporations (TNCs) in Europe have indeed engaged with the CSR agenda promoted by the EU and other private governance schemes such as the UN Global Compact. Although TNCs appear to be more transparent about their CSR impacts than in the past, the analysis also indicates that reporting is still very uneven across country and CSR areas. The commitments and quality of information that firms disclose outside of the environmental area are especially under-developed. Further they found, that the new Directive may go some way towards encouraging European firms to improve their engagement with and reporting on social and human rights issues by harmonizing practice through a mandatory Directive. The fact that the Directive is limited to large corporations and draws on a variety of existing codes results in an emphasis on environmental over social issues and means that positive change will likely be limited.
4. CONCLUSIONS The future reporting system should emphasize the information the users actually demand, and provide the information needed in the modern market economy. A balanced approach to financial and non-financial information (including CSR) provides a more complete picture that enables investors and other stakeholders to better understand how value is created, managed and sustained. It’s a view shared by the EU, which says that more transparency will drive the long-term performance of the EU's largest companies and contribute to Europe’s competitiveness and the creation of more jobs. European regulators have questioned the purely voluntary nature of CSR and are calling for ‘complementary’ legislation to encourage corporate reform. This change in tone is illustrated by the revised definition of CSR published by the European Commission in 2011, which states that CSR is “the responsibility of enter-prises for their impacts on society” and links this to compliance with government regulation. This change was followed in 2014 by the adoption of Directive 2014/95/EU. Certainly disclosure of relevant social information is an area of particular interest to many investors, particularly in areas such as health and safety at work, community relations and human rights. However, it should be noted, that reporting is only the tip of the iceberg. Everything of substance is happening underneath the surface, that is, inside the enterprise, in governance, in management oversight, in monitoring, culture, performance and incentives, etc. While it is no magic bullet, the Directive can help enterprises manage the impacts of CSR reporting. It represents a meaningful step toward functioning markets and greater corporate accountability (Kinderman 2015). The above trends in the development of CSR reporting outlined by the EU are showing promise and should be encouraged. Drafts of new regulations and the recently adopted ones take into account the current trends in the development of enterprises and the current needs of local communities and state governments. However, further successful development of a reporting system requires cooperation of many actors involved in the creation of this system (EU Commission, states members of EU, professional organizations).
REFERENCES 1. ACCA Think Ahead 2015: “The European Commission’s multi-stakeholder forum on corporate social responsibility, Available from: <http://www.ac-
caglobal.com/vn/en/technical-activities/technical-resources-search/2015/february/ec-forum-on-csr.html>, Viewed 2 January 2016. 2. Asongu, JJ, 2007, Strategic Corporate Social Responsibility in Practice, Greenview Publishing Company.
1 According to Birgit Spießhofer and Robert G. Eccles, the EU NFR Directive represents a “paradigm shift from [financial] value assessment and generation to accountability and private enforcement by financial and non-financial stakeholders”.

VOLUME NO. 6 (2016), ISSUE NO. 09 (SEPTEMBER) ISSN 2231-1009
INTERNATIONAL JOURNAL OF RESEARCH IN COMPUTER APPLICATION & MANAGEMENT A Monthly Double-Blind Peer Reviewed (Refereed/Juried) Open Access International e-Journal - Included in the International Serial Directories
http://ijrcm.org.in/
19
3. Banking and Finance 2014: Non-Financial Reporting, Available from: http://ec.europa.eu/finance/accounting/non-financial_reporting/index_en.htm, Viewed 28 September 2014.
4. Business-humanrights.org 2015: Opening Speech of Richard Howitt MEP at the European Commission Multi-Stakeholder Forum on Corporate Social 5. COM (2001) 366 final, “Green Paper. Promoting a European framework for Corporate Social Responsibility, Commission of the European Communities”,
Brussels. 6. COM (2002) 347 final, “Corporate Social Responsibility: A business contribution to Sustainable Development”, Commission of the European Communities,
Brussels 2002. 7. COM (2011) 681 final, “A renewed EU strategy 2011-14 for Corporate Social Responsibility, Communication from the Commission to the European 8. DG Enterprise & Industry 2014, The Corporate Social Responsibility Strategy of the European Commission: Results of the Public Consultation, November, p.
5. 9. Ec.europa.eu 2011: European Commission Communication on CSR 2011: Implementation table, Available from: http://ec.europa.eu/enterprise/policies/sus-
tainable- business/files/doc/csractionstimeline121213webversion_en.pdf>, Viewed 28 May 2014. 10. Elżbieta Burzym), Zeszyty Teoretyczne Rachunkowości, vol. 76 (132), p. 85. 11. European Multi Stakeholders Forum on CSR 2004: Final results & recommendations. Final report, Available from: http://www.corporatejus-
tice.org/IMG/pdf/CSR_20Forum_20final_20report.pdf. Viewed 20 May 2014. 12. Favotto, A, Kollman, K, 2015: Corporate Social Responsibility in an Era of Economic Crisis: Empty Gesture or Tool for Corporate Learning?, London School of
Economics and Political Science, Available from: http://blogs.lse.ac.uk/eurocrisispress/2015/03/19/corporate-social-responsibility-in-an-era-of-economic-crisis-empty-gesture-or-tool-for-corporate-learning/, Viewed 28 December 2015.
13. Kinderman, D, 2015: The Politics of Corporate Transparency and the Struggles over the Non-Financial Reporting Directive 2014/95/EU, Available from: http://clsbluesky.law.columbia.edu/2015/09/01/the-politics-of-corporate-transparency-and-the-struggles-over-the-non-financial-reportingdirective20149 5eu/, Viewed 4 January 2016.
14. Martinuzzi, A, Krumay, B, Pisano U: The New Communication of the EU Commission on CSR and National CSR Strategies and Action Plans, European Sustain-able Development Network, Available from: http://www.sd-network.eu/?k=quarterly%20reports&report_id=23#qr11, Viewed 20 January 2016.
15. OECD Publishing 2011, “Guidelines for Multinational Enterprises 2011 Edition”. 16. Official Journal of the European Union L 182/19 2013. Directive 2013/34/EU of The European Parliament and of The Council of 26 June 2013 on the annual
financial statements, consolidated financial statements and related reports of certain types of undertakings, amending Directive 2006/43/EC of the European Parliament and of the Council and repealing Council Directives 78/660/EEC and 83/349/EEC.
17. Official Journal of the European Union, L 330/1 2014. Directive 2014/95/EU of The European Parliament and of the Council of 22 October 2014 amending Directive 2013/34/EU as regards disclosure of non-financial and diversity information by certain large undertakings and groups.
18. Parliament, The Council, The European Economic and Social Committee and The Committee of The Regions”, Brussels. 19. Responsibility (CSR), Brussels”, 3 February 2015, Available from: <business-humanrights.org/.../Opening%20Speech%2>, Viewed 2 January 2016. 20. Śnieżek E, 2014, Społecznie odpowiedzialne przedsiębiorstwo przyszłości w kontekście ponadczasowych przemyśleń Profesor Elżbiety Burzym, (Socially re-
sponsible of company in the future in context timeless thoughts Professor 21. Spießhofer B, Eccles RG. 2014, Information und Transformation – CSR-Berichterstattung in Europa und den USA (Information and Transformation - CSR
Reporting in Europe and the US), in: Forum Wirtschaftsethik, Jahresschrift des DNWE (Forum Business Ethics, Annual Publication of DNWE), p. 27. 22. United Nations Conference on Trade and Development 2011, Investment and Enterprise Responsibility Review: Analysis of investor and enterprise policies
on corporate social responsibility, New York and Geneva, pp. 53-53.

VOLUME NO. 6 (2016), ISSUE NO. 09 (SEPTEMBER) ISSN 2231-1009
INTERNATIONAL JOURNAL OF RESEARCH IN COMPUTER APPLICATION & MANAGEMENT A Monthly Double-Blind Peer Reviewed (Refereed/Juried) Open Access International e-Journal - Included in the International Serial Directories
http://ijrcm.org.in/
20
A STUDY ON THE INVESTORS AWARENESS TOWARDS HEALTH INSURANCE POLICY IN TAMILNADU
DR. P. RAMAN PROFESSOR
PANIMALAR ENGINEERING COLLEGE CHENNAI
ABSTRACT
The topic of the study is about insurance awareness among general public in Tamil Nadu, the aim of the study is to find out investors perception towards insurance and their understanding on health insurance benefits, to study the insurers’ knowledge about insurance coverage and others benefits and to evaluate the socio-economic profile of the insured and uninsured population by parameters such as Age group, Educational qualification, household income, occupation, etc. A primary survey of households was undertaken for four districts, covering both rural and urban areas, in Chennai, Vellore, Dharmapurai and Salem. The researcher used simple random sampling for conducting the survey. The sample size of the study undertaken by the researcher was 150 insurance investors. The data were collected from various investors through questionnaires. The descriptive method of research has undertaken for the study. The collected data had been analyzed by applying statistical tools such as factor analysis, discriminate analysis, Correlation, ANOVA, weighted average etc. The paper provides an insight of investor’s belief and perception with respect to insurance. Findings, suggestions, and conclusion are given based on the values observed from the study.
KEYWORDS insurance habit, awareness about health insurance, information flow and consumer behavior.
1. INTRODUCTION nsurance occupies an important place in the complex modern world since risk, which can be insured, has increased enormously in every pace of life. This has led to growth in the insurance business and evolution of various types of insurance covers. The insurance sector acts as a mobiliser of savings and a financial intermediary and is also a promoter of investment activities. It can play a significant role in the economic development of a country, while economic devel-
opment itself can facilitate the growth of the insurance sector.
2. OBJECTIVES OF THE STUDY PRIMARY OBJECTIVE 1. To study the awareness on health insurance with particular reference to Tamil Nadu. SECONDARY OBJECTIVES 1. To study and analyse awareness levels of the insured and uninsured population with regard to health insurance. 2. To study the perception towards insurance and their view on health insurance benefits over investment in insurance. 3. To analyse the insurers’ knowledge about insurance coverage and others factors. 4. To evaluate the socio-economic profile of the insured and uninsured population by socio-economic parameters such as age group, educational qualification,
household income, occupation, etc.
3. SCOPE AND NEED FOR THE STUDY The growing need for financial education for the families to take better decision and to increase their economic security has been widely recognized. It is felt that well informed and well educated customers can create economic ripples. They make better financial decisions for themselves and their families, increasing their economic security and well being. Secured families are more involved in their communities as home owners and voters. They are more involved as parents with their children’s schools and teachers, enabling better educational and economic outcomes for their children. They contribute to vital, thriving communities, further fostering community economic development. Thus, being financially literate is not only important to the individual household and family, it is also important to communities and societies. (Hogarth, Jeanne M., 2006). Insurance companies can address the problem of financial illiteracy of consumers by educating them.
4. REVIEW OF LITERATURE Gweneth Norris, John Innes, (2002). This is an in-depth case study using a grounded theory approach to explore managers’ views of ABC as part of the control system in an insurance company. Relevant issues are allowed to emerge from the data rather than imposing a theoretical framework upon them. Hypotheses are derived rather than confirmed. Issues emerging from this case study include: the relevance of ABC to managers, increased cost awareness coupled with the problem of taking qualitative factors into account, and the existence of different perceptions of managers within the same department. One hypothesis is how an understanding of ABC can affect job satisfaction by influencing the impact of ABC on managers’ actions. In this case study process and non-process managers had different levels of understanding and use of ABC information. A second hypothesis is that how managers view ABC information depends on whether they adopt a personal or an organisational perspective. Keywords: Control systems, Cost awareness, Perception of management Zuriah Abdul Rahman, NorzaidiMohdDaud, (2010), The purpose of this paper is to investigate first, the consumer buying behaviour and claims pattern of medical and health insurance (MHI)/medical and health tactful (MHT) policies and second, to determine whether moral hazard exists among policyholders at the time of application for the product and during claiming for compensation. The study was conducted on respondents from the insurance industry in Malaysia. It was found that most claims were rejected due to the discovery of some irregularities by the managed care organizations (MCO) while the Islamic insurer's claims experience, was otherwise. During the buying behaviour stage of MHT, there are fewer tendencies to withhold information but during the claiming stage, due to the generous level of compensation and their awareness of the coverage available naturally influence them to submit excessive claims. To a certain extent moral hazard is present when claims are made for longer disability durations than necessary, and having high average claims per person even for shorter duration disabilities. Keywords: Selection, Moral hazards, Malaysia, Medical insurance, Health insurance, Consumer behaviour. Mohamed, Issam A.W. and Osman, Kamal M (2011) The current paper analyzes the role of health insurance in mitigating poverty severity in Sudan the case study of National Fund for Health Insurance-Khartoum State. It is highlighting the role of health insurance in lifting the cost-burden of medical treatment on poor families. The principle target is to introduce problems that negatively affect individuals and the range health insurance covers in the society. Moreover, the paper shall analyze the necessary and basic needs of poor families related to covering risk of illness. That includes health services that health insurance system provides. Field surveys were conducted for real data from selected population in Khartoum State and were analyzed, graphically and with cross-tabulation. The primary observed findings are that there is lack of database in relation to poor families in the state. However, health centers were available overall parts of the state and localities. That is an indicative of more awareness that reduces the cost of transportation for the poor. Based on the findings, it is recommended that it is necessary to promote health services of high quality with less cost. Wealthy people should be motivated to pay. Moreover, it is vital to set up a mechanism to improve living circumstances of the poor categories. Banne, Ashok S and Bhola, Sarang ShankarIn 2012, Life insurance penetration in India which is the major indicator of growth of insurance in the country was just 3.17% compared to Japan 9.2%, Taiwan 15.0% S. Korea 6.9%. (IRDA Annual Report 2012-13, p121-122) One of the important reasons for low penetration was/is
I

VOLUME NO. 6 (2016), ISSUE NO. 09 (SEPTEMBER) ISSN 2231-1009
INTERNATIONAL JOURNAL OF RESEARCH IN COMPUTER APPLICATION & MANAGEMENT A Monthly Double-Blind Peer Reviewed (Refereed/Juried) Open Access International e-Journal - Included in the International Serial Directories
http://ijrcm.org.in/
21
unawareness of the Indian people about need of insurance in their life. It is true that with the establishment of IRDA and with the entry of private sector insurance companies, life insurance market is witnessing introduction of innovative, need based and customer friendly products. However, still majority of the Indian popu-lation is either uninsured or under-insured. Yet, buying a life insurance policy is not a subject of preference on the 'agenda' of most of the Indian people. Those who take out an insurance policy give priority for tax exemption and saving rather than risk cover. This paper is an attempt to study the awareness about need of life insurance among the customers of LIC. This research revealed that the customers are aware about need of life insurance in their life and the Individual Agents of LIC are the major source of information for the policyholders. Keywords: awareness, insurance penetration, risk cover, innovative, individual agent. Vellakkal, Sukumar, (2012). Adverse Selection and Private Health Insurance Coverage in India - A Rational Behaviour Model of Insurance Agents under Asymmetric Information. In the backdrop of the low level of health insurance coverage in India, this study examines the determinants of the scaling-up process of health insurance by analyzing the rational behavior of an insurance agent facing a trade-off between selling ‘health insurance’ and ‘other forms of insurance’ subject to his limited time and efforts, and the implications of such behavior on adverse selection and equity. The paper presents various pre-conditions affecting the rational behavior of insurance agents and also discusses two new concepts - ‘insurance habit’ and ‘asymmetric information on health insurance schemes’. Further, the study examines various strategies followed by insurance agents for maximizing their net incomes. The theoretical proposition is empirically validated by applying a binary Probity model and the primary data collected by the author is used in this context. The study concludes that given the existing incentive systems in the Indian insurance market for promoting various forms of insurance, the low level of insurance awareness among the general public, coupled with the dominant role of insurance agents in the market results in a situation of: Low level of health insurance coverage, no adverse selection and inequity in health insurance coverage. Keywords: health insurance, insurance agent, asymmetric information, adverse selection, insurance habit Since inception the Indian life insurance industry passed through many hurdles and hindrances in order to attain the present status. However, the income earning capacity, eagerness and awareness of the general public are the key determinants of the growth of any insurance industry. In the Indian context, the insurance habits among the general public during the independence decade was rare but there was a remarkable improvement in the Indian insurance industry soon after the economic reform era (1991) due to healthy competition from many national as well as international private insurance players. In this paper attempt has been made to analyse the overall performance of Life Insurance Industry of India between pre- and post-economic reform era. To measure the current status, volume of competitions and challenges faced by the Life Insurance Corporation of India and to measure the effectiveness of investment strategy of LIC over the period 1980 to 2009. Data were analysed by using T test and ANOVA. The study reveals that there is a tremendous growth in the performance of Indian Life Insurance industry and LIC due to the policy of LPG. Insurance industry also improved a lot due to the emergence of Private sector and opening up for foreign players. Further there is also a huge change in the investment pattern of LIC. There is an increasing trend toward the investment in Stock market by LIC from 60% to 93% from 1980 to 2009 due to the effective regulation of SEBI and increasing transparency of stock market. Keywords: Performance, Insurance, Investment Strategy. Ravi, Shamika and Bergkvist, Sofi (2013) our analysis shows that it is premature to dismiss the health insurance initiatives based on the existing analysis because these schemes perform better with time. This could be due to supply side factors such as improved implementation or demand side factors such as awareness of the scheme and financial literacy amongst users. To test this, we run the analysis by varying the definition of treatment group to only include districts that have schemes running for (a) at least a year and (b) longer than 2 years. The outcomes that we analyze are impoverishment, catastrophic healthcare expenditure and poverty gap change. Keywords: Publicly Financed Health Insurance, India Claartje L. terhoeven, Joost W.M. Verhoeven, (2013), the effects of corporate social responsibility (CSR) communication on external stakeholders' perceptions and behaviors have been studied extensively; however, researchers have largely overlooked the effects of CSR communication on internal stakeholders. This study seeks to propose that, by enhancing employee awareness of the organization’s CSR activities (aimed at society, the government, customers, and employees), organizational communication can increase affective commitment. Data were collected at a Dutch healthcare insurance company, using a web-based questionnaire (n=301). The proposed model was tested with structural equation modelling (SEM) using Amos. The bootstrapping results showed a positive association between information flow and affective commitment, with a mediating effect for CSR aimed at employees and customers. CSR projects aimed at the government and society at large did not mediate the relationship between information flow and affective commitment. The impact of CSR towards employees and customers can be explained by social exchange theory. When employees feel that their organization values their well-being and that of their customers, they reciprocate what they receive from the organisation by committing themselves to the organisation. As such, this study provides an important argument for the implementation of CSR activities: it increases the emotional attachment of employees towards their organisation. Keywords: Corporate social responsibility, Affective commitment, Information flow, Organizational communication, Affective psychology, Social responsibility, Corporate communications. Shah, Vrushali Bhushan and Bhola, Sarang Shankar (2013) The study aims at finding perception of sample investors about insurance as an investment avenue. Study is based on primary data collected from 1289 sample investors from urban as well as rural area from Satara; collected with the help of stratified sampling on the basis of Socio-economic Classes. It was revealed that there is ample awareness as well as preference towards insurance as investment. Life and Health Insurance is an important objective for investment. Regression Analysis unveils the existence of demographic factors and objectives for investment in choice of insurance as investment. Since the calculated value of R square does not explain enough variance, there is a scope to state that there exist other factors which may be psychographic or behavioural which influence decision making about insurance as Investment Avenue. Keywords: Life Insurance, Demographics, Regression Analysis, Socio-economic Classes.
5. RESEARCH METHODOLOGY The methodology of the study is descriptive research. It depends mainly on the primary data. The survey was conducted through questionnaire. The questionnaire was checked for reliability and validity. The questionnaire comprises both optional type and statement of likert’s scale. The responses of these sections are ob-tained from the investors in the 5-point scale, which ranges as follows.5- Strongly agree 4- agree, 3 –neutral 2-Disagree 1- strongly disagree and 3-point scale with 3 – High 2-Moderate and 1-low. The researcher used simple random sampling for conducting the survey. The sample size of the study undertaken by the researcher was 150 insurance investors. A primary survey of households was undertaken in four districts, covering both rural and urban areas, in Chennai, Vellore, Dharmapurai and Salem. Other areas were left out due to operational difficulties. TOOLS USED FOR ANALYSIS The primary data collected from the insurance investors are analysed by using the following statistical tools. Factor analysis, discriminate analysis, correlation, ANOVA, chi-square test, and weighted average.
6. LIMITATIONS OF THE STUDY The research of the study has some limitations. 1. The study was based on a sample survey of only 150 respondents. Hence the results obtained cannot be generalized for the total universe. 2. Shortage of time was another limiting factor for conducting the survey in the other geographical area. 3. False response or biased answers given by the respondents may affect the quality of the results obtained. 4. Lack of interest disposed by a few respondents leading to unauthentic response.

VOLUME NO. 6 (2016), ISSUE NO. 09 (SEPTEMBER) ISSN 2231-1009
INTERNATIONAL JOURNAL OF RESEARCH IN COMPUTER APPLICATION & MANAGEMENT A Monthly Double-Blind Peer Reviewed (Refereed/Juried) Open Access International e-Journal - Included in the International Serial Directories
http://ijrcm.org.in/
22
7. DATA ANALYSIS AND INTERPRETATION TABLE 1: DEMOGRAPHIC PROFILE
Gender No of respondents Percentage
Male 80 53
Female 70 47
Total 150 100
Marital status
Married 100 67
Unmarried 50 33
Total 150 100
Age Group (in Years)
Less than 25 20 13
25-30 25 17
31-35 30 20
36-40 35 23
Above 40 40 27
Total 150 100
Education qualification
School level 25 17
Under graduation 35 23
Post graduation 55 37
Others 35 23
Total 150 100
Occupation
Business 10 7
Salaried 50 33
Professional 25 17
Retired 20 13
Home maker 25 17
Agriculture farmers and others 20 13
Total 150 100
Household income (Rs. pm)
Less than 10,000 15 10
10,000-20,000 35 23
20,001-30,000 40 27
30,001-40,000 35 23
Above 40,000 25 17
Total 150 100
Family size
2 45 30
3 70 47
Above 3 35 23
Total 150 100
Area of living
Rural 55 37
Urban 95 63
Total 150 100
From the above analysis about investors perception towards health insurance and the result of frequency distribution analysis are presented below. It is observed that 53% of the respondents are male and 47% are female. The high proportion of the respondents taken for the study was married (67%). With respect to the age group of respondents most of the respondents belong to the age group over 40 years. From the study with respect to occupation, the most of the investors belong to salaried class and whose qualifications were post graduates. In the study high percentage of the insured household’s monthly income was observed to be between Rs. 20,001 to 30,000. Nevertheless, in both insured and uninsured households, a higher proportion of the respondents were in the urban category, with family size of 3 members.
TABLE 2: OPINION TOWARDS INSURANCE INVESTMENT DECISIONS
Attributes No of respondents Percentage
Radio 10 7
TV 25 17
Newspaper and magazine 15 10
Internet 28 19
Relatives and friends 32 21
Banners & hoardings 20 13
Agent 14 9
others 6 04
Total 150 100
From the study, it is inferred that friends, relatives & neighbors are the primary source of information for the households followed by Internet. Other major sources of information are television, banners & hoardings, news paper and magazines, agents, radio and others.

VOLUME NO. 6 (2016), ISSUE NO. 09 (SEPTEMBER) ISSN 2231-1009
INTERNATIONAL JOURNAL OF RESEARCH IN COMPUTER APPLICATION & MANAGEMENT A Monthly Double-Blind Peer Reviewed (Refereed/Juried) Open Access International e-Journal - Included in the International Serial Directories
http://ijrcm.org.in/
23
TABLE 3: TYPES OF INSURANCE TAKEN
Opinion No of respondents Percentage
No Insurance 25 17
Life Insurance 15 10
General insurance 10 7
Health insurance 50 33
Motor Insurance 20 13
Accident Insurance 23 15
Others 7 05
Total 150 100
From the analysis it is found that 33% of the insured respondents with health insurance followed by 17% were not insured and 15% of the respondents with accident and motor insurance, life insurance, general insurance and others.
TABLE 4: PERCEPTION TOWARDS THE CONCEPT OF INSURANCE
Opinion High Moderate Low
Prevent certain events 55 60 35
Prevent damage to assets from certain events 40 60 50
Compensate for losses 50 65 35
Rebuild the asset lost due to certain events 35 40 75
Capital appreciation 65 55 30
Compensate for loss of life 65 50 35
Others 45 45 60
Applying weighted average method
Ranks First Second Third
Weights 3 2 1
Weighted average rank
Factors Rank
Total Average Rank 1 2 3
Prevent certain events 165 120 35 320 53.3 III
Prevent damage to assets from certain events 120 120 50 290 48.3 V
Compensate for losses 150 130 35 315 52.5 IV
Rebuild the asset lost due to certain events 105 80 75 260 43.3 VII
Capital appreciation 195 110 30 335 55.8 I
Compensate for loss of life 195 100 35 330 55.0 II
Others 135 90 60 285 47.5 VI
From the analysis about the perception towards the benefits of an insurance policy as ranked high, moderate and low, It is found that a high proportion of insured think that investment in insurance can get capital appreciation, insurance can compensate for loss of life, insurance can prevent certain unforeseen events and compensate losses, insurance can prevent damage to assets from them, the other factors were rebuilt the asset loss due to certain events respectively.
TABLE 5: PURPOSE BEHIND INVESTMENT IN INSURANCE
Opinion No of respondents Percentage
Savings tool 35 23
Protection tool 75 50
Both 25 17
None 15 10
Total 150 100
From the study it is found that the majority of the investors opinion towards the purpose behind the insurance considered as a protection tool 50%, followed by 23 % of insurer as savings tool. Other purpose behind investment in insurance is both savings as well as protection tool and 10% opine that the purpose is none.
TABLE 6: PERCEPTION TOWARDS THE BENEFITS OF HEALTH INSURANCE
Purpose High Moderate Low
Protection against critical illness 68 46 36
Protection against all illness 55 60 35
Only OPD 50 40 60
Only hospitalization 60 55 45
Cash less facility 75 45 30
Tax benefits 55 65 30
Other benefits 45 65 40
Applying weighted average method
Ranks First Second Third
Weights 3 2 1
Weighted average method
Factors Rank
Total Average Rank 1 2 3
Protection against critical illness 204 92 36 332 55.33 III
Protection against all illness 165 120 35 320 53.33 V
Only OPD 150 80 60 290 48.33 VII
Only hospitalization 180 110 45 335 55.83 II
Cash less facility 225 90 30 345 57.50 I
Tax benefits 165 130 30 325 54.16 IV
Other benefits 135 130 40 305 50.83 VI

VOLUME NO. 6 (2016), ISSUE NO. 09 (SEPTEMBER) ISSN 2231-1009
INTERNATIONAL JOURNAL OF RESEARCH IN COMPUTER APPLICATION & MANAGEMENT A Monthly Double-Blind Peer Reviewed (Refereed/Juried) Open Access International e-Journal - Included in the International Serial Directories
http://ijrcm.org.in/
24
From the analysis about the perception towards the benefits of health insurance, this has been ranked viz., high, moderate and low, it if found that a high ratio of insured think that health insurance can provide cash less facility in the event of hospitalization, health insurance will bear the cost of only hospitalization, protection against critical illness, Tax benefits, protection against all illness and other benefit such as OPD respectively.
TABLE 7: BASIC PURPOSE BEHIND INSURANCE
Purpose No of respondents Percentage
For savings 15 10
Tax benefits 25 17
For covering risk of life 20 13
For security to my family 30 20
Usefulness in emergency 35 24
All the above 20 13
None of the above 5 03
Total 150 100
From the study, it is found that most of investors’ purposes behind insurance is useful in case of emergency (24%) followed by security to the family (20%). Other purpose is to gain tax benefit at 17%, for life cover and all other benefits including savings. Only meager at 3% opine that none of the above.
TABLE 8: AWARENESS OF INSURANCE POLICY
Purpose No of respondents Percentage
Security Purpose 10 7
Bulk return in future 25 17
Daughter’s marriage 20 13
Children’s Education 25 17
Good Return on Savings 20 13
Risk Cover and 35 23
Others 15 10
Total 150 100
From the analysis about the awareness level of insurance policy, it is found that a high percentage (23%) of the insured think that insurance can prevent certain unforeseen events (risk) and to get good returns in future and children education (17%). 13% of the insured think that to get good returns on savings and daughters marriage (13%) and only 7% opine that insurance is just for security purpose.
TABLE 9: FACTORS INFLUENCING THE INSURANCE DECISIONS
Factors No of respondents Percentage
Voluntary 20 13
Advice of friends / Neighbor / Relatives 35 23
Advice of agents 25 17
Through Employer 25 17
Advertisement 10 7
Recruitment of the financier and 20 13
Other Sources 15 10
Total 150 100
From the study, it is inferred that friends, relatives & neighbors are the primary source of information for the households followed by investment advisors and through employers. Other major influencing factors were 13% of the insurer on their own decisions and recruitment of financiers. Only 7% of the respondents are influenced by advertisement.
TABLE 10: RESPONDENTS’ OPINION ABOUT INVESTMENT ADVISORS TRUSTWORTHINESS USING WEIGHTED AVERAGE METHOD
Attributes No of respondents Weights Weighted average
Strongly agree 50 5 250
Agree 35 4 140
Neutral 30 3 90
Disagree 20 2 40
Strongly disagree 15 1 15
Total 150 535
Weighted moving average = 535/150 = 3.565 = 4 (approx.) Form the above table it is inferred that the respondents agree in their opinion regarding the trustworthiness of the investment advisors.

VOLUME NO. 6 (2016), ISSUE NO. 09 (SEPTEMBER) ISSN 2231-1009
INTERNATIONAL JOURNAL OF RESEARCH IN COMPUTER APPLICATION & MANAGEMENT A Monthly Double-Blind Peer Reviewed (Refereed/Juried) Open Access International e-Journal - Included in the International Serial Directories
http://ijrcm.org.in/
25
TABLE 11: COMPARATIVE ANALYSIS OF THE INVESTORS KNOWLEDGE ABOUT INSURANCE AND THEIR DWELLING REGION CROSS TABULATION
Awareness
Region Total Rural Urban
Security Purpose Count 4 6 10
Expected Count 4.9 5.1 10.0
Bulk return in future Count 15 10 25
Expected Count 12.3 12.7 25.0
Daughter’s marriage Count 12 8 20
Expected Count 9.9 10.1 20.0
Children’s Education Count 10 15 25
Expected Count 12.3 12.7 25.0
Good Return on Savings Count 7 13 20
Expected Count 9.9 10.1 20.0
Risk Cover Count 20 15 35
Expected Count 17.3 17.7 35.0
Others Count 6 9 15
Expected Count 7.4 7.6 15.0
Total Count 74 76 150
Expected Count 74.0 76.0 150.0
Note: Chi-square value: 6.28; df: 6 ; Level of sig. 5%; Table value: 12.59
From the above analysis, it is found that the chi-square value 6.28, p-value 0.00 are statistically insignificant at 5% level, this indicates that there is no association between the level of awareness towards investment in insurance with different region. Thus it can be seen that the dwelling region does not hamper the process of investment decision. Therefore, dwelling region of the investors (rural or urban) is immaterial of the investors’ knowledge. ANOVA Ho = There is no significant relationship between the investment objectives and the investors level of satisfaction. H1 = There is a significant relationship between the investment objectives and the investors level of satisfaction.
TABLE 12: COMPARATIVE ANALYSIS OF INSURERS’ OPINION TOWARDS INVESTMENT OBJECTIVES AND THEIR LEVEL OF SATISFACTION
Descriptive Statistics
Frequency N Mean Std. Deviation Std. Error Lower Bound Upper Bound Min. Max.
Safety 150 58.33 18.696 1.527 55.32 61.35 25 75
Security 150 51.33 8.082 .660 50.03 52.64 40 60
Liquidity 150 63.00 17.551 1.433 60.17 65.83 15 75
Marketability 150 66.33 23.528 1.921 62.54 70.13 15 85
Tax benefits 150 54.00 12.040 .983 52.06 55.94 30 60
Returns 150 58.33 18.696 1.527 55.32 61.35 25 75
Others factors 150 53.00 11.914 .973 51.08 54.92 35 65
Total 1050 57.76 17.246 .532 56.72 58.81 15 85
ANOVA
Frequency Sum of Squares df Mean Square F Sig.
Between Groups 26957.143 6 4492.857 16.440 .000
Within Groups 285033.333 1043 273.282
Total 311990.476 1049
From the above table, it is seen that the insurers opinion towards investment objectives (F=16.44) differ significantly with respect to the level of satisfaction. It is inferred that there is a relation between the investment objective and their level of satisfaction towards investment in insurance.
8. SUMMARY OF FINDINGS From the analysis about investors awareness about health insurance and the result of frequency distribution, it is found that majority of (53%) of the respondents are male and married (67%) whose monthly household income is between Rs. 20,001-30,000. With respect to the age group of respondents most of the respond-ents belong to the age group over 40 years and they were qualified with post graduates. A higher proportion of the respondents belong to the urban category; whose family size is 3. From the study, it is found that friends, relatives & neighbors are the primary source of information for the households followed by Internet. From the analysis about the perception towards the concept of insurance policy has been ranked high, moderate and low. It if found that a high proportion of insured think that investment in insurance can get capital appreciation and insurance can compensate for loss of life. From the study it is found that the majority of the insurer’s opinion towards the purpose behind the insurance considered as a protection tool 50%, followed by 23 % of insurer as savings tool. From the analysis about the perception towards the benefits of health insurance, this has been ranked viz., high, moderate and low, it is found that a high propor-tion of insured think that health insurance can provide cash less facility in the event of hospitalization, health insurance will bear the cost of only hospitalization, protection against critical illness, Tax benefits, protection against all illness and other benefit such as OPD respectively. From the study it is found that most of investors’ purposes behind insurance is useful in case of emergency (24%) followed by security to the family (20%). Other purpose is to gain tax benefit at 17%, for life cover. From the analysis about the awareness level of insurance policy, it if found that a high percentage (23%) of the insured think that insurance can prevent certain unforeseen events (risk) and to get good returns in future. Friends, relatives & neighbors are the primary source of information for the households followed by investment advisors and through employers. From the above analysis, it is found that the chi-square value 6.28, p-value 0.00 are statistically insignificant at 5% level, this indicates that there is no association between the level of awareness towards investment in insurance with different region. Thus it can be seen that the dwelling region does not hamper the process of investment decision. Therefore, dwelling region of the investors (rural or urban) is immaterial of the investors’ knowledge. From the above table, it is found that the insurers opinion towards investment objectives (F=16.44) differ significantly with respect to the level of satisfaction. It is inferred that there is a relation between the investment objective and their level of satisfaction towards investment in insurance.

VOLUME NO. 6 (2016), ISSUE NO. 09 (SEPTEMBER) ISSN 2231-1009
INTERNATIONAL JOURNAL OF RESEARCH IN COMPUTER APPLICATION & MANAGEMENT A Monthly Double-Blind Peer Reviewed (Refereed/Juried) Open Access International e-Journal - Included in the International Serial Directories
http://ijrcm.org.in/
26
9. SUGGESTIONS The findings of the survey show that 37 per cent of the insured households feel that they perceive benefits of insurance as ‘risk coverage’. Nearly one-third of the households indicated that they are willing to go in for insurance if it is customized to their needs. However, during any crisis, households are forced to take stock of their ability to handle longer-term social protection. The study has noted that improving health insurance awareness requires both structuring and enhancing the penetration of an appropriate awareness creation campaign with a regional and spatial focus. This suggests that public policy should address health insurance awareness needs of the people who need insurance the most, namely those who do not have other social security covers.
10. CONCLUSION The study focused on awareness parameters such as life insurance, health insurance and general insurance, as well as the socio-economic characteristics of insured and uninsured households as defined in this study. The study also examined insurance awareness with regard to rights and duties and the grievance and dispute resolution mechanism. An analysis based on socio-economic parameters enables an understanding of the categories of people which are insured and aware of insurance. If not insured, the impact of financial loss can be disastrous for the economically poor people. Thus, the government needs to create appropriate awareness and take necessary steps to protect the poor households. Also, poor people cannot access improved health and educational facilities and this makes them more vulnerable.
REFERENCES 1. Banne, Ashok S and Bhola, Sarang Shankar, Awareness of Life Insurance among Sample Customers (August 16, 2014). Indian Streams Research Journal, Vol.
4, Issue 7, Aug 2014. 2. Bedi, Harpreet Singh and Singh, Preeti, an Empirical Analysis of Life Insurance Industry in India (November 1, 2011). International Journal of Multidisciplinary
Research, Vol. 1, No. 7, pp. 62 3. Claartje L. Joost W.M. Verhoeven, (2013) "“Sharing is caring”: Corporate social responsibility awareness explaining the relationship of information flow with
affective commitment", Corporate Communications: An International Journal, Vol. 18 Iss: 2, pp.264 – 279. 4. Gweneth Norris, John Innes, (2002) "Managers’ views on ABC in an insurance company: A grounded theory case study ", Journal of Applied Accounting
Research, Vol. 6 Iss: 3, pp.57 – 89. 5. Mohamed, Issam A.W. and Osman, Kamal M., the Impacts of Health Insurance System on Poverty Alleviation in Sudan: Case Study of the National Fund for
Health Insurance in Khartoum State (2003-2009) (April 15, 2011). Health Economics Journal.Vol. 3, No. 52, 2011. 6. Ravi, Shamika and Bergkvist, Sofi, Are Publicly Financed Health Insurance Schemes Working in India? (July 11, 2013). 7. Shah, Vrushali Bhushan and Bhola, Sarang Shankar, Impact of Demographics’ on Choice of Insurance as Investment (October 18, 2013) SSRN. 8. Vellakkal, Sukumar, Adverse Selection and Private Health Insurance Coverage in India - A Rational Behaviour Model of Insurance Agents under Asymmetric
Information (May 1, 2012). Indian Council for Research on International Economic Relations Working Paper No. 233. 9. Zuriah Abdul Rahman, NorzaidiMohdDaud, (2010) "Adverse selection and its consequences on medical and health insurance and takaful in Malaysia", Hu-
manomics, Vol. 26 Iss: 4, pp.264 – 283.

VOLUME NO. 6 (2016), ISSUE NO. 09 (SEPTEMBER) ISSN 2231-1009
INTERNATIONAL JOURNAL OF RESEARCH IN COMPUTER APPLICATION & MANAGEMENT A Monthly Double-Blind Peer Reviewed (Refereed/Juried) Open Access International e-Journal - Included in the International Serial Directories
http://ijrcm.org.in/
27
WEATHER INDEX BASED CROP INSURANCE ASSESSMENT: TECHNOLOGICAL ADVANTAGES IN INDIA
G. KOTRESHWAR PROFESSOR
DEPARTMENT OF STUDIES IN COMMERCE UNIVERSITY OF MYSORE
MYSURU
V.GURUSIDDARAJU RESEARCH SCHOLAR
DEPARTMENT OF STUDIES IN COMMERCE UNIVERSITY OF MYSORE
MYSURU
ABSTRACT The assessment of Weather Index Based Crop Insurance Programme depends upon its technological support availability in that area. They are three major techno-logical supports which play an indispensable role in assessment of Weather Index Based Crop Insurance; they are Weather Station Technology, Remote Sensing Technology, and Information and Communication Technologies (ICTs). This article shows the arrangement of technologies in the form of Data Flow Diagram and it also supports the induction of crop insurance for the vegetable growers and its technological advantages with the help of data provided by Mahalanobis National Crop Forecast Centre, ISRO Centres (SAC & NRSC), India Meteorological Department State Remote Sensing Centers, State Agriculture Departments, National Agri-cultural Drought Assessment & Monitoring System (NADAMS).
KEYWORDS
weather index based crop insurance, technology.
I. INTRODUCTION n 2007, the Weather Based Crop Insurance Scheme (WBCIS) was introduced to provide protection to farmers against adverse weather events including rainfall deficits by basing insurance payouts not on damage, but on a given weather index. The insurance is linked to credit and farmers are requested to 2 obtain credit. Weather index data are generally taken from commercial weather stations approved by the insurance issuers. Feasible trigger and payout rates
were developed using weather index models to make the insurance products sustainable and attractive to farmers. Private weather index insurance is also available in India through two main insurance providers: ICICI Lombard and Indian Farmers Fertiliser Cooperative (IFFCO) Tokio General Insurance Company (ITGI). Their products have been distributed through multiple channels including rural corporative banks, input suppliers, and contract farming companies. BASIX, a micro-insuranceprovider, also started selling insurance products in 2008 with 40–50% subsidy, after the government announced that it will start to offer private insurance companies the same subsidies as public companies in certain regions. As the basis of risk, the actual amount of insurance compensation, and the farmers’ actual loss are largely influenced by the location of weather stations, WBCIS index insurance product is constrained by limited location of weather stations. The lack of weather data and real-time data transfer were also reported to be significant challenges to the accuracy and efficiency of the settling amount. In order to acquire accurate data and minimize basis risk, it is estimated that India would need an additional 10,000 weather stations, which is a significant financial commitment (IFAD 2010) (ShwetaSinha.et al.2015).
II. LITERATURE REVIEW Technical limitations: The index insurance product of WBCIS is limited by the location of weather stations. The Agricultural Finance Corporation, in its report on the effectiveness of WBCIS (AFC 2011) found that 77% of farmers were not satisfied with the location of weather stations. This is reasonable as the basis risk, the difference between the actual amount of insurance compensation and the farmers’ actual loss, is largely influenced by the location of weather stations. The lack of weather data and real-time data transfer were also reported to be significant challenges to the accuracy and efficiency of the settling amount. In many regions, the provision of daily data was not guaranteed and this made it difficult to design a more accurate model of crop growth and to decide a proper threshold level for payouts. In order to acquire accurate data and minimize basis risk, it is estimated that India would need an additional 10,000 weather stations, which is a significant financial commitment (IFAD 2010). To address this issue, better product design suited to the climate characteristics and nature of crops in the area needs to be implemented (Rao 2014). The early experience with weather index insurance in China, India and Thailand provides some good insights into its effectiveness and sustainability as a climate risk management tool. While weather insurance programmes have demonstrated the potential to help farmers protect their investments against recurrent droughts, there are several prerequisites to the success of these programmes: Raise the awareness of farmers: In all of the cases studied, low awareness of farmers about the potential benefits of weather index based insurance products and their relatively low premiums was an obstacle. Proper marketing and awareness raising campaigns should accompany the introduction of index-based insurance programmes. Invest in technological innovations: Accurate and timely weather data hold the key to successful index insurance products. The densification of hydrometeoro-logical networks in drought-prone areas, the development of crop-specific disaster loss databases, satellite-based products, and vegetation indexes are examples some of the technological innovations needed to operationalize weather insurance. (Shamika Sirimanne, Sanjay Srivastava. 2015).
I
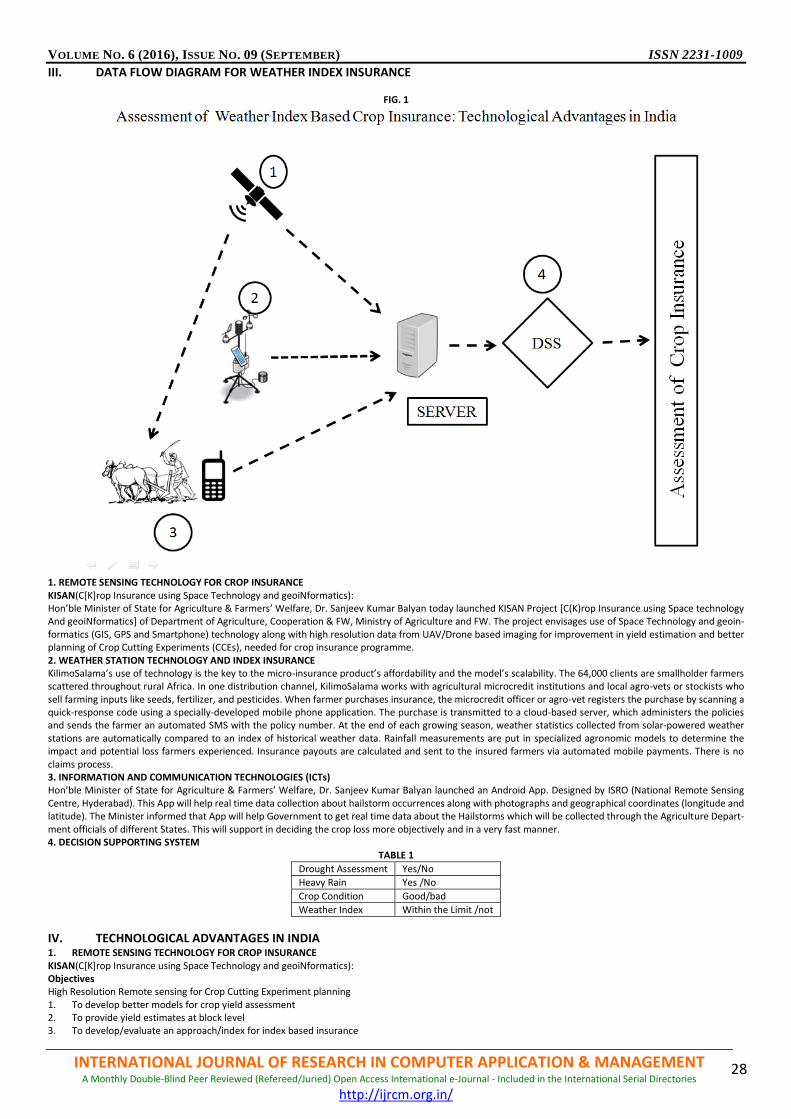
VOLUME NO. 6 (2016), ISSUE NO. 09 (SEPTEMBER) ISSN 2231-1009
INTERNATIONAL JOURNAL OF RESEARCH IN COMPUTER APPLICATION & MANAGEMENT A Monthly Double-Blind Peer Reviewed (Refereed/Juried) Open Access International e-Journal - Included in the International Serial Directories
http://ijrcm.org.in/
28
III. DATA FLOW DIAGRAM FOR WEATHER INDEX INSURANCE
FIG. 1
1. REMOTE SENSING TECHNOLOGY FOR CROP INSURANCE KISAN(C[K]rop Insurance using Space Technology and geoiNformatics): Hon’ble Minister of State for Agriculture & Farmers’ Welfare, Dr. Sanjeev Kumar Balyan today launched KISAN Project [C(K)rop Insurance using Space technology And geoiNformatics] of Department of Agriculture, Cooperation & FW, Ministry of Agriculture and FW. The project envisages use of Space Technology and geoin-formatics (GIS, GPS and Smartphone) technology along with high resolution data from UAV/Drone based imaging for improvement in yield estimation and better planning of Crop Cutting Experiments (CCEs), needed for crop insurance programme. 2. WEATHER STATION TECHNOLOGY AND INDEX INSURANCE KilimoSalama’s use of technology is the key to the micro-insurance product’s affordability and the model’s scalability. The 64,000 clients are smallholder farmers scattered throughout rural Africa. In one distribution channel, KilimoSalama works with agricultural microcredit institutions and local agro-vets or stockists who sell farming inputs like seeds, fertilizer, and pesticides. When farmer purchases insurance, the microcredit officer or agro-vet registers the purchase by scanning a quick-response code using a specially-developed mobile phone application. The purchase is transmitted to a cloud-based server, which administers the policies and sends the farmer an automated SMS with the policy number. At the end of each growing season, weather statistics collected from solar-powered weather stations are automatically compared to an index of historical weather data. Rainfall measurements are put in specialized agronomic models to determine the impact and potential loss farmers experienced. Insurance payouts are calculated and sent to the insured farmers via automated mobile payments. There is no claims process. 3. INFORMATION AND COMMUNICATION TECHNOLOGIES (ICTs) Hon’ble Minister of State for Agriculture & Farmers’ Welfare, Dr. Sanjeev Kumar Balyan launched an Android App. Designed by ISRO (National Remote Sensing Centre, Hyderabad). This App will help real time data collection about hailstorm occurrences along with photographs and geographical coordinates (longitude and latitude). The Minister informed that App will help Government to get real time data about the Hailstorms which will be collected through the Agriculture Depart-ment officials of different States. This will support in deciding the crop loss more objectively and in a very fast manner. 4. DECISION SUPPORTING SYSTEM
TABLE 1
Drought Assessment Yes/No
Heavy Rain Yes /No
Crop Condition Good/bad
Weather Index Within the Limit /not
IV. TECHNOLOGICAL ADVANTAGES IN INDIA 1. REMOTE SENSING TECHNOLOGY FOR CROP INSURANCE KISAN(C[K]rop Insurance using Space Technology and geoiNformatics): Objectives High Resolution Remote sensing for Crop Cutting Experiment planning 1. To develop better models for crop yield assessment 2. To provide yield estimates at block level 3. To develop/evaluate an approach/index for index based insurance

VOLUME NO. 6 (2016), ISSUE NO. 09 (SEPTEMBER) ISSN 2231-1009
INTERNATIONAL JOURNAL OF RESEARCH IN COMPUTER APPLICATION & MANAGEMENT A Monthly Double-Blind Peer Reviewed (Refereed/Juried) Open Access International e-Journal - Included in the International Serial Directories
http://ijrcm.org.in/
29
FIG. 2
NATIONAL AGRICULTURAL DROUGHT ASSESSMENT & MONITORING SYSTEM (NADAMS) NADAMS project, developed by National Remote Sensing Centre, provides near real-time information on prevalence, severity level and persistence of agricultural drought at state/ district/sub-district level. Currently, it covers 13 states of India (Andhra Pradesh, Bihar, Chattisgarh, Gujarat, Haryana, Jharkhand, Karnataka, Madhya Pradesh, Maharashtra, Odisha, Raja-sthan, Tamil Nadu, and Uttar Pradesh), which are predominantly agriculture based and prone to drought situation. In four states (Andhra Pradesh, Karnataka, Haryana and Maharashtra), the assessment is carried out at sub-district level. The remote sensing data of NOAA AVHRR (for district level), MODIS and Resourcesat-2 Advanced Wide Field Sensor, AWiFS (for sub-district level) along with IMD rainfall data was used for drought assessment. Various spectral indices, such as Normalized Difference Vegetation Index (NDVI), Normalized Difference Water Index (NDWI) & Shortwave Angle Slope Index (SASI) were computed and integrated with Soil Mosture Index and District Level Rainfall to assess the drought condition. Agricultural conditions are monitored at state/district level using daily NOAA AVHRR/ MODIS data. AWiFS of Resourcesat 1/2 (56 m resolution) is used for detailed assessment of agricultural drought at district and sub district level Fortnightly/monthly report of drought condition is provided to the Government under NADAMS. NCFC has started providing Drought Assessment Report from the Kharif season of 2012. Five Monthly drought reports (June to October) have been generated and sent to all the concerned state and national level government agencies. Operational Drought assessment during Kharif using Remote Sensing (Methodology developed by ISRO) Periodic District/Sub-District level drought assessment for 14 Agriculturally Dominant states of India (5 at Sub District level) Satellite based indices, Rainfall data, Ground information on sowing progression and Irrigation Statistics are used for drought assessment Drought Warning (Normal, Watch & Alert) is given in June July & August, while Drought Declaration (Mild, Moderate & Severe) in September & October DROUGHT ASSESSMENT: INPUTS
FIG. 3

VOLUME NO. 6 (2016), ISSUE NO. 09 (SEPTEMBER) ISSN 2231-1009
INTERNATIONAL JOURNAL OF RESEARCH IN COMPUTER APPLICATION & MANAGEMENT A Monthly Double-Blind Peer Reviewed (Refereed/Juried) Open Access International e-Journal - Included in the International Serial Directories
http://ijrcm.org.in/
30
MAHALANOBIS NATIONAL CROP FORECAST CENTRE RECOMMENDATIONS IMPROVING SAMPLING STRATEGY Need to reduce the sample size and simultaneously improve the accuracy by incorporating other data such as agricultural census data. (Action – NSSO/IASRI) NSSO jointly with IASRI would organize a one-day training Programme for crop cutting experiments WEATHER BASED INDICES • There is a need to develop a composite Weather index which can be representative, stable and easily available. There is scope of including Remote Sensing based indices in developing the composite index (Action – IMD) REMOTE SENSING TECHNOLOGY FOR CCE & CROP YIELD It has been shown that remote sensing data is very useful for assessing crop condition and generating sampling plan to improve CCE. It is planned that Crop cutting Experiments need to be carried out for Rice crop in the Kharif Season and Wheat crop in Rabi Season (2014-15) in the selected states (selected districts) using remote sensing based sampling. State governments and Insurance companies will carry out the CCE using GPS (Action: SAC, MNCFC, Insurance Companies & State Govts.) NRSC would generate the Android based Application for CCE and would provide support of Bhuvan platform for field data collection. Spatial yield model need to be developed by using weather, CCE and remote sensing data (Action: SAC, IMD & MNCFC) The pilot studies would be reviewed after crop seasons of 2014-15 and then the study can be extended to more major crops and states. General • All expenditure related to these pilot studies would be borne by the Credit Division of DAC. MOBILE SERVICES AND WEATHER FORECASTS [DANIELE TRICARICO, NICOLE DARABIAN. (2016)]. • The need of smallholder farmers in the developing world for accurate weather forecasts is made greater by the dependency on rain-fed agriculture, and by
the global impact of climate change. • To date, smallholder farmers largely rely on national meteorological agencies with low capacity for the provision of weather services that are distributed
over radio, TV and mobile. • MNOs can play a key role not only in disseminating weather forecasts but also in improving weather services by catalysing new content and technology
providers. • As a dynamic service component, weather forecasting presents an opportunity to drive stickiness of the overall mobile agriculture (mAgri) proposition,
provided that services are of high quality and locally relevant. • To exploit the potential of weather services, MNOs need to release their unique strategic assets, primarily the network intelligence to geo locate users, which
in the absence of smartphones equipped with Global Positioning System (GPS) allows the provision of localised services. • Besides information services, the digitisation of weather index insurance presents an opportunity for MNOs to use core capabilities (geo location and mobile
money) to enable agricultural mobile financial services (Agri MFS), starting from insurance and extending to tailored credit and savings products. • MNOs also have the ability to use their network for weather monitoring, either by rolling out weather stations or by analysing signal propagation from cell
sites, but to release this opportunity they need to establish new partnerships at ecosystem level. • By increasing their focus on weather services, MNOs can evolve the value proposition of their rural services towards more holistic bundles including dynamic
agronomic advice linked to localised weather forecasts, climate smart agronomic advice, and mobile money enabled Agri MFS. • A user centric approach in service design can help all mAgri providers to develop better weather services for smallholders. User centric design is also beneficial
to mobile financial services such as mobile weather index insurance.
TABLE 2
V. INDUCTION OF CROP INSURANCE FOR VEGETABLE GROWERS CHAMAN (Coordinated Horticulture Assessment and MAnagement using geoiNformatics): Considering the importance of Horticulture for the national economy and nutrient security, the Department of Agriculture & Cooperation, Ministry of Agriculture has launched a national level programme on horticulture assessment and development, called CHAMAN (Coordinated Horticulture Assessment and Management using geo-informatics). CHAMAN was launched during September, 2014. This programme envisages use of satellite remote sensing data for area and production estimation of 7 horticultural crops (Potato, Onion, Tomato, Chili, Mango, Banana and Citrus) in selected districts of major producing States. The programme also uses GIS (Geographical Information System) tools along with remote sensing data for generating action plans for horticultural development (site suitability, infrastructure development, crop intensification, orchard rejuvenation, aqua-horticulture, etc.). Another component of CHAMAN is to carry out research activities on horticultural crop condition studies, diseases assessment and preci-sion farming. Two National Level Agencies have been identified for implementing this programme i.e. Mahalanobis National Crop Forecast Centre (MNCFC) of Department of Agriculture & Cooperation for the remote sensing component and the Indian Agricultural Statistical Research Institute (IASRI) for the field survey component. The programme is jointly implemented through Space Applications Centre, Ahmedabad; National Remote Sensing Centre, Hyderabad; State Horticulture Departments; State Remote Sensing Centres, National Horticulture Research & Development Foundation, Nasik; India Meteorological Department and ICAR Centres. The three-year duration project has a total outlay of Rs.1338.4 lakh. HORTICULTURE ASSESSMENT • Area assessment and production estimation of major horticultural crops • Geospatial Applications for Horticultural Development • R&D Studies: Precision Farming, Signature Study Yield Modeling. Area and Production (7 Crops, 12 states, 180 Districts) • Fruits: Banana, Mango and 2itrus • Vegetables: Potato, Onion and Tomato • Spices: Chili

VOLUME NO. 6 (2016), ISSUE NO. 09 (SEPTEMBER) ISSN 2231-1009
INTERNATIONAL JOURNAL OF RESEARCH IN COMPUTER APPLICATION & MANAGEMENT A Monthly Double-Blind Peer Reviewed (Refereed/Juried) Open Access International e-Journal - Included in the International Serial Directories
http://ijrcm.org.in/
31
Horticultural Development Studies i) Site Suitability ii) Post-Harvest Infrastructure iii) Crop Intensification iv) GIS database creation v) Orchard Rejuvenation vi) Aqua-horticulture
FIG. 4
VI. CONCLUSION Help from Progress in Technology. Progress in technology and communications will significantly influence the development of the weather market. The quality of satellite imagery has made so much progress that, as mentioned above, some agricultural insurance deals already make use of vegetative indexes as insurance triggers. Weather station technology combined with better telecommunications allows continuous transmission of weather data through mobile phone technology at a reasonable price. Soil humidity measurements, an important factor in plant growth, can be taken at low cost and again be transmitted to the trader’s screen. Minuscule temperature gages can be placed in farmers’ fields and can transmit data at regular intervals. All these examples show that the weather market industry greatly benefits from specific progress in various hi tech applications. However, it must be also noted that the progressive improvement of weather forecasting ability could lead to potential sources of asymmetric information.
REFERENCES 1. Daniele Tricarico, Nicole Darabian. (2016). mAgri Weather forecasting and monitoring: Mobile solutions for climate resilience 2. J. Welte, A. Ault, C. Bowman, A. Layton, S. Noel, J. Krogmeier, D. Buckmaster. (2013). “Autogenic Mobile Computing Technologies in Agriculture: Applications
and Sensor Networking for Smart Phones and Tablets”. EFITA-WCCA-CIGR Conference “Sustainable Agriculture through ICT Innovation”, Turin, Italy, 24-27 June 2013
3. Shamika Sirimanne, Sanjay Srivastava, Sung Eun Kim, Ho Miu David Li, Axel Firer, and Shweta Sinha. (2015). Building Resilience to Droughts: Scaling up Weather Insurance in China, India, and ThailandUnited Nation Economic and Social Commission for Asia and the Pacific (ESCAP)
4. Shibendu S. Ray. (2016). Remote Sensing for Agricultural Applications, Mahalanobis National Crop Forecast Centre, Department of Agriculture, Cooperation & Farmers Welfare, New Delhi
5. [email protected] REPORTS 6. Crop Insurance Options for Vegetable Growers, United States Department of Agriculture 7. Kilimo Salama (Safe Farming) Weather Index Insurance in Kenya: Early Market Success 8. Risk Management Agency 9. Soham Sen (World bank) and Vikas Choudhary (World bank). ICT Applications for Agricultural Risk Management WEBSITES 10. www.ncfc.gov.in. 11. www3.rma.usda.gov/apps/agents/

VOLUME NO. 6 (2016), ISSUE NO. 09 (SEPTEMBER) ISSN 2231-1009
INTERNATIONAL JOURNAL OF RESEARCH IN COMPUTER APPLICATION & MANAGEMENT A Monthly Double-Blind Peer Reviewed (Refereed/Juried) Open Access International e-Journal - Included in the International Serial Directories
http://ijrcm.org.in/
32
CRM IN RETAILING
DR. NARINDER TANWAR ASSOCIATE PROFESSOR
FACULTY OF COMMERCE & BUSINESS STUDIES MANAV RACHNA INTERNATIONAL UNIVERSITY
FARIDABAD
ABSTRACT Customer Relationship Management (CRM) is the need of hour for the business world in today’s competitive scenario. Customer relationships management strat-egies allow an organization to put the customer right at the center of the organization and then framing each and every strategy around the customer portfolio. The article covers different aspects of customer relationship management (CRM) related to organized retail sector, which include understanding the concept of CRM, its process and various benefits which an organization derives by using customer relationship management strategies. Retail industry in India is going through a paradigm shift in its structure, composition and practices and along with the emergence of organized retailing in the recent past has strongly influenced the lifestyle of every consumer. Increased competition and demands of customers are posing serious challenges for retaining customers. Whether it a traditional grocery store from unorganized sector or a chain of retail stores from organized sector, each one of them is searching out for innovative ways to attract and retain. Managing effective relationships with customer is the key to achieve sustainable competitive advantage in today’s business environment. This will subsequently increase company's profitability regardless of economic condition. Operational Excellence is the most effective CRM Strategies that led to customer loyalty in retail industry. Whereby, product leadership less used by the retailer in CRM strategies. The retail sector in many ways such as by using various CRM strategies as a guideline to conduct business to achieve organizational goals and at the end of the day, creating customer loyalty, results in mutual benefits of both organization as well as the customer. According to Court (2004) in an article in the McKinsey Quarterly: “Twenty years ago, big companies used one advertising spot on three television networks to reach 80% of the US population; now they need up to 20 messaging and media programmes to the same reach”.
KEYWORDS customer relationship management, retailing, relationship strategies, customer orientation, customer satisfaction.
CUSTOMER RELATIONSHIP MANAGEMENT (CRM) RM, if you work in sales, marketing, or customer service, you’ve probably heard the term before – but what does CRM mean, and what can it do for your business? Before we begin to examine the conceptual foundations of CRM, defining what CRM is would be useful. In the marketing literature the terms customer relationship management and relationship marketing are used interchangeably. As Nevin (1995) points out, these terms have been used to reflect
a variety of themes and perspectives. Some of these themes offer a narrow functional marketing perspective while others offer a perspective that is broad and somewhat paradigmatic in approach and orientation. A narrow perspective of customer relationship management is database marketing emphasizing the promo-tional aspects of marketing linked to database efforts (Bickert, 1992). Customer relationship management (CRM) is a term that refers to practices, strategies and technologies that companies use to manage and analyze customer interactions and data throughout the customer lifecycle, with the goal of improving business relationships with customers, assisting in customer retention and driving sales growth. CRM systems are designed to compile information on customers across different channels or points of contact between the customer and the company -- which could include the company's website, telephone, live chat, direct mail, marketing materials and social media. CRM systems can also give customer-facing staff detailed information on customers' personal information, purchase history, buying preferences and concerns. According to Sheth and Sisodia (1995), the purpose of relationship marketing is to enhance marketing productivity by achieving efficiency and effectiveness. Customer relationship management (CRM) defines the way businesses interact with current and future customers. Traditionally, this has been done with software that automates and integrates your customer-facing activities: sales, marketing, and customer service. But today, best-in-class CRM software systems go beyond that core functionality – providing additional tools for customer analytics, personalization, e-commerce, social media, collaboration, and more. Customer relation-ship management (CRM) is an approach to managing a company's interaction with current and future customers. The customer relationship management approach tries to analyse data about customers' history with a company, in order to better improve business relationships with customers, specifically focusing on retaining customers, in order to drive sales growth. One important aspect of the customer relationship management approach is the systems of CRM that compile information from a range of different communica-tion channels, including a company's website, telephone, email, live chat, marketing materials, social media, and more. Through the CRM approach and the systems used to facilitate CRM, businesses learn more about their target audiences and how to best cater to their needs. However, the adoption of the CRM approach may also occasionally lead to favoritism within an audience of consumers, leading to dissatisfaction among customers and defeating the purpose of CRM. The situation was summed up well by Pine, Peppers, and Rogers (1995) in the Harvard Business Review article titled “Do You Want to Keep Your Customers Forever?” wherein they argued that: “Customers, whether consumers or businesses, do not want more choices. They want exactly what they want – when, where, and how they want it – and technology now makes it possible for companies to give it to them.”
RETAIL INDUSTRY IN INDIA Retail innovation has been unprecedented in the last decade of the twentieth century. Lee and Vryza argued that retailing had not only “….been a highly innovative force in the Market place” (1994) but also had a much wider impact on society overall. However, they expressed concerned about the dearth of literature on retailing innovation, in contrast to areas where a richer body of work had developed. Merrilees and Miller (1996) reviewed the dramatic transformation retailing in Australia from1946 onwards. They discussed innovative retail formats and what they termed “the ever-changing nature of retail competition” (1996). Retail innovation will be manifested in a variety of forms. Such formats range from minor changes in the retail mix, through minor and major makeovers, related and unrelated brand extensions, novel combinations such as supermarkets and in-store banking, and new service delivery systems such as online retailing. An important paper by Rosenberger III Merrilees and Miller (1999) proposes a new typology for retail innovations, with seven types classified. These include brand extensions within an allied field (McCafe by McDonalds) and brand extensions in an unrelated field. Retailing is the largest private industry in the world, with total sales of $ 6.6 trillion World over the retail sector is not only the oldest but also one of the most advanced users of the technology. Retailing is also India's largest industry accounting for over 10% of the country's GDP and round 8% of the employment (CII-Mckinsey report). The retail sector in India is witnessing the major transformation in its size, growth, structure, and format. It is the largest industry as this sector accounts for over 14% of country’s GDP and above 8% of its employment. In year 2006, the retail industry was estimated to be nearly Rs 10,800 billion. According to a report, this is likely to reach about Rs 17800 billion by 2010 indicating the growth rate of about 32% to 40%. The share of modern organized retailing in the region currently constitutes only a miniscule proportion of the total retail industry. In India the share of organized retail accounts for only about 3-4% of total retail. However, due to a verity of favorable factors, organized retailing is expected to grow significantly in coming years. Several factors contribute to the growth of modern organized retail. In general, economic development and growth of retailing are highly correlated. In addition, demographic profiles of the country such as proportion of young people in the population, rising income level and its influence on aspirations and life style of people, increasing number of working women
C

VOLUME NO. 6 (2016), ISSUE NO. 09 (SEPTEMBER) ISSN 2231-1009
INTERNATIONAL JOURNAL OF RESEARCH IN COMPUTER APPLICATION & MANAGEMENT A Monthly Double-Blind Peer Reviewed (Refereed/Juried) Open Access International e-Journal - Included in the International Serial Directories
http://ijrcm.org.in/
33
and double-income families, and the changing value orientation of population from austerity to conspicuous consumption are some of the important factors that fuel the growth of organized retailing. Modern retailers are using sophisticated and technologically enhanced clues to attract and hold the shoppers. A retail store experience involves activities such as browsing, price comparisons, search for merchandise, evaluating product variety and quality, and interaction with store personnel (Terblanche and Boshoff, 2001). Mulky and Nargundkar (2003) report that the Indian retail sector is largely traditional, but stores in modern format are emerging. Large Indian players like Reliance, K Rahejas, Bharti, and ITC are making significant investment in this sector, leading to the emergence of big retailer who can bargain with suppliers to reap the benefits of economies of scale. As compared to traditional stores, new format stores are pre-engineered retail outlets, characterized by well designed layout, ambience, display, self service, value added services, technology based operations and many more dimensions with modern outlook and practices. They seem to attract and influence young minds by satisfying both hedonic and utilitarian needs (Jain and Bagdare, 2009). Due to its increased applicability in service sector, CRM has gathered a lot of attention from scholars, researchers and practitioners with the result that a lot of research work has been done on the CRM and its applicability in service industry. Behavioural dimensions have found to play a critical role in determining the effectiveness of the CRM programmes (Jain and Jain, 2005). The purpose of the present research is to explore the dimensions of CRM effectiveness in Indian Retail Sector. The emergence of Retail in India is cause for success of Indian organized retail sector. With the help of modern management techniques we will become the specialist Retailers in future. We know that the relationship between the Retailer & customer is very close than other chains of distribution. India is a nation of shopkeepers. We can see more than 16 million plus retail outlets in India, and India has highest density of retail outlets in the world. Retail Industry in India is at present estimated to be more than US $ 250 billion. On that part of organized retailing is estimated 3.5% i.e. $ 7.47 billion. By the year 2015 the industry is expected to achieve a business of US $ 23 billion in organized retail. The share of organized trade in retailing in India was quite more than 4% in 2005 but in China it was between 7-8% in 1996 and 17% in 2003. At present USA is biggest retail market with 85% share of organized trade in retailing and then after there is Malaysia with 55% plus, Thailand with 40%plus, Brazil with 35%plus, Russia with 33%plus, Indonesia with 30%plus, Poland with 20%plus, China with 17% plus & India with 6% plus only.
REVIEW OF LITERATURE In the present day’s retail business, ensuring customer satisfaction in delivering the right product and service to the end-users is the major concern for the future growth of the organization. In the present study an attempt is made to find out the customer satisfaction during purchase in retail outlets based on customer survey. (Das Prasun, 2009). Literature on customer satisfaction is voluminous and spans several areas such as marketing, management and accounting. For exam-ple, numerous papers use the ACSI (American Customer Satisfaction Index) to study customer satisfaction at the company, industry and macroeconomic levels. This paper focuses only on customer satisfaction studies that are related to retailing and does not survey the literature that studies the design of satisfaction survey instruments, as there is no control over survey design. Iacobucci et al. (1994, 1995) provide precise definitions of service quality versus customer satisfac-tion. They contend that service quality should not be confused with customer satisfaction, but that satisfaction is a positive outcome of providing good service. Ittner and Larcker (1998) provide empirical evidence at the customer, business-unit and firm- level that various measures of financial performance (including revenue, revenue change, margin, return on sales, market value of equity and current earnings) are positively associated with customer satisfaction. However, in the retail industry they find a negative relationship between satisfaction and profitability which may be because benefits from increased satisfaction can be ex-ceeded by the incremental cost in retail. Sulek et al. (1995) find that customer satisfaction positively affects sales per labor hour at a chain of 46 retail stores. Anderson et al. (2004) find a positive association between customer satisfaction at the company level and Tobin’s q (a long-run measure of financial performance) for department stores and supermarkets. Babakus et al. (2004) link customer satisfaction to product and service quality within retail stores and find that product quality has a six significant impact on store-level profits. Research on customer satisfaction usually views employees as facilitators of the sales process who are critical to improving the conversion ratio, by providing information to the customers on prices, brands, and product features and by helping customers to navigate store aisles, finding the product and even cross-selling other products. The unique feature of the retail store execution problem is that it combines the factory and the sales components, but this stream of literature focuses only on the latter. As stated by Mendoza et al. (2006) the CRM concept has evolved in such a way that nowadays it must be viewed as a strategy to maintain a long-term relationship with the customers. Michael et al.(2005) suggested that companies have to move in accordance to the customer behavior if they want to thrive in coming world. They have to come along with new customer loyalty programmes and build more comprehensively among partners and vendors, enabled by technology, to bring mutually beneficial relationships. According to Peppers and Rogers (1999) In some organizations, CRM is simply a technology solution that extends separate databases and sales force automation tools to link sales and marketing functions in order to improve targeting. Other organizations consider CRM as a tool specifically designed for one-to-one customer communications, only responsibility of sales/ser-vice, call centers, or marketing departments. Ramanakumar, KPV (2008) writes about the Customer Relationship Management or Relationship Marketing. He refers to all marketing activities directed towards establishing, developing and maintaining relational exchanges successfully. According to V. Ramanathan (2008), Customer Relationship Management is an emerg-ing tool that enables retail marketers to maintain their presence in the dynamic market environment. In early days CRM was the tool preferred by the manufac-turers in order to motivate and retain retailers. Now retailers are applying this very same tool in order to retain customers. Both KPV Ramanakumar and V. Ramanathan bring certain CRM strategies into lime light being followed in the retail sector. They mention certain CRM strategies like personalization strategies, communication strategies like "Stay in Touch", "Inform Customers About the New Arrival", "Reward Strategies like offer tangible reward, discounts offers etc. Pahuja, Anurag opines that customer relationship management encompasses certain characteristics aspects. He says that business necessity regardless of whether one sells to end - consumer or to enterprise customers. According to Pradeep K Deb (2009), customer loyalty programs are the in - thing in today's retail world and Foodlands in Mumbai is one of the pioneers in this field in western India. He further gives the reaction of a typical consumer that "privilege cards or special offers are nothing but retail trade gimmicks and the consumer ends up spending more by availing themselves of the offer". According to Sreekumar P (2009), for implementing any CRM initiative or special loyalty offers, Lifetime Customer Value is the most important criteria.
OBJECTIVE OF THE STUDY The purpose of carrying out this research was to identify the key factors which should be focused on by the organized retail stores for establishing better relation-ships with customers.
RESEARCH METHODOLOGY The research design of the study is exploratory cum descriptive. The research is exploratory due to the fact that the field of organized retail has not been deeply touched by the earlier researcher. Therefore, in this case, extensive preliminary work needs to be done to gain familiarity with the phenomena in the situation to understand what is occurring, before developing a model and setting up a rigorous design for comprehensive investigation. The study is descriptive because the area of research that has been chosen by the researcher explains the attributes, which are associated with implication of customer relationship management strategies in the field of organized retail. To fulfill the objective of the study a questionnaire was prepared for customers visiting retail outlets. The questionnaire was put forwarded to respondents/customers (N = 100) visiting different organized retail outlets (Big Bazar, Reliance Mart, SRS Value Bazar). In the questionnaire respondents were asked to indicate their opinions on a five-point likert scale and the results are presented in the form of Table. The research has been carried out in NCR region. Further, to solve the purpose of the study both descriptive as well as inferential statistical techniques were applied. In the descriptive, Means and Standard Deviation were calculated and to test the significance level of the difference between Means of the criterion variables Karl Pearson’s Coefficient of Correlation (r) were applied.

VOLUME NO. 6 (2016), ISSUE NO. 09 (SEPTEMBER) ISSN 2231-1009
INTERNATIONAL JOURNAL OF RESEARCH IN COMPUTER APPLICATION & MANAGEMENT A Monthly Double-Blind Peer Reviewed (Refereed/Juried) Open Access International e-Journal - Included in the International Serial Directories
http://ijrcm.org.in/
34
RESULTS OF SURVEY From the literature review and discussion with experts in the field, various antecedents & determinants of customer relationship management in organized retail have been identified and a questionnaire was prepared. The questionnaires were put forwarded to respondents visiting retail outlets and observations are pre-sented in Table 1.1.
TABLE 1.1: KEY FACTORS OF CRM IN RETAILING (Number of Respondents = 100)
S. No. Variables Mean Scores Standard Deviation
1 Product range 3.71 1.078
2 Price range of products 3.98 1.148
3 Layout of products 3.67 1.218
4 Accessibility/location of retail store 3.80 1.047
5 Quality of personnel service 3.76 1.101
6 Quality of self service availability 3.33 1.344
7 Billing facility 3.48 1.240
8 Equipments/bags to carry products 3.32 1.305
9 Mode of payment 3.24 1.312
10 Time consumption at entrance/exist points 3.55 1.329
11 Parking facility 3.63 1.141
12 Point/product schemes on additional purchase 3.85 1.156
13 Interior of retail store 3.61 1.216
Source: Computed on the basis of Field Data It has been observed that out of different practices used by the retail outlets to establish better relationship with the customers and among all price range of products has the top value (Mean = 3.98, Std. Dev. = 1.148), and then point/product schemes on additional purchase (Mean =3.85, Std. Dev. = 1.156), accessibil-ity/location of retail store (Mean = 3.80, Std. Dev. = 1.047), quality of personnel service (Mean = 3.76, Std. Dev. = 1.101), product range (Mean = 3.71, Std. Dev. = 1.078), layout of products (Mean = 3.67, Std. Dev. = 1.218), parking facility (Mean = 3.63, Std. Dev. = 1.141), interior of retail store (Mean = 3.61, Std. Dev. = 1.216), time consumption at entrance/exit points (Mean = 3.55, Std. Dev. = 1.329), billing facility (Mean = 3.48, Std. Dev. = 1.240), quality of self service availability (Mean = 3.33, Std. Dev. = 1.344), equipments/bags to carry products (Mean = 3.32, Std. Dev. = 1.305), and mode of payment (Mean = 3.24, Std. Dev. = 1.312). Standard deviation value of some of the CRM strategies used by retail outlets such as product range (1.078), accessibility/location of retail store (1.047), quality of personnel service in retail store (1.101) indicate that there is consistency in the opinions of respondents, where as in case of quality of self service availability (1.344), time consumption at entrance/exit points (1.329), mode of payment (1.312), there is divergence of opinion among the respondents. Customers (N=100) were asked to indicate their opinion about various CRM strategies used by organized retail outlets to attract and retain them. From responses it has come out that about 68% customers feel that retails store are having a wide range of products offer to them. As competition is growing in marketplace so it is important that a variety of products should have been offered to customers. Around, 73% of the customers are in agreement that retail stores keep a wide range of products with wide range of prices as customers want that product/s should be made available in different varieties and prices. Nearly, 76% customers stated that retail outlets are approachable and it is also visible that due to increased competition in marketplace especially in organized retail focus has been given to make the location convenient for customers. About 4/5th customers agreed that in retail outlets the staff is well trained and they answer the queries raised by customers very well. About, 59% students stated that product layout is well arranged and thus resulting in a satisfied self-service experience. 63% customers have praised the billing system in retail outlets as we all know that technology has become an integral part of every sector today so is the retail sector. Most of the respondents have agreed on the growing importance of technology. Around, 60% customers have revealed that they are provided equipment/bags to carry products. As revealed by respondent’s retail outlets generally provide trolley to carry products and make it a better buying experience for customers. Nearly, 62% of the respondents are in agreement that there is a proper arrangement made by retail outlets on entrance and exit points and thus resulting in less time consumption at these points. Retail outlets know that generally it frustrates customers if it takes long time on entrance or exit. Therefore, sufficient number of staff members is deployed at these points. It has been observed in survey that 75% respondents have stated about some schemes offered in retail outlets on a particular amount of shopping. Even the retail stores know that offering schemes to customers is one of the better ways to attract and retain them. About, 65% customers have stated that retail stores focus on interior. When a customer enters in a retail store he/she interacts with the interior first. So, retail stores focus on this aspect to make a better shopping experience for customers. From the result of survey, it is evident that in most of the cases response of customers is positive and this is due to the reason that organized retail outlets are well aware of the fact usage of such CRM strategies will help in maintaining better relationships with customers and developing a better brand image in the marketplace. In the study, at attempt has also been made to gain insight into major CRM strategies used by retail outlets to have connected approach with customers. To identify a relationship among the means values of CRM factor and average of key CRM factors coefficient of correlation has been calculated and results are presented in Table 1.2
TABLE 1.2: RELATIONSHIP BETWEEN KEY FACTORS OF CRM AND AVERAGE OF KEY CRM FACTORS (Number of Respondents = 100)
S. No. Variables Mean Scores Standard Deviation r value
1 Product range 3.71 1.078 0.939**
2 Price range of products 3.98 1.148 0.981**
3 Layout of products 3.67 1.218 0.949**
4 Quality of personnel service 3.76 1.101 0.971**
5 Interior of retail store 3.61 1.216 0.947**
6 Point/product schemes on additional purchase 3.85 1.156 0.966**
Notes: r-value indicates value of Karl Pearson’s Coefficient of Correlation. ** indicates Correlation is significant at 1% level.
Source: Computed on the basis of Field Data Higher value of ‘r’ (Towards +1.000) indicates that such variables are more focused by the retail outlets while less value of ‘r’ (Towards 0.0) indicates that such variables are less focused for establishing better relationships with customers. The test results indicate that there is significant and positive correlations in relation to various CRM strategies used by stores such as price range of products (r = 0.981), focus more on providing point/product schemes to customers on additional purchase (r = 0.966), quality of personnel service (r = 0.971), vast variety of products in the store (r = 0.939), layout of products (r = 0.949), and interior of retail store (r = 0.947).
CONCLUSION The building & management relationship with customers has always been a key approach to marketing practices in general & retailing in particular. AMA (1995), “Relationship marketing is marketing with the conscious aims to develop & manage long term and/or trusting relationship with customers, distributors, suppliers, or other parties in marketing environment.” A band of loyalty is likely to develop between shopkeeper and the regular customer. Pathmarajah (1993) defines

VOLUME NO. 6 (2016), ISSUE NO. 09 (SEPTEMBER) ISSN 2231-1009
INTERNATIONAL JOURNAL OF RESEARCH IN COMPUTER APPLICATION & MANAGEMENT A Monthly Double-Blind Peer Reviewed (Refereed/Juried) Open Access International e-Journal - Included in the International Serial Directories
http://ijrcm.org.in/
35
relationship marketing as “the process where the seller and the buyer join a strong personal, professional and mutually profitable relationship over a time. Ac-cording to a research by Reichheld and Sasser in Harvard Business Review, 5% increase in customer retention can increase profitability by 35% in banking business, 50% in insurance and brokerage, and 125% in the customer credit card market. Therefore, banks are now stressing on retaining customers and increasing market share. Retailers have identified generating interest in a uniformed new customer is more difficult than to retain the existing customer. It is easier to satisfy an existing customer than to attract a new customer to the store. A satisfied customer is better form of advertising. A satisfied customer will purchase more and more product from your store. Therefore, adopting customer relationship management practices will surely help retail outlets to retain customers. Furthermore, it is highly important to understand that customer relationship management does not enable a quick win. It is a long-term approach that has to be adopted at a strategic level.
REFERENCES 1. Ang, Lawrence, and Ben Taylor, ‘Managing Customer Profitability Using Portfolio Matrices,’ Journal of Database Marketing & Customer Relationship Man-
agement, 12(4): 2005, pp. 298-304. 2. Benjamin Appiah - Kubi & Andrews, K. D., ‘Towards a successful customer relationship management: A conceptual framework,’ African Journal of Marketing
Management, Vol. 2(3), 2010, pp 037-043 3. Cao, Yong and Thomas S. Gruca, ‘Reducting Adverse Selection through Customer Relationship Management,’ Journal of Marketing, 69(4): 2005, pp. 219-229. 4. Chen, I., and Popovich, K., ‘Understanding Customer Relationship Management (CRM): People, Process, and Technology,’ Business Process Management
Journal, 9 (5), 2003, pp. 672–688. 5. Ciborra, C., and Failla, A., ‘Infrastructure as Process: The Case of CRM,’ IBM, Oxford University Press, 2000. 6. Court, David C., ‘A New Model of Marketing,’ McKinsey Quarterly, 4: 2004, pp. 4-6. 7. Diyan Kishore, ‘Lure of Huge Consumer Base,’ The Hindu, 2007, pp 285-289. 8. Gibsn G., ‘Modern Retailing Comprehensive Policy Vital,’ The Hindu, 2007, pp 281-284. 9. Greenleaf, Eric and S. Russell Winer, ‘Putting the Customer Back into Customer Relationship Management (CRM),’ Advances in Consumer Research, 29(1):
2002, pp. 357-360. 10. Keith A. R, & Eli Jones, ‘Customer relationship management: Finding value drivers,’ Industrial Marketing Management, vol. 37, 2008. pp 120–130. 11. Michael Levy, Baston, Aweitz and Ajay Pandit, ‘Retail Management,’ 6thEdition, Tata McGraw Hill, 2007. 12. Pine, B. Joseph, II, Don Peppers, and Martha Rogers, ‘Do You Want to Keep Your Customers Forever’? Harvard Business Review, 73(2): 1995, pp. 103-114. 13. Rey, B., ‘The Paradigm of CRM,’ Marketing Mastermind, 2007, pp. 54-56. 14. Seth J. N. and R. S. Sisodia (1995), ‘Improving Marketing Productivity in’ in J. Heilbrunn (Ed.) Encyclopedia of Marketing for the Year 2000, Chicago: American
Marketing Association/NTC. 15. Shainesh, G., Sheth, N. Jagdish, ‘CRM – A Strategic Perspective,’ Macmillan India Ltd., 2007. 16. Shapiro, B., K. Rangan, R. Moriaty and E. Ross, ‘Manage Customers for Profits (not just sales),’ Harvard Business Review, 65(9): 1987, pp. 101-108. 17. Sumner, M., ‘Critical Success Factors in Enterprise Wide Information Management Systems,’ Proceedings of the Americas Conference on Information Sys-
tems, Milwaukee, WI, 1999, pp. 232-234. 18. Zeithaml, V., R. Rust, and K. Lemon, ‘The Customer Pyramid: Creating and Serving Profitable Customers,’ California Management Review, 43(4): 2001, pp.
118-142.

VOLUME NO. 6 (2016), ISSUE NO. 09 (SEPTEMBER) ISSN 2231-1009
INTERNATIONAL JOURNAL OF RESEARCH IN COMPUTER APPLICATION & MANAGEMENT A Monthly Double-Blind Peer Reviewed (Refereed/Juried) Open Access International e-Journal - Included in the International Serial Directories
http://ijrcm.org.in/
36
LIBRARY AUTOMATION: AN OVERVIEW
P. SEKAR RESEARCH SCHOLAR
BHARATHIYAR UNIVERSITY COIMBATORE
DR. K.C. ABDUL MAJEED ASSOCIATE PROFESSOR
DLISC, FAROOK COLLEGE CALICUT
ABSTRACT
A well-equipped and well maintained library is indeed, the foundation stone of our modern educational system. Library automation in the 21st century is an inter-connecting system. It enables information users to share information resources through network. This article briefly explains the concept of library automation, objective, need, areas, planning, advantage & disadvantages of library automation, etc.
KEYWORDS library automation, information communication technology, areas of automation, software for library automation
INTRODUCTION he library plays a critical role in our society it is an important component of any educational institution, which is hub of the teaching, and learning activities where students, researchers and teachers can explore the vast resources of information. In the age of information communication technology, computers are being used for day-to-day housekeeping activity of the library which saves the time of the end users, and library professional also and at the same time
avoid duplication of work and make the library service smooth and effective. In the age of ICT library scenario has been drastically changed in terms of collection, organization and services. Simultaneously, user’s demands and attitudes have changed in its kinds. Also the information seeking behavior of user has dynamically changed. They want relevant, authentic information very quickly within a single place at their hand. This concept has posed challenges for library professionals for quick delivery of library services and information. This development in library field has brought the idea of Library Automation.
AUTOMATION Automation is the use of machines, control systems and information technologies to optimize productivity in the production of goods and delivery of services. Automation greatly decreases the need for human sensory and mental requirements while increasing load capacity, speed, and repeatability. CONCEPT AND MEANING OF LIBRARY AUTOMATION The word “automation” has been derived from Greek word “automose” means something, which has power of spontaneous motion or self-movement. The term “automation” was first introduced by D.S. Harder in 1936, who was then with General Motor Company in the U.S. He used the term automation to mean automatic handling of parts between progressive production processes According to Encyclopedia of Library and Information Science, “automation is the technology concerned with the design and development of process and system that minimize the necessity of human intervention in operation” (Kent,1977). According to McGraw Hill Encyclopedia of Science and Technology automation as “a coined word having no precise generally accepted technical meaning but widely used to imply the concept, development, or use of highly automatic machinery or control systems” (McGraw, 1982). Webster’s Third New International Dictionary of English Language Automation is defined as “automatically controlled operation of an apparatus, process or system by mechanical or electronic device that takes place of human organs of observation, effort and decision”. (Gove, 1966) Library automation may be defined as the application of automatic and semiautomatic data processing machines (computers) to perform traditional library house-keeping activities such as acquisition, circulation, cataloguing and reference and serials control. Today “Library Automation” is by far the most commonly used terms to describe the mechanization of library activities using the computer. (Uddin, 2009). Encyclopedia of Library and Information Sciences “Library Automation is the use of automatic and semiautomatic data processing machines to perform such traditional library activities as acquisitions, cataloguing, and circulation. These activities are not necessarily performed in traditional ways, the activities themselves are those traditionally associated with libraries; library automation may thus be distinguished from related fields such as information retrieval fields such as information retrieval, automatic indexing and abstracting and automatic textual analysis” (Kent, 1977).
WHAT IS LIBRARY AUTOMATION? Traditional library work consisting of acquisitions, technical processing, serials control, circulation and reference services all entail time consuming manual work. Though these activities are essential to proper functioning of a library they consume professional staff time that might otherwise go towards user services and library development. Library computerization is now gaining importance necessitating the establishment of profession wide standards. Comprehensive studies of library computer systems world over include discussions of machine-managed acquisitions, cataloguing, serials control, circulation and bibliographic service mod-ules. The literature in this area highlights major aspects of computer’s role in the library environment. Similar to several aspects of library management, the demand for more and faster information services and the decline in library resources are compelling.
NEED AND OBJECTIVES OF LIBRARY AUTOMATION Information explosion has resulted in the production of a large amount of literatures in every field of knowledge. Accordingly, the print documents are coming to the library in huge numbers which is not possible for a library to manage the collection manually. Now days no user has time to search the required and relevant information from the dense heap of information collection. They have no time to go shelve by shelve to pick up a book. So it necessitated for library automation. In most of libraries are yet to be automated. The various factors that necessitated changing a manually operated library system an automated library system are as follows.
Recording keeping activities of library can be done effectively in automated environment.
Issue, return and renewal of books can be performed quickly and searching of documents through Online Public
Access Catalogue (OPAC) which is a powerful tool of library automation.
It will be cost effectiveness
Maintain bibliographical records of all the materials, in a computerized form.
T

VOLUME NO. 6 (2016), ISSUE NO. 09 (SEPTEMBER) ISSN 2231-1009
INTERNATIONAL JOURNAL OF RESEARCH IN COMPUTER APPLICATION & MANAGEMENT A Monthly Double-Blind Peer Reviewed (Refereed/Juried) Open Access International e-Journal - Included in the International Serial Directories
http://ijrcm.org.in/
37
Provide bibliographical details through a single enumerative access point of holdings of a library.
Reduce the repetition in the technical processes of housekeeping operations.
Provide access to information at a faster rate.
Share the resources through library networking and implement new IT processes to provide high quality information.
AREAS OF LIBRARY AUTOMATION As a first step in a planning process, it is desirable to formulate a model for computerization listing all itemized and prioritized information systems being main-tained on a manual basis by the library. For this exercise it is necessary to break down these procedures into their constituent parts. When further subdividing these activities, each item is to be considered of its functional elements. The systems and subsystems listed below are only indicative and may vary with differing library system environments. These are acquisitions, selection, ordering, claiming/cancellation, receiving/invoice processing, extended procurements, Gift tracking, Fund Control, maintains information about all library related funds, ability to group funds (nesting), track fund allocations and adjustments, Fund encumbrance, Fund expenditure, Cash Balance, Free Balance, Automatic updating of fiscal information through recording of specific transactions, Track year-to date expenditures and Create Purchase Orders. TECHNICAL SERVICES Books, Serials, Special Collections, Cataloguing, Circulation, charge/Renewal, Discharge, Loan Periods, Processing schedules, Holds, Messages, Blocks, Notices, Transaction Recording Devices for offline processing, Member control and Inventory Control. SERIALS CONTROL Receipt (check-in), Claiming, Bindery control, replacements, monographic serials, invoice processing REFERENCE SERVICES Desk services, User tools, Bibliographic utilization, Reprography, Interlibrary communications, General Administration, Grants Administration, Library Publications, Bindery, Periodical Citation Searching, OPAC and Bibliographic Database. PLANNING FOR LIBRARY AUTOMATION
Needs mapping
Best possible package
Staff involvement
Budget (Purchase, Operation, maintenance etc.)
Hardware requirement (Client /Server, Printer etc.)
Platform (Operating system)
User awareness
Maintenance LIBRARY SOFTWARE’S USED FOR AUTOMATION
Database services. SOUL (Software for University Library)
Developed by INFLIBNET
Window based user-friendly software
Well-designed screens; logically arranged functions with existence help messages
Based on client server architecture
Multi user access
Provides facility to create view records in regional language (multilingual)
Nominal price (includes installation
onsite training, one-year support, free future updates multilingual software) LIBSYS
Most widely used in INDIA
Fully integrated
Multi user
System design to run on Super, Micro,
Minicomputer under UNIX/LAN
platforms SANJAY
Developed by DESIDOC
Is an Augmented version of CDS/ISIS
It is menu driven and works in windows
environment with LAN support MAITRAYEE LIBMAN ADVANTAGE OF LIBRARY AUTOMATION
Speed Information processing is done much faster which ensures better work flow through the library.
Accuracy The degree of precision and accuracy in processing information is high. However, it is dependent on the accuracy of information led into the system.
Cost effectiveness Operating costs can be reduced if the system is well designed and well managed.
Reduction in library workloads Library workloads can be reduced as the computer can do vast amount of work and processing.
Improved services to users High rate and better quality in performance is possible through the use of computers.
Avoids/eliminates duplication of work.
Easier access to external databases
Providing on-line access and search of information possible DISADVANTAGES OF LIBRARY AUTOMATION
Initial and recurring expenses
Hardware and Software Obsolescence
Lack of Staff
Financial Expenses
Security Problems
Maintenance of Automation software is totally depending on Computer administrator
Continuous staff training is required for it It is totally depend on Electricity
Costly maintenance

VOLUME NO. 6 (2016), ISSUE NO. 09 (SEPTEMBER) ISSN 2231-1009
INTERNATIONAL JOURNAL OF RESEARCH IN COMPUTER APPLICATION & MANAGEMENT A Monthly Double-Blind Peer Reviewed (Refereed/Juried) Open Access International e-Journal - Included in the International Serial Directories
http://ijrcm.org.in/
38
CONCLUSION Library automation is the process which needs proper planning, timely implementation and periodical evaluation. The librarian with the administrators has to set the priorities after analyzing the current status and future requirements. Selection of the suitable integrated library management package according to the needs of the users and the library is important. Retrospective conversion, OPAC, circulation and serials control, etc. should be conducted with care. Staff training and user education are keys to the success of the process. Library automation invites realistic approach. Librarian should acquire adequate knowledge about the hardware and software options available. All libraries should use standard software packages for automation and database creation to facilitate the exchange of bibliographic records between libraries. Databases may preferably be created in the MARC21 format because most libraries at the international level follow this. There is need for continuous monitoring of automation activities for improvement of the situation and for meeting the future needs. Academic achievement of a student is closely related to his/her ability to find, evaluate and use the required information according to the curriculum needs.
REFERENCES 1. Dhande, S. (2013). Library automation: Historical overview its need and service. National conference on Redesigning libraries and information centers in
digital era. (339pp). Degloor: Degloor college 2. Galhotra M. (2008), “Information Technology in library and information services”. Ess Ess Pub. New Delhi. 3. Nidhi (2012). Automation and Networking of Library. National Conference on KNOWLEDGE ORGANIZATION IN ACADEMIC LIBRARIES (KOAL-2012) (pp. 18).
New Delhi: Library Professional Association. 4. Shabana T. & Saleem A. (2012). Automation & Computerization of Academic Library. National Conference on KNOWLEDGE ORGANIZATION IN ACADEMIC
LIBRARIES (KOAL-2012) (pp.169- 172). New Delhi: Library Professional Association.

VOLUME NO. 6 (2016), ISSUE NO. 09 (SEPTEMBER) ISSN 2231-1009
INTERNATIONAL JOURNAL OF RESEARCH IN COMPUTER APPLICATION & MANAGEMENT A Monthly Double-Blind Peer Reviewed (Refereed/Juried) Open Access International e-Journal - Included in the International Serial Directories
http://ijrcm.org.in/
39
IMPACT OF STRESS ON MENTAL HEALTH OF SCHOOL TEACHERS IN RANCHI: A SOCIO - PSYCHOLOGICAL STUDY
BINDA KUMARI HOD & ASST. PROFESSOR
DEPARTMENT OF PSYCHOLOGY KARTIK ORAON COLLEGE
RATU
ABSTRACT The present study suggests that Teachers’ have so many works and problems in their life. Teaching can be one of the most stressful careers. Teachers' mental health plays an important role in the teaching-learning process. Teachers are divided into three groups: level of Occupational Stress, Moderate level, and More level of Occupational Stress. In the educational institution a teacher's role is crucial. The quality, competence, character, and effectiveness of teachers are undoubtedly the most significant factors influencing the quality of education. Hence, it is important for teachers' professional development to create satisfactory work conditions for enhanced effectiveness. Normally, the stress does not come from the students that you are teaching, but the before school and after school meetings and overwhelming paperwork we gate so many problems. Now a present day teachers’ have so many works. Some time they can’t solve their problems so they feel so stress in their life.
KEYWORDS gender, qualification, marital status, stress, mental health, school teachers.
INTRODUCTION eachers' mental health plays an important role in the teaching-learning process. If the teachers are of unsound mind, they can harm nation in terms of poor teaching and guidance to the students. They cannot do justice to their job. Their maladjustment will not adversely affect their personality but will produce maladjustment tendency in children.
Teaching can be one of the most stressful careers. Normally, the stress does not come from the students that you are teaching, but the before school and after school meetings and overwhelming paperwork. As teachers, we have so many responsibilities and so little time to accomplish them. When we can't complete our daily tasks and responsibilities, this can often translate into failure, stress and teacher burnout. Let's take a moment to understand stress that you as the teacher may be experiencing. When you look at this picture above, do you instantly think, "That is horrible. Those kids should be sitting flat on their bottoms. That is so disrespectful." PAUSE...Don't Get All Stressed Out!!! Take what would normally be a stressful situation and turn it into something positive and fun! This does not mean, however, to be lazy and have no discipline. Let's go over the feelings associated with stress, thoughts that go along with stress, and behaviors that you may be experiencing if you are stressed. There are 9 ways to reduce teacher stress. 1. If You Are Stressed You May Show Behaviors Crying Grinding Your Teeth Increase of a Normal Habit or Addiction Losing Your Appetite or Overeating Increased Heart Rate, Breathing or Sweating Trouble Sleeping Headaches Neck and Lower Back Pain 2. Yours’ Feelings Associated with Stress Scared Frustrated Moody Anxious Angry 3. Thoughts If You Are Stressed Low Self-Esteem Fear of Failure Worrying about the Future Forgetfulness Complaining About Work Can't Concentrate 4. Teacher Stress Ways to Reduce
Exercise Regularly.
Be Positive, Speak Positive, Think Positive
Become aware of how you react in Stressful Situations
Learn to say NO to certain requests and after school duties. You can't do Everything, and you shouldn't!
Understand and Accept that a teacher is not a Super Hero and we do have limits.
Find a Hobby and Ways to Relax at Home.
When you talk about your problems or issues regarding school, students, staff and administrators, make sure you are not complaining, but rather trying to figure out a solution.
Use Your Time Wisely. Evaluate how you spend your day, then make a weekly schedule and try to STICK TO IT.
Set Priorities and Realistic Goals.
At the end of the school day, think about all the things you achieved and finished rather that what you didn't have time to get done. 5. Create Personal Goals and Professional Goals
When creating personal goals and professional goals is to make sure that they are attainable. It is okay to "aim high", however, when you set the bar too high it can end up being a stressful situation.
T

VOLUME NO. 6 (2016), ISSUE NO. 09 (SEPTEMBER) ISSN 2231-1009
INTERNATIONAL JOURNAL OF RESEARCH IN COMPUTER APPLICATION & MANAGEMENT A Monthly Double-Blind Peer Reviewed (Refereed/Juried) Open Access International e-Journal - Included in the International Serial Directories
http://ijrcm.org.in/
40
6. Personal Goals for Teachers May Include Daily Exercise Routine: Staying active and healthy can reduce stress and may help you increase your awareness for dealing with stressful situations. Positive Thinking: It can be easy to formulate an attitude of pessimism, negativity, and hopelessness. This is basically because we have SO MUCH work and
SO LITTLE time! As teachers, we must train our minds to pause, reflect on a situation, then respond positively. Go to Bed at a Certain Time Each Night: When we don't get enough sleep, we tend to become short with students and other teachers. Enjoy Your Lunch Time: Your lunch time is meant for LUNCH. Many teachers grade papers or have demeaning conversations in the teacher's lounge. Lunch
can also be a good time to sit in your classroom and just have some quiet time to organize your thoughts. Slow Down - I am a people watcher, and when I watch teachers they are usually in a hurry to get somewhere, they are late arriving somewhere, or they
forgot something. This is because teachers have so much to do throughout the day that we often lose track of our priorities and become stressed. To slow down, try listening instead of talking and taking random moments of silence to stop and reflect on the day and manage priorities. Professional Goals for Teachers May Include:
Leave Work at a Certain Time Each Day: Teachers often feel that with all the work they have and papers to grade that they must stay late each night. It is important to have a home/family life to partake in fun and enjoyable activities.
Have Students Grade Papers: By having students help grade papers, they are actually modeling perfect practice by checking their own work. This will also create more time for you! This can be done as a whole group activity checking the homework from the night before.
Get Organized: Organization is a great way to get rid of teacher stress! The only problem...it takes time to get organized. So, you may need to come in early or stay late one or two days during a week to get your classroom organized. It will be worth it! Organize papers into labeled folders, organize your classroom into labeled bins and tubs, clean off your desk. You can also organize your student's line behavior. Don't leave the room until you have a beautiful straight line. When things are organized, there will be less stress.
7. Center Behavior Model Learning It is important when creating small group learning centers that you model how to behave in a small group as well as discuss the different roles within the small group. Sometimes, small groups may require that students change roles as note-taker, writer, problem solver, leader, etc. When students are working independently in small groups around the classroom, it is easy for the teacher to walk around and monitor student learning.
8. Homogeneous or Heterogeneous Grouping? Before setting up centers in your classroom, you must think about how you will structure your groups. There are two options for grouping. Homogeneous grouping is where each small group center has 3-4 students all with similar ability levels. Heterogeneous grouping is where each small group center has 3-4 students with one student being MIN, two students being MEETS, and one student being EXC. The exceeds student in the heterogeneous group will help lead and teach the group, which will also help the student understand the concept better. You may also want to give this student more challenging activities.
9. How to Set Up Your Learning Centers 3-4 students per group Length of Center Time: Pre-K through 2nd Grade = 15 minutes, 3rd Grade through 6th Grade = 20-30 minutes. Separate groups to different areas of your classroom Center activities MUST be self-checking. Have an answer key provided so the students can check their own work. Center work is usually not graded, as they will be able to check their work and fix their mistakes. You can take a weekly grade for participation. Have 4-6 centers around the room, depending on how many students you have. After the time is complete, have students clean up their center to its original
state and rotate to the next center.
REVIEW OF LITERATURE Job stress, also known as occupational stress, has been defined as the experience of negative emotional states such as frustration, worry, anxiety and depression attributed to work related factors (Kyriacou, 2001). Occupational stress in the human service professions, particularly in teachers, has been a focus of study in the last decades. Most surprisingly, school teachers have been considered to be under stress (Beer & Beer. 1992; Boyle et al.,1995; Hammen & De Mayo, 1982; Kinnunen, 1988; Kinnunen & Salo, 1994; Kyriacou, 1987; Malik, Mueller, & Meinke, 1991; Smith & Bourke, 1992; Pithers, 1995), undergoing the process of burnout (Beer & Beer, 1992; Burke & Greenglass, 1995; Kyriacou, 1987) or suffering from depressive symptoms (Beer & Beer, 1992; Hammen & De Mayo, 1982; Schonfeld, 1990; Schonfeld, 1992). There exists a substantial body of literature describing teaching as stressful occupation and suggesting that teacher stress appears to be an increasing problem (Antoniou et al., 2006; Chaplain, 1995; Guthrie, 2006; Kyriacou, 2001; Laughlin, 1984; Manthei & Gilmore, 1996; Munt, 2004; Punch & Tuetteman, 1996). In recent time, several studies have examined occupational stress in the teaching profession. Studies have suggested that teachers experience disproportionately high level of stress (Adeyemo & Ogunyemi, 2005; Borg 1990). A number of factors have been shown to influence teachers’ decisions about staying on or leaving the profession, including job stress, job satisfaction, resilience, and self-efficacy (e.g., Chan, et al., 2008; Day, et al., 2009). Typically, they include stressors in the areas of work role (e.g., workload); administration; class size; role ambiguity and conflict, (e.g., the sometimes conflicting demands of school management); the pressures of the teachers’ roles (e.g., counsellor, facilitator); poor working conditions; little recognition and low remunera-tion; lack of involvement in decision-making; student recalcitrance; lack of effective communication, as well as the many emotional demands of teaching (e.g., Blix, et al., 1994; Brown & Ralph, 1992; Cooper & Kelly, 1993; Punch & Tuetteman, 1990). In addition, a study in Bahrain by Al-Khalefa (1999) observed work conditions, salaries, bonuses and allowances, status of physical education, supervision, school facilities, workload and career development to be the major causes of stress for physical education teachers. Teachers who become burned out may be less sympathetic toward students, may have a lower tolerance for frustration in the classroom, may plan for their classes less often or less carefully, may fantasize or actually plan on leaving the profession, may feel frequent emotional or physical exhaustion, may feel anxious, irritable, depressed, and in general, may feel less committed and dedicated to their work (Farber & Miller, 1981). Furthermore, Farber (1984) assessed the sources of stress of suburban teachers in the United States and found that excessive paperwork, unsuccessful adminis-trative meetings, and the lack of advancement opportunities in teaching were related to stress. Workload, lack of resources, poor professional relationships with colleagues, inadequate salary, pupil misbehavior, difficult interactions with parents and expectations of other staff have been identified as sources of stress in many studies (Borg, Riding & Falzon, 1991; Boyle, et al., 1995; Pierce & Molloy, 1990; Pithers & Soden, 1998; Travers & Cooper, 1993). Smilansky (1984) examined teachers' work satisfaction and reports of job-related stress in some English elementary schools, and he found that teachers' general satisfaction and stress at work were related mostly to their reported feelings about what had happened within class (such as relations with pupils, the process of teaching, and pupil behavior in school) rather than to administrative or policy questions (such as degree of work autonomy, relations with principals). Negative self-perception, negative life experiences, low morale, and a struggle to maintain personal values and standards in the classroom all take their toll (Goodman, 1980; Schnacke, 1982; Schwanke, 1981). Stressed teachers had more illness, medicine intake, anxiety, depression, and sexual passivity. More psychological and psychosomatic symptoms were reported by teachers experiencing high burnout (Bauer et al., 2006).
AIMS AND OBJECTIVES 1. To study the effect of stress on mental health of tribal school teachers. 2. To study the effect of gender and religion on the level of stress.

VOLUME NO. 6 (2016), ISSUE NO. 09 (SEPTEMBER) ISSN 2231-1009
INTERNATIONAL JOURNAL OF RESEARCH IN COMPUTER APPLICATION & MANAGEMENT A Monthly Double-Blind Peer Reviewed (Refereed/Juried) Open Access International e-Journal - Included in the International Serial Directories
http://ijrcm.org.in/
41
METHODOLOGY HYPOTHESIS (ES) 1. There will be significant effect of stress on mental health of tribal school teachers. 2. Female Teachers will be more stressful than male Teachers 3. There will be no significant difference between Christian and non- Christian (sarna) teachers in Their level of stress. SAMPLE AND STUDY DESIGN The sample of the study comprised of 80 tribal teachers from different mission schools in Ranchi town. 40 were selected tribal Christian school teachers and 40 were tribal Sarna teachers.
Religion
Tribal school teachers Christian Sarna Total
Male 20 20 40
Female 20 20 40
Total 40 40 80
TOOLS The following tools have been used in the present study for the collection of data. Personal Data Sheet: personal data sheet was specially designed for the present study which include data related to personal identification of the teachers
specially their names, addresses, schools in which they are working, designation, nature of the job and salary etc. The occupation stress index scale: Perceived stress among the automobiles workers were measured by using the occupational stress index scale. This scale
was developed by Dr. A.K. Shrivastava & A.P Singh in 1981. This test measures the extent of stress which employees perceive arising from various constituents and conditions of their job.
General Health Questionnaire (GHQ)-12: This scale was made by shamsunder et; al 1986 and gautam et; al. 1987.it consist 12 questions related to health problem focused on anxiety /stress, malnutrition, weight, height, anemia, hemoglobin, blood pressure, sugar level etc. High scores indicate good mental health.
PROCEDURE OF DATA COLLECTION A booklet consisted of personal information schedule along with General Health Questionnaire (GHQ)-12 and The Occupational Stress Index Scale was used. For the collection of data, we had to personally consult to the principal of school. The data collection of the main study was carried out with the prior permission of the principal and the class teacher of the high school to get the responses. Introduction was given regarding the objectives of study, its importance, importance of their co-operation and their sincere responses just before the administration of the questionnaire. They were also assured that the answers given by them would be kept under strict confidence. Teachers were instructed very clearly about the pattern of answering for each question of the questionnaire. STATISTICAL ANALYSES The Following Statistical Techniques have been used in the analysis of obtained data. Percentage of low, moderate and high scores in o.s.i and its sub-scale have been calculated. The percentage and mean scores have also been graphically shown where felt necessary. The secondary school teachers are divided into three groups (Table 1), that is less, moderate and more stressed groups, on the basis of their Occupational Stress Scores. The occupational stress levels of secondary school teachers are between the following range: Less level of Occupational Stress (i.e. 46-122 scores), Moderate level (i.e. 123-155 scores), and More level of Occupational Stress (156-230 scores). An examination of Table 1 shows that the percentages of More, Moderate and Less Stressed groups of teachers are 03.75%, 36.25% and 60.00% respectively. In male sub-group, this translates into 00%, 40.00% and 60.00%, while in female sub group it is 8.00%, 32.00% and 60.00% respectively. Thus, it is evident from the analysis that nearly half of the teachers are in less stressed group and generally male teachers experience more stressful situations about their occupation than their counterparts.
TABLE 1: PERCENTAGE OF TEACHERS EXPERIENCING LESS, MODERATE AND MORE STRESS TOWARDS JOB
Group N Occupational Stress Groups Number of Teachers in each Group Percentage of Teachers in each Group
Male 40 low stress 24 60.00 %
Moderate Stress 16 40.00 %
High Stress 00 00.00 %
Female 40 low stress 24 60.00 %
Moderate Stress 13 32.00 %
High Stress 03 08.00 %
Total 80 low stress 48 60.00 %
Moderate Stress 29 36.25 %
High Stress 03 03.75 %
FIG. 1
0.00%
10.00%
20.00%
30.00%
40.00%
50.00%
60.00%
70.00%
Low Moderate High
Male
Female
Lev
el o
f S
tres
s

VOLUME NO. 6 (2016), ISSUE NO. 09 (SEPTEMBER) ISSN 2231-1009
INTERNATIONAL JOURNAL OF RESEARCH IN COMPUTER APPLICATION & MANAGEMENT A Monthly Double-Blind Peer Reviewed (Refereed/Juried) Open Access International e-Journal - Included in the International Serial Directories
http://ijrcm.org.in/
42
HOW STRESSFUL IS TEACHING It is evident from the result shown in Table 2 that the mean occupational stress scores of male and female teachers are found 115.95 and 120.03 with SDs of 16.72 and 22.85 respectively. When the means of two groups compared, the difference between comparison groups is found statistically significant (t=1.20, P>0.05). The trend of result showed that male teachers are significantly more stressed with their job than female teachers.
TABLE 2: COMPARISON OF MEAN OCCUPATIONAL STRESS SCORES OF MALE AND FEMALE TEACHERS
Gender N Mean Occupational Score SD t df P<
Male 40 115.95 16.72 1.20 78 Not Sig. Female 40 120.03 22.85
TABLE 3: COMPARISON OF MEAN OCCUPATIONAL STRESS SCORE OF CHRISTIAN AND SARNA TEACHERS
Group N Mean SD t df P<
Christian 40 118.03 15.62 0.82
78
Not Sig. Sarna 40 114.65 23.62
RESULTS & DISCUSSION The purpose of the current study was to examine the relation between stress and mental health of teachers. This section discus the results and implications of current study. Within this section, discussed are the main topic headings of objectives and hypotheses, limitations, future research implications, and conclusions. The present study suggests that nearly one-half of the population of secondary school teachers (60.00%) face less stress towards their occupation, while among the remaining teachers a large chunk of population falls into moderate stress group (36.25%); in contrast, a minor group consisting of 03.75% of the total population has more stress towards teaching profession. This is in partial accordance with Durani’s observation (2009) who reported that among 150 women working as teachers in schools, 39% were having low stress, 20% were having high stress, 15% were having very average stress, 13% were having very high stress, 8% of the respondents no stress, and 5% very low stress and 0% i.e. negligible were abnormal. This result is discordant with that of Nayak et al. (2009), who found the higher percentage of teachers (70.5%) to be in the low stress category, followed by very low stress category (23.5%) and lesser percent in moderate stress category (6.0%). Gender-wise analysis shows that male teachers are more stressed than female teachers. The lesser degree of job satisfaction among male teachers can be at-tributed to the perceptions of female teachers to shoulder the responsibilities same as males in this competitive world, along with their aspiration level, social acceptability, challenges, job responsibilities and career development. Moreover, it is a widely accepted fact that secondary schools are heading towards the work environments that are non- masculinized. The finding is supported by Byrne (1998) and Bhagawan (1997) who emphasized that the causes leading to burn-out/stress affect male teachers more than the female teachers who have higher motivation. Whatever the underlying explanation, the results reported here contradict those of other studies that reported higher stress in female primary and secondary staff (Antoniou et al., 2006; Laughlin, 1984; McCormick & Solman, 1992b; Timms et al., 2006; Abdul Majid, 1998), and no difference between the gender in the three burnout syndrome (Zhao & Bi 2003; Dali, 2004; Coulter & Abney, 2009). According to table 2 Mean Occupational Stress scores will be found of male teachers is 115.95 and female teachers is 120.03 and their SD is 16.72 and 22.85 on the basis of mean and SD scores t-value will be found 1.20 is not significant it shows that there is not significant difference between male teachers and female teachers on the stress level. According to table -3 mean occupation stress scores will be found of Christian teachers is 118.03 and sarna teachers is 114.65 and there SD is 15.62 and 23.62 on the basis of mean and SD score t-value will be found 0.82 is not significant it is shows that there is not significant difference between Christian teachers and female sarna teachers on the stress level.
FINDINGS The purpose of this study to find out a socio-psychological study in impact of stress on mental health with gender, marital status, qualification, teaching experience, salary, subject taught among school teachers of Ranchi.
CONCLUSIONS The study concludes that nearly half of the teachers are in less stressed group and male teachers face more occupational stress than their counterparts. Further, it is revealed from the result that trained school teachers have significantly higher occupational stress than an untrained teachers. It is recommended that regular assessment of stress level should be conducted for preventive measures. The study also finds that occupational stress is most prevalent among teachers with an experience of 6-10 years and least among 0-5 years of experience in teaching. Further, a no significant difference is seen between the monthly salary and occupa-tional stress of male and female school teachers. Also, no significant difference is found among the teachers teaching languages, arts, social sciences and sciences. In addition to this, the study also supports no significant difference in the marital status and occupational stress of Christian and Sarna school teachers. Stress affects the efficiency of the individual. So, there is a need to provide proper conducive environment and support to teachers to maintain individual stress at their workplace. Teachers should be positive in facing their challenges, which will help them in improving their functional skills and reduce stress, so that their profession is not affected. Besides that, the institution or management should check that, supervision, support and relationship with the teachers is properly taken care of and enhanced most strongly. Most importantly, it is recommended that principals and supervisors should investigate the causes for stress and evaluate the or-ganizational climate of the school.
REFERENCES 1. Abdul Majid, I. (1998). Occupational stress and teachers job satisfaction: Implications to the human relations management approach. A thesis submitted in
partial fulfillment of the requirement for the degree of Master of Education, Kulliyyah of Islamic Revealed Knowledge and Human Sciences, International Islamic University, Malaysia.
2. Adeyemo, D. A., & Ogunyemi, B. (2005). Emotional intelligence and self-efficacy as predicators of occupational stress among academic staff in a Nigerian university. Retrieved on May 6, 2010 from www.leadingtoday.org/weleadinlearning/da05.htm.
3. Al-Khalefa, S. M. (1999) Female PE teacher stress in primary schools in the Kingdom of Bahrain. Unpublished PhD Dissertation, Physical Education College in AL Harem, Cairo, Egypt.
4. Antoniou et al., 2006; Chaplain, 1995; Guthrie, 2006; Kyriacou, 2001; Laughlin, 1984; Manthei & Gilmore, 1996; Munt, 2004; Punch & Tuetteman, 1996. Demographic Differences and Occupational Stress of Secondary School Teachers. European Scientific Journal. March edition vol. 8, No.5 ISSN: 1857 – 7881 (Print) e - ISSN 1857- 7431.
5. Antoniou, A. S., Polychroni, F., & Vlachakis, A. N. (2006). Gender and age differences in occupational stress and professional burnout between primary and high-school teachers in Greece. Journal of Managerial Psychology, 21 (7), 682-690.
6. Bauer, J., Stamm, A., Virnich, K., Wissing, K., Mueller, U., Wirsching, M. et al. (2006). Correlation between burnout syndrome and psychological and psycho-somatic symptoms among teachers. International Archives of Occupational and Environmental Health, 79, 199- 204.
7. Beer & Beer, 1992; Hammen & De Mayo, 1982; Schonfeld, 1990; Schonfeld, 1992. Demographic Differences and Occupational Stress of Secondary School Teachers European Scientific Journal eujournal.org/files/journals/1/ articles/90/public/90-278-1-PB.pdf.

VOLUME NO. 6 (2016), ISSUE NO. 09 (SEPTEMBER) ISSN 2231-1009
INTERNATIONAL JOURNAL OF RESEARCH IN COMPUTER APPLICATION & MANAGEMENT A Monthly Double-Blind Peer Reviewed (Refereed/Juried) Open Access International e-Journal - Included in the International Serial Directories
http://ijrcm.org.in/
43
8. Beer, J., & Beer, J. (1992). Burnout and stress, depression and self-esteem of teachers. Psychological Reports, 71, 1331-1336. 9. Bhagawan, S. (1997). Job stress and burnout in teachers of secondary school in Orissa. Journal of Educational Research Extension, 33(4), 218-234. 10. Blix, G. B., Cruise, R. J, Mitchell, B. M., & Blix, G. G (1994). Occupational stress among University Teachers. Educational Research, 36, 157-169. 11. Borg, M. D. (1990). Hypertension, peptic ulcer, and diabetes in teachers. Journal of Australian Medical Association, 224, 489-492. 12. Borg, M. G., Riding, R. J., & Falzon, J. M. (1991). Stress in teaching: A study of occupational stress and its determinants, job satisfaction and career commitment
among primary schooltecahers. Educational Psychology, 11 (1), 59-75. 13. Boyle, G. J., Borg, M. G., Falzon, J. M., & Baglioni, A. J. (1995). A structural model of the dimensions of teacher stress. British Journal of Educational Psychology,
65(1), 49-67. 14. Brown, M., & Ralph, S. (1992). Teacher stress. Research in Education, 4,103-110. 15. Byrne, J. J. (1998). Burnout: Its causes, effects and remedies. Contemporary Education, 69(2), 86-91 16. Chan, W.-Y., Lau, S., Nie, S. L. Y., Lim, S., & Hogan, D. (2008). Organizational and personal predictors of teacher commitment: The mediating role of teacher
efficacy and identification with school. American Educational Research Journal, 45, 597–630. 17. Chaplain, R. P. (1995). Stress and Job Satisfaction: A Study of English primary school teachers. Educational Psychology, 15 (4), 473-489. 18. Cooper, G. L. & Kelly, M. (1993). Occupational stress in head teachers: A national UK study. British Journal of Educational Psychology, 63,130-143. 19. Coulter, M. A., & Abney, P. C. (2009). A study of burnout in international and country. International Review of Education, 105-121. 20. Dali, T. (2004). Psychosocial work characteristics as predictors for burnout: Findings from 3- year follow up of the PUMA study. Journal of Occupational and
Environmental Medicine, 47, 1015-1025. 21. Day, C., Sammons, P., Gu, Q., Kington, A., & Stobart, G. (2009). Committed for life? Variations in teachers’ work, lives and effectiveness. In M. Bayer, U.
Brinkkjær, H. Plauborg, & S. Rolls (Eds.), Teachers’ career trajectories and work lives (pp. 49–70). New York: Springer. 22. Farber, B., & Miller, J. (1981). Teacher burnout: A psycho-educational perspective. Teachers College Record, 83, 235-243. 23. Goodman, V. B. (1990). Urban teacher stress: A critical literature review. ERIC Document Reproduction Service No. ED 221 611. 24. Guthrie, R. (2006). Teachers and Stress. Australia & New Zealand Journal of Law & Education, 11 (1), 5-18. 25. Hammen, C., & DeMayo, R. (1982). Cognitive correlates of teacher stress and depressive symptoms: Implications for attributional models of depression.
Journal of Abnormal Psychology, 91(2), 96-101. 26. Kyriacou, C. (2001). Teacher Stress: Directions for Future Research. Educational Review, DOI: 10.1080/00131910120033628. 53 (1), 27-35. 27. Kyriacou, C. (2001). Teacher stress: Directions for future research – Educational Research. Publishing models and article dates explained p. 27-35. 28. Laughlin, A. (1984). Teacher Stress in an Australian Setting: The Role of Biographical mediators. Educational Studies, 10 (1), 7-22. 29. Manthei, R., & Gilmore, A. (1996). Teacher Stress in Intermediate Schools. Educational Research, 38(1), 3-19. 30. McCormick, J., & Solman, R. (1992b). Teachers’ Attributions of Responsibility for Occupational Stress and Satisfaction: An Organisational Perspective. Educa-
tional Studies, 18 (2), 201-222. 31. Munt, V. (2004). The Awful Truth: A Microhistory of Teacher Stress at Westwood High. British Journal of Sociology of Education, 25 (5), 578-591. 32. Nayak, J., Sawkar, S. P., Bhat, A. R. S., Yenagi, G., & Hasalkar, S. (2009). Demographic characteristics and organizational sources of stressors. Journal of
Community Guidance & Research, 26(3), 364-376. 33. Pierce, C. M. B., & Molloy, G. N. (1990). Psychological and biographical differences between secondary school teachers experiencing high and low levels of
burnout. British Journal of Educational Psychology, 60, 37–51. 34. Pithers, R. T., & Soden, R. (1998). Scottish and Australian teacher stress and strain: A comparative analysis. British Journal of Educational Psychology, 68, 269–
279. 35. Punch, K. F., & Tuetteman, E. (1990). Correlates of psychological distress among secondary school teachers. British Educational Research Journal, 16, 369-
382. 36. Punch, K. F., & Tuetteman, E. (1996). Reducing Teacher Stress: The effects of support in the work environment. Research in Education, 56, 63-72. 37. Schnacke, S. B. 1982. Burnout: Coping with predictable professional life crises. Paper presented at the annual meeting of the American Association of Colleges
for Teacher Education, Houston, TX. (ERIC Document Reproduction Service No. ED 257 836. 38. Schonfeld, I. S. (1990). Psychological distress in a sample of teachers. Journal of Psychology, 124, 321-328. 39. Schonfeld, I. S. (1992). A longitudinal study of occupational stressors and depressive symptoms in first-year female teachers. Teaching and Teacher Education,
8(2), 151-158. 40. Schwanke, D. C. (1981). Teacher stress: Selected ERIC resources. Washington, DC: ERIC Clearinghouse on Teacher Education. (ERIC Document Reproduction
Service No. ED 204– 258). 41. Smilansky, J. (1984). External and Internal Correlates of Teachers' Satisfaction and Willingness to Report Stress. British Journal of Educational Psychology. Vol
54, Issue 1, pages 84–92, DOI: 10.1111/j.2044-8279.1984.tb00847.x 42. Teacher Stress Tips. https://www.suu.edu/ed/fso/resources/teacher-stress-tips.pdf

VOLUME NO. 6 (2016), ISSUE NO. 09 (SEPTEMBER) ISSN 2231-1009
INTERNATIONAL JOURNAL OF RESEARCH IN COMPUTER APPLICATION & MANAGEMENT A Monthly Double-Blind Peer Reviewed (Refereed/Juried) Open Access International e-Journal - Included in the International Serial Directories
http://ijrcm.org.in/
44
SMART CITIES – CHALLENGES AND IMPLEMENTATION APPROACHES: COMPARISON PERSPECTIVE IN INDIA, UAE AND SINGAPORE
RAMAMURTHY VENKATESH ADJUNCT FACULTY
SYMBIOSIS INTERNATIONAL UNIVERSITY’S SYMBIOSIS INSTITUTE OF TELECOM MANAGEMENT PUNE
CHINTAN VADGAMA
ASST. PROFESSOR SYMBIOSIS INTERNATIONAL UNIVERSITY’S SYMBIOSIS INSTITUTE OF TELECOM MANAGEMENT
PUNE
MADHAVI DAMLE ASST. PROFESSOR
SYMBIOSIS INTERNATIONAL UNIVERSITY’S SYMBIOSIS INSTITUTE OF TELECOM MANAGEMENT PUNE
ABSTRACT
Smart Cities Mission under Ministry of Urban Development, India has released the list of first 20 smart cities with generic guidelines. Key objective of this mission is to promote cities that offer quality of life to citizens through connected infrastructure and a clean and sustainable environment by adopting ‘smart’ solutions with public private participation. While funding and governance issues need lot of coherent actions, implementation approaches and their impact on “smart city” service provider business models with potentially scalable ICT infrastructure poses lot of challenges too. Proactive and concerted participation of Urban Local Bodies (ULBs) and Public-private partnership companies, particularly managed service providers (MSPs) who will be one of the key factor deciding the success of India’s’ smart cities initiatives. Implementation approaches as planned in some of the global cities such as UAEs Dubai and Singapore shall be consulted to come out with integrated business models and innovative local partnerships (Local Ecosystem) that will suite India specific challenges. This may also help evolution of agreed standards, protocols and common data formats that facilitate interoperability across systems, ease the information flow challenges by MSPs, re-use existing infra-structure and put it to multiple use for faster deployment of smart city services.
KEYWORDS smart cities, implementation challenges, ecosystem business model, managed services providers, services co-creation, smart city platform. JEL CLASSIFICATION CODES A13, L90, O18, O38, R12.
1. INTRODUCTION mart cities are cities that are conceived and built as an overlay of digitally ‘Smart’ and ‘Intelligent’ solutions that will lead to the adoption of at least 5 of the 8 following smart parameters—smart energy, smart building, smart mobility, smart healthcare, smart infrastructure, smart technology, smart govern-ance and smart education, smart citizen.
By a definition given by Frost& Sullivan, a smart city is an enabling platform built by the government, for the people, to understand and manage the interactions between people and the infrastructure in a city and to guide informed policy making through the intelligent usage of technology. A report by Deloitte defines a smart city as “when investments in human and social capital, traditional (transport) and modern information and communications technology ICT infrastructure fuel sustainable economic development and a high quality of life, with a wise management of natural resources”. The integration of new aspects brought to take into account different and innovative factors in governance and management of the urban areas, and this process turned the focus on more complex conceptualizations such as the “smart city” (Schaffers et al., 2011) in which human and social capital and traditional and modern communication infrastructures are combined to carry on the sustainable economic growth and a higher quality of life through a proper management of available resources (Caragliu et al., 2011). Almost all nations are facing the pressure on sustainable natural resources and effect of environmental degradation due to modern lifestyles, notion of “smartness” and “smart cities” is more of necessity for all governments. Irrespective of the constituent political or legal status, all nations and communities need to provide efficient systems for adequate water supply, assured supply of electricity, sustainable environment and hygienic living conditions with good sanitation, solid waste management, efficient urban mobility and public transport system, affordable housing communities, seamless IT connectivity and digitally connected network systems, safety and security of citizens, good e-governance and citizen participation aided by good healthcare and education systems. Such an evolution leading to “smart nations” are possible only by adopting to well-planned implementation approaches. This paper looks in to the challenges and implementation approaches in select nations as a way to benchmark how Indian models shall adopt.
2. GLOBAL TRENDS SMART CITY INITIATIVES Globally various cities have developed to achieve various stages of “smartness” while many cities are still in the process of implementing smart functionalities within their smart city plans. Priorities and inclusion of key smart services as part of smart city plans differ across countries while the majority of initial services will be driven by utility and municipal services such as smarty mobility, smart transportation and smart energy services. Report on Strategic Opportunity Analysis of the Global (Frost & Sullivan, March 2015) Smart City Market predicts the distribution of various market segments globally for smart city services is expected to be as below.
S

VOLUME NO. 6 (2016), ISSUE NO. 09 (SEPTEMBER) ISSN 2231-1009
INTERNATIONAL JOURNAL OF RESEARCH IN COMPUTER APPLICATION & MANAGEMENT A Monthly Double-Blind Peer Reviewed (Refereed/Juried) Open Access International e-Journal - Included in the International Serial Directories
http://ijrcm.org.in/
45
FIGURE 1: SMART CITY MARKETS BY SEGMENTS – GLOBAL (2012-2020)
As such many countries and smart city councils have issued guidelines, KPIs and consultative operating models. A notable one is the Public draft of European Innovation Partnership on Smart Cities and Communities which emphasizes various priorities and importance of strong citizen participation, co-creation of smart services by public and private bodies, seamless integration of services as “managed services” model by Managed Services Providers (MSPs). Currently published country specific guidelines mainly serve as a framework to all stakeholders and public and private partnership entities on how to integrate smart city solutions and services for existing cities and new developments. However, there are challenges about KPIs and metrics for each segment of services which cannot be uniformly defined due to diverse and local/regional specific challenges, especially India. Consultative paper released by Indian Chamber of Commerce and Deloitte (“100 Smart cities in India, facilitating implementation, Feb 2015) spells out financial, technical and institutional constraints that are specific to India. Some of the key concerns are:
Limitations of technical capacity of ULBs and lack of related workforce talent
Challenges in adopting to business models that will leverage PPP and outsourcing arrangements both for operationalizing and maintaining smart solutions and services with output based managed services providers
Right mix of cloud based ICT infrastructure models required
Need effective coordination required between different levels of ULBs, State and Central government agencies for sharing of best practices and sharing of service delivery processes
Need for control of information flow and governance structure such as Central Control room with representation of all stakeholders with common database for sharing of data etc.
3. LITERATURE REVIEW To study and compare the challenges and impact of Smart City implementation initiatives, it is apparent that major generic guidelines provided by International bodies such as European Commission released recently around 2013 would be a good source of information to start with [1]. Objective of this paper is to compare and contract smart city implementation approaches by India and other two growing national initiatives. Concept of smart city has been in the discussions since 2005 starting with smart grid implementations in major power companies. Also, Green Economy and sustainable development theories gained momentum during last decade. Guidebook released by Division for Sustainable Development under UN Department of Economic and Social Affairs (UN DESA) and other contemporary research reports have been instrumental in various Smart City initiatives across the nations. Currently, urban and metropolitan contexts are increasingly influenced by globalization processes (Berry, 2008) and new technologies (Demirkan, et al., 2011). ICTs are now heavily involved in the governance and management of cities, where they are used as tools and as resources to improve quality of life, achieve sustainable development, and create a more open and innovative urban context through the participation of several actors (Anthopoulos and Tougountzoglou, 2012). Premise of this paper is to compare various smart city initiatives to see how Indian Smart City plans are geared to face the challenges of implementation and rollout. Regional reports and state guidelines on Smart city plans especially from Singapore and UAE are consulted for reviewing Indian initiatives [8] [9]. Ranking of nations for their ‘digital readiness’s by evaluating all nations using a metric called Network Readiness Index (NRI), proposed by WEF Global Information Technology Report illustrates that effectiveness of governments has increased as a result of their ability to provide citizen-centric online services enabling citizen participation in governance [12]. The term “Smart” in smart city initiatives is fully dependent on how ICT is being used by nations for inclusive growth. Also, another ranking based on Global Competitiveness shall be used to gauge the level of public private participation possible which is the essence of smart city plans. In other words, sustainable development and smart living requires significant level of business cohesion and services integration enabled by robust digital ICT infrastructure.
4. SMART CITIES IMPLEMENTATION APPROACHES Current approaches to smart cities implementation in various countries are essentially driven by Government initiatives and incentives for public-private partici-pation. World Economic Forum (WEF) yearly reports “The Global Information Technology Report” releases assessment of “networked readiness” of 143 economies every year using the Networked Readiness Index (NRI). Similarly, Global Competitiveness report (GITR) ranks the key factors and their interrelations that determine economic growth a country and its level of present and future prosperity. From Smart cities implementation perspective, these two indices are a good starting point to see how the individual nations should deploy smart solution models. While NRI provides the digital readiness of the nation that is vital for smart solutions, Competitiveness ranking will provide notable insights on how the private-public participation models will work under the given circumstances and guidelines for smart cities.
TABLE 1: RANKING HISTORY OF COUNTRIES UNDER DISCUSSION AS PER WEF GITR REPORTS
Country Population 2015 (mn) Ranking as per Global Competitiveness Report Ranking as per Global IT Report (GITR) " Network Readiness Index"
2012-13 2013-14 2014-15 2015-16 2013 2014 2015
Singapore 5.5 2 2 2 2 2 2 1
UAE 9.3 24 19 12 17 25 24 23
India 1259.7 59 60 71 55 68 83 89
China 1367.8 29 29 28 28 58 62 62
Brazil 202.8 48 56 57 75 60 69 84
Russia 143.7 67 64 53 45 54 50 41
South Africa 54 52 53 56 49 70 70 75

VOLUME NO. 6 (2016), ISSUE NO. 09 (SEPTEMBER) ISSN 2231-1009
INTERNATIONAL JOURNAL OF RESEARCH IN COMPUTER APPLICATION & MANAGEMENT A Monthly Double-Blind Peer Reviewed (Refereed/Juried) Open Access International e-Journal - Included in the International Serial Directories
http://ijrcm.org.in/
46
Comparing India with UAE, Singapore and other BRICS nation on ICT Index, India stands low with 89th rank for year 2015. Though Indian mobile market is very vibrant and expanding with recent surge in ecommerce and many clusters of IT excellence and frugal innovation, India is yet to leverage complete ICT potential to this benefits. However, there are some two important factors which are very encouraging is that (a) Affordability of mobile services as a result of the fierce competition and (b) Approach to Smart Cities as individual cities than nation or region wide. However, while there are generic guidelines for Smart City programs, a lot need to be done to manage the challenges during planning, implementing and operating smart city solutions with active participation of private sector who will be billing the major part of funding and financial investments.
FIGURE 2: COMPARISON OF UAE, SINGAPORE AND INDIA AS PER NETWORK READINESS FRAMEWORK –GITR 2105
4.1 SINGAPORE INITIATIVES Singapore as a nation has always in the forefront of technology driven national development. Recent reports suggest that Singapore is continuously leading the ICT revolution and digital initiatives, especially especially e-governance and smart city solutions. As per the Singapore governments published document on Smart City vision, a comprehensive plan is chalked out involving Singapore universities and medical facilities, multi-billion annual research and development (R&D) in-vestments, fast-growing community of tech start-ups and large pools of investment capital. Next Gen smart city plan of Singapore is centered on the premise of government and private sectors using ICT holistically to bring about better lives and greater business opportunities. This is substantiated by the fact that Singapore offers most conducive business and innovation environment worldwide and highly ranked for the quality of its regulatory framework. A good case of example would be how Infocomm Development Authority of Singapore has taken steps to develop an innovative technology platform in membrane and material advancements for water purification (pioneered by Hyflux). This method of clean drinking water pro-duction is now being used in several other countries as per Mr Steve Leonard, Executive Chairman of IDA, Singapore.
FIGURE 3: SINGAPORE SMART CITY INITIATIVE (SOURCE: FROST & SULLIVAN REPORT

VOLUME NO. 6 (2016), ISSUE NO. 09 (SEPTEMBER) ISSN 2231-1009
INTERNATIONAL JOURNAL OF RESEARCH IN COMPUTER APPLICATION & MANAGEMENT A Monthly Double-Blind Peer Reviewed (Refereed/Juried) Open Access International e-Journal - Included in the International Serial Directories
http://ijrcm.org.in/
47
4.2 UAE INITIATIVES Among the six GCC countries, UAE has been in the forefront of development and technology advancements while Qatar is close behind. As per GITR 2015 Network readiness index ranking, UAE (23) and Qatar (27) lead among top 30, while Bahrain(30), Saudi Arabia (35), and Oman (42) are not far behind barring Kuwait(72). This implies that a very strong commitment to ICT development by their respective governments is a must to foster digitally enabled societies and smart cities. Among UAE federal districts, Dubai is driving the smart city culture. With a population of about 2.5mn, this can be compared to growing Indian cities if not the metropolis cities. Smart Dubai Master Plan has envisaged smaller districts within the geographic limits of cities for design, development and delivery of smart solutions in alignment with Government entities and private sector partnerships. First edition of World Green Economy Summit was held at Dubai on 2014 and one of the key outcomes was to establish Public Private Partnership Platform to facilitate and showcase innovative projects partnerships and technology. Subse-quently Smart Dubai initiative is established with an ambitious goal of reducing energy consumption by 30% by 2030 in alignment with Smart City initiatives. (State of Green Economy Report, 2015) Some salient features for Dubai Smart City Master Plan and the guidelines provided in Smart Dubai District Guidelines (Smart Dubai, Executive briefing, March 2015) include:
Defined KPI for Smart Dubai with Smart City Platform and benchmarking
Smart Districts certification
Shared real-time information for infrastructure planning, vendors and services best practices
Platform-as- a- Service provided by City to be used as District dashboards, application and Centralized management services operations.
FIGURE 4: SMART DUBAI – SUMMARY OF GUIDANCE FOR FOCUS INITIATIVES FROM THE DISTRICTS
4.3 INDIAN INITIATIVES Smart Cities – Mission Statement and Guidelines document issued by Ministry of Urban Development, Government of India by June 2015 is not prescribing any particular model to be adopted by the Smart Cities. Due to inherent challenges within India and the distributed nature of cities/districts that can be included in Smart Cities vision, India is in right path to not to adopt ‘one-size-fits-all’ and each city has to formulate its own concept, vision, mission and plan for a Smart City Plan (SCP) that is appropriate to its local context, resources and levels of stakeholder’s engagement and participation. Some key elements that are expected out of city/district specific SCP are
Assured electricity supply with at least 10% of the Smart City’s energy requirement coming from solar, Adequate water supply including waste water recycling and storm water reuse
Sanitation including solid waste management and rain water harvesting,
Smart metering, robust IT connectivity and digitalization
Pedestrian friendly pathways, encouragement to non-motorized transport
Intelligent traffic management and Smart parking
Energy efficient street lighting & innovative use of open spaces
Redevelopment and Greenfield building to be at least 80% buildings/Green Buildings Of the total 200 cites planned, first 20 cities are now in the process of formulating implementation plans with slow momentum for Special purpose vehicles that will fund the majority of the projects under Public Private Partnership program. Unlike UAE and Singapore, Indian Government has committed to the development of smart cities but the major onus in on State & Urban Local Bodies (ULB) to come out with city level strategies and operating models for timely and effective implementation. In other words, though select cities in India exhibit smart solutions as highlighted above, the challenge is to replicate these solutions on a larger scale and to augment specific functionalities to bring in additional smart / intelligent features. Adoption of an integrated and replicable operating model among cities/ULBs is key to significantly reduce the time and cost of implementing smart city function-alities so that existing solutions can be leveraged both in the public and private sector enabling rapid scaling up of facilities.

VOLUME NO. 6 (2016), ISSUE NO. 09 (SEPTEMBER) ISSN 2231-1009
INTERNATIONAL JOURNAL OF RESEARCH IN COMPUTER APPLICATION & MANAGEMENT A Monthly Double-Blind Peer Reviewed (Refereed/Juried) Open Access International e-Journal - Included in the International Serial Directories
http://ijrcm.org.in/
48
5. PRIORITIES AND CHALLENGES As recognized by Indian Government, there are key challenges in ensuring success for SCPs by different Cities/ULBs and district bodies. Firstly, this is the first instance of “competitive and cooperative federalism” being exercised by promoting competitive spirit and autonomy to local bodies for development programs. This is will need lot of efforts from those competing SCPs for integration and implementation Secondly, generic guidelines as given now need to be expanded in detail to ensure understanding the concepts of retrofitting, redevelopment and Greenfield development by various stakeholders with individual SCPs. Thirdly, co-creation of services and citizen involvement is much more essential than just a passive participation in governance. Inculcating smart city concept and involvement of “Smart Citizen” in defining, deploying smart solutions need to be enabled by the SPV through increasing use of ICT, especially mobile-based tools. Such challenges are also envisaged by smart city visions of UAE and Singapore which are in the same region as India and their respective guidelines for smart cities rollout provide vital points for Indian stakeholders to take note of and to benchmark prioritized KPIs. Table 2 as below compares Smart Cities Vision guidelines and priorities of India, Singapore, UAE approaches. Understandably Singapore and UAE are smaller nations with good digital infrastructure and competitive business environment as established by their consistent rankings in WEF reports. Nevertheless, smart city approaches by India too on select cities to start with which shall be considered as 20 smaller nations from the perspective of comparison. Some of the salient points of Singapore and UAE models are Singapore model is based on their superior infrastructure and availability of strong public-private participation scope. Citizen participation has been inculcated under strong government leadership for more than 30 years and hence Singapore vision is largely KPI driven. They have established various levels of KPIs to be achieved in specific terms especially on transportation and energy consumption. Especially they aim to achieve 50% citizen using public transport relies on their commitment to achieve their smart city vision. While there is no specific mention of centralized and government controlled information system to integrate, Singapore will have an inter-ministerial committee to oversee and regulate achievement of their prioritized smart city KPIs. UAE on the other hand, with their federal governments of seven emirates, will chiefly focus on Dubai closely followed by Abu Dhabi which are similar to Singapore as a city with similarly population and economic profile. For obvious reasons Dubai has taken the lead as a serious contender to Singapore-like metropolis that are now under transformation to smart cities. UAE model is to encourage “smart districts” competing each other to achieve smart city goals while the Dubai Govern-ment actively providing an integrated digital platform for managing infrastructure, information and assets. Governmental control over information and interaction of various elements of smart solutions are more emphasized. It is to be noted that UAE cities such as Dubai have more expatriate communities and floating population as compared to Singapore and this explains why a centralized control of information flow connecting smart solutions are very much necessary. From Indian perspective, more detailed levels of introspection are needed to percolate the objectives and broader guidelines of Smart City Plans which can be translated into realizable delivery models as more than 95% of funding and support will come from Public-Private partnerships. Table 2 provides a high level comparison of Smart City Plan priorities & focus areas as published by respective: governing bodies in India, Singapore and UAE. This is clear that both Singapore and UAE have come out with more focused guidelines and KPIs leveraging their current status of “digital readiness”, strong government control over civic infrastructure, expected people participation and progressive environment. Singapore model is more KPI driven with clear mandate on achievable by inspiring and enabling public private partnerships. UAE model is similarly made with lot of expert consultancies input with stress on government/state authorizes enabling centralized information control by “Smart City Platform”. Both approaches are valid given their national objectives and the configurable guidelines shall further be evolving as Smart City projects evolve.

VOLUME NO. 6 (2016), ISSUE NO. 09 (SEPTEMBER) ISSN 2231-1009
INTERNATIONAL JOURNAL OF RESEARCH IN COMPUTER APPLICATION & MANAGEMENT A Monthly Double-Blind Peer Reviewed (Refereed/Juried) Open Access International e-Journal - Included in the International Serial Directories
http://ijrcm.org.in/
49
TABLE 2: COMPARISON OF SMART CITY PLAN PRIORITIES & FOCUS: INDIA, SINGAPORE, UAE

VOLUME NO. 6 (2016), ISSUE NO. 09 (SEPTEMBER) ISSN 2231-1009
INTERNATIONAL JOURNAL OF RESEARCH IN COMPUTER APPLICATION & MANAGEMENT A Monthly Double-Blind Peer Reviewed (Refereed/Juried) Open Access International e-Journal - Included in the International Serial Directories
http://ijrcm.org.in/
50
6. SUGGESTED OPERATING MODELS AND IMPLEMENTATION FOCUS Implementation of SCPs in Indian cities with about 2-3 million approximate population similar to Singapore or say Dubai city, but with significantly less infrastruc-ture development levels will require high degree of coherence and coordination among different stakeholders such as utility companies, telecom operators, secu-rity surveillance services provider, municipal authorities, IT infrastructure providers and all others. Thus, Indian model of SCP implementation should be well planned with focused operational metrics, ecosystem business models with social entrepreneurship culture, co-creation of service packages depending upon local needs. As envisaged by Indian Government, specialized consultants are awarded the responsibility of providing expert guidance’s to various ULBs and municipal bodies to operationalize city specific Smart City Plans (SCPs). Given the guidelines and practical challenges that are expected in Indian context, following operational model is suggested while operationalizing SCPs [Fig 5].
FIGURE 5: PENTAGON MODEL FOR GOVERNANCE OF SMART CITY PROJECTS
At each municipal or ULB level a committee or governance body shall be instituted to manage the SCPs in five different key result areas as per this Pentagon model (shown as A, B, C, D and E) with specific measurable KPIs. City specific designated Consulting companies can ensure consistency in Guidelines & Government Directives [A] while a steering committee from ULB shall oversee PP partnerships [B] as per funding and other financial arrangements as mandated by Special Purpose Vehicle (SPV) model. (Chintan, et al) However, for effective Governance and Control of A and B, there ought to be sub committees or control groups with well-grained KPI objectives, tools and systems for timely reporting and measurement. For unified control and governance, a specialized entity within each SCP district or municipal area under respective ULB with identical and integrated KPIs and management platform [C] to be established who in turn will collaborate with select Managed Services Providers (MSPs) as stand-alone OTT (Over The Top) player [D] or an integrated Communication Services Provider (CSP) as managed services model [E]. Comprehensive yet uniform guidelines and measureable metrics shall be issued for Central Information Platform, MSPs and CSPs such as: [C] Unified Control Center & information repository operational guidelines – Cloud Data Centre [D] Operational guidelines & service performance metrics for Managed Services Providers [E] Business level “ecosystem” models & service metrics for Communication Services Providers KPIs and metrics at each level shall be addressed based on following key focus areas modeled in Fig 6.

VOLUME NO. 6 (2016), ISSUE NO. 09 (SEPTEMBER) ISSN 2231-1009
INTERNATIONAL JOURNAL OF RESEARCH IN COMPUTER APPLICATION & MANAGEMENT A Monthly Double-Blind Peer Reviewed (Refereed/Juried) Open Access International e-Journal - Included in the International Serial Directories
http://ijrcm.org.in/
51
FIGURE 6: MEASUREABLE METRICS TO ADDRESS KEY CHALLENGES IN SMART CITY PROJECTS
7. DISCUSSIONS Key success factors for SCP implementation in India will largely depend upon the level of citizen participation and project management capabilities at ULB/district levels by adapting to measurable KPIs as propose earlier. As per reported news, initially 20 Indian cities will be subjected to Smart City implementation plan as per published list of Indian Government. Involvement of Public private participation, especially the managed services providers (MSPs), suggested model needs further dimension of “maturity level” similar or same as what is proposed by European Commission Initiative, Smart Cities and Communities. [Fig 7]. Such an approach shall provide good insight to those factors that will impact the SCP implementation and potential scalability and maturity of ICT infrastructure needed.
FIGURE 7: MEASURING SMART CITY PLANS: OBJECTIVE KPIS FOR GOVERNANCE AND CONTROL MATURITY

VOLUME NO. 6 (2016), ISSUE NO. 09 (SEPTEMBER) ISSN 2231-1009
INTERNATIONAL JOURNAL OF RESEARCH IN COMPUTER APPLICATION & MANAGEMENT A Monthly Double-Blind Peer Reviewed (Refereed/Juried) Open Access International e-Journal - Included in the International Serial Directories
http://ijrcm.org.in/
52
From maturity level perspective, adopted Business model for public private partnership will play an accelerating role. As for as technology approach is concerned, it is highly desirable to have a seamless wireless infrastructure with robust information portability between managed services providers. In UAE and Singapore, unique identification of every citizen is already enabled such Emirates ID in UAE and Singapore Citizenship ID in Singapore. Apparently, both are smart cards with built in chip for information storage and have been mandatory for all Government services. E-Governance initiative’s in both countries are maturing rapidly with advanced information systems and connected citizens via m-governance mobile apps. In India, Unique ID for citizens is issued as Aadhaar card which are not digitally capable but simple cards with citizenship information. Digital information of citizens and their participation and co-creation of services within smart city ecosystem is what India should aim for at least to start with in those 20 cities to evolve a robust and integrated smart city model which can be emulated in subsequent cities on pan-India basis.
8. FURTHER RESEARCH In effect, Indian SCP maturity shall be fostered by reasonably good level of citizen partnership, social entrepreneurship business models, connected information ecosystems and KPI drive Managed Services providers’ services. Guidelines and high level performance measures need to be established accordingly especially based on technology approach and service model maturity expected. Since the concept of smart cities is still in nascent state globally, further research is required on how to evolve unified standards for smart communities, portability among SCPs, creating talented pool of workforce that are required to operate and maintain smart city services. Digitization of connected devices and services which will come from multiple sources can lead to aggregation of services by different Communication Services Providers. Mobility among connected citizens and connected devices powered by apps such as what applications will be available to citizens on the move should also be an integral part of SCP rollout. It is advisable to call for closer public discussions among SCP areas so as to align the smart citizen’s needs. Such research findings need to be concurred and included in the operational plans of SCPs. Good research and conclusive recommendations are required to mitigate lack of collaboration and coordination among various public departments and to encour-age adaptation of shared information tools among various SCP stakeholders. Further, best practices of international standards such as ISO 140001 Environmental safety or ISO or OHSAS standards need to be aligned with Smart City vision. Use of social media to proliferate smart city concept and measure level of public participation on co-creation of services provides ample scope for further research.
REFERENCES 1. A Guidebook to the Green Economy Issue 4: A guide to international green economy initiatives United Nations Division for Sustainable Development,
UNDESA. June 2013, Available from https://sustainabledevelopment.un.org/content/documents/916geguidebook4.pdf 2. Anthopoulos, L. and Tougountzoglou, T. (2012), “A viability model for digital cities: economic and acceptability factors”, in Reddick, C.G. and Aikins, S.K. (Eds),
Web 2.0 Technologies and Democratic Governance, Vol. 1, Springer, New York, NY, pp. 79-96. 3. Bonomi Santos, J., & Spring, M. (2013). New service development: managing the dynamic between services and operations resources. International Journal
of Operations & Production Management, 33(7), 800-827. 4. Berry, J.W. (2008), “Globalisation and acculturation”, International Journal of Intercultural Relations, Vol. 32 No. 4, pp. 328-336 5. Caragliu, A., Del Bo, C. and Nijkamp, P. (2011), “Smart cities in Europe”, Journal of Urban Technology, Vol. 18 No. 2, pp. 65-82 6. Demirkan, H., Harmon, R.R. and Goul, M. (2011), “A service-oriented web application framework”, IT Professional, Vol. 13 No. 5, pp. 15-21. 7. Deloitte report - 100 Smart Cities: Need for Innovation and Integrated Approach” workshop on 10th February, 2015 8. European Innovation Partnership on Smart Cities and Communities Operational Implementation Plan: First Public Draft, accessed 15 Mar 2016, http://ec.eu-
ropa.eu/eip/smartcities/files/operational-implementation-plan-oip-v2_en.pdf 9. Gartner Press release, Gartner identifies Top 10 Strategic technology trends for smart governance, accessed 12 Mar 2016, www.gartner.com/news-
room/id/2707617 10. Ministry of Urban Development, Government of India, Smart Cities: Mission Statement and guidelines, June 2015, accessed 12 Mar 2016,
http://smartcities.gov.in/writereaddata/SmartCityGuidelines.pdf 11. Strategic Opportunity Analysis of the Global Smart City Market, Frost & Sullivan, Published Aug 2013, http://www.frost.com/sublib/display-re-
port.do?id=M920-01-00-00-00 12. Smart cities - Ranking of European medium-sized cities. Available from: http://www.smart-cities.eu/download/smart_cities_final_report.pdf 13. Smart Dubai District Guidelines, March 2015, Available from: http://smartdubai.ae/districtguidelines/ 14. Smart Nation Singapore: Smart Ideas. One Smart Nation. Available from: http://www.smartnation-forbes.com/ 15. Schaffers, H., Komninos, N., Pallot, M., Trousse, B., Nilsson, M. and Oliveira, A. (2011), “Smart cities and the future internet: towards cooperation frameworks
for open innovation”, in Domingue, J.J., Galis, A., Gavras, A., Zahariadis, T., Lambert, D., Cleary, F., Daras, P., Krco, S., Müller, H., Li, M.-S., Schaffers, H., Lotz, V., Alvarez, F., Stiller, B., Karnouskos, S., Avessta, S., Nilsson, M. (Eds), The Future Internet, Springer, Berlin, pp. 431-446.
16. Vadgama CV, Khutwad A, Damle M, Patil S. Smart funding options for developing smart cities: A proposal for India. Indian Journal of Science and Technology. 2015; 8(34):1-12.
17. Washburn D, Sindhu U, Balaouras S, Dines RA, Hayes NM, Nelson LE. Helping CIOs Understand “Smart City” Initiatives: Defining the Smart City, Its Drivers, and the Role of the CIO. Forrester Research, Inc. Cambridge, MA. 2010.
18. World Economic Forum. (2015). The Global Information Technology Report 2015. Geneva. 19. World Economic Forum. (2015). Global Competitiveness Report 2015-2016. Geneva.

VOLUME NO. 6 (2016), ISSUE NO. 09 (SEPTEMBER) ISSN 2231-1009
INTERNATIONAL JOURNAL OF RESEARCH IN COMPUTER APPLICATION & MANAGEMENT A Monthly Double-Blind Peer Reviewed (Refereed/Juried) Open Access International e-Journal - Included in the International Serial Directories
http://ijrcm.org.in/
53
IMPACT OF TRAINING PROGRAMMES OF CENTRAL BOARD FOR WORKERS EDUCATION ON THE LABOUR FORCE OF KERALA
SHEEBA JOSEPH
ASST. PROFESSOR BASELIUS COLLEGE
KOTTAYAM
ABSTRACT Educating the working force has always been a challenge to a developing nation like India. The backbone of a nation is its working class people. The growth and development of a nation is measured to a great extent by the quality of it's work force who labors to build it up. Every civilized nation which has sensed this point has invested earnestly to train and educate its working class people. In India, this role has been taken up mainly by the Central Board of Workers Education (CBWE), a pioneer institution under the central Ministry of Labour& Employment. The Board has, over the years, successfully weaved out a special adult education pro-gramme that covers a whole range of skills and knowledge, which contribute to the harmonious development of a worker’s personality, his role in the society and the knowledge and attitudes required for such roles. The study brings out that, to a considerable extent the training programmes of CBWE have an impact on the quality of work life in organised, unorganised and rural labours sectors in Kerala.
KEYWORDS
CBWE, QWL, Training programmes, organized labour, unorganized labour.
INTRODUCTION he Central Board for Workers Education was registered in 1958 as an autonomous body under the societies Act 1860. It gets Grants- in- Aid from the Ministry of labour and Employment to operate its activities. Since its inception the Board has been engaging in the herculean task of training the working class throughout the country and preparing them as an organized, well trained and responsible group united in common interest for the socio economic
development of the country. In order to achieve their objectives, the institution provides various training programmes for the workers of the organized and rural sectors at national, regional and unit levels through a network of 50 regional and 9 sub- Regional directorates spread all over the country and an apex training institute in Mumbai named the Indian Institute of Workers Education. The Board also trains its own staff at the apex training centre. It has done a yeoman’s job to achieve its declared objectives all throughout these years. However, no serious study has been conducted so far to inquire into the effectiveness of these programmes and activities of the Board to bring about desirable behavioural changes in the life of the workforce in rural and urban areas. Hence it is proposed to conduct a study on the impact of the training programmes of the Board on the quality of work life of the unorganized labour in Kerala.
SIGNIFICANCE OF THE STUDY India is the second largest populated country in the world and is rich in human resources. Where there are more human resources, more production and devel-opment should follow and the country is likely to emerge as a developed nation in all respects. But this has not been happened in the Indian context. The large and illiterate workforce in India instead of being an asset to the nation became a burden to it and the country ended up in poverty unable to cater to the needs of its citizens. This paradox of India remaining a third world country when there were more resources and hands to work was a baffling situation for the policy makers. A critical survey of this pathetic situation pointed to the poor quality of the Indian workforce. The workers were largely illiterate, unrecognized and unaware of the modern training methods and quality improving techniques. They were exploited in all walks of life and were made to their rights and responsibilities as member of the society or of the trade unions. They never felt being involved in nations building process. Every scheme implemented requires a feedback analysis of its effectiveness to carry forward the schemes with more vigor. Though the training programs are conducted by the Central Board of workers Education across the length and breadth of India for the last 55 years, no in-depth study has been conducted to gauge its impact and its efficiency. The study is hence relevant in this context.
OBJECTIVES The overall objectives of the study are: To evaluate the effectiveness of the training programmes conducted by the CBWE in achieving its set goals. To identify the shortcomings, if any. To recommend suitable measures for the effective implementation of the training programs for optimum result.
METHODOLOGY The study is delimited to the work force of the organised, unorganized and rural sectors of the state of Kerala. The entire work force in Kerala is trained by the CBWE through its two Regional Directorates. Regional Directorate of Kochi covers the districts from Thrissur to Thiruvananthapuram including Lakshadweep’s. The rest of the districts in the state come under the Regional Directorate of Kozhikodu. For the purpose of study, samples are selected from the organized, unorganized and rural sectors from one district each from the North, Central and South region of Kerala. Sample survey method is employed for the study. Samples are proposed to be taken from each of these classes of workers on random basis from the selected districts. Structured questionnaire/ schedules will be used for collecting prim
HYPOTHESES H0: There is no significant relationship between Gender and effectiveness of programmes attended by the respondents. H0: There is no significant relationship between marital status and type of programme attended by the respondents.
LIMITATIONS Time has been an important limiting factor The method of data collection is questionnaire method and its inherent limitations are expected in the data collected.
T

VOLUME NO. 6 (2016), ISSUE NO. 09 (SEPTEMBER) ISSN 2231-1009
INTERNATIONAL JOURNAL OF RESEARCH IN COMPUTER APPLICATION & MANAGEMENT A Monthly Double-Blind Peer Reviewed (Refereed/Juried) Open Access International e-Journal - Included in the International Serial Directories
http://ijrcm.org.in/
54
ANALYSIS AND INTERPRETATION TABLE 1: GENDER OF THE RESPONDENTS
Source: Primary data Table 1 analyses the gender pattern of the respondents. As per the table it is clear that 68% of the respondents in organized sector are male and rest of the 28% are female. And 32% of the unorganized sector respondents are male and remaining 72% are female. Thus, it is observed that majority of the organized sectors are male whereas in unorganized sectors are female.
TABLE 2: MARITAL STATUS
Marital Status Organized % Unorganized & Rural %
Married 34 89.48% 41 66.13%
Unmarried 2 5.26% 14 22.58%
Divorced 0 0% 0 0%
Separated 0 0% 0 0%
Widowed 2 5.26% 7 11.29%
Others 0 O% 0 0%
Total 38 100% 62 100%
Source: Primary data Table 2 analyses the marital status of the respondents. As per table 2 it is found that, in organized sector 89.48 percent are married, 5.26 percent are unmarried and remaining 5.26 percent are widowed. Where as in the case of Unorganized and rural sector 66.13 percent are married respondents, 22.58 percent are unmar-ried while 11.29 percent are widowed. Thus, it is observed that majority of the respondents are married while minor section belongs to unmarried and remaining are widows.
TABLE 3: EDUCATIONAL QUALIFICATION OF THE RESPONDENTS
Education Organized % Unorganized & Rural %
<10 3 7.90% 20 32.26%
10 4 10.52% 14 22.58%
+2 6 15.79% 16 25.81%
Graduate 14 36.84% 9 14.52%
Post Graduate 8 21.05% 2 3.22%
Others 3 7.90% 1 1.61%
Total 38 100% 62 100%
Source: Primary data Table 3 analyses the level and pattern of educational qualification of the respondents. In organized sector 36.84 percent of the respondents are graduates, 21.05 percent are post graduates, 15.79 percent are plus two holders, 10.52 percent are matriculation passed, 7.90 percent respondents have other qualification and remaining 7.90 percent are below 10 qualifications. And in case of Unorganized and rural sector 32.26 percent are below 10 qualifications, 25.81 percent are plus two scholars, 22.58 are possess matriculation, 14.52 percent are graduates, 3.22 percent are post graduates and remaining 1.61 percent have other qualification. Thus, it is observed that in organized sector most of the respondents are graduate where as in case of unorganized and rural sector majority of the respondents are below matriculation qualification.
TABLE 4: EFFECTIVENESS OF PROGRAM
Effectiveness of Program Organized % Unorganized & Rural %
Highly Effective 19 50% 46 74.19%
Moderate Effective 18 47.36% 16 25.81%
Not Effective 1 2.64% 0 0%
Total 38 100% 62 100%
Source: Primary data Table 4 analyses the effectiveness of programs provided for the respondents. As per the table it is clear that in organized sector, 50 percent of the total respondents are of the opinion that the training programs are highly effective, 47.36 are of the opinion that it is moderately effective and 2.64 percent opined that it is not effective. Where as in case of the unorganized and rural sector 74.19 percent of the respondents are of the opinion that training effective and remaining 25.81 percent is highly are of the opinion that it is moderately effective.
TABLE 5: TYPE OF PROGRAM ATTENDED BY THE RESPONDENTS
Program Organized % Unorganized & Rural %
QWL 10 26.32% 2 3.34%
SCSP 1 2.63% 4 6.56%
STSP 1 2.63% 6 9.68%
Empowerment 10 26.32% 15 24.29%
Special Seminar 9 23.68% 22 35.58%
Re-training 3 7.89% 3 4.41%
Others 4 10.53% 10 16.14%
Total 38 100% 62 100%
Source: Primary data Table 5 reveals the type of programattended by the respondents. As per table 5 it is found that 26.32 percent of the organized sector are attend the Quality of Work Life programand empowerment program, 23.68 percent of respondents attend the special seminars, 7.89 percent attend the re-training program and 2.63 percent attend the SCSP and STSP program. As in case of unorganized and rural sector, 35.58 percent of the total respondent attend the special seminars, 24.29 percent attend the empowerment program, 16.14 percent attend the other training program, 9.68 percent attend the STSP program, 4.41 percent attend the re-training program and remaining 3.34 percent attend the quality of work life program. Thus, it is clear that in organized sector majority of the respondents attended the employee empowerment program where as special seminars were mostly conducted among unorganized and rural sectors.
Gender Male % Female %
Organized 17 68% 21 28%
Unorganized & Rural 8 32% 54 72%
Total 25 100% 75 100%

VOLUME NO. 6 (2016), ISSUE NO. 09 (SEPTEMBER) ISSN 2231-1009
INTERNATIONAL JOURNAL OF RESEARCH IN COMPUTER APPLICATION & MANAGEMENT A Monthly Double-Blind Peer Reviewed (Refereed/Juried) Open Access International e-Journal - Included in the International Serial Directories
http://ijrcm.org.in/
55
TABLE 6: SHORTCOMINGS IN TRAINING PROGRAMOF CBWE
Sl. No District Inadequate Duration Lack of awareness Improper methodology Lack of follow up
1 Ernakulam Organised 7 1 1 6
Unorganised 10 0 0 5
2 Kollam Organised 7 0 0 4
Unorganised 19 0 0 0
3 Thrissur Organised 6 0 0 4
Unorganised 14 1 1 14
Source: Primary data 63 respondents have the opinion that the duration of training programmes are inadequate. 33 respondents are having the opinion that lack of follow up is the major shortcoming of the traningprogrammes. For 2 each of the respondents, lack of awareness and improper methodology is the major problem. Inadequate duration and lack of follow up are the major drawbacks of the training programmes of CBWE. HYPOTHESIS Hypothesis – 1 H0: There is no significant relationship between Gender and effectiveness of programmes attended by the respondents. H1: There is significant relationship between Gender and effectiveness of programmes attended by the respondents. Test statistics: Chi Square Test
TABLE 7: RESULT OF CHI-SQUARE TEST
Test statistics Degree of Freedom Level of Significance Computed Value of 2 Table value H0 Accepted or Rejected 2 1 0.05 9.1572 3.841 Rejected
Since the calculated value of 2 is greaterthan the Table value, it is significant. Hence the null hypothesis is rejected at 5% level of significance and we may conclude
that there is significant relationship between Gender and effectiveness of programmes attended by the respondents. Hypothesis – 2 H0: There is no significant relationship between marital status and type of programme attended by the respondents. H1: There is significant relationship between marital status and type of programme attended by the respondents. Test statistics: Chi Square Test
TABLE 8: RESULT OF CHI-SQUARE TEST
Test statistics Degree of Freedom Level of Significance Computed Value of 2 Table value H0 Accepted or Rejected 2 4 0.05 4.6912 9.468 Accepted
Since the calculated value of 2 is less than the Table value, it is not significant. Hence the null hypothesis may be accepted at 5% level of significance and we may
conclude that there is no significant relationship between marital status and type of programmes attended by the respondents.
FINDINGS The major findings of the study are:
Majority of the respondents from organized sectors are male whereas that of unorganized sectors are female.
Majority of the respondents are married while minor section is unmarried and remaining are widowed.
In organized sector most of the respondents are graduate where as in case of unorganized and rural sector majority of the respondents are below matricu-lation qualification.
In organized sector majority of the respondents attended the employee empowerment programme where as special seminars were mostly conducted among unorganized and rural sectors.
In organized sector the programmes conducted are highly effective in the opinion of 50% respondents while it is moderately effective as per 47% of respond-ents. But more than 74 % of the respondents from organized sector opines that the programmes attended are highly effective.
The respondents are of the opinion that CBWE is effective in imparting the training programmes.
Inadequate duration and lack of follow up are the major drawbacks of the training programmes of CBWE.
SUGGESSIONS Majority of the programmes conducted are either employee empowerment programme or special seminars. Other type of programmes should also be given
importance. The duration for training programmes should be increased in order to make it more effective. Follow up measures should be undertaken by the board. Better results can be achieved only if there is proper follow up.
CONCLUSION Quality of work life is a process in which the organization recognizes their responsibility for excellence of organizational performance as well as employee skills. Training implies constructive development in such organizational motives for optimum enhancement of quality of work life of the employees. The Scheme of Workers Education aims at achieving the objectives of creating and increasing awareness and educating the workforce for their effective participation in the socio-economic development of the country. The study reveals that the training programmes of CBWE are helping the labour force both in organized and unorganized sectors which resulted in the up gradation of their skills and knowledge. Highly effective training Methodology, very good attitude of Trainer’s, highly effective training content and adequate facilities offered by the CBWE helps it to achieve its set goals.
REFERENCES 1. Bernadin. John, Human Resource Management-an experimental approach, New Delhi. Tata McGraw Hill Ltd, 2004. 2. Guptha.shashi K, Joshi Raossy, Human Resource Management, kalyani publications, New Delhi – 110002, 2013. 3. [email protected] 4. Michel Armstrong (2001), “A Handbook of Human Resource Management Practice”, Kogan Page, 8th Editon. 5. P. Subba Rao (2009), “Essentials of Human Resource management and Industrial Relations”, Himalaya Publication House, 3rd Revised & Enlarged Edition. 6. Seyed Mehdi Hosseini, GholamrezaMehdizadehJorjatki (2010) “Quality of work life(QWL) and Its relationship with performance”, University Of Firouzkou-
hBranch, Tehran. WEBSITES 7. [email protected] 8. www.researchersworld.com 9. www.theijm.com

VOLUME NO. 6 (2016), ISSUE NO. 09 (SEPTEMBER) ISSN 2231-1009
INTERNATIONAL JOURNAL OF RESEARCH IN COMPUTER APPLICATION & MANAGEMENT A Monthly Double-Blind Peer Reviewed (Refereed/Juried) Open Access International e-Journal - Included in the International Serial Directories
http://ijrcm.org.in/
56
ONLINE BUYING BEHAVIOUR AMONG TEENAGERS - AN INDIAN PERSPECTIVE
ABHINAV GUPTA ASST. PROFESSOR SRM UNIVERSITY
SONEPAT
ABSTRACT The development of electronic commerce, in particular electronic retailing, sets numerous challenges for both retailers and customers. The ease and availability of the electronic retailing environment can result in impulsive online purchasing. Impulsive buying behaviour refers to the tendency of consumers to make a purchase spontaneously, instantaneously and without prior consideration. Generally, in the Croatian context, the issue of impulsive buying is not sufficiently represented in scientific papers, and this is particularly true in the context of electronic retailing. Although this chapter focuses on the rather narrow part of online buying behaviour, it sought to provide a better understanding of purchasing behaviour of Croatian consumers in an electronic commerce environment. The research contributes to the existing literature by extending the understanding of consumer purchasing behaviour and by providing new insights into purchasing intentions of Indian teen-ager’s consumers in an online shopping environment
KEYWORDS online buying, teenagers buying behaviour.
INTRODUCTION he online buying has become a full arena as big as retail store buying and now is at times preferred for means of convenience and utility gained through various deals available. India has a large internet savvy population that is not only accessing the internet but also buying online. With a revolution in the very basics of transaction from a physical store format to a non-store one, the retail industry has begun to understand the indispensability of the internet
as a medium of transaction. However, the rate of diffusion and adoption of the new phenomenon amongst consumers is still relatively low. Trust on online transactions is one of the key barriers to vendors succeeding in online transactions. A lack of trust discourages consumers from participating in online buying. With the internet advancing new opportunities, it is important to understand the factors that generate trust of Indian consumers in the online buying system. The purpose of this paper is to explore the determinants of trust in online buying behavior of consumers. This paper is a theoretical attempt at conceptualizing ‘‘trust’’ as a construct, in the context of online buying and testing it empirically. The objective of the study is to explore what prompts customers to buy online among teens. Bakos (1991), describes an e-market as ‘‘... an inter-organizational information system that allows the participating buyers and sellers to exchange information about prices and product offerings’’. Meuter et al. (2000) have defined e-retailing in terms of the internet market as ‘‘a virtual realm where products and services exist as digital information and can be delivered through information-based channels’’. Jones et al. (2000) said ‘‘... carrying out of retailing activities with customers that leads to an exchange of value, where the parties interact electronically, using network or telecommunications technologies’’. We may define online-retailing as use of an electronic via media through which the customer and the marketer may enter into a transaction for sale and purchase, so as to benefit both the parties in the long run. The rapid usage rate of buyers transacting online has been due to advances in technology, to consumer characteristics (both demographic as well as psychographic) and to situational influences. The objective of the study is to explore the factors that influence teenagers ’s online buying decision and to establish their causal impact, if any.
LITERATURE REVIEW Much of the early research on internet shopping behavior has focused on predicting the type of consumer who is likely to use the internet to search for and buy products. Bellman et al. (1999) investigated several predictors for whether an individual will buy online. These authors concluded that demographic variables such as income, education and age have a modest impact on the decision of whether to buy online. They found that the most important determinant of buying on the web was previous behavior such as earlier online purchases. “Once people are online, whether they buy there and how much they spend has more to do with whether they like to buy online and whether the time they have for buying is limited” (Bellman et al., 1999, p. 37). This is consistent with Forrester Research that concluded “demographic factors such as age, race and gender don’t matter anywhere near as much as the consumers’ attitudes toward technology” (Modahl, 2000). In examining the relationship between age and internet shopping motivations, Dholakia and Uusitalo (2002) found that younger consumers reported more hedonic and utilitarian benefits of online shopping than older consumers. They did not measure online search or buying behavior, only the perceived benefits of shopping. The relative impact of demographic factors such as age when compared with attitudinal or motivational factors has only been addressed by a small number of studies. Korgaonkar and Wolin (1999) found that motivational factors as well as age and gender impacted the likelihood of online purchasing. In their study, older males were the group that had the highest online purchase behavior. This is consistent with the results of Donthu and Garcia’s (1999) research, who found that older internet users were more likely to buy online when compared to younger users, even though the younger users had more positive attitudes towards internet shopping. Joines et al. (2003) found that web usage motivations significantly predicted both online purchasing and online information searching for products or services. It is often stated that impulsive buying behaviour provides hedonic rewards (Hausman, 2000). According to Kacen, Hess, and Walker (2012), product characteristics, particularly the hedonic nature of product, have a 50% greater influence on impulse buying than do retailing factors. The findings of the positive impact of hedonic consumption tendencies have been reported for fashion and apparel industries in context of both physical and e-impulse buying (Park, Kim, Funches, & Foxx, 2012). The general logic behind these findings is that consumers tend to view shopping as action involving more than sole purchasing of product. Rather, the impulsive shopping releases emotions such as cheer, jealousy, fear, passion and joy. Furthermore, involvement was found to be an important variable impacting consumers’ tendencies to make an impulse purchase (Liang, 2012). Accordingly, the needs, values and interests of individuals determine the relevance of products for individuals. Cognitive efforts invested by individuals to gather information about products can generate product-specific impulse buying tendency. In that context, impulse purchases of new products differ from impulse purchases of other types of products. Harmancioglu, Finney, and Joseph (2009) emphasise that the knowledge of new product and consumer desire for excitement and esteem promote impulse buying intention and behaviour.
RESEARCH METHODOLOGY This research is exploratory in nature and has been done the national capital region of Delhi with data being gathered through a structured questionnaire to understand what triggers the teenagers to engage in online purchases and what do they most prefer to purchase through ecommerce websites. The collected data was analysed through MS excel and statistical software SPSS.
RESULTS A total of 128 teenagers between the age group 13 -19 years responded to the questionnaire from the 200 requested to do so representing a response rate of 64%
T

VOLUME NO. 6 (2016), ISSUE NO. 09 (SEPTEMBER) ISSN 2231-1009
INTERNATIONAL JOURNAL OF RESEARCH IN COMPUTER APPLICATION & MANAGEMENT A Monthly Double-Blind Peer Reviewed (Refereed/Juried) Open Access International e-Journal - Included in the International Serial Directories
http://ijrcm.org.in/
57
REASONS FOR ONLINE PURCHASES TABLE 1
1 Impulsiveness associated with new products 32%
2 Ease of information about new products 28%
3 Comparative analysis & Review availability 22%
4 Deals that can be sought 10%
5 Convenience of buying without visiting the store 8%
KIND OF PRODUCTS PURCHASED TABLE 2
1 Cellphones 47%
2 Mobile accessories 22%
3 Books 12%
4 Branded Sportswear 11%
5 Watches 8%
MOTIVATING FACTORS FOR PURCHSES ONLINE TABLE 3
1 Speed with which information can be sought 25%
2 Security of purchases done 23%
3 Ease of delivery 22%
4 Content of web page 18%
5 Transparency and diversity of products available 12%
CONCLUSIONS The development of electronic commerce, in particular electronic retailing, sets numerous challenges for both retailers and customers. The ease and availability of the electronic retailing environment can result in impulsive online purchasing. Impulsive buying behaviour refers to the tendency of consumers to make a purchase spontaneously, instantaneously and without prior consideration. Generally, in the Croatian context, the issue of impulsive buying is not sufficiently represented in scientific papers, and this is particularly true in the context of electronic retailing. Although this chapter focuses on the rather narrow part of online buying behaviour, it sought to provide a better understanding of purchasing behaviour of Croatian consumers in an electronic commerce environment. The re-search contributes to the existing literature by extending the understanding of consumer purchasing behaviour and by providing new insights into purchasing intentions of Indian teenager’s consumers in an online shopping environment. These findings may be useful to online retailers, as well as marketers and practitioners, to recognise and understand the features of online purchasing behaviour in order to convert casual online visitors to buyers. Additionally, online retailers should design their web sites to encourage impulsivity in online buying behaviour. In particular, the potential impulse purchases can be increased by applying some external trigger cues, such as sales, promotions, purchase ideas, suggested items, etc. However, the findings should be considered in the light of their limitations
REFERANCES 1. Bakos, J.Y. (1991), ‘‘A strategic analysis of electronic marketplaces’’, MIS Quarterly, Vol. 15 No. 3, pp. 295-310 2. Bellman, S., Lohse, G. and Johnson, E. (1999), “Predictors of online buying behavior”, Communications of the ACM, Vol. 42 No. 12, pp. 32-8. 3. Donthu, N. and Garcia, A. (1999), “The internet shopper”, Journal of Advertising Research, Vol. 39 No. 3, pp. 52-9. 4. Harmancioglu, N., Finney, R. Z., & Joseph, M. (2009). Impulse purchases of new products: an empirical analysis. Journal of Product & Brand Management,
18(1), 27–37. 5. Hausman, A. (2000). A multi-method investigation of consumer motivations in impulse buying behaviour. Journal of Consumer Marketing, 17(5), 403–426 6. Jones, S., Wilkens, M., Morris, P. and Masera, M. (2000), ‘‘Trust requirements in e-business’’, Communications of the ACM, Vol. 43 No. 12, pp. 81-87 7. Kacen, J. J., Hess, J. D., & Walker, D. (2012). Spontaneous selection: The influence of product and retailing factors on consumer impulse purchases. Journal
of Retailing and Consumer Services, 19(6), 578–588 8. Korgaonkar, P. and Wolin, L. (1999), “A multivariate analysis of web usage”, Journal of Advertising Research, Vol. 38 No. 1, pp. 7-21. 9. Liang, Y.-P. (2012). The relationship between consumer product involvement, product knowledge and impulsive buying behavior. Procedia – Social and
Behavioral Sciences, 57, 325–330 10. Meuter, M.L., Ostrom, A.L., Roundtree, R.I. and Bitner, M.J. (2000), ‘‘Self-service technologies: understanding customer satisfaction with technology based
service encounters’’, Journal of Marketing, Vol. 64, July, pp. 50-64. 11. Modahl, M. (2000), Now or Never: How Companies Must Change to Win the Battle for the Internet Consumer, Harper Business, New York, NY. 12. Park, E. J., Kim, E. Y., Funches, V. M., & Foxx, W. (2012). Apparel product attributes, web browsing, and e-impulse buying on shopping websites. Journal of
Business Research, 65(11), 1583–1589.

VOLUME NO. 6 (2016), ISSUE NO. 09 (SEPTEMBER) ISSN 2231-1009
INTERNATIONAL JOURNAL OF RESEARCH IN COMPUTER APPLICATION & MANAGEMENT A Monthly Double-Blind Peer Reviewed (Refereed/Juried) Open Access International e-Journal - Included in the International Serial Directories
http://ijrcm.org.in/
58
WEST BENGAL - A TOURIST DESTINATION: COMPARATIVE ANALYSIS OF BENGAL TOURISM BUSINESS MODEL WITH KERALA & GUJARAT
SANJANA MONDAL ASST. PROFESSOR
CALCUTTA BUSINESS SCHOOL KOLKATA
ABSTRACT
West Bengal is a unique state of India that is gifted with all tourism ingredients to address the need of all type of tourists. With the Himalayan range on the north to Bay of Bengal in the south, lush green forest and wide range of historic evidence & Pilgrim destinations; West Bengal has varied option of tourism products to offer to its tourists. But in the context of tourism market Bengal is still a backbencher as compared to the other Indian states that have marched way ahead of Bengal. Tourism being one of the major contributing industries, its sustainable development is extremely important for an economy to capitalize. This paper is a study report on Bengal’s marketing mix inadequacies and finding and mixing consistent attributes to identify West Bengal as a preferred destination and distinguish it through positive image building, i.e. how tourists perceive West Bengal in their minds. A comparison of Tourism Business Model of West Bengal is done with that of Kerala and Gujarat to critically analyze the gap in Marketing West Bengal tourism.
KEYWORDS
West Bengal, tourism ingredients, tourism marketing mix, positive image building, tourism business model, Kerala, Gujarat.
INTRODUCTION ourism being one of the major contributing sectors in the economy today has gained immense importance worldwide. All the economy worldwide is behind tapping the potential of this sector as growth of tourism sector can act as a supplement to declining Industrial Sector (UNWTO Annual Report- A year of recovery 2010). As tourism is a gamut of a number of ancillary trade and industry, focusing on the development of this sector can lead to the improvement
of the economy as a whole. Nature is a gift of God and it is heterogeneously distributed. All the state, countries and destinations are struggling to en cash its natural possession in the form of highlighting its tourism products. But most of them fail to market the product due to lack of insights and myopic policy decisions. Tourism is considered either as a product or as a service while actually it is a combination of both product and service in a same cauldron. Creating, communicating and delivering value tourism added with professionalism in anticipation with the need & preference of the tourist, to be properly iden-tified so as to reach the goal of acquiring the heart mind and market share.
METHODOLOGY Tourism business model of West Bengal, Kerala and Gujarat is compared on the basis of the tourism policy of each state derived from the secondary source (internet). The Vision, Mission and Objectives of each state is critically analyzed to understand the motive of each state behind marketing their tourism products. The tourist’s inflow data of each state is refereed to infer their position in Indian tourism market. Some primary data is also collected to show the need of the tourist as a consumer of tourism sector to justify the gap in the Business Model.
LITERATURE SURVEY
TABLE 1: COMPARISON OF THE VISION STATEMENT OF THE STATES OF KERALA & GUJARAT WITH THAT OF BENGAL
Kerala Gujarat West Bengal
Vision of the 3 states
Tourism becomes a vibrant and signifi-cant contributor to the sustainable de-velopment of the state of Kerala. Source: Kerala Tour-ism Policy 2012, De-partment of Tour-
ism, Government of Kerala.
To position Gujarat as a vibrant tourist destina-tion, with an emphasis on improving visitor expe-rience, livelihood linkages, environmental con-cerns and enhancing investment opportunities, thus catapulting tourism as one of the most im-portant economic drivers, leading to sustainable development and inclusive growth in the State.
Source: Tourism Policy for the State of Gujarat (2015-2020)
West Bengal will aim to become a preferred tourism and tourism re-lated investment destination by leveraging its unique geographical setting along with its various tourism related assets to promote tour-ism in an integrated manner which will not only bring in more invest-ment and further the socio-economic goals of the Government, but also ensure that all these are in conformity with the relevant acts, rules and regulations relating to environmental protection. The over-all aim will be to see that the tourism sector contributes towards im-proving the quality of life of people in general.
Source: West Bengal Tourism Policy, 2008, Government of West Bengal, Department of Tourism.
Framework of Kerala Tourism Model: based on this whole tourism strategy of the state is formulated.
T

VOLUME NO. 6 (2016), ISSUE NO. 09 (SEPTEMBER) ISSN 2231-1009
INTERNATIONAL JOURNAL OF RESEARCH IN COMPUTER APPLICATION & MANAGEMENT A Monthly Double-Blind Peer Reviewed (Refereed/Juried) Open Access International e-Journal - Included in the International Serial Directories
http://ijrcm.org.in/
59
FIGURE 1: KERALA TOURISM MODEL
Source: A report on Kerala’s Approach to Tourism Development: A Case Study Ministry of Tourism Government of India and CRISIL
FRAMEWORK OF GUJARAT TOURISM MODEL Gujarat’s strategy of marketing their tourism product is based on the motto of starting with segments as marketing is complex and each segment has its own flavor. Based on their objective of: 1. Positioning themselves among top five tourist destination(State) in India 2. Providing innovative form of tourism products likes adventure, cruise, event-based, inland waterways, medical. 3. Segmenting the tourists & targeting each segment with unique offerings. 4. Developing tourism packages and products to augment tourist stay and encourage repeat visits 5. Promoting tourism products segment-wise and building PPP framework of business.
FIGURE 2: THE PICTORIAL REPRESENTATION OF GUJARAT TOURISM BUSINESS BASED ON THEIR CURRENT POLICY IS SHOWN
FRAMEWORK OF WEST BENGAL TOURISM BUSINESS MODEL The current Bengal tourism is based on the following perceived model proposed on the basis of the objectives of Bengal Tourism Policy. The basic objectives of the Tourism Policy of West Bengal will be as follows: 1. To improve the market share of West Bengal in the inbound international tourism segment and also to have a dominant share in the domestic tourism
market. 2. To promote responsible and sustainable tourism through the integrated development of the infrastructure and not sporadic, stand alone and fragmented
development. 3. To develop a portfolio of tourism products by utilizing its unique ecological, historical, cultural, religious, wildlife, sports, shopping, health care, educational
and human assets. 4. To facilitate tourism by all segments, particularly the middle and lower income tourists, by making the tourist spots in the State more easily accessible
through “single window facility” at the State capital and at the district headquarters and on the internet. 5. To fully tap the direct and indirect economic benefits of tourism by “broad basing” tourism activities. This will be done by creating more employment
opportunities and by dispersing tourism into the hinterland which will further the socio-economic goals of the Government. 6. To proactively develop partnership with the governmental and nongovernmental agencies including the private sector (Public-Private-Partnership model)
(PPP) to take advantage of complementary capital and intellectual assets to promote tourism. 7. To increase the revenue earnings of the State and the foreign exchange reserves of the country.
Source: West Bengal Tourism Policy, 2008, Government of West Bengal, Department of Tourism.

VOLUME NO. 6 (2016), ISSUE NO. 09 (SEPTEMBER) ISSN 2231-1009
INTERNATIONAL JOURNAL OF RESEARCH IN COMPUTER APPLICATION & MANAGEMENT A Monthly Double-Blind Peer Reviewed (Refereed/Juried) Open Access International e-Journal - Included in the International Serial Directories
http://ijrcm.org.in/
60
PROPOSED AS PERCEIVED BY THE AUTHOR ON THE BASIS OF THE TOURISM POLICY OBJECTIVES OF WEST BENGAL
FIGURE 3: 5U MODEL OF BENGAL TOURISM BUSINESS
COMPARISON TABLE:1 COMPARISON OF THE TOURISM BUSINESS OF KERALA, GUJARAT & BENGAL
To gradually minimize the gap in the model of operation to that of service delivery and maximize customer satisfaction a proper marketing plan need to be developed. This marketing plan matches the different form of tourism opportunities provided by a state to the right target market of the tourist to whom it is intended and the way of providing those opportunities. Developing a marketing plan around those components helps in 1. Ensuring that the offerings are satisfying the desires of the tourists or not 2. Identifying the strategies to help the target tourists to access the opportunities provided. 3. Understanding how to best market opportunities based on how tourists relate themselves to that potential market 4. Identify domestic and international competitors and strategies to diversify to the unique tourism opportunities the destination/state/country has. Developing a marketing plan requires to think in terms of using diverse approaches to communicating about the tourism business of the state (i.e., marketing mix). Marketing Mix includes the four Ps (i.e., product, price, place and promotion) of business marketing (Perreault and McCarthy 2002) and three Ps (i.e., programming, people, and partnership) of tourism marketing (Mill and Morrison2002). The Tourism Business of the 3 states Kerala, Gujarat and Bengal is compared on the basis of 8 P’s of tourism marketing mix to identify Bengal’s marketing mix inadequacies as in the context of tourism market Bengal is still a backbencher as compared to the other Indian states that have marched way ahead of Bengal in terms of tourist inflow.
Comparison Basis KERALA GUJRAT BENGAL
1. FOCUS Tourists and community development Branding Product and Economic Benefit
2. STRATEGY Hospitality S-T-P Developing a portfolio of tourism products
3. USP Illiteracy rate & global presence Home state of PM Rich culture and historic evidence, gastro-nomic delicacies
4. COST Very High Medium Low
5. ACCESSIBILITY Distance from major market. Infrastruc-tural issues pertaining to air transport
New air strips and facilitating the com-mencement / strengthening air opera-tions at major tourist destinations
Easily accessible through “single window facility” at the State capital and at the dis-trict headquarters.
5 U
of
Tou
rism
De
velo
pm
en
t
UTTPADON
UNNAYAN
UTTSADHON
UDDESH
UPASATTO
V
GENERATION Tourism products & services
DEVELOPMENT Tourism Market and infrastructure
BOOST INVESTMENT Public-Private-Partnership model
PROMOTION Improve the market share
REVENUE GENERATION Tap the direct and indirect eco-nomic benefits of tourism
Policy Planning Initiative Results

VOLUME NO. 6 (2016), ISSUE NO. 09 (SEPTEMBER) ISSN 2231-1009
INTERNATIONAL JOURNAL OF RESEARCH IN COMPUTER APPLICATION & MANAGEMENT A Monthly Double-Blind Peer Reviewed (Refereed/Juried) Open Access International e-Journal - Included in the International Serial Directories
http://ijrcm.org.in/
61
TABLE 2: MARKETING MIX COMPARISON FOR TOURISM BUSINESS OF KERALA, GUJARAT & BENGAL
Marketing Mix Comparison KERALA GUJARAT BENGAL
1. PRODUCT natural environment Innovative forms of tourism. Develop portfolio of unique tourism product
2. PRICE HIGH MEDIUM LOW
3. PLACE Kerala is positioned as a visible global brand in tourism Distance from major market. Infrastructural issues pertain-ing to air transport. Distribution channel: a. Internet & using social marketing
tools b. Tie up with global institution c. Innovative campaigns & road
shows d. Film & media
Infrastructural development for tour-ist information, transport services, accommodation and way-side ameni-ties. Opening new air strips Distribution channel: a. Internet b. Fairs and festivals c. social networking, d. blogs, e. virtual tourism, etc f. Celebrity Endorsement
Tourist spots in the State are easily accessi-ble through “single window facility” at the State capital and at the district headquarters and on the internet. Distribution channel: a. Celebrity Endorsement b. Tourism fair & Exhibition c. Advertisement Campaign d. On website & brochures
4. PROMOTION To market Kerala as a visible global brand in domestic and international markets
Creating Kerala Convention Promotion Bureau (KCPB)
To make Gujarat one amongst the top five tourist States of India in terms of local, national and international tour-ist footfalls by 2025;
to become a preferred tourism and tourism related investment destination by leverag-ing its unique geographical setting
5. PEOPLE quality human resources in tourism and hospitality
tourism-specific skill development leading to gainful employment and self-employment especially for the lo-cal populace
Not specified or considered
6. PROCESS To create enabling environment & hu-man resource in tourism for the state and the country.
Development of diverse tourism packages and products to augment tourist stay and encourage repeat vis-its
Integrated development of the infrastruc-ture and not sporadic, stand alone and frag-mented development.
7. PROGRAMMING World-class, yet local visitor experi-ence. Tourism sector attracts investment, which will be sensitive to the natural environment
Attract the MICE segment, by creat-ing convention/exhibition facility and support infrastructure; leverage innovative forms of tourism such as adventure, cruise, event-based, inland waterways, medical and others
Utilizing its unique ecological, historical, cul-tural, religious, wildlife, sports, shopping, health care, educational and human assets.
8. PARTNERSHIP P-P-P Model P-P-P Model P-P-P Model
RECOMMENDATIONS 1. Instead of concentrating on the production, product and finally selling orientation of business West Bengal should concentrate on marketing and societal
orientation for planning its tourism business. 2. Most of the objectives pertaining to the vision a mission of the state tourism policy is based on creating and developing a new product. Instead the state
should focus on the matching ability of its offerings with the profile of the tourists. 3. If employment generation is the main concern of the state it could be done in developing tourism research institutes engaging individuals in different forms
of tourism research. Training institutes to be built to train professionals for all the ancillary industries supporting tourism. This will lead to a sustainable growth to the tourism sector of the state.
4. Social Media to be used for community formation among tourists who are dedicated towards environmental conservation and hence sustainable form of tourism growth and development could be achieved.
CONCLUSION West Bengal being the unique state of India that is gifted with all tourism ingredients can address the need of all type of tourists. The present model of tourism development of West Bengal to be amended and more professional approach of tourism marketing concentrating on the tourists to be developed for its growth in long run and built a positive image in the mind of its target tourists. Though the research is concluded on the basis of the tourism policy of Bengal that is available on the internet and on certain reports and articles on current tourism development, hence there are certain limitations. Following some of the tested successful Model like Kerala, Bengal should concentrate on better mixing its marketing ingredients for its tourism business. Certain professional and expert alterations in the business plan and policy by leveraging its unique geographical setting along with its various tourism related assets could lead West Bengal to fulfill its border vision of becoming a preferred tourism and tourism related investment destination.
REFERENCES 1. Annual Report, United Nations World Tourism Organization (UNWTO) A year of recovery 2010 2. Article, A Futuristic Perspective on West Bengal’s Tourism, Subhasish Chakraborty, Travel writer Industry, pp. 1-15, 3. Article, A Strategic Perspective of Kerala Tourism Model, Sushant S Srivastava, SIES College of Management, Marketing & Strategy Articles, Published on 05
July 2012. 4. Babu, Sutheeshna, (2008), Spatial Dimensions of Tourism in India A macro-level perspective. In S. Babu, S. Mishra and B.B. Parida (ed.), Tourism Development
Revisited: Concepts, issues and challenges, Response Books- Sage Publishers, New Delhi, pp. 285-305. 5. Berno, T. and Bricker, K. (2001): Sustainable tourism development: the long road from theory to practice, International Journal of Economic Development
3(3), pp. 1-18. 6. Cronin, L. (1990): A strategy for tourism and sustainable developments, World Leisure and Recreation 32(3), pp. 12-18. 7. Dodds, R. & Butler, R. (2010): Barriers to implementing sustainable tourism policy in mass tourism destinations, Tourismos, Vol. 5, No.1, pp. 35-54. 8. Government of India, India Tourism Statistics (2010), Ministry of Tourism, Market Research Division, New Delhi, India. 9. Government of India, Indian Tourism Statistics at a Glance (2011), Department of Tourism, New Delhi, India. 10. Government of India, Indian Tourism Statistics at a Glance (2012), Department of Tourism, New Delhi, India.

VOLUME NO. 6 (2016), ISSUE NO. 09 (SEPTEMBER) ISSN 2231-1009
INTERNATIONAL JOURNAL OF RESEARCH IN COMPUTER APPLICATION & MANAGEMENT A Monthly Double-Blind Peer Reviewed (Refereed/Juried) Open Access International e-Journal - Included in the International Serial Directories
http://ijrcm.org.in/
62
11. IITTM- ICC Report, Travel and Tourism Industry in India: Looking East, Travel India 2011, Indian Institute of Tourism and Travel Management (An Organisation of Ministry of Tourism), Gwalior, India.
12. Kerala Tourism Policy 2012, Department of Tourism, Government of Kerala. 13. Report, Kerala’s Approach to Tourism Development: A Case Study Ministry of Tourism Government of India and CRISIL. 14. Sherap Bhutia, American International Journal of Research in Humanities, Arts and Social Sciences, 6(3), March-May, 2014, pp. 239-246 15. Tourism Policy for the State of Gujarat (2015-2020) 16. West Bengal Tourism Policy, 2008, Government of West Bengal, Department of Tourism. WEBSITES 17. Article, West Bengal to launch new tourism policy, published in Business Standard, December 11, 2014, Last Updated at 20:04 IST, retrieved on 13th April,
2016 http://www.business-standard.com/article/news-ians/west-bengal-to-launch-new-tourism-policy-114121101157_1.html. 18. Article, West Bengal to unveil new tourism policy in January, published in Economic Times, retrieved on 13th April, 2016 http://articles.economictimes.indi-
atimes.com/2015-11-27/news/68604770_1_new-tourism-policy-bengal-global-business-summit-wbtdc. 19. Banglar Mukh, the official portal of the West Bengal State Government, retrieved on 10th April, 2016 from http://wb.gov.in/portal/banglarMukh 20. The official portal of Government of West Bengal, Department of Tourism, retrieved on 10th April, 2016 from http://www.wbtourism.gov.in/

VOLUME NO. 6 (2016), ISSUE NO. 09 (SEPTEMBER) ISSN 2231-1009
INTERNATIONAL JOURNAL OF RESEARCH IN COMPUTER APPLICATION & MANAGEMENT A Monthly Double-Blind Peer Reviewed (Refereed/Juried) Open Access International e-Journal - Included in the International Serial Directories
http://ijrcm.org.in/
63
e-COMMERCE IN INDIA: A BOON OR BANE
DR. GURINDER KAUR ASST. PROFESSOR
JAIN INSTITUTE OF MANAGEMENT & ENTREPRENEURSHIP JAMSHEDPUR
ABSTRACT
E-commerce in India came into existence with the advent of globalization and it grows rapidly in the years ahead with increasing internet penetration and availa-bility of budget smart phones. E-Commerce is giving a lot of competition to today’s businesses. Over last few decades the popularity of e-commerce has tremen-dously increased due to its quick and convenient way of exchanging goods and regional and global services. The present study is a conceptual survey which aims to analyze the present scenario of e-commerce in India. For this, CRISIL database is used. Considering the present scenario, the study throws light on the prospects and challenges faced by e-commerce in India. The study reported that India’s online retail industry has recorded a compound annual growth of over 56 percent in the 5 years i.e. increase from Rs 15 billion revenues in 2007-08 to Rs 139 billion in 2012-13. Online ticketing holds a major share (65 percent in 2013) of e-commerce in India. With the advent of e-commerce, no doubt standard of living of the people and the satisfaction level of customers have improved but it has become a major threat for physical retailers. Moreover, if used excessively, it can harm the environment and the health of the future generation.
KEYWORDS e-commerce, smartphones.
I. INTRODUCTION ith the advent of Internet and its commercialization since 1994 a new medium of commerce popularly known as ‘E-Commerce (EC)’ rapidly emerged in the modern global economy. E-Commerce can be defined as sale or purchase of goods and services conducted over computers and mobile phones with the connection of internet network or through TV channels by various modes specifically designed for the e-commerce. In other words, it means
the business being transacted over the electronic medium of internet. The first e-commerce site in India was rediff.com. It was one of the most trafficked portals for both Indian and non-residents Indians. The past 2 years have seen a rise in the number of companies enabling e-commerce technologies and the internet in India (Chanane and Goel, 2012). Industries like travelling, banking, media, advertising, retailing have utilized the benefits being provided by E-commerce. These industries have added E-commerce as another channel for increasing sales and customer satisfaction. E-commerce combined with social media tools have become a very potent way of being in touch with the customers. e-COMMERCE MARKET IN INDIA Online Ticketing: Ticketing for air, rail, bus travel, hotels/ cruises, travel packages, movies, events –Does not include captives. Online ticketing holds 63
percent share of the total e-commerce in India. (MakeMyTrip, Redbus, BookMyShow) Online Retail: Retail products sold through the online route. It comprises 17 percent of the total e-commerce industry in India. (Jabong, Myntra, Firstcry) Online marketplaces: Platforms where sellers and buyers transact online –Does not include classifieds. It holds only one percent share of the total internet
industry in India. (Flipkart, eBay, Amazon.in) Online deals: Deals are purchased online by consumers and the redemption payments may/ may not happen online. It holds only 1 percent share in total e-
commerce industry in India. (Groupon, mydala TimesDeal) Online portals: Includes car, job, property and matrimonial portals (Gaadi.com, Naukri.com, Magicbricks) E-commerce industry is growing with leaps and bound in India. In this paper, an attempt has been made to analyze the present scenario of the E-Commerce Sector in India. Based on the analyses, the study further aims to find out the prospects and the challenges that are likely to be faced by E-Commerce Industry in India. For achieving these objectives, the study is divided into five sections. Section-I introduces the topic. Section- II reviews the existing literature. Section- III throws light on the present scenario of e-commerce industry in India. Section- IV discusses the prospects and challenges of e-commerce industry in India. Section- V concludes the discussion. A lot of research work has been done in the past on the E-commerce industrial development, it challenges, opportunities, growth scenario in India. Some of which is discussed in the proceeding section of the study.
II. REVIEW OF EXISTING LITERATURE Hariharaputhiran (2012) attempts to analyse the challenges and opportunities of E-Commerce in India. The study examined that the challenges faced by E-com-merce industry in India are ethical issues, perceptions of risk at e-service counters, challenges for e-commerce education and legal systems etc. The opportunities provided by e-commerce include e-learning and education, e-business, e-commerce integration, e-insurance, e-banking etc. Terzi (2011) highlighted the impact of e-commerce on international trade and employment. It reported that the volume of international trade has a direct relation with e-commerce i.e. it has increased via e-commerce. The countries open to imports from high-income economies will benefit from knowledge spillovers. In addition, electronic commerce is expected to have a positive and negative effect on job creation. Tiwari and Singh (2011) reported the impact of e-commerce on environment. For this, a sample of 500 people in Noida was collected. The results revealed that majority of the people are aware of the impact of e-commerce on global warming and on their health. Still they are in the habit of using the same. The study suggested that Government, Businesses, and Individuals altogether should be responsible for doing something about reducing negative impacts of e-commerce on environment. Ray (2011) evaluated the emerging trends of e-commerce in India. Based on that, it reported the challenges and opportunities to e-commerce industry in India. Though e-commerce has enabled the international trade and boosted the global economy, but it has some challenges also which include e-commerce legislation. The government should come forward to provide a legal framework for e-commerce so that while domestic and international trade are allowed to expand their horizons, basic rights such as privacy, intellectual property, prevention of fraud, consumer protection etc are all taken care of. Bhattacharya and Mishra (2015) discuss the Evolution, Growth and Challenges in E-commerce Industry in India. The study reported that the factors responsible for the growth of e-commerce in India are growth of internet usage, use of plastic money, increasing use of devices like mobile phone, laptops, note books etc, growth of disposable income, additional attractive services and schemes provided online. Challenges faced by this sector are privacy, data security, IPR laws.
III. PRESENT SCENARIO OF E-COMMERCE INDUSTRY IN INDIA E-Commerce industry is growing rapidly in India. Among the whole world, majority of internet users are in Asia. Internet users in Asia alone are 48.2 percent and in rest of the world is 51.8 percent. Among the total internet users i.e. 1622084293 in Asia in 2015, 41.6 percent are from China followed by India i.e. 23.1 percent. Internet users in India have increased from 5000000 in 2000 to 375000000 in 2015 (Internet World Stats). Chart I shows the Internet Penetration rate in India. The Internet Penetration Rate corresponds to the percentage of the total population of a given country or region that uses the Internet. It shows that the internet penetration in India increased from 0.10 percent in 1998 to 30 percent in 2015 i.e. and increase of almost 30 percent over the past 17 years. A sharp increase has been noticed from 2012 to 2015. It is surprising to note that penetration rate has increased by almost 19
W

VOLUME NO. 6 (2016), ISSUE NO. 09 (SEPTEMBER) ISSN 2231-1009
INTERNATIONAL JOURNAL OF RESEARCH IN COMPUTER APPLICATION & MANAGEMENT A Monthly Double-Blind Peer Reviewed (Refereed/Juried) Open Access International e-Journal - Included in the International Serial Directories
http://ijrcm.org.in/
64
percent in the past 3 years i.e. from 11.4 percent in 2012 to 30 percent in 2015. The main reason for this is that there is huge competition in the mobile phone market. Companies have started supplying the smart phones at cheaper rates. So, most of the people have started using Smartphone due to its cheaper rates and internet data packages are also available at the competitive prices. It is due to this reason that the internet users have increased over the past few years.
CHART I: INTERNET PENETRATION RATE IN INDIA
Source: Internet World Stats
It can be noted form Chart-II that online retail market size has shown considerable improvement over the past few years in India. It has increased by Rs 450 billion in the past 7-8 years. India’s online retail industry has recorded a compound annual growth of over 56 percent in the 5 years It has increased from Rs 15 billion in 2007-08 to Rs 504 billion in 2015-16. A rapid increase is seen from 2012-13 to 2015-16. Market share has increased from 139 billion in 2012-13 to Rs 504 billion in 2015-16 i.e. an increase by Rs 315 billion in the past 3 years. The main reason for that is the increase in the internet connections and the awareness of the customers towards the e-commerce services. The evidence of the former is already explained in chart-I.
CHART II: ONLINE RETAIL MARKET SIZE IN INDIA
Source: Internet World Stats
Local retailers are adversely affected with the increasing use of e-commerce services by the common people. Chart- III throws light on the same. Net addition to the retail stores has decreased by more than 50 percent in the past four years. It has decreased from 39 in 2009-10 to 15 in 2012-13. It is disheartening to mote that only one new store was added in 2011-12. E-commerce has disturbed the business of the retailers. Most of the people feel it convenient to shop online as a wide variety of products is available online. It saves the time, energy and cost to shop online. Products of all ranges i.e. of low price and of very high price; of different brands and of different styles are available online which may not be possible for a single retailer to keep under a single roof.
CHART III- NET STORE ADDITION
Source: CRISIL Research
1998 1999 2000 2001 2002 2003 2004 2005 2006 2007 2009 2010 2012 2015
Penetration Rate 0.10% 0.30% 0.50% 0.70% 1.60% 2.10% 3.60% 4.50% 3.60% 3.70% 7.00% 8.50% 11.40% 30.00%
0.00%
5.00%
10.00%
15.00%
20.00%
25.00%
30.00%
35.00%
2007-08 2008-09 2009-10 2010-11 2011-12 2012-13 2013-14 2014-15 2015-16
Rs Billion 15 24 38 58 91 139 224 334 504
0
100
200
300
400
500
600
Ru
pe
es
in B
Illio
n
2009-10 2010-11 2011-12 2012-13
Net Store Addition 39 23 1 15
0
5
10
15
20
25
30
35
40
45

VOLUME NO. 6 (2016), ISSUE NO. 09 (SEPTEMBER) ISSN 2231-1009
INTERNATIONAL JOURNAL OF RESEARCH IN COMPUTER APPLICATION & MANAGEMENT A Monthly Double-Blind Peer Reviewed (Refereed/Juried) Open Access International e-Journal - Included in the International Serial Directories
http://ijrcm.org.in/
65
IV. PROSPECTS AND CHALLENGES OF E-COMMERCE INDUSTRY IN INDIA PROSPECTS OF E-COMMERCE INDUSTRY IN INDIA a) E-Business: E-business has recorded a rapid growth nowadays. E-business is a convenient mode of reaching the costumers and has a huge scope of covering
widespread costumers. Even small entrepreneurs by making the website of their company are recording huge growth. Online stock trading has also seen tremendous growth with the introduction of e-commerce.
b) Shopping has become very convenient nowadays. One can shop for a huge range of products sitting at home with just a click on mobile or computer. Over the past year Jabong, Snapdeal, Amazon, eBay, Myntra, shopclues etc. have seen a rapid growth in categories such as mobile handsets, jewellery, fashion apparel, books, gift items and other items
c) Not only new products manufactured by the company, even a common man can put an advertisement of second hand products and can get a good deal for the same. It has become convenient for those also who are searching for second hand products. A wide range of items are covered under it like house, car, dresses, bike, books, accessories, mobile etc.
d) Distance education through e-learning has become a boon for those who cannot go to college regularly. Even by sitting at distant place and by continuing the current job, one can pursue additional degrees which can help in job promotion in many ways.
e) It has become convenient for making online payments and online registration in any of the government and private department like payment of internet bill, insurance charges, registration at passport office etc. Online payment is faster, more user-friendly and definitely more secure than the traditional processes. Therefore, it is more attractive to the users. At the same time, it incurs less cost and requires fewer resources than traditional methods and is therefore more profitable for the company also.
f) E-banking has also provided relief to the busy businessman and other people. All transactions can be done without standing in a queue. It saves a lot of time, energy and resources.
g) Electronic Commerce has the Potential to increase revenue by creating new markets for old products, creating new information-based products, and estab-lishing new service delivery channels to better serve and interact with customers
CHALLENGES OF E-COMMERCE INDUSTRY IN INDIA a) Delay in delivery and lack of proper courier services in some areas also make customers frustrated and one of challenge faced by e-commerce. b) Web transaction takes place with credit card, but credit card itself is not safe. Anyone who can transfer the data of credit card on the web is not sure about
the salesman identity. c) Even today, many of the Indian customers prefer purchasing a product by touching and having a look at it. They feel more comfortable and trustworthy in
buying products directly from shop. Moreover, majority of Indian rural population are unaware of internet and its uses. d) E-commerce companies are offering Cash on Delivery (COD) as one of mode of payment for the buyers. It is seen that majority of the customers denied to
make the payment at the time of delivery of the product. 30%-50% of buyers are also taking advantage of this while purchase of any product and service over internet. COD has been introduced to counter the payment security issues of online transaction but this mode has been proving expensive to companies
e) Visual pollutions influence human minds and psychology. It has become very convenient to do shopping on mobile phone. Due to competition, various online shopping applications provide discounts and introduce mega sales time to time. These apps keep sending notifications regarding the sales which may divert the attention of the people. Infact, it has become addiction nowadays. People waste a lot of time searching for good deals and browsing for their product.
f) Wireless technologies are being used extensively nowadays in intranet and Internet. This has exposed the user to harmful electromagnetic radiations which may cause serious diseases like cancer.
g) A large number of towns and villages remain out of access for E-commerce companies due to the absence of proper all weather roads. h) Major e-commerce giants like flipkart, amazon, jabong, myntra, etc. have possed a serious problem to the new entrants. The presence of these giants is
placing huge challenges before the new entrants. As a result, many of the new entrants remain unprofitable even after a few years of operation.
V. CONCLUSION E-Commerce is spreading widely in India. the internet penetration in India increased from 0.10 percent in 1998 to 30 percent in 2015 i.e. and increase of almost 30 percent over the past 17 years. online retail market size has increased by Rs 450 billion in the past 7-8 years. It has increased from Rs 15 billion in 2007-08 to Rs 504 billion in 2015-16. A major change has occurred from 2012-13. Net addition to the retail stores has decreased by more than 50 percent in the past four years. It has decreased from 39 in 2009-10 to 15 in 2012-13. Prospects of E-Commerce include E-business, E- banking, E-learning, E- Insurance, etc. Some of the challenges facing e-commerce industry are delay in delivery, visual pollution, harmful radiations causing serious diseases like cancer, difficulty for new firms to enter, cash on delivery costly for the company etc.
REFERENCES 1. Bhattacharya, Sourabh and Bibhuti Bhusan Mishra (2015), ‘Evolution, Growth and Challenges in E-commerce Industry: A Case of India’, SUMEDHA Journal of
Management, Vol.4, No.1, Jan-Mar. 2015. 2. Chanana, Nisha and Sangeeta Goele (2012), ‘Future of E-Commerce in India’, International Journal of Computing & Business Research. 3. CRISIL Press release as on February 24, 2014, Mumbai, Online retailing will triple to Rs 500 billion in 3 years 4. Das, Kishore Kumar and Affreen Ara (2015), ‘Growth of E-Commerce in India’, International Journal of Core Engineering & Management (IJCEM) Volume 2,
Issue 4, July 2015. 5. Dholakia, Pinky (2015), ‘Prospects of E-Commerce and its future Implications in India’, 6. Hairharaputhiran, S (2012), ‘Challenges and Oppprotunities of E-commerce’, International Journal of Marketing, Financial Management and Management
Research, Vol 1, No. 3, March. 7. Herekar, Prakash M. (2014), ‘E-Commerce in India – Problems and Prospects’, ASM’s International E- journal of ongoing Researh on Management and IT. 8. Kaur, Harjot and Daljit Kaur (2015), ‘E-Commerce in India – Challenges and Prospects’, International Journal of Engineering and Techniques - Volume 1 Issue
2, Mar - Apr 2015. 9. Manav Aggarwal (2014), ‘Escalating Development of E-Commerce in India’, International Journal of Scientific Research, Vol 3, No. 11, November. 10. Nuray Terzia (2011), ‘The impact of e-commerce on international trade and Employment’, Procedia Social and Behavioral Sciences, Vol. 24, pp. 745–753. 11. Prospects and Challenges’, Computer Engineering and Intelligent Systems, Vol 2, No. 5. Research Hub – International Multidisciplinary Research Journal
Volume-2, Issue-2, February-2015 12. Sarbapriya Ray (2011), ‘Emerging Trend of E-Commerce in India: Some Crucial Issues, 13. Sridhar Vaithianathan (2010), ‘A review of e-commerce literature on India and research agenda for the future’, Electron Commer Res, No.-10, pp. 83–97. 14. Tivari and Singh (2011), ‘E-Commerce: Prospect or Threat for Environment’, International Journal of Environmental Science and Development, Vol. 2, No. 3,
June 2011 WEBSITES 15. http://www.crisil.com 16. http://www.internetworldstats.com

VOLUME NO. 6 (2016), ISSUE NO. 09 (SEPTEMBER) ISSN 2231-1009
INTERNATIONAL JOURNAL OF RESEARCH IN COMPUTER APPLICATION & MANAGEMENT A Monthly Double-Blind Peer Reviewed (Refereed/Juried) Open Access International e-Journal - Included in the International Serial Directories
http://ijrcm.org.in/
66
CHALLENGES OF E-SERVICE ADOPTION AND IMPLEMENTATION IN ALLAHABAD
DR. AARTI ARORA ASST. PROFESSOR
UNITED INSTITUTE OF MANAGEMENT ALLAHABAD
AMIT KUMAR
ASST. PROFESSOR UNITED INSTITUTE OF MANAGEMENT
ALLAHABAD
ABSTRACT Allahabad is the most populous city in Uttar Pradesh. The level of e-government services in Allahabad is still very low and the government needs to improve in the area of ICT provision including telecommunication and infrastructure. In a bid to create awareness and promote National e-governance plan, flagship scheme and e- services delivery, officials of district administration and health department are working round the clock. Officials believe that e-services should be designed in such a way that they provide end-to-end services by reducing the need for manual intervention or involvement. The city of Allahabad is among the largest cities of Uttar Pradesh and situated at the confluence of three rivers- Ganga, Yamuna and the invisible Saraswati. However, the issue is how long Allahabad and other developing cities will keep avoiding the adoption and implementation of e-Service despite the facts that the same e-Services have been adopted and implemented successfully to some extent in other metro cities in India. As USA is ready to take steps to develop Allahabad, we can see benefits associated with these e-Services.
KEYWORDS e-services, e-government services.
INTRODUCTION he recent trends in world globalization has been promoted by the advancement in information technology specially with what internet and telecommuni-cation have brought, both developed and the few less developed nations like in this concept both national and state level, the thinking is that strategic use of internet and telecommunication be sufficient in providing better e-services to the public in all developing cities in India. In other words, faced with the
persistent demand of e-services by the population not only at national and state level but also at local level government level in both developed and less developed nations of the world, could such e-services provision be extended to the public? The concept of e-government emerged in the late 1990s despite that the history of e-government as a tool in government establishment could be traced back to the origin of computer itself and just like other e-platform concept such as e-commerce, the term e-government was born out of the internet world. (Ake Gronlund and T.A Horan) A few decades ago, e-government as a term and as an identified activity was unknown before now and because of the rapid growth, there is a possible future direction for the research domain. (Heeks Richard and Savita Bailur) It is important to know that” e-government initially began as an intra-governmental commu-nication tool” According to’ Schwester, R. ‘(2009), shortly before government organizations developed their websites with useful information for their citizens. Online transactions started soon after the information of government websites were understood, following the private sector’s focus on electronic government.
E-SERVICE The term e-Service represents content centred and interactive internet based customer service, driven by the customer and integrated with related organisational customer support processes and technologies with the goal of strengthening the customer provider relationship” Moreover, [Sukasame, N. (2004)] argued that e-service as a term is not only about “electronic” and “service” but the true e-service operation may be where part if not all interaction between service provider and customer is done via internet. This was also substantiated by Surjadjaja, H., Ghosh, S., & Antony, F. (2003). Though, the governments of developed nations have realised that the provision of essential public services cannot be shouldered alone and the obstacles in demand patterns coupled with the limitation in resources have brought about the need for Public Private Collaboration [Roztocki, N and Weistroffer, H.R. (2008)]. Also, given the advent of global and competitive markets, many governments have come to accept that there is the need to create and sustain competitive advantage via cost reduction, product differentiation or augmentation, while providing these public services. Many companies have seen their profits doubled through the use of online services in their operation and a typical example is Hewlett Packard (HP) which is transforming their after sales business into a profit generating e-service business unit(Ruyter Ko De, Martin Wetzels and Mirella Kleijnen (2001)). Despite the fact that e-governance is still a bit low in some countries in Asia region [Gajendra Sharma, Xi Bao and Wang Qian (2012)], there are still lessons to be learnt from the region’s e-Service adoption success, for example the e-Perolehan system (a procurement system) in Malaysia [Kaliannan, M., & Awang, H. (2010)]. This was designed to assist government in service procurements among other objectives such as ensuring transparency (Ruyter Ko De, Martin Wetzels and Mirella Kleijnen (2001)) and accountability in all procurements by government. “E-Perolehan is the new procurement system allows the Government ministries to elec-tronically select items to be procured from the desktop, initiate an electronic approval process and also create, submit and receive purchase orders, delivery orders and other related documents electronically” Although this quote was found in the article written by but the authors were quoting [Roland T. Rust and P.K Kannan (2003)]. The initiative was a success even with a major challenge which is how an appropriate and context tailored strategy could be established in order to guide the project. Another e-Service success from the Asia region is the government investment in China on e-government by the Chinese central government which established over 90 portals with many regional and municipal websites and this is also supported by that the investment assisted China to take over as the largest online population from Japan and they are now only just behind the USA in global ranking [Roztocki, N and Weistroffer, H.R. (2008)].
BACKGROUND E-Government service implementation has begun in lower middle income countries like India but the lack of evidence and research has (Roztocki, N and Weistroffer, H.R. (2008)) hindered a clear framework for the adoption as expected, in fact e-government activities are actually very low in the country [Mundy, D and Musa, B (2010)]. It is well known fact that from 1960 upward, the use of information systems in transforming and improving operations in both public and private organisations has been a success and moving from paper-based operations (manual) to computerised based one has been part of the transformation witnessed as sited by [Kolsaker, A, and Lee-Kelley, L. (2009)] face to face approach and the use of telephone in doing business transactions with citizens has been faced out to some extent through the use of online based services. The city of Allahabad is among the largest cities of Uttar Pradesh and situated at the confluence of three rivers- Ganga, Yamuna and the invisible Saraswati. The meeting point is known as Triveni and is especially sacred to Hindus. The earlier settlements of the Aryans were established in this city, then known as Prayag”
T

VOLUME NO. 6 (2016), ISSUE NO. 09 (SEPTEMBER) ISSN 2231-1009
INTERNATIONAL JOURNAL OF RESEARCH IN COMPUTER APPLICATION & MANAGEMENT A Monthly Double-Blind Peer Reviewed (Refereed/Juried) Open Access International e-Journal - Included in the International Serial Directories
http://ijrcm.org.in/
67
Prayagasya Praveshshu Papam Nashwati Tatkshanam. All sins are cleaned with entry in Prayag (the ancient name of modern time Allahabad) PRAYAG is one of the historic and mythological cities of India with glorious past and present. It continues to enjoy the distinction of being a place of haunting and lasting memories. It is a city of mixed culture of Hindu, Muslims, Jains and Christians However, the issue is how long Allahabad and other developing cities will keep avoiding the adoption and implementation of e-Service despite the facts that the same e-Services have been adopted and implemented successfully to some extent in other metro cities in India. As USA is ready to take steps to develop Allahabad, we can see benefits associated with these e-Services. Despite the rapid growth of E-readiness in most countries in the world, from the study conducted by the [World Atlas,], the Middle East and Africa currently serve a total of about 1m internet broadband subscribers, a small sum compared with the 53m in Asia and 42m in the Americas. Low levels of investment and limited sources of financing constitute the primary reasons for the slow development. With public and private funds for infrastructure development lacking, even broadly available technologies remain too costly for widespread adoption. It is good to know that focusing on customers is the main eservice fundamental philosophy, that is, to be able to meet customers’ needs in order to make both markets and revenue grow. Technology has a vital role to play in e-service as it is seen as enabler and businesses can exploit the opportunity provided through technological enhancement to gain market competitive advantage, this will open new forms of customer focused and e-services support services that are more convenient for many users [Roland T. Rust and P.K Kannan (2003)].
RESEARCH METHODOLOGY Qualitative research as described by Castellan, Catherine M. (2010) “a researcher identifies with postpositivism” where researchers have an understanding of the research and interacts with respondents on what is being researched. This method will be used in this study where an online survey using questionnaires was sent to various respondents in e-Service adoption and implementation in Allahabad such as government officials, students, non-governmental agencies, private busi-ness owners through email and social media technologies. There are other methods like case studies, quantitative methods but the authors decided to use qualitative survey questionnaires We considered the distance from Allahabad to Naini and Jhunsi and there are often difficulties meeting with widely dispersed respondents. In this study, the questionnaires were designed to help in data collection and the questions are into two categories namely: demography which were used and validated by, [Susanto, T.D and R. Goodwin (2010)] and the second part of the questionnaires is about e-Service adoption and implementation whose questions have been used and validated by. Data were collected between 5th March to 29th March 2016 and a total of 120 responses were collected with details in finding section below.
FINDINGS From the recent survey conducted between 5th March and 29th March 2016 for the purpose of this paper the results show that the 120 participants who participated in the questionnaires have now heard of e-services but the implementation is not forth-coming as expected. They acknowledged that there are many challenges in e-service adoption and implementation in Allahabad. DATA ANALYSIS This section will highlight the main findings in the survey conducted between 5th March and 29th March 2016 and provide indications from the opinions of the participants towards the challenges facing e-services adoption and implementation in Allahabad. Questionnaires were used in the study. At 29th March 2016 we have 120 respondents, among which 72 respondents (60%) are from Central Allahabad (main City), 7 respondents (6%) from North Allaha-bad region, 3 respondents (3%) from Eastern Allahabad region, 15 respondents (13%) from Western Allahabad, 12 respondents (10%) from Southern Allahabad, 6 respondents from Naini region and 2 respondents (2%) are from Jhunsi region.
61%
6%
3%
13%
10%
5%
2%
REGIONAL ANALYSIS
Central Allahabad (72)
Allahabad North(7)
Allahabad East(3)
Allahabad West(15)
Allahabad South(12)
Naini, Allahabad(6)
Jhunsi, Allahabad(2)

VOLUME NO. 6 (2016), ISSUE NO. 09 (SEPTEMBER) ISSN 2231-1009
INTERNATIONAL JOURNAL OF RESEARCH IN COMPUTER APPLICATION & MANAGEMENT A Monthly Double-Blind Peer Reviewed (Refereed/Juried) Open Access International e-Journal - Included in the International Serial Directories
http://ijrcm.org.in/
68
As we can see and deduce from the analysis shown above, more participants in the age range 20-39 participated in the survey with 61%. This may be due to the fact that they might have more idea and knowledge about e-government services than other age ranges. Out of the 120 respondents, 84 (70%) were males and 36(30%) females.
The qualification level of the respondents may affect the opinions among all the respondents because of different level of education. The education and current occupation as used and validated by. In this study, 8% have less than high school degree, 10% high school degree or equivalent, 12% some college but no degree, 35% bachelor degree and 34% post graduate degree which is the highest in the survey. Government employees are 31%, non-government employee is 8%, private employee 22%, business owner is 6%, student is 25%, and others 6%.
Less Than 20 Yrs15%
20-39 Yrs61%
40-59 Yrs13%
60 Yrs and Above11%
AGE ANALYSIS
Less Than 20 Yrs
20-39 Yrs
40-59 Yrs
60 Yrs and Above
0
5
10
15
20
25
30
35
40
STUDENTS OWN BUSINESS GOVERNMENT EMPLOYEES
PRIVATE EMPLOYEES
OTHERS
Students, 30
Own Business, 11
Government Employees, 37
Private Employees, 29
Others, 9
OCCUPATION ANALYSIS
Students
Own Business
GovernmentEmployees
Private Employees
Others
Male70%
Female30%
GENDER ANALYSIS
Male
Female

VOLUME NO. 6 (2016), ISSUE NO. 09 (SEPTEMBER) ISSN 2231-1009
INTERNATIONAL JOURNAL OF RESEARCH IN COMPUTER APPLICATION & MANAGEMENT A Monthly Double-Blind Peer Reviewed (Refereed/Juried) Open Access International e-Journal - Included in the International Serial Directories
http://ijrcm.org.in/
69
Students and government employees are the highest number of respondents says that these groups tend to also be the people most likely to use e-government services. Therefore, this result is not surprising. In the e-Government services, awareness question, only 13% are not aware of e-government services which are useful to know when the time comes to promote new services. Most people in the survey result that have used the e-services did so to apply for a passport (54%) and 28% have used several e-services.
ALLAHABAD AND E-SERVICE Allahabad is the most populous city in Uttar Pradesh. The level of e-government services in Allahabad is still very low and the government needs to improve in the area of ICT provision including telecommunication and infrastructure. In a bid to create awareness and promote National e-governance plan, flagship scheme and e- services delivery, officials of district administration and health department are working round the clock. Officials believe that e-services should be designed in such a way that they provide end-to-end services by reducing the need for manual intervention or involvement. Officials of various departments would be holding a workshop cum seminar at CMET, Allahabad on May 14 to discuss e-services, e-district projects, e-services delivery and its enabling as well as challenges being faced by districts for implementing e-service delivery. Although the coming of mobile communication into the city in 2001 looked promising as it has increased the economic strength of the city because of rapid growth in the sector. However, the majority of the population have limited or no access to the internet due to lack of availability of network infrastructures. Another critical issue is the frequent interruption of electricity in the city, which means that citizens cannot rely on an e-service being available and the government will have to increase their efforts to combat the problem if Allahabad wants to be identified as one of the best city in e-government services provision to the citizens in the world.
Below 10th, 9
10th, 1212th, 14
Graduate, 42 Post Graduate, 41
0
5
10
15
20
25
30
35
40
45
BELOW 10TH 10TH 12TH GRADUATE POST GRADUATE
EDUCATIONAL ANALYSIS
Below 10th
10th
12th
Graduate
Post Graduate
Heard of It, 37
Never Heard of It, 11
Aware, 38
Very Aware, 34
0
5
10
15
20
25
30
35
40
HEARD OF IT NEVER HEARD OF IT AWARE VERY AWARE
E - SERVICES AWARENESS ANALYSIS
Heard of It
Never Heard of It
Aware
Very Aware

VOLUME NO. 6 (2016), ISSUE NO. 09 (SEPTEMBER) ISSN 2231-1009
INTERNATIONAL JOURNAL OF RESEARCH IN COMPUTER APPLICATION & MANAGEMENT A Monthly Double-Blind Peer Reviewed (Refereed/Juried) Open Access International e-Journal - Included in the International Serial Directories
http://ijrcm.org.in/
70
CHALLENGES OF E-SERVICE ADOPTION AND IMPLEMENTATION There are various challenges facing the adoption and implementation of e-Service in Allahabad as obtained and analysed by the survey results, higher scorers are Trust issue, Finance, Usability Issues, Leadership and Management - Corruption, Cultural difference, Lack of information security and privacy and others as indi-cated in Fig.
According to the survey and as shown in Fig., we will be discussing the first four most important barriers affecting adoption and implementation of e-Service in Allahabad, they are: Finance (38%): This is essential in e-Service implementation as the project might not see the light of the day if there is no money for the implementation. Finance issues could come from the high cost of ICT equipment, and of the setting up and maintenance of telecommunication infrastructure across a large variable terrain country. Financial security matters in e-government projects [Gilbert D. and Balestrini P. (2004)]. Looking at the Allahabad perspective involved in this study, this barrier ranked 3rd and no one is sure of exactly how much money the government has reserved for e-government projects in the yearly budget as there is no documentation. One issue with finance in projects in Allahabad is even if money is allocated, due process is not always followed in the disbursement of the fund due to high corruption Moreover, leaders don’t account for what they do in government in Allahabad, and there are no checks and balances, the legislative arm
0
5
10
15
20
25
30
35
40
45
50
EXTREMELY SATISFIED SATISFIED NEUTRAL DISSATISFIED EXTREMELY DISSATISFIED
Extremely satisfied, 9
Satisfied, 49
Neutral, 29
Dissatisfied, 24
Extremely Dissatisfied, 3
E-SERVICES USAGE SATISFACTION LEVEL ANALYSIS
Extremely satisfied
Satisfied
Neutral
Dissatisfied
Extremely Dissatisfied
0
5
10
15
20
25
30
35
40
45
50
CHALLENGES OF E-SERVICES

VOLUME NO. 6 (2016), ISSUE NO. 09 (SEPTEMBER) ISSN 2231-1009
INTERNATIONAL JOURNAL OF RESEARCH IN COMPUTER APPLICATION & MANAGEMENT A Monthly Double-Blind Peer Reviewed (Refereed/Juried) Open Access International e-Journal - Included in the International Serial Directories
http://ijrcm.org.in/
71
of government who could challenge the executive is seen merely as a rubber-stamping body and there is belief that they may be bribed to ignore abnormalities [ Joel Barkan (2009)]. Usability Issues (33%): This is another serious challenge facing the adoption and implementation of e-Service in Allahabad because of high levels of illiteracy. Usability aims to make sure users are satisfied with the e- Service usage, this needs to be considered when designing a website as it should be accessible to all prospective users irrespective of their background. Cultural contexts for all intended users is also put into consideration when designing websites as this will go a long way to encourage the usage of these services and it is advisable that World Wide Web Consortium (W3C) guidelines should be followed during website design [Hillier, M. (2003)] Mobile services have now presented their own challenges that go beyond the basics of website design, and usability on a personal computer. Leadership and Management – Corruption (35%): The support of leaders and management in implementation and adoption of e-government services is highly important in achieving the desirable success but in present Allahabad that might be difficult as many of the top management staff in various government offices, agencies and ministries are highly corrupt. Corruption is as prominent in the country as power is being abused for personal gain among officials paying bribes to contractors, influencing and the manipulation of elections happens. Setting up the anti-corruption agency to curb corruption is not really effective as they take orders from government rather than being independent body. Trust Issues (40%): The security of the e-Service portals will be of the great benefit not only to the users but the government and private organisations who venture into provision of e-Service to the populace. As shown from the study, trust issues came second in the league of the challenges facing e-Service adoption and implementation in Allahabad with 40%, are of the opinion that the e-Government services must be built on trust among the stakeholders like government, citizens, NGOs and private organizations. People might not be willing to participate in using an e-Service portal if they feel the security of their data will be breached. Furthermore, privacy principles must be respected and accepted by the e-Services providers in order for the required benefits in implementing the projects to be achieved.
RESEARCH RECOMMENDATION We are of the opinion that the government in Allahabad should be able to take a bold step in investing money in e-governance through the provision of e-Services to the public and citizens; There are some recommendations that could be beneficial in reducing if not totally eradicating the challenges facing e-Service adoption and implementation in Allahabad based on the survey results: More money should be allocated to e-Government services development in the city’s yearly budget as presented to the legislative arm of government by the executive arm. The State minister and top directors in charge of information and the telecommunication ministry should map out strategies of full implementation and allocation of money meant for e-Service development and they should ignore corruption and favouring dishonest contractors, if the city is to achieve desired and expected results. Culture and usability issues need to be addressed when designing e-service websites and applications. Well-developed sites and apps will benefit the illiterate as well as the middle class literate members of the population, and could ensure the rapid expansion of e-services. Trust is another major factor and for the e-Governance projects to be successful, trust must be built among the stakeholders like government agencies, ministries, citizens, business owners and banks. Citizens and users of e-Services will be using their information online so there must be adequate security to protect their data and privacy. The awareness level of e-Services should be addressed as the users and citizens have more knowledge of the existence of e-Services and a comprehensive advert and campaign could be put in place. However, until there are reliable e-services to use, this could only further awareness and not usage. Interactive tools should be included in designed e-Service websites to enhance interactions between government and citizens of Allahabad. A well-structured strategic plan should be built for e-Service projects and issues relating to culture should be addressed for e-Service adoption success.
CONTRIBUTION AND FURTHER WORK In this paper, we have been able to contributes to the analysis of e-Service adoption and implementation in Allahabad, where we have been able to capture the thoughts of various respondents involve in the provision, implementation and adoption of e-Government services in Allahabad. We have also made necessary recommendations that will improve the e- Service adoption and implementation in the city. The research is significant as government need to invest money and commitment in the provision of e-Services to local citizens, and it is rather unfortunate that at the moment, there is no Local Government in Allahabad with a functioning website and this lack being a barrier to the use of e-Services by the citizens. There is still a lot to do in the area of e-Services in Allahabad, if the city is really serious in overcoming the challenges in the adoption and implementation.
CONCLUSION We have been able to discuss various challenges facing e- Services adoption and implementation in Allahabad, and recommendations have been made towards the development, implementation and adoption of these government services in Allahabad. Though, e-Governance is still young in many lower middle income cities like Allahabad, successful e-Service implementation and adoption will provide increased revenue and the boost economy. More research is now needed to identify and implement cost-effective, usable e-Service systems for the city, and there is a need for government to make positive change in the way services are being delivered to citizen and others stakeholders. Issues like awareness and availability of services and trust all need further development in order to allow e-Government services to be delivered and used by citizens.
REFERENCES 1. Ake Gronlund and T.A Horan (2004) "Introducing E-government: History, Definitions and Issues, Communications of the Association for Information Systems,
Volume 15, Page 713-729. 2. Almarabeh, Tamara and Abu Ali, Amer (2010) A general framework for e-Government: Definition Maturity Challenge, Opportunities and Success, European
Journal of Scientific Research, Volume 39, Issue 1, page 29-42. 3. Castellan, Catherine M. (2010) Quantitative and Qualitative Research: A View for Clarity, International Journal of Education, Vol. 2, No. 2 4. Danish Dada (2006) “The failure of e-Government in Developing Countries: A Literature Review” The Electronic Journal on Information Systems in Developing
Countries, Volume 26, Issue 1. Page 1-10 5. Gajendra Sharma, Xi Bao and Wang Qian (2012) Empirical Investigation on Adoption of e-Governance Services in Developing Countries and Ethical Issues,
International Journal of Advanced Research in Computer Science and Software Engineering 2 (12), December - 2012, pp. 19-27. 6. Gilbert D. and Balestrini P. (2004) Barriers and benefits in the adoption of e-government, The International Journal of Public Sector Management, Volume
17, No. 4, page 286-301. 7. Heeks Richard and Savita Bailur (2007) "Analyzing e-government research: Perspectives, philosophies, theories, methods, and practice." Government infor-
mation quarterly 24.2, pp 243-265. 8. Hillier, M. (2003) “The role of Cultural context in multilingual website usability” Electronic Journal of Commerce Research and Applications, Volume 2, Number
1, page 2-14. 9. Kaliannan, M., & Awang, H. (2010). Adoption and use of e-government services: a case study on e-procurement in Malaysia. WSEAS Transactions on Business
and Economics, 7(1), 1-10. 10. Margaret Tan, Deng Xiaoai, Yang Qiushi and Cheng Chen (2013) AN Investigation of e-Government Services in China, The Electronic Journal of Information
Systems in Developing Countries (EJISDC), Volume 57, Issue 5, page 1-20.

VOLUME NO. 6 (2016), ISSUE NO. 09 (SEPTEMBER) ISSN 2231-1009
INTERNATIONAL JOURNAL OF RESEARCH IN COMPUTER APPLICATION & MANAGEMENT A Monthly Double-Blind Peer Reviewed (Refereed/Juried) Open Access International e-Journal - Included in the International Serial Directories
http://ijrcm.org.in/
72
11. Roland T. Rust and P.K Kannan (2003) e-Service: A New Paradigm for Business in the Electronic Environment, Communications of the ACM June 2003, Volume 46, No. 6.
12. Roztocki, N and Weistroffer, H.R. (2008) Information Technology in Emerging Economies, Information Technology for Development, 14, 1, 1-10. 13. Schwester, R. (2009). Examining the Barriers to e-Government Adoption. Electronic Journal of E-government, 7(1) 14. Susanto, T.D and R. Goodwin (2010) “Factors Influencing Citizen Adoption of SMS Based e-Government Services” Electronic Journal of e-Government, Volume
8, Issue 1, pages 55-71. 15. United Nations (2014) E-government Survey, E-government for the future we want, New York, USA.

VOLUME NO. 6 (2016), ISSUE NO. 09 (SEPTEMBER) ISSN 2231-1009
INTERNATIONAL JOURNAL OF RESEARCH IN COMPUTER APPLICATION & MANAGEMENT A Monthly Double-Blind Peer Reviewed (Refereed/Juried) Open Access International e-Journal - Included in the International Serial Directories
http://ijrcm.org.in/
73
EFFECTS OF TEACHING FACILITIES AND LEARNING RESOURCES ON THE PERFORMANCE OF SCIENCE IN PRIMARY SCHOOLS IN KENYA
GRACE AKINYI OYUGI LECTURER
MAASAI MARA UNIVERSITY KENYA
ABSTRACT
The need for teachers to be equipped with learning resources and facilities to enhance creativity in delivery is essential in the implementation of science as a subject especially in primary section. There is need to establish the approaches, the faculty techniques procedures and routines used in implementation by science teachers, as the result indicates, negative trend which is an evidence of a problem, the study looked into the effects of learning resources and facilities in implementation of science. It aims at developing learning facilities and resources which could aid the teaching of science in primary school. This paper presents the background and justification for approaches that could be applied in teaching of science using the learning facilities and resources. The findings of the study are well stated and recommendations listed.
KEYWORDS teaching facilities, learning resources, primary schools.
INTRODUCTION he world which we live in today is steeped in science and technology inventions governed by ever increasing discoveries, inventions and innovations. It is through science that we relate better to the phenomena which helps us to understand our world. In order to promote deep conceptual understanding of science there is need to develop positive attitude and skills at an early age, the teaching and learning should be based on practical learning reasoning and
experimental procedures to investigate real life phenomenon. This can only be done when materials are made available. The paper looked into the effect of learning resources on the result. In Kenya, effective teaching is predominantly measured in terms of examination achievement wamahiu (2007). Examination is used in selecting, monitoring and placement of students to the next level. It is also used in the evaluation of teachers work on knowledge and skills attained by students. This has led to so many questions on the trend of poor performance in science in Kenya leading to investigation on the availability of facilities and resources applicable during science lesson, as they are essential for practical aspect of the learning.
STATEMENT OF PROBLEMS Poor attainment by students in science subjects generally within the school system has been attributed to unsatisfactory teacher performance. The result of performance in science indicated a trend of poor performance for the four years, there was need to establish whether facilities and learning resources were affecting the performance. The purpose of the study was to establish the effect of learning resources and facilities on performance of science.
LITERATURE REVIEW A case conducted by cooper (2011) on the constructivist teaching of science on the evaluation of using of text books found out that textbooks were used extensively in upper primary classrooms delivery in every aspect of learning, from the data analysis. none of the textbooks were distinctively constructivist style the study warn the teachers against relying completely in textbooks. However, the study did not look at other various learning resources which could be applied in teaching of science to enhance practical lessons which this study looked into. According to SMASSE baseline report (1994), most science lessons were carried out through lecturing method and not child centered methods, the teachers claimed that they lacked facilities and resources for handling practical lessons and reluctant to use a few facilities available. The findings of this study concurred with the findings and went ahead to write on the solution
THEORETICAL UNDERPINNINGS AND CONSTRUCTIVIST APPROACH The study applied constructivist teaching theory which was relevant to the study as it was rooted to the cognitive theories of Pieget (1800) and Vyotsky. The theory states that people create their own meaning through experiences. It advocates for active learning schemes, assimilation which was applicable to the study. From Vygotaski, we got social constructivism, group work and apprenticeship. The theory embraces discovery method on the learners rather than relying on information from the teacher. This leads to discovery of main ideas by learners leading to deductions from findings. If resources can be made available, then the teacher would feel motivated and develops positive attitude towards teaching of science subjects leading to enhancement in achievement of educational goals.
CONCEPTUAL FRAMEWORK
T

VOLUME NO. 6 (2016), ISSUE NO. 09 (SEPTEMBER) ISSN 2231-1009
INTERNATIONAL JOURNAL OF RESEARCH IN COMPUTER APPLICATION & MANAGEMENT A Monthly Double-Blind Peer Reviewed (Refereed/Juried) Open Access International e-Journal - Included in the International Serial Directories
http://ijrcm.org.in/
74
The study applied survey design as it is appropriate for capturing the opinion perception and attitudes of people and to generalize findings. The study targeted public schools and all the science trained teachers totaling to 320 and all head teachers through using stratified random sampling, the targeted population was divided into two zones then random sampling with strict adherence to the law of probability was applied to ensure that each number of the population was selected. Two instruments used were questionnaire for teaching staff and interview guides for head teachers to ensure reliability, test re- test was administered within an interval of two weeks then results were correlated to test the reliability of the research instruments. A pilot test was used to test the content validity of the instruments in the schools which were excluded from the study.
RESPONSE ON THE FACILITIES AND RESOURCES EQUIPPED IN SCHOOLS Majority of the participating teachers 56 percent indicated that they were not equipped with facilities and learning resources in their schools while remaining 44% said they were equipped with learning facilities. The view of lack of resources was supported by the head teachers in their response which showed 77% in conclu-sion from the information gathered, it was concluded that there is need for provision of learning resources to be supplied in schools. It was also revealed from questionnaires that most practical lessons were done when the topics were on plants, insects root and base where the improvisation was applicable. A big percentage of 34% said that they had neither learning facilities nor resources in their schools which affect practical learning of science leading to poor implementation. 60%of head teachers strongly agreed that facilities are in adequate hindering effective teaching of science leading to poor performance. This information implies that, there is need for the government and other stakeholders in education sector to create more facilities and provide adequate resources that can be used to improve teaching of science subjects.
CONCLUSION The paper has considered issues and implications of facilities and learning resources in regard to teaching and learning process of Science subject.
RECOMMENDATIONS It is recommended that teachers should be taken for in servicing to improve on pedagogical skills. The government should recommend ways by which schools could obtain learning resources which could aid teaching of science’. There is need for motivation of science teachers in order to perform effectively.
REFERENCES 1. Alinder 1995 Project work on challenges facing implementation of science in secondary schools. 2. Bruce,2006Post Primary science teacher’s perception of primary science education, Springer Netherlands. 3. Bybee, R1995 Science curriculum reform in the united states 4. Okere2003Effective Science Teaching 23rdAnnual research Forum in Nairobi.
VOLUME NO. 6 (2016), ISSUE NO. 09 (SEPTEMBER) ISSN 2231-1009
INTERNATIONAL JOURNAL OF RESEARCH IN COMPUTER APPLICATION & MANAGEMENT A Monthly Double-Blind Peer Reviewed (Refereed/Juried) Open Access International e-Journal - Included in the International Serial Directories
http://ijrcm.org.in/
75
IMPACT OF LIBERALISATION ON WORKING OF APMC: A CASE STUDY OF DHARWAD DISTRICT
DR. VIJAYAKUMAR MANE LECTURER
GOVERNMENT P U COLLEGE HEBSUR
ABSTRACT
The price of agricultural products before the WTO agreement in India was lower than the international prices. The prices of international agricultural products have become the lower than the Indian agricultural prices this is resulted in the growing unrest among the farmers in different states and pushed them in to bad condition. The policy of trade liberalization resulted in the falling of prices of farm commodities especially from mid-90s onwards. Due to the lack of remunerative prices for their products the farmers began to dump their products like tomato, onion etc in the fields. Some of the products were thrown on the road in protest.
KEYWORDS APMC, Dharwad, liberalisation.
INTRODUCTION he implementation of the liberalization policies focused on the withdrawals of the state from economic sectors also resulted in the abolition of Indian agricultural subsidies that had supported farmers for decades. As a result of economic reforms Indian farmers were pushed into competition with the international market making them extremely vulnerable to price volatility and integrated India in to global market, then Indian farmers desperately forced
into the using new highest priced inputs, which incorporated innovative, but expensive, biotechnology and which came with the promise of producing higher yields and providing greater resistance against pests. However, such inputs often fail to live up to these promises, driving farmers into further debt as they failed to produce enough crop to make for rising input costs. These inputs sold by foreign multinational corporations became available only after Indian markets were opened up under economic reforms. Besides disadvantages of liberalization, there are number of defects found in agricultural sector as well as in working of agricultural marketing viz. inadequate facilities for transport, lack of financial facilities at cheaper rate, lack of information regarding price, lack of grading and standardization, inadequate storage facility, presence of large number of middlemen in the markets and frequent fluctuation of prices. Due to all these factors farmer is not getting justice price for products this has created a situation that forces farmers to commit suicide.
STATEMENT OF THE PROBLEM Small and marginal farmers in particular have been the worst suffers from the onslaught of liberalisation in India. Due to liberalisation private sector is strength-ening in this regard the problem under investigation, i.e., Impact of Liberalisation On Working Of Apmc: A Case Study Of Dharwad Ditrict, is taken with genuine curiosity of investigating the impact of liberalization on Annigeri APMC of Navalgund Taluk of Dharwad district which had a large number of small farmers.
OBJECTIVES OF THE STUDY 1. To study the impact of liberalisation on Indian agricultural sector. 2. To identify the suitable suggestion to face the challenges of liberalisation.
HYPOTHESIS 1. Due to liberalisation agricultural sector is suffering. 2. Due to liberalisation private sector is strengthening at the cost of the farmers 3. Due to liberalisation distress among farmers is increasing.
REVIEW OF LITERATURE Malati Phogat., in her book Globalisation and the farmers: An Impact Assessment (2010), talks about the recent waves of liberalization, structural adjustment and economic reforms began in India. In case of agricultural sector, the debate has been going on how and in what manners Indian agriculture is affected by these reforms, liberalization and consequent policies. The study has focused the implication of globalization and related policies on agricultural sector. The book tries to identify how globalization affected the society in general and farmers in particular. K P Singh., in his book Agricultural Marketing and Rural Development (2011), narrates about the impact of globalization and liberalization on agriculture and small farmers in developing countries, the global framework affecting rural producers in developing countries, the cause’s effects of the green revolution in Punjab and strategy for effective agricultural marketing extension to meet the challenges in 21st century has been discussed in this book. Mohd. Iqbal Ali and Bhaskar G., in his book WTO Globalization and Indian Agriculture (2011), explain about globalization trends of the recent past which have impacted the world economies particularly those of developing countries immensely. Countries worldwide are reshaping their economic and trade policies to meet the challenges of new rules of trade under WTO and intense competition unleashed by the forces of globalization. The changed economic milieu has affected the Indian economy more to be the agricultural sector in several ways. Narshimha Reddy, D and Srijit Mishra., in their book Agrarian crisis in India (2009) highlighted the plight of farmers, since a decade Indian agriculture has been marked by deceleration in growth and distress of farmers. This book brings together detailed analysis of this crisis in all its dimensions. S. S. Acharya and N. L. Agarwal., in their book Agricultural Marketing in India (2009) made an analysis with special emphasis on marketing functions, institutions, efficiency, costs and margins, government efforts in the improvement of agricultural marketing and market research. Kumar D., in his book Agriculture under Globalization (2009) says that ‘In a global agricultural economy, small farms will be replaced by large farms, which in turn will be controlled by giant multinational corporations. Small farmers quite simply will not be able to compete in a "free market" global economy especially in low-income countries. Low-income countries that do not spend heavily on research and technology dissemination and do not upgrade their rural infrastructure and reduce transaction costs will experience declining prices for agricultural commodities without any decreases in costs of production have been discussed.
IMPACT OF LIBERALISATION ON AGRICULTURE MARKETING AND FARMERS The data was collected from farmers and analysed and interpreted by using the statistical tools such as percentages, graphical representation to study the impact of liberalisation on working of APMC’s.
T

VOLUME NO. 6 (2016), ISSUE NO. 09 (SEPTEMBER) ISSN 2231-1009
INTERNATIONAL JOURNAL OF RESEARCH IN COMPUTER APPLICATION & MANAGEMENT A Monthly Double-Blind Peer Reviewed (Refereed/Juried) Open Access International e-Journal - Included in the International Serial Directories
http://ijrcm.org.in/
76
1. EDUCATION STATUS OF FARMERS TABLE - 1
Education Land Holdings
1 Acres 2 Acres 3 Acres 4 Acres 10 Acres <10Acres Total
Primary 6 (60.0) 8 (38.1) 9 (40.9) 11 (32.4) 8 (30.8) 11 (29.7) 53 (35.3)
High School 3 (30.0) - 8 (36.34) 11 (32.4) 7 (26.9) 18 (48.7) 47 (31.3)
Illiterate 1 (10.00 9 (42.9) 4 (18.20 8 (23.50 7 (26.9) 4 (10.8) 33 (22.0)
Degree - - 1 (4.5) 3 (8.8) 3 (11.50 2 (5.4) 9 (6.0)
Post-graduate - 1 (4.7) - - - - 1 (0.7)
Others - 3 (14.3) - 1 (2.9) 1 (3.9) 2 (5.4) 7 (4.7)
Total 10(100.0) 21(100.0) 22(100.0) 34(100.0) 26(100.0) 37(100.0) 150(100.0)
Note: Figures in parentheses are percentages of the total farmers in the respective category. The level of education is an important factor in adoption of new technologies in farming business. Hence the education level of farmers was worked out and presented in the table-1 it is revealed from the table that 35.3 percent farmers were educated primary level, 31.3 percent farmers High School level, 22.0 percent illiterate, 6.0 percent farmers degree level, 4.7 percent intermediate level and 0.7 percent means only one farmers educated post graduate level. It is clear from above discussion that the higher proportion of farmer’s educated primary and High school level and illiterate is higher in number. In the era of liberalisation farmers has to compete with global goods, maintaining standardisation, adopting new technologies, but due to lack of education farmers facing difficulties in understanding and adopting changed situation. 2. RESPONSE OF FARMERS ON KNOWN ABOUT LIBERALISATION
TABLE - 2
Village
Yes/No Land Holdings
1 Acres 2 Acres 3 Acres 4 Acres 10 Acres <10Acres Total
Annigeri Yes - - - - - - -
No 8(80.0) 2(9.5) 7(31.8) 5(14.7) 1(3.8) 7(18.9) 30(20.0)
Navalgund Yes - 1(4.8) - - - - 1(0.7)
No 1(10.0) 6(28.5) 2(9.1) 6(17.7) 4(15.4) 10(27.0) 29(19.3)
Shisvinalli Yes - - - - - - -
No - 2(9.5) 4(18.2) 12(35.3) 6(23.1) 6(16.2) 30(20.0)
Hebbal Yes - - - 1(2.9) - - 1(0.7)
No 1(10.0) 7(33.3) 4(18.2) 4(11.8) 11(42.3) 2(5.4) 29(19.3)
Morab Yes - - - 1(2.9) - - 1(0.7)
No - 3(14.3) 5(22.7) 5(14.7) 4(15.4) 12(32.4) 29(19.3)
Total
Yes - 1(4.8) - 2(5.9) - - 3(2.0)
No 10(100.0) 20(95.2) 22(100.0) 32(94.1) 26(100.0) 37(100.0) 147(98.0)
Total 10(100.0) 21(100.0) 22(100.0) 34(100.0) 26(100.0) 37(100.0) 150(100.0)
Note: Figures in parentheses are percentages of the total farmers in the respective category. The knowledge of farmers on liberalisation process was assessed and presented in table -2. This is revealed from the table that highest proportion of farmers that is out of 150 farmers 147 farmers who responded on negative on the knowledge regarding liberalisation. It shows that farmer’s failure in facing challenges of liberalisation in agriculture sector. Due to liberalisation multinational company’s products like American corn, Pizza Huts, K.F.C etc. Scattered all over the nation and Indians showing interests towards these products and this is caused regress for rural agriculture industry. 3. RESPONSE OF FARMERS ON GETTING INFORMATION OF PRICE OF AGRICULTURAL PRODUCTS
TABLE - 3
Education Land Holdings
1 Acres 2 Acres 3 Acres 4 Acres 10 Acres <10Acres Total
News papers 9 (90.0) 11 (52.4) 18 (81.8) 24 (70.6) 18 (69.2) 33 (89.2) 113 (75.3)
Others 1 (10.0) 9(42.8) 4 (18.2) 9 (26.5) 8 (30.8) 4 (10.8) 35 (23.3)
Internet - 1(4.8) - - - - 1 (0.7)
SMS - - - 1(2.9) - - 1 (0.7)
T.V - - - - - - -
Radio - - - - - - -
Total 10(100.0) 21(100.0) 22(100.0) 34(100.0) 26(100.0) 37(100.0) 150(100.0)
Note: Figures in parentheses are percentages of the total farmers in the respective category. Famers getting information regarding price presented in table-3. This is revealed from the table that 75.3 percent farmers are getting in information regarding price of agricultural products through news papers, 23.3 percent through traders, middleman and villagers and 0.7 percent farmers through internet and SMS. It shows that because of illiteracy farmers depended on others and no one farmers get information through T.V and Radio. Due to liberalization many private T.V channels emerged and all these channels disseminating commercial programmes and not programmes in the interests of farmers.

VOLUME NO. 6 (2016), ISSUE NO. 09 (SEPTEMBER) ISSN 2231-1009
INTERNATIONAL JOURNAL OF RESEARCH IN COMPUTER APPLICATION & MANAGEMENT A Monthly Double-Blind Peer Reviewed (Refereed/Juried) Open Access International e-Journal - Included in the International Serial Directories
http://ijrcm.org.in/
77
4. FARMERS RESPONSE ON BETTER PRICE IN APMC TABLE - 4
Village
Yes/ No
Land Holdings
1 Acres 2 Acres 3 Acres 4 Acres 10 Acres <10Acres Total
Annigeri Yes - - 1(4.5) 1(2.9) - 2.(5.4) 4(2.7)
No 8(80.0) 2(9.5) 6(27.3) 4(11.8) 1(3.8) 5(13.5) 26(17.3)
Navalgund Yes - 1(4.8) - 1(2.9) 1(3.8) 2(5.4) 5(3.3)
No 1(10.0) 6(28.5) 2(9.1) 5(14.7) 3(11.5) 8(21.6) 25(16.7)
Shisvinalli Yes - - 1(4.5) 2(5.9) 3(11.5) 2(5.4) 8(5.3)
No - 2(9.5) 3(13.6) 10(29.4) 3(11.5) 4(10.8) 22(14.7)
Hebbal Yes - 1(4.8) 1(4.5) 1(2.9) 1(3.8) 1(2.7) 5(3.3)
No 1(10.0) 6(28.5) 3(13.6) 4(11.8) 10(38.4) 1(2.7) 25(16.7)
Morab Yes - - - 2(5.9) 1(3.8) 4(10.8) 7(4.7)
No - 3(14.3) 5(22.7) 4(11.8) 3(11.5) 8(21.6) 23(15.3)
Total
Yes - 2(9.5) 3(13.6) 7(20.6) 6(23.1) 11(29.7) 29(19.3)
No 10(100.0) 29(90.5) 19(86.4) 27(79.4) 20(76.9) 26(70.3) 121(80.7)
Total 10(100.0) 21(100.0) 22(100.0) 34(100.0) 26(100.0) 37(100.0) 150(100.0)
Note: Figurs in parentheses are percentages of the total farmers in the respective category. Farmers getting better price in APMC’s is worked out and presented in the table-4 it is revealed form the table that 80.7 percent farmers are not getting better price, 19.3 percent farmers not getting better price. Big land holders responded that they are getting better price whereas small holding farmers are not. It is find out that big land holder and those who have big land holders, storage of agriculture goods and transportation facility are beneficiary, without having these facilities that farmers are in loss. Now situation is created that who’s having above facility they can survive in agriculture business.
FINDINGS OF THE STUDY 1. During the field work it is found that due to illiteracy of farmers, the multinational companies are exploiting the farmers and the APMCs which were supposed
to safeguard the interest of the farmer’s community has failed in its duties. 2. The agricultural produce is not sold in APMCs, the agricultural business people go to the fields and purchase the goods. Here the farmer has no choice to
bargain or to ask for prices. 3. Due to urgent financial needs the farmers are selling their produce immediately even when the prices are low. 4. Due to liberalisation farmers are moving towards growing commercial crops and this has created surplus growth and the prices are going down. 5. Though there are APMC markets, the middleman and licensed private traders are dominating and the exploitation is on the increase. 6. Due to usage of chemical fertilisers the fertility of land is declining. 7. The financial liability of farmers is increasing due to non availability of prices and the APMC support; this has sometimes led to farmer’s suicide. 8. Due to liberalisation the online trading and electronic commerce has increased and this is not supportive to farmers. 9. It is surprising and shocking to know that many of the farmers do not know about the liberalisation concept. They say that it is not at their reach it is the top
people activity and they are least concerned about it.
SUGGESTIONS 1. It is necessary to develop the standard and scope of basic services like roads, modern means of communication, storage facilities. 2. The regulated markets authorities and government may like steps to improve the awareness among farmers about regulated market. 3. Adequate arrangements of agricultural produce on support price, if the price falls below the level. 4. Agriculture technology must reach to farmers, irrespective of size of land holdings. 5. Proper training should be given to the farmers by agricultural assistants regarding use of pesticides and fertilizers. 6. Primary agricultural produce marketing co-operatives must open their branches in the rural areas and have to purchase produce of farmers at s reasonable
price.
CONCLUSION
On the basis of findings of the study some variable suggestions were given. Due to liberalization policy role of government in managing markets is on the decline worldwide. In the countries in the world, market operation is conducted by corporate sector. So farmer’s welfare point of view sincere implementation of welfare schemes by government and favourable response to these governmental efforts on the part of the farmers undoubtedly bring golden days for farmers.
REFERENCES
1. Alagh. Y.K., (2003), “Globalisation and Agriculture Crisis in India” Deep and Deep Publishers New Delhi. 2. Hardeep Singh, Manoj Kr. Goel and Amit Kr. Singhal., (2012), “New Perspectives in Rural and Agriculture Marketing”, VSRD International Journal of Business
and Management Research, Vol. 2. 3. Jamge, D.L., (2008), “Globalisation of Agricultural Economy: A Change of Opportunity before Indian Agriculture”, Indian Streams Research Journal, Vol.2,
Issue-8, September. 4. Muralidhas. B.V. and Mamatha. D. M, (etal)., (2011), “Globalisation and its impact on Indian agriculture: A study of farmers suicides in the state of Andhra
Pradesh” Nepalese Journal of Public Policy and Governance, Vol. xxix, No.2, December. 5. Ohja. A.K., (2002) “Globasation and Liberalization- prospects of new world order” Third Concept an International Journal of Ideas, August. 6. Roy, M., (2012), “Agricultural Marketing: New Challenges”, International Journal of Humanities and Applied Sciences, Vol.1, No.2. 7. Selvaraj, A, and Sakthivel N., (2009), “Farmers Perceptions towards Regulated markets” Financing Agriculture-A National Journal of Agriculture and Rural
Development, January-February.

VOLUME NO. 6 (2016), ISSUE NO. 09 (SEPTEMBER) ISSN 2231-1009
INTERNATIONAL JOURNAL OF RESEARCH IN COMPUTER APPLICATION & MANAGEMENT A Monthly Double-Blind Peer Reviewed (Refereed/Juried) Open Access International e-Journal - Included in the International Serial Directories
http://ijrcm.org.in/
78
A STUDY ON THE CUSTOMER PERCEPTION TOWARDS PASSENGER CARS WITH SPECIAL REFERENCE TO MALAPPURAM DISTRICT IN KERALA
SHAHIBA.EC RESEARCH SCHOLAR
SNGC COLLEGE K.G CHAVADI, COIMBATORE
ABSTRACT
In India, the automobile industry today is the most lucrative industry. Due to the increase in disposable income in both rural and urban sector and easy finance being provided by all the financial institute, the passenger car sales have increased. passenger car industry is one of the largest industries showing rapid growth over the years and contributing certainly to the industrial development. The passenger car market is changing very rapidly due to tough competition and advance technology. Therefore, it requires the automobile manufacturer to understand the customer’s perception on time and take fast action to reflect market changes quickly. Today’s market is dominated by customers. Therefore, it is important to know the customer’s perception. Customer’s perception is typically affected by advertising, review, public relation, social media, personal experience and other channels. It is true fact that if you are satisfied you recommended to others. Word of mouth and customer satisfaction play a very important role in determining market perception about an automobile. It is the market perception that determines the success of a company and so it is very important for the car manufacturers to measure the “willingness of existing users of a product to recommend it to others”. The same is a lot of interest to customers as well for it helps them make the purchase decision. A car is one of the most significant purchases that an Indian household makes.
KEYWORDS house hold, perception, disposable income.
INTRODUCTION oday’s market is driven and dominated by customers and that is the reason he is considered the king. Customers are becoming ever more demanding in almost every industry and in most cases they have more options to choose from than ever before. it is not easy to predict the complex mind of the customers as each individual is a unique product of genetics, environment and experience. According to Business dictionary, customer perception is defined
as “a marketing concept encompasses a customer’s impression, awareness and/or consciousness about a company or its offering.” Customer perception refers to how customers view a certain product based on their own conclusions. These conclusions are derived from a number of factors such as price and overall experi-ence. Customer perception defined as the way that customer usually view or feel about certain services and products.
FACTORS AFFECTING CONSUMER PERCEPTION 1 PRICE Price should be part of a comprehensive marketing plan, where even inexpensive products are depicted as favourable alternatives with similar levels of quality to the competition, with a price that is somewhat lower but still comparable with other possibilities. 2 QUALITY Quality can describe any attribute in a set of characteristics that satisfy or disappoint a consumer, including usability, reliability and durability. Marketing can influence a consumer’s perception of quality, but in the end, and particularly with non-durable goods, a consumer’s actual experience with a product will determine his perception of quality. 3 SERVICE QUALITY Humans are social animals and their consumer behaviour is often determined by the social relationships that surround a product, including interactions with customer service representatives. 4 PACKAGING AND BRANDING Packaging and branding have a huge effect on consumer perceptions, particularly at the point of purchase. Packaging and branding, of course, cover everything from the attractiveness and display quality of an item to the attributes of a product the manufacturer chooses to highlight. 5 REPUTATION A product’s reputation is built up overtime and is usually a combination of actual experience with the product, word-of-mouth recommendations and marketing campaigns that attempt to establish a status or shared view of the product or brand.
CONSUMER PREFERENCES Consumer preferences are defined as the subjective tastes, as measured by utility, of various bundles of goods. They permit the consumer to rank these bundles of goods according to the levels of utility they give the consumer. Note that preferences are independent of income and prices. Ability to purchase goods does not determine a consumer’s likes or dislikes. One can have a preference for Porsches over fords but only have the financial means to drive a ford.
FACTORS AFFECTING CONSUMER PREFERENCES 1 Advertising 2 Social Institution 3 Cost 4 Consumer Income 5 Available Substitutes
CONSUMER SATISFACTION Consumer satisfaction is a term frequently used in marketing. It is a measure of how products and services supplied by a company meet or surpass customer expectation.
CONSUMER ACCEPTANCE Acceptance describes consumer willingness to receive and/or to tolerate consumer acceptance and satisfaction are related, as the first is a precursor of the latter. However, despite the fact that satisfaction and acceptance can be thought of as lying on a continuum, acceptance does not automatically lead to satisfaction.
T

VOLUME NO. 6 (2016), ISSUE NO. 09 (SEPTEMBER) ISSN 2231-1009
INTERNATIONAL JOURNAL OF RESEARCH IN COMPUTER APPLICATION & MANAGEMENT A Monthly Double-Blind Peer Reviewed (Refereed/Juried) Open Access International e-Journal - Included in the International Serial Directories
http://ijrcm.org.in/
79
OBJECTIVES OF THE STUDY 1. To analyse the perception of customers towards passenger cars in Malappuram municipality 2. To identify the various product attributes that influence the purchase decision of passenger cars. 3. To find out the major information sources regarding purchase decision of passenger cars. 4. To identify the preferences towards various brands of passenger cars.
METHODOLOGY OF THE STUDY POPULATION The population of the study constitutes the customers of passenger cars belonging to Malappuram district SAMPLE DESIGN The sample size is fixed as 120. The customers are selected by using purposive sampling method. SOURCES OF DATA Primary data are collected by using questionnaire from customers belonging to Malappuram district and secondary data are collected from books, journals and internet. LIMITATIONS OF THE STUDY 1. This study is restricted to Malappuram district. So the result may not be applicable to other areas. 2. The sample size is limited to 120. 3. The study of customer perception is qualitative nature. So all the inherent limitation of qualitative study may be reflected.
REVIEW OF LITERATURE Mandeep kauri and Sandhu (2006) attempted to find out the important features which a customer considers while going for the purchase of a new car. The study covers the owners of passenger cars living in the major cities of the state of Punjab and the union territory of Chandigarh. The respondents perceive that safety and comfort are the most important features of the passenger car followed by luxuriousness. So the manufacturers must design the product giving maximum weightage to these factors. Brown et al (2010) analysed the consumers’ attitude towards European, Japanese, and the US cars. The country –of-origin plays a significant role in the consumers’ behavior. The brand name, lower price and distributor’s reputation completely have a significant impact on the sale of passengers’ car. Guiles (2008) identified that fuel economy and lower maintenance have its impact on customers’ behavior towards the passenger car. Baumgartner and Jolibert (2008) revealed that car produced in Germany received the highest rating on firm attitudes namely acceleration, safety, styling, and workmanship among the Americans. At the same time, Japanese car ranked highest on fuel economy and reliability. Dornoff et al (2008) identified the market segment is the primary determinant of the consumer behavior in the passenger car market. The level of expectation and perception on various attributes of car differ from consumers in one segment to another.
ANALYSIS TABLE 1: IMPORTANCE OF PASSENGER CAR
Importance Frequency Percentage
Necessity 69 57.5
Status 36 30
Luxury 15 12.5
Total 120 100
Source: Primary Data Inference: out of 120 respondents, 57.5% states that passenger car are necessity, 30% view passenger car as status item, only 12.5% view as luxury.
TABLE 2: RANKING OF INFORMATION SOURCES
Information sources Rank 1 Rank 2 Rank 3 Rank 4 Rank 5 Rank 6 Total
Family members 50 28 10 11 11 10 120
Relatives 2 13 38 29 20 18 120
Friends 17 28 22 28 20 5 120
Advertisement 26 16 22 22 28 6 120
Internet 7 12 7 12 14 68 120
Dealer 18 23 21 18 27 13 120
Source: primary data
TABLE 3: WEIGHTED RANKING OF INFORMATION SOURCES
Information source Rank 1*6 Rank 2*5 Rank 3*4 Rank 4*3 Rank 5*6 Rank 6*1 Total Score Mean score
Family members 300 140 40 33 22 10 545 4.54
Relatives 12 65 152 87 40 18 374 3.11
Friends 102 140 88 84 40 5 459 3.82
Advertisement 156 80 88 66 56 6 452 3.76
Internet 42 60 28 36 28 68 262 2.18
Dealer 108 115 84 54 54 13 428 3.56
Source: primary data Inference: by analysing the mean scores, it is clear that the most preferred product attribute is brand image. The second preferred product attribute is mileage, price, style and design, easy driving, internal space, resale value are preferred in the third, fourth, fifth, sixth and seventh positions. the least preferred product attribute is innovative technology.
TABLE 4: LEVEL OF SATISFACTION
Level of satisfaction frequency percentage
Highly satisfied 34 28.33
Satisfied 78 65
Dissatisfied 7 5.83
Highly dissatisfied 1 .83
Total 120 100
Source: primary data Inference: 93% of respondents are satisfied with their passenger car. Among them 28% are highly satisfied and 65% are satisfied.

VOLUME NO. 6 (2016), ISSUE NO. 09 (SEPTEMBER) ISSN 2231-1009
INTERNATIONAL JOURNAL OF RESEARCH IN COMPUTER APPLICATION & MANAGEMENT A Monthly Double-Blind Peer Reviewed (Refereed/Juried) Open Access International e-Journal - Included in the International Serial Directories
http://ijrcm.org.in/
80
FINDINGS 1. From the study, it is found that 57.5% respondents consider passenger car as a necessity. 2. The study reveals that the most ranked information source regarding the purchase decision of passenger car is “family members”. the least ranked infor-
mation source is “internet”. 3. From the study, it is found that the most preferred product attribute of passenger car is brand image and the least preferred product attribute is innovative
technology 4. While analysing the level of satisfaction, it is found that majority of the respondents 93.33% are satisfied. 5. About 24.17% of the respondents are highly satisfied with the overall performance of their passenger car. 6. While analysing the overall satisfaction, it is found that majority of the respondents are satisfied with various aspects of passenger car. 7. The study reveals that the overall perception of respondents towards passenger car in Malappuram district is found to be positive and satisfied. More than
50% of respondents agreed with all the statements. 8. 60% of the respondents out of those customers who are willing to replace their car not prefer the same brand. Only about 40% prefer the same brand.
SUGGESTIONS 1. Growth in disposable income and higher education will remain the main drivers of future advance cars. Car manufacturers need to track these trends and
align their product strategies. 2. Car dealers and manufacturers show very good hospitality to customers during their visits to the place of showroom before and immediately after their
purchase. But after sometime they face a problem with their dealers regarding after sales service. Therefore, it is suggested that the services rendered should be properly explained, friendly approach and reliability in service to be further improved.
3. Marketer might want to focus on TV commercials on car models and brand to catch the attention of the intending future customers. 4. Marketers need to understand the requirements of customer and focus their marketing strategies towards these requirements. 5. Car segment wise analysis also bought out specific comfort requirement across all the brands. Manufacturers might look into these aspects to their car
design, so to attract car passengers, prone to decide the models based on these criteria.
CONCLUSION Passenger car industry is one of the largest industries showing rapid growth over the years and contributing certainly to the industrial development. The passenger car market is changing very rapidly due to tough competition and advance technology. The present study throws light on the perception and satisfaction of customers towards passenger cars in Malappuram Municipality. The overall perception of customers towards passenger cars in the population of the study is found to be positive and major portion of the respondents are satisfied with various aspects of passenger car. The brand image is the most preferred product attribute while choosing the passenger car. Another aspect noticed is that even through customers are aware about the internet, the least ranked information source is internet. The majority of customers prefer Maruti Suzuki brand of passenger car.
REFERENCES 1. K. Anand, Dr. K. Shyma Sundar, Factors affecting Consumer’s Brand preference of small Cars, IOSR journal of Business and Management, Vol 6, Issue 5, Ver.3
(May, 2014), pp. 43-47 2. Kotler and Keller. A framework for Marketing Management”,3rd ed, Pearson 240-245 3. Ramesh Sardar, Brand preference of passenger Cars in Aurangabad District, International journal of Multidisciplinary Research, Vol. 2 Issue 3, March 2012,
ISSN 22315780. 4. Sangeeta Gupta, A study of Buying Decision Influencers for passengers Car Segment in New Delhi, International journal of Business and Management Inven-
tion, Volume 2 Issue 12,

VOLUME NO. 6 (2016), ISSUE NO. 09 (SEPTEMBER) ISSN 2231-1009
INTERNATIONAL JOURNAL OF RESEARCH IN COMPUTER APPLICATION & MANAGEMENT A Monthly Double-Blind Peer Reviewed (Refereed/Juried) Open Access International e-Journal - Included in the International Serial Directories
http://ijrcm.org.in/
81
COLLECTIVE BARGAINING: A GENERAL PERSPECTIVE
BRAJESH KUMAR PARASHAR RESEARCH SCHOLAR
CRIM BARKATULLAH UNIVERSITY
BHOPAL
ABSTRACT The term “Collective Bargaining (CB)” merely stands for the intellectual process of negotiation. It provides a prospect to the workers to attain industrial democracy. CB is the process of joint decision-making and essentially represents a democratic technique of life in industrial environment. The Encyclopedia of Social Sciences defines CB as a process of discussion and negotiation between two parties, one or both of whom is a group of persons acting in concert, more specifically it is the procedure by which an employer or employees and a ground employees agree upon the conditions of work. In CB the management or employer doesn’t deal straightforwardly with the employees, but it deals with an institution, which is certified to represent the interests of employees for the purpose of negotiation and managing the terms & conditions of employment. Hence, it is an institutional process of representations. In the process of CB, principally the two main actors of the IR System, interacts to protest and enhance the interests and benefits of their respective institutions. This paper resides upon the concept of CB overall, which comprises the discussion of its objectives, scope, theories, types, circumstances, backgrounds, and special levels.
KEYWORDS industrial relations, workers’ participation in management, trade union, negotiation.
INTRODUCTION eatrice Webb (an Economic theorist) first used the term CB in 1891, which refers to the collective negotiations and agreements between the two main parties of an Industrial Relation System. CB is made up from two words collective, which means “Group” and bargaining, which means “Proposals and Counter Proposals”. Therefore, it is a process in which the representatives of a trade union & the representatives of employer’s association meet and
attempt to negotiate a contract or agreement, which specifies the nature of employee union-employer association relationship. CB has described as an elegant bipartite confrontation in an industrial prospective, between the Workers’ representatives and the management representatives with a view to disembark at an agreement. The CB is a method by which problems of wages and conditions of employment are resolved harmoniously, serenely and willingly between worker’s trade union and management association for the purpose of establishing jointly satisfying terms and conditions of employment. There are two main purposes of CB are as under: It aims to regulate terms & conditions of employment It has the purpose of being an opportunity for the resolution of conflicts or disputes CB is a process of bargaining between the two main actors of Industrial Relation Management. Now the question arises 1. why they bargain? 2. For which purpose they bargain? 3. And How to Bargain? The two actors bargain for maintaining industrial peace and harmony, which is very important for the economic growth and progress of any nation. This is an exchange process; in which both are exchange something (which is less valuable or desirable) for gaining something (which is more valuable or desirable). In other words, we can say in the process of exchange management decides to satisfy a need or desire by offering some relaxation, services, money in terms of overtime or piecework, goods, etc. and the trade union exchange labor, outturn, production etc. For bargaining purpose, both the actors come across the table, put their different proposals for discussion, and ultimately agreed upon some common or central course of action. The complete process has based on proposals and counter proposals in order to reaching some common minimum agenda for agreement. The term CB is comprehensive to all negotiations between the two main actors of an industrial relation system in order to determining terms and conditions of employment as well as working conditions, regulating relations between the employees and employers, and regulating relations between employer’s association’s and a employees union or between workers’ unions.
SOME IMPORTANT DEFINITIONS OF CB Michael J. Jucious has described the CB as a process of by which employers on the one hand and representatives of employees on the other, attempt to arrive at some agreements covering the conductions under which employees will contribute and be compensated for their services. Edwin B. Flippo has define the CB as a process in which the representatives of labour organization and the representatives of business organization meet and attempt to negotiate a contract or agreement which specifies the nature of the employee-employer union relationship. Tudwig Teller has explained the CB as an agreement between a single employer or an association of employers on one hand and a labour union on the other, which regulates the terms and conditions of employment. The I.L.O. defines CB as “the negotiations about working conditions and terms of employment between an employer, or a group of employers, or one or more employers' organizations, on the one hand, and one or more representative workers' organization on the other with a view to reaching agreement. K. Alexander explain CB as a process of bargaining between the employers and their workers by which they settle their disputes among themselves relating to employment or non-employment or terms of employment or conditions of labor of the workmen, on the strength of the sanctions available to each side. Occa-sionally such bargaining results in amicable settlement arrived at voluntarily and peaceful between the parties. But quite often the workers and the employers have to apply sanctions by resorting to the weapons of strikes and lock-outs to pressurize one another which makes both the sides aware of the strength of one another and that finally forces each to arrive at a settlement in the mutual interests. It is thus the strength of the parties which determines the issues rather than the wordy duals which are largely put on for show as any element of strength in one party is by the same token an element of weakness in another.
CHARACTERISTICS OF CB
Based on the above discussion it is clear that the CB is a Group Process as opposed to an individual action, because in the process of discussion and negotiation the representatives of workers and management association representatives took part for the success. They discuss on the various proposals and counter-pro-posals in order to reach an agreement, hence CB approach is flexible in nature rather than static or rigid. CB is purely an Art, the art of serving the ideas, philosophy, views, opinions, suggestions ect., such that the opponent not only listen carefully but also agree to act as per your desire. It is an art of speaking to the point and listening carefully. Hence, leadership certainly plays a great role in the success of CB. In addition to this the other factors which have a positive impact on the process are recognition and membership base of trade union among the workers, attitude and commitment of management association towards the success of negotiation, implementation and monitoring of the proposals of common agenda, level of communication between the two parties, etc. CB is fundamentally a complementary process rather than a competitive one.
B

VOLUME NO. 6 (2016), ISSUE NO. 09 (SEPTEMBER) ISSN 2231-1009
INTERNATIONAL JOURNAL OF RESEARCH IN COMPUTER APPLICATION & MANAGEMENT A Monthly Double-Blind Peer Reviewed (Refereed/Juried) Open Access International e-Journal - Included in the International Serial Directories
http://ijrcm.org.in/
82
CB is a dynamic continuous on going process. It is democratic in nature. CB is a mutual formulation of an organization’s polices on all the concerned matters that directly or indirectly affects the employee’s interests. CB is recognized as an advanced form of human relationship. CB is a process in the sense that it consists of a number of steps. It begins with the presentation of the charter of demands and ends with reaching an agreement, which would serve as the basic law governing industrial relations in an organization. Mutual trust and understanding serve as the by products of harmonious relations between the two parties.
OBJECTIVES OF PROCESS OF CB The prime objectives of the process of CB are discussed as under: 1. To set up and maintain cordial industrial relations between the management and the workers. 2. To prevent or minimize the industrial disputes and take necessary action to settle down the disputes or conflicts on initial stage at the minimum possible
level in a mutually agreeable manner. 3. To develop a conductive atmosphere to foster good industrial relations. 4. To enhance the quality as well as productivity of the organization by preventing strikes, lockouts etc. 5. To provide a prospect to the employees to voice their problems on the issues pertains to employment. 6. To facilitate concluding a solution that is good enough to both the parties involves. 7. CB resolves differences over knotty issues, and protects the workers interests through collective action. 8. CB performs rule-making function. Collective Employment Agreement (CAE) direct industrial relationships in the bargaining unit and thus create usually
applied standards. 9. CB is a technique whereby a poorer social group or class apply a never- slackening force for a bigger share in social sovereignty, as well as for more welfare
and greater security and liberty. 10. CB is a Rational Process, which appeals to facts and to logic, resolve conflicting interests in the light of universal interests of both the parties. It is a Bipartite
and Dynamic Process. 11. To defend the benefits of workers through collective action and promote Industrial Democracy in industrial jurisprudence. 12. CB is a voluntary process under which the representatives of both employers and labor enter into an agreement.
THE PROCESS OF CB CB is the process of united decision-making and represents a democratic way of life in industry. The initial point of the process of bipartite CB is the presentation of the charter of demands and the final stage is the reaching of an agreement / contract, which would provide as the essential law governing industrial relations over a period in an Organization. The complete process of CB engrosses five center steps:
Preparation → Discussion → Proposal → Bargaining → Settlement
Step I: Preparation – Choosing a negotiation team and representatives of both the trade union and employer association. Both the actors should be skilled in negotiation and they must know the norms of existing labor laws, and both scan the available data or information to establish whether they have a strong position for negotiation. Step II: Discussion – Both parties meet several times to set ground rules for the negotiation process. Step III: Proposal – Both parties make opening statements, outlining options and possible explanations on the issue under discussion.
Step IV: Bargaining – Following proposals, the parties discuss potential compromises, bargaining to produce an agreement that is good enough to both the parties. This becomes a “Draft” Agreement, which is not legally binding, but a stepping-stone to coming to a final CB Agreement or Collective Employment Agreement (CAE). This type of agreements generally set out wages, working conditions, training and development programs, normal working hours, overtime, piecework, bonus and other benefits, health and safety, and grievance handling mechanisms. Step V: Final Agreement or Settlement– Once an agreement has made with mutual consent; it must be put in writing, signed by the representatives of both the parties, and put into practice. Negotiations form an important aspect of the process of CB. It means there is significant scope for discussion, concession (reciprocated give & take) in the CB deliberations rather than confrontation.

VOLUME NO. 6 (2016), ISSUE NO. 09 (SEPTEMBER) ISSN 2231-1009
INTERNATIONAL JOURNAL OF RESEARCH IN COMPUTER APPLICATION & MANAGEMENT A Monthly Double-Blind Peer Reviewed (Refereed/Juried) Open Access International e-Journal - Included in the International Serial Directories
http://ijrcm.org.in/
83
LEVELS OF CB Generally, CB is prearranged and carries out at the following three levels: Plant Level Industry Level National Level At plant level, negotiations have conducted between the plant management and the workers union belongs to plant. At the Industry level, several sections of the same industry band together and form an association, which negotiates with a union having parallel status. At national level, the representatives of trade union and the employer’s association negotiate across the table and arrive at a resolution.
ESSENTIAL PREREQUISITES OF THE SUCCESSFUL CB The essential prerequisites for CB to be successful are as under: 1. The existence of a well-recognized trade union and an enlightened management team are being seated across the bargaining table. 2. Both parties must come across the table with an open frame of mind for exercising on the problems as well as their tentatively possible solutions with a fact-
finding approach and compliance to adopt some creative and innovative approach for the selection of the best possible solution. 3. With the purpose of make the negotiations result into success, the workers representatives and the management association must rely on facts & figures
and available data to validate their claims. 4. Whenever the two parties come across the bargaining table, all the important and interconnected issues are to be taken for consideration for discussion. 5. When there is strength of mind of give and take between the management association and trade union representatives, CB can be an effective technique of
settling industrial disputes within the industrial premises without the intervention of third party.
CONCLUSION
In an industrial organization to solve, the problems arising at the plant or industry level the need of the CB has readily felt. In the early decades of the twentieth century, the advocates of CB thought it essential for betterment of Industrial Relations due to following three reasons. Primarily, a system of peaceful and schedule bargaining would eradicate industrial strife and violence. Second, CB stood for "Industrial Democracy" Finally, CB promised to make capitalism work. CB is one of the methods wherein the employer and the employees can settle their disputes, conflicts, and opinion of differences by coming across the bargaining table in a healthy atmosphere. Hitherto the determination of terms and conditions of employment are concerned, one important outcome of CB has been that it has enabled trade unions to participate in the decision-making process regarding wages, safety & health, hours of work, working conditions etc, and it certainly strengthen the concept of WPM. Earlier the employer used to decide the above issues unilaterally, but now they have become subjects of bilateral consultation with the arrival of CB. Thus, CB in the field of industrial relations management has introduced an element of industrial democracy. Hence, the concept of CB is extremely useful from the standpoint of workers, trade unions and management.
REFERENCES 1. B.S. Murty, The Role of Collective Bargaining in Industrial Relations, The Indian worker, October,6, 1980. Page No: 51-55. 2. Collective Bargaining Power and Union by Dr. Abhishek Gupta (Administrative-cum-Accounts Officer, Sardar Swaran Singh National Institute of Renewable
Energy (An autonomous Institute of Ministry of New & Renewable Energy), Kapurthala, Punjab) and Neetu Gupta (Student (MBA), Annamalai University, Tamil Nadu), published in Abhinav, National Monthly Refereed Journal of Research in Commerce and Management, Volume No-02, Issue No-04, ISSN:2277-1166, 2013, Page No: 06-12.
3. Dr. Biswanath Ghosh (2011) “Industrial Relations of Developing Economy” (First Edition), Published by Himalaya Publishing House, Girgaon, Mumbai, Page No: 48-51.
4. Industrial Relations & Collective Bargaining (Theory & Practice), Second Edition, by Nirmal Singh & S.K. Bhatia, Deep & Deep Publications Pvt. Ltd. New Delhi, 2006, ISBN: 81-7629-264-8.
5. Managing Trade Unions at the Firm Level & the Dynamics of Collective Bargaining, Indian Journal of Industrial Relations, Publisher: Shri Ram Centre for IR & HR New Delhi, ISSN Number: 0019-5286, Volume No-04, Issue No-01, 2008, Page No: 117-129.

VOLUME NO. 6 (2016), ISSUE NO. 09 (SEPTEMBER) ISSN 2231-1009
INTERNATIONAL JOURNAL OF RESEARCH IN COMPUTER APPLICATION & MANAGEMENT A Monthly Double-Blind Peer Reviewed (Refereed/Juried) Open Access International e-Journal - Included in the International Serial Directories
http://ijrcm.org.in/
84
6. Michael Armstrong (2006) has described Collective bargaining process in his book “A Handbook of Human Resource Management Practice”, tenth edition, ISBN 0-7494-4631-5, published by Kogan Page Limited.
7. Paul Marginson (Industrial Relations Research Unit, University of Warwick, Coventry, United Kingdom), The changing nature of collective employment rela-tions, 2015, Employee Relations (Special Issue: The changing face of employment relations), ISSN: 0142-5455, Volume No- 37, Issue No-06, Page No: 645-657.
8. Research Paper Commerce Management Laws and Realities of Collective Bargaining Agreement (CBA) in Indian Industries DEBAYAN NANDI Department of Business Administration Siliguri Institute of Technology Salbari. P.O. Sukna. Volume No-4, Issue No-7, July-2015, ISSN: 2277 – 8160.
9. S. Murty and R. K. Das, Emerging trends of industrial relations: the case of collective bargaining practice in Indian steel industry, Indian Journal of Labor Economics, ISSN: 0971-7929, Volume No-30, Issue No-04, 1998. Page No: 295-305.
10. Subba Rao, A.V-Collective Bargaining in Indian industries-Indian Journal of Social Work, ISSN: 0019-5634, Volume-22, Issue No-02, 1961, Page No: 81-88. 11. V. Prasad and Vijay Durga, “Collective Bargaining – Its Relationship to Stakeholders” Indian Journal of Industrial Relations, Publisher: Shri Ram Centre for IR
& HR New Delhi, ISSN Number: 0019-5286, Volume-45, Issue No-02, 2009.

VOLUME NO. 6 (2016), ISSUE NO. 09 (SEPTEMBER) ISSN 2231-1009
INTERNATIONAL JOURNAL OF RESEARCH IN COMPUTER APPLICATION & MANAGEMENT A Monthly Double-Blind Peer Reviewed (Refereed/Juried) Open Access International e-Journal - Included in the International Serial Directories
http://ijrcm.org.in/
85
REQUEST FOR FEEDBACK
Dear Readers At the very outset, International Journal of Research in Computer Application & Management (IJRCM) acknowledges & appreciates your efforts in showing interest in our present issue under your kind perusal. I would like to request you to supply your critical comments and suggestions about the material published in this issue, as well as on the journal as a whole, on our e-mail [email protected] for further improve-ments in the interest of research. If you have any queries, please feel free to contact us on our e-mail [email protected]. I am sure that your feedback and deliberations would make future issues better – a result of our joint effort. Looking forward to an appropriate consideration. With sincere regards Thanking you profoundly Academically yours Sd/- Co-ordinator
DISCLAIMER The information and opinions presented in the Journal reflect the views of the authors and not of the Journal or its Editorial Board or the Publishers/Editors. Publication does not constitute endorsement by the journal. Neither the Journal nor its publishers/Editors/Editorial Board nor anyone else involved in creating, producing or delivering the journal or the materials contained therein, assumes any liability or responsibility for the accuracy, completeness, or usefulness of any information provided in the journal, nor shall they be liable for any direct, indirect, incidental, special, consequential or punitive damages arising out of the use of infor-mation/material contained in the journal. The journal, neither its publishers/Editors/ Editorial Board, nor any other party involved in the preparation of material contained in the journal represents or warrants that the information contained herein is in every respect accurate or complete, and they are not responsible for any errors or omissions or for the results obtained from the use of such material. Readers are encouraged to confirm the information contained herein with other sources. The responsibility of the contents and the opinions expressed in this journal are exclusively of the author (s) concerned.

VOLUME NO. 6 (2016), ISSUE NO. 09 (SEPTEMBER) ISSN 2231-1009
INTERNATIONAL JOURNAL OF RESEARCH IN COMPUTER APPLICATION & MANAGEMENT A Monthly Double-Blind Peer Reviewed (Refereed/Juried) Open Access International e-Journal - Included in the International Serial Directories
http://ijrcm.org.in/
II