
Download PDF - OpenSky
66
-
Upload
khangminh22 -
Category
Documents
-
view
2 -
download
0
Transcript of Download PDF - OpenSky


<3-2
CT>
3Xoc c
4<
S 6
L D 8O
z 10
X 12oc c
<14
LU
00 18LUC C
21oC C 25LUXo_ 28COO2 32I—< 37c c
O40
U_43
C C
LUh- 482LUo 50
_ l 55<2O 59h-< 652
ATMOSPHERIC TECHNO LO GY is p u b lis h e d f o r th e NCAR Atmospheric Technology Division, W esley S. M e la h n , A c t in g D ire c to r . F a c ilit ie s o f th e A tm o s p h e r ic T e c h n o lo g y D iv is io n and th e ir heads are: Research Aviation Facility, J o h n W . H in k e lm a n J r.; National Scientific Balloon Facility, A lf re d S h ip le y ; Computing Facility , G . S. P a tte rso n J r .; Field Observing Facility , R o b e rt S e ra f in ; Research Systems Facility, D av id W . B argen.Publication Manager: H a rry B . V a u gh a n , A tm o s p h e r ic T e c h n o lo g y D iv is io n ; Guest Editor: W illia m J. Landsperge r, N a tio n a l S c ie n t if ic B a llo o n F a c il i ty .
E d ito r: R ona ld C o x ; Managing Ed ito r: J u d ith G oode ; A rt D irector: W illia m H e m p h ill; Layout: H ow ard Crosslen; Copy Editors: M arie B o yko , K . Redm an; Graphic Production: John B azil, B e tty Cross, Lee F o rt ie r , Ju s tin K itsu ta ka , Barbara M eric le , M ichae l S h ibao ; Photography: Charles Sem m er, R o b e rt Bumpas, A n th o n y Galvan I I I , G inger W adle igh ; Production Assistants: C onnie C harbonneau, Janet S hed lovsky.
The National Center fo r Atm ospheric Research (NCAR) is operated by the nonpro fit University Corporation fo r A tm ospheric Research (UCAR) under the sponsorship o f the National Science Foundation. NCAR is an equal opp o rtun ity employer.
UCAR Member Institutions: University o f Alaska, U niversity o f Arizona, California Institu te o f Technology, Un iversity o f California, Catho lic University o f America, University o f Chicago, Colorado State University, Un iversity o f Colorado, Cornell University, University of Denver, Drexel University, F lorida State University, Harvard University, Un iversity o f Hawaii, University o f Illino is at Urbana-Champaign, Iowa State University, Johns Hopkins U n iversity, Un iversity o f M aryland, Massachusetts Institu te o f Technology, M cGill University, University o f M iami, University of Michigan, University o f Minnesota, University o f Missouri, Un iversity of Nevada, New Mexico Institu te o f M ining and Technology, State University of New York at A lbany, New York University, Ohio State University, University o f Oklahoma, Oregon State University, Pennsylvania State University, Purdue University, Rice University, Saint Louis University, S tanford University, Texas A & M University, University o f Texas, University of T oronto , Utah State University, University o f Utah, University o f Washington, University o f Wisconsin, Woods Hole Oceanographic Ins titu tion .
P u blished q u a r te rly in M arch, June, S e p tem be r, and D ecem ber b y th e N a tio n a l C en ter fo r A tm o s p h e r ic Research, 18 50 T a b le Mesa D rive (Post O ff ic e B o x 3 0 0 0 ), B o u ld e r, C o lo ra d o 8 0 3 0 3 . Second class postage
p a id a t B o u ld e r, C o lo ra do . S u b s c r ip tio n s fre e on request. ■Cover by Howard Crosslen

The Scientific Contribution
of Balloon-Borne Research
The Scientific Balloon Facility was the first o f the NCAR Facilities; established in 1961, it becam e fully operational in 1963. Over the ensuing years it has built a sound record, bo th for direct support to scientific investigators and for the development and refinem ent o f ballooning techniques.
When the Facility was founded, we anticipated that it w ould play an increasingly im portant role in the atm ospheric sciences. As we expected , many atmospheric problems have indeed been studied through balloon-borne equipm e n t , especially w ith the growing emphasis on stratospheric chemistry. What we did not anticipate was the great upsurge of in terest in the “new astronom y”— studies o f the universe by means o f observed cosmic rays, gamma and X rays, and infrared radiation. Since this developm ent occurred, balloon flights in support o f various fields o f astronom y and space science have numerically overshadowed flights supporting the atm ospheric sciences and solar physics.
As a result, we were frequently asked (and we asked ourselves) whether the N ational Center for A tmospheric Research is the proper institution to support a facility primarily com m itted to non-atm ospheric science. In March1971, the UCAR Board of Trustees appointed an ad hoc com m ittee to address this question; its members were Wilmot N. Hess (chairm an), Henry G. Houghton, and John C. Beckman.
In October of the same year, the com m ittee reported its conclusion that th e B a llo o n Facility represented a unique and outstanding capability im portan t to many scientific disciplines and that it had prospered under its p r e s e n t management. Therefore, although the atmospheric sciences would probably remain a m inority of the Facility ’s users, the com m ittee recommended tha t the Facility should be continued under the jurisdiction o f NCAR. UCAR considered and adopted this recom m e n d a t io n and now is constantly striving to improve not only the service, but also the techniques used for setting
priorities for experim ents from disparate fields. We are proud of the Facility , now retitled the National Scientific Balloon Facility, and its support to science, and will make every effort to ensure its continued success.
I would like to express my personal thanks to past and present members of the NCAR Panel on Scientific Use of Balloons and its successor, the UCAR NSBF Budget and Program Com m ittee, for their advice and criticism over the years. We have often asked their assistance and it has always been willingly given. The success o f the Facility is in large part due to their help.
John W. FirorDirectorNCAR
David Atlas, originator o f Atm ospheric Technology and Director o f the Atm ospheric Technology Division (ATD) for the past 16 m onths, was recently appointed Director o f the National Hail Research Experim ent. Wesley S. Melahn is serving as Acting D irector o f ATD.
2

‘hat Outfit in Texas
T h is issue o f Atm ospheric Technology, devoted to scientific ballooning, appears soon after the ten th anniversary of the first balloon flight from our station in Palestine, Texas. It has been an exciting and rewarding decade for the facility. We are now more than 800 flights older than when we first set up shop in the old arm ory on the University o f Colorado campus.
What is the National Scientific Balloon Facility? Why was it formed? I am sure these will be the most frequent q u es tio n s from readers outside the sc ien tific com m unity that uses the balloon as a research tool. As one of the first facilities to be formed at NCAR, the balloon group was organized to m eet the requirem ent for a national agency, devoted specifically to scientific ballooning. The mission of the NSBF is to:
• Plan and develop facilities and to provide ballooning operational services to m eet the ballooning req u ir e m e n ts o f th e sc ien tific com m unity;
• Work to m eet future scientific b a l lo o n in g n e e d s by keeping abreast o f the plans for research involving the use o f balloons, and by translating these plans into requirem ents and perform ing the research and development and test and evaluation necessary to provide advanced ballooning services; and
• Provide consulting services in the field o f scientific ballooning.
O r ig in a l ly s t r u c tu r e d w ith the management and engineering arms situated in Boulder, Colorado, and operations in Palestine, the facility is now concentrated in its entirety at the Palestine location. From this consolidated base the NSBF technical staff offers the scientist com plete support in balloon launching, tracking and recovery, data r e t r ie v a l , e n g in e e r in g a s s is ta n c e , machine shop and photo facilities, and program management. The adm inistrative staff, in addition to keeping our own house straight, is available for assistance in emergency procurem ent, customs, TWX messages, and for the m ultitude o f other small efforts that a group seems to need when they are operating away from home.
The com petent and experienced staff o f supervisors, engineers, and technicians has enabled the NSBF to achieve national and international prominence in the span o f the facility’s existence. We have served more than 75 different U.S. and foreign universities and research institutions since 1961.
Our crews range over the world in their support o f experiments in cosmic ray and particle astronom y, in x-ray and gamma ray astronom y, in optical, infrared, and ultraviolet astronom y, and in cosmic dust research, aeronom y, and th e atm ospheric and environm ental sciences. Even if you run through the list quickly, that is still a lo t o f science.
Y o u might ask what manner o f people it takes to make a balloon facility tick. Com petent minds and physically sound bodies are prerequisites, o f course, but it takes more than that. Dedicated people with a flair for the unusual, who thrive on m atching wits w ith the scientists’ inventiveness, who cannot rest while a flight is in the air, and who seem to be stimulated by the
long hours of hard w ork— these are balloonists. Balloonatics, we are sometimes called. That in itself sets our people apart.
T h e National Science Foundation supports the NSBF and provides the tools necessary to accomplish our task, for which we and the scientific com m unity are deeply grateful. The personal reward, however, which we have very strong feelings about, is the close association w ith the experim enters and sharing in bo th the joy o f success and the burden o f failure when it occurs. The NSBF can proudly claim a strong assist in the award o f over 100 Ph.D.s as a result o f flights made by the facility. We have put approxim ately 238 T o f scientific equipm ent into the skies since 1963 and are regularly flying balloons that would engulf a football field with room to spare.
What o f the future? As we satisfy each new requirem ent, the scientific com m unity renews the challenge. The NSBF will conduct more than 100 flight operations this year. If this increase in demand and activity is any indication, the “gas bag” will be needed for a long time to come. The renaissance of the balloon has barely begun.
Alfred Shipley ManagerNational Scientific Balloon Facility
3

The Balloon RediscoveredAlfred Shipley
T h e versatile balloon— aeronaut’s o b s e s s io n , ch ild ’s delight, tool o f science, and weapon o f war. This rem arkable invention o f the brothers M o n tg o lf ie r , apply ing Archim edes’ principle almost 2,000 years after his death, was undoubtedly greeted by 18th c e n tu ry scientists w ith the lament, “Why didn’t we think of it before?”
Much o f what we are doing in scientific ballooning today has been thought o f before. Some refinem ent has taken place, o f course, but many of the basic ideas form ulated by early aeronauts are still in use today. The load lines, the valve, the rip panel, the open appendix, even the foreshortened parachute, have all been rediscovered by the m odern day balloonist. W ouldn’t Roger Bacon and Father Lana, who fostered the theory of the superpressure sphere, marvel at the success o f today’s globe-circling Mylar s u p e rp re s s u re balloons? And Felix Nadar, who lifted a several-thousand- p o u n d , tw o - s to r ie d g o n d o la in 1863— w hat would be his response to Stratoscope II flights carrying tons of telescopic gear aloft to 24 km?
Although we owe m uch to the inventiveness of ballooning pioneers in the late 18th and early 19th centuries, their discoveries were made during a relatively inactive scientific era. As w ith m a n y o f t o d a y ’s scientific breakthroughs, the m anned balloon often fo u n d its prim ary application as a w eapon of war. Benjamin Franklin wrote in 1783:
T h e in v e n tio n o f the balloon appears to be a discovery o f great im portance and w hat may possibly give a new turn to hum an affairs. Convincing sovereigns of the folly
o f wars may perhaps be one effect o f it, since it will be impracticable for the m ost po ten t o f them to guard his dominions. Five thousand balloons capable of raising two m en each, could not cost more than five ships of the line; and where is the prince who could afford so to cover his country with tro o p s for its defense as that10,000 m e n descending from clouds might not in many places do an infinite deal o f mischief before a force could be brought to repel them?
F ranklin’s words of wisdom about the com bat capabilities o f the balloon may have been a portent o f m odern warfare strategy.*
Modern balloonists can equate many o f their present activities w ith feats o f the past. The rush of the early aeronauts to escape the bonds of M other E arth in the 18th century, however, cannot com pare w ith the flurry o f ballooning that h a s o c c u r re d during the last two decades. Its development overshadowed, even in war, by high-flying maneuver- able aircraft, the free balloon remained virtually unchanged for nearly 100 years after the flight o f Nadar’s “Le G eant.”
Only in the early 1940s, w ith the availability o f plastic films tha t could be easily sealed and would w ithstand the rigors o f the environm ent, did major breakthroughs in design and m anufacture become possible. Not surprisingly,
*F ranklin witnessed the firs t manned ascent by Pilatre de Rozier in October 1783. When later questioned by a skeptic, “ O f what use is such a device?” he is said to have rejoined, “ O f what use is a newborn babe?”
the rediscovery o f the balloon received its primary im petus from military research and development efforts. In the early 1950s, a few years after General Mills, Inc., began w ork on the developm ent o f plastic balloons, a project titled “ Research and Development in the Field o f High A ltitude Plastic Balloons” was sponsored by the jo in t m ilitary services and conducted by the University o f Minnesota. This project was probably th e m o s t com prehensive scientific exam ination o f the balloon since its invention. Out o f this program, scientific ballooning has evolved rapidly to its present advanced status.
Most o f the major nations of the world now support scientific ballooning efforts o f their own, resulting in hun dreds o f launches annually. These flights have afforded yet another possibility for in te r n a t io n a l c o o p e r a t io n in the sciences. While the United States took the lead in revitalizing the balloon and its use in scientific research, other countries such as Russia, Japan, France, and India are also now prom inent in the m anufacture o f materials and balloons. Let us take a brief look at how the state o f the art o f scientific ballooning has progressed over the two decades since the M innesota program was initiated in late 1951.
The Fifties
When the five-year M innesota p rogram ended in 1956, scientists were already taking advantage o f the plastic balloon to reach previously unattainable altitudes. Manned flight during the last half o f the decade helped provide some o f the needed answers for m an’s push
4

r 325into space. Altitude records for bo th manned and unm anned balloons were continually pushed upward.
The Sixties
Manned scientific flights all but disappeared by 1962, the year in which the NCAR Scientific Balloon Facility was founded, with a flight station at Palestine, Texas. The average volume of balloons being flown climbed from just under 85,000 to 227,000 m 3 (3 million to 8 million f t3) by the end of the decade. By 1967, the 300,000 - m 3 ( 10.6 million f t3) balloon had become a w ork horse. Balloons having volumes of4 2 0 ,0 0 0 - 5 7 0 ,0 0 0 m 3 ( 1 5 - 2 0 m illion f t3) started appearing in 1968 and 1969.
In 1962 the Air Force Cambridge Research Laboratories had set a flight duration record using a Mylar superpressure sphere 10 m (34 ft) in diameter that stayed aloft for 30 days. By 1966, superpressure balloons were circling the southern hemisphere for the GHOST (G lo b a l Horizontal Sounding Technique) program. As space age electronics were adapted to ballooning, experim ents became more com plicated and average payloads increased from 140 kg (3 0 0 1 b ) to over 4 5 0 k g (1,0001b). Proving its capabilities and reliability, the balloon platform became a testing ground for experim ents destined for satellites.
The Seventies
W in zen Research Inc. responded to d e m a n d s for even greater altitu d e by deve lop ing 850,000- and 1,300,000-m3 (30 and 47 million f t3) p o ly e th y le n e balloons. Large Mylar superpressure spheres m anufactured by Raven Industries, Inc., and having higher load-carrying capabilities were successfully flown. During 1973, one such sphere carrying 68 kg (1501b) made two circles around the southern hem isphere in 36 days before its recovery in Australia, 14 km (9 mi) from the launch p o in t . Payloads o f 1,800 - 2 ,300 kg ( 4 ,0 0 0 - 5,000 lb) are launched routinely.
(a)
z>ooCO
300
- 275
- 250
(b) 2000
1900-
1800-
1700 -
1600-
1500 -
1400-
1300 -
1200 •CO 1100 Q^ 1000
2 900 •
800 -
700
600
500 -
400
300 -
200 -
100 -
The average balloon volumes and payloads flo w n by the N SB F from 1964 through 1973 are shown by graphs (a) and (b), respectively. B oth categories show lower figures fo r 1973, even though the num ber o f N SB F flights increased by approxim ately 25% that year. Continued refinem ent o f experim ents and more atmospheric science and infrared experim ents with lighter gondolas account fo r m ost o f the decrease.
5
KILO
GR
AMS
THO
USA
ND
S OF
CU
BIC
ME
TER
S

I do not think it is possible to forecast exactly how ballooning will develop during the rest o f the present decade. Greater altitudes, longer flight durations, and greater load-carrying capability , I believe are all w ithin reach. Perhaps in six years we will see polyethylene replaced by a new m aterial for scientific ballooning. We may see a new generation o f miniaturized experim ents as longer exposure times become available. An international balloon network with superpressure balloons circling the northern hemisphere is possible. At any rate, I do not believe the balloon will fade into obscurity for a long time to come. And even if it does, it will likely be rediscovered once more by a future generation. •
A lfred Shipley is the Manager o f the NSBF. N ow in his 13th year with the facility, he has also served as a project engineer and supervisor o f operations. His professional training includes U.S. A ir Force courses in aircraft maintenance, fligh t engineering, weather, electronics, and management. O f his 17 years in the A ir Force, 11 were spent in meteorological equipm en t testing and engineering; he supervised those functions at Eglin A ir Force Base A ir Proving Grounds and AFC RL. Shipley has also w orked as a fie ld project engineer in the Research Division o f the Teledynamics Division, Am erican Bosch Arm a Corporation.
Flight Operations ServiceA £< M U l 0 ^ 'IfoH * D tif id Robert S. Kubara
The job o f the NSBF Operations D epartm ent really begins when the engineers, designers, and scientists have com pleted their assignments. When the experim ent is ready, “ Flight Ops” is responsible for conducting a safe and successful scientific ballooning operation. This means putting the balloon and payload at the desired float altitude for the required period, providing the system for scientific data retrieval and g o n d o la control, and returning the e x p e r im e n t — h o p e f u l ly in good condition— to the point of origin.
Ballooning operations were once a simple task that any enthusiastic group o f scientists could carry out unaided; now they have evolved into a complex exercise and require a precisely coor
dinated interface among technicians, machines, and electronics.
A typical balloon flight today may involve launch vehicles as large as the heaviest earth movers, multiengine aircraft w ith the m ost sophisticated instrum entation and com munications gear, special recovery vehicles capable of hoisting 4,536 kg (10,000 lb), and com puters. The list of special equipm ent and skills required for the NSBF to fulfill its mission would fill several pages.
A brief look at our history shows that over the last decade we have served 55 universities, 17 government agencies, and six other research organizations with more than 900 balloon flights. Average payloads have increased from
181kg in 1963 to 680 kg in 1973. Average balloon volumes have increased during the same decade from 85,000 m “ to 2 6 9 ,0 0 0 m3 . Maximum balloon sizes— w ith their high demands on m a n u fa c tu r in g t e c h n o lo g y — have s t e a d i l y in c re a s e d : in 1 9 6 8 , a425,000 - m3 balloon was the largest flown, and in 1974, flights are planned using 1,416,000 - m 3 balloons.
Striving to keep pace w ith these scientific needs, the Operations D epartm ent has launched payloads ranging in weight from less than 45 kg to more than 4,500 kg and reached altitudes of more than 47 km w ith balloons larger than 1,019,400 m 3 ; average flight durations have tripled over the ten-year period.
6

" F lig h t O ps" Organization
The Operations D epartm ent consists o f fo u r sections representing four d is t in c t f u n c t io n s that contribute specific skills to the m any phases o f preflight preparation and are combined in a team effort for the actual flight. The sections and their responsibilities are described below; the services they provide are then discussed in some detail.
• A dm inistra tion . Provides overall management o f operations, handles flight requests, corresponds with scientific groups to explain pertinent operations details, procures balloons, and maintains balloon inventories and historical records.
• Flight Operations. Provides in terface rigging to the scientific gondola and launch, tracking, and recovery services.
• Flight Electronics. Provides the data retrieval system and electronics for the gondola and balloon control.
• M eteorology. Provides inform ation and forecasts for all meteorological param eters concerned w ith the balloon flight.
Adm inistration
Aside from its management function, the section’s main service is to establish procedures to m aintain a thorough and effic ien t interchange o f inform ation w ith the scientist to insure a successful flight. The scientist m ust know what services are available, how he can arrange for his flight, and w hat kinds o f balloons, flight electronics equipm ent, rigging facilities, and meteorological support will be provided.
• R equest fo r Flight Support. All formal requests for flight support are made to the NSBF Operations D epartm ent on an NSBF Flight Request Form. This form is evaluated to determine operational requirem ents. Copies o f the form can be obtained from: National Scientific Balloon Facility, Operations D ep a rtm en t, Post Office Box 1175, Palestine, Texas 75801. Com plete flight
operations services are provided to the U.S. scientific com m unity at essentially no charge; separate financial arrangem ents m ust be made by foreign experimenters. Support includes allocation of space for preparing experim ents, flight rigging (including parachutes, ballast, crush pads), meteorological services, and launch, tracking, and recovery.
• Balloon Consulting Services. The first step in selecting a balloon is to evaluate the scientific requirem ents for the flight specified on the request form. P e r t in e n t inform ation includes the nature o f the experim ent, its estimated weight, and the desired float altitude and duration. If possible we select a balloon from our inventory of stock b a l lo o n s , which generally have no special design features and are available in sizes to m eet a wide range o f payload and altitude requirem ents. The stock balloons are selected from com petitive bids by balloon m anufacturers on the basis o f cost, reliability, and technical specifications. When a stock balloon is assigned to a program, the user incurs no cost until after the flight.
If no stock balloon is suitable NCAR generally purchases a balloon m anufactured according to the required technical specifications. An NSBF Balloon Selection Com m ittee chooses the balloon unless the scientific user directs otherwise. The user is billed for the balloon’s cost when it is delivered to the NSBF.
Fligh t Operations
When the scientist has readied his experim ent for flight, flight electronics have been checked out, and the m eteo ro lo g ic a l conditions are favorable, flight operations takes over to rig the experim ent and to conduct the launch, tracking, and recovery.
• Preflight Rigging. The NSBF has full rigging capability for integrating the scientific gondola into the balloon flight train. All necessary supplies (in addition to flight electronics), such as cables, parachutes, and hardware, are provided.
• Launch. Different launch techniques are used, depending on the
balloon system and the size o f the experim ent. The most common technique is the dynam ic launch in which a launch vehicle is used to support the gondola before launch. The inflated balloon bubble is constrained by a spool and then released; the launch vehicle maneuvers the payload directly under the ascending balloon. When the balloon is fully extended above the payload, the launch vehicle lets the payload go. The dynam ic launch allows com pensation for changes in surface wind directions; it can be used in winds as strong as 10 k t, depending on the length o f the system, the maneuvering area, and the type o f vehicle used. The longest o f the facility ’s vehicles is Tiny Tim, a specially designed, 4 7 ,1 7 4 -kg (52 - T) vehicle that has launched gondolas as tall as 10 m and as heavy as 2,800 kg.
Static launches are generally used for tandem balloon systems and are preferred for very heavy payloads. A tandem system consists o f a top balloon and a main balloon, separated by a transfer tube. The top balloon holds enough gas at launch to lift the entire system; during ascent the expanding gas from the top balloon flows to the main balloon. Before launch the entire balloon system is erected over the payload under continuous control o f a winch vehicle. The main balloon is sheathed in a plastic reefing sleeve to prevent sailing prior to launch. The winch vehicle used at the NSBF has a capacity o f 1.05 km (3,460 ft) o f 1 .6 -cm (5/8 - in.) cable and can safely handle cable tensions as great as 18,144 kg (40,0001b). Gross loads o f 6 ,350 kg (14,000 lb) have been launched by the NSBF using the static launch technique.
• Tracking. To make the accurate position reports o f the balloon’s trajectory now essential for many scientific experim ents, we provide continuous tracking using radar, radio direction finding, and electronics navigation techniques. We operate two twin-engine tracking aircraft.
• Recovery. The safe recovery and return o f scientific equipm ent is o f great concern to operations personnel. Experien ced technicians make up the
7

ground recovery crew; they are guided by the tracking aircraft to the scientific gondola and use specialized equipm ent to handle and transport it.
Fligh t Electronics
The Flight Electronics Section p rovides balloon control telem etry, altitude se n so rs , telecommands, and ground support equipm ent. A new-generation Consolidated Instrum ent Package (CIP) will soon be operating w ith a single command system for both balloon control and scientific commands, as well as a telem etry system capable of handling data transmissions on the flight over a command radio frequency carrier. The ground station associated with the CIP will record scientific data and flight param eters including time, altitude, and balloon position on increm ental magnetic tape for post-flight processing. (The CIP package and ground station are described more fully in the article entitled, “ A New PCM Command System for Balloon-Borne Experim ents.” )
M eteorology
The Meteorology Section supports all phases o f the ballooning operation.
Each flight is preceded by a weather b r ie f in g that includes forecasts for launch conditions, float trajectory, en- route weather for the chase aircraft, and descent area weather. A continuous weather watch is m aintained while the balloon is in flight. F urther, limited m e teo ro lo g ic a l support is given to balloon launches conducted by the NSBF at locations other than Palestine. The Meteorology Section responds to many meteorological inquiries from the scientific com m unity, especially in relation to climatology.
Rem ote Operations
In addition to the balloon launches made from our base at Palestine, Texas, the NSBF has launched balloons from m any U.S. locations and six foreign countries, providing launch, tracking, electronics, and recovery support. The facility is responsible for diplom atic clearances and logistic support. We plan to continue to provide support consistent w ith the demands o f the scientific com m unity, and we will consider requests for flight support from any location in the world. •
Balloon Tracking System
7{Je *)t *)&
“Where’s it at?” This is one of the questions most often asked o f the personnel in the control room during a balloon flight. It may come from NSBF personnel or from someone in another scientific group that is ready to fly and wants to know the speed and direction o f the float wind. The person most
concerned is the scientist involved with the experim ent in the air. The better he knows the balloon’s geographic location, the more accurate his pointing system is, and hence the more valid his data. It is also necessary to know the balloon track to insure a safe and convenient recovery of the payload.
R obert S. Kubara is the head o f the Operations D epartm ent o f the NSBF. He has 20 years o f experience in scientific ballooning, including more than 11 with N C A R, which he jo ined in 1962 as a fie ld engineer. He has managed operational balloon programs in India, Panama, Brazil, and Argentina, and is the author o f several papers in the fie ld o f scientific ballooning.
Earl E. Smith
Several m ethods are used for balloon tracking. The ones m ost often used are visual sighting, aircraft, radar, radiosonde, and a navigation system (Omega in our case). Each m ethod, and its relative merits, is discussed below. Among the other m ethods that can or have been used for tracking (though no t by the
8

NSBF) is the detection of the azimuth o f an on-board transm itter using phased antennae. A tone is transm itted from the ground to an on-board receiver, then retransm itted to the ground where the phase relation is measured and converted to distance in miles.
Visual Tracking
Visual tracking requires a theodolite to measure the balloon’s azim uth and elevation angles. The line-of-sight distance to the balloon is calculated from its trigonom etric relation to the balloon’s altitude. High accuracy requires care in setting up the theodolite and exact knowledge o f the balloon’s altitude above ground level. The calculated position will normally be correct within2 km or less, but the useful range is affected by atm ospheric visibility; the m ethod is usable only in daylight hours w ith a minimum o f cloud cover.
A ircraft
The pilot o f the tracking aircraft can often make visual sightings; then, when he is under the balloon, he can obtain a fix on this position using data obtained from Visual Omnirange (VOR) stations, which have distance-measuring equipm e n t . In add ition , the aircraft is equipped w ith radio direction finding (DF) gear for use at night or when the sky is overcast. The DF set is tuned to the radio frequency carrier on the balloon, and phase measurem ents are made o f the signal as received on the antennae and displayed on a m eter. This gives the azim uth o f the transm itter from the aircraft. When the DF is directly under the "balloon the signal received is the same from all sides so that a cone of silence is detected. Again, the pilot can fix his position, using ground equipm ent, and relate this to the balloon position, w ith a normal lim it o f accuracy o f 8 km. Accuracy is not only affected by factors such as the exactness with which the pilot can determine w hether he is under the balloon, the radiation patterns o f the transm itter antenna, and the frequency used, but also by atmospheric disturbances such
as those generated by thunderstorm s.
Radar
Radar tracking is one o f the m ost accurate m ethods. The M33 radar used in Palestine is lim ited to a range of about 91 km and is mainly used for ascent tracking. Longer range radar is prohibitively expensive, and more than one unit would be needed to cover long float trajectories or flights at locations other than Palestine. Some tracking inform ation can be obtained from the FAA air traffic control center radar, but since balloon tracking is no t one o f the FAA’s major responsibilities, tracking data from the center will not always be readily available. A radar target or aircraft-type transponder w ith a unique identifying code for NSBF balloons is flown on every flight so that air traffic controllers can more easily track and identify the balloon for their own purposes.
Radiosonde
The radiosonde system was developed for the collection of weather data such as pressure, air tem perature, relative hum idity, and position, for the calculation o f wind speed and direction. For balloon tracking, only the position is o f primary interest. A 300 - mW transm itter operating at ~ 1 6 8 0 MHz is flown w ith the balloon and the signal is received on the ground w ith an autom atic trac k in g dish antenna. Servo transm itters coupled to the antenna transm it the azim uth and elevation angles to receivers at a remote readout and printer. The altitude inform ation received via telem etry is used together w ith the elevation angle to com pute the distance ou t; geographic position can then be p lo tted using the azim uth. The m ethod is very accurate out to about 250 km where the elevation angle is ~ 5 ° . Distances measured w ith smaller elevation angles are generally unreliable.
Navigational System s
The NSBF considered several navigation systems to find a tracking m ethod
that would be accurate, low-cost, long- range, and easily adapted to balloon flig h ts . Loran C, which operates at 100 kHz, was unsuitable because the necessary bandw idth overlapped the te le m e try data bandwidth. F urtherm ore, the system was designed for ship navigation and a balloon trajectory would quickly move beyond its range. A nother system considered was the VOR m ethod used by aircraft. The airb o rn e multi-channel receiver selects three or four o f the strongest stations, transm its the data to the ground where it is processed and the position is determined by triangulation. VOR requires co n sid erab le power and weight on board, and would be useful only where a num ber o f VOR stations existed along a float path. Satellite positioning was another possibility that was considered impractical. The only satellites available for tracking were the orbiting satellites; their infrequent appearance over the b a llo o n ’s flight area— varying from o n c e p e r 9 0 m in to o n c e p e r 12 hr— would leave long periods w ithout updated inform ation and require complex on-board equipm ent and considerable telem etered data.
Omega
The Omega system now being developed by the Navy for worldwide navigation seems to m eet the requirem ents for balloon tracking. When com pleted the Omega netw ork will be used over the entire globe. The on-board weight requirem ent is minimal and the ground processing fairly low in cost. The system consists o f a series o f eight transm itters placed so that three or more stations can be received at any global location. The basic operating frequencies are 10.2, 11.33, and 13.6 kHz. Each station will transm it for ~1 sec w ith a 0.2 - sec interval between stations, and repetitions every 10 sec. Each station can be identified by the length o f its transm ission. A phase com parison o f two stations gives a line o f position (LOP) w ith each zero crossing considered one lane. If three stations are received, one is chosen as the reference station and phase measurem ents are made with the
9

other two. If a map w ith superimposed Omega lanes is used, the analog phase inform ation can be used to p lot positions, or the analog signal can be digitized and fed into a com puter for position calculation. Since the LOPs are hyperbolic, the calculations are somewhat com plicated on a spherical surface.
To use the Omega system, a known position m ust be established in relation to a set o f LOPs, and from that time on only the LOPs are needed for position inform ation. If, however, one pair of LOPs is in terrupted for a period long enough to lose position, then some means must be available to find the relation between the actual position and the LOP. The diurnal shift o f the ionosphere and the presence o f atmospheric noise do cause some inaccuracies in the positions. If no correction is made, there may be a 10- to 15 - km error, but w ith signal-averaging and diurnal-shift corrections the position can easily be d e te r m in e d w ith an accuracy of ±2 - 4 km.
For balloon tracking, an Omega receiver is flown on board. This consists simply o f a high-gain, tuned amplifier and antenna with a band pass o f about
200 cycles. The 13.6 - kHz frequency is mixed in to the telem etry video signal for transmission to the ground. Here it is fed in to an Omega receiver and the other frequencies in the video signal are filtered out. A phase com parison is made and the results are digitized and presented to a Hewlett-Packard 9100B calculator with extended m em ory. The ou tpu t is printed for real-time m onitoring and is also fed to the com puter for incorporation in the scientific data which are w ritten onto increm ental
com puter tape. The inform ation is in the form of longitude and latitude in degrees, m inutes, and tenths o f minutes. Omega tracking has been used successfully for several balloon flights. A t present, one o f the four transm itters is o ff the air for repairs and one station (located in Norway) cannot be received in the southern and western United States. Most o f the eight transm itters should be operational by 1975, making the system available for use on flights from any location. •
Earl E. Sm ith acquired a wide range o f experience in the maintenance o f ground com m unication system s during his 21 years in the U.S. A ir Force. Since his retirem ent fro m the Service in 1965, he has operated, maintained, and improved the telem etry system at the NSBF, as well as specified the operational requirements fo r the new PCM data and com m and system.
Tracking andSa^ani SoMook
The tracking and recovery phase o f a balloon flight begins long before launch, at a briefing for scientists and flight operations staff to review all operational plans and contingencies. A weather briefing follows, usually about 6 hr before the scheduled launch tim e; at its conclusion, crews and equipm ent are assigned to the flight.
T he rec o v e ry crews— who have adopted the nickname o f “ Roadrun- ners” — arrive at the NSBF 1 or 2 hr
Recovery
before launch time. A fter thorough preparation and preflight check of the tracking aircraft (including a complete run-up and equipm ent check), a flight check is made to test the com patibility and operation of the com mand radios with the command receivers on the scientific gondola.
At approxim ately the same time, the recovery vehicles are inspected for safety items and operational readiness. Aircraft and ground vehicles are equipped
Don J. Gage
with the special tools and gear needed for a safe and orderly recovery under a variety o f adverse conditions. Aboard the aircraft are portable backup radios, maps and charts covering all areas and all flying conditions (including instrum ent flight), recovery tool kits, and survival gear. Recovery vehicles are ou tf i t t e d with backup com m unications such as walkie-talkies and special equipment dictated by the kinds o f terrain and the recovery conditions anticipated.
10

A gondola is successfully recovered— despite one o f N a tu re’s unpredictable tricks.
If recovery is predicted for a remote area, water cans, extra gas cans, and survival equipm ent will also be taken.
Beginning the "Safari"
D u rin g the balloon’s launch and ascent, the aircrew remains on standby in the operations area. When the balloon has passed through the tropopause, the crew receives a final briefing that includes specific instructions from the scientists for securing the payload after impact, the latest plots o f the balloon track, and directions for check-in locations while en route to the predicted recovery area. When all preparations are com plete and radio links have been established, the crews depart— and the “ safari” has begun.
En route, the aircrew tracks the balloon w ith autom atic direction finding equipm ent, and radar fixes obtained from the Federal Aviation A dm inistration (FAA); this inform ation is used to update the balloon’s current and projected trajectory. The crew flies along the proposed flight path ahead of the balloon and com municates w ith the recovery vehicle, continuously updating inform ation on the recovery area until flight term ination.
Capture
When the desired time at float altitude has been achieved or the technical requirem ents have been m et, the balloon flight is turned over to the tracking pilot to term inate at his discretion. Using the balloon’s track and speed as a basis for their calculations, the pilot and technician file a term ination notice with the closest FAA facility, giving the balloon’s altitude, the estim ated term ination point, the proposed cut-down time, and an estimate of the location and time o f impact.
Shortly before term ination, the crew makes a final position check on the balloon to update the im pact point prediction. A t the m om ent o f term ination, com mands are sent from the aircraft to turn off, or stow, the scientific payload, and a separate command from the aircraft fires a squib to separate the balloon from the parachute and gondola, thus term inating the flight. The aircraft then begins closely following the descent portion o f the balloon flight. The pilot positions the aircraft for visual contact w ith the parachute and gondola, while the technician m onitors and records time vs altitude. Concurrently, updated reports are radioed
to the FAA and the ground position o f the recovery crew is readjusted to facilitate a speedy recovery.
Shortly before the gondola impacts a com m and is given to release the “ safety pins” on the parachute disconnector. As soon as im pact is recorded either visually or aurally, a command is sent to separate the parachute from the gondola. This precaution is taken to prevent the gondola from being dragged and to protect the parachute from damage.
Caging
Recovery begins when the flight is safely on the ground and its position is recorded accurately. The first task is to guide the ground recovery crew, which is already in the vicinity, quickly to the precise spot where the gondola fell; m onitoring from above, the aircrew directs the recovery vehicle crew to the place of impact. The m ost difficult problem o f the recovery operation is now at hand— that o f diplomatically explaining to the property owner about the presence o f the gondola on his premises. After receiving an assurance that the recovery crew will do its best not to damage or destroy property , the owner usually grants permission for access to the gondola. Upon its arrival at the scene the aircraft usually tries to land so its crew can link up w ith the ground vehicle crew to assist in recovery operations.
N e x t , the crews m ust answer a myriad o f questions from a crowd of onlookers that has assembled at the site o f im pact; finally they m ust ascertain the extent o f damage to local property
11

and to the gondola itself. “Power o f f ’ or disconnecting procedures are custom ary to pro tect scientific instrum ents and NCAR equipm ent. The parachute is then cleared o f all obstructions, rolled up, and loaded onto the recovery vehicle. Meanwhile the crew disassembles the gondola com ponents and prepares the scientific gear for proper loading.
The recovery truck then moves into position, the outriggers are set, and the hoist is readied to lift the main package o ff the ground. Because the hoist on the recovery truck is capable of lifting 5,400 kg, it can handle all but the largest gondolas. While the gondola is suspended above the ground, the trailer is p o s it io n e d underneath, and the package is lowered to the trailer bed and stowed for the ride hom e, amply secured to insure its safety. The crew then cleans up the recovery area, for ecological reasons and to satisfy the property owner. Damage is repaired if possible, or the owner is com pensated for the un repaired portion o f his property.
A fter the vehicle is rechecked to see tha t its cargo is secure, the somewhat slower journey home begins. When the recovery vehicle and crew arrive back at the base, all scientific instrum ents are returned to the scientist’s working area. NCAR instrum ents and hardware are returned to their respective shops for a thorough inspection, adjustm ent, and repair in preparation for use in the next scientific experiment.
This account has been somewhat idealized and describes a normal daytime balloon flight w ith an easy trajectory and a slow speed. But every flight has its own “ personality.” For instance, the gondola may land in a swamp or in heavy roadless woods, challenging the ingenuity of the recovery team. Mechanical failures o f equipm ent, either in the air or on the ground, or the occurrence o f one of N ature’s unpredictable tricks can turn a tedious job into a unique experience. But despite many obstacles, the “ R oadrunners” are faithful to their slogan to “bring ‘em back alive.” •
M eteorological Services
“ . . . but nobody does anything about it.” If he were alive today, Mark Twain would find we are trying to do something about it. The degree to which we can succeed remains to be seen. In any case, the famous author would surely be astonished by the progress and improvem ent in weather forecasting during the past several decades. And nowhere, in the opinion of this writer, is the need fo r a c c u ra te prediction o f various weather parameters more essential than
in support o f scientific ballooning.
Weather Requirem ents
Accurate and timely prediction of meteorological factors is required for each phase o f the balloon flight: launch, a s c e n t, trajectory, descent, and recovery; a com plete flight forecast is also needed for the balloon-tracking aircraft. A n inaccurate or less-than-complete forecast could result in a flight failure.
D on J. Gage received a B .A . in philosophy fro m Loras College,D ubuque, Iowa, in 1960, and com p leted his training as a naval aviator in 1962. He spent six years on active du ty in the U.S. Marine Corps as an aviator and a training o fficer in aerial observation, and a year and a ha lf as a fir s t o fficer fo r N orthw est Orient Airlines. For the last six years he has p ilo ted the N SB F aircraft used to track balloons launched fro m Palestine and o ther fie ld sites, including Argentina. He has supervised and w orked w ith recovery crews fo r alm ost 400 flights.
William J. Landsperger\
Some examples easily come to mind: an erroneous wind forecast could lead to destruction o f the balloon on the launch pad, as well as damage to or loss of the scientific package; a badly missed trajectory forecast, certainly a possibility during the spring and fall reversals, might cause prem ature flight term ination (due to proxim ity of the G ulf o f Mexico and Mexico)— so prem ature that the scientist would get little or no data; a seriously inaccurate forecast o f
12

the descent vector could result in impact in an area entirely unacceptable for recovery operations; and strong, gusty surface winds could cause damage to the scientific package following impact.
The following list o f meteorological parameters critical to ballooning operations and the rigid limits imposed by each show the extent o f support required. They are not necessarily given in order o f relative im portance.
• Surface Wind at Launch. Except for small balloons, i.e., those having a volume o f less than 85 X 103 m 3 (3 million f t3), the maximum allowable wind speed (including gusts) for inflation and launch is 10 kt or less. For balloons larger than 315 X 103 m 3 (11 million f t3), the maximum allowable speed becomes progressively less than10 kt.
• Boundary Layer Winds. A correct forecast o f the structure o f the lowest 300 m in the boundary layer is at least as im portant as the surface wind forecast. The direction and speed are bo th critical. If the predicted direction for the layout o f the balloon train is wrong by more than 10 - 20°, serious problems can arise at the m om ent o f launch, when the launch director attem pts to maneuver the launch vehicle under the rising balloon; if he is unable to get under the balloon when it becomes fully erect and sim ultaneously to be moving in the same direction, an abort will probably occur.
• Hydrometeors. Most, if not all, h y d ro m eteo rs will preclude balloon inflation and launch.
• T h u n d e r s t o r m s . Thunderstorm conditions always preclude launches. E x tr e m e caution is indicated even though the nearest thunderstorm may be at least 50 km (30 mi) away from the launch site and is forecast to remain at that distance. It is strongly suspected that there may have been instances when storms at this distance have p roduced dow ndrafts, subsequently causing sudden gusts o f surface winds in excess o f 20 k t on the launch pad.
• Cloud Cover. Any layer o f clouds covering 60% or more o f the sky at altitudes below 7,315 m (24,000 ft) will preclude a launch except when the top
o f the cloud deck is at less than 1,525 m (5,000 ft).
• L o c a t io n o f th e Balloon at 22,860 m. F or air traffic control purposes, the meteorologist m ust predict the location o f the balloon as it passes th ro u g h 22,860 m (70,000 ft). This inform ation and other data are filed w ith the Federal Aviation A dm inistration (FAA) office 6 h r before launch.
• Weather fo r the Chase Aircraft. The forecast and actual weather conditions must m eet the minimum FAA requirem ents for the tracking aircraft as well as safety factors for the balloon launch, en-route, and recovery phases.
• Trajectory. The predicted trajectory m ust be accurate w ithin certain tolerances— which vary w ith the specified objectives of the scientist— and must be consistent w ith NSBF constraints. The questions we must try to answer are whether the scientist can obtain his required num ber o f hours of observation, and whether the flight can be term inated to insure a successful recovery.
• D escent Vector to Im pact Location. The margin for error in determining the descent vector is indeed
small— at least in certain instances. Every effort is made by the m eteorologist and the pilot to insure that the balloon and its scientific package will land safely and preferably in an easily accessible location.Following is a detailed description of the sequence o f events in the m eteorological support o f a typical flight.
Before the flight, the operations staff meets with the scientific group. All details o f operational support are confirmed and the time o f launch, altitude, num ber o f hours at float altitude, and the ascent and descent times are determined.
When the scientific group announces that they are ready, procedures to present their weather briefings begin. Briefings are given 7 hr or more prior to scheduled launch time. (Flight data are filed w ith the FAA not later than 6 hr before launch.) All inform ation needed to make the initial GO or NO-GO decision is presented at the weather briefing.
Pertinent weather charts, analyses, and forecasts are studied daily in the meteorological section. Upper air data from the National W eather Service are p lo t t e d and analyzed. Rocketsonde
Fig. 1 N S B F meteorologists m u st examine several parameters which will a ffect a balloon fligh t during its entire course. One such fac to r is the annual cycle o f prevailing wind speeds at various altitudes; shown here are wind speeds a t three stratospheric levels.
MONTHS

wind data are regularly received from the White Sands Missile Range.
The briefing consists o f the presentation o f the current synoptic situation, the prognostic chart valid for launch tim e, and the briefing forecast sheet. The forecast includes the surface forecast (surface winds, boundary layer winds, cloud cover, precipitation, thun derstorm s, fog, etc.); predicted balloon positions at 22,860 m (70,000 ft) and float initiation, and maximum wind and minimum tem perature in the troposphere; flight trajectory and term ination point (at altitude); descent track to impact location; surface weather conditions in the impact (recovery) area; and route forecasts for the tracking aircraft.
A f te r launch , the meteorological situation is m onitored and updated as necessary throughout the flight.
Winds in the Stratosphere
One of the m ost challenging aspects o f the meteorological support is the correct in terpretation o f the existing wind field and the time-phased prediction o f the winds during the elapsed flight time. The degree o f accuracy attained is directly pertinent to the flight trajectory and to the ascent/ descent tracks.
To resolve these questions we m aintain continuing streamline analyses of the wind flow at three levels or at a
In the early days o f the NSBF, flight instrum entation was designed primarily for balloon control and tracking functions. There was no consideration for the transmission of scientific data or o f control functions. Instrum ents consisted
com bination o f levels: 30.5 km, 32 km through 33.5 km (com posite due to the scarcity o f data), and all levels above33.5 km.
The m ajority o f our flights are at levels higher than 33.5 km , i.e., they are usually higher than levels reached by m ost radiosonde ascents. It is in this area that rocketsonde data play a major role. We compare them, level for level, w ith appropriate radiosonde data. The degree of similarity has a direct bearing on our prediction o f the flight trajectory.
T h e m eteorology section recently developed its own rawinsonde capability. Using specially purchased high altitude rawinsonde balloons, wind data above 36.6 km can now be determined for the Palestine area when this is con-
o f a high frequency barocoder beacon, p h o to b a ro g r a p h , electrom echanical tim er, tone command receiver/decoder, and radiosonde transm itter (see Fig. 1).
The barocoder beacon operated in a frequency range o f 1,660 to 1,690 kHz
sidered necessary by the m eteorology section or when requested for the experiment.
Flights launched at locations other than Palestine require additional rocketsonde data. In these instances we coordinate our efforts to obtain wind data w ith the rocket ranges at Cape Kennedy, Wallops Island, and F t. Churchill.
Scientists interested in long duration flights plan on flying during “ tu rn around,” i.e., during the spring or fall w ind reversal periods. During these reversals it is not uncom m on to observe periods lasting three to four weeks during which the wind speeds from 27 to 46 km are less than 20 k t. Graphs showing the annual march o f the predom inant wind speeds for selected levels are given in Fig. 1. •
PresentEarl E. Smith
and was used for altitude and aircraft tracking. The radio frequency (R F) ou tput was a 2 - W keyed continuous wave carrier (keyed CW). A ltitude inform ation, in Morse code, was controlled by an aneroid-type pressure sensor
Flight Electronics--1963 to*Jt i
William J. Landsperger received his B.S. in m eteorology fro m Florida State University in 1959 and d id graduate w ork there the fo llow ing year. A s a weather o fficer in the U.S. A ir Force, he directed operational meteorological support to units o f the Strategic and Tactical A ir Commands. Landsperger is now serving as ch ie f m eteorologist o f the NSBF. He is a professional m em ber o f the American M eteorological Society.
14

PHOTOBAROGRAPH
Fig. 1 Balloon control and tracking instrum ents used with early balloons.
which moved a pen arm across an etched code drum. A calibration was made before each flight, w ith calibration points plotted on a graph w ith code letters vs altitude (in feet), an arrangem e n t w hich perm itted interm ediate codes to be converted to altitude. The keyed CW occupied about 30% of the tim e; the remainder was solid carrier for the purpose o f homing by direction- finding equipm ent in the tracking aircraft, which flew through the cone of silence to fix the balloon position geographically.
This barocoder beacon quite often (and in a variety o f ways) failed, and its altitude inform ation was not reliable above 10 mb. It was replaced in late 1966 w ith a more accurate and dependable unit, w ith essentially the same operation except that the RF carrier had a strength o f 5 W, and two-bellows- type aneroids were used for altitude inform ation. One bellows was used for altitudes up to 10 mb and the other between 10 and 2 mb. Both instrum ents had faults in com m on— notably the mechanical size o f the pin arm contact, the tem perature effect on the aneroid sensor, and play in the mechanical linkage from aneroid to pin arm — but the 5 - W, two-bellows type was a m uch improved version. Overall system accuracy was at best about 400 m. Each of these instrum ents could shift carrier frequency by 1 kHz to confirm an onboard function, such as a radio com m and being received.
The photobarograph consisted o f a camera w ith an electric m otor which moved the film and operated flashing lights to take pictures o f tim e and altitude indicators. An aneroid-operated m eter display pressure sensor was used, w ith a wristwatch m ounted in the center for a time reference. The pressure sensor had a range from 0 to 35 mb and had to be calibrated before each flight. Inform ation from this instrum ent and the barocoder quite often disagreed by several thousand feet, but was nevertheless useful as back-up altitude data.
The electromechanical tim er was used as a back-up device for term ination after a preset time had elapsed. There were two outputs, each with a different time,
so that the second outpu t could be used by a scientist for a turn-on function. The unit was operated by an electric m otor, which drove a screw or a gear- operated cam to activate a microswitch to com plete the external circuit. The tim er was always a very reliable unit.
The tone command receiver/decoder contained two, four, or six relay contact closures for the duration o f the received tone. The receiver was adapted from a M otorola “Handie-Talkie” with a private line feature, which was a tone- operated reed circuit w ith a time delay that activated the audio ou tpu t stage when the proper tone was present. When private line requirem ents were m et the audio ou tput was applied to additional resonant reed circuits w ith tim e delays to activate the proper relay. A system such as this is lim ited in that one tone is needed for each function provided. Balloon control required two o f the six tones available, or more if a helium valve or other control function was needed. Only two private line tones were ever used for separation o f tone com mands by the NSBF. Since the private line circuit had occasionally failed in a mode which enabled the audio ou tpu t to be turned on, it was never considered safe to use it as the only separation o f the other tones. Therefore, no more than six commands could be used on any given flight, and only one flight could be conducted at a time.
The radiosonde transm itter was reliable for tracking to a distance o f about 2 5 0 km . It included provisions for normal tem perature measurem ents of the outside air, the internal package, and a reference resistor. The system was pow ered with dry cell batteries to extend the operating time to about 12 hr (vs the normal 3-4 hr w ith a radioso n d e water-activated battery). This system was sometimes used for transmission o f scientific data, but was not considered desirable for a normal telem etry system.
A pulse code m odulation (PCM) data and com mand system was developed for transmission o f data and for increased com mand control capability. Also included were three voltage-controlled subcarrier oscillators (VCO), one o f
15
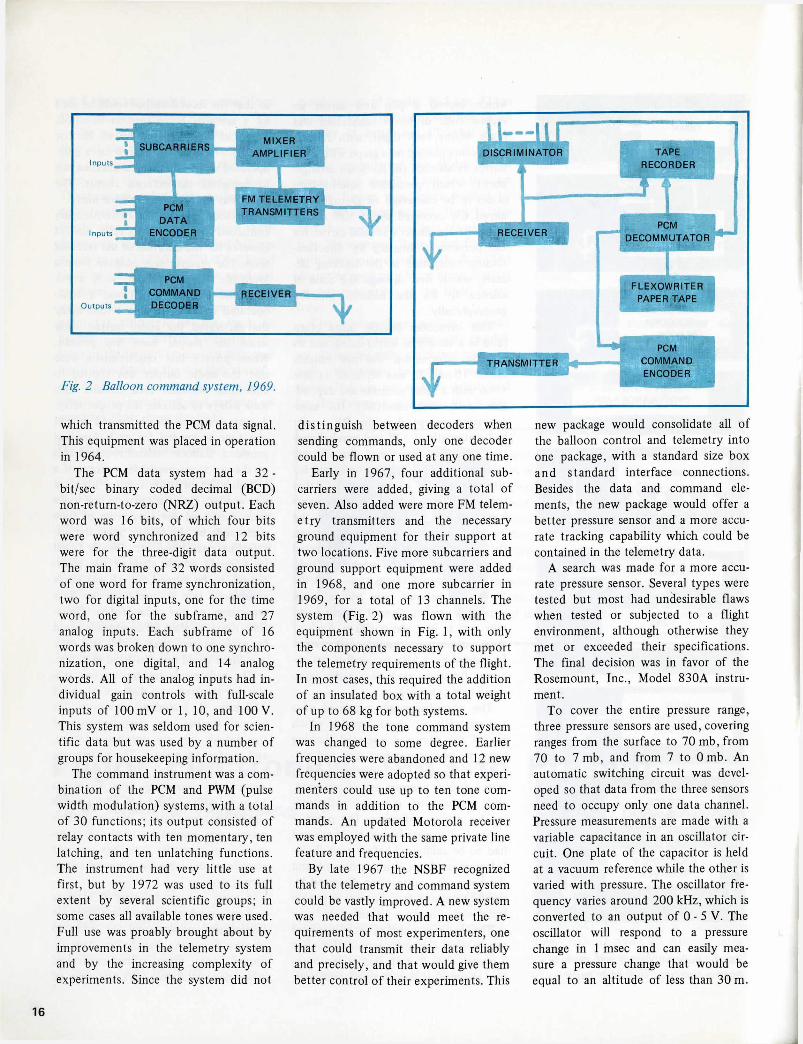
Fig. 2 Balloon com m and system , 1969.
which transm itted the PCM data signal. This equipm ent was placed in operation in 1964.
The PCM data system had a 32 - bit/sec binary coded decimal (BCD) non-return-to-zero (NRZ) ou tpu t. Each word was 16 bits, o f which four bits were word synchronized and 12 bits were for the three-digit data output. The main frame o f 32 words consisted o f one word for frame synchronization, two for digital inputs, one for the time word, one for the subframe, and 27 analog inputs. Each subframe o f 16 words was broken down to one synchronization, one digital, and 14 analog words. All o f the analog inputs had individual gain controls with full-scale inputs o f 100 mV or 1, 10, and 100 V. This system was seldom used for scientific data but was used by a num ber o f groups for housekeeping inform ation.
The com mand instrum ent was a com bination o f the PCM and PWM (pulse w idth m odulation) systems, w ith a total o f 30 functions; its ou tpu t consisted of relay contacts with ten m om entary, ten latching, and ten unlatching functions. The instrum ent had very little use at first, but by 1972 was used to its full extent by several scientific groups; in some cases all available tones were used. Full use was proably brought about by improvements in the telem etry system and by the increasing com plexity of experiments. Since the system did not
d is tin g u ish between decoders when sending commands, only one decoder could be flown or used at any one time.
Early in 1967, four additional subcarriers were added, giving a to tal o f seven. Also added were more FM telem e try transm itters and the necessary ground equipm ent for their support at two locations. Five more subcarriers and ground support equipm ent were added in 1968, and one more subcarrier in 1969, for a to tal of 13 channels. The system (Fig. 2) was flown with the equipm ent shown in Fig. 1, w ith only the com ponents necessary to support the telem etry requirem ents of the flight. In most cases, this required the addition o f an insulated box w ith a total weight o f up to 68 kg for both systems.
In 1968 the tone com m and system was changed to some degree. Earlier frequencies were abandoned and 12 new frequencies were adopted so that experim enters could use up to ten tone com mands in addition to the PCM com mands. An updated M otorola receiver was employed w ith the same private line feature and frequencies.
By late 1967 the NSBF recognized that the telem etry and com m and system could be vastly improved. A new system was needed that would m eet the requirem ents o f most experim enters, one that could transm it their data reliably and precisely, and that would give them better control o f their experim ents. This
new package would consolidate all o f the balloon control and telem etry into one package, with a standard size box a n d standard interface connections. Besides the data and com mand elements, the new package would offer a better pressure sensor and a more accurate tracking capability which could be contained in the telem etry data.
A search was made for a more accurate pressure sensor. Several types were tested but m ost had undesirable flaws when tested or subjected to a flight environm ent, although otherwise they met or exceeded their specifications. The final decision was in favor of the Rosem ount, Inc., Model 830A instrument.
To cover the entire pressure range, three pressure sensors are used, covering ranges from the surface to 70 mb, from 70 to 7 mb, and from 7 to Om b. An autom atic switching circuit was developed so that data from the three sensors need to occupy only one data channel. Pressure measurem ents are made with a variable capacitance in an oscillator circuit. One plate o f the capacitor is held at a vacuum reference while the other is varied with pressure. The oscillator frequency varies around 200 kHz, which is converted to an ou tpu t o f 0 - 5 V. The oscillator will respond to a pressure change in 1 msec and can easily m easure a pressure change that would be equal to an altitude o f less than 30 m.
16

T A B LE 1CO M PARISO N OF O LD A N D NEW A IR B O R N E E LE C TR O N IC S SYSTEMS
FUNCTION OLD NEW (CIP)
Discrete 30 55QZ Digital words None One 16 bits< Address None 64 unique (6 bits each)
B it rate per sec 12.5 360oo Receiver 1 1
ua.Power 150 mA - 28 V 40 mA - 28 VWeight 4.6 kg 2.3 kgSize 9,834 cc 3,687 cc
Analog inputs 40 16 per add-on module up to 128 maxDigital inputs 3 4 words per add-on module up to 32 max
ccLU
Bit rate per sec
j
32 (fixed) Programmable, 10 bits per sec to 256 KBS (kilob its per sec)
Qo Bits per word 12 BCD (fixed) Programmable 6-10 binaryo~z> Accuracy ±0.3% ±1 LSB +0.25% ±'/2 LSBLU O utput code N R 2L (fixed) Programmable any PCM code<h- Format Fixed Programmable<Q Readout Teletype, paper tape Teletype, paper tape, computer tape
Subcommutation Fixed ProgrammableOQ. Super-commutation None Programmable
Power 300 mA - 28 V 83 - 104 mA - 28 VWeight 8.2 kg 960 gSize 18,430 cc 983 cc
CCo Sensor Bellows CapacitanceC/3z Accuracy + 100 m to 4 mb ±30 m to 0.3 mbLU00 Transmitter HF (1,680 kHz) Telemetry (L-band)LUG Output Coded CW 0 - 5 VDH 28-V power 150 mA average 50 mAI - Weight 3.6 kg 540 g each (1.62 kg total)< Size 7,227 cc 308 cc
Weight 36 - 68 kg 40 - 45 kg
LU Interface connector Special Standard0< Size 0.226 - 0.440 m3 0.162 m 3* Battery requirements fo r 10-hr float 28 V, 10 Ah (barocoder) 28 V, 20 Ahro<Q.
12 V, 4 Ah (receiver/decoder)130 V, 6 V (radiosonde)12 V (ballast)28 V, 20 Ah (telemetry)22.68 kg (total weight o f batteries)
13.6 kg (for entire battery package)
The overall system, including calibration and telem etry errors, is accurate to about 60 - 80 m o f actual pressure altitude. This instrum ent has become a very valuable tool for regulating sunset ballasting and valving down balloons.
Table 1 is a comparison o f the old and new packages. The new package, soon to be in operation, will include standard interface connectors m ounted on the exterior o f the box w ith inputs to all data channels, command outputs, and necessary timing pulse outputs. O ther articles in this publication de
scribe the command and PCM data encoder in the new instrum ent package. The new package, which will also include 12 subcarrier oscillators, altitude sensors, and balloon control functions, will be smaller and lighter than the old system. The experim enter will have better com mand control, and when he leaves Palestine, his data will be on in d u stry -co m p atib le com puter tapes which will include altitude and position data so that they can more easily be processed on his own com puter.
The NSBF continues to search for
ways to improve balloon instrum entation. The photobarograph was replaced by th e Rosem ount pressure sensor about three years ago, an electronic tim er will soon replace the electromechanical timer, the barocoder is to be replaced with Rosem ounts as well, and the tone com m and system com pletely replaced by the new PCM. It will be some time before the versatility or capabilities o f the new instrum ents are exceeded; however, they could already be replaced by smaller, lighter com ponents with lower power requirem ents.
•
17

A New PCM Command System for Balloon-Borne Experiments
W. Jack Snider
As balloon-borne experim ents become more com plex, the requirem ent for remote control becomes more important. With the ability to modify his equipm ent during a flight, a scientist can m onitor his data in real time and update the system configuration as necessary. In addition to the scientific requirem ents, command capability is also necessary for such balloon control functions as the release o f ballast or helium and the term ination o f the flight. To m eet these needs, the NSBF has acquired a pulse code m odulation (PCM) command system, developed by United Technology Laboratories.
The system consists o f an encoder, a d e c o d e r , and a receiver/transm itter radio link between the ground and the balloon (Fig. 1). The basic building
blocks for the encoder and decoder are Data Com m unicator Modules, m anufactured by Larse Corporation. The SEN unit accepts 16 bits o f data input and provides time-division multiplexing, encoding, and frequency-shift keying for m odulation o f the command transm itter. The REDE unit accepts the ou tput from the command receiver, decodes the data, and presents it in its original state as 16 bits o f ou tput.
The SEN unit performs several functions that greatly increase the reliability o f the PCM system. These include a special coding o f the 16 data bits and a double transmission o f each encoded word. The code consists o f a 34 - bit word representing 16 data bits, made up o f eight four-bit elements and two sy n c h ro n iz a tio n bits (Fig. 2). Each
element contains two data bits preceded by a low clock bit and followed by a high clock bit. The ou tput signal is frequency-shift keyed (FSK) for m odulation o f the transm itter. Each bit is represented by a tone o f 1,440 Hz for a zero state or 1,800 Hz for a one state.
The REDE unit in the decoder makes security checks on the data before strobing it to the ouput circuitry. When a com mand transmission is received, the REDE unit first makes code element checks to ensure that any errors in troduced by the com m unication link are not interpreted as data. The first 34 - bit word is then stored until the second transm ission has been received and validated. The two words are then co m p ared for bit-by-bit correlation. When this check is com pleted, the last
Fig. 1 C om m and system block diagram.
18

six bits o f the data word are released to the ou tpu t terminals. Designated as address bits, these six bits are then patched back into the REDE unit for decoding. If the address is correct, the remaining ten bits are released and a data strobe pulse is generated, indicating that all data are valid for that decoder.
The im plem entation o f these modules into a usable command system is o u tlined below.
Encoder Design
The com mand encoder provides the selector switches, control logic, and timing circuitry necessary to operate the SEN module and to key the command transm itter. Three modes of operation can be selected, using front-panel selector switches (Fig. 3). In the COMMAND mode, one o f 48 open-collector drivers in the decoder unit is activated for control o f relays or for application o f logic levels to digital circuitry. The DATA mode allows transmission of a 1 6 -b it data word as one com m and; the state o f the 16 bits is established by setting toggle switches on the front panel. The REMOTE mode o f operation provides fo r com puter control o f command transmission; when this mode is selected all front panel switches are deactivated and the com puter is given control of com m and, data, and address selection.
In any o f the three modes of operation, the encoder circuitry interprets the switch settings and presents 16 bits to the SEN unit for encoding and transmission. Figure 4 shows how these bits are used for both the command and the data modes. Bits ten through 15 are used for address selection in all modes. A total of 64 different addresses is possible. In the com mand m ode, bits zero through seven represent the com mand number and bits eight and nine indicate the type of transmission. For a 16 - bit data-word transmission, the encoder must make two double-scan transmissions. In the first transmission, bits zero through seven o f the command word contain data bits zero through seven. In the second transmission, these bits contain bits eight through 15 of the data word. Bits eight and nine of the
Fig. 2 Coded com m and word.
DATAPOINT o 1
Fig. 3 PCM com m and encoder.
Fig. 4 B it use in com m and word.
C O M M A N D M O D E
1514 13 12 11 10 I 9J 8 I 7 6 5 4 3 2 1 0
DECODER ADDRESS oo
•» ' o COM MAND NUMBER
Command Mode
D A T A M O D E
FIRST TRANSMISSION
15 14 13 12 11 10
COO) 7 6 5 4 3 2 1 0
DECODER ADDRESS 0 1 Byte Code
BYTE #1 D ATA
SECOND TRANSMISSION
15 14 13 12 11 10 CO 00 7 6 5 4 3 2 1 0
DECODER ADDRESS 1 0 Byte Code
BYTE # 2 D A TA
19

Fig. 5 PCM com m and decoder.
command word are used to identify the two bytes o f the data word. Timing pulses from the SEN unit are used to control the sequence of data-word transmissions. The encoder autom atically keys the com mand transm itter for the required length o f time to complete each command.
The encoder case was designed to be m o u n te d in a s tan d ard 48.3 - cm ( 1 9 -in .) panel, an aircraft instrum ent panel, or a portable carrying case, making all units identical and in terchangeable. Primary power to the unit is 28 V dc, so that the portable unit can be battery operated.
Decoder Design
The com mand decoder (Fig. 5) accepts the FSK output from the com m and receiver, perform s decoding and s e c u r i ty ch e ck s , and presents the1 6 -b it command word to the ou tput circuitry. A data-ready pulse from the REDE unit initiates a tim ed sequence of decoding and command activation.
The ou tpu t logic interprets bits eight and nine o f the com mand word to determ ine the mode o f operation. If these bits indicate a discrete com mand, bits zero through five are decoded and used to activate the appropriate open- collector driver. Associated with each com mand is a 24 - V - dc ou tpu t which is turned on by the control circuitry for
50 msec. This voltage is used in conjunction with the driver to activate the com m and function. A current lim it o f 80 mA prevents damage to the driver circuitry.
When the data mode of operation is detected, bits zero through seven of the first transmission are loaded into a tem porary storage register. When the second transmission is com pleted, bits eight through 15 o f the data word are loaded into the ou tpu t register and a data strobe pulse is generated to initiate a parallel dum p o f the full 16 bits to the user’s circuitry.
To minimize the power required for decoder operation, the ou tput logic is powered up for only 400 msec when a command is received. This approach reduces the steady-state current to less than 40 mA.
A Ten-Com m and Decoder
F or applications requiring ten or fewer commands, a simplified version of the decoder is available. This simplified decoder uses a REDE unit and ten relay drivers that are activated by bits zero through nine o f the command word. Each bit serves as a discrete command channel w ithout the need for decoding. Only those commands which set one of the ten bits at a time are used in this application.
Decoders o f this type will be used for
helium valve operation, for term ination, for parachute cutaway, and on flights requiring minimum command capability. When used for flight term ination, th e decoder is assigned an address num ber in the upper 32 possible addresses to prevent accidental term ination o f a flight. The m ost significant bit o f the address code is protected in the encoder by using a switch in series with the address selector switches: to transm it a command to a term ination decoder, this additional switch m ust be placed in the “ term inate arm ed” position. A warning light on the encoder gives an indication when either the address selector or the term inate armed switch is set for term ination.
T h e com m and decoder is incorporated into the standard flight package so that all interconnections w ith an experim ent are made through a single interface panel. Commands used by the NSBF are wired internally to the appropriate system function. •
W. Jack Snider received his B.S.E.E. fro m Louisiana Polytechnic Institu te in 1964; he earned his M .S.E.E. from Southern M ethodist University in 1969, while working with General Dynamics as a design engineer fo r the F - 111 aircraft’s ground support equipment. Since 1971 he has been serving as an electrical engineer with the NSBF. Snider is a m em ber o f Tau Beta Pi and Eta Kappa N u engineering honor societies and is a registered professional engineer in Texas.
20

The Data Acquisition and Retrieval SystemTOAat 1{ou See 7<t "MJAat *!{»* (fa t W. Jack Snider
The m ost im portant function of the electronic support systems provided by the NSBF to the scientific user is the accurate recovery and reproduction of data from balloon-borne experiments. As experim ents have become more com plex, the requirem ents for support in this area have becom e more demanding. Great flexibility in the num ber o f inputs, sampling form at, b it rate, parity, and real-time m onitoring capability is necessary for a system tha t m ust m eet the requirem ents o f a broad range of experim ents. Now fully operational, the new pulse code m odulation (PCM) data handling system is accurate and reliable and has answered the scientific com m unity’s demands for this capability.
Data Encoder
The heart o f this system is a PCM data encoder from the Spacetac 2100 series with m odular construction, plugin form at, synchronizatipn word stor
age, and programmable system functions. These features enable the user to select a system configuration to m eet his exact requirem ents w ithout any need for redesign.
As the function diagram (Fig. 1) shows, the system consists of a control un it and expander modules. The control unit comprises the electronics necessary to process, assemble, encode, and o u t
put the m ultiplexed analog and digital inform ation from the expander m odules.
Input selection codes are generated in th e c o n tro l unit from inform ation stored in an electrically programmable, read-only m emory (EPROM) in which the telem etry form ats are stored. One EPROM set has storage capacity for up to eight formats, but the num ber o f
Fig. 1 Function diagram o f the PCM data encoder.
■ +20 to +40 V
Filtered O utput
Unfiltered NR Z-L O utput
“ Parity
“ Format Number
B it Rate
Word Length
a O utput Code
■a E oc F5 uE 2 cF S’ 3o 2 u- o °-
21

Table 1PCM Data Encoder Specifica tions
FORMAT SPECIFICATIONSF o rm a t L en g th 2 0 4 8 b its /fra m e m ax
S u b fra m e L e n g th 2 ,4 , 8 , 16, 3 2 ,6 4 , 128 fra m e s
W o rd L en g th 6 to 11 b its /w o rd , c o m m a n d a b le
A n a lo g In p u ts 1 28 s ing le -ended m ax 6 4 d if fe re n t ia l m a x
D ig ita l In p u ts 3 2 w o rd s o f 6 to 10 b its each m a x
F ram e S y n c h ro n iz a t io n U p to 4 0 b its , c u s to m e r p ro g ra m m a b le
S u b fra m eS y n c h ro n iz a t io n
In v e rte d fra m e s y n c h ro n iz a t io n o r fra m e c o u n te r
A /D SPECIFICATIONSA n a lo g S igna l Range 0 to + 5 .1 1 5 V
R e s o lu tio n 6 to 10 b its
A c c u ra c y +0.2% FS ± % LSBL in e a r ity ±0 .1% FS
COMMANDABLE SYSTEM FUNCTIONSO u tp u t Codes N R Z -L , N R Z -M , N R Z -S , R Z
Bi«t>-L, Bi<3>-M, Bi<P-S N R Z -L , R Z , B i f - L
B i t Rates E x te rn a l: 2 5 6 kH z m a x In te rn a l: c ry s ta l-c o n tro l le d 2 5 6 kH z m a x . Seven b in a r ily re la te d sub m u lt ip le s are c o m m a n d a b le . B i t ra te s ta b il i ty is ± 5 0 p p m
W o rd L en g th 6 , 7 , 8 , 9 , 10, 11 b its /w o rd
T e le m e try F o rm a ts 8 s to re d fo rm a ts m ax
P a rity O d d p a r i ty b it E ven p a r i ty b i t" A l l ones” o r " a l l z e ro s " d e te c t b it N o p a r i ty b i t
P ro g ra m m in g In p u t 4 7 K o h m s in p a ra lle l w ith 2 0 pF
C h a ra c te ris tic s T T L , D T L , C -M O S c o m p a tib le
ANALOG SIGNAL M ULTIPLEXERC hanne l C a p a c ity /E x p a n d e r
16 h igh -leve l s ing le -ended in p u ts o r 8 h ig h -le ve l d if fe re n t ia l in p u ts o r a n y c o m b in a t io n o f s ing le -ended and d if fe re n t ia l in p u ts _______________________
In p u t S igna l D y n a m ic Range
-5 to + 1 0 V
C o m m o n M o de S igna l R e je c tio n
6 0 dB m in a t d c to 1 00 H z
In p u t O ve rvo lta ge R ange
-2 0 to + 3 5 V w ith o u t deg ra d in g any o th e r channe ls
In p u t Im pedance S a m p lin g ____
5 0 M o h m s m in
N o n -sa m p lin g 1 00 M o h m s m in
P o w e r O f f 100 M o h m s m in
In p u t B ack C u rre n t 2 0 n anoam ps a t 25C
In p u t C apac itance 1 0 0 pF + (8 p F tim e s th e n u m b e r o f ana log expa n d e rs used!
P o w e r C o n s u m p tio n S ta n d b y _______________
2 5 m W
E x p a n d e r S e lec ted 2 0 0 m W
D IG ITA L S IG NAL M ULTIPLEXERC hanne l C a p a c ity / E x p a n d e r___________
4 0 channe ls o rg a n ize d as fo u r 1 0 -b it b y te s ______________________
In p u t V o lta g e Range " 0" =„ r , , -5 0 to + 1 .5 V
+ 1.7 to + 5 0 V
In p u t Im pedance 100 K o h m s
P o w e r C o n s u m p tio n 3 0 m W
A sso c ia ted w it h e ve ry 1 0 -b it b y te is a T T L -c o m p a t ib le s y n c h ro n iz a tio n s ignal w h ic h rises a t least 2 0 nsec b e fo re and fa lls a t least 1 Msec a f te r th e a c tu a l sa m p lin g o f th e 10 se lected channe ls .
SYSTEM POWERIn p u t V o lta g e Range + 2 0 to + 4 0 V m a x , w ith reverse
p o la r it y p ro te c t io n
In p u t P ow er C o n s u m p tio n C o n tro l U n it
Less th a n 2 .3 W
A n a lo g S ignal M u lt ip le x e rs
2 5 m W p er e x p a n d e r p lu s 175 m W _____________________
D ig ita l S igna l M u lt ip le x e rs
3 0 m W per e xp a n d e r
Is o la t io n D C is o la tio n b e tw e e n p o w e r g ro u n d and signal g ro u n d a nd case g ro u n d is g rea te r th a n 10 M ohm s
SYNCHRONIZATION WORD STORAGE
PRE-MODULATION FILTER
STORAGE
22

The ground station at Palestine.
form ats per EPROM will vary depending on the com plexity o f the form at and the am ount o f EPROM storage required. As an example, four separate form ats w ith 30 w o rd s per frame and a 16 - frame subframe can easily be stored in one EPROM set. The appropriate form at for a particular application is selected from the EPROM by hardwiring or applying logic levels to pins on the programming connector. The lim itations on form at com plexity and detail specifications for the system are o u tlined in Table 1.
Each analog expander unit (m ultiplexer) is capable o f multiplexing 16 single-ended inputs, eight differential inputs, or any com bination o f singleended and differential inputs. These expander units are connected to the control unit subassemblies with printed circuit bus cards that are autom atically adapted to any system configuration. A maximum o f eight analog multiplexers, providing 128 inputs, may be used at one time. Each analog channel will accept signals between -5 and +10 V w ithout degrading the analog-to-digital conversion accuracy or resolution.
In addition to the analog inputs, up to eight digital multiplexers, each with capability for four ten-bit inputs, can be included in the system buildup. These digital m ultiplexers are interfaced into the control un it in the same way as the analog expanders. High input impedance (100 K ohms) and a wide input signal range (-50 to +50 V) allow the use o f discrete bits for O N /OFF status m onitoring of both analog signals and digital data. When used in this m anner, each digital m ultiplexer is capable of m ultiplexing 40 discrete event sources into the data stream. These 40 inputs are selected as four groups (channels) o f ten bits each. Associated with the selection o f each ten-bit byte is a synchronization signal that rises at least 20 jusec before and falls at least 1 /usee after the actual sampling of the ten-bit channel; this signal allows additional data source control.
For frame synchronization a 20 - bit w ord is stored in a second EPROM set and selected according to the program in the form at storage. This word can be
expanded up to a maximum o f 40 bits if required. Subframe synchronization is accomplished either by inverting the frame synchronization word at the sub- frame rate or by the use o f a frame counter.
In the ou tpu t circuitry o f the control unit, the synchronization w ord and the analog and digital data streams are merged into a PCM telem etry form at, as programmed in the form at storage. Parity , ou tpu t code, and bit rate are generated in accordance w ith selections made at the programming connector. The outpu t bit stream is then either bandw idth lim ited with a plug-in prem odulation filter or presented unfiltered to the ou tpu t o f the system. This signal is then used to m odulate the t e le m e t r y transm itter for relay to ground receiving stations.
Ground Processing
Telemetry data received from a balloon flight must be processed and recorded while providing real-time m onitoring capability to the experim enter. A t the NSBF station in Palestine this is done w ith a com puter-controlled PCM decom m utation and data handling system. This system consists o f EMR 2700
series decom m utation equipm ent and a D i g i t a l E q u ip m e n t C o r p o r a t io n P D P -1 1 /2 0 com puter system (Fig. 2).
The first step in the decom m utation process is to filter the incoming bit stream and present a noise-free serial o u tp u t to the decom m utator. The NSBF uses an EMR 2721 signal conditioner. Any standard PCM code at bit rates up to one megabit per second can be processed by this unit. F or optim al operation, either a constant-tim e-delay f i l t e r sam p le detector or a reset- integrator detector can be selected to extract the PCM signals from the noise. Two different filters are available because the frequency spectrum o f a return-to-zero (RZ) signal is twice that o f a non-re turn-to-zero (NRZ) signal w ith the same bit rate. Bi-phase signals are converted to equivalent NRZ to achieve better signal-to-noise performance. After it passes through decision circuitry, the signal is reconstructed, then converted to NRZ-change. In addition, either an NRZ-change, NRZ-mark, or a bi-phase-change signal is supplied for analog tape recording. Four bit-rate clock pulses are generated in synchronization with the reconstructed data o u tputs; they are at 0, 90, 180, and 270° w ith respect to the data.
23
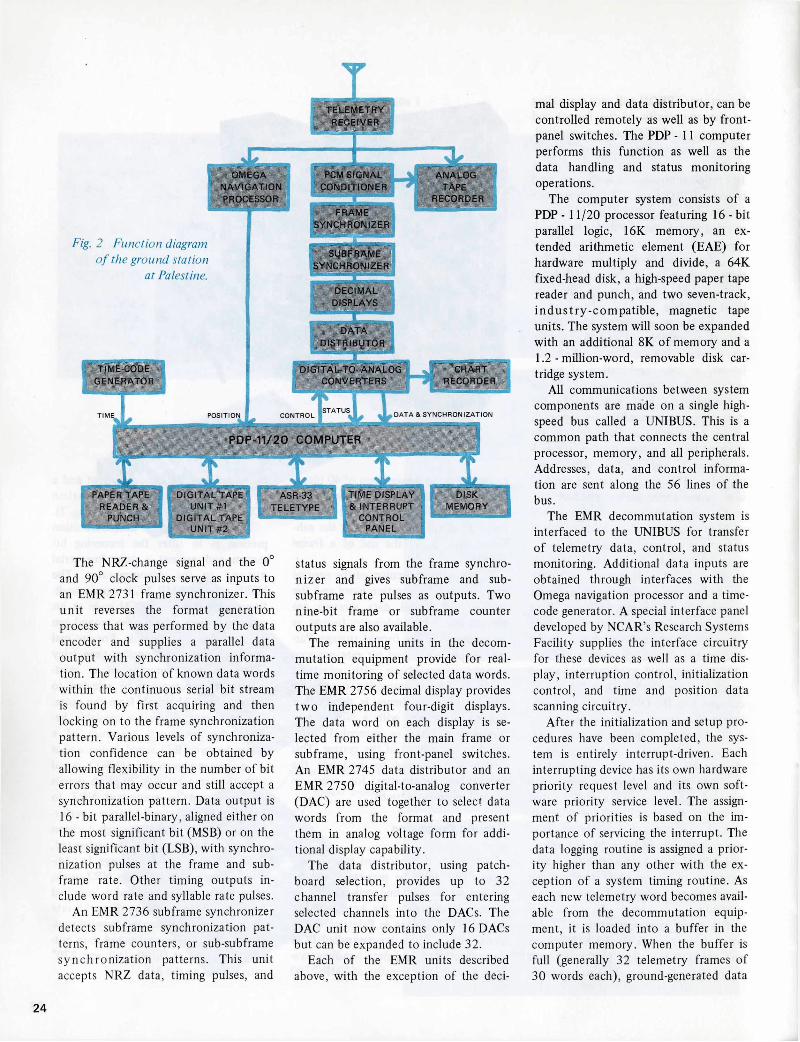
TE LE M E TR YRECEIVER
OMEGAN A V IG A T IO NPROCESSOR
Fig. 2 Function diagram o f the ground station
at Palestine.
TIME-CODEGENERATOR
PCM S IG N A L I J C ONDITIO NER
TFRAME
SYNCHRONIZER
iAN ALO G
TAPERECORDER
SUBFRAME SYNCHRONIZER
DECIM ALDISPLAYS
D ATADISTRIBUTO R
1 3 =D IG IT A L -T O -A N A L O G CHART
CONVERTERS RECORDER
PAPER TAPE READER &
PUNCH
D IG IT A L TAPE U N IT #1
D IG IT A L TAPE U N IT # 2
TIM E DISPLAY & INTERRUPT
CONTROL PANEL
DISKM EMORY
The NRZ-change signal and the 0° and 90° clock pulses serve as inputs to an EMR 2731 frame synchronizer. This u n it reverses the form at generation process that was perform ed by the data encoder and supplies a parallel data ou tput with synchronization inform ation. The location o f known data words within the continuous serial bit stream is found by first acquiring and then locking on to the frame synchronization pattern. Various levels o f synchronization confidence can be obtained by allowing flexibility in the num ber of bit errors that may occur and still accept a synchronization pattern. Data ou tpu t is 16 - bit parallel-binary, aligned either on the most significant bit (MSB) or on the least significant bit (LSB), with synchronization pulses at the frame and sub- frame rate. O ther timing ou tpu ts include word rate and syllable rate pulses.
An EMR 2736 subframe synchronizer detects subframe synchronization pa tterns, frame counters, or sub-subframe sy n c h ro n iz a tio n patterns. This unit accepts NRZ data, timing pulses, and
status signals from the frame synchron iz e r and gives subframe and subsubframe rate pulses as outputs. Two nine-bit frame or subframe counter ou tputs are also available.
The remaining units in the decom m utation equipm ent provide for realtime m onitoring o f selected data words. The EMR 2756 decimal display provides tw o independent four-digit displays. The data word on each display is selected from either the main frame or subframe, using front-panel switches. An EMR 2745 data distributor and an EM R 2750 digital-to-analog converter (DAC) are used together to select data words from the form at and present them in analog voltage form for additional display capability.
The data distributor, using patchboard selection, provides up to 32 channel transfer pulses for entering selected channels into the DACs. The DAC unit now contains only 16 DACs but can be expanded to include 32.
Each o f the EMR units described above, w ith the exception of the deci
mal display and data distributor, can be controlled rem otely as well as by front- panel switches. The PDP - 11 com puter perform s this function as well as the data handling and status m onitoring operations.
The com puter system consists o f a PDP - 11/20 processor featuring 16 - bit parallel logic, 16K m em ory, an extended arithm etic element (EAE) for hardware m ultiply and divide, a 64K fixed-head disk, a high-speed paper tape reader and punch, and two seven-track, in d u s try -c o m p a tib le , magnetic tape units. The system will soon be expanded w ith an additional 8K o f m em ory and a 1.2 - million-word, removable disk cartridge system.
All com m unications between system com ponents are made on a single highspeed bus called a UNIBUS. This is a com mon path that connects the central processor, m em ory, and all peripherals. Addresses, data, and control inform ation are sent along the 56 lines of the bus.
The EMR decom m utation system is interfaced to the UNIBUS for transfer o f telem etry data, control, and status m onitoring. Additional data inputs are obtained through interfaces with the Omega navigation processor and a time- code generator. A special interface panel developed by NCAR’s Research Systems Facility supplies the interface circuitry for these devices as well as a time display, in terruption control, initialization control, and time and position data scanning circuitry.
A fter the initialization and setup procedures have been com pleted, the system is entirely interrupt-driven. Each interrupting device has its own hardware priority request level and its own software priority service level. The assignm ent o f priorities is based on the importance o f servicing the interrupt. The data logging routine is assigned a priority higher than any other w ith the exception o f a system timing routine. As each new telem etry word becomes available from the decom m utation equipm ent, it is loaded into a buffer in the com puter m em ory. When the buffer is full (generally 32 telem etry frames o f 30 words each), ground-generated data
24

are added and the buffer contents are dum ped onto one of the magnetic tape units. Tapes generated in this way contain all the scientific telem etry data plus time, position, date, and altitude data which are generated or calibrated on the ground. Each tape record is thus com plete within itself and contains all the inform ation necessary for analysis. The use o f two tape drives w ith autom atic crossover assures that no data are lost during tape-changing operations.
O ther routines that are serviced at lower priorities include two data p rin tout programs. One is used to calculate and print inform ation that is im portant for balloon control and tracking purposes, including altitude in feet, rate o f ascent in feet per m inute, position in longitude and latitude, and time. The other provides a real-time look at scientific data in engineering units. The in te rval between printouts o f these two
routines is established by front-panel selector switches and can be changed at any time during a flight. In addition, a printout o f either program can be requested at any time by the operator.
A down-range receiving station is used when the flight trajectory extends beyond the range o f coverage from Palestine. This station consists o f essentially the same equipm ent as at Palestine, w ith the exception o f the com puter. A manual version o f the PCM decom m utation equipm ent is available for real-time m onitoring and conditioning o f signals for analog recording. The analog tapes are played through the com puterized station after the flight to generate digital tapes. This procedure gives the experim enter a com plete set o f industry-com patible tapes covering his data for the entire flight. These tapes can easily be read into a larger com puter for data reduction.
Fligh t Preparation
Considerable coordination is needed to make full use of the data handling capability outlined above. Each scientis t’s flight request includes his requirem ents for data retrieval. These requirem ents are reviewed by NSBF personnel and discussed w ith the scientist. A form at is selected for the data encoder that will provide the necessary sampling rates for all parameters and the EPROM is ordered if necessary. Real-time m onitoring and programming requirem ents are outlined several weeks before the scheduled flight date so that all software can be generated. The airborne hardware and decom m utation patchboards are prepared for use when the experim enter arrives in Palestine. The data system then plays a very im portant role in the preflight checkout by m onitoring all the param eters o f the system. •
Searching for Antim atter in the Cosm ic Rays
Andrew Buffington, University o f California at Berkeley
It is a great adventure to build an instrum ent to measure cosmic rays, to take it far from hom e to fly it by balloon, to return with data to analyze, and then to interpret the results. Cosmic ray studies are particularly fascinating because they use measurem ents o f the smallest things in nature— the elementary particles— to deduce facts about the largest things in nature— the galaxy and the universe. Existence o f antim atter is one o f the most fundam ental and striking symmetries discovered in these elem entary particles. Our group
has conducted a search to see whether antim atter particles can be found in the primary cosmic rays, and several times we have had the pleasure of using the balloon launch facilities at Palestine. I believe our search for antim atter is an exciting example o f the m otivation which brings scientists to the balloon facility, o f the excitem ent and hard w ork they experience while preparing and flying their instrum ents, and of the knowledge that results from their m easurements. Readers who would enjoy learning more about antim atter or about
our group’s other cosmic ray experim ents should consult the sources listed at the end o f this article in the section titled “ For Further Reading.”
A ntim atter in the Universe
A ntim atter is a good example o f a discovery from one branch o f physics which stimulates profound thought in another branch of physics. Elementary- p article physicists found that when m atter is produced by high energy collisions in accelerator experim ents, an
25

equal am ount o f antim atter is always created at the same time. Soon after this sym m etry was discovered, some astrophysicists began to wonder w hether la rg e a m o u n ts o f antim atter were created billions of years ago in the early universe. If the rules o f creation of m atter were the same then as they are now in our laboratories, we should expect the universe to contain equal am ounts o f m atter and antim atter. But where could this antim atter be? We believe it is absent here on earth and in the solar system, since we never see the trem endous annihilating explosions and accompanying gamma rays that would result from chance encounters of pieces o f antim atter w ith m atter. The low observed fluxes o f gamma rays imply that m atter and antim atter interm ix very little throughout our galaxy— less than one part per billion.
Perhaps some sort o f barrier exists w hich keeps m atter and antim atter apart. Our galaxy could be composed half o f m atter and half o f antim atter, w ith a complex array o f these barriers preventing the mixing. We cannot tell whether this is the case by looking through telescopes, since the light from antim atter stars would be exactly the same as that from stars o f “norm al” m atter. We would like to travel around
the galaxy to gather samples o f material for analysis, but that ideal seems to lie beyond technical reach.
Fortunately , material from far o u tside the solar system comes to us in the form o f energetic cosmic rays. These particles, which were ejected millions of years ago by stars in violent late stages o f their evolution, come to us primarily from the nearest 1% of the galaxy, although some have come from m uch farther away. Analyzing the cosmic rays could tell us whether there are regions o f antim atter somewhere near us in the galaxy. I f there are, we might someday be able to bring enough back to satisfy the apparently insatiable energy needs o f earth. Such distant space travel seems to be very difficult, but given sufficient m otivation perhaps a means could be found.
Techniques
A ntim atter has two properties that distinguish it from normal m atter. The first o f these, the well-known annihilatio n which results when antim atter touches m atter, might someday make antim atter a good source of energy. This property was also used as a characteristic signature in the early searches for antim atter in cosmic rays: an emulsion
block was flown above the atmosphere, and a large num ber o f fairly low energy cosmic ray nuclei came to rest in it. The track of each stopping nucleus was examined for signs o f violent annihilation explosions from an antinucleus. Various groups perform ed such searches several years ago; they saw no annihilation explosions in about 20,000 stopping cosmic rays.
However, the low energy cosmic rays examined by this technique would probably not penetrate a m atter/an tim atter barrier. We wanted to carry out our search at higher energies in hopes o f getting a more representative sample of m aterial from the galaxy. To accomplish this we used the other crucial property o f an tim atter: the negative electric charge of antinuclei is opposite to that o f normal m atter. This means that normal nuclei and antinuclei bend in opposite directions when they travel through a magnetic field.
To search for antim atter, we built a superconducting magnetic spectrom eter, show n schematically in Fig. 1. The magnet, w ith its liquid helium cooling system, provides a strong magnetic field over a large volume. When an energetic cosmic ray comes from above, it passes through trigger scintillators. When the electronics viewing these scintillators
Fig. 1 The superconducting magnetic spectrom eter (courtesy o f the Lawrence Berkeley Laboratory, University o f California).
CAMERAS
MAGNETDEWAR
COIL
PHOTOMULTIPLIER TUBES IN MAGNETIC SHIELDS
SCINTILLATORS S3 AND S4 1.0
---1---SCALE
2 METERS H
MAGNET VENT STACK
ANTICOINCIDENCE COUNTER
SCINTILLATORSSUPPORT FRAME
PRESSURE SHELL
BATTERIES AND ELECTRONICS
26

detects a highly charged nucleus that has passed all the way through the apparatus, it triggers the spark cham bers. These m ark the trajectory of the particle w ith bright sparks, whose locations are recorded on film by the camera. In a com plete flight, we usually recorded 30,000 cosmic ray events with this technique. A fter the flight, we looked for oppositely bent trajectories that indicated negatively charged nuclei. The technique enabled us to look for antinuclei in cosmic rays w ith up to 50 times the energy allowed by the em ulsion block technqiue.
Since antim atter cosmic rays were quickly destroyed by interactions in the atm osphere, we had to fly our instrum ent by balloon to be able to gather our data. The project was. our first experim ent carried out by rem ote control; all o f our previous experience had been at accelerators where we had access to the experim ent while it was in progress. It took our group about a year and a half to put together our com plicated instrum ent w ith its cryogenic m agnet, spark chambers, optics, electronics, scintillators, and pressure shell. Although the physicists and support staff each had various responsibilities in the construction and testing o f the instrum ent, each o f us, at some point, had to become intim ately familiar w ith the whole system. To get his equipm ent working right, and to understand the measurem ents he makes w ith it, every e x p e rim en ta l physicist has a “love affair” w ith his instrum ent. He becomes involved with it to the exclusion of almost everything else. For each flight o f our instrum ent, this period o f intense involvement extended over the final m onths o f test and calibration at Berkeley, and culm inated in our m on th ’s stay at Palestine.
Flights from Palestine
A field operation w ith our gondola means many things to each m em ber of our group. To everyone it means many days w ith long hours o f work to bring the instrum ent to a state o f proven flight readiness. To each member o f the team it means time-consuming care in
perform ing his repairs and calibrations, since the success o f the flight will hinge on efficient perform ance of the com ponents. Since our gondola is com plex, we cannot afford to fly it often and must depend on a high percentage of success in our flights.
In Palestine we frequently see familiar things juxtaposed w ith new and unfamiliar things. Strange Texas creatures fly and climb into our optics and electronics boxes. Scorpions come out o f hiding to menace us when we have the lights out for our optical calibrations. Never have I seen a place with bigger bugs than Texas! The location brings out new aspects in the members o f our team ; I hear our people telling new stories at lunch or to the NCAR crew in the coffee room. Also, every physicist feels the need to become an am ateur meteorologist during his stay, and we all spend lots o f tim e perusing the maps and crowding the weather briefings. The long days o f preparation time test our nerves and gradually lower our tolerance to the absence o f our families and urban com forts.
Flight day is the high point o f our adventure. First we make the crucial checkout; then we attend the weather briefing, watch the balloon layout and inflation, and finally see our equipm ent launched . In our trailer excitem ent m ounts during the ascent and early data-taking; each of us wonders whether all the arduous preparations have been successful or whether some failure will cheat us o f our data and perhaps even of o u r in strum en t. We have feedback through telem etry, and each m em ber of our team has to scan a portion of the inform ation for anomalies. Through our extensive electronics redundancy and our command capability, we can “ fly” our experim ent, getting physics and engineering inform ation in real time and altering our flight profile to m eet une x p e c te d tr ig g e r rates, electronics failures, and changing weather conditions. Our group has had very good luck w ith ballooning; we have obtained good physics data from five out o f six flights.
A fter the flight several members o f our group usually have enough energy left to go along with the recovery crew
to find where the gondola has come down. To me, this is the strangest experience o f all in ballooning, since the gondola looks very m uch out o f place, whether it has landed in the woods, on the prairie, or in a farm er’s field. Frequently a crowd seems to spring out o f the ground and wants to know all about it. It generally takes a day or two to get the gondola loaded onto a truck and back to Palestine. Another week’s work is required to “d eb rie f’ the equipm ent and to make it ready for return to Berkeley.
Data A nalysis and Results
A fter developing the film we measure the sparks on an autom atic machine and
Fo r Further Reading
Alfven, H., 1966: Worlds-Antiworlds; A ntim a tter in Cosmology. W.H. Freeman, San Francisco.
<
B uffing ton , A., R. A. Muller, L. H. Sm ith, and G. F. Sm oot, 1972: High e n e rg y p a r t i c le astronom y. Sci. Technol. 28, 289 - 298.
------------, L. H. Sm ith, G. F. Smoot,L .W . Alvarez, and M. A. Wahlig, 1972: Search for antim atter in prim a ry c o sm ic rays. Nature 236, 3 3 5 -3 3 8 .
Ginzburg, V. L., and S. I. Syrovatskii, 1964: The Origin o f Cosmic Rays. Pergamon Press, New York.
P e n n y p a c k e r , C. R., G. F. Sm oot, A . B uffing ton , R. A. Muller, and L. H. Sm ith, 1973: Measurement of g eo m ag n e tic cu toff rigidities and particle fluxes below geomagnetic cu to ff near Palestine, Texas. J. Geophys. Res. 78, 15 1 5 - 15 27.
S m ith , L. H., A. Buffington, G. F. Sm oot, and L.W . Alvarez, 1973: A measurem ent o f cosmic ray rigidity spectra for above 5 GV/c o f elements from hydrogen to iron. A strophys. J. 1 8 0 ,9 8 7 - 1010.
27

run the data through our com puter programs. The com puter reconstructs the trajectory of the particle through the magnet for each event and determines the m om entum and sign o f the charge. Any events that appear to have negative charge are carefully remeasured by hand. Most o f the “negative-charge” events are found to be the result o f e r r o r s by the autom atic measuring machine. Only a few hand-measured events are found still to curve in the negative direction, and their am ount o f curvature is insignificant.
We have recorded and analyzed alm ost 50,000 cosmic ray nuclei, but have identified none as antim atter. Perhaps our galaxy does not contain antim atter at all. If it does, the m atter/an tim atter barrier must be so strong that very few particles up to 0.999 the speed o f light can get through. Our findings strongly limit the models that can be used by
theorists who believe that antim atter exists in bulk in our galaxy. We would certainly like to improve our search, either by greatly increasing the statistics o f the measurements, or by examining m uch higher energies. We seem to have reached the limit of our technique and
are now searching for a better way to identify antinuclei. The beauty of this kind o f search is that indisputable observations o f only one or two antim atter events would be enough to assure us that antim atter exists in bulk in our galaxy. •
A ndrew Buffington is an associate research physicist at the Space Sciences Laboratory o f the University o f California at Berkeley, where he is involved in astrophysics experim ents including flights o f balloon gondolas to measure the nuclear, electron, and positron spectra o f cosmic rays. He received B.S. (1961) and Ph.D.(1966) degrees fro m M assachusetts In stitu te o f Technology. Before going to Berkeley in 1969, he w orked as a research assistant a t M.I. T., engaging in teaching as well as research in elementary particle physics. He has been a m em ber o f the Sigma X i since 1961. His group is presently supported by a grant fro m N A SA .
Long Duration BallooningJames A. Winker, Raven Industries, Inc.
Most scientists who have used balloons as carrier vehicles for their experim ents are aware that there are several types of balloons. The expandable neoprene type widely used in m eteorological sounding typically rises until it bursts in a to tal flight time not greatly exceeding an hour. The so-called zero pressure balloon has accounted for by far the greatest proportion of scientific ballooning in the last quarter o f a century. It rises to and floats at an altitude where it becomes full, attains buoyant equilibrium, and vents excess gas. Environmental changes or diffusion of the l i f t in g gas disturbs the equilibrium
which m ust be restored by an in term ittent release o f ballast. Ballasting requirem ents usually prohibit flights longer than three or four days; longer flights are generally undertaken during the b ian n u al stratospheric wind reversal when it is easier and less expensive to track the balloon and recover its payload because it does not drift so far.
T h e p r im a ry r e q u ir e m e n t fo r achieving flight durations o f great length is a carrier balloon. It is interesting to consider that as long duration ballo o n in g becomes more com mon, a whole new philosophy will need to evolve to guide the conduct o f flight
operations and the design o f scientific payloads. The balloon that will open this new era is called the superpressure balloon (Fig. 1) and is now in advanced stages of development; when perfected, i t will increase flight durations by several orders o f magnitude. The superpressure balloon has the inherent capability o f long duration flight w ithout ballast, as has been thoroughly dem onstrated in NCAR’s GHOST Program and subsequent exercises. Until about a year ago, the superpressure balloon that had evolved was mainly suited to atm ospheric sounding and wind tracing. Now, however, the technology o f super
28

Fig. 1 A superpressure balloon 13 m in diam eter undergoing inspection and pressure test.
pressure balloons is being rapidly expanded to serve scientists who need the same long duration capability, but for heavier payloads and at higher altitudes.
What Is "Superpressure"?
The very term “ superpressure balloon” connotes an aerostat containing a positive differential pressure. But it would be incorrect to infer that “ superpressure” implies a very high internal pressure. To achieve stable, unballasted flight, all that is required is an envelope o f relatively inelastic material and a constant internal overpressure, however miniscule. The theory o f superpressure balloon flight is treated thoroughly by Grass (1962) and Lally (1968) and will
not be dwelt on here. It is sufficient to n o te several factors which together present a real challenge to the balloon designer.
Because the superpressure balloon is sealed from the m om ent o f launch, free lift gas cannot escape when the balloon reaches its floating altitude and the balloon becomes pressurized. The pressure level that ensues is initially dependent on the free lift provided, but this pressure will then fluctuate up or down as the balloon’s tem perature rises or falls relative to the am bient tem perature. The superpressure generated by free lift m ust be high enough that it is not all lost at night when the radiation tem perature o f the balloon can go well below the am bient tem perature, and it
must not be so high that solar heating during the day causes a fatal rise in pressure.
While the principle o f superpressure balloons has long been known, its practical realization had to await the appearance o f a material with a suitable com bination of strength, m odulus, light tra n sm iss io n , and gas permeability. Semi-practical designs were fabricated as early as 20 to 30 years ago, but it was not until Mylar and other polyester films became available that reliability and predictability could be achieved. Polyester and some newer films are just s t r o n g e n o u g h to c o p e w ith tem perature-induced pressure fluctuations within a modest safety margin. In theory gas loss by diffusion through the films will not be critical for weeks, m onths, or even years. In practice, flight durations are lim ited more by im perfections in the film, m anufacturing flaws, or ultraviolet degradation of the material.
Developm ent of Superpressure Balloons
Almost every facet o f m odern balloon design was anticipated in some way during the earliest days o f ballooning. For example, Henry de la Vaulx (1903) described a crude form o f superpressure balloon which not only enhanced altitude stability but also provided a degree o f altitude control. De la V aulx’s article in turn cited earlier work along the same line. The first practical application of superpressure balloons was during World W ar II when Japan released several h u n d re d bom b carriers, along w ith thousands o f the zero pressure type, in an attem pt to bomb the U.S. mainland (Mikesh, 1973; Takada, 1951). Even these were not true superpressure vehicles, since they needed to carry a small am ount o f ballast to maintain flight for more than a few days. In the mid 1950s renewed interest in long duration ballooning resulted in a num ber o f “ pseudo” -superpressure designs at General Mills which showed promise but yielded no real success (B artholomew, 1953; W hitnah, 1955). Vinyl, saran, and polyethylene films were used,
29

bu t none o f them had the strength to w ithstand pressure fluctuations. Neverth e less , small polyethylene balloons w ithout instrum entation on board made flights from M innesota to Europe in w hat we assume was an approxim ation o f superpressure flight.
The real beginning for practical superpressure balloons was in 1956 when a feasibility program was instituted at the Air Force Cambridge Research Laboratories (AFCRL). Small, pillow-shaped Mylar balloons were launched from Denver, and some o f them reached the east coast eight days later. This work was followed by a more am bitious program in which balloons flew for 30 days at high altitudes and carried significant payloads (Kelly, 1963).
During the 1960s, NCAR contributed further developments to the superpressu re ballooning begun by AFCRL. NCAR’s w ork resulted in a carrier for light payloads that consistently flies three to six m onths and frequently more than a year. Maximum performance figures to date include flight durations o f 744 days, altitudes up to36 km (5 mb), and payloads to 1,500 N (340 lbf). In the past few years payload weights and altitudes have been extended so that scientists making experim ents o f m oderate weight will have carrier vehicles available to them in the imm ediate future. A ltitude and payload capabilities particularly can be expected to increase consistently in the years to come.
Design Parameters
The design o f a superpressure balloon for any specific application involves a m uch more delicate balance among variables than the design of a zero pressure balloon. In bo th cases, the general principle is to use the minimum practical skin thickness to keep the balloon light in weight and small in size, bo th for easier handling and for lower cost. The factor limiting smallness for a superpressure balloon is the force o f the skin stress that will occur at the peak supertem perature. Polyester films have an u l t im a te strength in excess of 200 MN/m2 (29,000 psi). Designs are
usually based on predicted peak skin stress values in the range o f 70 MN/m2 (10,000 psi). With smaller balloons, up to 5 or 6 m in diameter, the weight penalty o f a thicker skin is relatively unim portant, and skin stresses are held to some 50 M N/m2 for greater reliability. The thicker skin is also more im portan t for obtaining long durations with small balloons because o f their adverse surface-to-volume ratio.
In larger balloons weight becomes m uch more crucial and design stresses may be allowed to go as high as 90 MN/m2 . Flight history shows relatively few cases in which the peak pressure was underestim ated, resulting in balloon rupture. More often nighttime supertem peratures are lower than had been predicted, with consequent loss o f altitude stability, followed by early term ination o f the flight.
The various parameters all fit to gether in a somewhat com plex chart as
shown in Fig. 2. This graph, along with Fig. 3, can be used for a first order a p p ro x im atio n o f balloon size and weight for a given payload and altitude. Designs for actual applications are alm ost invariably calculated by an individual com puter run using the specific flight variables involved. In addition to payload and altitude, these variables include such factors as the climatology at the latitude of flight, desire for m aximum or only nominal duration, launch facilities available, launch difficulties expected, and perhaps even a risk tradeo ff that the experim enter is willing to accept.
Before this step, however, the graphs do allow determ ination of balloon size and weight to a reasonable degree of accuracy. Figure 2 shows a family of segmented line curves for various payloads. Each line segment represents the thinnest recommended film that can be used to support the given payload at the
Fig. 2 Superpressure balloon size estimator, w ith alternate fam ilies o f line segments in color fo r clarity only.
30

1 10 100
BALLOON DIAMETER (m)
Fig. 3 Superpressure balloon weights. A lternate lines are in color fo r clarity.
required altitude. The curves o f Fig. 2 are based on a free lift o f 15%, a m aximum supertem perature of 10%, and a maximum film stress of 70 M N/m2 . To take a specific example, consider a payload o f 1,000 N (225 lbf) at 3 mb. The graph shows that the thinnest polyester bilaminate that can be used is 19 pm thick. It also shows that the balloon diameter will be 68 m. Any polyester
film thicker than 19 /nm can also be used, w ith the result being a larger and heavier balloon having a lower skin stress.
The line segments as shown in Fig. 2 lim it maximum stress to 7 0 M N/m2 . Each o f the segments can be extended upw ard, again with diminishing skin stresses. Extrapolating downward would in c re a se film stress. Table 1 shows
specifications for several typical super- pressure spheres.
Cost Effectiveness
The process o f fabrication is far more costly for polyester spheres than for polyethylene balloons. This fact will
References
Bartholomew, F., 1953: M eteorological Constant Level Balloon Development. General Mills, Inc., Report No. 1251. Minneapolis, Minnesota.
De la Vaulx, H., 1903: L’emploi des ballons il ballonnet d ’apres la theorie du General Meusnier. Academie des S c ie n c e s , Paris. Com ptes Rendus Hebdomadaires des Seances 137(19), 749 - 753.
Grass, L. A., 1962: Superpressure Ballo o n f o r Constant Level Flight. A FC RL Instrum entation for Geop h y sic s and Astrophysics No. 21. Bedford, Massachusetts, 62 pp.
Kelly, T. W. (ed.), 1963: Proceedings o f th e A F C R L S c i e n t i f i c Balloon Sym posium . Air Force Surveys in Geophysics No. 154. AFCRL, Bedford, Massachusetts.
Lally, V. E., 1967: Superpressure Balloons fo r H orizontal Soundings o f the Atm osphere. NCAR Technical Note 28. Boulder, Colorado, 167 pp.
Mikesh, R. C., 1973: Japan’s World WarI I Balloon Bom b A ttacks on N orth A m e r i c a . Smithsonian Annals o f Flight No. 9. Smithsonian Institution, Washington D.C.
T a k a d a , T ., 1951: Balloon bomb. Shizen 6(1), 22 - 33; 6(2), 4 4 - 5 4 ; 6(3), 70 - 77 (in Japanese).
W hitnah, G. R., 1955: Final R eport on Contract N onr 875(00) A n n ex XII. General Mills, Inc., Report No. 1366. Minneapolis, Minnesota.
Table 1T Y P IC A L S P EC IF IC ATIO N S FOR SUPERPRESSURE B A LLO O N S
Diameter (m) 3.5 7.9 19.5 33.5 59.2 90.2
Volume (m3) 22.5 ■ 261 3,880 19,700 108,600 384,000
Weight (N) 32.3 403 890 2,160 4,450 10,875
Film Thickness* inm) 25 X 25 50 X 25 X 50 25 X 25 19 X 19 13 X 13 13 X 13
Design Payload Weight (M)
10 310 670 670 1,450 2,200
Altitude with Design Payload !mb)
150 200 32 10 4.5 2.9
Altitude with Design Payload (m)
13,600 11,800 23,400 31,000 36,500 39,700
* L a m in a te d p o ly e s te r. N um b e rs in d ic a te th ic k n e s s o f each laye r.
31

deter some experimenters from using polyester vehicles. However, the fact that extrem ely long durations enable experim ents not otherwise possible will in many cases make the costs acceptable. On the other hand, there will be a large body o f experim ents for which the cost per exposure hour simply does favor the superpressure type. It is difficult to generalize about balloon and operations costs, and even more diffi
c u l t to make comparisons between “pears and oranges.” However, we will generalize for the sake o f establishing a frame o f reference.
Payloads on zero pressure balloons are c o m m o n ly in th e ran g e of3,000 - 10,000 N, whereas superpressure payloads will probably not greatly exceed 2 ,000 N for the next few years. Allowing for this disparity, the balloon and flight operations costs for typical
experim ents on zero pressure balloons might range from $0.10 to $ 1.00 per newton-hour. In the same frame o f re fe ren c e , superpressure flight costs might be the equivalent o f $0.05 - $0.10 per newton-hour. While this in itself is a distinctly favorable ratio, the real im petus for growth in long duration superpressure ballooning will probably come from the new types o f experim ents which it makes possible. •
James A. Winker earned bachelor’s degrees in Aeronautical engineering and business administration fro m the University o f M innesota in 1952. He worked as a junior engineer in balloon developm ent with General Mills, Inc., from 1951 to 1954, and as a research and developm ent o fficer in charge o f internal pressure balloon developm ent fo r the A ir Force Cambridge Research Laboratories fro m 1954 to 1956. In 1956 he joined Raven Industries, Inc., where he has served as senior engineer in the aerospace engineering division; ch ie f engineer in charge o f the development, test, quality control, and support groups; and now as manager o f the applied technology division. Winker holds more than ten patents fo r devices related to ballooning, and is a m em ber o f the Am erican Institu te o f Aeronautics and Astronautics, Tau Beta Pi, Tau Omega, Triangle Fraternity, and the sport balloonists’ association, the Balloon Federation o f America.
Long Duration Flight Program
o O & fte /u u tA Michael Pavey
An exciting event has recently taken place in the world o f scientific ballooning, an event that may have more influence on the future use o f balloons fo r scientific experim ents than any other recent achievement. This event w as the com mand term ination and recovery of a scientific gondola on1 March 1973 from a superpressure balloon after 36 days aloft and two com plete orbits o f the southern hemisphere.
It all began in late 1971 and early1972 with the form ulation o f plans for an expedition to Australia to make this
am b itio u s flight and recovery. The scientific com m unity had already shown considerable interest in using superpressure spherical balloons for flights o f long duration. The NSBF felt, however, that it was necessary to prove the feasibility o f recovery after a long duration flight before embarking on any major developments o f balloons or electronics.
A t the start o f the program (designated Project Boomerang) the decision was made to use the old, reliable polyester superpressure spherical balloon. Most previous attem pts at long duration
flights made w ith other materials and balloon shapes had been quite unsatisfactory but the polyester sphere had been used successfully on hundreds of flights ranging from only a few days to more than 1.5 years. Payloads ranged from only a few newtons to 40 or 50 N; a few were 5 0 0 -1 ,2 0 0 N. The m aximum altitude reached w ith the heaviest payload, however, was only 20 - 30 mb, a level hardly useful for research in areas such as cosmic ray and x-ray and gamma ray astronom y. As an alternative to attem pting higher altitudes w ith these
32
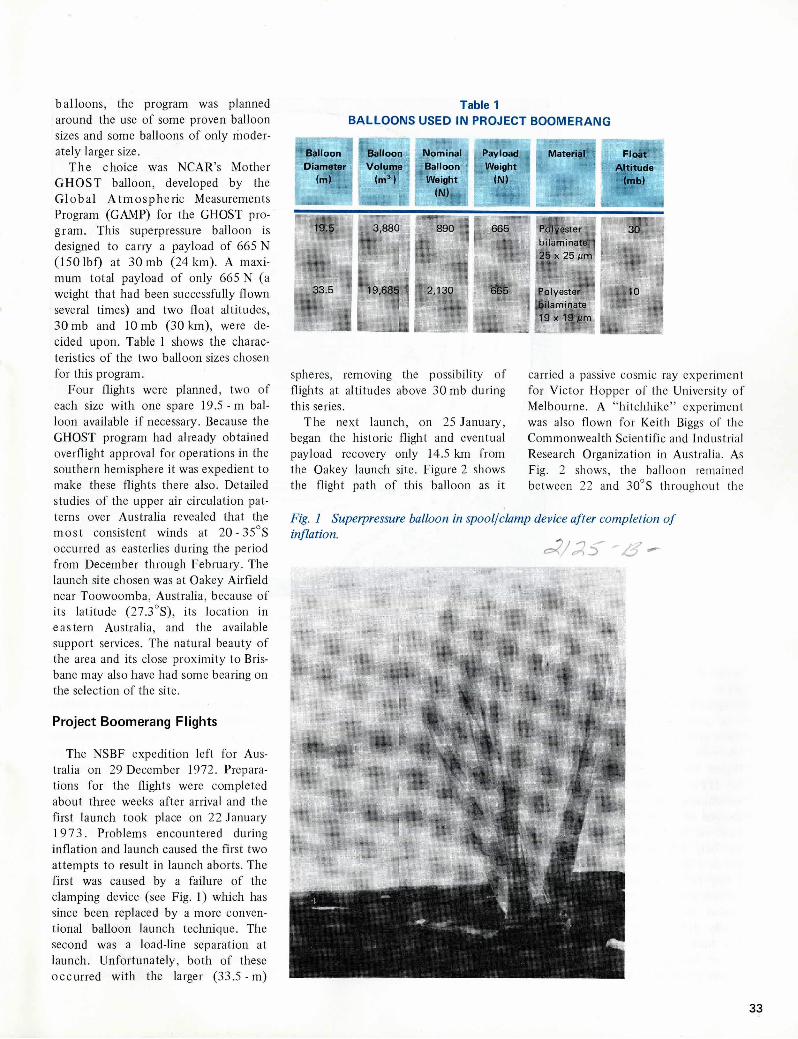
Table 1BALLOONS USED IN PROJECT BOOMERANG
BalloonDiameter
(m)
BalloonVolume
<m3)
NominalBalloonWeight
(N)
PayloadWeight
(N)
Material FloatAltitude
(mb)
19.5
3 3 .5
iHHHHBi
3 ,8 8 0
1 9 ,6 8 5
8 9 0
2 ,1 3 0■■ ■B ill
6 6 5
6 6 5iSfisjgaagi
P o lye s te r b ila m in a te 2 5 x 2 5 nm
P o lye s te r b ila m in a te 19 x 19 |Um
3 0
10
balloons, the program was planned around the use of some proven balloon sizes and some balloons of only m oderately larger size.
T h e choice was NCAR’s M other G H O S T balloon, developed by the G lo b a l A tm o sp h e ric Measurements Program (GAMP) for the GHOST program . This superpressure balloon is designed to carry a payload of 665 N (150 lbf) at 30 mb (24 km). A m axim um total payload of only 665 N (a weight that had been successfully flown several times) and two float altitudes, 30 mb and 10 mb (30 km), were decided upon. Table 1 shows the characteristics o f the two balloon sizes chosen for this program.
Four flights were planned, two of each size w ith one spare 1 9 .5 -m balloon available if necessary. Because the GHOST program had already obtained overflight approval for operations in the southern hemisphere it was expedient to make these flights there also. Detailed studies o f the upper air circulation patterns over Australia revealed that the m o s t consistent winds at 20 -35°S occurred as easterlies during the period from December through February. The launch site chosen was at Oakey Airfield near Toowoom ba, Australia, because of its latitude (27.3°S), its location in easte rn Australia, and the available support services. The natural beauty of the area and its close proxim ity to Brisbane may also have had some bearing on the selection of the site.
Project Boomerang Flights
The NSBF expedition left for Australia on 29 December 1972. Preparations for the flights were com pleted about three weeks after arrival and the first launch took place on 22 January 1 9 7 3 . Problems encountered during inflation and launch caused the first two attem pts to result in launch aborts. The first was caused by a failure o f the clamping device (see Fig. 1) which has since been replaced by a more conventional balloon launch technique. The second was a load-line separation at launch. U nfortunately, both o f these occu rred w ith the larger (33.5 - m)
spheres, removing the possibility o f flights at altitudes above 30 mb during this series.
The next launch, on 25 January, began the historic flight and eventual payload recovery only 14.5 km from the Oakey launch site. Figure 2 shows the flight path o f this balloon as it
carried a passive cosmic ray experim ent for V ictor Hopper o f the University o f Melbourne. A “hitchhike” experim ent was also flown for Keith Biggs of the Com m onwealth Scientific and Industrial Research Organization in Australia. As Fig. 2 shows, the balloon remained between 22 and 30°S throughout the
Fig. 1 Superpressure balloon in spool/clamp device a fter com pletion o f inflation.
33

Fig. 2 Trajectory o f Flight No. 81 - N launched on 25 January and recovered on 1 March 1973 (altitude o f 30 mb).
entire flight (NSBF Flight No. 81 -N w i t h N C A R c o d e d d e s ig n a t io n 278032/7 SD/LUCK).
A com etary dust-collection system for Curtis Hemenway of the Dudley Observatory was carried on the last two flights. The first balloon remained aloft for 212 days (NSBF Flight No. 82 - N), establishing a record for duration at an altitude o f 30 mb. The second— which burst on reaching float altitude— was the only balloon failure in the group. Figure 3 shows the trajectory through 4 July 1973 for Flight No. 82 - N. This balloon got caught in the wind reversal period during its second orbit and finally drifted back over Australia in late June. By this time its position was q u i te inaccurate and an attem pted recovery was unsuccessful. The failure
may have resulted because the term ination was not com manded in the right geographic location or because there was insufficient on-board power for the term ination.
Fligh t Electronics
T h e Australian Boomerang flights used a very basic electronics system that consisted of a 1 /2 -W high-frequency telem etry system, a PCM command system, a power supply (solar cells and rech arg eab le batteries), and various means of term ination and tracking. The chief requirem ents for the electronics were to use systems already available and to keep the power requirem ents and weight at a minimum; the acquisition of scientific data was not a prerequisite.
Trackin g System
T h e p r o je c t re c e iv e d excellent track in g support from the GHOST tracking station network in the southern hemisphere. The main tracking device was a sun-angle sensor on the balloon which located the balloon’s position at noon each day. (The time at which a photoresistor registered minimum resistance gave the longitude, and the m inimum resistance value itself gave the angle o f the sun, which was then used to determ ine the latitude.) A sun-angle sensor attached to the top o f the balloon transm itted its signal through the two coder-transm itters, also at the top. A second sun-angle sensor was carried in the main electronics package beneath the balloon. The many trade-offs re
34

Fig. 3 Trajectory o f Flight No. 82 - N launched on 29 January 1973, which established a fligh t record o f 212 days a t an altitude o f 30 mb.
quired to locate the system accurately (including estim ation o f the balloon’s speed and trajectory) restricted accuracy to a value optim istically estim ated at 160 km.
The major problem encountered in Project Boomerang was the insufficient accuracy of the balloon location inform ation. This is o f special im portance during the period im m ediately preceding recovery o f the payload. In fact, w ithout the use o f Australian east coast radar for tracking during the term ination period o f Flight N0 . 8 I - N the balloon might not even have been located, let alone term inated. With an accuracy o f only 160 km it was necessary to use additional location techniques during cutdown and recovery. These consisted of a Suchy radar target
attached to the load line and a high- f r e q u e n c y continuous-wave beacon, w ith a 5 - W output. The beacon operated on a frequency o f 1.80 MHz and was turned on by com mand control when w ithin radio range. It could be located by an aircraft direction finding system and would allow accurate fixes to w ithin ±6.8 km (4 mi) on the balloon and ±8 km (5 mi), for location o f the package for recovery purposes. All these various means of tracking were used to sucessfully locate, term inate, and recover Flight No. 81 - N.
Data Transm ission
In addition to the data from the sun- angle sensor, strain gage data from the balloon skin were also relayed to the
ground stations. The bo ttom transm itter sent back inform ation such as the tem perature o f the electronics package and the status o f the battery pack and the com mand system. The telem etry system consisted of a low-bit-rate PCM data signal (about 30 bits/sec) that was used to key a continuous-wave carrier. Each f l ig h t o p e ra te d w ithin a band o f 1 5 .020 - 15.029M Hz. This high frequency transm itter was basically the system developed previously by the GHOST program; it is extrem ely lightweight, consumes very little power, and has a transmission range o f hundreds to thousands o f miles.
Telecom m and
The com mand system was a PCM
35

type w ith a ten-function ou tpu t. Unique address codes were used for each dec o d e r . A PCM e n c o d e r w ith a frequency-shift-keyed audio tone o f 1,600 and 1,900 Hz was used to frequency m odulate a transm itter. The tone was received, dem odulated, and decoded in to command functions by the balloon electronics. The transm itter operated at 148.9 MHz w ith a narrow band frequency m odulation and w ith a25 -W output. The major drawback w ith this system was that it was only effective to the radio horizon range. It was intended primarily for the com mand term ination of the flight and for turning the tracking beacon on and off. However, on Flight No. 82 - N it was also used for changing sample collectors in the scientific package.
Power System
The power to operate all o f the electronic and cutdow n devices consisted o f a 28 - V silcad battery pack and a solar cell panel. The solar cells were m ounted in a tetrahedral shape so that one side would be in the sunlight at all times during the day. Each side contained sufficient cells to operate the electronics and recharge the battery pack to full capac ity over a period o f sunlight 10 - 12 hr long.
Palestine Test Flights
Before going to Australia for the Boomerang flights, the NSBF made a te s t flight w ith a 33.5 - m-diameter balloon w ith a payload o f 665 N. This flight was conducted on 28 October1972, to check bo th the launch system an d balloon perform ance w ith this larger, untested vehicle. A 20 - h r float at 10 mb was made before command term ination o f the flight. Numerous strain gage and tem perature data were recorded throughout the flight, along w ith accurate pressure altitude data. These data have given us the first opportunity in the history o f superpressure ballooning to examine m ore closely actual flight param eters that influence the perform ance o f this kind o f balloon. Additional data gathering flights o f this
type are planned to enable the design o f an efficient balloon for long duration application.
After the successful conclusion o f Project Boomerang from Australia, a second Palestine test flight (Boom erang II) was conducted in May 1973. The goal was to increase the load- carrying and float-altitude capabilities o f superpressure balloons. A 59.2 - m- diam eter spherical balloon constructed o f a 25 - ;um laminated polyester film was designed to support a 1 ,4 5 0 -N (325 - lbf) payload at a float altitude o f4.5 m b. A new launch technique was s u c c e s s fu l ly tr ied using a heavily padded, norm al launch spool and an u p w in d lau n ch . The inflation and launch were sm ooth; however, a num ber o f problems were encountered during the balloon’s ascent. Portions o f the balloon became caught between the suspension lines; this trapped region appeared (through a telescope) to be p a r t i a l ly in f la te d as the balloon approached 80% inflation and was presumably pulled back through the lines and torn as the sphere expanded to its full volume.
T h e b a l la s t system also caused trouble. The am ount o f ballast dropped was unknow n until the payload was recovered and about 178 N (18 kg) o f ballast were found in the hopper. I f the proper ballast flow rate had been m aintained, all ballast should have been expended. The added load sigificantly reduced the am ount o f overpressure. T h e balloon eventually reached its specified float altitude and though some p ressurization was observed on the system, it was not enough to com pensate for the negative super-temperature at night. Shortly after sunset rapid descent o f the balloon required com m and term ination.
Future Plans
Project Boomerang has established the feasibility of recovering long durat io n flights and the possibility o f carrying heavier payloads to higher altitudes. With the addition of an improved e le c tro n ic s capability, superpressure long duration balloon flights can be
come a reality for scientific experim entation. Already, flights from Palestine are planned with an ultim ate design goal o f 2,225 N at 40 km. New materials are currently being evaluated which will significantly reduce the balloon vehicle’s cost and possibly improve flight durations. Clearly we are on the verge o f an exciting new era in scientific ballooning.
A s head o f the Engineering D epartm ent o f the NSBF, Michael Pavey is responsible fo r directing all engineering efforts at the facility, including work scheduling, technical supervision, budgeting, proposal preparation, and planning fo r the fu ture. He earned B.S. degrees in both mathematics and art fro m Augustana College, Sioux Falls, South Dakota, in 1961. That same year he jo ined Raven Industries, Inc . , as a designer and project engineer in the aerospace engineering division. In 1966 he became project engineer in R a ven ’s balloon division, and in 1970 he was appointed manager o f balloon programs in the applied technology’ division, responsible fo r engineering, production, and sales fo r all balloon projects. Before assuming his present position in January 1973, he served fo r one year as a project engineer a t the NSBF, involved in establishing and testing long duration superpressure ballooning fo r scientific application.
36

High Energy Astronom yfrom Balloons Robert C. Haymes, Rice University
Gamma rays and X rays from cosmic sources, bo th discrete and diffuse, carry a trem endous am ount of inform ation about the nature o f those sources. Through the study o f these radiations we can learn about processes that release m uch more energy than tha t generated in normal processes, such as those that power stars like the sun. We can learn about objects observed to produce as m uch energy as would be released in the com plete annihilation of one hun dred million solar masses. We can explore the properties of m atter so condensed that nearly a solar mass is contained in a sphere only 20 km in diameter, and o f m atter infalling on collapsed objects so massive tha t their enormous surface gravity even prevents light from leaving them.
Cosmic ray sources characteristically r a d ia te high energy photons. High energy astronom y can help reveal where this ubiquitous radiation is generated, and also remotely m ap its distribution throughout the galaxy and beyond, from observations o f the gamma rays produced as cosmic rays bom bard other m atter.
The origin o f the chemical elements has always been a great problem . N ucleosynthesis leads to discrete, characteristic gamma ray spectra; high energy astronom y may tell us where the elem ents are being made.
A ntim atter is only rem otely detectable as such through gamma ray studies. Mapping its locations, if any, would be vital to cosmology. Its potential for com plete energy release might even some day provide a new source o f energy for practical use.
Since high energy radiation is m uch m ore penetrating than visible light, absorption o f the radiation by dust between the source and the observer is not as serious as in conventional astronom y. Thus, it is possible to observe
sources hidden from us optically, such as the center o f the galaxy.
U nfortunately, however, absorption o f X and gamma radiation by the earth’s atm osphere is a serious problem . Our atm osphere passes the visible band o f wavelengths through itself w ith relatively m inor attenuation, but the entire high energy band is absorbed by it.
A ttenuation o f electrom agnetic radiation at a given energy by transmission through an absorber such as the atm osphere is an exponential function of the am ount o f atmosphere along the line of sight between the source and the detector. Typical e-folding depths at high energies in our atmosphere are at most only a few percent o f the to ta l atm ospheric thickness.
F ig u re 1 shows how atmospheric absorption depends on the energy of the radiation. The necessary observations o f source locations, energy spectra, polarization, interior brightness distribution, and variability cannot be made successfully from underneath the entire thickness o f the earth’s atm osphere, except at the extrem ely high end o f the energy band. It is clear from the figure tha t altitudes o f at least 30 km (100,000 ft) are necessary for the observations. X rays, the lower energy radiations, require even higher altitudes.
Present-day balloon technology limits attainable altitudes to approxim ately 5 0 km (1 5 0 ,000 ft). Therefore, the m in im u m -e n e rg y extraterrestrial X radiation scientists can study from balloon altitudes is about lO keV . Such radiation is referred to as “hard” X rays. Rockets and spacecraft are required for the study of “ so ft” X rays.
Yet few high energy astronom ers today are satisfied with altitudes of only 30 km, even for energies far greater than 10 keV. The reason for this is the atm ospheric background.
As cosmic rays bom bard the atm o
sphere, X and gamma rays result from interactions of the cosmic rays w ith air atoms. These atm ospheric photons constitute an intense background against which the relatively faint celestial radiation must be observed. The background at typical balloon altitudes is often several orders o f magnitude more intense than is the radiation from the brightest celestial sources.
To at least a first approxim ation, the intensity o f the atmospheric photons depends linearly on atm ospheric pressure. Thus the background at an altitude where pressure is ~ 1 mb (50 km) is only about 10% o f that encountered at the 10 - mb level (30 km).
Since the atmosphere absorbs ex traterrestrial photons and is a source of background, why bother making m easurements from within it? The answer to this question is largely, bu t no t entirely, economic: typical balloons cost a ro u n d ten thousand dollars, while spacecraft costs are measured in terms o f millions o f dollars. Even w ithout consideration o f the relative collecting areas o f balloon and satellite telescopes, balloon experim ents are about 100 times cheaper than those conducted with spacecraft.
T oday’s scientific satellites carry payloads weighing several hundreds o f k ilograms. Typical balloon payloads weigh thousands o f kilograms, and much of the additional weight may be devoted to collector area. Thus the cost ratio cited above may become even greater for equal-area detectors.
Satellite experim ents are no t free from background. Most o f today’s orbiting satellites penetrate the high fluxes o f particles in or precipitating from geomagnetically trapped radiation (the Van Allen belts). These high particle fluxes may paralyze the data systems and thus reduce the useful time to those periods spent outside the zones. Or,
37

150130
110100
10“3 10'1 10 10J 10s ENERGY OF RADIATION lev)
Fig. 1 A tm ospheric attenuation o f electromagnetic radiation as a func tion o f energy/wavelength. The curves show the altitude dow n to which each percentage o f radiation is transmitted; the lighter color represents the decrease in the am ount passing through the atmosphere. Grid sections between 102 and 10~l A show the transmission o f X rays; sections to the right o f those show the percentages fo r gamma rays. N o te the presence in the infrared region (~ 10~ l to 10~4 cm ) o f occasional windows in atmospheric opacity.
they may activate the spacecraft and even the detectors themselves, limiting the sensitivity o f some measurem ents fo r long after direct exposure has ceased.
One reason for the popularity o f balloon-borne astronom y is that the atmospheric background is at least partially reducible. Besides flight at high altitudes, it is advantageous to use the low est latitudes feasible, where the cosmic ray flux is lower. At high altitudes over the geomagnetic equator, cosmic ray intensity is only about 10% o f that found over either geomagnetic pole. It now appears that the atm ospheric photon fluxes follow a similar latitude distribution.
O ther reasons for the frequent use o f balloons by high energy astronom ers are com m on to virtually all balloon-borne experim ents, regardless o f discipline. One is that the payloads are usually recoverable: they can be flown again with recalibration and checks of the perform ance so tha t steady improvem ent is made through a series o f flights. A nother reason is the “ quick reaction capability.” As new phenom ena are discovered, experim ents can be much
more quickly designed, built, and conducted w ith balloons than is practical w ith today’s scientific satellites. Many in v e s t ig a to r s have concluded that balloon-borne astronom y today offers the highest inform ation return per dollar spent for those wavelengths accessible from balloon altitudes.
Balloon-altitude high energy astronomy does, however, have some serious lim itations. In addition to the problems associated with atmospheric absorption o f the “ signal” and atmospheric generation o f “ noise,” unam biguous observations o f the diffuse, cosmic background are difficult from balloons. The residual atm osphere above the balloon is in itself a diffuse source of radiation; hence some m odel-dependent extrapolations o f the atm ospheric com ponent to the top of the atmosphere are necessary for the interpretation of the observations of the diffuse radiation.
F u r th e rm o re , present-day balloon technology limits the observing time to a m aximum o f a day or two. There are several reasons why much longer observing times than this are required:
• Unlike its older cousins, the optical and radio astronomies, high energy as
tronom y is photon-lim ited. Random ly arriving individual photons are detected, and the mean rate is usually small. Under these circumstances, the precision o f the m easurem ents is inversely proportional to the square root o f the num ber o f detected photons. Thus, even neglecting the relatively intense atm ospheric background, which m ust also be measured, the precision o f the results is proportional to the square root of the observing time on a given discrete source. To improve precision by a factor of ten, hundreds o f hours (i.e., a m onth or so) o f observing time will be needed for a given collecting area.
High energy astronom y does resemble its older relatives in that a full day is required for all o f the sky to pass th ro u g h an earth-bound observer’s upper meridian. For more than a few closely spaced sources to be observed d u r in g a single experim ent, much greater observing times than those now available are needed.
• While solar physics is not usually considered part o f high energy astronomy, it is known that X rays and gamma rays are em itted during solar flares. Studies o f these radiations should
38

add m uch to our understanding of flares and o f the sun. These observations, as well as observations o f other variable sources, require long observing times so that the infrequent events may be detected.
• Infrequent, transient sources o f high energy radiation have been disc o v e re d w ith satellite experiments. Strong evidence for other transients has been adduced by comparisons o f data from separate balloon flights. Complete surveys and detailed tem poral studies o f these sources using balloons w ith large weight-lifting capability will require an increase o f flight time to at least a m onth.
As we move tow ard the era o f high energy astronom ical observatories and o f the space shuttle, w hat can we predict for the future of balloon-borne astronom y? Both o f those spacecraft can carry very heavy payloads, and w h e n i t b eco m es operational, the shuttle will even offer a recovery and repair capability, together with the presence of man. There are reasons to believe that balloon-borne astronom y will nevertheless remain alive and well. It seems likely to continue to satisfy a need o f a large part o f the astrophysical com m unity for many years to come.
NCAR’s National Scientific Balloon Facility (NSBF) is developing superpressure balloons that promise observing times of several m onths for 250 - kg payloads at altitudes of 40 km. Early in1973, a p ro to type com pleted two revolutions o f the earth before it was successfully recovered near the launch site in Australia.
Superpressure payload weights are m u c h smaller than the 3 0 ,0 0 0 -kg capacity of the space shuttle. Considering past experience in optical astronom y, however, there will no doubt always be many small experim ents that do not require the large-weight capability o f the shuttle but that nevertheless accomplish valuable science. Numerous se p a ra te experim ents w ith different research requirem ents can easily be accom m odated on separate long duration balloons w ithout compromising the scientific needs o f any o f them . A single spacecraft tha t carries several experi
m ents may require some compromises in o r d e r to accom modate all the experiments.
Superpressure balloons show promise o f very economical experim ents, at least for payloads o f less than 250 kg. It is likely that long duration balloon experim ents will cost less than $ 100/kg o f payload— including developmental and production expenses for the vehicle and for the payload.
Balloon payloads autom atically avoid the worst o f the precipitating-particle fluxes. If conducted at low geomagnetic latitudes, observations in high energy astronom y conducted from long duration balloons may therefore be quite sensitive.
A higher altitude capability is also being developed by the NSBF for zero- pressure balloons. The goal is to develop in a few years a balloon that can lift 2 5 0 - kg payloads to about 60 km (180,000 ft). This altitude corresponds to a pressure o f about 0.25 mb. Such a balloon should significantly improve the sensitivity o f high energy astronom y experim ents and it should make balloons useful to other scientific disciplines.
The m odern scientific balloon is a remarkably effective educational tool. Many o f the present generation o f space scientists did their graduate thesis research with such vehicles. Since the payload capacity is relatively large, and since the development pace for the payload is the responsibility o f the investigator himself, an untrained student can tackle a whole balloon-borne system w ithout sophisticated “high technology.” He can learn about the technical aspects o f space science, from the space environm ent to telem etry, and can progress at his own speed, learning from his m is tak e s w ithout hindering a large project.
Much concern has been expressed about the widening gap in science and technology between the developed and th e developing countries. Scientific ballooning offers a way for scientists and students in the developing countries to enter into observational high energy astrophysics and also to develop m odern systems w ithout imposing impossible
demands upon their budgets. In sum, it seems likely that high energy astronomers the world over will continue to find the scientific balloon an attractive vehicle, for at least the foreseeable future.
Fo r Further Reading
G ratton, L. (ed.), 1966: High-Energy Astrophysics. Academic Press, Inc., 463 pp.
Greisen, K., 1971: The Physics o f Cosm ic X-Ray, Gamma-Ray and Particle Sources. Gordon and Breach, Inc., 115 pp.
Weekes, T. C., 1969: High-Energy A strophysics. Chapman and Hall, L td., 207 pp. •
R obert C. Haym es received his B.S. (1952), M.S. (1953), and Ph.D. (1959) degrees in physics fro m N ew York University, where he also served as assistant professor o f physics from 1959 to 1962. A fte r a term as a resident research appointee a t the Je t Propulsion Laboratory, California In stitu te o f Technology, fro m 1962 to 1964, he jo ined R ice University as assistant professor o f space science. In 1972 he was appointed to his present position at R ice as professor o f space physics and astronomy. Haymes is currently serving as chairman o f the UCAR Budget and Program C om m ittee fo r the NSBF. He is a m em ber o f several professional societies and has published m ore than 30 scientific papers.
39

Thermal Analysis ProgramS t tw i v a i Leland A. Carlson, Texas A&M University
HEAT FLU X OF OUTER LAYER
Fig. 1 M odel o f a balloon package: an equivalent-area sphere.
The success o f a high altitude balloon e x p e r im e n t frequently depends on maintaining the payload com ponents w ith in certain specified tem perature limits. Since it may be subjected to both daytim e solar heating and nighttime coldness, the payload package m ust be designed to w ithstand wide extrem es in its thermal environm ent. Thermal analysis and accurate prediction o f the tem peratures o f the com ponents over a period o f time are thus im portant in p re f lig h t planning— particularly for long duration flights on which cyclical effects and the coupling o f com ponents in the package may be im portant.
In conjunction w ith researchers at Texas A&M University, staff members o f the NSBF recently developed a model and a com puter program for thermal analysis o f balloon packages (Carlson et al., 1973). This model has been successfu lly used to determine the proper insulation, external coating, and power requirem ents o f actual flight packages and to study the therm al sensitivities o f a num ber o f typical packages (Carlson and Morgan, 1973).
Therm al Model
To make the model generally applicable, the package is represented by a sphere o f equivalent external surface area (Fig. 1). The idealized package normally has an external surface coating o f paint or tape that covers a layer o f insulation, usually about 50 mm thick. Inside, the com ponents are divided into two groups. Those located near the outside wall, such as the supporting structure and com ponents with low heat capacity, are grouped as “ internal com ponents.” The remaining com ponents are considered to be part of the “ reservoir,” and usually include the scientific instrum ents. The reservoir usually re
sponds slowly to thermal changes and provides a heat “ storage” for the rest of the package.
In the model all com ponents in a given group are assumed to have the same tem perature at any time. Circumferential variations are not perm itted, but all tem peratures are considered to be functions o f time. In bo th the in te rnal and reservoir com ponents the model allows for the dissipation o f power that is generated by electronics and on-board heaters. Internally, the model takes into account convection between the com ponents and the inside air, radiation between com ponents, and conduction th ro u g h the insulation and braces. E x te rn a lly , the heating consists of forced and natural convection with the atmosphere, and o f radiation. Daytime radiation is generally about 50% solar, 25% earth albedo, 20% atmospheric, and 5% earth and balloon infrared. At
night the radiative flux is reduced by a factor o f about four because o f the absence o f solar flux and earth albedo. The model not only accounts for the transient variation o f these properties but also includes changes resulting from atmospheric variations with altitude, changes in internal or reservoir power levels, sunrise and sunset, etc. See Carlson et al., 1973, for more details and further discussion.
Therm al Sensitivity of the Package
T h e therm al behavior o f balloon packages is affected by many parameters. Internal power is the primary influence on the tem perature inside the package. A typical large package has sufficient electronics and heaters in the reservoir to generate about 70 W or1,000 cal/min continuously. Also, the heat capacity o f a typical reservoir is
40

about 105 cal/C; at float, conditions frequently are such tha t the heating rate between the reservoir and the wall is near zero. From power alone, then, a heating rate o f 0.6C/hr can be expected, and the reservoir will warm only about 6C in 10 hr. If, however, the power were 210 W, the increase would be as m uch as 18C in 10 hr. Such a large increase can be serious because during daylight hours the surface coating o f balloon packages frequently causes the skin and inside wall to be warmer than the reservoir and thus to contain the heat generated from power sources. The best remedy is to design therm ostatically controlled heaters that reduce their ou tpu t when environm ental tem peratures rise.
The problem o f overheating can be particularly acute for small packages. Such packages usually have a reservoir heat capacity o f only 100 cal/C and a power dissipation o f only 14 W can induce a heating rate o f 120C/hr. Therefore the outside surface and insulation should be designed to perm it rapid dissipation of this energy. In general, because o f the strong coupling between com ponents, the correct surface can be determ ined only from com plete therm al analysis.
A b o u t h a l f th e g o n d o la s now launched at the NSBF are pressurized. Pressurization affects the internal heat transfer by improving the convection between the com ponents of the package and quickening their therm al response to external influences such as altitude changes or sunset. While each package is different, the results to date indicate that the actual tem perature change from p re s su r iz a tio n is small, particularly when com pared to other factors such as internal heaters.
Pre-launch environm ental conditions, although frequently ignored, are among the factors that can exert a strong influence on the therm al behavior o f the package. For example, if a package is placed in direct sunlight, its skin will warm quickly and reach a tem perature th a t places it in radiative thermal equilibrium with the incoming solar energy. Conversely, if the package is placed in the shade the skin may cool
below the am bient tem perature, again a c h ie v in g equilibrium. The hour a package is generally outside before launch may be sufficient time for the internal com ponents and reservoir to be affected. This effect can be very significant for small packages and may cause an initial reservoir tem perature 10 - 15C above am bient (Morgan and Carlson, 1973). Because of their slower response large packages are less affected. On the other hand, large packages are quite sensitive to their initial tem perature. Both the initial part o f the flight and the therm al history o f the entire mission may be affected by the initial tem perature because o f the large heat capacity and slow therm al response o f large packages. For example, studies o f two identical packages, one launched at 8C and one at 15C, indicate a residual 4C difference even after 11 h r o f flight (Carlson and Morgan, 1973).
T h e th e rm a l sensitivity o f large packages suggests that the time o f year for which the launch is planned should be considered in the therm al design o f the package. The average tem peratures a t Palestine, which range from 4C during a w inter night to 38C during a summer day, can be used as a guide to the therm al response o f the package. Pre-heating or pre-cooling can also be effectively used to ensure that the
package will m aintain the proper tem perature. For example, a package was recently pre-heated to 15C to ensure a flight profile above the 10C minimum requirem ent, even though the am bient tem perature of the launch site was 7C.
Probably the m ost im portant influence on the thermal behavior o f a balloon package is its external configuration: the type of surface coating, the type and am ount o f insulation, the presence o f braces, and the size and p ro x im ity o f the balloon. Primary among these is the surface coating and its associated radiative properties. The solar absorptivity, a, measures the percentage o f solar radiation striking the surface that is absorbed; the infrared emissivity, e, indicates the am ount of radiative energy (relative to a black body) em itted by the surface. N ot only are the magnitudes o f a and e im portant but so, too, is the ratio a /e because it is indicative of the am ount o f solar energy retained by the surface.
Figure 2 shows the effect o f surface coating on the reservoir tem perature o f a typical large package. This package was placed outside an hour before launch. It was launched at sunrise, had a float altitude o f 38 km, and stayed at float altitude until shortly after sunset. As can be seen, the solar absorptivity has a strong effect on therm al behavior.
Fig. 2 The e ffec t o f surface coating on reservoir temperature.
T ------------------- 1-------------------- 1-------------------- 1-------------------- 1----------
Dt-<
O>
LAUNCH FLOAT
i 1__ I I__ I
SUNSET
10
LOCAL TIME (hr)
41

LEGEND
S O LID LINES - RESERVOIRCOMPONENTS
DASHED LINES - IN T E R N A LCOMPONENTS
76-MM L IG H T BLUE■ a m b FO AM COVERED WITH
A L U M IN U M -M Y L A R TAPE........ 38-MM L IG H T BLUE FO AM ,«m » mmm UNCOATED— — A C T U A L F L IG H T D A TA— — 38-MM L IG H T BLUE
FO A M ,U N C O A TE D
wtm wtm
SUNRISE
J - J .
LOCAL TIME (hr)
Fz#. 3 The e ffec t o f insulation thickness and surface coating on com ponent temperature. The m o d e l’s predictions fo r tw o cases (colored and gray lines) are compared w ith temperatures recorded during an actual flig h t o f a 206-kg package with a flo a t a ltitude o f 41.1 km (black lines).D aytim e pow er was 81 W; betw een sunset and sunrise, the pow er was 171 W.
If bare Ethafoam is used for a high a, the package warms up considerably after arrival at float altitude and reaches a m aximum tem perature o f 26C. However, if the E thafoam is painted white the reservoir cools slowly while at float altitude and maintains a tem perature around 5C, and if it is painted a sandpiper color, the tem peratures are in term ediate. This kind o f variation has also been predicted and observed for small packages (Morgan and Carlson, 1973), although they tend to respond more rapidly and reach a steady equilibrium tem perature at float altitude. The importance of the type of external surface is clear since its choice can affect the tem perature of the reservoir by 15 - 20C or more.
A nother im portant aspect o f the external configuration is the am ount o f insulation used on the outside of the package. A thicker layer will minimize transient changes. Since at night the outside wall is cold and the heat flow is from the reservoir outw ard, thick insulation would retain reservoir warmth. The daytim e effect is not so easy to generalize. More insulation usually creates a slightly cooler inside tem perature. However, if the degree o f internal power is very high— for instance, 200 W in a
large package or 100 W in a small one— extra insulation may keep the heat in. In these cases, the package with the thicker insulation will probably be ho tte r, possibly by 1 0 -2 0 C , than one w ith less protection.
Frequently , however, the thickness of insulation and the type o f surface coating are selected together to create specific therm al conditions. Figure 3 shows how this is done by doubling the insulation and changing the coating in a sim ulated model. F or this package, some o f the im portant instrum ents were m odeled as internal com ponents and some were modeled as the reservoir. Thus, bo th tem peratures were o f vital interest. In bo th cases there were large tem perature changes at sunset and sunrise and a change in the am ount o f power at sunrise. The figure shows that the thicker (76 - mm) insulation coated w ith aluminum-Mylar m aintained significantly warmer nighttim e tem peratures and slightly cooler daytim e tem peratures. I f the thermal requirem ents had been 1 0 C < T < 3 5 C , the thinner, uncoated insulation would have been inadequate. (A further discussion of the therm al sensitivity o f balloon packages to these and other phenom ena is given by Carlson and Morgan, 1973.)
Com parison with Fligh t Measurements
C o m p a riso n s between predictions made using the package model and actual in-flight measurem ents have been made for bo th large and small packages (Carlson et al., 1973; Carlson and Mor-
References
Carlson, L. A., P. S. Morgan, K. Stefan, W. C. Wilson, and R. H. Cormak, 1973: High A ltitu d e Balloon Package Thermal Analysis: M odel and Com p u te r Program, Texas Engineering E x p e r i m e n t a l S ta t i o n R e p o r t TAMRF - 921 - 7307, June 1973.
Carlson, L. A., and P. S. Morgan, 1973: Thermal Sensitivity o f High A ltitude Balloon Packages, Texas Engineering E x p e r i m e n t S t a t i o n R e p o r t TAMRF - 921 - 7308, June 1973.
Morgan, P. S., and L. A. Carlson, 1973: Thermal Analysis o f the M ulti-Therm Balloon Packages, Texas Engineering E x p e r i m e n t S t a t i o n R e p o r t TAMRF - 921 - 7306, May 1973.
42
gan, 1973; Morgan and Carlson, 1973). When accurate data are used to model the package the predictions are generally very accurate. (Some night m easurements are given for the thin insulation case in Fig. 3.) A t 2330 hr the balloon made an unplanned descent from 4 1 .1 k m (1 3 5 ,0 0 0 ft) to about37 km (122,000 ft), where the am bient tem perature is about 5C colder. A t a b o u t 0400 hr the package heaters
failed, and the flight was term inated at sunrise. Despite these irregularities the flight data and the predictions agreed quite well.
Conclusion
It is believed that the present model can be used to predict accurately the therm al behavior of high altitude balloon packages and to design their ther
mal protection systems. No doubt remains that balloon packages are thermally very sensitive to the type o f ex t e r na l surface coating, pre-launch conditions and tem perature, and in ternal power supplies and heaters; they are m oderately sensitive to the thickness o f insulation, the presence of external braces, and pressurization; and they are relatively insensitive to the size of the balloon or the inside wall coating. •
Leland A. Carlson has been an assistant professor o f aerospace engineering at Texas A& M University since 1969, when he received a Ph.D. in aero-astro engineering fro m The Ohio S ta te University. He is a registered professional engineer in Texas and has published m ore than a dozen technical papers and reports. He is a m em ber o f several professional and honorary societies, including the Texas Society o f Professional Engineers, the American Physical Society, Sigma Xi, and Sigma Gamma Tau. For the past two years he has held offices in the H ouston chapter o f the American Institu te o f Aeronautics and Astronautics, and in the Aerospace Division o f the American Society o f Engineering Education.
Material Testing and Analysis
"X- IRaied 'pilot L. Dale Webb, Texas A&M University, and Michael Pavey
To the materials engineer, the most am az in g thing about scientific ballooning is that almost 90% o f the balloons actually reach float altitude. This is surprising because although balloons are designed for float conditions at ceiling altitude, that is a long way up from the ground, a long way from where the film and balloon were m anufactured, packaged, crated, shipped, and su b se q u e n tly stored, uncrated, and inflated. Further, the film must survive extensive physical handling and severe
e n v iro n m e n ta l conditions before it reaches design float altitude and conditions. Induced stresses on the balloon are calculated for altitude conditions at float but not for any other phase o f its service life. This means that very little is known about the true stress relationships and structural changes the m aterials may undergo during the handling and ascent portions o f a flight.
W ithout knowing the exact nature of these stress relationships it is difficult to specify materials that will perform ade
quately. Fortunately , the problem is not nearly so serious as it sounds. For instance, we already know tha t two polye th y len e films, X - 1 2 4 and S tra to Film®, have perform ed with a high degree of success under nearly all conditions encountered in a balloon flight. But we also know tha t over the past 1 0 - 1 5 years there have been “qualified” balloon materials which did not perform as expected. We hoped that by thoroughly examining every characteristic o f each o f these films a definite
43
pattern could be established to discrimina t e between good films and bad. Characterizing every aspect o f every film to achieve discrimination has p r o v e n , h o w e v e r , t o be a time- consuming and expensive process.
A ctual Stresses
Logically, the solution would be first to determine the actual stresses in a balloon so that test techniques could be developed. Actual inform ation on stress, strain, and skin tem perature obtained during inflation, launch, and ascent would enable simulation tests to be perform ed in the laboratory. However, this kind of inform ation is very elusive. The NSBF conducted a num ber of test flights to this end bu t found that nearly the entire surface o f a balloon would have to be covered w ith strain gages and therm istors to determ ine the actual stress and strain distribution. Although t e m p e r a t u r e d istributions were recorded, the lack o f corresponding stress and strain data obscured the definition o f useful test requirem ents. The developm ent o f discriminatory testing techniques is, therefore, bo th an exercise in duplicating the extrem ely severe environmental conditions that a balloon undergoes in flight and a search for a means o f detecting possible structural changes that could have occurred in the materials before the flight. For example, how m uch abuse is the film subjected to when the balloon is being fabricated? What changes in the molecular structure o f the film occur during heat sealing? The material can also be significantly affected by the abrasion, folding, and creasing that occur during packing and shipm ent o f the balloon to the launch site and during pre-launch handling. Despite the im portance o f these considerations they are relatively minor com pared to the problems encountered during launch and ascent.
At launch the balloon is only partially inflated. The helium in the balloon “ bubble” at ground level is highly com pressed by atmospheric pressure and occupies only a small percentage of the balloon’s fully expanded volume. Stress on the film, however, is greatest
just at launch o f the balloon system. Near the top o f the balloon the film is subjected to a biaxial stress state. Below the bubble the film is constrained under th e l a u n c h spool during inflation, creating a region of probable abrasion and heavy creasing or folding of the film while it is stressed. Upon release from the spool the previously constrained b a l l o o n suddenly “leaps” skyward, creating a large mushroom effect w ith rapid unfolding of the material. This severe loading, with its high rates of deform ation and high stresses, sometimes results in a system failure.
Most balloon failures have occurred during ascent through or close to the tropopause (coldest region) where the tem peratures are com monly in the range o f -70 to -85C. At this level, shear winds can be encountered and the loosely hanging film may suddenly catch the wind, forming a “sail.” The “ sailing” and cold tem peratures in com bination are probably the most severe conditions the balloon film will encounter. U nfortunately, it is also during this period in the life o f the balloon that we know l e a s t abou t the actual shapes and stresses involved.
The designer endeavors to maximize the lift-to-weight ratio o f the balloon. This requires stressing the films near their elastic lim it. Since m any of the films are therm oplastics, their viscoelastic nature dictates that their elastic limit depends upon the tem perature and duration o f the applied stress. Many flaws are inherent in the films and more are created by handling and fabrication. Small flaws, such as microscopic pin holes or disorders on the molecular level, grow at a rate depending upon bo th magnitude and direction o f the applied load. The seriousness o f any existing flaw depends on stress magnitudes and directions as well as tem perature.
Studies o f fracture mechanics suggest t h a t t h e relationship among these parameters takes the form
where crcr is the stress at which a flaw of
size c begins to enlarge at a rapid rate, E is the m odulus of elasticity o f the film, and y is the material property repres e n t i n g the work required (energy expended) to create a unit o f “new” surface area (make the crack grow).
In this equation, bo th E and 7 are strong ly tem perature-dependent. The m odulus E increases as tem perature decreases and the energy required to enlarge the flaw, 7 , becomes smaller as the film gets cold, reaching a minimum value at the “b rittle” transition tem perature for the film. The longer a balloon system is exposed to loads which enhance flaws in the film, the more likely system failure becomes as the balloon reaches the low tem perature extremes of the upper atmosphere.
Since flaws are inherent in all balloon systems, their seriousness m ust be defined in terms o f size and growth rate for any given stress and tem perature. Quality control tests must therefore be developed that will measure the significance of inherent flaws in terms o f their im portance to balloon flight.
Flaws intensify applied stress in their imm ediate vicinity. A film that is unable to deform plastically in regions o f high stress m ust necessarily fracture. For this reason, it is very im portant that prospective balloon films be “ ductile” in their behavior at all tem peratures encountered in the upper atmosphere. Because the significance of microscopic flaws is minimized in ductile films, valid measurem ent o f a film’s cold-brittle tem perature and subsequent strength loss is essential.
Testing for Co ld Brittleness
A number o f testing techniques and procedures have been used to check balloon film for cold-brittleness p roperties. Studies o f environm ental and testing parameters have revealed several that could influence both the cold- brittle point and the film strength; these factors are summarized in Table 1. Until the mi d - 1 9 6 0 s the cold-brittle point for all polyethylene used in balloons was required to be at least -68C. At that time the only way to make cold-brittle determ inations was to drop or roll a
44

TABLE 1FACTORS INFLUENCING COLD BRITTLENESS ANDSTRENGTH AT FAILURE
FACTORSCOLD-BRITTLE
POINTTEMPERATURE
FAILURESTRENGTH
INCREASE PRE-LOAD WARMER DECREASE
INCREASE PRE-LOAD TEMPERATURE WARMER DECREASE
INCREASE PRE-LOAD TIME WARMER DECREASE
INCREASE STRAIN RATE WARMER INCREASE
INCREASE PRE-LOAD RATE WARMER DECREASE
steel ball through a diaphragm of film and then to inspect the resulting tear to determine whether the failure was ductile or brittle.
From 1962 through late 1964 the balloon failure rate became excessively high. Since balloon design and fabrication had not been altered, one of the major suspected causes of this high failure rate was an undetected change in the properties of the polyethylene. The normal cold-brittleness and strength tests showed no differences between the films of that period and the earlier, more successful films of the late 1950s through 1961. In lieu of any discriminatory test, a proposed solution to the problem was simply to develop films capable of passing the standard cold- brittleness test at temperatures considerably colder than -68C. In 1964, StratoFilm® became the first film especially developed to meet the new criterion. Both StratoFilm® and the subsequently developed X -124 had cold-brittle points at or below -80C. The use of these films immediately brought about a significant increase in the number of successful balloon flights, a trend that has continued to the present time.
Because former test techniques are still used to determine cold brittleness, changes in the film can still occur without detection by testing. In fact, some films which now pass all current resin and finished film property tests (such as having a properly low brittle transition temperature, adequate uniaxial tensile
strength, and strong heat seals) make completely unreliable balloon systems.
Records of many actual flights have helped in the search for discriminatory tests for prospective films. Studies showed that temperatures and handling of the balloons at ground level had a significant effect on the altitude at which brittleness, and hence fracturing, occurred. Air Force-sponsored research* revealed that subjecting film to the static loading characteristic of prelaunch balloon restraint could cause a significant increase in the temperature at which the film became brittle (i.e., the film became brittle at a much warmer temperature than before it was stretched). The cold-brittle transition temperatures of films that had exhibited problems in flight were found to have been significantly altered by the pre- loading; successful films were much less influenced. The pre-loading had, in a sense, improved the test’s capacity for discriminating between good and bad films.
Still this technique has a number of drawbacks, including in particular the necessity to obtain specially fabricated heat-sealed cylinders for the test. Moreover, actual samples from production balloons could not be directly evalu
* Alexander, H. and D. Weissman, 1972: A Compendium o f the Mechanical Properties o f Polyethylene Balloon Films, Stevens Inst it u t e o f T e c h n o lo g y (January) , various pagings.
ated, the tests were expensive and time- consuming, and the parent film could no t be evaluated without the ever present seals influencing the results.
In mid - 1972 the NSBF, with Texas A&M University, initiated a program to- explore means of developing practical test methods and relevant acceptance criteria for balloon material systems. One effort has been the development of a mechanical testing system that subjects the film to a multiaxial stress presumably similar to that induced in actual flight. The testing system consists of:
• An environmental chamber in which the low temperatures that are characteristic of the upper atmosphere can be maintained,
• A “ diaphragm” sample holder (Fig. 1) in which a rectangular sh ee t o f film ~ 15 X 38 cm (6X 15 in.) can be clamped along its edges in an airtight fashion so that it can be inflated to failure,
• A pressurization and pressure- measuring system, and
• A film-height measuring device.The inflated film has a shape of a long cylindrical balloon, with spherical end segments attached to a cylindrical body. The hoop stress in the film is computed from knowledge of the inflation pressure, radius of curvature of the film, and film thickness (a = PR/t).
The film and its holder are inserted in the chamber (Fig. 2) and liquid nitrogen is injected to produce a desired low temperature. The assembly is allowed to reach equilibrium and the film is then pressurized to failure. Just above its cold-brittle point the film fails by smoothly tearing along a fairly straight line normal to the hoop stress (Fig. 3, bottom). Below its cold-brittle point the film shatters into a jagged tear pattern, exposing “new” surface area orders of magnitude greater than before (Fig. 3, top).
Pre-stretching the balloon films to extension ratios, X (final length/initial length), up to 2.0 emphasizes the differences among otherwise similar films. In this technique the films are cut to a rectangular shape 15 X 38 cm; one end is clamped to a load frame, and the
45

; ; <
. . . *,iiSSSte. j*— s ,
•
HriPP»' ■ •
. . . j . • . , .
. . . it , . .
. . . & * ■ • ■
. . » | * J»
. . ijtLuJ» V . .
'*Tn*n illlillli
Fig. 1 The racetrack diaphragm clamping ring is shown here clamped over stretched polyethylene in holder arrangement.
other is stretched to the extent necessary to achieve any given extension ratio. The films are held stretched at the same extension ratio by the sample holder which is bolted together, sandwiching the already stretched film between its plates.
When a workable technique had been evolved it was used to determine the actual cold-brittle point of various poly- ethylenes. Tests were made from sections cut from films of actual balloons that had failed; these results were then compared with those from tests on new material known to have come from film lots that had performed satisfactorily. Figures 4 and 5 show results from these early tests. In both instances, fairly well defined cold-brittle temperatures were determined. A cold-brittle temperature was also found for material specimens containing heat seals. These two sets of data represent the first time that inflation of a diaphragm of film had been used to determine a cold-brittle point. They also are the first sets of data to indicate a shift in the cold-brittle point when a heat seal is introduced into the film.
The next phase of testing was to determine the cold-brittle points on “old” and “new” DFD 5500 balloon films. These are the films which only the pre-loaded cylinder tests had previously been able to discriminate as being “good” and “bad,” respectively. As expected, when tested in the dia
phragm tester in an unstretched condition, both films indicated almost identical cold-brittle points. This result corresponds with those from unloaded cylinder tests which also revealed no difference between the two films.
Procedures were then established for stretching the film to the specified elongation percentages. Techniques were developed to clamp the film in the “ racetrack” tester in a stretched configuration. These samples were then cooled in the chamber and inflated to rupture. Figures 6 and 7 give the results of tests performed in this way on the old and new DFD 5500 film. These results indicate a marked difference in the cold-brittle point for any X greater than 1.0 for the two films.
This research indicates that a valuable method of generating acceptance criteria for films and heat seals is to measure both the biaxial film strength and the influence of extension ratios on the b rittle transition temperature. An “envelope” curve can thus be generated for each good and bad film which can serve both as a check on each new batch of good film and as a standard for comparison with any candidate film. Such tests will serve adequately during the period necessary for discovering the true nature of the film microstructure (molecular type, crystallinity, cross-link density, entanglements, etc.) and how it is influenced by extrusion, heat sealing, and launch and flight loadings. •
Fig. 2 Environmental chamber and auxiliary equipment for use with the racetrack tester. A clamped sample is being loaded into the chamber.
Fig. 3 Samples o f films pressurized to failure at cold temperatures in the racetrack tester. The top sample shows cold-brittle fracture;
the bottom sample shows ductile, non-fractured failure.
46

ccIDC/Dcn
ccD
Figure 4 Figure 5
t iA
A
A>> A
.... .
AA
A
A A ' 2I
' A ‘i
A
AA A k
A
........1....-4 4 - ■L.oia-brittie Komt
....... 14 1---------7 2 -74 -7 6 -7 8 -8 0 -8 2 -8 4 -8 6 -8 8 -7 2 -7 4 -7 6 -7 8 -8 0 -8 2 -8 4
TEST TEMPERATURE (°C) TEST TEMPERATURE (°C)
Racetrack cold-brittle tests o f 0.70-mm StratoFilm® (Fig. 4) and 0.75-mm X-124 (Fig. 5).Samples 3 X 1 2 in. in size were tested in the transverse direction, unstretched. Solid figures denote brittle failure.
-86 -8 8
Figurr i g u r £)
t c►A oI • 4
m i ■a %A
e /
o z\
A%
*A * •
L4
A • o O 1«
' - #■ 1 , A*A
•
( •L
A
Cold-Brittle Point D FD 5500 New
Cold-Brittle Point DFD 5500 Old
Cold-Brittle Point D FD 5500 New
-------1— 1-4-
Cold-Brittle Point DFD 5500 Old
^ 5
trD(/>t/3
CCD
-42 -4 4 -58 -30 -32 -3 4 -36 -3 8 -4 03 -4 8 - 5 0 -5 2 -5 4 -5
TEST TEMPERATURE (°C) TEST TEMPERATURE (°C)
Results o f racetrack testing of2-mm old and new DFD 5500 film (represented by triangles and circles, respectively). Samples 3 X 1 2 in. in size were tested in the transverse direction.Those in Fig. 6 were unstretched; those in Fig. 7 were stretched by a factor o f 50%. In the latter case, the difference in cold-brittle points is clearly defined. Solid figures denote brittle failure.
-4 6
L. Dale Webb holds a B.S. in physics from New Mexico Institute o f Mining and Technology (1958), an M.S. in solid state physics from Oregon State University (1961), and a Ph.D. in interdisciplinary engineering from Texas A&M University (1969). He has worked as a physicist for the Rare Metals Division o f the U.S. Bureau o f Mines, and for Rocketdyne, the solid rocket division o f North American Rockwell Corp., as a senior design engineer and as the responsible engineer and principal investigator for the fracture mechanics program. In 1969 he joined the faculty o f civil engineering o f Texas A&M University as an assistant professor o f materials science and engineering. He is a member o f several professional and honorary societies and is the author o f more than 30 technical reports.
47
FAIL
URE
PRES
SURE
(p
si)
FAIL
URE
PRES
SURE
(p
si)

Giant Balloons Jean R. Nelson, Winzen Research Inc.
Two major objectives of scientists using balloon-borne equipment are higher altitudes and heavier payloads. Higher altitudes require larger, lighter balloons, and heavier payloads require larger, stronger balloons. Efforts directed toward developing larger, lighter, and stronger balloons have solved many design, manufacturing, and operational problems. These areas are interdependent in the achievement of optimal balloon performance.
One of the critical limitations in building giant balloons (500,000 to2 million m3 in volume) is the weight of the balloon. Two alternative solutions have been found to this problem. The first is a lighter, stronger film material made of a type of nylon resin. The second is to use StratoFilm® (made from polyethylene resin) and at the same time to strengthen the portions of the balloon that undergo stress during inflation, launch, and ascent through the troposphere. We strengthened the balloon by designing a shape with additional thicknesses of material integrally sealed along with the balloon wall. These form multiple layers, or concentric caps, in the wall for greater bubble s treng th while the balloon climbs through the troposphere. The bulk of the balloon wall below the caps can be made of much thinner film with a huge weight saving that does not compromise the balloon’s strength. Basic computer programs furnished by NCAR were modified to accommodate this improvement in the design. Computer programs have been indispensable for solving problems in the design of intermediate shapes for inflation and ascent when the balloon is only partially inflated.
Another substantial design improvement to permit the flying of heavier payloads resulted in improved end fittings. A new method for clamping on
the apex fitting was developed to keep the bubble well shaped and concentrically loaded during inflation, even with greatly increased loads. This method of clamping was tensile-tested to 40,000 kg on a simulated balloon top with no evidence of slipping or damage to the material.
The requirements for increased balloon sizes have led to many substantial improvements in the manufacturing area. The first change was a longer, unimpeded work area. In 1969 the length of the production plant at Sulphur Springs, Texas, was extended from 183 to 244 m. This length permits the construction of balloons up to 1.8 million m3 with very heavy payloads, and up to 2.1 million m3 with light payloads of ~200 kg. Space is available for further extension of the building to handle any practical balloon size up to a volume of 3.4 million m3 with heavy loads, or a volume of 4.1 million m3 with light loads.
Materials development has been conducted with many films, but those showing most promise are in the nylon family of resins. Applied research is progressing in both nylon and polyethylene films for heavy loads and for high altitudes in programs sponsored by NCAR, the Air Force Cambridge Research Laboratories (AFCRL), and the Office of Naval Research (ONR). The basic development of films and the required techniques for handling and sealing have been conducted by Winzen Research Inc., while procurement and flight evaluation of the balloons have been attended to by governmental agencies.
One of the difficult problems in manufacturing is quality control, particularly for a product like a balloon, in which one flaw can mean catastrophe for a scientist. To ease this problem vir
tually all the balloon components were gradually moved to in-house production at Winzen Research. This practice began with the manufacture of film and was then extended to include load tapes, nylon and polyester braided lines, and construction and repair adhesive film tape.
The advent of giant balloons required a whole new approach to manufacturing tooling. The length of seal, varying thicknesses of material, and different types of materials required the development of far more sophisticated sealing equipment. A new sealing machine was developed to achieve the required accuracies in sealing temperature, pressure, and speed, and to automate the process almost completely to minimize variation among operators. The length, bu lk , and to ta l weight of these ba llo o n s— m any of which weigh1,000 - 2,000 kg, and a few more than 3,5 00kg— necessitated the developm ent and fabrication of material- dispensing machines and finished balloon loading machines to handle the material and the completed balloon.
A giant balloon is just a huge mass of plastic and a few metal fittings unless it can be brought to life with a helium injection and sent on its way to the fringe of space. Many methods of launching balloons have been developed as balloons have grown larger and payloads heavier. The principal ones are shown in Table 1. At the present time the m ost com m only used launch method is the dynamic launch. During inflation the bubble is restrained with a roller and the payload is supported by a mobile vehicle. The bubble is released by the roller, the payload vehicle is moved under the bubble, and the system is released at the appropriate time. This is, of course, a simplified description which does not cover variations
48

Table 1 Types of Launch
A ClutchB Anchor line and roller restraintC Mobile payload and roller restraintD Tom balloon and roller restraintE TandemF Vertical—ground and seaG Reefing-sleeve verticalH Stonehenge (combination of B and E)
caused by balloon size, payload bulk and weight, wind velocity and direction, and the type of launch vehicle. Basically this type of launch is limited to payload weights in the range from 2,000 to3.000 kg in optimal weather conditions for launching. It is remarkable that a balloon can survive the flailing and buffeting caused by the sudden release of tremendous forces as it reaches a new equilibrium configuration for ascent.
It has been evident for many years that the optimal launch method is with the balloon and its payload in ascent position, commonly known as a vertical launch. The balloon is symmetrically loaded and the payload is subjected to little stress at launch. The one main danger in all balloon launches is wind. In the vertical launch it restricts the launch window almost to zero, since the balloon flight train is 300 m high or more. Some reduction in the flailing of uninflated balloon material has been achieved through the use of a polyethylene reefing sleeve attached to the balloon. A thin plastic panel opens the sleeve and allows the expanding bubble to tear itself free. The sleeve has been used successfully on balloons of140.000 to 1.3 million m3 . But even when it is used, the small cone angle (10°) permits the wind to fill loose material and expand it into a “sail,” causing occasional failures.
While payloads in excess of 3,000 kg have been flown using a tandem balloon system, there are many disadvantages to this launching method. A second balloon to contain the launch bubble increases the weight and volume of the system beyond that of a single-cell balloon system, and the main balloon is
under more severely stressed conditions than is a single cell. Inflation and launch control demand many sophisticated and costly launch vehicles. In short, this method is unpromising.
A program was conceived that combines the protective reefing sleeve with the optimal vertical launch to contend with the problem of wind. This program has been sponsored and funded by the ONR. The many adverse effects of wind on a balloon launch were analyzed and a system developed to overcome or reduce these effects.
To provide a wide launch window, all development tests were conducted with ground winds of about 15 kt. The balloon is laid out with its apex downwind and its base fitting attached to an anchor or winch. Inflation is begun and the bubble is allowed to weathercock with the wind as it rises to the vertical position. The reefing sleeve is released as inflation proceeds so that a “ tight” bubble is maintained until full inflation. When the parachute is attached to the base of the balloon, a winch or a vehicle with an anchor pulley erects the balloon over the payload. The payload can be attached to an anchor line which is cut to insure a smooth launch, or attached to a mobile vehicle to move under the bubble for release after the let-up cable is released.
At a more detailed level, some of the anticipated problems brought surprises. We supposed that one of the major problems would be with erection of the initial bubble, as it is with a platform roller launch, because there were large areas of undeployed material and little lift to control them. But this was not the case. The difference is that the vertical launch allows the elongated initial bubble, with its keel or hanging sail of uninflated film, to move parallel to the wind and thus to remain stable. By comparison, if even a light wind (3 or4 kt) is at an angle to a platform roller during the initial erection of the bubble, a risky sailing of the balloon can develop because the roller is immobile. As the bubble grows it can move off the original line of erection and drag the uninflated portion over the ground. The reefing sleeve protects the balloon by
forming a portable ground cloth. Years of experience with platform roller inflations have shown that if the bubble’s cone angle is maintained between 30 and 60°, the bubble is streamlined enough to protect the balloon film from winds as high as 15 kt. A self-ripping sleeve, developed first, could not make cone angles large enough without damaging the balloon. Moreover, the material often rolled instead of ripping, and caused superpressure in the bubble. The sleeve was finally made from a dacron material with a high-slip polyethylene liner. It was circumferentially hemmed every 0.6 m along its length to contain a releasable restraint line. With this construction, inflations of over1,800 kg with a 50 - pm film during winds of 18 kt and inflations of over 300 kg with 13 -jum material in winds over 15 kt caused no balloon damage. The restraint lines are released with a hand line or with squib cutters. After launch, when the balloon system has accelerated up to almost the wind-field velocity, a baroswitch-controlled squib cutter severs the restraint line and allows the sleeve to open fully, but it remains attached to a flange on the balloon gore seam for the duration of the flight.
Two other problems remained to be solved, both in connection with the inflation tubes. Inflation tubes are troublesome in wind even in platform roller launches where the bubble is relatively close to the ground. With the bubble some 200 m in the air, the wind forces on an inflation tube could lift a man off the ground or tear the tube out of the balloon. The first approach was to put the inflation tube inside the balloon. This worked all right for low inflations but caused problems when the pull of the bubble at the base of the cone flattened the tube into a slit which restricted gas flow and caused a high concentration of stress and film damage. Moving the inflation tube outside to a flange attached to the sleeve and covering it with protective fabric gave excellent results. In this arrangement helium is put in at the base of the balloon and enters the bubble at the apex fitting.
49

Table 2
E X P E R I M E N T A L B A L L O O N S
Q U AN TITY VOLUME FILM OPERATIONS
2 56,000 m 3 50-ium StratoFilm ® AFCRL1 113,000 m 3 15-Mm StratoFilm ®N AFCRL1 198,000 m 3 38-,um StratoFilm ® ONR/NCAR1 906,000 m 3 38-Mm S tratoFilm ® AFCRL
The second problem was to restrict the rotation of the bubble during inflation to prevent it from twisting off the source of helium. Patch techniques developed for blimp suspension applications provided the solution. Two patches were constructed and sealed into adjacent gores, 180° apart. These patches can handle 100 kg of pull without damage to the balloon. With the large moment arm on the bubble, the maximum force needed to control the rotation is 11 kg. An elastic cord is inserted in the line to prevent undue shock to the bubble. To help the operators control the bubble’s torque, the handling lines are braided around two No. 20 conductors and contained on a reel with an adjustable clutch. Just before launch, power can be applied through these lines to release them from the balloon.
The development program has included a dozen ground inflations with 50 - and 13 - nm balloons with volumes of 7,000 to 56,000 m3 and one 13 - /urn,7,000 - m3 balloon. Several experimental balloons currently awaiting flight
evaluation are listed in Table 2.It is our firm belief that the vertical-
inflation, reefing-sleeve launch system will open the way for even larger bal
loons than the 1.4 - million-m3 balloons now under construction, and even heavier payloads than those up to 4,500 kg now being lifted. •
Jean R. Nelson has been Director o f Engineering at Winzen Research Inc. since 1960. He has supervised his company’s participation in Stratolab V, and been involved in about 50 Skyhook and manned balloon flights. He earned a B.S.M.E. from the University o f Missouri in 1940, when he became senior project engineer with the Allison Division o f General Motors, concentrating on carburetion, fuel controls, and accessories for military aircraft. In 1953 he was appointed project engineer for Minneapolis Honeywell, where he served until assuming his present position.
Development of a Powered Balloon
System Arthur O. Korn, Air Force Cambridge Research Laboratories
Several governmental agencies have expressed strong interest in the capability to suspend payloads over selected areas at high altitudes for periods of one week or more. In response, the Aerospace Instrumentation Laboratory of the Air Force Cambridge Research Laboratories (AFCRL) has explored the feasibility of providing a propulsive force on unmanned balloons to enable hovering or loitering missions. Studies
show that during selected periods of the year such a system would be feasible over many geographical areas, at selected altitudes up to 30 km above ground level.
For purposes of demonstration, a system has been designed and constructed, using a conventional free balloon with existing hardware and launch equipment. This system has now been flown on two occasions and although
problems did occur during flight, the concept of pointing and powering a large free balloon system against the wind at high altitude was successfully realized.
The concep t depends on the existence of minimum-wind fields; low wind speeds are required because of the high drag of the balloon. Although many investigations have been conducted on high velocity winds in the
50

atmosphere, especially those relating to jet-stream activity, minimum-wind fields have received little attention, apparently because they are of little operational importance in the performance of aerospace vehicles. They are, however, directly related to the planning for high altitude flights of free balloon systems whenever it is desirable to obtain maximum flight duration with minimum horizontal movement from a fixed geographical location. Figure 1 shows the approximate altitude at which these minimum-wind (Min-Wind) fields occur during summer in the northern hemisphere where the occurrence of stratospheric easterlies above tropospheric westerlies results in a transitional area of light and variable winds. Within this layer there are levels at which the winds are essentially zero.
For several years the Aerospace Instrum entation Laboratory has been flying unpowered free balloon systems in this Min-Wind layer, both to test the ability of a flight system to remain over a designated area for an extended period and to obtain data on the structure of minimum-wind fields. In these test flights it has been possible to keep a balloon within a 160-km radius of a point on the ground for up to 100 hr.
Figure 2 shows the results of one of our ten test flights. If we determine that the balloon system is drifting too far, we can locate a compensating wind at a nearby altitude; then, by ballasting to climb or valving gas to descend, we can shift the balloon into the desired wind field. The success of these unpowered flights aroused AFCRL’s interest in powered flight, since we reasoned that if some small amount of propulsion were available, the station-keeping capability of balloon systems could be greatly extended.
F ig u re 3 graphically presents the concept of powering a free balloon. The flight system is launched in the conventional manner and ascends to the predetermined minimum-wind layer. When it arrives there, the motor is turned on, the system is pointed into the wind by radio control, and station-keeping is established.
HI
Fig. 1 Mean scalar winds in the northern hemisphere in summer. Areas in color indicate regions where the use o f a powered balloon is feasible.
Fig. 2 Hovering balloon flight C68 - 24, launched from Chico, California,0823 PDT, 1 August 1968. Flight duration was 104.3 hr. Arrows show direction o f movement. Letters correlate trajectory with time and altitude.
90 80LATITUDE
50 40° 30 20° 10‘
I CENTRAL I MIDDLE EAST & J T EUROPE "MEDITERRANEAN*! SOUTH
------- -) |~ - EAST —ASIA
SUMMER, NORTHERN HEMISPHERE, MEAN SCALAR WINDS (kt)
SCAN DINAVIA
-------------U.S.S.R.
Westerly Wind > 15 kt
Easterly Wind > 15 k t
TIM (PDT) §
<
>O* 3 0HD0CO 201 I— ccO 10
60 50 40 30 20
EAST-WEST MOVEMENT (n mi)
■CHICO-*
CHICO ...__1-----
(FLOAT)
51

In conjunction w ith Goodyear Aerospace Corporation, AFC R L first studied the fe a s ib ility o f the high-altitude powered balloon concept, using both streamlined (b lim p) and natural-shaped (o r ro u n d ) ba lloon configurations. Reciprocating engines, turbines, and electric motors were considered as candidates fo r balloon propulsion, and fuel cells, solar cells, and batteries fo r electrical power. Results o f this feasibility study are shown in Table 1.
A fte r the feasibility o f the powered concept was established, the problem was s tud ied parametrically and an economical system was designed fo r flight demonstration. Figure 4 shows a typical result o f the parametric study. D L refers to disk loading on the propeller. Low disk loading results in the highest efficiency in a low density atmosphere. Power Source No. 3 is a combination o f solar cells and primary silver
Fig. 3 An idealized representation o f the powered free balloon concept. The minimum-wind layer represented by the band o f color is between 60,000 and 70,000 ft.
Ta b le 1R E S U L T S O F F E A S IB IL IT Y S T U D Y
O F P O W E R S O U R C E S F O R B A L L O O N S
• A ir -b re a th in g eng ines are best b e lo w 3 0 ,0 0 0 f t . (C o n tin e n ta l T -6 5 andA i Research T -7 6 )
• T h e best p o w e r source above 5 0 ,0 0 0 f t is an e le c tr ic m o to r d r iv e n b y b a tte r ie s and recharged b y so la r ce lls.
• T h e s tre a m lin e d b a llo o n c o n c e p t, th o u g h th e o re t ic a l ly b e tte r ( lo w e r d rag! th a n a ro u n d b a llo o n , is v e ry c o s tly and d i f f i c u l t to la u n ch a n d recover.
• M ic ro w a v e p o w e r tra n s m is s io n to a b a llo o n fo r p ro p u ls io n is to o expensive and a large g ro u n d in s ta lla t io n is in vo lve d .
Fig. 4 Altitude as a function o f balloon volume for a 500 - lb payload
(Power Source No. 3).10s 106 107 10®
BALLOON VOLUME ( ft3) f
52

Solar Cell Array
£ - 12 - " -
Mylar-ScrimNatural-ShapedBalloon
Swivel with Disconnect
Payload
Gondola with Electric Motor and Batteries
Fig. 6 Powered balloon payload at launch. (Official U.S. Air Force photograph.)
Fig. 5 General arrangement o f a natural-shaped powered balloon.
zinc batteries. Normally, a disadvantage of solar cells is that a supporting structure has to be provided. In this application, however, the supporting structure exists, since the solar cell array could be supported entirely by the balloon envelope. Flexible cadmium sulfide cells would be desirable for this use.
The system is shown diagramatically in Fig. 5. The parachute system rigging hardware, balloon, and control system are off-the-shelf items currently used for conventional ballooning; the propeller is a 200-rpm, FH - 1100 helicopter rotor. The direction of motor thrust is controlled by a rudder located in the slipstream of the propeller. After a mission the balloon is expended and the gondola recovered by parachute.
Flight Tests
After these studies were completed, feasibility demonstration flights were
undertaken. A natural-shaped, powered balloon system was built and then flown twice. To minimize flight costs, this system used available balloons, launch equipment, and routine techniques. The test flight gondola is shown in Fig. 6.
The first demonstration flight was in September 1972. The system carried a 1,724 - kg payload to an altitude of 18.6 km. Propulsion batteries comprised 816 kg of the payload; although the battery power system was very heavy, it was the most economical for the limited duration of the test flight. This first high-altitude powered balloon flight successfully demonstrated the feasibility of powering a free balloon system against the wind. All systems functioned for the first power-on cycle of 43 min. The propulsion motor was then allowed to cool for 11 min before another power-on cycle was initiated. The autopilot system was given various heading com m ands during these powered cycles, and the system was also flown by manually controlling the rudder.
After four power-on cycles (3 hr of
flight time) control of the azimuth heading was no longer possible. It was then determined that the rudder had broken free of the payload, and subsequent examination of the failed rudder support tube indicated improper heat treatment after a welding process. The system did, however, attain airspeeds in excess of 5.7 m/sec.
The system was again flown successfully in June 1973. However, after less than 1 hr of flight, a socket-to-pin connection in a rudder-control integrated circuit failed, inactivating the rudder servo motor. Once again, though, airspeed was measurable and gondola stability was confirmed. The payload was recovered in good condition and is being reworked for another flight.
Future Program
An advanced powered balloon system known as POBAL-S is now in the design stage. POBAL-S will use the lower drag, class-C hull configuration with a stern- mounted, gimbaled electric motor for propulsion; no rudder will be required.
53
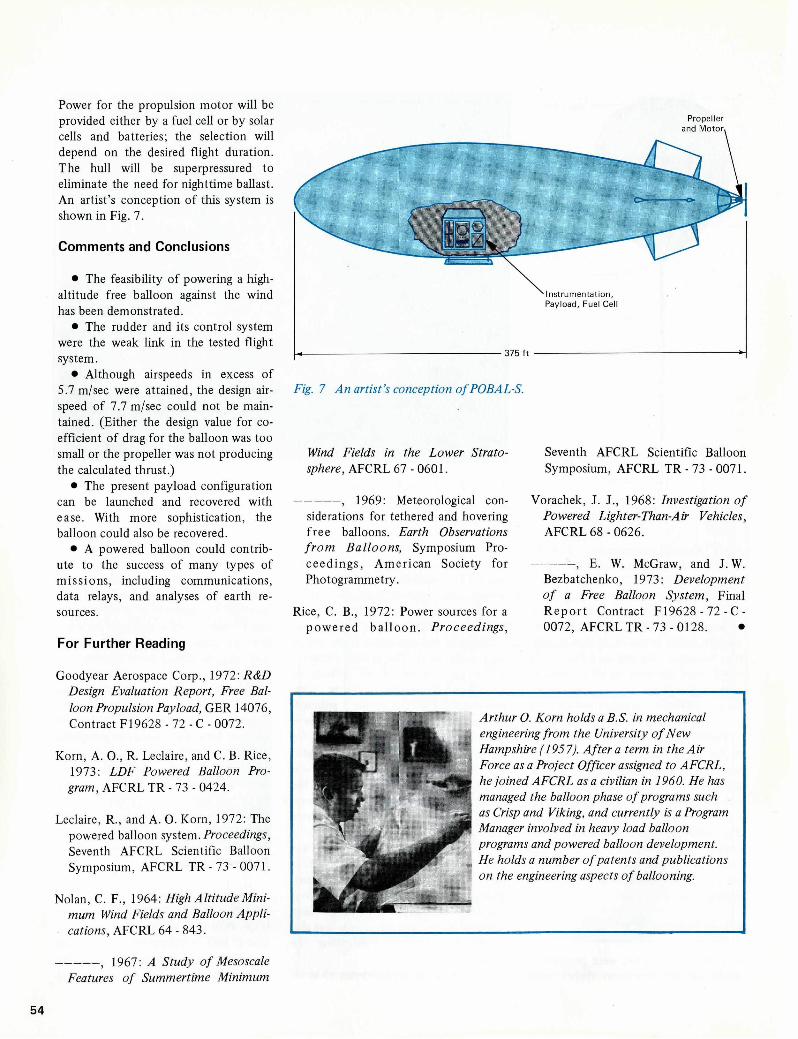
PropellerPower for the propulsion motor will be provided either by a fuel cell or by solar cells and batteries; the selection will depend on the desired flight duration. The hull will be superpressured to eliminate the need for nighttime ballast. An artist’s conception of this system is shown in Fig. 7.
Comments and Conclusions
• The feasibility of powering a high- altitude free balloon against the wind has been demonstrated.
• The rudder and its control system were the weak link in the tested flight system.
• Although airspeeds in excess of 5.7 m/sec were attained, the design airspeed of 7.7 m/sec could not be maintained. (Either the design value for coefficient of drag for the balloon was too small or the propeller was not producing the calculated thrust.)
• The present payload configuration can be launched and recovered with ease. With more sophistication, the balloon could also be recovered.
• A powered balloon could contribute to the success of many types of missions, including communications, data relays, and analyses of earth resources.
For Further Reading
Goodyear Aerospace Corp., 1972: R&D Design Evaluation Report, Free Balloon Propulsion Payload, GER 14076, Contract F19628 - 72 - C - 0072.
Korn, A. 0., R. Leclaire, and C. B. Rice, 1973: LDF Powered Balloon Pro
gram, AFCRL TR - 73 - 0424.
Leclaire, R., and A. O. Korn, 1972: The powered balloon system. Proceedings, Seventh AFCRL Scientific Balloon Symposium, AFCRL TR - 73 - 0071.
Nolan, C. F., 1964: Fligh Altitude Minimum Wind Fields and Balloon Applications, AFCRL 64 - 843.
---------- , 1967: A Study o f MesoscaleFeatures o f Summertime Minimum
Fig. 7 An artist’s conception o f POBAL-S.
Wind Fields in the Lower Stratosphere, AFCRL 67-0601.
-----------, 1969: Meteorological considerations for tethered and hovering free balloons. Earth Observations fro m Balloons, Symposium Proceedings, American Society for Photogrammetry.
Rice, C. B., 1972: Power sources for a pow ered balloon. Proceedings,
Seventh AFCRL Scientific Balloon Symposium, AFCRL TR - 73 - 0071.
Vorachek, J. J., 1968: Investigation o f Powered Lighter-Than-Air Vehicles, AFCRL 68 - 0626.
---------- , E. W. McGraw, and J. W.Bezbatchenko, 1973: Development o f a Free Balloon System, Final R eport Contract F19628 - 72 -C - 0072, AFCRL TR - 73 - 0128. •
Arthur O. Korn holds a B.S. in mechanical engineering from the University o f New Hampshire (1957). After a term in the Air Force as a Project Officer assigned to AFCRL, he joined AFCRL as a civilian in 1960. He has managed the balloon phase o f programs such as Crisp and Viking, and currently is a Program Manager involved in heavy load balloon programs and powered balloon development. He holds a number o f patents and publications on the engineering aspects o f ballooning.
5 4
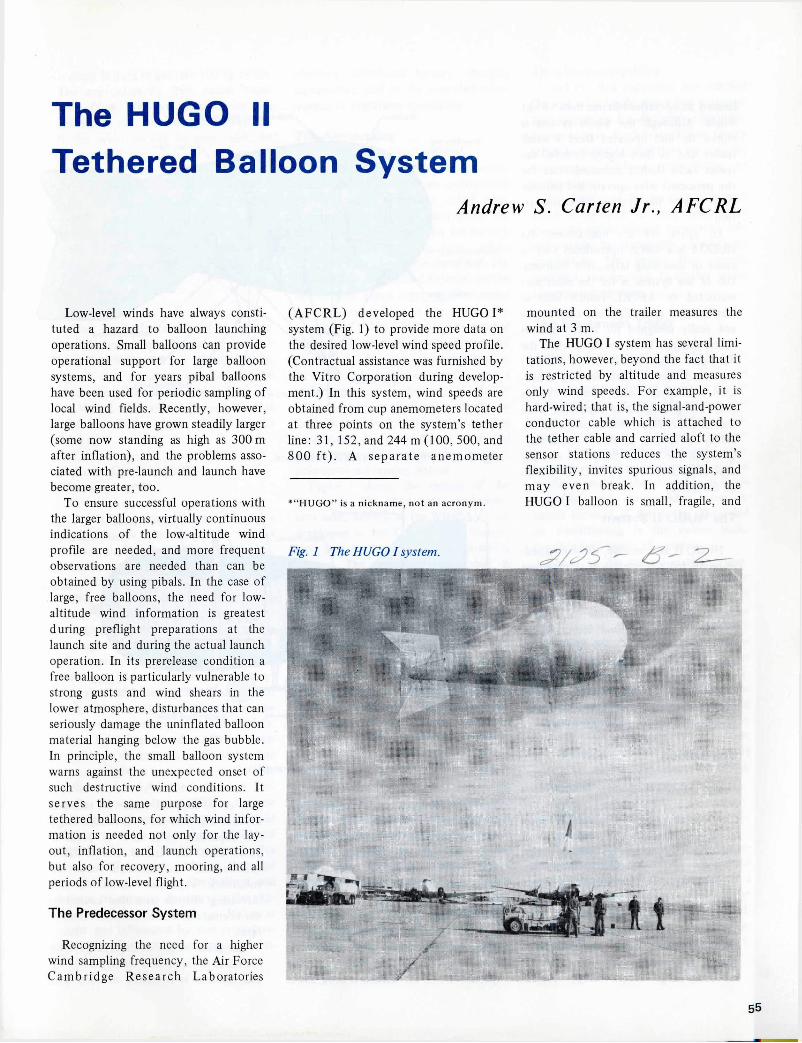
The HUGO II Tethered Balloon System
Andrew S. Carten Jr., AFCRL
Low-level winds have always constituted a hazard to balloon launching operations. Small balloons can provide operational support for large balloon systems, and for years pibal balloons have been used for periodic sampling of local wind fields. Recently, however, large balloons have grown steadily larger (some now standing as high as 300 m after inflation), and the problems associated with pre-launch and launch have become greater, too.
To ensure successful operations with the larger balloons, virtually continuous indications of the low-altitude wind profile are needed, and more frequent observations are needed than can be obtained by using pibals. In the case of large, free balloons, the need for low- altitude wind information is greatest during preflight preparations at the launch site and during the actual launch operation. In its prerelease condition a free balloon is particularly vulnerable to strong gusts and wind shears in the lower atmosphere, disturbances that can seriously damage the uninflated balloon material hanging below the gas bubble. In principle, the small balloon system warns against the unexpected onset of such destructive wind conditions. It serves the same purpose for large tethered balloons, for which wind information is needed not only for the layout, inflation, and launch operations, but also for recovery, mooring, and all periods of low-level flight.
The Predecessor System
Recognizing the need for a higher wind sampling frequency, the Air Force Cam bridge Research Laboratories
(AFCRL) developed the HUGO I* system (Fig. 1) to provide more data on the desired low-level wind speed profile. (Contractual assistance was furnished by the Vitro Corporation during development.) In this system, wind speeds are obtained from cup anemometers located at three points on the system’s tether line: 31, 152, and 244 m (100, 500, and 800 ft) . A separate anemometer
mounted on the trailer measures the wind at 3 m.
The HUGO I system has several limitations, however, beyond the fact that it is restricted by altitude and measures only wind speeds. For example, it is hard-wired; that is, the signal-and-power conductor cable which is attached to the tether cable and carried aloft to the sensor stations reduces the system’s flexibility, invites spurious signals, and may even break. In addition, the HUGO I balloon is small, fragile, and*“ H U G O ” is a n ickname, n o t an acronym.
Fig. 1 The HUGO I system.
55

limited to operations in less than 15 - kt winds. Although the whole system is stored on and operated from a small trailer and is thus highly mobile, the trailer lacks shelter accomodations for the personnel who operate and periodically service the system’s instrumentation.
In spite o f its limitations, the HUGO I is a useful operational tool to assist in launching large, free balloons. Use of the system is for the most part restricted to AFCRL launch sites in New Mexico and California, since it was not really designed for more rigorous environments. Thus, in 1971 when the Air Force Weapons Laboratory (AFWL) requested that AFCRL develop a low- level atmospheric measurement system with a higher altitude capability than that of the HUGO I system and with the ability to operate in 40 - kt winds anywhere in the United States, an entirely new HUGO system (HUGO II) had to be designed.
The HUGO II System
HUGO II is a mobile, self-contained, tethered balloon system that measures temperature, pressure, wind speed, and wind direction at selected levels, normally up to an altitude of 600 m (2,000 ft) above ground level (AGL). Developed with the contractual assistance of the G. T. Schjeldahl Company, the HUGO II system was designed specifically for support of the TORUS Electromagnetic Pulse (EMP) Simulator Development Program of the AFWL.
The Balloon
The HUGO II system balloon is a 3 2 4 - kg (7 1 5 - l b ) , 850 - m 3 (30,000 - ft3), helium-inflated balloon of British manufacture, derived from the time-honored barrage balloon design (Fig. 2). It is equipped with an air- inflated inner cell (ballonet) to insure rigidity of the hull at low altitudes, before the helium has expanded. The tail fins are also air-inflated. Made of neoprene-coated nylon, the balloon is rugged and aerodynamically stable. Its relatively large size seemingly contra-
Fig. 2 The 30,000 - f t 3 HUGO II balloon.
Fig. 3 General arrangement o f the aero sonde.
diets the concept of a “small” supporting balloon system. However, this size was dictated by the need to maintain a normal flight altitude of 600 m AGL while supporting several heavy items whose aggregate weight (excluding the tether line weight) is more than 180 kg. Since ground level may be as high as 1,800 m the balloon may be flying as much above mean sea level as 2,400 m (8,000 ft). At that height the specific lift of the helium is only about
80% of its sea-level value; or, stated in another way, the sea-level volume of gas has expanded by a ratio of 1:0.8 or 25%. Thus the size of the HUGO II balloon can accommodate both the volumetric expansion associated with increasing altitude and that caused by the normal increase in ambient temperatures.
The gross weight of the flying system (balloon, payload, and tether) is 567 kg. The balloon is normally inflated with
56

enough helium to provide 703 kg of lift. The approximately 25% excess buoyancy (free lift) not only causes the balloon to rise, but also guarantees that if the wind should become calm the balloon will stay aloft with the desired amount of line tension. The aerodynamic shape of the balloon provides additional lift and stable flight performance when winds are present; but, because that lift disappears when the wind subsides, it cannot be counted on throughout the flight.
The Payload
The payload consists of a balloon control unit suspended where the balloon lines join, plus the sensor stations, lights, and pennants attached to the tether line. The tether line is 3/16 - in. “ AMGAL Monitor” (no-twist) steel cable; a 600 -m length of cable weighs 54.4 kg.
Balloon Control Unit, Warning Lights
The balloon control unit contains a radio receiver, decoder, and various control circuits designed to relieve balloon overpressure automatically or on command, and in case of emergency, to dump the helium and sever the tether line at the unit’s attachment point.
Lights are carried to provide warning at night in FAA-controlled airspace. (Orange pennants provide daytime warning.) The light units are battery- operated and are a modification of standard aircraft, high-intensity strobe lights, with a rating of 1,000 candela. Three lights are spaced at 100 - m intervals below the balloon on the tether line and one light is located on top of the balloon. At night the balloon is normally flown only at 300 m because FAA regulations for nighttime flight at 600 m would require three additional light units and their batteries; this would add another 54 kg to the total weight being carried by the balloon, and reduce its capacity for carrying the payload. The decision to fly at 300 m at night was influenced by that consideration, by the cost factors involved (in
cluding additional battery charging equipment), and by the expected infrequency of nighttime operations.
The Aerosondes
The HUGO II atmospheric measurement capability is in three aerodynami- cally shaped sensor units, called aerosondes, that are suspended from the tether line. The aerosondes are battery powered and are hung from quick- disconnect mounting brackets that can be moved to any desired location on the tether line. Upon interrogation sensor data are transmitted at the S-band frequency of 2,280.5 MHz to the ground station, where they are displayed and reco rded . Sensor interrogation at 421 MHz can be programmed over a wide range of modes: automatic or manual, single station or multiple stations in sequence, adjustable sampling frequencies, etc. Ground level winds and temperature are measured by a separate, pole-mounted sensing station.
Figure 3 shows the details of the aerosonde. The wind speed and direction unit, known as the WINDAV, was developed at the University of Wisconsin Space Science and Engineering Center. The wind direction unit is unique in that it senses changes in the earth’s magnetic field as the cups rotate and processes that information into direction signals. The pressure sensor is mounted only on the topmost aerosonde and is intended to assist in the computation of the balloon’s altitude. The aerosonde is suspended from the pivot point shown at the top. It is balanced and aerodynamically stable so that it points into the wind at a horizontal attitude, regardless of the angle of the tether.
The aerosonde is a heavy unit, weighing about 17.2 kg (including batteries). At first glance this may seem excessive, but it is a complex unit containing a command receiver and decoder, two time-delay relay circuits, a transmitter, three sensors and sensor data processing circuits, and enough batteries for 24 hr of operation. The command receiver and decoder were originally included to provide a shut
down/turn-on capability.Luckily, this capability has enabled
the use of a single down-link transmission frequency for all three aerosondes. In ter-range Instrumentation Group (IRIG) subcarrier oscillators are used for frequency division multiplexing of sensor data.
The design of the aerosonde permits rapid attachment to, and detachment from, the tether line, an important consideration in marginally operational conditions. The design also permits compact storage and facilitates maintenance and servicing.
The Equipment Trailer
Figure 4 shows the HUGO II over- the-road equipment. Note that the mooring mast is folded down; it can be raised and secured quickly upon arrival at a new location. The shelter on the trailer contains the command transmitte r, the recording instrumentation, ba tte ry charging equipment, and a working area for the crew. The balloon and flight gear are stored in compartments forward of the shelter. Heat and air conditioning in the shelter make possible field use in all weather.
Power to the ground station is supplied by an auxiliary gasoline engine generator, shown here lashed to the trailer; normally it is unloaded at the o p era tio n al site. The hydraulically controlled winch is powered by a gasoline engine. The winch drum carries1,800 m of tether cable; to protect personnel against the danger of electric shock the winch and cable are grounded during operations. The instrument shelter is covered with aluminum as further protection. A cage (not shown in Fig. 4) has been added to protect the winch operator.
Mooring
The mooring mast and dolly combination shown in Fig. 5 is used to secure the system between flights at a p articu la r operating location. (The system must be packed and redeployed, of course, when moved to another location.) When moored as shown in Fig. 5,
57

2-Ton
Fig. 4 General arrangement o f the trailer.
Mechanism
Cone
Tie Down Cables
Dolly
36.0-Ft Total Adjustment
Winch Hydraulic Winch/
Gasoline Power Unit
Balloon Storage Box
Storage Box
Winch
/Mast Assembly
Telemetry Station Building
Fig. 5 The HUGO II moored configuration.
Mooring Mast
Blower
Confluence (Detached)
Dolly Winch
Fairlead 'Mooring Dolly
the HUGO II system was subjected to winds of over 45 kt during December1972 at Holloman Air Force Base, with no damage to the balloon or the ground station. Also during that test period, the completely unattended moored balloon was observed to rotate 360° around the ground station under the influence of light, shifting winds.
The HUGO II system design incorporates a mooring mast and dolly to meet the requirement that the inflated balloon survive winds of up to 70 kt
when it is bedded down. The exposure to strong winds in December 1972 demonstrated how this mooring method works. It also pointed out the need for a better outrigger system to counteract trailer tilting moments produced by loading on the 11 - m mast.
Development Status
The HUGO II system has now undergone three series of tests. All the intended functions of the system have
been tested, including deployment, mooring, flight at 762 m AGL (1,830 m above MSL), command transmission, and telemetry transmission. Several deficiences in the design uncovered in the course of testing have led to improvements in the outriggers, mooring mast, storage arrangements, aerosonde m ounting brackets, and aerosonde battery accessibility provisions. A modification program was carried out in the fall of 1973 to make the necessary improvements. An upgraded WINDAV has
58
been designed and incorporated in the HUGO II system and in testing at Holloman AFB in December 1973 met all performance specifications.
Conclusions
During the HUGO II test program several points of interest have emerged:
• The system is highly mobile and can be set up or taken down quickly by trained personnel, once the site is prepared.
• Preparation of the site is important. A dry, cleared, flat inflation area 31 m in diameter is the minimum acceptable site. Ground anchors are mandatory in the inflation circle for inflation, launch, recovery, and deflation. If temporary anchors are used, very hard ground will seriously delay setting up the system.
• Although the squib-actuated tether line em ergency cutting device is grounded against inadvertent static electrical discharge, it is unprotected in lightning storms. Flight in such storms should not be attempted.
• The size of the HUGO II balloon makes launching and recovery in winds in excess of 15 kt difficult.
• The mooring mast and dolly keep the balloon still when it is bedded down, except in winds above 20 kt. In high winds the balloon is stable, despite the increased buffeting to which it is subjected.
• The modular approach to the HUGO II system design affords a great
deal of flexibility in the use of system components.
For Further Reading
Harrington, E. V. Jr., A. S. Carten Jr., and C. D. C orbin , 1973: The HUGO II tethered balloon system. Proceedings, Seventh AFCRL Scientific Balloon Symposium, AFCRL T R -73 -0071. •
Andrew S. Carten Jr. earned his A.B. from Holy Cross College and his M.S. from Tufts University. During World War II he served as a staff weather officer in the U.S. Air Force. After a term as an engineer with the Bendix Corporation, he joined AFCRL in 1954. From 1960 to 1971, he was a Senior Engineer involved with meteorological equipment; his current position is that o f Balloon Systems Engineer. Carten has presented a number o f papers on atmospheric measurements and instrumentation at meteorological conferences and has published papers in several professional journals.
Project SkyhookWalter F. Martin and Capt. Edward C. Melton, USN, Office o f Naval Research
On 21 August 1973, a 413,000 - m3 (14.6 - million-ft3), thin-walled plastic balloon lifted off the launch area at Thom pson, Manitoba, Canada. The launch marked the 26th year of the Office of Naval Research (ONR) Project S kyhook. R obert C. Hartman, a research scientist from Goddard Space Flight Center, was sending a scientific experim ent weighing over 1,814 kg (4,000 lb) to an altitude above 34.7 km (114,000 ft). His payload, designed to measure positron and electron spectra in the range from 1 to 20 GeV, was “on
station” more than 31 hr, and was recovered a fte r touchdown some 300 km west of Thompson.
Balloons for Science
In 1946 it was realized that a stable platform from which high-altitude scientific observations could be made was needed to gather information of value for future space flights. The initial project, Helios, required the construction of plastic balloons that could lift a manned gondola equipped with scien
tific instruments to the stratosphere. A cluster of plastic balloons, only a fraction as heavy as one large, rubberized balloon, was to be used to reach an altitude of more than 30 km (100,000 ft).
The technology of plastic balloon m anufacture was, however, insuffic ien tly advanced to allow manned balloon flights as planned. But Helios studies did confirm the feasibility of using plastic balloons to take scientific instruments to high altitudes for periods of up to a day or more. Accordingly, ONR began Project Skyhook, and the
59

Fig. 1 Four plastic Skyhook balloons, constructed for the ONR by General Mills, Inc., are prepared for an early morning launch. The Skyhooks appear only partially inflated because the gas expands as the balloons rise to the upper atmosphere. (Official U.S.Navy photograph.)
Fig. 2 Skyhook balloon 93 leaving the deck o f the U.S.S. Norton Sound.(Official U.S. Navy photograph.)
first flight of a Skyhook balloon occurred on 25 September 1947: a vehicle with a volume of 850 m3 (30,000 ft3), bu ilt by General Mills, Inc., and launched at St. Cloud, Minnesota, carried a payload of 28.6 kg (63 lb) to an altitude of 30 km before descending at Eau Claire, Wisconsin (Fig. 1).
Since then more than 3,000 such flights have been made under ONR sponsorship from locations throughout the world. In 1948, the first shipboard Skyhook launch took place from the U.S.S. Norton Sound. Several hundred shipboard launchings have been made since th a t time (Fig. 2). Project Rockoon, which featured small Deacon rockets lifted by a Skyhook balloon to about 21 km (70,000 ft) and released, was conducted in arctic waters during 1952.
On 18 May 1954, Super Skyhook, the largest plastic balloon built up to that time (85,000 m3 or 3 million ft3), was launched from the University of Minnesota airport by General Mills for
the U.S. Navy. It soared to a float altitude of 35.7 km (117,000 ft), carrying a1 80 - kg (400 - lb) scientific payload designed to gather cosmic ray information. In less than seven years, balloon sizes had increased by nearly two orders of magnitude (Fig. 3).
Altitude records were also being set as plastic balloon usage surged. On 7 September 1956, the University of Minnesota launched a giant, unmanned, Mylar plastic balloon developed by the G. T. Schjeldahl Company to set an altitude record of 44.2 km (145,000 ft).
Project Stratoscope I marked the ten th anniversary of Skyhook. On25 September 1957 a giant solar telescope carried to an altitude of 25 km (8 1 ,000 ft) obtained some of the sharpest photographs ever taken of the sun (Fig. 4).
As U.S. Air Force projects such as Manhigh and Farside began using balloon techniques developed for Skyhook
and other ONR balloon projects, ONR reactivated its manned balloon program, which had remained dormant for several years. The Stratolab program was initiated in 1954, when the gondola shell originally designed by Jean Piccard and b u ilt for Project Helios arrived at Minneapolis to be fitted out and tested. The purpose of Stratolab was to provide a research platform from which importan t operational and physiological space-barrier problems could be studied. Operational altitudes from 18 to 30 km (60,000 to 100,000 ft) were considered particularly significant in that future military aircraft operations were forecast for those altitudes.
The gondola was designed to be pressurized with cabin pressure remaining near sea-level value regardless of the altitude attained in flight. Winzen Research Inc. and General Mills combined talents to provide adequate climate, sensing,
60

Fig. 3 One o f the stages in the inflation and launching o f the Super Skyhook in 1954. (Official U.S.Navy photograph.)
Fig. 5 From left to right, Lcdr. Lee M.Fig. 4 During the Stratoscope I flights over 400 photographs o f sunspots Lewis, Charles Moore, and Lcdr. Malcolm D.were taken which did lead to a better understanding o f the motions Ross prepare to enter the gondola for a testobserved in the strong magnetic fields o f the sunspots. The 30 - cm (12 - in.) o f the equipment for Project Stratolab IV.telescope-camera was equipped with a closed circuit television camera (Official U.S. Navy photograph.)and a remote control mechanism that enabled the research team to guide the camera and at the same time to see on the TV screen the area under
flight control, safety, and communications equipment for the gondola.
Stratolab High I, launched by General Mills on 8 November 1956, reached an altitude of 23 km (76,000 ft). Chief pilot of this and subsequent Stratolab flights was Cdr. Malcolm D. Ross, USNR (Ret.). The late Lcdr. Lee M. Lewis, USN (Ret.), was copilot for the first three flights. Stratolab I broke the 21- year altitude record of Explorer II, and ushered in an era of almost routine Navy and Air Force high-altitude manned plastic balloon flights. Stratolab II, III, and IV accomplished the first national television broadcast from outer space and the discovery of water vapor in close proximity to the planet Venus (Fig. 5). Stratolab V, the final flight in the series, was highlighted by several ballooning “firsts.” It was launched from the flight deck of the aircraft carrier U.S.S. Antietam in 1961— the
61

Fig. 6 This sequence o f photographs was taken during the launch o f a typical scientific experiment under the Skyhook program in 19 72. The first panel shows experimental equipment for the balloon hanging from the launch truck boom. The second, third, and fourth show the balloon bubble being inflated with helium gas, immediately after being released from the anchor vehicle, and erect over the launch vehicle just before picking up the payload. In the last photograph, the balloon has been launched and is ascending toward its float altitude.
5
I
62

firs t manned balloon flight to be launched from a ship. Soaring to a new record height of 34.4 km (113,000 ft) in an open gondola, its two pilots conducted the first environmental tests of the Navy-developed space suit, forerunner of apparel used in NASA’s Mercury program.
Manned flights, high in public interest from 1955 through 1961, somewhat overshadow ed an o th er program , Skyhook Churchill, which began within this period (1959). Taking its name from F ort Churchill in Manitoba, Skyhook Churchill began operations with only eight contractor personnel, six balloons, and one aircraft for recovery of scientific payloads. James A. Earl of the University of Maryland conducted the first scientific investigations in this program. Although the number of Churchill flights has declined from a high of nearly 40 per year in the mid - 1960s, balloon volume and payload weight have been increasing at an astonishing rate, dictating a steady level of operations (Fig. 6). Skylab Churchill marked its 15th consecutive year of operations at Fort Churchill during the summer of 1973.
Skyhook flights have also been launched from Antarctica, the arctic ice island T -3 , Peru, Panama, Australia, Iceland, and numerous sites on the North American continent.
Skyhook Climatic Impact Assessment Program (CIAP), a project to monitor stratospheric constituents on a global basis, was initiated in December 1971. Working in close coordination with the Department of Transportation (DOT), ONR contractors accelerated current programs to obtain a data base of ozone, water vapor, and particulate matter in the stratosphere.
Balloons were used to lift scientific experiments to the edge of space a full 13 years before the first successful U.S. scientific satellite was placed in orbit. Because approximately 99% of our e a r th ’s atmospheric mass is below 30 km, scientific experiments conducted at or above this level avoid most of the atmospheric “noise” and other effects encountered at lower levels; hence, the quality of in situ and remote
measurements obtained is much improved over that from less efficient, lower altitude, airborne platforms. When compared with a rocketsonde, for example, a high altitude balloon enables a longer experiment exposure and a wider choice of geographical locations from which to launch.
B alloon reliability has increased markedly over the past 25 years. A pioneer in balloon design and manufacture, Otto C. Winzen, President of Winzen Research, summed up the hazards facing thin-walled plastic balloons: “Consider the traumatic flight experience a balloon has to survive: F irs t the stresses of inflation and launching, then ascent at 200-400 meters per minute, crossing jet streams with velocities up to 250 kilometers per hour and temperatures occasionally down to -86°C, finally reaching down to0.1 percent of an atmosphere exposing the balloon to the virtually unabated force of solar and cosmic radiation. The flight reliability of over 96 percent which has been achieved is nothing short of remarkable.”
Cross-agency interest in Skyhook remains at a high level. NASA, which provides some of the funds for the Skyhook program, sees increased in
terest in balloon research over the next few years in spite of overall budget reductions. E rnest O tt, program engineer for sounding rockets and balloons, says, “As less space becomes available on orbiting spacecraft, many scien tis ts are turning to balloons, sounding rockets, and aircraft.”
1972-1973 Flight Operations
The ONR 1972 - 1973 Skyhook program has been truly global in scope. Operations from 16 geographical locations resulted in 105 successful flights. Major experiments were flown by the Universities of California (Riverside and Berkeley), Chicago, Maryland, Melbourne (Australia), Minnesota, New Hampshire, and Wyoming, and by Case Western Reserve University, California Institute of Technology, Louisiana State University, Massachusetts Institute of Technology (M.I.T.), Washington University in St. Louis, and the Atomic Energy Commission (AEC). Smaller, piggyback (tag-along) experiments were flown by Rice University, St. Paul University, and the Universities of Calgary and Tokyo. Other government agencies which also participated in flying large scientific packages were Goddard Space
Fig. 7 Scientific equipment being launched at the Balloon Launch Station, Alice Springs, Australia, on 5 April 1972.
63

NoseHeaters
INTAKE
Screens
Fig. 1 The location o f the different elements o f the evaporator can be seen in this cross-sectional view. The forward thermistor is used for control o f the heating, and the rear thermistor for a measurement o f the air temperature at the Lyman-alpha unit.
17:55
TIME (hr:min)Fig. 2 The dotted curve is the aircraft rate o f climb, which is approximately equal to the vertical air motion. The lower curve is the water content as determined by the power required to heat the air and evaporate the water.
Lyman-Alpha Detector
to provide the heating to the air at the earliest possible time. The thermistors used for control have a 1 - sec time constant, and are shielded from the direct air flow to minimize the chance of unevaporated drops striking them. Except in high water content conditions, the water should virtually all be evaporated by the time it reaches the first thermistor.
In this improved version of the instrument, the water content is measured by the use of a Lyman-alpha source and detector, which measure the specific humidity of the sample after the water has been converted to vapor. This is an improvement over the previously described method of power measurements for several reasons. The use of power levels allowed a baseline drift of 2 or 3 g/m3 in the water content, and so they were only useful for high water content regions of the cloud. They also required a knowledge of airspeed, pressure, and outside air temperature. With the Lyman-alpha, only outside air temperature is required, and this is only needed for the purpose of subtracting out the ambient humidity level. That is, the Lyman-alpha measures the specific humidity of the heated sample, which includes the ambient humidity level. The measured specific humidity of the heated, and thereby expanded, sample is then referred back to the outside air temperature, and the humidity level subtracted from this value to obtain the condensed water content.
Calibrations of the collection efficiency of the evaporator were carried out in the laboratory by measurements of the pressure head required for a given flow rate of air through the evaporator. These calibrations were also checked by measurements of the power consumed while operating the aircraft in clear air.
HeatersThermistors Lyman-Alpha Source
TIME (min)
Fig. 3 This is a sample o f the types o f water contents which have been measured by the improved form o f the evaporator which uses the specific humidity o f the heated air to measure the water content o f the sampled air. The negative and positive spikes at 1.5 min are due to a recording problem.
66

The collection efficiency thus determined was 95% for air, and this would also apply to very small drops. Because of their inertia and drag characteristics, drops larger than about 100 ^m should be collected with almost 100% efficiency.
One of the more spectacular records of two consecutive penetrations of a single cloud is shown in Fig. 2. This record was obtained by measurements of the power supplied to the evaporator. The variation of the baseline when outside the cloud can be seen in this figure, as well as the values just after D where the instrument has become clogged with ice, and thus gives negative readings due to the airflow being less than indicated by the aircraft velocity. At B, C, and D,
water contents of over 20 g/m3 were encountered. Points A and B correspond to points D and C on the second pass through the cloud, with the first pass being at 5.5 km (18,000 ft) and the second at 5.0 km.
A penetration through the outer region of a large cloud resulted in the water contents shown in Fig. 3. These data were obtained with the improved version of the evaporator with the Lyman-alpha readout. No rate of climb data were obtained for the aircraft on this date, but the altitude changes indicate that the 15 g/m3 of water content was in a region of updraft of approximately 10 m/sec.
The two versions of the evaporator described above were meant for mea
suring regions of high water content inside severe storms. Had they been meant for other types of measurements, a different intake area and degree of heating might have been used. The output temperature of the air is dictated by the greatest concentration of water which is to be measured, and the intake area is a compromise between the power consumption and the sample limited resolution.
Thomas G. KyleNational Hail Research ExperimentNCARP.O. Box 3000Boulder, Colorado 80303 •
The editorial staff sadly announces the death of William Swinbank, Director of the National Hail Research Experiment, who supervised the writing of the December issue of Atmospheric Technology.
67