Download PDF - IJRCM
99
VOLUME NO. 7 (2016), ISSUE NO. 08 (AUGUST) ISSN 0976-2183 A Monthly Double-Blind Peer Reviewed (Refereed/Juried) Open Access International e-Journal - Included in the International Serial Directories Indexed & Listed at: Ulrich's Periodicals Directory ©, ProQuest, U.S.A., EBSCO Publishing, U.S.A., Cabell’s Directories of Publishing Opportunities, U.S.A., Google Scholar, Open J-Gage, India [link of the same is duly available at Inflibnet of University Grants Commission (U.G.C.)], The American Economic Association's electronic bibliography, EconLit, U.S.A., Index Copernicus Publishers Panel, Poland with IC Value of 5.09 & number of libraries all around the world. Circulated all over the world & Google has verified that scholars of more than 5000 Cities in 187 countries/territories are visiting our journal on regular basis. Ground Floor, Building No. 1041-C-1, Devi Bhawan Bazar, JAGADHRI – 135 003, Yamunanagar, Haryana, INDIA http://ijrcm.org.in/
-
Upload
khangminh22 -
Category
Documents
-
view
17 -
download
0
Transcript of Download PDF - IJRCM
VOLUME NO. 7 (2016), ISSUE NO. 08 (AUGUST) ISSN 0976-2183
A Monthly Double-Blind Peer Reviewed (Refereed/Juried) Open Access International e-Journal - Included in the International Serial Directories Indexed & Listed at:
Ulrich's Periodicals Directory ©, ProQuest, U.S.A., EBSCO Publishing, U.S.A., Cabell’s Directories of Publishing Opportunities, U.S.A., Google Scholar,
Open J-Gage, India [link of the same is duly available at Inflibnet of University Grants Commission (U.G.C.)],
The American Economic Association's electronic bibliography, EconLit, U.S.A.,
Index Copernicus Publishers Panel, Poland with IC Value of 5.09 & number of libraries all around the world.
Circulated all over the world & Google has verified that scholars of more than 5000 Cities in 187 countries/territories are visiting our journal on regular basis.
Ground Floor, Building No. 1041-C-1, Devi Bhawan Bazar, JAGADHRI – 135 003, Yamunanagar, Haryana, INDIA
http://ijrcm.org.in/
VOLUME NO. 7 (2016), ISSUE NO. 08 (AUGUST) ISSN 0976-2183
INTERNATIONAL JOURNAL OF RESEARCH IN COMMERCE & MANAGEMENT A Monthly Double-Blind Peer Reviewed (Refereed/Juried) Open Access International e-Journal - Included in the International Serial Directories
http://ijrcm.org.in/
ii
CONTENTS Sr. No.
TITLE & NAME OF THE AUTHOR (S) Page No.
1. IMPACT OF THE TAX PROPOSALS IN THE UNION BUDGET FOR 2016-17 ON INDIVIDUAL INCOME TAX ASSESSEES: AN ANALYSIS DR. DHANANJOY RAKSHIT
1
2. STRESS MANAGEMENT: A SPECIAL FOCUS ON SOFTWARE EMPLOYEES IN TWIN CITIES OF HYDERABAD & SECUNDERABAD K.SRI RANGA LAKSHMI, B. SUBBA RAO & B. SUDHAKAR REDDY
3
3. AN EMPIRICAL STUDY ON RELATIONSHIP OF SUPERVISION, INNOVATION & CHANGE AND CUSTOMER SERVICE (ORGANIZATIONAL CLIMATE) WITH RESILIENCE PAYAL SHARMA & DR. INDU BHARGAVA
9
4. CORPORATE SOCIAL RESPONSIBILITY AND GOVERNANCE SUMAIYA FATHIMA
14
5. COMPARATIVE ANALYSIS OF MEDICAL TOURISM IN KOLKATA WITH OTHER METROPOLITAN CITIES IN INDIA DR. ISITA LAHIRI & SWATI PAL
16
6. AN EVALUATIVE STUDY ON FINANCIAL PERFORMANCE OF DISTRICT CO-OPERATIVE CENTRAL BANKS IN INDIA D. VARALAKSHMI & P. VENKATESHWARLU
22
7. AN EMPIRICAL STUDY ON TRAINING AND DEVELOPMENT PRACTICES IN REGIONAL RURAL BANKS WITH SPECIAL REFERENCE TO PRATHAMA BANK JANKI
26
8. A STUDY ON CONSUMER BEHAVIOR FOR BRANDED APPARELS IN BANGALORE SHEETAL MAHENDHER & MARIA BOALER
30
9. PROBLEMS OF SMALL SCALE INDUSTRY IN PUNJAB MONICA GUPTA
36
10. MERGERS AND ACQUISITIONS IN INDIA AND ITS LONG TERM IMPACT ON SHAREHOLDERS WEALTH AMISH BHARATKUMAR SONI
39
11. CHALLENGES FOR ORGANIZED RETAILING IN INDIA VEENU JAIN
45
12. MAKE IN INDIA: AN AMBITIOUS PROJECT TO REVIVE INDIAN ECONOMY YOGITA SHARMA
47
13. MAKE IN INDIA: OPPORTUNITIES AND CHALLENGES JASMINE KAUR
51
14. EMOTIONAL BRANDING AS A TOOL TO SALVAGE TRUST AND CONFIDENCE OF CUSTOMER IN INDIAN PACKAGED FOOD INDUSTRY DR. RUPESH MALIK
56
15. PRE-MERGER AND POST-MERGER ANALYSIS OF FINANCIAL PERFORMANCE OF TARGET COMPANY - A CASE STUDY ASHISH V. DONGARE & DR. ANAND MULEY
60
16. HOW ORGANIZATIONAL STRUCTURE AIDS BUSINESS PERFORMANCE MUSIBAU AKINTUNDE AJAGBE, NKAM MICHAEL CHO, EKANEM EDEM UDO UDO & OJOCHIDE FRED PETER
64
17. AUDIT PRACTICES AND PROBLEMS ON SELECTED SAVING AND CREDIT COOPERATIVES IN SOUTH WOLLO ZONE, AMAHARA NATIONAL REGIONAL STATE MESELE KEBEDE
69
18. HYGIENE, SANITATION AND FOOD SAFETY - KNOWLEDGE AND PRACTICES AMONG FOOD HANDLERS WORKING IN RESTAURANTS AND FAST FOOD CENTERS IN TIRUPATI & TIRUMALA D VANDANA & D. L. KUSUMA
73
19. UNDERSTANDING THE MODELS OF CUSTOMER EXPERIENCE SAAKSHI BHANDARI
76
20. A STUDY ON WOMEN ENTREPRENEURS IN MICRO ENTERPRISES S. JENCY & A. SINIYA
85
REQUEST FOR FEEDBACK & DISCLAIMER 91
VOLUME NO. 7 (2016), ISSUE NO. 08 (AUGUST) ISSN 0976-2183
INTERNATIONAL JOURNAL OF RESEARCH IN COMMERCE & MANAGEMENT A Monthly Double-Blind Peer Reviewed (Refereed/Juried) Open Access International e-Journal - Included in the International Serial Directories
http://ijrcm.org.in/
iii
CHIEF PATRON PROF. K. K. AGGARWAL
Chairman, Malaviya National Institute of Technology, Jaipur (An institute of National Importance & fully funded by Ministry of Human Resource Development, Government of India)
Chancellor, K. R. Mangalam University, Gurgaon Chancellor, Lingaya’s University, Faridabad
Founder Vice-Chancellor (1998-2008), Guru Gobind Singh Indraprastha University, Delhi Ex. Pro Vice-Chancellor, Guru Jambheshwar University, Hisar
FOUNDER PATRON LATE SH. RAM BHAJAN AGGARWAL
Former State Minister for Home & Tourism, Government of Haryana Former Vice-President, Dadri Education Society, Charkhi Dadri Former President, Chinar Syntex Ltd. (Textile Mills), Bhiwani
FORMER CO-ORDINATOR DR. S. GARG
Faculty, Shree Ram Institute of Business & Management, Urjani
ADVISORS PROF. M. S. SENAM RAJU
Director A. C. D., School of Management Studies, I.G.N.O.U., New Delhi
PROF. M. N. SHARMA Chairman, M.B.A., Haryana College of Technology & Management, Kaithal
PROF. S. L. MAHANDRU Principal (Retd.), Maharaja Agrasen College, Jagadhri
EDITOR PROF. R. K. SHARMA
Professor, Bharti Vidyapeeth University Institute of Management & Research, New Delhi
CO-EDITOR DR. BHAVET
Faculty, Shree Ram Institute of Engineering & Technology, Urjani
EDITORIAL ADVISORY BOARD DR. RAJESH MODI
Faculty, Yanbu Industrial College, Kingdom of Saudi Arabia
PROF. SANJIV MITTAL University School of Management Studies, Guru Gobind Singh I. P. University, Delhi
PROF. ANIL K. SAINI Chairperson (CRC), Guru Gobind Singh I. P. University, Delhi
VOLUME NO. 7 (2016), ISSUE NO. 08 (AUGUST) ISSN 0976-2183
INTERNATIONAL JOURNAL OF RESEARCH IN COMMERCE & MANAGEMENT A Monthly Double-Blind Peer Reviewed (Refereed/Juried) Open Access International e-Journal - Included in the International Serial Directories
http://ijrcm.org.in/
iv
DR. SAMBHAVNA Faculty, I.I.T.M., Delhi
DR. MOHENDER KUMAR GUPTA Associate Professor, P. J. L. N. Government College, Faridabad
DR. SHIVAKUMAR DEENE Asst. Professor, Dept. of Commerce, School of Business Studies, Central University of Karnataka, Gulbarga
ASSOCIATE EDITORS PROF. NAWAB ALI KHAN
Department of Commerce, Aligarh Muslim University, Aligarh, U.P.
PROF. ABHAY BANSAL Head, Department of I.T., Amity School of Engineering & Technology, Amity University, Noida
PROF. V. SELVAM SSL, VIT University, Vellore
PROF. N. SUNDARAM VIT University, Vellore
DR. PARDEEP AHLAWAT Associate Professor, Institute of Management Studies & Research, Maharshi Dayanand University, Rohtak
DR. S. TABASSUM SULTANA Associate Professor, Department of Business Management, Matrusri Institute of P.G. Studies, Hyderabad
DR. JASVEEN KAUR Asst. Professor, University Business School, Guru Nanak Dev University, Amritsar
FORMER TECHNICAL ADVISOR AMITA
Faculty, Government M. S., Mohali
FINANCIAL ADVISORS DICKIN GOYAL
Advocate & Tax Adviser, Panchkula
NEENA Investment Consultant, Chambaghat, Solan, Himachal Pradesh
LEGAL ADVISORS JITENDER S. CHAHAL
Advocate, Punjab & Haryana High Court, Chandigarh U.T.
CHANDER BHUSHAN SHARMA Advocate & Consultant, District Courts, Yamunanagar at Jagadhri
SUPERINTENDENT SURENDER KUMAR POONIA
VOLUME NO. 7 (2016), ISSUE NO. 08 (AUGUST) ISSN 0976-2183
INTERNATIONAL JOURNAL OF RESEARCH IN COMMERCE & MANAGEMENT A Monthly Double-Blind Peer Reviewed (Refereed/Juried) Open Access International e-Journal - Included in the International Serial Directories
http://ijrcm.org.in/
v
CALL FOR MANUSCRIPTS We invite unpublished novel, original, empirical and high quality research work pertaining to the recent developments & practices in the areas of Com-puter Science & Applications; Commerce; Business; Finance; Marketing; Human Resource Management; General Management; Banking; Economics; Tourism Administration & Management; Education; Law; Library & Information Science; Defence & Strategic Studies; Electronic Science; Corporate Gov-ernance; Industrial Relations; and emerging paradigms in allied subjects like Accounting; Accounting Information Systems; Accounting Theory & Practice; Auditing; Behavioral Accounting; Behavioral Economics; Corporate Finance; Cost Accounting; Econometrics; Economic Development; Economic History; Financial Institutions & Markets; Financial Services; Fiscal Policy; Government & Non Profit Accounting; Industrial Organization; International Economics & Trade; International Finance; Macro Economics; Micro Economics; Rural Economics; Co-operation; Demography: Development Planning; Development Studies; Applied Economics; Development Economics; Business Economics; Monetary Policy; Public Policy Economics; Real Estate; Regional Economics; Political Science; Continuing Education; Labour Welfare; Philosophy; Psychology; Sociology; Tax Accounting; Advertising & Promotion Management; Management Information Systems (MIS); Business Law; Public Responsibility & Ethics; Communication; Direct Marketing; E-Commerce; Global Business; Health Care Administration; Labour Relations & Human Resource Management; Marketing Research; Marketing Theory & Applications; Non-Profit Or-ganizations; Office Administration/Management; Operations Research/Statistics; Organizational Behavior & Theory; Organizational Development; Pro-duction/Operations; International Relations; Human Rights & Duties; Public Administration; Population Studies; Purchasing/Materials Management; Re-tailing; Sales/Selling; Services; Small Business Entrepreneurship; Strategic Management Policy; Technology/Innovation; Tourism & Hospitality; Transpor-tation Distribution; Algorithms; Artificial Intelligence; Compilers & Translation; Computer Aided Design (CAD); Computer Aided Manufacturing; Computer Graphics; Computer Organization & Architecture; Database Structures & Systems; Discrete Structures; Internet; Management Information Systems; Mod-eling & Simulation; Neural Systems/Neural Networks; Numerical Analysis/Scientific Computing; Object Oriented Programming; Operating Systems; Pro-gramming Languages; Robotics; Symbolic & Formal Logic; Web Design and emerging paradigms in allied subjects.
Anybody can submit the soft copy of unpublished novel; original; empirical and high quality research work/manuscript anytime in M.S. Word format after preparing the same as per our GUIDELINES FOR SUBMISSION; at our email address i.e. [email protected] or online by clicking the link online submission as given on our website (FOR ONLINE SUBMISSION, CLICK HERE).
GUIDELINES FOR SUBMISSION OF MANUSCRIPT
1. COVERING LETTER FOR SUBMISSION:
DATED: _____________
THE EDITOR
IJRCM
Subject: SUBMISSION OF MANUSCRIPT IN THE AREA OF .
(e.g. Finance/Mkt./HRM/General Mgt./Engineering/Economics/Computer/IT/ Education/Psychology/Law/Math/other, please
specify)
DEAR SIR/MADAM
Please find my submission of manuscript titled ‘___________________________________________’ for likely publication in one of
your journals.
I hereby affirm that the contents of this manuscript are original. Furthermore, it has neither been published anywhere in any language
fully or partly, nor it is under review for publication elsewhere.
I affirm that all the co-authors of this manuscript have seen the submitted version of the manuscript and have agreed to inclusion of
their names as co-authors.
Also, if my/our manuscript is accepted, I agree to comply with the formalities as given on the website of the journal. The Journal has
discretion to publish our contribution in any of its journals.
NAME OF CORRESPONDING AUTHOR :
Designation/Post* :
Institution/College/University with full address & Pin Code :
Residential address with Pin Code :
Mobile Number (s) with country ISD code :
Is WhatsApp or Viber active on your above noted Mobile Number (Yes/No) :
Landline Number (s) with country ISD code :
E-mail Address :
Alternate E-mail Address :
Nationality :
* i.e. Alumnus (Male Alumni), Alumna (Female Alumni), Student, Research Scholar (M. Phil), Research Scholar (Ph. D.), JRF, Research Assistant, Assistant
Lecturer, Lecturer, Senior Lecturer, Junior Assistant Professor, Assistant Professor, Senior Assistant Professor, Co-ordinator, Reader, Associate Profes-
sor, Professor, Head, Vice-Principal, Dy. Director, Principal, Director, Dean, President, Vice Chancellor, Industry Designation etc. The qualification of
author is not acceptable for the purpose.

VOLUME NO. 7 (2016), ISSUE NO. 08 (AUGUST) ISSN 0976-2183
INTERNATIONAL JOURNAL OF RESEARCH IN COMMERCE & MANAGEMENT A Monthly Double-Blind Peer Reviewed (Refereed/Juried) Open Access International e-Journal - Included in the International Serial Directories
http://ijrcm.org.in/
vi
NOTES:
a) The whole manuscript has to be in ONE MS WORD FILE only, which will start from the covering letter, inside the manuscript. pdf.
version is liable to be rejected without any consideration.
b) The sender is required to mention the following in the SUBJECT COLUMN of the mail:
New Manuscript for Review in the area of (e.g. Finance/Marketing/HRM/General Mgt./Engineering/Economics/Computer/IT/
Education/Psychology/Law/Math/other, please specify)
c) There is no need to give any text in the body of the mail, except the cases where the author wishes to give any specific message
w.r.t. to the manuscript.
d) The total size of the file containing the manuscript is expected to be below 1000 KB.
e) Only the Abstract will not be considered for review and the author is required to submit the complete manuscript in the first
instance.
f) The journal gives acknowledgement w.r.t. the receipt of every email within twenty-four hours and in case of non-receipt of
acknowledgment from the journal, w.r.t. the submission of the manuscript, within two days of its submission, the corresponding
author is required to demand for the same by sending a separate mail to the journal.
g) The author (s) name or details should not appear anywhere on the body of the manuscript, except on the covering letter and the
cover page of the manuscript, in the manner as mentioned in the guidelines.
2. MANUSCRIPT TITLE: The title of the paper should be typed in bold letters, centered and fully capitalised.
3. AUTHOR NAME (S) & AFFILIATIONS: Author (s) name, designation, affiliation (s), address, mobile/landline number (s), and email/al-
ternate email address should be given underneath the title.
4. ACKNOWLEDGMENTS: Acknowledgements can be given to reviewers, guides, funding institutions, etc., if any.
5. ABSTRACT: Abstract should be in fully Italic printing, ranging between 150 to 300 words. The abstract must be informative and eluci-
dating the background, aims, methods, results & conclusion in a SINGLE PARA. Abbreviations must be mentioned in full.
6. KEYWORDS: Abstract must be followed by a list of keywords, subject to the maximum of five. These should be arranged in alphabetic
order separated by commas and full stop at the end. All words of the keywords, including the first one should be in small letters, except
special words e.g. name of the Countries, abbreviations etc.
7. JEL CODE: Provide the appropriate Journal of Economic Literature Classification System code (s). JEL codes are available at www.aea-
web.org/econlit/jelCodes.php. However, mentioning of JEL Code is not mandatory.
8. MANUSCRIPT: Manuscript must be in BRITISH ENGLISH prepared on a standard A4 size PORTRAIT SETTING PAPER. It should be free
from any errors i.e. grammatical, spelling or punctuation. It must be thoroughly edited at your end.
9. HEADINGS: All the headings must be bold-faced, aligned left and fully capitalised. Leave a blank line before each heading.
10. SUB-HEADINGS: All the sub-headings must be bold-faced, aligned left and fully capitalised.
11. MAIN TEXT:
THE MAIN TEXT SHOULD FOLLOW THE FOLLOWING SEQUENCE:
INTRODUCTION
REVIEW OF LITERATURE
NEED/IMPORTANCE OF THE STUDY
STATEMENT OF THE PROBLEM
OBJECTIVES
HYPOTHESIS (ES)
RESEARCH METHODOLOGY
RESULTS & DISCUSSION
FINDINGS
RECOMMENDATIONS/SUGGESTIONS
CONCLUSIONS
LIMITATIONS
SCOPE FOR FURTHER RESEARCH
REFERENCES
APPENDIX/ANNEXURE
The manuscript should preferably be in 2000 to 5000 WORDS, But the limits can vary depending on the nature of the manuscript.

VOLUME NO. 7 (2016), ISSUE NO. 08 (AUGUST) ISSN 0976-2183
INTERNATIONAL JOURNAL OF RESEARCH IN COMMERCE & MANAGEMENT A Monthly Double-Blind Peer Reviewed (Refereed/Juried) Open Access International e-Journal - Included in the International Serial Directories
http://ijrcm.org.in/
vii
12. FIGURES & TABLES: These should be simple, crystal CLEAR, centered, separately numbered & self-explained, and the titles must be
above the table/figure. Sources of data should be mentioned below the table/figure. It should be ensured that the tables/figures are
referred to from the main text.
13. EQUATIONS/FORMULAE: These should be consecutively numbered in parenthesis, left aligned with equation/formulae number placed
at the right. The equation editor provided with standard versions of Microsoft Word may be utilised. If any other equation editor is
utilised, author must confirm that these equations may be viewed and edited in versions of Microsoft Office that does not have the
editor.
14. ACRONYMS: These should not be used in the abstract. The use of acronyms is elsewhere is acceptable. Acronyms should be defined
on its first use in each section e.g. Reserve Bank of India (RBI). Acronyms should be redefined on first use in subsequent sections.
15. REFERENCES: The list of all references should be alphabetically arranged. The author (s) should mention only the actually utilised
references in the preparation of manuscript and they may follow Harvard Style of Referencing. Also check to ensure that everything
that you are including in the reference section is duly cited in the paper. The author (s) are supposed to follow the references as per
the following:
All works cited in the text (including sources for tables and figures) should be listed alphabetically.
Use (ed.) for one editor, and (ed.s) for multiple editors.
When listing two or more works by one author, use --- (20xx), such as after Kohl (1997), use --- (2001), etc., in chronologically ascending
order.
Indicate (opening and closing) page numbers for articles in journals and for chapters in books.
The title of books and journals should be in italic printing. Double quotation marks are used for titles of journal articles, book chapters,
dissertations, reports, working papers, unpublished material, etc.
For titles in a language other than English, provide an English translation in parenthesis.
Headers, footers, endnotes and footnotes should not be used in the document. However, you can mention short notes to elucidate
some specific point, which may be placed in number orders before the references.
PLEASE USE THE FOLLOWING FOR STYLE AND PUNCTUATION IN REFERENCES:
BOOKS
Bowersox, Donald J., Closs, David J., (1996), "Logistical Management." Tata McGraw, Hill, New Delhi.
Hunker, H.L. and A.J. Wright (1963), "Factors of Industrial Location in Ohio" Ohio State University, Nigeria.
CONTRIBUTIONS TO BOOKS
Sharma T., Kwatra, G. (2008) Effectiveness of Social Advertising: A Study of Selected Campaigns, Corporate Social Responsibility, Edited
by David Crowther & Nicholas Capaldi, Ashgate Research Companion to Corporate Social Responsibility, Chapter 15, pp 287-303.
JOURNAL AND OTHER ARTICLES
Schemenner, R.W., Huber, J.C. and Cook, R.L. (1987), "Geographic Differences and the Location of New Manufacturing Facilities," Jour-
nal of Urban Economics, Vol. 21, No. 1, pp. 83-104.
CONFERENCE PAPERS
Garg, Sambhav (2011): "Business Ethics" Paper presented at the Annual International Conference for the All India Management Asso-
ciation, New Delhi, India, 19–23
UNPUBLISHED DISSERTATIONS
Kumar S. (2011): "Customer Value: A Comparative Study of Rural and Urban Customers," Thesis, Kurukshetra University, Kurukshetra.
ONLINE RESOURCES
Always indicate the date that the source was accessed, as online resources are frequently updated or removed.
WEBSITES
Garg, Bhavet (2011): Towards a New Gas Policy, Political Weekly, Viewed on January 01, 2012 http://epw.in/user/viewabstract.jsp

VOLUME NO. 7 (2016), ISSUE NO. 08 (AUGUST) ISSN 0976-2183
INTERNATIONAL JOURNAL OF RESEARCH IN COMMERCE & MANAGEMENT A Monthly Double-Blind Peer Reviewed (Refereed/Juried) Open Access International e-Journal - Included in the International Serial Directories
http://ijrcm.org.in/
1
IMPACT OF THE TAX PROPOSALS IN THE UNION BUDGET FOR 2016-17 ON INDIVIDUAL INCOME TAX ASSESSEES: AN ANALYSIS
DR. DHANANJOY RAKSHIT PROFESSOR & HEAD
DEPARTMENT OF COMMERCE SIDHO KANHO BIRSHA UNIVERSITY
PURULIA
ABSTRACT The Finance Minister has placed his Budget Proposals in the Lok Sabha on 29th February, 2016. Among various proposals in the Budget for the year 2016-17, the proposals relating to direct tax particularly in the area of income tax are very important to the tax payer individuals. In the present article, an attempt has been made to analyse the impact of some major proposals of the Finance Minister relating to income tax provisions on Individual Assessees. In respect of each of these proposals discussions and analyses have been made. It is observed that the FM is not so pleased with the salaried individuals who are considered as more or less honest tax payers but he is very much pleased with the dishonest black money holders of our country who have accumulated black money of crores of rupees over a number of years and now the FM has given them the golden opportunity to convert their accumulated black money into white money just paying tax @ 45 per cent and without any harassment by the Government. The present researcher is of the opinion that instead of being kind to the gigantic tax evaders, the government should have used its enforcement machinery stringently to compel them to comply with the tax laws of our country.
KEYWORDS
Lok sabha, finance minister, individual assessee.
1. INTRODUCTION he Union Budget, 2016 placed in the Lok Sabha by the Finance Minister Arun Jaitley on 29th February, 2016 has created a mix reaction among the public of different sections of the society. The Budget has a number of good sides as well as many minus sides from the point of view of the public based on the impact of the budget proposals on the public. Among various proposals in the Budget, the proposals relating to direct tax particularly in the area of income
tax are very important to the tax payer individuals. In the present article, an attempt has been made to analyse the impact of the proposals of the Finance Minister relating to income tax provisions on the Individual Assessees.
2. IMPORTANCE OF THE STUDY The public eagerly wait for the day when our Union Finance Minister announces some new proposals to be effective for the next financial year. Any good an-nouncement is always welcome. But when some new proposal is made in the Budget which is not beneficial to the general public or is against the principles of ethical justice, the proposal becomes a matter of criticism. So far the matter of income-tax proposals is concerned, the honest tax payers of the country expect hopefully from the Finance Minister to ease their tax burden and at the same time expect to take some stringent actions against the tax evaders. In the Budget proposals for the Union Budget for the year 2016-17, it has been observed that the Finance Minister has proposed only some minor reliefs for the salaried persons but has proposed a mega incentive in favour of the tax-evaders by paving the way for them to convert their accumulated black money into white money. Hence, the present analytical paper in the area of the tax proposals in the Union Budget for the year 2016-17 is very important from the point of view of academic discussion.
3. OBJECTIVES OF THE STUDY The Objectives of the present study are: 1. To make a computation of the tax benefits that may be available to the tax payer individuals under different income groups in the financial year 2016-17
after taking into account the new budget proposals made by the Finance Minister in the Union Budget, 2016; 2. To analyse the impact of the major income tax proposals on the individual income tax assessees; and 3. To make some concluding remarks.
4. RESEARCH METHODOLOGY The present researcher has gone through all the new tax proposals relating to income tax made by the Finance Minister in the Union Budget, 2016. The major income tax proposals which have direct impact on the Individual Assessees have been selected. Then, after making necessary computations, analyses have been made with respect to impact of these tax proposals on the individual assesses. Here, major revised and/or new income tax proposals include proposed revision of tax-rebate under Section 87A, proposed revision in respect of deduction under Section 80GG towards payment of rent of house, proposed additional deduction under newly substituted Section 80EE in respect of interest on loan taken for acquiring residential flat or property, proposal for increase in the rate of Sur Charge, proposal for imposition of tax on dividend in the hands of the recipients and proposal for introduction of Voluntary Disclosure Scheme for unearthing black money.
5.0 RESULTS AND DISCUSSION 5.1 PROPOSAL TO ENHANCE TAX REBATE U/S 87A OF THE INCOME TAX ACT To provide relief to the lower income group individual assessees having taxable income up to Rs 5 lakh the Finance Minister has proposed to raise tax rebate under Section 87A of the Income Tax Act to Rs 5000 for the Assessment Year 2017-18 instead of tax rebate of Rs 2000 for the Assessment year 2016-17. ANALYSIS: As a result of introduction of this new provision, an individual tax payer will be benefitted with an additional tax-saving of (Rs 3000 + 3 per cent of Rs 3000) i.e. Rs 3,090, in comparison to tax payable for the Assessment Year 2016-17. Here, normal tax rate @ 10per cent and Education and Higher Education Cess @ 3per cent will be applicable. 5.2 PROPOSAL TO ALLOW ENHANCED DEDUCTION U/S 80GG As per Budget proposal the Finance Minister has hiked the allowable deduction under Section 80GG. The Finance Minister has proposed that an assessee who does not own any house property and does not get any house rent allowance from the employer but stays in a rented house and pays rent in excess of 10 per cent of total (i.e. taxable) income will be allowed a deduction in respect of house rent paid and this deduction would be up to Rs 5000 per month i.e. Rs 60,000 in a year for the Assessment Year 2017-18. Earlier this deduction was up to Rs 2000 per month i.e. up to Rs 24,000 in a year. ANALYSIS: The new proposal will bring to the assessee an additional tax-saving which works out minimum at Rs (3600 + 3per cent of 3600) i.e. Rs 3,708 and maximum at Rs 12,793. Here, for the purpose of computing maximum tax-saving, the maximum marginal tax rate of 30 per cent plus Sur Charge @ 15per cent (assuming that the assessee is a super-rich individual having total income above Rs 1 crore) plus Education and Higher Education Cess @ 3per cent have been taken into account. Here, computed maximum tax-saving in the hands of the individual assessee = Rs 10,800 x 1.15x 1.03 = Rs 12,793.
T
VOLUME NO. 7 (2016), ISSUE NO. 08 (AUGUST) ISSN 0976-2183
INTERNATIONAL JOURNAL OF RESEARCH IN COMMERCE & MANAGEMENT A Monthly Double-Blind Peer Reviewed (Refereed/Juried) Open Access International e-Journal - Included in the International Serial Directories
http://ijrcm.org.in/
2
5.3 PROPOSAL FOR ADDITIONAL DEDUCTION UNDER NEW SECTION 80EE As per the proposal of the Finance Minister, the interest payable on a housing loan that an individual takes from any financial institution for acquiring a residential flat or property shall be allowed as a deduction up to Rs 50,000 under the newly substituted Section 80EE, if the loan is taken in the financial year 2016-17, the cost of the house is not exceeding Rs 50 lakh and the loan amount does not exceed Rs 35 lakh. Such person should not own any residential property on the date of sanction of this housing loan. ANALYSIS: This provision will encourage the home-less individuals to buy homes for their own. The tax-benefit available to an individual assessee works out minimum at Rs (5000 + 3 per cent of 5000) i.e. Rs 5150 and maximum at Rs 17,768. Here, for the purpose of computing maximum tax-saving, the maximum marginal tax rate of 30 per cent plus Sur Charge @ 15per cent (assuming that the assessee is a super-rich individual having total income above Rs 1 crore) plus Education and Higher Education Cess @ 3per cent have been taken into account. Here, computed maximum tax-saving in the hands of the individual assessee = Rs 15,000 x 1.15x 1.03 = Rs 17,768. 5.4 PROPOSAL FOR INCREASE IN THE RATE OF SUR CHARGE The Finance Minister has proposed to raise the Sur Charge which was @ 12per cent for financial year 2015-16 to 15 per cent for the financial year 2016-17 (i.e. for Assessment Year 2017-18) on persons other than companies, firms and co-operative societies having taxable income above Rs 1 Crore. ANALYSIS: Only the super-rich individuals will have to bear additional tax burden with an extra levy of 3 per cent on normal tax payable. 5.5 PROPOSAL FOR IMPOSITION OF TAX ON DIVIDEND INCOME IN THE HANDS OF THE RECIPIENTS Dividend Distribution Tax which is now (up to Assessment Year 2016-17) paid by companies will continue as before. In addition to this, the Finance Minister has proposed for the financial year 2016-17 (i.e. for Assessment Year 2017-18) a tax @ 10 per cent on the gross amount of dividend which will be payable by recipient individuals, HUFs and firms who will receive dividend in excess of Rs 10 lakh per annum. ANALYSIS: Up to financial year 2015-16, any dividend from any domestic company was tax-free in the hands of the recipients irrespective of the quantum of dividend. But for the financial year 206-17 such dividend will be taxable at applicable marginal rate of tax along with other taxable income of the assessee. That is, on this dividend amount (if it exceeds Rs 10 lakh) applicable Sur charge and Cess will also have to be paid. 5.6 PROPOSAL TO INTRODUCE VOLUNTARY DISCLOSURE SCHEME In the Budget proposal the Finance Minister has announced a Voluntary Disclosure Scheme (VDS) for a period of four months from June 1 to September 30, 2016 for the domestic black money holders to disclose now their previous undisclosed income remaining in the form of any asset and clear up their past unpaid tax by paying a normal tax @ 30 per cent plus Sur charge @ 7.5 per cent plus penalty @ only 7.5 per cent totalling a tax of 45 per cent on undisclosed income. The Finance Minister has announced that there will be no scrutiny or inquiry either in respect of Income Tax Act or Wealth Tax Act and such tax payers will have immunity from any prosecution. ANALYSIS: This is a golden opportunity for the high net worth individuals having black money to convert their black money into white money by paying tax at a flat rate of 45 per cent which is not too high considering the highest marginal rate of tax applicable to the honest tax payers of the country. It may be pointed out here that Government introduced such type of Voluntary Disclosure scheme in the year 1997.
6.0 CONCLUSION In the budget proposals for the year 2016-17 the FM has not proposed any change in the income tax rates or the slabs of tax rates applicable to the individual assesses. The FM has given only a token relief to the small income earners by allowing Rs 5,000 tax-rebate instead of Rs 2000 for financial year 2015-16. The FM is not so pleased with the salaried individuals and the retired individuals who are considered as more or less honest in respect of payment of income tax and they are now charged income tax @ 30.9 per cent including Education and Higher Education Cess, if their taxable income exceeds Rs 10 lakh. The FM has no mercy on these honest tax payers of our country but he is very much pleased with the dishonest black money holders of our country who have accumulated black money of crores of rupees over a number of years and after waiting for eighteen years they have been given the golden opportunity by dear FM of our country to convert their accumulated black money into white money just paying tax @ 45 per cent and obviously without any harassment by the Government. Such type of govern-ment sponsored amnesty scheme is not for the first time in our country. Since independence, the government had introduced Voluntary Disclosure Scheme (VDS) in some name or other for a number of times. It comes again and again and only patience is required to adopt the opportunity. Now this golden chance for them has come after a gap of eighteen years after its last introduction in the year 1997. But the present researcher is of the opinion that instead of being kind to the gigantic tax evaders the government should have used its enforcement machinery stringently to compel them to comply with the tax laws of our country.
REFERENCES 1. Income Tax Act, 1961 (as amended up to date) 2. The text of the Budget Speech of the Union Finance Minister for 2016-17

VOLUME NO. 7 (2016), ISSUE NO. 08 (AUGUST) ISSN 0976-2183
INTERNATIONAL JOURNAL OF RESEARCH IN COMMERCE & MANAGEMENT A Monthly Double-Blind Peer Reviewed (Refereed/Juried) Open Access International e-Journal - Included in the International Serial Directories
http://ijrcm.org.in/
3
STRESS MANAGEMENT: A SPECIAL FOCUS ON SOFTWARE EMPLOYEES IN TWIN CITIES OF HYDERABAD & SECUNDERABAD
K.SRI RANGA LAKSHMI ASST. PROFESSOR
DEPARTMENT OF MANAGEMENT STUDIES SRIDEVI WOMEN’S ENGINEERING COLLEGE
HYDERABAD
B. SUBBA RAO PROFESSOR & HEAD
DEPARTMENT OF MANAGEMENT STUDIES SRIDEVI WOMEN’S ENGINEERING COLLEGE
HYDERABAD
B. SUDHAKAR REDDY ASST. PROFESSOR
DEPARTMENT OF MANAGEMENT STUDIES SRIDEVI WOMEN’S ENGINEERING COLLEGE
HYDERABAD
ABSTRACT Stress is a part of day-to-day living of every individual. The college students may experience stress in meeting the academic demands, people on the job, business men may suffer stress to reach office in time and to complete the projects on time and even the house hold ladies may experience stress in managing the home affairs and to look for the maid servant. The reasons for the stress differ from person to person. Highly complex and stress-laden workplaces present challenges to organizational leaders as they are faced with the task of managing the workforce while concurrently maintaining commitment and morale. The stress people experience should not be necessarily treated as harmful. An optimum amount of stress can always act as an energizer or motivator and propel people to apply the efforts and complete the work. But a high level of Stress can be a serious threat to the personality traits of the individual and can cause physiological and social problems. Thus the main aim of this article is to bring the level of stress in software employees in general and twin cities of secunderabad and Hyderabad, Telangana State, India, in particular. By this survey 60percent of software employees in Hyderabad under stress occasionally. Married women and single mothers in software field are facing stress to balance work life. Due to stress the software employees are facing health problems like obesity, heart problems diabetes and infertility problems for females.
KEYWORDS
Hyderabad, Secunderabad, stress, physiological problems, social problems, software employees.
INTRODUCTION
he study of human resource management is one of the major criteria in the corporate sector. Now a day the corporate sector is booming in a high speed that the people have to work for prolonged hours to maintain the standard of living and achieve their basic needs. In spite of having the modern technol-ogies and facilities, people are feeling themselves to be work loaded and stressed. Stress arises because of many reasons some of which results from
excessive pressure and environmental stimulations like work conflict, work overload, lack of social support, etc. Highly complex and stress-laden workplaces present challenges to organizational leaders as they are faced with the task of managing the workforce while concur-rently maintaining commitment and morale. Leaders themselves can often be a central source of stress among employees (Basch & Fisher, 2000; Offer Mann & Hellmann, 1996; Sosik & Godshalk, 2000). As the characteristics of work change, so must the roles and tactics of modern leaders. Leaders, who promote supportive relationships, elicit motivation among subordinates, facilitate more positive and less negative emotions among subordinates, and engender more benign evalua-tions of stressful tasks among subordinates may be more effective than the more traditional leaders who tend toward task-directive techniques.
OBJECTIVES
1. To identify the factors causing stress to the employees at work in the organization 2. To know the stress management practices in software companies in Hyderabad 3. To offer suitable suggestions to the company to improve stress management practice of the company.
LITERATURE REVIEW
Hans Selye (1973).) Stress is the body’s nonspecific response to a demand placed on it. Richard S. Lazarus (1966) Stress as a condition or feeling experienced when a person perceives that ―demands exceed the Personal and social resources the individual is able to mobilize; Darshan et al (2009) observed that the software employees are professionally stressed and are at 10 times higher risk for developing depression and also significantly increase the incidence of psychiatric disor-ders. Preventive strategies like training in stress management, frequent screening to identify professional stress and depression at the initial stages and addressing these issues adequately might help the software professionals cope with their profession better without affecting their lifestyle and health. Jakkula Rao and Chandraiah (2011) found that job satisfaction and mental health are correlated but not significant. However, job satisfaction was positively and significantly cor-related with coping behavior. The mental health is negatively and significantly correlated with occupational stress. It can be explained that as job satisfaction and mental health increases coping behavior increases. And as stress increases mental health decreases. Stress may be referred to as an unpleasant state of emotional and physiological arousal that people experience in situations that they perceive as dangerous or threatening to their well-being. Stress is defined as a nonspecific response of the body to a stimulus or event (stressor). Under a general model of the stress response, when an individual experiences a stressor, the stressor will lead to a physiological response, one that can be measured by several indicators, such as elevated heart rate Transactional model of stress championed by Richard Lazarus and his colleagues (Holroyd & Lazarus, 1982; Lazarus & Folkman, 1984) - A theory that proposes that the experience of stress depends on one‘s subjective appraisal of events. Thus, stress is neither a stimulus nor a response but a stimulus-response transaction.
T
VOLUME NO. 7 (2016), ISSUE NO. 08 (AUGUST) ISSN 0976-2183
INTERNATIONAL JOURNAL OF RESEARCH IN COMMERCE & MANAGEMENT A Monthly Double-Blind Peer Reviewed (Refereed/Juried) Open Access International e-Journal - Included in the International Serial Directories
http://ijrcm.org.in/
4
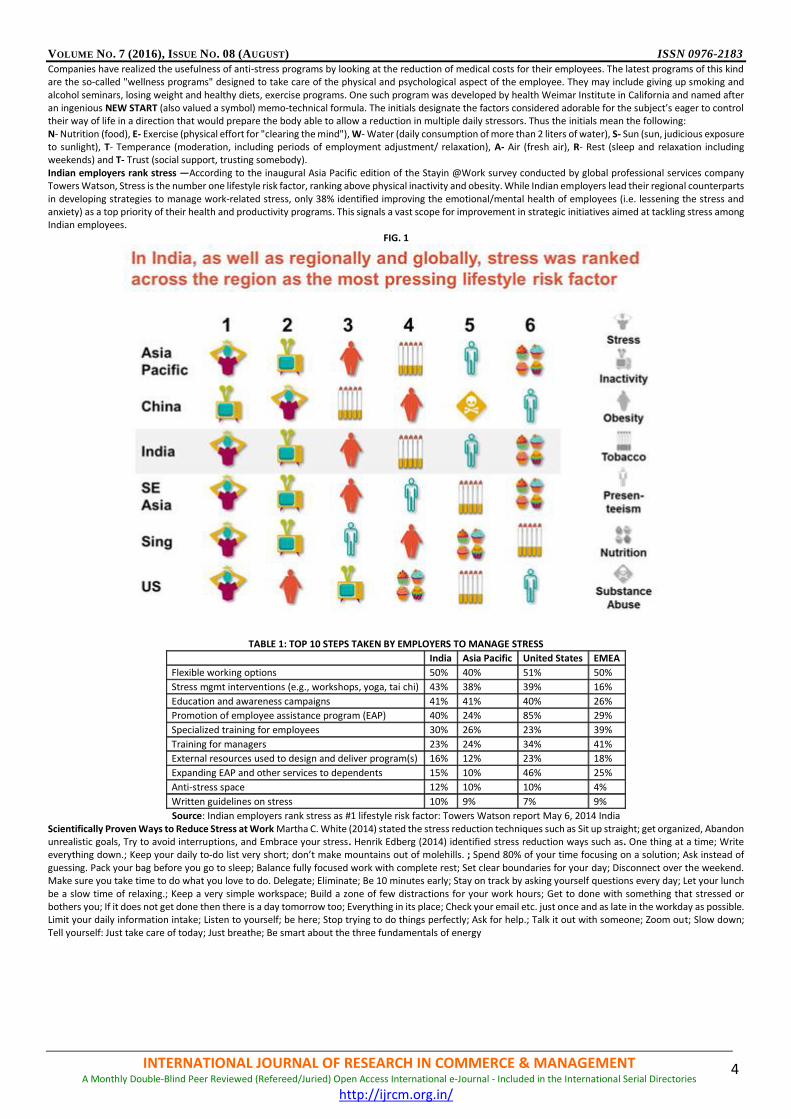
Companies have realized the usefulness of anti-stress programs by looking at the reduction of medical costs for their employees. The latest programs of this kind are the so-called "wellness programs" designed to take care of the physical and psychological aspect of the employee. They may include giving up smoking and alcohol seminars, losing weight and healthy diets, exercise programs. One such program was developed by health Weimar Institute in California and named after an ingenious NEW START (also valued a symbol) memo-technical formula. The initials designate the factors considered adorable for the subject’s eager to control their way of life in a direction that would prepare the body able to allow a reduction in multiple daily stressors. Thus the initials mean the following: N- Nutrition (food), E- Exercise (physical effort for "clearing the mind"), W- Water (daily consumption of more than 2 liters of water), S- Sun (sun, judicious exposure to sunlight), T- Temperance (moderation, including periods of employment adjustment/ relaxation), A- Air (fresh air), R- Rest (sleep and relaxation including weekends) and T- Trust (social support, trusting somebody). Indian employers rank stress —According to the inaugural Asia Pacific edition of the Stayin @Work survey conducted by global professional services company Towers Watson, Stress is the number one lifestyle risk factor, ranking above physical inactivity and obesity. While Indian employers lead their regional counterparts in developing strategies to manage work-related stress, only 38% identified improving the emotional/mental health of employees (i.e. lessening the stress and anxiety) as a top priority of their health and productivity programs. This signals a vast scope for improvement in strategic initiatives aimed at tackling stress among Indian employees.
FIG. 1
TABLE 1: TOP 10 STEPS TAKEN BY EMPLOYERS TO MANAGE STRESS
India Asia Pacific United States EMEA
Flexible working options 50% 40% 51% 50%
Stress mgmt interventions (e.g., workshops, yoga, tai chi) 43% 38% 39% 16%
Education and awareness campaigns 41% 41% 40% 26%
Promotion of employee assistance program (EAP) 40% 24% 85% 29%
Specialized training for employees 30% 26% 23% 39%
Training for managers 23% 24% 34% 41%
External resources used to design and deliver program(s) 16% 12% 23% 18%
Expanding EAP and other services to dependents 15% 10% 46% 25%
Anti-stress space 12% 10% 10% 4%
Written guidelines on stress 10% 9% 7% 9%
Source: Indian employers rank stress as #1 lifestyle risk factor: Towers Watson report May 6, 2014 India Scientifically Proven Ways to Reduce Stress at Work Martha C. White (2014) stated the stress reduction techniques such as Sit up straight; get organized, Abandon unrealistic goals, Try to avoid interruptions, and Embrace your stress. Henrik Edberg (2014) identified stress reduction ways such as. One thing at a time; Write everything down.; Keep your daily to-do list very short; don’t make mountains out of molehills. ; Spend 80% of your time focusing on a solution; Ask instead of guessing. Pack your bag before you go to sleep; Balance fully focused work with complete rest; Set clear boundaries for your day; Disconnect over the weekend. Make sure you take time to do what you love to do. Delegate; Eliminate; Be 10 minutes early; Stay on track by asking yourself questions every day; Let your lunch be a slow time of relaxing.; Keep a very simple workspace; Build a zone of few distractions for your work hours; Get to done with something that stressed or bothers you; If it does not get done then there is a day tomorrow too; Everything in its place; Check your email etc. just once and as late in the workday as possible. Limit your daily information intake; Listen to yourself; be here; Stop trying to do things perfectly; Ask for help.; Talk it out with someone; Zoom out; Slow down; Tell yourself: Just take care of today; Just breathe; Be smart about the three fundamentals of energy
VOLUME NO. 7 (2016), ISSUE NO. 08 (AUGUST) ISSN 0976-2183
INTERNATIONAL JOURNAL OF RESEARCH IN COMMERCE & MANAGEMENT A Monthly Double-Blind Peer Reviewed (Refereed/Juried) Open Access International e-Journal - Included in the International Serial Directories
http://ijrcm.org.in/
5
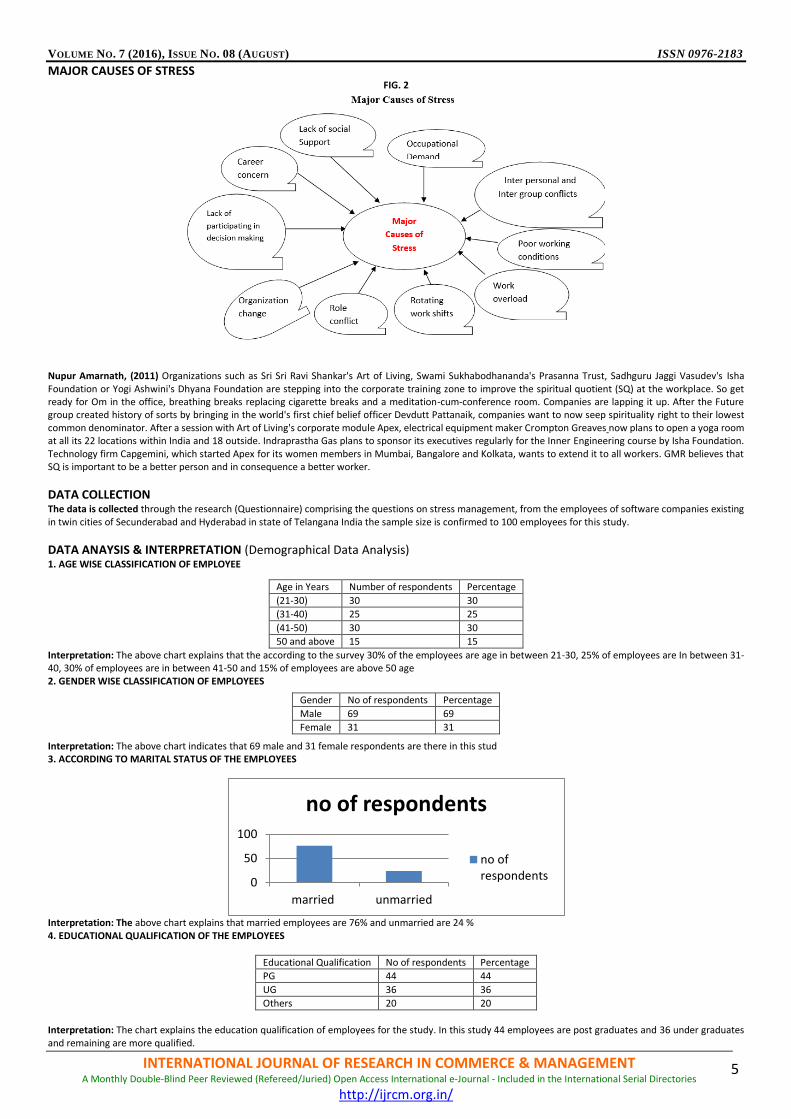
MAJOR CAUSES OF STRESS FIG. 2
Nupur Amarnath, (2011) Organizations such as Sri Sri Ravi Shankar's Art of Living, Swami Sukhabodhananda's Prasanna Trust, Sadhguru Jaggi Vasudev's Isha Foundation or Yogi Ashwini's Dhyana Foundation are stepping into the corporate training zone to improve the spiritual quotient (SQ) at the workplace. So get ready for Om in the office, breathing breaks replacing cigarette breaks and a meditation-cum-conference room. Companies are lapping it up. After the Future group created history of sorts by bringing in the world's first chief belief officer Devdutt Pattanaik, companies want to now seep spirituality right to their lowest common denominator. After a session with Art of Living's corporate module Apex, electrical equipment maker Crompton Greaves now plans to open a yoga room at all its 22 locations within India and 18 outside. Indraprastha Gas plans to sponsor its executives regularly for the Inner Engineering course by Isha Foundation. Technology firm Capgemini, which started Apex for its women members in Mumbai, Bangalore and Kolkata, wants to extend it to all workers. GMR believes that SQ is important to be a better person and in consequence a better worker.
DATA COLLECTION The data is collected through the research (Questionnaire) comprising the questions on stress management, from the employees of software companies existing in twin cities of Secunderabad and Hyderabad in state of Telangana India the sample size is confirmed to 100 employees for this study.
DATA ANAYSIS & INTERPRETATION (Demographical Data Analysis) 1. AGE WISE CLASSIFICATION OF EMPLOYEE Interpretation: The above chart explains that the according to the survey 30% of the employees are age in between 21-30, 25% of employees are In between 31-40, 30% of employees are in between 41-50 and 15% of employees are above 50 age 2. GENDER WISE CLASSIFICATION OF EMPLOYEES Interpretation: The above chart indicates that 69 male and 31 female respondents are there in this stud 3. ACCORDING TO MARITAL STATUS OF THE EMPLOYEES
Interpretation: The above chart explains that married employees are 76% and unmarried are 24 % 4. EDUCATIONAL QUALIFICATION OF THE EMPLOYEES
Educational Qualification No of respondents Percentage
PG 44 44
UG 36 36
Others 20 20
Interpretation: The chart explains the education qualification of employees for the study. In this study 44 employees are post graduates and 36 under graduates and remaining are more qualified.
0
50
100
married unmarried
no of respondents
no ofrespondents
Age in Years Number of respondents Percentage
(21-30) 30 30
(31-40) 25 25
(41-50) 30 30
50 and above 15 15
Gender No of respondents Percentage
Male 69 69
Female 31 31

VOLUME NO. 7 (2016), ISSUE NO. 08 (AUGUST) ISSN 0976-2183
INTERNATIONAL JOURNAL OF RESEARCH IN COMMERCE & MANAGEMENT A Monthly Double-Blind Peer Reviewed (Refereed/Juried) Open Access International e-Journal - Included in the International Serial Directories
http://ijrcm.org.in/
6
5. SOFTWARE EMPLOYEES NATURE OF JOB IN HYDERABAD
Nature of the job No.of respondents Percentage
Permanent 79 79
Temporary 21 21
Interpretation: From the analysis 79 are Permanent and 21 are temporary employees for this study 6. EXPERIENCE IN THE PRESENT COMPANY
Experience No of respondents Percentage
Less than 2 years 20 20
2-5 years 40 40
5-7 years 30 30
Greater than 7 years 10 10
Interpretation: It is evident from the analysis that less than 2 yr 20% of employees, 3-5 years 40%,5-7yrs 30% and greater than 7 yrs are 10% having experience in the company 7. INCOME LEVEL OF THE EMPLOYEES
Income level No of respondents Percentage
Below 25000 30 30
25000-35000 40 40
35000-45000 20 20
45000 and above 10 10
Interpretation: The above chart explain that 30% of employees are below 25,000, 40% are in between 25-35 k, 20% are in between 35-45k and only 10% employees are above 45k.
DATA ANAYSIS & INTERPRETATION (According to the study) 1. DO YOU FEEL LIKE STRESS IN YOUR JOB?
Parameters No of respondents Percentage
Always 20 20
Sometimes 60 60
Never 20 20
Interpretation: From the above chart it explains that 20% of employees are always under stress and 60% of employees are feel stress sometime due to situations and 20% are never under stress. 2. WHAT MAY CAUSES STRESS ON YOUR JOB?
Workers characteristics No of respondents Percentage
Social support 30 30
Other conditions (Type A)
Competitiveness 20 20
Time urgency 10 10
Hostility 10 10
(Type B)
Moderate Ambitiousness 10 10
Working conditions 10 10
Focus on quality 10 10
Interpretation: The result from the above fig shows the cause of stress on software employees. 40% of type A conditions like Competitiveness, Time urgency, Hostility. And 30% of type B conditions like Moderate Ambitiousness, working conditions, focus on quality. And 30% of social support. 3. WORKING CONDITIONS
Working conditions No of respondents Percentage
Lack of control 30 30
Time/deadline pressure 20 20
Poor relationship 10 10
Lack of communication 20 20
Work overload 20 20
Interpretation: Working conditions of the software employees and stress. It shows that due to lack of control 30% of employees are under stress, 20% of Time/deadline pressure, 10% Poor relationship, 20% Lack of communication, 20% Work overload 4. JOB CONDITIONS
Job conditions No of respondents Percentage
Design of the task 20 20
Management task 20 20
Interpersonal relationship 40 40
Work roles 10 10
Career concerns 10 10
Interpretation: The chart explains the internal factors effect on employee performance due to stress. 20% of Design of the task, 20% of Management task,40% of Interpersonal relationship and 10% Career concerns 5. DOES A SHORT BREAK DURING THE WORKING HOURS HELP TO REDUCE STRESS?
Parameters No of respondents Percentage
Strongly agree 60 60
Agree 20 20
Neutral 20 20
Disagree 0 0
Strongly disagree 0 0
Interpretation: 60% of employees are strongly agree that they need Short Break to reduce stress, 20% agree and 20% neutral

VOLUME NO. 7 (2016), ISSUE NO. 08 (AUGUST) ISSN 0976-2183
INTERNATIONAL JOURNAL OF RESEARCH IN COMMERCE & MANAGEMENT A Monthly Double-Blind Peer Reviewed (Refereed/Juried) Open Access International e-Journal - Included in the International Serial Directories
http://ijrcm.org.in/
7
6. INTERNAL AND EXTERNAL STRESSORS THAT CREATE STRESS TO AN INDIVIDUAL
Internal stressors No of respondents Percentage External stressors No of respondents Percentage
Inability to accept uncertainty 20 20 Major life change 10 10
Pessimism-negative self talk 20 20 Work 40 40
Unrealistic expectations 30 30 Relationship difficulties 30 30
Perfectionism 10 10 Financial problem 10 10
Lack of assertiveness 20 20 Children & family 10 10
INTERNAL STRESSORS
Interpretation: Internal stressors are 20% due to Inability to accept uncertainty, 20% Pessimism-negative self talk, 30% Unrealistic expectations, 10% Perfection-ism, 20% of Lack of assertiveness EXTERNALSTRESSORS
Interpretation: External stressors are 10% due Major life change, 40% of Work, 30 % of Relationship difficulties, 10% financial and 10 % children problems are external stress of software employees 7. DO YOU FEEL STRESS CAUSES PROBLEMS?
Problems No of respondents Percentage
Health Problems 50 50
Physical problems 30 30
Psychological effects 10 10
Burnout 10 10
Interpretation: Software employees face problems 50% of Health problems, 30% of Physical problems and 10 % Psychological effects and 10% burnout 8. DOES FINANCIAL MOTIVATION REDUCE THE STRESS?
Parameters No of respondents Percentage
Strongly agree 30 30
Agree 40 40
Neutral 10 10
Strongly disagree 10 10
disagree 10 10
Interpretation: 30% of employees are strongly agree that Financial motivation can reduce the stress, 40% agree,10 % neutral,10% strongly disagree and 10 % disagree. 9. DOES THE ORGANIZATION PROVIDE YOU ANY INCENTIVES AND EXTRA BENEFITS TO OVERCOME STRESS?
Options No. of respondents Percentage
To large extend 10 10
To some extend 70 70
Not at all 20 20
No idea 00 00
Interpretation: if organization provide Incentives and extra benefits 10% of employees are agree to overcome stress to large extent, 70% to some extent, and 20% to not at all.
0
5
10
15
20
25
30
35
Internal stressors Inability to acceptuncertainty
Pessimism-negativeself talk
Unrealisticexpectations
Perfectionism Lack of assertiveness
Column2
Column2
0
10
20
30
40
50
Major life change Work Relationship difficulties Financial problem Children & family
No of respondents
No of respondents
VOLUME NO. 7 (2016), ISSUE NO. 08 (AUGUST) ISSN 0976-2183
INTERNATIONAL JOURNAL OF RESEARCH IN COMMERCE & MANAGEMENT A Monthly Double-Blind Peer Reviewed (Refereed/Juried) Open Access International e-Journal - Included in the International Serial Directories
http://ijrcm.org.in/
8
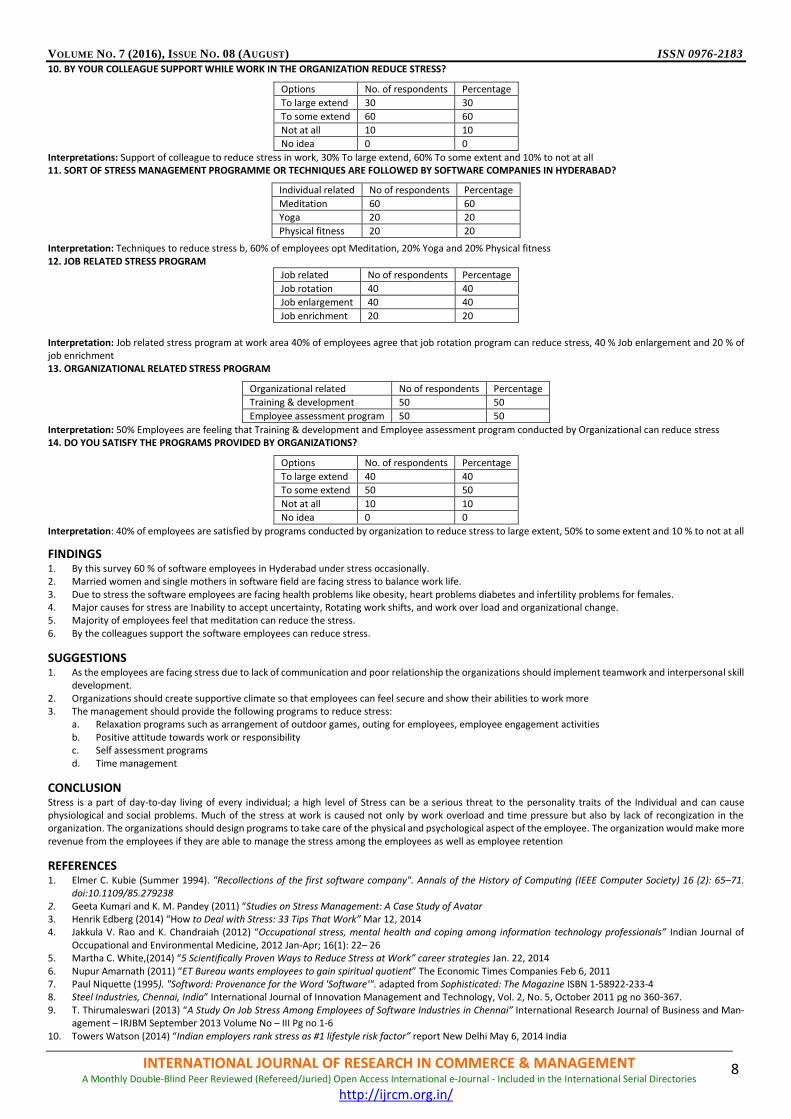
10. BY YOUR COLLEAGUE SUPPORT WHILE WORK IN THE ORGANIZATION REDUCE STRESS?
Options No. of respondents Percentage
To large extend 30 30
To some extend 60 60
Not at all 10 10
No idea 0 0
Interpretations: Support of colleague to reduce stress in work, 30% To large extend, 60% To some extent and 10% to not at all 11. SORT OF STRESS MANAGEMENT PROGRAMME OR TECHNIQUES ARE FOLLOWED BY SOFTWARE COMPANIES IN HYDERABAD? Interpretation: Techniques to reduce stress b, 60% of employees opt Meditation, 20% Yoga and 20% Physical fitness 12. JOB RELATED STRESS PROGRAM
Job related No of respondents Percentage
Job rotation 40 40
Job enlargement 40 40
Job enrichment 20 20
Interpretation: Job related stress program at work area 40% of employees agree that job rotation program can reduce stress, 40 % Job enlargement and 20 % of job enrichment 13. ORGANIZATIONAL RELATED STRESS PROGRAM
Organizational related No of respondents Percentage
Training & development 50 50
Employee assessment program 50 50
Interpretation: 50% Employees are feeling that Training & development and Employee assessment program conducted by Organizational can reduce stress 14. DO YOU SATISFY THE PROGRAMS PROVIDED BY ORGANIZATIONS?
Options No. of respondents Percentage
To large extend 40 40
To some extend 50 50
Not at all 10 10
No idea 0 0
Interpretation: 40% of employees are satisfied by programs conducted by organization to reduce stress to large extent, 50% to some extent and 10 % to not at all
FINDINGS
1. By this survey 60 % of software employees in Hyderabad under stress occasionally. 2. Married women and single mothers in software field are facing stress to balance work life. 3. Due to stress the software employees are facing health problems like obesity, heart problems diabetes and infertility problems for females. 4. Major causes for stress are Inability to accept uncertainty, Rotating work shifts, and work over load and organizational change. 5. Majority of employees feel that meditation can reduce the stress. 6. By the colleagues support the software employees can reduce stress.
SUGGESTIONS
1. As the employees are facing stress due to lack of communication and poor relationship the organizations should implement teamwork and interpersonal skill development.
2. Organizations should create supportive climate so that employees can feel secure and show their abilities to work more 3. The management should provide the following programs to reduce stress:
a. Relaxation programs such as arrangement of outdoor games, outing for employees, employee engagement activities b. Positive attitude towards work or responsibility c. Self assessment programs d. Time management
CONCLUSION Stress is a part of day-to-day living of every individual; a high level of Stress can be a serious threat to the personality traits of the Individual and can cause physiological and social problems. Much of the stress at work is caused not only by work overload and time pressure but also by lack of recongization in the organization. The organizations should design programs to take care of the physical and psychological aspect of the employee. The organization would make more revenue from the employees if they are able to manage the stress among the employees as well as employee retention
REFERENCES 1. Elmer C. Kubie (Summer 1994). "Recollections of the first software company". Annals of the History of Computing (IEEE Computer Society) 16 (2): 65–71.
doi:10.1109/85.279238 2. Geeta Kumari and K. M. Pandey (2011) “Studies on Stress Management: A Case Study of Avatar 3. Henrik Edberg (2014) “How to Deal with Stress: 33 Tips That Work” Mar 12, 2014 4. Jakkula V. Rao and K. Chandraiah (2012) “Occupational stress, mental health and coping among information technology professionals” Indian Journal of
Occupational and Environmental Medicine, 2012 Jan-Apr; 16(1): 22– 26 5. Martha C. White,(2014) “5 Scientifically Proven Ways to Reduce Stress at Work” career strategies Jan. 22, 2014 6. Nupur Amarnath (2011) “ET Bureau wants employees to gain spiritual quotient” The Economic Times Companies Feb 6, 2011 7. Paul Niquette (1995). "Softword: Provenance for the Word 'Software'". adapted from Sophisticated: The Magazine ISBN 1-58922-233-4 8. Steel Industries, Chennai, India” International Journal of Innovation Management and Technology, Vol. 2, No. 5, October 2011 pg no 360-367. 9. T. Thirumaleswari (2013) “A Study On Job Stress Among Employees of Software Industries in Chennai” International Research Journal of Business and Man-
agement – IRJBM September 2013 Volume No – III Pg no 1-6 10. Towers Watson (2014) “Indian employers rank stress as #1 lifestyle risk factor” report New Delhi May 6, 2014 India
Individual related No of respondents Percentage
Meditation 60 60
Yoga 20 20
Physical fitness 20 20
VOLUME NO. 7 (2016), ISSUE NO. 08 (AUGUST) ISSN 0976-2183
INTERNATIONAL JOURNAL OF RESEARCH IN COMMERCE & MANAGEMENT A Monthly Double-Blind Peer Reviewed (Refereed/Juried) Open Access International e-Journal - Included in the International Serial Directories
http://ijrcm.org.in/
9
AN EMPIRICAL STUDY ON RELATIONSHIP OF SUPERVISION, INNOVATION & CHANGE AND CUSTOMER SERVICE (ORGANIZATIONAL CLIMATE) WITH RESILIENCE
PAYAL SHARMA ASST. PROFESSOR
ACROPOLIS TECHNICAL CAMPUS INDORE
DR. INDU BHARGAVA PROFESSOR & HEAD
DEPARTMENT OF MANAGEMENT SUSHILA DEVI BANSAL COLLEGE OF TECHNOLOGY
INDORE
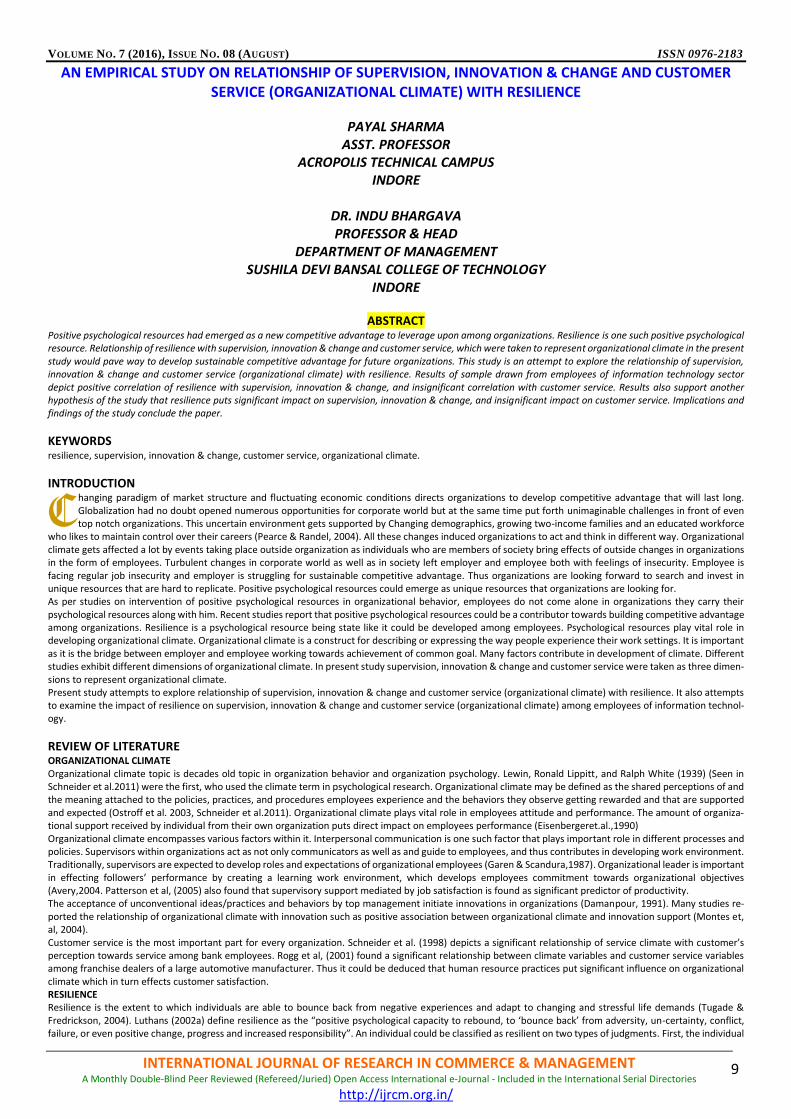
ABSTRACT Positive psychological resources had emerged as a new competitive advantage to leverage upon among organizations. Resilience is one such positive psychological resource. Relationship of resilience with supervision, innovation & change and customer service, which were taken to represent organizational climate in the present study would pave way to develop sustainable competitive advantage for future organizations. This study is an attempt to explore the relationship of supervision, innovation & change and customer service (organizational climate) with resilience. Results of sample drawn from employees of information technology sector depict positive correlation of resilience with supervision, innovation & change, and insignificant correlation with customer service. Results also support another hypothesis of the study that resilience puts significant impact on supervision, innovation & change, and insignificant impact on customer service. Implications and findings of the study conclude the paper.
KEYWORDS resilience, supervision, innovation & change, customer service, organizational climate.
INTRODUCTION hanging paradigm of market structure and fluctuating economic conditions directs organizations to develop competitive advantage that will last long. Globalization had no doubt opened numerous opportunities for corporate world but at the same time put forth unimaginable challenges in front of even top notch organizations. This uncertain environment gets supported by Changing demographics, growing two-income families and an educated workforce
who likes to maintain control over their careers (Pearce & Randel, 2004). All these changes induced organizations to act and think in different way. Organizational climate gets affected a lot by events taking place outside organization as individuals who are members of society bring effects of outside changes in organizations in the form of employees. Turbulent changes in corporate world as well as in society left employer and employee both with feelings of insecurity. Employee is facing regular job insecurity and employer is struggling for sustainable competitive advantage. Thus organizations are looking forward to search and invest in unique resources that are hard to replicate. Positive psychological resources could emerge as unique resources that organizations are looking for. As per studies on intervention of positive psychological resources in organizational behavior, employees do not come alone in organizations they carry their psychological resources along with him. Recent studies report that positive psychological resources could be a contributor towards building competitive advantage among organizations. Resilience is a psychological resource being state like it could be developed among employees. Psychological resources play vital role in developing organizational climate. Organizational climate is a construct for describing or expressing the way people experience their work settings. It is important as it is the bridge between employer and employee working towards achievement of common goal. Many factors contribute in development of climate. Different studies exhibit different dimensions of organizational climate. In present study supervision, innovation & change and customer service were taken as three dimen-sions to represent organizational climate. Present study attempts to explore relationship of supervision, innovation & change and customer service (organizational climate) with resilience. It also attempts to examine the impact of resilience on supervision, innovation & change and customer service (organizational climate) among employees of information technol-ogy.
REVIEW OF LITERATURE ORGANIZATIONAL CLIMATE Organizational climate topic is decades old topic in organization behavior and organization psychology. Lewin, Ronald Lippitt, and Ralph White (1939) (Seen in Schneider et al.2011) were the first, who used the climate term in psychological research. Organizational climate may be defined as the shared perceptions of and the meaning attached to the policies, practices, and procedures employees experience and the behaviors they observe getting rewarded and that are supported and expected (Ostroff et al. 2003, Schneider et al.2011). Organizational climate plays vital role in employees attitude and performance. The amount of organiza-tional support received by individual from their own organization puts direct impact on employees performance (Eisenbergeret.al.,1990) Organizational climate encompasses various factors within it. Interpersonal communication is one such factor that plays important role in different processes and policies. Supervisors within organizations act as not only communicators as well as and guide to employees, and thus contributes in developing work environment. Traditionally, supervisors are expected to develop roles and expectations of organizational employees (Garen & Scandura,1987). Organizational leader is important in effecting followers’ performance by creating a learning work environment, which develops employees commitment towards organizational objectives (Avery,2004. Patterson et al, (2005) also found that supervisory support mediated by job satisfaction is found as significant predictor of productivity. The acceptance of unconventional ideas/practices and behaviors by top management initiate innovations in organizations (Damanpour, 1991). Many studies re-ported the relationship of organizational climate with innovation such as positive association between organizational climate and innovation support (Montes et, al, 2004). Customer service is the most important part for every organization. Schneider et al. (1998) depicts a significant relationship of service climate with customer’s perception towards service among bank employees. Rogg et al, (2001) found a significant relationship between climate variables and customer service variables among franchise dealers of a large automotive manufacturer. Thus it could be deduced that human resource practices put significant influence on organizational climate which in turn effects customer satisfaction. RESILIENCE Resilience is the extent to which individuals are able to bounce back from negative experiences and adapt to changing and stressful life demands (Tugade & Fredrickson, 2004). Luthans (2002a) define resilience as the “positive psychological capacity to rebound, to ‘bounce back’ from adversity, un-certainty, conflict, failure, or even positive change, progress and increased responsibility”. An individual could be classified as resilient on two types of judgments. First, the individual
C

VOLUME NO. 7 (2016), ISSUE NO. 08 (AUGUST) ISSN 0976-2183
INTERNATIONAL JOURNAL OF RESEARCH IN COMMERCE & MANAGEMENT A Monthly Double-Blind Peer Reviewed (Refereed/Juried) Open Access International e-Journal - Included in the International Serial Directories
http://ijrcm.org.in/
10
should have experienced some kind of adverse or threatening event(s). Second, is the degree to which the individual was able to overcome and/or thrive (Mas-ten,1999). Studies show positive relationship of resilience with performance outcomes (Luthans, Avolio, et al.,2006; Luthans et al., 2005; Youssef, 2004). Luthans et al.(2005) depicts significant relationship among resilience and rated performance of Chinese workers. Resilience was found significantly related with job satisfaction among factory workers (Larson & Luthans, 2006)
STATEMENT OF THE PROBLEM In the light of present scenario of dynamic changes in marketplace, organizations are looking towards developing sustainable competitive advantage. Positive psychological resources could be one such example for future organizations. Thus present study is an attempt to examine relationship and impact of resilience on supervision, innovation & change and customer service representing organizational climate in the study.
OBJECTIVES OF THE STUDY 1. To study relationship between Supervision, Innovation & Change, Customer Service (Organizational Climate) and Resilience among employees of Information
Technology Sector. 2. To study the impact of Resilience on Supervision, Innovation & Change, Customer Service (Organizational Climate) among employees of Information Tech-
nology Sector.
HYPOTHESES 1. There is significant relationship between Supervision and Resilience among employees of Information Technology Sector. 2. There is significant relationship between Innovation & Change and Resilience among employees of Information Technology Sector. 3. There is significant relationship between Customer Service and Resilience among employees of Information Technology Sector. 4. There is significant impact of Resilience on Supervision among employees of Information Technology Sector. 5. There is significant impact of Resilience on Innovation & Change among employees of Information Technology Sector. 6. There is significant impact of Resilience on Customer Service among employees of Information Technology Sector.
RESEARCH METHODOLOGY SAMPLE AND PROCEDURES Indore was always a famous destination for companies of all sectors. During last decade Information technology sector has grown rapidly in Indore. Many new Indore based information technology based enterprises had made their mark not only in India but also outside India. Many talented employees are working in these information technology companies. A convenient random sample of 100 information technology company employees was drawn for present study. Personal interaction and e-mails were used to coordinate with respondents. Out of 100 only 70 complete in all respects and usable questionnaires were received back for analysis. TOOLS FOR DATA COLLECTION RESILIENCE MEASURE For measuring resilience self-designed questionnaire of 6 items was developed and used. Expert views and literature review supported in developing items for scale. Six items of the scale represent Resilience measure of a respondent. The Cronbach’s alpha value of scale has been found as.860, as per literature alpha value of more than.60 is good for measurement. Scale varies from strongly disagree -1 to strongly agree-6. Resiliency measure has shown accepted reliability and validity. SUPERVISION MEASURE Supervision measure was developed using a self-designed questionnaire for the present study. Initially 6 items were drawn from literature review and expert view. Later on the basis of Cronbach’s alpha, it was reduced to 5 item version to meet research needs. The Cronbach’s alpha value of scale has been found as .767. The scale varies from definitely false =1 to definitely true =4. INNOVATION & CHANGE MEASURE A self-designed questionnaire of 8 items was developed to measure innovation & change. Questionnaire was developed with the help of literature review and expert view. The Cronbach alpha coefficient of innovation & change measure was found as approximately.809. Innovation & change measure has shown accepted reliability and validity. The scale varies from definitely false =1 to definitely true =4. CUSTOMER SERVICE MEASURE Customer service measure was measured using a self-designed questionnaire in the study. Customer service scale consists of 5 items was developed with support of literature review and expert views. The Cronbach’s alpha value of scale has been found as.796. The scale varies from definitely false =1 to definitely true =4.
TABLE 1: RELIABILITY STATISTICS OF SCALES
Scale Cronbach's Alpha Cronbach's Alpha Based on Standardized Items N of Items
Resilience 0.86 0.867 6
Supervision 0.767 0.759 5
Innovation & Change 0.809 0.817 8
Customer Service 0.796 0.786 5
STATISTICAL TOOLS USED To access the relationship of supervision, innovation & change, customer service (organizational climate) with resiliency Co-relation analysis was used. In addition, to examine the hypothesized relationships regression analysis was used to access the impact of resiliency on supervision, innovation & change, customer service (organizational climate). RESULTS The participants included 44 males and 28 females, with an average age of 30-40 (n=31) years. Participants also includes above 40 years (n=30) and 20-30 years (n=11). The highest educational degree earned by participants included postgraduates (n = 30), graduates (n =22), and undergraduate (n =20). Participants have monthly income of above 5 Lakhs (n=33), 2-5 Lakhs (n=24) and below 2 Lakhs (n=15). Respondents have an experience of less than 1 year (n=8),1-5 years (n=24),6-10 years (n=26) and more than 10 years (n=4).
TABLE 2: PEARSON COEFFICIENT CORRELATION BETWEEN RESILIENCY AND ORGANIZATIONAL CLIMATE
Resiliency
Supervision
Pearson Correlation .593**
Sig. (2-tailed) .000
N 70
Innovation & Change
Pearson Correlation .387**
Sig. (2-tailed) .001
N 70
Customer Service
Pearson Correlation .156
Sig. (2-tailed) .197
N 70
**. Correlation is significant at the 0.01 level (2-tailed).
VOLUME NO. 7 (2016), ISSUE NO. 08 (AUGUST) ISSN 0976-2183
INTERNATIONAL JOURNAL OF RESEARCH IN COMMERCE & MANAGEMENT A Monthly Double-Blind Peer Reviewed (Refereed/Juried) Open Access International e-Journal - Included in the International Serial Directories
http://ijrcm.org.in/
11
TABLE 3: REGRESSION ANALYSIS - IMPACT OF RESILIENCE ON SUPERVISION Model Summary
Model R R Square Adjusted R Square
Std. Error of the Estimate
Change Statistics
R Square Change F Change df1 df2 Sig. F Change
1 .593a .351 .342 2.270 .351 36.822 1 68 .000
a. Predictors: (Constant), Resiliency
ANOVAa
Model Sum of Squares df Mean Square F Sig.
1 Regres-sion
189.693 1 189.693 36.822 .000b
Resid-ual
350.307 68 5.152
Total 540.000 69
a. Dependent Variable: Supervision
b. Predictors: (Constant), Resiliency
Coefficientsa
Model
Unstandardized Coeffi-cients
Standardized Coefficients
t Sig.
95.0% Confidence Interval for B
B Std. Error Beta Lower Bound
Upper Bound
1
(Con-stant)
7.632 1.244 6.134 .000 5.149 10.114
Resili-ency
.287 .047 .593 6.068 .000 .192 .381
a. Dependent Variable: Supervision
TABLE 4: REGRESSION ANALYSIS - IMPACT OF RESILIENCE ON INNOVATION & CHANGE
Model Summary
Model R R Square Adjusted R Square Std. Error of the Estimate Change Statistics
R Square Change F Change df1 df2 Sig. F Change
1 .387a .150 .137 3.693 .150 11.962 1 68 .001
a. Predictors: (Constant), Resiliency
ANOVAa
Model Sum of Squares df Mean Square F Sig.
1
Regression 163.182 1 163.182 11.962 .001b
Residual 927.618 68 13.641
Total 1090.800 69
a. Dependent Variable: Innovation & Change
b. Predictors: (Constant), Resiliency
Coefficientsa
Model Unstandardized Coefficients Standardized Coefficients
t Sig. 95.0% Confidence Interval for B
B Std. Error Beta Lower Bound Upper Bound
1 (Constant) 17.766 2.025 8.775 .000 13.726 21.806
Resiliency .266 .077 .387 3.459 .001 .112 .419
a. Dependent Variable: Innovation & Change
TABLE 5: REGRESSION ANALYSIS - IMPACT OF RESILIENCE ON CUSTOMER SERVICE
Model Summary
Model R R Square Adjusted R Square
Std. Error of the Esti-mate
Change Statistics
R Square Change
F Change
df1 df2 Sig. F Change
1 .156a .024 .010 3.416 .024 1.699 1 68 .197
a. Predictors: (Constant), Resiliency
ANOVAa
Model Sum of Squares
df Mean Square F Sig.
1
Regres-sion
19.823 1 19.823 1.699 .197b
Residual 793.377 68 11.667
Total 813.200 69
a. Dependent Variable: Customer Service
b. Predictors: (Constant), Resiliency
Coefficientsa
Model Unstandardized Coefficients Standardized Coefficients
t Sig.
95.0% Confidence Interval for B
B Std. Error Beta Lower Bound
Upper Bound
1
(Con-stant)
10.818 1.872 5.778 .000 7.082 14.554
Resili-ency
.093 .071 .156 1.303 .197 -.049 .234
a. Dependent Variable: Customer Service
Resilience is taken as independent variable and supervision, innovation & change and customer service (organizational climate) as dependent variable in the study. Hypothesis 1,2 and 3 focuses on correlation between supervision, innovation & change, customer service (organizational climate) and resilience among employees

VOLUME NO. 7 (2016), ISSUE NO. 08 (AUGUST) ISSN 0976-2183
INTERNATIONAL JOURNAL OF RESEARCH IN COMMERCE & MANAGEMENT A Monthly Double-Blind Peer Reviewed (Refereed/Juried) Open Access International e-Journal - Included in the International Serial Directories
http://ijrcm.org.in/
12
of information technology sector. Result of Pearson correlation coefficient in Table 2 indicate that at the level of 5% error there is significant positive correlation exists between resilience and supervision (r= 0.593), resilience and innovation & change (r= 0.387), but there exists insignificant correlation between resilience and customer service (r= 0.156 at significance value of.197) Thus hypothesis 1 and 2 is accepted while 3 is not accepted and it reveals that resilience shows significant positive relationship with supervision and innovation & change variables of organizational climate but insignificant relationship with customer service among employees information technology companies. Hypothesis 4 focuses on impact of resilience on supervision. For hypothesis testing regression Model was created where resilience as independent variable and supervision as dependent was entered. Model with resilience as independent variable is found significant with R2=.351, F= 36.822, b=.287, t=6.068, p=.000 (Table 3). F statistics has the value of 36.822 at significance of.000 this indicates that model is significant. The t statistics value for resilience is 6.068 at significance level of.000. As p value is less than.005, this indicates that resilience has shown significant impact on supervision. R square values indicate that resilience explained 35.1% of the variance in supervision. Thus as per results Hypothesis 4 is accepted and it shows that resilience puts significant impact on supervision among employees of information technology sector. For hypothesis 5 testing, regression Model was created where resilience as independent variable and innovation & change as dependent was entered. Model was found significant with R2=.150, F= 11.962, b=.266, t=3.459, p=.001 (Table: 4). F statistics has the value of 11.962 at significance of.000 this indicates that model is significant. The t statistics value for resilience is 3.459 at significance level of.000. As p value is less than.005, this indicates that resilience has shown significant impact on innovation & change. R square values indicate that resilience explained 15.0% of the variance in supervision. Thus as per results Hypothesis 5 is accepted and it reveals that resilience puts significant impact on innovation & change among employees of information technology sector. Regression model was created to test hypotheses 6 where resilience as independent variable and customer service as dependent was entered. Model was found insignificant with R2=.024, F= 1.699, b=.093, t=1.303, p=.197 (Table:5). The t statistics value for resilience is 1.303 at significance level of.197. As p value is more than.005, this indicates that resilience has shown insignificant impact on customer service. Thus as per results Hypothesis 6 is not accepted and it depicts that resilience puts insignificant impact on customer service among employees of information technology sector.
DISCUSSION Results of the Table 2 indicate that resilience is significantly correlated with supervision and innovation & change variable of organizational climate while shown insignificant correlation with customer service. This indicates that as resilience increases, it will put positive effects on supervision as well as on innovation & change in information technology sector. This positive relationship indicates advantage of having resilient employees at workplace. Results supports resilience importance and development among employees of information technology sector. This result is in line with Masten, 2001; Masten & Reed, 2002 study that considerable increase in an asset intensity (e.g. promotion, high increment) decreases perceived risk (fear of layoff). So by developing an employee’s personal asset through knowledge, skills, ability or by information, risks could be decreased. Findings from Table 3 and 4 depicts that there is significant impact of resilience on supervision and innovation & change variables of organizational climate. While Table 5 reveals that there is insignificant impact of resilience on customer service. This indicates that employee’s capacity to bounce back from negative experi-ences (resilience) contributes in working effectively within organization. Employees with high level of resilience might contribute in generating positivity within organization as resilience is a positive psychological resource (Luthans, 2002a). But study also indicates that in external relations like customer service resilience has shown insignificant impact. Thus resilience plays important role within organizational functions as compared to external functions. Positive psychological resources contribute effectively in enhancing productivity and well-being of organization and in coming future organizations would leverage this potential for their sustainable competitive advantage. This positive impact of resilience calls for psychological resource development at workplace. Research reports that resilience is state-like in nature and hence could be developed (Luthans & Avolio, 2006). Data for present study was drawn from information technology employees who belongs to widely distributed service sector, thus results indicates importance and role of resilience among service sector employees. Organizational climate is reflection of employee’s perception towards organization and its positive development is crucial for contemporary organizations. As per Srivastava, (2010) Em-ployee’s motivation and behavior get significantly influenced by organizational climate in service industry also. Results revel that employee’s resilience contributes significantly towards supervision as well as towards innovation & change, both are good signals for service sector. Positive impact on supervision might reduce supervision cost as employees with high level of resilience would understand on their own effectively and thus reflecting organization citizenship. Similarly, resilient employees would contribute in innovation and development as reported by results and might again support in cost reduction for organizations. As information and technology industry strives for continuous innovation and new change in such scenario positive contribution of resilience would pave the way for future selection and promotion policies in service sector organizations. Results obtained might be the reflection of aggressive competitiveness ample development op-portunities present widely in service sector and specifically in information technology sector. Study had taken supervision, innovation & change and customer service as variables to represent organizational climate to generate a comprehensive result with generalized implication across wider geographical areas. Result of present study provides wider implications of psychological resources like resilience development at workplace.
RECOMMENDATIONS/SUGGESTIONS 1. Organizations should design new effective selection and placement methods in the light of positive psychological resources importance among workforce. 2. Resilience development training interventions should be implied in service sector organizations. 3. Future research could focus more on external factors of organizational climate like customer service or quality to attain fruitful results. 4. Future research should incorporate more organizational variables to reveal impact of positive psychological resources on organization as a whole.
LIMITATIONS OF THE STUDY 1. Data for present study was drawn from only Indore region and thus results obtained does not depicts a generalized outcome. 2. Lack of context accounting due to time bound. As data was collected only once for the study thus result reflects respondents view at the time of questionnaire
filling only and not other time. While employees work in different situations and impact of their psychological resources varies accordingly. Thus study taken in to account only one-time context.
3. Questionnaire method many times serves for response biasness; our study could also be influenced by it though length of the instrument was kept fair for the same reason.
CONCLUSION Positive psychological resources development has emerged out as an important factor to leverage on in coming future for contemporary organizations. Interven-tion of positive psychology in human resource management since last decade had proved beneficial as well as remarkable. Present study is a contribution towards importance of positive psychological resources in organizations. Study suggests resilient employee’s puts positive impact on supervision and innovation & change variables of organizational climate among service sector employees, but resilience was found to put insignificant impact on customer service. Thus study reports that resilience contributes significantly towards organizational internal functions as compared to external functions. For competitive advantage organizations should focus on Psychological resources like resilience development. Present study supports resilience development for organizational effectiveness.
REFERENCES 1. Avery, G., (2004), “Understanding Leadership” Sage Publications, Cornwall. 2. Damanpour, F. (1991). Organizational Innovation: A Meta-Analysis of Effects of Determinants & Moderators. The Academy of Management Journal, 34(3),
555-590.
VOLUME NO. 7 (2016), ISSUE NO. 08 (AUGUST) ISSN 0976-2183
INTERNATIONAL JOURNAL OF RESEARCH IN COMMERCE & MANAGEMENT A Monthly Double-Blind Peer Reviewed (Refereed/Juried) Open Access International e-Journal - Included in the International Serial Directories
http://ijrcm.org.in/
13
3. Eisenberger, R., Fasolo, P., & Davis-LaMastro, V. (1990). Perceived organizational support and employee diligence, commitment, and innovation. Journal of Applied Psychology, 75, 51– 59.
4. Ferris, G. R., Arthur, M. M., Berkson, H. M., Kaplan, D. M., Harrell-Cook, G., & Frink, D. D. (1998). Toward a social context theory of human resource manage-ment-organizational effectiveness relationship. Human Resource Management Review, 8, 235–264.
5. Graen, G.B., & Scandura, T. (1987). Toward a psychology of dyadic organizing. In: B. Staw & L.L. Cumming (Eds.), Research in Organizational Behavior (Vol. 9, pp. 175-208). Greenwich, CT: JAI Press.
6. Larsen, M, Luthans, F (2006),” Potential Added Value of Psychological Capital in Predicting Work Attitudes”, Journal of Leadership and Organizational Stud-ies,13 (1), 44-61
7. Luthans, F. (2002a). The need for and meaning of positive organizational behavior. Journal of Organizational Behavior, 23, 695-706. 8. Luthans, F., & Youssef, C. M. 2004. Human, social, and now positive psychological capital management: Investing in people for competitive advantage. Or-
ganizational Dynamics, 33: 143–160. 9. Luthans, F., Avolio, B., Walumbwa, F., & Li, W. (2005). The Psychological Capital of Chinese Workers: Exploring the Relationship with Performance. Manage-
ment and Organization Review, 1, 249-271. 10. Luthans, F., Zhu, W., Avolio, B.J. (2006). The impact of efficacy on work attitudes across cultures. Journal of World Business,41 (2),121-132. 11. Masten, A. S. (2001). Ordinary magic: Resilience processes in development. American Psychologist, 56, 227-239. 12. Masten, A. S. 1999. Resilience comes of age: Reflections on the past and outlook for the next generation of research. In M. D. Glants, Johnson, J., & Huffman,
L. (Ed.), Resilience and Development: Positive Life Adaptations (pp. 282-296). New York: Plenum. 13. Masten, A. S., & Reed, M.-G.J. (2002). Resilience in development. In C. R. Snyder & S. Lopez (Eds.), Handbook of positive psychology (pp. 74-88). Oxford. 14. Montes, F.J.L., Moreno, A.R., & Fernandez, L.M.M., (2004). Assessing the organizational climate and contractual relationship for perceptions of support for
innovation. International Journal of Manpower, 25(2). 15. Ostroff C, Kinicki AJ, Tamkins MM. 2003. Organizational culture and climate. In Handbook of Psychology: Industrial and Organizational Psychology, ed. WC
Borman, D R I lgen, RJ Klimoski, vol. 12, pp. 565–93. New York: Wiley.Wiltshire: The Cromwell Press. 16. Patterson, M. G., West, M. A., Shackelton, V. J., Dawson, J. F., Lawthom, R., Maitlis, S., Robinson, D. L., & Wallace, A. M. (2005). Validating the organizational
climate measure: Links to managerial practices, productivity and innovation. Journal of Organizational Behavior, 26, 379-408. 17. Pearce, J., & Randel, A. (2004). Expectations of organizational mobility, workplace social inclusion, and employee job performance. Journal of Organizational
Behavior.Vol.25, issue 1, pp.81-98. 18. Rogg, K.L., Schmidt, D.B., Shull, c., & Schmitt, N., (2001). Human resource Practices, Organizational Climate and, Customer Satisfaction.Journal of Manage-
ment, 27, 431-449. 19. Schneider, B., White, S. S., & Paul, M. C. (1998). Linking service climate and customer perceptions of service quality: test of a causal model. Journal of Applied
Psychology, 83, 462– 469. 20. Schneider, B., Ehrhart, M.G., & Macey, W.A. (2011), “Perspectives on organizational climate and culture”, In Ashkanasy NM, Wilderom CPM, Peterson MF,
eds. 2011, “Handbook of Organizational Culture and Climate.Thousand Oaks”, CA: Sage. 21. Srivastav, A.K. (2010), “Organizational climate: BPO industry”, SCMS Journal of Indian Management, April-June, pp. 25-30. 22. Tugade, M. M., & Fredrickson, B. L. 2004. Resilient individuals use positive emotions to bounce back from negative emotional experiences. Journal of Per-
sonality & Social Psychology, 86(2): 320-333.
VOLUME NO. 7 (2016), ISSUE NO. 08 (AUGUST) ISSN 0976-2183
INTERNATIONAL JOURNAL OF RESEARCH IN COMMERCE & MANAGEMENT A Monthly Double-Blind Peer Reviewed (Refereed/Juried) Open Access International e-Journal - Included in the International Serial Directories
http://ijrcm.org.in/
14
CORPORATE SOCIAL RESPONSIBILITY AND GOVERNANCE
SUMAIYA FATHIMA PRINCIPAL
BET SADATHUNNISA COLLEGE BISMILLAHNAGAR, BENGALURU
ABSTRACT
Corporate governance is the system of rules, practices and processes by which a company is directed and controlled. Corporate governance essentially involves balancing the interests of the many stakeholders in a company - these include its shareholders, management, customers, suppliers, financiers, government and the community. The Corporate Governance framework is to encourage the efficient use of resources and equally to require accountability for the stewardship of those resources, being Socially Responsible means that people and organizations must behave ethically and with sensitivity toward social, cultural, economic and envi-ronmental issues. Striving for social responsibility helps individuals, organizations and governments have a positive impact on development, business and society with a positive contribution to bottom-line results. Corporate social responsibility (‘CSR’) is often associated with hopes for improved corporate governance. As understood conventionally, however, CSR is conceptually incoherent, practically unworkable, and wholly unjustified. To be compatible with corporate governance, ‘CSR’ needs to be understood not as Counterproductive Stakeholder Regimentation, but as Conscientious Stakeholder Responsibility.
KEYWORDS corporate social responsibility business ethics, accountability corporate governance stakeholder regimentation.
INTRODUCTION overnance is an issue that has come to the fore recently as a direct cause of problems associated with the financial and economic crisis. Financial arbitrage, short selling’s, toxic assets, management excessive bonus, golden parachutes and corruption populate our discussions as signs of malfunctions of the market and lack of corporate social responsibility. Some economists tend to justify these as moral hazard, but others argue that the overall significance of
it is largely understated by the mere observation of managerial misbehavior, which forms the tip of the iceberg. The submerged part of the iceberg is the institu-tional response in terms of corporate governance and the consequences of economic liberalization and deregulation of industry and business in an increasing globalized world. This paper will explore how corporate governance based on social responsibilities is becoming both a condition for business survival and a potential competitive advantage.
NEED FOR THE STUDY 1. Corporate governance is of paramount importance to a company and is almost as important as its primary business plan. When executed effectively, it can
prevent corporate scandals, fraud and the civil and criminal liability of the company. It also enhances a company’s image in the public eye as a self-policing company that is responsible and worthy of shareholder and debtholder capital. It dictates the shared philosophy, practices and culture of an organization and its employees. A corporation without a system of corporate governance is often regarded as a body without a soul or conscience. Corporate governance keeps a company honest and out of trouble.
2. Social responsibility is important to a business because it demonstrates to both consumers and the media that the company takes an interest in wider social issues that have no direct impact on profit margins. social responsibility is also recognized as part of a business's foundation, the impact of such endeavors can have life-changing consequences for recipients of aid and, equally, instill a sense of pride in the people who support and work toward its growth. A business can grow with or without social responsibility, but doing good for others allows a business to reap rewards in many ways.
The activities that can be undertaken by a company to fulfil its CSR obligations include eradicating hunger, poverty and malnutrition, promoting preventive healthcare, promoting education and promoting gender equality, setting up homes for women, orphans and the senior citizens, measures for reducing inequalities faced by socially and economically backward groups, ensuring environmental sustainability and ecological balance, animal welfare, protection of national heritage and art and culture, measures for the benefit of armed forces veterans, war widows and their dependents, training to promote rural, nationally recognized, Paralympic or Olympic sports, contribution to the prime minister's national relief fund or any other fund set up by the Central Government for socio economic development and relief and welfare of SC, ST, OBCs, minorities and women, contributions or funds provided to technology incubators located within academic institutions approved by the Central Government and rural development projects. Companies can also collaborate with each other for jointly undertaking CSR activities, provided that each of the companies are able individually report on such projects. A company can build CSR capabilities of its personnel or implementation agencies through institutions with established track records of at least three years, provided that the expenditure for such activities does not exceed 5% of the total CSR expenditure of the company in a single financial year
CORPORATE SOCIAL RESPONSIBILITY IN INDIA Business houses and corporate have been taking up socialwelfare activities from time to time. Recently, priority of business is getting widened from 1 P to 3Ps by inclusion of people and planet with profit. Short-term, charity based welfare interventions are being replaced by long-term- empowerment. While CSR is relevant in business for all societies, it is particularly significant for developing countries like India, where limited resources for meeting the ever growing aspirations and diversity of a pluralistic society. Corporate social responsibility is necessarily an evolving term that does not have a standard definition or a fully recognized set of specific criteria. With the understanding that businesses play a key role on job and wealth creation in society, CSR is generally understood to be the way a company achieves a balance or integration of economic, environmental, and social imperatives while at the same time addressing shareholder and stakeholder expectations, Corporate companies like ITC have made farmer development a vital part of its business strategy, and made major efforts to improve the livelihood standards of rural communities. IT companies like TCS and Wipro have developed software to help teachers and children in schools across India to further the cause of education
CORPORATE GOVERNANCE A company that has good corporate governance has a much higher level of confidence amongst the shareholders associated with that company. Active and independent directors contribute towards a positive outlook of the company in the financial market, positively influencing share prices. Corporate Governance is one of the important criteria for foreign institutional investors to decide on which company to invest in. The corporate practices in India emphasize the functions of audit and finances that have legal, moral and ethical implications for the business and its impact on the shareholders. The Indian Companies Act of 2013 introduced innovative measures to appropriately balance legislative and regulatory reforms for the growth of the enterprise and to increase foreign investment, keeping in mind international practices. The rules and regulations are measures that increase the involvement of the shareholders in decision making and introduce transparency in corporate governance, which ultimately safeguards the interest of the society and share-holders. Corporate governance safeguards not only the management but the interests of the stakeholders as well and fosters the economic progress of India in the roaring economies of the world.
G
VOLUME NO. 7 (2016), ISSUE NO. 08 (AUGUST) ISSN 0976-2183
INTERNATIONAL JOURNAL OF RESEARCH IN COMMERCE & MANAGEMENT A Monthly Double-Blind Peer Reviewed (Refereed/Juried) Open Access International e-Journal - Included in the International Serial Directories
http://ijrcm.org.in/
15
RELATIONSHIP BETWEEN CORPORATE GOVERNANCE AND CSR The conceptualization of CSR was, initially, purely in terms of philanthropy or charity. However, the post-liberalization phase has seen a fundamental shift from this philanthropy-based model of CSR to a stakeholder- participation based model. Furthermore, CSR is gradually getting fused into companies’ Corporate Gov-ernance practices. Both Corporate Governance and CSR focus on the ethical practices in the business and the responsiveness of an organization to its stakeholders and the environment in which it operates. Corporate Governance and CSR results into better image of an organization and directly affects the performance of an organization. The OECD principles on Corporate Governance, UN Global Compact Participation throw light on CSR scheme but in India CSR, by virtue of clause 49 of the listing agreement, have been made totally optional. It is pertinent to mention here that transparency, disclosure, sustainability and ethical behavior is central theme in both CSR and Corporate Governance. Further, it is worthwhile to mention that CSR is based on the concept of self governance which is related to external legal and regulatory mechanism, whereas Corporate Governance is a widest control mechanism within which a company takes it management decisions. Further-more, the objectives and benefits of CSR and Corporate Governance are similar in nature, some of them are stated herein below: Rebuilding of public trust and confidence by increased transparency in its financial as well as non-financial reporting and thereby increasing the shareholder
value. Establishing strong brand reputation of the company. Making substantial improvement in its relationship with various stakeholders. Contributing to the development of the region and the society around its area of operation addressing the concerns of its various stakeholders in a balanced
way so as to maintaining a strong market position. Furthermore, it may be worthwhile to note that in case of unlisted companies there is not robust system of corporate governance, although there are some provisions in the Companies Act, 1956, in this context the relationship between Corporate Governance and CSR is very important and significant. In order to appraise present position of CSR and Corporate Governance, it would be worthwhile to examine the legal and regulatory framework dealing with CSR and Corpo-rate Governance
CONCLUSION For many years, the approach of companies on the role of business in society could be summarized with the following words of Milton Friedman: “there is one and only one social responsibility of business to increase its profits” and “Business of business is business”. However, it may be worthwhile to mention that the world has moved far ahead from the aforesaid words of Milton Friedman, now a day’s Corporate Governance and CSR are integral part of any company. It may be noted that, at present, the provisions of Corporate Governance are mandatory and recommendatory under various provisions discussed hereinabove. However, there is no concrete system for CSR, it is purely optional. Furthermore, since Corporate Governance and CSR is interrelated and complementary to each other, by incorporating CSR provisions within Corporate Governance framework would be beneficial for India.
REFERENCES 1. Naresh Kumar, Shareholders Activism – Healthy Trend for Corporate Governance, Chartered Secretary, 39(8) 2010. 1075-1080. www.nujscfsl.com last ac-
cessed on 25th December 2011. 2. Sudip Mahapatra and Kumar Visalaksh, Emerging Trends In Corporate Social Responsibility: Perspectives And Experiences From Post-Liberalized India, avail-
able at http://www.csrweltweit.de/uploads/tx_jpdownloads/Sudip-3. Emerging_Trends_in_Corporate_Social_Responsibility1.pdf last accessed on 25th De-cember 2011.
3. Uday M. Karnik, CSR – A Challenge for the Corporates, Chartered Secretaries, 39(6) 2009.737-742.
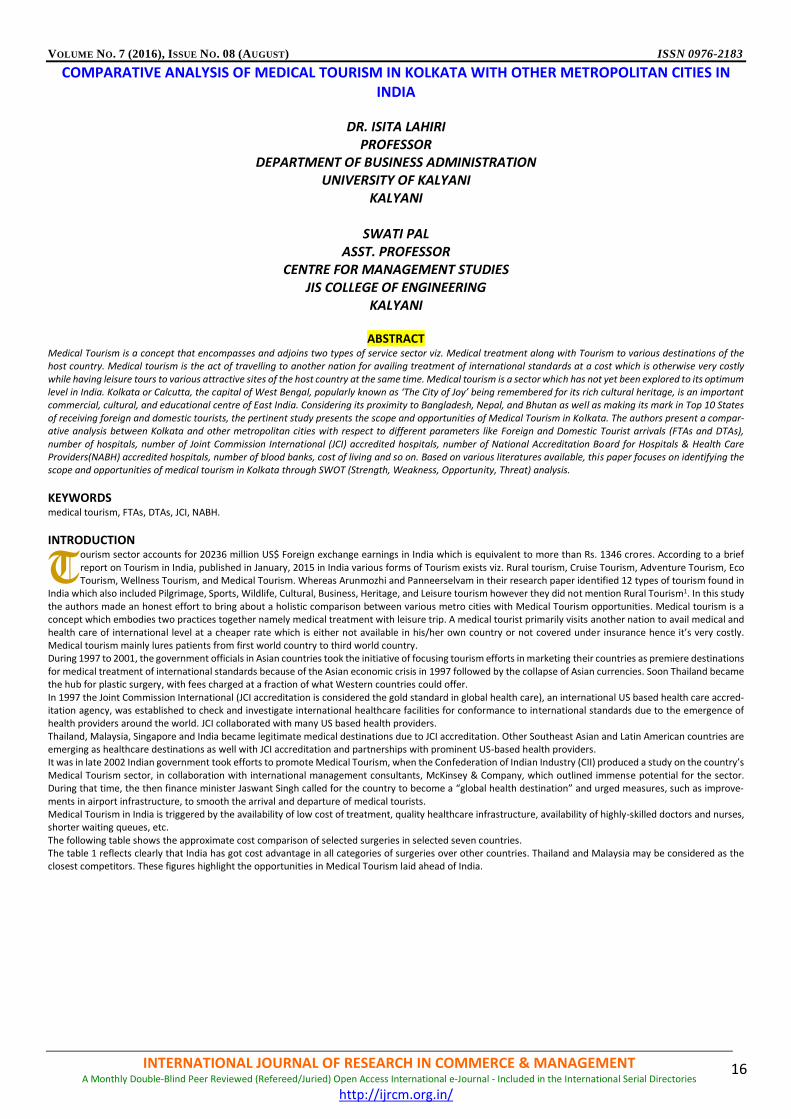
VOLUME NO. 7 (2016), ISSUE NO. 08 (AUGUST) ISSN 0976-2183
INTERNATIONAL JOURNAL OF RESEARCH IN COMMERCE & MANAGEMENT A Monthly Double-Blind Peer Reviewed (Refereed/Juried) Open Access International e-Journal - Included in the International Serial Directories
http://ijrcm.org.in/
16
COMPARATIVE ANALYSIS OF MEDICAL TOURISM IN KOLKATA WITH OTHER METROPOLITAN CITIES IN INDIA
DR. ISITA LAHIRI PROFESSOR
DEPARTMENT OF BUSINESS ADMINISTRATION UNIVERSITY OF KALYANI
KALYANI
SWATI PAL ASST. PROFESSOR
CENTRE FOR MANAGEMENT STUDIES JIS COLLEGE OF ENGINEERING
KALYANI
ABSTRACT Medical Tourism is a concept that encompasses and adjoins two types of service sector viz. Medical treatment along with Tourism to various destinations of the host country. Medical tourism is the act of travelling to another nation for availing treatment of international standards at a cost which is otherwise very costly while having leisure tours to various attractive sites of the host country at the same time. Medical tourism is a sector which has not yet been explored to its optimum level in India. Kolkata or Calcutta, the capital of West Bengal, popularly known as ‘The City of Joy’ being remembered for its rich cultural heritage, is an important commercial, cultural, and educational centre of East India. Considering its proximity to Bangladesh, Nepal, and Bhutan as well as making its mark in Top 10 States of receiving foreign and domestic tourists, the pertinent study presents the scope and opportunities of Medical Tourism in Kolkata. The authors present a compar-ative analysis between Kolkata and other metropolitan cities with respect to different parameters like Foreign and Domestic Tourist arrivals (FTAs and DTAs), number of hospitals, number of Joint Commission International (JCI) accredited hospitals, number of National Accreditation Board for Hospitals & Health Care Providers(NABH) accredited hospitals, number of blood banks, cost of living and so on. Based on various literatures available, this paper focuses on identifying the scope and opportunities of medical tourism in Kolkata through SWOT (Strength, Weakness, Opportunity, Threat) analysis.
KEYWORDS medical tourism, FTAs, DTAs, JCI, NABH.
INTRODUCTION ourism sector accounts for 20236 million US$ Foreign exchange earnings in India which is equivalent to more than Rs. 1346 crores. According to a brief report on Tourism in India, published in January, 2015 in India various forms of Tourism exists viz. Rural tourism, Cruise Tourism, Adventure Tourism, Eco Tourism, Wellness Tourism, and Medical Tourism. Whereas Arunmozhi and Panneerselvam in their research paper identified 12 types of tourism found in
India which also included Pilgrimage, Sports, Wildlife, Cultural, Business, Heritage, and Leisure tourism however they did not mention Rural Tourism1. In this study the authors made an honest effort to bring about a holistic comparison between various metro cities with Medical Tourism opportunities. Medical tourism is a concept which embodies two practices together namely medical treatment with leisure trip. A medical tourist primarily visits another nation to avail medical and health care of international level at a cheaper rate which is either not available in his/her own country or not covered under insurance hence it’s very costly. Medical tourism mainly lures patients from first world country to third world country. During 1997 to 2001, the government officials in Asian countries took the initiative of focusing tourism efforts in marketing their countries as premiere destinations for medical treatment of international standards because of the Asian economic crisis in 1997 followed by the collapse of Asian currencies. Soon Thailand became the hub for plastic surgery, with fees charged at a fraction of what Western countries could offer. In 1997 the Joint Commission International (JCI accreditation is considered the gold standard in global health care), an international US based health care accred-itation agency, was established to check and investigate international healthcare facilities for conformance to international standards due to the emergence of health providers around the world. JCI collaborated with many US based health providers. Thailand, Malaysia, Singapore and India became legitimate medical destinations due to JCI accreditation. Other Southeast Asian and Latin American countries are emerging as healthcare destinations as well with JCI accreditation and partnerships with prominent US-based health providers. It was in late 2002 Indian government took efforts to promote Medical Tourism, when the Confederation of Indian Industry (CII) produced a study on the country’s Medical Tourism sector, in collaboration with international management consultants, McKinsey & Company, which outlined immense potential for the sector. During that time, the then finance minister Jaswant Singh called for the country to become a “global health destination” and urged measures, such as improve-ments in airport infrastructure, to smooth the arrival and departure of medical tourists. Medical Tourism in India is triggered by the availability of low cost of treatment, quality healthcare infrastructure, availability of highly-skilled doctors and nurses, shorter waiting queues, etc. The following table shows the approximate cost comparison of selected surgeries in selected seven countries. The table 1 reflects clearly that India has got cost advantage in all categories of surgeries over other countries. Thailand and Malaysia may be considered as the closest competitors. These figures highlight the opportunities in Medical Tourism laid ahead of India.
T
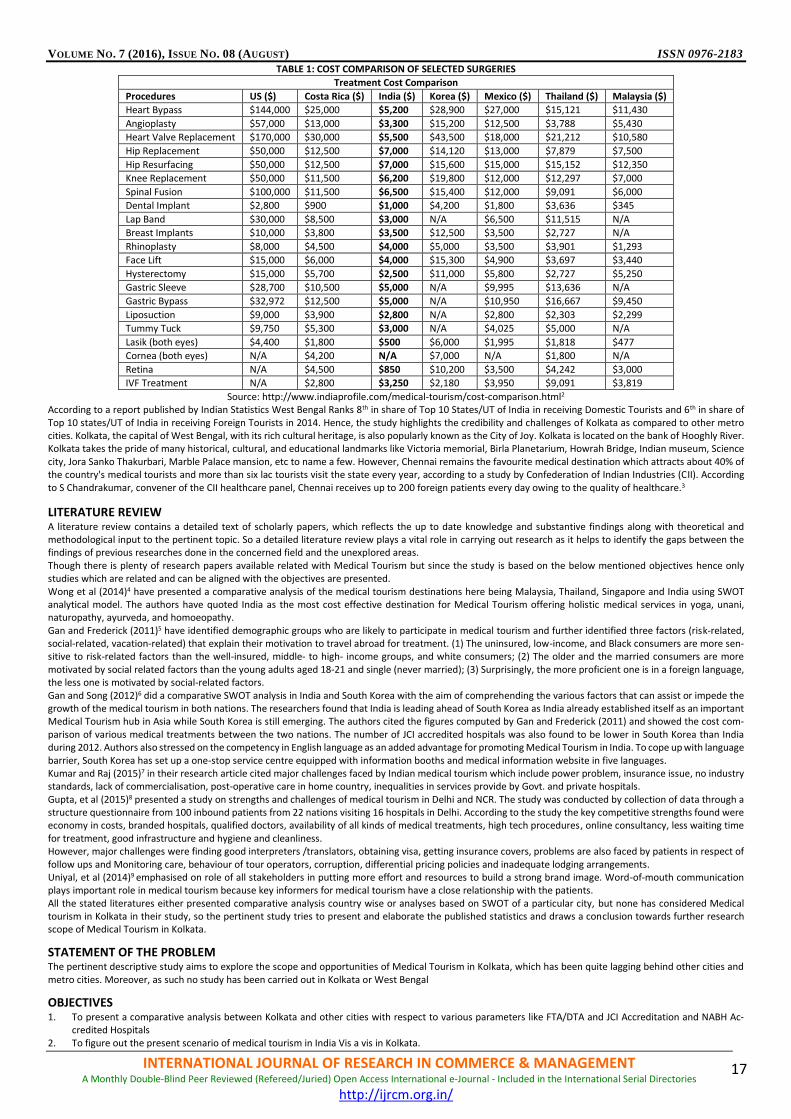
VOLUME NO. 7 (2016), ISSUE NO. 08 (AUGUST) ISSN 0976-2183
INTERNATIONAL JOURNAL OF RESEARCH IN COMMERCE & MANAGEMENT A Monthly Double-Blind Peer Reviewed (Refereed/Juried) Open Access International e-Journal - Included in the International Serial Directories
http://ijrcm.org.in/
17
TABLE 1: COST COMPARISON OF SELECTED SURGERIES
Treatment Cost Comparison
Procedures US ($) Costa Rica ($) India ($) Korea ($) Mexico ($) Thailand ($) Malaysia ($)
Heart Bypass $144,000 $25,000 $5,200 $28,900 $27,000 $15,121 $11,430
Angioplasty $57,000 $13,000 $3,300 $15,200 $12,500 $3,788 $5,430
Heart Valve Replacement $170,000 $30,000 $5,500 $43,500 $18,000 $21,212 $10,580
Hip Replacement $50,000 $12,500 $7,000 $14,120 $13,000 $7,879 $7,500
Hip Resurfacing $50,000 $12,500 $7,000 $15,600 $15,000 $15,152 $12,350
Knee Replacement $50,000 $11,500 $6,200 $19,800 $12,000 $12,297 $7,000
Spinal Fusion $100,000 $11,500 $6,500 $15,400 $12,000 $9,091 $6,000
Dental Implant $2,800 $900 $1,000 $4,200 $1,800 $3,636 $345
Lap Band $30,000 $8,500 $3,000 N/A $6,500 $11,515 N/A
Breast Implants $10,000 $3,800 $3,500 $12,500 $3,500 $2,727 N/A
Rhinoplasty $8,000 $4,500 $4,000 $5,000 $3,500 $3,901 $1,293
Face Lift $15,000 $6,000 $4,000 $15,300 $4,900 $3,697 $3,440
Hysterectomy $15,000 $5,700 $2,500 $11,000 $5,800 $2,727 $5,250
Gastric Sleeve $28,700 $10,500 $5,000 N/A $9,995 $13,636 N/A
Gastric Bypass $32,972 $12,500 $5,000 N/A $10,950 $16,667 $9,450
Liposuction $9,000 $3,900 $2,800 N/A $2,800 $2,303 $2,299
Tummy Tuck $9,750 $5,300 $3,000 N/A $4,025 $5,000 N/A
Lasik (both eyes) $4,400 $1,800 $500 $6,000 $1,995 $1,818 $477
Cornea (both eyes) N/A $4,200 N/A $7,000 N/A $1,800 N/A
Retina N/A $4,500 $850 $10,200 $3,500 $4,242 $3,000
IVF Treatment N/A $2,800 $3,250 $2,180 $3,950 $9,091 $3,819
Source: http://www.indiaprofile.com/medical-tourism/cost-comparison.html2
According to a report published by Indian Statistics West Bengal Ranks 8th in share of Top 10 States/UT of India in receiving Domestic Tourists and 6th in share of Top 10 states/UT of India in receiving Foreign Tourists in 2014. Hence, the study highlights the credibility and challenges of Kolkata as compared to other metro cities. Kolkata, the capital of West Bengal, with its rich cultural heritage, is also popularly known as the City of Joy. Kolkata is located on the bank of Hooghly River. Kolkata takes the pride of many historical, cultural, and educational landmarks like Victoria memorial, Birla Planetarium, Howrah Bridge, Indian museum, Science city, Jora Sanko Thakurbari, Marble Palace mansion, etc to name a few. However, Chennai remains the favourite medical destination which attracts about 40% of the country's medical tourists and more than six lac tourists visit the state every year, according to a study by Confederation of Indian Industries (CII). According to S Chandrakumar, convener of the CII healthcare panel, Chennai receives up to 200 foreign patients every day owing to the quality of healthcare.3
LITERATURE REVIEW A literature review contains a detailed text of scholarly papers, which reflects the up to date knowledge and substantive findings along with theoretical and methodological input to the pertinent topic. So a detailed literature review plays a vital role in carrying out research as it helps to identify the gaps between the findings of previous researches done in the concerned field and the unexplored areas. Though there is plenty of research papers available related with Medical Tourism but since the study is based on the below mentioned objectives hence only studies which are related and can be aligned with the objectives are presented. Wong et al (2014)4 have presented a comparative analysis of the medical tourism destinations here being Malaysia, Thailand, Singapore and India using SWOT analytical model. The authors have quoted India as the most cost effective destination for Medical Tourism offering holistic medical services in yoga, unani, naturopathy, ayurveda, and homoeopathy. Gan and Frederick (2011)5 have identified demographic groups who are likely to participate in medical tourism and further identified three factors (risk-related, social-related, vacation-related) that explain their motivation to travel abroad for treatment. (1) The uninsured, low-income, and Black consumers are more sen-sitive to risk-related factors than the well-insured, middle- to high- income groups, and white consumers; (2) The older and the married consumers are more motivated by social related factors than the young adults aged 18-21 and single (never married); (3) Surprisingly, the more proficient one is in a foreign language, the less one is motivated by social-related factors. Gan and Song (2012)6 did a comparative SWOT analysis in India and South Korea with the aim of comprehending the various factors that can assist or impede the growth of the medical tourism in both nations. The researchers found that India is leading ahead of South Korea as India already established itself as an important Medical Tourism hub in Asia while South Korea is still emerging. The authors cited the figures computed by Gan and Frederick (2011) and showed the cost com-parison of various medical treatments between the two nations. The number of JCI accredited hospitals was also found to be lower in South Korea than India during 2012. Authors also stressed on the competency in English language as an added advantage for promoting Medical Tourism in India. To cope up with language barrier, South Korea has set up a one-stop service centre equipped with information booths and medical information website in five languages. Kumar and Raj (2015)7 in their research article cited major challenges faced by Indian medical tourism which include power problem, insurance issue, no industry standards, lack of commercialisation, post-operative care in home country, inequalities in services provide by Govt. and private hospitals. Gupta, et al (2015)8 presented a study on strengths and challenges of medical tourism in Delhi and NCR. The study was conducted by collection of data through a structure questionnaire from 100 inbound patients from 22 nations visiting 16 hospitals in Delhi. According to the study the key competitive strengths found were economy in costs, branded hospitals, qualified doctors, availability of all kinds of medical treatments, high tech procedures, online consultancy, less waiting time for treatment, good infrastructure and hygiene and cleanliness. However, major challenges were finding good interpreters /translators, obtaining visa, getting insurance covers, problems are also faced by patients in respect of follow ups and Monitoring care, behaviour of tour operators, corruption, differential pricing policies and inadequate lodging arrangements. Uniyal, et al (2014)9 emphasised on role of all stakeholders in putting more effort and resources to build a strong brand image. Word-of-mouth communication plays important role in medical tourism because key informers for medical tourism have a close relationship with the patients. All the stated literatures either presented comparative analysis country wise or analyses based on SWOT of a particular city, but none has considered Medical tourism in Kolkata in their study, so the pertinent study tries to present and elaborate the published statistics and draws a conclusion towards further research scope of Medical Tourism in Kolkata.
STATEMENT OF THE PROBLEM The pertinent descriptive study aims to explore the scope and opportunities of Medical Tourism in Kolkata, which has been quite lagging behind other cities and metro cities. Moreover, as such no study has been carried out in Kolkata or West Bengal
OBJECTIVES 1. To present a comparative analysis between Kolkata and other cities with respect to various parameters like FTA/DTA and JCI Accreditation and NABH Ac-
credited Hospitals 2. To figure out the present scenario of medical tourism in India Vis a vis in Kolkata.
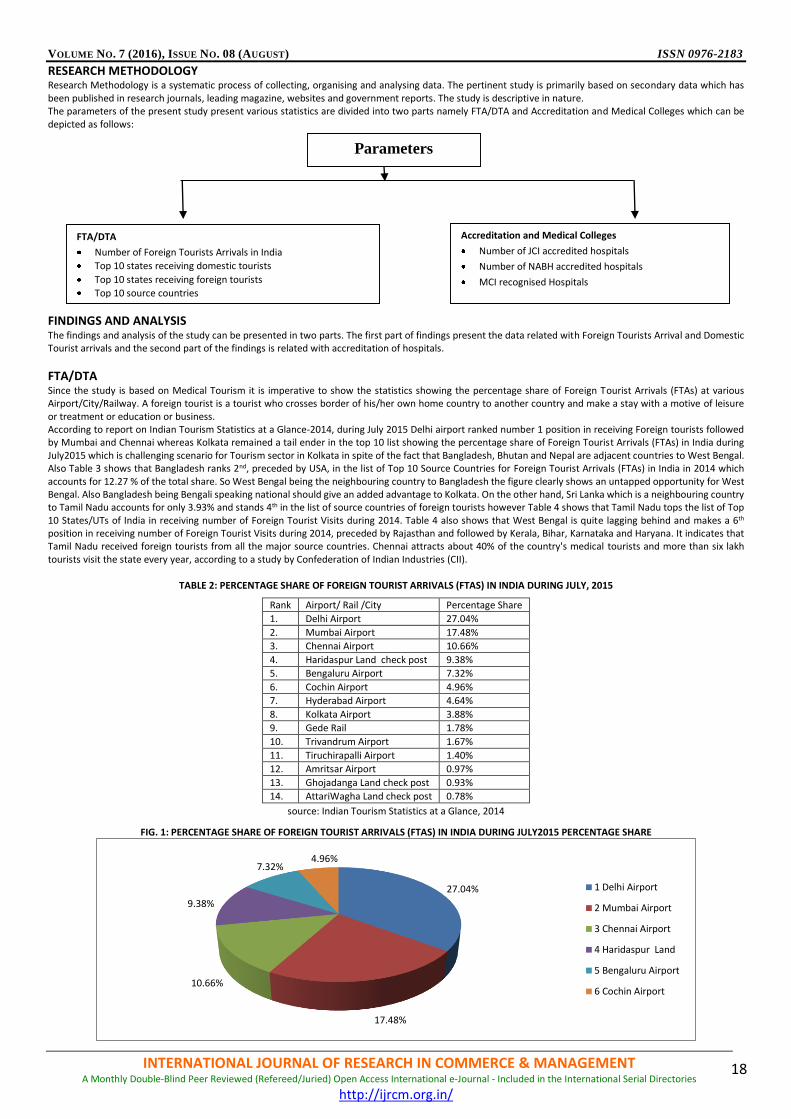
VOLUME NO. 7 (2016), ISSUE NO. 08 (AUGUST) ISSN 0976-2183
INTERNATIONAL JOURNAL OF RESEARCH IN COMMERCE & MANAGEMENT A Monthly Double-Blind Peer Reviewed (Refereed/Juried) Open Access International e-Journal - Included in the International Serial Directories
http://ijrcm.org.in/
18
RESEARCH METHODOLOGY Research Methodology is a systematic process of collecting, organising and analysing data. The pertinent study is primarily based on secondary data which has been published in research journals, leading magazine, websites and government reports. The study is descriptive in nature. The parameters of the present study present various statistics are divided into two parts namely FTA/DTA and Accreditation and Medical Colleges which can be depicted as follows:
FINDINGS AND ANALYSIS The findings and analysis of the study can be presented in two parts. The first part of findings present the data related with Foreign Tourists Arrival and Domestic Tourist arrivals and the second part of the findings is related with accreditation of hospitals.
FTA/DTA Since the study is based on Medical Tourism it is imperative to show the statistics showing the percentage share of Foreign Tourist Arrivals (FTAs) at various Airport/City/Railway. A foreign tourist is a tourist who crosses border of his/her own home country to another country and make a stay with a motive of leisure or treatment or education or business. According to report on Indian Tourism Statistics at a Glance-2014, during July 2015 Delhi airport ranked number 1 position in receiving Foreign tourists followed by Mumbai and Chennai whereas Kolkata remained a tail ender in the top 10 list showing the percentage share of Foreign Tourist Arrivals (FTAs) in India during July2015 which is challenging scenario for Tourism sector in Kolkata in spite of the fact that Bangladesh, Bhutan and Nepal are adjacent countries to West Bengal. Also Table 3 shows that Bangladesh ranks 2nd, preceded by USA, in the list of Top 10 Source Countries for Foreign Tourist Arrivals (FTAs) in India in 2014 which accounts for 12.27 % of the total share. So West Bengal being the neighbouring country to Bangladesh the figure clearly shows an untapped opportunity for West Bengal. Also Bangladesh being Bengali speaking national should give an added advantage to Kolkata. On the other hand, Sri Lanka which is a neighbouring country to Tamil Nadu accounts for only 3.93% and stands 4th in the list of source countries of foreign tourists however Table 4 shows that Tamil Nadu tops the list of Top 10 States/UTs of India in receiving number of Foreign Tourist Visits during 2014. Table 4 also shows that West Bengal is quite lagging behind and makes a 6th position in receiving number of Foreign Tourist Visits during 2014, preceded by Rajasthan and followed by Kerala, Bihar, Karnataka and Haryana. It indicates that Tamil Nadu received foreign tourists from all the major source countries. Chennai attracts about 40% of the country's medical tourists and more than six lakh tourists visit the state every year, according to a study by Confederation of Indian Industries (CII).
TABLE 2: PERCENTAGE SHARE OF FOREIGN TOURIST ARRIVALS (FTAS) IN INDIA DURING JULY, 2015
source: Indian Tourism Statistics at a Glance, 2014
FIG. 1: PERCENTAGE SHARE OF FOREIGN TOURIST ARRIVALS (FTAS) IN INDIA DURING JULY2015 PERCENTAGE SHARE
27.04%
17.48%
10.66%
9.38%
7.32%4.96%
1 Delhi Airport
2 Mumbai Airport
3 Chennai Airport
4 Haridaspur Land
5 Bengaluru Airport
6 Cochin Airport
Rank Airport/ Rail /City Percentage Share
1. Delhi Airport 27.04%
2. Mumbai Airport 17.48%
3. Chennai Airport 10.66%
4. Haridaspur Land check post 9.38%
5. Bengaluru Airport 7.32%
6. Cochin Airport 4.96%
7. Hyderabad Airport 4.64%
8. Kolkata Airport 3.88%
9. Gede Rail 1.78%
10. Trivandrum Airport 1.67%
11. Tiruchirapalli Airport 1.40%
12. Amritsar Airport 0.97%
13. Ghojadanga Land check post 0.93%
14. AttariWagha Land check post 0.78%
Accreditation and Medical Colleges
Number of JCI accredited hospitals
Number of NABH accredited hospitals
MCI recognised Hospitals
Parameters
FTA/DTA
Number of Foreign Tourists Arrivals in India
Top 10 states receiving domestic tourists
Top 10 states receiving foreign tourists
Top 10 source countries

VOLUME NO. 7 (2016), ISSUE NO. 08 (AUGUST) ISSN 0976-2183
INTERNATIONAL JOURNAL OF RESEARCH IN COMMERCE & MANAGEMENT A Monthly Double-Blind Peer Reviewed (Refereed/Juried) Open Access International e-Journal - Included in the International Serial Directories
http://ijrcm.org.in/
19
TABLE 3: TOP 10 SOURCE COUNTRIES FOR FOREIGN TOURIST ARRIVALS (FTAS) IN INDIA IN 2014
Source: Bureau of Immigration, Govt. of India
FIG. 2: PERCENTAGE OF TOP 10 SOURCE COUNTRIES FOR FOREIGN TOURIST ARRIVALS (FTAS) IN INDIA IN 2014
TABLE 4: SHARE OF TOP 10 STATES/UTs OF INDIA IN NUMBER OF FOREIGN TOURIST VISITS - 2014
Rank State/UT Number Percentage Share(%)
1. Tamil Nadu 4657630 20.6
2. Maharashtra 4389098 19.4
3. Uttar Pradesh 2909735 12.9
4. Delhi 2319046 10.3
5. Rajasthan 1525574 6.8
6. West Bengal 1375740 6.1
7. Kerala 923366 4.1
8. Bihar 829508 3.7
9. Karnataka 561870 2.5
10 Haryana 547367 2.4
Total of top 10 States 20038934 88.8
Others 2528716 11.2
Total 22567650 100.0
Source: State/ UT Tourism Departments, Indian Tourism Statistics at a Glance, 2014
FIG. 3: SHARE OF TOP 10 STATES/UTS OF INDIA IN NUMBER OF FOREIGN TOURIST VISITS - 2014 IN PERCENTAGE
Now the following Table 5 represents the share of Top 10 States/UT of Indian in Number of Domestic Tourists Visits till 2014. Domestic Tourists can be referred to those who reside in India and they travel to another state from their home state and make a stay with a motive of leisure or treatment or education or business. The figure shows that Tamil Nadu is leading the list followed by Uttar Pradesh, Karnataka, and Maharashtra. Whereas it is found from the table that West Bengal lies in the bottom of the list making a position of 8th in the list.
14.57
12.27
10.92
3.93
3.513.5
1 United States
2 Bangladesh
3 United Kingdom
4 Sri Lanka
5 Russian Federation
6 Canada
20.6
19.412.9
10.3
6.8
6.1
1 Tamil Nadu
2 Maharashtra
3 Uttar Pradesh
4 Delhi
5 Rajasthan
6 West Bengal
S.No Source Country FTAs (in Million) Percentage (%) Share
1 United States 1118983 14.57
2 Bangladesh 942562 12.27
3 United Kingdom 838860 10.92
4 Sri Lanka 301601 3.93
5 Russian Federation 269832 3.51
6 Canada 268485 3.50
7 Malaysia 262026 3.41
8 France 246101 3.20
9 Australia 239762 3.12
10 Germany 239106 3.11
Total top 10 Countries 4727318 61.56
Others 2951781 38.44
Grand Total 7679099 100.00

VOLUME NO. 7 (2016), ISSUE NO. 08 (AUGUST) ISSN 0976-2183
INTERNATIONAL JOURNAL OF RESEARCH IN COMMERCE & MANAGEMENT A Monthly Double-Blind Peer Reviewed (Refereed/Juried) Open Access International e-Journal - Included in the International Serial Directories
http://ijrcm.org.in/
20
TABLE 5: SHARE OF TOP 10 STATES/UTS OF INDIA IN NUMBER OF DOMESTIC TOURIST VISITS - 2014
Rank State/UT Number Percentage Share (%)
1. Tamil Nadu 327555233 25.6
2. Uttar Pradesh 182820108 14.3
3. Karnataka 118283220 9.2
4. Maharashtra 94127124 7.3
5. Andhra Pradesh 93306974 7.3
6. Telengana 72399113 5.6
7. Madhya Pradesh 63614525 5.0
8. West Bengal 49029590 3.8
9. Jharkhand 33427144 2.6
10 Rajasthan 33076491 2.6
Total of top 10 States 1067639522 83.3
Others 214312733 16.7
Total 1281952255 100.0
Source: State/ UT Tourism Departments, Indian Tourism Statistics at a Glance, 2014
ACCREDITATION Accreditation of hospitals play vital role in pulling patients from foreign nationals because accreditation is important component which ensures patient safety and quality of treatment. In this study the authors have cited JCI and NABH as the two main important bodies which provide accreditations and recognitions to the hospitals in India. JCI is an international body whereas NABH is the national apex body. The statistics provided below present the current status of Kolkata as compared to other cities regarding health care accreditations.
JCI Joint Commission International (JCI) works to improve patient safety and quality of health care in the international community by offering education, publications, advisory services, and international accreditation and certification. In more than 100 countries, JCI partners with hospitals, clinics, and academic medical centres; health systems and agencies; government ministries; academia; and international advocates to promote rigorous standards of care and to provide solutions for achieving peak performance. As per the official website of Joint Commission International (JCI), in India as of now only 23 organisations providing health care services are accredited by JCI spread over 13 cities all over India. Among the 13 cities Mumbai is having the maximum number of JCI accredited hospitals followed by New Delhi, and Bangalore. Chennai, Hyderabad and Gurgaon are in the second position whereas Kolkata is having only one JCI accredited Hospital. This figure is a major issue as far as the growth of medical tourism is concerned.
NABH National Accreditation Board for Hospitals & Healthcare Providers (NABH) is a constituent board of Quality Council of India, set up to establish and operate ac-creditation programme for healthcare organisations. The board is structured to cater to much desired needs of the consumers and to set benchmarks for progress of health industry. The board while being supported by all stakeholders including industry, consumers, government, have full functional autonomy in its operation. New Delhi is the leading city with 46 NABH accredited hospitals followed by Bangalore (26), Mumbai (15), Chennai (12) and Jaipur (9) whereas Kolkata is having only 8 NABH accredited Hospitals and lagging behind with 6th position which may divert medical tourists to other cities. Hence it’s a wakeup call for Government of West Bengal to channelize all the health care facilities towards accreditation and work out for providing quality health care.
TABLE 6: LIST OF NABH ACCREDITED HOSPITALS IN KOLKATA
Sl.no. Name of Hospital
1. B.M. Birla Heart Research Centre
2. Desun Hospital & Heart Institute
3. Rabindranath Tagore International Institute of Cardiac Sciences
4. Medical Super specialty Hospital
5. Fortis Hospitals Limited
6. Peerless Hospitex Hospital & Research centre
7. Ruby General Hospital Limited
8. Bhagirathi Neotia Woman & Child care Centre
Source: Consolidated by authors from http://nabh.co/frmViewAccreditedHosp.aspx Kolkata have many more renowned and premier super speciality hospitals like Wockhardt Hospital & Kidney Institute, Woodlands Hospital, AMRI Hospital, Belle Vue Clinic, Columbia Asia Hospital (Salt Lake), Kothari Medical Centre & Research Institute can be further brought under the umbrella of NABH and JCI accredita-tions.
TABLE 7: RANK WISE STATISTICS OF MEDICAL COLLEGES RECOGNISED BY MEDICAL COUNCIL OF INDIA (MCI)
1. Karnatak 50
2. Maharashtra 48
3. Tamil Nadu 48
4. Uttar Pradesh 36
5. Kerala 30
6. Andhra Pradesh 28
7. Gujarat 21
8. Telangana 20
9. West Bengal 17
10. Madhya Pradesh 14
11. Rajasthan 13
12. Delhi 08
Source: Consolidated by authors from http://www.mciindia.org/InformationDesk/ForStudents/ListofCollegesTeachingMBBS.aspx The Table 7 highlights the present scenario of Medical Colleges in various states which reflects that the South Indian states are the leading producers of MBBS doctors. Maharashtra is in 2nd position having MCI recognised MBBS colleges whereas West Bengal is rather lagging behind which poses strong competition and challenge in providing medical facilities.
VOLUME NO. 7 (2016), ISSUE NO. 08 (AUGUST) ISSN 0976-2183
INTERNATIONAL JOURNAL OF RESEARCH IN COMMERCE & MANAGEMENT A Monthly Double-Blind Peer Reviewed (Refereed/Juried) Open Access International e-Journal - Included in the International Serial Directories
http://ijrcm.org.in/
21
SCOPE FOR FUTURE STUDY The study has discussed various parameters and presented the gap between Kolkata and other cities however there can be few more aspects that might be considered for critically analysing the impediments in the growth of Medical tourism in Kolkata. Cost of living, Safety and security aspects along with recent statistics on cleanest cities under the initiative taken by Government of India ‘Swachh Bharat Mission’ may be few of those factors that are yet to be uncovered. Moreover, number of bed facilities provided by health care organisations and initiatives taken by governments of various cities can be also considered for predicting the growth scenario of Medical Tourism in Kolkata vis a vis in other cities.
CONCLUSION Medical Tourism is still at its infant stage in Kolkata in spite of the fact that Kolkata remained the first capital of India for 150 years under British rule. Kolkata with its rich cultural heritage is still not able to exploit this sector. The biggest opportunities lay in the fact that border of West Bengal touches Bangladesh, Nepal, and Bhutan. Language is not a barrier in West Bengal which is its key strength over Chennai. Moreover, Bangladesh is Bengali speaking national which should give a competitive advantage to Kolkata. The study can be considered a first step in the way of conducting a research in Medical Tourism in Kolkata.
REFERENCES 1. Arunmozhi, T. and Panneerselvam, A. (2013), ‘Types of Tourism in India’, International Journal of Current Research and Academic Review, ISSN: 2347-3215
Volume 1 Number 1 (2013) pp. 84-88 2. http://www.indiaprofile.com/medical-tourism/cost-comparison.html 3. http://timesofindia.indiatimes.com/india/Chennai-remains-favourite-destination-of-medical-tourists/articleshow/19641239.cms 4. Wong, K.M., Velasamy, P., Arshad, T. (2014) SHS Web of Conferences 12, ‘Medical Tourism Destination SWOT Analysis: A Case Study of Malaysia, Thailand,
Singapore and India’ http://www.shs-conferences.org/articles/shsconf/pdf/2014/09/shsconf_4ictr2014_01037.pdf 5. Gan, L.L. and Frederick, J.R. (2011), ‘A Survey of Consumers’ Perceptions toward Medical Tourism (2011 Study’ Southeast Decision Science Institute 42nd
Annual Meeting, Hilton Columbia Center, Columbia, South Carolina, Feb 29-Mar 2, 2012, Electronic copy available at: http://ssrn.com/abstract=2194850 6. Gan, L.L and Song, H. (2012), ‘A SWOT Analysis of Medical Tourism: India and South Korea’ Electronic copy available at: http://ssrn.com/abstract=2194856 7. Kumar, G.S. and Raj, R.K. (2015) ‘Status, Growth and Impact of Medical Tourism in India’ Volume 34, Issue 1, September - October 2015 International Journal
of Pharmaceutical Sciences Review and Research ISSN 0976 – 044X 8. Gupta, et al (2015) ‘Challenges and Strengths of Medical Tourism in Delhi NCR’ vol.1 issue.2 pg 230-251 DU Journal of Undergraduate Research and Innovation
ISSN 2395 – 2334 9. Uniyal, M., Dhodi, R.K., Dhodi, R. and Sharma, S (2014) ‘SWOT Analysis of Indian Medical Tourism Industry’ PARIPEX - INDIAN JOURNAL OF RESEARCH, Volume:
3 | Issue: 2 | Feb 2014, ISSN - 2250-1991 10. http://tourism.nic.in/writereaddata/CMSPagePicture/file/marketresearch/statisticalsurveys/India%20Tourism%20Statis-
tics%20at%20a%20Glance%202014.pdf 11. http://tourism.nic.in/writereaddata/CMSPagePicture/file/marketresearch/statisticalsurveys/India%20Tourism%20Statis-
tics%20at%20a%20Glance%202014.pdf 12. http://www.jointcommissioninternational.org/ 13. http://www.jointcommissioninternational.org/about-jci/jci-accredited-organizations/?c=India&a=Hospital%20Program, retrieved 09/02/16 14. http://nabh.co/introduction.aspx 15. http://nabh.co/frmViewAccreditedHosp.aspx 16. http://www.mciindia.org/InformationDesk/ForStudents/ListofCollegesTeachingMBBS.aspx
VOLUME NO. 7 (2016), ISSUE NO. 08 (AUGUST) ISSN 0976-2183
INTERNATIONAL JOURNAL OF RESEARCH IN COMMERCE & MANAGEMENT A Monthly Double-Blind Peer Reviewed (Refereed/Juried) Open Access International e-Journal - Included in the International Serial Directories
http://ijrcm.org.in/
22
AN EVALUATIVE STUDY ON FINANCIAL PERFORMANCE OF DISTRICT CO-OPERATIVE CENTRAL BANKS IN INDIA
D. VARALAKSHMI RESEARCH SCHOLAR
DEPARTMENT OF COMMERCE & MANAGEMENT STUDIES ANDHRA UNIVERSITY
VISAKHAPATNAM
P. VENKATESHWARLU PROFESSOR
ANDHRA UNIVERSITY VISAKHAPATNAM
ABSTRACT
Co-operation means working together. Co-operative banking is retail and commercial banking is organized on a co-operative basis. Cooperative banking system is a network of financial institutions formed by the voluntary association of members for mutual help. Cooperative banks and credit societies perform mainly banking services within the precisely defined framework of noble principles. Just like commercial banks, they accept all types of deposits and lend loans of different types usually to farmers and rural traders. The present paper attempts to examine the growth of DCCBs in India through selective indicators, it analyzes the Deposits, Credits and C/D Ratios of DCCBs. This paper also studies the growth of investment, working Capital and Cost of Management position in DCCBs. To achieve the objectives of the paper, data has been collected from various secondary sources and analyzed by using various statistical tools.
KEYWORDS District Cooperative Central Banks (DCCBs), deposits, capital, borrowings, credit, investment, reserves, c/d ratio, cost of management, working capital.
INTRODUCTION OF CO-OPERATIVE BANKS ooperative banking system is a network of financial institutions formed by the voluntary association of members for mutual help. Cooperative banks and credit societies perform mainly banking services within the precisely defined framework of noble principles. Just like commercial banks, they accept all types of deposits and lend loans of different types usually to farmers and rural traders. Co-operative banking become an important indispensable compo-
nent in banking sectors of their respective counties and gained considerable share in the market. The co-operative banking structure is a three tier federal one as follows,
A State Co-operative Bank works at the apex level (ie. works at state level).
The Central Co-operative Bank works at the Intermediate Level. (ie. District Co-operative Banks ltd. works at district level)
Primary co-operative credit societies at base level (At village level).
REVIEW OF LITERATURE Singh and Singh (2010), in their study titled, “Technical and Scale Efficiency in District Central Co-operative Banks of Punjab −A Non- Parametric Analysis” attempted to investigate the extent of technical efficiency across 20 DCCBs of Punjab with the help of Data Envelopment Analysis. Dr. Mrs. Ratna and K. Nimbalkar (2011) analyzed on “A Study of NPA's - Reference to Urban Co-Operative Banks” focused on urban co-operative banks facing keen competition with public sector banks and private sector banks, particularly after globalization in 1991. At the same time these banks are facing the problem of Non-Performing Assets also. Tirupathi (2012) in his research paper entitled "Performance Evaluation of DCCBs in India - A Study " examined the growth of DCCBs in India through selective indicators. It analysis the deposits, credits and C/D ratios of DCCBs. The paper also studies the growth of investment, working capital and cost of management position in DCCBs. Soyeliya Usha L. (2013) studied lending practices of cooperative banks in India, by choosing a sample of 200 respondents. She also studied customers level of satisfaction by using questionnaire and also by interviewing the experienced loan officers of the banks.
OBJECTIVES OF THE STUDY To study the growth of DCCBs in India during the period from 2004-05 to 2013-14.
To evaluate the financial performance of DCCBs in India through selective indicators during the period under study.
To understand the working Capital and Cost of Management position of DCCBs in India during the study period.
To examine the growth of investment by DCCBs in India during the study period.
METHODOLOGY OF THE STUDY The study is mainly based on secondary data, which has been gathered from various annual reports of DCCBs, mainly from the last ten years reports. The secondary data is also collected from NABARD, RBI bulletins, Government of India reports and online sources like nafscob.org etc.
SAMPLE OF THE STUDY This paper is an attempt to study the financial performance of the DCCBs. These banks were purposely selected for the study, keeping in view their role and involvement in shaping the economic condition, especially in terms of Number of banks, Branch offices, Membership, Capital, Reserves, Borrowings, Employees, Deposits, Credits, CD Ratios, Working Capital, Cost of Management and Investments.
DATA AND TOOLS For analysis of the data, various statistical tools (Mean, S.D, C.V, Trend analysis etc.,) has been used to arrive at conclusion in a scientific way.
LIMITATIONS OF THE STUDY The present paper studies the average performance of the District Central Cooperative Banks in India only. However, the results may not be proved similar in case of individual bank’s study. The present study considers the performance of DCCBs only 10 years period from 2004-05 to 2013-14.
C
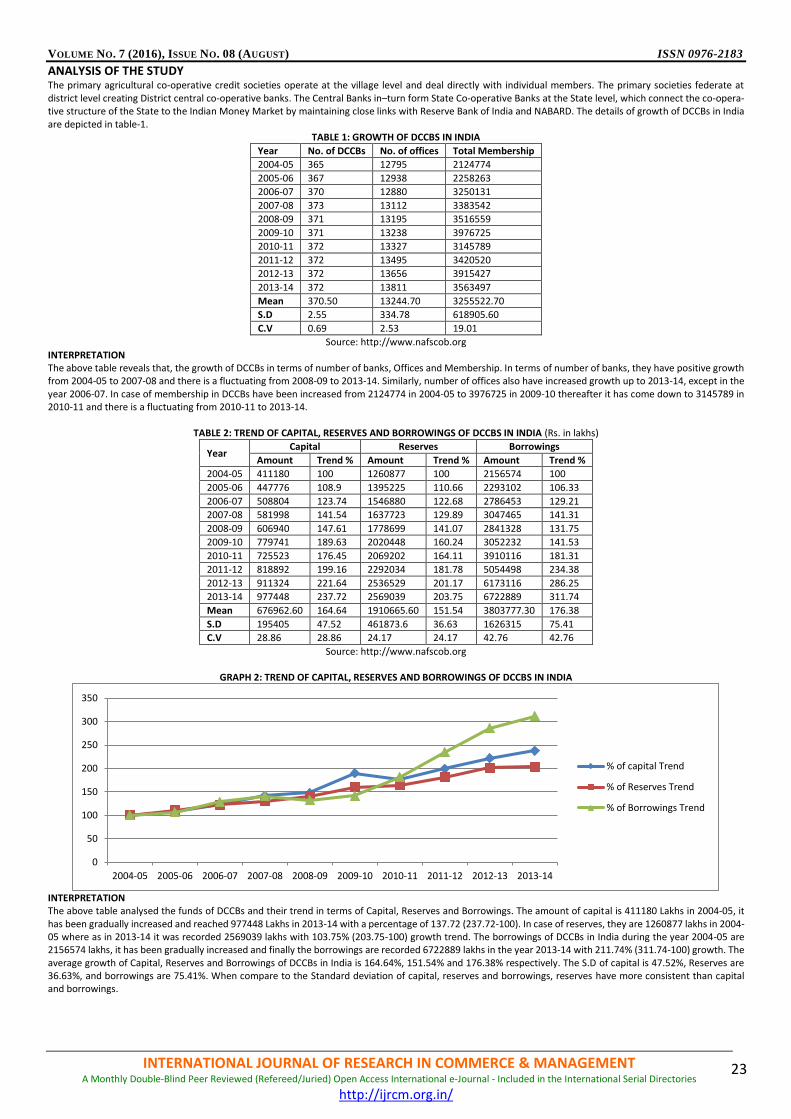
VOLUME NO. 7 (2016), ISSUE NO. 08 (AUGUST) ISSN 0976-2183
INTERNATIONAL JOURNAL OF RESEARCH IN COMMERCE & MANAGEMENT A Monthly Double-Blind Peer Reviewed (Refereed/Juried) Open Access International e-Journal - Included in the International Serial Directories
http://ijrcm.org.in/
23
ANALYSIS OF THE STUDY The primary agricultural co-operative credit societies operate at the village level and deal directly with individual members. The primary societies federate at district level creating District central co-operative banks. The Central Banks in–turn form State Co-operative Banks at the State level, which connect the co-opera-tive structure of the State to the Indian Money Market by maintaining close links with Reserve Bank of India and NABARD. The details of growth of DCCBs in India are depicted in table-1.
TABLE 1: GROWTH OF DCCBS IN INDIA
Year No. of DCCBs No. of offices Total Membership
2004-05 365 12795 2124774
2005-06 367 12938 2258263
2006-07 370 12880 3250131
2007-08 373 13112 3383542
2008-09 371 13195 3516559
2009-10 371 13238 3976725
2010-11 372 13327 3145789
2011-12 372 13495 3420520
2012-13 372 13656 3915427
2013-14 372 13811 3563497
Mean 370.50 13244.70 3255522.70
S.D 2.55 334.78 618905.60
C.V 0.69 2.53 19.01
Source: http://www.nafscob.org INTERPRETATION The above table reveals that, the growth of DCCBs in terms of number of banks, Offices and Membership. In terms of number of banks, they have positive growth from 2004-05 to 2007-08 and there is a fluctuating from 2008-09 to 2013-14. Similarly, number of offices also have increased growth up to 2013-14, except in the year 2006-07. In case of membership in DCCBs have been increased from 2124774 in 2004-05 to 3976725 in 2009-10 thereafter it has come down to 3145789 in 2010-11 and there is a fluctuating from 2010-11 to 2013-14.
TABLE 2: TREND OF CAPITAL, RESERVES AND BORROWINGS OF DCCBS IN INDIA (Rs. in lakhs)
Year Capital Reserves Borrowings
Amount Trend % Amount Trend % Amount Trend %
2004-05 411180 100 1260877 100 2156574 100
2005-06 447776 108.9 1395225 110.66 2293102 106.33
2006-07 508804 123.74 1546880 122.68 2786453 129.21
2007-08 581998 141.54 1637723 129.89 3047465 141.31
2008-09 606940 147.61 1778699 141.07 2841328 131.75
2009-10 779741 189.63 2020448 160.24 3052232 141.53
2010-11 725523 176.45 2069202 164.11 3910116 181.31
2011-12 818892 199.16 2292034 181.78 5054498 234.38
2012-13 911324 221.64 2536529 201.17 6173116 286.25
2013-14 977448 237.72 2569039 203.75 6722889 311.74
Mean 676962.60 164.64 1910665.60 151.54 3803777.30 176.38
S.D 195405 47.52 461873.6 36.63 1626315 75.41
C.V 28.86 28.86 24.17 24.17 42.76 42.76
Source: http://www.nafscob.org
GRAPH 2: TREND OF CAPITAL, RESERVES AND BORROWINGS OF DCCBS IN INDIA
INTERPRETATION The above table analysed the funds of DCCBs and their trend in terms of Capital, Reserves and Borrowings. The amount of capital is 411180 Lakhs in 2004-05, it has been gradually increased and reached 977448 Lakhs in 2013-14 with a percentage of 137.72 (237.72-100). In case of reserves, they are 1260877 lakhs in 2004-05 where as in 2013-14 it was recorded 2569039 lakhs with 103.75% (203.75-100) growth trend. The borrowings of DCCBs in India during the year 2004-05 are 2156574 lakhs, it has been gradually increased and finally the borrowings are recorded 6722889 lakhs in the year 2013-14 with 211.74% (311.74-100) growth. The average growth of Capital, Reserves and Borrowings of DCCBs in India is 164.64%, 151.54% and 176.38% respectively. The S.D of capital is 47.52%, Reserves are 36.63%, and borrowings are 75.41%. When compare to the Standard deviation of capital, reserves and borrowings, reserves have more consistent than capital and borrowings.
0
50
100
150
200
250
300
350
2004-05 2005-06 2006-07 2007-08 2008-09 2009-10 2010-11 2011-12 2012-13 2013-14
% of capital Trend
% of Reserves Trend
% of Borrowings Trend
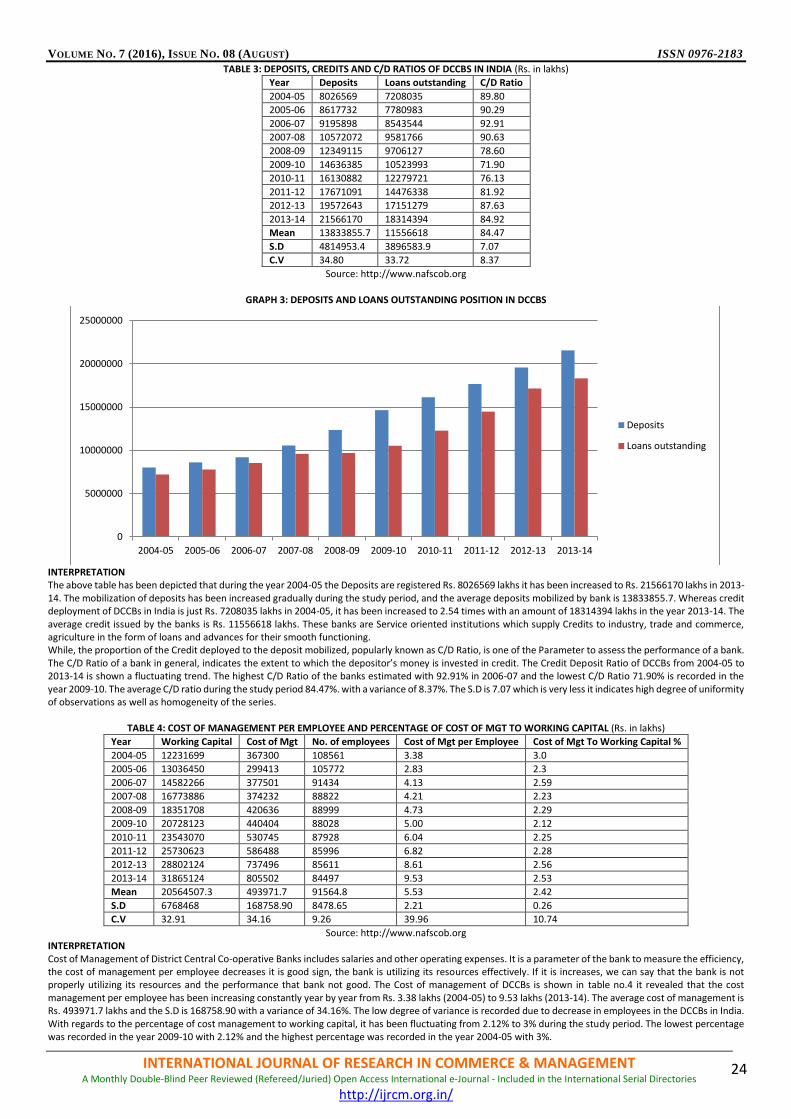
VOLUME NO. 7 (2016), ISSUE NO. 08 (AUGUST) ISSN 0976-2183
INTERNATIONAL JOURNAL OF RESEARCH IN COMMERCE & MANAGEMENT A Monthly Double-Blind Peer Reviewed (Refereed/Juried) Open Access International e-Journal - Included in the International Serial Directories
http://ijrcm.org.in/
24
TABLE 3: DEPOSITS, CREDITS AND C/D RATIOS OF DCCBS IN INDIA (Rs. in lakhs)
Year Deposits Loans outstanding C/D Ratio
2004-05 8026569 7208035 89.80
2005-06 8617732 7780983 90.29
2006-07 9195898 8543544 92.91
2007-08 10572072 9581766 90.63
2008-09 12349115 9706127 78.60
2009-10 14636385 10523993 71.90
2010-11 16130882 12279721 76.13
2011-12 17671091 14476338 81.92
2012-13 19572643 17151279 87.63
2013-14 21566170 18314394 84.92
Mean 13833855.7 11556618 84.47
S.D 4814953.4 3896583.9 7.07
C.V 34.80 33.72 8.37
Source: http://www.nafscob.org
GRAPH 3: DEPOSITS AND LOANS OUTSTANDING POSITION IN DCCBS
INTERPRETATION The above table has been depicted that during the year 2004-05 the Deposits are registered Rs. 8026569 lakhs it has been increased to Rs. 21566170 lakhs in 2013-14. The mobilization of deposits has been increased gradually during the study period, and the average deposits mobilized by bank is 13833855.7. Whereas credit deployment of DCCBs in India is just Rs. 7208035 lakhs in 2004-05, it has been increased to 2.54 times with an amount of 18314394 lakhs in the year 2013-14. The average credit issued by the banks is Rs. 11556618 lakhs. These banks are Service oriented institutions which supply Credits to industry, trade and commerce, agriculture in the form of loans and advances for their smooth functioning. While, the proportion of the Credit deployed to the deposit mobilized, popularly known as C/D Ratio, is one of the Parameter to assess the performance of a bank. The C/D Ratio of a bank in general, indicates the extent to which the depositor’s money is invested in credit. The Credit Deposit Ratio of DCCBs from 2004-05 to 2013-14 is shown a fluctuating trend. The highest C/D Ratio of the banks estimated with 92.91% in 2006-07 and the lowest C/D Ratio 71.90% is recorded in the year 2009-10. The average C/D ratio during the study period 84.47%. with a variance of 8.37%. The S.D is 7.07 which is very less it indicates high degree of uniformity of observations as well as homogeneity of the series.
TABLE 4: COST OF MANAGEMENT PER EMPLOYEE AND PERCENTAGE OF COST OF MGT TO WORKING CAPITAL (Rs. in lakhs)
Year Working Capital Cost of Mgt No. of employees Cost of Mgt per Employee Cost of Mgt To Working Capital %
2004-05 12231699 367300 108561 3.38 3.0
2005-06 13036450 299413 105772 2.83 2.3
2006-07 14582266 377501 91434 4.13 2.59
2007-08 16773886 374232 88822 4.21 2.23
2008-09 18351708 420636 88999 4.73 2.29
2009-10 20728123 440404 88028 5.00 2.12
2010-11 23543070 530745 87928 6.04 2.25
2011-12 25730623 586488 85996 6.82 2.28
2012-13 28802124 737496 85611 8.61 2.56
2013-14 31865124 805502 84497 9.53 2.53
Mean 20564507.3 493971.7 91564.8 5.53 2.42
S.D 6768468 168758.90 8478.65 2.21 0.26
C.V 32.91 34.16 9.26 39.96 10.74
Source: http://www.nafscob.org INTERPRETATION Cost of Management of District Central Co-operative Banks includes salaries and other operating expenses. It is a parameter of the bank to measure the efficiency, the cost of management per employee decreases it is good sign, the bank is utilizing its resources effectively. If it is increases, we can say that the bank is not properly utilizing its resources and the performance that bank not good. The Cost of management of DCCBs is shown in table no.4 it revealed that the cost management per employee has been increasing constantly year by year from Rs. 3.38 lakhs (2004-05) to 9.53 lakhs (2013-14). The average cost of management is Rs. 493971.7 lakhs and the S.D is 168758.90 with a variance of 34.16%. The low degree of variance is recorded due to decrease in employees in the DCCBs in India. With regards to the percentage of cost management to working capital, it has been fluctuating from 2.12% to 3% during the study period. The lowest percentage was recorded in the year 2009-10 with 2.12% and the highest percentage was recorded in the year 2004-05 with 3%.
0
5000000
10000000
15000000
20000000
25000000
2004-05 2005-06 2006-07 2007-08 2008-09 2009-10 2010-11 2011-12 2012-13 2013-14
Deposits
Loans outstanding
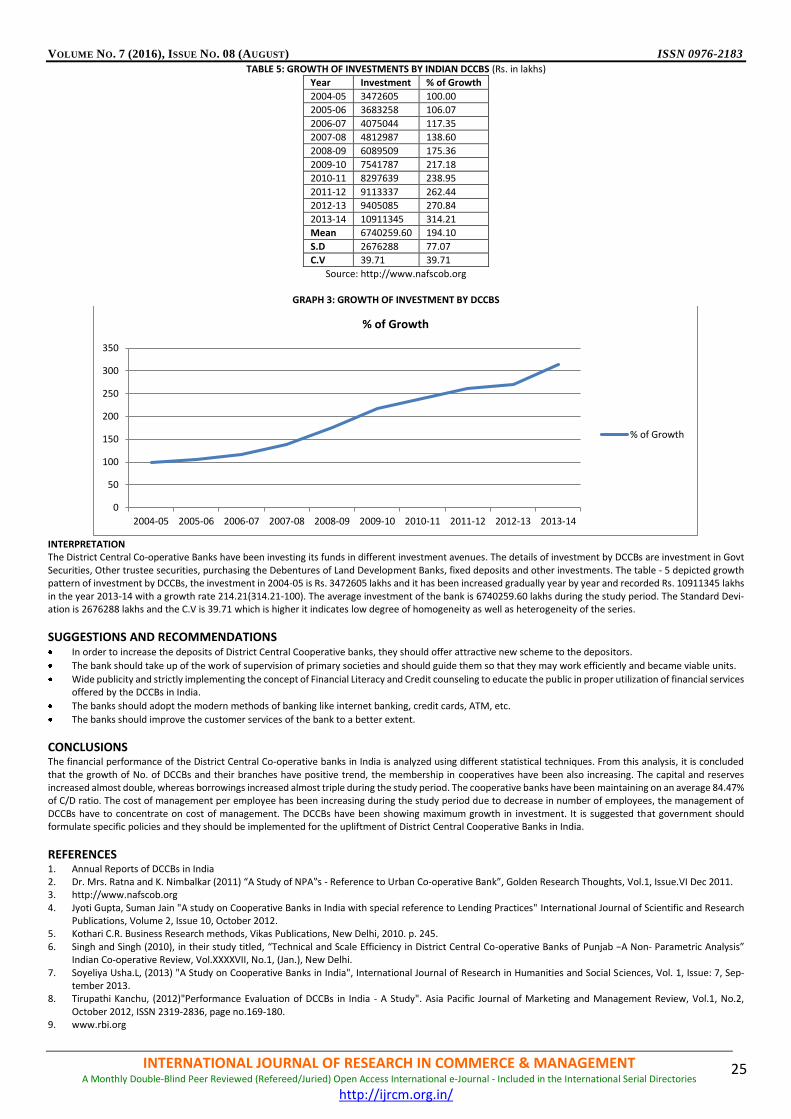
VOLUME NO. 7 (2016), ISSUE NO. 08 (AUGUST) ISSN 0976-2183
INTERNATIONAL JOURNAL OF RESEARCH IN COMMERCE & MANAGEMENT A Monthly Double-Blind Peer Reviewed (Refereed/Juried) Open Access International e-Journal - Included in the International Serial Directories
http://ijrcm.org.in/
25
TABLE 5: GROWTH OF INVESTMENTS BY INDIAN DCCBS (Rs. in lakhs)
Year Investment % of Growth
2004-05 3472605 100.00
2005-06 3683258 106.07
2006-07 4075044 117.35
2007-08 4812987 138.60
2008-09 6089509 175.36
2009-10 7541787 217.18
2010-11 8297639 238.95
2011-12 9113337 262.44
2012-13 9405085 270.84
2013-14 10911345 314.21
Mean 6740259.60 194.10
S.D 2676288 77.07
C.V 39.71 39.71
Source: http://www.nafscob.org
GRAPH 3: GROWTH OF INVESTMENT BY DCCBS
INTERPRETATION The District Central Co-operative Banks have been investing its funds in different investment avenues. The details of investment by DCCBs are investment in Govt Securities, Other trustee securities, purchasing the Debentures of Land Development Banks, fixed deposits and other investments. The table - 5 depicted growth pattern of investment by DCCBs, the investment in 2004-05 is Rs. 3472605 lakhs and it has been increased gradually year by year and recorded Rs. 10911345 lakhs in the year 2013-14 with a growth rate 214.21(314.21-100). The average investment of the bank is 6740259.60 lakhs during the study period. The Standard Devi-ation is 2676288 lakhs and the C.V is 39.71 which is higher it indicates low degree of homogeneity as well as heterogeneity of the series.
SUGGESTIONS AND RECOMMENDATIONS In order to increase the deposits of District Central Cooperative banks, they should offer attractive new scheme to the depositors.
The bank should take up of the work of supervision of primary societies and should guide them so that they may work efficiently and became viable units.
Wide publicity and strictly implementing the concept of Financial Literacy and Credit counseling to educate the public in proper utilization of financial services offered by the DCCBs in India.
The banks should adopt the modern methods of banking like internet banking, credit cards, ATM, etc.
The banks should improve the customer services of the bank to a better extent.
CONCLUSIONS The financial performance of the District Central Co-operative banks in India is analyzed using different statistical techniques. From this analysis, it is concluded that the growth of No. of DCCBs and their branches have positive trend, the membership in cooperatives have been also increasing. The capital and reserves increased almost double, whereas borrowings increased almost triple during the study period. The cooperative banks have been maintaining on an average 84.47% of C/D ratio. The cost of management per employee has been increasing during the study period due to decrease in number of employees, the management of DCCBs have to concentrate on cost of management. The DCCBs have been showing maximum growth in investment. It is suggested that government should formulate specific policies and they should be implemented for the upliftment of District Central Cooperative Banks in India.
REFERENCES 1. Annual Reports of DCCBs in India 2. Dr. Mrs. Ratna and K. Nimbalkar (2011) “A Study of NPA‟s - Reference to Urban Co-operative Bank”, Golden Research Thoughts, Vol.1, Issue.VI Dec 2011. 3. http://www.nafscob.org 4. Jyoti Gupta, Suman Jain "A study on Cooperative Banks in India with special reference to Lending Practices" International Journal of Scientific and Research
Publications, Volume 2, Issue 10, October 2012. 5. Kothari C.R. Business Research methods, Vikas Publications, New Delhi, 2010. p. 245. 6. Singh and Singh (2010), in their study titled, “Technical and Scale Efficiency in District Central Co-operative Banks of Punjab −A Non- Parametric Analysis”
Indian Co-operative Review, Vol.XXXXVII, No.1, (Jan.), New Delhi. 7. Soyeliya Usha.L, (2013) "A Study on Cooperative Banks in India", International Journal of Research in Humanities and Social Sciences, Vol. 1, Issue: 7, Sep-
tember 2013. 8. Tirupathi Kanchu, (2012)"Performance Evaluation of DCCBs in India - A Study". Asia Pacific Journal of Marketing and Management Review, Vol.1, No.2,
October 2012, ISSN 2319-2836, page no.169-180. 9. www.rbi.org
0
50
100
150
200
250
300
350
2004-05 2005-06 2006-07 2007-08 2008-09 2009-10 2010-11 2011-12 2012-13 2013-14
% of Growth
% of Growth

VOLUME NO. 7 (2016), ISSUE NO. 08 (AUGUST) ISSN 0976-2183
INTERNATIONAL JOURNAL OF RESEARCH IN COMMERCE & MANAGEMENT A Monthly Double-Blind Peer Reviewed (Refereed/Juried) Open Access International e-Journal - Included in the International Serial Directories
http://ijrcm.org.in/
26
AN EMPIRICAL STUDY ON TRAINING AND DEVELOPMENT PRACTICES IN REGIONAL RURAL BANKS WITH SPECIAL REFERENCE TO PRATHAMA BANK
JANKI COORDINATOR
GLOBAL INSTITUTE OF PROFESSIONAL EDUCATION MORADABAD
ABSTRACT
Every organization needs to have well trained and experienced people to perform the activities that have to be done. In fact, it is the application of knowledge. It gives an awareness of rules on procedure to guide their behavior & to improve their performance on their current job & prepare for an intend job. In an organization terms, it is intended to equip a person to earn, promotions and hold to greater responsibility. In an organization changing, employee training & development not only an activity that is desirable but also a activity that an organization must committed resources to if it is to maintain a viable and knowledgeable work force. Any training would be considered to be successful only when the knowledge gain by the participants is transferred to the job performance. Training evaluation consists of feedback, Research, Control, Power and intervention. Motivation, Reinforcement & practices are other important factors considered as the principle of Training & Development. In present context Training & Development is a need for a organization because it impart basic knowledge & skills to assist person more effective, to build a line, a competent people, to reduce supervision, Time & to ensure the economic output of the required ability. In short it promotes individual and collective moral, responsibility & Quality improved.
KEYWORDS training & development, employee performance, organization performance.
INTRODUCTION egional Rural Bank’s are local level banking organization operating in different states of India. They have been created with a view to serve primarily the Rural areas of India with basic banking financial services. The area of operating of RRB’s is limited to the area as notified by Govt. of India covering one or more district in the state, However RRB’s may have branches setup for urban operation & their area of operation may include urban areas too.
RRB’s also perform a variety of different functions such as-
Providing Banking facilities to rural & semi urban areas.
Caring out Govt. operations such as disbursement of wages of MGNREGA (Mahatma Gandhi National Rural Employment Guarantee Act-2005) workers, distributions of persons etc.
Providing pera banking facilities, locker facilities, Debit & Credit Cards. The RRB’s were owned by the central Govt. The state govt. & sponsored bank that held ratio in the sale as 50%, 15% and 35% respectively.
PRATHAMA BANK Prathama Bank is the first Regional Rural Bank of India sponsored by syndicate bank established on 2nd oct. 1975, with it Head office at Moradabad in accordance with RRB’s ordinance 1975 issued on 26 sep. 1975 (Replaced later by Regional Rural Bank) Act, 1976 of Govt. of India. The Bank is operating in four District namely Moradabad, Rampur, Amroha and Shambhal district with a network of 401 branches.
TRAINING Training is Act of the increasing the knowledge and skills of an employee for doing a particular job & is a subsystem of the organization because of departments like marketing and sales, H.R., Production & Finance are depending on it for it survive in short Training is the transforming process required some input & in turn it produces in the form of knowledge, skills & attitudes infact training gives an awareness of the rules & procedures the guied their behavior & to improve perfor-mance of employees for current job.
DEVELOPMENT Development is a related process and covered not only those activities which improve job performance but also those which bring about growth of the personality and short, it helps individual in the process towards maturity and actualization of potential capabilities so, that they can become not only good employees but better human beings.
OBJECTIVES OF THE STUDY 1. To increase productivity. 2. To improve quality. 3. To fulfill future personnel needs. 4. To improve organizational climate. 5. To improve health and safety. 6. Personal growth.
SCOPE OF THE STUDY The study will revolve around the below mentioned scope:
Improving the working ability or efficiency of employees.
Focusing on the workers to make them aware regarding the latest technology (up to date Technology).
Bringing about the perfection in the employees work through training and development.
Increasing productivity in the organization.
It will help for growth of the organization and to modulate the strategies in the Organization.
METHODOLOGY Methodology is a way to systematically solve the problem. The present research is based on defining the objective of the study, framing of questionnaire, feedback from the employees, Analysis of feedback data & conclusion, finding & suggestions. The area of study was Moradabad study was done by using primary & secondary data for different purposes. Primary data collected through the questionnaire & observation.
R
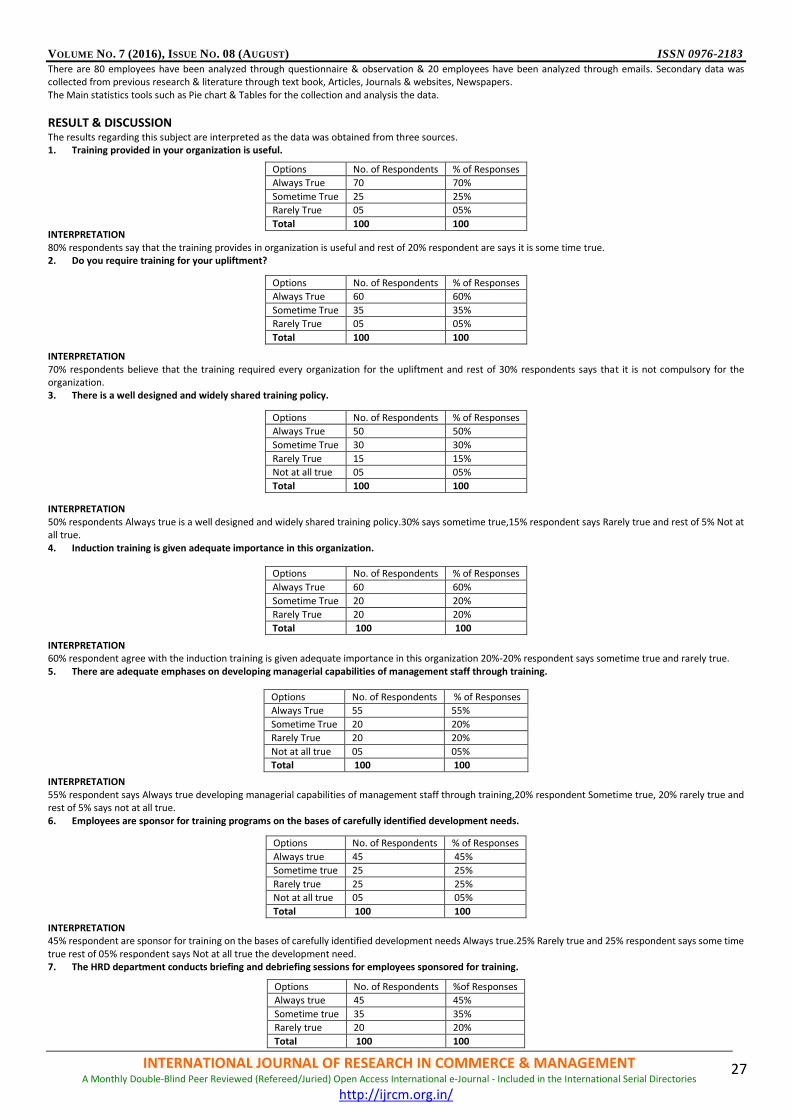
VOLUME NO. 7 (2016), ISSUE NO. 08 (AUGUST) ISSN 0976-2183
INTERNATIONAL JOURNAL OF RESEARCH IN COMMERCE & MANAGEMENT A Monthly Double-Blind Peer Reviewed (Refereed/Juried) Open Access International e-Journal - Included in the International Serial Directories
http://ijrcm.org.in/
27
There are 80 employees have been analyzed through questionnaire & observation & 20 employees have been analyzed through emails. Secondary data was collected from previous research & literature through text book, Articles, Journals & websites, Newspapers. The Main statistics tools such as Pie chart & Tables for the collection and analysis the data.
RESULT & DISCUSSION The results regarding this subject are interpreted as the data was obtained from three sources. 1. Training provided in your organization is useful.
INTERPRETATION 80% respondents say that the training provides in organization is useful and rest of 20% respondent are says it is some time true. 2. Do you require training for your upliftment?
INTERPRETATION 70% respondents believe that the training required every organization for the upliftment and rest of 30% respondents says that it is not compulsory for the organization. 3. There is a well designed and widely shared training policy.
INTERPRETATION 50% respondents Always true is a well designed and widely shared training policy.30% says sometime true,15% respondent says Rarely true and rest of 5% Not at all true. 4. Induction training is given adequate importance in this organization.
INTERPRETATION 60% respondent agree with the induction training is given adequate importance in this organization 20%-20% respondent says sometime true and rarely true. 5. There are adequate emphases on developing managerial capabilities of management staff through training.
INTERPRETATION 55% respondent says Always true developing managerial capabilities of management staff through training,20% respondent Sometime true, 20% rarely true and rest of 5% says not at all true. 6. Employees are sponsor for training programs on the bases of carefully identified development needs.
INTERPRETATION 45% respondent are sponsor for training on the bases of carefully identified development needs Always true.25% Rarely true and 25% respondent says some time true rest of 05% respondent says Not at all true the development need. 7. The HRD department conducts briefing and debriefing sessions for employees sponsored for training.
Options No. of Respondents % of Responses
Always True 70 70%
Sometime True 25 25%
Rarely True 05 05%
Total 100 100
Options No. of Respondents % of Responses
Always True 60 60%
Sometime True 35 35%
Rarely True 05 05%
Total 100 100
Options No. of Respondents % of Responses
Always True 50 50%
Sometime True 30 30%
Rarely True 15 15%
Not at all true 05 05%
Total 100 100
Options No. of Respondents % of Responses
Always True 60 60%
Sometime True 20 20%
Rarely True 20 20%
Total 100 100
Options No. of Respondents % of Responses
Always True 55 55%
Sometime True 20 20%
Rarely True 20 20%
Not at all true 05 05%
Total 100 100
Options No. of Respondents % of Responses
Always true 45 45%
Sometime true 25 25%
Rarely true 25 25%
Not at all true 05 05%
Total 100 100
Options No. of Respondents %of Responses
Always true 45 45%
Sometime true 35 35%
Rarely true 20 20%
Total 100 100
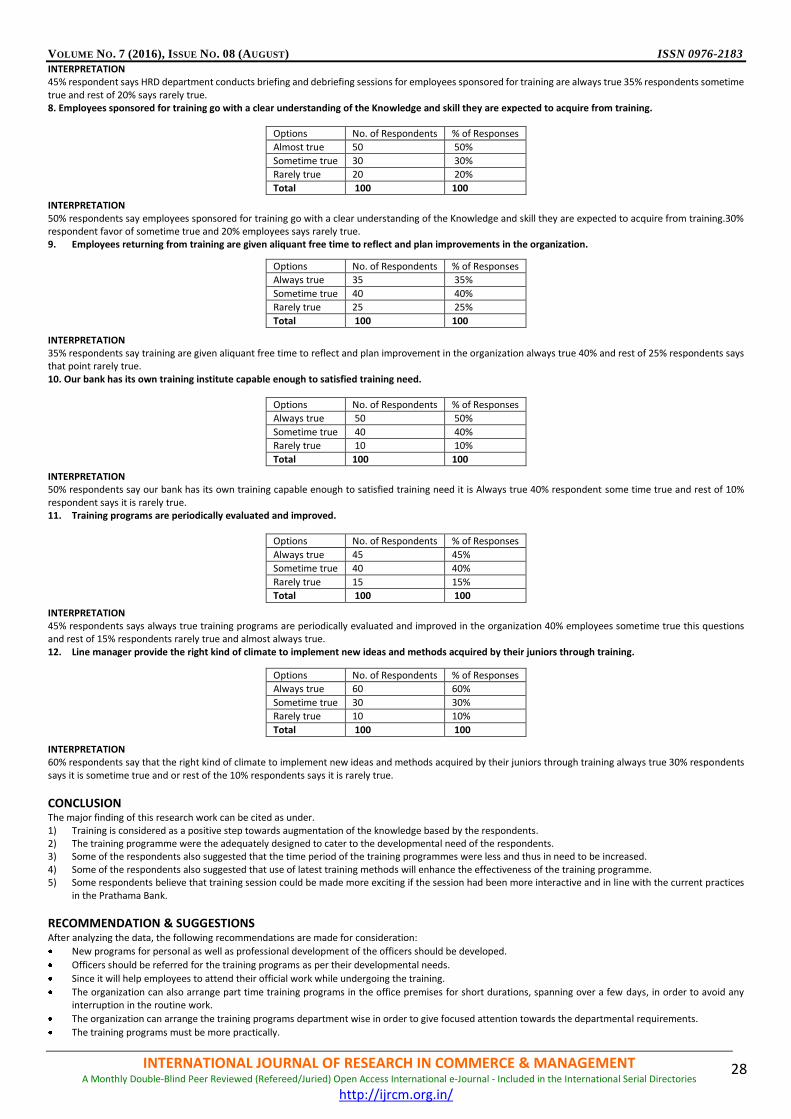
VOLUME NO. 7 (2016), ISSUE NO. 08 (AUGUST) ISSN 0976-2183
INTERNATIONAL JOURNAL OF RESEARCH IN COMMERCE & MANAGEMENT A Monthly Double-Blind Peer Reviewed (Refereed/Juried) Open Access International e-Journal - Included in the International Serial Directories
http://ijrcm.org.in/
28
INTERPRETATION 45% respondent says HRD department conducts briefing and debriefing sessions for employees sponsored for training are always true 35% respondents sometime true and rest of 20% says rarely true. 8. Employees sponsored for training go with a clear understanding of the Knowledge and skill they are expected to acquire from training.
INTERPRETATION 50% respondents say employees sponsored for training go with a clear understanding of the Knowledge and skill they are expected to acquire from training.30% respondent favor of sometime true and 20% employees says rarely true. 9. Employees returning from training are given aliquant free time to reflect and plan improvements in the organization.
INTERPRETATION 35% respondents say training are given aliquant free time to reflect and plan improvement in the organization always true 40% and rest of 25% respondents says that point rarely true. 10. Our bank has its own training institute capable enough to satisfied training need.
INTERPRETATION 50% respondents say our bank has its own training capable enough to satisfied training need it is Always true 40% respondent some time true and rest of 10% respondent says it is rarely true. 11. Training programs are periodically evaluated and improved.
INTERPRETATION 45% respondents says always true training programs are periodically evaluated and improved in the organization 40% employees sometime true this questions and rest of 15% respondents rarely true and almost always true. 12. Line manager provide the right kind of climate to implement new ideas and methods acquired by their juniors through training.
INTERPRETATION 60% respondents say that the right kind of climate to implement new ideas and methods acquired by their juniors through training always true 30% respondents says it is sometime true and or rest of the 10% respondents says it is rarely true.
CONCLUSION The major finding of this research work can be cited as under. 1) Training is considered as a positive step towards augmentation of the knowledge based by the respondents. 2) The training programme were the adequately designed to cater to the developmental need of the respondents. 3) Some of the respondents also suggested that the time period of the training programmes were less and thus in need to be increased. 4) Some of the respondents also suggested that use of latest training methods will enhance the effectiveness of the training programme. 5) Some respondents believe that training session could be made more exciting if the session had been more interactive and in line with the current practices
in the Prathama Bank.
RECOMMENDATION & SUGGESTIONS
After analyzing the data, the following recommendations are made for consideration:
New programs for personal as well as professional development of the officers should be developed.
Officers should be referred for the training programs as per their developmental needs.
Since it will help employees to attend their official work while undergoing the training.
The organization can also arrange part time training programs in the office premises for short durations, spanning over a few days, in order to avoid any interruption in the routine work.
The organization can arrange the training programs department wise in order to give focused attention towards the departmental requirements.
The training programs must be more practically.
Options No. of Respondents % of Responses
Almost true 50 50%
Sometime true 30 30%
Rarely true 20 20%
Total 100 100
Options No. of Respondents % of Responses
Always true 35 35%
Sometime true 40 40%
Rarely true 25 25%
Total 100 100
Options No. of Respondents % of Responses
Always true 50 50%
Sometime true 40 40%
Rarely true 10 10%
Total 100 100
Options No. of Respondents % of Responses
Always true 45 45%
Sometime true 40 40%
Rarely true 15 15%
Total 100 100
Options No. of Respondents % of Responses
Always true 60 60%
Sometime true 30 30%
Rarely true 10 10%
Total 100 100

VOLUME NO. 7 (2016), ISSUE NO. 08 (AUGUST) ISSN 0976-2183
INTERNATIONAL JOURNAL OF RESEARCH IN COMMERCE & MANAGEMENT A Monthly Double-Blind Peer Reviewed (Refereed/Juried) Open Access International e-Journal - Included in the International Serial Directories
http://ijrcm.org.in/
29
To cover all the employees in training programs as some of the employees complained that, they are very rarely called for training sessions.
More training programs must be conducted annually.
REFERENCES 1. Vaishali Chourasia, ‘Human Resource Management in Retail Industry with Reference to Training in Retail in Pmkvy and Up Government Scheme’, International
Journal of Research In Commerce & Management, Volume No. 7 (2016), Issue No. 2 (February), ISSN 0976 - 2183, pp. 15-20. 2. Rashmi S.B & Dr. A. M. Kadakol, ‘A Study on Employees Perspective Towards Training Program’, International Journal of Research In Commerce & Manage-
ment, Volume No. 7 (2016), Issue No. 2 (February), ISSN 0976 - 2183, pp. 24-25. 3. Dr. J. K. Raju & Naveen. G. Naik, ‘Role of Employee Training in Creating a Best Place to Work and Retain the Best Talent in the Organisation’, International
Journal of Research In Commerce, Economics & Management, Volume No. 5 (2015), Issue No. 12 (December), ISSN 2231 – 4245, pp. 33-38. 4. Dr. Itishree Mohanty & Dr. Smruti Ranjan Rath, ‘Training Programme in Practice in the Indian Steel Industry: A Comparative Analysis’, International Journal
of Research In Commerce, IT & Management, Volume No. 5 (2016), Issue No. 2 (February), ISSN 2231-5756, pp. 85-87.

VOLUME NO. 7 (2016), ISSUE NO. 08 (AUGUST) ISSN 0976-2183
INTERNATIONAL JOURNAL OF RESEARCH IN COMMERCE & MANAGEMENT A Monthly Double-Blind Peer Reviewed (Refereed/Juried) Open Access International e-Journal - Included in the International Serial Directories
http://ijrcm.org.in/
30
A STUDY ON CONSUMER BEHAVIOR FOR BRANDED APPARELS IN BANGALORE
SHEETAL MAHENDHER ASST. PROFESSOR
MOUNT CARMEL INSTITUTE OF MANAGEMENT BANGALORE
MARIA BOALER
ASST. PROFESSOR MOUNT CARMEL INSTITUTE OF MANAGEMENT
BANGALORE
ABSTRACT Propelled by steady rise in income levels and greater penetration of organized retail, India’s branded apparel market is expected to grow strongly in the next few years. Branded apparels would grow at a much stronger pace, driven by increased presence of organized retail, rising disposable incomes, changing demographics and increasing brand consciousness[1] . The Indian textiles industry is set for strong growth, buoyed by both strong domestic consumption as well as export demand. The industry is expected to reach US$ 220 billion by 2020. With consumerism and disposable income on the rise, the retail sector has experienced a rapid growth in the past decade with several international players like Marks & Spencer, Guess and Next having entered the Indian market. The organised apparel segment is expected to grow at a compound annual growth rate (CAGR) of more than 13 per cent over a 10-year period [2] . A decade ago, the corresponding percentage would probably have been closer to 25 per cent, in such a scenario a clear understanding of preferences of consumers will help the marketer to attract and maintain their target consumer group [1]. The purpose of this study is to examine Indian consumers buying behavior of branded apparel and deeply understand the key factors of branded clothing which influence consumers’ involvement towards stylish branded clothing. A survey was conducted among general consumers aged between 18-35 to obtain empirical evidence by using questionnaire and statistical techniques.
KEYWORDS brand, consumer, buying behavior.
INTRODUCTION he Indian economy has been witnessing a massive change for the last one decade because of the various dynamics of the business. Particularly the business sectors like share market, retailing, BPO, real estate etc. are growing rapidly. The Indian retailing industry is moving towards the phase of organized retailing from the phase of unorganized retailing. Over the past few years, the retail sales in India are hovering around 33-35 per cent of GDP as compared to around
20 per cent in the US. According to a survey conducted by business consultancy Technopak Advisors, the country’s retail market is expected to touch 620 billion euros by 2020 at a compounded annual growth rate (CAGR) of more than 25 per cent at the same time the competition is also growing within the industry because of the large number of players entering the markets both from national and international levels. These changes in the business environment directly influence the overall lifestyle behavior of the people. The changes in the behavior of consumers in turn have impact on the industry directly or indirectly. In order to attract and retain customers the companies have to come up with various business strategies. To plan a successful business strategy, it is very much necessary to understand the factual changing patterns of the consumer behaviour. The apparel and clothing industry being positioned at first place and also the spending on apparel and clothing among the customers are getting increased, it is very important to study the changing behavior of consumers[3]. The purpose of this study is to expand the knowledge of buying behavior of branded apparel of consumers and in a practical sense understanding factors which influence buying behavior of branded apparel.
INDIAN CONSUMER PROFILE The generation next customers (between ages 18 – 35) as a market segment are of immense importance in India in terms of both magnitude and spending capacity. The census fig. for 2001 shows that 54% of the population i.e. 540 million is below the age of 25 and 45% below the 19 years. The median age of an average Indian is about 25 years i.e. 100 million and will have about 325 million people in the 25 – 35 age group by 2020 ( Sinha, 2004). The size of the population is an important determinant of demand for many products and services. Out of the total population of 1027 million about 742 million live in rural areas and 285 million in urban areas (census 2001). By 2015 the share of organized retail market in India as per population projections is as follows: Metros and mini-metros 20% Top cities (pop: > 1m) 8% Large cities (Pop: 0.5 – 1m)3% Rest of India (towns & villages)69% (Source: NCAER, CSSO, TSMG analysis)[3]
TABLE 1
T
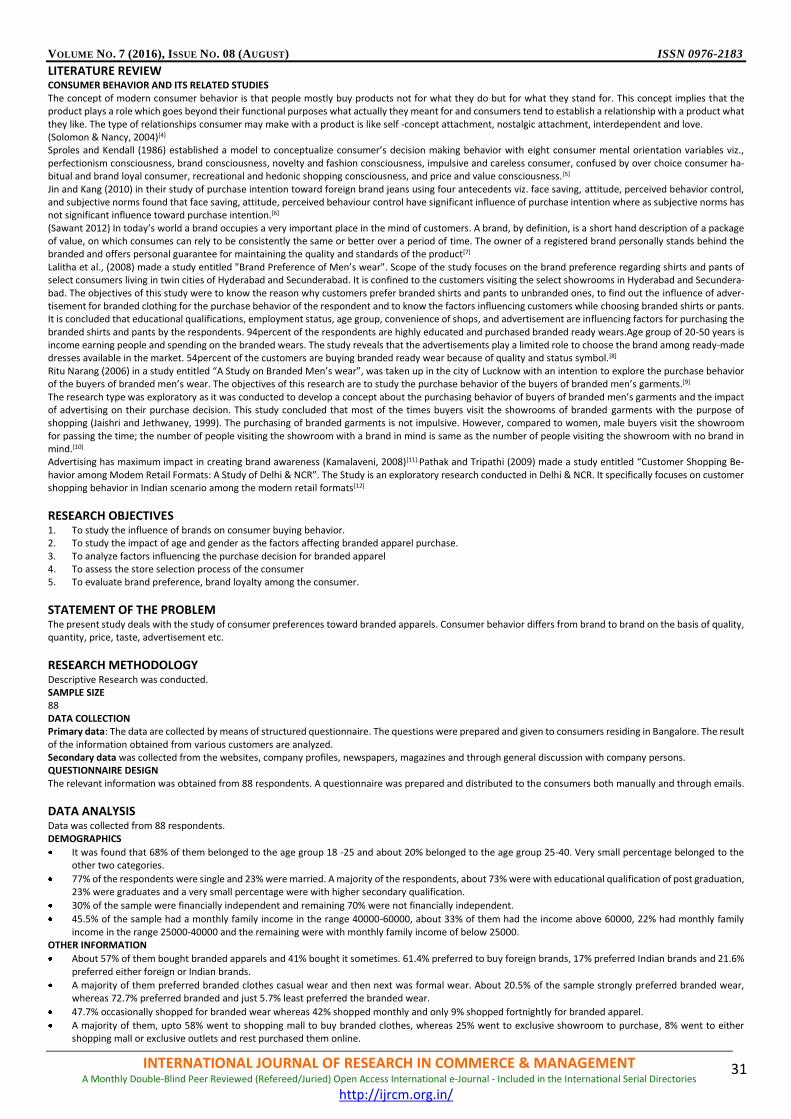
VOLUME NO. 7 (2016), ISSUE NO. 08 (AUGUST) ISSN 0976-2183
INTERNATIONAL JOURNAL OF RESEARCH IN COMMERCE & MANAGEMENT A Monthly Double-Blind Peer Reviewed (Refereed/Juried) Open Access International e-Journal - Included in the International Serial Directories
http://ijrcm.org.in/
31
LITERATURE REVIEW CONSUMER BEHAVIOR AND ITS RELATED STUDIES The concept of modern consumer behavior is that people mostly buy products not for what they do but for what they stand for. This concept implies that the product plays a role which goes beyond their functional purposes what actually they meant for and consumers tend to establish a relationship with a product what they like. The type of relationships consumer may make with a product is like self -concept attachment, nostalgic attachment, interdependent and love. (Solomon & Nancy, 2004)[4] Sproles and Kendall (1986) established a model to conceptualize consumer’s decision making behavior with eight consumer mental orientation variables viz., perfectionism consciousness, brand consciousness, novelty and fashion consciousness, impulsive and careless consumer, confused by over choice consumer ha-bitual and brand loyal consumer, recreational and hedonic shopping consciousness, and price and value consciousness.[5]
Jin and Kang (2010) in their study of purchase intention toward foreign brand jeans using four antecedents viz. face saving, attitude, perceived behavior control, and subjective norms found that face saving, attitude, perceived behaviour control have significant influence of purchase intention where as subjective norms has not significant influence toward purchase intention.[6] (Sawant 2012) In today’s world a brand occupies a very important place in the mind of customers. A brand, by definition, is a short hand description of a package of value, on which consumes can rely to be consistently the same or better over a period of time. The owner of a registered brand personally stands behind the branded and offers personal guarantee for maintaining the quality and standards of the product[7] Lalitha et al., (2008) made a study entitled "Brand Preference of Men’s wear". Scope of the study focuses on the brand preference regarding shirts and pants of select consumers living in twin cities of Hyderabad and Secunderabad. It is confined to the customers visiting the select showrooms in Hyderabad and Secundera-bad. The objectives of this study were to know the reason why customers prefer branded shirts and pants to unbranded ones, to find out the influence of adver-tisement for branded clothing for the purchase behavior of the respondent and to know the factors influencing customers while choosing branded shirts or pants. It is concluded that educational qualifications, employment status, age group, convenience of shops, and advertisement are influencing factors for purchasing the branded shirts and pants by the respondents. 94percent of the respondents are highly educated and purchased branded ready wears.Age group of 20-50 years is income earning people and spending on the branded wears. The study reveals that the advertisements play a limited role to choose the brand among ready-made dresses available in the market. 54percent of the customers are buying branded ready wear because of quality and status symbol.[8]
Ritu Narang (2006) in a study entitled “A Study on Branded Men’s wear”, was taken up in the city of Lucknow with an intention to explore the purchase behavior of the buyers of branded men’s wear. The objectives of this research are to study the purchase behavior of the buyers of branded men’s garments.[9] The research type was exploratory as it was conducted to develop a concept about the purchasing behavior of buyers of branded men’s garments and the impact of advertising on their purchase decision. This study concluded that most of the times buyers visit the showrooms of branded garments with the purpose of shopping (Jaishri and Jethwaney, 1999). The purchasing of branded garments is not impulsive. However, compared to women, male buyers visit the showroom for passing the time; the number of people visiting the showroom with a brand in mind is same as the number of people visiting the showroom with no brand in mind.[10] Advertising has maximum impact in creating brand awareness (Kamalaveni, 2008)[11].Pathak and Tripathi (2009) made a study entitled “Customer Shopping Be-havior among Modem Retail Formats: A Study of Delhi & NCR”. The Study is an exploratory research conducted in Delhi & NCR. It specifically focuses on customer shopping behavior in Indian scenario among the modern retail formats[12]
RESEARCH OBJECTIVES 1. To study the influence of brands on consumer buying behavior. 2. To study the impact of age and gender as the factors affecting branded apparel purchase. 3. To analyze factors influencing the purchase decision for branded apparel 4. To assess the store selection process of the consumer 5. To evaluate brand preference, brand loyalty among the consumer.
STATEMENT OF THE PROBLEM The present study deals with the study of consumer preferences toward branded apparels. Consumer behavior differs from brand to brand on the basis of quality, quantity, price, taste, advertisement etc.
RESEARCH METHODOLOGY
Descriptive Research was conducted. SAMPLE SIZE 88 DATA COLLECTION Primary data: The data are collected by means of structured questionnaire. The questions were prepared and given to consumers residing in Bangalore. The result of the information obtained from various customers are analyzed. Secondary data was collected from the websites, company profiles, newspapers, magazines and through general discussion with company persons. QUESTIONNAIRE DESIGN The relevant information was obtained from 88 respondents. A questionnaire was prepared and distributed to the consumers both manually and through emails.
DATA ANALYSIS Data was collected from 88 respondents. DEMOGRAPHICS
It was found that 68% of them belonged to the age group 18 -25 and about 20% belonged to the age group 25-40. Very small percentage belonged to the other two categories.
77% of the respondents were single and 23% were married. A majority of the respondents, about 73% were with educational qualification of post graduation, 23% were graduates and a very small percentage were with higher secondary qualification.
30% of the sample were financially independent and remaining 70% were not financially independent.
45.5% of the sample had a monthly family income in the range 40000-60000, about 33% of them had the income above 60000, 22% had monthly family income in the range 25000-40000 and the remaining were with monthly family income of below 25000.
OTHER INFORMATION
About 57% of them bought branded apparels and 41% bought it sometimes. 61.4% preferred to buy foreign brands, 17% preferred Indian brands and 21.6% preferred either foreign or Indian brands.
A majority of them preferred branded clothes casual wear and then next was formal wear. About 20.5% of the sample strongly preferred branded wear, whereas 72.7% preferred branded and just 5.7% least preferred the branded wear.
47.7% occasionally shopped for branded wear whereas 42% shopped monthly and only 9% shopped fortnightly for branded apparel.
A majority of them, upto 58% went to shopping mall to buy branded clothes, whereas 25% went to exclusive showroom to purchase, 8% went to either shopping mall or exclusive outlets and rest purchased them online.

VOLUME NO. 7 (2016), ISSUE NO. 08 (AUGUST) ISSN 0976-2183
INTERNATIONAL JOURNAL OF RESEARCH IN COMMERCE & MANAGEMENT A Monthly Double-Blind Peer Reviewed (Refereed/Juried) Open Access International e-Journal - Included in the International Serial Directories
http://ijrcm.org.in/
32
There were various criteria based on which people chose various brands. To name a few Product Quality, Design, Brand name, promotion and price.
37.5% of them bought branded apparel on special occasions, 30.7% bought it during end of season sale, and the rest bought during festival or end of season sale or special occasion.
The various sources of information on various brands for apparel were from advertisements, past experience, peer and family, online and store executive.
6.8% of them strongly agree that they wear only branded clothes, 26.1% agree that they wear only branded clothes and 65.9% are neutral that they wear only branded clothes. 1.1% is invalid data.
53.4% agree that brand name is important for them when they go shopping, 39,8% are neutral about the importance of brand name and 5.7% strongly agree that brand name is important for them when they go shopping. 1.1% is invalid data.
11.4% believe that the brand enhances their status, 39.8% are neutral that the brand enhances their status whereas the rest disagree about it.
3.4% strongly agree that brand reflects latest fashion, 20.5% agree that it reflects latest fashion, 47.7% are neutral about it and 28.4% disagree that brand reflects latest fashion.
14.8% agree that brand enhances their confidence, 35.2% are neutral about it and 48.9% disagree that brand enhances confidence in them.
56.8% disagree that brand speaks about their attitude, 35.2% are neutral about it and 6.8% agree that brand speaks about their attitude.
1. Relationship between Age and buying branded apparel
Correlations
1. Age 6. Do you buy branded Apparel?
Spearman's rho
1. Age
Correlation Coefficient 1.000 -.027
Sig. (2-tailed) . .808
N 86 85
6. Do you buy branded Apparel?
Correlation Coefficient -.027 1.000
Sig. (2-tailed) .808 .
N 85 87
This clearly shows that there is no relationship between age and buying branded apparel. The sig value is >.05 and we accept null hypothesis. 2. Relationship between marital status and buying branded apparel
Crosstab
Count
6. Do you buy branded Apparel? Total
1 2 3
2. Marital Status 1 40 0 27 67
2 10 1 9 20
Total 50 1 36 87
Chi-Square Tests
Value df Asymp. Sig. (2-sided)
Pearson Chi-Square 3.685a 2 .158
Likelihood Ratio 3.282 2 .194
Linear-by-Linear Association .328 1 .567
N of Valid Cases 87
a. 2 cells (33.3%) have expected count less than 5. The minimum expected count is .23.
We can see the sig value >.05, and hence we accept the null hypothesis that marital status has no influence on buying branded apparel. 3. Relationship between educational qualification and buying branded apparel
Crosstab
Count
6. Do you buy branded Apparel? Total
1 2 3
3. Educational Qualification
2 0 0 3 3
3 10 1 9 20
4 40 0 23 63
Total 50 1 35 86
Chi-Square Tests
Value df Asymp. Sig. (2-sided)
Pearson Chi-Square 8.538a 4 .074
Likelihood Ratio 9.152 4 .057
Linear-by-Linear Association 3.886 1 .049
N of Valid Cases 86
a. 5 cells (55.6%) have expected count less than 5. The minimum expected count is .03.
There is slight indication of buying branded apparel depending on educational qualification and this is due to that small category of sample which belongs to higher secondary. That apart it shows clearly that there is no relationship between educational qualification and buying branded apparel.

VOLUME NO. 7 (2016), ISSUE NO. 08 (AUGUST) ISSN 0976-2183
INTERNATIONAL JOURNAL OF RESEARCH IN COMMERCE & MANAGEMENT A Monthly Double-Blind Peer Reviewed (Refereed/Juried) Open Access International e-Journal - Included in the International Serial Directories
http://ijrcm.org.in/
33
4. Financially independent and buying branded apparel
Crosstab
Count
6. Do you buy branded Apparel? Total
1 2 3
4. Are you financially independent 1 15 1 10 26
2 34 0 26 60
Total 49 1 36 86
Chi-Square Tests
Value df Asymp. Sig. (2-sided)
Pearson Chi-Square 2.414a 2 .299
Likelihood Ratio 2.500 2 .286
Linear-by-Linear Association .065 1 .799
N of Valid Cases 86
a. 2 cells (33.3%) have expected count less than 5. The minimum expected count is .30.
Since the sig value >.05, we accept the null hypothesis that there is no relationship between financial independence and buying branded apparel. 5. Monthly family income and buying branded apparel
Crosstab
Count
6. Do you buy branded Apparel? Total
1 2 3
5. Monthly Family Income
1 1 0 2 3
2 9 0 6 15
3 21 1 17 39
4 18 0 11 29
Total 49 1 36 86
Symmetric Measures
Value Asymp. Std. Errora Approx. Tb Approx. Sig.
Interval by Interval Pearson's R -.071 .108 -.650 .518c
Ordinal by Ordinal Spearman Correlation -.063 .108 -.576 .566c
N of Valid Cases 86
a. Not assuming the null hypothesis.
b. Using the asymptotic standard error assuming the null hypothesis.
c. Based on normal approximation.
The sig value >.05 and hence we accept null hypothesis that there is no relationship between monthly family income and buying branded apparel. 6. Monthly family income and frequency to shop for branded clothes
Here we see sig value <.05, and hence reject the null hypothesis and we can say that the monthly family income has an influence on the frequency of buying branded clothes. 7. Monthly income and degree of preference of branded clothes.
Paired Samples Test
Paired Differences t df Sig. (2-tailed) Mean Std. Devia-
tion Std. Error Mean
95% Confidence Interval of the Difference
Lower Upper
Pair 1
5. Monthly Family Income - 10. What is the degree of prefer-ence of branded clothes?
1.309 .944 .105 1.100 1.517 12.477 80 .000
The above is the result of paired T test and shows sig value <.05, hence we reject the null hypothesis and accept that there is an influence of monthly family income on the degree of preference of branded clothes. REGRESSION MODEL
1. Coefficientsa
Model Unstandardized Coefficients Standardized Coefficients t Sig.
B Std. Error Beta
1
(Constant) 2.792 .941 2.968 .004
1. Age .074 .178 .080 .419 .677
2. Marital Status .418 .257 .283 1.626 .108
3. Educational Qualification -.162 .135 -.140 -1.194 .236
4. Are you financially independent .243 .254 .180 .957 .342
5. Monthly Family Income -.222 .089 -.289 -2.500 .015
a. Dependent Variable: 16. Rate the following statements [I wear only branded clothes]
From the table we can get the regression model as: P = 2.792 + .074 X + .418 Y -.162 W +.243 V -.222 Z,
Paired Samples Test
Paired Differences t df Sig. (2-tailed) Mean Std. Devia-
tion Std. Error Mean
95% Confidence Interval of the Difference
Lower Upper
Pair 1
5. Monthly Family Income - 11. How frequently do you shop for branded apparel?
-.264 1.166 .125 -.513 -.016 -2.115
86 .037

VOLUME NO. 7 (2016), ISSUE NO. 08 (AUGUST) ISSN 0976-2183
INTERNATIONAL JOURNAL OF RESEARCH IN COMMERCE & MANAGEMENT A Monthly Double-Blind Peer Reviewed (Refereed/Juried) Open Access International e-Journal - Included in the International Serial Directories
http://ijrcm.org.in/
34
Where P represents the dependent variable – I wear only branded clothes. With X, Y, W, V, Z representing 1,2,3,4,5 respectively from the table above. 2.792 is the constant. We can see for every unit change in marital status there is .418 unit change in P and for every unit change in financially independent variable there is .243 unit change in P, age having very less effect and variable W and Z having negative change. Here let P represent the dependent variable that Brand name is important for me when I shop, with dependent variables X. Y, W, V, Z representing 1, 2, 3, 4,5 from the table above. The regression model is : P = 1.649 - .099 X + .251 Y -.022 W +.210 V + .102 Z We can see that for every unit change in marital status and financial independence there is .251 and .210 units change in P respectively.
3.Coefficientsa
Model Unstandardized Coefficients Standardized Coefficients t Sig.
B Std. Error Beta
1
(Constant) 2.955 1.066 2.773 .007
1. Age .176 .201 .171 .875 .385
2. Marital Status -.691 .293 -.418 -2.356 .021
3. Educational Qualification -.074 .155 -.058 -.477 .635
4. Are you financially independent -.055 .289 -.037 -.191 .849
5. Monthly Family Income .063 .101 .074 .628 .532
a. Dependent Variable: 16. Rate the following statements [Brand enhances my status]
Here let P represent the dependent variable that Brand enhances my status, with dependent variables X. Y, W, V, Z representing 1, 2, 3, 4,5 from the table above. The regression model is: P = 2.955 - .176 X - .691 Y -.074 W -.055 V + .063 Z We can see that for every unit change in age and monthly family income there is .176 and .063 units change in P respectively. For every unit change in marital status there is high negative change, that is -.691 units change in P.
4. Coefficientsa
Model Unstandardized Coefficients Standardized Coefficients t Sig.
B Std. Error Beta
1
(Constant) .478 1.105 .433 .666
1. Age .215 .209 .201 1.029 .307
2. Marital Status -.208 .303 -.121 -.687 .494
3. Educational Qualification .134 .159 .101 .845 .401
4. Are you financially independent .452 .299 .289 1.512 .135
5. Monthly Family Income .039 .104 .044 .373 .711
a. Dependent Variable: 16. Rate the following statements [Brand reflects latest fashion]
Here let P represent the dependent variable that Brand reflects latest fashion, with dependent variables X. Y, W, V, Z representing 1, 2, 3, 4,5 from the table above. The regression model is: P = .478 + .215 X - .208 Y +.134 W + .452 V + .039 Z We can see that for every unit change in age and financial independence there is .215 and .452 units change in P respectively. For every unit change in marital status there is negative change, that is -.208 units change in P. Here let P represent the dependent variable that Brand clothes enhance my confidence, with dependent variables X. Y, W, V, Z representing 1, 2, 3, 4,5 from the table above. The regression model is: P = 1.891 - .175 X + .451 Y -.063 W + .343 V - .012 Z We can see that for every unit change in marital status and financial independence there is .451 and .343 units change in P respectively. For every unit change in age, educational qualification and monthly family income there is negative change in P.
CONCLUSION
Analysis of the collected data revealed that branded clothing was preferred by most of the respondents which indicates that today’s customer is very brand conscious. Chi Square test done helped us to analyze that there is no relationship between demographic variables like age, marital status, educational qualification,
2. Coefficientsa
Model Unstandardized Coefficients Standardized Coefficients t Sig.
B Std. Error Beta
1
(Constant) 1.649 .915 1.801 .076
1. Age -.099 .173 -.113 -.573 .569
2. Marital Status .251 .250 .181 1.006 .317
3. Educational Qualification -.022 .132 -.020 -.166 .869
4. Are you financially independent .210 .247 .166 .851 .397
5. Monthly Family Income .102 .086 .141 1.177 .243
a. Dependent Variable: 16. Rate the following statements [Brand name is important for me when I shop]
5. Coefficientsa
Model Unstandardized Coefficients Standardized Coefficients t Sig.
B Std. Error Beta
1
(Constant) 1.891 1.131 1.672 .099
1. Age -.175 .214 -.161 -.820 .415
2. Marital Status .451 .309 .263 1.461 .148
3. Educational Qualification -.063 .163 -.047 -.386 .701
4. Are you financially independent .343 .305 .218 1.124 .265
5. Monthly Family Income -.012 .107 -.013 -.112 .911
a. Dependent Variable: 16. Rate the following statements [Branded clothes enhance my confidence]

VOLUME NO. 7 (2016), ISSUE NO. 08 (AUGUST) ISSN 0976-2183
INTERNATIONAL JOURNAL OF RESEARCH IN COMMERCE & MANAGEMENT A Monthly Double-Blind Peer Reviewed (Refereed/Juried) Open Access International e-Journal - Included in the International Serial Directories
http://ijrcm.org.in/
35
financially independence of respondents has no influence on purchase of branded apparel. But monthly family income was found to be associated with frequency of purchase of branded apparel and preference of branded apparel which indicates that companies should target particular income groups for better results. Foreign brands are preferred more which indicates that Indian brands have to evolve more and also need to work on their brand communication for example apparel brands like AND even though Indian in origin people might perceive it to be a foreign brand. In terms of place of purchase the culture is shifting towards buying from the malls because of shopping experience the consumers get. The factors influencing the purchase decision for branded apparel was found to be Product Quality, Design, Brand name, Promotion and price. The study also shows that criteria like Brand enhances their status, brand reflects latest fashion, brand enhances their confidence, brand speaks about their attitude was found to be insignificant.The predic-tive model indicates that decision to wear branded apparel i.e whether branded clothes increase confidence and influence of brand name in purchase decisions are dependent more on marital status and financial independence whereas for understanding whether Brand reflects latest fashion and enhances status ,age is the main factor which affects the buying behavior. From the above analysis the perspectives and motives behind the respondent’s purchases is clearly understood. This analysis will help the marketer to attract and maintain their target consumer group. It gives important insights to the marketer to redefine the strategies of retailing branded apparel in India
REFERENCES 1. Branded apparels poised to grow - The Hindu Nov 18th 2013 2. www.cci.in/pdfs/surveys-reports/textile-industry-in-india.pdf 3. Balanaga Gurunathan k, KrishnaKumar.m (2013) Factors Influencing Apparel Buying Behaviour in India: A Measurement Model, Paripex Indian Journal of
Research. Volume: 2 | Issue: 3 | March 2013 ISSN - 2250-1991. 4. Solomon, M. R & Rabolt, Nancy J. (2006). Consumer Behavior inFashion, Pearson Education. 5. Sproles, G. B & Kendall, e.l. (1986). A methodology for profiling consumers' decision-making styles. Journal of Consumer affairs, 20(2), 267-278. 6. Jin & Kang. (2010). Face or Subjective Norm? Chinese College Students' Purchase Behaviours towards Foreign Brand Jeans, Clothing and Textile Research
Journal,28(3),218-233 7. Sawant, R. P. (2012), "Impact of Advertising on Brand Awareness and Consumer Preference (With Special Reference to Men’S Wear)", IOSR Journal of Busi-
ness and Management, Vol.5, No.6, pp 54-61 8. Lalitha. A., Ravikumar, J.and Padmavali, K. (2008). Brand preference of Men Wear. Indian Journal of Marketing, 38(10), pp.33-36 9. Ritu Narang, (2006). A Study on Branded Men Wear. Indian Journal of Marketing, 6(11), PP. 39 10. Jaishri, N. Jethwaney, (1999). Advertising, Phoenix Publishing House, New Delhi, 1st Edition. 11. Kamalaveni. D., Kalaiselvi, S. and Rajalakshmi, S. (2008). Brand Loyalty of Women consumers with respect to FMCGs. Indian Journal of Marketing, 38(9), PP.
4450 12. Pathak. S.V. and Aditya P. Tripathi., (2009). Consumer shopping behaviour among Modern Retail Formats: A Study of Delhi & NCR. Indian Journal of Marketing,
39(2), PP. 312
VOLUME NO. 7 (2016), ISSUE NO. 08 (AUGUST) ISSN 0976-2183
INTERNATIONAL JOURNAL OF RESEARCH IN COMMERCE & MANAGEMENT A Monthly Double-Blind Peer Reviewed (Refereed/Juried) Open Access International e-Journal - Included in the International Serial Directories
http://ijrcm.org.in/
36
PROBLEMS OF SMALL SCALE INDUSTRY IN PUNJAB
MONICA GUPTA ASST. PROFESSOR
ITFT COLLEGE CHANDIGARH
ABSTRACT
In Punjab, small-scale industries occupy an important place, because of their employment potential and contribution to total industrial output. They also help in resource utilization and further help to promote changes in a gradual and phased manner. Government has taken a number of steps to promote them, However, with the recent measures, small-scale industries face certain problems like the industry does not have skilled manpower, the shortage of migrant labor in Punjab, Inadequate credit assistance, Irregular supply of raw material, Lack of machinery and equipment, expensive and inadequate power supply, Competition from large-scale units, high degree of obsolescence and high rate of sales tax. In this paper an attempt is made to overcome these problems. In this context certain suggestions are given so as to solve the above problems. If we look at the current Indian scenario there are many problems which are being faced by Indian small scale industry but the focus of this research paper is laid down only on the problems which are being currently faced in the state of Punjab.
KEYWORDS SSI (small scale industries), capital, industry, seed capital, working capital.
INTRODUCTION small scale industry is a project which involves a small budget and is runby a small group of people. According to the definition provided by government website (business.gov.in), a SSI is a business setup in which the financial commitment towards infrastructure does not surpass Rs.1 Crore. Industries remain an integral component of the State economy, with capabilities in the entire manufacturing value chain, from R&D and design to marketing and sales. With
the emphasis given on the liberalized industrial policy, the Government have given a great deal of importance to the establishment and development of small-scale industries. Even, a number of products have been exclusively reserved for production in the small-scale sector. Small industries are fairly labor intensive with comparatively smaller capital investment than the larger units. Therefore, these units are more suited for economics where capital is scarce and there is abundant supply of labor.
LITERATURE REVIEW A literature review is an account of what has been published on a topic by accredited scholars and researchers. In writing the literature review, our purpose is to convey to the reader what knowledge and ideas have been established on a topic, and what their strengths and weaknesses are. It should be started from the latest one to back say up to thirty years. Vasandhara Raje age 45 (2000) states that credit is an essential input for the working of small-scale Industries. Any delay or inadequate supply of credit is detri-mental to the growth of the SSI units. Therefore, timely and adequate supply of credit is of crucial importance for setting up and for expanding the existing SSI units. Balasubrahmanya 42 (1998) in his study describes the elements of India's small industry policy with specific reference to protective measures, and reviews it's impact on the growth and efficiency of the sector. Parsed and Kushik (1997) have traced out locus of comprehensive policies and programs of the small-scale sector during the 50 years of independence. Hina Sindhu 40 (1996) in their study state that, employment generation has increased over a period of time: The other findings of the study are related to decline in employment in the household industries, and a decline in the contribution of the large scale sector to employment generation. Rao 35 (1995) reports that the potential for investment related to technology requisition and transfer in small-scale and medium sector has assumed considerable significance in their interest to the challenges of liberalisation and globalisation of markets. The international prospective planning team (1995), which made an extensive study of India's small-scale industries, was of the opinion that Government; efforts for the promotion of this sector were largely scattered and dealt with only isolated segments of the problem. Thomas. T. Thomas 34 (1994) states that there is a need for extensive education of the small-scale industrial units promoters in general management and specif-ically in the fundamentals of marketing management. Venugopal 31 (1993) observed that Governmental agencies set up for promoting village and cottage Industries are inactive and their performance is below the level of expectations. He argues that the survival of village and cottage industries depends on their ability to become competitive. Their efforts should be to reduce cost and improve quality through technological upgradation. Ramabijoy 32 (1993) in his study analyses government support, capacity under utilisation marketing and financing power and transport of small-scale Industries and also the entrepreneurship and management of sickness. Jamuar 28 (1992) in his study discusses the development of small-scale and cottage Industry in India and the role of small-scale Industry in India, the present position and problems of small-scale Industry with special references to Industrial sickness, government policy and measures to develop small-scale and cottage Industry and new Industrial policy on small-scale and cottage Industry. Rama Swamy 29 (15193) in his study examines three hypothesis regarding small- scale manufacturing units. namely: small firms use more labor per unit of capital, they produce more output per unit of capital and small firms use resources more efficiently than large firms in terms of total Factor Productivity. The analysis indicates that capital intensity and partial productivities are sensitive to alternative measures of firm size and total factor productivity are not found systematically related. Dias Syrian 25 (1991) examines the scale, nature and effects of current sub contracting linkages between smc 11 and large Industries in Sri-Lanka, In general weaker relationships exist between large and small industries, however strong links exhibit with respect to more organised few large firms. The reason for this weaker relationship is the immaturity of small Industries in meeting the requirements of large Industries in terms of technology, production cost, and quality and delivery services. Sandesara (1988) relate a study of assistance programs for small-scale industries. The study revealed that units producing items in the reserved list did not show away superior performance over other units, mainly because the easy entry for new small-scale units had intensified the competition among the small units. Ram Vepa (1988) in his study discusses the growth of small-scale Industry, organisational structure, some key issues, and field planning for small-scale Industry and its prospectus for nineties. Sidhartha Shankar Dash and others (1990) in a study under taken in Balasori district in Orissa attempt to analyze the operational problems in launching SSI units. They conclude that although policies are good, often delay in implementation and faulty implementation upset the entrepreneur's plan and in many cases lead the production process to a stand still Tara Nand Singh Tarun and DevandraThakar (1986) reveal that the fundamental problem of Industrial development in India is the problem of transplanting and acclimatizing the fruits of technology so as to raise the whole level of productivity.
A
VOLUME NO. 7 (2016), ISSUE NO. 08 (AUGUST) ISSN 0976-2183
INTERNATIONAL JOURNAL OF RESEARCH IN COMMERCE & MANAGEMENT A Monthly Double-Blind Peer Reviewed (Refereed/Juried) Open Access International e-Journal - Included in the International Serial Directories
http://ijrcm.org.in/
37
The report of the sub group on small-scale industries for the Seventh Plan I' (1985) had found that the efforts of the government have not met with the same degree of success in different parts of the country nor have they removed the basic weakness of the small-scale sector. Vinayak, ShankarraoBhoyar "1984) states that program of Co- operative industrial estates coupled with Co-operatives in other related fields is a powerful instru-ment, which possesses the capacity to transform the backward area into advanced ones. The task force on small-scale industries (1984) found that available subsidies and concessions are not distributed to eligible units at the right time. Such assistance announced by the government are badly delayed for several reasons such as delay in issuing detailed orders, inadequacy of budget provisions etc. Narayana Reddy (1983) in his doctoral thesis reports that SSI units are to equip themselves with better and improved methods of marketing, disseminated through proper training programs inducted by the Institute of Marketing, which may be started exclusively. Hence there is a need for creating the Institute of Marketing for small industry at national level. Ram Vepa ' (1983) in his study reports that over the last 25 years a network of institutions and policies has been developed in the country but not all of them have been successful. But taken in totality, they have provided a well-organized frame works in which the small and cottage industry have been allowed to grow. Roy Roth Well and 'Water Zegveld (1982) reveal that SME have been and in general, continue to be, technologically innovative. Technology based new SMEs plays an important part in the emergence of new technology and in economic growth SME, particularly, young technology based SMEs also make an exceptional contri-bution to employment creation. Independent SME, and their larger counterparts, does represent an important vehicle for regional regeneration. Graham Bannock (1981) presents a vivid picture of the practical problems of the individual small business, showing how they relate to the wider issues of economic policy. He believes the release of the economic dynamisms inherent in the small business sector could help to generate the social and economic change needed for the resumption of inflation-free growth. The Japanese delegation, which visited India ' (1961), found that most of the facilities and concessions provide, were in excess of their requirements and they warned that it would lead to continuous dependence of these units on the government.
OBJECTIVE OF THE STUDY The objective of the study is to bring forward the various problems faced by the small scale industry of Punjab and recommend some ways to solve these problems so that the industry can grow further to contribute something to the economy.
RESEARCH DESIGN A research design is the "blue print" of the study. The design of a study defines the study type and sub-type, research question, hypotheses, independent and dependent variables, experimental design, and, if applicable, data collection methods and a statistical analysis plan. Research design is the framework that has been created to seek answers to research questions. METHODS OF DATA COLLECTION PRIMARY DATA: Are those which are collected a fresh and for the first time and thus happen to be original in character and known as Primary data. SECONDARY DATA: Are those which have been collected by someone else and which have already been passed through the statistical process are known as Secondary data. TYPE OF RESEARCH USED The research will be conducted by means of descriptive research in which main data is taken from the internet and other journals or books. I.e. mainly secondary data will be used. These are already available i.e. they refer to the data which have already been collected and analyzed.
PROBLEMS FACED BY SMALL SCALE INDUSTRY IN PUNJAB INDUSTRY DOES NOT HAVE SKILLED MANPOWER The small scale industries in Punjab do not have the infrastructure to train youth. Industrialists say that lack of skilled labor is one of the major reasons for the state's declining share in industrial investment, since industries such as textiles, sports goods and engineering are labor-intensive. Partly as a result of this scarcity, many companies in the state have recently set up or expanded their facilities in other states. THE SHORTAGE OF MIGRANT LABOR IN PUNJAB The shortage of migrant labor in Punjab has dampened the Industrial production in the state. As a result, a number of companies especially in SMEs are unable to cope with the demand as their production took a nose dive and are further compelled to put their expansion plans on hold. Industrialists believe that the shortage of labor is up to the extent of 40 per cent in the state. The Industries rely on migrant labors from Bihar, Uttar Pradesh, Orissa etc. INADEQUATE CREDIT ASSISTANCE The small scale industries are neither in a position to go to the public to mobilize resources nor able to convince the financing agencies about their strength. This sector genuinely needs low cost funds not only to reduce the cost of production to be viable but also to compete with the large industries as well as upcoming MNCs. IRREGULAR SUPPLY OF RAW MATERIAL The state depends on raw material resources located at distant places in other states. This places the local industry at a disadvantage due to the both transpor-tation costs and inadequate and irregular supply of raw material. LACK OF MACHINERY AND EQUIPMENT The industries in Punjab use obsolete tools and machinery. These units have obsolete machinery and equipment’s which are not actually required. EXPENSIVE AND INADEQUATE POWER SUPPLY Steel units cannot afford captive power, as their requirements are huge. A steel mill requires a 2,500 KVA generator at the minimum, but these are unviable to purchase and maintain. So, the mills are completely dependent on the state electricity board. During the kharif sowing season (May through August) power is available 12 hours a day, three to four days a week. Production is suspended owing to power cuts but the industry has to bear labor costs and fixed costs during this period. Power supply becomes inconsistent in winters also owing to high consumption by the domestic sector. The average power tariff is about 5.50 paisa per unit, one of the highest in the country. The withdrawal of freight equalization to units located away from the sea, followed by the ten-year tax holiday for hills states announced by the Centre, also hurt the industry. COMPETITION FROM LARGE-SCALE UNITS Small manufacturers are facing stiff competition from all type of industries in the present era. The small entrepreneurs have to compete with large and medium size organizations in terms of product, price, distribution and promotional aspects especially the units from textiles industry. It has been found that units relating to leather and leather products considered ‘competitive pricing’ and textiles considered ‘low cost of product’ as the main competitive advantages, but there is urgent need to expand the list of competitive advantages to become highly competitive in the market. HIGH DEGREE OF OBSOLESCENCE Industry in the Punjab is using the very old and obsolete technology. Punjab’s technology is very old whereas china and Japan uses the very latest technology and they produce the latest products which are affordable. HIGH RATE OF SALES TAX At least 95 per cent of the pharmaceutical units in Amritsar are not functioning to capacity because of high taxes. Not only in Amritsar but entire Punjab, have already cut down the production by 35-40 per cent. They are struggling to survive due to the competition as the high input costs make the products expensive in Punjab as compared to Himachal Pradesh.

VOLUME NO. 7 (2016), ISSUE NO. 08 (AUGUST) ISSN 0976-2183
INTERNATIONAL JOURNAL OF RESEARCH IN COMMERCE & MANAGEMENT A Monthly Double-Blind Peer Reviewed (Refereed/Juried) Open Access International e-Journal - Included in the International Serial Directories
http://ijrcm.org.in/
38
FINDINGS Industries in Punjab do not have the infrastructure to train youth.
The Industries rely on migrant labors from Bihar, Uttar Pradesh, Orissa etc
Small scale industries are neither in a position to go to the public to mobilize resources nor able to convince the financing agencies about their strength.
The state depends on raw material resources located at distant places in other states.
The industries in Punjab use obsolete tools and machinery.
There is Expensive and inadequate power supply.
The small entrepreneurs have to compete with large and medium size organizations in terms of product, price, distribution and promotional aspects espe-cially the units from textiles industry.
Industry in the Punjab is using the very old and obsolete technology.
At least 95 per cent of the pharmaceutical units in Amritsar are not functioning to capacity because of high taxes.
SUGGESTIONS A good infrastructure should be developed, so that the unskilled youth can get proper training.
If the state has its own labor supply, then the problem of labor migration can be solved.
There should be availability of credit in surplus. A strong goodwill of the company should be created so that, the company does not face any problem in raising finances.
The state should have its own raw material, so that no cost is incurred on getting the raw material from the different places.
The machinery and equipment’s which are used for production should be of the latest technology.
Adequate amount of power supply should be ensured so that the production does not suffers.
Innovation should be a part of production in terms of product, price, distribution and promotional activities. Customers are always attracted by something new.
Latest technology should be used for production so that we are at par with other nations.
The production capacity of the plant should be utilized up to the maximum extent possible.
REFERENCES 1. http://budget.business-standard.com/news.php?id=40&bs_autono=113123000970 2. http://business.mapsofindia.com/india-business/small-business.html 3. http://cjournal.cz/files/64.pdf 4. http://shodhganga.inflibnet.ac.in/bitstream/10603/6545/10/10_chapter%202.pdf 5. http://shodhganga.inflibnet.ac.in/bitstream/10603/684/7/07_chapter-i.pdf 6. http://www.business-standard.com/article/economy-policy/high-taxes-push-punjab-pharma-units-to-the-edge-106071101059_1.html 7. http://www.business-standard.com/article/economy-policy/industries-in-punjab-affected-by-labour-shortage-110060500062_1.html 8. http://www.business-standard.com/article/sme/punjab-town-s-steel-cluster-is-losing-its-lustre-112090400016_1.html 9. http://www.business-standard.com/article/sme/revised-credit-norms-to-give-smes-a-boost-115051101279_1.html 10. http://www.ijsett.com/images/Paper21(1).pdf 11. http://www.preservearticles.com/201101153374/problems-faced-by-small-scale-industries-in-india.html 12. http://www.slideshare.net/priyansakthi/methods-of-data-collection-16037781 13. http://www.writing.utoronto.ca/advice/specific-types-of-writing/literature-review 14. http://www.yourarticlelibrary.com/industries/small-scale-industries-in-india-definition-characteristic-and-objectives/23464/ 15. https://books.google.co.in/books?id=eTUhxJXF_9UC&pg=PA71&lpg=PA71&dq=is+there+Irregular+supply+of+raw+material+in+punjab+small+scale+indust
ries?&source=bl&ots=XurLHXugdw&sig=KURI_O3YFGBn_qbQl9aA6UABCJA&hl=en&sa=X&ved=0ahUKEwi-zOfYgcLJAhUHCo4KHZKRDgoQ6AEIGzAA#v=onepage&q=is%20there%20Irregular%20supply%20of%20raw%20material%20in%20pun-jab%20small%20scale%20industries%3F&f=false
16. https://books.google.co.in/books?id=wSgdERJIE7YC&pg=PA24&lpg=PA24&dq=is+there+a+Lack+of+machinery+and+equipment+in+punjab+small+scale+industries?&source=bl&ots=EmShox38YG&sig=ht1eZSDeSCNjxMvQFZzZQOB6G9o&hl=en&sa=X&ved=0ahUKEwi34czsgsLJAhUDVI4KHSjWAU0Q6AEINDAE#v=onepage&q=is%20there%20a%20Lack%20of%20machinery%20and%20equipment%20in%20punjab%20small%20scale%20industries%3F&f=false
17. https://en.wikipedia.org/wiki/Research_design

VOLUME NO. 7 (2016), ISSUE NO. 08 (AUGUST) ISSN 0976-2183
INTERNATIONAL JOURNAL OF RESEARCH IN COMMERCE & MANAGEMENT A Monthly Double-Blind Peer Reviewed (Refereed/Juried) Open Access International e-Journal - Included in the International Serial Directories
http://ijrcm.org.in/
39
MERGERS AND ACQUISITIONS IN INDIA AND ITS LONG TERM IMPACT ON SHAREHOLDERS WEALTH
AMISH BHARATKUMAR SONI ASST. PROFESSOR GLS UNIVERSITY
AHMEDABAD
ABSTRACT In this study I had done the analysis in two part: First trend analysis (2004 to 2015); Second Long term view shareholders wealth analysis. To know the long term perspective for shareholder’s wealth I had done the fundamental analysis of 5 companies from the year 2004 and 5 companies from the yare 2005) and see the effect post merger on the acquiring company with the tools of fundamental analysis.
KEYWORDS mergers & acquisition, pre and post merger analysis, share holder’s wealth.
INTRODUCTION he decision to invest in a new asset would mean internal expansion for the firm. The new asset would generate returns raising the value of the corporation. Mergers offer an additional means of expansion, which is external, i.e. the productive operation is not within the corporation itself. For firms with limited investment opportunities, mergers can provide new areas for expansion. In addition to this benefit, the combination of two or more firms can offer several
other advantages to each of the corporations such as operating economies, risk reduction and tax advantage. Today mergers, acquisitions and other types of strategic alliances are on the agenda of most industrial groups intending to have an edge over competitors. Stress is now being made on the larger and bigger conglomerates to avail the economies of scale and diversification. Different companies in India are expanding by merger etc. In fact, there has emerged a phenomenon called merger wave. The terms merger, amalgamations, take-over and acquisitions are often used interchangeably to refer to a situation where two or more firms come together and combine into one to avail the benefits of such combinations and re-structuring in the form of merger etc., have been attempted to face the challenge of increasing competition and to achieve synergy in business operations.
LITERATURE REVIEWS
Sr. No.
Topic Name Author/ Authors Name
Outline of the Paper
1 Long-term Post-merger Performance of Firms in India
K Ramakrishnan The author had taken sample of 87 domestic mergers and found that in the long run, mergers appear to have been financially beneficial for firms in the Indian industry
2 Business restructuring and its transfer pricing implications
Roy Choudhury, Rakesh Mishra
The article points out that different form of business restructuring will have different tax consequences. Highlighted slum sale of a business or undertaking as per Income tax act 1961
3 The Impact of Domestic Mergers and Acquisitions on Acquirer Shareholders’ Wealth in India
Neelam Rani, Surendra S. Yadav and P.K. Jain
Paper Examine share price performance from 2003-2008 by having CAAR tool for some specific duratiom
4 Leadership Crisis - The Case of Pricewa-terhouseCoopers India
S.S.Ganesh In this case he shows how the leadership or top management changes in PWC and the results and hurdels of the same.
5 Procedural Issues in Mergers and Acqui-sitions of Companies: A Comparison be-tween Nigeria and India
Abubakar Garba, B.M. Abubakar, M.S. Umar
Nigerian authors shows us how to compare the two countires law and how we can make the change in exising body and do the betterment in legality of the country by keeping Indian laws in mind.
6 India tax laws in need of an overhaul Berry, Rohit The Author said still a lot needs to be done on the regulations, and one can expect momentum on the open issues only after the new government is in place, which is expected by mid 2009.
7 Taxation framework facilitates M&A in India
Sanghvi, Jayesh, Ro-hira, Narendra
The contribution of the four authors in M&A tax frameworks shows the contempora-neous economic reforms by the Indian government and restructuring by Indian com-panies to attain global scale have resulted in sharp rise in M&A activity in recent years
8 Mergers and Acquisitions in India with Special Reference to the Financial Sec-tor: Recent Trends and Patterns
Priya Bhalla This paper said regarding the upward trend the M&A in India and it increases year by year. Indian companies are showing their strength
9 The Internationalization of Firms from India: Investment, Mergers and Acquisi-tions
Deepak Nayyar This paper analyzed the rapid expansion in outflows of foreign direct investment from India and rapid expansion of outward direct foreign investment from India during the early 2000s, but India’s share in such investment from developing countries remains modest in terms of both stock and flows.
10 Impact of Mergers and Acquisition on Shareholders Wealth
V K Shobhana and N. Deepa
Related with my topic but they only concentrated the banking sector and analysed the wealth of the shareholders
11 Market Response to the Announcement of Mergers and Acquisitions: An Empiri-cal Study from India
Neelam Rani, Surendra S. Yadav and P.K. Jai
The paper article examined the short-run abnormal returns to India based mergers and acquisitions during 2003–2008 by using event study methodology. There work was based on a sample of 623 M&A.
12 Mergers and Acquisitions in India: A strategic impact analysis for the corpo-rate enterprises in the post liberaliza-tion period
Rabi NarayanKar & Amit Soni
Authors observed that M&As in India were strategic in nature that motives range from growth and expansion to high quality of human resources, strong brand pres-ence and global identity and leadership.
13 Predicting Acquisition in India Parama Barai and Pitabas Mohanty
122 target firms acquired in 2002- 2005 taken as sample and due to high debt level it continues in india the process of M&A
14 India M&A Trend Report: Q1-Q3 2013 By MergerMarket India’s M&A through Q1-Q3 2013 was valued at US$ 17bn, 44% below Q1-Q3 2012 (US$ 30.3bn)
15 CCI Report on A review of Mergers & Ac-quisitions in India
Hari Kishan Author had given insight regarding section 5 and 6 of the competition act 2002 and amendment in 2012
T

VOLUME NO. 7 (2016), ISSUE NO. 08 (AUGUST) ISSN 0976-2183
INTERNATIONAL JOURNAL OF RESEARCH IN COMMERCE & MANAGEMENT A Monthly Double-Blind Peer Reviewed (Refereed/Juried) Open Access International e-Journal - Included in the International Serial Directories
http://ijrcm.org.in/
40
NEED/IMPORTANCE OF THE STUDY To understand the trend in mergers and acquisition
To aware the investors regarding the effect, before and after the mergers & acquisitions
To make their strategies for investments, for both the investors’ long term by keeping in mind mergers & acquisitions.
OBJECTIVES Primary Objective 1. Measuring Wealth of Shareholders for long term view Secondary Objectives 1. To understand the trend in M&A 2. To know the effect of merger on the company 3. To understand the shareholder’s wealth after the deal
HYPOTHESIS H0: There is a negative relationship post merger as per the fundamental analysis of the acquiring company H1: There is a positive relationship post merger as per the fundamental analysis of the acquiring company
RESEARCH METHODOLOGY RESEARCH DESIGN Causal Research POPULATION The population of my research is taken of ten years of Indian Listed Companies Mergers and Acquisitions from financial year 2004 to 2014 SAMPLING FRAME Indian companies who are registered in the Stock exchanges. So, the list of registered Indian companies in the stock exchanges becomes the part of my sampling frame. SAMPLING UNIT Sampling unit will be primarily consisting of the two years of Mergers and Acquisitions. SAMPLE SIZE Sample size will be of five companies each out of selected two years of above. SAMPLING METHODS Convenience sampling method.
RESULTS & DISCUSSION ANALYSIS 1. TREND ANALYSIS Analysis: 5 companies each from 2005 and 2006: Measuring Wealth of Share holders for Long Term INTRODUCTION Mergers and Acquisitions (M&As) have been a prominent trend in the advanced capitalist countries since the late nineteenth century. But only in recent times has it become a regular phenomenon in ‘developing’ countries. The striking feature of the present wave of M&As at the global level is that it includes many cross-border (CB) deals and is propelled by a different set of forces. The total number of M&As worldwide increased almost three-fold during 1990 to 1999. The total value of M&As worldwide has increased more than five-fold during the corresponding period. While the total number of M&As has increased fivefold during 2000-2009 and total value has increased almost nine fold. The global environment that emerged from the new policy regime, i.e. privatization, liberalization in trade, finance and investment, as well as technological changes has created a situation that facilitates CB Mergers (UNCTAD 2000). The Indian evidence suggests that the new economic environment of the nineties has facilitated M&As. Mergers of firms belonging to the same business groups operating in similar product-lines ap-peared to dominate the Merger-wave in India. The participation of foreign-controlled firms in the M&As process has increased significantly during the second half of the nineties. Around 37.7 per cent of the total Foreign Direct Investment (FDI) made by multinational corporations (MNCs) during 1991-1998 was financed through cross-border M&As activity, and the same per cent increased to around 50% during 2000-2009, either through Acquisition of substantial equity stakes in existing ventures or through buy-out of real assets through asset-sales. ANALYSIS: TRENDS FROM INDIAN PERSPECTIVE It is evident that a substantial growth of M&As in the Indian corporate sector has been witnessed after 1990s. For instance, total no. of M&A has increased to 3089 (source: capital line) during 2005-2014 (Table 1) from the level of 1302 during 1990-2004 (Table 2), and 268 during 1980-1990s.
TABLE 1: TREND OF M&AS DURING 2005-2014
Year Total
2005 283
2006 399
2007 432
2008 298
2009 312
2010 361
2011 292
2012 241
2013 293
2014 178
Total 3089
(Source: Capital Line)

VOLUME NO. 7 (2016), ISSUE NO. 08 (AUGUST) ISSN 0976-2183
INTERNATIONAL JOURNAL OF RESEARCH IN COMMERCE & MANAGEMENT A Monthly Double-Blind Peer Reviewed (Refereed/Juried) Open Access International e-Journal - Included in the International Serial Directories
http://ijrcm.org.in/
41
TABLE 2: TRENDS OF M&AS DURING 1990--2004
Year Total
1990-1995 291
1995-2000 743
2000-2004 268
Total 1302
(Source: Capital Line) While the Indian corporate houses seem to have been bracing up to face foreign competition during the first phase (1990-1995), the second phase (1995-2000) witnessed a large presence of multinational firms which comes in Indian Market through M&A, in third phase (2000-2004) it shows down fall compare to earlier phase. In these 15 years’ total deals were 1302. In the last ten years (2005 to 2014) it goes 3 times more than earlier decade (1995 to 2004). MNCs have actively participated in the M&A process during the second half of the 20th century with a view to gain market entry or to strengthen their presence. 2. PILOT STUDY ANALYSIS Measuring Wealth of Share holders for Long Term view: As a Pilot study taken 05 Companies each from the year 2005 and 2006 Analysis Measuring Wealth of Share holders for Long Term by keeping in mind following random 10 M&A’s: Year 2005 1. Acquirer Company : JSW Steel Ltd Target Company : Jindal Iron & Steel Co Ltd Merger Date : 21/03/2005 Sector : Steel 2. Acquirer Company : Tata Motors Ltd Target Company : Tata Finance Ltd (Merged) Merger Date : 30/07/2005 Sector : Finance 3. Acquirer Company : Welspun India Ltd Target Company : Glofame Cotspin Industries Ltd (merged) Merger Date : 4/8/2005 Sector : Textiles 4. Acquirer Company : Chambal Fertilizers & Chemicals Ltd Target Company : India Steamship Company Ltd (merged) Merger Date : 22/08/2005 Sector : Shipping 5. Acquirer Company : Gujarat Narmada Valley Fertilizers Company Ltd Target Company : Narmada Chematur Petrochemicals Ltd (merged) Merger Date : 28/10/2005 Sector : Petrochemicals Year 2006 1. Acquirer Company : Dabur India Ltd Target Company : Balsara Hygiene Products Ltd (merged) Merger Date : 27/01/2006 Sector : FMCG 2. Acquirer Company : Century Plyboards (India) Ltd Target Company : Shyam century Ferrous Ltd Merger Date : 28/02/2006 Sector : Miscellaneous 3. Acquirer Company : V I P Industries Ltd Target Company : Blow Plast Ltd (merged) Merger Date : 10/3/2006 Sector : Plastic products 4. Acquirer Company : Torrent Power Ltd Target Company : Torrent Power AEC Ltd (merged) Merger Date : 23/03/2006 Sector : Power Generation & Distribution 5. Acquirer Company : Tata Consultancy Services Ltd Target Company : Tata Infotech Ltd (merged) Merger Date : 23/03/2006 Sector : IT – Software

VOLUME NO. 7 (2016), ISSUE NO. 08 (AUGUST) ISSN 0976-2183
INTERNATIONAL JOURNAL OF RESEARCH IN COMMERCE & MANAGEMENT A Monthly Double-Blind Peer Reviewed (Refereed/Juried) Open Access International e-Journal - Included in the International Serial Directories
http://ijrcm.org.in/
42
Ratios and Measures for Analysis 1. Profitability Check a. Sales b. PAT c. Net profit margin d. EPS (annualized) (Unit Cur) 2. Liquidity Ratio a. Current Asset b. Debtor ratio c. Inventory Turnover ratio 3. Solvency Ratio a. Debt – Equity Ratio b. Interest Cover Ratio c. Impact on Capital Market d. Equity Paid Up e. Dividend f. Book Value g. Market Capitalization 4. Impact on the Cash Flows a. Operating Activities b. Investing Activities c. Financing Activities 5. Returns a. ROCE (%) b. RONW (%) 6. Forex Investment a. Revenue earnings in Forex b. Revenue Expenses in Forex FINDINGS OVERALL FINDINGS 2005
JSW Tata Welspun Chambal GNFC
Steel Motors India Fertilizers
Particulars
Profitability Check
Net Sales ↑ ↑ ↑ ↑ ↑
PAT ↑ ↑ ↑ ↓ ↑
Net profit margin ↑ ↓ ↓ ↓ ↓
EPS (annualized) (Unit Cur) ↑ ↑ ↓ ↓ ↑
Liquidity Ratios
Current Ratio ↓ ↑ ↑ ↓ ↑
Inventory Ratio ↓ ↓ ↓ ↓ ↑
Debtors Ratio ↑ ↑ ↑ ↑ ↓
Solvency Ratios
Debt-Equity Ratio ↓ ↑ ↓ ↓ ↓
Interest Cover Ratio ↑ ↓ ↓ ↑ ↑
Impact on Capital Market
Equity Paid Up ↑ ↑ ↑ ↑ ↑
Book Value (Unit Cur) ↑ ↑ ↑ ↑ ↑
Market Capitalisation ↑ ↑ ↓ ↑ ↑
Dividend (annualized%) ↑ ↑ ↓ ↓ ↑
Impact on Cash Flow
Operating Activities ↓ ↑ ↓ ↓ ↑
Investing Activities ↓ ↓ ↑ ↓ ↓
Financing Activities ↑ ↓ ↓ ↑ ↓
Return
ROCE (%) ↓ ↓ ↓ ↓ ↑
RONW (%) ↓ ↓ ↓ ↓ ↓
Forex Investment
Revenue earnings in Forex ↑ ↑ ↑ ↑ ↑
Revenue expenses in Forex ↑ ↑ ↑ ↑ ↑
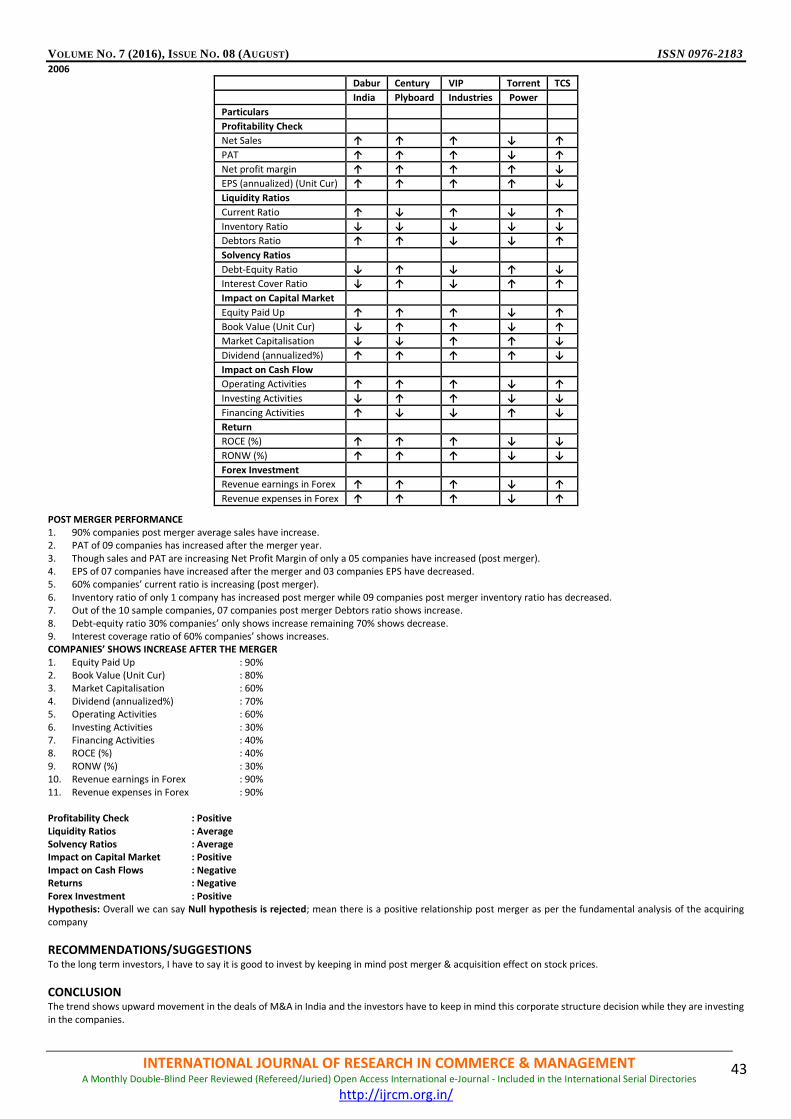
VOLUME NO. 7 (2016), ISSUE NO. 08 (AUGUST) ISSN 0976-2183
INTERNATIONAL JOURNAL OF RESEARCH IN COMMERCE & MANAGEMENT A Monthly Double-Blind Peer Reviewed (Refereed/Juried) Open Access International e-Journal - Included in the International Serial Directories
http://ijrcm.org.in/
43
2006
Dabur Century VIP Torrent TCS
India Plyboard Industries Power
Particulars
Profitability Check
Net Sales ↑ ↑ ↑ ↓ ↑
PAT ↑ ↑ ↑ ↓ ↑
Net profit margin ↑ ↑ ↑ ↑ ↓
EPS (annualized) (Unit Cur) ↑ ↑ ↑ ↑ ↓
Liquidity Ratios
Current Ratio ↑ ↓ ↑ ↓ ↑
Inventory Ratio ↓ ↓ ↓ ↓ ↓
Debtors Ratio ↑ ↑ ↓ ↓ ↑
Solvency Ratios
Debt-Equity Ratio ↓ ↑ ↓ ↑ ↓
Interest Cover Ratio ↓ ↑ ↓ ↑ ↑
Impact on Capital Market
Equity Paid Up ↑ ↑ ↑ ↓ ↑
Book Value (Unit Cur) ↓ ↑ ↑ ↓ ↑
Market Capitalisation ↓ ↓ ↑ ↑ ↓
Dividend (annualized%) ↑ ↑ ↑ ↑ ↓
Impact on Cash Flow
Operating Activities ↑ ↑ ↑ ↓ ↑
Investing Activities ↓ ↑ ↑ ↓ ↓
Financing Activities ↑ ↓ ↓ ↑ ↓
Return
ROCE (%) ↑ ↑ ↑ ↓ ↓
RONW (%) ↑ ↑ ↑ ↓ ↓
Forex Investment
Revenue earnings in Forex ↑ ↑ ↑ ↓ ↑
Revenue expenses in Forex ↑ ↑ ↑ ↓ ↑
POST MERGER PERFORMANCE 1. 90% companies post merger average sales have increase. 2. PAT of 09 companies has increased after the merger year. 3. Though sales and PAT are increasing Net Profit Margin of only a 05 companies have increased (post merger). 4. EPS of 07 companies have increased after the merger and 03 companies EPS have decreased. 5. 60% companies’ current ratio is increasing (post merger). 6. Inventory ratio of only 1 company has increased post merger while 09 companies post merger inventory ratio has decreased. 7. Out of the 10 sample companies, 07 companies post merger Debtors ratio shows increase. 8. Debt-equity ratio 30% companies’ only shows increase remaining 70% shows decrease. 9. Interest coverage ratio of 60% companies’ shows increases. COMPANIES’ SHOWS INCREASE AFTER THE MERGER 1. Equity Paid Up : 90% 2. Book Value (Unit Cur) : 80% 3. Market Capitalisation : 60% 4. Dividend (annualized%) : 70% 5. Operating Activities : 60% 6. Investing Activities : 30% 7. Financing Activities : 40% 8. ROCE (%) : 40% 9. RONW (%) : 30% 10. Revenue earnings in Forex : 90% 11. Revenue expenses in Forex : 90% Profitability Check : Positive Liquidity Ratios : Average Solvency Ratios : Average Impact on Capital Market : Positive Impact on Cash Flows : Negative Returns : Negative Forex Investment : Positive Hypothesis: Overall we can say Null hypothesis is rejected; mean there is a positive relationship post merger as per the fundamental analysis of the acquiring company
RECOMMENDATIONS/SUGGESTIONS To the long term investors, I have to say it is good to invest by keeping in mind post merger & acquisition effect on stock prices.
CONCLUSION The trend shows upward movement in the deals of M&A in India and the investors have to keep in mind this corporate structure decision while they are investing in the companies.

VOLUME NO. 7 (2016), ISSUE NO. 08 (AUGUST) ISSN 0976-2183
INTERNATIONAL JOURNAL OF RESEARCH IN COMMERCE & MANAGEMENT A Monthly Double-Blind Peer Reviewed (Refereed/Juried) Open Access International e-Journal - Included in the International Serial Directories
http://ijrcm.org.in/
44
SCOPE FOR FURTHER RESEARCH From the research it clearly shows that in long term investors perspective, I had not reached to the clear majority of neither positive nor negative sign so, I have to do the industry wise analysis of selected years and carry forward the research now industry specific. With that we can come to more precise conclusion.
ACKNOWLEDGEMENT I would like to acknowledge the N. R. Institute of Business Management (GLS University) to support my research, my PHD Guide Dr. Sneha S. Shukla and last but not least my family members for their continuous support.
REFERENCES 1. Abubakar Garba, B.M. Abubakar, M.S. Umar (2014), Research Paper on: “Procedural Issues in Mergers and Acquisitions of Companies: A Comparison between
Nigeria and India”, Published in: European Journal of Business and Management, ISSN 2222-1905 (Paper) ISSN 2222-2839 (Online), Vol 6 No 8 2. Berry, Rohit (2009), Research Paper on: “India tax laws in need of an overhaul” Published in: International Tax Review, Issue: May, Supplement, Issue 48 3. Deepak Nayyar, Research Topic (2008): “The Internationalization of Firms from India: Investment, Mergers and Acquisitions”, Published in Oxford Develop-
ment Studies, Vol. 36, No. 1. 4. Hari Kishan, CCI Report (2012) on “A review of Mergers &Acquisitions in India” (Research Paper prepared under the Internship Programme of Competition
Commission of India) Under the Guidance of: Shri Ajay Gohel – Joint Director (Law) – Combination Devision- Competition Commission of India 5. K Ramakrishnan (2008), Research Paper on “Research Paper on: Long-term Post-Merger Performance of Firms in India” Published in Vikalpa, Issue: April-
June, Volume 33, No 2. 6. Neelam Rani, Surendra S. Yadav and P.K. Jain (2012), Research Paper On: “The Impact of Domestic Mergers and Acquisitions on Acquirer Shareholders’
Wealth in India” Published in Global Journal of Flexible Systems Management Issue: December, 13(4), p179–193 7. Neelam Rani, Surendra S. Yadav and P.K. Jain (2013), Research Article: “Market Response to the Announcement of Mergers and Acquisitions: An Empirical
Study from India” Vision 17(1) 1–16, MDI, SAGE Publications, Los Angeles, London, New Delhi, Singapore, Washington DC. 8. Parama Barai and Pitabas Mohanty (2012), “Predicting Acquisition in India” Published in Vikalapa, Volume 37, No. 3, Issue July – September. 9. Priya Bhalla, Research Topic (2010): “Mergers and Acquisitions in India with Special Reference to the Financial Sector: Recent Trends and Patterns”, Published
in the IUP Journal of Business Strategy, Vol. VII, No. 3. 10. RabiNarayanKar & Amit Soni, Research Paper on: “Mergers and Acquisitions in India: A strategic impact analysis for the corporate enterprises in the post
liberalization period” 11. Research Report by MERGERMARKET on “India M&A Trend Report: Q1-Q3 2013” 12. Roy Choudhury, Rakesh Mishra (2007), “Business restructuring and its transfer pricing implications” Published in: International Tax Review. Issue: October,
p13-17 13. S. S. Ganesh (2014), Research Article On:” Leadership Crisis - The Case of PricewaterhouseCoopers India”, Published on: Vilakshan, XIMB Journal of Manage-
ment, Issue September, Vol.11 (2) 14. Sanghvi, Jayesh, Rohira, Narendra, Research Paper on: “Research Taxation framework facilitates M&A in India”. Published in: International Tax Review, Issue:
M&A Tax Year Book: Vol. 16 15. V K Shobhana and N. Deepa (2012), Research Topic “Impact of Mergers and Acquisitions on the Shareholder Wealth of the Select Acquirer Banks in India: An
Event Study Approach” published in The IUP Journal of Bank Management, Vol. XI, No. 2.
VOLUME NO. 7 (2016), ISSUE NO. 08 (AUGUST) ISSN 0976-2183
INTERNATIONAL JOURNAL OF RESEARCH IN COMMERCE & MANAGEMENT A Monthly Double-Blind Peer Reviewed (Refereed/Juried) Open Access International e-Journal - Included in the International Serial Directories
http://ijrcm.org.in/
45
CHALLENGES FOR ORGANIZED RETAILING IN INDIA
VEENU JAIN ASST. PROFESSOR
DEPARTMENT OF COMMERCE & MANAGEMENT KAMLA LOHTIA SANATAN DHARAM COLLEGE
LUDHIANA
ABSTRACT After the entrance of ecommerce in India, the phase of retail industry has changed drastically Retailing is the interface between the producer and the individual consumer buying for personal consumption. This excludes direct interface between the manufacturer and institutional buyers such as the government and other bulk customers. The Indian Retail sector has come off age and has gone through major transformation over the last decade with a noticeable shift towards organised retailing. The retail market is expected to reach a whooping Rs. 47 lakh crore by 2016-17, as it expands at a compounded annual growth rate of 15 per cent, accordingy to the ‘Yes Bank - Assocham’ study. The retail market, (including organised and unorganised retail), was at Rs. 23 lakh crore in 2011-12. According to the study, organised retail, that comprised just seven per cent of the overall retail market in 2011-12, is expected to grow at a CAGR of 24 per cent and attain 10.2 per cent share of the total retail sector by 2016-2017.
KEYWORDS retailing, organised retail sector.
INDIAN RETAIL INDUSTRY ndian market has high complexities in terms of a wide geographic spread and distinct consumer preferences varying by each region necessitating a need for localization even within the geographic zones. India has highest number of outlets per person (7 per thousand) Indian retail space per capita at 2 sq ft (0.19 m2)/ person is lowest in the world Indian retail density of 6 percent is highest in the world. 1.8 million households in India have an annual income of
over4.5 million(US$66,555.00) The Indian retail industry is the fifth largest in the world. Comprising of organized and unorganized sectors, Indian retail industry is one of the fastest growing industries in India, especially over the last few years. Though initially, the retail industry in India was mostly unorganized, however with the tastes and preferences of the consumers, the industry is getting more popular these days and getting organized as well. Now with growing market demand, the industry is expected to grow at pace of 25-30% annually. The Indian retail industry is currently growing at a great pace and is expected to go up to US $ 833 billion by the year 2013. In the last four years’ consumer spending in India has climbed up to 75%. In India though, organized retail accounts for app. 5-6% of total retail revenues, however, with a young population, increasing disposable income, changing life styles and a robust economy India is set to emerge as one of the fastest growing organized retail markets in the world. Organized retailing refers to trading activities undertaken by licensed retailers, i.e. those who are registered for sales tax, income tax, etc. These include the corporate backed hypermarkets and retail chains and also the privately owned larged retail businesses. Unorganized retailing, on the hand, refers to the traditional formats of low cost retailing. Modern retailing formats in retail sector in India are becoming popular now a day. This is the sector which shows the maximum potential yet to be explored because, still 97-98% of total retail industry lies with unorganized sector. It means yet domestic as well as international organized retailers have the unexplored potential in Indian economy. Yet modern retailing is going through transition in India, upcoming modern formats have to face a very tough competition from traditional formats. People are not ready to give up habits and mind set for traditional mom and pop shop. And on the other hand, an ever- going variety of institutions, constantly buffeted by a highly fluid environment leads the unorganized sector to be fiercely competitive and innovatively oriented.
OBJECTIVES OF THE STUDY 1. To study the emerging retail formats in India 2. To study the growth trends of Indian retail sector 3. To study the challenges in the growth of organized retail sector
RESEARCH METHODOLOGY This paper is based on secondary data and Information has been sourced from various books, trade journals, government publications, newspapers etc
RETAIL FORMATS IN INDIA Hyper Marts/ Super Markets: large self – servicing outlets offering products from a variety of categories. Examples like Spencer’s, Big Bazaar.
Mom-and –pop Stores: they are family owned business catering to small sections; they are individually handled retail outlets and have a personal touch.
Departmental Stores: are general retail merchandisers offering quality products and services. Examples like Ebony, Shopper’s Stop, Westside.
Convenience Stores: are located in residential areas with slightly higher prices goods due to the convenience offered. Examples like in&Out, Safal, 6ten.
Shopping Malls: the biggest form of retail in India, malls offers customers a mix of all types of products and services including entertainment and food under a single roof.
E-trailers: are retailers providing online buying and selling of products and services.
Discount Stores: these are factory outlets that give discount on the MRP. Examples like Subhiksha, Koutons, Nike, and Levis.
Vending: It is a relatively new entry in the retail sector. Here beverages, snacks and other small items can be bought via vending machines.
Specialty Stores: are retail chains dealing in specific categories and provide deep assortment. Mumbai’s Crossword Book Store and RPG’s Music World is a couple
of examples.
CHALLENGES IN THE GROWTH OF ORGANIZED RETAIL SECTOR RETAIL NOT BEING RECOGNIZED AS AN INDUSTRY IN INDIA – Lack of recognition as an industry hampers the availability of finance to the existing and new
players. This affects growth and expansion plans.
THE HIGH COSTS OF REAL ESTATE – Real estate prices in some cities in India are amongst the highest in the world. The lease or rent of property is one of the
major areas of expenditure; a high lease rental reduces the profitability of a project. HIGH STAMP DUTIES – In addition to the high cost of real estate the sector also faces very high stamp duties on transfer of property, which varies from state to state (12.5% in Gujarat and 8% in Delhi). The problem is compounded by problems of clear titles to ownership, while at the same time land use conversion is time consuming and complex as is the legal process for settling of property disputes.
LACK OF ADEQUATE INFRASTRUCTURE - Poor roads and the lack of a cold chain infrastructure hampers the development of food and grocery retail in India. The
existing supermarkets and foods retailers have to invest a substantial amount of money and time in building a cold chain network.
I

VOLUME NO. 7 (2016), ISSUE NO. 08 (AUGUST) ISSN 0976-2183
INTERNATIONAL JOURNAL OF RESEARCH IN COMMERCE & MANAGEMENT A Monthly Double-Blind Peer Reviewed (Refereed/Juried) Open Access International e-Journal - Included in the International Serial Directories
http://ijrcm.org.in/
46
MULTIPLE AND COMPLEX TAXATION SYSTEM – The sales tax rates vary from state to state, while organized players have to face a multiple point control and system there is considerable sales tax evasion by small stores. In many locations, retailers have to face a multi point octroi with the introduction of value Added Tax (VAT) in 2005. There is price war between different retail organizations. Each and every one is saying to provide goods at low cost and offers various promo-tional schemes. In such a case it is difficult to keep one’s customers with oneself. Supply-chain inefficiencies -Supply chain needs to be efficiently-managed because it has a direct impact on the company’s bottomlines. Presently the Indian organised retail has an efficient supply chain but it appears efficient only when compared with the unorganised sector. On an international level the Indian organ-ised retailers fall short of international retailers like Wal-Mart and Carrefour in terms of efficiencies in supply chain. following are some key challenges that the retailers face during procuring goods from suppliers to delivering the same to end-customers are discussed.
Inventory management is the first challenge that retailers face at the local store level as well as at the warehouse level.
Logistics is another challenge related to the supply chain. It is imperative for any organised food and grocery retailer to establish a robust cold chain. Amul is the best example of this scenario, as it has developed a cold storage chain across India.
The third challenge related to the supply chain is procurement. Big organised retailers enjoy economies of scale based on their size and expansion plans. The economical benefits of scale in procurement are achieved when procurement is made in thousands or millions of units; however, the main challenge here is to procure adequate amount of stock according to customer requirements, failing which the resultant rise in inventory can affect bottomlines.
Challenges with respect to human resources - The Indian organised retail players shell out more than 7% of sales towards personnel costs. The high HR costs are essentially the costs incurred on training employees as there is a severe scarcity for skilled labour in India. The retail industry faces attrition rates as high as 50%, which is high when compared to other sectors also. Changes in career path, employee benefits offered by competitors of similar industries, flexible and better working hours and conditions contribute to the high attrition. Shrinkage - Retail shrinkage is the difference between the book value of stock and the actual stock or the unaccounted loss of retail goods. These losses include theft by employees, administrative errors, shoplifting by customers or vendor fraud. According to industry estimates, nearly 3-4% of the Indian chain’s turnover is lost on account of shrinkage. The organised industry players have invested IT, CCTV and antennas to overcome the problem of shrinkage. Global economic slowdown impacting consumer demand - The current contraction in overall growth has not been so severe ever since the one witnessed during World War II. The sub prime-triggered crisis in the US during end of 2007 gradually spread across other parts of the world; as a the fallout of this crisis, credit availability dropped sharply in advanced economies and their GDP growth contracted incessantly during the last quarter of 2008. The financial crisis continued to trouble advanced and developing economies in spite of policymakers’ attempts to replenish liquidity in these markets. Many financial institutions collapsed and filed for bankruptcy, as the situation got from bad to worse. Many banks/institutions made massive write-downs following this turn of events. During 2007-10, the write-downs on global exposures are expected to be worth US$ 4 trillion while the write downs on the US-originated assets alone are likely to be worth US$ 2.7 trillion11. Such massive write-down will affect the financial system to a grave extent, as it is likely to further strain banks’ funding capabilities. Already these write-downs are turning into a major challenge for banks/financial institutions because of solvency issues, and deepening risk of failure of banks/ financial institu-tions. Failure of the US investment bank Lehman Brothers, for instance, has had an enormous impact on the overall global financial system, and has consequently shaken the confidence of banks, investors, households etc. According to IMF’s World Economic Outlook (Apr 2009), the global GDP contracted by 1.8% in the first quarter of 2009 as compared with the 4.5% growth recorded during the same period in the previous year. Likewise, the advanced economies witnessed contraction in GDP growth (by 1.7%) during the last quarter of 2008 while the US, Euro area and Japan witnessed a recessionary trend12. According to IMF estimates, the world GDP will continue to contract by 2.4% during the third quarter of 2009. Going ahead, policymakers face a daunting task as they need to put back things as early as possible; according to IMF’s World Economic Outlook (Apr 2009), the world economy is expected to recover gradually only in 2010 by 1.9%, by corroborating demand, with appropriate monetary and fiscal measures. Consumption declines in the advanced economies Private consumption expenditure is an important indicator of overall economic growth. In the last couple of quarters, the decline in consumption has further affected the global economic downturn. Moreover, widespread financial crisis severely hit credit availability and household disposable income. For instance, US households lost 20% (US$ 13 trillion)14 of their net worth as a percentage of disposable income from the second quarter of 2007 to the fourth quarter of 2008. The stock prices across the world started falling during the second quarter of 2007 and continued its losses through-out 2008; the global stock markets lost between 40-60% in dollar terms that translated to a huge loss of global wealth in 2008. The personal disposable income (at current prices) in the US registered negative growth (3.9% and 2.1%) during the last two quarters of 2008, respectively. The consumer demand situation was aggravated further by reduced capital availability and consequent fall in investments. Price War- There is a price war between different retail organizations. Every one is saying to provide goods at low cost and offers various promotional schemes. In such a case it is difficult to keep one’s customers with oneself. Channel Conflicts: Globally, retailers maintain a direct relationship with their suppliers. Due to the complex taxation structure and geographical spread of the country, most FMCG companies have developed regional distribution and re-distribution network. Cutting out the distribution network will hurt the operating structure of distributors. 10. Unique Indian Customer: The Indian consumer experiencing modern retail has now warmed up to this idea. Buying habits have still not changed, where people prefer to buy most of the fruits and vegetables on a daily basis. The Indian consumers have a strong preference for freshly cooked food over packaged. Food mainly attributed to dietary patterns, poor electricity supply, low penetration of refrigerators and a family structure where one of the primary roles of the housewife’s is feeding the family. There is also an impact on the basket size because of non-availability of personal transport facilities, due to which the consumers prefer to buy smaller quantities from stores conveniently located near their homes.
CONCLUSION It can be concluded that after the entrance of ecommerce in India, the phase of retail industry has changed drastically Retailing is the interface between the producer and the individual consumer buying for personal consumption. This excludes direct interface between the manufacturer and institutional buyers such as the government and other bulk customers. The Indian Retail sector has come off age and has gone through major transformation over the last decade with a noticeable shift towards organised retailing. The retail market is expected to reach a whooping Rs. 47 lakh crore by 2016-17, as it expands at a compounded annual growth rate of 15 per cent, accordingy to the ‘Yes Bank - Assocham’ study. The retail market, (including organised and unorganised retail), was at Rs. 23 lakh crore in 2011-12. According to the study, organised retail, that comprised just seven per cent of the overall retail market in 2011-12, is expected to grow at a CAGR of 24 per cent and attain 10.2 per cent share of the total retail sector by 2016-2017.
REFERENCES 1. https://www.google.co.in/search?q=future+of+retailing+in+indis&oq=future+of+retailing+in+indis&aqs=chrome..69i57j0l5.8598j0j7&sourceid=chrome&e
s_sm=93&ie=UTF8#q=challenges+for+organised+retailing+in+india&start=30 2. http://www.retailngtoday.com/ 3. http://www.ibef.org/industry/retail-india.aspx 4. http://www.iracst.org/ijcbm/papers/vol4no22015/17vol4no2.pdf

VOLUME NO. 7 (2016), ISSUE NO. 08 (AUGUST) ISSN 0976-2183
INTERNATIONAL JOURNAL OF RESEARCH IN COMMERCE & MANAGEMENT A Monthly Double-Blind Peer Reviewed (Refereed/Juried) Open Access International e-Journal - Included in the International Serial Directories
http://ijrcm.org.in/
47
MAKE IN INDIA: AN AMBITIOUS PROJECT TO REVIVE INDIAN ECONOMY
YOGITA SHARMA ASST. PROFESSOR
PG DEPARTMENT OF COMMERCE BANARSI DASS ARYA GIRLS COLLEGE
JALANDHAR CANTT.
ABSTRACT Make in India is one of the major campaigns started by the Prime Minister of India, in September, 2014, the main objective of which was set manufacturing units and to increase the export rate and lower the import rate in India with the help of foreign investors. Requirement of skilled labor, ease of doing business, good infrastructure and low manufacturing cost are some basic Pre-requisites for the success of the Make in India campaign. In this review article the major challenges in the way of the campaign such as political stalemate, role of Indian states in the implementation of the concept, taxation, provision of basic and better infrastruc-ture, power supply, skilled manpower, reduced and easy paper work for getting relevant permissions etc. are discussed. Further, some major and recent break-throughs and achievements in some of the sectors including automobile, aviation, defence, construction, tourism and hospitality of Make in India campaign are also reviewed.
KEYWORDS Indian economy, make in India, challenges, sectors.
1. INTRODUCTION very major country like England, United State, Japan and China has a very strong manufacturing sector. The global export share of China is remarkably much higher than India. In India manufacturing contributes 2% of GDP globally1. For small countries like Thailand, the contribution of the manufacturing sector to their GDP is 36%, Indonesia and Malaysia it is approximately 25%2. In order to increase the GDP share, the Make in India campaign was inaugurated by
Prime Minister Narender Modi in September, 2014 to revive the Indian economy. This wide ambitious campaign gained a wide range of popularity nationally as well as across the borders. The concept of Make in India is quite different from the concept of Made in India. Made in India refers to the goods which are manu-factured in India, whereas the concept of Make in India is of different perspectives. In India, we import more as compared to export. As a result, a lot of money is going outside the country. India has a great potential to be a great manufacturing hub as far as the resources are concerned.
2. OBJECTIVES Through Make in India, an open invitation to the foreign companies is made to invest and set manufacturing units in India. The main concept of Make in India is to manufacture more in India and increase the export rate and lower the import rate. To be a potential manufacturing hub, there are four basic requirements; skilled labor, ease of doing business, good infrastructure and low manufacturing cost. A number of students throughout the country enroll themselves in various technical and job- oriented diploma and degree courses such as mechanical, engineering, electronics etc. Moreover present government is also setting and sup-porting skill development centre in the country to provide highly skilled workforces- the basic requirement of the Make in India concept. The creating infrastructure of global standards is possible in India. Global standards mean creating an environment to operate technology intensive manufacturing units3. The main problems which persist in India for doing business are the strict rules and regulations, a lot of documentation, getting different types of permissions from different govern-ment agencies and regulators which delay the process of setting manufacturing units along with a great deal of humiliation and wasting valuable time. These problems are thoroughly addressed in Make in India. For ease of doing business, paperwork is reduced to a minimum, easy approvals from different regulators, minimum human intervention, and maximum response and help when it comes to support and grievance redressal. Thus, the role of the government will be a facilitator rather than a regulator. Another important issue addressed in Make in India concept is the manufacturing cost. As compared to China, India is a better option for labor at low cost. Significant tax incentives, subsidies, enabling the conditions to make industries to do well in manufacturing will reduce the manufac-turing cost, ultimately leading to increase the rates of export. Through this campaign, there will be a critical evaluation of selected domestic companies having leadership in innovations and new technologies for turning them into global champions, boosting trade and economic growth. The direct and indirect outputs of the Make in India concept are; more job opportunities reducing unemployment, high purchasing power to better-living styles, better state of the art of infrastruc-ture, smart cities etc. The major 25 sectors identified to give a trust and push and the focus centers of the Make in India campaign are automobiles, food processing, renewable energy, automobile components, IT and BPM, roads and highways, aviation, leather industries, space, biotechnology, media and entertainment, textiles and garments, chemicals, mining, thermal power, construction, oil and gas, tourism and hospitality, defence, manufacturing pharmaceuticals, electrical machinery, ports, electronic systems and railways etc. The Indian government has set an ambitious target of enhancing the manufacturing output contribution to 25% of GDP by 2025 along with 90 million domestic jobs4. According to a Washington-based development institution, India is going to overtake China to clinch the position of the world’s fastest growing, big economy by 2016-17. According to World Bank, India is going to be Asia’s third-largest economy in spite of declining GDP globally
3. CHALLENGES IN THE WAY OF MAKE IN INDIA The concept of Make in India is undoubtedly an inspiring initiative of the Indian government which has reduced the risk factors for investing in India for many big foreign industries, but the pace of the progress is slower as decided and predicted5,6. In this section, the main hurdles and barriers which are responsible for this slow pace are discussed. 3.1. POLITICAL STALEMATE Political stalemate or gridlock is of major concern among the policymakers, analysts and investors. Session by session the working of the parliamentary affairs is interrupted and delaying the approval of important bills in the parliament houses owing to political gridlock. As a result, the economy and the mindsets of the investors are confused. Important bills and reforms such as land acquisition and labor and Goods and Services Tax (GST) are some examples. GST is the most important and critical reform, required for smooth and efficient business for ensuring low cost and improve tax revenues. Critical economic reforms required for the implementation of Make in India programme still need approvals from both houses of the Indian parliament. Foreign investors, who are attracted by ambitious promises, may opt for other options after getting frustrated by this political stalemate. Global rating agencies are also worried about the slow pace of reforms in India. The political logjam may lead to uncertainties and low interest of the overseas investors. 3.2. ROLE OF INDIAN STATES The role of the Indian states is very crucial in the implementations and success of the Make in India initiative. India with a federal political system like the United States has a large and versatile geographical and demographical distribution. The involvement and cooperation of state-level decision-makers, political leaders and authorities in a positive way is the basic requirement for the grand success of the new initiative. But it seems to be a dream as many of the now-NDA governed states are hesitating in its implementations. In contrast, many of the NDA led states have implemented this concept and even developed some copycat state-led
E

VOLUME NO. 7 (2016), ISSUE NO. 08 (AUGUST) ISSN 0976-2183
INTERNATIONAL JOURNAL OF RESEARCH IN COMMERCE & MANAGEMENT A Monthly Double-Blind Peer Reviewed (Refereed/Juried) Open Access International e-Journal - Included in the International Serial Directories
http://ijrcm.org.in/
48
investment schemes such as “Make in Madhya Pradesh” by BJP led Madhya Pradesh state government. Thus to make this concept of Make in India a success, a common consensus among the states is to be made to achieve national progress. 3.3. BASIC AND BETTER INFRASTRUCTURE No business can succeed without the availability of high quality and modern infrastructure. Industrial zone equipped with basic needs of modern and high-speed communication technologies, integrated logistic arrangements, regular power supplies, connectivity to transporting areas, ease of availability of raw materials etc. No infrastructure is possible without the availability of land. This requires a new, transparent, effective and equitable land acquisition law. However, the approval of such laws is interrupted due to political gridlock. 3.4. POWER SUPPLY There are many villages in many of the Indian states where still there is either the limited power supply or no power supply. Thus providing the basic need of the industry i.e. power supply is the major issues to be dealt with. Throughout the country, power failures and brownouts are very common endemic particularly in summers, making Make in India a challenge. India is running short of power with a deficit of ~ 5.1%. The Comptroller and Auditor General (CAG) recently claimed a loss of $37 billion due to lack of transparency in the allocation of the coal blocks7. Under these conditions, the government first should plan to reduce the nationwide deficit in power generation. 3.5. SKILLED MANPOWER Another hurdle in the path of Make in India is the shortage of skilled manpower. A nation requires skilled human resources in order to prosper and move atop in the global scenario. Indian comes second after China as far as its population statistics are concerned. In spite of this, India is still in the list of developing countries. No doubt the power of the India is its youth, but this power is not utilized in a fruitful manner. The youth is not skilled in a right way and the major reason for this is our education system. In spite of mushrooming of educational institutions in the last two decades, skilled manpower is limited. The curriculum is not updated according to the needs and demands. Even no skilled trainers, teachers and instructors are employed in these educational institutions. The students are educated theoretically rather than practically. The majority of the talented students passing out from the different universities and colleges move to foreign countries as the incentives are three to four time in foreign countries as compared to India. This issue of brain drain and migration is still another cause of the shortage of skilled manpower in India. The inadequacy of the skilled manpower has a direct effect on the country’s GDP and economic progress. However, in order to tackle this problem Indian government have started ‘SKILL INDIA program’ the main aim of which is to develop multi-skill development programme with a mission for better and highly payable employment and entrepreneurship for all socio-economic classes. 3.6. TAXATION India is ranked 142nd in the list of 189 countries when it is assessed for ease of doing business. The complex taxation system, a huge amount of paperwork and corruption may be the main cause of worries among the investors. Although, various steps have been taken to provide a conducive environment and platform for doing business through Make in India initiative though still beyond realities.
4. SECTOR WISE DEVELOPMENTS In a major boost to the 'Make in India' initiative, the Government has received confirmation from top technology firms such as GE, Bosch, Tejas and Panasonic regarding their decision to invest in the electronic, medical, automotive and telecom manufacturing clusters in India. "We have received 57 investment proposals of over Rs 19,000 crore (US$ 3.05 billion) of which 30 proposals worth Rs 6,500 crore (US$ 1.04 billion) have been approved," said Ravi Shankar Prasad, Union Minister of Communications and Information Technology, Government of India. 4.1. AUTOMOBILE SECTOR Being the 7th largest producer of vehicles, 2nd largest two-wheeler manufacturer, and fifth largest commercial vehicle manufacturer in world, Indian auto industry contributes approximately 7.1 per cent of the GDP and is expected to rise to impressive 3rd position by 20168. India is also a prominent auto exporter and has strong export growth expectations for the near future. As compared to April 2014-January 2015, the registration of export commercial vehicles grew by 18.36 % in April 2015-January 2016. With the collaborative efforts of the Indian Government and major automobile manufactures, India is expected to be the world leader in the manufacturing and export of two and four wheelers in the world by 20209. Some of the paramount initiative taken by Indian government include; setting up of an independent Department for Transport, to resolve issues related to fuel technologies, motor body specifications and fuel emissions; 100% FDI to encour-age foreign investors to invest in the automobile sector; ‘Make in India’ initiative and Auto Mission Plan (AMP) 2016-26 to triplicate passenger vehicle units by 2026; announcement of US$ 124.71 billion in agriculture sector in the Union budget of 2015-16 to increase the tractor segment sales; inculcation of Industry/pri-vate sponsored research programs; tax incentives for companies with in-house research and development centre; promotion of eco-friendly CNG based, hybrid and electric vehicle to reduce carbon dioxide emission under National Electric Mobility Mission 2020 along with exempted basic custom duty (BCD) on lithium ion automotive battery manufacturers; establishment of Regulatory Framework under the Ministry of Shipping, Road Transport and Highways and incentives provision in rebates in land cost, stamp duty relaxations on sale, subsidized power tariffs, concessional interest rates on loans etc10,11. The recent developments and the investments which are being either made or expected to be made under ‘Make in India’ campaign are given below. Suzuki, Toyota and Nissan (Japan) - For make in India campaign about $11-12 billion is expected to be invested by Japan in India. From April 2000 to September 2015, India has received $19.16 billion FDI from Japan. Many car manufacturing companies like Suzuki, Toyota and Nissan are already well known names. For the first time Suzuki company, in collaboration with Indian Maruti company will manufacture car in India and will export them to Japan from January 2016. According to R C Bhargava, the chairman of Maruti Suzuki company the export will be of ‘Baleno’ at a rate of 20,000 to 30,000 per annum12. Toyota Motor Corporation will invest Rs 1,000 crore in coming years for setting up new plants in India13. Renault-Nissan-a collaboration of French Renault SA and Nissan Motor Japan is expected to invest Rs 4,200 crore in Chennai (Tamilnadu) for the expansion of its already existing plant14. General Motors and Ford (USA) - General Motors from USA is expected to invest $1 billion in India at its Talegaon plant situated in Maharashtra to launch 10 new Chevrolet models during the next five years as announced by General Motors CEO Mary Barra. The company has set a target of exporting 40,000 units in 201615.Ford Motor Corporation another USA car manufacturer will increase its present capacity from 200,000 cars and 340,000 engines at its Chennai based manufacturing plant. For this, the company has planned to invest Rs. 2.4 lakh crore. The company has also started a new manufacturing unit at Sanand, Gujarat in March 2015 with an investment of about $1 billion to produce Ford Aspire sedan and Figo hatch16. Volkswagen and BMW (Germany) - Volkswagen a German car making company has planned to invest 15 billion rupees ($250 million) during next 5-6 years to increase its plant capacity from 130,000 to 200,000 cars per year. Another renowned car making company from Germany, BMW has increased its investment from 5.3 billion Indian Rupees in 2012 to 6.4 billion Indian Rupees in 201517. 4.2. AVIATION Aviation market of India is one of the fastest growing markets. At present India is the ninth largest Aviation market of the world where its market size is about US $ 16 billion18. India has set the target of becoming 3rd largest aviation market by 2020 and then to be the largest aviation market of the world by 203019. For majority of the Indian population air transport is still a luxurious but expensive mode of travelling. So there is a big untapped market where so much growth opportunities are available and this target can be achieved with proper focus on quality, cost, passenger interest and appropriate policies. In order to achieve these targets, Foreign direct investment limit was raised in the defence sector by the NDA government from 26 per cent to 49 per cent. An agreement was signed between Shelley Lavender, the president of Boeing Military Aircraft and Sukaran Singh, director of Tata Advanced Systems Limited (TASL) regarding collaboration of aerostructures for Boeing’s commercial and military aircraft manufacturing20. Honeywell Aerospace India is going to invest in the next generation of Indian aerospace engineers and pilots. A licence has given by Honeywell Aerospace to Tata Power Strategic Engineering Division to manufacture Honeywell’s Tactical Advanced Land Invigator in India21. Jeff Immelt, the Chairman and CEO of General Electric describe India as the ‘growth engine for Asia’. The company has made the investment of $3 billion in the country in the last 5 years. Company is very much interested to invest in india in rail, power and healthcare to develop its infrastructure. The company announced a $200 million investment in its multi-modal manufacturing facility in Pune, Maharashtra22.

VOLUME NO. 7 (2016), ISSUE NO. 08 (AUGUST) ISSN 0976-2183
INTERNATIONAL JOURNAL OF RESEARCH IN COMMERCE & MANAGEMENT A Monthly Double-Blind Peer Reviewed (Refereed/Juried) Open Access International e-Journal - Included in the International Serial Directories
http://ijrcm.org.in/
49
4.3 CONSTRUCTION Construction industry is the 2nd largest Indian industry after agriculture. It contributes about 11% of India’s GDP. This sector provides employment to more than 35 million people in India23. It has three main segments i.e. real estate construction, infrastructure and other industrial activities. Under Make in india campaign the requirement of minimum area and capitalization have been waived which means that FDI is allowed in very small projects also. Swachh Bharat Mission, Smart cities project and ‘Housing for All by 2022’ like projects of Indian government are definitely going to increase the pace of growth of construction industry24. Following companies have shown their keen interest in construction industry of India. Hines-ADIA: A residential project having a capacity of 600 apartments is going to be constructed by Hines-ADIA and Conscient Developers with an investment of about 400-500 crore in the Golf Course Extension Road area, Gurgaon25. Tishman Speyer (USA): In a joint venture, Singapore’s sovereign wealth fund GIC and Tishman Speyer- New York-based real estate firm, through Tishman Speyer’s Waverock office development project invested Rs. 1,000 crores in Gachibowli- a Special Economic Zone promoted by the TSIIC (Telangana State Industrial Infra-structure Corporation, Hyderabad) comprising 2.5 million square feet area for over 20,000 professionals from companies like TCS, Accenture, DuPont, Cap Gemini and BirlaSoft. It is noteworthy to mention that the 1.5 million square feet area has already been constructed26. Another Singapore based IT park specialist-Ascendas Group will invest about 1 billion USD to expand its technology parks in major cities like Pune, Bangalore and Hyderabad along with setting up new IT park in Gurgaon27. 4.4. DEFENCE India has the third largest armed force in the world. 60% of the defence equipments is imported. In order to foreshorten the import, foreign exchange and security issues concerned there is tremendous requirement to manufacture these equipments in India. Through defence procurement policy, in make in India initiative, the manufacturing share is to be increased from 15% of Gross Domestic Product (GDP) to 25 % along with generating employment opportunities of ten million per annum. Here is a brief detail about the companies which have either invested or are going to invest in the defence sector. Lockheed Martin: Phil Shaw, chief executive, Lockheed Martin India, has expressed his keen interest to manufacture F-16 aircraft in India28. Boeing India: An offer of manufacturing F/A-18 fighter jets is made by Boeing. A research centre is going to be expanded by Boeing in Bengaluru. Boeing has also given indication of making investment in those Indian companies which are engaged in the production of aeronautical components29. Raytheon: Negotiations are going on between The Indian Air Force(IAF) and Raytheon for buying two intelligence, surveillance, target acquisition reconnaissance (ISTAR) aircraft for about $350 million each so that ground detection capabilities of India can be increased30. 4.5. TOURISM AND HOSPITALITY One of the fastest and biggest growing sector in the economy is the Tourism sector in the global economy having several positive and negative effects like cultural, economic, social and environmental etc. It contributes remarkably to the GDP of a country through the growth of transport, hotels, shopping, restaurants and entertainment etc. In India tourism and hospitality contributed nearly US$ 187.9 billion or 12.5 per cent to the GDP in 2014-1531. Due to a rich historical culture and heritage, Indian tourism has huge potential to attract tourists from around the globe. Additionally, this sector is also helpful in earning foreign exchange and creating numerous employment opportunities. Accor: Accor, a French hospitality chain has plan of opening approximately 12 hotels across brands in India and to invest $ 280 million for adopting a new digital technology which would improve the database of its customers worldwide32. Embassy: Embassy Group, which is the promoters of Embassy Office Parks is going to invest Rs. 1,100 crore in Bengaluru for hotel, commercial and residential project renamed as “EmbassyONE”33. Starwood: Starwood Hotels and Resorts have plan of opening five new properties in India in Tier 1 and Tier 2 markets which will make India 3rd largest market for Starwood in terms of number of hotels34. Jumeirah: Jumeirah Group, a Dubai based luxury hotel chain has plan to establish its first property of about $2.5 billion in Mumbai, India by 2019 under the brand name of Jumeirah35.
CONCLUSION
To conclude, the concept of Make in India is a very promising and innovative initiative started by Indian government. The direct and indirect outputs of the Make in India concept include more job opportunities reducing unemployment, high purchasing power to better-living styles, better state of the art of infrastructure, smart cities etc. The role of the government is to be a facilitator rather than a regulator. Through this campaign, selected domestic companies with leadership in innovations and new technologies are also evaluated for boosting trade and economic growth and for turning them into global champions. The campaign is still in its initial stages so it will be very early to predict its success.
REFERENCES 1. http://articles.economictimes.indiatimes.com/2015-09-05/news/66241311_1_growth-engine-india-support-jeff-immelt 2. http://articles.economictimes.indiatimes.com/2016-03-16/news/71573537_1_ireo-conscient-abu-dhabi-investment-authority 3. http://auto.economictimes.indiatimes.com/news/industry/automotive-mission-plan-2016-26-unveiled-here-are-the-key-highlights/48772090. 4. http://economictimes.indiatimes.com/industry/auto/news/passenger-vehicle/cars/toyota-to-invest-over-rs-1000-crore-in-india-doesnt-rule-out-daihatsus-
entry/articleshow/48767359.cms 5. http://economictimes.indiatimes.com/news/defence/boeing-keen-to-make-f/a-18-fighters-in-india-ceo-dennis-a-muilenburg/articleshow/50827817.cms 6. http://indiabudget.nic.in/budget2015-2016/budget.asp 7. http://indiainbusiness.nic.in/newdesign/index.php?param=industryservices_landing/385/3 8. http://indianexpress.com/article/india/india-news-india/make-in-india-has-become-a-movement-in-japan-pm-modi/ 9. http://m.arabianbusiness.com/nakheel-seeks-grow-2-5bn-indian-investment-portfolio-611062.html 10. http://m.dailyhunt.in/news/india/english/live-mint-epaper-livemint/make-in-india-key-for-honeywell-arijit-ghosh-newsid-50908217 11. http://mfgtechupdate.com/2015/07/make-in-india-challenges-and-opportunities-for-manufacturing-sector/ 12. http://thediplomat.com/2014/02/why-india-must-revive-its-manufacturing-sector/ 13. http://www.allonmoney.com/investments/make-in-india-event-narendra-modi/ 14. http://www.bloomberg.com/news/articles/2016-02-18/lockheed-martin-offers-to-build-f-16-jets-in-india-in-modi-push 15. http://www.business-standard.com/article/pti-stories/starwood-hotels-to-open-5-more-properties-in-india-in-2016-116012001216_1.html 16. http://www.dnaindia.com/india/report-french-hospitality-chain-accor-aim-to-start-12-hotels-by-this-year-end-2069096 17. http://www.dnaindia.com/money/report-renault-nissan-plans-to-invest-rs-5000-crore-to-expand-tamil-nadu-plant-2079860 18. http://www.financialexpress.com/article/companies/bmw-financial-services-steps-up-investment-in-india/144488/ 19. http://www.financialexpress.com/article/industry/automobiles/general-motors-to-invest-1-bn-in-india-lines-up-10-models/110094/ 20. http://www.hindustantimes.com/columns/5-major-challenges-to-modi-s-make-in-india/story-9GpB3TxSZUlEusYmb91MHI.html 21. http://www.ibef.org/industry/indian-aviation.aspx 22. http://www.indianconstructionindustry.com/overview.html. 23. http://www.makeinindia.com/home 24. http://www.makeinindia.com/sector/automobiles 25. http://www.newindianexpress.com/auto/Ford-India-Making-Fresh-Investment-in-Chennai-Plant/2015/09/17/article3033119.ece 26. http://www.smartindustryblog.com/wordpress/asia/challenges-of-the-make-in-india-campaign/ 27. http://www.supportbiz.com/articles/top-story/make-india-country-sets-ambitious-target-manufacturing-output.html

VOLUME NO. 7 (2016), ISSUE NO. 08 (AUGUST) ISSN 0976-2183
INTERNATIONAL JOURNAL OF RESEARCH IN COMMERCE & MANAGEMENT A Monthly Double-Blind Peer Reviewed (Refereed/Juried) Open Access International e-Journal - Included in the International Serial Directories
http://ijrcm.org.in/
50
28. http://www.supportbiz.com/articles/top-story/make-india-country-sets-ambitious-target-manufacturing-output.html 29. http://www.thehindu.com/business/Industry/boeingtata-advanced-systems-sign-pact-for-aerospace-defence-manufacturing/article7425482.ece 30. http://www.thehindu.com/features/homes-and-gardens/indias-construction-sector-to-boom/article8314034.ece. 31. http://www.thehindubusinessline.com/companies/embassy-group-to-invest-1100-cr-to-complete-four-seasons-hotel/article7566357.ece 32. http://www.thehindubusinessline.com/economy/policy/iaf-in-talks-with-raytheon-for-surveillance-aircraft/article7945465.ece 33. http://www.thehindubusinessline.com/info-tech/singapore-it-park-firm-ascendas-plans-expansion-in-india/article7908637.ece 34. http://www.thehindubusinessline.com/news/real-estate/gic-to-invest-in-tishman-speyers-waverock-project-in-hyderabad/article7792942.ece 35. https://en.wikipedia.org/wiki/Automotive_industry_in_India

VOLUME NO. 7 (2016), ISSUE NO. 08 (AUGUST) ISSN 0976-2183
INTERNATIONAL JOURNAL OF RESEARCH IN COMMERCE & MANAGEMENT A Monthly Double-Blind Peer Reviewed (Refereed/Juried) Open Access International e-Journal - Included in the International Serial Directories
http://ijrcm.org.in/
51
MAKE IN INDIA: OPPORTUNITIES AND CHALLENGES
JASMINE KAUR ASST. PROFESSOR
DEPARTMENT OF COMMERCE SGND KHALSA COLLEGE UNIVERSITY OF DELHI
DELHI
ABSTRACT Manufacturing sector is the backbone of any economy. It fuels growth, productivity, employment, and strengthens the agricultural sector and the service sector. With, the gradual slowdown of the world economy and slowing down of consumption demand, it is pertinent to strengthen the country’s manufacturing export growth by overcoming the bottlenecks of high cost of capital, lack of economies of scale, inflexible labour laws, inadequate infrastructure, lack of branding, trade barriers etc. Through this paper, I attempt to identify the problems faced by the manufacturing sector in the first part of the paper. In the second part of the paper I critically examine the newly launched Make in India initiative and analyse its strength, weakness, opportunity and threat. And try to find out whether the efforts of the government to make manufacturing a key engine for India’s economic growth are giving fruitful results.
KEYWORDS GDP, manufacturing sector, growth, make in India.
JEL CODES L6, N15, D24.
1. INTRODUCTION ake in India” campaign aims to develop and foster the manufacturing industry of the country by attracting and facilitating foreign and domestic busi-nesses’ to manufacture in India. Apart from increasing the contribution of manufacturing in GDP to 25 per cent, the initiative aims to create quality jobs through developing an innovative ecosystem. Under the initiative, 25 sectors have been identified for creating a business friendly environment. Conse-
quent with the launch of “Make in India”, there was approximately 40 per cent increase in Foreign Direct Investment (FDI) inflows during October, 2014 to June, 2015 over the corresponding period of the previous year. Furthermore, supplementary initiatives, like ease of doing business, have added to the global competi-tiveness of the country reflected in the improvement in India’s ranking (increased by 16 rungs) as per the Competitiveness Index of the World Economic Forum. One unique feature of Indian economy is the high share of services in GDP. While the manufacturing sector has a minor share in GDP, it is necessary to underline the importance of this sector, which has a large multiplier effect for the economy, with not only meeting domestic demand with a consequent reduction import dependence and providing employment opportunities to people especially technically less skilled workers. Hence, the recently unveiled initiatives like the “Make in India, “Invest India” and Ease of Doing Business in India are imperative to achieve the necessary growth in the manufacturing sector in a country like India, where the majority of the population has limited education opportunities. Indian economy has experienced a promising rate of growth over the past years, even in the backdrop of sluggish performance of the world economy. However, a dampening scenario of the manufacturing sector in the country is a cause of concern. Dampening merchandise exports is another cause of concern, which are contracting since December 2014. Manufactured goods have declined by 4.1 per cent in the financial year 2015-16, within which electronic and engineering goods have decreased drastically. A recent OECD paper (2015) highlighted the problem of low productivity in the manufacturing sector owing to the preponderance of small manufacturing firms who fail to take advantage of economies of scale, which they suggested was primarily due to restrictive policies and tax avoidance. Nevertheless, for the year 2014-15, Central Statistics Office, share of manufacturing sector in Gross Domestic Price (GDP) at current prices is approximately at 15 per cent. The highest share within the manufacturing sector is of “other manufactured goods” (37%) followed by “Machinery and Equipment” (20%). Comparing India’s share of manufacturing sector in GDP with other countries depicts a challenging picture. While it is not surprising that share of India’s manufac-turing sector is considerably less than that of China’s, it is indeed striking that it is smaller (albeit marginally) than some of the neighbouring countries like Sri Lanka and Bangladesh. Given the recent slowdown of the Chinese economy and it losing its cost competiveness, this is an opportune time for India to firm up its manu-facturing sector so that it becomes robust and competitive.
FIGURE I: COUNTRY-WISE COMPARISON OF MANUFACTURING, VALUE ADDED (% of GDP)
Source: World Bank, 2014
However, there is a need to resolve some fundamental problems inherent in the sector, here, both the Government and the industry needs to be fully committed to enhancing the productivity of the sector. The State Governments need to have transparent and flexible rules and regulations relating to the land and labour within their territories. The Central Government needs to come up with clear national policies, especially relating to taxation, to build up industry confidence in
35.9
18.8 17.4 17.113.9 13.3
10.98.6
6.5 5.0
0.0
5.0
10.0
15.0
20.0
25.0
30.0
35.0
40.0
M
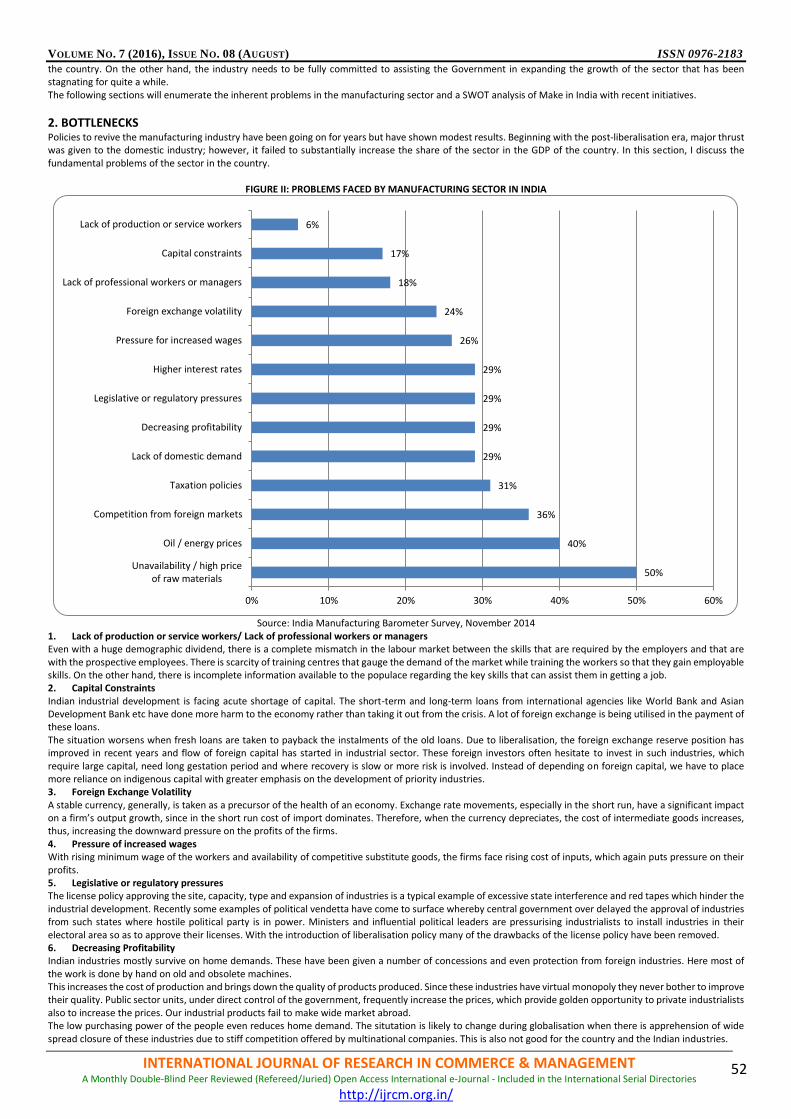
VOLUME NO. 7 (2016), ISSUE NO. 08 (AUGUST) ISSN 0976-2183
INTERNATIONAL JOURNAL OF RESEARCH IN COMMERCE & MANAGEMENT A Monthly Double-Blind Peer Reviewed (Refereed/Juried) Open Access International e-Journal - Included in the International Serial Directories
http://ijrcm.org.in/
52
the country. On the other hand, the industry needs to be fully committed to assisting the Government in expanding the growth of the sector that has been stagnating for quite a while. The following sections will enumerate the inherent problems in the manufacturing sector and a SWOT analysis of Make in India with recent initiatives.
2. BOTTLENECKS Policies to revive the manufacturing industry have been going on for years but have shown modest results. Beginning with the post-liberalisation era, major thrust was given to the domestic industry; however, it failed to substantially increase the share of the sector in the GDP of the country. In this section, I discuss the fundamental problems of the sector in the country.
FIGURE II: PROBLEMS FACED BY MANUFACTURING SECTOR IN INDIA
Source: India Manufacturing Barometer Survey, November 2014
1. Lack of production or service workers/ Lack of professional workers or managers Even with a huge demographic dividend, there is a complete mismatch in the labour market between the skills that are required by the employers and that are with the prospective employees. There is scarcity of training centres that gauge the demand of the market while training the workers so that they gain employable skills. On the other hand, there is incomplete information available to the populace regarding the key skills that can assist them in getting a job. 2. Capital Constraints Indian industrial development is facing acute shortage of capital. The short-term and long-term loans from international agencies like World Bank and Asian Development Bank etc have done more harm to the economy rather than taking it out from the crisis. A lot of foreign exchange is being utilised in the payment of these loans. The situation worsens when fresh loans are taken to payback the instalments of the old loans. Due to liberalisation, the foreign exchange reserve position has improved in recent years and flow of foreign capital has started in industrial sector. These foreign investors often hesitate to invest in such industries, which require large capital, need long gestation period and where recovery is slow or more risk is involved. Instead of depending on foreign capital, we have to place more reliance on indigenous capital with greater emphasis on the development of priority industries. 3. Foreign Exchange Volatility A stable currency, generally, is taken as a precursor of the health of an economy. Exchange rate movements, especially in the short run, have a significant impact on a firm’s output growth, since in the short run cost of import dominates. Therefore, when the currency depreciates, the cost of intermediate goods increases, thus, increasing the downward pressure on the profits of the firms. 4. Pressure of increased wages With rising minimum wage of the workers and availability of competitive substitute goods, the firms face rising cost of inputs, which again puts pressure on their profits. 5. Legislative or regulatory pressures The license policy approving the site, capacity, type and expansion of industries is a typical example of excessive state interference and red tapes which hinder the industrial development. Recently some examples of political vendetta have come to surface whereby central government over delayed the approval of industries from such states where hostile political party is in power. Ministers and influential political leaders are pressurising industrialists to install industries in their electoral area so as to approve their licenses. With the introduction of liberalisation policy many of the drawbacks of the license policy have been removed. 6. Decreasing Profitability Indian industries mostly survive on home demands. These have been given a number of concessions and even protection from foreign industries. Here most of the work is done by hand on old and obsolete machines. This increases the cost of production and brings down the quality of products produced. Since these industries have virtual monopoly they never bother to improve their quality. Public sector units, under direct control of the government, frequently increase the prices, which provide golden opportunity to private industrialists also to increase the prices. Our industrial products fail to make wide market abroad. The low purchasing power of the people even reduces home demand. The situtation is likely to change during globalisation when there is apprehension of wide spread closure of these industries due to stiff competition offered by multinational companies. This is also not good for the country and the Indian industries.
50%
40%
36%
31%
29%
29%
29%
29%
26%
24%
18%
17%
6%
0% 10% 20% 30% 40% 50% 60%
Unavailability / high priceof raw materials
Oil / energy prices
Competition from foreign markets
Taxation policies
Lack of domestic demand
Decreasing profitability
Legislative or regulatory pressures
Higher interest rates
Pressure for increased wages
Foreign exchange volatility
Lack of professional workers or managers
Capital constraints
Lack of production or service workers

VOLUME NO. 7 (2016), ISSUE NO. 08 (AUGUST) ISSN 0976-2183
INTERNATIONAL JOURNAL OF RESEARCH IN COMMERCE & MANAGEMENT A Monthly Double-Blind Peer Reviewed (Refereed/Juried) Open Access International e-Journal - Included in the International Serial Directories
http://ijrcm.org.in/
53
7. Low Demand The reason for low demand for industrial products in the country arises due to low consumption level, weak purchasing power and poor standard of living. The domestic market is predominately underdeveloped through lack of enthusiasm generated by the middle and upper class segment who do not wish to raise their standard and improve their living conditions. 8. Taxation Policies India is a federal country, with the Union and State governments levying their own set of taxes, which becomes cumbersome for a firm that works beyond the boundaries of a few states. Thus, a single taxation system, like the Goods and Services Tax (GST) will be a step in the right direction, if it is passed by the Parliament. 9. Competition from foreign markets Goods produced in the country, have to either be consumed domestically or have to be exported. Here, the biggest factor of the saleability of the product is its price, which is affected by the cost of inputs, taxes and export tariffs. If these rates of these factors are high, then it may reduce the demand of the product. 10. Oil/Energy Prices Fuel costs are an important factor in factory inputs. Given that India is majorly dependent on oil imports, it gains greater significance. However, with the recent slump in oil prices, pressure from this factor has eased. 11. Unavailability/high price of raw materials Availability and affordability of raw materials are one of the biggest concerns of manufactures. In the increasingly globalised world, the capacity of the market to absorb these cost fluctuations decreases, as it becomes harder for industries to shift their cost burden to consumers because of availability of cheaper similar products. Indian Agricore, which is the major source of industrial raw material, is still dependent on the monsoon. Natural calamities like drought, famine, flood etcseriously affect agricultural production as well the supply of industrial raw material. Failure of monsoon even affects the purchasing power of the people and the demand for industrial products. It sometimes creates surplus in the market and industrial plumpness. Cement industry is recently facing such crisis.A situation of drought even affects hydel generation, leading to energy crisis, more pressure on railways to transport coal and on thermal power sector for higher output. This leads to a chain of crises that have interlinking sinking effect. Additionally, despite all efforts India has not been able to attain self-sufficiency as far as industrial material is concerned. India is still dependent on foreign imports for transport equipment’s, machineries (electrical and non-electrical), iron and steel, paper, chemicals and fertilisers, plastic material etc. Out of the total industrial production consumer goods contribute only 38 per cent. In newly industrialised countries like Singapore, South Korea and Malaysia this percentage is 52, 29 and 28 respectively. This clearly shows that import substitution is still a distant goal for the country and efforts have to be seriously directed towards it. An inadequate infrastructural facility is another major problem faced by the Indian manufacturing industries. Energy crisis has a huge influence on the industrial development and production. The result of which are power cuts and rostering which hampers the industrial production. Most of the State Electricity Boards are running in loss and are in miserable condition. Rail transport is overburdened while road transport is plagued with several problems. Even national highways in many places are in bad shape. Telecommunication facilities are mainly restricted to big cities. In India, most of the industries are located in few selected areas leaving out vast expanse of the country devoid of industrial establishments. Most of the industries are located in and around metropolitan cities like Mumbai, Kolkata, Delhi etc. While the states like Maharashtra, Gujarat, Tamil Nadu etc are well ahead in industrial development others like Meghalaya, Manipur, Jammu and Kashmir, Himachal Pradesh, Tripura, Orissa, Assam etc. are far behind. This has not only created regional imbalance and regional disparity but may also give rise to serious problems like unrest, violence and terrorism. Industrial locations, in several instances, were established without reference to the most important decision making criteria i.e. cost-effectiveness. Most of the location decisions are often politically motivated, each state clamors for the establishment of major industries in the public sector within its boundaries
3. MAKE IN INDIA The Government launched the Make in India initiative in 2014 with the aim to make India a manufacturing hub while eliminating the unnecessary laws and regulations, making bureaucratic processes easier, make government more transparent, responsive and accountable and to take manufacturing growth to 10% on a sustainable basis. Make in India aims to make the Indian manufacturing industry more competitive by easing the rules and regulations in the country to make it more attractive for both domestic and foreign investors. The mission presently is emphasizing on 25 sectors for reviewing the manufacturing sector. Make in India initiative focuses on the following 25 sectors of our economy, namely:
Automobiles
Automobile Components
Aviation
Biotechnology
Chemicals
Construction
Defence manufacturing
Electrical Machinery
Electronic systems
Food Processing
Information Technology and Business process management
Leather
Media and Entertainment
Mining
Oil and Gas
Pharmaceuticals
Ports and Shipping
Railways
Renewable Energy
Roads and Highways
Space
Textiles and Garments
Thermal Power
Tourism and Hospitality
Wellness Prime Minister Mr. Narendra Modi launched the Make in India campaign on September 25, 2014. The timing of the launch was appropriate which came right after the successful insertion of Mangalyaan, which was a wholly indigenously built low-cost probe into the Martian orbit - the event highlighted India's success in manufacturing, science and technology, and all this at inexpensive costs. It also came just a day ahead of the Prime Minister's maiden US visit. It enhanced India’s attractiveness as an investment destination, the launch ceremony was held at the Vigyan Bhavan in New Delhi. In the “Make in India” week in the year 2016 the initiative received Rs. 15.2 lakh crore investment proposals.

VOLUME NO. 7 (2016), ISSUE NO. 08 (AUGUST) ISSN 0976-2183
INTERNATIONAL JOURNAL OF RESEARCH IN COMMERCE & MANAGEMENT A Monthly Double-Blind Peer Reviewed (Refereed/Juried) Open Access International e-Journal - Included in the International Serial Directories
http://ijrcm.org.in/
54
OBJECTIVES OF “MAKE IN INDIA” • To make investing in the manufacturing sector more attractive for the domestic and foreign investors, • To give global recognition to the Indian economy, • To create a competitive industrial environment, • To enhance further development of infrastructure, • To use latest technologies and • To generate employment and skill development. MAKE IN INDIA FOCUS • First Develop India and then Foreign Direct Investment, • Look-East on one side and Link-West on the other, • Highways and ‘I-ways. • facilitate investment • encourage innovation • protect intellectual property KEY POLICIES 1. Ease of business: Make in India is an initiative towards easy handling of business with a faster redressal mechanism. Only Business, NO harassment is the
underlining idea. 2. Skill and jobs for the youth: Skill endowment and job creation in 25 key industries will be encompassed under this plan for able youth development and
relevant training in certain key areas. These industries include roads and highways, construction, defence development and automobiles among others. 3. Making India a manufacturer: Urging global investors to make India an industrial hub is the eye-catching feature about which all of us read every day. Nar-
endra Modi is urging investors to set up industries in India instead of just FDI. This includes making India a destination for production of goods and exporting the same to the world over. India has demand, demography and democracy and we need investment, technology and exposure.
4. Getting away with archaic laws: Raising FDI caps in a controlled manner and parting with the red tape restrictions in decision making is another important feature of this plan. Archaic laws have become synonymous with our country's business-related environment and hence this Make in India campaign aims at eliminating them. The problems faced by Walmart in setting up in India paint a gloomy picture and this sets a precedent for others to follow. Infrastructure is ailing and set up in red-tape and this plan aims at redressing that.
5. 100 smart cities: This will also help in achieving the target of 100 smart cities and affordable housing schemes by making the investors a partner in the plan and investors adopting a city.
6. Disinvestment of PSU: Certain inefficient and loss-incurring PSUs will be disinvested i.e. a certain part of them will be sold off to private players so as to generate revenue and do away with the resource-sucking headaches. Private firms have an unmatched administration and management at times.
There's no denying that India, a country with demand, demographic dividends and democracy lagging in 142nd place in the Ease of doing business Index is a heart breaking scenario. What a great sea of opportunities with extraordinary demands but there is more than one stumbling block that hold us back. What a great land of oozing abundance and startling scarcity. To raise the standard of living, to make our country a major hub for industries and to embrace progress leaving behind our anti-business leanings for good this is the right step ahead. There will be professional training in important sectors, more employment opportunities and the business houses will adopt a city to help in the creation of 100 smart cities. POLICIES UNDER 'MAKE IN INDIA' INITIATIVE There are four major policies under the 'Make in India' program: 1. New Initiatives: This initiative is to improve the ease of doing business in India, which includes increasing the speed with which protocols are met with, and increasing transparency. Here's what the government has already rolled out
Environment clearances can be sought online.
All income tax returns can be filed online.
Validity of industrial licence is extended to three years.
Paper registers are replaced by electronic registers by businessmen.
Approval of the head of the department is necessary to undertake an inspection. 2. Foreign Direct Investment (FDI): The government has allowed 100% FDI in all the sectors except Space (74%), Defence (49%) and News Media (26%).FDI re-strictions in tea plantation has been removed, while the FDI limit in defence sector has been raised from the earlier 26% to 49% currently. 3. Intellectual Property Facts: The government has decided to improve and protect the intellectual property rights of innovators and creators by upgrading infra-structure, and using state-of-the-art technology. The main aim of intellectual property rights (IPR) is to establish a vibrant intellectual property regime in the country, according to the website. These are the various types of IPR: • Patent: A patent is granted to a new product in the industry. • Design: It refers to the shape, configuration, pattern, colour of the article. • Trade mark: A design, label, heading, sign, word, letter, number, emblem, picture, which is a representation of the goods or service. • Geographical Indications: According to the website, it is the indication that identifies the region or the country where the goods are manufactured. • Copyright: A right given to creators of literary, dramatic, musical and artistic works. • Plant variety Protection: Protection granted for plant varieties, the rights of farmers and plant breeders and to encourage the development of new varieties
of plants. • Semiconductor Integrated Circuits Layout-Design: The aim of the Semiconductor Integrated Circuits Layout-Design Act 2000 is to provide protection of Intel-
lectual Property Right (IPR) in the area of Semiconductor. 4. National manufacturing: Here the vision is, • to increase manufacturing sector growth to 12-14% per annum over the medium term. • to increase the share of manufacturing in the country’s Gross Domestic Product from 16% to 25% by 2022. • to create 100 million additional jobs by 2022 in manufacturing sector. • to create appropriate skill sets among rural migrants and the urban poor for inclusive growth. • to increase the domestic value addition and technological depth in manufacturing. • to enhance the global competitiveness of the Indian manufacturing sector. • to ensure sustainability of growth, particularly with regard to environment.
4. SWOT ANALYSIS OF MAKE IN INDIA The Strength, Weakness, Opportunity and Threat analysis (SWOT) is a useful dynamic study to measure the performance of the Make in India campaign. It will serve as an indicator to show which way the initiative is heading. Each item under different heads will vary from time to time and more things can be seen under strengths and opportunity with good governance.
VOLUME NO. 7 (2016), ISSUE NO. 08 (AUGUST) ISSN 0976-2183
INTERNATIONAL JOURNAL OF RESEARCH IN COMMERCE & MANAGEMENT A Monthly Double-Blind Peer Reviewed (Refereed/Juried) Open Access International e-Journal - Included in the International Serial Directories
http://ijrcm.org.in/
55
STRENGTH 1. A stable, committed, progressive, democratic, supporting and innovative government. 2. A most awaited perfect political and business environment. 3. Everything under one roof i.e. availability of different resources to run a business at a single place. 4. Availability of a huge domestic market and global export market. 5. Indian economy is one of the fastest growing economies in the world. 6. Good international relationship. 7. Favourable talent pool across the world in different MNC to influence decision to invest in India. 8. India has many strong fortune industrialists who are capable to support as well as manage the global investment and make in India campaign. 9. Above all there is a strong global confidence in the Indian system. WEAKNESS Internal 1. There still much scope for development as far as the infrastructure is concerned. The roads, transportation, energy are not up to the mark to match interna-
tional standards. 2. The business and political environment still needs to become more transparent, speedy and mature. 3. The bureaucratic system and execution of decision is very time taking in India. 4. There is lack of synchronisation in the interests of the state and central government. External 1. The dependency for oil and few other things on other countries. 2. The dependency on the decision of private firms to invest in India or not rather than on the government of few related countries. OPPORTUNITY 1. Fastest growing economy in Asia as well as the world 2. Possibility of driving demand through consumption in India with increasing level of disposable income available with approximately billion consumers. 3. Huge demographic dividend and Government subsidies would make manufacturing in India more competitive. 4. Both front end and back end support by the Government for industries willing to manufacture in the country. THREAT 1. An established and developed competitor in the neighbourhood i.e. China. 2. Many counter campaigns by other countries like China, Russia, and Brazil etc. 3. Foreign countries are hesitant to invest in India due to the poor global ranking for “ease of doing business” i.e. below 150. 4. Internal and across border political instability. 5. The ever dynamic global political and economic scenario and their impact on India.
5. CONCLUSION Progress of a nation is closely related to the needs and capabilities of its people. While, theoretically, countries that are developed, made their transition from an agrarian economy to an industrial economy and then finally a service-dominated economy. Unfortunately, for India, the industrial wave in the post-independence phase failed to catch up and the direct transition to a service led growth meant that large number of people could not find opportunities that aligned to their capabilities. Thus, a large number of our populace is still engaged in agriculture, where there is a possibility of disguised unemployment. Therefore, it is essential that the manufacturing sector of the country be developed so that India is able to utilize its untapped demographic advantage, which countries like China have employed to become the world’s largest demographic hub. “Make in India” has a tremendous potential of reforming the manufacturing sector of the country. In order to make a wholesome development of the sector there should be complementary improvements in infrastructure, labour, policies and rules and regulations in the country. The Government has initiated in developing smart cities and industrial corridors in some key areas and have started working on five smart cities as part of the Delhi-Mumbai Industrial Corridor. On skilling the workforce, recent initiatives by the Government like the “Pradhan Mantri Kaushal Vikas Yojana (PMKVY)”, which aims at aligning its training programs with im-portant programmes (‘Swachh Bharat’, ‘Make in India’, ‘Digital India’, ‘National Solar Mission’ etc.) is a significant step in solving the problem of unproductive labour force in India. For facilitating investment, there is an urgent need to build trust of both the foreign and domestic investors, and ensure that there is “ease of doing business” in India through transparent and less cumbersome procedures.
REFERENCES 1. Challenges and Opportunities of India's Manufacturing Sector”, Joumard, I., U. Sila and H. Morgavi (2015), OECD 2. Cohen, Stephen S., and John Zysman. "Why manufacturing matters: The myth of the post-industrial economy." California Management Review 29.3 (1987):
9-26. 3. India Manufacturing Barometer 2014 Turning the corner, Pricewaterhousecoopers India 4. Investment Opportunities in India, Department of Industrial Policy & Promotion 5. Saurabh Sanyal, ‘Exploring prospects of make in India and made in India’. 6. Dr.T.V. Ramana, 2015, Make in India: Illusion or Possible Reality Check?, International Journal of Academic Research.

VOLUME NO. 7 (2016), ISSUE NO. 08 (AUGUST) ISSN 0976-2183
INTERNATIONAL JOURNAL OF RESEARCH IN COMMERCE & MANAGEMENT A Monthly Double-Blind Peer Reviewed (Refereed/Juried) Open Access International e-Journal - Included in the International Serial Directories
http://ijrcm.org.in/
56
EMOTIONAL BRANDING AS A TOOL TO SALVAGE TRUST AND CONFIDENCE OF CUSTOMER IN INDIAN PACKAGED FOOD INDUSTRY
DR. RUPESH MALIK ASST. PROFESSOR
DEPARTMENT OF MANAGEMENT STUDIES N. C. COLLEGE OF ENGINEERING
ISRANA
ABSTRACT The brand preference and buying decisions of modern customers are not influenced by rationality alone rather their decision making process is greatly influenced by emotional needs. Even the big established brands try to knot the customer with their brands at an emotional level. Acquiring a new customer is not sufficient for the marketer the key to success lies in retaining the current customers through long lasting relationship and gaining new. Some changes in the external environment cause distrust among customers towards specific brands, that results in a great loss in the form of falling sales and profit of such organizations. In order to regain that lost trust and confidence, brands need to generate emotions towards the actual product that they offer. This paper is an effort to find out the association between demographic factors (age, gender & education) and emotional attachment with the brand advertisement. Further the paper will try to explore the rele-vance of emotional branding as a tool to counter negative repercussion and regain customer trust & confidence in the brand (Specific case of Maggie noodles is taken here to represent packaged food industry in India.)
KEYWORDS emotional branding, customer loyalty, packaged food industry
INTRODUCTION strong brand association exists in various industries. People buy a specific brand not just because it performs outstanding on rational criteria, but just because of the reason that the brand is attached to them at an emotional level. “The purpose of emotional branding is to enable people to form emotional connections with brands in a subliminal way” (Gobé 2009, xxix). Many companies are trying to design their communication message to trigger the emotions
of customers, to name a few; mobile brands like Apple and Samsung, automobile brands like Maruti-Suzuki, Hyundai, Honda, Toyota and many more. The prime question here is, does this strong emotional knot exist only for fashion, Mobile and Automobile brands or it also covers the packaged food industry. The importance of this study increases after the several controversies come into existence from time to time starting from the case of Cadbury in October 2003, when worms were found in their chocolates. After this, in 2006 pesticide issue hits the base when the Centre for Science and Environment said that Pepsi and Coca Cola contained pesticides and insecticides much beyond the prescribed bounds. In May 2014, one of the most trusted noodles brand Maggi was in controversies because of the reports of Food Safety Regulators from Uttar Pradesh, India, which confirmed the existence of high levels of monosodium glutamate (MSG) and lead content in Maggie much beyond the permissible limits. Consumption of monosodium glutamate (MSG) and lead beyond the permissible limits can cause long-term damage to almost every organ, including liver, kidney, brain, and bones. In June 2015, the Uttar Pradesh Food and Drug Administration reported that detergent was found in the milk samples produced by Mother Dairy. The list of controversies does not end here, many big brands like McDonalds-Burger, KFC chicken, PepsiCo’s Lay’s potato chips, Subway sandwich etc. have been accused of adulteration and misleading the customers through false claims and inadequate labelling.
THEORETICAL BACKGROUND AND LITERATURE REVIEW The concept of branding is not new to anyone, it has been discussed widely in literature for decades, and it has attracted attention of a lot of marketers from past three decades. Emotional branding is a complex concept and can be viewed as a blend of several marketing theories. “Emotional branding is defined as the engagement of consumers in a deep, long-term, intimate emotional connection with the brand, which is beyond the benefit based satisfaction, and which creates a special trust based relationship for the development of a holistic emotional experience” (Morrison and Crane, 2007). “It is highly evident that intense psycholog-ical bonds with the brands referred as emotional brand connections lead to higher levels of firm performance and competitive advantage” (Malar et al., 2011). The concept of emotional branding has been studied from several angles in branding literature Wyner, G.A. (2003) elucidated emotions in building brand associa-tions. In 2005 Yoo, C., & MacInnis explained emotions in brand attitude formation and emotions, Tsai, S-P described comprehensive model of brand purchase value and intention and Thomson, MacInnis, D.J., Park, C.W. studied the relationship between people and the brands and found that customers build up long lasting emotional relationships with a few selected brands. DeWitt, T., Nguyen, D.T., and Marshall, R. (2008) studied emotions in customer loyalty. Past studies have put a light on emotional branding as an instrument of, customer attraction, attitude formation, purchase intention and so forth. No study was directed to find out whether emotional branding can contribute in salvaging trust and confidence of customers in Indian packaged food industry after the brand dented badly due to negative publicity based upon various agencies reports. Here the specific case of Maggie for which, India was the second largest market in term of Sales revenue in 2014 is taken to represent the Indian packaged food industry. Maggie is making hard efforts to develop emotional ties with its customers to regain the confidence and loyalty of its customers for the brand after the MSG and lead content controversies.
IMPORTANCE OF THE STUDY Marketers require to build a bond between its customers and brand for long term success. Emotional branding is gaining importance globally and brands are being humanized to trigger customers at emotional level. This study is an attempt to explore another dimension of emotional branding as a tool to salvage customer trust and confidence.
STATEMENT OF THE PROBLEM The customers may feel very uncomfortable when they come in conflict with what they believe. Though the emotional branding creates a relationship between a brand and its customers, but can it prove as a life saver in the situation when the brand gains 360-degree negative publicity.
HYPOTHESIS H0 1: There is no significant association between age and emotional attachment with brand advertisement. Ha 1: There is a significant association between age and emotional attachment with brand advertisement. H0 2: There is no significant association between gender and emotional attachment with brand advertisement. Ha 2: There is a significant association between gender and emotional attachment with brand advertisement. H0 3: There is no significant association between education and emotional attachment with brand advertisement. Ha 3: There is a significant association between education and emotional attachment with brand advertisement.
A

VOLUME NO. 7 (2016), ISSUE NO. 08 (AUGUST) ISSN 0976-2183
INTERNATIONAL JOURNAL OF RESEARCH IN COMMERCE & MANAGEMENT A Monthly Double-Blind Peer Reviewed (Refereed/Juried) Open Access International e-Journal - Included in the International Serial Directories
http://ijrcm.org.in/
57
OBJECTIVES OF THE STUDY 1. To find out the relationship between age and emotional attachment with brand advertisement. 2. To find out the relationship between gender and emotional attachment with brand advertisement. 3. To find out the relationship between Education and emotional attachment with brand advertisement. 4. To find out the role of Emotional branding in regaining the trust and confidence of customer in Indian packaged food industry
METHODOLOGY The methodology for the study is quantitative in nature. The study includes packaged food buyers specifically Maggie noodles. Structured questionnaire was developed in Google forms with Likert type scale rating, from strongly agree to strongly disagree. A non-probability, convenience sampling technique was used to order a consumer survey. A total of 150 questionnaires were administered; responses to 110 were received and found to be fit for analysis.
DATA ANALYSIS Respondents Profile: Among the total respondent’s majority of the respondents i.e. 61.8% lies in the age bracket of 18 to 25 years and only 9.1 % respondents were of 35 years above age. In the gender distribution out of total respondents 55.5 % were female respondents whereas remaining 44.5% respondents were male. In the education distribution a 44.5% respondents were Post Graduates and remaining 55.5 % were under graduates.
TABLE 1: DEMOGRAPHIC PROFILE OF THE RESPONDENTS
Demographic Variables Categories Frequency Percent Cumulative Percent
AGE 18-25 Years 68 61.8 61.8
26-30 Years 19 17.3 79.1
31-35 Years 13 11.8 90.9
Above 35 Years 10 9.1 100.0
Total 110 100.0
Gender Male 49 44.5 44.5
Female 61 55.5 100.0
Total 110 100.0
Education UG 61 55.5 55.5
PG 49 44.5 100.0
Total 110 100.0
(Source: Primary Data) In order to identify association between demographic factors and emotional attachment with brand advertisement cross tabulation was performed. AGE V/S EMOTIONAL ATTACHMENT WITH THE ADVERTISEMENT CAMPAIGNS Emotional attachment of customers with the brand is very crucial for the marketers and they are striving hard to achieve the same. The question of prime im-portance is whether there is an impact of age on the emotional attachment with the brand. H0 1: There is no significant association between age and emotional attachment with brand advertisement. Ha 1: There is a significant association between age and emotional attachment with brand advertisement.
TABLE 2: AGE V/S EMOTIONAL ATTACHMENT WITH THE ADVERTISEMENT CAMPAIGNS CROSS TABULATION
I found myself emotionally attached with the advertisement campaigns of the Maggie Noodles.
Total Disagree Neutral Agree
AGE 18-25 Years Count 28 27 13 68
Expected Count 22.3 30.3 15.5 68.0
% within AGE 41.2% 39.7% 19.1% 100.0%
26-30 Years Count 6 7 6 19
Expected Count 6.2 8.5 4.3 19.0
% within AGE 31.6% 36.8% 31.6% 100.0%
31-35 Years Count 1 7 5 13
Expected Count 4.3 5.8 3.0 13.0
% within AGE 7.7% 53.8% 38.5% 100.0%
Above 35 Years Count 1 8 1 10
Expected Count 3.3 4.5 2.3 10.0
% within AGE 10.0% 80.0% 10.0% 100.0%
Total Count 36 49 25 110
Expected Count 36.0 49.0 25.0 110.0
% within AGE 32.7% 44.5% 22.7% 100.0%
(Source: Primary Data)
TABLE 3 : CHI-SQUARE TESTS
Value df Asymp. Sig. (2-sided)
Pearson Chi-Square 12.417a 6 .053
Likelihood Ratio 13.389 6 .037
Linear-by-Linear Association 3.979 1 .046
N of Valid Cases 110
As table 3 indicates that calculated value of chi-square (12.417) is less than the tabulated value (12.592) at degree of freedom 6 and 5% significance level. Hence, the null hypothesis is rejected. It means age is significantly associated with emotional attachment with brand advertisement GENDER V/S EMOTIONAL ATTACHMENT WITH BRAND ADVERTISEMENT. H0 2: There is no significant association between gender and emotional attachment with brand advertisement. Ha 2: There is a significant association between gender and emotional attachment with brand advertisement.

VOLUME NO. 7 (2016), ISSUE NO. 08 (AUGUST) ISSN 0976-2183
INTERNATIONAL JOURNAL OF RESEARCH IN COMMERCE & MANAGEMENT A Monthly Double-Blind Peer Reviewed (Refereed/Juried) Open Access International e-Journal - Included in the International Serial Directories
http://ijrcm.org.in/
58
TABLE 4: GENDER V/S EMOTIONAL ATTACHMENT WITH THE ADVERTISEMENT CAMPAIGNS CROSS TABULATION
I found myself emotionally attached with the advertisement campaigns of the Maggie Noodles.
Total Disagree Neutral Agree
GENDER Male Count 0 28 21 49
Expected Count 16.0 21.8 11.1 49.0
% within GENDER 0.0% 57.1% 42.9% 100.0%
Female Count 36 21 4 61
Expected Count 20.0 27.2 13.9 61.0
% within GENDER 59.0% 34.4% 6.6% 100.0%
Total Count 36 49 25 110
Expected Count 36.0 49.0 25.0 110.0
% within GENDER 32.7% 44.5% 22.7% 100.0%
(Source: Primary Data)
TABLE 5: CHI-SQUARE TESTS
Value df Asymp. Sig. (2-sided)
Pearson Chi-Square 47.820a 2 .000
Likelihood Ratio 62.272 2 .000
Linear-by-Linear Association 44.923 1 .000
N of Valid Cases 110
As table 5 indicates that calculated value of chi-square (47.820) is much more than the tabulated value (5.991) at degree of freedom 2 and 5% significance level. Hence, the null hypothesis is accepted. It means gender is not significantly associated with emotional attachment with brand advertisement. EDUCATION V/S EMOTIONAL ATTACHMENT WITH BRAND ADVERTISEMENT H0 3: There is no significant association between education and emotional attachment with brand advertisement. Ha 3: There is a significant association between education and emotional attachment with brand advertisement.
TABLE 6: EDUCATION V/S EMOTIONAL ATTACHMENT WITH THE ADVERTISEMENT CAMPAIGNS CROSS TABULATION
I found myself emotionally attached with the advertisement campaigns of the Maggie Noodles.
Total Disagree Neutral Agree
EDUCATION UG Count 12 37 12 61
Expected Count 20.0 27.2 13.9 61.0
% within EDUCATION 19.7% 60.7% 19.7% 100.0%
PG Count 24 12 13 49
Expected Count 16.0 21.8 11.1 49.0
% within EDUCATION 49.0% 24.5% 26.5% 100.0%
Total Count 36 49 25 110
Expected Count 36.0 49.0 25.0 110.0
% within EDUCATION 32.7% 44.5% 22.7% 100.0%
(Source: Primary Data)
TABLE 7: CHI-SQUARE TESTS
Value df Asymp. Sig. (2-sided)
Pearson Chi-Square 15.673a 2 .000
Likelihood Ratio 16.182 2 .000
Linear-by-Linear Association 2.492 1 .114
N of Valid Cases 110
As table 7 indicates that calculated value of chi-square (15.673) is more than the tabulated value (5.991) at degree of freedom 2 and 5% significance level. Hence, the null hypothesis is accepted. It means education is not significantly associated with emotional attachment with brand advertisement.
TABLE 8: MAGGIE NOODLES ADVERTISEMENT IS SO CLOSELY RELATED WITH MY PAST EMOTIONAL INCIDENTS THAT IT BRINGS A TEAR/SMILE IN/ON MY
EYES/FACE
Particulars Frequency Percent Cumulative Percent
Strongly Disagree 12 10.9 10.9
Disagree 12 10.9 21.8
Neutral 48 43.6 65.5
Agree 25 22.7 88.2
Strongly Agree 13 11.8 100.0
Total 110 100.0
(Source: Primary Data) Table 8 clearly shows that 11.8% of the respondents are strongly agree with the statement that Maggie Noodles advertisement are so closely related with my past emotional incidents that it brings a Tear/smile in/on my eyes/face and 22.7% agreed with the same. Around 43.6% of the respondents found their selves in neutral state and 21.8% respondents disagreed with the statement.
TABLE 9: I BUY MAGGIE NOODLES NOT JUST BECAUSE OF ITS TASTE BUT DUE TO OF THE ATTACHMENT WITH THE BRAND AT EMOTIONAL LEVEL (CONNECTION, MEMORIES ATTACHED ETC.)
Particulars Frequency Percent Cumulative Percent
Strongly Disagree 12 10.9 10.9
Disagree 48 43.6 54.5
Neutral 25 22.7 77.3
Strongly Agree 25 22.7 100.0
Total 110 100.0
(Source: Primary Data)

VOLUME NO. 7 (2016), ISSUE NO. 08 (AUGUST) ISSN 0976-2183
INTERNATIONAL JOURNAL OF RESEARCH IN COMMERCE & MANAGEMENT A Monthly Double-Blind Peer Reviewed (Refereed/Juried) Open Access International e-Journal - Included in the International Serial Directories
http://ijrcm.org.in/
59
Table 9 shows that only 22.7 % respondents buy Maggie noodles not just because of its Taste but due to the attachment with the brand at emotional level. A clear majority (54.5%) disagreed with the statement and 22.7% are neutral on the same. Although only 22.7% customers take buying decision due to emotional appeal but this number cannot be ignored by the marketer. TABLE 10: I BELIEVE THE EMOTIONAL KNOT WITH THE BRAND MAGGIE CONTINUOUSLY OPPOSING THE NEGATIVE PUBLICITY THE BRAND SUFFERED IN PAST.
Particulars Frequency Percent Cumulative Percent
Disagree 12 10.9 10.9
Neutral 36 32.7 43.6
Agree 37 33.6 77.3
Strongly Agree 25 22.7 100.0
Total 110 100.0
(Source: Primary Data) Table 10 clearly indicates that 56.3 % respondents believe that emotional knot with the brand Maggie continuously opposing the negative publicity the brand suffered in past. Only 10.9% respondents believe that the emotional knot does not oppose negative publicity. So it can be said that emotional branding can be used by the marketers as a tool to counter negative repercussions
TABLE 11: EMOTIONAL ATTACHMENT WITH THE BRAND MAGGIE CONTRIBUTED A LOT IN REGAINING MY TRUST AND CONFIDENCE IN THE BRAND AFTER LEAD AND MSG CONTENT REPORTS BY SEVERAL AGENCIES
Particulars Frequency Percent Cumulative Percent
Disagree 12 10.9 10.9
Neutral 24 21.8 32.7
Agree 62 56.4 89.1
Strongly Agree 12 10.9 100.0
Total 110 100.0
(Source: Primary Data) Table 11 indicates that 67.3% respondents agreed that their emotional attachment with the brand Maggie contributed a lot in regaining their trust and confidence in the brand after lead and MSG content reports by several agencies. Only 10.9 % respondents disagreed with the same and 21.8% respondents kept their response in the neutral category. A marketer can’t ignore the power of emotional attachment as a tool to salvage trust and confidence in the brand.
CONCLUSION Maggie planned its comeback in a different way, they tied up with Snapdeal to register request for the home delivery of Maggie noodles as it was not possible to make Maggie noodles available everywhere in India in such less span of time. Suresh Narayanan, Chairman & MD, Nestle India on behalf of all employees of Nestle gave a thank message to all suppliers, distributors, retailers and consumers for their support. Later on all their Advertisement campaigns including ‘Khushiyon ki recipe’, Independent, Mom’s Maggie, ‘Dhabe ki Raunak laut kar aa gayi’-Welcome back’, ‘Princess’, ‘same taste – nothing has changed’ senior and junior conver-sation Hostel ad and many more are targeted to trigger consumer emotions directly. The finding of this study indicated that age is significantly associated with emotional attachment with brand advertisement. Gender and education have no significant relationship with emotional attachment with the brand advertisement. 34.5% customers accepted that Maggie noodles advertisement is so closely related with their past emotional incidents that it brings a tear/smile in/on my eyes/face. 22.7% respondents accepted that they buy Maggie noodles simply because of emotional knot with the brand. Although 22.7 % seems a small number but the marketer can’t ignore it as in totality it may have a great impact on the sales of brand. 56.3 % respondents believe that emotional knot with the brand Maggie continuously opposing the negative publicity the brand suffered in past. All this data clearly shows the role of emotional branding in retaining and regaining the trust and confidence in the brand.
REFERENCES 1. DeWitt, T., Nguyen, D.T., and Marshall, R. (2008). Exploring Customer Loyalty Following Service Recovery: The Mediating Effects of Trust and Emotions.
Journal of Service Research, 10, 269-281. 2. Gobé, M. (2009) Emotional branding: the new paradigm for connecting brands to people. New York: Allworth Press. 3. Malar, L., Krohmer, H., Hoyer, W. D., & Nyffenegger, B. (2011). Emotional Brand Attachment and Brand Personality: The Relative Importance of the Actual
and the Ideal Self. Journal of Marketing, 75 (July), 35 52. 4. Morrison, S., & Crane, F.G. (2007) Building the service brand by creating and managing an emotional brand experience. Brand Management, 14, 5, 410 421. 5. Thomson, M., MacInnis, D.J., Park, C.W. (2005). The ties that bind: measuring the strength of consumers' emotional attachments to brands. Journal of Con-
sumer Psychology 15 (1), 77-91. 6. Tsai, S-P. (2005). Utility, cultural symbolism and emotion: A comprehensive model of brand purchase value. International Journal of Research in Marketing,
22, 3, 277-291 7. Wyner, G. A. (2003). The Customer-Brand Relationship. Marketing Management, 12, 1, 6-7. 8. Yoo, C., & MacInnis, D. (2005). The brand attitude formation process of emotional and informational ads. Journal of Business Research, 58, 1397 1406.
VOLUME NO. 7 (2016), ISSUE NO. 08 (AUGUST) ISSN 0976-2183
INTERNATIONAL JOURNAL OF RESEARCH IN COMMERCE & MANAGEMENT A Monthly Double-Blind Peer Reviewed (Refereed/Juried) Open Access International e-Journal - Included in the International Serial Directories
http://ijrcm.org.in/
60
PRE-MERGER AND POST-MERGER ANALYSIS OF FINANCIAL PERFORMANCE OF TARGET COMPANY - A CASE STUDY
ASHISH V. DONGARE RESEARCH SCHOLAR
RTM NAGPUR UNIVERSITY NAGPUR
DR. ANAND MULEY ASST. PROFESSOR
J. M. PATEL COLLEGE BHANDARA
ABSTRACT
This study has been undertaken for Pre-merger and Post-merger analysis of financial performance of target company. This paper is an attempt to understand the impact of merger of MEL with SAIL on the financial performance of MEL/CFP. For the purpose of this study, eight ratios representing the categories of ratios such as liquidity ratios, solvency ratios, activity ratios and profitability ratios of the target company i.e. MEL/CFP are calculated for analyzing the pre-merger and post-merger analysis of financial performance. The four years before the merger and four years after the merger is taken for this study and impact of merger is studied using the t-test. In the study it is concluded that post-merger, there is no significant impact on current ratio and operating cycle ratio whereas there is significant impact on quick ratios and asset turnover ratio. It is also concluded that there is no significant change in both the solvency ratios i.e. debt to asset ratio and interest coverage ratio of the MEL/CFP. Further, no positive change in profitability of the MEL after merger is found.
KEYWORDS ferro alloys, financial ratios, merger.
INTRODUCTION ost LPG i.e. (Liberalisation, Privatisation and Globalisation), the business environment in India has changed a lot. The Indian companies strive hard and also succeeded to maintain their position in the market in spite of having steep competition from the international players operating in different sectors. One of the key strategies to stay in the competition that were adopted in last two-three decade by the corporates is merger and acquisition. The objective of
Merger and acquisition is different in different cases and it depends upon the various factors such as position of the company in the sector where it is operating, dynamics of the sector, strength and weakness of the company, economic conditions etc. Most of the merger and acquisition takes place for the reasons mentioned as under:
For consolidation of business
To achieve economiesof scale,
For diversification,
For procuring raw material
To strengthen distribution channel
To expand geographic reach One of the important sectors responsible for the growth of infrastructure of any country is the steel sector and the industry which is closely associated with this industry is Ferro ally industry. In the year 2011, Maharashtra Elektrosmelt Limited (MEL) representing the Ferro alloy industry merged with Steel Authority of India (SAIL) representing steel industry. MEL now called as Chandrapur Ferro ally Plant (CFP). In this paper an attempt has been made to understand the impact of this merger on the financial performance of MEL/CFP. The four year before the merger and four years after the merger is taken for this study and eight ratios repre-senting the categories of ratios such as liquidity ratios, solvency ratios, activity ratios and profitability ratios are calculated for analyzing the pre-merger and post-merger analysis of financial performance of the target company i.e. MEL in this case.
REVIEW OF LITERATURE In order to study the impact of the merger, the Author ‘Govind M. Dhinaiya’ carried out a research titled “Impact of mergers & acquisitions on the performance of companies”. The objective of this study was to analyze operating performance of companies involved in mergers & acquisitions using various ratios. The analysis was done using the data of two years before & after mergers & acquisitions with help of paired sample t-test. The results suggest that there were minor variations in the performance after M&A but it was not statistically significant. Further, the result has proved that companies failed to perform well after mergers and acquisitions in all parameters under study. The analysis shows that performance was different from different industry. Hence performance of company depends on the type of industry in which mergers and acquisitions take place. Author ‘Komal Gupta’ conducted a research on “Mergers and acquisitions in the Indian banking sector: A study of selected banks”. In this study the effects of merger and acquisitions on the financial performance of the selected banks in India has been evaluated. Pre and post merger comparison is conducted on selected variables to analyse the effectiveness of mergers and acquisitions on the banks. The results of the study indicate that there is a positive impact of mergers and acquisitions on the financial performance of the selected banks. Researcher ‘Mahesh R. & Daddikar Prasad’ conducted a research on “Post merger and acquisition financial performance analysis: a case study of select Indian airline companies” with the objective to analyze whether the Indian Airline Companies have achieved financial performance efficiency during the post merger & acquisition period specifically in the areas of profitability, leverage, liquidity, and capital market standards. They used sample t-test to determine the differences in financial performance standards two year before and two year after the merger activity. The result of this study shows that there is no improvement in surviving Company’s return on equity, net profit margin, interest coverage, earning per share and dividend per share post-merger & acquisition. A research on the topic “Comparative Study of Pre and Post Corporate Integration through Mergers and acquisition” was conducted by researchers ‘Manoj Kumara. N.V, Satyanarayana’ to explore the potentialities and capabilities of the firm by looking pre and post merger and acquisition performance. This study examined the comparative differ-ence between pre and post merger and acquisition in terms of financial performance. The samples of ten major companies were taken from a list of merger and acquisition in India-2010.The results indicated a significant positive value creation to the acquired firms. Researcher ‘Long Hoang Pham’ carried out study titled “An analysis of pre and post-acquisition financial performance of target czech banks: a comparative analy-sis”. The objective of the study is to analyze and compare the pre and post-acquisitions financial performance of four identified banks, through ratio analysis., with greater emphasis on ROA, RONW, EPS, DE and NPM as financial efficiency parameters. Secondary sources such as published annual report and accounts of the
P

VOLUME NO. 7 (2016), ISSUE NO. 08 (AUGUST) ISSN 0976-2183
INTERNATIONAL JOURNAL OF RESEARCH IN COMMERCE & MANAGEMENT A Monthly Double-Blind Peer Reviewed (Refereed/Juried) Open Access International e-Journal - Included in the International Serial Directories
http://ijrcm.org.in/
61
selected banks were used to collect the data and subsequently analyzed using Wilcoxon signed rank test. The data was being collected for three years before and after the acquisition. The study concluded that M&A of the selected firms have resulted in no significant change in the financial performance of these firms. ‘Dr. Yusuf Ali Khalaf Al-Hroot’ conducted research on the topic “Pre and Post-Merger Impact on Financial Performance: A Case Study of Jordan Ahli bank”. The results of this study show that 5 Out of 12 ratios (41.67%) significantly improved after the merger to Jordan Ahli bank, while 3 ratios (25%) improved but insignifi-cantly, in the other hand 3 ratios (25%) significantly deteriorated after merger, while 1 ratio (8.33%) insignificantly deteriorated after merger. This shows that merger has improved performance of Jordan Ahli bank with a total percentage (66.67%). On the basis of findings, we concluded that financial performance of merger Jordan Ahli bank insignificantly improved in the post-merger period. A study on “Impact of Mergers & Acquisitions on Firms’Long Term Performance: A Pre & Post Analysis of the Indian Telecom Industry” was conducted by researcher ‘Neha Verma and Dr. Rahul Sharma’ with the aim to study the impact of mergers and acquisitions on the performance of Indian Telecom industry, by examining some pre and post-merger financial and operating variables. For the purpose of the study, companies which have been merged or acquired during the period 2001-02 to 2007-08 have been selected. This study concluded that it becomes important to generate elevated profits after the mergers and acquisitions in order to rationalize the decision of M&A, undertaken by the management to the shareholders. In the paper “Indian Ferro Alloy Industry– Present Status and Future Outlook” the authors C.N. Harman and N.S.S. RamaRao, discussed in detail about the evolution of the Indian Ferro alloy industry in a phased manner. In the paper ‘The Indian Ferroalloy Industry at Cross Roads’- the paper for Metals & Minerals Review – Ferroalloy Special – January 2013 issue the author Prabhash Gokarn, discussed in detail the various aspects regarding the past performance of the industry and the expected growth of it.
OBJECTIVES The core objective of this study is to find out the impact of the merger on the financial performance of the target firm. 1. To study the change in the liquidity ratios of MEL/CFP after merger. 2. To analyse the impact on the solvency ratios of MEL/CFP after merger. 3. To find out the impact on profitability ratios of MEL/CFP after merger. 4. To access the improvement in efficiency ratios of MEL/CFP after merger.
RESEARCH METHODOLOGY Nature and source of the Data: The data which is being used for the purpose of this study is collected from secondary sources. Annual reports of MEL and SAIL, websites of SAIL, various stock broking firms and research agencies are used for collecting the data. Further the year books of Indian Bureau of Mines (IBM) are also used for conceptual framework Sample size and period: The data for a period of eight years i.e. from 2008 to 2015of MEL/CFP is taken for this study. Tools and Techniques: The ratio analysis and t test are used for the purpose of this study. The variables used in the study are quantitative variables. Hypothesis testing has also been carried out. Formulation of Hypothesis: The hypotheses are formulated taking into account the objective of the study. The hypotheses for this study are as follows:- (a) H1- Post merger, there is significant impact on the liquidity ratio of the MEL. (b) H1- Post merger, there is significant change in the solvency position of the MEL. (c)H1- There is change in profitability of the MEL after merger. (d)H1- There is impact on activity ratios of the MEL before and after merger.
DATA ANALYSIS AND HYPOTHESIS TESTING In order to evaluate the impact of the merger on the performance of MEL a comparative study for the same period i.e. four year before the merger and four year after the merger (including the year of merger) has been carried out. For the purpose of this study two ratios from each category of ratios are identified and exhibited accordingly. 1. LIQUIDITY RATIOS Current ratios and quick ratios are the two ratios which have been considered from the category of liquidity ratios. These ratios are tabulated in the table-1.
TABLE 1: PRE AND POST MERGER LIQUIDITY RATIOS
Source: Ratios are calculated using data collected from financial statements of company.
Observations There is not much difference in the mean value of pre and post current ratio of MEL, however, the variance of current ratio of MEL before the merger and after merger has difference. Further, in case of quick ratio there is wide gap in mean as well as variance of pre and post-merger. 2. SOLVENCY RATIOS The Solvency ratios are also known as leverage ratios. These ratios measure the burden of the debt on the company and compare it with assets or equity. The solvency ratios considered for the pre and post-merger study are debt to asset ratio and interest coverage ratios. The other important solvency ratios such as debt to equity, equity multipliers etc are not considered due to limitations of data on account of merger of MEL. For the purpose of this study, the two identified ratios are exhibited in the table 2.
Liquidity Ratio
Current Ratio Quick Ratio
Pre-Merger Pre-Merger
2007-08 1.64 1.24
2008-09 1.93 1.32
2009-10 2.55 1.88
2010-11 3.26 2.18
Post-Merger Post-Merger
2011-12 2.44 0.40
2012-13 1.01 0.08
2013-14 3.28 0.17
2014-15 3.10 0.07
Descriptive analysis for liquidity ratios
Mean Variance
Pre-Merger Post-Merger Pre-Merger Post-Merger
Current Ratio 2.34 2.46 0.52 1.06
Quick Ratio 1.66 0.18 0.20 0.02

VOLUME NO. 7 (2016), ISSUE NO. 08 (AUGUST) ISSN 0976-2183
INTERNATIONAL JOURNAL OF RESEARCH IN COMMERCE & MANAGEMENT A Monthly Double-Blind Peer Reviewed (Refereed/Juried) Open Access International e-Journal - Included in the International Serial Directories
http://ijrcm.org.in/
62
TABLE 2: PRE AND POST MERGER SOLVENCY RATIOS
Solvency Ratio
Debt to Asset Ratio Interest Coverage Ratio
Pre-Merger Pre-Merger
2007-08 0.00176 497.66
2008-09 0.00406 241.99
2009-10 0.00080 434.66
2010-11 0.00070 144.29
Post-Merger Post-Merger
2011-12 0.00069 26.92
2012-13 0.00007 -1936.00
2013-14 0.00000 -3881.50
2014-15 -0.00002 -2260.00
Source: Ratios are calculated using data collected from financial statements of company.
Observations There is difference in the mean value of pre and post, Debt to Equity as well interest coverage ratios. Variance of both the ratios also indicates the same. The study of Change/impact/relationship of these variables has been done in the next section called hypothesis testing. 3. PROFITABILITY RATIOS These are the ratios which are used to find out an ability of the firm to generate earnings against expenses and related costs. Profitability ratio measures earning ability of the firm relative to the sales made by the firm or assets held by the firm or the shareholder’s funds etc. Taking into account the limitations of the data on shareholder’s equity, net worth etc., following two ratios have been identified for pre and post-merger analysis.
TABLE 3: PROFITABILITY RATIOS
Return on Asset(ROE) Net Profit Margin (NPM)
Pre-Merger Pre-Merger
2007-08 0.165351173 0.114759708
2008-09 0.164349719 0.126151871
2009-10 0.172348683 0.144583568
2010-11 0.087289494 0.085077397
Post-Merger Post-Merger
2011-12 0.014378889 0.018864584
2012-13 -0.036050623 -0.052668788
2013-14 -0.068643918 -0.117471748
2014-15 -0.042935407 -0.085694252
Source: Ratios are calculated using data collected from financial statements of company.
Observations The mean value of ROE and NPS are different and with variance for these two ratios. This indicates the change the profitability of the company after its merger. 4. ACTIVITY RATIOS The ratios which gives information about how efficiently the company is using its assets. These ratios involve the comparison of sales revenue or cost of goods sold with inventories, debtors, fixed assets etc., To examine the activity ratios pre and post-merger, the asset turnover ratio and operating cycle (days) are consid-ered. They are exhibited as under:
TABLE 4: ACTIVITY RATIOS
ASSET TURNOVER RATIO OPERATING CYCLE
PRE-MERGER PRE-MERGER
2007-08 1.440846936 90.49858633
2008-09 1.302792557 99.79904377
2009-10 1.192035067 100.6343641
2010-11 1.026000998 77.43114637
POST-MERGER POST-MERGER
2011-12 0.762216058 95.88275749
2012-13 0.684477945 46.07976026
2013-14 0.584344059 84.89646354
2014-15 0.501030184 212.8248061
Source: Ratios are calculated using data collected from financial statements of company.
Descriptive analysis for solvency ratios
Mean Variance
Pre-Merger Post-Merger Pre-Merger Post-Merger
Debt to Asset Ratio 0.0018 0.00018 0.00000244 0.000000114
Interest Coverage ratio 329.65 -2012.645 27098.49503 2573166.314
Descriptive analysis for profitability ratios
Mean Variance
Pre-Merger Post-Merger Pre-Merger Post-Merger
ROE 0.147 -0.033 0.0016 0.0012
NPM 0.117 -0.059 0.0006 0.003
Descriptive analysis for Activity ratios
Mean Variance
Pre-Merger Post-Merger Pre-Merger Post-Merger
ATO 1.24 0.633 0.030 0.013
OC 92.09 109.92 116.61 5162.73
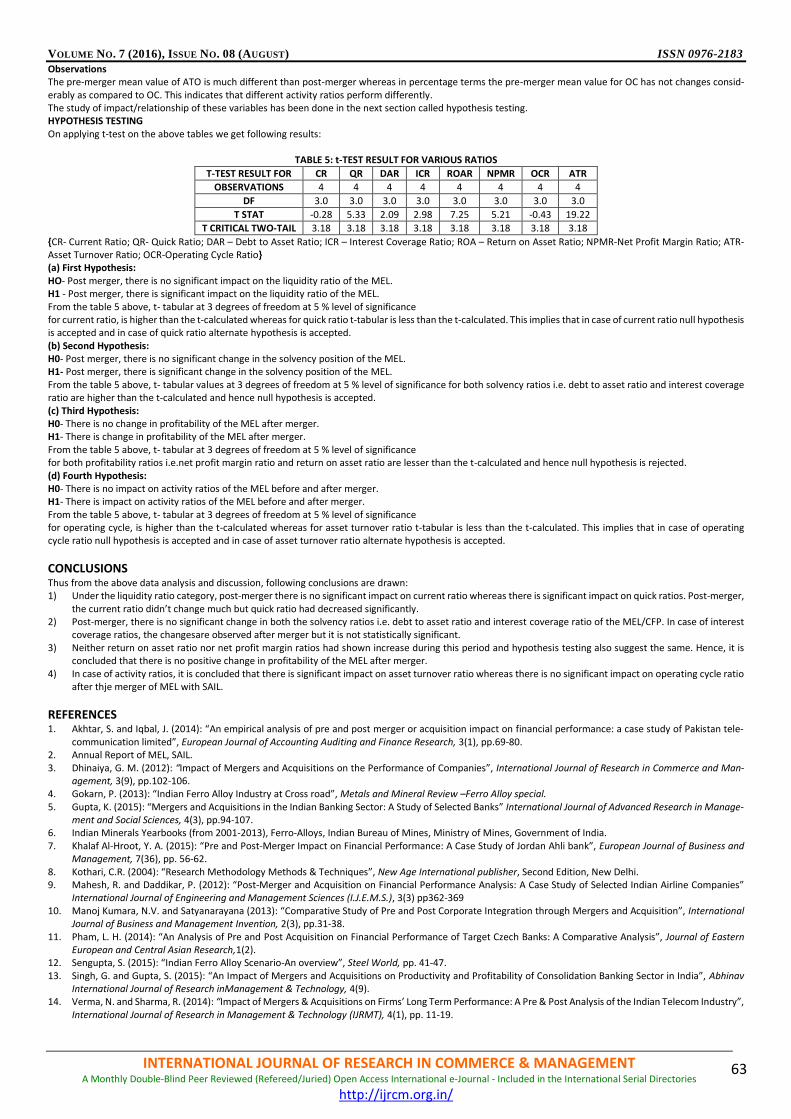
VOLUME NO. 7 (2016), ISSUE NO. 08 (AUGUST) ISSN 0976-2183
INTERNATIONAL JOURNAL OF RESEARCH IN COMMERCE & MANAGEMENT A Monthly Double-Blind Peer Reviewed (Refereed/Juried) Open Access International e-Journal - Included in the International Serial Directories
http://ijrcm.org.in/
63
Observations The pre-merger mean value of ATO is much different than post-merger whereas in percentage terms the pre-merger mean value for OC has not changes consid-erably as compared to OC. This indicates that different activity ratios perform differently. The study of impact/relationship of these variables has been done in the next section called hypothesis testing. HYPOTHESIS TESTING On applying t-test on the above tables we get following results:
TABLE 5: t-TEST RESULT FOR VARIOUS RATIOS
T-TEST RESULT FOR CR QR DAR ICR ROAR NPMR OCR ATR
OBSERVATIONS 4 4 4 4 4 4 4 4
DF 3.0 3.0 3.0 3.0 3.0 3.0 3.0 3.0
T STAT -0.28 5.33 2.09 2.98 7.25 5.21 -0.43 19.22
T CRITICAL TWO-TAIL 3.18 3.18 3.18 3.18 3.18 3.18 3.18 3.18
{CR- Current Ratio; QR- Quick Ratio; DAR – Debt to Asset Ratio; ICR – Interest Coverage Ratio; ROA – Return on Asset Ratio; NPMR-Net Profit Margin Ratio; ATR- Asset Turnover Ratio; OCR-Operating Cycle Ratio} (a) First Hypothesis: HO- Post merger, there is no significant impact on the liquidity ratio of the MEL. H1 - Post merger, there is significant impact on the liquidity ratio of the MEL. From the table 5 above, t- tabular at 3 degrees of freedom at 5 % level of significance for current ratio, is higher than the t-calculated whereas for quick ratio t-tabular is less than the t-calculated. This implies that in case of current ratio null hypothesis is accepted and in case of quick ratio alternate hypothesis is accepted. (b) Second Hypothesis: H0- Post merger, there is no significant change in the solvency position of the MEL. H1- Post merger, there is significant change in the solvency position of the MEL. From the table 5 above, t- tabular values at 3 degrees of freedom at 5 % level of significance for both solvency ratios i.e. debt to asset ratio and interest coverage ratio are higher than the t-calculated and hence null hypothesis is accepted. (c) Third Hypothesis: H0- There is no change in profitability of the MEL after merger. H1- There is change in profitability of the MEL after merger. From the table 5 above, t- tabular at 3 degrees of freedom at 5 % level of significance for both profitability ratios i.e.net profit margin ratio and return on asset ratio are lesser than the t-calculated and hence null hypothesis is rejected. (d) Fourth Hypothesis: H0- There is no impact on activity ratios of the MEL before and after merger. H1- There is impact on activity ratios of the MEL before and after merger. From the table 5 above, t- tabular at 3 degrees of freedom at 5 % level of significance for operating cycle, is higher than the t-calculated whereas for asset turnover ratio t-tabular is less than the t-calculated. This implies that in case of operating cycle ratio null hypothesis is accepted and in case of asset turnover ratio alternate hypothesis is accepted.
CONCLUSIONS Thus from the above data analysis and discussion, following conclusions are drawn: 1) Under the liquidity ratio category, post-merger there is no significant impact on current ratio whereas there is significant impact on quick ratios. Post-merger,
the current ratio didn’t change much but quick ratio had decreased significantly. 2) Post-merger, there is no significant change in both the solvency ratios i.e. debt to asset ratio and interest coverage ratio of the MEL/CFP. In case of interest
coverage ratios, the changesare observed after merger but it is not statistically significant. 3) Neither return on asset ratio nor net profit margin ratios had shown increase during this period and hypothesis testing also suggest the same. Hence, it is
concluded that there is no positive change in profitability of the MEL after merger. 4) In case of activity ratios, it is concluded that there is significant impact on asset turnover ratio whereas there is no significant impact on operating cycle ratio
after thje merger of MEL with SAIL.
REFERENCES 1. Akhtar, S. and Iqbal, J. (2014): “An empirical analysis of pre and post merger or acquisition impact on financial performance: a case study of Pakistan tele-
communication limited”, European Journal of Accounting Auditing and Finance Research, 3(1), pp.69-80. 2. Annual Report of MEL, SAIL. 3. Dhinaiya, G. M. (2012): “Impact of Mergers and Acquisitions on the Performance of Companies”, International Journal of Research in Commerce and Man-
agement, 3(9), pp.102-106. 4. Gokarn, P. (2013): “Indian Ferro Alloy Industry at Cross road”, Metals and Mineral Review –Ferro Alloy special. 5. Gupta, K. (2015): “Mergers and Acquisitions in the Indian Banking Sector: A Study of Selected Banks” International Journal of Advanced Research in Manage-
ment and Social Sciences, 4(3), pp.94-107. 6. Indian Minerals Yearbooks (from 2001-2013), Ferro-Alloys, Indian Bureau of Mines, Ministry of Mines, Government of India. 7. Khalaf Al-Hroot, Y. A. (2015): “Pre and Post-Merger Impact on Financial Performance: A Case Study of Jordan Ahli bank”, European Journal of Business and
Management, 7(36), pp. 56-62. 8. Kothari, C.R. (2004): “Research Methodology Methods & Techniques”, New Age International publisher, Second Edition, New Delhi. 9. Mahesh, R. and Daddikar, P. (2012): “Post-Merger and Acquisition on Financial Performance Analysis: A Case Study of Selected Indian Airline Companies”
International Journal of Engineering and Management Sciences (I.J.E.M.S.), 3(3) pp362-369 10. Manoj Kumara, N.V. and Satyanarayana (2013): “Comparative Study of Pre and Post Corporate Integration through Mergers and Acquisition”, International
Journal of Business and Management Invention, 2(3), pp.31-38. 11. Pham, L. H. (2014): “An Analysis of Pre and Post Acquisition on Financial Performance of Target Czech Banks: A Comparative Analysis”, Journal of Eastern
European and Central Asian Research,1(2). 12. Sengupta, S. (2015): “Indian Ferro Alloy Scenario-An overview”, Steel World, pp. 41-47. 13. Singh, G. and Gupta, S. (2015): “An Impact of Mergers and Acquisitions on Productivity and Profitability of Consolidation Banking Sector in India”, Abhinav
International Journal of Research inManagement & Technology, 4(9). 14. Verma, N. and Sharma, R. (2014): “Impact of Mergers & Acquisitions on Firms’ Long Term Performance: A Pre & Post Analysis of the Indian Telecom Industry”,
International Journal of Research in Management & Technology (IJRMT), 4(1), pp. 11-19.

VOLUME NO. 7 (2016), ISSUE NO. 08 (AUGUST) ISSN 0976-2183
INTERNATIONAL JOURNAL OF RESEARCH IN COMMERCE & MANAGEMENT A Monthly Double-Blind Peer Reviewed (Refereed/Juried) Open Access International e-Journal - Included in the International Serial Directories
http://ijrcm.org.in/
64
HOW ORGANIZATIONAL STRUCTURE AIDS BUSINESS PERFORMANCE
MUSIBAU AKINTUNDE AJAGBE HEAD
DEPARTMENT OF MANAGEMENT RITMAN UNIVERSITY
IKOT EKPENE
NKAM MICHAEL CHO RESEARCH SCHOLAR
DEPARTMENT OF BUSINESS ADMINISTRATION & SUSTAINABILITY ICT UNIVERSITY
CAMEROON
EKANEM EDEM UDO UDO SR. LECTURER
DEPARTMENT OF MANAGEMENT UNIVERSITY OF CALABAR
CROSS RIVER STATE
OJOCHIDE FRED PETER ASST. LECTURER
DEPARTMENT OF BUSINESS MANAGEMENT COVENANT UNIVERSITY
OTA
ABSTRACT This paper examined how organizational structure aids business performance. Existing studies have shown that it is nearly impossible for an organization to exist without a defined organizational structure. Studies also revealed that the main purpose of organizational structure is the division of work among members of the organization, and the co-ordination of their activities so they are directed towards the goals and objectives of the organization. The sources of data used for this research are from secondary sources. The secondary sources are from journals and conference articles, the internet, newspapers, magazines and textbooks. This research found that organizational structure has a significant impact on the performance of business organizations. Hence, the researchers recommend that busi-ness organizations should endeavor to develop a properly defined structure for the organization so as to achieve set objectives.
KEYWORDS
organizational structure, business performance, business organization.
1. INTRODUCTION elson and Quick (2011) opined that profit making is among the cardinal reasons why business organizations are established, this is aside from other non-profit related purposes. The profit and nonprofit objectives of business organizations are said to be realized when firms attain laid down goals and objec-tives. Birkinshaw (2001) stressed that organizational goals and objectives are broken down into different tasks among the organizations employees. Such
responsibilities as shared among the employees are further grouped into departments (Nelson & Quick, 2011). However, departments in business organizations may be grouped into different functional levels to enable employees to function effectively by having a vivid understanding of the command structure. The func-tional levels in a typical business organization are marketing and sales, personnel and administration, production and logistics, finance and accounting and so on. Maduenyi et al. (2015) argued that more distinction could be found within each department and between the jobs people perform. The authors emphasized further that different departments are connected to form the existing organizational structure. Such organization’s structure gives the business entity the mech-anism which helps in fulfilling its function in the geographical environment where it is situated (Nelson & Quick, 2011; Ajagbe et al., 2016). The structure of a business organization is of no relevance unless it is supported by appropriate mechanisms and a consistent culture (Birkinshaw, 2001; Fadeyi et al., 2015). However, organizational structure is among the major strategic priorities business managers should implement for firms to perform effectively. The type of organizational structure to be adopted would depend to a large extent on the nature of the particular industry in question. Adegbuyi et al. (2015) concluded that the form which the organizational structure should take may be periodically represented in form of an organizational chart. As a result of the importance of organizational struc-ture to business organizations, this study examines how organizational structure aids business performance. In view of this, this study will be arranged in the following manner. The next section will start by trying to understand the meaning of organizations, performance, and organizational structure. The concept and variables to measure business performance will be explored. Then how organizational structure affects business performance will be considered. The study shall conclude with a short conclusion and brief suggestions to policy makers in business organizations.
2. LITERATURE REVIEW 2.1 ORGANIZATION AND PERFORMANCE Organization is a group of two or more people working co-operatively toward a common objective or set of objectives (Kaplan & Norton, 1992; Hodge & William, 2004; Lebans & Euske, 2006). In short, an organization is a group of people working together to achieve a purpose that cannot be achieved by an individual working alone. Martinelli (2001) defines an organization as a set of elements in interaction, organized level and decision making units. While Carton and Hofer (2006) describe Performance as a measure of the state of an organization, or the outcomes that result from management decisions and the execution of those decisions by employees of the business organization. Lebans and Euske (2006) considered Performance as a set of financial and nonfinancial indicators which offer infor-mation on the degree of achievement of objectives and results.
N
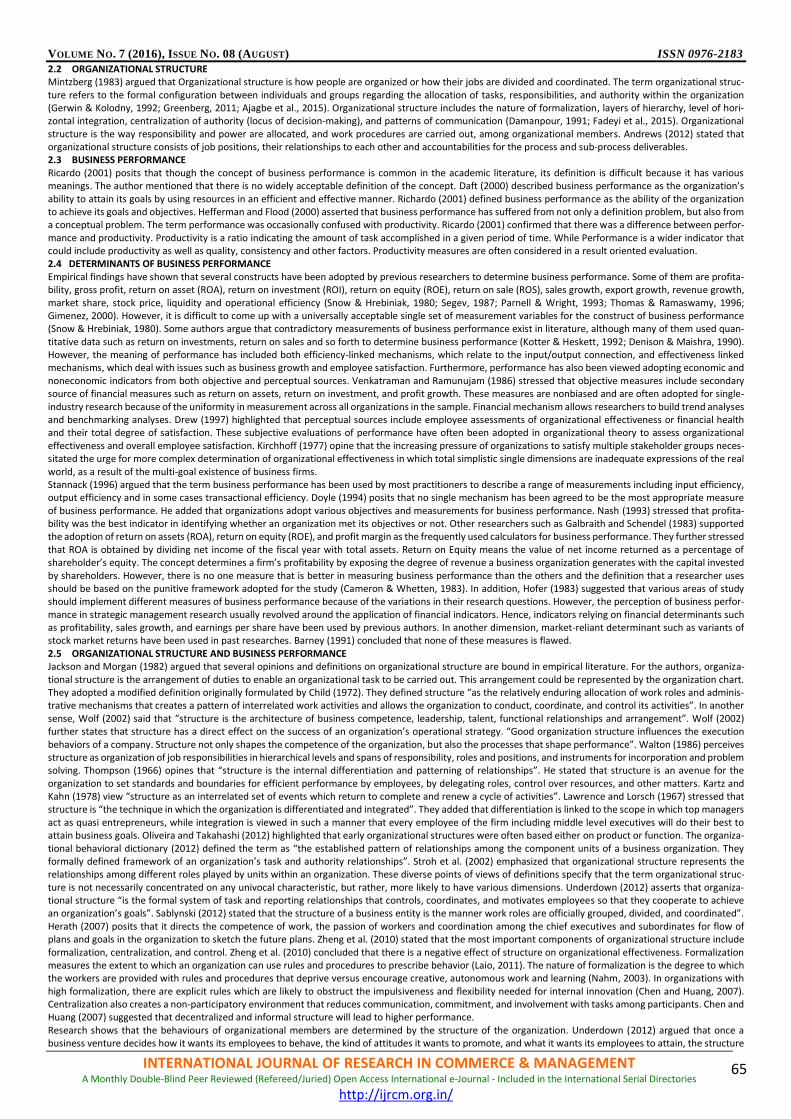
VOLUME NO. 7 (2016), ISSUE NO. 08 (AUGUST) ISSN 0976-2183
INTERNATIONAL JOURNAL OF RESEARCH IN COMMERCE & MANAGEMENT A Monthly Double-Blind Peer Reviewed (Refereed/Juried) Open Access International e-Journal - Included in the International Serial Directories
http://ijrcm.org.in/
65
2.2 ORGANIZATIONAL STRUCTURE Mintzberg (1983) argued that Organizational structure is how people are organized or how their jobs are divided and coordinated. The term organizational struc-ture refers to the formal configuration between individuals and groups regarding the allocation of tasks, responsibilities, and authority within the organization (Gerwin & Kolodny, 1992; Greenberg, 2011; Ajagbe et al., 2015). Organizational structure includes the nature of formalization, layers of hierarchy, level of hori-zontal integration, centralization of authority (locus of decision-making), and patterns of communication (Damanpour, 1991; Fadeyi et al., 2015). Organizational structure is the way responsibility and power are allocated, and work procedures are carried out, among organizational members. Andrews (2012) stated that organizational structure consists of job positions, their relationships to each other and accountabilities for the process and sub-process deliverables. 2.3 BUSINESS PERFORMANCE Ricardo (2001) posits that though the concept of business performance is common in the academic literature, its definition is difficult because it has various meanings. The author mentioned that there is no widely acceptable definition of the concept. Daft (2000) described business performance as the organization’s ability to attain its goals by using resources in an efficient and effective manner. Richardo (2001) defined business performance as the ability of the organization to achieve its goals and objectives. Hefferman and Flood (2000) asserted that business performance has suffered from not only a definition problem, but also from a conceptual problem. The term performance was occasionally confused with productivity. Ricardo (2001) confirmed that there was a difference between perfor-mance and productivity. Productivity is a ratio indicating the amount of task accomplished in a given period of time. While Performance is a wider indicator that could include productivity as well as quality, consistency and other factors. Productivity measures are often considered in a result oriented evaluation. 2.4 DETERMINANTS OF BUSINESS PERFORMANCE Empirical findings have shown that several constructs have been adopted by previous researchers to determine business performance. Some of them are profita-bility, gross profit, return on asset (ROA), return on investment (ROI), return on equity (ROE), return on sale (ROS), sales growth, export growth, revenue growth, market share, stock price, liquidity and operational efficiency (Snow & Hrebiniak, 1980; Segev, 1987; Parnell & Wright, 1993; Thomas & Ramaswamy, 1996; Gimenez, 2000). However, it is difficult to come up with a universally acceptable single set of measurement variables for the construct of business performance (Snow & Hrebiniak, 1980). Some authors argue that contradictory measurements of business performance exist in literature, although many of them used quan-titative data such as return on investments, return on sales and so forth to determine business performance (Kotter & Heskett, 1992; Denison & Maishra, 1990). However, the meaning of performance has included both efficiency-linked mechanisms, which relate to the input/output connection, and effectiveness linked mechanisms, which deal with issues such as business growth and employee satisfaction. Furthermore, performance has also been viewed adopting economic and noneconomic indicators from both objective and perceptual sources. Venkatraman and Ramunujam (1986) stressed that objective measures include secondary source of financial measures such as return on assets, return on investment, and profit growth. These measures are nonbiased and are often adopted for single-industry research because of the uniformity in measurement across all organizations in the sample. Financial mechanism allows researchers to build trend analyses and benchmarking analyses. Drew (1997) highlighted that perceptual sources include employee assessments of organizational effectiveness or financial health and their total degree of satisfaction. These subjective evaluations of performance have often been adopted in organizational theory to assess organizational effectiveness and overall employee satisfaction. Kirchhoff (1977) opine that the increasing pressure of organizations to satisfy multiple stakeholder groups neces-sitated the urge for more complex determination of organizational effectiveness in which total simplistic single dimensions are inadequate expressions of the real world, as a result of the multi-goal existence of business firms. Stannack (1996) argued that the term business performance has been used by most practitioners to describe a range of measurements including input efficiency, output efficiency and in some cases transactional efficiency. Doyle (1994) posits that no single mechanism has been agreed to be the most appropriate measure of business performance. He added that organizations adopt various objectives and measurements for business performance. Nash (1993) stressed that profita-bility was the best indicator in identifying whether an organization met its objectives or not. Other researchers such as Galbraith and Schendel (1983) supported the adoption of return on assets (ROA), return on equity (ROE), and profit margin as the frequently used calculators for business performance. They further stressed that ROA is obtained by dividing net income of the fiscal year with total assets. Return on Equity means the value of net income returned as a percentage of shareholder’s equity. The concept determines a firm’s profitability by exposing the degree of revenue a business organization generates with the capital invested by shareholders. However, there is no one measure that is better in measuring business performance than the others and the definition that a researcher uses should be based on the punitive framework adopted for the study (Cameron & Whetten, 1983). In addition, Hofer (1983) suggested that various areas of study should implement different measures of business performance because of the variations in their research questions. However, the perception of business perfor-mance in strategic management research usually revolved around the application of financial indicators. Hence, indicators relying on financial determinants such as profitability, sales growth, and earnings per share have been used by previous authors. In another dimension, market-reliant determinant such as variants of stock market returns have been used in past researches. Barney (1991) concluded that none of these measures is flawed. 2.5 ORGANIZATIONAL STRUCTURE AND BUSINESS PERFORMANCE Jackson and Morgan (1982) argued that several opinions and definitions on organizational structure are bound in empirical literature. For the authors, organiza-tional structure is the arrangement of duties to enable an organizational task to be carried out. This arrangement could be represented by the organization chart. They adopted a modified definition originally formulated by Child (1972). They defined structure “as the relatively enduring allocation of work roles and adminis-trative mechanisms that creates a pattern of interrelated work activities and allows the organization to conduct, coordinate, and control its activities”. In another sense, Wolf (2002) said that “structure is the architecture of business competence, leadership, talent, functional relationships and arrangement”. Wolf (2002) further states that structure has a direct effect on the success of an organization’s operational strategy. “Good organization structure influences the execution behaviors of a company. Structure not only shapes the competence of the organization, but also the processes that shape performance”. Walton (1986) perceives structure as organization of job responsibilities in hierarchical levels and spans of responsibility, roles and positions, and instruments for incorporation and problem solving. Thompson (1966) opines that “structure is the internal differentiation and patterning of relationships”. He stated that structure is an avenue for the organization to set standards and boundaries for efficient performance by employees, by delegating roles, control over resources, and other matters. Kartz and Kahn (1978) view “structure as an interrelated set of events which return to complete and renew a cycle of activities”. Lawrence and Lorsch (1967) stressed that structure is “the technique in which the organization is differentiated and integrated”. They added that differentiation is linked to the scope in which top managers act as quasi entrepreneurs, while integration is viewed in such a manner that every employee of the firm including middle level executives will do their best to attain business goals. Oliveira and Takahashi (2012) highlighted that early organizational structures were often based either on product or function. The organiza-tional behavioral dictionary (2012) defined the term as “the established pattern of relationships among the component units of a business organization. They formally defined framework of an organization’s task and authority relationships”. Stroh et al. (2002) emphasized that organizational structure represents the relationships among different roles played by units within an organization. These diverse points of views of definitions specify that the term organizational struc-ture is not necessarily concentrated on any univocal characteristic, but rather, more likely to have various dimensions. Underdown (2012) asserts that organiza-tional structure “is the formal system of task and reporting relationships that controls, coordinates, and motivates employees so that they cooperate to achieve an organization’s goals”. Sablynski (2012) stated that the structure of a business entity is the manner work roles are officially grouped, divided, and coordinated”. Herath (2007) posits that it directs the competence of work, the passion of workers and coordination among the chief executives and subordinates for flow of plans and goals in the organization to sketch the future plans. Zheng et al. (2010) stated that the most important components of organizational structure include formalization, centralization, and control. Zheng et al. (2010) concluded that there is a negative effect of structure on organizational effectiveness. Formalization measures the extent to which an organization can use rules and procedures to prescribe behavior (Laio, 2011). The nature of formalization is the degree to which the workers are provided with rules and procedures that deprive versus encourage creative, autonomous work and learning (Nahm, 2003). In organizations with high formalization, there are explicit rules which are likely to obstruct the impulsiveness and flexibility needed for internal innovation (Chen and Huang, 2007). Centralization also creates a non-participatory environment that reduces communication, commitment, and involvement with tasks among participants. Chen and Huang (2007) suggested that decentralized and informal structure will lead to higher performance. Research shows that the behaviours of organizational members are determined by the structure of the organization. Underdown (2012) argued that once a business venture decides how it wants its employees to behave, the kind of attitudes it wants to promote, and what it wants its employees to attain, the structure
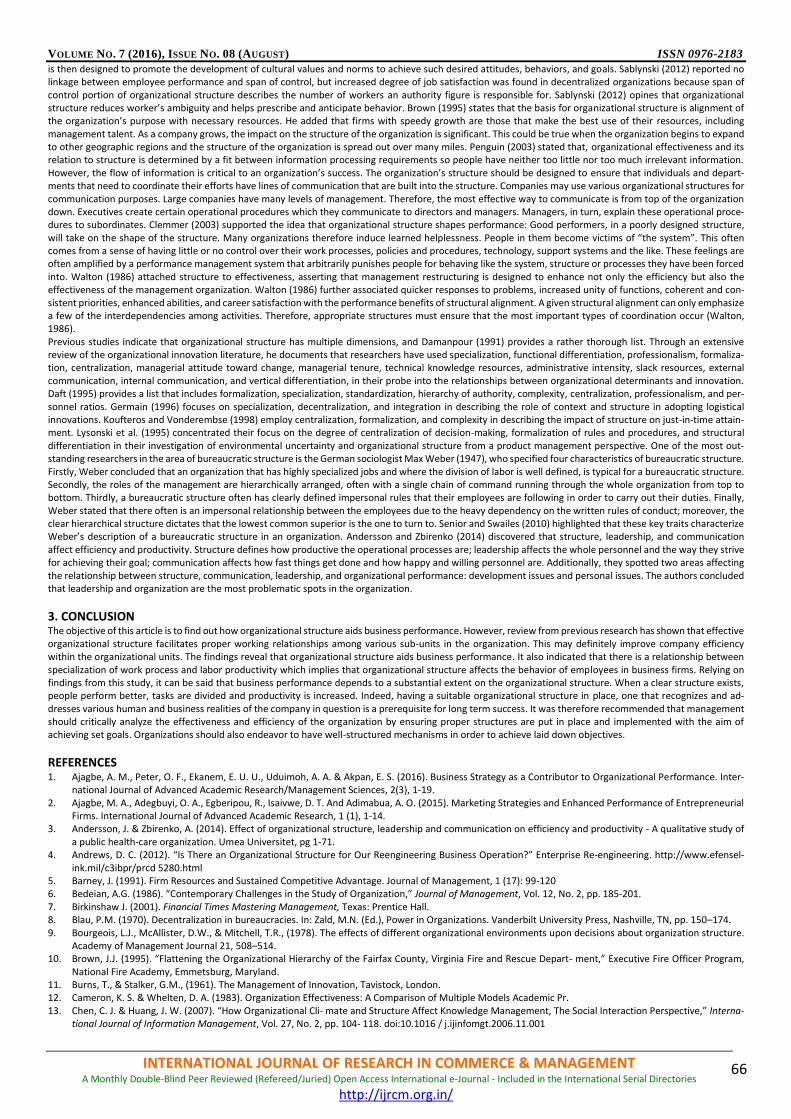
VOLUME NO. 7 (2016), ISSUE NO. 08 (AUGUST) ISSN 0976-2183
INTERNATIONAL JOURNAL OF RESEARCH IN COMMERCE & MANAGEMENT A Monthly Double-Blind Peer Reviewed (Refereed/Juried) Open Access International e-Journal - Included in the International Serial Directories
http://ijrcm.org.in/
66
is then designed to promote the development of cultural values and norms to achieve such desired attitudes, behaviors, and goals. Sablynski (2012) reported no linkage between employee performance and span of control, but increased degree of job satisfaction was found in decentralized organizations because span of control portion of organizational structure describes the number of workers an authority figure is responsible for. Sablynski (2012) opines that organizational structure reduces worker’s ambiguity and helps prescribe and anticipate behavior. Brown (1995) states that the basis for organizational structure is alignment of the organization’s purpose with necessary resources. He added that firms with speedy growth are those that make the best use of their resources, including management talent. As a company grows, the impact on the structure of the organization is significant. This could be true when the organization begins to expand to other geographic regions and the structure of the organization is spread out over many miles. Penguin (2003) stated that, organizational effectiveness and its relation to structure is determined by a fit between information processing requirements so people have neither too little nor too much irrelevant information. However, the flow of information is critical to an organization’s success. The organization’s structure should be designed to ensure that individuals and depart-ments that need to coordinate their efforts have lines of communication that are built into the structure. Companies may use various organizational structures for communication purposes. Large companies have many levels of management. Therefore, the most effective way to communicate is from top of the organization down. Executives create certain operational procedures which they communicate to directors and managers. Managers, in turn, explain these operational proce-dures to subordinates. Clemmer (2003) supported the idea that organizational structure shapes performance: Good performers, in a poorly designed structure, will take on the shape of the structure. Many organizations therefore induce learned helplessness. People in them become victims of “the system”. This often comes from a sense of having little or no control over their work processes, policies and procedures, technology, support systems and the like. These feelings are often amplified by a performance management system that arbitrarily punishes people for behaving like the system, structure or processes they have been forced into. Walton (1986) attached structure to effectiveness, asserting that management restructuring is designed to enhance not only the efficiency but also the effectiveness of the management organization. Walton (1986) further associated quicker responses to problems, increased unity of functions, coherent and con-sistent priorities, enhanced abilities, and career satisfaction with the performance benefits of structural alignment. A given structural alignment can only emphasize a few of the interdependencies among activities. Therefore, appropriate structures must ensure that the most important types of coordination occur (Walton, 1986). Previous studies indicate that organizational structure has multiple dimensions, and Damanpour (1991) provides a rather thorough list. Through an extensive review of the organizational innovation literature, he documents that researchers have used specialization, functional differentiation, professionalism, formaliza-tion, centralization, managerial attitude toward change, managerial tenure, technical knowledge resources, administrative intensity, slack resources, external communication, internal communication, and vertical differentiation, in their probe into the relationships between organizational determinants and innovation. Daft (1995) provides a list that includes formalization, specialization, standardization, hierarchy of authority, complexity, centralization, professionalism, and per-sonnel ratios. Germain (1996) focuses on specialization, decentralization, and integration in describing the role of context and structure in adopting logistical innovations. Koufteros and Vonderembse (1998) employ centralization, formalization, and complexity in describing the impact of structure on just-in-time attain-ment. Lysonski et al. (1995) concentrated their focus on the degree of centralization of decision-making, formalization of rules and procedures, and structural differentiation in their investigation of environmental uncertainty and organizational structure from a product management perspective. One of the most out-standing researchers in the area of bureaucratic structure is the German sociologist Max Weber (1947), who specified four characteristics of bureaucratic structure. Firstly, Weber concluded that an organization that has highly specialized jobs and where the division of labor is well defined, is typical for a bureaucratic structure. Secondly, the roles of the management are hierarchically arranged, often with a single chain of command running through the whole organization from top to bottom. Thirdly, a bureaucratic structure often has clearly defined impersonal rules that their employees are following in order to carry out their duties. Finally, Weber stated that there often is an impersonal relationship between the employees due to the heavy dependency on the written rules of conduct; moreover, the clear hierarchical structure dictates that the lowest common superior is the one to turn to. Senior and Swailes (2010) highlighted that these key traits characterize Weber’s description of a bureaucratic structure in an organization. Andersson and Zbirenko (2014) discovered that structure, leadership, and communication affect efficiency and productivity. Structure defines how productive the operational processes are; leadership affects the whole personnel and the way they strive for achieving their goal; communication affects how fast things get done and how happy and willing personnel are. Additionally, they spotted two areas affecting the relationship between structure, communication, leadership, and organizational performance: development issues and personal issues. The authors concluded that leadership and organization are the most problematic spots in the organization.
3. CONCLUSION The objective of this article is to find out how organizational structure aids business performance. However, review from previous research has shown that effective organizational structure facilitates proper working relationships among various sub-units in the organization. This may definitely improve company efficiency within the organizational units. The findings reveal that organizational structure aids business performance. It also indicated that there is a relationship between specialization of work process and labor productivity which implies that organizational structure affects the behavior of employees in business firms. Relying on findings from this study, it can be said that business performance depends to a substantial extent on the organizational structure. When a clear structure exists, people perform better, tasks are divided and productivity is increased. Indeed, having a suitable organizational structure in place, one that recognizes and ad-dresses various human and business realities of the company in question is a prerequisite for long term success. It was therefore recommended that management should critically analyze the effectiveness and efficiency of the organization by ensuring proper structures are put in place and implemented with the aim of achieving set goals. Organizations should also endeavor to have well-structured mechanisms in order to achieve laid down objectives.
REFERENCES 1. Ajagbe, A. M., Peter, O. F., Ekanem, E. U. U., Uduimoh, A. A. & Akpan, E. S. (2016). Business Strategy as a Contributor to Organizational Performance. Inter-
national Journal of Advanced Academic Research/Management Sciences, 2(3), 1-19. 2. Ajagbe, M. A., Adegbuyi, O. A., Egberipou, R., Isaivwe, D. T. And Adimabua, A. O. (2015). Marketing Strategies and Enhanced Performance of Entrepreneurial
Firms. International Journal of Advanced Academic Research, 1 (1), 1-14. 3. Andersson, J. & Zbirenko, A. (2014). Effect of organizational structure, leadership and communication on efficiency and productivity - A qualitative study of
a public health-care organization. Umea Universitet, pg 1-71. 4. Andrews, D. C. (2012). “Is There an Organizational Structure for Our Reengineering Business Operation?” Enterprise Re-engineering. http://www.efensel-
ink.mil/c3ibpr/prcd 5280.html 5. Barney, J. (1991). Firm Resources and Sustained Competitive Advantage. Journal of Management, 1 (17): 99-120 6. Bedeian, A.G. (1986). “Contemporary Challenges in the Study of Organization,” Journal of Management, Vol. 12, No. 2, pp. 185-201. 7. Birkinshaw J. (2001). Financial Times Mastering Management, Texas: Prentice Hall. 8. Blau, P.M. (1970). Decentralization in bureaucracies. In: Zald, M.N. (Ed.), Power in Organizations. Vanderbilt University Press, Nashville, TN, pp. 150–174. 9. Bourgeois, L.J., McAllister, D.W., & Mitchell, T.R., (1978). The effects of different organizational environments upon decisions about organization structure.
Academy of Management Journal 21, 508–514. 10. Brown, J.J. (1995). “Flattening the Organizational Hierarchy of the Fairfax County, Virginia Fire and Rescue Depart- ment,” Executive Fire Officer Program,
National Fire Academy, Emmetsburg, Maryland. 11. Burns, T., & Stalker, G.M., (1961). The Management of Innovation, Tavistock, London. 12. Cameron, K. S. & Whelten, D. A. (1983). Organization Effectiveness: A Comparison of Multiple Models Academic Pr. 13. Chen, C. J. & Huang, J. W. (2007). “How Organizational Cli- mate and Structure Affect Knowledge Management, The Social Interaction Perspective,” Interna-
tional Journal of Information Management, Vol. 27, No. 2, pp. 104- 118. doi:10.1016 / j.ijinfomgt.2006.11.001
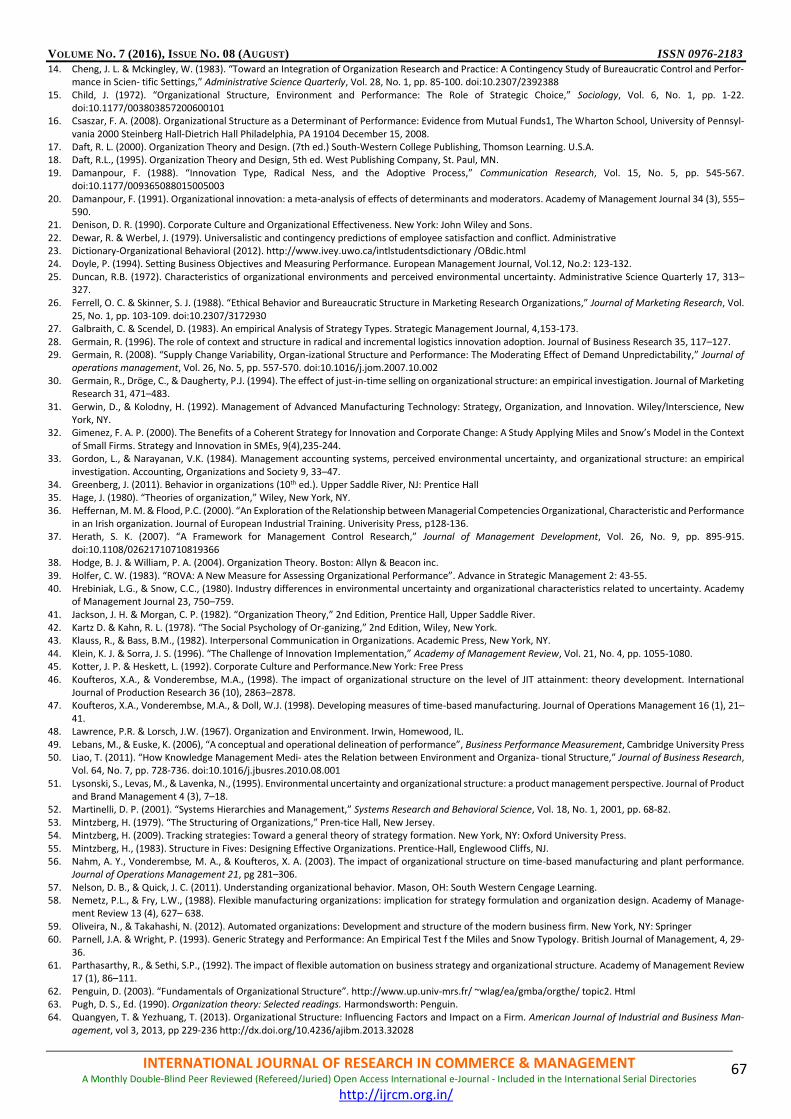
VOLUME NO. 7 (2016), ISSUE NO. 08 (AUGUST) ISSN 0976-2183
INTERNATIONAL JOURNAL OF RESEARCH IN COMMERCE & MANAGEMENT A Monthly Double-Blind Peer Reviewed (Refereed/Juried) Open Access International e-Journal - Included in the International Serial Directories
http://ijrcm.org.in/
67
14. Cheng, J. L. & Mckingley, W. (1983). “Toward an Integration of Organization Research and Practice: A Contingency Study of Bureaucratic Control and Perfor-mance in Scien- tific Settings,” Administrative Science Quarterly, Vol. 28, No. 1, pp. 85-100. doi:10.2307/2392388
15. Child, J. (1972). “Organizational Structure, Environment and Performance: The Role of Strategic Choice,” Sociology, Vol. 6, No. 1, pp. 1-22. doi:10.1177/003803857200600101
16. Csaszar, F. A. (2008). Organizational Structure as a Determinant of Performance: Evidence from Mutual Funds1, The Wharton School, University of Pennsyl-vania 2000 Steinberg Hall-Dietrich Hall Philadelphia, PA 19104 December 15, 2008.
17. Daft, R. L. (2000). Organization Theory and Design. (7th ed.) South-Western College Publishing, Thomson Learning. U.S.A. 18. Daft, R.L., (1995). Organization Theory and Design, 5th ed. West Publishing Company, St. Paul, MN. 19. Damanpour, F. (1988). “Innovation Type, Radical Ness, and the Adoptive Process,” Communication Research, Vol. 15, No. 5, pp. 545-567.
doi:10.1177/009365088015005003 20. Damanpour, F. (1991). Organizational innovation: a meta-analysis of effects of determinants and moderators. Academy of Management Journal 34 (3), 555–
590. 21. Denison, D. R. (1990). Corporate Culture and Organizational Effectiveness. New York: John Wiley and Sons. 22. Dewar, R. & Werbel, J. (1979). Universalistic and contingency predictions of employee satisfaction and conflict. Administrative 23. Dictionary-Organizational Behavioral (2012). http://www.ivey.uwo.ca/intlstudentsdictionary /OBdic.html 24. Doyle, P. (1994). Setting Business Objectives and Measuring Performance. European Management Journal, Vol.12, No.2: 123-132. 25. Duncan, R.B. (1972). Characteristics of organizational environments and perceived environmental uncertainty. Administrative Science Quarterly 17, 313–
327. 26. Ferrell, O. C. & Skinner, S. J. (1988). “Ethical Behavior and Bureaucratic Structure in Marketing Research Organizations,” Journal of Marketing Research, Vol.
25, No. 1, pp. 103-109. doi:10.2307/3172930 27. Galbraith, C. & Scendel, D. (1983). An empirical Analysis of Strategy Types. Strategic Management Journal, 4,153-173. 28. Germain, R. (1996). The role of context and structure in radical and incremental logistics innovation adoption. Journal of Business Research 35, 117–127. 29. Germain, R. (2008). “Supply Change Variability, Organ-izational Structure and Performance: The Moderating Effect of Demand Unpredictability,” Journal of
operations management, Vol. 26, No. 5, pp. 557-570. doi:10.1016/j.jom.2007.10.002 30. Germain, R., Dröge, C., & Daugherty, P.J. (1994). The effect of just-in-time selling on organizational structure: an empirical investigation. Journal of Marketing
Research 31, 471–483. 31. Gerwin, D., & Kolodny, H. (1992). Management of Advanced Manufacturing Technology: Strategy, Organization, and Innovation. Wiley/Interscience, New
York, NY. 32. Gimenez, F. A. P. (2000). The Benefits of a Coherent Strategy for Innovation and Corporate Change: A Study Applying Miles and Snow’s Model in the Context
of Small Firms. Strategy and Innovation in SMEs, 9(4),235-244. 33. Gordon, L., & Narayanan, V.K. (1984). Management accounting systems, perceived environmental uncertainty, and organizational structure: an empirical
investigation. Accounting, Organizations and Society 9, 33–47. 34. Greenberg, J. (2011). Behavior in organizations (10th ed.). Upper Saddle River, NJ: Prentice Hall 35. Hage, J. (1980). “Theories of organization,” Wiley, New York, NY. 36. Heffernan, M. M. & Flood, P.C. (2000). “An Exploration of the Relationship between Managerial Competencies Organizational, Characteristic and Performance
in an Irish organization. Journal of European Industrial Training. Univerisity Press, p128-136. 37. Herath, S. K. (2007). “A Framework for Management Control Research,” Journal of Management Development, Vol. 26, No. 9, pp. 895-915.
doi:10.1108/02621710710819366 38. Hodge, B. J. & William, P. A. (2004). Organization Theory. Boston: Allyn & Beacon inc. 39. Holfer, C. W. (1983). “ROVA: A New Measure for Assessing Organizational Performance”. Advance in Strategic Management 2: 43-55. 40. Hrebiniak, L.G., & Snow, C.C., (1980). Industry differences in environmental uncertainty and organizational characteristics related to uncertainty. Academy
of Management Journal 23, 750–759. 41. Jackson, J. H. & Morgan, C. P. (1982). “Organization Theory,” 2nd Edition, Prentice Hall, Upper Saddle River. 42. Kartz D. & Kahn, R. L. (1978). “The Social Psychology of Or-ganizing,” 2nd Edition, Wiley, New York. 43. Klauss, R., & Bass, B.M., (1982). Interpersonal Communication in Organizations. Academic Press, New York, NY. 44. Klein, K. J. & Sorra, J. S. (1996). “The Challenge of Innovation Implementation,” Academy of Management Review, Vol. 21, No. 4, pp. 1055-1080. 45. Kotter, J. P. & Heskett, L. (1992). Corporate Culture and Performance.New York: Free Press 46. Koufteros, X.A., & Vonderembse, M.A., (1998). The impact of organizational structure on the level of JIT attainment: theory development. International
Journal of Production Research 36 (10), 2863–2878. 47. Koufteros, X.A., Vonderembse, M.A., & Doll, W.J. (1998). Developing measures of time-based manufacturing. Journal of Operations Management 16 (1), 21–
41. 48. Lawrence, P.R. & Lorsch, J.W. (1967). Organization and Environment. Irwin, Homewood, IL. 49. Lebans, M., & Euske, K. (2006), “A conceptual and operational delineation of performance”, Business Performance Measurement, Cambridge University Press 50. Liao, T. (2011). “How Knowledge Management Medi- ates the Relation between Environment and Organiza- tional Structure,” Journal of Business Research,
Vol. 64, No. 7, pp. 728-736. doi:10.1016/j.jbusres.2010.08.001 51. Lysonski, S., Levas, M., & Lavenka, N., (1995). Environmental uncertainty and organizational structure: a product management perspective. Journal of Product
and Brand Management 4 (3), 7–18. 52. Martinelli, D. P. (2001). “Systems Hierarchies and Management,” Systems Research and Behavioral Science, Vol. 18, No. 1, 2001, pp. 68-82. 53. Mintzberg, H. (1979). “The Structuring of Organizations,” Pren-tice Hall, New Jersey. 54. Mintzberg, H. (2009). Tracking strategies: Toward a general theory of strategy formation. New York, NY: Oxford University Press. 55. Mintzberg, H., (1983). Structure in Fives: Designing Effective Organizations. Prentice-Hall, Englewood Cliffs, NJ. 56. Nahm, A. Y., Vonderembse, M. A., & Koufteros, X. A. (2003). The impact of organizational structure on time-based manufacturing and plant performance.
Journal of Operations Management 21, pg 281–306. 57. Nelson, D. B., & Quick, J. C. (2011). Understanding organizational behavior. Mason, OH: South Western Cengage Learning. 58. Nemetz, P.L., & Fry, L.W., (1988). Flexible manufacturing organizations: implication for strategy formulation and organization design. Academy of Manage-
ment Review 13 (4), 627– 638. 59. Oliveira, N., & Takahashi, N. (2012). Automated organizations: Development and structure of the modern business firm. New York, NY: Springer 60. Parnell, J.A. & Wright, P. (1993). Generic Strategy and Performance: An Empirical Test f the Miles and Snow Typology. British Journal of Management, 4, 29-
36. 61. Parthasarthy, R., & Sethi, S.P., (1992). The impact of flexible automation on business strategy and organizational structure. Academy of Management Review
17 (1), 86–111. 62. Penguin, D. (2003). “Fundamentals of Organizational Structure”. http://www.up.univ-mrs.fr/ ~wlag/ea/gmba/orgthe/ topic2. Html 63. Pugh, D. S., Ed. (1990). Organization theory: Selected readings. Harmondsworth: Penguin. 64. Quangyen, T. & Yezhuang, T. (2013). Organizational Structure: Influencing Factors and Impact on a Firm. American Journal of Industrial and Business Man-
agement, vol 3, 2013, pp 229-236 http://dx.doi.org/10.4236/ajibm.2013.32028

VOLUME NO. 7 (2016), ISSUE NO. 08 (AUGUST) ISSN 0976-2183
INTERNATIONAL JOURNAL OF RESEARCH IN COMMERCE & MANAGEMENT A Monthly Double-Blind Peer Reviewed (Refereed/Juried) Open Access International e-Journal - Included in the International Serial Directories
http://ijrcm.org.in/
68
65. Ricardo, R. & Wade, D. (2001). Corporate Performance Management: How to Build a Better Organization Through Measurement Driven Strategies Alignment. Butterworth Heinemann.
66. Rudolph, H.R., & Welker, R.B., (1998). The effects of organizational structure on communication within audit teams. Auditing: A Journal of Practice and Theory 17 (2), 1–14.
67. Ruekert, R.W., Walker Jr., O.C., & Roering, K.J. (1985). The organization of marketing activities: a contingency theory of structure and performance. Journal of Marketing 49, 13–25.
68. Sablynski, C. J. (2012). “Foundation of Organizational Structure,” http://www.csus.edu/indiv/s/ sablynskic /ch.14.html 69. Science Quarterly 24, 426–448. 70. Segev, E. (1987). Strategy, Strategy-making and Performance in a Business Game. Strategic Management Journal, 8,565-577. 71. Senior, B. & Swailes, S. (2010). Organizational Change. 4th edition. Harlow: Prentice Hall. 72. Snow, C. C. & Hrebiniak, L.G. (1980). Strategy, Distinctive Competence, and Organizational Performance. Administrative Science Quarterly, 25,307-335. 73. Spekman, R.E., & Stern, L.W., (1979). Environmental uncertainty and buying group structure. Journal of Marketing 43, 54–64. 74. Stannack, P. (1996). Perspective on Employees Performance. Management Research News, Vol19, No4/5.p38-40 75. Stroh, L. K., Northcraft, G. B., & Neale, M. A. (2002). Organizational behavior: A management challenge. Mahwah, N.J: Lawrence Erlbaum. 76. Swamidass, P.M., & Newell, W.T. (1987). Manufacturing strategy, environmental uncertainty and performance: a path analytic model. Management Science
33 (4), 509–524. 77. “The Importance of a Good Organizational,” 2012. http://smallusiness.chron.com/importance-goodorganizational-srtucture 78. Thomas, A.S. & Ramaswamy, K. (1996). Matching Managers to Strategy: Further Tests of Miles and Snow Typology. British Journal Management,7, 247- 261. 79. Thompson, J. D. (1966). “Organization in Action,” McGraw-Hill, New York. 80. Underdown, R. (2012). “Organizational Structures, Retrieved from: http://dept.lamar.edu/industrial/underdown/ org_mana/org/org_structure-George.html 81. Venkatraman, N. & Ramanujam, V. (1986). Measurement of Business Performance in Strategy Research: A Comparison Approaches. Academy of Manage-
ment Review, 11,801-814. 82. Walton, R. E. (1986). “A Vision-Led Approach to Management Restructuring,” Organizational Dynamics, Vol. 14, No. 4, pp. 5-17. 83. Walton, R.E. (1985). From control to commitment: transforming work force management in the United States. In: Clark, K., Hayes, R., Lorenz, C. (Eds.). The
Uneasy Alliance: Managing the Productivity–Technology Dilemma. Harvard Business School Press, Boston, pp. 237–265. 84. “What are the Benefits of Organiaztional,” 2012. Retrieved from: http://www.ehow.com/list_6532 85. “What Impacts Organizational Structure?” 2012. Retrieved from: http://www.ehow.com/facts_515 86. White, R. E. & Hamermes, R.G. (1981). “Toward a Model of Business Unit Performance: An Integrative Approach,” Academy of Management Review, Vol. 6,
No. 2, pp. 213-223. 87. Wolf, D. (2002). “Execution and Structure”. http://www.dewarsloan. com/workin%20 papers execution%20and20%structure.html 88. Zammuto, R.F., & O’Connor, E.J., (1992). Gaining advanced manufacturing technologies’ benefits: the roles of organizational design and culture. Academy of
Management Review 17 (4), 701–728. 89. Zheng, W., Yang, B. & Mclean, G. N. (2010). “Linking Organ- izational Culture, Strategy and Organizational Effective- ness; Mediating Role of Knowledge
Management,” Journal of Business research, Vol. 63, No. 7, 2010, pp. 763- 771. doi:10.1016 / j.jbusres.2009.06.005

VOLUME NO. 7 (2016), ISSUE NO. 08 (AUGUST) ISSN 0976-2183
INTERNATIONAL JOURNAL OF RESEARCH IN COMMERCE & MANAGEMENT A Monthly Double-Blind Peer Reviewed (Refereed/Juried) Open Access International e-Journal - Included in the International Serial Directories
http://ijrcm.org.in/
69
AUDIT PRACTICES AND PROBLEMS ON SELECTED SAVING AND CREDIT COOPERATIVES IN SOUTH WOLLO ZONE, AMAHARA NATIONAL REGIONAL STATE
MESELE KEBEDE LECTURER
DEPARTMENT OF ACCOUNTING & FINANCE COLLEGE OF BUSINESS & ECONOMICS
WOLAITA SODDO UNIVERSITY SODDO
ABSTRACT The people faces audit problems particularly the selected saving and credit cooperatives and other external users. Number of recommendation are given for the
the auditors to know their weaknesses and strength in order to take improvements for their future careers like Signal to their audit teams that providing high quality
audit services is a top audit priority and that the office does not view such services as a commodity; the office can do this by emphasizing the importance of audit
quality in training programs and annual performance re-views, Encourage all personnel to maintain an attitude of professional skepticism that focuses on the
importance of the auditor’s role in protect-ing the public interest and maintaining strong capital markets. Beside to this the number of auditors with sufficient
training in each sub Woreda should increases in order to balance the number of co-operatives so that there are graduated students those who have taken the
course cooperative accounting along with its legal system, therefore, the government has to train this manpower collaborate with cooperatives to solve the chal-
lenges. Cooperatives have to prepare their financial statement on time through cooperative accounting system that focus on transactions. It should provide a
complete audit or transaction trial for each transaction.
KEYWORDS
audit practices, audit problems.
INTRODUCTION he aim of this paper is to give some information from well experienced countries about audit practices to the cooperatives and to throw new light on the above mentioned problems and discuss them from different angles (appointments, due professional cares, program, routine checking, vouching receipts and payments, verification and valuation, audit report classification and audit control system).
Today it is quite clear that saving and credit cooperatives are facing serious and fundamental problems. Issues at the center of such problems such basic concepts as the nature and aim of cooperatives, as well as its structural and the principles on which it operates. Saving and credit cooperatives were formed as social organizations and did not operate their cooperatives as businesses. (ILO, 1995). A second problem, which existed people were scared to take up leadership positions to control and follow up in each primary cooperative activity. The problem of non-viable saving and credit cooperatives still existed so that this condition was creating gap between the management and external auditors (updated: D.de Jong, 2006) Cooperative societies have no internal auditors because of their limited financial capacity. Thus the absence of internal auditor in each primary cooperatives create difficulty to control day to day activities and ready to external auditors in a given period of time. (ILO,1995). Auditing has numerous advantages but has certain limitations too. At the time of auditing, auditors have to depend on the books of accounts and records produced before they prepared by the staff of the organization staff without intention or in convince with the management law misrepresentation of such records. Auditor’s management is in a position to bring them to light uncover all sorts of manipulations. In other words, audit may not trace out all type of errors misappropriations or manipulations. (Chandier and et al, 1996). Though the cooperative proclamation No. 147/98 and its amendment proclamation No. 402/2004 of Ethiopia gives due attention to dealing with the audit, inspec-tion, keeping audit and inspection results and actions to be taken to avoid different problems, challenges and to keep fund of the society, there are unsolved problems. So, the study tries to identify major problems and good practices of cooperative auditing based on selected saving and credit cooperatives in South Wollo Zone.
OBJECTIVES OF THE STUDY The researcher, so, has inspired to investigate problems in cooperative auditing practices in the selected saving and credit cooperatives. The general objective of the study is to investigate the problems of cooperative auditing practices in selected saving and credit cooperatives in south Wollo Zone. SPECIFIC OBJECTIVES 1. To study the audit practices in selected saving and credit cooperatives in south Wollo Zone. 2. To investigate the problems related to audit of selected saving and credit cooperatives in South Wollo Zone. 3. To identify mechanisms to overcome the problems of cooperative auditing practices in the selected study units.
METHODOLOGY METHODS OF DATA COLLECTION AND SAMPLING STUDY DESIGN The survey would conducted on woreda promoters, audit and inspection case team, senior and junior auditors, members and key informants of selected saving and credit cooperatives in south Wollo zone. SAMPLING Since the study objective is to investigate problems of cooperative auditing practices. A representative sample is taken from the woredas of south Wollo adminis-trative Zone. Cluster sampling procedures were followed along with purposive sampling in order to select the study area and respondents. SELECTION OF RESPONDENTS The study is intended to analyze the problems of Cooperative auditing practices in the selected saving and credit cooperatives. The study respondents were selected from the committees of saving and credit cooperatives; Woreda audit promotion bureaus and the members of the saving and credit cooperatives. The respondents from committees of the saving and credit cooperatives and auditors and promoters from the woredas promotion bureaus were the key informants. The members as a group of the saving and credit cooperatives were used for focus group discussion (FGD).
T
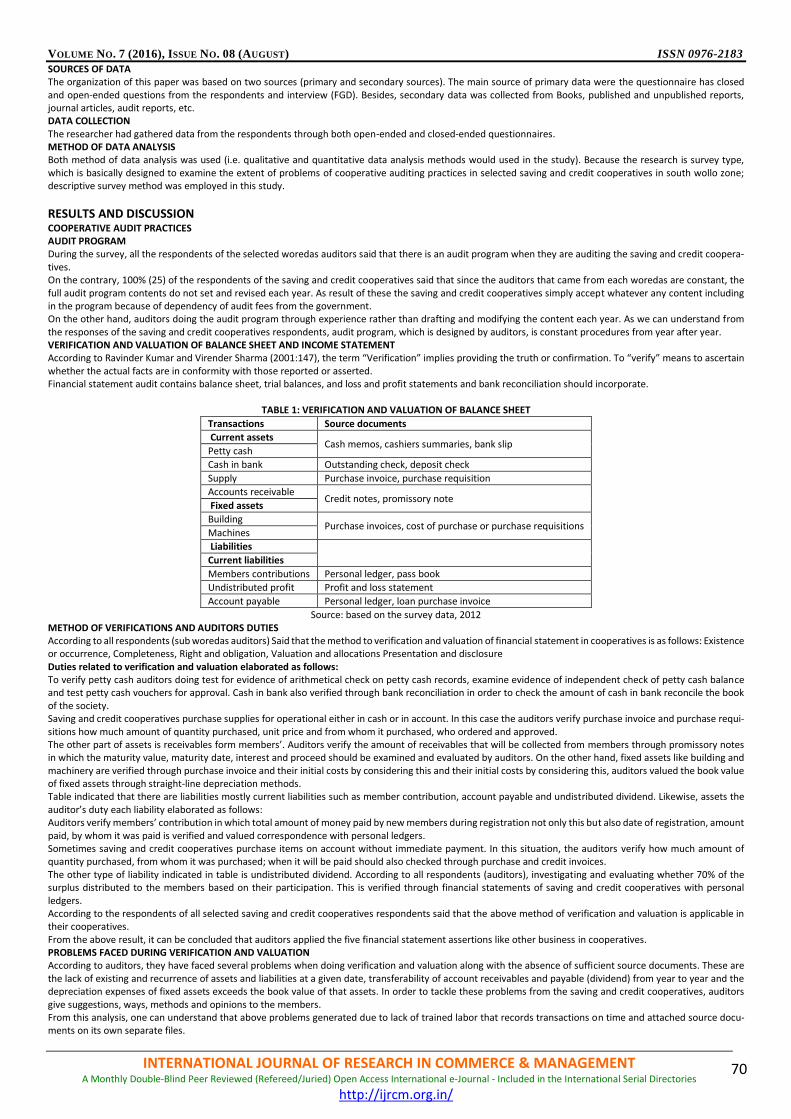
VOLUME NO. 7 (2016), ISSUE NO. 08 (AUGUST) ISSN 0976-2183
INTERNATIONAL JOURNAL OF RESEARCH IN COMMERCE & MANAGEMENT A Monthly Double-Blind Peer Reviewed (Refereed/Juried) Open Access International e-Journal - Included in the International Serial Directories
http://ijrcm.org.in/
70
SOURCES OF DATA The organization of this paper was based on two sources (primary and secondary sources). The main source of primary data were the questionnaire has closed and open-ended questions from the respondents and interview (FGD). Besides, secondary data was collected from Books, published and unpublished reports, journal articles, audit reports, etc. DATA COLLECTION The researcher had gathered data from the respondents through both open-ended and closed-ended questionnaires. METHOD OF DATA ANALYSIS Both method of data analysis was used (i.e. qualitative and quantitative data analysis methods would used in the study). Because the research is survey type, which is basically designed to examine the extent of problems of cooperative auditing practices in selected saving and credit cooperatives in south wollo zone; descriptive survey method was employed in this study.
RESULTS AND DISCUSSION COOPERATIVE AUDIT PRACTICES AUDIT PROGRAM During the survey, all the respondents of the selected woredas auditors said that there is an audit program when they are auditing the saving and credit coopera-tives. On the contrary, 100% (25) of the respondents of the saving and credit cooperatives said that since the auditors that came from each woredas are constant, the full audit program contents do not set and revised each year. As result of these the saving and credit cooperatives simply accept whatever any content including in the program because of dependency of audit fees from the government. On the other hand, auditors doing the audit program through experience rather than drafting and modifying the content each year. As we can understand from the responses of the saving and credit cooperatives respondents, audit program, which is designed by auditors, is constant procedures from year after year. VERIFICATION AND VALUATION OF BALANCE SHEET AND INCOME STATEMENT According to Ravinder Kumar and Virender Sharma (2001:147), the term “Verification” implies providing the truth or confirmation. To “verify” means to ascertain whether the actual facts are in conformity with those reported or asserted. Financial statement audit contains balance sheet, trial balances, and loss and profit statements and bank reconciliation should incorporate.
TABLE 1: VERIFICATION AND VALUATION OF BALANCE SHEET
Transactions Source documents
Current assets Cash memos, cashiers summaries, bank slip
Petty cash
Cash in bank Outstanding check, deposit check
Supply Purchase invoice, purchase requisition
Accounts receivable Credit notes, promissory note
Fixed assets
Building Purchase invoices, cost of purchase or purchase requisitions
Machines
Liabilities
Current liabilities
Members contributions Personal ledger, pass book
Undistributed profit Profit and loss statement
Account payable Personal ledger, loan purchase invoice
Source: based on the survey data, 2012 METHOD OF VERIFICATIONS AND AUDITORS DUTIES According to all respondents (sub woredas auditors) Said that the method to verification and valuation of financial statement in cooperatives is as follows: Existence or occurrence, Completeness, Right and obligation, Valuation and allocations Presentation and disclosure Duties related to verification and valuation elaborated as follows: To verify petty cash auditors doing test for evidence of arithmetical check on petty cash records, examine evidence of independent check of petty cash balance and test petty cash vouchers for approval. Cash in bank also verified through bank reconciliation in order to check the amount of cash in bank reconcile the book of the society. Saving and credit cooperatives purchase supplies for operational either in cash or in account. In this case the auditors verify purchase invoice and purchase requi-sitions how much amount of quantity purchased, unit price and from whom it purchased, who ordered and approved. The other part of assets is receivables form members’. Auditors verify the amount of receivables that will be collected from members through promissory notes in which the maturity value, maturity date, interest and proceed should be examined and evaluated by auditors. On the other hand, fixed assets like building and machinery are verified through purchase invoice and their initial costs by considering this and their initial costs by considering this, auditors valued the book value of fixed assets through straight-line depreciation methods. Table indicated that there are liabilities mostly current liabilities such as member contribution, account payable and undistributed dividend. Likewise, assets the auditor’s duty each liability elaborated as follows: Auditors verify members’ contribution in which total amount of money paid by new members during registration not only this but also date of registration, amount paid, by whom it was paid is verified and valued correspondence with personal ledgers. Sometimes saving and credit cooperatives purchase items on account without immediate payment. In this situation, the auditors verify how much amount of quantity purchased, from whom it was purchased; when it will be paid should also checked through purchase and credit invoices. The other type of liability indicated in table is undistributed dividend. According to all respondents (auditors), investigating and evaluating whether 70% of the surplus distributed to the members based on their participation. This is verified through financial statements of saving and credit cooperatives with personal ledgers. According to the respondents of all selected saving and credit cooperatives respondents said that the above method of verification and valuation is applicable in their cooperatives. From the above result, it can be concluded that auditors applied the five financial statement assertions like other business in cooperatives. PROBLEMS FACED DURING VERIFICATION AND VALUATION According to auditors, they have faced several problems when doing verification and valuation along with the absence of sufficient source documents. These are the lack of existing and recurrence of assets and liabilities at a given date, transferability of account receivables and payable (dividend) from year to year and the depreciation expenses of fixed assets exceeds the book value of that assets. In order to tackle these problems from the saving and credit cooperatives, auditors give suggestions, ways, methods and opinions to the members. From this analysis, one can understand that above problems generated due to lack of trained labor that records transactions on time and attached source docu-ments on its own separate files.
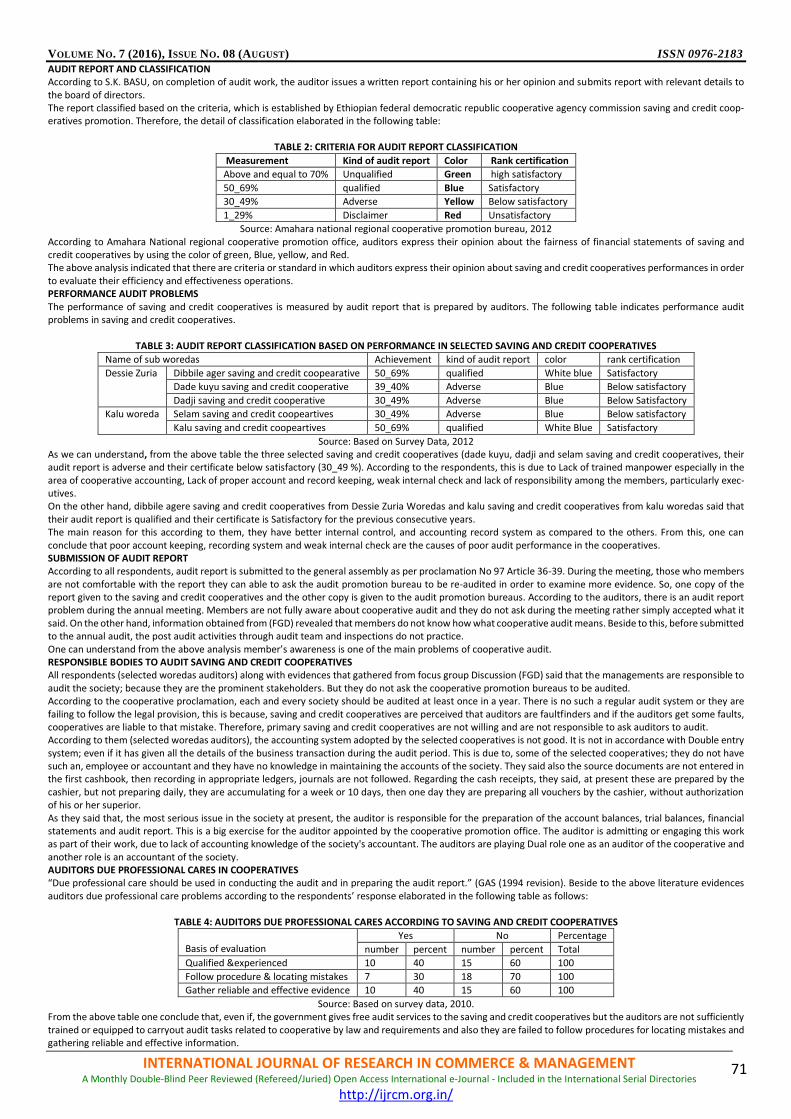
VOLUME NO. 7 (2016), ISSUE NO. 08 (AUGUST) ISSN 0976-2183
INTERNATIONAL JOURNAL OF RESEARCH IN COMMERCE & MANAGEMENT A Monthly Double-Blind Peer Reviewed (Refereed/Juried) Open Access International e-Journal - Included in the International Serial Directories
http://ijrcm.org.in/
71
AUDIT REPORT AND CLASSIFICATION According to S.K. BASU, on completion of audit work, the auditor issues a written report containing his or her opinion and submits report with relevant details to the board of directors. The report classified based on the criteria, which is established by Ethiopian federal democratic republic cooperative agency commission saving and credit coop-eratives promotion. Therefore, the detail of classification elaborated in the following table:
TABLE 2: CRITERIA FOR AUDIT REPORT CLASSIFICATION
Measurement Kind of audit report Color Rank certification
Above and equal to 70% Unqualified Green high satisfactory
50_69% qualified Blue Satisfactory
30_49% Adverse Yellow Below satisfactory
1_29% Disclaimer Red Unsatisfactory
Source: Amahara national regional cooperative promotion bureau, 2012 According to Amahara National regional cooperative promotion office, auditors express their opinion about the fairness of financial statements of saving and credit cooperatives by using the color of green, Blue, yellow, and Red. The above analysis indicated that there are criteria or standard in which auditors express their opinion about saving and credit cooperatives performances in order to evaluate their efficiency and effectiveness operations. PERFORMANCE AUDIT PROBLEMS The performance of saving and credit cooperatives is measured by audit report that is prepared by auditors. The following table indicates performance audit problems in saving and credit cooperatives.
TABLE 3: AUDIT REPORT CLASSIFICATION BASED ON PERFORMANCE IN SELECTED SAVING AND CREDIT COOPERATIVES
Name of sub woredas Achievement kind of audit report color rank certification
Dessie Zuria Dibbile ager saving and credit coopearative 50_69% qualified White blue Satisfactory
Dade kuyu saving and credit cooperative 39_40% Adverse Blue Below satisfactory
Dadji saving and credit cooperative 30_49% Adverse Blue Below Satisfactory
Kalu woreda Selam saving and credit coopeartives 30_49% Adverse Blue Below satisfactory
Kalu saving and credit coopeartives 50_69% qualified White Blue Satisfactory
Source: Based on Survey Data, 2012 As we can understand, from the above table the three selected saving and credit cooperatives (dade kuyu, dadji and selam saving and credit cooperatives, their audit report is adverse and their certificate below satisfactory (30_49 %). According to the respondents, this is due to Lack of trained manpower especially in the area of cooperative accounting, Lack of proper account and record keeping, weak internal check and lack of responsibility among the members, particularly exec-utives. On the other hand, dibbile agere saving and credit cooperatives from Dessie Zuria Woredas and kalu saving and credit cooperatives from kalu woredas said that their audit report is qualified and their certificate is Satisfactory for the previous consecutive years. The main reason for this according to them, they have better internal control, and accounting record system as compared to the others. From this, one can conclude that poor account keeping, recording system and weak internal check are the causes of poor audit performance in the cooperatives. SUBMISSION OF AUDIT REPORT According to all respondents, audit report is submitted to the general assembly as per proclamation No 97 Article 36-39. During the meeting, those who members are not comfortable with the report they can able to ask the audit promotion bureau to be re-audited in order to examine more evidence. So, one copy of the report given to the saving and credit cooperatives and the other copy is given to the audit promotion bureaus. According to the auditors, there is an audit report problem during the annual meeting. Members are not fully aware about cooperative audit and they do not ask during the meeting rather simply accepted what it said. On the other hand, information obtained from (FGD) revealed that members do not know how what cooperative audit means. Beside to this, before submitted to the annual audit, the post audit activities through audit team and inspections do not practice. One can understand from the above analysis member’s awareness is one of the main problems of cooperative audit. RESPONSIBLE BODIES TO AUDIT SAVING AND CREDIT COOPERATIVES All respondents (selected woredas auditors) along with evidences that gathered from focus group Discussion (FGD) said that the managements are responsible to audit the society; because they are the prominent stakeholders. But they do not ask the cooperative promotion bureaus to be audited. According to the cooperative proclamation, each and every society should be audited at least once in a year. There is no such a regular audit system or they are failing to follow the legal provision, this is because, saving and credit cooperatives are perceived that auditors are faultfinders and if the auditors get some faults, cooperatives are liable to that mistake. Therefore, primary saving and credit cooperatives are not willing and are not responsible to ask auditors to audit. According to them (selected woredas auditors), the accounting system adopted by the selected cooperatives is not good. It is not in accordance with Double entry system; even if it has given all the details of the business transaction during the audit period. This is due to, some of the selected cooperatives; they do not have such an, employee or accountant and they have no knowledge in maintaining the accounts of the society. They said also the source documents are not entered in the first cashbook, then recording in appropriate ledgers, journals are not followed. Regarding the cash receipts, they said, at present these are prepared by the cashier, but not preparing daily, they are accumulating for a week or 10 days, then one day they are preparing all vouchers by the cashier, without authorization of his or her superior. As they said that, the most serious issue in the society at present, the auditor is responsible for the preparation of the account balances, trial balances, financial statements and audit report. This is a big exercise for the auditor appointed by the cooperative promotion office. The auditor is admitting or engaging this work as part of their work, due to lack of accounting knowledge of the society's accountant. The auditors are playing Dual role one as an auditor of the cooperative and another role is an accountant of the society. AUDITORS DUE PROFESSIONAL CARES IN COOPERATIVES “Due professional care should be used in conducting the audit and in preparing the audit report.” (GAS (1994 revision). Beside to the above literature evidences auditors due professional care problems according to the respondents’ response elaborated in the following table as follows:
TABLE 4: AUDITORS DUE PROFESSIONAL CARES ACCORDING TO SAVING AND CREDIT COOPERATIVES
Basis of evaluation
Yes No Percentage
number percent number percent Total
Qualified &experienced 10 40 15 60 100
Follow procedure & locating mistakes 7 30 18 70 100
Gather reliable and effective evidence 10 40 15 60 100
Source: Based on survey data, 2010. From the above table one conclude that, even if, the government gives free audit services to the saving and credit cooperatives but the auditors are not sufficiently trained or equipped to carryout audit tasks related to cooperative by law and requirements and also they are failed to follow procedures for locating mistakes and gathering reliable and effective information.

VOLUME NO. 7 (2016), ISSUE NO. 08 (AUGUST) ISSN 0976-2183
INTERNATIONAL JOURNAL OF RESEARCH IN COMMERCE & MANAGEMENT A Monthly Double-Blind Peer Reviewed (Refereed/Juried) Open Access International e-Journal - Included in the International Serial Directories
http://ijrcm.org.in/
72
AUDITOR’S FAMILIARITIES WITH SAVING AND CREDIT COOPERATIVES ACCOUNTING, PROCEDURE AND BY-LAWS 100 %(25) of respondents (selected saving and credit cooperatives) said that, auditors are not familiar with cooperative accounting. Not only auditors but also accountants do not know what cooperative accounting means and how it is applied in the cooperatives. According to them even, the selected saving and credit cooperatives most of they used double entry bookkeeping system. Auditors give suggestions to the saving and credit cooperatives to use double entry when they are preparing their financial statements because auditors use double entry system. The main reason of this fact is that, there are no qualified accountants and auditors who did take cooperative account as a course. Therefore, they are doing whatever they know from their experience. As we can understand from the responses of the respondents, auditors due professional care with familiarity of cooperative accounting system, all respondents said that auditors have no know how what cooperative accounting means and how to apply during the audit processes. Cooperative accounting is formulated for the simplicity and easy understanding of the members for the cooperatives but still not applicable for saving and credit cooperatives due to lack of trained man power in the area of this field.
TABLE 5: AUDITOR’S FAMILIARITY WITH SAVING AND CREDIT COOPERATIVES RULE AND PROCEDURES
Respondents responses Proper knowledge of relevant law
number percent
Agree 5 20
Strongly agree - -
Disagree 20 80
Strongly disagree - -
Total 25 100
Source: based on survey data, 2012 As we can observe the above table, 20 %(5) of the respondents said that auditors know cooperative by laws through experience. Even if; they did not learn cooperative legal system as a course, they are reading and using as a reference material during their performance. On the other hand, 80%(20) of the respondents said that since they are using like other businesses, auditors do not know the right cooperative bylaws, procedures and rules even the accounting system and emphasis only the accounting documents rather than the non-financial audit aspects in which the performance, rule, and regulation included. Therefore, the above findings indicated that the proclamation 147/91 is not fully applicable by the auditors for the time being.
RECOMMENDATIONS Based on finding result the researcher put some of the recommendations, which assists those who faced audit problems particularly the selected saving and credit cooperatives and other external users. This recommendation is also important to the auditors to know their weaknesses and strength in order to take improve-ments for their future careers.
Signal to their audit teams that providing high quality audit services is a top audit priority and that the office does not view such services as a commodity; the office can do this by emphasizing the importance of audit quality in training programs and annual performance reviews.
Encourage all personnel to maintain an attitude of professional skepticism that focuses on the importance of the auditor’s role in protecting the public interest and maintaining strong capital markets.
Beside to this the number of auditors with sufficient training in each sub Woreda should increases in order to balance the number of cooperatives so that there are graduated students those who have taken the course cooperative accounting along with its legal system, therefore, the government has to train this manpower collaborate with cooperatives to solve the challenges.
Cooperatives have to prepare their financial statement on time through cooperative accounting system that focus on transactions. It should provide a com-plete audit or transaction trial for each transaction.
REFERENCES 1. Krishna A Kapadia, ‘Methodology of Auditing Process: The Alarm to Malpractices’, International Journal of Research In Commerce & Management, Volume
No. 7 (2016), Issue No. 4 (April), ISSN 0976 - 2183, pp. 86-87. 2. A. B. Devale & Dr. R. V. Kulkarni, ‘A Role of Knowledge Based System in Information System Audit’, International Journal of Research In Commerce, IT &
Management, Volume No. 5 (2015), Issue No. 12 (December), ISSN 2231-5756, pp. 3-5.

VOLUME NO. 7 (2016), ISSUE NO. 08 (AUGUST) ISSN 0976-2183
INTERNATIONAL JOURNAL OF RESEARCH IN COMMERCE & MANAGEMENT A Monthly Double-Blind Peer Reviewed (Refereed/Juried) Open Access International e-Journal - Included in the International Serial Directories
http://ijrcm.org.in/
73
HYGIENE, SANITATION AND FOOD SAFETY - KNOWLEDGE AND PRACTICES AMONG FOOD HANDLERS WORKING IN RESTAURANTS AND FAST FOOD CENTERS IN TIRUPATI & TIRUMALA
D VANDANA RESEARCH SCHOLAR
DEPARTMENT OF HOME SCIENCE SRI VENKATESWARA UNIVERSITY
TIRUPATI
D. L. KUSUMA PROFESSOR (RETD.)
DEPARTMENT OF HOME SCIENCE SRI VENKATESWARA UNIVERSITY
TIRUPATI
ABSTRACT Tirumala and Tirupati are world Famous Pilgrim centres in Andhra Pradesh, India. Tirupati, the Gate Way of Tirumala, the abode of the famed “Lord Venkateswara” attracts around 3 Lakh Pilgrims, and Visitors of Domestic and International and minimum of one lakh everyday. Besides pilgrim centres, Tirupati a centre of hosting several Educational Institutions and Small Scale Industries and their is a dire need for the study. In this descriptive study, food handlers working in Restaurants and Indian Fast Food Centres in Tirupati and Tirumala town area of Andhra Pradesh, were selected for the sample. To Assess the knowledge and practices among food handlers working in Restaurants and Fast Food Centres. Of the total respondents, Restaurants of Tirupati and Tirumala Scored moderate values 70% and 67.2% in the practices towards Hygiene Sanitation, and Food Safety to the maximum of cleaning of floors, ventilation, temperature control at storage at preparation where as in Fast Food Centres of Tirupati and Tirumala scored minimum values i.e., 30.0% and 16.4%. The Fast Food Centres where not given much priority to Hygiene Sanitation, and Food Safety Practices in anyway. Restaurants showed moderate Practices and where as Fast Food Centres showed poor practices in both areas. The findings suggest an overall deficiency in the standards and practices by food handlers in Fast Food Centres of in both locations.
KEYWORDS hygiene, sanitation, food safety, food handlers.
INTRODUCTION ack of basic infrastructure, poor knowledge of Hygiene and Practices in Food Service Establishments can contribute to out breaks of food borne illness. Food Safety is defined by the FAO/WHO, as the assurance that when food is consumed in the usual manner does not cause harm to human health and wellbeing (WHO, 2002). According to WHO (1989) food handling personnel play important role in ensuring Food Safety throughout the chain of food production and
storage. Lack of unsuitable environments for food operations can contribute to poor microbial quality of foods. In addition, poor sanitary practices, food storage, food handling and preparations can create an environment in which Bacteria and other infectious agents are more transmitted over inadequate time and temperature control and cross contaminations are responsible for food poisoning outbreaks (Wilson, 1997). Poor personnel hygiene frequently contributes to food borne illness which indicates that food handler’s knowledge and handling practices needs to be improved. As stated by WHO, each year over two million people die from diarrheal diseases, many of which are acquired from eating contaminated food from food services establishments (Lee et.al; 2012). Major factors in food contamination are food handling during preparation process by food handlers, food purchase form unsafe sources, inadequate cooking (or) heating storage at room temperature cross contamination from other foods poor personal hygiene or improper food handling practices. Safe handling of food especially in catering establishments is a basic element in the reduction of food borne illnesses and it is essential to understand the Hygiene sanitation and Food Safety knowledge and practices of food handlers working in the catering centres.
METHODOLOGY A purposive sampling technique was followed and multistage random selection was utilized in the selection of the sample units. A multiple group comparison design was adopted where in a total number of 130 Food Catering Centres divided in to Restaurant and Fast Food Centres both in Tirupati and Tirumala Towns of Andhra Pradesh. 50 Restaurants and 50 Fast Food Centres from Tirupati and 10 Restaurants and 20 Fast Food Centres from Tirumala as per the data of Municipal Corporation and Revenue Section of Tirupati & Tirumala. Information regarding their Hygiene, sanitation and Food Safety Practices was collected using a structured schedule. Percentages, Means and Anova was calculated to see differences between the practices Restaurants and Fast Food Centres in two locations. A schedule consists of demographic profile of respondents and a structured questions prepared for the study which consists of 25 questions. Each question was evaluated and aimed to generate Yes/No answer and assigned mark 1 for ‘Yes’ answer and mark Ó’ for ‘No ‘ answer and total scores obtained in each of the area was calculated, interpreted in relation to the maximum score using appropriate statistical procedure and Data analysis was done using SPSS Version of (20.0).
ANALYSIS TABLE 1: DEMOGRAPHIC CHARACTERISTICS OF FOOD HANDLER’s: 130
Demographic Characterises Number Percentage%
GENDER All are Male Respondents 100%
Education Qualification
Below 10th Class 8 10.04 %
Intermediate 43 33.08 %
Graduates 60 46.15 %
HTML ,Degree / Diploma 14 10.76 %
Post Graduates 5 3.85 %
Working Experience
Below 5 years 35 26.92 %
5 to 10 years 58 44.62 %
10 to 15 years 22 16.92 %
15 to 25 years 15 11.53 %
L
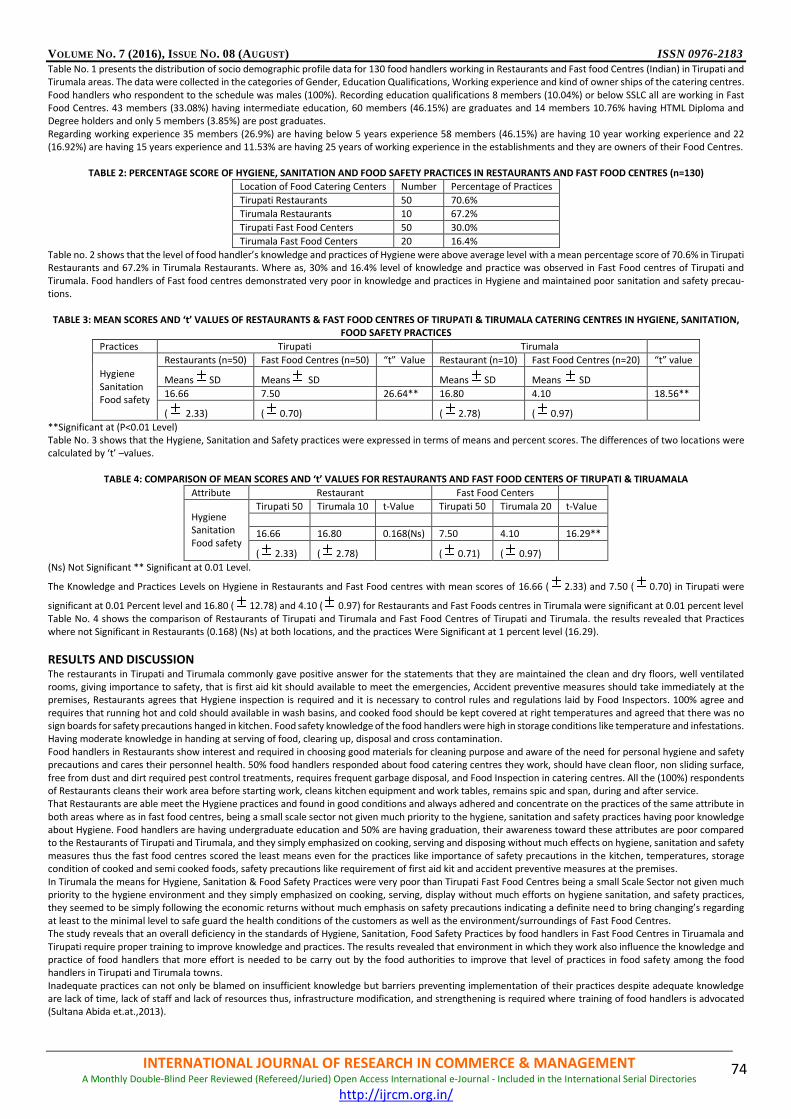
VOLUME NO. 7 (2016), ISSUE NO. 08 (AUGUST) ISSN 0976-2183
INTERNATIONAL JOURNAL OF RESEARCH IN COMMERCE & MANAGEMENT A Monthly Double-Blind Peer Reviewed (Refereed/Juried) Open Access International e-Journal - Included in the International Serial Directories
http://ijrcm.org.in/
74
Table No. 1 presents the distribution of socio demographic profile data for 130 food handlers working in Restaurants and Fast food Centres (Indian) in Tirupati and Tirumala areas. The data were collected in the categories of Gender, Education Qualifications, Working experience and kind of owner ships of the catering centres. Food handlers who respondent to the schedule was males (100%). Recording education qualifications 8 members (10.04%) or below SSLC all are working in Fast Food Centres. 43 members (33.08%) having intermediate education, 60 members (46.15%) are graduates and 14 members 10.76% having HTML Diploma and Degree holders and only 5 members (3.85%) are post graduates. Regarding working experience 35 members (26.9%) are having below 5 years experience 58 members (46.15%) are having 10 year working experience and 22 (16.92%) are having 15 years experience and 11.53% are having 25 years of working experience in the establishments and they are owners of their Food Centres.
TABLE 2: PERCENTAGE SCORE OF HYGIENE, SANITATION AND FOOD SAFETY PRACTICES IN RESTAURANTS AND FAST FOOD CENTRES (n=130)
Location of Food Catering Centers Number Percentage of Practices
Tirupati Restaurants 50 70.6%
Tirumala Restaurants 10 67.2%
Tirupati Fast Food Centers 50 30.0%
Tirumala Fast Food Centers 20 16.4%
Table no. 2 shows that the level of food handler’s knowledge and practices of Hygiene were above average level with a mean percentage score of 70.6% in Tirupati Restaurants and 67.2% in Tirumala Restaurants. Where as, 30% and 16.4% level of knowledge and practice was observed in Fast Food centres of Tirupati and Tirumala. Food handlers of Fast food centres demonstrated very poor in knowledge and practices in Hygiene and maintained poor sanitation and safety precau-tions.
TABLE 3: MEAN SCORES AND ‘t’ VALUES OF RESTAURANTS & FAST FOOD CENTRES OF TIRUPATI & TIRUMALA CATERING CENTRES IN HYGIENE, SANITATION, FOOD SAFETY PRACTICES
Practices Tirupati Tirumala
Hygiene Sanitation Food safety
Restaurants (n=50) Fast Food Centres (n=50) “t” Value Restaurant (n=10) Fast Food Centres (n=20) “t” value
Means SD Means SD
Means SD Means SD
16.66 7.50 26.64** 16.80 4.10 18.56**
( 2.33) ( 0.70)
( 2.78) ( 0.97)
**Significant at (P<0.01 Level) Table No. 3 shows that the Hygiene, Sanitation and Safety practices were expressed in terms of means and percent scores. The differences of two locations were calculated by ‘t’ –values.
TABLE 4: COMPARISON OF MEAN SCORES AND ‘t’ VALUES FOR RESTAURANTS AND FAST FOOD CENTERS OF TIRUPATI & TIRUAMALA
Attribute Restaurant Fast Food Centers
Hygiene Sanitation Food safety
Tirupati 50 Tirumala 10 t-Value Tirupati 50 Tirumala 20 t-Value
16.66 16.80 0.168(Ns) 7.50 4.10 16.29**
( 2.33) ( 2.78)
( 0.71) ( 0.97)
(Ns) Not Significant ** Significant at 0.01 Level.
The Knowledge and Practices Levels on Hygiene in Restaurants and Fast Food centres with mean scores of 16.66 ( 2.33) and 7.50 ( 0.70) in Tirupati were
significant at 0.01 Percent level and 16.80 ( 12.78) and 4.10 ( 0.97) for Restaurants and Fast Foods centres in Tirumala were significant at 0.01 percent level Table No. 4 shows the comparison of Restaurants of Tirupati and Tirumala and Fast Food Centres of Tirupati and Tirumala. the results revealed that Practices where not Significant in Restaurants (0.168) (Ns) at both locations, and the practices Were Significant at 1 percent level (16.29).
RESULTS AND DISCUSSION The restaurants in Tirupati and Tirumala commonly gave positive answer for the statements that they are maintained the clean and dry floors, well ventilated rooms, giving importance to safety, that is first aid kit should available to meet the emergencies, Accident preventive measures should take immediately at the premises, Restaurants agrees that Hygiene inspection is required and it is necessary to control rules and regulations laid by Food Inspectors. 100% agree and requires that running hot and cold should available in wash basins, and cooked food should be kept covered at right temperatures and agreed that there was no sign boards for safety precautions hanged in kitchen. Food safety knowledge of the food handlers were high in storage conditions like temperature and infestations. Having moderate knowledge in handing at serving of food, clearing up, disposal and cross contamination. Food handlers in Restaurants show interest and required in choosing good materials for cleaning purpose and aware of the need for personal hygiene and safety precautions and cares their personnel health. 50% food handlers responded about food catering centres they work, should have clean floor, non sliding surface, free from dust and dirt required pest control treatments, requires frequent garbage disposal, and Food Inspection in catering centres. All the (100%) respondents of Restaurants cleans their work area before starting work, cleans kitchen equipment and work tables, remains spic and span, during and after service. That Restaurants are able meet the Hygiene practices and found in good conditions and always adhered and concentrate on the practices of the same attribute in both areas where as in fast food centres, being a small scale sector not given much priority to the hygiene, sanitation and safety practices having poor knowledge about Hygiene. Food handlers are having undergraduate education and 50% are having graduation, their awareness toward these attributes are poor compared to the Restaurants of Tirupati and Tirumala, and they simply emphasized on cooking, serving and disposing without much effects on hygiene, sanitation and safety measures thus the fast food centres scored the least means even for the practices like importance of safety precautions in the kitchen, temperatures, storage condition of cooked and semi cooked foods, safety precautions like requirement of first aid kit and accident preventive measures at the premises. In Tirumala the means for Hygiene, Sanitation & Food Safety Practices were very poor than Tirupati Fast Food Centres being a small Scale Sector not given much priority to the hygiene environment and they simply emphasized on cooking, serving, display without much efforts on hygiene sanitation, and safety practices, they seemed to be simply following the economic returns without much emphasis on safety precautions indicating a definite need to bring changing’s regarding at least to the minimal level to safe guard the health conditions of the customers as well as the environment/surroundings of Fast Food Centres. The study reveals that an overall deficiency in the standards of Hygiene, Sanitation, Food Safety Practices by food handlers in Fast Food Centres in Tiruamala and Tirupati require proper training to improve knowledge and practices. The results revealed that environment in which they work also influence the knowledge and practice of food handlers that more effort is needed to be carry out by the food authorities to improve that level of practices in food safety among the food handlers in Tirupati and Tirumala towns. Inadequate practices can not only be blamed on insufficient knowledge but barriers preventing implementation of their practices despite adequate knowledge are lack of time, lack of staff and lack of resources thus, infrastructure modification, and strengthening is required where training of food handlers is advocated (Sultana Abida et.at.,2013).
VOLUME NO. 7 (2016), ISSUE NO. 08 (AUGUST) ISSN 0976-2183
INTERNATIONAL JOURNAL OF RESEARCH IN COMMERCE & MANAGEMENT A Monthly Double-Blind Peer Reviewed (Refereed/Juried) Open Access International e-Journal - Included in the International Serial Directories
http://ijrcm.org.in/
75
Previous study reported that improved knowledge will lead to behavioural changes involving improved practices and staff attitudes, can limit the improvements of practices among staff (Griffith, 2000). This majority of studies support knowledge as a prerequisite of safe food handling practices (Daniels et as., 2001., Lin et al.,2004). Food Service managers are responsible for making sure employees follow safe food handling practices, so customers do not become ill form un safe food making certain that the food served to customers is safe for consumption is a priority for retail food service operations such as Hotels, Restaurants, Fast Food centres, Hospitals, Schools and Catering Operations.
CONCLUSION Restaurants showed moderate Practices and where as Fast Food Centres showed poor practices in both areas. The findings suggest an overall deficiency in the standards and practices by food handlers in Fast Food Centres of in both locations.
REFERENCES 1. Abida Sultana, AmnaAwan, IfIat Jchseen (2013)., Sanitation Practices among Food Handlers Working in street Restaurants in Rawalpindi, Pakistan, Rawal
Medical Journal Vot-38., No:4 Oct-Dec-2013. 2. Albert J.A. (1995) Food Safety Knowledge and Practices of Consumers in the USN Journal of Consumer Studies and Home Economics 19-119-134. 3. Basic steps to improve safety of street vended food (Internet) World Health Organisation, 2010 June 30. Availbale from:www.who.int/ foodsafety/fs.../
No.03_StreetFood_June10_en.pdf 4. Clatton DA, Griffith CJ, Price P, Peters AC. 2002 Food handlers and self practices. Int J Environ Health Res 12:25-39. 5. Daniels, R.W. Daniels, B.L. Gilmet, P and Noonam, D (2001)., 2000 Home Food Safety Study Report, Food safety Magazine, 7(2).,1-4. 6. FAO/WHO (2002). Global Forum of Food Safety regulators food and Agricultural Organisation and world Health Organization, Geneva. 7. Food borne disease (Internet) 2013 (updated 2013 Mar, 6) Available from http://foodsanitation/WHO Foodborne disease.mht 8. Griffith c.2005, Are we making the most of Food Safety Inspection a glimpse in to the future. British Food Journal, 107:132:139. 9. Griffth C.J. (2000). Food Safety in Catering Establishments J.M. Farber and EC – food EDS safe Handling of Foods 235-256. 10. J.R. and chen S.Y. (2004) Study of the knowledge, attitudes and practices of Food Hygiene by cooks in Day Care Centers in the Taivan Area, Nutrition Science
Journal, 29(1) 83-96. 11. Lee. H. Chick. W, Baker F, Saari N, Mahyndin AN (2012) sanitation practices among food handlers in a military food service Institution, Malaysia. Food Nu-
trsec2012., 3-1561-6. 12. Mohd.Firdaus. Siau, A., son, R., Mohhiddin, o.Jon.P.S.and chai, L.C. (2015) Food Court Hygiene assessment and food safety knowledge attitudes and pracitves
of food handlers in putrajaya. International Food Research Journa 22(5).,1843-1854 13. S.N. Mahindra (2004), Food Safety Concept and Reality., APH Publishing Corporation Darya Uanj New Delhi -110002. 14. WHO (2008) A Guide to developing knowledge, attitudes and practices survey world health organization Geneva. 15. WHO, (2002), WHO Global Strategy for Food Safety. Food Safety Department, World Health Organisation, Geneva.
VOLUME NO. 7 (2016), ISSUE NO. 08 (AUGUST) ISSN 0976-2183
INTERNATIONAL JOURNAL OF RESEARCH IN COMMERCE & MANAGEMENT A Monthly Double-Blind Peer Reviewed (Refereed/Juried) Open Access International e-Journal - Included in the International Serial Directories
http://ijrcm.org.in/
76
UNDERSTANDING THE MODELS OF CUSTOMER EXPERIENCE
SAAKSHI BHANDARI RESEARCH SCHOLAR
DELHI SCHOOL OF ECONOMICS DELHI UNIVERSITY
NEW DELHI
ABSTRACT Customer experience is emerging as the new-age differentiator. There has been a paradigm shift of focus from developing product brands to building customer relationships to creating and delivering engaging and compelling customer experiences. Customer experience recognizes a customer as more than just a rational being, seeking fulfillment of his hedonic, emotional and sensory aspirations. The existing literature highlights various pre-requisites and challenges in developing a robust scale for measurement of customer experience. This paper attempts to understand the existing models of customer experience to develop an insight into the measurement of this construct.
KEYWORDS differentiator, emotional, measurement, models.
INTRODUCTION ith the ever evolving dynamic marketing environment, there has been a considerable shift of focus in context of the building blocks to achieve a distinctive competitive advantage. From emphasizing on developing powerful “Product brands” to “Building strong customer relationships through improvised service quality” to “Creating compelling customer experiences; there has been a paradigm shift.
The concept of customer experience recognizes customers as more than just rational beings, seeking fulfillment of their emotional, sensory and hedonic aspira-tions. Besides, literature reviews customer experience as an inherently personal and subjective phenomena existing primarily in the mind of the customer. Thus, no two customers can ever have the exact same experience. This makes customer experience an attractive proposition for leading edge companies to be developed as a source of building a sustainable competitive advantage in the advent of excessive commoditization. Given the fact that customer experience (whether good, bad or indifferent) arises in the course of the interactions that he/ she has with the organization across multiple touch points during the entire customer lifecycle and has the potential of a possible influence on other related aspects of customer satisfaction, customer loyalty etc., makes it an interesting field of study and further research.
OBJECTIVES OF THE STUDY 1. To gain an understanding of the concept of customer experience by review of the existing literature in this domain. 2. To appreciate the nuances involved in the measurement of customer experience. 3. To study some of the models developed in the field of customer experience.
LITERATURE REVIEW In today’s world, customer experience is emerging as the new-age differentiator. The competitive battleground of differentiators is also changing. In the 1970s, the differentiator was quality or functionality; in the 1990s it has been brand and price; in the early 2000s, it is service, information and delivery (Shaw and Ivens, 2002, p. 2). All these attributes are considered as givens today; that is, customers take them for granted and feel entitled for them. Currently, in the mid-2000s, it is customers’ emotional attachment with the brand, the brand community and the brand company via customer experience that is gaining importance in the literature (Anderson et al., 2006; Barber and Strack, 2005; Bendapudi and Bendapudi, 2005; McGrath and Macmillan, 2005; Mascarenhas et al., 2004; Narayandas, 2005; Selden and Macmillan, 2006). It is a stream of experiences that will develop over time (and not a specific experience) in order to achieve a sustainable competitive advantage because the specific experience encounter will lose its novelty the next time it is encountered (Palmer 2010). Delivering total customer experience (TCE) goes beyond mere customer satisfaction and is a relatively new concept since satisfied customers could still defect (Jones and Sasser, 1995). In the past, companies have primarily focused on the physical aspects of the product, while totally neglecting the emotional and value aspects and hence, losing many customers in the long run (Nunes and Cespedes, 2003). Different authors have defined customer experience from different perspectives. As the scientific contributions are rich and diverse, so are the different interpre-tations and conceptualizations of the customer experience offered by each author, nevertheless, despite the differences of perspective and the various models proposed, one can identify some common core characteristics of customer experience. First, it has a temporal dimension which originates from the entire set of contact points (or moments of truth, Carlzon, 1987) between the customer and the company, or the company’s offer (Addis and Holbrook, 2001; Caru’ and Cova, 2003; LaSalle and Britton, 2003) Then, it is strictly personal and it involves and engages a customer at different levels (rational, emotional, sensorial, physical and also ‘‘spiritual’’) so as to create a holistic gestalt (Brakus, 2001; Schmitt, 1999).
METHODOLOGY The research methodology comprises a thorough study of secondary sources of data. Articles, mainly from reputed journals of marketing and related fields were reviewed in order to gain an insight and conceptual understanding of the topic. Besides, a few e-resources including articles, blogs and videos and sections of some specific books were also used for deeper understanding of the concept and its application.
MEASUREMENT OF CUSTOMER EXPERIENCE Maklan and Klaus (2011) have listed out a few features of an appropriate measure of customer experience. These are:
It is based upon an overall cognitive and emotional assessment of value from the customers’ point-of-view rather than evaluated against benchmarks or expectations.
Captures the value-in-use of the organization’s offer, not just the attributes of product and service delivery
Assesses, as much as possible, emotional responses as well as the functional delivery of the organization’s promise
Determines a reasonable focal time period, sufficiently pre and post the service delivery, to allow the customer to assess the experience over time and across channels.
Is validated against behavioral measures as well as attitudinal ones.
W

VOLUME NO. 7 (2016), ISSUE NO. 08 (AUGUST) ISSN 0976-2183
INTERNATIONAL JOURNAL OF RESEARCH IN COMMERCE & MANAGEMENT A Monthly Double-Blind Peer Reviewed (Refereed/Juried) Open Access International e-Journal - Included in the International Serial Directories
http://ijrcm.org.in/
77
Palmer (2010) identifies the major challenges in measuring customer experience. These are as follows:
Complexity of context specific variables is the biggest problem in developing an operationally acceptable measure of customer experience.
Experience is conditioned by differences between individuals, differences over time in an individual’s emotional state, and a variety of situation specific factors. A measure of experience must take account of these moderating influences.
Non-linearity of customer experience. The effects of non-linearity have been observed in attempts to measure flow. However, researchers have noted con-text specific effects on flow, with a suggestion that some personal characteristics may enable individuals to engage in flow experiences more frequently, more intensely, and for longer periods than others (Csikszentmihalyi and Csikszentmihalyi, 1988).
Identification of an optimal level of experience. For the parallel and contributory constructs of quality and satisfaction, there is an implicit assumption that consumers will prefer outcomes with higher scores on these scales. However, experience is more complex and nonlinearity may imply lower cut-off points at which an experience is not recognized, and a higher point beyond which “more” experience may be associated with negative benefits.
Practical obstacles to developing and implementing a robust measurement scale for customer experience. A measurement instrument must incorporate not only contextual parameters, but also the sequencing of events, and their retention in the memory in the form of an attitude some time after an event occurred.
An experimental treatment may arouse high positive emotions when it is new, but these effects will be likely to wear off with repeated exposure.
MODELS OF CUSTOMER EXPERIENCE GILMORE & PINE II (2002): LOCATION HIERARCHY MODEL The authors vouched for integration of the physical and virtual marketing experiences for the customers and proposed the Location Hierarchy Model suggesting various location hierarchy levels that companies should focus on for providing engaging customer experiences in both the physical and virtual formats.
TABLE 1: LOCATION HIERARCHY MODEL
Physical Access Virtual Access
Flagship location Flagship sites
Experience hubs Experience portals
Major venues Major platforms
Derivative presence Derivative Placement
Worldwide markets World wide web
Source: Gilmore & Pine II (2002) Every company should examine its own situation and determine which levels amongst the five physical and five virtual make marketing sense. Their contribution is considered to be a pioneer in the field of Customer Experience and paved way for a lot of future researches. MASCARENHAS ET AL. (2006) MODEL The authors have discussed the concepts of total customer experience (TCE) and lasting customer loyalty (LCL).to derive managerial frameworks for strategizing TCE to achieve LCL. Brand loyalty is a “deeply held commitment to re-buy or re-patronize a preferred product/service consistently in the future, thereby, causing repetitive same brand set purchasing, despite situational influences and marketing efforts having the potential to cause switching behavior” (Oliver, 1999, p. 34). This definition helped to distinguish loyalty as behavioral, attitudinal and situational (Chaudhuri and Holbrook, 2001; Uncles et al., 2003). TCE strategy focuses on the blend of the physical elements and the emotional elements in delivering customer experience. While this is promising, it may not be lasting because emotions are fleeting and vacillating. Hence, to ensure that TCE should build lasting customer loyalty (LCL), a third and necessary dimension to TCE – the value dimension was added to it. What business strategy should aim is a TCE that builds LCL by blending the physical, emotional and value elements of the target customers. Value is the consumer’s perception of the benefits minus the costs of maintaining an ongoing relationship with a provider (Zeithaml, 1988). Building customer value through market offerings is a consumer-value-centric competence that should be the driving obsession of an organization (Srivastava et al., 1999, p. 172). The typology of TCE and Lasting Customer Loyalty (LCL) When marketers offer products and services that consistently have strong physical attributes-based satisfaction, provide high emotional experience, and high perceived value summing to a high TCE, they will automatically generate high and lasting customer loyalty (LCL). Conversely, when market offerings are low on physical experience, emotional involvement and customer perceived values, they fail to generate LCL. Between these extreme positions there may be other contingent circumstances that will generate partial TCE and, therefore, partial LCL. The authors suggested a multidimensional loyalty ladder as a function of major TCE variables: value differentiation, provider-interaction, and engaging experiences. These three TCE variables interact both horizontally (by rows) and vertically (by columns) to impact each rung of the loyalty ladder bottom-upwards. TCE-LCL Dynamic
Loyalty is not a one-step process, but a long ascending process consisting of many sequential steps.
Each rung of the ladder is partial or quasi loyalty (e.g. repetitive behavior, brand interest).
Loyalty can move upwards or downwards, depending upon how the customer experiences the impact of the TCE variables at a given point in time.
Loyalty, therefore, is an interactive and interdependent process, a buyer-seller relational process generating relational equity.
Higher in the ladder, the stronger is customer loyalty.
Conversely, lower in the ladder, more vulnerable is customer loyalty.
Loyalty is an accumulative process, a step-by-step function.
Given the volatility of consumer preferences and lifestyles, an ascending loyalty is a slower process than a descending one. TCE and LCL result when organizations build themselves around what is good for the customers, and change their organizational structures, systems and processes to build great customer experiences – this is an outside in approach, while the conventional approach has been an inside out strategy that defines companies by what is good for themselves, rather than what is good for the customer (Shaw and Ivens, 2002, pp. 8-9). The reason for this new approach is that the customer is progressively becoming an emotional equity holder in the brand. The product should have an emotional appeal, a value statement, and a personal identity that is, real TCE should build a brand community of lasting loyal customers (McAlexander et al., 2002). Linking TCE with LCL is unique and challenging. Adding the third dimension of value chain moments makes TCE more focused and loyalty-driven. The typology of TCE-based customer loyalty is new and offers a broad strategic canvas for marketers. The loyalty ladder with each rung buttressed by differentiated value, inter-active relationship and TCE makes it credible, viable and a strategic destiny. TCE and LCL are also distinguished from related concepts in marketing to derive managerial implications. However, this linking needs to be empirically tested. BERRY AND CARBONE (2007) MODEL The authors remark that customers’ desire to come back to a business again (loyalty) results more from how they feel about the total experience they receive than from what they rationally think about a company’s products and services. Zaltman’s research approach, trademarked as Zaltman Metaphor Elicitation Technique (ZMET), reveals mental models that shape customer thought and behavior. Arguing that emotions are interrelated with reasoning processes in impacting behavior, Zaltman designed ZMET to use metaphor to capture both thoughts and feelings.

VOLUME NO. 7 (2016), ISSUE NO. 08 (AUGUST) ISSN 0976-2183
INTERNATIONAL JOURNAL OF RESEARCH IN COMMERCE & MANAGEMENT A Monthly Double-Blind Peer Reviewed (Refereed/Juried) Open Access International e-Journal - Included in the International Serial Directories
http://ijrcm.org.in/
78
Companies can seek to articulate the conscious and unconscious feelings that customers desire and contrast those feelings with the current experience they are offering by conducting an experience audit. Using stationary video cameras as well as pinhole cameras hidden in a researcher’s wristwatch or clothing, organiza-tions can document a great body of actual customer experiences. This approach involves five steps:
Identify emotions that evoke customer commitment
Establish an experience motif
Inventory and evaluate experience clues
Determine the experience gap
Close the experience gap and monitor execution Once the audit has been completed, the team in charge of overhauling the customer experience should use the results to develop an “experience motif” that reflects the organization’s core values and branding strategy. Captured in a few words, the motif then serves as the North Star for all experience management efforts. In other words, it acts as the unifying element for every clue in the newly designed customer experience. The experience motif is the touchstone from which clues can be developed and defined. GENTILE, SPILLER AND NOCI (2007) MODEL The authors attempt to understand the specific role of different experiential features in the success achieved by some well-known products. The Research methodology involved an explorative study and the data analyzed was partially qualitative. The sample of cases taken was among those that are considered, both in the existing literature and in the common opinion, as successful and are characterized by widely-known brands with a very strong image. Two variables, namely:
Type of knowledge embedded (tacit vs. coded, as per Polanyi, 1983);
Durability (non durable, medium range, long range) were considered for the selection process since they have a considerable impact in determining the Customer Experience. The research has been carried out in two phases. In the first part, the experiential features of the offering proposed by the company have been analyzed by means of secondary sources and direct interviews: this phase was meant to understand the marketing strategy used by the company and the aspects of the Customer Experience on which the company focused in its strategy. In the second part, a market research has been performed to assess how customers perceive and evaluate the different components of the Customer Experience and to assess which of the six components were perceived as the most relevant for each of the products analyzed. A survey, both explorative and descriptive in nature, was carried out by means of a structured questionnaire with multiple choice, rating scale and agreement scale questions based on a 1-4 Likert scale. The questionnaire had been submitted to a non-statistical sample of almost 200 units (for each analyzed product, totaling 2368 units) chosen among individuals, between 16 and 55 years, who usually buy/use the considered product. The final version of questionnaire is made up of three parts: the first is aimed at collecting demographical information (age, gender, education, etc.) about the respondents; the second investigates the motivations on the basis of the purchase by analyzing the role of the experiential features; the last section is aimed at comparing the evaluation of the different components in order to understand which one the customers consider as most relevant. The first analysis was carried out on the collected data to assess the relative weight of the utilitarian value when compared to the hedonic value. In the second phase each component of the Customer Experience has been analyzed to investigate how customers evaluated it and how much relevant it was when compared with the others. Factor analysis was carried out to explore the internal structure of the dataset, additionally; further qualitative analysis and a cluster analysis (for some specific cases) were used. The results were as follows:
Utilitarian vs. Hedonic value Overall the experiential features are perceived by customers almost as much relevant as the functional ones, indeed 7 products out of 12 have been classified as ‘‘balanced’’ and 2 products have been reported to be “hedonic”. Such observations should however be tempered with the consideration that certain types of experiences are particularly difficult to be investigated simply by means of a questionnaire. Those are experiences which indeed are felt by a customer but often at a sub-conscious level, thus a quick and superficial analysis, such as that performed while responding to a questionnaire are likely to miss or underestimate their real impact. Also often an impulse purchase, mainly dictated by irrational motivations, is later re-interpreted in rational terms and thus underestimated in the reported per-ceptions of a questionnaire.
Experiential Components The value associated with the sensorial component is substantially high (above the mean) across all the considered cases. The value associated with the relational component does not vary sensibly across products and it is lower than expected Given the results the sensorial and the relational component were analyzed separately. The main objective of the factor analysis was to study whether the experiential components were actually being perceived separately by customers or not. The results of the factor analysis showed that each case reported both pure components (that is, factors that can be related to a single experiential component) and ‘‘mixed components’’ (that is, factors whose variables belong to different experiential components). Mixed components can be considered as a cue for the hypothesized existence of interrelations between components, which in turn stand for complex experiences. The Interpretative Model consists of two parts:
Sensorial Component An in-depth analysis revealed that whenever a clear link between the core functionality of a product and a natural sense could be established (e.g. iPod/hearing, Pringles/taste, etc.) then that specific sensorial component was perceived as being the most relevant for the user. On the other hand, when a clear link could not be identified, the results showed that sight was the sense perceived as most important.
Commitment/Involvement Matrix The analysis of the scores reported in association to the emotional, cognitive, pragmatic and lifestyle components suggested the definition of two variables that could account for the differences of relevance reported for the four components: 1. Customer involvement- The level of importance a customer attributes to an object, an action or an activity and the enthusiasm and interest they can generate
(Dalli and Romani, 2000; Goldsmith and Emmert, 1991). Such variable is affected by two factors: cost of the offering (both in absolute terms and in relative terms when compared with competitors’) and impact on the customer’s self image.
2. Customer commitment- The effort in terms of resources the customer makes to use the product (adapted from Grandinetti and Paiola, 2003).Such variable is influenced by two factors: purchase/use frequency and level of complexity in using the product.
Customer Commitment and Customer Involvement were used to explain the relevance of the four components; in the case of the relational component the same two variables could be applied to describe three sub-typologies of the relational component. Accordingly, three kinds of relational component could be identified:
Absent or superficial: when a low-level customer involvement is present the relational component stems from interpersonal relationships that are temporally limited to the time spent while using the product (e.g. Play station and Pringles);
Connected to collecting practices; when the relational component is more intense than in the previous case (due to the high level of customer involvement), but the low commitment level indicates that the relational component is mainly generated by collecting practices stemmed from the ownership of the product (e.g. Collectors clubs for Swatch and Swarovski);
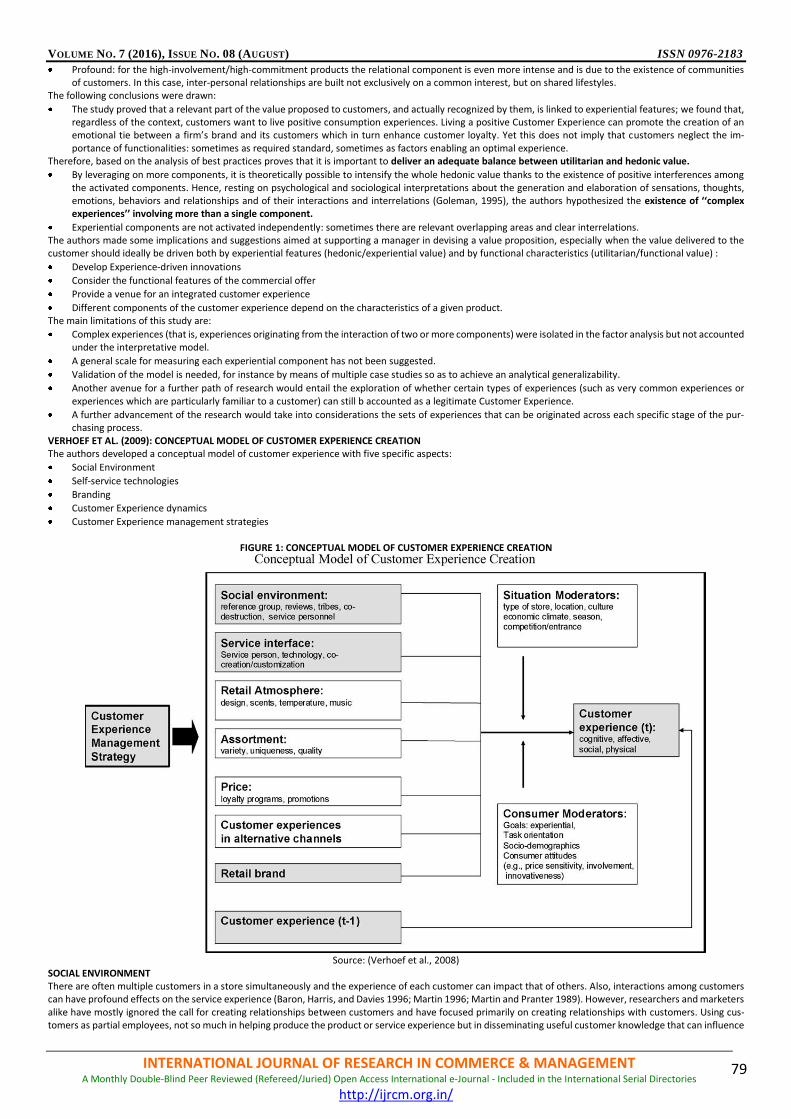
VOLUME NO. 7 (2016), ISSUE NO. 08 (AUGUST) ISSN 0976-2183
INTERNATIONAL JOURNAL OF RESEARCH IN COMMERCE & MANAGEMENT A Monthly Double-Blind Peer Reviewed (Refereed/Juried) Open Access International e-Journal - Included in the International Serial Directories
http://ijrcm.org.in/
79
Profound: for the high-involvement/high-commitment products the relational component is even more intense and is due to the existence of communities of customers. In this case, inter-personal relationships are built not exclusively on a common interest, but on shared lifestyles.
The following conclusions were drawn:
The study proved that a relevant part of the value proposed to customers, and actually recognized by them, is linked to experiential features; we found that, regardless of the context, customers want to live positive consumption experiences. Living a positive Customer Experience can promote the creation of an emotional tie between a firm’s brand and its customers which in turn enhance customer loyalty. Yet this does not imply that customers neglect the im-portance of functionalities: sometimes as required standard, sometimes as factors enabling an optimal experience.
Therefore, based on the analysis of best practices proves that it is important to deliver an adequate balance between utilitarian and hedonic value.
By leveraging on more components, it is theoretically possible to intensify the whole hedonic value thanks to the existence of positive interferences among the activated components. Hence, resting on psychological and sociological interpretations about the generation and elaboration of sensations, thoughts, emotions, behaviors and relationships and of their interactions and interrelations (Goleman, 1995), the authors hypothesized the existence of ‘‘complex experiences’’ involving more than a single component.
Experiential components are not activated independently: sometimes there are relevant overlapping areas and clear interrelations. The authors made some implications and suggestions aimed at supporting a manager in devising a value proposition, especially when the value delivered to the customer should ideally be driven both by experiential features (hedonic/experiential value) and by functional characteristics (utilitarian/functional value) :
Develop Experience-driven innovations
Consider the functional features of the commercial offer
Provide a venue for an integrated customer experience
Different components of the customer experience depend on the characteristics of a given product. The main limitations of this study are:
Complex experiences (that is, experiences originating from the interaction of two or more components) were isolated in the factor analysis but not accounted under the interpretative model.
A general scale for measuring each experiential component has not been suggested.
Validation of the model is needed, for instance by means of multiple case studies so as to achieve an analytical generalizability.
Another avenue for a further path of research would entail the exploration of whether certain types of experiences (such as very common experiences or experiences which are particularly familiar to a customer) can still b accounted as a legitimate Customer Experience.
A further advancement of the research would take into considerations the sets of experiences that can be originated across each specific stage of the pur-chasing process.
VERHOEF ET AL. (2009): CONCEPTUAL MODEL OF CUSTOMER EXPERIENCE CREATION The authors developed a conceptual model of customer experience with five specific aspects:
Social Environment
Self-service technologies
Branding
Customer Experience dynamics
Customer Experience management strategies
FIGURE 1: CONCEPTUAL MODEL OF CUSTOMER EXPERIENCE CREATION
Source: (Verhoef et al., 2008)
SOCIAL ENVIRONMENT There are often multiple customers in a store simultaneously and the experience of each customer can impact that of others. Also, interactions among customers can have profound effects on the service experience (Baron, Harris, and Davies 1996; Martin 1996; Martin and Pranter 1989). However, researchers and marketers alike have mostly ignored the call for creating relationships between customers and have focused primarily on creating relationships with customers. Using cus-tomers as partial employees, not so much in helping produce the product or service experience but in disseminating useful customer knowledge that can influence

VOLUME NO. 7 (2016), ISSUE NO. 08 (AUGUST) ISSN 0976-2183
INTERNATIONAL JOURNAL OF RESEARCH IN COMMERCE & MANAGEMENT A Monthly Double-Blind Peer Reviewed (Refereed/Juried) Open Access International e-Journal - Included in the International Serial Directories
http://ijrcm.org.in/
80
the customer’s experience (of both the help seeker and the helper). Compatibility management involves attracting similar customers and managing the service environment to foster customer-to-customer interactions that enhance customer satisfaction (Martin and Pranter 1991). Similar to customer-to-customer interaction in a brick-and-mortar setting, customers can “interact” with other customers in an online setting by posting customer reviews on company websites or on different blogs or chat rooms. Such information has been found to be very influential (Hagel and Armstrong 1998; Kozinets 1999) and acts as a new form of the traditional word of- mouth communication. SELF-SERVICE TECHNOLOGY Technology-based service delivery systems are becoming an integral part of shopping, and hence are critical to examine in terms of their impact on customer experience. Parasuraman (2000) proposed a “pyramid model” of services marketing that expands the two-dimensional triangle in the traditional “triangle model” – representing company–customer, company–employee, and employee–customer interactions – into a three-dimensional pyramid with “technology” at its apex to reflect the fact that the interactions among companies, employees and customers are increasingly likely to be mediated by some form of technology. Insights from extant research suggest that it is best for retailers to offer a blend of employee-based and SST-based service options (e.g., Parasuraman, Zeithaml, and Malhotra 2005; Reinders, Dabholkar, and Frambach 2008; Selnes and Hansen 2001). An optimum blend of employee- and technology-based service systems and to understand the contingencies that might influence that optimum blend is needed. Another aspect to be analyzed is the impact of technology failures on the customer experience in retailing contexts. BRANDING The model considers the interaction between the brand and the customer experience. Customer brand perceptions (of the retailer), when primed prior to shopping experience, might significantly influence the customer’s experience. It is also important to consider the reinforcing effects of the customer’s experience and the brand over time. The interaction of the brand and the customer’s experience may also be bi-directional. Keller and Lehmann (2003) propose that the customer mindset (e.g., awareness, associations, attitude, attachment and activity) is the key driver of brand perfor-mance (e.g., price premiums, price elasticities, market share, expansion success). CUSTOMER EXPERIENCE DYNAMICS It is critical to recognize that a customer experience is not limited to the customer’s interaction in the store alone. Rather it is impacted by a combination of experiences which evolve over time, including search, purchase, consumption and after-sales phases of the experience (Neslin et al. 2006). It may also involve multiple retail channels and repeated experiences within a channel. Thus, it is important to consider the dynamics of an exchange when studying the customer’s experience. Crucial notions in the understanding of customer dynamics concern the fact that current customer satisfaction affects future expectations. Other researchers have shown that current satisfaction scores are strong predictors of future satisfaction scores. This seems to suggest that satisfaction scores are pretty stable over time and that there are strong carry-over effects. However, external events, such as critical incidents, might trigger updating processes in which new information (from the critical incidents) is included into customers’ satisfaction assessments (e.g., Bolton 1998; van Doorn and Verhoef 2008). CUSTOMER EXPERIENCE MANAGEMENT STRATEGIES Customer experience management is a retailer’s strategy to engineer the customer’s experience in such a way as to create value both to the customer and the firm. Although, studies provide some indirect evidence that customer experience based strategies might provide a superior competitive advantage. However, there might be some pitfalls. Providing a superior customer experience can be quite expensive. And, do customers want to pay more for an enriched experience is also the question. The Model also recognizes various Situation moderators and Consumer moderators that moderate the Customer Experience. Though the authors have given a holistic portrayal of the customer experience construct and proposed a conceptual model delineating its determinants; there is scope for future research across various domains of the determinants. PALMER (2010) MODEL The author proposed an integrated framework which begins with basic stimuli, converged into three higher order constructs namely, tangible and process quality, brand relationships and interpersonal relationships, and leads to the development of an attitude, mediated by the sequencing of the stimuli and the emotional predisposition of the individual. Attitude is likely to be not stable over time, and further subsequent recall of an experience is likely to result in attitude being weighted towards selected elements of the overall experience. It is the attitude that pertains over time and is stable that is most likely to subsequently influence behavior. The three constructs have been long developed and analyze consumption and evaluation from three overlapping perspectives. Further, despite there being liter-ature on each of them, literature explaining explicit linkages between any of these two constructs is limited. SERVICE QUALITY AND SATISFACTION Service providers may be interested in perceptions of that part of a service offer that they control, but consumers’ perception of their “total experience” may embrace other non-controllable components. For example: Lack of adequate parking space can play a significant role in the overall dining experience at a restraint. However, there is increasing evidence that anticipation of an event may itself be an important experiential benefit, evidenced by the way that some organizations use queues and waiting time to generate emotions of excitement and anticipation for the main event (Cowley et al., 2005). (For example: Apple I phones, Micromax Yureka, comeback of Maggi via flash sales). Application of service quality measurement techniques have suffered from a relatively static analysis of the components of overall quality, without taking sufficient account of their dynamic interaction over time. Whereas some components of the total experience are more likely to persist as long-term attitude adjustment (O’Neill and Palmer, 2001). Most quantitative approaches to understanding service quality have used linear measures of performance, despite a suggestion that consumers’ response to quality improvement may be non linear (Cronin, 2003; Galloway, 1999). Also, discussion of service quality has not adequately addressed situations where value derives from sacrifice and the inner directed experimental benefits which some cultures associate with suffering. BRANDS There has been a growing preference for importance of developing brands with personality that allow consumers to live the brand” and to “experience the brand” (e.g. Smith and Wheeler, 2002). There have been many conceptualizations of the unique attributes of a brand and these usually distinguish between elements that can be objectively measured and the subjective values that can only be defined in the minds of consumers (e.g. Gardner and Levy, 1955; Munson and Spivey, 1981; De Chernatony and McDon-ald, 2003) Emotional relationship consumers develop between a brand and their own perceived or sought personality is also a perspective to be considered. Also, it has been recognized that high contact service encounters, employees must identify with the values of a brand if they are to deliver an experience in accordance with consumers’ expectations (Knox and Freeman, 2006). INTERPERSONAL RELATIONSHIPS A congruity between a brand’s values and a consumer’s self image, and a good fit between their physical and psychological needs and the functional and symbolic values of the brand fosters relationship with the brand (Sirgy and Su, 2000). Both interpersonal relationships and brand relationships contribute to a consumer’s experience of a product. It could be hypothesized that the two elements are substitutable, in that weaknesses in interpersonal relationships may be condoned if these are compensated by benefits of consuming the brand relationship.

VOLUME NO. 7 (2016), ISSUE NO. 08 (AUGUST) ISSN 0976-2183
INTERNATIONAL JOURNAL OF RESEARCH IN COMMERCE & MANAGEMENT A Monthly Double-Blind Peer Reviewed (Refereed/Juried) Open Access International e-Journal - Included in the International Serial Directories
http://ijrcm.org.in/
81
EMOTIONAL BASES FOR CUSTOMER EXPERIENCE “Emotionally bonded customers tend to invest more in their relationships than customers lacking affective commitment” (Mattila, 2001). Emotions are more likely to play an important role in attitude formation and change when they are viewed as relevant to the product being consumed (Hoyer and McInnis, 2001; Price, Arnould and Tierney, 1995). The same product or service could be low involving for some and high involving for others. Emotions are a mediating device between an event and an experience. SEQUENCING The contribution of models of service quality to a customer experience construct is limited by the neglect of order effects in most studies of service quality. The importance of sequencing to the development of a memorable customer experience has been recognized (e.g. Chase and Dasu, 2001; Pine and Gilmore, 1998, 1999). According to Chatman (1978), experiences should have a sequence structure with a story structured in a manner similar to musical pieces. Creating a story-like time pattern in experience design can provide sequences of emotions similar to those provided by episodes in human life (Deighton, 1992). Chase and Dasu (2001) noted that the sequence of events in an experience design should improve over time and end on a positive note because the final stage in a service process ending dominates the memory of the entire experience. Sequencing issues are addressed in discussion of “flow”, described as an experiential state “so desirable that one wishes to replicate it as often as possible” (Csikszentmihalyi, 1988, p. 16). Therefore, to remain in flow, an individual must be presented with progressively more challenging scenarios in order to ensure that the level of complexity is consistent with their motivation and skills. EXPERIENTIAL SCHEMATA Failure to recognize the effects of attribute combination was a weakness of most approaches measuring service quality and satisfaction. Schemata comprise cognitive frameworks for the interpretation and organization of new information (Baron and Byrne, 1991). They facilitate understanding of the relationship between old and new information, and of how past experience predisposes an individual to behave in certain ways rather than others. No two people will see the same event in the same way because schemata are culture bound. Definitions of customer experience that emphasize the cognitive and affective outcome of unexpected elements of a total service offer, may imply that consumers are less rather than more likely to attend to events that confirm their prior expectations. ATTITUDE ADJUSTMENT OVER TIME Buyers’ re-purchase intentions are influenced by their attitude at the time of re-purchase, rather than that which prevails immediately following or during con-sumption of a service – the time at which service quality is most commonly measured. Abercrombie (1967, p. 32) pointed out that perceptions are not stable over time by stating that “with the passage of time, experiences which at first were defined and separate from each other tend to become associated and confused. It is not so much that we actually forget things, but that we misremember them”. Recall of experience may be non linear, with evidence that elderly people may vividly recall experiences of several decades previously, but have difficulty recalling events of a few days ago (Krech et al., 1969). A method for extending the duration of an experience is the use of memorabilia, which contributes to an experience in two important ways. First, it is a visible reminder of the experience, extending the memory of it after the actual encounter; second, memorabilia can facilitate peer discussion of the experience (Goulding, 1999). MAKLAN AND KLAUS (2011) MODEL The authors worked with a major UK bank interested in understanding how to differentiate its household mortgage offer and developed a measure for Customer Experience Quality (EXQ) to identify the dimensions, and their attributes, that explain its most important marketing outcomes: loyalty (defined as repurchase of the mortgage), word-of-mouth recommendation (Samson 2006) and satisfaction. It was developed in four stages:
Scale generation - articulates the meaning and domain of service experience based on insights from the literature and a comprehensive qualitative study. It results in a preliminary scale containing 37 items that represent five dimensions.
Initial purification - assesses the scale with a representative sample of the bankʼs repeat mortgage purchasers (75 qualified responses). Using exploratory factor analysis, the scale is purified to 19 items that represent four customer experience dimensions.
Refinement - via confirmatory factor analysis (CFA) validates the purified scale based on a representative sample (218 qualified responses), which confirms the scale’s reliability and validity.
Validation against the most important marketing outcomes - by assessing the extent to which customer experience, and its dimensions, explain consumers’ overall satisfaction perceptions, repeat purchase and word-of-mouth.
FIGURE 2: CUSTOMER EXPERIENCE QUALITY SCALE: DIMENSIONS, ATTRIBUTES AND EXOGENEOUS VARIABLES
Source: (Maklan and Klaus, 2011)
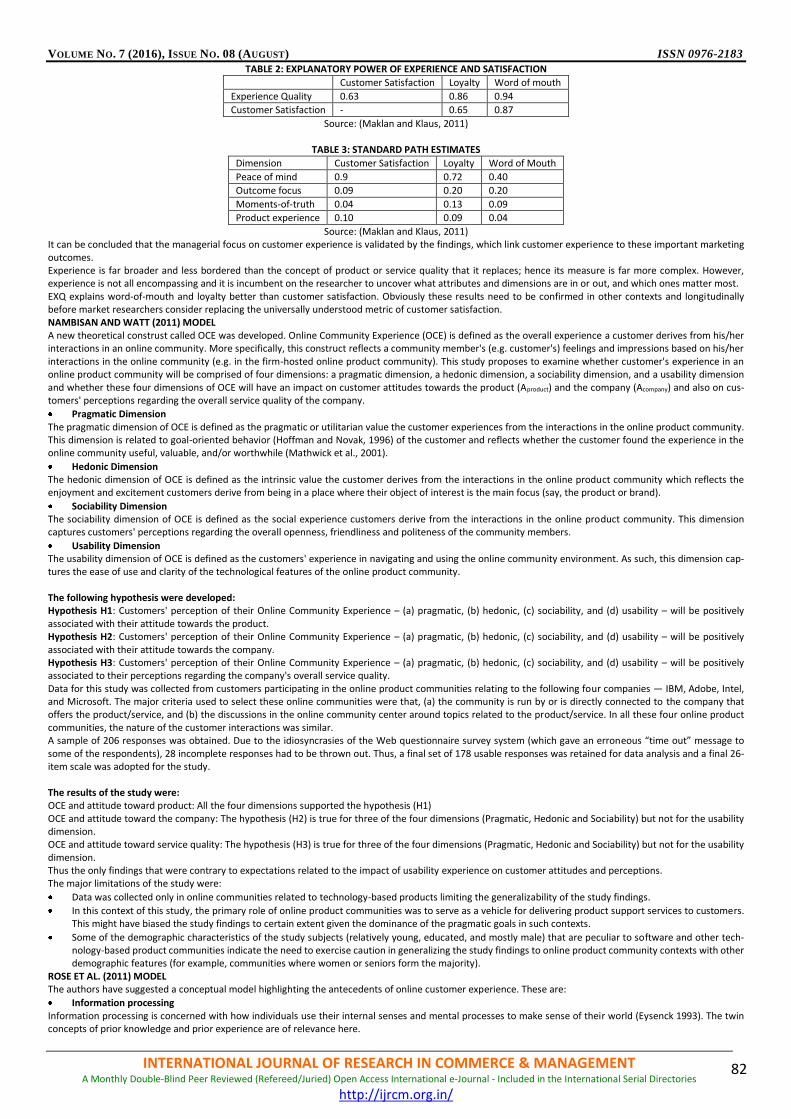
VOLUME NO. 7 (2016), ISSUE NO. 08 (AUGUST) ISSN 0976-2183
INTERNATIONAL JOURNAL OF RESEARCH IN COMMERCE & MANAGEMENT A Monthly Double-Blind Peer Reviewed (Refereed/Juried) Open Access International e-Journal - Included in the International Serial Directories
http://ijrcm.org.in/
82
TABLE 2: EXPLANATORY POWER OF EXPERIENCE AND SATISFACTION
Customer Satisfaction Loyalty Word of mouth
Experience Quality 0.63 0.86 0.94
Customer Satisfaction - 0.65 0.87
Source: (Maklan and Klaus, 2011)
TABLE 3: STANDARD PATH ESTIMATES
Dimension Customer Satisfaction Loyalty Word of Mouth
Peace of mind 0.9 0.72 0.40
Outcome focus 0.09 0.20 0.20
Moments-of-truth 0.04 0.13 0.09
Product experience 0.10 0.09 0.04
Source: (Maklan and Klaus, 2011) It can be concluded that the managerial focus on customer experience is validated by the findings, which link customer experience to these important marketing outcomes. Experience is far broader and less bordered than the concept of product or service quality that it replaces; hence its measure is far more complex. However, experience is not all encompassing and it is incumbent on the researcher to uncover what attributes and dimensions are in or out, and which ones matter most. EXQ explains word-of-mouth and loyalty better than customer satisfaction. Obviously these results need to be confirmed in other contexts and longitudinally before market researchers consider replacing the universally understood metric of customer satisfaction. NAMBISAN AND WATT (2011) MODEL A new theoretical construst called OCE was developed. Online Community Experience (OCE) is defined as the overall experience a customer derives from his/her interactions in an online community. More specifically, this construct reflects a community member's (e.g. customer's) feelings and impressions based on his/her interactions in the online community (e.g. in the firm-hosted online product community). This study proposes to examine whether customer's experience in an online product community will be comprised of four dimensions: a pragmatic dimension, a hedonic dimension, a sociability dimension, and a usability dimension and whether these four dimensions of OCE will have an impact on customer attitudes towards the product (Aproduct) and the company (Acompany) and also on cus-tomers' perceptions regarding the overall service quality of the company.
Pragmatic Dimension The pragmatic dimension of OCE is defined as the pragmatic or utilitarian value the customer experiences from the interactions in the online product community. This dimension is related to goal-oriented behavior (Hoffman and Novak, 1996) of the customer and reflects whether the customer found the experience in the online community useful, valuable, and/or worthwhile (Mathwick et al., 2001).
Hedonic Dimension The hedonic dimension of OCE is defined as the intrinsic value the customer derives from the interactions in the online product community which reflects the enjoyment and excitement customers derive from being in a place where their object of interest is the main focus (say, the product or brand).
Sociability Dimension The sociability dimension of OCE is defined as the social experience customers derive from the interactions in the online product community. This dimension captures customers' perceptions regarding the overall openness, friendliness and politeness of the community members.
Usability Dimension The usability dimension of OCE is defined as the customers' experience in navigating and using the online community environment. As such, this dimension cap-tures the ease of use and clarity of the technological features of the online product community. The following hypothesis were developed: Hypothesis H1: Customers' perception of their Online Community Experience – (a) pragmatic, (b) hedonic, (c) sociability, and (d) usability – will be positively associated with their attitude towards the product. Hypothesis H2: Customers' perception of their Online Community Experience – (a) pragmatic, (b) hedonic, (c) sociability, and (d) usability – will be positively associated with their attitude towards the company. Hypothesis H3: Customers' perception of their Online Community Experience – (a) pragmatic, (b) hedonic, (c) sociability, and (d) usability – will be positively associated to their perceptions regarding the company's overall service quality. Data for this study was collected from customers participating in the online product communities relating to the following four companies — IBM, Adobe, Intel, and Microsoft. The major criteria used to select these online communities were that, (a) the community is run by or is directly connected to the company that offers the product/service, and (b) the discussions in the online community center around topics related to the product/service. In all these four online product communities, the nature of the customer interactions was similar. A sample of 206 responses was obtained. Due to the idiosyncrasies of the Web questionnaire survey system (which gave an erroneous “time out” message to some of the respondents), 28 incomplete responses had to be thrown out. Thus, a final set of 178 usable responses was retained for data analysis and a final 26-item scale was adopted for the study. The results of the study were: OCE and attitude toward product: All the four dimensions supported the hypothesis (H1) OCE and attitude toward the company: The hypothesis (H2) is true for three of the four dimensions (Pragmatic, Hedonic and Sociability) but not for the usability dimension. OCE and attitude toward service quality: The hypothesis (H3) is true for three of the four dimensions (Pragmatic, Hedonic and Sociability) but not for the usability dimension. Thus the only findings that were contrary to expectations related to the impact of usability experience on customer attitudes and perceptions. The major limitations of the study were:
Data was collected only in online communities related to technology-based products limiting the generalizability of the study findings.
In this context of this study, the primary role of online product communities was to serve as a vehicle for delivering product support services to customers. This might have biased the study findings to certain extent given the dominance of the pragmatic goals in such contexts.
Some of the demographic characteristics of the study subjects (relatively young, educated, and mostly male) that are peculiar to software and other tech-nology-based product communities indicate the need to exercise caution in generalizing the study findings to online product community contexts with other demographic features (for example, communities where women or seniors form the majority).
ROSE ET AL. (2011) MODEL The authors have suggested a conceptual model highlighting the antecedents of online customer experience. These are:
Information processing Information processing is concerned with how individuals use their internal senses and mental processes to make sense of their world (Eysenck 1993). The twin concepts of prior knowledge and prior experience are of relevance here.

VOLUME NO. 7 (2016), ISSUE NO. 08 (AUGUST) ISSN 0976-2183
INTERNATIONAL JOURNAL OF RESEARCH IN COMMERCE & MANAGEMENT A Monthly Double-Blind Peer Reviewed (Refereed/Juried) Open Access International e-Journal - Included in the International Serial Directories
http://ijrcm.org.in/
83
The twin factors of perceived ease-of-use (PEOU) and perceived usefulness (PU) The perception of how easy a site is to use is extensively linked to a positive online experience (Chen and Dubinsky 2003; Cheung et al. 2005; Cho and Park 2001). Usefulness is well supported in the literature (Cao et al. 2005; Geffen, 2003; Geffen et al. 2003) and is the idea that the website will fit with and support the customer’s daily life (i.e. when shopping, banking, etc.).
Skill (SK) and perceived control (PC) The acquisition of skill is the customer’s ability to use the Internet with proficiency (Klein and Ford 2002). Perceived control relates to consumers’ feelings about the degree to which they have control over their own access, search and evaluation of the content of an organization’s website.
Perceived benefits (BN) and Enjoyment (EN) Perceived benefits are linked to brand commitment, mediated through brand trust and involvement (Ha 2004) suggesting that feelings of reward and positive benefit (i.e. positive emotion) generate support for the online brand Apart from the functional purpose of being online for the customer, enjoyment also plays a role (Koufaris et al. 2002). This concept is included in drivers of quality across a diverse range of websites. Citing Watson et al. (1998), Cao et al. (2005) propose that online customers seek gratification in escapism, entertainment and interaction. An inter-related effect of enjoyment and control is that they are found to determine the customer’s likelihood of returning to a website (Koufaris et al. 2002).
Risk and trust Trust is the most significant long-term barrier for realizing the potential of Internet marketing’ (Corbitt et al. 2003, p. 203). There are differing views within the literature on the role of trust and its position as an antecedent or consequence of experience. Trust and satisfaction are outcome variables that both independently and together have a direct influence upon customer loyalty (Jin and Park, 2006). An alternative approach views trust as a contributory factor. Trust propensity which is a personality trait of the online customer affects the customer’s view of the trustworthiness of both the ‘Internet Merchant’ as well as the ‘Internet Shopping Medium. Individual trust propensity on the part of the online customer was found to have a moderating effect upon trust. Thus “trust propensity” was included in the OCE framework. Perceived risk has been viewed in terms of two key components: ‘uncertainty and the seriousness of the consequences of the purchase’ (Cases 2002, p. 377). Ha (2004), citing Cox (1967a, 1967b), refers to perceived risk as the ‘unresolved tension’ between the customer’s buying goals, the various product offerings that match these goals and possible adverse outcomes of the purchase being made or not made. The removal or reduction of concerns about risk for the customer will increase perceptions of customer value in relation to the exchange experience (Wood and Scheer, 1996). The model identifies two consequences of OCE – Customer satisfaction (CS) and re-purchase intention (RI). The framework proposes that CS is a consequence of positive emotional and cognitive states of OCE. Re-purchase intention (RI) has been defined as ‘the re-usage of the online channel to buy from a particular retailer’ (Khalifa and Liu 2007). The model proposes that OCE has both a direct effect on re-purchase intention as well as an indirect effect via CS.
FIGURE 3: A CONCEPTUAL FRAMEWORK OF OCE
Source: Rose et al. (2011) This framework is only conceptual at present and needs to be empirically tested. Further, next stage of development of the literature should move away from its well-defined understanding of website quality and behavioral focus towards a deeper level of understanding of the component states of OCE, namely the cognitive and affective states. This calls for research into the construct of OCE and the development of measurement scales which enable the component states to be verified and measured. The relatively complex and interrelated effects of antecedent factors require further investigation. There should be congruence between technological develop-ments and OCE literature.
CONCLUSION Customer experience is evolving as a robust differentiator in the advent of excessive commodisation. There has been a paradigm shift from the use of product to service to relationships and now to customer experiences as sources of building sustainable competitive advantage. Customer experiences – compelling and memorable have the potential of making marketing superfluous. Customer experience transcends all related facets of customer satisfaction, service quality, customer relationships etc. and is a much more profound phenomenon and has a lasting endurance. Some of the difficulties highlighted in the literature such as complexity of context specific variables, non-linearity of customer experience, conditioning of experi-ence by differences across individuals, time, emotional states etc. and identification of an optimal level of experience have to be considered. A robust measurement scale needs to be developed based upon an overall cognitive and emotional assessment of value from the customer’s perspective needs to be developed which can be validated against behavioral and attitudinal measures. Although some research has been done in this domain, there is still a lot of room for empirical research across various industries to understand the concept and applicability of this construct in the real world. There is also a lot of scope for research in the field of online customer experience and use of personalization as a technique to create compelling customer experience.
LIMITATIONS The limitations of this study are that due to a time constraint only selected sources of literature could be reviewed for understanding the models developed for understanding customer experience. Further, no empirical work has been done as a part of this study.
REFERENCES 1. Berry, L. L., & Carbone, L. P. (2007). Build Loyalty through Experience Management. Quality Progress, 26-32. 2. Berry, L. L., Carbone, L. P., & Haeckel, S. H. (2002). Managing the Total Customer Experience. MIT Sloan Management Review, 85-89. 3. Carbone, L. P. (2004). Clued In: How to Keep Customers Coming Back Again and Again. New Jersey: FT Prentice Hall.
Antecedents
Information Processing
Perceived Ease of-Use
Perceived Usefulness
Perceived Benefits
Perceived Control
Skill
Trust Propensity
Perceived Risk
Enjoyment
Experience
Cognitive state
Affective state
Consequence
Customer satisfaction
Consequence
Re-purchase intention
VOLUME NO. 7 (2016), ISSUE NO. 08 (AUGUST) ISSN 0976-2183
INTERNATIONAL JOURNAL OF RESEARCH IN COMMERCE & MANAGEMENT A Monthly Double-Blind Peer Reviewed (Refereed/Juried) Open Access International e-Journal - Included in the International Serial Directories
http://ijrcm.org.in/
84
4. Gentile, C., Spiller, N., & Noci, G. (2007). How to Sustain the Customer Experience: An Overview of Experience Components that Co-create Value with the Customer. European Management Journal, 395-410.
5. Gilmore, J. H., & Pine II, B. (2002). Customer experience places: the new offering frontier. Strategy & Leadership, 4-11. 6. Haeckel, S. H., Carbone, L. P., & Berry, L. L. (2003). How to Lead the Customer Experience. Marketing Management, 18-23. 7. Johnston, R., & Kong, X. (2011). The customer experience: a road-map for improvement. Managing Service Quality: An International Journal, 5-24. 8. Kotler, P., Keller, K. L., Koshy, A., & Jha, M. (2012). Marketing Management: A South Asian Perspective. Noida: Pearson Education. 9. Maklan, S., & Klaus, P. (2011). Customer Experience: Are We Measuring the Right Things. International Journal of Market Research, 771-792. 10. Mascarenhas, O. A., Kesavan, R., & Bernacchi, M. (2006). Lasting customer loyalty: a total customer experience approach. Journal of Consumer Marketing,
397-405. 11. Nambisan, P., & Watt, J. H. (2011). Managing customer experiences in online product communities. Journal of Business Research, 889–895. 12. Palmer, A. (2010). Customer experience management: a critical review of an emerging idea. Journal of Services Marketing, 196-208. 13. Rawson, A., Duncan, E., & Jones, C. (2007). The Truth about Customer Experience. Harvard Business Review. 14. Rose, S., Hair, N., & Clark, M. (2011). Online Customer Experience: A Review of the Business-to-Consumer Online Purchase Context. International Journal of
Management Reviews, 24–39. 15. Shaw, C. (2007). The DNA of customer Experience: How Emotions Drive Value. New York: Palgrave Macmillan. 16. Shaw, C., & Ivens, J. (2002). Building great customer experiences. Basingstoke: Palgrave Macmillan. 17. Verhoef, P. C., Lemon, K. N., Parasuraman, A., Roggeveen, A., Tsiros, M., & Schlesinger, L. A. (2009). Customer Experience Creation: Determinants, Dynamics
and Management Strategies. Journal of Retailing, 31-41.

VOLUME NO. 7 (2016), ISSUE NO. 08 (AUGUST) ISSN 0976-2183
INTERNATIONAL JOURNAL OF RESEARCH IN COMMERCE & MANAGEMENT A Monthly Double-Blind Peer Reviewed (Refereed/Juried) Open Access International e-Journal - Included in the International Serial Directories
http://ijrcm.org.in/
85
A STUDY ON WOMEN ENTREPRENEURS IN MICRO ENTERPRISES
S. JENCY
RESEARCH SCHOLAR ST. BERCHMANS COLLEGE
CHANGANASSERY
A. SINIYA STUDENT
FATIMA MATA NATIONAL COLLEGE KOLLAM
ABSTRACT
Organising women through self help group and equip them to undertake income generating activity through the formation of micro enterprises have created an economic revolution in the country. Emergences of women entrepreneurs and beginning of micro enterprises development have followed from these achievements. Micro enterprises foster the economic status of women as an effective means to eradicate poverty. Women entrepreneurs in micro enterprises are contributing a lot in rural development and growth of the economy but their potential is still untapped. Right effort from multi direction is required in the development of women entrepreneurs. The micro entrepreneurship is strengthening the women empowerment and removes gender inequality. In modern society women have stepped out of the house to participate in all sort of economic activities. Today with the growth of micro enterprises, many women have plunged into entrepreneurship, but they are facing many obstacles especially in the finance and marketing of their product. This study is related to find out the growth and problem (especially financial and marketing) faced by women in micro enterprises and to what extent they are aware about the government schemes to support the entrepreneurs in Kollam. The sample frame used in this study is simple random sampling. Questionnaire were prepared and applied to relevant entrepreneurs for collecting data. It was found that none of the respondent was fully aware about the government support scheme. This indicates a controversy on the opinion that incentive of the gov-ernment is inadequate. This shows that there is an absence of sufficient information system to make awareness about the government support scheme.
KEYWORDS government scheme, micro enterprises, self help groups, women entrepreneurs.
1. INTRODUCTION ntrepreneurs play a pivotal role in the economic development of any country. They are considered to be the most important economic agent for the economic augmentation of the nation. Entrepreneurship was once the domain of the male population but now, it offers the door wide open to women as well.
Over the past few years, many women folk entered the field of entrepreneurship and paved success in ventures. Like men entrepreneurs, women entrepreneurs also have an equal role in the nation’s development. Women entrepreneurs will be able to ensure the prosperity & growth of the nation along with the develop-ment of Kerala state by starting enterprises, exploring new markets, innovating new products & techniques and by giving employment to people. Widespread establishment of women enterprises proceeds on micro and small-scale basis in the rural area of the state. Micro enterprise and small-scale business have always played a significant role in the economic development of the country. Its role might not appear spectacular in comparison to that of large corporations, involving the development of enormous physical, financial and human resource. However, the collective impacts of the multitude of micro enterprises have been tremendous, particularly in the area of job creation.
2. REVIEW OF THE LITERATURE Resia Beegam (1993) made an investigation on the problems of women entrepreneurship in Kerala. It was found that even after getting sufficient support from the members of the family and government; most of them are running at loss. She found that more state assistance should be warranted for the betterment of their conditions. Ghosh (1998) in his study emphasized that the development of the women micro entrepreneurs should be seen as the appropriate way to assault poverty at grass root level as it generates employment and income. Mathew (1998) conducted a study on financial problem of women entrepreneurs in Kerala. This study revealed that nearly 90% of the rural enterprises faced the problem of lack of capital and women entrepreneurs failed to get appropriate support from banking system in Kerala. Krishan Embran (2004) conducted as study on women entrepreneurs in Kerala. It was found that the assistance provided by the government were mainly financial assistance to attract women to start new units. Though large numbers of institutions were functioning in the state, only a few women entrepreneurs could avail the service rendered by them. Lack of information and procedural complications was the main causes. The study shows that the present institutional support system is not sufficient to support the sustainable development of women entrepreneurship in the state. Seetha Kumari (2007) conducted a comparative study on women entrepreneurs in Kerala and Tamil Nadu. The result of this study reveals that women entrepre-neurs in Kerala and Tamil Nadu were indifferent in certain extent. But most of the women entrepreneurs in Kerala and Tamil Nadu have no access to information and communication technology even after entering the business. The majority of the women entrepreneurs have utilized the service of government agencies. However, they have similarities in the basic reason for inadequate credit from financial institution, the nature of the personal problem and the steps taken to solve these problems. Kumari Shetal (2010) conducted work in the rural areas, & the result of that study indicates the lack of supportive network. Financial and marketing issues were major problem area for rural women entrepreneurs and major de- motivator for other women to initiate entrepreneurial activity. Kishore and Choudhary (2011) in their study emphasized the role of women entrepreneurs, as they have been making a significant impact in all segments of the economy in India. However, it is potentially empowering and liberating only if it provides women an opportunity to improve their well-being and enhance their capabilities.
3. SIGNIFICANCE OF THE STUDY The mere presence of Industries, whether it is small, large or medium provides the sign of economic development of a nation. Organising women through self help group and equip them to undertake income generating activity through the formation of micro enterprises have created an economic revolution in the country. Emergences of women entrepreneurs and beginning of micro enterprises development have followed from these achievements. Micro enterprises foster the economic status of women as an effective means to eradicate poverty. Women entrepreneurs in micro enterprises are contributing a lot in rural development and growth of the economy but their potential is still untapped. Right effort from multi direction is required in the development of women entrepreneurs. The micro entrepreneurship is strengthening the women empowerment and removes gender inequality. The present study is much relevant and timely because women
E
VOLUME NO. 7 (2016), ISSUE NO. 08 (AUGUST) ISSN 0976-2183
INTERNATIONAL JOURNAL OF RESEARCH IN COMMERCE & MANAGEMENT A Monthly Double-Blind Peer Reviewed (Refereed/Juried) Open Access International e-Journal - Included in the International Serial Directories
http://ijrcm.org.in/
86
entrepreneur starts and run their unit in the form of micro enterprises and they faces financial and marketing problem. Problem identification is the first step in taking suitable decision. So this study helps various authorities to take suitable decision to solve problems faced by women entrepreneurs in micro enterprises.
4. STATEMENT OF THE PROBLEM In modern society women have stepped out of the house to participate in all sort of economic activities. Today with the growth of micro enterprises, many women have plunged into entrepreneurship, but they are facing many obstacles especially in the finance and marketing of their product. This study is related to the identification of the status and growth of women entrepreneurs in micro enterprises in Kollam district and to identify the financial and marketing difficulties faced by them. The Government provides various support schemes to encourage women entrepreneurs. The study also aims to evaluate the perception of women entrepreneurs towards Government scheme.
5. OBJECTIVES OF THE STUDY The main objectives of the study are: 1. To identify the status and growth of the women entrepreneurs in micro enterprises in Kollam district. 2. To estimate and evaluate various difficulties faced by the women entrepreneurs with respect to their finance and marketing. 3. To evaluate the perception of women entrepreneurs towards government schemes.
6. SCOPE OF THE STUDY Women start and run their enterprises in different forms such as micro enterprises, small and medium-scale enterprises etc. The scope of this study is restricted to women entrepreneurs in micro enterprises in the district of Kollam.
7. RESEARCH METHEDOLOGY 7.1 COLLECTION OF DATA Necessary data for project report were collected through findings from primary data and secondary data. 7.1.1 Primary Data: Interaction with the Manager of District Industries Centre in Kollam and women entrepreneurs of micro enterprises in Kollam was made to collect primary data. A structured questionnaire was used to collect data from women entrepreneur. 7.1.2 Secondary Data: Secondary data were collected from books, journals and various internet sites. 7.2 Sampling Method A sample size of 50 registered women entrepreneurs in micro enterprises of the Kollam district have been selected at random for this study. Simple random sampling method was used. 7.3 Analytical tool The data collected were analyzed and interpreted by using simple mathematical techniques such as percentage. Percentage = No of respondent / 100
8. SCHEMES FOR THE DEVELOPMENT AND PROMOTION OF WOMEN ENTREPRENEUR IN MICRO ENTERPRISE In order to encourage more and more women enterprises in the MSE sector, several schemes have been formulated by the Ministry and some more are in the process of being finalized, targeted only at the development of women enterprises in India. a) Trade Related Entrepreneurship Assistance and Development Scheme for women (TREAD): With a view to encourage women in setting up their own
ventures, government implements a scheme, namely, “Trade Related Entrepreneurship Assistance and Development (TREAD) during the 11th plan. The scheme envisages economic empowerment of women through the development of their entrepreneurial skill in non- farm activities. There are three major components of the scheme:
GOI grants up to 30% of the total project cost to the Non- Government Organizations (NGOs) for promoting entrepreneurship among women. The remaining 70% of the project cost is financed by the lending agency as loan for undertaking activities as envisaged in the project.
GOI grants up to Rs1 lakh per programme to training institution\ NGOs for imparting training to the women entrepreneurs, subject to these institutions \NGOs bring their share to the extent of minimum 25% of GOI grant.
Need- based GOI grants up to Rs 5 lakh to National Entrepreneurship Development Institution and any other institution of repute for the undertaking field surveys, research studies, evaluation studies, designing of training modules etc The scheme envisages that Women Associations /NGOs/SHGs should prepare composite bankable proposals for a group of women entrepreneurs, and submit to the office of the DC (MSME) for forwarding to the Bank for their appraisal. Bank examines the proposal and issues approval. 30 % of the loan amount is sanctioned as grant and made available to the bank by office of DC (MSME) for further disbursement to NGOs.
b) Micro & Small Enterprises Cluster Development Programme (MSE – CDP): The Cluster Development Programme (CDP) being implemented envisages diag-nostic study of identified clusters of traditional skill -based MSEs to identify appropriate technologies and their providers and to facilitate adoption of available technology meeting the specific need of the end users. The Cluster Development aims at enhanced competitiveness, technology improvement, adoption of best manufacturing practices, marketing of products, employment generation etc. The various types of interventions includes:
Soft Interventions – The capacity of building activities in the cluster where no fixed assets is acquired or formed. Soft interventions includes Diagnostic study, Forming association – Trust building & Developing Identity, Capacity building, Organizing workshops, seminar, Training & Exposure visits, Market develop-ment, Launch of websites, Common procurement, Common / complementary sales and branding. In the past depending upon the type of clusters available for soft intervention has varied in the range of Rs 25-35 lakh per cluster. Currently an internal ceiling of Rs 10 lakh for soft intervention is under this scheme.
Hard Interventions – Hard interventions includes Setting up of Common Facility Centre (CFCs),Mini Tool Room, Design Centre, Testing Facility, Training Centre, R& D Centre, Common Raw Material Bank /Sales depot,Display /Exhibition Centre In case of the hard intervention the contribution from the M/o MSME varies between 30%– 80% of the Project cost, but in the case of clusters owned and managed by women entrepreneurs, contribution of the M/o MSME could up to 90% of the project cost.
c) Credit Guarantee Fund Scheme for Micro and Small Enterprises: The Scheme was launched in August 2000 to ensure better flow of credit to micro and small enterprises by minimizing the risk perception of financial institutions and bank in lending without collateral security. Under the scheme, guarantee cover is provided to collateral free credit facility extended by member lending institution (MLIs) to the new as well as existing micro and small enterprises on loans up to Rs 50 lakh. The guarantee cover available is up to 75% of the loan extended. The extent of guarantee cover is 80% for Micro enterprises for loan up to Rs 5 lakh, MSEs operated and /or owned by women and all loans in the North – East Region. The lending institutions availing guarantee from the Trust have to pay one time guarantee fee of 1.5% and service charges of 0.75% per annum of the credit facility sanctioned. For loans up to Rs 5 lakh, the onetime guarantee fee is 1 % and service charges are 0.5% per annum of the credit facility sanctioned.
d) Support for Entrepreneurial and Managerial Development: MSME – DIs regularly organizes a number of Entrepreneurship Skill Development Programme (ESDPs) / Entrepreneurship Development Programme (EDPs)/ Management Development Programmes (MDPs) to train the potential entrepreneurs in im-proving their techno / managerial knowledge and skill with a view to facilitating them to start MSEs in various fields. Many of the programmes are tailor made for the target group for SC, ST, OBC, Women, Minorities and other weaker sections and exclusively for women also. These programmes are also called “Out –reach Programmes” as they are conducted in rural / less developed areas.22.5% of the total target of ESDPs /EDPs are conducted exclusively for SC,

VOLUME NO. 7 (2016), ISSUE NO. 08 (AUGUST) ISSN 0976-2183
INTERNATIONAL JOURNAL OF RESEARCH IN COMMERCE & MANAGEMENT A Monthly Double-Blind Peer Reviewed (Refereed/Juried) Open Access International e-Journal - Included in the International Serial Directories
http://ijrcm.org.in/
87
ST, Women and physically challenged persons with a stipend of Rs 500/- per month per candidate under the promotional packages for MSEs. No fee is charged from SC/ST, Women and Physically Handicapped.
e) Exhibitions for Women under promotion package for Micro & Small Enterprises: DC (MSME) has formulated a scheme for women entrepreneurs to en-courage Small& Micro manufacturing unit by women and register in DIC in their efforts at tapping and developing overseas markets, to increase participation of representatives of small /micro manufacturing enterprises under MSME stall at International Trade Fairs/Exhibitions, to enhance export from such unit. Under this scheme, participation of women entrepreneurs in 25 international exhibitions is envisaged during the 11th plan (2007-2012). With a view to encourage women entrepreneurs to participate in International Exhibitions under MDA scheme it has been decided to:
Provide rent free space in the exhibitions Reimburse 100% economy class air fare for one representative The overall ceiling shall however be Rs 1.25 lakh.
9. WOMEN ENTREPRENEURS IN MICRO ENTERPRISES IN KOLLAM Most of women owned enterprises are registered as micro enterprises in Kollam district. The following table shows women owned micro enterprises in Kollam from 2008-2015.
TABLE 1: WOMEN MICRO ENTREPRENEURS IN KOLLAM
As on 31-Dec Units promoted Rate of growth on the basis of prev:year Rate of growth on the basis of base year(2008)
2008 396
2009 455 14.89 14.89
2010 552 21.31 39.39
2011 684 24 72.72
2012 875 27.92 120.96
2013 1148 31.2 189.90
2014 1565 36.32 295.20
2015 2251 43.83 468.43
Source: compiled by the researcher using secondary data
FIG. 1
As shown in the above graph, number of women owned micro enterprises in Kollam district has been increased. As stated above, there is an increase in the number but the growth rate is very slow
FIG. 2: COMPARISON OF GROWTH RATE BASED ON PREVIOUS YEAR & BASE YEAR
The above graph indicates the growth rate of women enterprises with reference to the previous year & base year (2008). From the graph, it can be concluded that there is a gradual growth in the number of women owned enterprises per year as shown by the blue line. When compared with the base year (2008), the growth is drastic as shown by the steep red line on the graph.
0
500
1000
1500
2000
2500
2008 2009 2010 2011 2012 2013 2014 2015
Units promoted
0
100
200
300
400
500
600
2008 2009 2010 2011 2012 2013 2014 2015
Rate of growth on the basis of baseyear(2008)
Rate of growth on the basis of prev:year
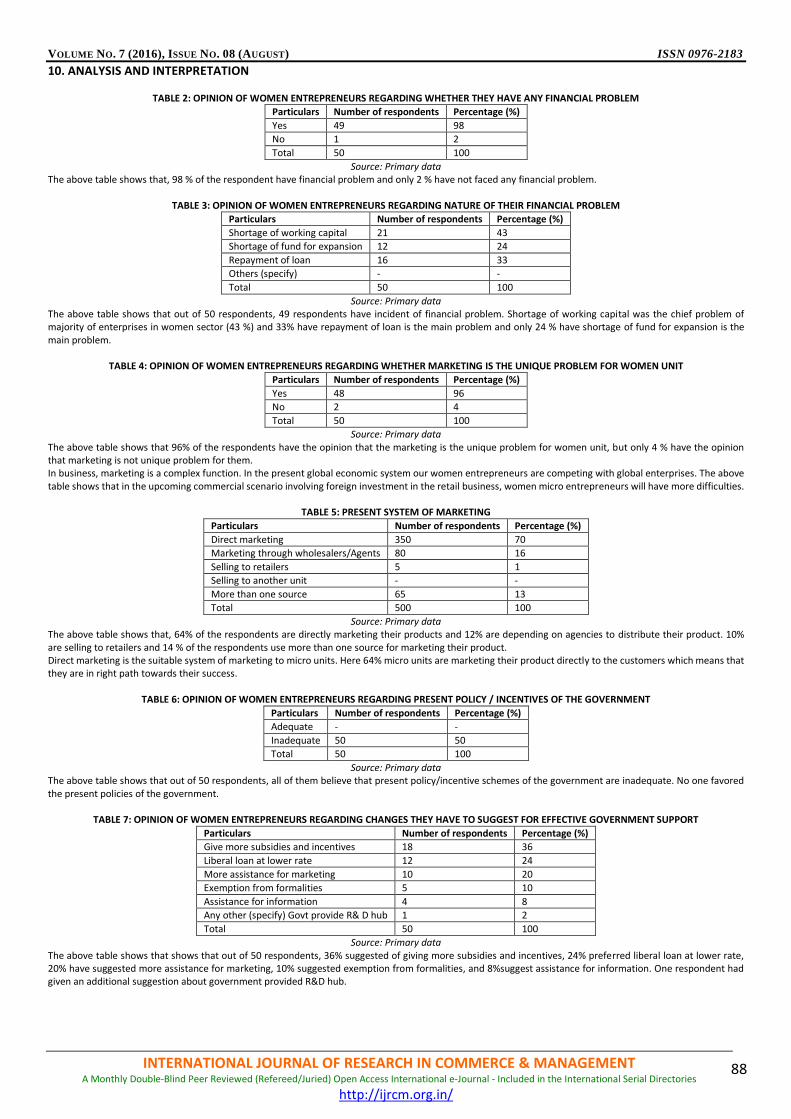
VOLUME NO. 7 (2016), ISSUE NO. 08 (AUGUST) ISSN 0976-2183
INTERNATIONAL JOURNAL OF RESEARCH IN COMMERCE & MANAGEMENT A Monthly Double-Blind Peer Reviewed (Refereed/Juried) Open Access International e-Journal - Included in the International Serial Directories
http://ijrcm.org.in/
88
10. ANALYSIS AND INTERPRETATION
TABLE 2: OPINION OF WOMEN ENTREPRENEURS REGARDING WHETHER THEY HAVE ANY FINANCIAL PROBLEM
Particulars Number of respondents Percentage (%)
Yes 49 98
No 1 2
Total 50 100
Source: Primary data The above table shows that, 98 % of the respondent have financial problem and only 2 % have not faced any financial problem.
TABLE 3: OPINION OF WOMEN ENTREPRENEURS REGARDING NATURE OF THEIR FINANCIAL PROBLEM
Particulars Number of respondents Percentage (%)
Shortage of working capital 21 43
Shortage of fund for expansion 12 24
Repayment of loan 16 33
Others (specify) - -
Total 50 100
Source: Primary data The above table shows that out of 50 respondents, 49 respondents have incident of financial problem. Shortage of working capital was the chief problem of majority of enterprises in women sector (43 %) and 33% have repayment of loan is the main problem and only 24 % have shortage of fund for expansion is the main problem.
TABLE 4: OPINION OF WOMEN ENTREPRENEURS REGARDING WHETHER MARKETING IS THE UNIQUE PROBLEM FOR WOMEN UNIT
Particulars Number of respondents Percentage (%)
Yes 48 96
No 2 4
Total 50 100
Source: Primary data The above table shows that 96% of the respondents have the opinion that the marketing is the unique problem for women unit, but only 4 % have the opinion that marketing is not unique problem for them. In business, marketing is a complex function. In the present global economic system our women entrepreneurs are competing with global enterprises. The above table shows that in the upcoming commercial scenario involving foreign investment in the retail business, women micro entrepreneurs will have more difficulties.
TABLE 5: PRESENT SYSTEM OF MARKETING
Particulars Number of respondents Percentage (%)
Direct marketing 350 70
Marketing through wholesalers/Agents 80 16
Selling to retailers 5 1
Selling to another unit - -
More than one source 65 13
Total 500 100
Source: Primary data The above table shows that, 64% of the respondents are directly marketing their products and 12% are depending on agencies to distribute their product. 10% are selling to retailers and 14 % of the respondents use more than one source for marketing their product. Direct marketing is the suitable system of marketing to micro units. Here 64% micro units are marketing their product directly to the customers which means that they are in right path towards their success.
TABLE 6: OPINION OF WOMEN ENTREPRENEURS REGARDING PRESENT POLICY / INCENTIVES OF THE GOVERNMENT
Particulars Number of respondents Percentage (%)
Adequate - -
Inadequate 50 50
Total 50 100
Source: Primary data The above table shows that out of 50 respondents, all of them believe that present policy/incentive schemes of the government are inadequate. No one favored the present policies of the government.
TABLE 7: OPINION OF WOMEN ENTREPRENEURS REGARDING CHANGES THEY HAVE TO SUGGEST FOR EFFECTIVE GOVERNMENT SUPPORT
Particulars Number of respondents Percentage (%)
Give more subsidies and incentives 18 36
Liberal loan at lower rate 12 24
More assistance for marketing 10 20
Exemption from formalities 5 10
Assistance for information 4 8
Any other (specify) Govt provide R& D hub 1 2
Total 50 100
Source: Primary data The above table shows that shows that out of 50 respondents, 36% suggested of giving more subsidies and incentives, 24% preferred liberal loan at lower rate, 20% have suggested more assistance for marketing, 10% suggested exemption from formalities, and 8%suggest assistance for information. One respondent had given an additional suggestion about government provided R&D hub.
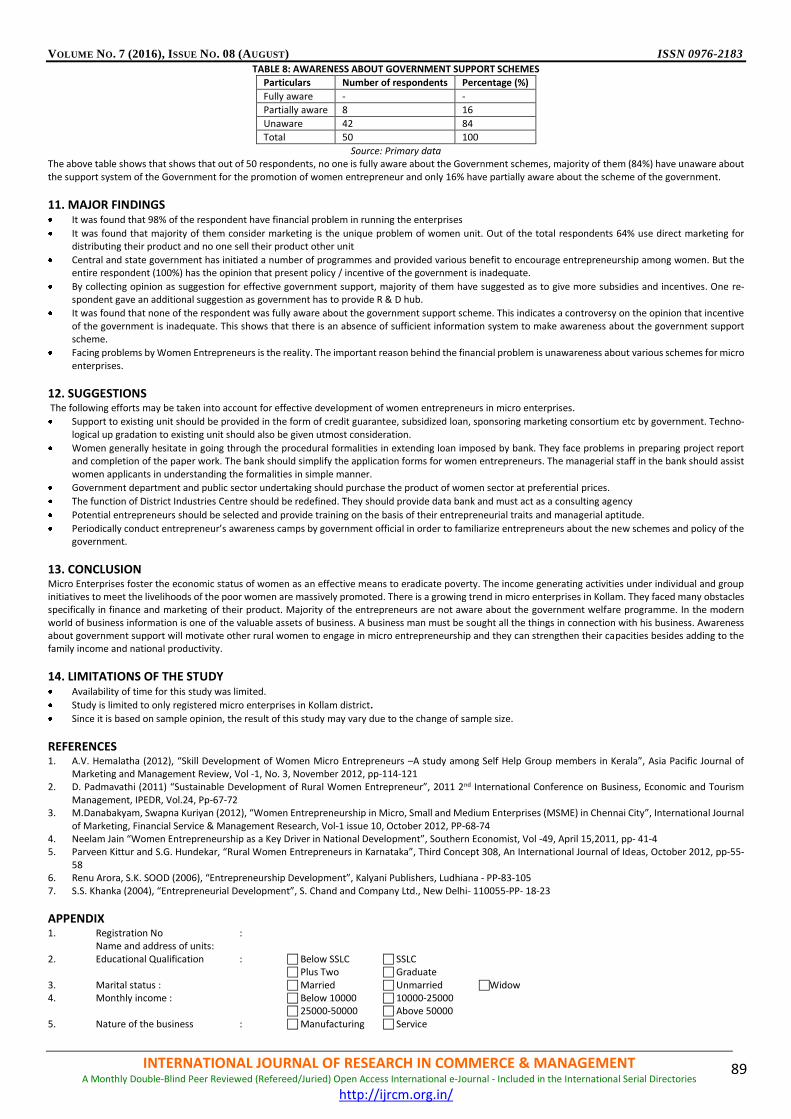
VOLUME NO. 7 (2016), ISSUE NO. 08 (AUGUST) ISSN 0976-2183
INTERNATIONAL JOURNAL OF RESEARCH IN COMMERCE & MANAGEMENT A Monthly Double-Blind Peer Reviewed (Refereed/Juried) Open Access International e-Journal - Included in the International Serial Directories
http://ijrcm.org.in/
89
TABLE 8: AWARENESS ABOUT GOVERNMENT SUPPORT SCHEMES
Particulars Number of respondents Percentage (%)
Fully aware - -
Partially aware 8 16
Unaware 42 84
Total 50 100
Source: Primary data The above table shows that shows that out of 50 respondents, no one is fully aware about the Government schemes, majority of them (84%) have unaware about the support system of the Government for the promotion of women entrepreneur and only 16% have partially aware about the scheme of the government.
11. MAJOR FINDINGS It was found that 98% of the respondent have financial problem in running the enterprises
It was found that majority of them consider marketing is the unique problem of women unit. Out of the total respondents 64% use direct marketing for distributing their product and no one sell their product other unit
Central and state government has initiated a number of programmes and provided various benefit to encourage entrepreneurship among women. But the entire respondent (100%) has the opinion that present policy / incentive of the government is inadequate.
By collecting opinion as suggestion for effective government support, majority of them have suggested as to give more subsidies and incentives. One re-spondent gave an additional suggestion as government has to provide R & D hub.
It was found that none of the respondent was fully aware about the government support scheme. This indicates a controversy on the opinion that incentive of the government is inadequate. This shows that there is an absence of sufficient information system to make awareness about the government support scheme.
Facing problems by Women Entrepreneurs is the reality. The important reason behind the financial problem is unawareness about various schemes for micro enterprises.
12. SUGGESTIONS The following efforts may be taken into account for effective development of women entrepreneurs in micro enterprises.
Support to existing unit should be provided in the form of credit guarantee, subsidized loan, sponsoring marketing consortium etc by government. Techno-logical up gradation to existing unit should also be given utmost consideration.
Women generally hesitate in going through the procedural formalities in extending loan imposed by bank. They face problems in preparing project report and completion of the paper work. The bank should simplify the application forms for women entrepreneurs. The managerial staff in the bank should assist women applicants in understanding the formalities in simple manner.
Government department and public sector undertaking should purchase the product of women sector at preferential prices.
The function of District Industries Centre should be redefined. They should provide data bank and must act as a consulting agency
Potential entrepreneurs should be selected and provide training on the basis of their entrepreneurial traits and managerial aptitude.
Periodically conduct entrepreneur’s awareness camps by government official in order to familiarize entrepreneurs about the new schemes and policy of the government.
13. CONCLUSION Micro Enterprises foster the economic status of women as an effective means to eradicate poverty. The income generating activities under individual and group initiatives to meet the livelihoods of the poor women are massively promoted. There is a growing trend in micro enterprises in Kollam. They faced many obstacles specifically in finance and marketing of their product. Majority of the entrepreneurs are not aware about the government welfare programme. In the modern world of business information is one of the valuable assets of business. A business man must be sought all the things in connection with his business. Awareness about government support will motivate other rural women to engage in micro entrepreneurship and they can strengthen their capacities besides adding to the family income and national productivity.
14. LIMITATIONS OF THE STUDY Availability of time for this study was limited.
Study is limited to only registered micro enterprises in Kollam district.
Since it is based on sample opinion, the result of this study may vary due to the change of sample size.
REFERENCES 1. A.V. Hemalatha (2012), “Skill Development of Women Micro Entrepreneurs –A study among Self Help Group members in Kerala”, Asia Pacific Journal of
Marketing and Management Review, Vol -1, No. 3, November 2012, pp-114-121 2. D. Padmavathi (2011) “Sustainable Development of Rural Women Entrepreneur”, 2011 2nd International Conference on Business, Economic and Tourism
Management, IPEDR, Vol.24, Pp-67-72 3. M.Danabakyam, Swapna Kuriyan (2012), “Women Entrepreneurship in Micro, Small and Medium Enterprises (MSME) in Chennai City”, International Journal
of Marketing, Financial Service & Management Research, Vol-1 issue 10, October 2012, PP-68-74 4. Neelam Jain “Women Entrepreneurship as a Key Driver in National Development”, Southern Economist, Vol -49, April 15,2011, pp- 41-4 5. Parveen Kittur and S.G. Hundekar, “Rural Women Entrepreneurs in Karnataka”, Third Concept 308, An International Journal of Ideas, October 2012, pp-55-
58 6. Renu Arora, S.K. SOOD (2006), “Entrepreneurship Development”, Kalyani Publishers, Ludhiana - PP-83-105 7. S.S. Khanka (2004), “Entrepreneurial Development”, S. Chand and Company Ltd., New Delhi- 110055-PP- 18-23
APPENDIX 1. Registration No : Name and address of units: 2. Educational Qualification : Below SSLC SSLC Plus Two Graduate 3. Marital status : Married Unmarried Widow 4. Monthly income : Below 10000 10000-25000 25000-50000 Above 50000 5. Nature of the business : Manufacturing Service
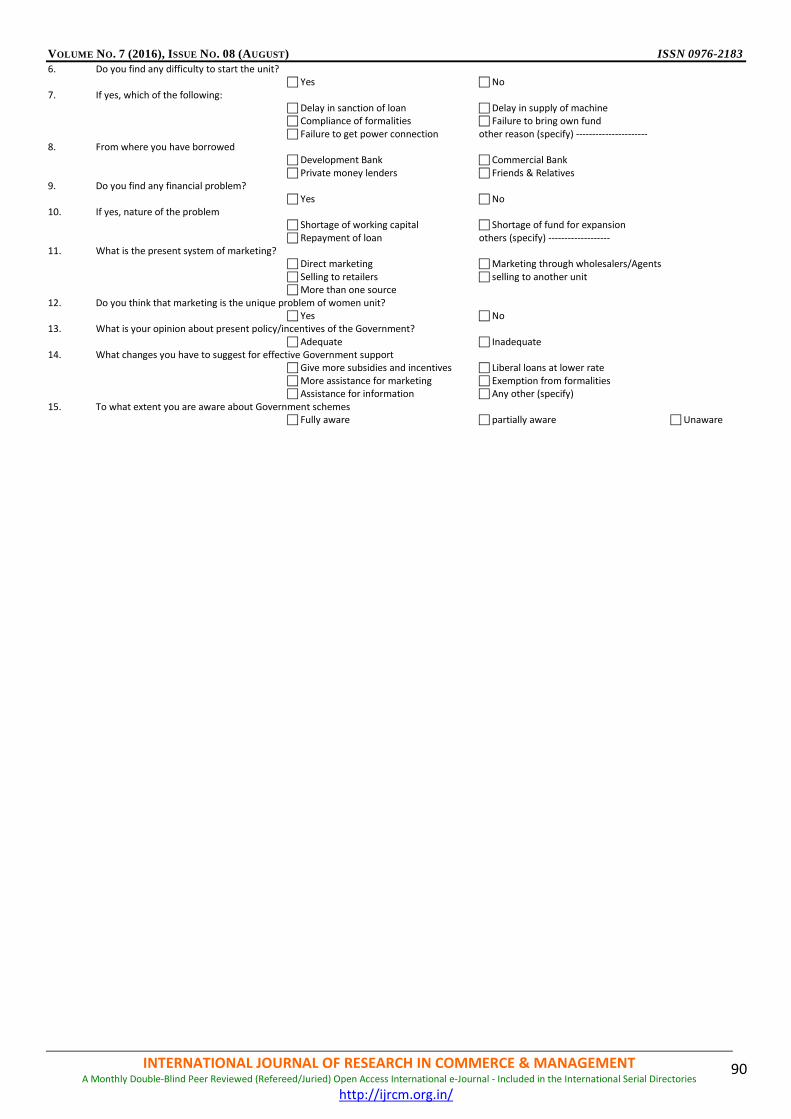
VOLUME NO. 7 (2016), ISSUE NO. 08 (AUGUST) ISSN 0976-2183
INTERNATIONAL JOURNAL OF RESEARCH IN COMMERCE & MANAGEMENT A Monthly Double-Blind Peer Reviewed (Refereed/Juried) Open Access International e-Journal - Included in the International Serial Directories
http://ijrcm.org.in/
90
6. Do you find any difficulty to start the unit? Yes No 7. If yes, which of the following: Delay in sanction of loan Delay in supply of machine Compliance of formalities Failure to bring own fund Failure to get power connection other reason (specify) ---------------------- 8. From where you have borrowed Development Bank Commercial Bank Private money lenders Friends & Relatives 9. Do you find any financial problem? Yes No 10. If yes, nature of the problem Shortage of working capital Shortage of fund for expansion Repayment of loan others (specify) ------------------- 11. What is the present system of marketing? Direct marketing Marketing through wholesalers/Agents Selling to retailers selling to another unit More than one source 12. Do you think that marketing is the unique problem of women unit? Yes No 13. What is your opinion about present policy/incentives of the Government? Adequate Inadequate 14. What changes you have to suggest for effective Government support Give more subsidies and incentives Liberal loans at lower rate More assistance for marketing Exemption from formalities Assistance for information Any other (specify) 15. To what extent you are aware about Government schemes Fully aware partially aware Unaware

VOLUME NO. 7 (2016), ISSUE NO. 08 (AUGUST) ISSN 0976-2183
INTERNATIONAL JOURNAL OF RESEARCH IN COMMERCE & MANAGEMENT A Monthly Double-Blind Peer Reviewed (Refereed/Juried) Open Access International e-Journal - Included in the International Serial Directories
http://ijrcm.org.in/
91
REQUEST FOR FEEDBACK
Dear Readers At the very outset, International Journal of Research in Commerce & Management (IJRCM) acknowledges & appreciates your efforts in showing interest in our present issue under your kind perusal. I would like to request you to supply your critical comments and suggestions about the material published in this issue, as well as on the journal as a whole, on our e-mail [email protected] for further improve-ments in the interest of research. If you have any queries, please feel free to contact us on our e-mail [email protected]. I am sure that your feedback and deliberations would make future issues better – a result of our joint effort. Looking forward to an appropriate consideration. With sincere regards Thanking you profoundly Academically yours Sd/- Co-ordinator
DISCLAIMER The information and opinions presented in the Journal reflect the views of the authors and not of the Journal or its Editorial Board or the Publishers/Editors. Publication does not constitute endorsement by the journal. Neither the Journal nor its publishers/Editors/Editorial Board nor anyone else involved in creating, producing or delivering the journal or the materials contained therein, assumes any liability or responsibility for the accuracy, completeness, or usefulness of any information provided in the journal, nor shall they be liable for any direct, indirect, incidental, special, consequential or punitive damages arising out of the use of infor-mation/material contained in the journal. The journal, neither its publishers/Editors/ Editorial Board, nor any other party involved in the preparation of material contained in the journal represents or warrants that the information contained herein is in every respect accurate or complete, and they are not responsible for any errors or omissions or for the results obtained from the use of such material. Readers are encouraged to confirm the information contained herein with other sources. The responsibility of the contents and the opinions expressed in this journal are exclusively of the author (s) concerned.
VOLUME NO. 7 (2016), ISSUE NO. 08 (AUGUST) ISSN 0976-2183
INTERNATIONAL JOURNAL OF RESEARCH IN COMMERCE & MANAGEMENT A Monthly Double-Blind Peer Reviewed (Refereed/Juried) Open Access International e-Journal - Included in the International Serial Directories
http://ijrcm.org.in/
I