
Volume 5, Issue 4 (XIX) : October – December 2018 - Advance ...
VOLUME NO. 3 (2013), I SSUE NO. 09 (SEPTEMBER ) ISSN 2231-5756
A Monthly Double-Blind Peer Reviewed (Refereed/Juried) Open Access International e-Journal - Included in the International Serial Directories
Indexed & Listed at: Ulrich's Periodicals Directory ©, ProQuest, U.S.A., EBSCO Publishing, U.S.A., Cabell’s Directories of Publishing Opportunities, U.S.A.,
Open J-Gage, India [link of the same is duly available at Inflibnet of University Grants Commission (U.G.C.)], Index Copernicus Publishers Panel, Polandwith IC Value of 5.09 &number of libraries all around the world.
Circulated all over the world & Google has verified that scholars of more than 2840 Cities in 164 countries/territories are visiting our journal on regular basis.
Ground Floor, Building No. 1041-C-1, Devi Bhawan Bazar, JAGADHRI – 135 003, Yamunanagar, Haryana, INDIA
http://ijrcm.org.in/

VOLUME NO. 3 (2013), I SSUE NO. 09 (SEPTEMBER ) ISSN 2231-5756
INTERNATIONAL JOURNAL OF RESEARCH IN COMMERCE, IT & MANAGEMENT A Monthly Double-Blind Peer Reviewed (Refereed/Juried) Open Access International e-Journal - Included in the International Serial Directories
http://ijrcm.org.in/
ii
CONTENTSCONTENTSCONTENTSCONTENTS Sr. No. TITLE & NAME OF THE AUTHOR (S) Page
No.
1. ADEQUACY OF KNOWLEDGE AND ATTITUDE TOWARDS INFORMATION TECHNOLOGY OF STUDENT LIBRARY USERS AT SELECTED COLLEGES AND
UNIVERSITIES IN CALABARZON, PHILIPPINES
DR. MA. LINDIE D. MASALINTO, DR. MA. CONSUELO M. OBILLO, RUFO S CALIXTRO JR., JOSEFA G. CARRILLO & MA. XENIA Z. BITERA
1
2. MOBILITY IN HETEROGENEOUS WIRELESS NETWORK USING HMAC
C. SUGANTHI & DR. C. MANOHARAN
4
3. A STUDY ON CONSUMERS PERCEPTION TOWARDS THE PURCHASE DECISION OF TWO WHEELER MOTORCYCLES IN NELLORE DISTRICT, ANDHRA
PRADESH
D.V.RAMANA & DR. PARA SUBBAIAH
9
4. OPTIMIZING THE DE-DUPLICATION FOLIAGE IMAGE ACCESS IN STORAGE SYSTEMS
CHITTALA RAMA SATYA & B.VIJAYA KUMAR
15
5. A STUDY ON THE IMPACT OF E TAILERS ON UNORGANISED AND ORGANISED RETAILERS WITH REFERENCE TO ELECTRONIC GOODS
KALAVATHY K.S & DR. BINA PANDEY
18
6. A MODERN CLASSIFICATION OF PRICING STRATEGIES OF RETAILERS
SREELATA, N. V. NARASIMHAM & DR. M. K. GUPTA
24
7. LEADERSHIP CONCEPT: AN OPINION SURVEY IN A PRIVATE SECTOR AND GOVERNMENT SECTOR
DR. E. LOKANADHA REDDY & DR. G HARANATH
30
8. MARKETING MIX: A REVIEW ON THE ‘P’S OF MARKETING
M.VASUDEVAN, DR. V. M. SENTHILKUMAR & K.SASIKUMAR
37
9. SECURING A BIOMETRIC TRAIT: A CASE STUDY ON FINGER PRINTS
MADHU CHAUHAN & DR. R. P. SAXENA
40
10. INFORMATION AND COMMUNICATION TECHNOLOGY AND THE PERFORMANCE OF SMALL AND MEDIUM ENTERPRISES IN NASARAWA STATE,
NIGERIA
UMARU DANLADI MOHAMMED & CHINELO GRACE OBELEAGU-NZELIBE
43
11. RELIABILITY TEST PLANS BASED ON LOG-LOGISTIC DISTRIBUTION
R.R.L.KANTAM, B.SRIRAM & A. SUHASINI
49
12. MIGRATION AND SUSTAINABLE DEVELOPMENT
DR. H.R.UMA, MADHU G.R. & MAHAMMAD HABEEB
58
13. THE ANTECEDENTS OF BRAND LOYALTY: AN EMPIRICAL STUDY ON AIRTEL CELLULAR SERVICES
DR. P. SUJATHA
61
14. STATUS OF BI SOLUTIONS AT SELECTED BRANCHES OF BANKS IN RAJASTHAN
DR. AZIMUDDIN KHAN
66
15. A STUDY ON USAGE OF GEOSPATIAL TECHNOLOGIES IN POWER UTILITY
VARUN PRAKASH
71
16. AN IMPROVED INVISIBLE WATERMARKING TECHNIQUE FOR IMAGE AUTHENTICATION
DASU VAMAN RAVI PRASAD
76
17. ORGANIZATIONAL STRUCTURE, RESPONSIBILITY, MOTIVATION LEVEL AND JOB SATISFACTION OF SELF-FINANCING ENGINEERING COLLEGES BY
USING MATHEMATICAL MODELING
RAVI DATT, DR. SUNIL DUTT, DR. SITA RAM & SANTOSH KUMARI
82
18. DESIGN AND IMPLEMENTATION OF A REAL-TIME VEHICLE TRACKING SYSTEM
MAITANMI OLUSOLA STEPHEN, OGUNLERE SAMSON OJO, DR. ADEKUNLE YINKA, GREGORY ONWODI & MALASOWE BRIDGET
86
19. PERFORMANCE EVALUATION OF MANET ROUTING PROTOCOLS WITH SCALABILITY FOR E-MAIL THROUGHPUT TRAFFIC USING OPNET MODELER
MANDEEP SINGH & BALWINDER SINGH
93
20. DETAILED INVESTIGATION OF RESIDENTIAL SATISFACTION IN APARTMENT’S MANAGEMENT SERVICE
P. BALATHANDAYUTHAM & DR. R. SRITHARAN
98
21. A STUDY ON THE PSYCHOLOGICAL IMPACT OF REDUNDANCY ON SURVIVORS
S.SOWJANYA
100
22. A STUDY ON SECURITY THREAT AWARENESS AMONG STUDENTS USING SOCIAL NETWORKING SITES, BY APPLYING DATA MINING TECHNIQUES
A.PAPPU RAJAN
103
23. ELECTRONIC REMITTANCE SYSTEM IN INDIA: CHANGING PARADIGMS OF PAYMENT MECHANISMS IN INDIA
SAMIR
107
24. E-SATISFACTION AND E-LOYALTY OF CONSUMERS SHOPPING ONLINE
R. SATHISH KUMAR
111
25. STUDENTS PERCEPTION TOWARDS e-BANKING: SPECIAL REFERENCE TO KOLLAM DISTRICT IN KERALA
NIJAZ NIZAR
114
26. TECHNOLOGICAL DRIFT TOWARDS SMART DEVICES: AN OVERVIEW
MUKESH H.V & HALASWAMY D. NAIK
118
27. MOTIVATION AS AN EFFECTIVE TOOL FOR ORGANIZATIONAL DEVELOPMENT IN NIGERIA
DR. ABDULSALAM JIBRIL & YUSUF SAJO
121
28. AN UNDERSTANDING OF DUNNING’S OWNERSHIP-LOCATION-INTERNALISATION (OLI) ECLECTIC THEORY OF MULTINATIONAL COMPANIES
JABES GABBIS ODHIAMBO KOTIENO
124
29. AUTHORING TOOL: KEY FOR E-LEARNING SYSTEM DEVELOPMENT
JAVED WASIM
128
30. ANTECEDENTS AND CONSEQUENCES OF WORK-EXHAUSTION (IT SECTOR)
UMAIR NAJAM & FAISAL ABBAS
131
REQUEST FOR FEEDBACK 136

VOLUME NO. 3 (2013), I SSUE NO. 09 (SEPTEMBER ) ISSN 2231-5756
INTERNATIONAL JOURNAL OF RESEARCH IN COMMERCE, IT & MANAGEMENT A Monthly Double-Blind Peer Reviewed (Refereed/Juried) Open Access International e-Journal - Included in the International Serial Directories
http://ijrcm.org.in/
iii
CHIEF PATRONCHIEF PATRONCHIEF PATRONCHIEF PATRON PROF. K. K. AGGARWAL
Chairman, Malaviya National Institute of Technology, Jaipur (An institute of National Importance & fully funded by Ministry of Human Resource Development, Government of India)
Chancellor, K. R. Mangalam University, Gurgaon
Chancellor, Lingaya’s University, Faridabad
Founder Vice-Chancellor (1998-2008), Guru Gobind Singh Indraprastha University, Delhi
Ex. Pro Vice-Chancellor, Guru Jambheshwar University, Hisar
FOUNDER FOUNDER FOUNDER FOUNDER PATRONPATRONPATRONPATRON LATE SH. RAM BHAJAN AGGARWAL
Former State Minister for Home & Tourism, Government of Haryana
Former Vice-President, Dadri Education Society, Charkhi Dadri
Former President, Chinar Syntex Ltd. (Textile Mills), Bhiwani
COCOCOCO----ORDINATORORDINATORORDINATORORDINATOR AMITA
Faculty, Government M. S., Mohali
ADVISORSADVISORSADVISORSADVISORS DR. PRIYA RANJAN TRIVEDI
Chancellor, The Global Open University, Nagaland
PROF. M. S. SENAM RAJU Director A. C. D., School of Management Studies, I.G.N.O.U., New Delhi
PROF. M. N. SHARMA Chairman, M.B.A., Haryana College of Technology & Management, Kaithal
PROF. S. L. MAHANDRU Principal (Retd.), Maharaja Agrasen College, Jagadhri
EDITOREDITOREDITOREDITOR PROF. R. K. SHARMA
Professor, Bharti Vidyapeeth University Institute of Management & Research, New Delhi
COCOCOCO----EDITOREDITOREDITOREDITOR DR. BHAVET
Faculty, Shree Ram Institute of Business & Management, Urjani
EDITORIAL ADVISORY BOARDEDITORIAL ADVISORY BOARDEDITORIAL ADVISORY BOARDEDITORIAL ADVISORY BOARD DR. RAJESH MODI
Faculty, Yanbu Industrial College, Kingdom of Saudi Arabia
PROF. SANJIV MITTAL University School of Management Studies, Guru Gobind Singh I. P. University, Delhi
PROF. ANIL K. SAINI Chairperson (CRC), Guru Gobind Singh I. P. University, Delhi

VOLUME NO. 3 (2013), I SSUE NO. 09 (SEPTEMBER ) ISSN 2231-5756
INTERNATIONAL JOURNAL OF RESEARCH IN COMMERCE, IT & MANAGEMENT A Monthly Double-Blind Peer Reviewed (Refereed/Juried) Open Access International e-Journal - Included in the International Serial Directories
http://ijrcm.org.in/
iv
DR. SAMBHAVNA Faculty, I.I.T.M., Delhi
DR. MOHENDER KUMAR GUPTA Associate Professor, P. J. L. N. Government College, Faridabad
DR. SHIVAKUMAR DEENE Asst. Professor, Dept. of Commerce, School of Business Studies, Central University of Karnataka, Gulbarga
ASSOCIATE EDITORSASSOCIATE EDITORSASSOCIATE EDITORSASSOCIATE EDITORS PROF. NAWAB ALI KHAN
Department of Commerce, Aligarh Muslim University, Aligarh, U.P.
PROF. ABHAY BANSAL Head, Department of Information Technology, Amity School of Engineering & Technology, Amity
University, Noida
PROF. A. SURYANARAYANA Department of Business Management, Osmania University, Hyderabad
DR. SAMBHAV GARG Faculty, Shree Ram Institute of Business & Management, Urjani
PROF. V. SELVAM SSL, VIT University, Vellore
DR. PARDEEP AHLAWAT Associate Professor, Institute of Management Studies & Research, Maharshi Dayanand University, Rohtak
DR. S. TABASSUM SULTANA Associate Professor, Department of Business Management, Matrusri Institute of P.G. Studies, Hyderabad
SURJEET SINGH Asst. Professor, Department of Computer Science, G. M. N. (P.G.) College, Ambala Cantt.
TECHNICAL ADVISORTECHNICAL ADVISORTECHNICAL ADVISORTECHNICAL ADVISOR AMITA
Faculty, Government M. S., Mohali
FINANCIAL ADVISORSFINANCIAL ADVISORSFINANCIAL ADVISORSFINANCIAL ADVISORS DICKIN GOYAL
Advocate & Tax Adviser, Panchkula
NEENA Investment Consultant, Chambaghat, Solan, Himachal Pradesh
LEGAL ADVISORSLEGAL ADVISORSLEGAL ADVISORSLEGAL ADVISORS JITENDER S. CHAHAL
Advocate, Punjab & Haryana High Court, Chandigarh U.T.
CHANDER BHUSHAN SHARMA Advocate & Consultant, District Courts, Yamunanagar at Jagadhri
SUPERINTENDENTSUPERINTENDENTSUPERINTENDENTSUPERINTENDENT SURENDER KUMAR POONIA

VOLUME NO. 3 (2013), I SSUE NO. 09 (SEPTEMBER ) ISSN 2231-5756
INTERNATIONAL JOURNAL OF RESEARCH IN COMMERCE, IT & MANAGEMENT A Monthly Double-Blind Peer Reviewed (Refereed/Juried) Open Access International e-Journal - Included in the International Serial Directories
http://ijrcm.org.in/
v
CALL FOR MANUSCRIPTSCALL FOR MANUSCRIPTSCALL FOR MANUSCRIPTSCALL FOR MANUSCRIPTS We invite unpublished novel, original, empirical and high quality research work pertaining to recent developments & practices in the areas of
Computer Science & Applications; Commerce; Business; Finance; Marketing; Human Resource Management; General Management; Banking;
Economics; Tourism Administration & Management; Education; Law; Library & Information Science; Defence & Strategic Studies; Electronic Science;
Corporate Governance; Industrial Relations; and emerging paradigms in allied subjects like Accounting; Accounting Information Systems; Accounting
Theory & Practice; Auditing; Behavioral Accounting; Behavioral Economics; Corporate Finance; Cost Accounting; Econometrics; Economic
Development; Economic History; Financial Institutions & Markets; Financial Services; Fiscal Policy; Government & Non Profit Accounting; Industrial
Organization; International Economics & Trade; International Finance; Macro Economics; Micro Economics; Rural Economics; Co-operation;
Demography: Development Planning; Development Studies; Applied Economics; Development Economics; Business Economics; Monetary Policy; Public
Policy Economics; Real Estate; Regional Economics; Political Science; Continuing Education; Labour Welfare; Philosophy; Psychology; Sociology; Tax
Accounting; Advertising & Promotion Management; Management Information Systems (MIS); Business Law; Public Responsibility & Ethics;
Communication; Direct Marketing; E-Commerce; Global Business; Health Care Administration; Labour Relations & Human Resource Management;
Marketing Research; Marketing Theory & Applications; Non-Profit Organizations; Office Administration/Management; Operations Research/Statistics;
Organizational Behavior & Theory; Organizational Development; Production/Operations; International Relations; Human Rights & Duties; Public
Administration; Population Studies; Purchasing/Materials Management; Retailing; Sales/Selling; Services; Small Business Entrepreneurship; Strategic
Management Policy; Technology/Innovation; Tourism & Hospitality; Transportation Distribution; Algorithms; Artificial Intelligence; Compilers &
Translation; Computer Aided Design (CAD); Computer Aided Manufacturing; Computer Graphics; Computer Organization & Architecture; Database
Structures & Systems; Discrete Structures; Internet; Management Information Systems; Modeling & Simulation; Neural Systems/Neural Networks;
Numerical Analysis/Scientific Computing; Object Oriented Programming; Operating Systems; Programming Languages; Robotics; Symbolic & Formal
Logic; Web Design and emerging paradigms in allied subjects.
Anybody can submit the soft copy of unpublished novel; original; empirical and high quality research work/manuscript anytime in M.S. Word format
after preparing the same as per our GUIDELINES FOR SUBMISSION; at our email address i.e. [email protected] or online by clicking the link online
submission as given on our website (FOR ONLINE SUBMISSION, CLICK HERE).
GUIDELINES FOR SUBMISSION OF MANUSCRIPTGUIDELINES FOR SUBMISSION OF MANUSCRIPTGUIDELINES FOR SUBMISSION OF MANUSCRIPTGUIDELINES FOR SUBMISSION OF MANUSCRIPT
1. COVERING LETTER FOR SUBMISSION:
DATED: _____________
THE EDITOR
IJRCM
Subject: SUBMISSION OF MANUSCRIPT IN THE AREA OF.
(e.g. Finance/Marketing/HRM/General Management/Economics/Psychology/Law/Computer/IT/Engineering/Mathematics/other, please specify)
DEAR SIR/MADAM
Please find my submission of manuscript entitled ‘___________________________________________’ for possible publication in your journals.
I hereby affirm that the contents of this manuscript are original. Furthermore, it has neither been published elsewhere in any language fully or partly, nor is it
under review for publication elsewhere.
I affirm that all the author (s) have seen and agreed to the submitted version of the manuscript and their inclusion of name (s) as co-author (s).
Also, if my/our manuscript is accepted, I/We agree to comply with the formalities as given on the website of the journal & you are free to publish our
contribution in any of your journals.
NAME OF CORRESPONDING AUTHOR:
Designation:
Affiliation with full address, contact numbers & Pin Code:
Residential address with Pin Code:
Mobile Number (s):
Landline Number (s):
E-mail Address:
Alternate E-mail Address:
NOTES:
a) The whole manuscript is required to be in ONE MS WORD FILE only (pdf. version is liable to be rejected without any consideration), which will start from
the covering letter, inside the manuscript.
b) The sender is required to mentionthe following in the SUBJECT COLUMN of the mail:
New Manuscript for Review in the area of (Finance/Marketing/HRM/General Management/Economics/Psychology/Law/Computer/IT/
Engineering/Mathematics/other, please specify)
c) There is no need to give any text in the body of mail, except the cases where the author wishes to give any specific message w.r.t. to the manuscript.
d) The total size of the file containing the manuscript is required to be below 500 KB.
e) Abstract alone will not be considered for review, and the author is required to submit the complete manuscript in the first instance.
f) The journal gives acknowledgement w.r.t. the receipt of every email and in case of non-receipt of acknowledgment from the journal, w.r.t. the submission
of manuscript, within two days of submission, the corresponding author is required to demand for the same by sending separate mail to the journal.
2. MANUSCRIPT TITLE: The title of the paper should be in a 12 point Calibri Font. It should be bold typed, centered and fully capitalised.
3. AUTHOR NAME (S) & AFFILIATIONS: The author (s) full name, designation, affiliation (s), address, mobile/landline numbers, and email/alternate email
address should be in italic & 11-point Calibri Font. It must be centered underneath the title.
4. ABSTRACT: Abstract should be in fully italicized text, not exceeding 250 words. The abstract must be informative and explain the background, aims, methods,
results & conclusion in a single para. Abbreviations must be mentioned in full.

VOLUME NO. 3 (2013), I SSUE NO. 09 (SEPTEMBER ) ISSN 2231-5756
INTERNATIONAL JOURNAL OF RESEARCH IN COMMERCE, IT & MANAGEMENT A Monthly Double-Blind Peer Reviewed (Refereed/Juried) Open Access International e-Journal - Included in the International Serial Directories
http://ijrcm.org.in/
vi
5. KEYWORDS: Abstract must be followed by a list of keywords, subject to the maximum of five. These should be arranged in alphabetic order separated by
commas and full stops at the end.
6. MANUSCRIPT: Manuscript must be in BRITISH ENGLISH prepared on a standard A4 size PORTRAIT SETTING PAPER. It must be prepared on a single space and
single column with 1” margin set for top, bottom, left and right. It should be typed in 8 point Calibri Font with page numbers at the bottom and centre of every
page. It should be free from grammatical, spelling and punctuation errors and must be thoroughly edited.
7. HEADINGS: All the headings should be in a 10 point Calibri Font. These must be bold-faced, aligned left and fully capitalised. Leave a blank line before each
heading.
8. SUB-HEADINGS: All the sub-headings should be in a 8 point Calibri Font. These must be bold-faced, aligned left and fully capitalised.
9. MAIN TEXT: The main text should follow the following sequence:
INTRODUCTION
REVIEW OF LITERATURE
NEED/IMPORTANCE OF THE STUDY
STATEMENT OF THE PROBLEM
OBJECTIVES
HYPOTHESES
RESEARCH METHODOLOGY
RESULTS & DISCUSSION
FINDINGS
RECOMMENDATIONS/SUGGESTIONS
CONCLUSIONS
SCOPE FOR FURTHER RESEARCH
ACKNOWLEDGMENTS
REFERENCES
APPENDIX/ANNEXURE
It should be in a 8 point Calibri Font, single spaced and justified. The manuscript should preferably not exceed 5000 WORDS.
10. FIGURES &TABLES: These should be simple, crystal clear, centered, separately numbered & self explained, and titles must be above the table/figure. Sources
of data should be mentioned below the table/figure. It should be ensured that the tables/figures are referred to from the main text.
11. EQUATIONS:These should be consecutively numbered in parentheses, horizontally centered with equation number placed at the right.
12. REFERENCES: The list of all references should be alphabetically arranged. The author (s) should mention only the actually utilised references in the preparation
of manuscript and they are supposed to follow Harvard Style of Referencing. The author (s) are supposed to follow the references as per the following:
• All works cited in the text (including sources for tables and figures) should be listed alphabetically.
• Use (ed.) for one editor, and (ed.s) for multiple editors.
• When listing two or more works by one author, use --- (20xx), such as after Kohl (1997), use --- (2001), etc, in chronologically ascending order.
• Indicate (opening and closing) page numbers for articles in journals and for chapters in books.
• The title of books and journals should be in italics. Double quotation marks are used for titles of journal articles, book chapters, dissertations, reports, working
papers, unpublished material, etc.
• For titles in a language other than English, provide an English translation in parentheses.
• The location of endnotes within the text should be indicated by superscript numbers.
PLEASE USE THE FOLLOWING FOR STYLE AND PUNCTUATION IN REFERENCES:
BOOKS
• Bowersox, Donald J., Closs, David J., (1996), "Logistical Management." Tata McGraw, Hill, New Delhi.
• Hunker, H.L. and A.J. Wright (1963), "Factors of Industrial Location in Ohio" Ohio State University, Nigeria.
CONTRIBUTIONS TO BOOKS
• Sharma T., Kwatra, G. (2008) Effectiveness of Social Advertising: A Study of Selected Campaigns, Corporate Social Responsibility, Edited by David Crowther &
Nicholas Capaldi, Ashgate Research Companion to Corporate Social Responsibility, Chapter 15, pp 287-303.
JOURNAL AND OTHER ARTICLES
• Schemenner, R.W., Huber, J.C. and Cook, R.L. (1987), "Geographic Differences and the Location of New Manufacturing Facilities," Journal of Urban Economics,
Vol. 21, No. 1, pp. 83-104.
CONFERENCE PAPERS
• Garg, Sambhav (2011): "Business Ethics" Paper presented at the Annual International Conference for the All India Management Association, New Delhi, India,
19–22 June.
UNPUBLISHED DISSERTATIONS AND THESES
• Kumar S. (2011): "Customer Value: A Comparative Study of Rural and Urban Customers," Thesis, Kurukshetra University, Kurukshetra.
ONLINE RESOURCES
• Always indicate the date that the source was accessed, as online resources are frequently updated or removed.
WEBSITES
• Garg, Bhavet (2011): Towards a New Natural Gas Policy, Political Weekly, Viewed on January 01, 2012 http://epw.in/user/viewabstract.jsp

VOLUME NO. 3 (2013), I SSUE NO. 09 (SEPTEMBER ) ISSN 2231-5756
INTERNATIONAL JOURNAL OF RESEARCH IN COMMERCE, IT & MANAGEMENT A Monthly Double-Blind Peer Reviewed (Refereed/Juried) Open Access International e-Journal - Included in the International Serial Directories
http://ijrcm.org.in/
1
ADEQUACY OF KNOWLEDGE AND ATTITUDE TOWARDS INFORMATION TECHNOLOGY OF STUDENT
LIBRARY USERS AT SELECTED COLLEGES AND UNIVERSITIES IN CALABARZON, PHILIPPINES
DR. MA. LINDIE D. MASALINTO
CHIEF LIBRARIAN & PART TIME PROFESSOR
UNIVERSITY OF PERPETUAL HELP - DJGTMU
STO.NINO
DR. MA. CONSUELO M. OBILLO
DIRECTOR
INSTITUTE OF MEDICAL EDUCATION
UNIVERSITY OF PERPETUAL HELP - DJGTMU
STO.NINO
RUFO S CALIXTRO JR.
DIRECTOR
RESEARCH DEPARTMENT
UNIVERSITY OF PERPETUAL HELP - DJGTMU
STO.NINO
JOSEFA G. CARRILLO
DIRECTOR
EXTERNAL AFFAIRS OFFICE
UNIVERSITY OF PERPETUAL HELP - DJGTMU
STO.NINO
MA. XENIA Z. BITERA
DIRECTOR
RESEARCH DEPARTMENT
UNIVERSITY OF PERPETUAL HELP - DJGTMU
STO.NINO
ABSTRACT Technology plays a very vital role in almost aspect of life. In fact it has completely changed the way we live. There are many manual tasks that have been
automated, thanks to new and innovative technology. Modern day technology has the ability to carry out a wide range of critical and complex processes quite
efficiently. Just as technology has created an impact on almost all walks of life, it also has had a major impact in the field of education. In fact the impact of
information technology in education has been very positive, thereby leading to huge changes in the entire education industry for the better. The modern world
has reacted strongly to the fast pace of the advancement of science and technology which has affected the various dimensions of living and lifestyles. It has
likewise affected all types of organizations, the business, government, and most of all the school. In management operation, automation has taken place of clerks
and computers have pervaded all types of organization, and have become an inherent feature. Methods of operations, communications have been revised to suit
what are current of the times. Not only have lifestyles of people been affected with the use of cell phones as a mode for communication, it has also affected the
classroom processes including structure This study sought to answer the following questions: How adequate is the knowledge of personnel on IT? What are the
attitudes of student respondents towards the following: Technical knowledge of the computer, Capabilities of the computer, and Importance of the computer;
and To what extent are attitudes of the respondents significantly related to: knowledge of computer and demographic variables? Descriptive method and random
sampling was used in this study. The researchers utilized a quota samples of five hundred ( 500 ) student library users of selected colleges and universities in (
Cavite, Laguna, Batangas, Rizal and Quezon) CALABARZON during first semester of the school year 2012-2013, and focus only on attitudes of respondents in
terms of technical knowledge of computer, capabilities and importance. Descriptive method of research with the questionnaire as the main source of data.
Based on the results the importance of information technology to the respondents, showed positive attitudes, followed by the capabilities of the computer, but
attitudes were neutral on the technical knowledge of the computer. On relationship between attitudes with adequacy of knowledge of information technology in
its technical aspect, capabilities and importance was determined the summary of the values on such relationship with attitudes as the independent variables and
adequacy of knowledge as the criterion measures; technical aspect showed negligible but positive and direct relationship, technical knowledge of information
technology does not contribute much to attitudes towards information technology; Capabilities of the computer showed almost significant but very negligible
relationship which means that knowledge of computer does not contribute much to the attitudes of the students towards information technology and importance
of computers showed substantial and it was very significant which means that importance of the computers result in positive attitudes towards them.
KEYWORDS Information technology; knowledge, attitude - computer; Information Technology, Assessment.
INTRODUCTION echnology plays a very vital role in almost aspect of life. In fact it has completely changed the way we live. There are many manual tasks that have been
automated, thanks to new and innovative technology. Modern day technology has the ability to carry out a wide range of critical and complex processes
quite efficiently. Just as technology has created an impact on almost all walks of life, it also has had a major impact in the field of education. In fact the T

VOLUME NO. 3 (2013), I SSUE NO. 09 (SEPTEMBER ) ISSN 2231-5756
INTERNATIONAL JOURNAL OF RESEARCH IN COMMERCE, IT & MANAGEMENT A Monthly Double-Blind Peer Reviewed (Refereed/Juried) Open Access International e-Journal - Included in the International Serial Directories
http://ijrcm.org.in/
2
impact of information technology in education has been very positive, thereby leading to huge changes in the entire education industry for the better. With the
advent of computers and internet technology, the field of education has undergone a complete transformation. This shows that the relevance of information
technology in education is something that cannot be ignored. Consider this fact, the introduction of computers in education has made it very convenient for
teachers to provide knowledge to students in an easy to learn manner. The use of internet technology has made education an interactive process.
Technology adaptation theory was utilized in this study it is a theory of cycles. As technology alters the work environment, creating new routines and conditions,
new problems develop. Those who produce technology realize these problems and continually modify the technology in order to solve them. It is an ongoing
cycle of adjustment to the new reality that technology creates in all areas of life. The modern world has reacted strongly to the fast pace of the advancement of
science and technology which has affected the various dimensions of living and lifestyles. It has likewise affected all types of organizations, the business,
government, and most of all the school. In management operation, automation has taken place of clerks and computers have pervaded all types of organization,
and have become an inherent feature.
Faculty, students and researchers now frequent the library not only to pore over volumes of reference materials in the shelves, but to participate in a variety of
interactive concerns. These are provided by, among others, sound and video clips which supplement knowledge generated in the past by traditional mode. The
advent of internet technology has given rise to online education. Today, distance learning through online education has added a new dimension to education
and learning. There are plenty of schools and colleges offering online courses to students wherein students can submit their assignments and homework
through internet. In fact most online schools, colleges, and universities offer students the facility of making online submission of assignments. (Buenrostro, 2009)
According to Scheeren (2010). the future for library information systems includes the ongoing move to visual system with single-search capability with these
systems patrons will be able to enter a research questions on once screen in the return will be books from the collection, items from fee-based databases, and
vetted Web sites. Further, students will have had instructions in query formulation, so they will be able to create efficient searches. Another area for the future
library information system is that of digital libraries. Library information systems provide more search options for patrons than traditional card catalogs. Any
piece of data in the MARC record can be search by a modern library information system. Library system reduce the cost of providing catalog. While initial costs
are high, sustaining costs are lower than such labor-intense duties as typing and filing catalog cards. The study attempts to determine the relationship between
adequacy of knowledge of respondents who are library users of selected colleges and universities in CALABARZON and their attitudes if they are significantly
different or related to demographic variables.
METHODOLOGY This study sought to answer the following questions: What are the attitudes of student respondents towards the following: Technical knowledge of the
computer, Capabilities of the computer, and Importance of the computer; and To what extent are attitudes of the respondents significantly related to:
knowledge of computer and demographic variables? The researchers utilized a quota samples of five hundred ( 500 ) student library users of selected colleges
and universities in ( Cavite, Laguna, Batangas, Rizal and Quezon) CALABARZON, Philippines during first semester of the school year 2012-2013, and focus only on
attitudes of respondents in terms of technical knowledge of computer, capabilities and importance. Descriptive method of research was utilized in this study
with the questionnaire as the main source of data. The questionnaire was validated by members of the faculty of the University of Perpetual Help Laguna, who
were requested to go over the questionnaires and recommend suggestions for the improvement .For evaluation and scoring Likert Scale within a
continuum of five was used. Percentage, weighted and T-test was used for in-depth interpretation of the data. The primary sources of data were students in
selected colleges and universities in CALABARZON area.( UPHSL; UPH-DJGTMU; St. Michael’s College of Laguna; University of San Agustin and La Consolacion
College ). Through self-made questionnaires, the researchers acquired the needed information necessary for the study. The secondary sources of data were
acquired from books, journals, researches and internet. The researchers acquired permission from the management of selected colleges and universities prior to
the conduct of the study where the researchers personally direct the data gathering procedure .The data gathered were tallied, tabulated, and interpreted.
RESULTS 1. ADEQUACY OF KNOWLEDGE OF STUDENT ABOUT INFORMATION TECHNOLOGY
The knowledge of the student respondents were described in terms of their adequacy of information on the technical, capabilities and importance aspect. 1.1
Technical aspect, adequacy of knowledge of respondents were quite varied and fell in two ( 2 ) categories with the most of their responses saying that “they
were not sure” and some responses showing adequate knowledge about the technical aspect of IT. 1.2 Capabilities, weighted averages ranged from 3.55 to 3.90
identifying adequacy of knowledge in one category that is “adequate” as to the capabilities. 1.3 Importance, knowledge of the respondents on the importance
were reckoned as “ adequate and very adequate” as revealed by weighted average ranging from 4.10 to 4.92.
2. ATTITUDES OF STUDENTS TOWARDS INFORMATION TECHNOLOGY
2.1 Technical aspect, attitudes of students were neutral as indicated by weighted averages ranging from 3.19 to 3.48. An overall weighted mean of 3.32 revealed
that as a whole, their attitudes towards the technical aspect of computer were neutral. 2.2 Capabilities, responses of the group revealed receptively and
acceptance of the capabilities of the computers. An overall weighted mean of 4.33 revealed that they had positive attitudes towards capabilities of the
computers, which is part of information technology. 2.3 Attitudes, student responses were homogeneous and fell in one category, showing very positive
attitudes towards the importance of the computer as revealed by weighted means ranging from 4.50 to 4.85 indicated a very positive attitudes.
3. RELATIONSHIP OF ATTITUDES WITH ADEQUACY OF KNOWLEDGE ON INFORMATION TECHNOLOGY
The relationship between attitudes of respondents towards information technology was determined with adequacy of their knowledge of information
technology. 3.1 Technical aspect, the relationship between attitudes and the student knowledge was described by a computed correlation of 0.126 as negligible
but positive and direct. A computed T-value of 1.265 reckoned it however as not significant nor important. With this, technical knowledge of Information
Technology does not contribute much to the attitudes towards Information Technology. 3.2 Capabilities of the computers, the relationship between attitudes
and their knowledge of capabilities is described by a bigger correlation coefficient of 1.211 which was almost significant beyond the .05 level. However, a
computed T-value of 1.945 reckoned is not significant and bringing only 4.452 percent of variations with the relationship which is very negligible. Knowledge of
the capabilities does not contribute much to the attitudes towards information technology. 3.3 Importance of computers, the relationship between attitudes and
knowledge of the importance of computer was described by a computed correlation coefficient of 0.421 which was substantial. It was very significant beyond
the .01 level. Attitudes due to their knowledge of important result in positive attitudes towards them. Overall knowledge of information technology is described
by a computed correlation coefficient of 0.326 which is described as low but positive and direct. Amount of variations observable in attitudes due to knowledge
of information technology reached 10.63 percent which is quite large and reckons overall adequacy of knowledge of information technology as strong predictors
of attitudes.
4. RELATIONSHIP BETWEEN ATTITUDES TOWARDS INFORMATION TECHNOLOGY AND DEMOGRAPHIC VARIABLES
The relationship between attitudes towards information technology and demographic variables are age, gender, course enrolled in, time they spent in the
library and what part of the day they spend in the library. 4.1 Age, was significantly related to attitudes towards information technology as described by
computed correlation coefficient of 0.732 as low but positive and direct. It is significant beyond the .01 level. Amount of variations observable in attitude due to
the contribution of age reached 15.05 percent, which is quite large and reckons age as a strong predictor attitudes.4.2 Gender, relationship between gender and
attitudes was described by a computed correlation coefficient of 0.388, which is positive and direct and signifies low relationship. 4.3 Courses enrolled in,
relationship was described by a computed correlation coefficient of 0.443 which described the relationship as marked and substantial and also positive and
direct. It is also significant as reckoned by a computed t-value of 3.132. Course enrolled in is a strong predictor of attitudes towards information technology. 4.4
Time spent in the library, relationship was described by a computed correlation coefficient of 0.126, as negligible and also not significant by a computed t –value
of 0.891. Amount of variations observable in attitude is negligible and not strong predictor of attitudes towards information technology.

VOLUME NO. 3 (2013), I SSUE NO. 09 (SEPTEMBER ) ISSN 2231-5756
INTERNATIONAL JOURNAL OF RESEARCH IN COMMERCE, IT & MANAGEMENT A Monthly Double-Blind Peer Reviewed (Refereed/Juried) Open Access International e-Journal - Included in the International Serial Directories
http://ijrcm.org.in/
3
DISCUSSION Based on the results the importance of information technology to the respondents, showed positive attitudes, followed by the capabilities of the computer, but
attitudes were neutral on the technical knowledge of the computer. On relationship between attitudes with adequacy of knowledge of information technology
in its technical aspect, capabilities and importance was determined the summary of the values on such relationship with attitudes as the independent variables
and adequacy of knowledge as the criterion measures; technical aspect showed negligible but positive and direct relationship, technical knowledge of
information technology does not contribute much to attitudes towards information technology; Capabilities of the computer showed almost significant but very
negligible relationship which means that knowledge of computer does not contribute much to the attitudes of the students towards information technology and
importance of computers showed substantial and it was very significant which means that importance of the computers result in positive attitudes towards
them.
CONCLUSION In the light of the above findings of the study, the following conclusion can now be made. Respondents were in general young in their middle twenties, mostly
females, enrolled in Nursing, Engineering and Education. Students had more knowledge of the importance and capabilities of Information Technology than
technical knowledge. Age gender and course enrolled in were strong intervening variables of attitudes towards information technology. Technical aspect was
not indispensible in the use of computers, while their attitudes were neutral on technical aspect, they had positive attitudes in general to information
technology. Except time, most of the demographic variables were good predictors of knowledge and attitudes.
RECOMMENDATIONS In the light of the above results, the following recommendations are hereby given. More personal variables should be elicited from student so that information
would be known on what differences or similarities exists. There should be more promotional gimmicks from the library staff to encourage students to know
more about the technical aspects of the computer. More information should be found in bulletins that are attractive to students, so they would be encourage to
read more about computers. A series of lectures may be conducted by the library staff on the technical aspect of Information Technology. Ways and means
should be planned to encouraged other groups to develop positive attitudes towards Information Technology. Information should be given to the staff on the
strong predictors of both knowledge and attitudes. Information about adequacy of knowledge and attitudes should be given to staff and different colleges for
decision making.
REFERENCES BOOKS
1. Adanza, Estelia G. ( 2008 ) Methods of Research for the Health Profession. Quezon City: RexBookstore.
2. Buenrostro, Juan Jr. (2009). The Digital Library and other issues in Library and Information Science. Philippines: [s.n.].
3. Lamb, Annette, and Larry Johnson. (2007). InfoTech: An Info-Skills Workout: Wikis and Collaborative Writing. Lanham: Scarecrow.
4. Lamb, Annette, and Larry Johnson. (2007). InfoTech: Podcasting in the School Library, Part 1: Integrating Podcasts and Vodcasts into Teaching and Learning.
Lanham: Scarecrow.
5. McPherson, Keith. (2007). “Literacy Links: School Library Blogging.” In Toward a 21st Century School Media Program. Lanham: Scarecrow.
6. Scheeren, William O. (2010). Technology for School Librarian: theory and practice. USA: Libraries Unlimited.
7. Valenza, Joyce. (2007). “Something Wiki Comes This Way…Are you Ready?”. Lanham:Scarecrow.
8. Yadav, S.K (2007). Online Library Initiatives. New Delhi: Shree Publishers & Distributors.
THESIS
9. Alarcon,May Joy et al. “An Automated Library Monitoring System with Barcode and Networking.” Unpublished Undergraduate Thesis, University of
Perpetual Help System, Laguna, 2011.
10. Alora, Carolina B. 2001Information Technology Level of Awareness at La Consolacion College. La Consolacion Binan, Lagun
11. Alzona, Ma. Cecilia. “LAN Based UPHSL-Library System.” Unpublished Thesis, University of Perpetual Help System, Laguna, 2010.
12. Balmaceda, Jayson P. “Library Monitoring System-Immaculate Heart of Mary School.” Unpublished Thesis, University of Perpetual Help System, Laguna,
2005.
13. Hernandez, Michelle et al. “Engineering Library System.” Unpublished Undergraduate Thesis, University of Perpetual Help System, Laguna, 2005.
INTERNET
14. “ABCs of Web 2.0:Avatars Blogs, Collaborative Wikis: Blogs, Vlogs, Podcasts, and Web Feeds.” Eduscapes. http://eduscapes.com/sessions/abc/abc3.htm.
(2009)

VOLUME NO. 3 (2013), I SSUE NO. 09 (SEPTEMBER ) ISSN 2231-5756
INTERNATIONAL JOURNAL OF RESEARCH IN COMMERCE, IT & MANAGEMENT A Monthly Double-Blind Peer Reviewed (Refereed/Juried) Open Access International e-Journal - Included in the International Serial Directories
http://ijrcm.org.in/
4
MOBILITY IN HETEROGENEOUS WIRELESS NETWORK USING HMAC
C. SUGANTHI
ASST. PROFESSOR
DEPARTMENT OF INFORMATION TECHNOLOGY
V.M.K.V.ENGINEERING COLLEGE
SALEM
DR. C. MANOHARAN
PRINCIPAL
ANNAI MATHAMMAL SHEELA ENGINEERING COLLEGE
NAMAKKAL
ABSTRACT These NG wireless terminals must provide seamless access while roaming between different wireless networks. For a seamless integration, the mobile terminal
must be capable of accessing each network when needed. Each network structure performs resource allocation according to various techniques such as Time
Division Multiple Allocation (TDMA) slots, Code Division Multiple Allocation (CDMA) codes, and random allocation in order to achieve high network utilization in
accessing different networks. Therefore, to address the diverse Quality of Service (QoS) requirements, NG wireless terminals must be able to adapt to the
heterogeneous access schemes. To achieve this Hexagon based Medium Access Control (HMAC) Layer is proposed to model heterogeneous access schemes. Based
on this, HMAC provides architecture independent decision and guarantees QoS requirements. The six parameters are analyzed to evaluate the performance of the
heterogeneous wireless network. The simulation result shows that HMAC provides a seamless access, achieves high network utilization and guarantees QoS
requirement.
KEYWORDS Heterogeneous Wireless Network, Medium Access Control, Resource Allocation, and Seamless Access.
INTRODUCTION he next generation of wireless systems represents a heterogeneous environment with different access networks technologies that differ in bandwidth or
data rate. In this kind of environment, seamless access is the challenging issue that supports the roaming of users from one system to another.
Wireless communication, despite the hype of the popular press, is a field that has been around for over a hundred years, starting around 1897 with Marconi’s
successful demonstrations of wireless telegraphy. By 1901, radio reception across the Atlantic Ocean had been established; thus, rapid progress in technology
has also been around for quite a while. In the intervening hundred years, many types of wireless systems have flourished, and often later disappeared. For
example, television transmission, in its early days, was broadcast by wireless radio transmitters, which are increasingly being replaced by cable transmission.
Similarly, the point-to-point microwave circuits that formed the backbone of the telephone network are being replaced by optical fiber. In the first example,
wireless technology became outdated when a wired distribution network was installed; in the second, a new wired technology (optical fiber) replaced the older
technology. The opposite type of example is occurring today in telephony, where wireless (cellular) technology is partially replacing the use of the wired
telephone network (particularly in parts of the world where the wired network is not well developed) [1].
Many types of wireless communication systems exist, but a distinguishing attribute of a wireless network is that communication takes place between computer
devices. These devices include personal digital assistants (PDAs), laptops, personal computers (PCs), servers, and printers. As with networks based on wire, or
optical fiber, wireless networks convey information between computer devices. The information can take the form of e-mail messages, web pages, database
record, streaming video or voice. In most cases, wireless networks transfer data, such as e-mail messages and files, but advancements in the performance of
wireless network is enabling support for video and voice communications as well.
TYPES OF WIRELESS NETWORKS • WLANS: Wireless Local Area Networks
WLANS allow users in a local area, such as a university campus or library, to form a network or gain access to the internet. A temporary network can be formed
by a small number of users without the need of an access point; given that they do not need access to network resources.
• WPANS: Wireless Personal Area Networks
The two current technologies for wireless personal area networks are Infra Red (IR) and Bluetooth (IEEE 802.15). These will allow the connectivity of personal
devices within an area of about 30 feet. However, IR requires a direct line of site and the range is less.
• WMANS: Wireless Metropolitan Area Networks
This technology allows the connection of multiple networks in a metropolitan area such as different buildings in a city, which can be an alternative or backup to
laying copper or fiber cabling.
• WWANS: Wireless Wide Area Networks
These types of networks can be maintained over large areas, such as cities or countries, via multiple satellite systems or antenna sites looked after by an ISP.
These types of systems are referred to as 2G (2nd Generation) systems [3].
Today, growing consumer demand for access to communication services anywhere and anytime is accelerating the technological development towards the
integration of various wireless access technologies, nowadays called as Fourth Generation (4G) wireless systems. 4G wireless systems will provide significantly
higher data rates, offer a variety of services and applications previously not possible due to speed limitations, and allow global roaming among a diverse range of
mobile access networks.
REVIEW OF LITERATURE There exist several studies in the literature to address the integration of existing wireless system. In [12], Ad-hoc CEllular NETwork (ACENET) architecture for
3.5G and 4G mobile system is proposed. In which a heterogeneous MAC protocol is used to integrate IEEE 802.11, Bluetooth and HiperLAN/2 with cellular
architectures. The coordination between transmissions of different access protocols is provided using beacons from the base stations. ACENET consists of a
cellular network and ad hoc network. Even though ACENET improves the throughput performance, it needs many modifications in the base stations in order to
achieve this.
T

VOLUME NO. 3 (2013), I SSUE NO. 09 (SEPTEMBER ) ISSN 2231-5756
INTERNATIONAL JOURNAL OF RESEARCH IN COMMERCE, IT & MANAGEMENT A Monthly Double-Blind Peer Reviewed (Refereed/Juried) Open Access International e-Journal - Included in the International Serial Directories
http://ijrcm.org.in/
5
In [6], a dynamic access probability protocol has been proposed for cellular Internet and satellite-based networks. The network computes an access probability,
which depends on the load, and announces it, as a broadcast message, to the user. However, the QoS requirements of the application are not addressed.
A unified framework for the channel assignment problem in time, frequency, and code domains is proposed in [9]. The unified (T/F/C) DMA algorithm consists of
labelling and colouring phases. Using the graph theory solutions, channel assignment problems in heterogeneous network structures have been addressed.
A MAC protocol with Fair Packet Loss Sharing (FPLS) scheduling is proposed for fourth generation wireless multimedia communications in [4]. The MAC protocol
exploits both time-division and code division multiplexing. FPLS is a QoS requirement based packet scheduling algorithm. The main aim is to provide QoS
guarantees in terms of transmission delay, accuracy, and to maximize system resource utilization. The proposed MAC protocol is shown to provide QoS
guarantees in hybrid TD/CDMA systems. However, the proposed protocol necessitates a new wireless network infrastructure with new base stations for fourth
generation communications.
In [8], an integrated approach for the management of power and performance of mobile devices in heterogeneous wireless environments is developed. It
decides what wireless network interface (WNIC) to employ for a given application and how to optimize the WNIC usage. And it enhances the QoS by maximizing
the power savings in heterogeneous wireless systems. In [5], an Adaptive Medium Access Control (A-MAC) layer to address the heterogeneities posed by the NG
wireless networks is proposed.
A joint session admission control scheme for multimedia traffic is introduced in [13]. In which it maximizes the overall network revenue with good Quality of
Service (QoS). They integrate two different networks, a Wireless Local Area Network (WLAN) and a wideband Code Division Multiple Access Network (CDMA). A
novel concept of effective bandwidth is used in the CDMA network to derive the unified radio resource usage, taking into account both physical layer linear
minimum mean square errors (LMMSE) receivers and characteristics of the packet traffic. However, the integration requires modifications in the existing base
stations.
In [2], a new adaptive MAC based on OFDMA technology has been designed. In Wireless Local Area Network (WLAN), the existing Medium Access Control (MAC)
scheme lack scalability when the network is crowded. It is due to the use of random multiple access techniques in the MAC layer. It provides a new opportunity
for devising more efficient MAC protocols. Data transmission opportunities are assigned through an access point that can schedule traffic streams in both time
and frequency domains.
A radio resource allocation is proposed for a heterogeneous wireless access medium in [11]. A novel algorithm is developed for the resource allocation. The
coordination among different available wireless access networks base stations is established via the MT multiple radio interfaces in order to provide the required
bandwidth to each MT. A priority mechanism is employed, so that each network gives a higher priority on its resources to its own subscribers as compared to
other user. Numerical results demonstrate the validity of the proposed algorithm. The application of this framework requires major modifications in the NG
wireless network components.
Based on the above works, the existing proposals need a significant modification in the existing infrastructure and base stations or a completely new
architecture. The result is the integration problem, in terms of implementation costs, scalability and backward compatibility. The NG wireless networks are also
expected to provide diverse range of services. This diversity in the MAC layer guarantees Quality of Service requirements in wireless environments.
PROBLEM IDENTIFICATION The literature reviews presented above discussed listed several proposals which address the integration of existing wireless systems. However, the integration
requires modifications in the existing base stations or a new wireless network infrastructure with new base stations. Although it improves the throughput
performance over the existing networks, many modifications in the base stations are required to achieve this. These approaches lead to integration problems in
terms of implementation costs, scalability and backward compatibility. Few proposals concentrate only on integrating the existing wireless network but not on
the Quality of Service. Some proposals discuss the Quality of Service requirement in heterogeneous wireless network. Therefore, the problem is identified as
integration of existing wireless network, high network utilization and guarantees Quality of Service requirements.
METHODOLOGY The proposed work is a solution to the problems identified above. The solution is a new Hexagon based Adaptive Medium Access Control (HMAC) layer. The
proposed HMAC framework has three sub-layers for seamless access, resource utilization and QoS scheduling. This HMAC framework is deployed in the NG
wireless terminals of heterogeneous wireless network.
A. Hexagon based Medium Access Control
HMAC has three sub-layers. The Access sub-layer detects the available networks that the NG wireless terminal can access. The Decision sub-layer is responsible
for selecting a suitable resource from the available network. The Scheduling sub-layer provides a QoS-based scheduling.
B. Access sub-layer
The NG wireless terminal is equipped with multiple-mode radio capabilities. Recent developments in radio receiver and transmitter development have led the
way to mobile hand-held devices that are capable of functioning in multiple access technologies. The NG wireless terminals are capable of receiving signals from
multiple network access points and transmitting signals to different access schemes simultaneously.
The HMAC consists of Adaptive Network Interfaces (ANIs) which is responsible for accessing different resource schemes in the underlying heterogeneous
wireless networks. The MT communicates with different networks through ANIs. It monitors and records the parameters of various networks based on
bandwidth, usage charges and power consumption as in [7]. These parameters are expressed in terms of weight factors to calculate the access function as
follows:
∑=
=n
jjij
iaccess fwN
1,
10 << i
accessN (1)
∑=
=n
jjw
1
1 (2)
In the equation (1) and (2), n represent the numbers of parameters consider for calculating the Niaccess access function of network interface i. wj represent the
weight of jth
parameters. fi, j stands for the normalized score of interface i for jth
parameter.
C. Decision Sub-layer
The Decision sub-layer performs decision to choose a suitable interface to forward a specific traffic. The ANIs associated with each network discovers the
possible network from the available networks. The Received Signal Strength of the base station and velocity of the NG wireless terminals are used to select the
possible network. The decision algorithm is shown below:
Step 1: If the rssi is less than rssti then for all nj where j not equal to i
Step 2: Check whether rssi is greater than rssti and vi is less than vtj then
Step 3: Add the network nj to the possible network
Step 4: Calculate the difference rssdi between rssi and rssti
After selecting the possible network, a priority value is assigned to each possible network. Based on the decision function the ANIs selects a suitable network
interface. The decision function is calculated as follows:
PNN ivalue
iacces
idecision ∗=
(3)
VOLUME NO. 3 (2013), I SSUE NO. 09 (SEPTEMBER ) ISSN 2231-5756
INTERNATIONAL JOURNAL OF RESEARCH IN COMMERCE, IT & MANAGEMENT A Monthly Double-Blind Peer Reviewed (Refereed/Juried) Open Access International e-Journal - Included in the International Serial Directories
http://ijrcm.org.in/
6
In the equation (3), Niaccess is the access function calculated by access sub-layer using (1) and (2). P
ivalue is the priority value assigned to each possible network.
D. Scheduling Sub-layer
After the decision process calculation using (3), a QoS-based scheduler is used for each ANI in order to guarantee the QoS requirements of each flow.
Accordingly the scheduling is performed in the ANIs where multiple flows are directed.
To address the requirements of the scheduler in NG wireless terminals, we propose a Dynamic Time Slot scheduling algorithm based on the idea presented in
[10]. The scheduling algorithm is presented as follows.
• Dynamic Time Slot Scheduling Algorithm
The dynamic time slot scheduling is a frame based packet scheduler. Here, the time is slotted into frames of variable length. Each session makes a reservation in
terms of maximum traffic when it is allowed to transmit during a frame period. The reservation is made according to a session’s allocated rate. Each session is
assigned a weight in terms of number of bits or bytes. The algorithm is defined as follows:
Enqueue
Step 1: Assign arrived packet p to a flow index flowi
Step 2: Check whether the active list alisti is empty then
Step 3: Add the flow index flowi in the active list alisti
Step 4: Assign zero to the deficit counter dci
Step 5: Check for free buffers if not available then
Step 6: Free the buffer
Step 7: Enqueue the packet p to the queue qi
The Enqueue algorithm adds arrived packet in the queue. When the packet p arrives, a flow index flowi is assigned to the packet. Then the flow index flowi is
added in the active list alisti queue. If the active list alisti is full, then find a free buffer and add the flow index flowi with packet p in the queue.
Dequeue
Step 1: Check whether the active list alisti is not empty then
Step 2: Remove the flow index flowi from the active list alisti
Step 3: Add quantum value qtvi to the deficit counter dci
Step 4: Calculate the packet size pktsizei of the packet p in the queue qi
Step 5: If the packet size pktsizei is less than or equal to deficit counter dci
Step 6: Delete the flow index flowi from the queue qi
Step 7: Subtract the packet size pktsizei from the deficit counter dci
The Dequeue algorithm removes the flow index flowi from the queue qi. Then the quantum value qtvi is added to the deficit counter dci. The packet size pktsizei
is calculated from the queue qi. Then subtract the packet size pktsizei from the deficit counter dci and delete the head of the active list alisti.
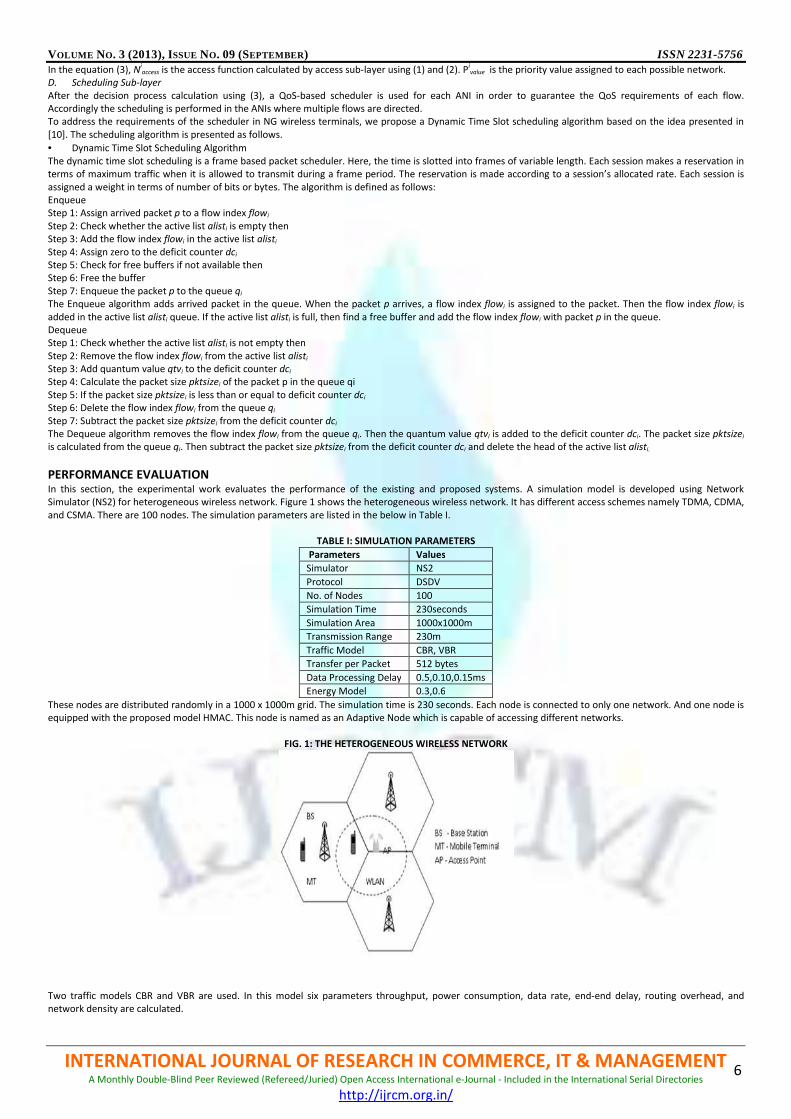
PERFORMANCE EVALUATION In this section, the experimental work evaluates the performance of the existing and proposed systems. A simulation model is developed using Network
Simulator (NS2) for heterogeneous wireless network. Figure 1 shows the heterogeneous wireless network. It has different access schemes namely TDMA, CDMA,
and CSMA. There are 100 nodes. The simulation parameters are listed in the below in Table I.
TABLE I: SIMULATION PARAMETERS
Parameters Values
Simulator NS2
Protocol DSDV
No. of Nodes 100
Simulation Time 230seconds
Simulation Area 1000x1000m
Transmission Range 230m
Traffic Model CBR, VBR
Transfer per Packet 512 bytes
Data Processing Delay 0.5,0.10,0.15ms
Energy Model 0.3,0.6
These nodes are distributed randomly in a 1000 x 1000m grid. The simulation time is 230 seconds. Each node is connected to only one network. And one node is
equipped with the proposed model HMAC. This node is named as an Adaptive Node which is capable of accessing different networks.
FIG. 1: THE HETEROGENEOUS WIRELESS NETWORK
Two traffic models CBR and VBR are used. In this model six parameters throughput, power consumption, data rate, end-end delay, routing overhead, and
network density are calculated.
VOLUME NO. 3 (2013), I SSUE NO. 09 (SEPTEMBER ) ISSN 2231-5756
INTERNATIONAL JOURNAL OF RESEARCH IN COMMERCE, IT & MANAGEMENT A Monthly Double-Blind Peer Reviewed (Refereed/Juried) Open Access International e-Journal - Included in the International Serial Directories
http://ijrcm.org.in/
7
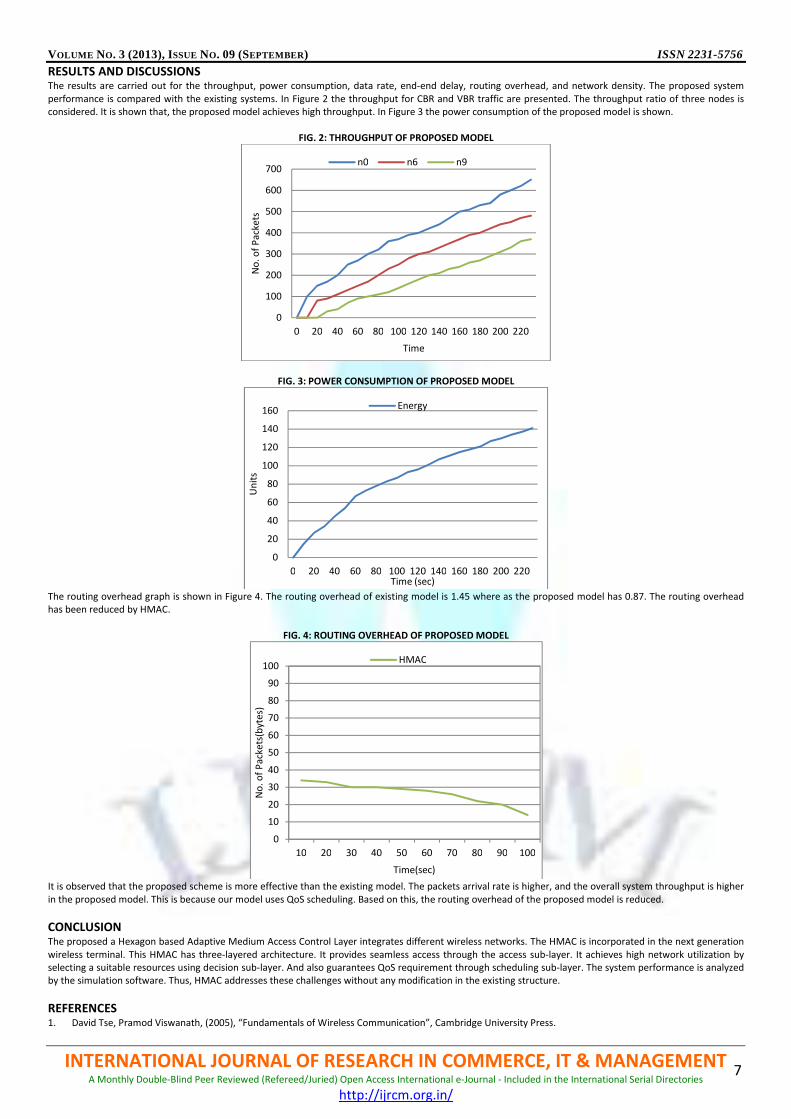
RESULTS AND DISCUSSIONS The results are carried out for the throughput, power consumption, data rate, end-end delay, routing overhead, and network density. The proposed system
performance is compared with the existing systems. In Figure 2 the throughput for CBR and VBR traffic are presented. The throughput ratio of three nodes is
considered. It is shown that, the proposed model achieves high throughput. In Figure 3 the power consumption of the proposed model is shown.
FIG. 2: THROUGHPUT OF PROPOSED MODEL
FIG. 3: POWER CONSUMPTION OF PROPOSED MODEL
The routing overhead graph is shown in Figure 4. The routing overhead of existing model is 1.45 where as the proposed model has 0.87. The routing overhead
has been reduced by HMAC.
FIG. 4: ROUTING OVERHEAD OF PROPOSED MODEL
It is observed that the proposed scheme is more effective than the existing model. The packets arrival rate is higher, and the overall system throughput is higher
in the proposed model. This is because our model uses QoS scheduling. Based on this, the routing overhead of the proposed model is reduced.
CONCLUSION The proposed a Hexagon based Adaptive Medium Access Control Layer integrates different wireless networks. The HMAC is incorporated in the next generation
wireless terminal. This HMAC has three-layered architecture. It provides seamless access through the access sub-layer. It achieves high network utilization by
selecting a suitable resources using decision sub-layer. And also guarantees QoS requirement through scheduling sub-layer. The system performance is analyzed
by the simulation software. Thus, HMAC addresses these challenges without any modification in the existing structure.
REFERENCES 1. David Tse, Pramod Viswanath, (2005), “Fundamentals of Wireless Communication”, Cambridge University Press.
0
100
200
300
400
500
600
700
0 20 40 60 80 100 120 140 160 180 200 220
No
. o
f P
ack
ets
Time
n0 n6 n9
0
20
40
60
80
100
120
140
160
0 20 40 60 80 100 120 140 160 180 200 220
Un
its
Time (sec)
Energy
0
10
20
30
40
50
60
70
80
90
100
10 20 30 40 50 60 70 80 90 100
No
. o
f P
ack
ets
(byt
es)
Time(sec)
HMAC
VOLUME NO. 3 (2013), I SSUE NO. 09 (SEPTEMBER ) ISSN 2231-5756
INTERNATIONAL JOURNAL OF RESEARCH IN COMMERCE, IT & MANAGEMENT A Monthly Double-Blind Peer Reviewed (Refereed/Juried) Open Access International e-Journal - Included in the International Serial Directories
http://ijrcm.org.in/
8
2. Fallah, Y.P., Khan, S., Nasiopoulos, P. and Alnuweiri, H.M. (2008), “Hybrid OFDMA/CSMA Based Medium Access Control for Next-Generation Wireless
LANs”, Proc. ICC, pp. 2762-2768.
3. Computer Networking, Viewed on 2012 http://computernetworkingnotes.com/wireless-networking-on-cisco-router/types-of-wireless-networks.html
4. Huang, V. and Zhuang, W. (2002) “QoS-Oriented access control for 4G multimedia CDMA communications”, IEEE Communication Magazine, Vol. 20, No.3,
pp. 118-125.
5. Mehmet Vuran, C. and Akyildiz Ian, F. (2007), “A-MAC: Adaptive Medium Access Control for Next Generation Wireless Terminals”, IEEE/ACM Transactions
on Networking, Vol. 15, No. 3, pp. 1-14.
6. Naor, Z. and Levy, H. (2001), “A centralized dynamic access probability protocol for next generation wireless networks”, Proceedings IEEE INFOCOM, Vol. 2,
pp. 767 -775.
7. Pramod Goyal and Saxena, S.K. (2008), “A Dynamic Decision Model for Vertical Handoffs across Heterogeneous Wireless Networks”, World Academy of
Science, Engineering and Technology, Vol. 31, pp. 677-682.
8. Qadeer W, Simunic T, Ankcorn J, Krishnan V, and De Micheli G. (2003), “ Heterogeneous wireless network management”, PACS 2003: San Diego, CA, USA,
pp. 86 – 100.
9. Ramanathan, S. (1997), “A unified framework and algorithm for (T/F/C) DMA channel assignment in wireless networks”, Proceedings IEEE INFOCOM, Vol. 2,
pp. 900-907.
10. Shreedhar, M. and Varghese, G. (1996), “Efficient Fair queuing using Deficit Round Robin”. IEEE/ACM Transactions on Networking, Vol. 4,
No. 3, pp. 375-385.
11. Wei Wang Xin Liu, Vicente, J, and Mohapatra, P. (2011), “Integration Gain of Heterogeneous WiFi/WiMAX Networks”, IEEE Transaction on Mobile
Computing, Vol. 10, No. 8, pp. 1131-1143.
12. Yeh, C.H. (2002), “ACENET: Architectures and protocols for high throughput, low power, and QoS provisioning in next-generation mobile communications”,
Proceedings IEEE PIMRC, Vol. 2, pp. 779 -786.
13. Yu, F. and Krishnamurthy, V. (2007), “Optimal joint session admission control in integrated wlan and cdma cellular networks with vertical handoff”, IEEE
Transaction on mobile computing, Vol. 6.

VOLUME NO. 3 (2013), I SSUE NO. 09 (SEPTEMBER ) ISSN 2231-5756
INTERNATIONAL JOURNAL OF RESEARCH IN COMMERCE, IT & MANAGEMENT A Monthly Double-Blind Peer Reviewed (Refereed/Juried) Open Access International e-Journal - Included in the International Serial Directories
http://ijrcm.org.in/
9
A STUDY ON CONSUMERS PERCEPTION TOWARDS THE PURCHASE DECISION OF TWO WHEELER
MOTORCYCLES IN NELLORE DISTRICT, ANDHRA PRADESH
D.V.RAMANA
HEAD
COLLEGE OF COMMERCE, MANAGEMENT & INFORMATION SCIENCES
S. V. UNIVERSITY
TIRUPATHI
DR. PARA SUBBAIAH
PROFESSOR & HEAD
DEPARTMENT OF MANAGEMENT
SSN COLLEGE OF ENGINEERING & TECHNOLOGY
ONGOLE
ABSTRACT Successful marketing requires that companies must fully relate themselves to their customers
and adopt a holistic marketing orientation towards their
consumers and should gain a 360 degree view of both their daily lives and the changes that occur during their lifetimes. Gaining a thorough in-depth consumer
understanding helps to ensure that the right products are marketed to the right customers in the right way. India is the second largest producer of two wheelers
in the world. It stands next only to Japan in terms of number of two-wheelers produced, with the entry of multinational players the competition in the two
wheeler segment is increasing. As a result customers are getting a wider choice of brands at different price slots and at high standards of quality. Under this
scenario this study explores individual consumer buying dynamics and consumer buying behavior of motorcycle users and allows the marketers to gain insights
into why individuals act in certain consumption related ways and with learning what internal and external influences compel them to act as they do. It will be
helpful to producers to design and redesign marketing strategies to influence consumption decision of buyer. The present study is undertaken to access the most
influencing factors of the motorcycle and its response over the respondents, and to understand their perceptions about different motorcycle brands in the market.
Analytical study was carried out by using a questionnaire and the collected data were analyzed by using percentage, factor and ANOVA. The study reveals that
Hero Honda is the most preferred brand followed by Bajaj. And it highlights that there is significant influence of demographic factors over the purchase decision
of customers.
KEYWORDS Buying Behavior, Factor analysis, Motivating factors. Purchase decision. Analysis of variance. Chi-square.
INTRODUCTION ith the liberalization, privatization and globalization of Indian economy and with the entry of many multinational players the competition in the two
wheeler segment is reaching summit. As a result customers are getting a wider choice of brands at different price slots and at high standards of
quality. Under this scenario understanding the consumer buying behavior of motorcycle users allows the marketers to gain insights into why
individuals act in certain consumption related ways and with learning what internal and external influences compel them to act as they do. So the study of
consumer buying behavior of motorcycles users will be helpful to producers to design and redesign marketing strategies to influence consumption decision of
buyer. At the same time it will be very useful to customers while making their purchase decision. The study of buying behavior of motor cycle users is felt
relevant in today’s changing market environment of two-wheelers. Because the two wheeler sales in the country have sky rocketed in the recent years and the
annual sales of motorcycles in India is expected to cross the 16 million mark by 2016 (FICCI, Arun Firodia, chairman (Kinetic Engineering), as there is low
penetration of two wheelers in the country at 68 two wheelers per 1000 citizens (2008). And India has 500 millions of middle class population waiting to buy two
wheelers, which leaves immense scope for growth of the market.
REVIEW OF LITERATURE The review of literature available on the consumer buyer behavior of two wheeler automobiles with main emphasis on motor bikes was carried out.
O’Brien1 (1987) examined in his study four factors namely demographic, personality, sources of message, and product class and their effect on information
handling. The products chosen for the study were cars and breakfast. It was found that the factors had varying effects on information handling; search initiation
had no effect which suggested that substantial number of consumers failed to engage in extensive search prior to purchase. But unlike previous search, his study
focused on incentives for information seeking for a given product, how much would a utility maximizing consumer with a given preference gain from search.
Hill (1987)2 made a study on the mood of consumer with the objectives of looking at the mood literature and its development thereof.
Ravichandran (1988)3, in his research work, examined information sources used, choice marking and discrimination between urban and semi-urban population
with reference to purchase of durable goods with 550 sample consumers from Chennai city and four other towns. The products chosen were refrigerators,
television, ceiling fans and domestic mixers. The findings revealed that urban consumers made use of commercial sources, and semi urban, personal sources.
They showed significant differences in the time taken for decision.
Sekar.S4.examined the “consumer values in product consumption patterns”, among the consumers in the city of Chennai (1995), the consumers for the purpose
of the study were classified into ‘higher income’, ‘middle income’ and ‘lower income’ groups. the results revealed that the product consumption patterns of
lower income group of consumers appeared to be more influenced by their “physical value” while that of the middle income group was more influenced by their
epistemic value and that of higher Income consumers were influenced by their “social values”, hence the author concluded that the product consumption
patterns of the three income groups differed to their value orientation.
Duncan and Olshavslay (1992)5
In a survey of 164 recent purchases of two wheelers showed that consumer beliefs about the market place and about their
capabilities as consumer accounted for 50 percent of the variance in extent of external search. The types of brand (domestic, foreign, or local) considered by a
consumer were found to be significantly related to the belief. The main objective of this research was to study the degree of relationship between market place
related beliefs and pre-purchase external information search behavior. The extent of external search for information exhibited by consumers prior to purchase
typically had been found to be very limited. In some cases little or no external search occurred.
W

VOLUME NO. 3 (2013), I SSUE NO. 09 (SEPTEMBER ) ISSN 2231-5756
INTERNATIONAL JOURNAL OF RESEARCH IN COMMERCE, IT & MANAGEMENT A Monthly Double-Blind Peer Reviewed (Refereed/Juried) Open Access International e-Journal - Included in the International Serial Directories
http://ijrcm.org.in/
10
IMPORTANCE OF THE STUDY India has become world number two in two wheeler manufacturing. Because two-wheeler is really a common man’s vehicle offering an affordable solution for
personal mobility and a status symbol. The two wheeler sales in the country have tremendously increased in the recent years and the annual sales of
motorcycles in India is expected to cross the 16 million mark (as per FICCI and SIAM) by 2016, leaves immense scope for the growth of the market. The two
wheeler population has gone up to over 70 millions (as per estimates of NCAER) still there is a big potential to be tapped. The two wheelers have penetrated 7%
of rural households and 24% of urban markets (NCAER), thus it leaves an immense scope for the market to grow in rural areas. With the opening up of rural
markets, improved road connectivity and higher disposable incomes one can expect excellent prospects for two wheelers in rural area.
STATEMENT OF THE PROBLEM Due to the stiff competition in the two wheeler segment customers have a wider choice in terms of number of brands, models and features at different price
slots, and all these transformed the expectations of the customers. Now the customers are expecting the manufacturers to provide the products as per their
tastes, preferences, habits, and lifestyles. The study of buying behavior of motorcycle users is more appropriate to today’s marketing environment because
customers are more conscious and particular about the products and services they want to have. If the firm/marketer fails to understand what their customers
want, the products launched by the firm will be rejected in the market. In order to improve the new product success rate and to ensure customer acceptance
one has to make an effort to learn everything what one could about their prospective customers regarding their needs, preferences, changing lifestyles, income
levels and their purchasing patterns.
OBJECTIVES OF THE STUDY 1. To identify the relationship between the current brand of motorcycle being used by respondents and demographic characteristics of consumers.
2. To analyze the factors/attributes influencing the purchase decision of motor cycle users while making the purchase decision.
HYPOTHESES 1. There is no significant relationship between age, annual income, occupation and education and the current brand being used.
2. There is no significant variation in attributes of motorcycle in influencing the purchase decision of the respondent.
RESEARCH METHODOLOGY The study is descriptive in nature. The researcher used a structured schedule to collect data from the respondents. Convenience sampling method is used.
Respondents are divided into three parts consisting of three revenue divisions.
SAMPLING DESIGN AND STATISTICAL TOOLS The study was confined to Nellore District in Andhra Pradesh. The sample consists of 252 customers, Convenience sampling was used. The study was conducted
during the month of May-July 2012. The collected data were tabulated and analyzed by using percentage, factor analysis and ANOVA.
DATA ANALYSIS AND INTERPRETATION The data collected from the respondents were systematically analyzed and presented under the following heads
Part A: Demographic profile of the respondents is provided.
Part B: Influence of the demographic factors over the purchase decision of the consumers is presented, and most influencing attributes of the motorcycle over
the purchase decision of customer are analyzed.
Part A: Demographic profile of the respondents
TABLE 01: DEMOGRAPHIC PROFILE OF THE RESPONDENTS
Age of Respondents Percentage Education Percentage Occupation Percentage
Below--26 27.8 Up to tenth 10.70 Student 19.0
26---35 40.5 Intermediate 16.67 Business 22.2
36---45 20.2 Degree 35.31 Private employee 46.8
Above 45 11.5 Post Graduation 28.57 Government employee 7.1
Total 100.0 Others 8.70 Agriculture 2.0
Total 100.0 Professional 2.8
Total 100.0
Gender percentage Income (Rs/month) Percentage Marital Status Percentage
Male 98.0 Below-- 10,000 21.0 Married 57.9
Female 2.0 10,001--20,000 35.3 Unmarried 42.1
Total 100.0 20,001--30,000 22.2 Total 100.0
Above 30,000 2.4
No income 19.0
Total 100.0
From the above table it is observed that there are 60.7% of the respondents between 26-45 years old. 63.88% of the respondents are graduates, 27.37% are
under graduates. 46.8 % of the respondent are private employees, and 22.2% are business people.57.5% of the respondents’ income is between Rs 10,000 to
30,000. 47.9% respondents are married and remaining is unmarried.98% of the respondents are male.
PREFERENCE OF CURRENT BRAND (i.e. BRAND BEING USED) OF MOTORCYCLE
The study also intended to know what is current brand used by the respondent and the demographic factors influence over the choice of the current brand.
TABLE 02: PREFERENCE OF CURRENT BRAND OF MOTORCYCLE
Brand No. of. Respondents Percentage
Hero Honda 104 41.26
Bajaj 74 29.36
TVS 37 14.68
Yamaha 16 6.34
Honda 13 5.15
Suzuki 6 2.32
LML 1 0.39
Bullet 1 0.39
Total 252 100.0
Source: primary data
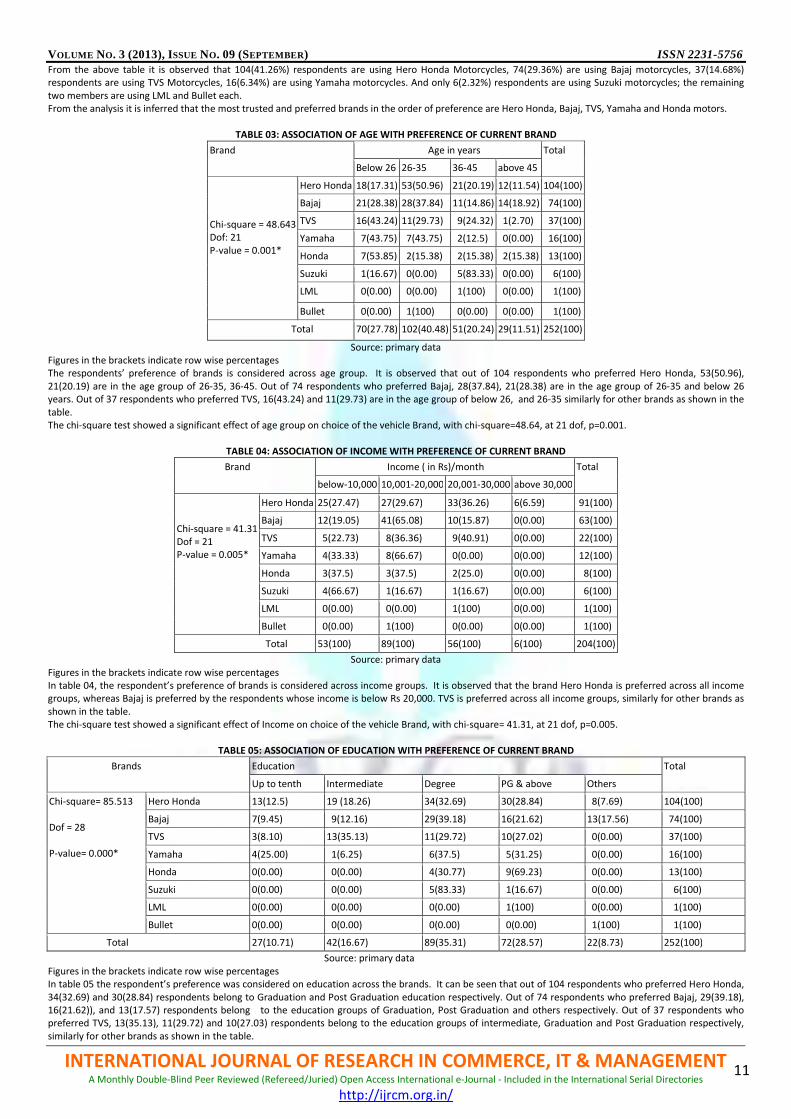
VOLUME NO. 3 (2013), I SSUE NO. 09 (SEPTEMBER ) ISSN 2231-5756
INTERNATIONAL JOURNAL OF RESEARCH IN COMMERCE, IT & MANAGEMENT A Monthly Double-Blind Peer Reviewed (Refereed/Juried) Open Access International e-Journal - Included in the International Serial Directories
http://ijrcm.org.in/
11
From the above table it is observed that 104(41.26%) respondents are using Hero Honda Motorcycles, 74(29.36%) are using Bajaj motorcycles, 37(14.68%)
respondents are using TVS Motorcycles, 16(6.34%) are using Yamaha motorcycles. And only 6(2.32%) respondents are using Suzuki motorcycles; the remaining
two members are using LML and Bullet each.
From the analysis it is inferred that the most trusted and preferred brands in the order of preference are Hero Honda, Bajaj, TVS, Yamaha and Honda motors.
TABLE 03: ASSOCIATION OF AGE WITH PREFERENCE OF CURRENT BRAND
Brand
Age in years Total
Below 26 26-35 36-45 above 45
Chi-square = 48.643
Dof: 21
P-value = 0.001*
Hero Honda 18(17.31) 53(50.96) 21(20.19) 12(11.54) 104(100)
Bajaj 21(28.38) 28(37.84) 11(14.86) 14(18.92) 74(100)
TVS 16(43.24) 11(29.73) 9(24.32) 1(2.70) 37(100)
Yamaha 7(43.75) 7(43.75) 2(12.5) 0(0.00) 16(100)
Honda 7(53.85) 2(15.38) 2(15.38) 2(15.38) 13(100)
Suzuki 1(16.67) 0(0.00) 5(83.33) 0(0.00) 6(100)
LML 0(0.00) 0(0.00) 1(100) 0(0.00) 1(100)
Bullet 0(0.00) 1(100) 0(0.00) 0(0.00) 1(100)
Total 70(27.78) 102(40.48) 51(20.24) 29(11.51) 252(100)
Source: primary data
Figures in the brackets indicate row wise percentages
The respondents’ preference of brands is considered across age group. It is observed that out of 104 respondents who preferred Hero Honda, 53(50.96),
21(20.19) are in the age group of 26-35, 36-45. Out of 74 respondents who preferred Bajaj, 28(37.84), 21(28.38) are in the age group of 26-35 and below 26
years. Out of 37 respondents who preferred TVS, 16(43.24) and 11(29.73) are in the age group of below 26, and 26-35 similarly for other brands as shown in the
table.
The chi-square test showed a significant effect of age group on choice of the vehicle Brand, with chi-square=48.64, at 21 dof, p=0.001.
TABLE 04: ASSOCIATION OF INCOME WITH PREFERENCE OF CURRENT BRAND
Brand Income ( in Rs)/month Total
below-10,000 10,001-20,000 20,001-30,000 above 30,000
Chi-square = 41.31
Dof = 21
P-value = 0.005*
Hero Honda 25(27.47) 27(29.67) 33(36.26) 6(6.59) 91(100)
Bajaj 12(19.05) 41(65.08) 10(15.87) 0(0.00) 63(100)
TVS 5(22.73) 8(36.36) 9(40.91) 0(0.00) 22(100)
Yamaha 4(33.33) 8(66.67) 0(0.00) 0(0.00) 12(100)
Honda 3(37.5) 3(37.5) 2(25.0) 0(0.00) 8(100)
Suzuki 4(66.67) 1(16.67) 1(16.67) 0(0.00) 6(100)
LML 0(0.00) 0(0.00) 1(100) 0(0.00) 1(100)
Bullet 0(0.00) 1(100) 0(0.00) 0(0.00) 1(100)
Total 53(100) 89(100) 56(100) 6(100) 204(100)
Source: primary data
Figures in the brackets indicate row wise percentages
In table 04, the respondent’s preference of brands is considered across income groups. It is observed that the brand Hero Honda is preferred across all income
groups, whereas Bajaj is preferred by the respondents whose income is below Rs 20,000. TVS is preferred across all income groups, similarly for other brands as
shown in the table.
The chi-square test showed a significant effect of Income on choice of the vehicle Brand, with chi-square= 41.31, at 21 dof, p=0.005.
TABLE 05: ASSOCIATION OF EDUCATION WITH PREFERENCE OF CURRENT BRAND
Brands Education Total
Up to tenth Intermediate Degree PG & above Others
Chi-square= 85.513
Dof = 28
P-value= 0.000*
Hero Honda 13(12.5) 19 (18.26) 34(32.69) 30(28.84) 8(7.69) 104(100)
Bajaj 7(9.45) 9(12.16) 29(39.18) 16(21.62) 13(17.56) 74(100)
TVS 3(8.10) 13(35.13) 11(29.72) 10(27.02) 0(0.00) 37(100)
Yamaha 4(25.00) 1(6.25) 6(37.5) 5(31.25) 0(0.00) 16(100)
Honda 0(0.00) 0(0.00) 4(30.77) 9(69.23) 0(0.00) 13(100)
Suzuki 0(0.00) 0(0.00) 5(83.33) 1(16.67) 0(0.00) 6(100)
LML 0(0.00) 0(0.00) 0(0.00) 1(100) 0(0.00) 1(100)
Bullet 0(0.00) 0(0.00) 0(0.00) 0(0.00) 1(100) 1(100)
Total 27(10.71) 42(16.67) 89(35.31) 72(28.57) 22(8.73) 252(100)
Source: primary data
Figures in the brackets indicate row wise percentages
In table 05 the respondent’s preference was considered on education across the brands. It can be seen that out of 104 respondents who preferred Hero Honda,
34(32.69) and 30(28.84) respondents belong to Graduation and Post Graduation education respectively. Out of 74 respondents who preferred Bajaj, 29(39.18),
16(21.62)), and 13(17.57) respondents belong to the education groups of Graduation, Post Graduation and others respectively. Out of 37 respondents who
preferred TVS, 13(35.13), 11(29.72) and 10(27.03) respondents belong to the education groups of intermediate, Graduation and Post Graduation respectively,
similarly for other brands as shown in the table.
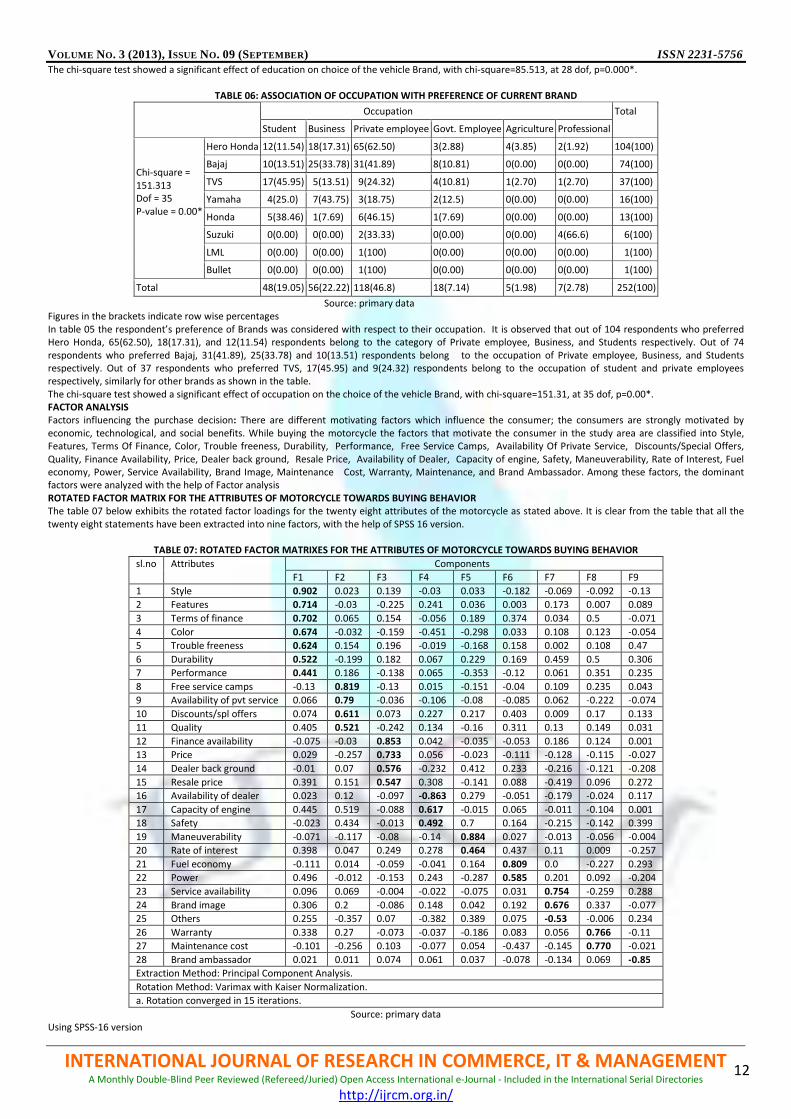
VOLUME NO. 3 (2013), I SSUE NO. 09 (SEPTEMBER ) ISSN 2231-5756
INTERNATIONAL JOURNAL OF RESEARCH IN COMMERCE, IT & MANAGEMENT A Monthly Double-Blind Peer Reviewed (Refereed/Juried) Open Access International e-Journal - Included in the International Serial Directories
http://ijrcm.org.in/
12
The chi-square test showed a significant effect of education on choice of the vehicle Brand, with chi-square=85.513, at 28 dof, p=0.000*.
TABLE 06: ASSOCIATION OF OCCUPATION WITH PREFERENCE OF CURRENT BRAND
Occupation Total
Student Business Private employee Govt. Employee Agriculture Professional
Chi-square =
151.313
Dof = 35
P-value = 0.00*
Hero Honda 12(11.54) 18(17.31) 65(62.50) 3(2.88) 4(3.85) 2(1.92) 104(100)
Bajaj 10(13.51) 25(33.78) 31(41.89) 8(10.81) 0(0.00) 0(0.00) 74(100)
TVS 17(45.95) 5(13.51) 9(24.32) 4(10.81) 1(2.70) 1(2.70) 37(100)
Yamaha 4(25.0) 7(43.75) 3(18.75) 2(12.5) 0(0.00) 0(0.00) 16(100)
Honda 5(38.46) 1(7.69) 6(46.15) 1(7.69) 0(0.00) 0(0.00) 13(100)
Suzuki 0(0.00) 0(0.00) 2(33.33) 0(0.00) 0(0.00) 4(66.6) 6(100)
LML 0(0.00) 0(0.00) 1(100) 0(0.00) 0(0.00) 0(0.00) 1(100)
Bullet 0(0.00) 0(0.00) 1(100) 0(0.00) 0(0.00) 0(0.00) 1(100)
Total 48(19.05) 56(22.22) 118(46.8) 18(7.14) 5(1.98) 7(2.78) 252(100)
Source: primary data
Figures in the brackets indicate row wise percentages
In table 05 the respondent’s preference of Brands was considered with respect to their occupation. It is observed that out of 104 respondents who preferred
Hero Honda, 65(62.50), 18(17.31), and 12(11.54) respondents belong to the category of Private employee, Business, and Students respectively. Out of 74
respondents who preferred Bajaj, 31(41.89), 25(33.78) and 10(13.51) respondents belong to the occupation of Private employee, Business, and Students
respectively. Out of 37 respondents who preferred TVS, 17(45.95) and 9(24.32) respondents belong to the occupation of student and private employees
respectively, similarly for other brands as shown in the table.
The chi-square test showed a significant effect of occupation on the choice of the vehicle Brand, with chi-square=151.31, at 35 dof, p=0.00*.
FACTOR ANALYSIS
Factors influencing the purchase decision: There are different motivating factors which influence the consumer; the consumers are strongly motivated by
economic, technological, and social benefits. While buying the motorcycle the factors that motivate the consumer in the study area are classified into Style,
Features, Terms Of Finance, Color, Trouble freeness, Durability, Performance, Free Service Camps, Availability Of Private Service, Discounts/Special Offers,
Quality, Finance Availability, Price, Dealer back ground, Resale Price, Availability of Dealer, Capacity of engine, Safety, Maneuverability, Rate of Interest, Fuel
economy, Power, Service Availability, Brand Image, Maintenance Cost, Warranty, Maintenance, and Brand Ambassador. Among these factors, the dominant
factors were analyzed with the help of Factor analysis
ROTATED FACTOR MATRIX FOR THE ATTRIBUTES OF MOTORCYCLE TOWARDS BUYING BEHAVIOR
The table 07 below exhibits the rotated factor loadings for the twenty eight attributes of the motorcycle as stated above. It is clear from the table that all the
twenty eight statements have been extracted into nine factors, with the help of SPSS 16 version.
TABLE 07: ROTATED FACTOR MATRIXES FOR THE ATTRIBUTES OF MOTORCYCLE TOWARDS BUYING BEHAVIOR
sl.no Attributes Components
F1 F2 F3 F4 F5 F6 F7 F8 F9
1 Style 0.902 0.023 0.139 -0.03 0.033 -0.182 -0.069 -0.092 -0.13
2 Features 0.714 -0.03 -0.225 0.241 0.036 0.003 0.173 0.007 0.089
3 Terms of finance 0.702 0.065 0.154 -0.056 0.189 0.374 0.034 0.5 -0.071
4 Color 0.674 -0.032 -0.159 -0.451 -0.298 0.033 0.108 0.123 -0.054
5 Trouble freeness 0.624 0.154 0.196 -0.019 -0.168 0.158 0.002 0.108 0.47
6 Durability 0.522 -0.199 0.182 0.067 0.229 0.169 0.459 0.5 0.306
7 Performance 0.441 0.186 -0.138 0.065 -0.353 -0.12 0.061 0.351 0.235
8 Free service camps -0.13 0.819 -0.13 0.015 -0.151 -0.04 0.109 0.235 0.043
9 Availability of pvt service 0.066 0.79 -0.036 -0.106 -0.08 -0.085 0.062 -0.222 -0.074
10 Discounts/spl offers 0.074 0.611 0.073 0.227 0.217 0.403 0.009 0.17 0.133
11 Quality 0.405 0.521 -0.242 0.134 -0.16 0.311 0.13 0.149 0.031
12 Finance availability -0.075 -0.03 0.853 0.042 -0.035 -0.053 0.186 0.124 0.001
13 Price 0.029 -0.257 0.733 0.056 -0.023 -0.111 -0.128 -0.115 -0.027
14 Dealer back ground -0.01 0.07 0.576 -0.232 0.412 0.233 -0.216 -0.121 -0.208
15 Resale price 0.391 0.151 0.547 0.308 -0.141 0.088 -0.419 0.096 0.272
16 Availability of dealer 0.023 0.12 -0.097 -0.863 0.279 -0.051 -0.179 -0.024 0.117
17 Capacity of engine 0.445 0.519 -0.088 0.617 -0.015 0.065 -0.011 -0.104 0.001
18 Safety -0.023 0.434 -0.013 0.492 0.7 0.164 -0.215 -0.142 0.399
19 Maneuverability -0.071 -0.117 -0.08 -0.14 0.884 0.027 -0.013 -0.056 -0.004
20 Rate of interest 0.398 0.047 0.249 0.278 0.464 0.437 0.11 0.009 -0.257
21 Fuel economy -0.111 0.014 -0.059 -0.041 0.164 0.809 0.0 -0.227 0.293
22 Power 0.496 -0.012 -0.153 0.243 -0.287 0.585 0.201 0.092 -0.204
23 Service availability 0.096 0.069 -0.004 -0.022 -0.075 0.031 0.754 -0.259 0.288
24 Brand image 0.306 0.2 -0.086 0.148 0.042 0.192 0.676 0.337 -0.077
25 Others 0.255 -0.357 0.07 -0.382 0.389 0.075 -0.53 -0.006 0.234
26 Warranty 0.338 0.27 -0.073 -0.037 -0.186 0.083 0.056 0.766 -0.11
27 Maintenance cost -0.101 -0.256 0.103 -0.077 0.054 -0.437 -0.145 0.770 -0.021
28 Brand ambassador 0.021 0.011 0.074 0.061 0.037 -0.078 -0.134 0.069 -0.85
Extraction Method: Principal Component Analysis.
Rotation Method: Varimax with Kaiser Normalization.
a. Rotation converged in 15 iterations.
Source: primary data
Using SPSS-16 version

VOLUME NO. 3 (2013), I SSUE NO. 09 (SEPTEMBER ) ISSN 2231-5756
INTERNATIONAL JOURNAL OF RESEARCH IN COMMERCE, IT & MANAGEMENT A Monthly Double-Blind Peer Reviewed (Refereed/Juried) Open Access International e-Journal - Included in the International Serial Directories
http://ijrcm.org.in/
13
The rotated factor matrix, for the buying decision factors or attributes of motorcycle towards buying behavior is given in the results.
RESULTS AND DISCUSSION Hypothesis 1: There is no significant relationship between age, annual income, occupation and education and the current brand being used.
TABLE 08: SUMMARY OF ASSOCIATION BETWEEN THE BRAND BEING USED AND DEMOGRAPHIC FACTORS (CHI-SQUARE TEST @ 5% LEVEL)
Sl. No Factors Statistical values Result
Chi-square Dof p-value
1 Age 48.64 21 0.001* Significant
2 Income 41.31 21 0.005* Significant
3 Education 85.51 28 0.000* Significant
4 Occupation 151.31 35 0.00* Significant
Inference: As seen from the above table the influence of demographic factors over the choice of brand being used is significant with respect to Age, Income,
Education, and Occupation at 5% level with the Chi-Square values as mentioned in the above table. So, it can be concluded that Age, Income, Education, and
Occupation have impact over the choice of brand that is being used by the respondent.
FACTORS CONSIDERED IN BUYING DECISION OF A MOTORCYCLE
Factor analysis of 28 attributes relating to the buying behavior of motorcycle users were identified into nine factors and these factors are presented in the
following table.
TABLE 09: BUYING DECISION FACTORS FOR MOTORCYCLE
Sl.No Factors Eigen value Percentage of variance Cumulative percentage of variance
1 Style 5.861 20.932 20.932
2 Promotional offers 3.389 12.102 33.035
3 Price 2.855 10.195 43.230
4 Capacity Of engine 2.244 8.014 51.244
5 Maneuverability 1.913 6.832 58.076
6 Fuel economy 1.744 6.227 64.303
7 Service Availability 1.466 5.234 69.537
8 Maintenance Cost 1.237 4.420 73.957
9 Brand Ambassador 1.014 3.623 77.580
KMO and Bartlett's Test
Kaiser-Meyer-Olkin Measure of Sampling Adequacy. .306
Bartlett's Test of Sphericity Approx. Chi-Square 4313.104
Dof 378
Significance. .000
It is observed from the above table that the nine factors such as Style, Promotional offers, Price, Capacity of engine, Maneuverability, Fuel economy, Service
Availability, Maintenance Cost, and Brand Ambassador were extracted from a total of 28 attributes. These factors account for about 77.580 percent of variance
in the data. Eigen value for the first factor style is 5.861 which indicates that the factor contains very high information than others factors. The first factor, Style
provides the maximum insights of buying decision of motorcycle users in the study area. It is very important factor, because the respondents prefer to buy the
motorcycle which is stylish in look. To improve on these attribute, manufacturers of the two wheeler industry must concentrate on this aspect and give top
priority to this factor.
The second important factor called Promotional offers, this include price/cash discounts, gifts, free accessories, extended warranty and free checkups, with
3.389 Eigen value and account for 12.102 percent variance. It explains that people chose to buy motorcycle if it posses the attribute of promotional offers. The
third and fourth factors are Price and Capacity of engine account for 10.195 and 8.014 percent of variance with the Eigen values of 2.855 and 2.244 respectively.
It indicates that price and capacity of engine are the next most important factors which govern the purchase decision. Buyers are giving importance to these
factors while buying the motorcycle.
The fifth and sixth factors are called Maneuverability and Fuel economy, account for 6.832 and 6.227 percent of variance with the Eigen values 1.913 and 1.744
indicating that Maneuverability (ease of ride comfort in negotiating curves) and fuel economy (mileage) are simultaneously important for the user of the
motorcycle. The seventh, eighth and ninth factors are called Service Availability, Maintenance Cost and Brand Ambassador with 5.234, 4.420 and 3.623
percent of variance respectively. The Eigen values for the factors are 1.466, 1.237 and 1.014 respectively. These factors are also important in buyer decision
making.
High value of Kaiser-Mayer-Olkin (KMO) and Bartlett's measure of sampling adequacy (0.306) indicates the correlation between the pairs of variables explained
by other variables and thus factor analysis is considered to be appropriate in this model.
Hypothesis 2: There is no significant variation in the attributes of motorcycle in influencing the purchase decision of the respondent.
Inference: From the analysis of table 09 it is clear that the significance of various attributes of motorcycle varies from person to person as seen in their Eigen
values. Bartlett’s test of Sphericity with 378 degree of freedom gives rise to a chi-square value of 4313.104, and the value is significant at 5% level. Therefore the
degree of priority given by the respondents to various attributes of motorcycle varies.
FINDINGS 1) Demographic factors showed an impact over the purchase decision of the motorcycle users
2) 153(60.72%) Respondents are in the age group of 26-45 years, 104 respondents bought Hero Honda and 74 bought Bajaj motorcycles, and 32 bought TVS
motorcycles. (Results showed that Hero Honda and Bajaj are the most preferred brands.)
3) There are 145(71%) respondents whose income level is between Rs10, 001 to 30,000.
4) Respondents who are graduates and post graduates are 161(63.8%), below intermediate are 69(27.3%).
5) 118(46.82%) respondents are private employees, 56(22.22%) are business people, 48(19.04%) are students, and 18(7.14%) are government employees.
6) Factor analysis reduced the 28 factors into 9 factors, which are considered to be the most influential factors of purchase decision of the buyer viz; Style,
Promotional offers, Price, Capacity Of engine, Maneuverability, Fuel economy, Service Availability, Maintenance Cost, Brand Ambassador.
RECOMMENDATIONS/SUGGESTIONS 1. Through the research it is evident that consumers prefer Hero Honda, Bajaj and TVS motors.
2. Marketers should concentrate more on the age group of 26-45 years, because this age group is the most influencing age group while making the purchase
decision of motorcycles.
3. Respondents whose income per month is above Rs 10,000/ and below 30,000/ are the target group for motor cycle purchase so focus more on this.

VOLUME NO. 3 (2013), I SSUE NO. 09 (SEPTEMBER ) ISSN 2231-5756
INTERNATIONAL JOURNAL OF RESEARCH IN COMMERCE, IT & MANAGEMENT A Monthly Double-Blind Peer Reviewed (Refereed/Juried) Open Access International e-Journal - Included in the International Serial Directories
http://ijrcm.org.in/
14
4. Private employees and business people are the major target group for purchasing the motorcycle; hence more focus is required on this group.
5. Nine most influencing factors are found in the study by reducing the 28 factors. Therefore marketers should focus on these factors to influence the
customer purchase decision.
CONCLUSION From the Chi-Square test it is evident that demographic factors of the motorcycle buyers showed influence over the purchase decision of motorcycle, also it is
evident that consumers are not giving equal priority to all the product attributes. Therefore producers and marketers should pay more attention on those
factors which connect to the buyer and influence their purchase decision, consumers give importance to Style, Promotional offers, Price, Capacity Of engine,
Maneuverability, Fuel economy, Service Availability, Maintenance Cost, Brand Ambassador.
SCOPE FOR FURTHER RESEARCH The present study gives scope for further research in the area of promotion and promotional offers, what are more attractive to customers. Next one can focus
on the finance schemes attractive for customers and mode of purchase customer’s prefer to buy the vehicle and what is the kind of finance pattern does the
buyer like. Also the occasion on which buyers like to buy the vehicle can become scope for further research.
REFERENCES 1. Calvin P. Duncan and Olshavsky, External Search, the Role of Consumer Beliefs, Journal of Marketing Science, Vo. XIX, February, 1992. Pp.32-43.
2. http://www.siam.com.
3. Loudon David and AlbertJ. Della Bitta, “Consumer Behavior-Concepts and Applications” 3rd Edn; New York, McGraw-Hill International, 1998.
4. Majumdar, Ramanuj, (1991), “Marketing Research: Text, Applications and Case Studies”, Wiley Easten Limited, New Delhi.
5. Nishar Ahamad N. “Factors Determining Purchase and Post-purchase Behavior of Two Wheeler Users”, Published PhD dissertation, 1997, Department of
Commerce, University of Madras, India.
6. Ravichandran.M. (1988). “Consumer perceptions and purchase Decisions”. A study of Urban and semi urban consumers of durable goods. Unpublished PhD
Dissertation, Dept of Commerce, University of Madras (June).
7. Ronald P.Hill. (1987). “The Buying process: Effects of and on consumer mood states. “Advances in consumer research, vol.XIV, and p.435.
8. Sekar.S, “Consumer values in product consumption patterns”, a study based on selected income groups in madras city.Dept of commerce, University of
Madras 1985.
9. Terrence V. O’Brien, “Tracking Consumer Decision-making “. Journal of Marketing, January. Vol.35 (1); pp.34-40.

VOLUME NO. 3 (2013), I SSUE NO. 09 (SEPTEMBER ) ISSN 2231-5756
INTERNATIONAL JOURNAL OF RESEARCH IN COMMERCE, IT & MANAGEMENT A Monthly Double-Blind Peer Reviewed (Refereed/Juried) Open Access International e-Journal - Included in the International Serial Directories
http://ijrcm.org.in/
15
OPTIMIZING THE DE-DUPLICATION FOLIAGE IMAGE ACCESS IN STORAGE SYSTEMS
CHITTALA RAMA SATYA
STUDENT
ST. MARTIN’S ENGINEERING COLLEGE
HYDERABAD
B.VIJAYA KUMAR
PROFESSOR
ST. MARTIN’S ENGINEERING COLLEGE
HYDERABAD
ABSTRACT We are now in the era of the Big Data revolution where nearly every aspect of computer engineering is being driven by large-data processing and analysis. The
vast volume of data is used on Personalized Searches in normal or internet applications. Valid of data is important for accessing system without De-duplication. In
this paper, we proposed to optimize the de-duplicated data using Map Reduce with the help of similarity based methodology that are used for comparable
system. To access the data are in data storage applications using point-to-point process. The experimental results are conducting the probability testing is applied
on large data sets on ternary clusters.
KEYWORDS Big Data, De-Duplication, Foliage Images, Optimize, Point-to-Point, Probability Testing, Ternary.
INTRODUCTION n our daily life, increasing in the business data growth rates is high, rapidly changes in coming years. Likewise, retention and retrieval requirements for new
and existing data will expand, driving still more data to disk storage. The trend to larger data sets is due to the additional information derivable from
analysis of a single large set of related data, which is forming Big Data. It is a collection of datasets. The data sizes are constantly moving from a few
terabytes to many petabytes of data in a single data set. So it becomes difficult to process using on-hand database management tools or traditional data
processing applications. With this difficulty, new platforms of "big data" tools are being developed to handle various aspects of immense quantities of data such
as web logs, social networks and search indexing. Using key-based word searching we can search for words anywhere in the record.
Keyword searches are useful when we don’t have complete information about what we are trying to search. For example it is a good substitute for a title or
author search when we have incomplete title or author information. But by using keyword searches we can’t suppress the redundant data of many users. There
is ever-increasing focus on improving data storage efficiencies across the information infrastructure. Data reduction is a tactic which can decrease the disk
storage; network bandwidths required and optimize use of existing storage assets. Deduplication is a well-known technique for data reduction process that
means eliminating the redundant data in sequential-access disk and from active-data storage pools. One unique instance of the data is retained on storage
media, and redundant data is replaced with a pointer to the unique data copy. The goal of Deduplication is to reduce the overall amount of time that is required
to retrieve data by letting you store more data on disk.
The proposed system incorporates large data sets i.e., Big Data by forming three ternary clusters namely, Tag cluster, User cluster and Image data cluster. Also,
all the information kept into three clusters. Clusters has played a critical role for pattern recognition, image segmentation i.e., which provides similar objects to
create groups in an un-labeled data. Various clustering algorithms are created to define a partitioning of a dataset. It is importance of parameters are assigned
an improper value, the clustering method results in a partitioning scheme that is not optimal for the specific data set leading to wrong decisions. The problems
of deciding the number of clusters better fitting a dataset as well as the evaluation of the clustering results has been subject of many research efforts
The rest of the paper is organized as follows: Section 1 deals with present surveys of related work. Section 2 offers fuzzy classifications of decision personnel
signature dataset. Section 3 contains details about support vector machine. Section 4 presents the study of foliage image using Map Reduce technique. Section 5
discussed the similarity technique applied on foliage image using Map Reduce. Section 6 presents the experimental results obtained. Finally, we conclude the
conclusion and future works.
1. PERSONALIZED SEARCH In previously discussed the personalized image search framework by various authors are simultaneously considering user and query information discussed in
Learn to Personalized Image Search From the Photo Sharing Websites by Jitao Sang et al., published in IEEE Transaction Multimedia, 2012 [4]. The user’s
preferences over images under certain query are estimated by how probable he/she assigns the query-related tags to the images. A ranking based tensor
factorization model named RMTF is proposed to predict users’ annotations to the images. To better represent the query-tag relationship, we build user-specific
topics and map the queries as well as the users’ preferences onto the learned topic spaces. In this part, three modules are follows
1.1. USER-SPECIFIC TOPIC MODELING
User-specific information is considered to distinguish the exact intentions of the user queries and to re-rank the list results. Users may have different intentions
for the same query for example; searching for “jaguar” by a car fan has a completely different meaning from searching by an animal specialist.
1.2. PERSONALIZED IMAGE SEARCH
In the research community of personalized search, evaluation is not an easy task since relevance judgment can only be evaluated by the searchers themselves.
This approach is very expensive and needs large-scale real search logs. Social sharing websites provide rich resources that can be exploited for personalized
search evaluation. User’s social activities, such as rating, tagging and commenting, indicate the user’s interest and preference in a specific document.
1.3. RANKING
Photo sharing websites differentiate from other social tagging systems by its characteristic of self-tagging: most images are only tagged by their owners. If any
problem occurs to enable information propagation it calls for external resources. Here, in addition to the ternary interrelations, we also collect multiple intra-
relations among users, images and tags. We assume two items with high affinities should be mapped close to each other in the learnt factor subspaces. Previous
works on these lines were proposed by various authors; Jitao Sang is discussed in Learn to Personalized Image Search from the Photo Sharing Websites, IEEE
Transactions on Multimedia vol.14, August 2012[4, 5, 6, and 7].
2. TERNARY CLUSTER ANALYSIS Classification is the set of objects which are assigning to one among a set of pre-defined categories. It is a systematic approach for building classification models
from an input dataset. Consider, Entire input personnel signature can be segmented into three clusters i.e., foliage (leaf) character images, users and Tagging.
The cluster data is represented in the form of triplets.
I

VOLUME NO. 3 (2013), I SSUE NO. 09 (SEPTEMBER ) ISSN 2231-5756
INTERNATIONAL JOURNAL OF RESEARCH IN COMMERCE, IT & MANAGEMENT A Monthly Double-Blind Peer Reviewed (Refereed/Juried) Open Access International e-Journal - Included in the International Serial Directories
http://ijrcm.org.in/
16
Let U, I, T denote the sets of users, Images and Tags. The group of data of a cluster is denoted by C⊂U X I X T, i.e., each triplet (u, i, t) Є C means that user u has
annotated image i with tag t. the ternary interrelations can then constitute a three dimensional tensor y Є �|�| �|�|�|� | is applied on map reduce [10].
3. SUPPORT VECTOR MACHINE Support Vector Machine is a machine learning process. It is defined over a vector space in which the problem is to find a decision surface that “best” separates
the data vectors into two classes suggested by Isabelle Moulinier et al., 1997 [4] is discussed the simplest linear form; an SVM is a hyper-plane that separates a
set of positive from a set of negative with maximum margin.
The hyper-plane (dot) used on the database images and represented as linear SVMs or it can be found in a higher-dimensional space by transforming the images
into a representation having more dimensions like input variables than the whole database in data images are treated as non-linear SVMs. It is used to provide
simple solution by mapping the image data into a higher dimensional space and then reducing the problem to a linear.
The purpose of hyper-plane is to separates the training data by a maximal margin. All vectors lying on one side of the hyper-plane are labeled as 0, and all
vectors lying on the other side are labeled as 1. The training instances that lie closest to the hyper-plane are called support vectors [1, 4 and 9].
The Linear Support Vector Machine S = w.i (3.1)
Where w is the normal vector namely called as database to the hyper-plane, and i is the input vector is known as Input Data. In the linear case, the margin is
defined by the distance of the hyper-plane to the nearest of the positive and negative.
4. MAP REDUCE BASED T-NARY CLUSTER OPTIMIZATION USING SIMILARITY The process requires validation that the target database is clean and contains the non-redundant data, from an identity perspective. The identity de-duplication
process involves comparing all records of the image database among them, powered by complex mathematical algorithms that discover the some statistical
study of similarity relationships within datasets.
When we send a request from local database to cloud database the requirement of basic algorithm for any recognition can be solved. The interface of classifier
with the help of SVM classifier is followed by two classes namely called cloud database and local database by using map reduce classification problem; the goal is
to find the image object and store to local database by a function which is induced from the mention figure below.
FIG: 4.1: MAP REDUCE BASED PERSONALIZED IMAGE SEARCHES USING SIMILARITY
MapReduce programming model is proposed. MapReduce is a functional programing model that implements for processing and generating large data sets as
in[2][3]. It is well-developed technology for distributing and parallelized environments and also working on large data sets. Initially, the user makes a request to
the cloud data storage about the triplets. Then the image data produces a set of intermediate key value pairs (images) with the help of map functions written by
third party users. The existing cloud data storage is used to calculate the mean value for each image i.e., intermediate key value with the help of image
normalization process and feature extraction values. The cloud database consisting of intermediate key values associated with the same intermediate key and
passes them to the Reduce function with the help of MapReduce library by SVM classifier. Finally, the user of the reduce function is accepts an intermediate key
and a set of values for that key for the database. We compare the mean value with the target image of database with the help of similarity approach to calculate
the distances i.e., Euclidean distance.
�� ���� � ������ = √�(� − �)� ( 4.1)!
"#$
5. EXPERIMENTAL RESULTS The experimental Results are produced on personnel signature image cluster datasets uses one of the approach test of Hypothesis ( the estimating the value of a
parameter we need to decide whether to accept or reject a statement about the parameter.), which is to generalize the two-sample software reliability testing if
the data belong to more than two groups. The product reliability test is conducted on personnel signatures data sets to test for the equality of the means of two
or more normal data set and also uses variances.
%&'(')*)+, = -./'01 &2 3(404 5607 50 2)78 2()*.109&+(* 7./'01 &2 3(404 .7801 3&74)801(+)&7
By using this formula, to calculate the failure probability with the help of testing from input images. To find reliability of software, we need to find the respect is
done or not from given input datasets [11].
In the above case tagging, user and images are ternary relations data sets. The three equivalents sample data clusters using searching and comparing purposes.
To conduct the test whether check the three equal relations data or not and taking the data are equal or not.
Tagging User Images
Personalized Images Search by SVM
Local Database by
Similarity
VOLUME NO. 3 (2013), I SSUE NO. 09 (SEPTEMBER ) ISSN 2231-5756
INTERNATIONAL JOURNAL OF RESEARCH IN COMMERCE, IT & MANAGEMENT A Monthly Double-Blind Peer Reviewed (Refereed/Juried) Open Access International e-Journal - Included in the International Serial Directories
http://ijrcm.org.in/
17
Let H0 is the sample mean are not equal.
Let H1 is the sample mean are equal
If H0 = H1 then, Display both are Equal mean. So test is accepted.
Otherwise both are Not Equal, so test is rejected.
6. CONCLUSION AND FUTURE WORKS De-duplication is one of the best concepts in Data Storage and it is a kind of Cloud Computing application. In this paper, we describe the cloud storage as image
data storage which shows that the proposed method can provide the reliable data, fault tolerant and can improve efficiency and scalability. This approach has
several applications such as Intrusion Detection and new technologies like Biometric and Video survival lance Systems, etc. Furthermore, the magnitude of the
recognition level of an image which will follow some probability distribution using de-duplication.
REFERENCES 1. A.Thousoo, J.S.Sarma, N.Jain, Z.Shao, P. Chakka, S.Anthony, H.Liu, P.Wychoff, and R.Murthy. Hive- a warehousing solution over a map-reduce framework.
In VLDB, 2009.
2. A.Thousoo, R.Murthy, J.S.Sarma, Z.Shao, N.Jain, P.Chakka, S.Anthony, H.Liu and N.Zhang. Hive-a petabyte scale data warehousing using hadoop. In ICDE,
2010.
3. Ali Meligy and Manar Al-Khatib, A Grid-Based Distributed SVM Data Mining Algorithm, European Journal of Scientific Research, ISSN 1450-216X Vol.27 No.3
(2009), pp.313-321.
4. Isabelle Moulinier Feature Selection: A Useful Preprocessing Step. In Proceedings of the 19th
Annual BCS-IRSG Colloquium on IR Research, P.P. 140-158,
1997.
5. J. Teevan and S T Dumais, and D. J. Liebling published in “To personalize or not to personalize: Modeling Queries with variation in user intent, in Proc.SIGIR,
2008, PP 163-170.
6. Jitao Sang and Changsheng Xu and Dongyuan Lu., Learn to Personalized Image Search from Photo Sharing Websites published in IEEE Transactions
Multimedia Vol.14, August 2012.
7. Learman K and A. Plangprasophchok, and C. Wong. Published in personalizing image search results on flickr, J.CoRR, Vol abs/0704.1676.2007.
8. Naeem Naik, and L. M. R. J. Lobo, and Riyaz Jamadar. Published in a Novel Personalized Image Search Framework, International Journal of Engineering
Research & Technology (IJERT) Vol. 1 Issue 10, December- 2012, ISSN: 2278-0181.
9. Wiki-pedia.com/software reliability testing.
10. wiki-pedia/Cluster Analysis.
11. wiki-pedia/Support Vector Machine.

VOLUME NO. 3 (2013), I SSUE NO. 09 (SEPTEMBER ) ISSN 2231-5756
INTERNATIONAL JOURNAL OF RESEARCH IN COMMERCE, IT & MANAGEMENT A Monthly Double-Blind Peer Reviewed (Refereed/Juried) Open Access International e-Journal - Included in the International Serial Directories
http://ijrcm.org.in/
18
A STUDY ON THE IMPACT OF E TAILERS ON UNORGANISED AND ORGANISED RETAILERS WITH
REFERENCE TO ELECTRONIC GOODS
KALAVATHY K.S
ASSOCIATE PROFESSOR
THE OXFORD COLLEGE OF BUSINESS MANAGEMENT
BANGALORE
DR. BINA PANDEY
PROFESSOR
THE OXFORD COLLEGE OF BUSINESS MANAGEMENT
BANGALORE
ABSTRACT The proliferation of internet shopping has attracted a lot of attention and has spawned a heated debate about its impact on traditional retailing. Internet has
changed the methods of retailing as well as the purchasing habits of consumers .E commerce has put a significant amount of control in the hands of shoppers,
who have become habituated to both the speed and convenience of purchasing online. The internet provides consumers with the capabilities to shop around the
clock, from any location , as well as easily access research about products’ attributes and competitive pricing. This article makes an attempt to explore the
impact on both organized and unorganized retailers. It was found that the impact of e tailers on organized retailers is considerable when compared to
unorganized retailers.
KEYWORDS internet shopping, E Commerce, organized retailers, unorganized retailers.
INTRODUCTION etail is the sale of goods and services from individuals or businesses to the end-user. Retail comes from the Old French word tailler, which means "to cut
off, clip, pare, divide" in terms of tailoring (1365). It was first recorded as a noun with the meaning of a "Sale in small quantities" in 1433 (from the
Middle French retail, "piece cut off, shred, scrap, paring"). Like in French, the word retail in both Dutch and German also refers to the sale of small
quantities of items. Retailers are part of an integrated system called the supply chain. A retailer purchases goods or products in large quantities from
manufacturers directly or through a wholesale, and then sells smaller quantities to the consumer for a profit. Retailing can be done in either fixed locations like
stores or markets, door-to-door or by delivery. Retailing includes subordinated services, such as delivery. The term "retailer" is also applied where a service
provider services the needs of a large number of individuals, such as a public. Shops may be on residential streets, streets with few or no houses or in a shopping
mall. Online retailing, a type of electronic commerce used for business-to-consumer (B2C) transactions and mail order, are forms of non-shop retailing.
Shopping generally refers to the act of buying products. Sometimes this is done to obtain necessities such as food and clothing; sometimes it is done as a
recreational activity. Recreational shopping often involves window shopping (just looking, not buying) and browsing and does not always result in a purchase.
THREE CATEGORIES OF RETAILERS UNORGANIZED/TRADIONAL RETAILER
Traditional retail refers to these thousands of small, mostly family-owned retail businesses. They are also referred to as the "unorganized" retail sector. The
"organized" sector refers to large, modern regional and national retail stores.
Through the centuries, Indians have purchased goods from small local vendors, entrenching this style throughout the country. Unorganized retailing refers to the
traditional formats of low-cost retailing, for example, the local corner shops, owner manned general stores, paan/beedi shops, convenience stores, hand cart
and pavement vendors, etc.
ORGANIZED/MODERN RETAILERS
Organized retailing comprises mainly of modern retailing with busy shopping malls,multi-storied malls and huge complexes that offer a large variety of products
in terms of quality, value for money and makes shopping a memorable experience.
Modern retail sector is at the crossroads where the growth of organized retailing and growth inthe consumption by the Indian population is going to take a
higher growth trajectory.It is undergoing a major transformation as entry of global players and watchful expansion by major Indian retailers has opened new
vistas of joint ventures, tie-ups and franchise offering new formats, services, private labels, locations and recently to diverge from metros to smaller towns,
Arvind Singhal Chairman Technopak Advisors has rightly said that, “A lot of international retailers and brands are most likely to look at India, as global markets
have stabilized and the Indian economy has proved to be better than most other countries. In India the Wal-Mart model is a 20th century concept that is fast
becoming obsolete in the 21st century .Internet now threatens the hyper market which may survive in small towns with low land prices, but looks doomed to
becoming a minority player.
E-TAILERS/E-RETAILERS
Retailing through online domain is known as E-tailing. E-tailing can describe food retailing or service retailing or goods retailing. An online selling system can
make opportunity for the organization to introduce its goods and services, advertise its new items, sell easily and quickly, and receive money online. Also, the
company reaches customers in remote places and this can extend the area of its business. Four dimensions including Privacy, Fulfillment, System Availability and
Efficiency are identified as the main criteria for judging e-service quality.
E-tailing offers unique advantages to the consumer that no other form of retailing can match. The hypertext nature of the medium allows for more flexible forms
of transactions (growth of C2B and C2C) to flourish. It allows for easier comparisons across broad product categories with the evolution of shopping bots and
similar mechanisms. The medium also offers flexible/dynamic pricing mechanisms to the consumer. These evolutions reduce any friction in the online market
place and stimulate the use of the web as a retail environment. In the long-run, this will benefit the marketers as well as the consumers. Further, this will
penalize the marketers who thrived in market places that had entry barriers in the form of a lack of freely available information. Earlier, such a situation
restricted the customers in making informed choices and led to inefficient pricing and localized monopolies
THE FUTURE OF INTERNET RETAILING Whilst it may not be possible to predict with any degree of certainty how the internet will shape the design of markets, the practice of marketing or the behavior
of online shoppers, in the future, it is clear that the market-share and influence of online retailing will continue to rise. For example, in the UK, it has been
estimated that the number of customers being served by the UK online and catalogue retail industry, which currently stands at 26.9 million active online
R

VOLUME NO. 3 (2013), I SSUE NO. 09 (SEPTEMBER ) ISSN 2231-5756
INTERNATIONAL JOURNAL OF RESEARCH IN COMMERCE, IT & MANAGEMENT A Monthly Double-Blind Peer Reviewed (Refereed/Juried) Open Access International e-Journal - Included in the International Serial Directories
http://ijrcm.org.in/
19
consumers, will rise to around 30 million by the year 2013, representing over half of the UK population. In similar vein, statistics for the USA also provide
evidence of the rapid growth of internet retailing. In recent years, and a strong expectation that this growth will continue, well into the future. The role of online
retail is changing in India too. There are almost 120 million internet users in India and looking at the 2020 vision it could reach to 1 billion if it contines to grow
at this rate. This continuing expansion of online retailing will inevitably draw renewed attention to its likely affect on the high street. Moreover, given the
customers’ desire to use the internet as a flexible tool for researching products and locating stores, as well as purchasing merchandise, it would also seem likely
that the multi-channel format will be the preferred design. The established retailers will inevitably continue to face stiff competition from successful and high
profile “virtual merchants” and “disinter mediators”, such as amazon.com, apple.com and dell.com
COMPARISON OF WEB AND TRADITIONAL RETAIL MARKET
Compared to the traditional market, the Web market differs along three main dimensions:
i) technology infrastructure; ii) channel integration; and iii) information intensity. This discussion is not meant to be complete and comprehensive, but rather a
summary of some important characteristics that retailers should understand about the Web market.
1. TECHNOLOGY INFRASTRUCTURE
Advances in technology have provided useful supportive tools in the conventional market. For example, television and radio have greatly facilitated one-way
communication. Various information systems can be used to process transactions, collect and analyze data. Technology-based tools have helped marketers
perform their marketing strategies more efficiently and effectively in the traditional marketplace. The Web-based marketplace serves as a platform for
advanced technology and applications. Marketers who pioneer new Web-based technology and commercial applications can gain substantial competitive
advantage.
2. CHANNEL INTEGRATION
The powerful integrated environment of the Web can affect the marketplace in many ways. Many business models, such as those similar to TV and catalog
shopping, can be implemented readily online. Different business tools and functions can be integrated. Consumer orders can be automatically processed and
routed to suppliers. Information channels are integrated, with information flowing both ways between vendors and customers. This facilitates the gathering and
sharing of market knowledge. For consumers, competitors are just a click away, allowing easy co combined communication medium and distribution/transaction
channel, which is quite different from traditional marketplaces.
3. INFORMATION INTENSITY
Information availability is limited in the traditional market. While electronic techniques, such as POS, have been used to collect information for inventory
management and customer analysis, they have limited potential. First, the information collected through these systems does not tend to be extensive, since it
simply includes merchandise descriptions and quantities sold. While some stores also collect customer account data, valuable information generated through
personal interaction with customers, such as their preferences, is typically lost.
Surveys and analysis by stores and brand manufacturers are generally conducted, if at all, on a limited sample basis. Second, information collection and analysis
in the traditional market is primarily performed from the marketer's point of view and for the marketer's use and purpose. Information that directly facilitates
consumers' information searching or market evaluation is not as easily available. Electronic techniques used in the traditional retail market tend to be supportive
tools, and do not emphasize the customers' views, roles or power.
The Web is a truly information-intensive environment. Vast amounts of information can be collected, integrated, processed, presented, and accessed through
the Web by both marketers and consumers. Marketers now can track detailed information for all e-tailing consumer interactions, not just select samples.
However, soft market features, such as reputation and reliability, may be more difficult to gather and evaluate. Consumers can gain more market knowledge for
criteria comparison, however potential problems of information overload may increase perceived searching costs (Head et al. 2000). Marketers may provide
tools to facilitate consumer information collection, but may have to redesign their marketing strategies since competitors can also accumulate market
knowledge and match price differences.
REVIEW OF LITERATURE RETAIL IN INDIA
India’s growing retail boom is a triumph story. With strong essentials developing in the Indian economy in the liberalized environment since 1991 with changes
in income levels, lifestyles, taste & habits of consumers with preference for superior quality and branded products, vast domestic market with a very competitive
manufacturing base, India has also observed a major retail boom in recent years. Being encouraged by India’s growing retail boom many multinational
companies also started making beeline to enter India’s retail market. Investment from abroad has also been hailed by Indian industry, by and large, as the same
has been considered to be very vital for adding to domestic investment, addition to capacity, higher growth in manufacturing, trade, business, employment,
demand, consumption and income with multiplier effects. (Amisha Gupta, 2010)
GROWTH OF RETAIL IN INDIA
Till recently, Government of India allowed 51% FDI in single brand retail and 100% in cash & carry only. One of the major steps taken by the Government
recently to encourage the organized retailing in the country was the recent decision of the cabinet to allow 51% FDI in multi brand retail and100% in single brand
retail in Nov 2011. The decision was delayed and held back for some time because of the absence of political consensus. As a result of the liberalized policies &
reform measures taken by the government since 1991, Indian Economy has achieved commendable growth rates over the last few years with many success
stories in many fronts. India’s growing retail boom is one such success story. With strong fundamentals developing in the economy with changes in income
levels, lifestyles, taste & habits reflecting in strong consumerism with preference for superior quality and branded products, vast domestic market with a very
competitive manufacturing base, India also observed a major retail boom in recent years (Dube, Arindrajit, Lester, T. William and Eidlin, Barry, 2007).
In the hindsight, many of the original predictions made at the dawn of the interest era have not become a reality. Retailers are not cannibalizing their own
custom, virtual merchants do not dominate the market place, and the high street has not been put out of business. By contrast, other predictions have come to
pass electronic intermediaries are playing an increasingly important role, “one to one” marketing has become a reality, prices are most competitive, and,
perhaps most importantly, the consumer has become more powerful (Neil F Doherty And Fiona Ellis-Chadwick, 2010).
As online retailing expands on the back of customer incentives and product discounts, brick and mortar chain stores such as Shoppers Stop Ltd, Lifestyle
International (P). Ltd and The Bombay Store are reworking their Internet strategies to compete with e-tailers such as flipkart.com. The retail chains are seeking
to tap an e-tailing sector that is heating up. According to a November report by Avendus Capital Pvt. Ltd on the digital consumer industry, e-tailing is set to
become a Rs 53,000 crore market by 2015 from the current Rs 3,600 crore, but still accounting for just around 1.4% of the Rs 36 trillion retail markets in India.
(Sapna Agarwal, 2012) “Online retail will hit a $1 billion (around Rs 4,910 crore at today’s exchange rate) turnover this financial year. The one category that is
getting a boost online is books, followed by electronics,” said Govind Shrikhande, managing director and chief executive officer, Shoppers Stop, which runs the
book retail store—Crossword. In 2011, the sales of books and electronic items in physical stores slowed as e-tailing sites grabbed market share, Shrikhande said.
Towards this end, Crossword launched cross word in five months back. It has also tweaked the strategy for its book retail chain of 80 stores to grow through the
franchisee route. (Livemint and Wallstreet Journal, Feb 03 2012).
“Three things important for a future bazaar consumer is price, access and convenience,” said Kashyap Deorah, President of futurebazaar.com. “For every
consumer who goes online and shops, there are four who go offline and buy at stores,” said Deorah, who expects online sales to contribute 10-15% of the
group’s retail revenue in the next couple of years. (Livemint and Wallstreet Journal, Feb 03 2012) “Internet retail is going to grow. It is an important channel of
distribution,” said Kabir Lumba, managing director, Lifestyle. (Livemint and Wallstreet Journal, Feb 03 2012) “We are tying up almost every other day with an
online retailer,” said Asim Dalal, managing director, Bombay Swadeshi Stores Ltd, which runs The Bombay Store. He expects 20-25% of sales to come from its
online presence in the next three years versus 10% now for the new venture. (Livemint and Wallstreet Journal, Feb 03 2012) “Retail takes time to warm up to

VOLUME NO. 3 (2013), I SSUE NO. 09 (SEPTEMBER ) ISSN 2231-5756
INTERNATIONAL JOURNAL OF RESEARCH IN COMMERCE, IT & MANAGEMENT A Monthly Double-Blind Peer Reviewed (Refereed/Juried) Open Access International e-Journal - Included in the International Serial Directories
http://ijrcm.org.in/
20
the online medium due to two reasons—the lack of touch and feel (resulting in a different user experience compared with physical retail) and the need to
develop an ecosystem, which sometimes does not exist,” said the Avendus report, adding that savings inherent to the e-tailing model—the reduction of
inventory and high-cost retail space—provides e-tailers the margins to enable such incentives for consumers. (Livemint and Wallstreet Journal, Feb 03 2012).
“Brick and mortar stores have to reinvent. Some of them are already doing it and have relaunched their websites,” said Binny Bansal, chief operations officer
and co-founder of Flipkart Online Services Pvt. Ltd. (Livemint and Wallstreet Journal, Feb 03 2012) “One of the big draws to shop online is the prices. Retailers
can’t compete with pure-play e-commerce companies who have lower cost of operations and a dedicated logistics support. Even if they get the pricing right,
they would cannibalize their own sales further, stressing the already stretched margins,” said Arvind Singhal, chairman, Technopak Advisors Pvt Ltd, a retail
consultancy firm. (Livemint and Wallstreet Journal, Feb 03, 2012)
“Last year, close to 500 e-commerce portals were launched in India of which at least a half-a-dozen odd players would have revenues of over Rs 100 crore in the
next fiscal,” said Mukul Singhal, senior associate at SAIF Partners Ltd, a private equity firm which has made early stage investments in Zovi.com, Inkfruit.com and
Firstcry.com. (Livemint and Wallstreet Journal, Feb 03 2012)
EMERGENCE OF E-TAILING E-tailing is a market practice that is still in its infancy. Viewing the web as a marketing tool, marketer incorporates the web into their traditional strategies.
Viewing the web as a new market place, business emerges with new product/service designs, targeted customers, and strategies. Traditional methods to
evaluate the success of a business seem insufficient in the new economy. Despite increasing sales, many e-businesses are not profiting. In this developing
market, many businesses aim to build a brand name and customer base, while leaving profitability a long-term consideration. (F. Wang, M. Head, N. Archer,
2002).
The proliferation of internet shopping as a viable retail format has attracted a great deal of media attention about its potential impacts on place-based shopping.
Specifically, the growing estimates of online retail sales have caused the real estate industry to become increasingly, concerned about the ability of internet
shopping to replace shopping at bricks-and-mortar stores. However, the current research and literature lacks a systematic assessment of the potential impacts
of this emerging retail format on the traditional models of shopping. Without such an assessment planners and real estate professionals will find it difficult to
navigate the various claims in the media and are faced with great uncertainty about their traditional practices. (M. K. Massagli, 2000)
Mass-customization is producing fundamental change, revolutionizing attitudes to choice, with a key role for agents (human and online) in helping people
choose. Consumer power will grow and brands will be under pressure from rising consumer expectations. While retailers fight back with targeted marketing and
special offers, brands will need to serve consumer needs as much as suppliers. Online shopping could transform consumer behavior, driven by cost saving and
convenience and spurred on by competition. Will retailers protect their traditional channels or go online because they are afraid not to? ‘Etailing’ will need to
create consumer trust, so regulation will be critical, possibly leading to legal responsibilities for quality on Internet service providers (ISPs) and portals and with
systems to help new entrants build a track record of reliability, thereby increasing competition, choice and consumer power. (Henry Stewart Publications, 2002)
The online information disclosed by electronic retailers (e-tailers) is expected to play a role in building customer relationships. The level of online information
disclosure relies on the e-tailer's discretion while unethical online information disclosure practices, such as disclosure of misleading information, may harm the
entire electronic retailing industry. Information disclosure is explained significantly by the country in which an e-tailer is located, whether the business is
confined to the internet, and the number of payment methods. However, no effect is found for the price level of the major product line and whether products
are shipped to international customers. (Kim, Daekwan, Cavusgil, S. Tamer, 2006)
The effects of electronic Word-of-Mouth (eWOM) in the form of online customer-to customer recommendations on attitudes about the recommended product
and confidence in the choice decision - the amount of eWOM has a significant impact on buyer confidence in product choice. In addition, for buyers less
motivated to process information, the effect of eWOM on their choice confidence is mediated by their attitude towards the recommended product, suggesting
that the amount of eWOM functions as a purchase cue. (Harris, J. Gupta, Pranjal, 2008)
Indian Retail Industry is ranked among the ten largest retail markets in the world. The attitudinal shift of the Indian consumer and the emergence of organized
retail formats have transformed the face of Retailing in India. With the sign of reemergence of economic growth in India, consumer buying in retail sector is
being projected as a key opportunity area. As a consequence, Indian corporate houses are refocusing its strategic perspective in retail marketing with the idea to
use resources optimally in order to create core competence and gain competitive advantage. ( Dr.S. Akhter, I. Equbal, 2012).
Online shopping is now an everyday part of most peoples’ lives. From the perspective of the here and now, and looking forward, there is plenty of evidence to
suggest that this internet-enabled revolution has much more life in it yet. The revolution has moved from a phase in which the innovation and ideas were
primarily flowing from the supply-side to one in which the innovation and ideas were primarily flowing from the supply-side to one in which the consumer, from
the demand-side, is empowered to direct the way in which the revolution unfolds. (Neil F Doherty And Fiona Ellis-Chadwick, 2010).
The Indian Online Retail is a rich segment waiting to be exploited. Internet is a potent medium that can serve as a unique platform for the growth of retail brands
in India. The medium holds many virtues favorable for the retail industry including a higher customer penetration, increased visibility, and convenient
operations. The current web-based models for e-tailing are part of an embryonic phase preceding an era of rapid transformation, challenge, and opportunity in
Indian retail market. The Indian retail market is witnessing a revolution. The growth of internet has enabled the new retail format of the virtual retailer to
emerge and forced the existing retailers to consider etailing model of retailing as well. Online retailing or e-tailing is described as transactions that are conducted
through interactive online computer systems, which link consumers with sellers electronically, where the buyer and merchant are not at the same physical
location. In a short space of time, internet retailing or e-tailing has firmly established itself as a viable alternative to store based shopping. (S. Suri, P. Vij, S. Singh,
2012) FDI in multi branding retail welcomes more entrants and more competition in E-world of retail in India. E-tailing, as now, would change with the flow of
time and become the most essential weapon for all retailers to stay in the competition and sustain their business. For all organized players this decision will
create more challenges in the future. For unorganized the scenario will less comparatively than the organized players. (Ramakrishna H., 2013)
STATEMENT OF THE PROBLEM The study is undertaken with the intention to understand the impact of E tailers on the unorganized and organized retailers with reference to purchase of
electronic products in Bangalore .Retail sector is one of the contributing factors for the growth of our economy. The transition from unorganized to organized to
E retail describes the fast growth of the retail sector. With its fast growth ,the consumer is also looking for avenues where marketing services becomes a matter
of convenience .In this regard, introduction of retail with maintenance of e quality standards have attracted the consumers towards it. Due to this the consumer
is slowly shifting its focus from unorganized/organized retail towards e-retail. High literacy rate in Bangalore compounded with the boom in IT sector has
resulted in the consumers becoming tech savvy .Consumers are influenced to shop online, which in turn has impacted the sales of brick and mortar stores. In
light of these developments the study –“A study on the impact of E tailers on traditional and organized retailers with reference to electronic goods” has become
imperative.
OBJECTIVE OF THE STUDY The main objective of the research is to study the impact of E tailers on the sale of organized and unorganized retailers with specific reference to electronic
goods.
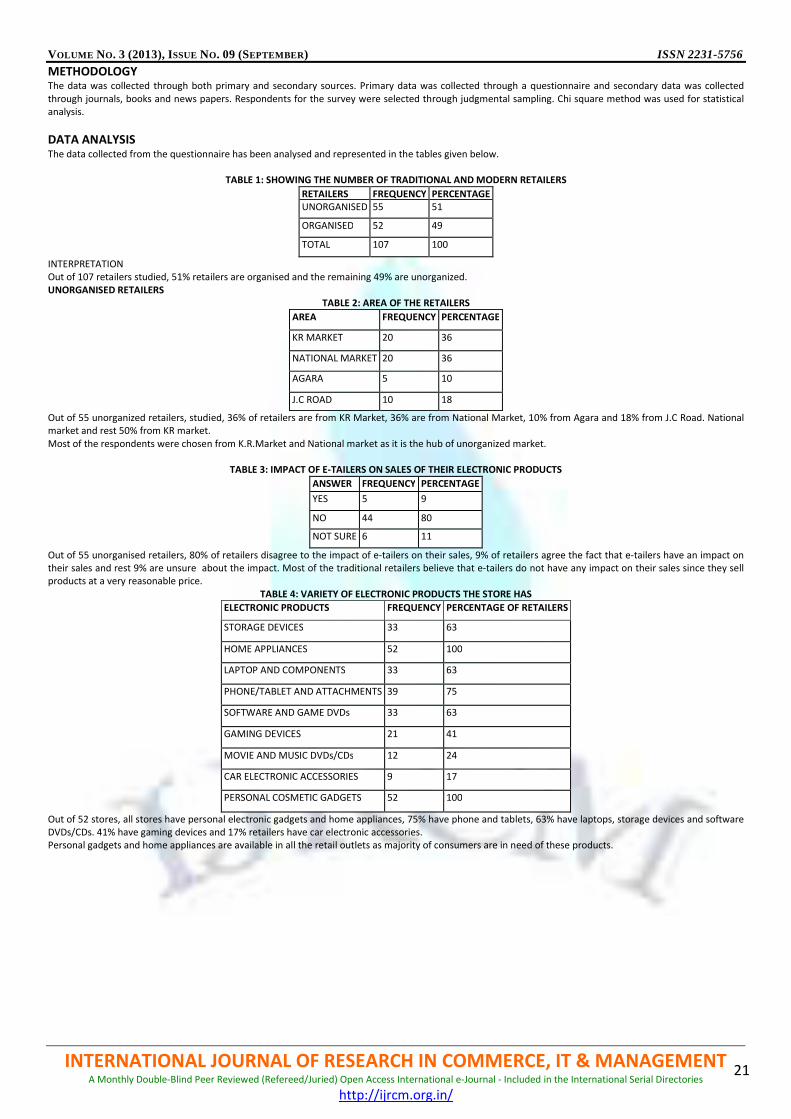
VOLUME NO. 3 (2013), I SSUE NO. 09 (SEPTEMBER ) ISSN 2231-5756
INTERNATIONAL JOURNAL OF RESEARCH IN COMMERCE, IT & MANAGEMENT A Monthly Double-Blind Peer Reviewed (Refereed/Juried) Open Access International e-Journal - Included in the International Serial Directories
http://ijrcm.org.in/
21
METHODOLOGY The data was collected through both primary and secondary sources. Primary data was collected through a questionnaire and secondary data was collected
through journals, books and news papers. Respondents for the survey were selected through judgmental sampling. Chi square method was used for statistical
analysis.
DATA ANALYSIS The data collected from the questionnaire has been analysed and represented in the tables given below.
TABLE 1: SHOWING THE NUMBER OF TRADITIONAL AND MODERN RETAILERS
RETAILERS FREQUENCY PERCENTAGE
UNORGANISED 55 51
ORGANISED 52 49
TOTAL 107 100
INTERPRETATION
Out of 107 retailers studied, 51% retailers are organised and the remaining 49% are unorganized.
UNORGANISED RETAILERS
TABLE 2: AREA OF THE RETAILERS
AREA FREQUENCY PERCENTAGE
KR MARKET 20 36
NATIONAL MARKET 20 36
AGARA 5 10
J.C ROAD 10 18
Out of 55 unorganized retailers, studied, 36% of retailers are from KR Market, 36% are from National Market, 10% from Agara and 18% from J.C Road. National
market and rest 50% from KR market.
Most of the respondents were chosen from K.R.Market and National market as it is the hub of unorganized market.
TABLE 3: IMPACT OF E-TAILERS ON SALES OF THEIR ELECTRONIC PRODUCTS
ANSWER FREQUENCY PERCENTAGE
YES 5 9
NO 44 80
NOT SURE 6 11
Out of 55 unorganised retailers, 80% of retailers disagree to the impact of e-tailers on their sales, 9% of retailers agree the fact that e-tailers have an impact on
their sales and rest 9% are unsure about the impact. Most of the traditional retailers believe that e-tailers do not have any impact on their sales since they sell
products at a very reasonable price.
TABLE 4: VARIETY OF ELECTRONIC PRODUCTS THE STORE HAS
ELECTRONIC PRODUCTS FREQUENCY PERCENTAGE OF RETAILERS
STORAGE DEVICES 33 63
HOME APPLIANCES 52 100
LAPTOP AND COMPONENTS 33 63
PHONE/TABLET AND ATTACHMENTS 39 75
SOFTWARE AND GAME DVDs 33 63
GAMING DEVICES 21 41
MOVIE AND MUSIC DVDs/CDs 12 24
CAR ELECTRONIC ACCESSORIES 9 17
PERSONAL COSMETIC GADGETS 52 100
Out of 52 stores, all stores have personal electronic gadgets and home appliances, 75% have phone and tablets, 63% have laptops, storage devices and software
DVDs/CDs. 41% have gaming devices and 17% retailers have car electronic accessories.
Personal gadgets and home appliances are available in all the retail outlets as majority of consumers are in need of these products.
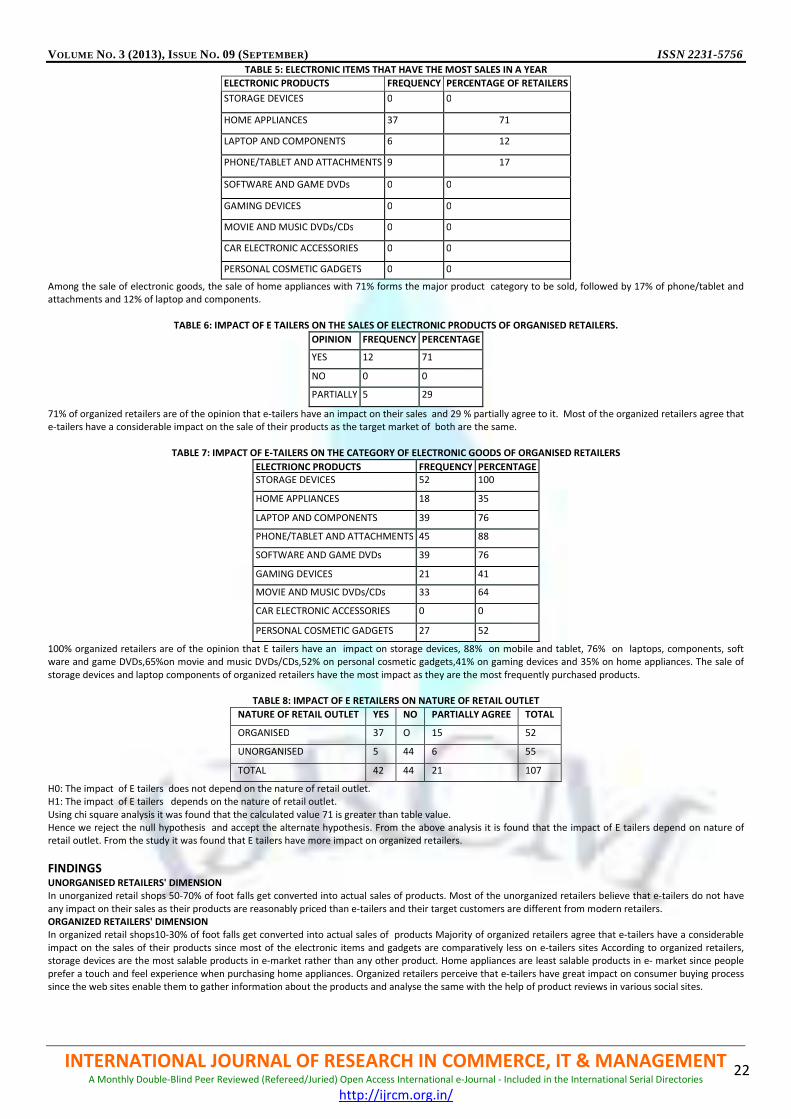
VOLUME NO. 3 (2013), I SSUE NO. 09 (SEPTEMBER ) ISSN 2231-5756
INTERNATIONAL JOURNAL OF RESEARCH IN COMMERCE, IT & MANAGEMENT A Monthly Double-Blind Peer Reviewed (Refereed/Juried) Open Access International e-Journal - Included in the International Serial Directories
http://ijrcm.org.in/
22
TABLE 5: ELECTRONIC ITEMS THAT HAVE THE MOST SALES IN A YEAR
ELECTRONIC PRODUCTS FREQUENCY PERCENTAGE OF RETAILERS
STORAGE DEVICES 0 0
HOME APPLIANCES 37 71
LAPTOP AND COMPONENTS 6 12
PHONE/TABLET AND ATTACHMENTS 9 17
SOFTWARE AND GAME DVDs 0 0
GAMING DEVICES 0 0
MOVIE AND MUSIC DVDs/CDs 0 0
CAR ELECTRONIC ACCESSORIES 0 0
PERSONAL COSMETIC GADGETS 0 0
Among the sale of electronic goods, the sale of home appliances with 71% forms the major product category to be sold, followed by 17% of phone/tablet and
attachments and 12% of laptop and components.
TABLE 6: IMPACT OF E TAILERS ON THE SALES OF ELECTRONIC PRODUCTS OF ORGANISED RETAILERS.
OPINION FREQUENCY PERCENTAGE
YES 12 71
NO 0 0
PARTIALLY 5 29
71% of organized retailers are of the opinion that e-tailers have an impact on their sales and 29 % partially agree to it. Most of the organized retailers agree that
e-tailers have a considerable impact on the sale of their products as the target market of both are the same.
TABLE 7: IMPACT OF E-TAILERS ON THE CATEGORY OF ELECTRONIC GOODS OF ORGANISED RETAILERS
ELECTRIONC PRODUCTS FREQUENCY PERCENTAGE
STORAGE DEVICES 52 100
HOME APPLIANCES 18 35
LAPTOP AND COMPONENTS 39 76
PHONE/TABLET AND ATTACHMENTS 45 88
SOFTWARE AND GAME DVDs 39 76
GAMING DEVICES 21 41
MOVIE AND MUSIC DVDs/CDs 33 64
CAR ELECTRONIC ACCESSORIES 0 0
PERSONAL COSMETIC GADGETS 27 52
100% organized retailers are of the opinion that E tailers have an impact on storage devices, 88% on mobile and tablet, 76% on laptops, components, soft
ware and game DVDs,65%on movie and music DVDs/CDs,52% on personal cosmetic gadgets,41% on gaming devices and 35% on home appliances. The sale of
storage devices and laptop components of organized retailers have the most impact as they are the most frequently purchased products.
TABLE 8: IMPACT OF E RETAILERS ON NATURE OF RETAIL OUTLET
NATURE OF RETAIL OUTLET YES NO PARTIALLY AGREE TOTAL
ORGANISED 37 O 15 52
UNORGANISED 5 44 6 55
TOTAL 42 44 21 107
H0: The impact of E tailers does not depend on the nature of retail outlet.
H1: The impact of E tailers depends on the nature of retail outlet.
Using chi square analysis it was found that the calculated value 71 is greater than table value.
Hence we reject the null hypothesis and accept the alternate hypothesis. From the above analysis it is found that the impact of E tailers depend on nature of
retail outlet. From the study it was found that E tailers have more impact on organized retailers.
FINDINGS UNORGANISED RETAILERS' DIMENSION
In unorganized retail shops 50-70% of foot falls get converted into actual sales of products. Most of the unorganized retailers believe that e-tailers do not have
any impact on their sales as their products are reasonably priced than e-tailers and their target customers are different from modern retailers.
ORGANIZED RETAILERS' DIMENSION
In organized retail shops10-30% of foot falls get converted into actual sales of products Majority of organized retailers agree that e-tailers have a considerable
impact on the sales of their products since most of the electronic items and gadgets are comparatively less on e-tailers sites According to organized retailers,
storage devices are the most salable products in e-market rather than any other product. Home appliances are least salable products in e- market since people
prefer a touch and feel experience when purchasing home appliances. Organized retailers perceive that e-tailers have great impact on consumer buying process
since the web sites enable them to gather information about the products and analyse the same with the help of product reviews in various social sites.
VOLUME NO. 3 (2013), I SSUE NO. 09 (SEPTEMBER ) ISSN 2231-5756
INTERNATIONAL JOURNAL OF RESEARCH IN COMMERCE, IT & MANAGEMENT A Monthly Double-Blind Peer Reviewed (Refereed/Juried) Open Access International e-Journal - Included in the International Serial Directories
http://ijrcm.org.in/
23
CONCLUSION Thanks to cheap labor, small shops can provide home delivery at low cost. Many shopkeepers know their customers personally and extend them credit. For all
these reasons, the am bania will easily compete with hyper markets in most locations .If India continues to grow rapidly, after some decades labor will become
too expensive for small shopkeepers to offer home delivery. Other developments like goods and service tax may also reduce their ability to evade sales tax and
income tax.
But long before these developments reduce the shopkeepers’ edge over hypermarkets, E commerce will swamp both. E Commerce is still constrained today by
limited credit card usage ,but this is expanding very fast.E tailing has become an important part of consumer shopping behavior and is here to stay in times to
come. Though it might not replace brick and mortar stores completely, its impact can be significant. Hence it is important for retailers to redefine their strategies
to sustain their business in the future. Fifty million small shop keepers went on strike to skotch hyper markets.But neither they nor Mamta Banerjee can stop E
commerce.That’s no disaster. The traditional Bania is ready to stand in his shop 12 hours a day, but not his educated children.Just as the children of educated
farmers want to get out of farming ,the children of shop keepers want to get out of retail.We need ecomomic reforms to bring in foreign hyper markets .
SUGGESTIONS FOR ORGANIZED RETAILERS
• Since E tailers have more impact on organized retailers than unorganized retailers, organized retailer should come up with strategies to counter the impact.
• Organised retailers should look at E tailing as an opportunity to reach out to a larger population across the market. They can do it by launching their own
online sales portals or making their products available through other portals.
• The biggest crowd puller for online stores is the discounted prices as compared to physical stores. This should be kept in mind while devising the pricing
strategy for brick and mortar stores.
• Retailers must extend more benefits to their consumers like free home delivery and more promotional offers.
FOR E-TAILERS
• Online retailers should make significant investment in technology to replicate the physical store experience for consumers. One such example is virtual
trial rooms-‘Virtual Try-on ‘-introduced by Fashionista.com and Tobi.com-an online fashion boutique in the USA which helps consumers try apparel in the
virtual world.
• Delivery time for electronic products like pendrives and storage devices are very fast. Same speed should be maintained while delivering high end
electronic goods as well.
• E tailers should continuously upgrade their existing security solutions in order to avoid fraudulent activities which can compromise the security of E tailing
websites.
REFERENCES JOURNALS
1. A Sharma and R Krishnan, 2002. "Clicks Only, Clicks Only and Bricks, And Bricks Only: Are Retail Salespeople An Important Foctor In Choice ".vol 18
Numbers 3-4,PP 317-316..
2. Amisha Gupta,2012, Foreign Direct investment in Indian retail sector: Strategic issues and implications,IJEMS,,vol 3(3),issue 1,PP 280-283.
3. Daekwan Kim,S.Tamer Cavusgil,International,2006, Journal of marketing and Advertising,,Vol.3,No1,PP 89-104.
4. Dr Shahid Akhter, Iftekhar Equbal, Jan 2012. "Organized Retailing In India-Challenges And Opportunities ".Zenith,vol 2,issue ,PP 28-291.1
5. Fang Wang, Milena Head and Norm Archer,2002. "E-Tailing: An Analyis Of Web Impact on The Retail Market", Journal of Business strategies, vol 19, Pg 73-
93,
6. Jagadish Patil, Rajesh Kanthe, 2012. "Retail In India: A Sunrise Or Sunset. ".International journal of Business Management & Research,Vol @,Issue 4,Pg 91-
96
7. Judy Harris,Pranjal gupta,2008 , “You should buy this one! The influence of online recommendations on juddgements about the recommended product
“,International journal of Electronic marketing and retailing, 2(2),PP 176-189
8. Namita Rajput, Subodh Kesharwani, Akanksha Khanna, 2012. "FDI and Indian Retail Sector: An Analysis ".Journal of Business Administration research,vol
1,No 1,PP 52-64.
9. Rich G A, 2002. "The Internet: Boom or Bust To Sales Organization ". Journal of Marketing Management,vol 18,issue 3,PP 287-300.
10. S Jacob Pratabaraj & Sarpasatha Joe, 2013. "Analysis Of Consumer Behavior In Branded Fast Food Joints",3(1),PP 11-20
11. Sapna Suri, Priya Vij And Sukhbir Singh, 2012. "E-Tailing In India: Its Issues, Opportunities And Effective Strategies For Growth And Development”,
International Journal of Business and Research,Vol 2,Issue 4,pp 91-96.
NEWSPAPERS
12. Sapna Agarwal,Feb 3,2012,”Retailers gear up for e tailing as consumers go online,Live mint and the wall street journal”
13. Swaminathan SAnklesaria Aiyar 23rd
June 2012 “Online shopping is the real threat to small shopkeepers”Times of India”
WEBSITES
14. www.blog.makemytrip.com/chasingtheonlineretaildream.html
15. www.ecommerce.com
16. www.journalofbusinessstrategy.com/e-tailing
17. www.usabilitysciences.com/shippingoptionpositivelyimpactretailwebsite.html
18. www.wikipedia.org/e-commerce

VOLUME NO. 3 (2013), I SSUE NO. 09 (SEPTEMBER ) ISSN 2231-5756
INTERNATIONAL JOURNAL OF RESEARCH IN COMMERCE, IT & MANAGEMENT A Monthly Double-Blind Peer Reviewed (Refereed/Juried) Open Access International e-Journal - Included in the International Serial Directories
http://ijrcm.org.in/
24
A MODERN CLASSIFICATION OF PRICING STRATEGIES OF RETAILERS
SREELATA
RESEARCH SCHOLAR
SCHOOL OF MANAGEMENT STUDIES
INDIRA GANDHI NATIONAL OPEN UNIVERSITY
NEW DELHI
N. V. NARASIMHAM
PROFESSOR, SCHOOL OF MANAGEMENT STUDIES, INDIRA GANDHI NATIONAL OPEN UNIVERSITY, NEW DELHI; &
DEAN
SCHOOL OF BUSINESS & ADMINISTRATION
WAWASAN OPEN UNIVERSITY
MALAYSIA
DR. M. K. GUPTA
ASSOCIATE PROFESSOR
PT. J. L. N. GOVERNMENT P.G. COLLEGE
FARIDABAD
ABSTRACT Retail is one of the fastest changing sectors in India. Price promotion tools are very integral to a retailer. The current research paper analyzes the pricing
strategies of retailers in India and abroad. These strategies are categorized into shopping event pricing strategies and non- shopping event pricing strategies. By
considering these various price related promotion strategies, the emerging retail calendar of Indian retailers is derived. An extensive study of foreign retailers’
and Indian retailers’ pricing strategies has been done through following the retail related news in Indian and Foreign retail market for a period of 3 years from
2010-13. These have helped to frame a price promotion related categorization and develop a retailer’s calendar.
KEYWORDS Retail, Pricing Strategies, Retail Price Promotions.
INTRODUCTION he retail industry is poised to touch $ 1.3 trillion by 2020. The estimated value of the retail sector at the present juncture is about $ 500 billion.
Penetration level of modern retail, which currently stands at 5 per cent, will grow about six times from the current $ 27 billion to $ 220 billion in 2020.
The Indian retail industry is going through a phase of change. It is also at this time that the retailers are witnessing the advent of new and very innovative
pricing strategies and price related promotional events. In India the retailers earlier identified two seasons the August to January season when the festive season
begins and the February to July season when the season culminated with the stock clearance sale in the month of July. But the current retail scene has changed
immensely with the entry of organized retailers.
REVIEW OF LITERATURE Swee Hoon Ang (1997) investigated the effects of price reductions expressed in percentage terms and by using an Asian setting on consumer response where
she suggested that an implausible claim produced higher shopping intention.
Srivatava Smriti (2012) studied the marketing strategies of retailers which included the promotional strategies. She concludes that that promotional offers have
a strong impact.
SymphonyIRI (2012) report on Millennial Shoppers reveals that price is an important consideration for shoppers. It suggests that retailers should come up with
promotional programs that reflects this generation’s quest for living well with less.
Raman Swati and Radhika Neela (2005) presented the case of ‘Big Bazaar’, one of the constituent stores of Pantaloon Retail India Ltd (PRIL). The case study
reveals that the major USP of Big Bazaar store is ‘low pricing to offer best price proposition to customers’. Big Bazaar offers products at prices 5% to 60% lower
than the maximum retail price. As a result of this, customers focus less on branded items (price discount normally less) and more on unbranded products (of
comparable quality as branded ones) available at a cheaper rate. This shows the importance of pricing in the context of retail scene in India.
According to Erica Betts and Peter McGoldrick (1996), ‘Sale’ shopping as a social occasion is characterized by a more highly charged atmosphere than is shopping
at other times. This first motive relates to the increased energy and enthusiasm shoppers have as a result of the atmosphere and general ambience generated
largely by other shoppers. Hence shopping fests have the effect of generating interest and attracting consumers.
David R Bell (1998) analysis that stores following Everyday Low Pricing get a greater share of visits from the large basket shoppers hence it shows that the pricing
policy has an effect on consumer behaviour.
Noel Muzondo (2011) concludes in his current study that price is very important in determining consumer choice of store in a hyperinflationary environment.
The study has confirmed that promotion is a critical element in determining shopping behaviour in a hyperinflationary environment.
SIGNIFICANCE/NEED OF THE STUDY The above studies covered some pricing strategies. The current study is initiated to understand the various pricing strategies which retailers have been adopting.
In recent times innovative events centered on price promotions have come up. In fact these events have changed the traditional “two season calendar” followed
by retailers in India. The researcher attempts to present the new retail price promotion calendar and the prevalent pricing strategies in retail sector.
OBJECTIVES OF THE STUDY The basic objective of the study is to describe the major pricing strategies that are being used by retailers in India and abroad. This study aims to:
1. Describe the pricing strategies of retailers in India and abroad
2. To analyze these pricing strategies into Non Shopping Event Pricing Strategies & Shopping Event Pricing Strategies.
T

VOLUME NO. 3 (2013), I SSUE NO. 09 (SEPTEMBER ) ISSN 2231-5756
INTERNATIONAL JOURNAL OF RESEARCH IN COMMERCE, IT & MANAGEMENT A Monthly Double-Blind Peer Reviewed (Refereed/Juried) Open Access International e-Journal - Included in the International Serial Directories
http://ijrcm.org.in/
25
3. To analyze the traditional and new shopping events centered on price promotions.
4. To draw up the new emerging calendar of retailers in India reflecting some price centered events.
5. To make suitable suggestions to retailers on the basis of research
RESEARCH METHODOLOGY SOURCES OF DATA
Secondary data regarding the pricing strategies followed by retailers in the retail industry was collected from various research papers, articles, newspaper
articles, reports and websites. The researcher has collected retail news of India and abroad for the last three years from the websites of newspapers like The
Times of India, The Economic Times, The Hindu Business Line, Mint, Business Standard, Deccan Herald, The New York Times, The Chicago Tribune, The Star
Tribune, The Guardian, The Wall Street Journal etc.
ANALYSIS AND DISCUSSION The current research paper brings forth several pricing strategies that are prevalent today. They are listed below:
• Price Advertising
• Low Price Lock
• Price Freeze
• Price Challenge
• Price Guarantee
• Individualized Prices
• Mobile Coupon Initiative
• Grocery Receipt Comparison
• Traditional Shopping Events
• Small Business Saturday
• End Of The Season Discount Sales
• Promotional Sales
• New Created Events
• Innovative Pricing Oriented Properties
These are further grouped under the following two heads:
1. Non Shopping Event Pricing Strategies like Price Advertising, Low Price Lock, Price Freeze, Price Challenge, Price Guarantee, Individualized Prices, Mobile
Coupon Initiative & Grocery Receipt Comparison.
2. Shopping Event Pricing Strategies like Small Business Saturday, End of the season discount sales, Black Friday, New Created events like the Independence
Day Sale, the Republic Day Sale, Innovative Pricing Oriented Properties like Future Group’s ‘Public Holiday Sales’ etc. These shopping events can be further
broken down into traditional and new shopping events centered on price promotions
THE NON SHOPPING EVENT PRICING STRATEGIES Price Advertising is a very commonly used pricing strategy of organized retailers nowadays. It refers to advertising price reductions and advertising prices in
relation to competitor’s prices. Value retailers typically use this strategy to entice customers. It is now common to f ewspaper inserts showing the low prices
offered by retailers. Sometimes they also compare their prices with those of competitors. Consider this case for example. Publix Super Markets, Inc., commonly
known as Publix, is an American supermarket chain based in Lakeland, Florida (Publix). Nearly a year after Wal-Mart began its price-comparison ad campaign
against other grocers; the Lakeland-based supermarket chain i.e. Publix is battling back. Publix has launched what amounts to a "bring it on" campaign to
reassure customers that the store has affordable prices — if you shop the sales and buy-one-get-one deals. The no-frills message is clear: "Wal-Mart doesn't
always have the lowest price." For example, Publix came up with a price advertising campaign “two boxes of Mueller's pasta cost $2.72 at Walmart versus $1.37
on special at Publix. Two boxes of Duncan Hines cake mix cost $2.48 at Walmart versus $1.67 at Publix. Buy every item on sale, and you'd save $97.86.”
The campaign underscores what many Publix shoppers have claimed all along, that you can save money on groceries if you do a little homework. Publix
spokeswoman Shannon Patten said the ads reflect the chain's stance that meeting customers' high expectations doesn't have to mean higher prices. The
campaign rolled out on March 7 2013 for its stores in Florida, Georgia, Alabama, South Carolina and Tennessee. "We want our loyal and potential customers to
know that we offer more than clean stores, quality products and friendly service. We offer great value," Patten said. Walmart isn't blind to Publix's
counterattacks and has no plans of backing down. The Bentonville, Ark., chain is filming TV commercials about price-comparison shopping in 50 markets
nationwide. It knows a lot of people don't like to bother with sales and coupons. Just give them the best price. (Thurston, 2013)
Following this price advertising war between Publix & Wal-Mart came Giant Eagle’s response. Giant Eagle is another retailer based in Pennsylvania. It announced
it was cutting the prices on more than 3,000 popular grocery items — a move expected to save customers about 15 percent on their grocery bills. (Lindeman, 2012)
This announcement from Giant Eagle in March 2013 is an indication for the price wars that is driven by Price Advertising (Lindeman, 2012). But price alone is
unlikely to be enough for competitors in the grocery business to battle heavyweights like Wal-Mart, which has laid out a strategy of sacrificing profit margin to
drive volume increases, said Jim Hertel, managing partner at consulting firm Willard Bishop in Barrington, Ill. That's why Giant Eagle is also mailing coupons and
gift cards directly to customers based on their buying habits.
The same retailers also uses low price lock strategy. The O'Hara grocer, rolled out "low price locks" on seasonal items starting in October 2012. The retailer
claims to deliver more than $70 million in annual savings to consumers through the thousands of goods included in its new "everyday price reduction effort."
This new round of cuts is not tied to a particular season and should be in place indefinitely, said Rob Borella, senior director of corporate communications for
Giant Eagle (Lindeman, 2012)
.
The price lock program is meant to guarantee that cost-conscious shoppers won't see price hikes on certain items at least until after Jan. 2. The O'Hara grocer's
"Low Price Lock" marketing campaign locks in prices on more than 300 items from store-brand spiral hams at $2.29 a pound to a 100-count bag of Top Care
cotton balls for $1. The grocer said some prices were reduced before being locked. The concept of locking down grocery prices has been used by various chains
around the country. The Bi-Lo chain, based in Greenville, S.C., introduced its "Price Lock" program in 2010. In that case, users of the grocer's loyalty card get a set
price on certain items for an eight-week period4 (Lindeman, 2012)
. This Low Price Lock strategy is specifically resorted to by retailers during inflationary times.
Price Freeze is another pricing strategy which is used by retailers like Wegman. Wegmans Food Markets, Inc. is a family-owned U.S. regional supermarket chain
headquartered in Gates, New York, near Rocheste. (Wegmans) In 2011, Wegmans began the program to freeze prices on food staples. The purpose of the
program, company officials said, was to help consumers who struggle with rising costs. The program has been renewed several times since. The lists generally
reflect seasonal shopping behaviors, with the summer list, for instance, having items suited to warm-weather diets and food preparation. The store has used
consumer surveys and other outreach with shoppers to help devise the lists (Tobin, 2013).
During the Christmas Shopping Season in 2012, Wal-Mart came up with its newly rolled out (and heavily advertised) Christmas Price Guarantee strategy. After
making a purchase, if a competitor advertises a lower price on the same product between November 1 and December 25, the big box retailer will match it.
Shoppers have to bring their receipt and advertisement to a store to receive the differential refund, which is made in the form of a gift card. It also seemingly
telegraphs a "we are so confident about our prices that we'll match our rivals' prices" message to consumers (Mohammed, Nov 22).

VOLUME NO. 3 (2013), I SSUE NO. 09 (SEPTEMBER ) ISSN 2231-5756
INTERNATIONAL JOURNAL OF RESEARCH IN COMMERCE, IT & MANAGEMENT A Monthly Double-Blind Peer Reviewed (Refereed/Juried) Open Access International e-Journal - Included in the International Serial Directories
http://ijrcm.org.in/
26
Price Challenge has also come up in a big way in India especially during these promotional sales. Hypermarkets run by retail biggies are outdoing each other with
price challenges, aggressive discounts and combo offerings for the Independence Day sales.Mukesh Ambani’s Reliance Retail has come out with a 10-day ‘Price
Challenge’ from August 10-19 at its Reliance Fresh, Super and Mart stores, where it challenges customers to find a cheaper deal at other stores. If they do,
Reliance Retail claims it would pay double the difference. Bharti’s ‘easyday’ has gone a step ahead and launched 18-day ‘Freedom from inflation’ offer. The chain
is also challenging consumers to find lower prices, saying it would match that if buyers indeed get better deals elsewhere (Kamath, 2012).
Target is using a combination of mobile advertising, SMS and its mobile site to educate consumers about the company’s mobile coupon initiative and encourage
them to save money on several of their favorite products. The company is running the mobile campaign within The Weather Channel’s iPhone application.
Nowadays retailers are using mobile coupons too like The Target mobile ad reads “Click to text “UPUP” to 827438 (TARGET) for coupons. When users tap on the
mobile ad, they are redirected to their SMS app that already has the short code 827438 filled in. From there, consumers have the option of texting the keyword
UPUP. If they choose to opt-in, users receive a message from Target that includes a link to its mobile site where they can learn more about the company’s
mobile coupons. When consumers click on the link, they are taken to the retailer’s mobile-optimized site where they can get coupons for their favorite Up & Up
products, which expire on April 27. The landing page features a mobile bar code that includes several coupons on many Up & Up products. Consumers can show
their phone at a Target in-store location to redeem them at the point-of-sale (Rimma, 2013).
Grocery Receipt Comparison is a new tool in the kitty of retailers to seek the attention of price conscious consumers. Walmart is testing a program that invites
consumers to send Walmart a photo of a grocery receipt from a Walmart competitor. Within a couple of days, Walmart responds with a calculation of how much
the consumer would have saved at its stores. The "Walmart Receipt Comparison Tool" went live in mid-August in Albuquerque, Chicago & Atlanta. A website set
up around the effort “seeforyourself.walmart.com/receiptcomparison” (Ryan, 2012).
Individualized Prices is another phenomenon in which with the use of data collected about consumers is used to generate specific offers for individual
consumers. Consider this case, Grocers like Safeway and Kroger are going one step further, each offering differing methods to determine individualized prices.
Hoping to improve razor-thin profit margins, they are creating specific offers and prices, based on shoppers’ behaviors, that could encourage them to spend
more: a bigger box of Tide and bologna if the retailer’s data suggests a shopper has a large family, for example (and expensive bologna if the data indicates the
shopper is not greatly price-conscious). The pricing model is expected to extend to other grocery chains — and over time could displace standardized price tags.
Even though the use of personal shopping data might raise privacy concerns among some consumers, retailers are counting on most people accepting the trade-
off if it means they get a better price for a product they want (Clifford, 2012).
SHOPPING EVENT PRICING STRATEGIES There are many traditional and new shopping events which center around price promotion. In India traditionally ther has the Off Season Discount Sale in July
and the Festive Shopping Season around Diwali. In the US, the Festive Shopping season starts with Black Friday in the month of November. New Created events
like the Independence Day Sale, the Republic Day Sale etc have also become a regular event in India. The following section details upon these Shopping Event
pricing strategies.
In US the Shopping Season starts with Black Friday which is the day following the Thanksgiving Day. Thanksgiving Day is observed on the 4th
Thursday of
November. It is regarded as the beginning of the Christmas shopping season. In recent years, most major retailers have opened extremely early and offered
promotional sales to kick off the holiday shopping season. Black Friday is not an official public holiday as such, but many non-retail employees and schools have
both Thanksgiving and the day after off, followed by a weekend, thereby increasing the number of potential shoppers. It has routinely been the busiest shopping
day of the year since 2005 (Black Friday).
Traditional Shopping Events like the Black Friday Weekend generate tremendous amount of revenue and are driven by price promotions. According to a National
Retail Federation survey conducted by BIGinsight over the thanksgiving weekend, traffic and spending grew over the entire weekend. More people than ever
before also shopped online and in stores on Black Friday, as 89 million shoppers braved the crowds, up from 86 million last year. According to the survey, a
record 247 million shoppers visited stores and websites over Black Friday weekend, up from 226 million last year. Making sure to take advantage of retailers’
promotions to the full extent, the average holiday shopper spent $423 this weekend, up from $398 last year. Total spending reached an estimated $59.1 billion.
“From green beans to great deals, millions of Americans found time this Thanksgiving to make the most of retailers’ promotions and enjoy a special family
holiday,” said NRF President and CEO Matthew Shay. “To keep their customers excited about holiday shopping, retailers will continue to offer attractive
promotions through December, and provide strong consumer value with low prices, enhanced mobile and online offerings, and unique product assortment.”
The survey was conducted on Nov. 23-24 2012 by BIGinsight for NRF in which 4,005 consumers polled (“Thanksgiving Day Promotions Win Over Millions of
Holiday Shoppers, According to NRF”, 2012).
After the thanksgiving shopping event held by big retailers, Small Business Saturday is observed in the US. Consumers are encouraged to support their local
small businesses two days after Thanksgiving. Small businesses can't usually compete with big-box stores' big sales on Black Friday, so many hope to use Small
Business Saturday to get a piece of the action during the biggest shopping weekend of the year (John, 2012)
.
In India also the shopping season starts with the festival season. There is the Diwali Shopping Sale run by prominent retailers like Future Group, Reliance Retail,
Lifestyle etc. Lifestyle department store chain Shoppers Stop achieved its highest single-day sales on Sunday i.e. 11th
Nov, 2012 at 21.59 crore.
Shoppers Stop on Monday i.e. 12th
Nov, 2012, shot off an email to all its employees about the record-breaking Sunday sales. The country's largest departmental
store chain also achieved its highest full price sales at Rs 74.53 crore during the last week, 31% more than the previous high of Rs 56.7 crore. Biyani says the
retailer has grown sales across categories to outstrip initial estimates. Sales of key categories like food, apparel and electronics have all grown by more than
20%-25% (Mukherjee, 2012).
During the same shopping festival season, Easyday, another prominent Indian Retailer launched a festive campaign. Easyday Market stores is owned and
operated by Bharti Retail. It launched a month long festive campaign, ‘Kam Daam Mein Dhoomdham’, - an exquisite assortment of compelling deals and offers
on all merchandise at its easyday Market stores, from 13th October 2012 to 16th November 2012 (“Easyday Stores Unveil a Festive Collection at Attractive
Prices”, 2012).
End of the season discount sales starts in July in India. Typically, the spring-summer sale season in India kicks off in the first weekend of July and runs through
the month. This is also a time of retailers offering deep discounts. For example, International youthful lifestyle brand, Esprit, kicked off the sale season by
offering shoppers a discount of up to 40% in 2012 sale season (Bagchi, 2012).
But in 2012 many retailers advanced their sales in June. For example, many brands including Arrow, French Connection and Puma advanced the start of their
end-of-season sales to the last week of June instead of the traditional July. Bhatia of Pantaloons says more and more customers now wait to shop during the
sales seasons. Almost 30% of Pantaloons' revenues are generated during the discount seasons for the last four-five years. Lavina Rodrigues, marketing manager
at Metro Shoes Ltd, which sells multi-brand footwear through 175 outlets across the country, says the company is yet to gauge the sales records for the two-day
flat 50% sale this year, but indications are it is same as July last year. She says Metro is generally able to sell almost 60% of the old stocks during the sales
periods. In some cities like Rajkot, where consumers are more receptive of the discount season, the company would get rid of almost 85% of the old stuff (Rasul
Bailay, 2012).
The sale period was also extended by a month and was continued till August. ‘Sale’ season in the country started around end-May, but was extended by eight
weeks. For instance, Shoppers Stop was still busy luring ‘shopaholics’ to stores with flat 51 per cent discount till August last year. “What typically used to be a
month-long phenomenon has become a 3-month affair now. said Devangshu Dutta of retail consulting firm, Third Eyesight (Pani, 2012).
Again in January there is another round of off season sale. Last year The end-of-season sale lasted as long as seven-eight weeks, against the norm of four-five
weeks (Tandon, 2013).
But the Indian retail industry has seen a lot new created events hovering around price promotion in the recent few years. Today there are promotional sales like
the Independence Day Sale, The Republic Day Sales and innovative Pricing Oriented Properties like the recently concluded Public Holiday Sale.

VOLUME NO. 3 (2013), I SSUE NO. 09 (SEPTEMBER ) ISSN 2231-5756
INTERNATIONAL JOURNAL OF RESEARCH IN COMMERCE, IT & MANAGEMENT A Monthly Double-Blind Peer Reviewed (Refereed/Juried) Open Access International e-Journal - Included in the International Serial Directories
http://ijrcm.org.in/
27
Promotional Sales around Independence Day is held by retailers in India. For example, Top consumer electronics retailers have sold most of their months-old
inventory in just one week of promotional sale around the Independence Day when consumers surprised them by flooding stores, kindling hopes of a revival in
discretionary spending and forcing companies to ramp up production. Future Group's electronic retail chain eZone recorded 50% jump in sales across its 38
stores. It sold more than 25,000 mobile phones, 600 tablets, 1,800 LCD and LED televisions on I-Day alone, clearing out its inventory. Similarly, Videocon Group's
electronic retail chain Next said its sales grew 30% y-o-y. These promotional sales are very relevant for items of discretionary spending. Discretionary spending
includes travel, entertainment and gadgets where people spend only if they have enough disposable funds to do so (Malviya, 2012).
But Kishore Biyani has taken this concept further by launching his Big Bazaar Maha Bachat Program. India's largest hypermarket chain, Big Bazaar, started its
annual nationwide event '6 Days MahaBachat' on the occasion of Independence Day from August 10. Commencing with a slogan "Megengai Pe HALLA BOL", the
scheme is being launched at all 164 stores of Big Bazar, Food Bazaar and FBB Stores across the nation simultaneously. The MahaBachat event, which will
conclude on August 15, has exciting array of attractive offers and discounts. Big Bazar scheme will have something for everyone from daily household goods to
food, grocery, apparel, footwear, toys, luggage, kitchenware, bed, and bath ware, home decor, furniture, electronics and more ( “Big Bazaar begins 6 days
MahaBachat event across the country”, 2012).
‘Created events’ such as Republic Week and Independence Week have helped top modern retailers record higher sales than during the Diwali week in big cities,
says a study by Nielsen, the world’s largest information and insights provider.
Republic Week sales grossed 9% higher sales than the Diwali week while Independence Week overtook the festive week by 6% last year, according to the study
by Nielsen’s analytical services Scantrack, which tracked FMCG sales of seven key modern retailers in five cities.
A combination of factors, including retailers increasingly partnering consumer goods companies to offer better deals often and nervous consumers trying to do
most their shopping during sales in a slowing economy, have led to a dramatic rise in the number of discounting events created by modern retailers (Malviya S. ,
2013).
Innovative Pricing Oriented Properties like Future Group’s “Public Holiday Sales” is another example of a recent pricing oriented events in Indian retail sector.
The four-day Mega Sale starting from April 28 to May 1 will offer deals and discounts on wide range of products across various categories. PSU employees will
get a special bonanza on Labour Day, as showing their employee ID cards can help them get special offers at the retail outlet. Mr Sadashiv Nayak, CEO, Big
Bazaar, said, “Big Bazaar has been a forerunner in creating a new paradigm in Indian retail sectors through properties like Sabse Saste Din and Republic Day Sale.
Over the years these innovative properties have become industry practices and most awaited shopping days for Indian consumers ( “Big Bazaar's Labour Day
offer”, 2013).”
These Pricing Oriented Properties have become very relevant. If Future Group ran “Public Holiday Sale” from from April 28 to May1 then reliance followed it up
with the “Sabse Sachi Sale from 1st May to 6
th May. A combination of factors, including retailers increasingly partnering consumer goods companies to offer
better deals often and nervous consumers trying to do most their shopping during sales in a slowing economy, have led to a dramatic rise in the number of
discounting events created by modern retailers. Adrian Terron, executive director, shopper and retailer, at Nielsen India, says such events mark the best
opportunity to strengthen shopper loyalty. “The Indian shopper behaves differently during these bursts of modern trade events, and she is encouraged to shop
differently by responding to deals and her own instincts to explore more than she would in routine shopping trips,” he says. With deal-seekers turning their
focus to such events, retailers are creating more such discounting weeks. Retailers are perhaps already aware of this trend and that maybe why they rolled out
their latest created event on May 1. That, along with the rising number of such events, may also explain a slowdown in Republic Week sales growth to 8% this
year from nearly 58% jump last year (Malviya S. , 2013).
FINDINGS AND CONCLUSIONS There have been tremendous changes in the Indian retail sector in the recent times and with modernization of retail sector these changes will keep on
increasing. These changes are in terms of the price oriented pricing strategies being adopted by retailers, the shopping events conducted by the retailers and the
calendar followed by retailers.
The current section brings out these major strategies, their categorization into Non-shopping Event Pricing Strategies and Shopping Event Pricing Strategies. This
categorization is further followed through the breaking up of Shopping Event Pricing Strategies into Traditional Pricing Events and New Pricing Events.
The major findings of the current study are listed below:
1. The pricing related strategies of retailers as per the timing of occurrence may be broadly classified into two categories; The Non Shopping Event Pricing
Strategies and the Shopping Event Pricing Strategies as given in the following figure.
FIG 1: CLASSIFICATION OF PRICING SRATEGIES
Classification of Pricing Strategies
Non Shopping
Event Pricing
Strategies
Price Freeze
Low Price Lock
Price Advertising
Price Challenge
Price Guarantee
Individualized Prices
Mobile Coupon Initiative
Shopping Event Pricing Strategies
Traditional Shopping Events
Off Season Discount Sale
Festive Season Shopping Sale
New Shopping Events
Promotional Sales like Independence
Day Sale
Innovative Pricing Properties like
Public Holiday Sale

VOLUME NO. 3 (2013), I SSUE NO. 09 (SEPTEMBER
INTERNATIONAL JOURNAL OF RESEARCH IN COMMERCEA Monthly Double-Blind Peer Reviewed (Refereed
2. The Non Shopping Pricing Strategies are mainly influenced to entice consumers from competitors or to provide a reason to shop during inflation
or to make people buy more like price advertising, low price lock, price freeze, price challenge, price guarantee, indivi
initiative and grocery receipt comparison. These strategies are adopted by the western retailers like Wegmans, Wal
3. The shopping events may also be further categorized into the traditional and the nontraditional events.
4. Traditional shopping events are Black Friday Sale, Off Season Discount Sale, Diwali Festive Season Sale. These are used to ei
the case of off-season discount sale during July. During this time, retailers offer deep discoun
objective varies within cultural contexts. In US where the shopping season culminates with the Christmas Sale it is held more
the Diwali Festive Season Sale is held more for family consumption as well as for gifting purposes. Traditional shopping events have been in vogue for a
long time. These are usually associated with a country’s festive season or changes in season.
5. Nontraditional shopping events are a relatively n
events like Independent Day Sale, Republic Day Sale and Public Holiday Sales. These are held by big retailers like Reliance a
main idea of big retailers behind these events is to attract the first time shoppers. In these events deep discounts are offe
publicized through print media like newspapers and pamphlets as also broadcast media like radio.
6. The earlier retail calendar in India consisted of primarily two events i.e.
� the off season discount sale in July and in January.
� and the Festive Shopping Season starting in August with Raksha Bandhan and culminating with Diwali in October or November.
� Traditional Retail Calendar vs the Modern Retail Calendar
FIG. 2: TRADITIONAL RETAIL C
7. The modern retail calendar in India is jam-packed
� Innovative Pricing Properties are lined up in the month of May like Future Group’s
also offer huge discounts on monthly grocery items as well as other consumer durables.
� The off season discount sale is preponed to June and may be extended till August
� August has the promotional sales running in the form of Independence Day sale wherein monthly grocery items like atta, rice, dal and personal care
items like soap, shampoos as well as toiletries are included. There are many buy 1 get offers, multiple product bundles avail
Consumer durables are also having price discount offers.
� October, November is time for Festive Sale of Diwali. Earlier consumer durable were only the items showing price discounts bu
groceries are also included. Like Easyday’s Kam Daam Mein Dhoom Dhaam which offered deals and offers on all merchandise at its easyday Market
stores
8. Price Advertising is a tool in the hands of big retailers like Wal
huge volumes. Regional retailers may adopt low price lock strategy in times of inflation like Giant Eagle did in October 2012
strategy during inflationary times. Consumers would not have to compare prices on a daily ba
a period of time. This will ensure a more stable demand for the retailers too.
9. Big national level retailers like Target and Wal-Mart use internet for price related strategies like Mobile Cou
are relatively new pricing initiatives.
SUGGESTIONS 1. The Non Shopping Pricing Strategies like price advertising, low price lock, price freeze, price challenge, price guarantee, i
coupon initiative and grocery receipt comparison are used mainly by foreign retailers. These are used to mainly entice consum
provide a reason to shop during inflationary times or to make people buy more. These strategies are ado
Mart. These strategies can also be used by Indian retailers.
2. Big retailers have used Nontraditional shopping events in the form of Created events like Independent Day Sale, Republic Day
to attract the first time shoppers. Small retailers can also tie
up with an event like on the lines of Small Business Saturday
encouraged to support their local small businesses two days after Thanksgiving as the small retailers can not compete with big
Black Friday. In Indian context also this can be used as a pricing based event by the small retailers.
3. Internet is unavoidable for the present day retailers. Big national level retailers of U S like Target and Wal
Mobile Coupons and Grocery Receipt Comparison. These are relatively new pricing initiatives. Regional retailers should also m
REFERENCES JOURNALS
1. David R. Bell, James M. Lattin, “Shopping Behavior and Consumer Preference for Store Price Format: Why “Large Basket” Shopper
Science/Vol. 17, No. 1, 1998, pp. 66–88
2. Erica J. Betts and Peter J. McGoldrick, 1996, "Consumer behaviour and the retail sales: Modelling the development of an attitude problem", European
Journal of Marketing, Vol. 30, Issue 8, pp 40-58
3. Noel Muzondo and Edward Mutandwa, “The Seven Ps Of Marketing And Choice Of Main Grocery Sto
Marketing Review Vol. 1(9) pp. 01 – 18, November, 2011
4. Roy Subhadip, 2005, “Factors governing consumers’ choice of supermarkets & segmenting them into identifiable groups
IUP Journal of Services Marketing, December, pp 21
5. Smriti Srivastava, International Journal of Research in Finance & Marketing, Volume 2, Issue 2, “Marketing Strategies Adopted
Case Study Of Max Lifestyle Store-Phoneix Mall, Lucknow”, Pg 142
the off season discount sale in July & January.
• and the Festive Shopping Season starting in August with Raksha Bandhan and culminating with Diwali in October or November.
EPTEMBER )
INTERNATIONAL JOURNAL OF RESEARCH IN COMMERCE, IT Refereed/Juried) Open Access International e-Journal - Included in the International Serial Directories
http://ijrcm.org.in/
Pricing Strategies are mainly influenced to entice consumers from competitors or to provide a reason to shop during inflation
or to make people buy more like price advertising, low price lock, price freeze, price challenge, price guarantee, indivi
initiative and grocery receipt comparison. These strategies are adopted by the western retailers like Wegmans, Wal-
The shopping events may also be further categorized into the traditional and the nontraditional events.
Traditional shopping events are Black Friday Sale, Off Season Discount Sale, Diwali Festive Season Sale. These are used to ei
season discount sale during July. During this time, retailers offer deep discounts exceeding 40% or more. During Festive Season sale, the
objective varies within cultural contexts. In US where the shopping season culminates with the Christmas Sale it is held more
ore for family consumption as well as for gifting purposes. Traditional shopping events have been in vogue for a
long time. These are usually associated with a country’s festive season or changes in season.
Nontraditional shopping events are a relatively new phenomenon especially in the Indian context. These Nontraditional Shopping Events include created
events like Independent Day Sale, Republic Day Sale and Public Holiday Sales. These are held by big retailers like Reliance a
main idea of big retailers behind these events is to attract the first time shoppers. In these events deep discounts are offe
publicized through print media like newspapers and pamphlets as also broadcast media like radio.
he earlier retail calendar in India consisted of primarily two events i.e.
the off season discount sale in July and in January.
and the Festive Shopping Season starting in August with Raksha Bandhan and culminating with Diwali in October or November.
ditional Retail Calendar vs the Modern Retail Calendar
TRADITIONAL RETAIL CALENDAR VS THE MODERN RETAIL CALENDER
Innovative Pricing Properties are lined up in the month of May like Future Group’s Public Holiday Sale and Reliance’s Sabse Sachi Sale. These events
also offer huge discounts on monthly grocery items as well as other consumer durables.
The off season discount sale is preponed to June and may be extended till August
ional sales running in the form of Independence Day sale wherein monthly grocery items like atta, rice, dal and personal care
items like soap, shampoos as well as toiletries are included. There are many buy 1 get offers, multiple product bundles avail
Consumer durables are also having price discount offers.
October, November is time for Festive Sale of Diwali. Earlier consumer durable were only the items showing price discounts bu
Kam Daam Mein Dhoom Dhaam which offered deals and offers on all merchandise at its easyday Market
Price Advertising is a tool in the hands of big retailers like Wal-Mart. These retailers have the advantage of being national retailers and hence they
huge volumes. Regional retailers may adopt low price lock strategy in times of inflation like Giant Eagle did in October 2012
strategy during inflationary times. Consumers would not have to compare prices on a daily basis as they will be assured that prices shall stay constant over
a period of time. This will ensure a more stable demand for the retailers too.
Mart use internet for price related strategies like Mobile Coupons and Grocery Receipt Comparison. These
The Non Shopping Pricing Strategies like price advertising, low price lock, price freeze, price challenge, price guarantee, i
coupon initiative and grocery receipt comparison are used mainly by foreign retailers. These are used to mainly entice consum
provide a reason to shop during inflationary times or to make people buy more. These strategies are adopted by the western retailers like Wegmans, Wal
Mart. These strategies can also be used by Indian retailers.
Big retailers have used Nontraditional shopping events in the form of Created events like Independent Day Sale, Republic Day
to attract the first time shoppers. Small retailers can also tie-up with companies to offer such event based shopping events or better still they may follow it
Small Business Saturday which is observed in the US after the Thanksgiving event of big retailers. Consumers are
nesses two days after Thanksgiving as the small retailers can not compete with big
Black Friday. In Indian context also this can be used as a pricing based event by the small retailers.
etailers. Big national level retailers of U S like Target and Wal-Mart use internet for price related strategies like
Mobile Coupons and Grocery Receipt Comparison. These are relatively new pricing initiatives. Regional retailers should also m
David R. Bell, James M. Lattin, “Shopping Behavior and Consumer Preference for Store Price Format: Why “Large Basket” Shopper
ldrick, 1996, "Consumer behaviour and the retail sales: Modelling the development of an attitude problem", European
Noel Muzondo and Edward Mutandwa, “The Seven Ps Of Marketing And Choice Of Main Grocery Store In A Hyperinflationary Economy”, Contemporary
18, November, 2011
Roy Subhadip, 2005, “Factors governing consumers’ choice of supermarkets & segmenting them into identifiable groups
Journal of Services Marketing, December, pp 21-35.
Smriti Srivastava, International Journal of Research in Finance & Marketing, Volume 2, Issue 2, “Marketing Strategies Adopted
Lucknow”, Pg 142 (Swee Hoon Ang, 1997)-159.
the off season discount sale in July & January.
and the Festive Shopping Season starting in August with Raksha Bandhan and
Modern Retail Calendar
• Innovative Pricing Properties are lined up in the month of May like Future Group’s Public Holiday Sale and Reliance’s Sabse Sachi Sale. These events also offer huge discounts on monthly grocery items as well as other consumer durables.
• The off season discount sale of July is preponed to June and may be extended till August
• August has the promotional sales running in the form of Independence Day sale wherein monthly grocery items like atta, rice, dal and personal care items like soap, shampoos as well as toiletries are included. There are many buy 1 get offers.
• Come January and there is again off season sale for 4extended till March in 2012.
ISSN 2231-5756
, IT & MANAGEMENT Included in the International Serial Directories
28
Pricing Strategies are mainly influenced to entice consumers from competitors or to provide a reason to shop during inflationary times
or to make people buy more like price advertising, low price lock, price freeze, price challenge, price guarantee, individualized prices, mobile coupon
-Mart.
Traditional shopping events are Black Friday Sale, Off Season Discount Sale, Diwali Festive Season Sale. These are used to either clear old inventories like in
ts exceeding 40% or more. During Festive Season sale, the
objective varies within cultural contexts. In US where the shopping season culminates with the Christmas Sale it is held more for gifting purposes. In India,
ore for family consumption as well as for gifting purposes. Traditional shopping events have been in vogue for a
ew phenomenon especially in the Indian context. These Nontraditional Shopping Events include created
events like Independent Day Sale, Republic Day Sale and Public Holiday Sales. These are held by big retailers like Reliance and Future Group’s Big Bazar. The
main idea of big retailers behind these events is to attract the first time shoppers. In these events deep discounts are offered. These events are highly
and the Festive Shopping Season starting in August with Raksha Bandhan and culminating with Diwali in October or November.
N RETAIL CALENDER
Public Holiday Sale and Reliance’s Sabse Sachi Sale. These events
ional sales running in the form of Independence Day sale wherein monthly grocery items like atta, rice, dal and personal care
items like soap, shampoos as well as toiletries are included. There are many buy 1 get offers, multiple product bundles available at lower rates.
October, November is time for Festive Sale of Diwali. Earlier consumer durable were only the items showing price discounts but now monthly
Kam Daam Mein Dhoom Dhaam which offered deals and offers on all merchandise at its easyday Market
Mart. These retailers have the advantage of being national retailers and hence they have
huge volumes. Regional retailers may adopt low price lock strategy in times of inflation like Giant Eagle did in October 2012. They can also use Price Freeze
sis as they will be assured that prices shall stay constant over
pons and Grocery Receipt Comparison. These
The Non Shopping Pricing Strategies like price advertising, low price lock, price freeze, price challenge, price guarantee, individualized prices, mobile
coupon initiative and grocery receipt comparison are used mainly by foreign retailers. These are used to mainly entice consumers from competitors or to
pted by the western retailers like Wegmans, Wal-
Big retailers have used Nontraditional shopping events in the form of Created events like Independent Day Sale, Republic Day Sale and Public Holiday Sales
t based shopping events or better still they may follow it
which is observed in the US after the Thanksgiving event of big retailers. Consumers are
nesses two days after Thanksgiving as the small retailers can not compete with big-box stores' big sales on
Mart use internet for price related strategies like
Mobile Coupons and Grocery Receipt Comparison. These are relatively new pricing initiatives. Regional retailers should also match up such initiatives.
David R. Bell, James M. Lattin, “Shopping Behavior and Consumer Preference for Store Price Format: Why “Large Basket” Shoppers Prefer EDLP, Marketing
ldrick, 1996, "Consumer behaviour and the retail sales: Modelling the development of an attitude problem", European
re In A Hyperinflationary Economy”, Contemporary
Roy Subhadip, 2005, “Factors governing consumers’ choice of supermarkets & segmenting them into identifiable groups - A multivariate approach”, The
Smriti Srivastava, International Journal of Research in Finance & Marketing, Volume 2, Issue 2, “Marketing Strategies Adopted By Retailers In Retail Store: A
Modern Retail Calendar
Innovative Pricing Properties are lined up in the month of May like Future Group’s Public Holiday Sale and Reliance’s Sabse Sachi Sale. These events also offer huge discounts on monthly grocery items as well as other consumer
The off season discount sale of July is preponed to June and may be extended till
August has the promotional sales running in the form of Independence Day sale wherein monthly grocery items like atta, rice, dal and personal care items like soap, shampoos as well as toiletries are included. There are many buy 1 get
Come January and there is again off season sale for 4-5 weeks which was

VOLUME NO. 3 (2013), I SSUE NO. 09 (SEPTEMBER ) ISSN 2231-5756
INTERNATIONAL JOURNAL OF RESEARCH IN COMMERCE, IT & MANAGEMENT A Monthly Double-Blind Peer Reviewed (Refereed/Juried) Open Access International e-Journal - Included in the International Serial Directories
http://ijrcm.org.in/
29
6. Swee Hoon Ang, Siew Meng Leong and Wei Lin Tey “Effects of price reduction sale ads on consumer responses”, Pricing Strategy & Practice Volume 5,
Number 3, 1997, pp. 116–125
7. SymphonyIRI Report, “Millennial Shoppers: Tapping into the Next Growth Segment”, July 2012
WEBSITES
8. “Publix fights back against Wal-Mart’s Price Comparison Campaign”, March 23, 2013, http://www.tampabay.com/news/business/retail/publix-fights-back-
against-walmarts-price-comparison-campaign/2110684, (March 24, 2013)
9. Kats Rimma, “Target intensifies mobile coupon push via interactive marketing campaign”, March 25, 2013, http://www.mobilecommercedaily.com/target-
intensifies-mobile-coupon-push-via-interactive-marketing-campaign, (March 25, 2013)
10. Teresa F. Lindeman , Pittsburgh Post-Gazette, “Giant Eagle conveys to its customers how much are they saving each year”, March 21, 2013,
http://www.post-gazette.com/stories/business/news/giant-eagle-steps-up-its-price-war-680246/, (March 21, 2013)
11. Tom Tobin, Rochester (N.Y.) Democrat and Chronicle , Jan 02, 2013, “Wegmans freezes some food prices again Wegmans renews popular program”, Jan
03, 2013, http://www.usatoday.com/story/money/2013/01/02/wegmans-freezes-some-prices/1805267/
12. Rafi Mohammed , “Black Friday 2011: Advantage Retailers”, Nov 22, 2011, http://blogs.hbr.org/cs/2011/11/black_friday_2011_advantage_re.html,
13. Oliver St. John, USA TODAY http://www.usatoday.com/story/money/business/2012/11/22/small-business-saturday-holiday-shopping/1717673/, , “Small
Business Saturday is a big hit”, Nov 22, 2012.
14. http://www.nrf.com/modules.php?name=News&op=viewlive&sp_id=1462, “Thanksgiving Day Promotions Win Over Millions of Holiday Shoppers,
According to NRF”, Nov 25, 2012
15. Writankar Mukherjee, ET Bureau, Diwali: Big retailers like Shoppers Stop, Future Group join bash as sales match pre-slowdown days”, Nov 30, 2012,
http://articles.economictimes.indiatimes.com/2012-11-13/news/35086586_1_diwali-sales-jump-in-overall-sales-big-retailers
16. http://www.indiaeducationdiary.in/showEE.asp?newsid=16088, “Easyday Stores Unveil a Festive Collection at Attractive Prices”, October 15, 2012
17. http://www.post-gazette.com/stories/business/news/giant-eagles-lock-joins-industry-effort-to-keep-shoppers-spending-in-holiday-season-
657084/#ixzz293HxrJtv, “Giant Eagle's 'lock' joins industry effort to keep shoppers spending in holiday season”, October 11, 2012, Teresa F. Lindeman
18. http://www.detroitnews.com/article/20121010/BIZ/210100329/Halloween-sales-scream-worthy, “Halloween sales to be scream-worthy “ ,
Karen Dybis
19. http://en.wikipedia.org/wiki/Black_Friday_%28shopping%29, 7th
May 2013.
20. Anshul Dhamija & Shrabonti Bagchi , http://articles.timesofindia.indiatimes.com/2012-07-01/mumbai/32494453_1_sale-season-brands-retailers, “Your
retail therapy starts with extra time”, TNN Jul 1, 2012.
21. Priyanka Pani, http://www.thehindubusinessline.com/marketing/festive-sales-may-fall-flat-on-extended-discount-season/article3844703.ece, Business
Line, The Hindu, “Festive sales may fall ‘flat’ on extended discount season”, Aug 31, 2012.
22. Tom Ryan , http://www.retailwire.com/discussion/16234/walmart-tests-grocery-receipt-comparison-tool “Walmart Tests Grocery Receipt Comparison
Tool” By August 27, 2012
23. http://articles.economictimes.indiatimes.com/2012-08-21/news/33302931_1_festive-season-sales-peak-viveks, The Economic Times, “Electronics retailers
clear inventory after Independence Day boom”, Writankar Mukherjee & Sagar Malviya, ET Bureau Aug 21, 2012.
24. http://indiatoday.intoday.in/story/big-bazaar-6-days-mahabachat-across-the-country/1/212714.html, India Today Online New Delhi, August 10, 2012, “Big
Bazaar begins 6 days MahaBachat event across the country”
25. http://www.business-standard.com/india/news/retail-biggies-outdo-each-otherprice-challenges-discounts/483144/, Business Standard, “Retail biggies
outdo each other with price challenges, discounts”, Raghavendra Kamath / Mumbai Aug 13, 2012
26. http://www.thehindubusinessline.com/marketing/big-bazaars-labour-day-offer/article3361080.ece, The Hindu Business Line, “Big Bazaar's Labour Day
offer”, New Delhi, 27th April 2013.
27. http://www.nytimes.com/2012/08/10/business/supermarkets-try-customizing-prices-for-shoppers.html?_r=1&pagewanted=all, The New York Times,
“Shopper Alert: Price May Drop for You Alone”, Stephanie Clifford, Published: August 9, 2012. A version of this article appeared in print on August 10,
2012, on page A1 of the New York edition with the headline: Shopper Alert: Price May Drop For You Alone.
28. http://articles.economictimes.indiatimes.com/2012-08-07/news/33083816_1_retail-sector-modern-retailers-retail-industry, “The Economic Times”,
“Modern retail to grow 6-times to $220 billion by 2020: Ficci study”, PTI Aug 7, 2012
29. Bailay, Sarah Jacob & Sagar Malviya,http://articles.economictimes.indiatimes.com/2012-07-17/news/32714571_1_end-of-season-sales-discount-sales-
kailash-bhatia, “The Economic Times”, “End-season sale lures shoppers back to malls and high streets”, Rasul ET Bureau Jul 17, 2012
30. “With more Reasons to Shop, Diwali’s Passé - R •Day & I •Day Week Sales Top Festive Buying”, The Economic Times , 8th May 2013, Pg 4, Sagar Malviya.

VOLUME NO. 3 (2013), I SSUE NO. 09 (SEPTEMBER ) ISSN 2231-5756
INTERNATIONAL JOURNAL OF RESEARCH IN COMMERCE, IT & MANAGEMENT A Monthly Double-Blind Peer Reviewed (Refereed/Juried) Open Access International e-Journal - Included in the International Serial Directories
http://ijrcm.org.in/
30
LEADERSHIP CONCEPT: AN OPINION SURVEY IN A PRIVATE SECTOR AND GOVERNMENT SECTOR
DR. E. LOKANADHA REDDY
PROFESSOR
SRI VENKATESWARA COLLEGE OF ENGINEERING & TECHNOLOGY
CHITTOOR
DR. G HARANATH
ASST. PROFESSOR
DEPARTMENT OF COMMERCE
YOGI VEMANA UNIVERSITY
KADAPA
ABSTRACT The importance of leadership has been realized by the management owing to various revelations brought out by different researchers in various related fields of
management. The present study is conducted in Government General Hospital and Indo National Limited in Nellore district. The objective of the study is to
examine the views of the employees on leadership, an ideal leader and leadership qualities. The study is mainly based on primary data collected from the
employees of Government General Hospital and Indo National Limited in Nellore district, by making personal visits through a schedule prepared for this purpose.
The present study confines to doctors, managers, assistant officers and clerical staff employees. The data collected through the schedules from primary source
have been processed and the results obtained by employing appropriate statistical tool like percentage It is found that ‘guiding’ is the preferred meaning for the
leadership; ‘father’ was preferred as leader; the desirable quality of a leader is knowledge and undesirable quality of a leader is pride.
JEL CODE M12
KEYWORDS Leadership, Leadership Traits, Ideal Leader, Government Employees, Private Employees.
INTRODUCTION he importance of leadership has been realized by the management owing to various revelations brought out by different researchers in various related
fields of management. It is presumed that satisfaction is the cause for increasing the productivity while dissatisfaction for industrial strife and poor
performance. The satisfaction and dissatisfaction among people in the organizations are related to leadership directly and indirectly. As such, the studies
related to the concept would be of much importance to the managers, employees and academicians alike. The present study is conducted in Government
General Hospital and Indo National Limited in Nellore district.
CONCEPT OF LEADERSHIP There are as many definitions of leadership as there are scholars who have attempted to analyze and understand the concept, but there is no universally
accepted definition of it1. The word ‘leader’ stems from the root leden meaning ‘to travel’ or ‘show the way’. It has been derived from the verb “to lead.” This
also implies “to advance,” “to expel,” “to stand out,” to guide and govern the actions of others. A leader is a person who leads a group of followers.
The Oxford English Dictionary (1933) notes that the word "leader” appeared in the English language as early as 1300 A.D. However, the word “leadership” did
not appear until about 1800 A.D. 2
Albeit, leadership appears to be a rather sophisticated concept, words meaning ‘chief’ or ‘king’ are the only ones found in
many languages to differentiate the ruler from other members of society. A preoccupation with leadership occurred predominantly in countries with Anglo-
Saxon heritage. However, leaders have always been there in all cultures throughout history and the practice and philosophy of leaders and leadership can be
gleaned from well-known writings as diverse in content, philosophy, and time as the Greek classic Homer’s Iliad, the Old and New Testaments of the Bible, the
Mahabharata, the Ramayana, the Bhagavatha and the Kautilya’s Arthashastra in India, essays of Confucius in China, Machiavelli’s The Prince which is concerned
with rules and principles for obtaining and holding power.
But, the understanding, developing, predicting and managing the behaviour of leaders is still an enigma, despite the fact there are about 33,000 articles and
books have been written about so far in 20th
century. The basic question is ‘what in fact constitutes leadership?’ While Gore and Silander3 have mentioned about
five thousand entries on the concept of leadership, Stogdill4 reviewed seventy two definitions of leadership. Karmel
5 is of the opinion that it is very difficult to
settle on a single definition of leadership that is general enough to accommodate these many meanings and specific enough to serve as an operationalisation of
the variable. However, there is a certain underlying unity among the various conceptualizations made in this area.
According to Management Guru, Peter F. Drucker6, “Leadership is the lifting of man’s visions to higher sights, the raising of a man’s performance to a higher
standard, the building of a man’s personality beyond its normal limitations.”
Different scholars have focused on multiple aspects of leadership like: the creative and directive force of morale (Munson7, 1981); the process by which an
agent induces a subordinate to behave in a desired manner (Bennis8,1959); the presence of a particular influence relationship between two or more persons
(Hollander and Jullian9, 1969); directing and coordinating the work of group members (Fiedler
10,1967); an interpersonal relationship in which others comply
because they want to, not because they have to (Merton11
, 1969); transforming followers, creating visions of the goals that may be attained, and articulating for
the followers the way to attain these goals (Bass12
, 1985; Tichy and Devanna13
, 1986); the process of influencing an organised group toward accomplishing its
goals (Roach and Behling14
, 1984); actions that focus resources to create desirable opportunities (Campbell15
, 1991); the leaders job is to create conditions for
the team to be effective (Ginnett16
, 1996); etc. According to Andrew17
(1998), some view leadership as the personal relationship between the individual and the
group; others as the process of striving toward common goals and values; still others, as aspects of behaviour, whether desired and in control of the individual
or, alternatively, reactive and driven by forces in the environment.
Various definitions and concepts of leadership have been reviewed by a number of scholars including Morris and Seeman18
; Shartle19
; Carter20
; Gibb21
and Bass22
.
From such syntheses the leadership has been defined as an initiation of structure; a locus of group processes; as an art of inducing compliance; as an exercise of
influence; as an actor behaviour; as a goal achievement; as an effect of interaction; as a differentiated role, and as a personality and its effects.
The functions of leadership however cover a wide range of activities like coordination, decision making, policy making, group representing, controlling,
arbitrating etc. Leadership, not being a single phenomenon, is affected by many variables and involves with several skills like technical, human, conceptual,
designing, creative, communicative and designing. The main aspect of influencing people by a leader is the power which has many sources. The leadership
T

VOLUME NO. 3 (2013), I SSUE NO. 09 (SEPTEMBER ) ISSN 2231-5756
INTERNATIONAL JOURNAL OF RESEARCH IN COMMERCE, IT & MANAGEMENT A Monthly Double-Blind Peer Reviewed (Refereed/Juried) Open Access International e-Journal - Included in the International Serial Directories
http://ijrcm.org.in/
31
effectiveness covers the personality of a leader, his past experience; his expectations of superiors; the characteristics of subordinates; the requirements of the
task; and the organizations.
Twentieth century has witnessed several theories on leadership which is a complex concept having a bearing on motivation morale, organization climate, human
relations, and communication. The ability to influence people in a group is indispensable in organizations. Beginning with scientific management the
evolutionary process of leadership can be traced with three theories viz., trait theory, behavioural theory and contingency theory. The trait theory has been put
to rigorous research by Byrd, Jennings, Gheselli, Stogdill etc., and resulted in the development of behavioural theory. Likert’s system 4 theory, Mc Gregor x and
y theory, continuous theory of Tennenbanm and Schmudt, etc. has opened new vistas on the behavioural dimensions of leadership. The confusion and
controversy of trait and behvioural theories have given way to the contingency model of leadership like fielder’s contingency model, known and Yetton
contingency model, path goal theory, life cycle theory, tri-dimensional model, learning model, etc.
TRAIT APPROACH TO LEADERSHIP Early studies of leadership in the 1940s and the 1950s concluded that leadership is largely a matter of personality, a function of specific traits. A successful
leader not only secures the desired behaviour from his followers but succeeds in creating a sense of satisfaction among them. Leadership traits cannot be fixed
with certainty for all leaders. But a leader cannot be effective unless he possesses certain basic qualities. The following are some of the studies that attempted
to identify these traits:
Ordway Tead23
has suggested ten qualities of a good leader: 1. Physical and nervous energy, 2. Sense of purpose and direction, 3.Enthusiasm, 4.Friendliness and
affection, 5. Integrity, 6. Technical mastery, 7. Decisiveness, 8. Intelligence, 9. Teaching skill, and 10. Faith.
Chester I. Barnard24
has indicated two aspects of leadership traits: 1. Commanding subordinates admiration includes outstanding qualities in respect of physique,
skill, technology, perception, knowledge, memory and imagination, and 2. Individual superiority in determination, persistence, endurance and courage.
Henry Fayol25
regards the qualities of a good leader as: 1. Health and physical fitness, 2. Intelligence and mutual vigour, 3. Moral qualities, 4. Knowledge, and 5.
Managerial ability.
George R. Terry26
has suggested the qualities as: 1. Energy - both mental and physical, 2. Emotional stability, 3. Knowledge of human relations, 4. Empathy, 5.
Objectivity, 6. Personal motivation, 7. Communication skills, 8. Teaching ability, and 9. Social skills and technical competence.
Stogdill27
identifies through research the traits as: 1. Physical characteristics such as age, appearance, height and weight; 2. Social background-education,
social status and mobility; 3. Intelligence-superior judgement, decisiveness, knowledge and fluency of speech; 4. Personality-alertness, self-confidence, personal
integrity, self-assurance and dominance needs; 5. Task related characteristics-high need for achievement and responsibility, initiative and a high task orientation;
and 6. Social characteristics.
Keith Davis28
lists the characteristics of leadership as: a) Intelligence, b) Social maturity and breadth, c) Inner motivation and achievement drives, d) Human
relations attitudes:
LEADERSHIP SKILLS Some researchers have mixed the skills with the traits resulting from the development of human relations by a leader with the subordinates.
Chris Argyris29
mentions the characteristics of a leader as: 1. The leader is constantly interacting and commanding, 2. The leader makes the organization a part of
his self image, 3. The leader’s personal goals, values and feeling the organizationally centred, 4. The leader handles the supervisors as individuals, 5. The leader
controls the transmission of important information, 6. The leader emphasizes the present, and 7. The leader sets realistic goals.
According to Harold Koontz30
, every group of people that performs near its total capacity has some person as its head who is skilled in the art of leadership. This
skill seems to be a compound of at least four major ingredients: (1) the ability to use power effectively and in a responsible manner, (2) the ability to
comprehend that human beings have different motivation forces at different times and in different situations, (3) the ability to inspire followers, and (4) the
ability to act in a manner that will develop a climate conducive to responding to and arousing motivations.
Katz31
, in his classic study of managers identifies three important types of managerial skills: technical, interpersonal, and conceptual. Diagnostic skills are also
prerequisites to managerial success.
Gary Yukl32
(1981) summarising the research in the field till his times, identified following traits and skills as characteristic of successful leaders:
Traits Characteristic of Successful Leaders: Adaptable to situations, Alert to the social environment, Ambitious and achievement-oriented, Assertive,
Cooperative, Decisive, Dependable, Dominant (the desire to influence others), Energetic (high activity level), Persistent, Self-confident, Tolerant of stress, and
Willing to assume responsibility.
Skills Characteristic of Successful Leaders: Clever (intelligent), Conceptually skilled, Creative, Diplomatic and tactful, Fluent in speaking, Knowledgeable about the
group task, Organized (administrative ability), Persuasive and Socially skilled.
Michael and Dean33
suggest a number of leadership skills critical to success in the global economy. They include: Cultural flexibility, Communication skills.
Human resource development (HRD) skills, Creativity, and Self-management of learning.
An academic analysis made by Kanungo and Misra34
noted “the prevailing conceptualizations of skills required for successful managerial performance hinders
our understanding of the phenomenon”. To get over this problem, Whetten and Cameron35
provide a more empirical derivation of effective leadership skills.
On the basis of an interview study of over 400 highly effective managers, the following ten skills were identified as Verbal communication (including listening),
Managing time and stress, Managing individual decisions, Recognizing, defining, and solving problems, Motivating and influencing others, Delegating, Setting
goals and articulating a vision, Self-awareness, Team building, Managing conflict.
Follow-up studies and related research have found skills similar to the ten above. Through statistical techniques, the results of various research studies were
combined into the following four categories of effective leadership skills: Participative and human relations; Competitiveness and control; Innovativeness and
entrepreneurship; and Maintaining order and rationality
TRAITS RESEARCH AND RESULTS In general, the search for leadership traits has been largely unsuccessful. It has failed to demonstrate a consistent and definite relationship between leadership
ability on one hand and physical traits or personality characteristics or a combination of the two on the other36
. Byrd37
, in a critical assessment of research on
Trait theory upto 1940, identified a long list of traits made by studies, which had differentiated between leaders and the led. He found that only 5 per cent of
the traits listed in them were common to four or more of the studies. Another study by Jennings38
, concluded: ‘fifty years of the study have failed to produce
one personality trait or set of qualities that can be used to discriminate between leaders and non-leaders’.
Later studies identified some correlation between leadership and certain personality traits; for example a significant correlation was seen between leadership
effectiveness and such traits as intelligence, supervisory ability, initiative, self-assurance and individuality39
. A definite correlation was observed in some cases
between the traits of intelligence, scholarship, dependability, responsibility, social participation and socio-economic status of leaders, as compared with non-
leaders40
. But even these correlations between traits and leadership are not really pervasive. Most of the so-called traits are in essence the pattern of
behaviour that one would expect from a leader, particularly in a managerial position41
.
In general, studies of leader’s traits have not been a very fruitful approach to explain leadership. Not all leaders possess all the traits, and many non-leaders may
possess most or all of them. Also, the trait approach gives no guidance as to how much of a particular trait a person should have to be a leader. Furthermore,
the dozens of studies that have made do not agree as to what traits are leadership traits or what their relationships are to actual instances of leadership. Most
of these so-called traits are really patterns of behaviour.

VOLUME NO. 3 (2013), I SSUE NO. 09 (SEPTEMBER ) ISSN 2231-5756
INTERNATIONAL JOURNAL OF RESEARCH IN COMMERCE, IT & MANAGEMENT A Monthly Double-Blind Peer Reviewed (Refereed/Juried) Open Access International e-Journal - Included in the International Serial Directories
http://ijrcm.org.in/
32
REVIEW OF LITERATURE Some of the studies made by different authors in both theoretical and empirical spheres are presented hereunder.
The research conducted in the early part of 19th
century is replete with identification of certain personality traits essential for leadership. Research studies
conducted at the Bureau of Business Research, Ohio State University have attempted to identify initiating structure and consideration42
.
Krech and Crutchfield43
(1948) proposed a number of leadership functions. These are executive, planner, policy maker, ‘expert’ external group representative,
controller of internal relationships, purveyor of rewards and punishments, arbitrator and mediator, exemplar, symbol of the group, surrogate for individual
responsibility, ideologist, father figure and scapegoat.
Hemphill44
(1949) and his associates at Ohio State Leadership Studies developed a list of approximately 1,800 items describing different aspects of leader
behaviour. The items were sorted by the research team into nine different categories or hypothetical subscale, with most items assigned to several subscales.
However, 150 items were found on which sorters were agreed to subscale for assigning an item. These items were used to develop the first form of the Leader
Behaviour Description Questionnaire (LBDQ)
Harding45
(1949) enumerated twenty types of educational leaders as follows: autocrat, cooperator, elder statesman, eager beaver, pontifical, muddled, loyal
staff man, prophet, scientist, mystic, dogmatist, open-minded, philosopher, business expert, benevolent despot, child protector, community-minded, cynic,
optimist and democrat.
A study by Katz, Maccoby, and Morse46
(1950) investigated the relationship between the productivity of clerks in an insurance company and various leadership
characteristics. Twelve pairs of work groups which performed the same type of work but which differed in their productivity were studied. The supervisors of
the high producing groups employed were rated as less ‘production centered’ and more ‘employee centered’; exercised better judgment; were more rational
and less arbitrary, and were more democratic and less authoritarian than supervisors of low-producing sections.
Bales47
(1950) at Harvard and Hare48
et. al. (1955) had done work on the study of small group. They found that in small groups two different kinds of leaders
emerge. One kind was the task-leader characterized by those who talk more and who offer suggestions, and the other kind was called socio-emotional leader
represented by those who make it easier for others to talk and offer psychological support.
Haiman49
(1951) suggested that five types of leaders are needed in a democracy. These are: 1. The executive, 2. The judge, 3. The advocate, 4. The expert, and
5. The discussion leader.
Cattell50
(1954) explored four types of leaders in experimental groups. These are: (1) persistent-momentary problem solvers, high in interaction rate, (2) salient
leaders-picked up by observers as exerting the most powerful influence on the group, (3) socio-metric leaders-nominated by their peers and (4) elected leaders-
attaining office by election.
Stogdill51
(1959) suggested that it is the function of the leader to maintain group structure and goal direction and to reconcile conflicting demands arising outside
the group.
Douglas McGregor52
(1960) states that there are four variables involved in leadership: Characteristics of the leader; attitudes, needs and personal characteristics
of followers; characteristics of the organization; and the social, economic and political milieu. He also notes that leadership is not a property of the individual,
but a complex relationship among these variables. He identifies two major perpetual structures, which are labelled Theory X for the authoritarian approach and
Theory Y for the participative approach.
Bhatt and Pathak53
(1962) found high intelligence and dependability as important perceived characteristics of effective supervision.
Sequeria54
(1962), who worked with Ganguli, has outlined the characteristics of the effective supervision. He has come to the conclusion that effective
supervisory practice is less ambiguous and less relative. The main criterion seems to be the level of supervisor in the hierarchy.
Amin55
(1963) reports on the behaviour and traits of jobbers who were liked by the workers. Qualities perceived in successful jobbers were high technical
knowledge and ability to co-ordinate supply of materials, good behaviour, politeness and straightforward and persuasive approach. They were not expected to
pass on duties to workers under them but were expected to give freedom to workers in their work.
Apple White56
(1965) had summarized much of the research on leadership roles and functions, the question of why people attempt to lead, leadership under
stress conditions, the relationship of communication to leadership, the problem of leader assessment and the concept of leadership styles.
Sinha and Kumar57
(1966) found student leadership to be related to anxiety and dominance and not to extroversion, neuroticism, adjustment, rigidity and
ambiguity tolerance.
Bayati58
(1969) investigated into the leader behaviour characteristics of school pupils. He found significant relationship of children’s age, parents income and
occupations to the patterns of nursery school behaviour.
Thiagarajan and Deep59
(1970) found that authoritarian leaders as more influential than the persuasive, and the persuasive more than participative.
Habibullah and Sinha60
(1980) studied five hundred and twenty-three executives of the Bharath Heavy Electrical Limited to find out various factors of leader
behaviour. The responses of the executives to the leadership styles scales were factor analyzed by the principal component method and varimax rotation was
used. Resultantly, they found the following ten usable factors: subordinate based participation; leader centered nurturance; authoritarianism; guidance and
encouragement; direction; task-orientation; friendly-orientation; power; role performance, distance and discipline.
Ramakanth61
(1985) has made an attempt to know the attitudes of managers in different manufacturing organizations with regard to the classical or modern
point of view. He has used a questionnaire covering four distinct areas: 1. Capacity for leadership initiative 2. sharing information and objectives, 3.
Participation and 4. Internal control. On the basis of responses, he concludes that in the areas of capacity for leadership initiative, sharing information and
objectives and participation, the managers are in favour of modern approach and in the area of internal control, they are in favour of classical approach.
Rajinder Kaur62
(1993) has designed a study to investigate the psychological characteristics of democratic and autocratic managers as well as to find out the
relationship between managerial styles and managerial success. 325 managers from Bharat Electronics Limited, Banaglore comprised the sample. The study
indicates that managerial success is not associated with managerial styles. A tendency towards the autocratic style prevails among the Indian managers. The
psychological correlates reveal a qualitative difference in the characteristics of the democratic and the autocratic managers.
V. Ravichandran and D.Nagabrahmam’s63
(1997) study attempted to explore the effectiveness of leadership in a transitory environment. A list of 15 traits/skills
such as vision, expertise, motivation, calculated-risk, innovativeness, exemplary, assertion, integrity, charisma, interpersonal skills, initiativeness, ambition,
altruism, commitment and empathy were identified through interaction process based on which a questionnaire was constructed and rated on five-point Likert
scale. Data were collected from 299 managers representing 8 nationalized banks and their branches. The study states that effective leadership was perceived to
be related to the person and his character such as one’s expertise with interpersonal capabilities and empathy. The study also suggests that effective leaders are
those with vision and having noble and altruistic goals. It is also noted that the ideal of leadership in everybody’s mind has influencing effect on leadership in
organizations if it is properly communicated and shared among top echelons.
STATEMENT OF THE PROBLEM Leadership is the crucial issue in all organizations, as every manager has to deal with this aspect in order to succeed in the organizational mission. Though there
are many independent theories leadership, no single theory is relevant to all the situations. Thus, the search for understanding new dimensions of leadership has
been continuing. Normally the success and failure of organizations have been attributed to the effectiveness of leaders in organizational setting. As such the
topic of leadership welcomes the research studies without limitations so as to add a new dimension to leadership theory and practice. This is due to the fact that
each organization has its own personality. That is, organizations vary widely both structurally and functionally. As such, the specific findings of one research in a
particular area and in a particular organization may not be totally relevant to other organizations. Hence, there is a need for the investigation of the problems
like Leadership. The present empirical research study of Government General Hospital (GGH) and Indo National Limited (INL) addresses to the issue of leadership
concept.

VOLUME NO. 3 (2013), I SSUE NO. 09 (SEPTEMBER ) ISSN 2231-5756
INTERNATIONAL JOURNAL OF RESEARCH IN COMMERCE, IT & MANAGEMENT A Monthly Double-Blind Peer Reviewed (Refereed/Juried) Open Access International e-Journal - Included in the International Serial Directories
http://ijrcm.org.in/
33
OBJECTIVE OF THE STUDY The specific objective of the study is to examine the views of the employees in Government General Hospital and Indo National Limited on leadership, an ideal
leader and leadership qualities.
METHODOLOGY The study is mainly based on primary data collected from the employees of Government General Hospital and Indo National Limited in Nellore district, by
making personal visits through a schedule prepared for this purpose. The present study confines to doctors, managers, assistant officers and clerical staff
employees. Their opinions of employees on leadership concept, leadership idealism and leadership qualities, are taken. The total census consists of employees
from grade-I to grade-III in Government General Hospital is 103, and I.N. Ltd., is 149 with the departments covered at different levels.
TOOLS FOR DATA COLLECTION In the present study, two schedules were used for the data collection. Schedule-I is designed to elicit the information relating to SEOP variables viz., name,
designation, age, experience, education qualifications economic background, social background, family profession. Schedule-II is designed to study the opinion
on leadership concept, leadership idealism and leadership qualities.
TOOLS FOR ANALYSIS The data collected through the schedules from primary source have been processed and the results obtained by employing appropriate statistical tool like
percentage.
RESULTS AND DISCUSSIONS LEADERSHIP CONCEPT
The concepts and constructs of leadership reveal the opinions of the employees in Government General Hospital and Indo National Limited, in terms of their
inner feelings about the meaning of leadership, leadership idealism, qualities, undesirable qualities of leaders which attracted them to recognize their
leadership. The present study examine the view point of the employees of Government General Hospital and Indo National Limited on leadership concepts and
constructs in their organization.
TABLE 1: CONCEPT OF LEADERSHIP ACCORDING TO EMPLOYEES OF GGH & INL (N=103,149)
Ranks Leadership Meaning Number of responses Responses in percentage
GGH INL GGH INL
1 Guiding 98 138 95 92
2 Controlling 84 131 82 88
3 Protecting 82 122 80 82
4 Helping 51 94 50 63
5 Influencing 39 54 38 36
6 Loving 22 48 21 32
Source : Compiled from field survey.
Guiding: It is evident from the table 1 that the Government General Hospital employees have shown higher meaning of leadership as ‘guiding’ than the Indo
National Limited employees as the meaning percentage of Government General Hospital employees (95%) is being higher than the meaning percentage of Indo
National Limited employees (92%).
Controlling: It is evident form the table 1 that the Indo National Limited employees have shown higher meaning of leadership in ‘controlling’ than the
Government General Hospital employees as the meaning percent of Indo National Limited employees (88%) is being higher than the meaning percentage of
Government General Hospital employees (82%).
Protecting: It is evident from the table 1 that the Indo National Limited employees have shown higher meaning of leadership in ‘protecting’ than the
Government General Hospital employees, as the meaning percentage of Indo National Limited employees (82%) is being higher than the meaning percentage of
Government General Hospital employees (80%).
Helping: It is evident from the table 1 that the Indo National Limited employees have shown higher meaning of leadership in ‘Helping’ than the Government
General Hospital employees, as the meaning percentage of Indo National Limited employees (63%) is being higher than the meaning percentage of Government
General Hospital employees (50%).
Influencing: It is evident from the table 1 that the Government General Hospital employees have shown higher meaning of leadership in ‘influencing’ than the
Indo National Limited employees, as the meaning percentage of Government General Hospital employees (38%) is being higher than the meaning percentage of
Indo National Limited employees (36%).
Loving: It is evident from the table 1 that the Indo National Limited employees have shown higher meaning of leadership in ‘loving’ than the Government
General Hospital employees, as the meaning percentage of Indo National Limited employees (32%) is being higher than the meaning percentage of Government
General Hospital employees (21%).
TABLE 2: IDEAL LEADER ACCORDING TO EMPLOYEES OF GGH & INL (N=103,149)
Ranks Ideal leader Number of responses Responses in %
GGH INL GGH INL
1 Father 85 135 82 91
2 Mother 64 91 62 61
3 Boss (supervisor) 56 86 56 56
4 Teacher 41 68 40 46
5 Friend 38 61 37 41
6 Spouse 31 59 30 40
7 Politician 24 42 23 28
8 Uncle 20 26 19 17
9 Religious priest Master, Swamiji, etc 12 18 11 12
Source : Compiled from field survey.
Father: It is evident from the table 2 that the Indo National Limited employees have shown higher Ideal leader as ‘Father’ than the Government General Hospital
employees as the Ideal leader percent of Indo National Limited employees (91%) is being higher than the Ideal leader as father percent of Government General
Hospital employees (82%).
Mother: It is evident from the table 2 that the Government General Hospital employees have shown higher Ideal leader as ‘Mother’ than the Indo National
limited. employees as the Ideal leader percent of Government General Hospital employees (62%) is being higher than the Ideal leader as father percent of Indo
National Limited employees (61%).

VOLUME NO. 3 (2013), I SSUE NO. 09 (SEPTEMBER ) ISSN 2231-5756
INTERNATIONAL JOURNAL OF RESEARCH IN COMMERCE, IT & MANAGEMENT A Monthly Double-Blind Peer Reviewed (Refereed/Juried) Open Access International e-Journal - Included in the International Serial Directories
http://ijrcm.org.in/
34
Boss (Superior): It is evident from the table 2 that the Government General Hospital and Indo National Limited employees of Ideal leaders as ‘Boss’ percent have
equal (56% and 56%).
Teacher (Guru): It is evident from the table 2 that the Indo National Limited employees have shown higher Ideal leader as ‘Teacher’ than the Government
General Hospital employees as the Ideal leader percent of Indo National Limited employees (46%) is being higher than the Ideal leader as father percent of
Government General Hospital employees (40%).
Friend: It is evident from the table 2 that the Indo National Limited employees have shown higher Ideal leader as ‘Friend’ than the Government General Hospital
employees as the Ideal leader percent of Indo National Limited employees (41%) is being higher than the Ideal leader as father percent of Government General
Hospital employees (37%).
Spouse: It is evident from the table 2 that the Indo National Limited employees have shown higher Ideal leader as ‘Spouse’ than the Government General
Hospital employees as the Ideal leader percent of Indo National Limited employees (40%) is being higher than the Ideal leader as father percent of Government
General Hospital employees (30%).
Politician: It is evident from the table 2 that the Indo National Limited employees have shown higher Ideal leader as ‘Politician’ than the Government General
Hospital employees as the Ideal leader percent of Indo National Limited employees (28%) is being higher than the Ideal leader as father percent of Government
General Hospital employees (23%).
Uncle: It is evident from the table 2 that the Government General Hospital employees have shown higher Ideal leader as ‘Uncle’ than the Indo National limited.
employees as the Ideal leader percent of Government General Hospital employees (19%) is being higher than the Ideal leader as father percent of Indo National
Limited employees (17%).
Religious priest: It is evident from the table 2 that the Indo National Limited employees have shown higher Ideal leader as ‘Religious priest’ than the
Government General Hospital employees as the Ideal leader percent of Indo National Limited employees (12%) is being higher than the Ideal leader as father
percent of Government General Hospital employees (11%).
TABLE 3: THREE IMPORTANT QUALITIES OF LEADERS ACCORDING TO EMPLOYEES OF GGH & INL (N=103,149)
Ranks
Leadership qualities
Number of responses Responses in %
GGH INL GGH INL
1 Knowledge 91 133 88 89
2 Sincerity 83 119 81 80
3 Passion for success 69 105 67 70
4 Self confidence 52 96 50 64
5 Ambition 44 63 43 42
6 Intelligence 40 51 39 34
7 Perseverance 33 39 32 26
8 Industry 21 26 20 17
9 Courage 19 20 18 13
10 Sociability 17 16 16 11
11 Democracy 14 12 13 8
12 Optimism 11 10 10 7
13 Humility 8 7 7 5
14 Open mindedness 6 6 5 4
15 Sympathy 5 0 4 0
16 Empathy 3 0 2 0
Source : compiled from field survey
Knowledge: The first preference to the leadership qualities of ‘Knowledge’ it is evident form the table 3 reveals that the Indo National Limited employees have
shown major contribution of their leaders is knowledge than the Government General Hospital employees, under major contribution of their leaders is
knowledge as the percent of Indo National Limited employees 183(89) is more than the percent of Government General Hospital employees 91(88).
Sincerity: The second preference to the leadership qualities of sincerity it is evident from the table 3 reveals that the Government General Hospital employees
have shown major contribution of their leaders is sincerity than the Indo National Limited employees, under major contribution of their leaders is sincerity as the
percent of Government General Hospital employees 83(81) is more than the percent of Indo National Limited employees 119(80).
Passion for success: The third preference to the leadership qualities of passion for success it is evident from the table 3 reveals that the Indo National Limited
employees have shown major contribution of their leader is passion for success than the Government General Hospital employees, under major contribution of
their leader is passion for success as the percent of Indo National Limited employees 105(70) is more than the percent of Government General Hospital
employees 69(67).
The other leadership qualities like self confidence, ambition, intelligence, perseverance, industry(Hard working), courage, Sociability, Democracy, Optimism,
Humility, Open mindedness, Sympathy, Empathy, have not been considered as important factors by the both Government General Hospital and Indo National
Limited employees.

VOLUME NO. 3 (2013), I SSUE NO. 09 (SEPTEMBER ) ISSN 2231-5756
INTERNATIONAL JOURNAL OF RESEARCH IN COMMERCE, IT & MANAGEMENT A Monthly Double-Blind Peer Reviewed (Refereed/Juried) Open Access International e-Journal - Included in the International Serial Directories
http://ijrcm.org.in/
35
TABLE 4: THREE UNDESIRABLE QUALITIES OF A LEADERS ACCORDING TO EMPLOYEES OF GOVERNMENT GGH & INL (N=103,149)
Ranks Leadership undesirable Qualities Number of responses Responses in %
GGH INL GGH INL
1 Ego 79 125 77 84
2 Pride 64 111 62 74
3 Jealousies 60 103 58 69
4 Laziness 57 92 55 62
5 Harshness 51 89 50 60
6 Hypocrisy 50 72 49 48
7 Cunningness 44 66 43 44
8 Selfishness 36 60 35 40
9 Anger 31 51 30 34
10 Pomp 20 43 19 30
11 Envy 16 38 15 26
12 Arrogance 16 32 15 21
13 Rudeness 12 32 12 21
14 Democracy 10 23 10 15
15 Timidity 8 20 8 13
16 Innocence 8 16 8 11
17 Dullness 8 0 8 0
18 Insincerity 4 0 4 0
19 Ignorance 4 12 4 8
20 Shyness 0 10 0 7
21 Pessimism 3 0 3 0
22 Indifference 3 8 3 5
23 Autocracy 0 6 0 4
24 Greed 3 0 3 0
Source: compiled from field survey
Ego : The first preference to the leaders undesirable qualities of ‘ego’ it is evident from the table 4 reveals that the Indo National Limited employees have shown
major contribution of their leaders is ego than the Government General Hospital employees, under major contribution of their leaders is ego as the percent of
Indo National Limited employees 125(84) is more than the percent of Government General Hospital employees 79(77).
Pride : The second preference to the leaders undesirable qualities of ‘pride’ it is evident from the table 4 reveals that the Indo National Limited employees have
shown major contribution of their leaders is pride than the Government General Hospital employees, under major contribution of their leaders is pride as the
percent of Indo National Limited employees 111(74) is more than the percent of Government General Hospital employees 64(62).
Jealousy (Envy) : The third preference to the leaders undesirable qualities of ‘jealousy’ it is evident from the table 4 reveals that the Indo National Limited
employees have shown major contribution of their leaders is pride than the Government General Hospital employees, under major contribution of their leaders
is jealousy as the percent of Indo National Limited employees 103(69) is more than the percent of Government General Hospital employees 60(58).
The other leaders undesirable qualities like laziness, harshness, hypocrisy, cunningness, selfishness, angry, pomp, envy, arrogance, rudeness, democracy,
timidity, innocence, dullness, insincerity, ignorance, shyness, pessimism, indifference, autocracy, greed, have not been considered as important factors by the
both Government General Hospital and Indo National Limited employees.
FINDINGS AND CONCLUSIONS The following are the major findings of the concepts and constructs of leadership.
1. The analysis relating to the concept of leadership basing on the perceptions of 103, and 149 employees of GGH and INL respectively reveals that
‘guiding’ is the preferred meaning for majority of the respondents followed by controlling, protecting, helping, influencing and loving.
2. The analysis reveals that ‘father’ was preferred as leader by majority followed by mother, boss (supervisor), teacher, friend, spouse, politician, uncle,
religious guru.
3. The opinions expressed by employees about the three important qualities of leaders, knowledge was preferred by majority followed by sincerity,
passion for success.
4. The opinion expressed by employees about the three important undesirable qualities of leaders, Ego was preferred by majority followed by pride,
jealousies.
REFERENCES 1. Bennis, W. G. (1959). Leadership Theory and Administrative Behaviour: The Problem of Authority. Administrative Science Quarterly, Vol.4, pp. 259-269.
2. Ralph M Stogdill. (1974), “Handbook of Leadership: A Survey of Theory and Research.” The Free Press, New York, pp.7.
3. Gore, W.J., and Silander, F.S. (1959). A Bibliographical Essay on Decision Making. Administrative Science Quarterly, Vol.6, pp.121-129.
4. Stogdill. (1974), “Handbook of Leadership: A Survey of Theory and Research.” The Free Press, New York, pp.7.
5. Karmel, B. (1978). Leadership: A Challenge to Traditional Research Methods and Assumptions. Academy of Management Review, Vol.3, pp.475-482.
6. Peter Drucker, (1970), “Practice of Management.” Allied publishers, New Delhi, p.159.
7. Munson, C.E. (1981). Style and Structure in Supervision. Journal of Education for Social Work, 17, pp.65-72.
8. Bennis, W.G. (1959). Leadership Theory and Administrative Behaviour: The Problem of Authority. Administrative Science Quarterly, 4.
9. Hollander, E.P., and Jullian J.W. (1996). On Temporary Trends in the Analysis of Leadership Processes. Psychological Bulletin, 71, pp.387-391.
10. Fiedler, F.E. (1969), “A Theory of Leadership Effectiveness.” McGraw Hill, New York.
11. Merton, R.K. (1969). The Social Nature of Leadership. American Journal of Nursing, 69, pp.2614-2618.
12. Bass, B.M. (1985), “Leadership and Performance Beyond Expectations.” The Free Press, New York.
13. Tichy, N.M., and Devanna, M.A. (1986), “The Transformational Leader.” Wiley, New York.
14. Roach, C.F., and Behling, O. (1984), “Functionalism: Basis for an Alternative Approach to the Study of Leadership.” In Leadership and Managers by J.G.
Hunt (ed.), Pergamon, New York.
15. Campbell, D.P. (1991), “Campbell Leadership Index Manual.” National Computer System.
16. Ginnett, R.C. (1996). Team Effectiveness Leadership Model: Identifying Leverage Points for Change. Proceedings of the National Leadership Institute
Conference, College Park, MD: National Leadership Institute.
17. Kakabadse, Andrew, (1998). Leadership for the Third Millennium. Essence of Leadership, International Thompson Publishing.
18. Morris, W.T., Seeman, M. (1950). The Problem of Leadership: An Interdisciplinary Approach. American Journal of Sociology, 56, pp.149-155.

VOLUME NO. 3 (2013), I SSUE NO. 09 (SEPTEMBER ) ISSN 2231-5756
INTERNATIONAL JOURNAL OF RESEARCH IN COMMERCE, IT & MANAGEMENT A Monthly Double-Blind Peer Reviewed (Refereed/Juried) Open Access International e-Journal - Included in the International Serial Directories
http://ijrcm.org.in/
36
19. Shartle, C.L. (1951). Studies in Naval Leadership in H. Guetzkow Groups. Leadership and Men, Carnegie Press, Pittsburgh.
20. Carter, L.F. (1953), “Leadership and Small Group Behaviour in M. Sheriff and M.O. Wilson, Group Relations at the Crossroads.” Harper.
21. Gibb, C.A. (1954), “Leadership in G. Lindzey and others, Handbook of Social Psychology.” Addison-Wesley, Mass.
22. Bass, B. M. (1960), “Leadership, Psychology and Organizational Behaviour.” Harper, New York, 1960.
23. Ordway Tead, (1953), “The Art of Leadership.” McGraw Hill Book Company, Inc. New York, pp.83.
24. Chester I Barnard. (1946), “The Functions of the Executive.” Harvard University Press, Cambridge, pp.260.
25. Henry Fayol. (1949), “General and Industrial Management.” Pitman and Sons, London.
26. George R Terry. (1968), “Principles of Management.” Richard D. Irwin, Inc. Home Wood, Illinois, pp.461-463.
27. Ralph M Stogdill. (1948). Personal Factors Associated with Leadership: A Survey of the Literature. Journal of Psychology, January, pp.35-71.
28. Keith Davis. (1972), “Human Behaviour at work.” 4th edition, Mc Graw Hill, New Delhi, pp.102-104.
29. Chris Argyris. (1953), “Executive Leadership.” Harper and Brothers Publishers, New York, pp.4-5.
30. Harold Koontz and Heinz Weihrich. (1990), “Essentials of Management.” 5th Edition, McGraw Hill Series in Management, New York, pp.345.
31. Robert L Katz. (1974). The Skills of an Effective Administrator. Harvard Business Review, September-October, pp.90-102.
32. Yukl, Gary. (1981), “ Leadership in Organizations.” Prentice Hall, Englewood Cliffs, New Jersey.
33. Michael J. Marquart and Dean W. Engel. (1993). HRD Competencies for a Shrinking World. Training and Development, May, pp.62-64.
34. Rabindra, M. Kanungo., and Sasi Misra. (1992). Managerial Resourcefulness: A Reconceptualization of Management Skill. Human Relations, December,
pp.1311-1332.
35. David A. Whetten, and Kim. S. Cameron. (1991), “Developing Management Skills.” Harper Collins, New York, pp.8.
36. Gibb, C.A. (1969), “Leadership in Hand Book of Social Psychology.” Edited by Lindzey, G., and Aronson, Vol.4, Addison-Wesley, Mass, pp.215-229.
37. Byrd, C. (1940), “Social Psychology.” Appleton – Century – Crofts, pp183-188.
38. Jennings, E.E. (1961). The Anatomy of Leadership. Management of Personnel Quarterly, Vol.1, Autumn, pp.2.
39. Gheselli, E.E. (1963). Management Talent. American Psychologist, Vol.18, October, pp.631-642.
40. Stogdill, R.M. (1948). Personal Factors Associated with Leadership: A Survey of Literature. Journal of Psychology, Vol.25, pp.35-71.
41. Koontz, H., and O’ Donnel, C. (1976), “Management.” McGraw-Hill, New York, pp.591.
42. Stogdill, R.M., and Coons, A.E. (Ed) (1957). Leader Behaviour: Its Description and Measurement. Research Monograph No.88, Bureau of Business Research,
Ohio State University, Columbus.
43. Krech, E. and Crutchfield, R.S. (1948), “Theory and Problems of Social Psychology.” McGraw Hill, New York.
44. Hemphill, J.K. (1949). The Leader and his Group. Journal of Educational Research, pp.28.
45. Harding, L. W. (1949). Twenty-One Varieties of Educational Leadership. Educational Leadership, 6, pp. 299-302.
46. Katz. D.N., Maccoby., and Morse, N. (1950). Productivity, Supervision, and Morale in an Office Situation. Survey Research Center, Institute for Social
Research, University of Michigan, Ann Arber, Michigan.
47. Bales, R.F. (1950), “Interaction Process Analysis: A Method for the study of Small Groups.” Cambridge.
48. Hare, A.P., Borgatta, E.E., and Bales, R.F. (1955), “Small Groups Studies in Social Group Interaction.” New York.
49. Haiman, F.S. (1951), “Group Leadership and Democratic Action.” Houghton Mifflin, Boston.
50. Cattell, R.B. and Stice, G.F. (1954). Four formulae for Selecting Leaders on the basis of Personality. Human Relations, 7.
51. Stogdill, R.M. (1959), “Individual Behaviour and Group Achievement.” Oxford University Press, New York.
52. Douglas McGregor. (1960), “The Human Side of Enterprise.” McGraw Hill Book Company, New York.
53. Bhatt, L. J., and Pathak, N.S. (1962). A Study of Functions of Supervisory Staff and Characteristics Essential for Success as viewed by a Group of Supervisors.
Manas, 9, pp.25-31.
54. Sequeria, C.E. (1962). Functions of a Supervisor. Indian Journal of Applied Psychology, 1, pp.46-54.
55. Amin, D.L. (1963). Perception of the First Line Supervisor about His Job. Industrial Relations, IIBM, Calcutta.
56. Apple White, and Phillip, B. (1965), “Organisational Behaviour.” Engle Wood Cliffs, Prentice-Hall, New Jersey, (Chapter 6).
57. Sinha, D., and Kumar, P. (1966). A Study of Certain Personality Variables in Student Leadership. Psychological Studies, 11, pp.1-8.
58. Bayati, J.L. (1969). An Investigation into the Leader Behavior Characteristics of Higher Secondary School Pupils. Journal of College Education, Karnataka
University, Dharwar, 6, pp.17-20.
59. Thiagarajan, K.M., and Deep, S.D. (1970). A Study of Supervisor Subordinate Influence on Satisfaction in four Cultures. Journal of Social Psychology, 82,
pp.173-180.
60. Habibullah, A.H.M., and Sinha, J.B.P. (1980). Motivational Climate and Leadership Styles. Vikalpa, 5.
61. Ramakanth, J. (1985), “Attitudes of Managers in Public Enterprises.” Unpublished Thesis Submitted to Osmania University, Hyderabad.
62. Rajinder Kaur. (1993). Managerial Styles in the Public Sector. Indian Journal of Industrial Relations, Volume 28, No.4, April, pp.363-367.
63. Ravichandran, V., and Nagabrahmam, D. (1997). Leadership in a Transitory Environment. Indian Journal of Industrial Relations, Volume 32, No.4, April,
pp.423-435.
VOLUME NO. 3 (2013), I SSUE NO. 09 (SEPTEMBER ) ISSN 2231-5756
INTERNATIONAL JOURNAL OF RESEARCH IN COMMERCE, IT & MANAGEMENT A Monthly Double-Blind Peer Reviewed (Refereed/Juried) Open Access International e-Journal - Included in the International Serial Directories
http://ijrcm.org.in/
37
MARKETING MIX: A REVIEW ON THE ‘P’S OF MARKETING
M.VASUDEVAN
ASST. PROFESSOR
DEPARTMENT OF MANAGEMENT STUDIES
K.S.RANGASAMY COLLEGE OF ARTS & SCIENCE
TIRUCHENGODE
DR. V. M. SENTHILKUMAR
PROFESSOR
DEPARTMENT OF BUSINESS ADMINISTRATION
K.S.R. COLLEGE OF ENGINEERING
TIRUCHENGODE
K.SASIKUMAR
ASST. PROFESSOR
DEPARTMENT OF MANAGEMENT STUDIES
TAMILNADU COLLEGE OF ENGINEERING
COIMBATORE
ABSTRACT The marketing mix concept is an essential part of marketing theory. Marketing mix is the vehicle through which the marketers’ strategies are delivered to the
customers. Marketers should design the marketing mix effectively to create and sustain competitive advantage in addition to customer satisfaction. The main
focus of this article is to identify the elements of marketing mix in the perspective of different authors. The study has examined the views of eminent personalities
and experts in marketing with respect to the number of elements that is ‘P’s of marketing mix. The study presents an idea to the marketers regarding the
marketing mix elements while designing the marketing mix.
KEYWORDS Marketing Mix, Elements (Ps).
INTRODUCTION he organizations in the current scenario focus on achieving certain predetermined objectives. In order to achieve the same, a number of actions are to be
performed including production, marketing, human resource, finance, logistics, purchasing, storage, trading, assembling, distribution etc. Such activities
are interrelated to each other. Marketing is one of the most important activities of an organization. Marketing mix includes all the necessary elements
that a marketing campaign should encompass to enhance sales and efficiency of the marketing programme.
According to Chong (2003), Marketing mix has originated from the single P (price) of microeconomic theory. In the view of Hodder Education, n.d, the idea of
designing the marketing mix is similar to mixing a cake. The proportions of ingredients in a cake is altered by the baker based on the cake the consumer
demands, similarly the elements in the marketing mix can be altered based on the products. Bennett (1997) emphasizes that marketing mix is a conceptual
framework that helps the managers in configuring their offerings to suit consumers’ needs.
THE HISTORY Borden (1965) is identified to have used the term marketing mix firstly. The marketing mix elements of Borden consisted of 12 elements namely, product
planning; pricing; branding; personal selling; channels of distribution; advertising; promotions; packaging; display; servicing; physical handling; and fact finding
and analysis. Lazer and Kelly (1962) and Lazer, Culley and Staudt (1973) categorized the elements of marketing mix into three groups as follows: the Products
and services mix, the communication mix and the distribution mix. Further Borden’s idea was refined by McCarthy (1964) and he reframed the 12 elements to
four elements or 4Ps, namely product, price, place and promotion.
ELEMENTS OF MARKETING MIX – VARYING VIEWS ON THE NUMBER OF Ps As highlighted before, Borden’s 12 elements of marketing mix was reconfigured into 4Ps by Mc Carthy. Booms and Bitner (1980) added 3 Ps to the original 4 Ps
extending the concept of product marketing mix (the 4Ps) to the concept of services (product, price, place and promotion + participants, physical evidence and
process). The fifth P (People) was proposed by Judd (1987). Kotler (1986) included political power and public opinion to the concept of the elements of
marketing mix. 3 Ps (personnel, physical facilities and process management) were added by MaGrath (1986). Baumgartner (1991) introduced the concept of
15Ps.
T
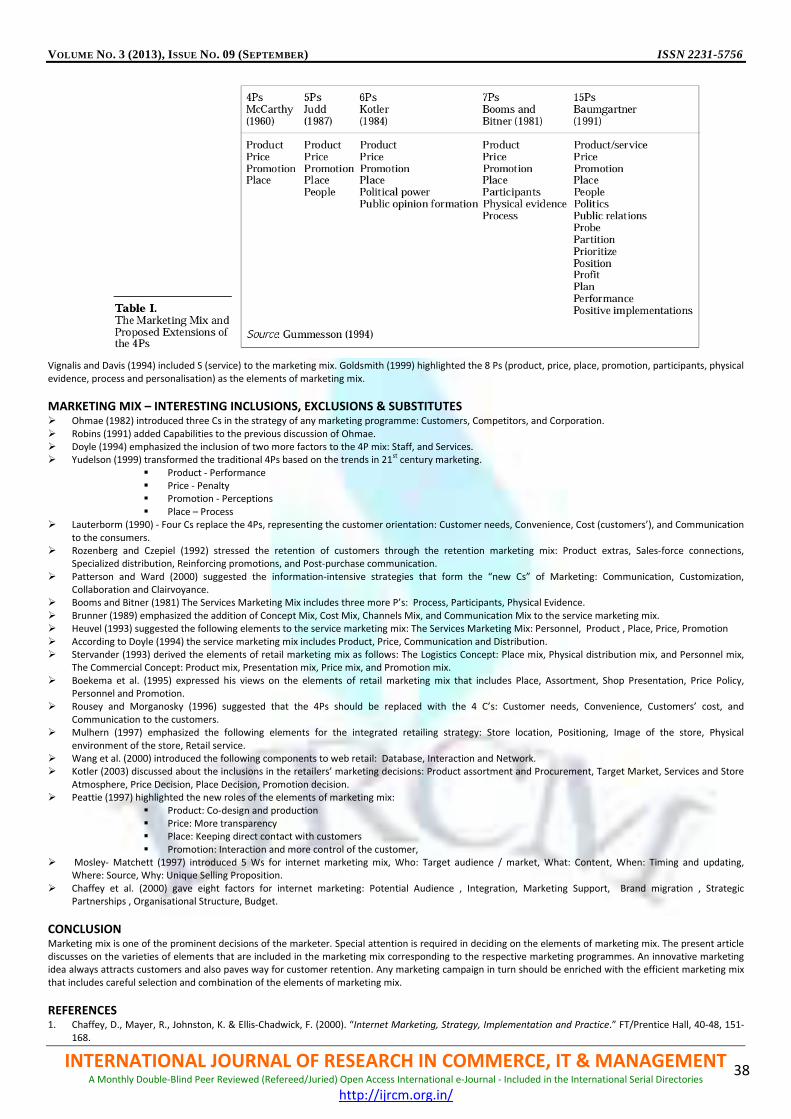
VOLUME NO. 3 (2013), I SSUE NO. 09 (SEPTEMBER ) ISSN 2231-5756
INTERNATIONAL JOURNAL OF RESEARCH IN COMMERCE, IT & MANAGEMENT A Monthly Double-Blind Peer Reviewed (Refereed/Juried) Open Access International e-Journal - Included in the International Serial Directories
http://ijrcm.org.in/
38
Vignalis and Davis (1994) included S (service) to the marketing mix. Goldsmith (1999) highlighted the 8 Ps (product, price, place, promotion, participants, physical
evidence, process and personalisation) as the elements of marketing mix.
MARKETING MIX – INTERESTING INCLUSIONS, EXCLUSIONS & SUBSTITUTES � Ohmae (1982) introduced three Cs in the strategy of any marketing programme: Customers, Competitors, and Corporation.
� Robins (1991) added Capabilities to the previous discussion of Ohmae.
� Doyle (1994) emphasized the inclusion of two more factors to the 4P mix: Staff, and Services.
� Yudelson (1999) transformed the traditional 4Ps based on the trends in 21st century marketing.
� Product - Performance
� Price - Penalty
� Promotion - Perceptions
� Place – Process
� Lauterborm (1990) - Four Cs replace the 4Ps, representing the customer orientation: Customer needs, Convenience, Cost (customers’), and Communication
to the consumers.
� Rozenberg and Czepiel (1992) stressed the retention of customers through the retention marketing mix: Product extras, Sales-force connections,
Specialized distribution, Reinforcing promotions, and Post-purchase communication.
� Patterson and Ward (2000) suggested the information-intensive strategies that form the “new Cs” of Marketing: Communication, Customization,
Collaboration and Clairvoyance.
� Booms and Bitner (1981) The Services Marketing Mix includes three more P’s: Process, Participants, Physical Evidence.
� Brunner (1989) emphasized the addition of Concept Mix, Cost Mix, Channels Mix, and Communication Mix to the service marketing mix.
� Heuvel (1993) suggested the following elements to the service marketing mix: The Services Marketing Mix: Personnel, Product , Place, Price, Promotion
� According to Doyle (1994) the service marketing mix includes Product, Price, Communication and Distribution.
� Stervander (1993) derived the elements of retail marketing mix as follows: The Logistics Concept: Place mix, Physical distribution mix, and Personnel mix,
The Commercial Concept: Product mix, Presentation mix, Price mix, and Promotion mix.
� Boekema et al. (1995) expressed his views on the elements of retail marketing mix that includes Place, Assortment, Shop Presentation, Price Policy,
Personnel and Promotion.
� Rousey and Morganosky (1996) suggested that the 4Ps should be replaced with the 4 C’s: Customer needs, Convenience, Customers’ cost, and
Communication to the customers.
� Mulhern (1997) emphasized the following elements for the integrated retailing strategy: Store location, Positioning, Image of the store, Physical
environment of the store, Retail service.
� Wang et al. (2000) introduced the following components to web retail: Database, Interaction and Network.
� Kotler (2003) discussed about the inclusions in the retailers’ marketing decisions: Product assortment and Procurement, Target Market, Services and Store
Atmosphere, Price Decision, Place Decision, Promotion decision.
� Peattie (1997) highlighted the new roles of the elements of marketing mix:
� Product: Co-design and production
� Price: More transparency
� Place: Keeping direct contact with customers
� Promotion: Interaction and more control of the customer,
� Mosley- Matchett (1997) introduced 5 Ws for internet marketing mix, Who: Target audience / market, What: Content, When: Timing and updating,
Where: Source, Why: Unique Selling Proposition.
� Chaffey et al. (2000) gave eight factors for internet marketing: Potential Audience , Integration, Marketing Support, Brand migration , Strategic
Partnerships , Organisational Structure, Budget.
CONCLUSION Marketing mix is one of the prominent decisions of the marketer. Special attention is required in deciding on the elements of marketing mix. The present article
discusses on the varieties of elements that are included in the marketing mix corresponding to the respective marketing programmes. An innovative marketing
idea always attracts customers and also paves way for customer retention. Any marketing campaign in turn should be enriched with the efficient marketing mix
that includes careful selection and combination of the elements of marketing mix.
REFERENCES 1. Chaffey, D., Mayer, R., Johnston, K. & Ellis-Chadwick, F. (2000). “Internet Marketing, Strategy, Implementation and Practice.” FT/Prentice Hall, 40-48, 151-
168.

VOLUME NO. 3 (2013), I SSUE NO. 09 (SEPTEMBER ) ISSN 2231-5756
INTERNATIONAL JOURNAL OF RESEARCH IN COMMERCE, IT & MANAGEMENT A Monthly Double-Blind Peer Reviewed (Refereed/Juried) Open Access International e-Journal - Included in the International Serial Directories
http://ijrcm.org.in/
39
2. Chong, K. W. (2003). “The Role of Pricing in Relationship Marketing - A Study of the Singapore Heavy Equipment Spare Parts Industry”, PhD Dissertation,
International Graduate School of Management, University of South Australia.
3. Cowell, D. W. (1984). “The Marketing of Services”, Institute of Marketing and the CAM foundation. Heineman Professional Publishing.
4. Doyle, P. (1994). “Marketing Management and Strategy”. Prentice Hall.
5. Gummesson, E. (1994). “Making Relationship Marketing Operational”. International Journal of Service Industry Management, 5(5), 5-20.
6. Kotler, P. (1984). “Marketing Management: Analysis, Planning and Control (5th ed.)”. New Jersey: Prentice-Hall.
7. Kotler, P. (1984). “Marketing Management: Analysis, Planning and Control (5th ed.)”. New Jersey: Prentice-Hall.
8. Kotler, P. (1986). “Principles of Marketing (3rd ed.)”. New Jersey: Prentice Hall.
9. Kotler, P. (2003). “Marketing Management (11th ed.)”. Prentice Hall International Editions.
10. Lauterborn, B. (1990). “New Marketing Litany: Four Ps Passé: C-Words Take Over. Advertising Age, 61(41), 26.
11. MaGrath A. J. (1986). “When Marketing Services, 4Ps Are Not Enough”. Business Horizons, 29(3), 45-50.
12. Möller, K. (2006). “The Marketing Mix Revisited: Towards the 21st Century Marketing by E. Constantinides”. Journal of Marketing Management, 22(3), 439-
450.
VOLUME NO. 3 (2013), I SSUE NO. 09 (SEPTEMBER ) ISSN 2231-5756
INTERNATIONAL JOURNAL OF RESEARCH IN COMMERCE, IT & MANAGEMENT A Monthly Double-Blind Peer Reviewed (Refereed/Juried) Open Access International e-Journal - Included in the International Serial Directories
http://ijrcm.org.in/
40
SECURING A BIOMETRIC TRAIT: A CASE STUDY ON FINGER PRINTS
MADHU CHAUHAN
RESEARCH SCHOLAR, MEWAR UNIVERSITY, CHITTORGARH; &
ASST. PROFESSOR (IT)
INSTITUTE OF INFORMATION TECHNOLOGY & MANAGEMENT
DELHI
DR. R. P. SAXENA
PROFESSOR
MAHAMAYA TECHNICAL UNIVERSITY
NOIDA
ABSTRACT Today’s inevitable need is getting the correct information within specified time frame. For satisfying our requirement, it is very important to make the information
secured from being damaged or tempered by any unauthorized user. There are many upcoming techniques in the field of information security. This paper
enlighten us about possible methods of securing an information, starting from the most basic and traditional method i.e. password based, ID based and biometric
trait based. As we all know that there are various possible biometric traits like fingerprint, hand recognition, iris based, ratina scan, face recognition etc. In this
paper we have chosen finger print for further research. Based on the study about these methods i.e. password based, ID based and biometric trait based, the
better method is also suggested. We also discuss various threats prevailing in the field of securing a biometric trait like latent print attacks, Trojan horse and fake
feature attacks. We also state literature review as much of the work is already done in this field. After mentioning the already existing work, we discuss the
current issues and challenges like robustness, performance, interoperatibility etc. We also discuss research objective to elaborate the work done in field of
securing a biometric trait, followed by future scope and conclusion.
KEYWORDS Physical Trait, Authentication, Steganography, Cryptography, Watermarking.
INTRODUCTION rom past many years, security has been a major concern, whether we talk about securing any product, information or identity of a person. Although many
methods, techniques and algorithms are being implemented, some of them are good to a large extent but threats are still prevailing. Here, in this paper
we will be concentrating on securing identity of a person. Again many minds are on their tracks to design a foolproof technique for the same.
As we know that there are various schemes like password based, ID based and physical trait1 based.
In the password based scheme, every user is provided with a password. When he wants to access any resource, he is asked to submit the password which is
matched with the one, stored in the database. Once there is a match the resource is accessible to the user, else not.
In case of ID based security, the person is given an Identity Card. This card contains the information about the person. At the time of request for any resource
the user has to show the card, after checking the required credentials, user is authenticated to use that resource.
In physical trait1 scheme the user provide an impression of finger print on the sensor which, along with the person’s details, is saved as a template in the
database. At the time of verification, the user is again asked to give the fingerprint sample which is then matched with already saved template. Depending on
the result, the user is allowed to access the resources.
Apart from matching the sample, there are measures to check the authentication accuracy, namely FRR 2and FAR
3.
As per the above discussion, it is analyzed that a system using physical trait is better as compared to password or ID based systems. Biometric systems possess a
complicated architectural design, incorporating complex modules as it deals with different kind of data. Apart from being complicated these types of system face
major problems, and root of all is Security. Securely saving a template, protecting it from unauthorized access, transferring the template without any errors and
many more aspects are to being worked upon. 1Here physical trait means Finger print Sample
2FRR means that a genuine person is denied to access the resources
3FAR means that a fake person is given the access to the resources
EXISTING WORK DONE Fengling Han et.al.[11], discuss a chaotic approach for encrypting fingerprint images by using a 2D chaotic sequence which is obtained from multi scroll chaotic
attractors. For generating the private key, initial values of chaotic attractors are used.
Before the actual work is done, a large number of features of fingerprints including overall ridge flow pattern, ridge frequency, lacation and position of singular
points, minutiae points, location of pores etc. she proposed two fingerprint authentication schemes. The first one is local fingerprint matching scheme where
images are captured and processed at local system. Second is centralized matching scheme where image is captured at local site and are sent to central point via
network, also used in ATM banking systems.
They also suggest different schemes that can be used to protect digital image/video from attacker i.e. digital watermarking and encryption. They also state that
normal encryption algorithms like DES, IDEA and RSA are not suitable for biometric image encryption.
Juan M. Vilardy et.al. [14], in their paper discuss a digital algorithm i.e. fractional fourier transform to encrypt fingerprint data samples. In the process of
encryption, a grayscale image of fingerprint is taken and it’s placed as the phase of a complex exponential, then is transformed five times and multiplied in
intermediate steps by four random phase masks statistically independent, thus to obtain the encrypted fingerprint.
On the other hand, in the process of decryption, the encryption procedure is applied in the inverse sense to the conjugated complex of the encrypted
fingerprint, then is taken the negative of the phase of the resulting image of the decryption process and the original fingerprint is obtained this way that had
been encrypted.
In the complete process nine keys are used constituted of five fractional orders and four random phase masks.
The Mean Square Error (MSE) between the input fingerprint and our decrypted fingerprint is calculated to validate the reliability of this algorithm.
Colin Soutar et.al.[9] emphasized on understanding the interface between biometric systems and general security systems is critical for the successful
deployment of biometric technologies. They states that at the time of sending private/ confidential data, the problems such as identity, replay and hill climbing
attacks must be avoided.
F

VOLUME NO. 3 (2013), I SSUE NO. 09 (SEPTEMBER ) ISSN 2231-5756
INTERNATIONAL JOURNAL OF RESEARCH IN COMMERCE, IT & MANAGEMENT A Monthly Double-Blind Peer Reviewed (Refereed/Juried) Open Access International e-Journal - Included in the International Serial Directories
http://ijrcm.org.in/
41
Daesung Moon et.al.[10], state that biometric-based authentication can provide a strong security guarantee of the identity of users. They propose a secure and
efficient protocol to transmit fingerprint images from a fingerprint sensor to a client by exploiting the characteristics of the fingerprint images. To reduce the
computational workload of applying the algorithm on full finger print sample, they suggest to apply the encryption algorithm to a nonce for integrity and to a
specific bitplane of each pixel of the fingerprint image for confidentiality. Experimental results show that the integrity and confidentiality of the fingerprint
images can be guaranteed without any leakage of the fingerprint ridge information and can be completed in real-time on embedded processors.
TYPE OF ATTACKS There are various types of severe attacks to the components of biometric systems.
Latent print attacks. Sometimes, we can extract previous finger print features from the sensor itself, as the impression of finger is left on the surface of sensor
which can be activated at later point of time.
Trojan horse virus may also attack computer systems, therefore it is advisable to perform any kind of biometric processing in a separate hardware outside the
system.
Fake feature attack, more commonly known as Spoofing, is also a kind of attack in which mechanical copies of the feature are designed, which is shielded by
liveness detection technique to a large extent.
Irrespective of the sensor, a stored template can be replayed into the system i.e. a copy of finger print can be replayed in the database.
Being easy to use, easy to install and of requiring less investment, fingerprint analysis is majorly in practice as compared to other biometric techniques. In order
to promote this technique and for enhancing its reach to many other areas, first an increased security is demanded.
There are various techniques to provide impart security such as cryptography, watermarking and steganography.
S.Brindha and Ila.Vennila (2011), states that Cryptography is a process of hiding information into an unintelligible (encrypted) form for the purposes of secure
transmission. Through the use of a “key” the receiver can decode the encrypted message (decrypting) to retrieve the original message.
Stenography improves on this by hiding the fact that a communication even occurred. The message m is imbedded into a harmless message c which is defined as
the cover-obect. The message m is then embedded into c, generally with use of a key k that is defined as the stego-key. The resulting message is then embedded
into the cover-object c, which results in stego-object s. Ideally the stego-object is indistinguishable from the original message c, appearing as if no other
information has been encoded.
While cryptography focuses on methods to make encrypted information meaningless to unauthorized parties, steganography is based on concealing the
information itself.
Watermarking is very similar to steganography in a number of respects. Both seek to embed information inside a cover message with little to no degradation of
the cover-object. Watermarking however adds the additional requirement of robustness. An ideal steganographic system would embed a large amount of
information, perfectly securely with no visible degradation to the cover object. An ideal watermarking system however would embed an amount of information
that could not be removed or altered without making the cover object entirely unusable.
Watermarking technique provides solution to ensure the validity of biometrics; proposed scheme is composed of three parts: watermark embedding, data
embedding and data extraction. They also states the difference between encryption and watermarking highlighting the advantages of using watermarking.
Firstly, watermark is imperceptible. Secondly, the watermarks and the works they embedded in are inseparable.
CURRENT ISSUES AND CHALLENGES As we all know that, the output of any system depends upon the input provided. Similarly, the result of a fingerprint recognition system depends on the quality
of fingerprint sample inputted. The fingerprint image depends on various factors like skin conditions, sensor conditions etc. A poor quality image results in
missed features which in turn along with lack of robustness, degrade the performance of the system. Thus accepting a sample of good quality and maintaining
its validity is a major challenge.
Sensor interoperatibility is also a major area of concern. Different vendors are designing different kind of sensors on the basis of customer’s needs and
preferences. But once we talk about comparing the samples taken from different sensors, we are restricted to do so. Thus changing a sensor may affect
performance of the system. Thus to solve this issue, common data exchange formats should be developed to facilitate the exchange of feature sets between
vendors.
Today, the fingerprint sensors are embedded in various devices like mobile phones and PDAs to provide security. But the sensor, being of small in area leads to
less overlap between fingerprint positions of same finger which hampers performance of the system.
RESEARCH OBJECTIVE After studying all the aspects, we have analyzed that there are many algorithms designed in this filed. I have decided to study Multi-algorithm multibiometrics
System, where as the name suggest, more than one algorithm is implemented to identify the user. Based on the study, my aim is to design an optimized
algorithm to make a finger print sample more secure, so that the scope of finger print recognition system could be widened.
FUTURE SCOPE There are some high security areas where security based on one trait is not sufficient. The logic behind is, if anyone loose the particular trait e.g. person loose his
hand then the system will not be able to recognize the user, even if he is the authorized one. In this paper we have emphasized on security aspect of Finger
prints which could be extended to providing security on the basis of other Biometric traits like hand, face, iris, retina etc. Work can also be extended to
combining more than one physical feature, depending on the requirement, to provide security.
CONCLUSION As we have seen that out of many possible methods of information security i.e. password based, ID card based and biometric based, later is better. On one hand,
if we consider simplicity and installation, then former method is chosen. But we consider better security, then biometric method should be the choice. Thus the
implementation of technique depends upon granularity of secrecy of information and the level of security needed. Apart from the fact that in biometric trait
method there are some threats, we can believe that those can be worked upon. There are many great minds which are trying to impart security with the
techniques like watermarking, steganography and cryptography. On the basis of literature survey we can conclude that watermarking is comparatively simple to
implement. If anyone wants to implement any of the biometric trait method then there is different kind of data would be studied. Such as, in fingerprints, to
understand the features one should have in depth knowledge of minutiae, ridges patterns etc. We have also discussed the current issues and challenges, which
emphasized on robustness, performance and interoperatibility. The day when all hindrances are over, biometric technique will be used all over the world and
that too in all the fields.
REFERENCES BOOKS
1. Hand Book of Biometrics Jain, Anil K.; Flynn, Patrick; Ross, Arun A. (Eds.) 2008, X, 556 p. 60 illus.
CONFERENCE PAPERS
2. An Introduction to Multibiometrics Arun Ross(2007), West Virginia University, 15th Europian signal processing conference.
VOLUME NO. 3 (2013), I SSUE NO. 09 (SEPTEMBER ) ISSN 2231-5756
INTERNATIONAL JOURNAL OF RESEARCH IN COMMERCE, IT & MANAGEMENT A Monthly Double-Blind Peer Reviewed (Refereed/Juried) Open Access International e-Journal - Included in the International Serial Directories
http://ijrcm.org.in/
42
3. Ann Cavoukian (2008).Biometric Encryption: A Transformative Technology that Delivers Strong Security and Privacy.nn Information and Privacy
Commissioner Ontario. Institute of Electrical and Electronics Engineers 6th Biometrics Symposium
4. Joseph Lewis(2002). Biometrics for secure Identity Verification: Trends and Developments. University of Maryland, Bowie,State University.
5. Ontario (2008).Biometric Encryption: A Transformative Technology that Delivers Strong Security and Privacy. Institute of Electrical and Electronics
Engineers 6th Biometrics Symposium.
THESIS
6. Umut Uludag (2006). Secure Biometric Systems. (Doctoral Dessertation, Michigan State University).
JOURNALS AND OTHER ARTICLES
7. Anil K. Jain, Arun Ross, Sharath Pankanti (2006). Biometrics: A Tool for Information Security”, IEEE Transactions on Information Forensics and Security, Vol
1, No. 2.
8. Anthony.et.al (2009). Securing Biometric Data. Seminar Biometric & Security. Mitsubishi Electronic Research Laboratories.
9. Colin Soutar. Biometric System Security.CTO.Bioscrypt Inc. [email protected]
10. Daesung Moon.et.al.(2006).An Efficient Selective Encryption of Fingerprint Images for Embedded Processors. Department of Computer Information, Korea
University, Chungnam, Korea.
11. Fengling Han.et.al.(2006). Fingerprint images encryption via multi-scroll chaotic attractors. School of Computer Science and Information Technology, Royal
Melbourne Institute of Technology, Melbourne, VIC 3001, Australia
12. Fingerprint based Biometric Systems by Chaynika Taneja and Sumit Goswami, PC Quest, Edition Nov. 2010
13. History of Steganography and Cryptography. Downloaded from: http://www.petitcolas.net/fabien/steganography/history.html.
14. Juan M. Vilardy.et.al (2008). Fingerprint Encryption using Fractional Fourier Transform. 5th. European Congress on Computational Methods in Applied
Sciences and Engineering
15. Kamalpreet.et.al (2011). Multi-Biometric Personal Verification System based on Fingerprints and Iris. IJECT Vol. 2, Issue 2, June 2011 ISSN : 2230-
7109(Online) | ISSN : 2230-9543(Print).
16. Uwe M. Bubeck, Multibiometric Authentication - An Overview of Recent Developments, Term Project CS574, Spring 2003, San Diego State University.
17. Zambooni. Attacking Biometric Access Control Systems.(Powerpoint presentation). Downloaded from: www.miskatoniclabs.com/biometrics/

VOLUME NO. 3 (2013), I SSUE NO. 09 (SEPTEMBER ) ISSN 2231-5756
INTERNATIONAL JOURNAL OF RESEARCH IN COMMERCE, IT & MANAGEMENT A Monthly Double-Blind Peer Reviewed (Refereed/Juried) Open Access International e-Journal - Included in the International Serial Directories
http://ijrcm.org.in/
43
INFORMATION AND COMMUNICATION TECHNOLOGY AND THE PERFORMANCE OF SMALL AND MEDIUM
ENTERPRISES IN NASARAWA STATE, NIGERIA
UMARU DANLADI MOHAMMED
SR. LECTURER
DEPARTMENT OF BUSINESS ADMINISTRATION
UNIVERSITY OF ABUJA
NIGERIA
CHINELO GRACE OBELEAGU-NZELIBE
DEAN
FACULTY OF MANAGEMENT SCIENCES
UNIVERSITY OF ABUJA
NIGERIA
ABSTRACT The adoption of Information and Communication Technology (ICT) has precipitated accelerated performance in the Small and Medium Enterprises (SMEs) sub-
sector despite its disadvantage of pushing people out of job. It has made rapid changes in global production, work and business methods, and trade and
consumption patterns in and between enterprises and consumers. This study examines the impact of the adoption of ICT on the Performance of SMEs in terms of
productivity, profitability, turnover, efficiency, customer’s satisfaction, employment opportunity, cost reduction and time saving. Questionnaires were
administered to 100 SMEs in Nasarawa State which were randomly selected as the study sample and Pearson Product Moment Correlation Coefficient (PPMCC)
was used as the method of analysis to find the correlation between ICT and the performance indicators in addition to the descriptive statistics. The findings of the
study showed that, the adoption of ICT is positively and significantly correlated to productivity, profitability and employment generation but, negative and
significant relationship to cost savings. This means that the adoption of ICT increases productivity, profitability and employment generation by the SMEs and
decreases operation costs. The study concludes a significant correlation between the adoption of ICTs and the performance of SMEs in Nasarawa State. This
inspires the study to recommend for the future an integration of ICT in day-to-day activities and/or general operations of the SMEs in Nasarawa state.
KEYWORDS Information and Communication Technology, Small and Medium Enterprises, Performance Indicators.
1. INTRODUCTION oday’s business world has been deeply influenced by Information and Communication Technology (ICT) and the application of ICT among business is
widespread. ICT is rapidly changing global production, work, business methods, trade and consumption patterns in and between enterprises and
consumers. It has provided new ways to store, process, distribution and exchange information within companies and with customers (Kollberg & Dreyer,
2006). The recent ICT developments have enormous implications for the operation, structure and strategy of organizations (Buhalis, 2003). Organizations of all
types around the globe are currently utilizing ICT, not only to cut costs and improve efficiency, but also to provide better customer service (Ashrafi & Murtaza,
2008). Spanos et al, (2002) state that ICT has the ability to enhance, coordinate and control the operations of many organizations and can increase the use of
management systems.
On the other hand, Ongori and Migiro (2010) state that the impact of globalization has obliged many SMEs to adopt ICT in order to survive in the present
competitive era especially in competing with large organizations. Bresnahan et al. (2002) argued that durable productivity gains have been achieved in
enterprises that use ICT. ICT helps in the effective flow of data in organizations thereby assisting organizations to obtain information at any given time which in
turn, helps these organizations to reach their desired targets. In addition, ICT brings about change in businesses and helps to create competitive advantage
hence, organizations of all types including SMEs adopt ICT.
Information and Communication Technology (ICT) is considered to be a powerful tool for socio-economic development. Effective ICT-utilisation, appropriate
applications, and individually tailored solutions, can create cross-sectoral opportunities and, thus, ICT can play a substantial role to address a number of goals on
the development agenda. In an attempt to identify sectors that are likely to be responsive to technological change with high return on investment, Small and
Medium Enterprises (SMEs) have materialised as one potential target sector to harness ICT for development.
Small and Medium Enterprises (SMEs) play an important role in economic development of a country. Several theories elaborate on the connection between
information technology, economic development and social change. Almost all agree on the importance of information and communication technology adoption
in SME, while the importance of SME as the engine to economic growth is well acknowledged worldwide.
Information and communication technology, particularly the “Internet” is having a significant impact on the operations of SMEs and essential for the survival and
growth of the nation’s economy in general and SMEs in particular. Information technology is changing the economy and traditional businesses have become
more dependent on new technologies. New technologies facilitate increased interactivity, flexibility, cheap business transactions as well as improve
interconnectivity with business partners and customers. Information technology is having a significant impact the sector of Small and Medium Enterprises
(SMEs), especially where industries are in decline with high levels of unemployment. Inspite of all the advantages accrued by ICTs, it is capable of rendering
people jobless as works that are required to be done manually are replaced with computers.
This study focus on the impact of the adoption of ICT on the performance of SMEs in Nigeria, particularly in Nasarawa State. Thus, the study addresses the
following questions; does the adoption of ICT increase productivity, profitability, turnover, efficiency and customer’s satisfaction? Does it reduce operation cost,
and saves time? What is the effect of the adoption of ICT on employment opportunity?
RESEARCH HYPOTHESES The study assumed the following answers to the research problem that informed the study:
H01: There is no significant correlation between the adoption of ICT and the productivity of SMEs in Nasarawa State.
H02: There is no significant correlation between the adoption of ICT and the profitability of SMEs in Nasarawa State.
H03: There is no significant correlation between the adoption of ICT and cost reduction of SMEs in Nasarawa State.
H04: There is no significant correlation between the adoption of ICT and employment generation in SMEs in Nasarawa State.
T

VOLUME NO. 3 (2013), I SSUE NO. 09 (SEPTEMBER ) ISSN 2231-5756
INTERNATIONAL JOURNAL OF RESEARCH IN COMMERCE, IT & MANAGEMENT A Monthly Double-Blind Peer Reviewed (Refereed/Juried) Open Access International e-Journal - Included in the International Serial Directories
http://ijrcm.org.in/
44
2. LITERATURE REVIEW 2.1 EXPLORING THE IMPACT OF ICT
Adeosun, et al,(2009) state that, the use of ICT enables strategic management, communication, collaboration, information access, decision making, data
management and knowledge management in organizations. ICT causes fundamental changes in the nature and application of technology in businesses. ICT can
provide powerful strategic and tactical tools for organizations, which, if properly applied and used, could bring great advantages in promoting and strengthening
their competitiveness (Buhalis, 2003). Hengst and Sol (2001) state that ICT enables organizations to decrease costs and increase capabilities and thus assist to
shape inter-organizational coordination. The use of ICT can assist to lower coordination cost and increase outsourcing in organizations.
ICT is used to exchange information and it provides a medium for learning. Ramsey, et al, (2003) note that organizations generally stand to gain from ICT in areas
such as reduced transaction costs, information gathering and dissemination, inventory control, and quality control. Fink and Disterer, (2006) argue that ICT not
only help organizations to become more efficient and effective but also help them to become competitive. Pavic et al. (2007) state that organizations have the
opportunity to achieve a competitive advantage from the advances in ICT through innovation, marketing, efficiency gains, better quality and customer
responsiveness. Lal,(2004) further states that web-enabled services increase the competitiveness of organizations as they change the relationship with
customers and also assist to create stronger link between firms and clients. ICT helps to increase business competitiveness and enhance enterprise performance
through indirect cost savings such as labour costs and increased labour productivity and direct cost such as reduction of firm’s input (Chowdhury & Wolf, 2003;
Love et al., 2006). In order words, ICT can influence the performance of an enterprise in multifaceted ways. Hence, ICT can bring about change in organizations
and make them more competitive, innovative and generates growth (Obijiofor et al., 2005).
2.2 THE ROLE AND BENEFITS OF ICT IN SMEs
The definition of SMEs varies from country to country but is often based on employment, assets or a combination of the two. The Small and Medium
Development Agency of Nigeria (SMEDAN) defines SMEs based on the following criteria: a micro enterprise as a business with less than 10 people with an annual
turnover of less than 5 million Naira, a small enterprise as a business with 10-49 people with an annual turnover of 5-49 million Naira while a medium enterprise
as a business with 50-199 people with an annual turnover of 50-499 million Naira. In Nigeria, SMEs cover the entire range of economic activity within all sectors
(SMEDAN, 2005).
In the present knowledge-based economy, it is important for SMEs to adopt processes that enable them to provide services that will bring about competitive
advantage. ICT has a significant positive impact on organizational performance (Maldeni & Jayasena, 2009) and is vital to SMEs. Without the use of ICT, modern
businesses are not possible as ICT has a significant impact on SMEs operations and crucial for the survival and growth of economies in general (Berisha-Namanil,
2009). ICT provide opportunities for business transformations (Chibelushi, 2008) and provide SMEs the opportunity to conduct business anywhere (Jennex et al.,
2004). The European Commission (2008), states that SMEs could use ICT in order to grow and to become more innovative. Love et al; (2004) also ascertain that
the use of ICT offers many benefits to SMEs at different levels (operational level, tactical level and strategic level). The benefit of ICT cuts across all sectors of the
economy and all the fields of human activities.
According to Fullanteli and Allegra, (2003), ICT offers to enterprises a wide range of possibilities for improving SME’s competitiveness. It provides mechanisms
for getting access to new market opportunities and specialized information services such as distance consulting, continuous training, and new advisory modes.
Organizations can exchange real-time information and build closer relationships with their customers, suppliers and business partners. Customers can receive
immediate feedback that allow companies to react fast to changing customers’ demands and recognizing new market niches. This implies that organizations that
are able to exploit the potentials offered by ICT can handle innovative processes such as Supply Chain Management (SCM), Customer Relationship Management
(CRM) and Knowledge Management (KM) more effectively (Fullanteli and Allegra, 2003). Also, Swift, (2009) argues that SMEs benefit from the use of ICT as it
connects them more easily and cheaply to external contacts. Through the use of ICT infrastructures, SMEs can engage in e-commerce.
Electronic commerce will aid them in increasing their efficiency in their day-to-day business operations and sustain their business growth through the opening of
new market channels, and to increase the flow of information (Ongori & Migiro, 2010). ICT enable SMEs to have access to robust business information that lead
to organizational effectiveness (Irani, 2002). Hence, ICT is now viewed as a vital resource that enhances the competitiveness of SMEs in any business
environment.
2.3 ICT ADOPTION AND FIRM PERFORMANCE
Despite the potential benefits of ICT and e-commerce, there is debate about whether and how their adoption improves firm performance. Use of and
investment in ICT requires complementary investments in skills, organisation, innovation, investment and change entails risks and costs as well as bringing
potential benefits. While many studies point to the possibility of market expansion as a major benefit for SMEs, larger businesses can also expand into areas in
which SMEs dominated. Moreover, it is not easy for SMEs to implement and operate an on-line business, as this involves complementary costs for training and
organisational changes as well as direct costs of investing in hardware and software solutions.
While many studies provide evidence of the positive effects of ICT adoption on firm performance, others have shown no relation between computer use and
firm performance. A study of Canadian manufacturing establishments (plants) with ten or more employees (excluding food processing establishments) drawn
from the Statistics of Canada’s business register, shows that those with high productivity growth are more likely to be using greater numbers of advanced ICT
(Baldwin, 2002). Between 1988 and 1997, advanced technology users grew more in terms of both productivity and profitability than non-ICT users, especially
when they use communication technologies, including company-wide and/or inter-company computer networks.
Recently, Organisation and Economic Cooperative Development (OECD) analysis shows the impacts of ICT and e-business strategies on firm performance as
being positive in the overall, but that ICT are not a panacea in themselves. The OECD’s Electronic Commerce Business Impacts Project (EBIP) studied a set of 220
early successful adopters of e-business strategies in a range of established sectors in eleven different countries. This study showed the positive impacts of e-
commerce on their turnover and profitability and to a lesser extent on employment, most notably when e-commerce is part of larger business strategies of firms
(OECD, 2002). Further work by researchers in 13, OECD countries, based on large scale statistical surveys provides, evidence that the use of ICT can contribute to
improved firm performance, in terms of increased market share, expanded product range, customised products and better response to clients demand.
Moreover, it indicates that ICT may help reduce inefficiency in the use of capital and labour, e.g. by reducing inventories, and that the more customers or firms
are connected to the network, the greater the benefits (spillover effects). However, the analysis shows that complementary investments in skills, organisational
change and innovation are key to making ICT work, and that the use of ICT affects firm performance primarily when accompanied by other changes and
investments and that without these, the economic impact of ICT may be limited.
Denni, (1996) stresses that every business must bring ICT into their business operation and take advantage of the benefits they offer. Small businesses are
increasingly using and adopting information and communication technology due to the advent of Personal Computers, (PCs), cost-effectiveness and cheaper ICT
products. Alberto and Fernando, (2007) argue that the use of ICT can improve business competitiveness with internet providing numerous opportunities for
SMEs to compete equally with large corporations. Apulu and Latham (2010) state that appropriate use of ICT can assist SMEs gain competitive advantage by
reducing costs and improving core business processes. ICT improves business competitiveness and enhances enterprise performance through indirect cost
savings such as labour cost and increased labour productivity and direct cost such as reduction of firms input (Chowdbury & Wolf, 2003). According to
Brynsolfsson and Hitt (2000), the use of ICT can help to cut down the cost of coordination, communication, information processing and also enable efficient
service provision at lower cost.
As the world economy continues to move toward increased integration as a result of advances in information communications technology, and the increasing
reduction in trade barriers, some of the greatest opportunities for small businesses will derive from their ability to participate in the regional and international
markets (Mutula & Brakel, 2006). Adoption of the ICT is considered to be a means to enable these businesses to compete on a global scale, with improved
efficiency, and closer customer and supplier relationships (Chong et al., 2001). In this respect, SMEs should consider information and communication technology
(ICT) as an important approach in their business to take competitive advantage from the global markets (Mutsaers et al., 1998). Moreover, ICT is a resource of
SME which may help them to access and contribute to in order to enhance its competitiveness (Swash, 1998).

VOLUME NO. 3 (2013), I SSUE NO. 09 (SEPTEMBER ) ISSN 2231-5756
INTERNATIONAL JOURNAL OF RESEARCH IN COMMERCE, IT & MANAGEMENT A Monthly Double-Blind Peer Reviewed (Refereed/Juried) Open Access International e-Journal - Included in the International Serial Directories
http://ijrcm.org.in/
45
Some empirical studies by Bartelsman and Doms (2000), Brynjolfsson and Yang (1996), Dedrick et al. (2003), Kohli and Devaraj (2003) and Melville et al. (2004)
confirm the positive effect of information and communication technology (ICT) on firm performance in terms of productivity, profitability, market value and
market share. Their study also reveals that ICT has some effect in terms of intermediate performance measures, such as process efficiency, service quality, cost
savings, organization and process flexibility and customer satisfaction. The introduction of ICT will offer various new investment opportunities within local
industries, particular in the area of SMEs. Industries that are developing may take advantage of ICT which are being recognized by many previous studies. In fact,
there is a need to accelerate the implementation of ICT to improve business performance.
3. RESEARCH METHODOLOGY This study is essentially investigative and explanatory and seeks to know the effectiveness of the adoption of ICT on the performance of SMEs in Nasarawa State.
The structure of its process and procedure is therefore descriptive. This study belongs to the generic family research design type called survey design.
Due to the technical nature of the topic of study, coupled with the need to ensure that the responses obtained are representative and reliable enough, the
population of this study was narrowed to Nasrawa State, Nigeria with 100 SMEs randomly selected as sample. A questionnaire (or the research instrument) was
administered to each of the sampled firms but only 96 were retrieved and analysed, 4 were not returned. The copies of the 100 questionnaires were given to
managers and/or owners of the respective sampled SMEs in the 13 Local Government Areas (LGAs) of Nasarawa State.
The questionnaire was designed in such a way as to provide vital answers for the research questions and hypotheses tested. The questionnaire contained a set
of questions classified into two major sections; section “A” and section “B”. Section “A” featured questions on bio-data of the respondents, while Section “B”
contained numerous statements of assertion and closed-ended questions. These were designed primarily to provide information for testing the hypotheses
using Pearson Product Moment Correlation Coefficient (PPMCC) with the aid of SPSS in addition to descriptive statistics to analyse the differences in mean and
standard deviation of the numerous statements of assertion. The opinions of respondents to these statements were sought out through likert scale format
which is a psychometric scale commonly used in questionnaires, being the most widely used scale in survey researches.
4. RESULTS AND DISCUSSION The results and discussion of this study were analysed based on the hypotheses of the study. Descriptive and inferential statistics such as Pearson Product
Moment Correlation Coefficient adopted as analytical tools. The table is the result of the computation of the mean and standard deviation from the responses
collected from the sample studied.
DESCRIPTIVE STATISTICS
N Mean Std. Deviation
Adoption of ICTs 94 4.8404 .36817
Productivity of SMEs 96 3.4896 1.45815
Profitability of SMEs 94 3.5319 1.41954
Turnover of SMEs 96 3.5313 1.40640
Efficiency of SMEs 94 3.5213 1.41215
Customer's Satisfaction in SMEs 93 3.5054 1.41132
Cost Reduction in SMEs 96 4.6979 .46157
Employment Generation in SMEs 95 4.2211 .96952
Time Savings in SMEs 95 3.5368 1.41279
Valid N (listwise) 90
Source: SPSS Output, 2013
The above table confirms the effectiveness of the adoption of ICTs in SMEs given the high mean score of above 4.84. This follows that the adoption of ICT in
SMEs has more influence on cost reduction and employment generation with a high mean score of above 4.69 and 4.22 respectively. This means, they are rated
high compared to profitability, turnover, efficiency, customer’s satisfaction and time saving with respective mean scores of above 3.53, 3.53, 3.52, 3.50 and 3.53
respectively. Question on whether the adoption of ICT increases productivity scored the lowest mean score of about 3.49 from the study. This implies there is no
enough productivity in SMEs in Nasarawa State to justify the cost savings and employment generations.
CORRELATIONS
Adoption of ICTs Productivity of SMEs
Adoption of ICTs Pearson Correlation 1 .364(**)
Sig. (2-tailed) .000
N 94 94
Productivity of SMEs Pearson Correlation .364(**) 1
Sig. (2-tailed) .000
N 94 96
Source: SPSS Output, 2013
**Correlation is significant at the 0.01 level (2-tailed).
From the above Pearson’s results, it is clearly indicated that the adoption of ICT in SMEs Nasarawa State has significant positive correlation with productivity.
This implies that productivity in SMEs increases with increase in the adoption of ICTs. The correlation is low because it is only significant at 0.01 levels but it is
positive and direct. The Null hypothesis that states that, there is no significant correlation between the adoption of ICTs and the productivity of SMEs in
Nasarawa State is rejected.
CORRELATIONS
Adoption of ICTs Profitability of SMEs
Adoption of ICTs Pearson Correlation 1 .249(*)
Sig. (2-tailed) .016
N 94 93
Profitability of SMEs Pearson Correlation .249(*) 1
Sig. (2-tailed) .016
N 93 94
Source: SPSS Output, 2013
*Correlation is significant at the 0.05 level (2-tailed).
The above Pearson’s results indicate that the adoption of ICTs in Nasarawa State SMEs has significant positive correlation with profitability. This implies that
profitability in SMEs increases with increase in the adoption of ICTs. The correlation is significant at 0.05 levels. Thus, the Null hypothesis that states that, there is
no significant correlation between the adoption of ICTs and the profitability of SMEs in Nasarawa State is rejected.

VOLUME NO. 3 (2013), I SSUE NO. 09 (SEPTEMBER ) ISSN 2231-5756
INTERNATIONAL JOURNAL OF RESEARCH IN COMMERCE, IT & MANAGEMENT A Monthly Double-Blind Peer Reviewed (Refereed/Juried) Open Access International e-Journal - Included in the International Serial Directories
http://ijrcm.org.in/
46
CORRELATIONS
Adoption of ICTs Cost Reduction in SMEs
Adoption of ICTs Pearson Correlation 1 -.228(*)
Sig. (2-tailed) .027
N 94 94
Cost Reduction in SMEs Pearson Correlation -.228(*) 1
Sig. (2-tailed) .027
N 94 96
Source: SPSS Output, 2013
*Correlation is significant at the 0.05 level (2-tailed).
From the above Pearson’s results, it is clearly indicated that the adoption of ICTs in Nasarawa State SMEs has significant negative correlation with cost savings.
This implies that cost of expenditures in SMEs decreases with increase in the adoption of ICTs. The correlation is significant at 0.05 levels. Thus, the Null
hypothesis that states that, there is no significant correlation between the adoption of ICTs and the cost reduction of SMEs in Nasarawa State is rejected.
CORRELATIONS
Adoption of ICTs Employment Generation in SMEs
Adoption of ICTs Pearson Correlation 1 .220(*)
Sig. (2-tailed) .033
N 94 94
Employment Generation in SMEs Pearson Correlation .220(*) 1
Sig. (2-tailed) .033
N 94 95
Source: SPSS Output, 2013
*Correlation is significant at the 0.05 level (2-tailed).
From the above Pearson’s results, it is clearly indicated that the adoption of ICT in Nasarawa State SMEs has significant positive correlation with employment
generation. This implies that employment generation in SMEs increases with increase in the adoption of ICT. The correlation is significant at 0.01 levels. Thus,
the Null hypothesis that states that, there is no significant correlation between the adoption of ICT and the employment opportunity in SMEs in Nasarawa State
is rejected.
It suffices to say from the above results that, the adoption of ICT has positive and significant correlation with the productivity of SMEs in Nasarawa State given
the coefficient and level of significant of 0.364 & 0.000 respectively. Thus, our hypothesis that says, there is no significant correlation between the adoption of
ICT and the productivity of SMEs is rejected. This implies that adoption of ICT by SMEs in Nasarawa State could lead to massive productivity. This is consistent
with the findings in previous studies such as Brynjolfsson and Yang (1996), Bartelsman and Doms (2000), Baldwin (2002), Dedrick et al. (2003), Kohli and Devaraj
(2003). Thus, the adoption of ICTs by SMEs in Nasarawa State has not led to increased productivity given the lowest mean score of about 3.49 to commensurate
the employment target of the SMEs.
Similarly, the adoption of ICTs has positive and significant correlation with the profitability of SMEs in Nasarawa State given the coefficient and level of
significant of 0.249 & 0.016 respectively. Thus, the Null hypothesis is rejected by accepting the alternate hypothesis that the correlation between the adoption
of ICT and the profitability of SMEs in Nasarawa State is significant. This means that the adoption of ICT by SMEs in Nasarawa State has increased the
profitability. This is consistent with the findings in previous studies such as Brynjolfsson and Yang (1996), Bartelsman and Doms (2000), Dedrick et al. (2003),
Kohli and Devaraj (2003) and Melville et al. (2004). It follows that the adoption of ICT by SMEs in Nasarawa State would increase profitability in collaboration
with increased turnover, cost reduction, efficiency and customer’s satisfaction.
It is also evident from the above results and analysis that, the adoption of ICT has negative and significant correlation with cost savings of SMEs in Nasarawa
State given the coefficient and level of significant of -0.228 & 0.027 respectively. Thus, the Null hypothesis is rejected by accepting the alternate hypothesis that
the correlation between the adoption of ICT and the cost savings of SMEs in Nasarawa State is significant. This means that, the adoption of ICT by SMEs in
Nasarawa State has significantly reduced cost of expenditure. This is consistent with the findings in previous studies of Brynsolfsson and Hitt (2000) who argued
that the use of ICT can help to cut down the cost of coordination, communication, information processing and also enable efficient service provision at lower
cost, Chowdbury and Wolf (2003) and more recently Apulu and Latham (2010) confirmed the above finding in the studies.
The result also shows that, the adoption of ICT is significantly positively correlated to employment generation in SMEs in Nasarawa State given the coefficient
and level of significance of 0.220 and 0.033 respectively. Thus, the Null hypothesis is rejected by accepting the alternate hypothesis that the correlation between
the adoption of ICT and employment generation in SMEs in Nasarawa State is significant at 5%. This means that the adoption of ICTs by SMEs in Nasarawa State
would significantly increase employment opportunities. This is consistent with the findings in previous studies such as Denni (1996), Swift (2009). The results
revealed that the employment opportunities in SMEs suffer a setback because of the defective productivity in the SMEs that could not commensurate the
needed target.
5. CONCLUSIONS AND RECOMMENDATIONS From the study conducted and the findings obtained, the following conclusion were reached, the adoption of ICT is positively correlated to productivity,
profitability and employment generation with statistical significance. The cost savings correlation is negative and statistical significance. This implies that
productivity, profitability and employment opportunities of SMEs in Nasarawa State increase with an increase in the adoption of ICT but, cost saving decreases
with an increase in the adoption of ICT. That is, the correlation between the adoption of ICTs, and productivity, profitability and employment generation is
positive and significant, but that of cost savings is inverse. Thus we conclude that, the adoption of ICTs could exert positive impact on the performance of SMEs
in Nasarawa State by reducing cost of expenditure, and increasing productivity, profitability and employment opportunities. The study also concludes that ICT
adoption amongst SMEs in Nasarawa State have competitive advantage, satisfy their customers, and saves time and cost. The significance of this study is of
value to SME owner-managers and IT professionals as it could encourage them to intensify their efforts in deploying ICT in their various organizations and
enlightening employees on the benefits that is associated with the adoption of ICT.
The study recommends, based on the conclusions reached that; Nigerian SMEs should develop better organizational capabilities by integrating ICT in their day-
to-day activities as it could enable them to effectively benefit from the opportunities that are associated with the use of ICT in the current knowledge based
economy. Also, in order for SMEs in Nigeria to keep up with competitions in the present era of technological advancements, ICT awareness should be increased
and the Nigerian government should put in place viable frameworks that could support these SMEs and Nasarawa State government should throw its weight
fully to support SMEs in the state.
REFERENCES 1. Adeosun, O. O., Adeosun, T. H. & Adetunde, I. A. (2009). Strategic application of information and communication technology for effective service delivery in
banking industry. Journal of Social Sciences, 5(1), 47-51.
2. Alberto, B.M. & Fernando, L.L. (2007). A firm-level analysis of determinants of ICT adoption in Spain. Technovation, 27, 352-366.
3. Apulu, I., & Latham, A. (2010). Benefits of information and communication technology in small and medium sized enterprises: a case study of a Nigerian
SME. Proceedings of the 15th Annual Conference on UK Academy for Information Systems (UKAIS), March 23-24, Oriel College, University of Oxford.

VOLUME NO. 3 (2013), I SSUE NO. 09 (SEPTEMBER ) ISSN 2231-5756
INTERNATIONAL JOURNAL OF RESEARCH IN COMMERCE, IT & MANAGEMENT A Monthly Double-Blind Peer Reviewed (Refereed/Juried) Open Access International e-Journal - Included in the International Serial Directories
http://ijrcm.org.in/
47
4. Ashrafi, R. & Murtaza, M. (2008). Use and Impact of ICT on SMEs in Oman. Electronic Journal Information Systems Evaluation, 11(3), 125-138. [Online]
Available: http://www.ejise.com/volume-11/volume11-issue3/ashrafiAndMurtaza.pdf (October 10, 2009).
5. Bartelsman, E.J. and Doms, M. (2000). Understanding productivity: lessons from longitudinal Micro Data. Journal of Economic Literature, 38 (3), 569-594.
6. Berisha-Namani, M. (2009). The role of information technology in small and medium sized enterprises in Kosova. Fulbright Academy 2009 Conference
Small Places Can Change the World. [Online] Available: http://www.fulbrightacademy.org/file_depot/0- 10000000/2000030000/21647/folder/8 2430/Be
risha+Paper+IT+i n+SMEs+in+Kosovo.pdf (July 15, 2009).
7. Bresnahan, T., Brynjolfsson, E. & Hitt, L. M. (2002). Information technology workplace organisation and demand for skilled labour: firm level evidence.
Quarterly Journal of Economics, 117 (1), 339-76.
8. Brynjolfsson, E. & Yang, S. (1996). Information technology and productivity: a review of the literature. Advances in Computers, 43, 179-214.
9. Buhalis, D. (2003). eAirlines: strategic and tactical use of ICTs in the airline industry. Information and Management, 41, 805–825.
10. Chibelushi, C. (2008). Learning the hard way? Issues in the adoption of new technology in small technology oriented firms. Education + Training, 50(8/9),
725-736.
11. Chong, S., Pervan, G. & Bauer, C. (2001). Implementation Success of Internet-based Electronic Commerce for Small-and Medium-sized Enterprises in
Australia. 14th International Bled Electronic Commerce Conference, Bled, Slovenia, June 25-26.
12. Chowdhury, S. K. & Wolf, S. (2003). Use of ICTs and the economic performance of SMEs in East Africa. Discussion Paper No. 2003/06.
13. Dedrick, J., Gurbaxani, V. & Kraemer, K.L. (2003). Information technology and economic performance: a critical review of the empirical evidence. ACM
Computing Surveys, 35 (1), 1-28.
14. Denni, A.R. (1996). Information exchange and use in group decisions making: You can lead a group to information, but you can’t make it think. MIS
Quarterly, 4(2), 433-457
15. European Commission. (2008). Making SMEs more competitive [Online] Available: http://ec.europa.eu/enterprise/sme/competitive_en.htm (October 30,
2008).
16. Fink, D. & Disterer, G. (2006). International case studies: to what extent is ICT infused into the operations of SMEs. Journal of Enterprise Information, 19,
608-624.
17. Fulantelli, G. & Allegra, M. (2003). Small company attitude towards ICT based solutions: Some key-elements to improve it. Educational Technology and
Society, 6(1). [Online] Available http://www.ifets.info/journals/6_1/fulantelli.html (March 10, 2009).
18. Hengst, M. & Sol, H. G. (2001). The impact of information and communication technology on inter organizational coordination: Guidelines from theory.
Informing Science, Special Series on Information Exchange in Electronic Markets, 4, 3, 2001.A Special Series on Information Exchange in Electronic Markets.
19. Irani, Z. (2002). Information systems evaluation: navigating through the problem domain. Journal of Information & Management, 40 (1), 11-24.
20. Jennex, M. E., Amoroso, D. & Adelakun, O. (2004) E-commerce infrastructure success factors for small companies in developing economies. Electronic
commerce Research, 4, 263-286.
21. Kohli, R. and Devraj, S. (2003). Measuring information technology payoff: a meta-analysis of structural variables in firm-level empirical research.
Information System Research, 14 (2), 127-145.
22. Kollberg, M. & Dreyer, H. (2006). Exploring the impact of ICT on integration in supply chain control: a research model. Department of Production and
Quality Engineering, Norwegian University of Science and Technology, Norway.
23. Lal, K. (2004). E-business and export behaviour: evidence from Indian firms. World Development, 32(3), 505-517.
24. Love, P. E. D., Irani, Z. & Edwards, D. J. (2004). Industry-Centric benchmarking of information technology benefits, costs and risks for small and medium
sized enterprises in construction. Automation in Construction, 13(4), 507-524.
25. Maldeni, H. M. C. M. & Jayasena, S. (2009). Information and Communication Technology Usage and Bank Branch Performance. The International Journal on
Advances in ICT for Emerging Regions (ICTer), 2 (2), 29 – 37.
26. Melville, N., Kraemer, K.L. and Gurbaxani, V. (2004). Information technology and organizational performance: an integrative model of IT business value,
MIS Quarterly, 28 (22), 283-322.
27. Mutsaers, E-J., Van der Zee, H. & Giertz, H. (1998). The Evolution of Information Technology. Information Management and Computer Security, 6(3), 115–
26
28. Mutula, S.M. & Brakel, P.V. (2006). E-readiness of SMEs in the ICT sector in Botswana with respect to information access. The Electronic Library, 24(3), 402-
417.
29. Obijiofor, L., Inayatullah, S. & Stevenson, T. (2005). Impact of new information and communication technologies (ICTs) on the socio-economic and
educational development of Africa and the Asia-Pacific region. Paper presented at the third working conference on Information and Communications
Technology solutions for government operations, e-government and national development, an African Regional
30. OECD. (2002). Measuring the Information Economy, OECD Paris.
31. Ongori, H. & Migiro, S. O. (2010). Information and Communication technology adoption: a literature review. Journal of Chinese Entrepreneurship, 2(1), 93-
104.
32. Pavic, S., Koh, S. C. L. Simpson., M. & Padmore, J. (2007). Could e-business create a competitive advantage in UK SMEs? Benchmarking: An International
Journal, 14(3), 320-351.
33. Ramsey, E., Ibbotson, P., Bell, J. & Gray, B. (2003). E-opportunities of service sector SMEs: an Irish cross-border study. Journal of Small Business and
Enterprise Development, 10, 3, 250-64.
34. Spanos, Y. E., Prastacos, G. & Poulymenakou, A. (2002). The relationship between information and communication technologies adoption and management
Information & Management, 39(8), 659-675.
35. Swash, G. (1998). UK business information on the Internet. New Library World, 99(1144), 238-242.
36. WSIS PrepCom Pre-Event, Accra International Conference Centre, Accra, Ghana, 27-28 January 2005.

VOLUME NO. 3 (2013), I SSUE NO. 09 (SEPTEMBER ) ISSN 2231-5756
INTERNATIONAL JOURNAL OF RESEARCH IN COMMERCE, IT & MANAGEMENT A Monthly Double-Blind Peer Reviewed (Refereed/Juried) Open Access International e-Journal - Included in the International Serial Directories
http://ijrcm.org.in/
48
APPENDIX QUESTIONNAIRE
Please, TICK ( ) where appropriate
SECTION A: BIO DATA
1. Sex: Male ( ) Female ( )
2. Age: 18-25 ( ) 26-30 ( ) 31-40 ( ) 41-50 ( ) 51-60 ( ) 61 & above ( )
3. Marital Status: Single ( ) Married ( )
4. Educational Qualifications:
WASC/SSCE ( )
OND/HND/Bachelors’ Degree ( )
Post-Graduate Qualifications ( )
Others/specified ( )
SECTION B: ADOPTION OF ICT AND SMEs PERFORMANCE
5. Do you agree that the adoption of Information and communication Technology (ICT) has great influence on the general performance of Small and Medium
Enterprises (SMEs) in Nasarawa State?
i. Strongly Agree ( ) ii. Agree ( ) iii. Undecided ( ) iv. Disagree ( ) v. Strongly Disagree
6. Do you agree that increase in productivity increases the profitability of SMEs?
7. i. Strongly Agree ( ) ii. Agree ( ) iii. Undecided ( ) iv. Disagree ( ) v. Strongly Disagree
8. To what extent do you agree that increase in productivity reduces cost?
i. To a great extent ( ) ii. To somewhat extent ( ) iii. Undecided ( ) iv. To a little extent ( ) v. To no extent at all
9. Do you agree that internet facilities have significant impact on SMEs sales turnover?
i. Strongly Agree ( ) ii. Agree ( ) iii. Undecided ( ) iv. Disagree ( ) v. Strongly Disagree
10. Do you agree that the profitability of SMEs in Nasarawa State increases with the adoption of ICTs?
i. Strongly Agree ( ) ii. Agree ( ) iii. Undecided ( ) iv. Disagree ( ) v. Strongly Disagree
11. Do you agree that employment opportunity in SMEs in Nasarawa State is influenced by the adoption of ICT?
i. Strongly Agree ( ) ii. Agree ( ) iii. Undecided ( ) iv. Disagree ( ) v. Strongly Disagree
12. What is the effect of ICT on the efficiency of SMEs?
i. Avery great effect ( ) ii. Great effect ( ) iii. Undecided ( ) iv. Little effect ( ) v. No effect
13. What is the effect of ICT on customer’s satisfaction in SMEs products and services ?
i. Avery great effect ( ) ii. Great effect ( ) iii. Undecided ( ) iv. Little effect ( ) v. No effect
14. Do you agree that ICT provides information that satisfies the need of the customers?
i. Strongly Agree ( ) ii. Agree ( ) iii. Undecided ( ) iv. Disagree ( ) v. Strongly Disagree
15. To what extent do you agree that the adoption of ICT in SMEs has reduced cost?
i. To a great extent ( ) ii. To somewhat extent ( ) iii. Undecided ( ) iv. To a little extent ( ) v. To no extent at all
16. Do you agree that the adoption of ICT saves time in SMEs operations?
i. Strongly Agree ( ) ii. Agree ( ) iii. Undecided ( ) iv. Disagree ( ) v. Strongly Disagree ( )

VOLUME NO. 3 (2013), I SSUE NO. 09 (SEPTEMBER ) ISSN 2231-5756
INTERNATIONAL JOURNAL OF RESEARCH IN COMMERCE, IT & MANAGEMENT A Monthly Double-Blind Peer Reviewed (Refereed/Juried) Open Access International e-Journal - Included in the International Serial Directories
http://ijrcm.org.in/
49
RELIABILITY TEST PLANS BASED ON LOG-LOGISTIC DISTRIBUTION
R.R.L.KANTAM
PROFESSOR
DEPARTMENT OF STATISTICS
ACHARYANAGARJUNA UNIVERSITY
NAGARJUNA NAGAR
B.SRIRAM
LECTURER
DEPARTMENT OF STATISTICS
A.A.R & B.M.R. DEGREE COLLEGE
VIJAYAWADA
A. SUHASINI
LECTURER
DEPARTMENT OF STATISTICS
S.D.M.SIDDHARTHAMAHILAKALASALA
VIJAYAWADA
ABSTRACT The well known Log-Logistic Distribution as suggested by Balakrishnan et al.(1987) is considered with a known shape parameter(β = 3). In reliability studies the
item that are put to test, to collect the life of the items in order to decide upon accepting or rejecting a submitted lot, are called reliability test plans. For a given
producer’s risk, sample size, termination number and waiting time to terminate the test plan are computed. The preferability of the test plan over similar plans
existing in the literature are established.
KEYWORDS Log-Logistic distribution (β = 3), Reliability test plan, Producers risk, Acceptance sample number.
1. INTRODUCTION life test is an experiment that is conducted to determine whether or not a product needs the specified requirements for average life. Generally in such a
test fixed number of products taken as a sample out of a submitted lot of those products. To decide upon acceptance or otherwise of the lot on the basis
of the observed life times of sampled test procedure requires a specification of sample size, a terminating rule to arrive at a decision, the criterion that
defines, the preferability or otherwise of the lot and above all the risks associated with the decisions. Since exponential distribution the CFR model the central
distribution in reliability studies, Epstein (1954) developed reliability test plans for exponential distribution. Truncated live of this type are developed by Sobel &
Tischendrof (1959) for exponential distribution. Gupta & Groll (1961) constructed similar sampling plans based gamma life test sample data. Goode & Kao
(1961) constructed sampling plans based on Weibull distribution. Kantam & Rosaiah (1998) suggested acceptance sampling plans based on life tests when the
failure density model of the products is half-logistic distribution. The reliability test plans based on gamma variate was suggested by Kantam & SriRam (2010).
Kantam et al. (2012) constructed similar reliability test plans for exponentiated exponential distribution.
In this paper we present a different approach to the construction of sampling plans for Log logistic distribution with shape parameter (β = 3) following
Braverman (1981, Ch II). By considering the Log logistic distribution (β = 3) as the failure density governing the life times of the product in the submitted lot and
made an attempt to construct the necessary test plan that can be used to decide upon accepting or otherwise of the submitted lot of product. Rosaiah et al.
(2008) suggested similar plans for Inverse Rayleigh distribution, the operating characteristic of such plan are also presented. The necessary theory of the present
plans is given in Section 2, the operating characteristics are given in Section 3, and comparative study is presented in Section 4.
2 RELIABILITY TEST PLANS Let a lot of products of indefinitely large size be submitted for sampling inspection and decision to reject or accept. Let us assume that the probability density
function of life of a product is a Log Logistic distribution (β = 3) with scale parameter σ, whose probability density function f(x, σ), cumulative distribution
function F(x, σ) are given in equations
(2.1) 0,0;
1
3)(
23
2
>>>>>>>>
++++
==== σσσσ
σσσσ
σσσσσσσσ
xx
x
xf
(2.2) 0 0,x ;
1
x
)(3
3
>>>>>>>>
++++
==== σσσσ
σσσσ
σσσσx
xF
Let ‘α’ be the probability of rejecting the submitted lot that is truly good in some sense- known as producer’s risk. Naturally ‘α’ should be as small as possible.
We can think of the decision making in two different ways.
(i) Let σo be a specified value of σ representing the mean life of the product and ‘to’ be pre-assigned time at which the life testing experiment of sample
products is designed to be terminated. Hence ‘to’ may be called “Terminating time”. Gupta & Groll (1961) suggested the minimum sample size required is ‘n’
and an acceptance number c, such that if c or less failures occur out of ‘n’, before the time ‘to’, the lot would be accepted with a probability (1- α). This approach
is basically counting number of failures out of n, with in the terminating time ‘to’ and hence the life testing experiment would be stopped as soon as the time ‘to’
A
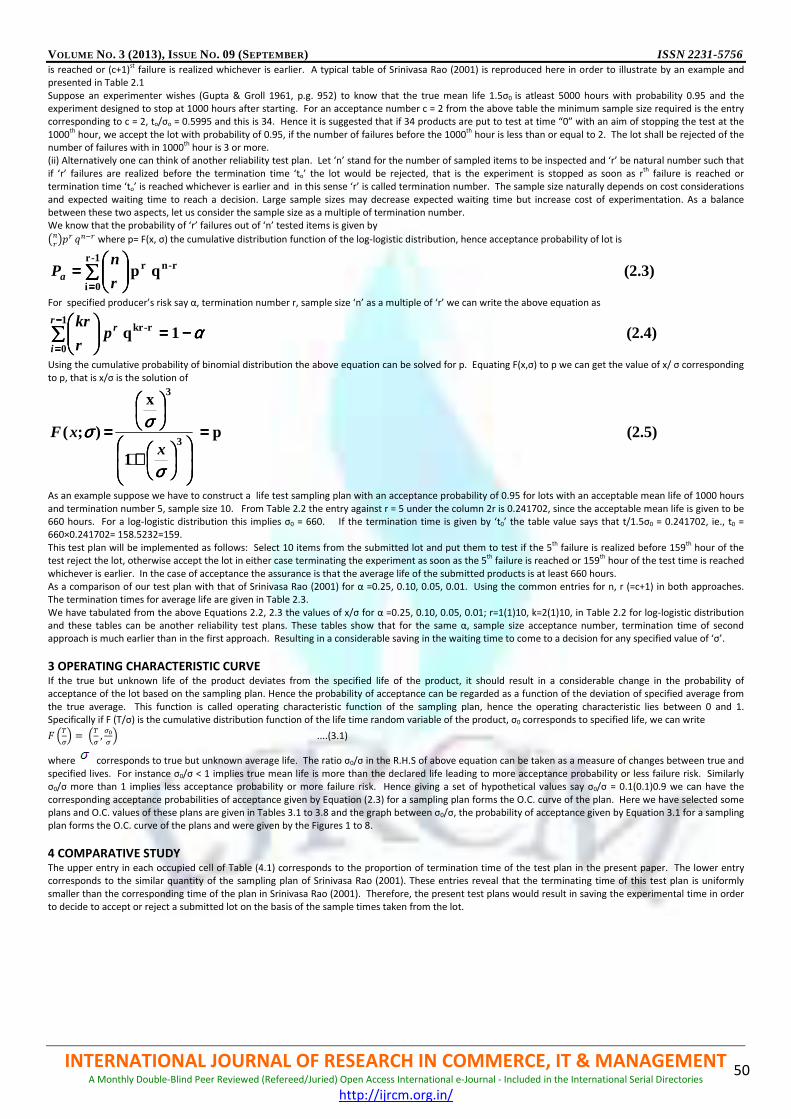
VOLUME NO. 3 (2013), I SSUE NO. 09 (SEPTEMBER ) ISSN 2231-5756
INTERNATIONAL JOURNAL OF RESEARCH IN COMMERCE, IT & MANAGEMENT A Monthly Double-Blind Peer Reviewed (Refereed/Juried) Open Access International e-Journal - Included in the International Serial Directories
http://ijrcm.org.in/
50
is reached or (c+1)st failure is realized whichever is earlier. A typical table of Srinivasa Rao (2001) is reproduced here in order to illustrate by an example and
presented in Table 2.1
Suppose an experimenter wishes (Gupta & Groll 1961, p.g. 952) to know that the true mean life 1.5σ0 is atleast 5000 hours with probability 0.95 and the
experiment designed to stop at 1000 hours after starting. For an acceptance number c = 2 from the above table the minimum sample size required is the entry
corresponding to c = 2, to/σo = 0.5995 and this is 34. Hence it is suggested that if 34 products are put to test at time “0” with an aim of stopping the test at the
1000th
hour, we accept the lot with probability of 0.95, if the number of failures before the 1000th
hour is less than or equal to 2. The lot shall be rejected of the
number of failures with in 1000th
hour is 3 or more.
(ii) Alternatively one can think of another reliability test plan. Let ‘n’ stand for the number of sampled items to be inspected and ‘r’ be natural number such that
if ‘r’ failures are realized before the termination time ‘to’ the lot would be rejected, that is the experiment is stopped as soon as rth
failure is reached or
termination time ‘to’ is reached whichever is earlier and in this sense ‘r’ is called termination number. The sample size naturally depends on cost considerations
and expected waiting time to reach a decision. Large sample sizes may decrease expected waiting time but increase cost of experimentation. As a balance
between these two aspects, let us consider the sample size as a multiple of termination number.
We know that the probability of ‘r’ failures out of ‘n’ tested items is given by
:!;<=; >!?; where p= F(x, σ) the cumulative distribution function of the log-logistic distribution, hence acceptance probability of lot is
∑∑∑∑====
====1-r
0i
r -nr (2.3) q p r
nPa
For specified producer’s risk say α, termination number r, sample size ‘n’ as a multiple of ‘r’ we can write the above equation as
(2.4) 1q r-kr1
0αααα−−−−====
∑∑∑∑−−−−
====
rr
ip
r
kr
Using the cumulative probability of binomial distribution the above equation can be solved for p. Equating F(x,σ) to p we can get the value of x/ σ corresponding
to p, that is x/σ is the solution of
(2.5) p
1
x
);(3
3
====
++++
====
σσσσ
σσσσσσσσx
xF
As an example suppose we have to construct a life test sampling plan with an acceptance probability of 0.95 for lots with an acceptable mean life of 1000 hours
and termination number 5, sample size 10. From Table 2.2 the entry against r = 5 under the column 2r is 0.241702, since the acceptable mean life is given to be
660 hours. For a log-logistic distribution this implies σ0 = 660. If the termination time is given by ‘t0’ the table value says that t/1.5σ0 = 0.241702, ie., t0 =
660×0.241702= 158.5232=159.
This test plan will be implemented as follows: Select 10 items from the submitted lot and put them to test if the 5th
failure is realized before 159th
hour of the
test reject the lot, otherwise accept the lot in either case terminating the experiment as soon as the 5th
failure is reached or 159th
hour of the test time is reached
whichever is earlier. In the case of acceptance the assurance is that the average life of the submitted products is at least 660 hours.
As a comparison of our test plan with that of Srinivasa Rao (2001) for α =0.25, 0.10, 0.05, 0.01. Using the common entries for n, r (=c+1) in both approaches.
The termination times for average life are given in Table 2.3.
We have tabulated from the above Equations 2.2, 2.3 the values of x/σ for α =0.25, 0.10, 0.05, 0.01; r=1(1)10, k=2(1)10, in Table 2.2 for log-logistic distribution
and these tables can be another reliability test plans. These tables show that for the same α, sample size acceptance number, termination time of second
approach is much earlier than in the first approach. Resulting in a considerable saving in the waiting time to come to a decision for any specified value of ‘σ’.
3 OPERATING CHARACTERISTIC CURVE If the true but unknown life of the product deviates from the specified life of the product, it should result in a considerable change in the probability of
acceptance of the lot based on the sampling plan. Hence the probability of acceptance can be regarded as a function of the deviation of specified average from
the true average. This function is called operating characteristic function of the sampling plan, hence the operating characteristic lies between 0 and 1.
Specifically if F (T/σ) is the cumulative distribution function of the life time random variable of the product, σ0 corresponds to specified life, we can write
@ A�BC = A�
B , BEB C ....(3.1)
where corresponds to true but unknown average life. The ratio σ0/σ in the R.H.S of above equation can be taken as a measure of changes between true and
specified lives. For instance σ0/σ < 1 implies true mean life is more than the declared life leading to more acceptance probability or less failure risk. Similarly
σ0/σ more than 1 implies less acceptance probability or more failure risk. Hence giving a set of hypothetical values say σ0/σ = 0.1(0.1)0.9 we can have the
corresponding acceptance probabilities of acceptance given by Equation (2.3) for a sampling plan forms the O.C. curve of the plan. Here we have selected some
plans and O.C. values of these plans are given in Tables 3.1 to 3.8 and the graph between σ0/σ, the probability of acceptance given by Equation 3.1 for a sampling
plan forms the O.C. curve of the plans and were given by the Figures 1 to 8.
4 COMPARATIVE STUDY The upper entry in each occupied cell of Table (4.1) corresponds to the proportion of termination time of the test plan in the present paper. The lower entry
corresponds to the similar quantity of the sampling plan of Srinivasa Rao (2001). These entries reveal that the terminating time of this test plan is uniformly
smaller than the corresponding time of the plan in Srinivasa Rao (2001). Therefore, the present test plans would result in saving the experimental time in order
to decide to accept or reject a submitted lot on the basis of the sample times taken from the lot.

VOLUME NO. 3 (2013), I SSUE NO. 09 (SEPTEMBER ) ISSN 2231-5756
INTERNATIONAL JOURNAL OF RESEARCH IN COMMERCE, IT & MANAGEMENT A Monthly Double-Blind Peer Reviewed (Refereed/Juried) Open Access International e-Journal - Included in the International Serial Directories
http://ijrcm.org.in/
51
TABLE 4.1: LLD COMMON ENTRIES OF SCALED TERMINATION TIME (t/σ0)
n
r c
2r 3r 4r 5r 6r 8r
(1- α)=0.25 1 0 261
1200
94
899
36
599
2 1 267
1200
171
899
3 2 337
1200
210
899
0.1 1 0 52
1500
35
1200
21
899
2 1 150
1500
71
899
0.05 1 0 25
2249
17
1200
8
899
2 1 101
1500
64
1200
37
899
0.01 1 0 5
2249
27
1500
20
1200
2 1 43
2249
27
1500
20
1200
The first entry in above table corresponds to test plan by our approach and the second one relates to that of Srinivasa Rao (2001).
CONCLUSION In this paper an acceptance decision rule is developed based on the life test when the life distribution of test items follows log-logistic distribution, its shape
parameter (β = 3), for the use of plans by the practitioners.
REFERENCES 1. Braverman, J.D. (1981). Fundamentals of Statistical Quality Control, Reston Publishing House Co., Inc. A Prentice-Hall Company, Reston, Virginia.
2. Epstein, B. & Sobel, M. (1954). Some theorems relevant to life testing from an exponential distribution, Ann.Math.Statist., Vol.25, 373-381.
3. Goode,H.P & Kao,J.H.K. (1961) Sampling plans based on the Weibull distribution, Proceedings of Seventh National Symposium on Reliability and Quality
Control, Philadelphia, Pennsylvania, pp.20-40.
4. Gupta, S.S. & Groll, P.A. (1961). Gamma distribution in acceptance sampling based on life tests, Journal of the American Statistical Association, 56, 942-970.
5. Kantam, R.R.L., & Rosaiah, K. (1998). Half logistic distribution in acceptance sampling based on life tests, IAPQR Transactions, 23(2), 117-125.
6. Kantam, R.R.L., B. SriRam & A. Suhasini (2012). Reliability Test Plans: Exponentiated Exponential Distribution, International Journal of Mathematical
Sciences, Vol.3, Sep 2012.
7. Srinivasa Rao,G. (2001). Some problems of statistical inference with applications in log-logistic distribution. Unpublished Ph.D. Thesis is awarded by
Nagarjuna University

VOLUME NO. 3 (2013), I SSUE NO. 09 (SEPTEMBER ) ISSN 2231-5756
INTERNATIONAL JOURNAL OF RESEARCH IN COMMERCE, IT & MANAGEMENT A Monthly Double-Blind Peer Reviewed (Refereed/Juried) Open Access International e-Journal - Included in the International Serial Directories
http://ijrcm.org.in/
52
TABLES TABLE 2.1: LOG LOGISTIC DISTRIBUTION RELIABILITY TEST PLANS GIVES CONSUMERS RISK
P* c t/σ0 0.5995 0.8994 1.2 1.5 2.2494 2.9991 3.7495 4.4991
0.75 0 8 3 2 1 1 1 1 1
1 15 6 4 3 2 2 2 2
2 22 9 6 4 3 3 3 3
3 38 11 7 6 5 4 4 4
4 35 14 9 7 6 5 5 5
5 41 17 11 9 7 6 6 6
6 47 19 13 10 8 7 7 7
7 54 22 14 11 9 9 8 8
8 60 25 16 13 10 10 9 9
9 66 27 18 14 11 11 10 10
10 72 30 19 15 13 12 11 11
11 79 32 21 17 14 13 12 12
12 85 35 23 18 15 14 13 13
13 91 37 24 20 16 15 14 14
14 97 40 26 21 17 16 15 15
15 103 42 28 22 18 17 17 16
0.90 0 12 5 3 2 1 1 1 1
1 21 8 5 4 3 2 2 2
2 29 11 7 5 4 4 3 3
3 36 14 9 7 5 5 4 4
4 44 17 11 8 6 6 5 5
5 51 20 13 10 8 7 7 6
6 58 23 14 11 9 8 8 7
7 64 26 16 13 10 9 9 8
8 71 29 18 14 11 10 10 9
9 78 31 20 16 12 11 11 11
10 84 34 22 17 13 12 12 12
11 91 37 23 18 14 13 13 13
12 98 40 25 20 16 14 14 14
13 104 42 27 21 17 15 15 15
14 111 45 29 23 18 17 16 16
15 117 48 30 24 19 18 17 17
0.95 0 16 6 3 3 2 1 1 1
1 25 10 6 4 3 3 2 2
2 34 13 8 6 4 4 4 3
3 42 16 10 8 6 5 5 4
4 49 19 12 9 7 6 6 6
5 57 22 14 11 8 7 7 7
6 64 25 16 12 9 8 8 8
7 71 28 18 14 10 9 9 9
8 79 31 19 15 12 10 10 10
9 86 34 21 17 13 12 11 11
10 93 37 23 18 14 13 12 12
11 99 40 25 19 15 14 13 13
12 106 43 27 21 16 15 14 14
13 113 45 29 22 17 16 15 15
14 120 48 30 24 19 17 16 16
15 127 51 32 25 20 18 17 17
0.99 0 24 9 5 4 2 2 2 2
1 35 13 8 6 4 3 3 3
2 45 17 10 7 5 4 4 4
3 54 20 12 9 6 6 5 5
4 62 24 14 11 8 7 6 6
5 70 27 16 12 9 8 7 7
6 78 30 18 14 10 9 8 8
7 86 34 20 15 11 10 10 9
8 94 37 22 17 13 11 11 10
9 101 40 24 19 14 12 12 11
10 109 43 26 20 15 14 13 12
11 116 46 28 22 16 15 14 13
12 124 49 30 23 17 16 15 14
13 131 52 32 25 19 17 16 16
14 138 55 34 26 20 18 17 17
15 145 57 36 28 21 19 18 18
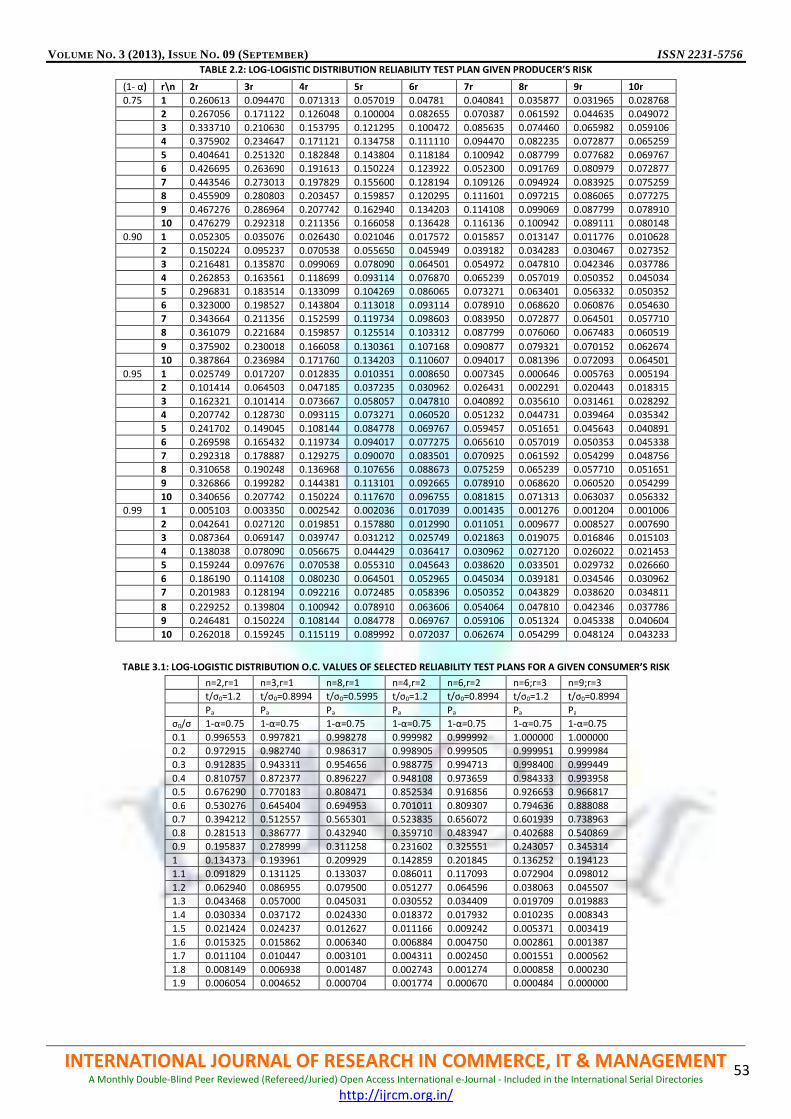
VOLUME NO. 3 (2013), I SSUE NO. 09 (SEPTEMBER ) ISSN 2231-5756
INTERNATIONAL JOURNAL OF RESEARCH IN COMMERCE, IT & MANAGEMENT A Monthly Double-Blind Peer Reviewed (Refereed/Juried) Open Access International e-Journal - Included in the International Serial Directories
http://ijrcm.org.in/
53
TABLE 2.2: LOG-LOGISTIC DISTRIBUTION RELIABILITY TEST PLAN GIVEN PRODUCER’S RISK
TABLE 3.1: LOG-LOGISTIC DISTRIBUTION O.C. VALUES OF SELECTED RELIABILITY TEST PLANS FOR A GIVEN CONSUMER’S RISK
(1- α) r\n 2r 3r 4r 5r 6r 7r 8r 9r 10r
0.75 1 0.260613 0.094470 0.071313 0.057019 0.04781 0.040841 0.035877 0.031965 0.028768
2 0.267056 0.171122 0.126048 0.100004 0.082655 0.070387 0.061592 0.044635 0.049072
3 0.333710 0.210630 0.153795 0.121295 0.100472 0.085635 0.074460 0.065982 0.059106
4 0.375902 0.234647 0.171121 0.134758 0.111110 0.094470 0.082235 0.072877 0.065259
5 0.404641 0.251320 0.182848 0.143804 0.118184 0.100942 0.087799 0.077682 0.069767
6 0.426695 0.263690 0.191613 0.150224 0.123922 0.052300 0.091769 0.080979 0.072877
7 0.443546 0.273013 0.197829 0.155600 0.128194 0.109126 0.094924 0.083925 0.075259
8 0.455909 0.280803 0.203457 0.159857 0.120295 0.111601 0.097215 0.086065 0.077275
9 0.467276 0.286964 0.207742 0.162940 0.134203 0.114108 0.099069 0.087799 0.078910
10 0.476279 0.292318 0.211356 0.166058 0.136428 0.116136 0.100942 0.089111 0.080148
0.90 1 0.052305 0.035076 0.026430 0.021046 0.017572 0.015857 0.013147 0.011776 0.010628
2 0.150224 0.095237 0.070538 0.055650 0.045949 0.039182 0.034283 0.030467 0.027352
3 0.216481 0.135870 0.099069 0.078090 0.064501 0.054972 0.047810 0.042346 0.037786
4 0.262853 0.163561 0.118699 0.093114 0.076870 0.065239 0.057019 0.050352 0.045034
5 0.296831 0.183514 0.133099 0.104269 0.086065 0.073271 0.063401 0.056332 0.050352
6 0.323000 0.198527 0.143804 0.113018 0.093114 0.078910 0.068620 0.060876 0.054630
7 0.343664 0.211356 0.152599 0.119734 0.098603 0.083950 0.072877 0.064501 0.057710
8 0.361079 0.221684 0.159857 0.125514 0.103312 0.087799 0.076060 0.067483 0.060519
9 0.375902 0.230018 0.166058 0.130361 0.107168 0.090877 0.079321 0.070152 0.062674
10 0.387864 0.236984 0.171760 0.134203 0.110607 0.094017 0.081396 0.072093 0.064501
0.95 1 0.025749 0.017207 0.012835 0.010351 0.008650 0.007345 0.000646 0.005763 0.005194
2 0.101414 0.064503 0.047185 0.037235 0.030962 0.026431 0.002291 0.020443 0.018315
3 0.162321 0.101414 0.073667 0.058057 0.047810 0.040892 0.035610 0.031461 0.028292
4 0.207742 0.128730 0.093115 0.073271 0.060520 0.051232 0.044731 0.039464 0.035342
5 0.241702 0.149045 0.108144 0.084778 0.069767 0.059457 0.051651 0.045643 0.040891
6 0.269598 0.165432 0.119734 0.094017 0.077275 0.065610 0.057019 0.050353 0.045338
7 0.292318 0.178887 0.129275 0.090070 0.083501 0.070925 0.061592 0.054299 0.048756
8 0.310658 0.190248 0.136968 0.107656 0.088673 0.075259 0.065239 0.057710 0.051651
9 0.326866 0.199282 0.144381 0.113101 0.092665 0.078910 0.068620 0.060520 0.054299
10 0.340656 0.207742 0.150224 0.117670 0.096755 0.081815 0.071313 0.063037 0.056332
0.99 1 0.005103 0.003350 0.002542 0.002036 0.017039 0.001435 0.001276 0.001204 0.001006
2 0.042641 0.027120 0.019851 0.157880 0.012990 0.011051 0.009677 0.008527 0.007690
3 0.087364 0.069147 0.039747 0.031212 0.025749 0.021863 0.019075 0.016846 0.015103
4 0.138038 0.078090 0.056675 0.044429 0.036417 0.030962 0.027120 0.026022 0.021453
5 0.159244 0.097676 0.070538 0.055310 0.045643 0.038620 0.033501 0.029732 0.026660
6 0.186190 0.114108 0.080230 0.064501 0.052965 0.045034 0.039181 0.034546 0.030962
7 0.201983 0.128194 0.092216 0.072485 0.058396 0.050352 0.043829 0.038620 0.034811
8 0.229252 0.139804 0.100942 0.078910 0.063606 0.054064 0.047810 0.042346 0.037786
9 0.246481 0.150224 0.108144 0.084778 0.069767 0.059106 0.051324 0.045338 0.040604
10 0.262018 0.159245 0.115119 0.089992 0.072037 0.062674 0.054299 0.048124 0.043233
n=2,r=1 n=3,r=1 n=8,r=1 n=4,r=2 n=6,r=2 n=6;r=3 n=9;r=3
t/σ0=1.2 t/σ0=0.8994 t/σ0=0.5995 t/σ0=1.2 t/σ0=0.8994 t/σ0=1.2 t/σ0=0.8994
Pa Pa Pa Pa Pa Pa Pa
σ0/σ 1-α=0.75 1-α=0.75 1-α=0.75 1-α=0.75 1-α=0.75 1-α=0.75 1-α=0.75
0.1 0.996553 0.997821 0.998278 0.999982 0.999992 1.000000 1.000000
0.2 0.972915 0.982740 0.986317 0.998905 0.999505 0.999951 0.999984
0.3 0.912835 0.943311 0.954656 0.988775 0.994713 0.998400 0.999449
0.4 0.810757 0.872377 0.896227 0.948108 0.973659 0.984333 0.993958
0.5 0.676290 0.770183 0.808471 0.852534 0.916856 0.926653 0.966817
0.6 0.530276 0.645404 0.694953 0.701011 0.809307 0.794636 0.888088
0.7 0.394212 0.512557 0.565301 0.523835 0.656072 0.601939 0.738963
0.8 0.281513 0.386777 0.432940 0.359710 0.483947 0.402688 0.540869
0.9 0.195837 0.278999 0.311258 0.231602 0.325551 0.243057 0.345314
1 0.134373 0.193961 0.209929 0.142859 0.201845 0.136252 0.194123
1.1 0.091829 0.131125 0.133037 0.086011 0.117093 0.072904 0.098012
1.2 0.062940 0.086955 0.079500 0.051277 0.064596 0.038063 0.045507
1.3 0.043468 0.057000 0.045031 0.030552 0.034409 0.019709 0.019883
1.4 0.030334 0.037172 0.024330 0.018372 0.017932 0.010235 0.008343
1.5 0.021424 0.024237 0.012627 0.011166 0.009242 0.005371 0.003419
1.6 0.015325 0.015862 0.006340 0.006884 0.004750 0.002861 0.001387
1.7 0.011104 0.010447 0.003101 0.004311 0.002450 0.001551 0.000562
1.8 0.008149 0.006938 0.001487 0.002743 0.001274 0.000858 0.000230
1.9 0.006054 0.004652 0.000704 0.001774 0.000670 0.000484 0.000000

VOLUME NO. 3 (2013), I SSUE NO. 09 (SEPTEMBER ) ISSN 2231-5756
INTERNATIONAL JOURNAL OF RESEARCH IN COMMERCE, IT & MANAGEMENT A Monthly Double-Blind Peer Reviewed (Refereed/Juried) Open Access International e-Journal - Included in the International Serial Directories
http://ijrcm.org.in/
54
TABLE 3.2 LOG-LOGISTIC DISTRIBUTION O.C. VALUES OF SELECTED RELIABILITY TEST PLANS FOR A GIVEN PRODUCER’S RISK
n=2,r=1 n=3,r=1 n=8,r=1 n=4,r=2 n=6,r=2 n=6;r=3 n=9;r=3
t/σ0=0.260613 t/σ0=0.09947 t/σ0=0.035877 t/σ0=0.267056 t/σ0=0.171122 t/σ0=0.333710 t/σ0=0.210630
Pa Pa Pa Pa Pa Pa Pa
σ0/σ 1-α=0.75 1-α=0.75 1-α=0.75 1-α=0.75 1-α=0.75 1-α=0.75 1-α=0.75
0.1 0.999965 0.999997 1.000000 1.000000 1.000000 1.000000 1.000000
0.2 0.999717 0.999980 0.999997 1.000000 1.000000 1.000000 1.000000
0.3 0.999045 0.999932 0.999990 0.999998 1.000000 1.000000 1.000000
0.4 0.997738 0.999838 0.999976 0.999991 0.999998 1.000000 1.000000
0.5 0.995589 0.999684 0.999954 0.999966 0.999994 0.999998 1.000000
0.6 0.992397 0.999454 0.999992 0.999900 0.999998 0.999990 0.999999
0.7 0.987967 0.999133 0.999873 0.999749 0.999996 0.999961 0.999997
0.8 0.982118 0.998706 0.999811 0.999448 0.999902 0.999875 0.999991
0.9 0.974684 0.998158 0.999731 0.998895 0.999803 0.999654 0.999975
1 0.965517 0.997475 0.999631 0.997560 0.999632 0.999152 0.999936
1.1 0.954495 0.996641 0.999508 0.996452 0.999353 0.998120 0.999853
1.2 0.941523 0.995642 0.999362 0.994164 0.998920 0.996174 0.999686
1.3 0.926536 0.994464 0.999189 0.990832 0.998272 0.992773 0.999376
1.4 0.909504 0.993092 0.998987 0.986161 0.997359 0.987213 0.998828
1.5 0.890434 0.991512 0.998754 0.979835 0.996032 0.978658 0.997910
1.6 0.869369 0.989711 0.998488 0.971527 0.994251 0.966198 0.996440
1.7 0.846390 0.987676 0.998187 0.960921 0.991880 0.948942 0.994182
1.8 0.821614 0.985393 0.997848 0.947727 0.988794 0.926130 0.990838
1.9 0.795193 0.982850 0.998747 0.931704 0.984852 0.897245 0.986058
TABLE 3.3 LOG-LOGISTIC DISTRIBUTION O.C. VALUES OF SELECTED RELIABILITY TEST PLANS FOR A GIVEN CONSUMER ’S RISK
TABLE 3.4 LOG-LOGISTIC DISTRIBUTION O.C. VALUES OF SELECTED RELIABILITY TEST PLANS FOR A GIVEN PRODUCER’S RISK
n=2,r=1 n=3,r=1 n=5,r=1 n=4,r=2 n=8,r=2
t/σ0=1.5 t/σ0=1.2 t/σ0=0.8994 t/σ0=1.5 t/σ0=0.8994
Pa Pa Pa Pa Pa
σ0/σ 1-α=0.90 1-α=0.90 1-α=0.90 1-α=0.90 1-α=0.90
0.1 0.993284 0.994834 0.996370 0.999932 0.999985
0.2 0.948111 0.959649 0.971400 0.995997 0.999084
0.3 0.839945 0.872144 0.907315 0.962666 0.999038
0.4 0.67629 0.730023 0.796478 0.852534 0.953654
0.5 0.494626 0.556159 0.647128 0.657511 0.861019
0.6 0.334511 0.386147 0.482007 0.438190 0.702189
0.7 0.214807 0.247511 0.328274 0.259802 0.504168
0.8 0.134373 0.149365 0.205322 0.142859 0.316068
0.9 0.083513 0.086664 0.119126 0.075613 0.174257
1 0.052245 0.049257 0.064991 0.039578 0.085976
1.1 0.033153 0.027827 0.033844 0.020848 0.038817
1.2 0.021424 0.01579 0.017067 0.011166 0.016410
1.3 0.014122 0.009063 0.008442 0.006115 0.006635
1.4 0.009498 0.005283 0.004140 0.003432 0.002612
1.5 0.006513 0.003136 0.002030 0.001975 0.001016
1.6 0.004551 0.001897 0.001001 0.001166 0.000395
1.7 0.003235 0.00117 0.000499 0.000705 0.000154
1.8 0.002338 0.000736 0.000252 0.000436 0.000000
n=2,r=1 n=3,r=1 n=5,r=1 n=4,r=2 n=8,r=2
t/σ0=0.052305 t/σ0=0.035076 t/σ0=0.021046 t/σ0=0.150224 t/σ0=0.070538
Pa Pa Pa Pa Pa
σ0/σ 1-α=0.90 1-α=0.90 1-α=0.90 1-α=0.90 1-α=0.90
0.1 1.000000 1.000000 1.000000 1.000000 1.000000
0.2 0.999998 0.999999 1.000000 1.000000 1.000000
0.3 0.999992 0.999997 0.999999 1.000000 1.000000
0.4 0.999982 0.999992 0.999997 1.000000 1.000000
0.5 0.999964 0.999984 0.999994 0.999999 1.000000
0.6 0.999938 0.999972 0.999990 0.999997 1.000000
0.7 0.999902 0.999956 0.999984 0.999992 1.000000
0.8 0.999853 0.999934 0.999976 0.999982 0.999999
0.9 0.999791 0.999906 0.999966 0.999964 0.999998
1 0.999714 0.999871 0.999953 0.999932 0.999997
1.1 0.999619 0.999828 0.999938 0.999880 0.999994
1.2 0.999506 0.999776 0.999919 0.999798 0.999990
1.3 0.999372 0.999716 0.999898 0.999675 0.999983
1.4 0.999215 0.999645 0.999872 0.999497 0.999974
1.5 0.999035 0.999563 0.999843 0.999244 0.999961
1.6 0.998829 0.999470 0.999809 0.998895 0.999943
1.7 0.998595 0.999364 0.999771 0.998425 0.999918
1.8 0.998333 0.999245 0.999728 0.997803 0.999884
1.9 0.998040 0.999113 0.999680 0.996995 0.999840
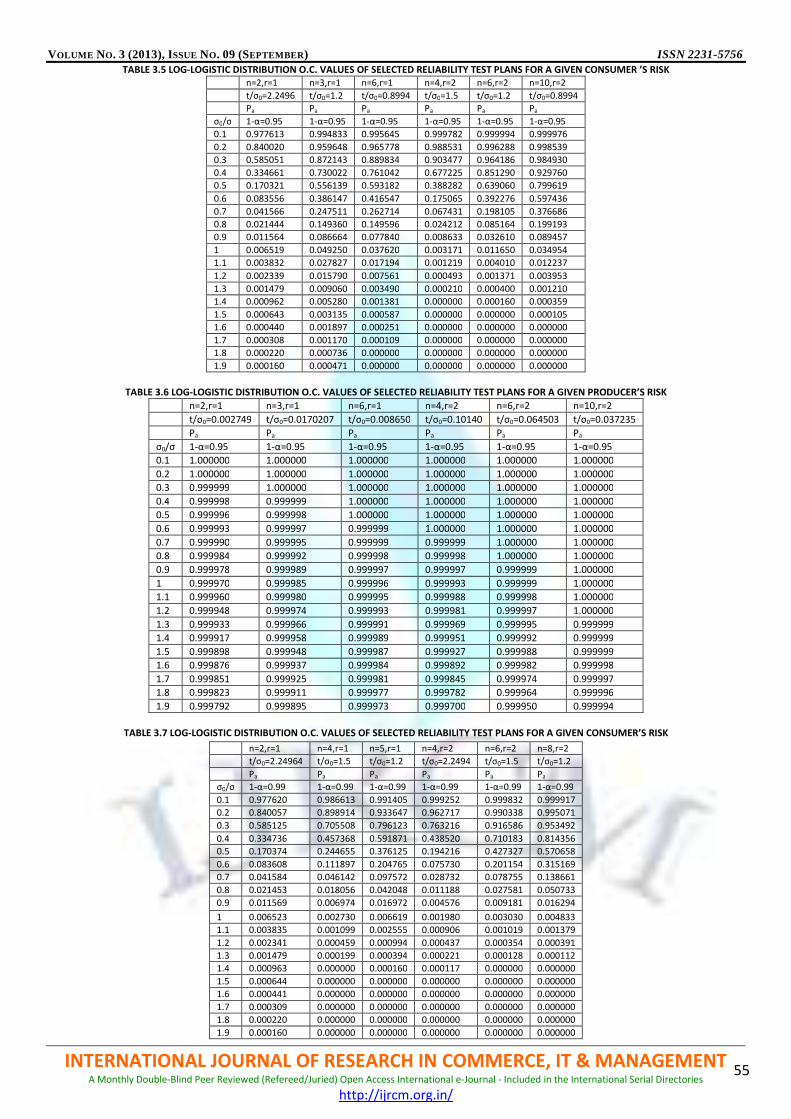
VOLUME NO. 3 (2013), I SSUE NO. 09 (SEPTEMBER ) ISSN 2231-5756
INTERNATIONAL JOURNAL OF RESEARCH IN COMMERCE, IT & MANAGEMENT A Monthly Double-Blind Peer Reviewed (Refereed/Juried) Open Access International e-Journal - Included in the International Serial Directories
http://ijrcm.org.in/
55
TABLE 3.5 LOG-LOGISTIC DISTRIBUTION O.C. VALUES OF SELECTED RELIABILITY TEST PLANS FOR A GIVEN CONSUMER ’S RISK
n=2,r=1 n=3,r=1 n=6,r=1 n=4,r=2 n=6,r=2 n=10,r=2
t/σ0=2.2496 t/σ0=1.2 t/σ0=0.8994 t/σ0=1.5 t/σ0=1.2 t/σ0=0.8994
Pa Pa Pa Pa Pa Pa
σ0/σ 1-α=0.95 1-α=0.95 1-α=0.95 1-α=0.95 1-α=0.95 1-α=0.95
0.1 0.977613 0.994833 0.995645 0.999782 0.999994 0.999976
0.2 0.840020 0.959648 0.965778 0.988531 0.996288 0.998539
0.3 0.585051 0.872143 0.889834 0.903477 0.964186 0.984930
0.4 0.334661 0.730022 0.761042 0.677225 0.851290 0.929760
0.5 0.170321 0.556139 0.593182 0.388282 0.639060 0.799619
0.6 0.083556 0.386147 0.416547 0.175065 0.392276 0.597436
0.7 0.041566 0.247511 0.262714 0.067431 0.198105 0.376686
0.8 0.021444 0.149360 0.149596 0.024212 0.085164 0.199193
0.9 0.011564 0.086664 0.077840 0.008633 0.032610 0.089457
1 0.006519 0.049250 0.037620 0.003171 0.011650 0.034954
1.1 0.003832 0.027827 0.017194 0.001219 0.004010 0.012237
1.2 0.002339 0.015790 0.007561 0.000493 0.001371 0.003953
1.3 0.001479 0.009060 0.003490 0.000210 0.000400 0.001210
1.4 0.000962 0.005280 0.001381 0.000000 0.000160 0.000359
1.5 0.000643 0.003135 0.000587 0.000000 0.000000 0.000105
1.6 0.000440 0.001897 0.000251 0.000000 0.000000 0.000000
1.7 0.000308 0.001170 0.000109 0.000000 0.000000 0.000000
1.8 0.000220 0.000736 0.000000 0.000000 0.000000 0.000000
1.9 0.000160 0.000471 0.000000 0.000000 0.000000 0.000000
TABLE 3.6 LOG-LOGISTIC DISTRIBUTION O.C. VALUES OF SELECTED RELIABILITY TEST PLANS FOR A GIVEN PRODUCER’S RISK
n=2,r=1 n=3,r=1 n=6,r=1 n=4,r=2 n=6,r=2 n=10,r=2
t/σ0=0.002749 t/σ0=0.0170207 t/σ0=0.008650 t/σ0=0.10140 t/σ0=0.064503 t/σ0=0.037235
Pa Pa Pa Pa Pa Pa
σ0/σ 1-α=0.95 1-α=0.95 1-α=0.95 1-α=0.95 1-α=0.95 1-α=0.95
0.1 1.000000 1.000000 1.000000 1.000000 1.000000 1.000000
0.2 1.000000 1.000000 1.000000 1.000000 1.000000 1.000000
0.3 0.999999 1.000000 1.000000 1.000000 1.000000 1.000000
0.4 0.999998 0.999999 1.000000 1.000000 1.000000 1.000000
0.5 0.999996 0.999998 1.000000 1.000000 1.000000 1.000000
0.6 0.999993 0.999997 0.999999 1.000000 1.000000 1.000000
0.7 0.999990 0.999995 0.999999 0.999999 1.000000 1.000000
0.8 0.999984 0.999992 0.999998 0.999998 1.000000 1.000000
0.9 0.999978 0.999989 0.999997 0.999997 0.999999 1.000000
1 0.999970 0.999985 0.999996 0.999993 0.999999 1.000000
1.1 0.999960 0.999980 0.999995 0.999988 0.999998 1.000000
1.2 0.999948 0.999974 0.999993 0.999981 0.999997 1.000000
1.3 0.999933 0.999966 0.999991 0.999969 0.999995 0.999999
1.4 0.999917 0.999958 0.999989 0.999951 0.999992 0.999999
1.5 0.999898 0.999948 0.999987 0.999927 0.999988 0.999999
1.6 0.999876 0.999937 0.999984 0.999892 0.999982 0.999998
1.7 0.999851 0.999925 0.999981 0.999845 0.999974 0.999997
1.8 0.999823 0.999911 0.999977 0.999782 0.999964 0.999996
1.9 0.999792 0.999895 0.999973 0.999700 0.999950 0.999994
TABLE 3.7 LOG-LOGISTIC DISTRIBUTION O.C. VALUES OF SELECTED RELIABILITY TEST PLANS FOR A GIVEN CONSUMER’S RISK
n=2,r=1 n=4,r=1 n=5,r=1 n=4,r=2 n=6,r=2 n=8,r=2
t/σ0=2.24964 t/σ0=1.5 t/σ0=1.2 t/σ0=2.2494 t/σ0=1.5 t/σ0=1.2
Pa Pa Pa Pa Pa Pa
σ0/σ 1-α=0.99 1-α=0.99 1-α=0.99 1-α=0.99 1-α=0.99 1-α=0.99
0.1 0.977620 0.986613 0.991405 0.999252 0.999832 0.999917
0.2 0.840057 0.898914 0.933647 0.962717 0.990338 0.995071
0.3 0.585125 0.705508 0.796123 0.763216 0.916586 0.953492
0.4 0.334736 0.457368 0.591871 0.438520 0.710183 0.814356
0.5 0.170374 0.244655 0.376125 0.194216 0.427327 0.570658
0.6 0.083608 0.111897 0.204765 0.075730 0.201154 0.315169
0.7 0.041584 0.046142 0.097572 0.028732 0.078755 0.138661
0.8 0.021453 0.018056 0.042048 0.011188 0.027581 0.050733
0.9 0.011569 0.006974 0.016972 0.004576 0.009181 0.016294
1 0.006523 0.002730 0.006619 0.001980 0.003030 0.004833
1.1 0.003835 0.001099 0.002555 0.000906 0.001019 0.001379
1.2 0.002341 0.000459 0.000994 0.000437 0.000354 0.000391
1.3 0.001479 0.000199 0.000394 0.000221 0.000128 0.000112
1.4 0.000963 0.000000 0.000160 0.000117 0.000000 0.000000
1.5 0.000644 0.000000 0.000000 0.000000 0.000000 0.000000
1.6 0.000441 0.000000 0.000000 0.000000 0.000000 0.000000
1.7 0.000309 0.000000 0.000000 0.000000 0.000000 0.000000
1.8 0.000220 0.000000 0.000000 0.000000 0.000000 0.000000
1.9 0.000160 0.000000 0.000000 0.000000 0.000000 0.000000

VOLUME NO. 3 (2013), I SSUE NO. 09 (SEPTEMBER
INTERNATIONAL JOURNAL OF RESEARCH IN COMMERCEA Monthly Double-Blind Peer Reviewed (Refereed
TABLE 3.8 LOG-LOGISTIC DISTRIBUTION
n=2,r=1 n=4,r=1
t/σ0=0.005103 t/σ0=0.002542
Pa Pa
σ0/σ 1-α=0.99 1-α=0.99
0.1 1.000000 1.000000
0.2 1.000000 1.000000
0.3 1.000000 1.000000
0.4 1.000000 1.000000
0.5 1.000000 1.000000
0.6 1.000000 1.000000
0.7 1.000000 1.000000
0.8 1.000000 1.000000
0.9 1.000000 1.000000
1 1.000000 1.000000
1.1 1.000000 1.000000
1.2 1.000000 1.000000
1.3 1.000000 1.000000
1.4 0.999999 1.000000
1.5 0.999999 1.000000
1.6 0.999999 1.000000
1.7 0.999999 1.000000
1.8 0.999998 1.000000
1.9 0.999998 1.000000
FIGURES
LOG-LOGISTIC DISTRIBUTION
LOG-LOGISTIC DISTRIBUTION
LOG-LOGISTIC DISTRIBUTION
EPTEMBER )
INTERNATIONAL JOURNAL OF RESEARCH IN COMMERCE, IT Refereed/Juried) Open Access International e-Journal - Included in the International Serial Directories
http://ijrcm.org.in/
LOGISTIC DISTRIBUTION O.C. VALUES OF SELECTED RELIABILITY TEST PLANS FOR A GIVEN PRODUCER’S RISK
n=4,r=1 n=5,r=1 n=4,r=2 n=6,r=2
=0.002542 t/σ0=0.002036 t/σ0=0.042641 t/σ0=0.027120
Pa Pa Pa
α=0.99 1-α=0.99 1-α=0.99 1-α=0.99
1.000000 1.000000 1.000000 1.000000
1.000000 1.000000 1.000000 1.000000
1.000000 1.000000 1.000000 1.000000
1.000000 1.000000 1.000000 1.000000
1.000000 1.000000 1.000000 1.000000
1.000000 1.000000 1.000000 1.000000
1.000000 1.000000 1.000000 1.000000
1.000000 1.000000 1.000000 1.000000
1.000000 1.000000 1.000000 1.000000
1.000000 1.000000 1.000000 1.000000
1.000000 1.000000 1.000000 1.000000
1.000000 1.000000 1.000000 1.000000
1.000000 1.000000 1.000000 1.000000
1.000000 1.000000 1.000000 1.000000
1.000000 1.000000 1.000000 1.000000
1.000000 1.000000 0.999999 1.000000
1.000000 1.000000 0.999999 1.000000
1.000000 1.000000 0.999999 1.000000
1.000000 1.000000 0.999998 1.000000
LOGISTIC DISTRIBUTION O.C. CURVESOF TABLE 3.1 (1-αααα=0.75) FOR A GIVEN CONSUMER’S RISK
LOGISTIC DISTRIBUTION O.C. CURVESOF TABLE 3.2 (1-αααα=0.75) ) FOR A GIVEN PRODUCER’S RISK
DISTRIBUTION O.C. CURVESOF TABLE 3.3 (1-αααα=0.90) FOR A GIVEN CONSUMER’S RISK
00.20.40.60.8
11.2
0 1 2
Figure 1
00.20.40.60.8
11.2
0 1 2
Figure 2
-0.2
0
0.2
0.4
0.6
0.8
1
1.2
0 1 2
Figure 3
ISSN 2231-5756
, IT & MANAGEMENT Included in the International Serial Directories
56
O.C. VALUES OF SELECTED RELIABILITY TEST PLANS FOR A GIVEN PRODUCER’S RISK
n=8,r=2
t/σ0=0.019851
Pa
1-α=0.99
1.000000
1.000000
1.000000
1.000000
1.000000
1.000000
1.000000
1.000000
1.000000
1.000000
1.000000
1.000000
1.000000
1.000000
1.000000
1.000000
1.000000
1.000000
1.000000
=0.75) FOR A GIVEN CONSUMER’S RISK
=0.75) ) FOR A GIVEN PRODUCER’S RISK
FOR A GIVEN CONSUMER’S RISK
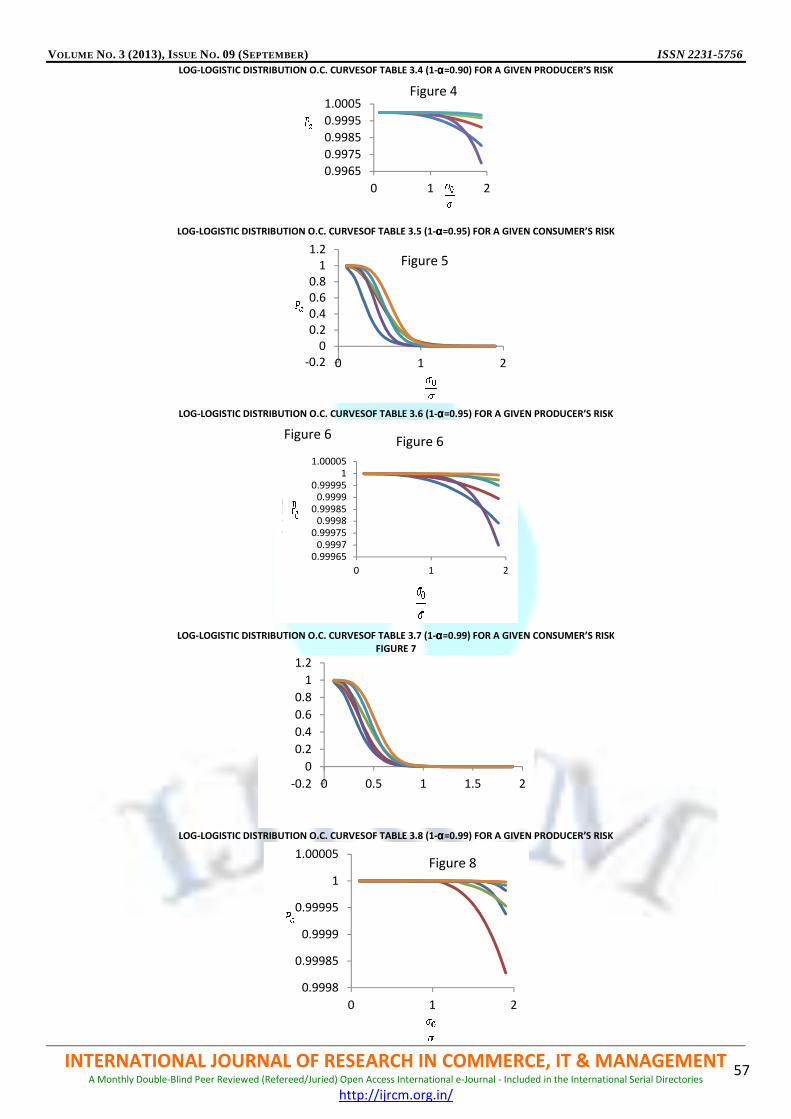
VOLUME NO. 3 (2013), I SSUE NO. 09 (SEPTEMBER
INTERNATIONAL JOURNAL OF RESEARCH IN COMMERCEA Monthly Double-Blind Peer Reviewed (Refereed
LOG-LOGISTIC DISTRIBUTION
LOG-LOGISTIC DISTRIBUTION
LOG-LOGISTIC DISTRIBUTION
LOG-LOGISTIC DISTRIBUTION
LOG-LOGISTIC DISTRIBUTION
Figure 6
EPTEMBER )
INTERNATIONAL JOURNAL OF RESEARCH IN COMMERCE, IT Refereed/Juried) Open Access International e-Journal - Included in the International Serial Directories
http://ijrcm.org.in/
LOGISTIC DISTRIBUTION O.C. CURVESOF TABLE 3.4 (1-αααα=0.90) FOR A GIVEN PRODUCER’S RISK
LOGISTIC DISTRIBUTION O.C. CURVESOF TABLE 3.5 (1-αααα=0.95) FOR A GIVEN CONSUMER’S
LOGISTIC DISTRIBUTION O.C. CURVESOF TABLE 3.6 (1-αααα=0.95) FOR A GIVEN PRODUCER’S RISK
LOGISTIC DISTRIBUTION O.C. CURVESOF TABLE 3.7 (1-αααα=0.99) FOR A GIVEN CONSUMER’S RISK
FIGURE 7
LOGISTIC DISTRIBUTION O.C. CURVESOF TABLE 3.8 (1-αααα=0.99) FOR A GIVEN PRODUCER’S RISK
0.9965
0.9975
0.9985
0.9995
1.0005
0 1 2
Figure 4
-0.2
0
0.2
0.4
0.6
0.8
1
1.2
0 1 2
Figure 5
0.999650.9997
0.999750.9998
0.999850.9999
0.999951
1.00005
0 1 2
Figure 6Figure 6
-0.2
0
0.2
0.4
0.6
0.8
1
1.2
0 0.5 1 1.5 2
0.9998
0.99985
0.9999
0.99995
1
1.00005
0 1 2
Figure 8
ISSN 2231-5756
, IT & MANAGEMENT Included in the International Serial Directories
57
=0.90) FOR A GIVEN PRODUCER’S RISK
FOR A GIVEN CONSUMER’S RISK
=0.95) FOR A GIVEN PRODUCER’S RISK
=0.99) FOR A GIVEN CONSUMER’S RISK
=0.99) FOR A GIVEN PRODUCER’S RISK

VOLUME NO. 3 (2013), I SSUE NO. 09 (SEPTEMBER ) ISSN 2231-5756
INTERNATIONAL JOURNAL OF RESEARCH IN COMMERCE, IT & MANAGEMENT A Monthly Double-Blind Peer Reviewed (Refereed/Juried) Open Access International e-Journal - Included in the International Serial Directories
http://ijrcm.org.in/
58
MIGRATION AND SUSTAINABLE DEVELOPMENT
DR. H.R.UMA
PROFESSOR
UNIVERSITY OF MYSORE
MANASAGANGOTRI
MADHU G.R.
JUNIOR RESEARCH FELLOW
DEPARTMENT OF STUDIES IN ECONOMICS & CO OPERATION
UNIVERSITY OF MYSORE
MYSORE
MAHAMMAD HABEEB
JUNIOR RESEARCH FELLOW
UNIVERSITY OF MYSORE
MYSORE
ABSTRACT Migration process is one of common trends in globalized economy. It may be international or internal migration, migration helpful to the improve the living
standard as individual and achieving development and growth of the economy. In this paper try to analyze the relationship between regional migration and
sustainable development .
KEYWORDS Migration, Rural, urban, sustainable development.
INTRODUCTION s discussed in Rio+20, migration has been recognized for its increasing importance and relevance to the social, economic and environmental dimensions
of sustainable development. Although the share of international migrants in the world’s population has remained at Approximately 3 per cent for more
than 20 years, their absolute numbers have increased significantly: in 1990, approximately 156 million people lived outside their country of birth, but
today this figure has increased to approximately 215 million. At the same time, today approximately 740 million internal migrants are estimated to have moved
away from their places of birth within the borders of their own countries.
Economic migrants are the world’s fastest growing group of migrants. At the micro level, individual migrants can be motivated to leave their homes in pursuit of
what are perceived to be better economic and social opportunities elsewhere. On a macro-level, migration is stimulated by the globalization of trade, transport
and communications technologies, as well as by demographic dynamics.
Like international migration, movement within the borders of a country is driven by the search for better opportunities. Rural-urban and urban-urban migration
is primarily driven by economic and social causes, with environmental change increasingly influencing movement. In Asia, workers are increasingly moving to
cities and manufacturing centers due to wage differentials and labour opportunities. Rural-urban and urban-urban migration is expected to contribute to the
significant urbanization of Africa and Asia in coming decades, with most growth taking place in medium-sized cities (those with populations between 500,000
and 1 million people).
An increasingly urban population provides many opportunities for achieving poverty reduction and sustainable development. When migrants are attracted to
cities because of employment opportunities, net benefits are likely to accrue as the concentration of ideas, skill, and capital lead to positive spill-over. Cities have
the potential to concentrate and make education, health, finance and other services more accessible, and communication and transport networks contribute to
engagement in public life. Remittances - a portion of migrant earnings. Also help lift families out of poverty in migrant-sending communities.
Agricultural labourers, especially in smaller villages away from towns and cities, are generally unskilled workers carrying on agricultural operation in the
centuries old traditional ways. Most agricultural workers belong to the depressed classes, which have been neglected for ages. The low caste and depressed
classes have been socially handicapped and they never had the courage to assert themselves. In some parts of India, agricultural labourers are migratory;
moving in search of jobs at the time of harvesting. This movement has some time helped them to get the benefits of growth and development.
DEFINITIONS Sustainable development: The Brundtland Commission Report entitled Our Common Future (1987) defined sustainable development as “development, which
meets the needs of the present without compromising the ability of future generations to meet their own needs”. The 1992 Earth Summit in Rio de Janeiro put
the concept of sustainable development on national and international policy agendas.
Migration: Migration is the crossing of the boundary of a political or administrative unit for a certain minimum period of time. It includes the movement of
refugees, displaced persons, uprooted people as well as economic migrants.
RESEARCH GAP Migration is one of the common trends in these days. In the same way agriculture labour migration is also common in these days. Agriculture labourer face so
many problems in his living condition and these problems push him from his native place and migrate to other places where he get good employment and
income opportunity. In Karnataka there is lot of disparities between North and South Karnataka and the drought is more prevalent in North which has led to the
migration of agricultural labourers from north to south Karnataka in search of jobs. This study focuses on this type of migrant labourers who have migrated from
north Karnataka to south Karnataka for employment in construction fields, and tries to prove that this type of migration of the marginalized section has helped
in their Sustainable development.
OBJECTIVES OF THE PAPER 1) To analyze the socio economic conditions of migrant labourers from south Karnataka to north Karnataka.
2) To examine the link between migration and sustainable development.
A

VOLUME NO. 3 (2013), I SSUE NO. 09 (SEPTEMBER ) ISSN 2231-5756
INTERNATIONAL JOURNAL OF RESEARCH IN COMMERCE, IT & MANAGEMENT A Monthly Double-Blind Peer Reviewed (Refereed/Juried) Open Access International e-Journal - Included in the International Serial Directories
http://ijrcm.org.in/
59
HYPOTHESES Ho=there is no change in labourers income after the migration.
H1 = there is a significant change in income after the migration.
METHODOLOGY Details regarding the socio-economic conditions of the selected laborers are based on the information collected through interview schedule.200 respondents are
selected from different construction fields in Mysore. Primary data collected from the respondents with the help of questionnaire. SPSS package is use for data
analysis. Paired T test method was used to analyze wage differences before and after migration. Excel is used for tabulation and construction of Chart .The
analysis of the socio-economic background of the selected seasonal migrant laborers has helped to explain the situational factors at the place of origin which
make them to migrate. The specific focus of the paper is to understand the socio-economic background of migrant labourers and sustainable development of
the migrant labourers through migration to other sector for better livelihood.
TABLE 1: AGE OF THE LABOURERS
Age Frequency percent
11-20 26 13.0
21-30 64 32.0
31-40 70 35.0
41-50 40 20.0
TOTAL 200 100.0
Table 1 has classified these labourers on the basis of age. As shown in the table it is middle age group which is showing more inclination towards migration to
improve their economic status.32% of labourers are 21-30 age group, 35%of labourers are 31-40 age group and other remaining part fall in low and higher age
group. It is clear from the table that the migration is very pronounced in the highly productive age group is 20-40 years
TABLE 2: MALE AND FEMALE RATIO
Gender Frequency Percentage
Female 64 32.0
Male 136 68.0
Total 200 100
The data has been classified on the basis of gender also. And it is men who are more migratory in this group. And the 32% of female population is normally the
dependent wife who follows husband to his working place. In most of the cases they are also joining the hands of their husbands to improve the family income
and they expressed their willingness to work in an alien place than in their native.
TABLE 3: CATEGORY WISE MIGRANT LABOURERS
The result shows the socio – economic conditions of the migrant labourers, table 3 refers the category wise migrated laborers and their percentage. According to
this table the migrated laborers from north Karnataka has been classified into SC and STs, OBCs and others and it is very clear that out of the total more than
40% are SCs and STs ,34 %belong to 2A(kuraba) . This clearly shows that the majority of the poor agricultural labourers, who migrate for their livelihood, are
from this marginalized group.
TABLE 4: EDUCATIONAL LEVELS OF MIGRANT LABOURERS
Education is very crucial for inclusive growth and this has been tested in this research paper and as expected the number of illiterates is very high (62%).25%of
the labourers are having higher primary school level and the maximum level of education among these people is high school level(13%).This works like a vicious
circle for these people. They are poor and are not able to get good education and they are not getting good education because they are poor.
TABLE 5: WORKING STATUS OF MIGRANTS
Status Frequency Percent
Helper 8 4.0
Labour 176 88.0
Mason 16 8.0
Total 200 100.0
Above table shows that 88%of migrants are working as labourers, they are unskilled hence they draw lower wages compare to mason and other workers who
are working in construction fields.
TABLE 6: PAIRED SAMPLE T TEST
Paired Differences
After And Before Migration Mean Std. Deviation Std. Error Mean t df Sig. (2-tailed)
-4110.000 4309.620 430.620 9.537 99 .000
Above Table6 refers to the wage earning status of the migrant labourers before and after their migration from north to south Karnataka. As shown above, the
table value is greater than calculated value (9.537> 1.984).therefore the null hypothesis is rejected. Rejecting null hypothesis shows that the test is statically
significant. There is a significant difference between income level of the migrated labourers before and after their migration. The income has actually increased.
Category Frequency Percentage
2A 68 34.0
2B 26 13.0
3A 2 1.0
3B 2 1.0
CAT I 22 11.0
SC 36 18.0
ST 44 22.0
TOTAL 200 100.0
Education level Frequency Percentage
Illiterate 124 62
Primary/higher primary 50 25
High school 26 13
TOTAL 100 100

VOLUME NO. 3 (2013), I SSUE NO. 09 (SEPTEMBER ) ISSN 2231-5756
INTERNATIONAL JOURNAL OF RESEARCH IN COMMERCE, IT & MANAGEMENT A Monthly Double-Blind Peer Reviewed (Refereed/Juried) Open Access International e-Journal - Included in the International Serial Directories
http://ijrcm.org.in/
60
This type of migration not only helped to improve the standard of living of the migrant labourers, but also made them economically and socially included as
majority of them belongs to the marginalized communities.
FINDINGS AND CONCLUSION The above study helps us to make some observation as below.
The migrant labourers from North Karnataka are becoming the main labour source to the construction sector in the cities and the construction works of the
cities are pulling these labourers because of high wages. Migrated labourers are coming to southern region in good number for employment to fulfilling their
financial as well as social needs. Most of the labourers have own land holding but they find it very difficult to survive because of this adverse environment in
agriculture sector, Therefore they migrate to other sectors where they are got higher wages, Since majority of these migrant labourers have come from poor
background and low socio economic status, the migration has helped them to improve not only their financial status but also their educational, social status. In
this way they felt that the migration has helped them to get included in the sustainable development process. In this type they earn more money with migration
and fulfill their financial needs and contribute to the sustainable development of the country and their social- economic development.
REFERENCES 1. Global Economic Prospects (2006) the World Bank.
2. J,Edward Taylor, Joaquin Arango,(1996), International Migration and Community Development, Population Index, Vol. 62, No. 3, pp. 397-418.
3. Jajati Keshari Parida,S Madheswaran,(2011) “Determinants Of Migration And Remittance In India, Empirical Evidence” The Institute for Social and Economic
Change, Bangalore, Working paper272.
4. Kalpana Bardhan(1973)Factors Affecting Wage Rates for Agricultural Labour” Economic and Political Weekly, Vol. 8, No. 26, pp. A56-A64
5. M. S. A. Rao (1966) “Urbanisation in a Delhi Village: Some Social Aspects” Economic and Political Weekly, Vol. 1, No. 9 , pp. 365-370.
6. M. S. Gore (1975)”Development and a Strategy for Urbanisation: Absence of a Positive 115+117-119.
7. M.H. Wani, Shahid Yousuf, S.H. Baba and S.A. Wani(2011), “agricultural labour migration: causes and implications”, Agricultural Economics Research
Review Vol. 24 (Conference Number) 2011
8. Nata Duvvury,(1989”)Women in Agriculture: A Review of the Indian Literature” Economic and Political Weekly, Vol. 24, No. 43 (Oct. 28, 1989), pp. WS96-
WS112
9. Nigel Harris (2005)”Migration and Development” Economic and Political Weekly, Vol. 40, No. 43, pp. 4591-4595.
10. Nirmala Banerjee (1969)”What Course for Urbanisation in India?” Economic and Political Weekly, Vol. 4, No. 28/30, pp. 1173-1176.
11. Omprakash Parganiha1, M.L. Sharma2, P.M. Paraye,(2009)Migration Effect of Agricultural Labourers on Agricultural Activities, Indian Res. J. Ext. Edu. 9 (3),
September, 2009
12. P. Parthasarathy Rao, P. S. Birthal and P. K. Joshi (2006)”Diversification towards High Value Agriculture: Role of Urbanization and Infrastructure”, Economic
and Political Weekly, Vol. 41, No. 26, pp. 2747-2753.
13. Pabitra Giri (1998)Urbanisation in West Bengal, 1951-1991, Economic and Political Weekly, Vol. 33, No. 47/48, pp. 3033-3035+3037-3038.
14. Per Lundborg and Paul S. Segerstrom (2000), International Migration and Growth in Developed Countries: A Theoretical Analysis, Economica, New Series,
Vol. 67, No. 268 (Nov., 2000), pp. 579-604.
15. Robyn Eversole (2008) “Development in Motion: What to Think about Migration? “, Development in Practice”, Vol. 18, No. 1, pp. 94-99.
16. Roel Jennissen: (2007),”Causality Chains in the International Migration Systems Approach”, Population Research and Policy Review, Vol. 26, No. 4 pp. 411-
436.

VOLUME NO. 3 (2013), I SSUE NO. 09 (SEPTEMBER ) ISSN 2231-5756
INTERNATIONAL JOURNAL OF RESEARCH IN COMMERCE, IT & MANAGEMENT A Monthly Double-Blind Peer Reviewed (Refereed/Juried) Open Access International e-Journal - Included in the International Serial Directories
http://ijrcm.org.in/
61
THE ANTECEDENTS OF BRAND LOYALTY: AN EMPIRICAL STUDY ON AIRTEL CELLULAR SERVICES
DR. P. SUJATHA
HEAD
DEPARTMENT OF MANAGEMENT STUDIES
ANNAMACHARYA INSTITUTE OF TECHNOLOGY & SCIENCES
TIRUPATI
ABSTRACT The Mobile market in India is very robust and is the second largest mobile telecom market in the world, adding nearly 20million subscribers every month. This
rapid growth in the mobile segment has been driven by an enabling policy framework and intense competition. With up to 12 competing operators in a circle, the
tariffs in India are the lowest as compared to global benchmarks. In such a hyper-competitive scenario service providers make an all out effort to attract and
retain customers. There is an ongoing effort from the service providers to improve the service and enhance customer delight. Even though the literature on
customer satisfaction is normally related to customer loyalty, a formal model explaining the steps between customer satisfaction and customer loyalty is missing.
It has been mentioned that customer satisfaction is necessary, but not a sufficient condition for improving customer loyalty. There are evidences that despite
favorable customer satisfaction, companies are losing important buyers of their products and services every day. If there is no straight forward relationship
between customer satisfaction and customer loyalty, then what is there in the middle? How can we explain that customer satisfaction does not always lead to
customer loyalty? The present study will address these primary problems by establishing relationship between mobile service quality, customer satisfaction,
switching costs and brand loyalty.
KEYWORDS Brand Loyalty, Customer Satisfaction, Service Providers, Switching Costs, Telecom Industry.
INTRODUCTION he service sector is growing at a faster rate than any other sector of the economies in both developed and developing countries. The most marked
change in the twentieth century, particularly in the later half, has been the economic transformation from the manufacturing sector to the service
sector in almost all the countries in the world. India is not exception to this change. Liberalization of Indian economy, during the 1990s, has given
momentum to the service sector. While, during the previous decades, the three main sectors of economic activity- agriculture, industry and service- have
roughly equal contribution to the gross domestic product (GDP) of India. According to the statistics of Central Statistical organization (CSO) data for 1999-2000,
the service sector accounts for more than 53 percent of Indian GDP. From 2001 onwards it has been increased gradually. Contribution of service sector to the
Indian GDP reached 86.5 percent by the end of the financial year 2012-13.
Among the various service sub-segments, the main growth driver of the sector is telecommunication services, apart from Information Technology (IT),
Information Technology-Enabled Services (ITES), and tourism. Since 1990s, the telecommunications sector has been a key area for the economic advancement of
developed as well as developing countries. In addition to this, the changing economic conditions, changing needs of customers and competition among the
telecom companies have made the field, a dynamic service sub-sector for economic development. So marketing orientation has become main strategy of
telecommunication services firms in India.
Because of heavy competition in Indian cellular services market, Airtel cellular services, the market leader is facing the threat of losing subscriber base. Though
Airtel has nation-wide network, the performance of the company with regard to service provision is not on par with other service providers in few areas.
The general purpose of this study is to reconceptualise a traditional model of consumer loyalty in the mobile services context. The importance of consumer
loyalty in the services industry cannot be overstated. As consumer’s controlling power over the market increases, the marketing effort is shifting from satisfying
customers to retaining customers.
This paper is mainly focused on assessing the relationship between mobile service quality, perceived value, customer satisfaction, switching costs and customer
loyalty. For the analysis of data, SPSS 11.5 software package and excel are used.
COMPANY PROFILE: AN OVERVIEW Bharti Airtel Limited formerly known as Bharti Tele-Ventures LTD (BTVL) is an Indian company offering telecommunication services in 18 countries. It is the
largest cellular service provider in India, with more than 197 million subscriptions as of April 2013. Bharti Airtel is the world's third largest, single-country mobile
operator and fifth largest telecom operator in the world in terms of subscriber base. It also offers fixed line services and broadband services. It offers its telecom
services under the Airtel brand and is headed by Sunil Bharti Mittal. The company also provides telephone services and broadband Internet access (DSL) in over
89 cities in India. It also acts as a carrier for national and international long distance communication services.
Brand Airtel was born free, a force unleashed into the market with a relentless and unwavering determination to succeed. A spirit charged with energy,
creativity and a team driven to seize the day, with an ambition to become the most globally admired telecom service.
It is the first service provider to introduce life-time prepaid and e-recharge system. AirTel has launched a new logo. The new logo would symbolise innovation,
energy and friendliness. It has also introduced 32K SIM card with DP5 server to its post-paid customers.A London based company which goes by the name Brand
Union has designed the new logo of Airtel. The new logo is the letter a in lowercase, and has airtel written in lowercase under the logo. Brand Union the
company that designed the new logo is also associated with the logo of Vodafone.
AIRTEL LOGO
The company is structured into four strategic business units - Mobile, Telemedia, Enterprise and Digital TV. The mobile business offers services in 18 countries
across the Indian Subcontinent and Africa. The Telemedia business provides broadband, IPTV and telephone services in 89 Indian cities. The Digital TV business
provides Direct-to-Home TV services across India. The Enterprise business provides end-to-end telecom solutions to corporate customers and national and
international long distance services to telcos.
Globally, Bharti Airtel is the 3rd largest in-country mobile operator by subscriber base, behind China Mobile and China Unicom. In India, the company has a
30.7% share of the wireless services market.
T

VOLUME NO. 3 (2013), I SSUE NO. 09 (SEPTEMBER ) ISSN 2231-5756
INTERNATIONAL JOURNAL OF RESEARCH IN COMMERCE, IT & MANAGEMENT A Monthly Double-Blind Peer Reviewed (Refereed/Juried) Open Access International e-Journal - Included in the International Serial Directories
http://ijrcm.org.in/
62
STATEMENT OF THE PROBLEM Mobile market in India is very robust and is the second largest mobile telecom market in the world, adding nearly 20million subscribers every month. This rapid
growth in the mobile segment has been driven by an enabling policy framework and intense competition. With up to 12 competing operators in a circle, the
tariffs in India are the lowest as compared to global benchmarks. And with Mobile Number Portability introduced in India, the competition has increased further.
In such a hyper-competitive scenario service providers make an all out effort to attract and retain customers. There is an ongoing effort from the service
providers to improve the service and enhance customer delight. All service providers have made huge investments towards setting up sophisticated, state-of-
the-art customer care centers, Interactive Voice Response (IVR) systems with consumer friendly, menu driven options that can easily cater to an entire gamut of
services.
Despite this new emphasis on customer retention and the acceptance that managers need to understand and know how customer retention can be achieved,
marketing researchers did not have advanced studies on the antecedents of customer retention in telecommunication services. Some authors of marketing
textbooks have linked customer retention to customer satisfaction (Kotler (1997), Kurtz and Clow (1998), Rust, Zahorik and Keiningham (1996), Zeithmal and
Bitner (1996) under the assumption that a satisfied customer may be prone to repeat purchases, whereas an unsatisfied customer may tend to defect. Similarly,
some marketing researchers have underscored the direct relationship between customer loyalty and customer satisfaction (Hallowel (1996), Heskett (1994)).
Even though the literature on customer satisfaction is normally related to customer loyalty, a formal model explaining the steps between customer satisfaction
and customer loyalty is missing. It has been mentioned that customer satisfaction is necessary, but not a sufficient condition for improving customer loyalty.
There are evidences that despite favorable customer satisfaction, companies are losing important buyers of their products and services every day.
If there is no straight forward relationship between customer satisfaction and customer loyalty, then what is there in the middle? How can we explain that
customer satisfaction does not always lead to customer loyalty? The present study will address these primary problems.
OBJECTIVES OF THE STUDY In order to get answers to the above questions, the present research is designed to achieve the following objectives:
• To find out the antecedents of Brand Loyalty.
• To find out the impact of Antecedents of Brand Loyalty (BL) on the loyal behavior of customers.
HYPOTHESES OF THE STUDY On the basis of the theoretical framework and review of literature, the following hypotheses were developed.
H1: There is no significant correlation between Mobile Service Quality (MSQ) and Brand Loyalty.
H2: There is no significant correlation between Perceived Value of mobile services (PVMS) and Brand Loyalty.
H3: There is no significant correlation between Customer Satisfaction (CS) and Brand Loyalty.
H4: There is no significant correlation between Switching Costs (SC) and Brand Loyalty.
RESEARCH METHODOLOGY The research methodology is the science of dealing with the principles of procedure in research study. It deals with the definition of the research problem,
research design, and method of data collection, selection of sampling, statistical tools employed and interpretation of collected data.
(i) Research Design: The research design is descriptive as it provides the inventory of feelings regarding Mobile Service Quality, Customer Satisfaction and
Customer Loyalty intentions of customers towards Airtel cellular service provider.
The subscriber respondents were chosen from the Airtel subscribers in Chittoor district, Andhra Pradesh
(ii) Research Model of the Present Study:
(iii) Period of Study: The study of this type requires at least a decade period to observe the trend and draw valid conclusions from the analysis. Now, the present
study covers a period of 10 years starting from 2002-2003 to 2011-2012.
(iv) Sources of Data: The data sources required for the study include both primary and secondary. The primary data sources were the subscribers of Airtel
cellular mobile telephone services in Chittoor district, Andhra Pradesh.
The secondary data sources were: relevant websites, national and international refereed journals, business magazines and news papers, working papers and
monographs relevant to the area of research. Literature related data were collected from the libraries like IIM-Bangalore Library, computer centre (IIM-B), Sri
Venkateswara University Central library and Digital library, etc.
(v) Data Collection- Research Instrument: A structured questionnaire consisting of six parts, was used as research instrument for the present study.
Mobile
Service
Quality
PVMS
Satisfaction
Loyalty
Switching costs

VOLUME NO. 3 (2013), I SSUE NO. 09 (SEPTEMBER ) ISSN 2231-5756
INTERNATIONAL JOURNAL OF RESEARCH IN COMMERCE, IT & MANAGEMENT A Monthly Double-Blind Peer Reviewed (Refereed/Juried) Open Access International e-Journal - Included in the International Serial Directories
http://ijrcm.org.in/
63
RELIABILITY ANALYSIS OF THE RESEARCH INSTRUMENT
Although a few measures used in this study were taken from previously published research and required only minor changes in wording, reliability of the
instrument was tested using Cronbach’s alpha. Cronbach's α (alpha) is a coefficient of reliability. It is commonly used as a measure of the internal consistency or
reliability of a psychometric test score for a sample of examinees. It was first named alpha by Lee Cronbach in 1951.
VALIDITY ANALYSIS OF THE RESEARCH INSTRUMENT
The scale used in the present study was assessed for validity, using confirmatory factor analysis (Peter, 1981). The dimensional structure of all the items used in
the present study, their difference scores were examined using a principal component factor analysis with VARIMAX rotation The results of confirmatory factor
analysis indicate an acceptable model of fit at 0.01 level of significance.
(vi) Sampling Methodology: Sampling frame comprised of the subscribers of cellular mobile services of Airtel, in Chittoor district of Andhra Pradesh. Non-
Probability Quota sampling technique was used.A total of 500 customers were contacted over a 3 months period (Aug-Oct 2012) via a structured questionnaire.
(vii) Statistical Techniques: In order to test the proposed hypotheses through data analysis, correlation and regression techniques were used.
DATA ANALYSIS H1: There is no significant correlation between MSQ and Brand Loyalty.
This hypothesis has been tested by using correlation and regression (Table 1.1 and 1.2).It has been observed from the results of correlation coefficients matrix
that there is significant positive correlation between Mobile Service Quality and Brand Loyalty. The corresponding correlation coefficient is highly significant at
1% level. Hence we can conclude that there is strong association between MSQ and Brand loyalty. But R2
value is less. It indicates that there are many other
factors other than MSQ that influence Brand Loyalty of the respondents. Only 5% of the variability in Loyalty can be predicted from MSQ. In other words, a large
number of residual variability is presented in Brand Loyalty.
TABLE 1.1: CORRELATION MATRIX
QMS
BL Pearson Correlation .240**
p-value 0.0000
TABLE 1.2: REGRESSION ANALYSIS RESULTS
(a)
Model R R Square Adjusted R Square
1 .240 .058 .056
2 .259 .067 .064
(b)
ANOVA
Model Sum of Squares df Mean Square F Sig.
1 Regression 1.704 1 1.704 30.524 .000a
Residual 27.805 498 .056
Total 29.509 499
2 Regression 1.985 2 .993 17.923 .000b
Residual 27.524 497 .055
Total 29.509 499
(c)
Coefficients
Model Unstandardized Coefficients Standardized Coefficients t Sig.
B Std. Error Beta
1 (Constant) 2.060 .235 8.776 .000
Quality .378 .068 .240 5.525 .000
2 (Constant) 2.295 .256 8.962 .000
Quality .378 .068 .240 5.550 .000
Connectivity -.056 .025 -.098 -2.252 .025
Dependent Variable: Brand_Loyalty
H2: There is no significant correlation between PVMS and Brand Loyalty.
From the Table 1.3, it has been observed that there is insignificant positive correlation between perceived value of mobile services and Brand loyalty. This
implies that PVMS and BL are related but even if the PVMS of the respondents is low, customers may be loyal to the brand and vice-versa. Regression analysis
results (Table 1.4) reveals that only 13 % of the variability in BL can be predicted from PVMS.
TABLE 1.3: CORRELATION MATRIX
PVMS
BL
Pearson Correlation .051
p-value .254
TABLE 1.4: REGRESSION ANALYSIS
(a)
Model R R Square Adjusted R Square
1 0.40 .16 .13

VOLUME NO. 3 (2013), I SSUE NO. 09 (SEPTEMBER ) ISSN 2231-5756
INTERNATIONAL JOURNAL OF RESEARCH IN COMMERCE, IT & MANAGEMENT A Monthly Double-Blind Peer Reviewed (Refereed/Juried) Open Access International e-Journal - Included in the International Serial Directories
http://ijrcm.org.in/
64
(b)
ANOVA
Model Sum of Squares df Mean Square F Sig.
1 Regression .077 1 .077 1.306 .041a
Residual 29.432 498 .059
Total 29.509 499
(c)
COEFFICIENTS
Model Unstandardized Coefficients Standardized Coefficients t Sig.
B Std. Error Beta
1 (Constant) 3.280 .067 49.188 .000
PVMS .021 .019 .051 1.143 .04
H3: There is no significant correlation between CS and Brand Loyalty.
From the tables 1.5 and 1.6, it has been observed that there is significant positive correlation between customer satisfaction and customer loyalty. The
corresponding correlation coefficient is significant at 5% level. The R2 value reveals that both the variables contribute to 31% of the explained variance. We can
conclude that customer satisfaction and Brand Loyalty are strongly related. Hence there is significant relationship between CS and BL.
TABLE 1.5: CORRELATION TABLE
CS
BL
Pearson Correlation .140*
p-value 0.002
TABLE 1.6 : REGRESSION ANALYSIS
(a)
(b)
ANOVA
Model Sum of Squares df Mean Square F Sig.
1 Regression .577 1 .577 9.924 .002
Residual 28.932 498 .058
Total 29.509 499
(c)
COEFFICIENTS
Model Unstandardized Coefficients Standardized Coefficients T Sig.
B Std. Error Beta
1 (Constant) 3.101 .081 38.087 .000
CS .066 .021 .140 3.150 .002
H4: There is no significant correlation between Switching Costs and Brand Loyalty.
The results of correlation and Regression analysis (Tables 1.7 and 1.8) reveal that there is strong significant relationship between Switching Costs and Brand
Loyalty. The correlation coefficient is 0.505, which indicates high association between the variables. From the table 1.8 (a), the adjusted R2
value offer
noteworthy insight on the overall ability of Switching costs to explain the variation in score on Brand Loyalty. Hence the relationship between SC and BL is highly
significant.
TABLE 1.7: CORRELATION MATRIX
SC
BL
Pearson Correlation .505**
p-value 0.0000
TABLE 1.8: REGRESSION ANALYSIS
(a)
Model R R Square Adjusted R Square
1 .25 .625 .620
(b)
ANOVA
Model Sum of Squares df Mean Square F Sig.
1 Regression 7.515 1 7.515 170.167 .000a
Residual 21.994 498 .044
Total 29.509 499
(c)
COEFFICIENTS
Model Unstandardized Coefficients Standardized Coefficients t Sig.
B Std. Error Beta
1 (Constant) 2.861 .039 73.394 .000
Switching_Cost .165 .013 .505 13.045 .000
Model R R Square Adjusted R Square
1 .6 .36 .31

VOLUME NO. 3 (2013), I SSUE NO. 09 (SEPTEMBER ) ISSN 2231-5756
INTERNATIONAL JOURNAL OF RESEARCH IN COMMERCE, IT & MANAGEMENT A Monthly Double-Blind Peer Reviewed (Refereed/Juried) Open Access International e-Journal - Included in the International Serial Directories
http://ijrcm.org.in/
65
RESULTS AND DISCUSSION • MOBILE SERVICE QUALITY AND BRAND LOYALTY ARE RELATED
The results of the correlation and regression analysis of the study indicated a significant relationship between mobile service quality and customer loyalty.
Previous studies also found that mobile service quality and customer loyalty are significantly related (Sirkit, 2000; Johnson and Sirkit, 2002; Zeithaml et al.,
1996). Boulding, Kalra, Staelin and Zeithaml (1993) also indicated that a perception of high mobile service quality lead to a firm’s success via high loyalty and
positive word of mouth.
• CUSTOMER SATISFACTION AND BRAND LOYALTY ARE RELATED
The results of the regression analysis report a significant relationship between customer satisfaction and customer loyalty in Airtel cellular services. This finding
is corroborated by the previous studies of Anderson and Sullivan (1993); Bolton (1998); Cronin and Taylor (1992); Fornell (1992); Oliver (1980); Patterson and
Spreng (1997); Rust and Zahorik (1993); Selnes (1998); Swan and Trawick (1981); Taylor and Baker (1994) and Woodside et al., (1989). Wang and Lo (2002) found
a direct relationship between customer satisfaction and Brand loyalty with evidence from China’s telecommunication industry.
• MOBILE SERVICE QUALITY VARIABLES DETERMINE BRAND LOYALTY
The influence of network quality, value-added services, convenience in procedures and customer service support has strong influence on overall perceived value
of mobile services and Brand Loyalty. A similar finding was reported by the previous studies of Gerpott et al., (2001); Lee et al., (2001); Kim and Yoon (2004), Kim
et al., (2004) Ahn et al., (2006), Keaveney (1995), Bolton (1998), Bolton et al., (2000), Kim (2000), Moer et al., (2000).
• PERCEIVED VALUE OF MOBILE SERVICES, CUSTOMER SATISFACTION AND CUSTOMER LOYALTY ARE RELATED:
Studies of Wang et al., (2004), Wang and Lo (2002), and Lee et al., (2001) have found positive relationships between the variables. The findings of the present
study are similar.
RECOMMENDATIONS Airtel has to take steps to improve their ratings on the following:
• DEVELOP LOYALTY PROGRAMS
Loyalty programs play an important role in retaining the existing customers. We can develop loyalty programs, an offer where an operator gets free minutes,
when their customers reach a certain level of usage. Airtel can also use internal scoring system to identify their high value customers and offer them on a
discretionary basis, rebates, specific membership clubs and gift certificates, or free goods when they renew their subscriptions.
• CUSTOMER SUPPORT
Airtel must empower its customer service representatives to take care of the problem quickly and efficiently. They must be empowered to handle the customer
complaints because customers are telling that different customer care executives are giving different responses to the same complaint. Also the procedure of
connecting to call centre should be made easy and the time taken by the call centre for redressal of the complaint should be as short as possible.
• VALUE-ADDED SERVICES(VAS)
Selling more to the existing subscribers is relatively easier as compared to acquiring new customers. Also the new subscriptions will largely happen at the bottom
of the pyramid therefore the new subscriptions will further lower the average revenue per user. So VAS is a potential long term revenue stream as it will be
easier to sell more to the existing customers. Airtel should make its VAS more accessible to customers when compared to competitors.
• PRICING STRUCTURE
Pricing is one of the major reasons for customers defecting from the telecom operators. New entrants like Uninor, Tata indicom are offering better tariff
packages. So, Airtel should also come up with attractive offers on par with competitors.
• TIE-UP WITH HANDSET MANUFACTURERS
Airtel can have tie-ups with cell phone manufacturers and can provide the handsets at subsidized rates. Once it is purchased, the phone will be locked. Customer
cannot use another sim in the same handset. This creates switching costs for the customers and hence they remain loyal to the brand.
LIMITATIONS OF THE STUDY The study has the following limitations:
Drawing Sample from a Single company was a major limitation of the study. Although service industries have much in common, each industry has its own
special characteristics in terms of product/ service complexity, distribution channels, automation levels etc. Drawing sample from a single company limits the
generalisability of the study.
Sample size: Many of the studies in this field used sample sizes in the range of thousands. The 500 sample size may be reported as small for few researchers
from their point of view and this can be concluded as further limiting factor for the generalization of findings.
FUTURE RESEARCH DIRECTIONS • What is the effect of psychological characteristics of customers on loyalty in cellular services? Whether these factors function as adjusting variables in the
existing interaction?
• What is the impact of inertia and customer indifference on brand loyalty in telecommunication services?
• How to establish relationship among the constructs such as customer satisfaction, loyalty and profitability in cellular mobile services?
• What is the impact of culture on Brand loyalty, as customers from different cultures have different perceptions and expectations?
REFERENCES 1. Bolton, R.N. and Drew, J.H. (1991), “A Multistage Model of Customer’s Assessment of Service Quality and Value”, Journal of Consumer Research, Vol. 17,
(March), pp.375-384.
2. Chadha, S.K. and Kapoor, Deepak (2009), “Effect of Switching Cost Service Quality and Customer Satisfaction on Customer Loyalty of Cellular Service
Providers in Indian Market:, The ICFAI University Journal of Marketing Management, Vol.8, No.1, pp.23-37.
3. Fornell, C., Johnson, M.D., Anderson, E.W., Cha, J. and Bryant, B.E. (1996), “The American Customer Satisfaction Index: Nature, Purpose, and Findings”,
Journal of Marketing, Vol.60, (October), pp.7-18..
4. Gerpott, T.J., Rams, W. and Schindler, A (2001), “Customer Retention Loyalty, and Satisfaction in the German Mobile Cellular Telecommunications
Market”, Telecommunications Policy, Vol. 25, pp. 249 -269.
5. Gronroos, C. (1984), “A Service Quality Model and its Marketing Implications”, European Journal of Marketing, Vol. 18, No.4, pp. 36-44.
6. Johnson, W.C. and Sirikit, A. (2002), “Service Quality in Thai Telecommunication Industry: A Tool for Achieving a Sustainable Competitive Advantage”,
Management Decision, Vol. 40, No.7, pp. 693-701.
7. Kim, H.S. and Yoon, C.H. (2004), “Determinants of Subscriber Churn and Loyalty in the Korean Mobile Telephony Market”, "Study of the Relationship
between Perception of Value and Price and Customer Satisfaction : The Case of Malaysian Telecommunications Industry", Journal of American Academy of
Business”, Telecommunications Policy, Vol. 28, pp.751-765.

VOLUME NO. 3 (2013), I SSUE NO. 09 (SEPTEMBER ) ISSN 2231-5756
INTERNATIONAL JOURNAL OF RESEARCH IN COMMERCE, IT & MANAGEMENT A Monthly Double-Blind Peer Reviewed (Refereed/Juried) Open Access International e-Journal - Included in the International Serial Directories
http://ijrcm.org.in/
66
STATUS OF BI SOLUTIONS AT SELECTED BRANCHES OF BANKS IN RAJASTHAN
DR. AZIMUDDIN KHAN
SR. MANAGER SYSTEMS
RAJASTHAN STATE MINES & MINERALS LIMITED
UDAIPUR
ABSTRACT In the wake of global financial crises the efficiency of the banking sector has also come under scrutiny. The mainstay of Indian economy has been the strength of
its banking system. With rapid development in the field of information technology, the use of business intelligence practices in banking sector has increased many
folds. In an empirical study of 25 selected Indian banks in the state of Rajasthan, the status of Business Intelligence and its applicability at branch level due to
implementation of Business Intelligence (BI) solutions have been studied. The major finding is that public sector banks are lagging in implementation of business
intelligence solutions compare to private banks. Branch Manager does not make much use of Dashboard and scorecard tools. They are confined to use standard
and ad-hoc reporting tools only. At Branch level, fraud prevention and detection analysis and Key Performance Indicators (KPI) analysis are highest application
being utilized by the respondent’s bank. Execution of regulatory compliances is highest benefit perceived by the respondents. New banks are in better position to
implement business intelligence solutions compare to old banks. The research is particularly useful for practitioners in the banking field and suggestions have
been given toward the end of paper.
KEYWORDS Banking, BI Implementation, Business Intelligence, Decision Making, Financial Benefits.
INTRODUCTION ith the globalization and removal of business boundaries, customer, supplier and competitor base has been increased, which has also increased the
complexity of decision making process. The emergence of fast communication makes environment less stable and unpredictable and provides less
time for examining the available business information, knowledge, and intelligence. Decision makers are taking decision by considering various
factors based on strategies and actual performance (Khan and Saxena, 2011).
The decision making depends on quality of available data, tools and technology, trust, flexibility and sound judgments taking capability of decision makers.
Business Intelligence (BI) systems should facilitate the decision makers to correct their intuition by taking advantage of analytical tools, which can test and verify
intuition before applying it to the decision making process. Decision maker can also use predictive models to improve their decision making. The current state of
decision making is forcing us to reap the real benefits of business intelligence.
Storing vast amounts of data does not ensure effective decision making. Business intelligence solution must turn dynamic, detailed data into information, and
make it available in real-time to the decision makers at the time of a decision. Actionable information must be accessible on-demand when it’s required. It
provides trends and patterns that might otherwise go undetected and unseen by decision makers. To be a successful bank, it needs a foundation of accurate,
current and complete information rather than managing a bank on intuition, educated guesses or averages. Business Intelligence can derive better return on
investment (ROI) from complex integrated banking software and other operational system implemented by unlocking the wealth of information stored in these
systems by consolidation of data from many sources, including a diverse customer base, extensive branch networks, and shareholders at data warehouse and
utilization of various business intelligence tools.
REVIEW OF LITERATURE A review of literature of various studies related to applicability of business intelligence and financial benefits achieved due to BI implementation in banks clearly
shows that very limited research has been done in Indian context. As per Morris et al., (2002) conducted a study on the financial impact of Business Analytics
based on 43 case studies of organizations that successfully implement and utilize analytic applications by interviewing in-person. The project goal was to
examine the return on investment (ROI) for analytic applications and financial impact of analytic applications on the core business processes that help contribute
to an organization’s success. They found that businesses that make an investment in analytics can achieve a significant and rapid return because of increased
efficiencies and expanded opportunity.
As Williams and Williams (2003) suggest that the business value of BI lies in its use within management processes that impact operational processes that drive
revenue or reduce costs, and/or in its use within those operational processes themselves. The quest for delivering business value via BI can be seen as a matter
of determining how an organization can use BI to improve management processes such as planning, controlling, measuring, monitoring, and/or changing so that
management can increase revenues, reduce costs, or both. And also to improve operational processes such as fraud detection, sales campaign execution,
customer order processing, purchasing, and/or accounts payable processing so that the business can increase revenues, reduce costs or both
According Eckerson (2006), most of the benefits from business intelligence are intangible in nature, which makes organizations to justify in terms of cost based
on survey of 510 respondents by the data warehousing institute in 2003. Kalakota and Robinson (2001) suggested that a business intelligence system built on a
data warehouse is about empowering best people of organization to gain insight from exploiting the information organization has spent millions to control and
years to develop. The data warehouse with business intelligence has the potential to enable users to continuously produce enormous, sustainable, measurable
benefits that lead to competitive advantage and fulfill the promise of IT.
As per IBA-Finsight (2007) special report suggests about the operational business intelligence in banking, it delivers information and insights to those manager
that are involved in operational and transactional processes. While serving a customer at a counter, the executive can cross sell other product based on the
information and analytics available from operational business intelligence system based on customers past transactions. The operational business intelligence
reduces the time it takes for a line of business user or application to react to business issue or requirement. The data latency to data warehouse should be as
small as possible to get operational analytics. ICICI bank had implemented the SAS solutions to address this problem. Nadeem and Hussain (2004) studied Credit
Information Bureau (CIB), State Bank of Pakistan (SBP), which maintain the information related to borrowing. The CIB is acting as central repositories in SBP to
provide the credit worthiness report. The bank was in need of providing fast, accurate, and dynamic analysis on both individual and group basis. They have
developed and customized the business intelligence solution OLBA-Online Business Analyst using oracle 9i database, MS SQL Server (data staging) and C#
programming language. The software provides credit worthiness analytics based data with graphical visualization.
Bach et al. (2007) studied to explore usage of business intelligence tools in Croatian banks. Author had examined the possible business tools and their usage in
general, and then explored their possible usage in banks. The survey on usage of business intelligence tools in Croatian banks was conducted. The results of the
survey revealed that only 46% of Croatian banks use both main business intelligence tools (data mining and data warehousing). Banks which use business
intelligence tools differ from the banks which do not have such a system. They differ in the following characteristics: size of total assets, participation of their
own assets in the Croatian banking sector, size of off-balance items, size of income and capital stock and rate of capital adequacy. Banks which use business
intelligence tools are larger and more successful. Large and successful banks invest more in information technology, especially business intelligence in the
purpose of more efficient business reporting. By using business intelligence tools, these banks will use their organizational knowledge even better, and
consequently they will become even more successful. This will make possible to invest even more into advanced information technology.
W
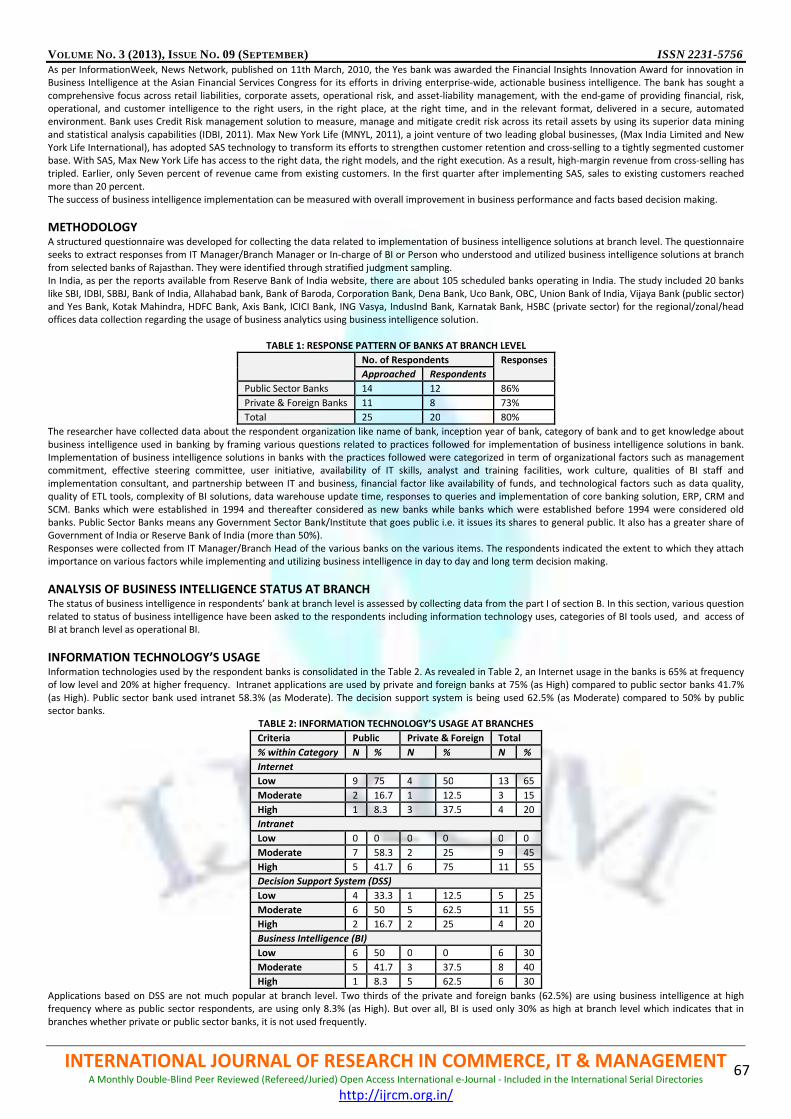
VOLUME NO. 3 (2013), I SSUE NO. 09 (SEPTEMBER ) ISSN 2231-5756
INTERNATIONAL JOURNAL OF RESEARCH IN COMMERCE, IT & MANAGEMENT A Monthly Double-Blind Peer Reviewed (Refereed/Juried) Open Access International e-Journal - Included in the International Serial Directories
http://ijrcm.org.in/
67
As per InformationWeek, News Network, published on 11th March, 2010, the Yes bank was awarded the Financial Insights Innovation Award for innovation in
Business Intelligence at the Asian Financial Services Congress for its efforts in driving enterprise-wide, actionable business intelligence. The bank has sought a
comprehensive focus across retail liabilities, corporate assets, operational risk, and asset-liability management, with the end-game of providing financial, risk,
operational, and customer intelligence to the right users, in the right place, at the right time, and in the relevant format, delivered in a secure, automated
environment. Bank uses Credit Risk management solution to measure, manage and mitigate credit risk across its retail assets by using its superior data mining
and statistical analysis capabilities (IDBI, 2011). Max New York Life (MNYL, 2011), a joint venture of two leading global businesses, (Max India Limited and New
York Life International), has adopted SAS technology to transform its efforts to strengthen customer retention and cross-selling to a tightly segmented customer
base. With SAS, Max New York Life has access to the right data, the right models, and the right execution. As a result, high-margin revenue from cross-selling has
tripled. Earlier, only Seven percent of revenue came from existing customers. In the first quarter after implementing SAS, sales to existing customers reached
more than 20 percent.
The success of business intelligence implementation can be measured with overall improvement in business performance and facts based decision making.
METHODOLOGY A structured questionnaire was developed for collecting the data related to implementation of business intelligence solutions at branch level. The questionnaire
seeks to extract responses from IT Manager/Branch Manager or In-charge of BI or Person who understood and utilized business intelligence solutions at branch
from selected banks of Rajasthan. They were identified through stratified judgment sampling.
In India, as per the reports available from Reserve Bank of India website, there are about 105 scheduled banks operating in India. The study included 20 banks
like SBI, IDBI, SBBJ, Bank of India, Allahabad bank, Bank of Baroda, Corporation Bank, Dena Bank, Uco Bank, OBC, Union Bank of India, Vijaya Bank (public sector)
and Yes Bank, Kotak Mahindra, HDFC Bank, Axis Bank, ICICI Bank, ING Vasya, IndusInd Bank, Karnatak Bank, HSBC (private sector) for the regional/zonal/head
offices data collection regarding the usage of business analytics using business intelligence solution.
TABLE 1: RESPONSE PATTERN OF BANKS AT BRANCH LEVEL
No. of Respondents Responses
Approached Respondents
Public Sector Banks 14 12 86%
Private & Foreign Banks 11 8 73%
Total 25 20 80%
The researcher have collected data about the respondent organization like name of bank, inception year of bank, category of bank and to get knowledge about
business intelligence used in banking by framing various questions related to practices followed for implementation of business intelligence solutions in bank.
Implementation of business intelligence solutions in banks with the practices followed were categorized in term of organizational factors such as management
commitment, effective steering committee, user initiative, availability of IT skills, analyst and training facilities, work culture, qualities of BI staff and
implementation consultant, and partnership between IT and business, financial factor like availability of funds, and technological factors such as data quality,
quality of ETL tools, complexity of BI solutions, data warehouse update time, responses to queries and implementation of core banking solution, ERP, CRM and
SCM. Banks which were established in 1994 and thereafter considered as new banks while banks which were established before 1994 were considered old
banks. Public Sector Banks means any Government Sector Bank/Institute that goes public i.e. it issues its shares to general public. It also has a greater share of
Government of India or Reserve Bank of India (more than 50%).
Responses were collected from IT Manager/Branch Head of the various banks on the various items. The respondents indicated the extent to which they attach
importance on various factors while implementing and utilizing business intelligence in day to day and long term decision making.
ANALYSIS OF BUSINESS INTELLIGENCE STATUS AT BRANCH The status of business intelligence in respondents’ bank at branch level is assessed by collecting data from the part I of section B. In this section, various question
related to status of business intelligence have been asked to the respondents including information technology uses, categories of BI tools used, and access of
BI at branch level as operational BI.
INFORMATION TECHNOLOGY’S USAGE Information technologies used by the respondent banks is consolidated in the Table 2. As revealed in Table 2, an Internet usage in the banks is 65% at frequency
of low level and 20% at higher frequency. Intranet applications are used by private and foreign banks at 75% (as High) compared to public sector banks 41.7%
(as High). Public sector bank used intranet 58.3% (as Moderate). The decision support system is being used 62.5% (as Moderate) compared to 50% by public
sector banks.
TABLE 2: INFORMATION TECHNOLOGY’S USAGE AT BRANCHES
Criteria Public Private & Foreign Total
% within Category N % N % N %
Internet
Low 9 75 4 50 13 65
Moderate 2 16.7 1 12.5 3 15
High 1 8.3 3 37.5 4 20
Intranet
Low 0 0 0 0 0 0
Moderate 7 58.3 2 25 9 45
High 5 41.7 6 75 11 55
Decision Support System (DSS)
Low 4 33.3 1 12.5 5 25
Moderate 6 50 5 62.5 11 55
High 2 16.7 2 25 4 20
Business Intelligence (BI)
Low 6 50 0 0 6 30
Moderate 5 41.7 3 37.5 8 40
High 1 8.3 5 62.5 6 30
Applications based on DSS are not much popular at branch level. Two thirds of the private and foreign banks (62.5%) are using business intelligence at high
frequency where as public sector respondents, are using only 8.3% (as High). But over all, BI is used only 30% as high at branch level which indicates that in
branches whether private or public sector banks, it is not used frequently.

VOLUME NO. 3 (2013), I SSUE NO. 09 (SEPTEMBER
INTERNATIONAL JOURNAL OF RESEARCH IN COMMERCEA Monthly Double-Blind Peer Reviewed (Refereed
CATEGORIES OF BUSINESS INTELLIGENCE TOOLSRespondents from Branches have given their view about the business intelligen
third of banks (65%) including public and private banks are having standard reporting tool and they are using it at High leve
Moderate level. Ad-hoc reporting tool is used 45% at “Moderate”, where as 35% are using at “Low”. The pattern of utilization of Ad
both public and private banks.
Dashboard tool is an essential tool of BI and it gives a graphical view of various key p
But it is surprising that 55% banks does not have dashboard. 83.3% respondents have given their opinion “Not at all” on use o
category. Only 20% in overall banks are using Dashboard. Private and foreign banks’ branches are ahead in using dashboard for monitoring their perfo
FIGURE
Excel is still a supportive tool to get analytics from exported
are having lower use. It is concluded from the responses given by the respondents that private, foreign and public sector b
except the dashboard which is better utilized by private and foreign banks as shown in Fig. 1.
ACCESS OF BUSINESS INTELLIGENCE AT BRANCH LEVELSThe response received to get the response on current available access of business intelligence versus B
There were four blocks given to check the current and should have access to the respondents. It is revealed from the response
access of less than 60% at branch level. Only 30% banks would like to access in 81
private and foreign banks are accessing BI in the range of 61
APPLICABILITY FOR BUSINESS INTELLIGENCEResponses were collected from branch head or operation head of the various banks on the various items by using 5
very poor, 2 = low, 3 = medium, 4 = high and 5 = very high. The respondents indicated the extent to which they atta
It is conceived from the Table 3 that the three applications fraud prevention and detection analysis, fair banking practices
Indicators (KPI) have highest application being utilized by the respondent’s bank with mean 4.2, 3.65 and 3.40 respectively. Fraud prevention an
analysis is highly applicable in present circumstances as every banks is utilizing information technology based automat
0
5
10
15
20
25
30
35
40
45
50
1-40%
EPTEMBER )
INTERNATIONAL JOURNAL OF RESEARCH IN COMMERCE, IT Refereed/Juried) Open Access International e-Journal - Included in the International Serial Directories
http://ijrcm.org.in/
CATEGORIES OF BUSINESS INTELLIGENCE TOOLS Respondents from Branches have given their view about the business intelligence tools like standard reporting, ad-hoc reporting, dashboard, and excel. Two
third of banks (65%) including public and private banks are having standard reporting tool and they are using it at High leve
reporting tool is used 45% at “Moderate”, where as 35% are using at “Low”. The pattern of utilization of Ad
Dashboard tool is an essential tool of BI and it gives a graphical view of various key performance indicators with controlling parameter of operation of branch.
But it is surprising that 55% banks does not have dashboard. 83.3% respondents have given their opinion “Not at all” on use o
erall banks are using Dashboard. Private and foreign banks’ branches are ahead in using dashboard for monitoring their perfo
FIGURE 1: VARIOUS CATEGORIES OF BI TOOLS AT BRANCHES
Excel is still a supportive tool to get analytics from exported transaction data. As per responses, 35% of all banks are using excel as High where as 40% of banks
are having lower use. It is concluded from the responses given by the respondents that private, foreign and public sector b
except the dashboard which is better utilized by private and foreign banks as shown in Fig. 1.
ACCESS OF BUSINESS INTELLIGENCE AT BRANCH LEVELS The response received to get the response on current available access of business intelligence versus BI should have at various levels, is depicted in the figure 2.
There were four blocks given to check the current and should have access to the respondents. It is revealed from the response
l. Only 30% banks would like to access in 81-100% bracket. 60% of public sector banks using BI (1
private and foreign banks are accessing BI in the range of 61-80% and 81-100%.
APPLICABILITY FOR BUSINESS INTELLIGENCE ollected from branch head or operation head of the various banks on the various items by using 5-point rating scale of importance, where 1 =
very poor, 2 = low, 3 = medium, 4 = high and 5 = very high. The respondents indicated the extent to which they attach importance on various applications.
FIGURE 2: ACCESS OF BI AT VARIOUS LEVELS
It is conceived from the Table 3 that the three applications fraud prevention and detection analysis, fair banking practices
ve highest application being utilized by the respondent’s bank with mean 4.2, 3.65 and 3.40 respectively. Fraud prevention an
analysis is highly applicable in present circumstances as every banks is utilizing information technology based automated system.
3535
20
10
0
25
45
30
40% 41-60% 61-80% 81-100%
Current
ISSN 2231-5756
, IT & MANAGEMENT Included in the International Serial Directories
68
hoc reporting, dashboard, and excel. Two
third of banks (65%) including public and private banks are having standard reporting tool and they are using it at High level where as 35% are using it at
reporting tool is used 45% at “Moderate”, where as 35% are using at “Low”. The pattern of utilization of Ad-hoc reporting is similar in
erformance indicators with controlling parameter of operation of branch.
But it is surprising that 55% banks does not have dashboard. 83.3% respondents have given their opinion “Not at all” on use of dashboard tool in public sector
erall banks are using Dashboard. Private and foreign banks’ branches are ahead in using dashboard for monitoring their performance.
transaction data. As per responses, 35% of all banks are using excel as High where as 40% of banks
are having lower use. It is concluded from the responses given by the respondents that private, foreign and public sector banks are equally utilizing the BI tools
I should have at various levels, is depicted in the figure 2.
There were four blocks given to check the current and should have access to the respondents. It is revealed from the responses that 70% of banks are having
100% bracket. 60% of public sector banks using BI (1-40% range) while 75%
point rating scale of importance, where 1 =
ch importance on various applications.
It is conceived from the Table 3 that the three applications fraud prevention and detection analysis, fair banking practices analysis and Key Performance
ve highest application being utilized by the respondent’s bank with mean 4.2, 3.65 and 3.40 respectively. Fraud prevention and detection
ed system.

VOLUME NO. 3 (2013), I SSUE NO. 09 (SEPTEMBER ) ISSN 2231-5756
INTERNATIONAL JOURNAL OF RESEARCH IN COMMERCE, IT & MANAGEMENT A Monthly Double-Blind Peer Reviewed (Refereed/Juried) Open Access International e-Journal - Included in the International Serial Directories
http://ijrcm.org.in/
69
TABLE 3: DESCRIPTIVE STATISTICS OF APPLICATIONS USED AT BRANCH
Applications Mean Score* Std. Deviation C.V. (Percent) Result @5%
Fraud Prevention 4.20 0.70 16.57 NS
Fair Banking 3.65 0.88 23.98 S
KPI 3.40 1.23 36.21 NS
Branch Profitability 3.35 1.14 33.93 NS
Account Profitability 3.30 1.17 35.58 NS
Collection Recoveries 3.30 0.86 26.20 NS
Segmentation 3.25 1.07 32.92 NS
Individual Profitability 3.05 1.10 36.03 NS
Cross Sell 3.05 0.94 30.97 NS
Attrition Analysis 3.00 1.30 43.26 NS
Channel efficiency 2.75 1.33 48.46 NS
Product Profitability 2.50 1.24 49.42 NS
Operational Analytics 2.20 1.58 71.64 NS
Campaign Analysis 1.05 1.43 136.36 S
* Mean score is the average on 5-point interval scale of importance
S=Mean importance score is significantly greater than that listed immediately below, based on t test
NS=Mean importance score is not significantly greater than that listed immediately below, based on t test
Campaign analysis application with mean score 1.05 was considered least applicable by respondents. Reason of lower applicability of Campaign analysis is least
used at branch level. Fraud prevention (CV=16.57%) applications has lowest variation in response, which means that the responses are consistent and therefore
mean score can be considered highly representative where as Campaign analysis has highest variation (CV=136.36%), which means that responses varied greatly
and it can be said that mean score is least representative. Further, One-Sample Kolmogorov-Smirnov test for significance shows that the result of the One-
Sample Kolmogorov-Smirnov test is significant for fair banking and campaign analysis.
FINANCIAL BENEFITS OF BUSINESS INTELLIGENCE It is clear from the Table 4 that the execution of regulatory compliances is highest benefit perceived by the respondents with mean 3.45. Financial benefits in
term of cost reduction is with mean score 2.55 has considered least applicable by respondents. Reason of lower response might be due to public sector banks
which do not give much importance to cost reduction.
TABLE 4: DESCRIPTIVE STATISTICS OF FINANCIAL BENEFITS OF BI AT BRANCH
Financial Benefits Mean Score* Std. Deviation C.V. (Percent) Result @5%
Execution Compliance 3.45 1.05 30.44 S
Revenue Growth 2.95 1.19 40.37 NS
Competitive Advantage 2.95 1.05 35.60 NS
Budget Control 2.65 1.14 42.89 NS
Cost reduction 2.55 1.19 46.70 NS
* Mean score is the average on 5-point interval scale of importance
S=Mean importance score is significantly greater than that listed immediately below, based on t test
NS=Mean importance score is not significantly greater than that listed immediately below, based on t test
Execution of regulatory compliance (CV=30.44%) has lowest variation in response, which means that the responses are consistent and therefore mean score can
be considered highly representative where as cost reduction has highest variation (CV=46.70%), which means that responses varied greatly and it can be said
that mean score is least representative. All results are of One-Sample Kolmogorov-Smirnov test show that all factors which delivered financial benefits are non
significant except execution compliances.
FINDING AND CONCLUSION BUSINESS INTELLIGENCE STATUS AT BRANCHES OF SELECTED BANKS
• Internet usage by the respondents of public sector banks at “Low” frequency is 75% and private and foreign banks is 50%. But an Internet usage at “High”
frequency is 37.5% by private and foreign banks in comparison to 8.3% public sector banks. Overall only 20% respondents are using internet as “High”.
• Three forth (75%) of private and foreign banks respondent and 41.7% from public and private banks confirm about the intranet usage at “High” frequency.
In over all, 55% usage of intranet at “High” and 45% at “Moderate” level.
• Almost two third (62.57%) from private and foreign and 50% from public sector banks respondent is habituating Decision Support System at moderate
frequency. 25% of private and foreign bank respondent is utilizing DSS at High frequency in compare to 16.7% of public sector banks.
• Business intelligence is used 30% as “High” and “Low” each and 40% as “Moderate” by respondent managers. In public sector category, only 8.3% is at
“High” and 41.7% at “Moderate” where as in private bank category, 62.5% is used at “High” and 37.5% at “Moderate” by the respondents.
• Business intelligence is underutilized. The banks have significant opportunities to increase the use of business intelligence technology to support critical
decision-making and operations.
• All banks including public and private banks are having standard reporting tool implemented as reported by respondents. 65% respondents are using as
“High” and 35% as “Moderate”.
• 15% Ad-hoc Reporting tool is used by respondents as “High”, 45% as ”Moderate”, 35% as “Low”. 5% respondents does not use ad-hoc reporting tool.
• Dashboard tools do not posses by 83.3% public sector banks and 12.5% private and foreign banks. In public sector banks, only 16.7% banks are using
dashboard as “Low” frequency compare to 50% as “High” by private and foreign banks. Overall, 55% respondents does not have dashboard tool
implemented.
• 35% respondents are employing Excel based analytics at “High” frequency where as 20% at “Moderate”, 40% at “Low” frequency. 5% respondents do not
use excel based analytics.
• Only 10% of respondents’ bank is practicing of business intelligence in 81-100% group. 20% in 61-80%, 35% in each 41-60% and 1-40% respondents have
access of business intelligence at branch level as operational BI. Respondent suggests, BI access should be 30% in 81-100% group, 25% in 41-60% and 45%
in 61-80% at branch.

VOLUME NO. 3 (2013), I SSUE NO. 09 (SEPTEMBER ) ISSN 2231-5756
INTERNATIONAL JOURNAL OF RESEARCH IN COMMERCE, IT & MANAGEMENT A Monthly Double-Blind Peer Reviewed (Refereed/Juried) Open Access International e-Journal - Included in the International Serial Directories
http://ijrcm.org.in/
70
APPLICABILITY OF BI AT BANK’S BRANCH • Two applications fraud prevention and detection analysis and Key Performance Indicators (KPI) analysis are highest application being utilized by the
respondent’s bank.
• Branch, account and individual profitability, collection recoveries, segmentation, and cross sell analysis are other applications which is being used by
respondent’s bank.
• Fraud prevention, Fair banking and KPI are applications given higher importance.
• Execution of regulatory compliances is highest benefit perceived by the respondents with mean score 3.45.
• Financial benefits in term of cost reduction are considered least applicable by respondents.
• Execution of regulatory compliance and competitive advantage has lowest variation in response, which means that the responses are consistent and
therefore mean score can be considered highly representative.
• All factors which delivered financial benefits are non significant except execution compliance.
SUGGESTIONS FOR IMPROVEMENT TO REAP THE BENEFITS OF BI SOLUTIONS Despite the implementation of sophisticated information technology infrastructure, a level of satisfaction out of delivered information is relatively low. Business
Intelligence solution make up a complex solution that allows meeting such needs and fills the information gap by creating intelligent enterprise. To achieve
improvement in the implementation of business intelligence solution at branches of banks, it is worthwhile to consider the following suggestions:
SUGGESTIONS TO BRANCHES OF THE BANKS AND RESPONDENT MANAGERS INCLUDEs; • Branches should utilize various BI tools other than core banking system (CBS).
• Branches should also utilize intranet based applications for knowledge sharing.
• Performance management analytics usage in terms of branch and employees should be increased which is under utilized as of now.
• Branches should increase its business intelligence penetration towards operational BI and tactical level, which is currently at strategic level only.
• It is found during data collection that branch heads are not having any schedule of working on analytics. It is suggested that Branch manager/Operation
head at branch should make a weekly and monthly schedule of doing analytics based on the customer data available with core banking system for their
city.
• It is suggested that branches should perform analytics for customer profitability (at least account type and branch wise), channel efficiency analysis for
various channels like branch, ATM, Internet, Mobile etc., customer segmentation for better cross sell and up sell of the products, customer churning
analysis to retain good customer and increase their loyalty, and product profitability to increase sale of more profitable products.
• Braches should also perform anti-money laundering analysis to check the suspicious transactions, which is a regulatory requirement too.
• Branches should make Non-performing asset analysis on regular basis along with collection recovery analytics to reduce NPA.
• Branches should also make fair banking analysis which is also a regulatory requirement.
• Branch manager should use dashboard to see the key performance indicators of their branch on continuous basis to monitor and control the branch
operation.
• With discussion held with branch manager during data collection, it is found that branch heads are lacking the knowledge and power of analytics. It is
suggested that branches should conduct regular orientation and training programs about importance of business analytics for their employees. These
programs should be conducted at least once in six months.
• Branches should also conduct some motivational and recreational programs on half yearly basis to break the monotony of job and rejuvenate them to
perform better.
REFERENCES 1. Bach Mirjana Pejic, Ivan Strugar, and Bozidor Jakovic, (2007), “Influence of Business Intelligence Implementation to the Banks’ Performance: Case study of
Croatian Banking Sector”, Faculty of Economics and Business, University of Zagreb, p.1-6.
2. Eckerson Wayne W., (2006), “Performance Dashboards: Measuring, Monitoring, and Managing Your Business”, John Wiley & Sons, Inc., p.45, p.48.
3. IBA-Finsight, (2007) “Operational Business Intelligence in Banking”, Special Report by IBA and Finsight, Finsight Media, p.9-1.
4. IDBI, (2001), http://www.sas.com/offices/asiapacific/india/success-stories/IDBI-Bank-uses-SAS-Credit-Risk-Management-Solution-to-measure-manage-
and-mitigate-credit-risk.html accessed on 1st March, 2011
5. Kalakota, R. and Robinson, M., (2001), “e-Business 2.0: roadmap for success”, Addison-Wesley, Boston, p.161.
6. Khan Azimuddin and Saxena Karunesh, (2011), “Banking@ Speed of Information Technology: The Business intelligence Imperative”, Vinimaya Journal,
National Institute of Bank Management, Pune, Vol. XXXII No.2, July-September.
7. MNYL, (2011), http://www.sas.com/offices/asiapacific/india/success-stories/mnylindia.html accessed on 1st March, 2011.
8. Morris Henry, Karen Moser, Dan Vesset, Robert Blumstein, Per Andersen, Nathaniel Martinez, Stephen D. Graham, and Marilyn Carr, (2002), “The Financial
Impact of Business Analytics”, IDC, MA, USA, p.6.
9. Nadeem Muhammad and Jaffri Syed Ata Hussain, (2004), “Application of Business Intelligence in Banks (Pakistan)”, SZABIST,
http://arxiv.org/abs/cs/0406004, Karachi, Pakistan, p.1-6.
10. Williams Steve and Williams Nancy, (2003), “The Business Value of Business Intelligence”, Business Intelligence Journal, Fall, p.4.

VOLUME NO. 3 (2013), I SSUE NO. 09 (SEPTEMBER ) ISSN 2231-5756
INTERNATIONAL JOURNAL OF RESEARCH IN COMMERCE, IT & MANAGEMENT A Monthly Double-Blind Peer Reviewed (Refereed/Juried) Open Access International e-Journal - Included in the International Serial Directories
http://ijrcm.org.in/
71
A STUDY ON USAGE OF GEOSPATIAL TECHNOLOGIES IN POWER UTILITY
VARUN PRAKASH
RESEARCH SCHOLAR, ICFAI UNIVERSITY, RANCHI
MANAGER
BSES RAJDHANI POWER LTD.
NEW DELHI
ABSTRACT Electricity Act 2002 was land mark in history of Indian Power sector, which paved the way for unbundling of power sector into Discoms and also led to
participation of private players in all three phases i.e.; generation, transmission and distribution of this sector. The power utilities since then has travelled long
journey from a just hardcore ‘sarkari’ govt organisation to now being slowly transformed to service industry. The power utilities since being service provide to
consumers/citizens has adopted various innovative technologies which has enabled them to provide better and faster service; one such technology is GeoSpatial
Technology. Still not all power utilities has adopted these technologies but still paper investigates the usage pattern , their problems related to usage and know
how of Geospatial Technologies in one such power utility through discussions and unstructured interviews of the focussed group executives. The study can be of
great help and learning for other utilities to define their strategy in rectification of problems of user departments and make use of this technology in full fledges
scale. The study will also help the utilities who are just in nascent stage of implementation of GIS, as they can link the same with users right from the start of the
project.
KEYWORDS power utility, GeoSpatial, users.
INTRODUCTION ikipedia defines GIS as geographic information system (GIS) is a system designed to capture, store, manipulate, analyze, manage, and present all
types of geographical data. The acronym GIS is sometimes used for geographical information science or geospatial information studies to refer to
the academic discipline or career of working with geographic information systems and is a large domain within the broader academic discipline
of Geoinformatics. In the simplest terms, GIS is the merging of cartography, statistical analysis, and computer science technology.
This geographically referenced database in recent times has been of great aiding tool in improving of electrical utility performance, better planning and
improving efficiency of various departments by adoption of this technology.
Geospatial technologies in last couple of years have seen exemplary application in utilities especially power sector. The importance of these was also felt by
government of India and which was seen as the initiative of the Government of India and of the States, as the Accelerated Power Development & Reform
Programme (APDRP) was launched in 2001, for the strengthening of Sub Transmission and Distribution network and reduction in AT&C losses.
The main objective of the programme was to bring Aggregate Technical & Commercial (AT&C) losses below 15% in five years in urban and in high-density areas.
The scheme comprises of two parts-Part-A & Part-B.
Part-A of the Restructured-APDRP Scheme relating to base line data for Consumer Indexing, Geographical Information System (GIS) Mapping, Metering of
Distribution Transformers (DTR’s) and Feeders, and Automatic Data Logging for all Distribution Transformers and Feeders. It would also include adoption of IT
applications for Meter Reading, Billing and Collection, Energy Accounting/Auditing., management Information System (MIS), redressal of consumer service
centers and IT base consumer centers etc. [5]
The study basically tries to investigate in details the usage pattern of GeoSpatial technologies among the user departments in power utility. The study aims at
motivation of user in using this new emerging technology and find out how geospatial technologies helps the user in decision making. The paper also tries to find
the various problems which limits the usage of GIS to user departments and which can be taken up to maximise the usage and thus help the utility in improving
efficiency.
LITERATURE REVIEW Clarke, K. C., 1986 defines GIS is a information system that integrates, stores, edits, analyzes, shares, and displays geographic information for informing decision
making. GIS applications are tools that allow users to create interactive queries (user-created searches), analyze spatial information, edit data in maps, and
present the results of all these operations.
Dr.Rajani Mishra, Praveen Shukla,(2011),investigates use of e-resources by research scholars of Institute of Technology , Banaras Hindu University deals with the
use of e-resources by the research scholars and to determine the extent to which research scholars of Institute of Technology, Banaras Hindu University (India)
are aware and make use of e resources, to highlight the problems faced by them in accessing e-resources, their views on usefulness of e-resources compared to
that of print resources and the place from where they prefer to access information.
Pramod Pathak & Govind Swaroop Pathak, ‘Behavioural issues in accidents : A study of Coal Mines ‘ The present research endeavour is designed to get insights
into the various causes of accidents in coal mines, as perceived by executives working in a coal mining organization.
Tarak Shah(2006) discusses on use of IT and geo spatial technologies taking Gujarat electricity board as case study , and also discusses various reforms which has
led to decrease in losses and increase in revenue for the state government
Nandan Nilekani, ‘IT Task Force Report for Power Sector’, stressed on usage of by various SEBs to provide unified view of spatial (geographical) and a spatial
(asset attributes) information for enhancing operations management .
OBJECTIVES The objective of study is as follows:
• To find frequency of use of GIS by user Depts.
• To Study user requirements from GIS and how they take GIS inputs in their decision making.
• Problems faced by utility users for GIS Usage.
W

VOLUME NO. 3 (2013), I SSUE NO. 09 (SEPTEMBER ) ISSN 2231-5756
INTERNATIONAL JOURNAL OF RESEARCH IN COMMERCE, IT & MANAGEMENT A Monthly Double-Blind Peer Reviewed (Refereed/Juried) Open Access International e-Journal - Included in the International Serial Directories
http://ijrcm.org.in/
72
METHODOLOGY The user departments of GIS in utility are shown in fig below.
FIG. 1.1
SAMPLE
The sample consisted 30 executives working in different departments of the utility.
SAMPLING METHOD AND PLAN
The method of sampling adopted for this study was ‘Purposive Sampling’, owing to the specific nature of research problem under investigation. The subjects
constitute executives who were participants in 4 days program of Application of GeoSpatial Technologies for utilities at one of the certified training Centres of
Ministry of Power in National Capital Region. Among these, the executives who voluntarily agreed to participate comprise our sample.
PROCEDURE
The data was collected by ‘a dual-moderator focus group interview’ (Malhotra, 2001). A focus group is an interview conducted by a trained moderator(s) in a
non structured and natural manner with a small group of respondents. The moderator leads the discussion. During the discussion the participants were asked
question and their views and experience on usage of the technology were taken. Some of the taken in the discussion and findings later. The main purpose of
focus groups is to gain insights by listening to a group of people from the appropriate target market talk about issues of interest to the researcher.
The value of the technique lies in the unexpected findings often obtained from a free flowing group discussion (for details, one may refer to Malhotra, 2001,
Morgan, 1997).
Focus groups are the most important qualitative research procedure. They are so popular that many marketing research practitioners consider this technique
synonymous with qualitative research (Garee & Schori, 1997).A focus group generally includes 8 to 12 member (Dachler, 1997; Fern, 1982). A focus group should
be synonymous in terms of demographic and socioeconomic characteristics. Commonality among group members avoids interactions and conflicts among group
members on side issues (Nelson &Fruitcake, 1988).
DATA ANALYSIS & INTERPRETATION The data was collected during the interview were analyzed and presented in form of tables and figures illustrated below.
KNOWLEDGE ABOUT GIS
Through focus group interviews user departments were asked about they were aware about what is GIS, its capabilities and activities etc.
TABLE 1: KNOWLEDGE OF GIS
SL PARTICULARS PARTICIPANTS(30) PERCENTAGE
1 Basic Awareness of GIS 27 90
2 Knowledge of custom Applications 15 50
3 In Depth Knowledge of GIS Applications in their area of interest. 6 20
FIGURE 1.1 KNOWLEDGE OF GIS
GIS KNOW HOW
90
50
20
0
20
40
60
80
100
Basic Awarness of GIS Knowledge of customApplications
In Depth Knowledge ofGIS Applications in their
area of interest.
PERCENTAGE

VOLUME NO. 3 (2013), I SSUE NO. 09 (SEPTEMBER ) ISSN 2231-5756
INTERNATIONAL JOURNAL OF RESEARCH IN COMMERCE, IT & MANAGEMENT A Monthly Double-Blind Peer Reviewed (Refereed/Juried) Open Access International e-Journal - Included in the International Serial Directories
http://ijrcm.org.in/
73
The graph clearly depicts that most of the user departments (90%) are aware about GIS, also 50 % of the user have knowledge of Custom Applications of GIS and
applications. But very less of the users (20%) are not aware powerful capability of GIS technology. So, there is needed to make use the user departments more
aware about GIS technologies usefulness for their day to day work and their area of interest.
FREQUENCY OF USE OF GIS
This is basically to study how frequently the user uses GIS data in any form, the pattern of usage was studied.
Most of the users use GIS data either monthly or occasionally. Daily usage of GIS data by the user is still very limited.
TABLE 2: FREQUENCY OF GIS DATA USAGE
FREQUENCY PARTICIPANTS(30) PERECENTAGE
DAILY 12 40
WEEKLY 18 60
MONTHLY 27 90
OCCASIONALLY 30 100
FIG 2: FREQUENCY OF GIS DATA USAGE
WHAT USER WANT MOST FROM GIS
The study tries to find out for what all different purpose User Departments needs GIS data. The study revealed that electrical network information is one of the
biggest information which users demand from GIS. With Delhi Geo-Spatial Data Infrastructure Act, 2011 coming into place , demand of GIS Maps mostly in pdf
format and also increased by users as they need to attach with the schemes they prepare.
Use of GIS Reports is less; the main factor accounting to this is that user wants reports with dynamic attributes, some of problems discussed in next section
mainly accounts for this.
TABLE-3: USAGE OF GIS DATA FOR DIFFERENT INFORMATION
SL NO What User want most from GIS DESCRIPTION PARTICIPANTS(30) %
1 Spatial View of Assets Location of DT/SSTN, Feeder etc 30 100
2 GIS Based Utility Reports Reports Published by GIS 18 60
3 Need For Maps Pdf/Print Out 24 80
4 Electrical Network Information SLDs, DT/Feeder etc Info 27 90
5 Location of Utility Buildings Nearest Complaint Centre, Cash Office 26 86.7
FIG. 3: USAGE OF GIS DATA FOR DIFFERENT INFORMATION
METHODS OF ACCESS OF GIS INFORMATION
In the Last section we discussed about different types of user information which user needs from GIS. Here the study tries to find out different ways through
which user access GIS data for their requirements. The study revealed contacting GIS Dept either by mail or call is most prevalent way to get the required
information which user needs. Access of Utility Intranet website is other major means of accessing information. The study clearly depicts usage of GIS website is
not very popular among users.
FREQUENCY OF GIS DATA USAGE
40
60
90100
0
20
40
60
80
100
120
DAILY WEEKLY MONTHLY OCCASIONALLY
PERCENTAGE
100
60
8090 86.66666667
0
20
40
60
80
100
120
Spatial Viewof Assets
GIS BasedUtility Reports
Need ForMaps
ElectricalNetwork
Information
Location ofUtility
Buildings
PERCENTAGE

VOLUME NO. 3 (2013), I SSUE NO. 09 (SEPTEMBER ) ISSN 2231-5756
INTERNATIONAL JOURNAL OF RESEARCH IN COMMERCE, IT & MANAGEMENT A Monthly Double-Blind Peer Reviewed (Refereed/Juried) Open Access International e-Journal - Included in the International Serial Directories
http://ijrcm.org.in/
74
TABLE 4: METHODS OF ACCESS OF GIS INFORMATION
ACCESS METHODS PARTICIPANTS(30) PERCENTAGE
Directly Call/Mail GIS Dept 27 90
Utility Intranet Website 24 80
Utility- GIS Website 15 50
FIG. 4: METHODS OF ACCESS OF GIS INFORMATION
HINDRANCES IN WIDESPREAD USAGE OF GIS
The study analysed various problem encountered by the users which limits the usage of GIS in the organisation. The retrieval speed of GIS web and is not very
interactive nature is one of major limitation which limits the usage of GIS. Other important factor is user specific information which user cannot get mainly due
to various factors like non integration with other modules like SCADA, SAP, and OMS etc. The study also stressed on improvement of IT Infrastructure like user
PC configuration i.e.; hardware and LAN Connectivity.
TABLE 5: HINDRANCES IN WIDESPREAD USAGE OF GIS
Causes PARTICIPANTS(30) PERCENTAGE
Slow LAN Connectivity 18 60
Low Configuration User PC 15 50
Slow Speed of GIS Website 21 70
GIS website not very User Interactive 12 40
Specific User Requirement not Available 18 60
Use of IT as work culture in Utility 12 40
FIG 5: HINDRANCES IN WIDESPREAD USAGE OF GIS
RESULTS & FINDINGS The major findings of the study are as follows:
� Most of the user knows about GIS, but still awareness among about advanced application of this technology and how they can use for their day-day work.
� The utility management should focus on increasing frequency of usage of GIS as still most of the user uses it either occasionally /monthly or weekly. Very
less user uses it daily.
� GIS data bank has enough information which user want which can be revealed, as 90% user want network related information from GIS and 80 % needs
maps for various purposes. GIS Database has great demand among the users.
9080
50
0102030405060708090
Directly Call/MailGIS Dept
Utility IntranetWebsite
Utility- GISWebsite
ACCESS OF GIS DATA
PERCENTAGE
60
50
70
40
60
40
0
10
20
30
40
50
60
70
80
Slo
w L
AN
Con
nect
ivity
Low
Con
figur
atio
nU
ser P
C
Slo
w S
peed
of G
ISW
ebsi
te
GIS
web
site
not v
ery
Use
rIn
tera
ctiv
e
Spe
cific
Use
rR
equi
rem
ent
not A
vaila
ble
Use
of I
T a
sw
ork
cultu
rein
Util
ity

VOLUME NO. 3 (2013), I SSUE NO. 09 (SEPTEMBER ) ISSN 2231-5756
INTERNATIONAL JOURNAL OF RESEARCH IN COMMERCE, IT & MANAGEMENT A Monthly Double-Blind Peer Reviewed (Refereed/Juried) Open Access International e-Journal - Included in the International Serial Directories
http://ijrcm.org.in/
75
� The finding revealed access of GIS information in the organisation is still primitive as 90% user contact GIS dept for their requirements. The need is make
the user more used to utility GIS website and does GIS analysis independently.
� Utility needs to address some IT infrastructure related issues in order to increase user level and their dependency on GIS.
CONCLUSION & FUTURE SCOPE The study revealed that users in various departments in the power utility are keen in using GeoSpatial technologies especially among young peers. The GIS
Database has been appreciated and the participants found it very useful in taking key decisions. The management of the utility should focus on addressing the
issues which has been found in the study. The study can also help other utilities of different states that are in stage of implementation of GIS and take the key
learning from the finding in the research study.
Since the study which was conducted on focussed group though discussion and unstructured natural way of interview, the research in the level can be carried
out based on Quantitative Analysis of research, and paves the way for next advanced research ‘ Road Ahead - Successful Implementation of Geospatial
technologies in utility’
GLOSSARY
GIS- Geographical Information System
SCADA- Supervisory Control & Data Acquisition System
OMS – Outage Management System
DT- Distribution Transformer
SLD- Single Line Diagram
SSTN- Sub Station
LAN- Local Area Network
EHV – Extra High Voltage
IT- Information Technology
REFERENCES 1. Clarke, K. C., 1986. Advances in geographic information systems, computers, environment and urban systems, Vol. 10, pp. 175–184.
2. Dr.Rajani Mishra, Praveen Shukla,’ Use of E-resources by research scholars of Inititute of Technology,Banaras Hindu University, India’, Researchers World,
3. Garee, Michael, L., & Schori, Thomas, R. (1997). ‘Focus Groups illuminate Quantitative Research’. Marketing News. Vol. 31 (12), p. 25.
4. Malhotra, Naresh. (2001). Marketing Research: An Applied Orientation, 3rd Edition, 1st Indian Reprint. Delhi, India: Addison Wesley Longman (Singapore).
5. Ministry of Power Reports, Government of India.
6. Nanadan Nilekani ‘IT Task force report for Power Sector’.
7. Nelson, J.E., & Frontczak, N. (1988) How Acquaintanceship and Analyst can influence Focus Group Results. Journal of Advertising, Vol 17 (1), p. 41 – 48.
8. Pramod Pathak & Govind Swaroop Pathak. ‘Behavioural issues in accidents : A study of Coal Mines’. Management Insight.
9. Tarak Shah,(2006)’ Gujarat Electricity Board – A Benchmark in the progress of SEB reforms.
WEBSITE
10. http://www.powermin.nic.in/distribution/apdrp/projects/pdf/Order_for_Restructured__APDRP_During_11th_Plan.pdf.

VOLUME NO. 3 (2013), I SSUE NO. 09 (SEPTEMBER ) ISSN 2231-5756
INTERNATIONAL JOURNAL OF RESEARCH IN COMMERCE, IT & MANAGEMENT A Monthly Double-Blind Peer Reviewed (Refereed/Juried) Open Access International e-Journal - Included in the International Serial Directories
http://ijrcm.org.in/
76
AN IMPROVED INVISIBLE WATERMARKING TECHNIQUE FOR IMAGE AUTHENTICATION
DASU VAMAN RAVI PRASAD
ASSOCIATE PROFESSOR
ANURAG GROUP OF INSTITUTIONS
VENKATAPUR (V)
ABSTRACT Digital Watermarking is a technique which embeds a watermark signal into the host image in order to authenticate it. In their previous work, a binary watermark
pattern was constructed from the information content of the image by selecting the minimum value from every block of size 2x2, and was disordered with the
help of Arnold Transform but which was not showing a fine robustness against compression and rotation operation. As a solution to this issue, an innovative
watermarking scheme is proposed. According to this, the low frequency sub-band of wavelet domain and the rescaled version of original image are utilized in the
watermark construction process. A scrambled version of watermark is obtained with the help of Arnold Transform. The operation of embedding and extraction of
watermark is done in high frequency domain of Discrete Wavelet Transform since small modifications in this domain are not perceived by human eyes. This
watermarking scheme deals with the extraction of the watermark information in the absence of original image, hence the blind scheme was obtained. Peak
Signal to Noise Ratio (PSNR) and Similarity Ratio (SR) are computed to measure image quality. In addition, the competency of the proposed method is verified
under common image processing operations and a comparative study is made against the previous technique.
KEYWORDS Robust watermarking, Discrete Wavelet Transform, Arnold Transform, Image Authentication, Content based watermarking.
1. INTRODUCTION he internet is an excellent distribution system for the digital media because of itsinexpensiveness and efficiency. Also the images can be readily shared,
easily used, processedand transmitted which causes serious problems such as unauthorized use and manipulation ofdigital content. As a result, there is
the need for authentication techniques to secure digitalimages. Digital watermarking is a technique which embeds additional information calleddigital
signature or watermark into the digital content in order to secure it. A watermark is a hidden signal added to images that can be detected or extracted later to
make someaffirmation about the host image.
The major point of digital watermarking is to find the balance among the aspects such asrobustness to various attacks, security and invisibility. The invisibleness
of watermarkingtechnique is based on the intensity of embedding watermark. Better invisibleness is achievedfor less intensity watermark. So we must select the
optimum intensity to embed watermark. Ingeneral there is a little tradeoff between the embedding strength (the watermark robustness)and quality (the
watermark invisibility). Increased robustness requires a stronger embedding,which in turn increases the visual degradation of the images. For a watermark to be
effective, it should satisfy the following features. They are:
Imperceptibility - It should be perceptually invisible so that data quality is notdegraded and attackers are prevented from finding and deleting it. A watermark
iscalled imperceptible if the watermarked content is perceptually equivalent to the original, un-watermarked content
• Readily Extractable - The data owner or an independent control authority shouldeasily extract it.
• Unambiguous - The watermark retrieval should unambiguously identify the dataowner.
• Robustness - It should tolerate some of the common image processing attacks. Awatermark is called robust if it resists a designated class of
transformations.Robust watermarks may be used in copyright protection applications to carrycopy and access control information.
The digital image watermarking scheme can be divided into two categories. They arevisible digital image watermarking and invisible image watermarking
techniques. In visiblewatermarking, the information is visible in the picture or video. Typically, the information istext or a logo which identifies the owner of the
original document. In invisible watermarking, information is added as digital data to audio, picture or video, but it cannot be perceived assuch. Further, the
invisible watermarks are categorized into watermarking techniques as fragile and robust. Generally, a robust mark is generally used for copyright protection
andownership identification because they are designed to withstand attacks such as common image processing operations, which attempt to remove or destroy
the mark. These algorithms ensure that the image processing operations do not erase the embedded watermark signal. On the other hand a fragile or semi-
fragile watermark are mainly applied to content authentication and integrity verification because they are very sensitive to attacks, i.e., it candetect slight
changes to the watermarked image with high probability. This paper deals with a robust watermarking. The commonly used watermarking applications include
copyrightrelated applications, medical forensic and military applications and content authenticationapplications.
Several methods have been proposed in literature [2]. Two categories of Digital watermarking algorithms are spatial-domain techniques and frequency-domain
techniques. Least Significant Bit (LSB) is the simplest technique in the spatial domain techniques [3] which directly modifies the intensities of some selected
pixels. The frequencydomain technique transforms an image into a set of frequency domain coefficients [4]. Thetransformation adopted may be discrete cosine
transform (DCT), discrete Fourier transforms(DFT) and discrete wavelet transforms (DWT) etc. After applying transformation, watermarkis embedded in the
transformed coefficients of the image such that watermark is not visible.Finally, the watermarked image is obtained by acquiring inverse transformation of
thecoefficients.
In feature based watermarking scheme, watermark is generated by applying someoperations on the pixel value of host image rather than taking from external
source. Recentresearches on secure digital watermarking techniques have revealed the fact that the content of the images could be used to improve the
invisibility and the robustness of a watermarking scheme [5]. In the proposed watermarking scheme, watermark is created from the content ofthe host image
and discrete wavelet transform (DWT) is used for embedding watermarks,since it is an excellent time-frequency analysis method, which can be well adapted for
extracting the information content of the image [6]. A detail survey on wavelet basedwatermarking techniques can be found in [7].
To improve the security, Wang et.al [8] adopt a key dependent wavelet transform. To takethe advantage of localization and multiresolution property of the
wavelet transform, Wangand Lin [9] proposed wavelet tree based watermarking algorithm. Tao et al [10]. put forward a discrete. Wavelet transform based
multiple water marking algorithm. The watermark isembedded into LL and HH subbands to improve the robustness. Luo et al [11]. Introduced aninteger
wavelets based watermarking technique to protect the copyright of digital data by utilizing encryption technique to enhance the security.
Yuan et al [12]. proposed an integer wavelet based Multiple logo watermarking scheme.The watermark is permuted using Arnold transform and is embedded by
modifying thecoefficients of the HH and LL subbands. Qiwei et al [13]. put forward a DWT based blindwatermarking scheme by scrambling the watermark using
chaos sequence. Many of thealgorithms proposed meet the imperceptibility requirement quite easily but robustness todifferent image processing attacks is the
key challenge and the algorithms in literatureaddressed only a subset of attacks.
This paper proposes a novel DWT based blind watermarking scheme, in whichwatermark is constructed from the spatial domain and is embedded in the high-
frequencyband. According to this algorithm, a DWT is performed on the host image and values in LL1subband forms the first matrix. The second matrix is
produced by finding average values fromevery 2x2 blocks. Watermark construction process finds the disparity values between thosetwo matrices and is
converted into binary form. The resultant matrix is disordered with thehelp of Arnold Transform. The extraction process is done without using original image
andthe newly developed method is robust against many common image attacks and experimentalresults verify this. The security of the proposed method lies on
the multifaceted procedureused to construct watermark.
T

VOLUME NO. 3 (2013), I SSUE NO. 09 (SEPTEMBER ) ISSN 2231-5756
INTERNATIONAL JOURNAL OF RESEARCH IN COMMERCE, IT & MANAGEMENT A Monthly Double-Blind Peer Reviewed (Refereed/Juried) Open Access International e-Journal - Included in the International Serial Directories
http://ijrcm.org.in/
77
2. RELATED BACKGROUND This section briefly describes the techniques and methods that have been adopted by thewatermarking schemes, including DWT, Scrambling using Arnold
Transform and watermarkconstruction process adopted in our previous watermarking algorithm.
2.1 DISCRETE WAVELET TRANSFORM
The DWT decomposes input image into four components namely LL, HL, LH and HHwhere the first letter corresponds to applying either a low pass frequency
operation or highpass frequency operation to the rows, and the second letter refers to the filter applied to the columns [14], which is shown in Figure 1.
The lowest resolution level LL consists of the approximation part of the original image.The remaining three resolution levels consist of the detail parts and give
the vertical high(LH), horizontal high (HL) and high (HH) frequencies. In the proposed algorithm, watermarkis embedded into the host image by modifying the
coefficients of high-frequency bands i.e.HH subband.
For a one level decomposition, the discrete two-dimensional wavelet transform of the image function f(x, y) can be written as
where is a low pass scaling function and is the associated band pass waveletfunction.
2.2 ARNOLD TRANSFORM
A digital image can be considered as a two unit function f(x,y) in the plane Z. It can berepresented as Z = f(x, y) where x, y belongs to {0,1,2,3....N −1} and N
represents order of digital image.The image matrix can be changed into a new matrix by the Arnold transform which results ina scrambled version to offer
security. It is a mapping function which changes a point (x, y) toanother point (x1, y1) by the equation (1).
2.3 OVERVIEW OF PREVIOUS METHOD
This section briefly describes about the watermarking generation algorithm of our previous work [1]. The watermark is generated from the spatial domain
information by performing the steps mentioned below.
• The original image X of size M x N is partitioned into non-overlapping blocks of size 2 x 2.
• Compute minimum value from each block and construct a matrix Mb (p, q), where p ∈ {1,2,3....M / 2} and q∈ {1,2,3....N / 2}.
• Find median value Md for the elements in Mb (p, q).
• Perform Arnold transform for three times on Mb (p, q) to scramble the elements and obtain matrix Ms (p, q).
• Form the watermark pattern to be embedded into original image as
• For a M x N image, a watermark pattern of size M/2 x N/2 is generated.
Example: Consider the input matrix of size 8x8
The matrix constructed by picking smallest element from every 2x2 block of original matrix is
After the application of Arnold transform the scrambled version of the matrix is
The median value obtained for the elements in Ms is 2. According to the constraint (2), the binary watermark pattern constructed is
In this method, watermark is generated by performing some operations on image pixels rather than taking from external source, hence the name content based
watermark. This watermark is embedded in the HH1 subband of original image and the resultant image is called watermarked image. This embedded watermark
is extracted in detection phase, and is compared with the calculated watermark to decide authenticity.

VOLUME NO. 3 (2013), I SSUE NO. 09 (SEPTEMBER ) ISSN 2231-5756
INTERNATIONAL JOURNAL OF RESEARCH IN COMMERCE, IT & MANAGEMENT A Monthly Double-Blind Peer Reviewed (Refereed/Juried) Open Access International e-Journal - Included in the International Serial Directories
http://ijrcm.org.in/
78
3. PROPOSED METHOD In the proposed scheme, there are three significant phases: Watermark generation, Watermark embedding and Watermark Detection. The watermark is
generated from pixel value of original image and so there is no need of external image or logo. Hence it is necessary to devise a method to generate watermark.
The resolution of watermark is assumed to be half of that of original image.
For embedding the watermark, a 1-level Discrete Wavelet Transform is performed. Watermark information is embedded in the high frequency bands (HH1) since
it is robust against various normal image processing and malicious attacks. The resultant image is called watermarked image. In detection phase, two kinds of
watermarks will be obtained. One is generated from watermarked image and the other is extracted from HH1 subband which has been already embedded
within the host image. Comparison is made between those watermarks to decide authenticity.
3.1 WATERMARK GENERATION
The watermark pattern is generated from the content information of host image. Watermark generation procedure includes the following steps and is shown in
Figure 2.
• Consider the original image P of size M x M.
• Perform 1-level DWT on the original image and acquire the LL1 component to find
watermark pattern, which is of size M/2 x M/2. Let this matrix be ‘A’.
• A reduced size (M/2 x N/2) image ‘B’ is obtained from original image by Performing the following steps.
(i) Partition the original image into non- overlapping blocks of size 2x2.
(ii) One feature value from each block is calculated according to equation (3).
• Find the difference between A and B. Let it be C.
• A binary sequence ‘W’ can be obtained by applying the following constraint.
• Disorder the matrix ‘W’ with the help of Arnold Transform, the resultant is the required watermark pattern to be embedded in to the host image.
Example:
Consider the input matrix of size 8x8
Applying 1-level DWT on the original matrix yields the LL1 component in integer form as
Now the integer matrix B is obtained by taking average values of every blocks of size 2x2.
Matrix ‘C’ is formed by calculating the difference between matrices A and B.
By applying the constraint
a binary sequence ‘W’ is obtained as

VOLUME NO. 3 (2013), I SSUE NO. 09 (SEPTEMBER ) ISSN 2231-5756
INTERNATIONAL JOURNAL OF RESEARCH IN COMMERCE, IT & MANAGEMENT A Monthly Double-Blind Peer Reviewed (Refereed/Juried) Open Access International e-Journal - Included in the International Serial Directories
http://ijrcm.org.in/
79
3.2 WATERMARK EMBEDDING
The watermark is embedded in the high frequency subband of DWT as follows:
• Apply 1-level DWT to original image.
• The watermark is embedded in the high frequency component HH1 of DWT.
• Perform inverse wavelet transform to obtain the watermarked image.
3.3 WATERMARK DETECTION
Proposed watermarking scheme extracts and generates watermark information fromwatermarked image and so original image is not essential. So it can be
referred as blindwatermarking.The authentication process includes the following steps:
• Watermark is derived form the content of watermarked image using the stepsdescribed under watermark generation in section 3.1.
• Apply 1-level DWT to the watermarked image and extract the embedded watermarkfrom HH1 subband.
• Compare the two watermarks (derived and extracted). If two values match,authenticity is preserved. Otherwise the authenticity is suspected.
• Quality of watermarked image and the watermark is found out according to equation(4) and (6).
4. EXPERIMENTAL RESULTS We consider the images with number of rows and columns are of equal size since the embedded watermark is a square matrix. For testing, the size of the
original image is taken as 512x512. Figure 3 (a) shows original image. A 256x256 binary watermark signal is constructed from original image and is embedded
within itself. The proposed method is tested using MATLAB.
After embedding the watermark, there was no visual difference between the original and watermarked images. Figure 3(b) shows watermarked image. The
absolute difference of the pixel intensities of the watermarked image and the original image is shown in Figure 3(c). The difference image shows that the
technique ensures high degree of fidelity.
(a) (b) (c)
Figure 3. (a) Original Image b) Watermarked Image (c) Difference Image
The visual quality of watermarked and attacked images is measured using the Peak Signal to Noise Ratio, which is defined in equation (4). The PSNR value of
watermarked image is 59.1168, which indicates that there is very little deterioration in the quality of original image.
where MSE is Mean Squared Error between original and distorted images, which is definedin equation (5).
where OI is original image and DI is the distorted image.
A comparison between extracted and original watermark can be done by computingSimilarity Ratio (SR) between these two patterns as defined in equation(6),
which is themetric used for identifying robustness of the watermarking process.
where ‘S’ denotes number of matching pixel values and ‘D’ denotes number of different pixelvalues. In the proposed scheme, similarity ratio evaluated between
extracted and calculatedwatermark is 0.8496 which indicates that the number of matching pixels are quite high andhence authenticity is preserved. The
simulation results of previous method [1] and the proposed one are exposed in Table 1.
In the proposed as well the previous watermarking techniques, the watermarked image is subjected to six types of distortions: compression, noise, filter, image
adjustment, scaling and rotation. Watermarked image has compressed using JPEG compression with different quality factors. Additive Gaussian Noise and Salt&
pepper noise has been added to the watermarked image. Also filtering such as median filtering, Linear filtering, histogram equalization and blurring has been
applied on the watermarked image. The intensity values of watermarked image are adjusted to new values such that 1% of data are saturated at low and high
intensities. Also aclockwise rotation with cropping operation is applied on the image. Results of the metrics Peak Signal to Noise Ratio and Similarity Ratio on the
test image cameramanagainst both methods are shown in Table 2 & 3 respectively.

VOLUME NO. 3 (2013), I SSUE NO. 09 (SEPTEMBER ) ISSN 2231-5756
INTERNATIONAL JOURNAL OF RESEARCH IN COMMERCE, IT & MANAGEMENT A Monthly Double-Blind Peer Reviewed (Refereed/Juried) Open Access International e-Journal - Included in the International Serial Directories
http://ijrcm.org.in/
80
The imperceptibility of watermark in the proposed method has been evaluated against incidental attacks by using the metric PSNR and are compared against. A
comparative study on Table 2 reveals the fact that the quality of watermarked image under various incidental image processing operations is more or less similar
in both methods.
Robustness of the proposed method under the common image processing operations has been identified with the help of Similarity Ratio and is compared
against our previous method. Table 3 shows the experimental results. The simulation results of both methods in the case of additive Gaussian noises show that
the robustness of watermark in this attack is high with constant variance 0. An increase in variance slightly affects the robustness in both cases. The
watermarked image is attacked with salt & pepper noise with density 0.002, the results obtained show that both techniques are highly robust in this case. An
analytical study demonstrates that the watermark in previous method shows more robustness than the proposed one under noise attacks.
Watermarked image is smoothed with a 3x3 median filter. Experimental results disclosethat the proposed technique is more robust than the technique in under
filtering operation.Similar is the case with linear filtering. Experimental results against Image adjustment andHistogram equalization attacks reveal that the
robustness of watermark is high in both themethods.
A Gaussian lowpass filter of size 3x3 and a standard deviation sigma 0.5 is applied on the image. Similarly the watermarked image is compressed with lossy JPEG
compression by applying the quality factor from 0 to 100. Experimental results of the proposed system against the operations such as blurring, histogram
equalization, JPEG compression and scaling show a high Similarity Ratio than, which in turn indicates that the robustness of currently devised technique is higher
than the previous method. For the rotation with cropping operation, the observed results dictate that the robustness of the proposed method is better than that
of the previous one.
5. CONCLUSION This study has discussed a new robust watermarking scheme, which provides a complete algorithm that embeds and extracts the watermark information
effectively. In this method, a binary watermark pattern is constructed from host image itself and is disordered with the help of Arnold Transform. The watermark
embedding process does not degrade the visual quality of the image. The designed method makes use of the Discrete Wavelet Transform which provides a
frequency spread of the watermark within the host image. Moreover the authentication process provides qualities like imperceptibility, robustness and security.
The performance of the watermarking scheme is evaluated with common image processing attacks such as additive noises, filtering, intensity adjustment,
histogram equalization, JPEG compression, Scaling and rotation. Experimental results demonstrate that watermark is robust against those attacks. Moreover the
simulation results of currently devised method are compared with that of our previous work [1], the results obtained show that the proposed technique is highly
robust against attacks such as image adjustment, blurring, histogram equalization, compression, scaling and rotation.
6. REFERENCES 1. S.S.Sujatha, and M.MohamedSathik, “Feature Based Watermarking Algorithm by Adopting ArnoldTransform”, Proc. of Springer International Conference
on Information and Communication TechnologiesICT 2010, Vol.1, pp.78-82, Sept 2010.
2. C.Rey, and J.Dugelay, “A survey of watermarking algorithm for Image authentication”, Journal on AppliedSignal Processing, Vol.6, pp.613-621, 2002.
3. C.I.Podilchuk, and E.J.Delp, “Digital watermarking: algorithms and applications” IEEE Signal ProcessingMagazine, pp. 33-46, July 2001.
4. ArvindkumarParthasarathy, and SubhashKak, “An Improved Method of Content Based ImageWatermarking”, IEEE Transaction on broadcasting, Vol.53,
no.2, pp.468 -479, June 2007.
5. L.Xie, S.Wang, L.Gan, L.Zhang, and Z.Shu, “A class of authentication digital watermarks for securemultimedia communication IEEE Transactions on Image
Processing, Vol.10, No.11, pp.1754 1764.
6. Ramana Reddy, MunagaV.N.Prasad, and D.SreenivasaRao, “Robust Digital Watermarking of Color Imagesunder Noise Attacks”, International Journal of
Recent Trends in Engineering, Vol.1, No. 1, May 2009.
7. Q.Ying, and W.Ying, “A survey of wavelet-domain based digital image watermarking algorithm”, Computer Engineering and Applications, Vol.11, pp.46-49,
2004.

VOLUME NO. 3 (2013), I SSUE NO. 09 (SEPTEMBER ) ISSN 2231-5756
INTERNATIONAL JOURNAL OF RESEARCH IN COMMERCE, IT & MANAGEMENT A Monthly Double-Blind Peer Reviewed (Refereed/Juried) Open Access International e-Journal - Included in the International Serial Directories
http://ijrcm.org.in/
81
8. Y.Wang, J.F.Doherty, and R.E.Van Dyck, “A wavelet-based watermarking algorithm for ownershipverification of digital images”, IEEE Trans. Image Process,
11, pp.77-88, 2002.
9. S.H.Wang , and Y.P.Lin, “Wavelet Tree quantization for copyright protection for watermarking”, IEEE Trans.Image Process, pp.154-165, 2002.
10. P.Tao, and A.M.Eskicioglu, “A robust multiple watermarking scheme in the discrete wavelet transform domain”, Proceedings of the SPIE, Vol.5601, pp.133-
144, 2004.
11. Y.Luo, L.Z.Cheng, B.Chen, and Y.Wu, “Study on digital elevation mode data watermark via integer wavelets”, Journal of software, 16(6), pp.1096-1103,
2005
12. Yuan Yuan, Decai Huang, and Duanyang Liu, An Integer Wavelet Based Multiple Logo-watermarking Scheme. In IEEE, Vol.2 pp.175-179, 2006.
13. Qiwei Lin, Zhenhui Liu, and Gui Feng, “DWT based on watermarking algorihthm and its implementing with DSP”, IEEE Xplore, pp. 131-134, 2009.
14. Xiang-Gen Xia, Charles G.Boncelet, and Gonzalo, “Wavelet Transform based watermark for digital images”, OPTICS EXPRESS, 1998 Vol.3, No.12, pp 497-
511.

VOLUME NO. 3 (2013), I SSUE NO. 09 (SEPTEMBER ) ISSN 2231-5756
INTERNATIONAL JOURNAL OF RESEARCH IN COMMERCE, IT & MANAGEMENT A Monthly Double-Blind Peer Reviewed (Refereed/Juried) Open Access International e-Journal - Included in the International Serial Directories
http://ijrcm.org.in/
82
ORGANIZATIONAL STRUCTURE, RESPONSIBILITY, MOTIVATION LEVEL AND JOB SATISFACTION OF SELF-
FINANCING ENGINEERING COLLEGES BY USING MATHEMATICAL MODELING
RAVI DATT
ASST. PROFESSOR
DEPARTMENT OF APPLIED SCIENCES
CHITKARA UNIVERSITY
BADDI
DR. SUNIL DUTT
ASSOCIATE PROFESSOR
DEPARTMENT OF ENGINEERING EDUCATION
NATIONAL INSTITUTE OF TECHNICAL TEACHERS TRAINING AND RESEARCH
CHANDIGARH U.T.
DR. SITA RAM
ASSOCIATE PROFESSOR
DEPARTMENT OF APPLIED SCIENCES
CHITKARA UNIVERSITY
BADDI
SANTOSH KUMARI
ASST. PROFESSOR
DEPARTMENT OF APPLIED SCIENCES
M M UNIVERSITY
KUMARHATTI
ABSTRACT The present study falls in the category of applied research being descriptive one; therefore, it has educational implications for principals, heads of the
department, educational administrators and educational planners. In this study an attempt was made to find out the perceptions of teachers with high and low
job satisfaction regarding their organizational climate so as to enable the principals and administrators to bring about suitable changes in the organizational
climate of the institute. This may be helpful to enhance job satisfaction of teachers and thereby improve student-learning.
KEYWORDS Standard deviation (SD), Skewness (SK), Kurtosis (KU), THJS, TLJS.
INTRODUCTION n early days, the higher education system of India was well supported by the Government. The salary and ‘non salary’ expenditures of the institutions were
borne by the Government. But soon, Government realized that it is beyond their capacity to provide higher education to everyone. So, a scheme of ‘self
financing’ institutions was proposed by various State Governments of India. Since then, many new colleges have come up with no financial support from
Governments. Particularly, professional higher education colleges such as Engineering, Medical, Management, Computer and Information Technology colleges
have come up in large numbers.
In state of Himachal Pradesh there are more than 85 institutions providing technical education (34 polytechnics, 19 Engineering and more than 18 University) are
not supported by government. More number of students are able to get admissions to professional courses due to the increase in the number of institutions. It
is observed that the teachers migrate from one institution to another frequently. This may be due to various factors and this has resulted in problems in the
technical education systems in HP. It ultimately affects on teaching and their involvement in institutions. In order to solve this problem it is necessary to identify
the causes for such problems and employ the remedial measures to eliminate or reduce the problem. Since this turnover of teachers may be due to various
factors, identifying the factors becomes an important stage in the problem solution. There may be quantitative as well as qualitative factors causing this
problem. Qualitative or non measurable factors or variable are more important due to the complexity of these variables and hence it is required to device some
modes or methods to identify them. There have been studies in this field of determining the non-measurable variables such as personality factors, job
satisfaction, burnout etc.
In order to “survive”, Indian organizations are being forced to undergo massive changes. In this context, it would be important to identify the factors in the
organizational environment that have the most positive impact on the performance of the organization. Among various factors, attitudes and feelings of the
individuals regarding their jobs and job experiences have been found to be significantly affecting their behaviors.(Herzberg, Mausner, Peterson and Capwell,
1957; Iaffaldano and Muchinsky,1985; Locke, 1970; Schwab and Cummings, 1970; Petty, McGee and Cavender, 1984).
Progress and development of a nation is directly linked with the successful implementation of policies based on a good educational system. It needs careful
planning and painstaking efforts. In this struggle, the role of a teacher is regarded as pivotal as he is the man behinds the guns who lead to success. No
educational system can rise above its teachers. Importance of teachers should be accepted.
As the teacher is the key person to make the educational system a success, therefore it is necessary that he should be provided all facilities so that he may
discharge his duties earnestly and as it is universally accepted that a dissatisfied worker cannot do full justice with his job. Keeping in view the role of the
teacher, the researcher has tried to make a survey of the prevalent conditions and atmosphere in which the college teachers are performing their duties. The
highest official position in the college is that of principal. Thus, the responsibility of running the college is that of the principal (Freiberg and Stein (1999).
According to Dunklee (2000) “the differences in students’ behaviour and academic outcomes are influenced inter alia by the principal. The principal leads from
his/her values. The activities of the college are determined by what the principal does.” Buttressing the above claim, Ramsey (1999) contends that, “in an
I
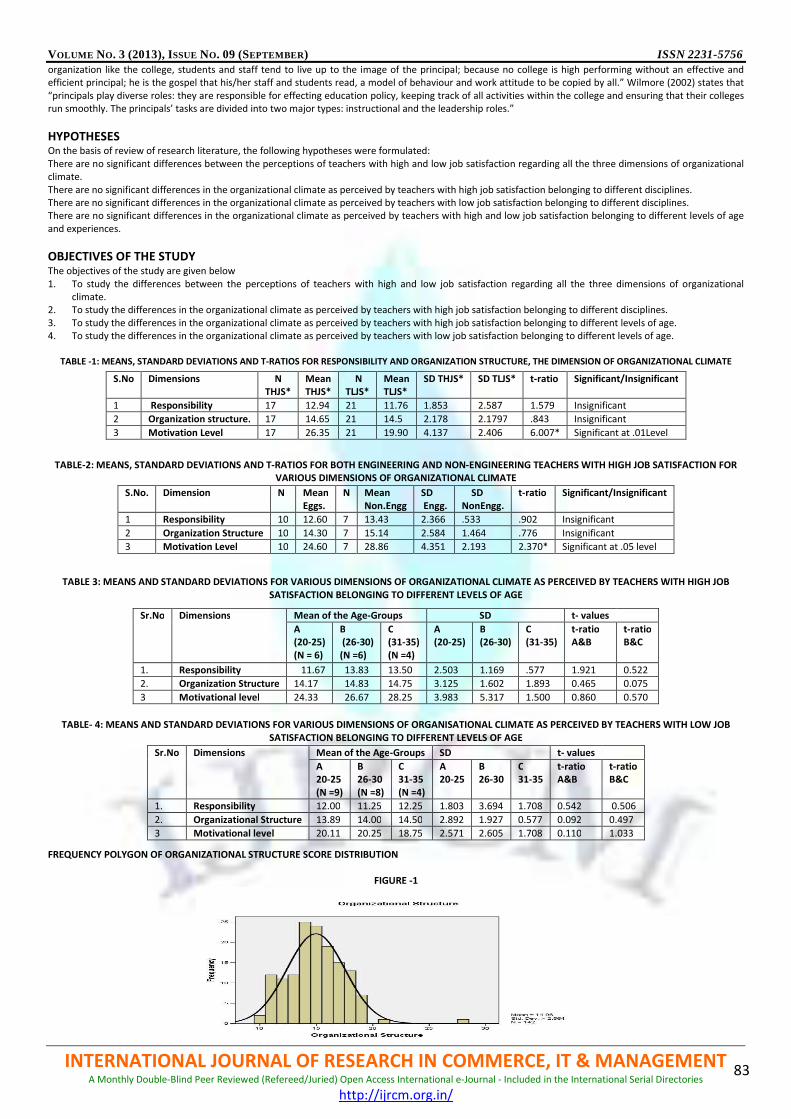
VOLUME NO. 3 (2013), I SSUE NO. 09 (SEPTEMBER ) ISSN 2231-5756
INTERNATIONAL JOURNAL OF RESEARCH IN COMMERCE, IT & MANAGEMENT A Monthly Double-Blind Peer Reviewed (Refereed/Juried) Open Access International e-Journal - Included in the International Serial Directories
http://ijrcm.org.in/
83
organization like the college, students and staff tend to live up to the image of the principal; because no college is high performing without an effective and
efficient principal; he is the gospel that his/her staff and students read, a model of behaviour and work attitude to be copied by all.” Wilmore (2002) states that
“principals play diverse roles: they are responsible for effecting education policy, keeping track of all activities within the college and ensuring that their colleges
run smoothly. The principals’ tasks are divided into two major types: instructional and the leadership roles.”
HYPOTHESES On the basis of review of research literature, the following hypotheses were formulated:
There are no significant differences between the perceptions of teachers with high and low job satisfaction regarding all the three dimensions of organizational
climate.
There are no significant differences in the organizational climate as perceived by teachers with high job satisfaction belonging to different disciplines.
There are no significant differences in the organizational climate as perceived by teachers with low job satisfaction belonging to different disciplines.
There are no significant differences in the organizational climate as perceived by teachers with high and low job satisfaction belonging to different levels of age
and experiences.
OBJECTIVES OF THE STUDY The objectives of the study are given below
1. To study the differences between the perceptions of teachers with high and low job satisfaction regarding all the three dimensions of organizational
climate.
2. To study the differences in the organizational climate as perceived by teachers with high job satisfaction belonging to different disciplines.
3. To study the differences in the organizational climate as perceived by teachers with high job satisfaction belonging to different levels of age.
4. To study the differences in the organizational climate as perceived by teachers with low job satisfaction belonging to different levels of age.
TABLE -1: MEANS, STANDARD DEVIATIONS AND T-RATIOS FOR RESPONSIBILITY AND ORGANIZATION STRUCTURE, THE DIMENSION OF ORGANIZATIONAL CLIMATE
TABLE-2: MEANS, STANDARD DEVIATIONS AND T-RATIOS FOR BOTH ENGINEERING AND NON-ENGINEERING TEACHERS WITH HIGH JOB SATISFACTION FOR
VARIOUS DIMENSIONS OF ORGANIZATIONAL CLIMATE
TABLE 3: MEANS AND STANDARD DEVIATIONS FOR VARIOUS DIMENSIONS OF ORGANIZATIONAL CLIMATE AS PERCEIVED BY TEACHERS WITH HIGH JOB
SATISFACTION BELONGING TO DIFFERENT LEVELS OF AGE
TABLE- 4: MEANS AND STANDARD DEVIATIONS FOR VARIOUS DIMENSIONS OF ORGANISATIONAL CLIMATE AS PERCEIVED BY TEACHERS WITH LOW JOB
SATISFACTION BELONGING TO DIFFERENT LEVELS OF AGE
FREQUENCY POLYGON OF ORGANIZATIONAL STRUCTURE SCORE DISTRIBUTION
FIGURE -1
S.No Dimensions N
THJS*
Mean
THJS*
N
TLJS*
Mean
TLJS*
SD THJS* SD TLJS* t-ratio Significant/Insignificant
1 Responsibility 17 12.94 21 11.76 1.853 2.587 1.579 Insignificant
2 Organization structure. 17 14.65 21 14.5 2.178 2.1797 .843 Insignificant
3 Motivation Level 17 26.35 21 19.90 4.137 2.406 6.007* Significant at .01Level
S.No. Dimension N Mean
Eggs.
N Mean
Non.Engg
SD
Engg.
SD
NonEngg.
t-ratio Significant/Insignificant
1 Responsibility 10 12.60 7 13.43 2.366 .533 .902 Insignificant
2 Organization Structure 10 14.30 7 15.14 2.584 1.464 .776 Insignificant
3 Motivation Level 10 24.60 7 28.86 4.351 2.193 2.370*
Significant at .05 level
Sr.No Dimensions Mean of the Age-Groups SD t- values
A
(20-25)
(N = 6)
B
(26-30)
(N =6)
C
(31-35)
(N =4)
A
(20-25)
B
(26-30)
C
(31-35)
t-ratio
A&B
t-ratio
B&C
1. Responsibility 11.67 13.83 13.50 2.503 1.169 .577 1.921 0.522
2. Organization Structure 14.17 14.83 14.75 3.125 1.602 1.893 0.465 0.075
3 Motivational level 24.33 26.67 28.25 3.983 5.317 1.500 0.860 0.570
Sr.No Dimensions Mean of the Age-Groups SD t- values
A
20-25
(N =9)
B
26-30
(N =8)
C
31-35
(N =4)
A
20-25
B
26-30
C
31-35
t-ratio
A&B
t-ratio
B&C
1. Responsibility 12.00 11.25 12.25 1.803 3.694 1.708 0.542 0.506
2. Organizational Structure 13.89 14.00 14.50 2.892 1.927 0.577 0.092 0.497
3 Motivational level 20.11 20.25 18.75 2.571 2.605 1.708 0.110 1.033

VOLUME NO. 3 (2013), I SSUE NO. 09 (SEPTEMBER ) ISSN 2231-5756
INTERNATIONAL JOURNAL OF RESEARCH IN COMMERCE, IT & MANAGEMENT A Monthly Double-Blind Peer Reviewed (Refereed/Juried) Open Access International e-Journal - Included in the International Serial Directories
http://ijrcm.org.in/
84
TOTAL SCORE OF ORGANIZATIONAL STRUCTURE
TABLE 1 (a)
Mean = 14.96 Median = 15.00
SD = 2.564 Skewness = .859
Kurtosis = 3.558 Number = 142
INTERPRETATION OF THE SCORES OF ORGANIZATIONAL STRUCTURE
From the scores of the dimension of organizational structure of organizational climate (fig-1) the skewness of the total sample was 0.859 which showed the
normal curve. The value of kurtosis was 3.558which is greater than the 0.263 for normal distribution hence the curve is leptokurtic. In terms of shape, a
leptokurtic distribution has a more acute peak around the mean (that is, a lower probability than a normally distributed variable of values near the mean) and
fatter tails. The polygon was very slightly skewed to the right; it indicates that slightly more data had been concentrated towards the left of the curve. Since the
values of the total score were near to the normal distribution. This was also got confirmed by the median (15.00) having slightly higher value than mean
(14.96). Hence the values of the total score were near to the normal distribution.
FREQUENCY POLYGON OF RESPONSIBILITY SCORE DISTRIBUTION
FIGURE – 2
TOTAL SCORE OF RESPONSIBILITY
TABLE 2 (a)
Mean = 12.11 Median = 12.00
SD = 2.169 Skewness = -.391
Kurtosis = .494 Number = 142
INTERPRETATION OF THE CORES OF RESPONSIBILITY From the scores of the dimension of responsibility of organizational climate (fig-2) the skewness of the total sample was -.391 which showed the normal curve.
The value of kurtosis was 0.494 which is greater than the 0.263 for normal distribution hence the curve is leptokurtic. In terms of shape, a leptokurtic
distribution has a more acute peak around the mean (that is, a lower probability than a normally distributed variable of values near the mean) and fatter tails.
The polygon was skewed to the left; it indicates that slightly more data had been concentrated towards the right of the curve. This was also got confirmed by the
median (12.00) having slightly lesser value than mean (12.11). Hence the values of the total score were near to the normal distribution.
FREQUENCY POLYGON OF MOTIVATIONAL LEVEL SCORE DISTRIBUTION
FIGURE -3
TOTAL SCORE OF MOTIVATION LEVEL
TABLE- 3 (a)
Mean = 22.76 Median = 23.00
SD = 3.703 Skewness = .289
Kurtosis = .080 Number = 142
INTERPRETATION OF THE SCORES OF MOTIVATION LEVEL From the scores of the dimension of motivation of organizational climate (fig-3 the skewness of the total sample was 0.289 which showed the normal curve. The
value of kurtosis was 0.080 which is less than the 0.263 for normal distribution hence the curve is platykurtic. Since the values of the total score were near to the
VOLUME NO. 3 (2013), I SSUE NO. 09 (SEPTEMBER ) ISSN 2231-5756
INTERNATIONAL JOURNAL OF RESEARCH IN COMMERCE, IT & MANAGEMENT A Monthly Double-Blind Peer Reviewed (Refereed/Juried) Open Access International e-Journal - Included in the International Serial Directories
http://ijrcm.org.in/
85
normal distribution. The polygon was very slightly skewed to the right; it indicates that slightly more data had been concentrated towards the left of the curve.
This was also got confirmed by the median (23.00) having slightly higher value than mean (22.76). Since the values of the total score were near to the normal
distribution.
RESULTS AND CONCLUSIONS In case of teachers with high and low job satisfaction t-ratios (Table- 1) were found insignificant on the two dimensions namely responsibility and organizational
structure. On the remaining one dimensions namely; motivational level, were found significant. The mean values of motivational level of teachers with high job
satisfaction were higher than the teachers with low job satisfaction. Therefore the teachers with high job satisfaction were highly motivated and feel their
organizational climate more conducive to perform their duties than those who were least satisfied with their job. These finding supports the finding of the Andre
Bishay (1996) conducted study on teacher motivation and job satisfaction and also supported by the research work of Ololube N.P. (2005), revealed significant
relationships among facets of job satisfaction and motivation factors.
All t-ratios (Table- 2) were found insignificant in two dimensions of organizational climate as perceived by teachers with high job satisfaction belonging to
engineering and non-engineering disciplines. On the remaining one dimensions namely; motivational level, were found significant. The results shows that
teachers with high job satisfaction from engineering discipline were highly motivated than the teachers from non-engineering discipline. The value of t-ratio
2.370 was found significant at 0.05 levels of significance.
The mean (28.86) score of motivation level of the teachers with high job satisfaction from non-engineering discipline was significantly higher than the mean
(24.60) score of motivation level of engineering discipline on the dimensions of motivational level. This reveals that the teachers with engineering discipline had
higher job satisfaction than the teachers who were from the non engineering disciplines.
ACKNOWLEDGEMENT his project is supported by Engineering Education & Management department of National Institute of Technical Teachers Training and Research, Chandigarh.
REFERENCES 1. Abu-Saad, I. and Hendrix, V. (1989) Organizational Climate and Teacher’s Job Satisfaction in a Multi-Cultural Milieu: The Case of the Bedouin Arab Schools
in Israel. International Journal of Educational Development, 15(2). 141-153.
2. Ahmad, A. 1997 Organizational Climate and Teacher’s Job Satisfaction in Residential and Non Residential Schools. Faculty of Educational Studies, University
Putra Malaysia.
3. Alan, S. S. and Santhapparaj, S. 2005 job satisfaction among Academic Staff in Private University in Malaysia.
4. Ali, N. and Akhtar, Z. 1999. Job satisfaction as related to organizational climate among bank officers, Paper presented in 4th international & 35th IAAP
conference at Anand (Gujarat), May 27-29.
5. Allen, D. K. (2003) Organizational Climate and Strategic Change in Higher Education: Organizational Insecurity. Journal of Higher Education, 46(1): 61-92.
6. Anderson, W. L. 2004 Increasing Teacher Effectiveness. UNESCO: International Institute for Educational Planning, Paris. Pp. 16, I8.
7. Bowen, D. and J. P. Siegen. 1977 The Relationship between Satisfaction and Performance, Proceedings of the Annual Convention of the American
Psychological Association. 23 pp. (typescript).
8. Bruce, W. M. and J. W. Blackburn. 1992 Balancing Job Satisfaction and Performance. Quorum Books, Westport, CT. 72 pp.
9. Chopra, R.K. 1982 A study of organizational climate of school in relation to job satisfaction of teacher’s and students achievement, Achievement, Ph.D.
Thesis, Agra University.
10. Coleman, B. 1998 Perspectives on Classrooms and Schools. The Open University Press, London, UK. p. 100-101.
11. Cooper, C.L. and Marshal, J. 1976 Occupational sources of stress. A review of the literature relating to coronary heart disease and mental health, Journal of
Occupational Psychology, Vol.49, pp.11-28.
12. Cooper, C.L., 1991 Stress in organizations. In M. Smith (Ed.). Analyzing Organizational Behaviour. London: MacMillan.
13. Cooper, D. R., & Schindler, P. S. 2003 Business research methods (8th Ed.). Boston: McGraw-Hill Irwin.
VOLUME NO. 3 (2013), I SSUE NO. 09 (SEPTEMBER ) ISSN 2231-5756
INTERNATIONAL JOURNAL OF RESEARCH IN COMMERCE, IT & MANAGEMENT A Monthly Double-Blind Peer Reviewed (Refereed/Juried) Open Access International e-Journal - Included in the International Serial Directories
http://ijrcm.org.in/
86
DESIGN AND IMPLEMENTATION OF A REAL-TIME VEHICLE TRACKING SYSTEM
MAITANMI OLUSOLA STEPHEN
ASST. LECTURER
DEPARTMENT OF COMPUTER SCIENCE
BABCOCK UNIVERSITY
OGUN STATE
OGUNLERE SAMSON OJO
LECTURER
DEPARTMENT OF COMPUTER SCIENCE
BABCOCK UNIVERSITY
OGUN STATE
DR. ADEKUNLE YINKA
ASSOCIATE PROFESSOR
DEPARTMENT OF COMPUTER SCIENCE
BABCOCK UNIVERSITY
OGUN STATE
GREGORY ONWODI
LECTURER
SCHOOL OF SCIENCE & TECHNOLOGY
NATIONAL OPEN UNIVERSITY OF NIGERIA
NIGERIA
MALASOWE BRIDGET
SR. LECTURER
DEPARTMENT OF COMPUTER SCIENCE
COLLEGE OF EDUCATION
NIGERIA
ABSTRACT Security in general is a major concern in our society today and over time, the security of vehicles has become a priority. Various inventions and technologies have
been brought about to put minds at rest, but the complete eradication of theft of cars is much of a tedious task. A solution to knowing the location of vehicles
either when they are stolen or for any other reasons. To know this location, it involves the installation of a vehicle tracker in a hidden position in the vehicle so
that it is not easily seen while providing essential clues as to the location of the vehicle and also a remote tracking server that receives the location information of
the car in longitude and latitude and converts it to a physical address and sends it to the authorized user.
KEYWORDS Tracker, vehicle, longitude, latitude.
INTRODUCTION ecurity in general is a major concern in our society today. Every day, people purchase vehicles for different purposes, but for which ever reason, a lot of
money is spent in the transaction which demands that adequate provision should be provided for its security and safety (Bajaja et al. 2012). Auto theft is
a serious crime which is getting rampant day after day. It is then necessary for car users everywhere to have a way to track down their cars in case it is
ever stolen. Real Time Vehicle Tracking System is one of the measures of securing vehicles. The word tracking means to find or follow something, therefore, Real
time vehicle tracking is a method used to track and monitor any remote vehicle equipped with a hardware unit that receives and transfers signals through global
positioning system (GPS) satellite. It makes use of GPS to provide actual geographic real time position of each vehicle.
A vehicle tracker is therefore a major and essential device that should be in every vehicle because it gives the owner the ability to know the exact location of
such cars at any point in time anywhere in the world with geography information systems (GIS) (Ambade et al. 2011).
It is very useful for both individuals and companies. It can help a company in the sense that the company workers cannot take the company car(s) to unassigned
locations. It can also help an individual who is probably on a business trip to know whether his car is still where he left it or not.
Today, the vehicle tracking system is playing a major role in most sectors as vehicles have become a major means of transportation.
PROBLEM STATEMENT An increase in car theft in the society which in most cases searching for such cars may not have positive effect is becoming a major concern. Systems like the
security lock and alarm system has been implemented in cars to prevent theft, but if a burglar can break open the lock, it therefore becomes easy for the burglar
to steal the car. This brought the need for the introduction of this real time tracking system.
S

VOLUME NO. 3 (2013), I SSUE NO. 09 (SEPTEMBER ) ISSN 2231-5756
INTERNATIONAL JOURNAL OF RESEARCH IN COMMERCE, IT & MANAGEMENT A Monthly Double-Blind Peer Reviewed (Refereed/Juried) Open Access International e-Journal - Included in the International Serial Directories
http://ijrcm.org.in/
87
OBJECTIVES OF THE STUDY The main objectives of this system are:
Developing Automatic Vehicle Location system using GPS for positioning information and global systems of telecommunication (GSM) for information
transmission.
LITERATURE REVIEW Over time, the security of vehicles has become a priority. Various inventions and technologies have been brought about to put minds at rest, but the complete
eradication of theft of cars is much of a tedious task. Technologies like the car alarm system have been put in place but it is limited to an audible distance and it
doesn’t give the location of the car if it is successfully stolen. A solution to knowing the location of vehicles when they are stolen is the Real Time Vehicle
Tracking System that involves the installation of a vehicle tracker in a hidden position in the vehicle so that it is not easily located while providing essential clues
as to the location of the vehicle.
GPS
The Global Positioning System (GPS) is the only fully-functional satellite navigation system. More than two dozen GPS satellites orbit the Earth, transmitting
radio signals which allow GPS receivers to determine their location, speed and direction. GPS has become indispensable for navigation around the world and an
important tool for map-making and synchronization of telecommunications networks. (Khindker, 2009)
It provides location and time information in all weather conditions, anywhere on or near the Earth where there is an unobstructed line of sight to four or more
GPS satellites.
Global Positioning System satellites transmit signals to equipment on the ground. GPS receivers passively receive satellite signals; they do not transmit. GPS
receivers require an unobstructed view of the sky, so they are used only in outdoors and they often do not perform well within forested areas or near tall
buildings. GPS operations depend on a very accurate time reference, which is provided by atomic clocks at the U.S. Naval Observatory. Each GPS satellite has
atomic clocks on board (Introduction to GSM, 2013).
Each GPS satellite transmits data that indicates its location and the current time. All GPS satellites synchronize operations so that these repeating signals are
transmitted at the same instant. The signals, moving at the speed of light arrive at a GPS receiver at slightly different times because some satellites are farther
away than others. The distance to the GPS satellites can be determined by estimating the amount of time it takes for their signals to reach the receiver.
HOW GPS DETERMINES POSITION
A GPS receiver knows the location of the satellites because that information is included in satellite transmissions. By estimating how far away a satellite is, the
receiver also knows that it is located somewhere on the surface of an imaginary sphere centred at the satellite. It then determines the sizes of several spheres,
one for each satellite. The receiver is located where these spheres intersect; this can be seen as depicted in fig. 1.
FIGURE 1. - HOW GPS RECEIVER DETERMINES ITS LOCATION
Source: (Introduction to GSM, 2013)
HOW ACCURATE IS THE GPS?
The accuracy of a position determined with GPS depends on the type of receiver. Most hand-held GPS units have about 10-20 meter accuracy. Other types of
receivers use a method called Differential GPS (DGPS) to obtain much higher accuracy. DGPS requires an additional receiver fixed at a known location nearby.
Observations made by the stationary receiver are used to correct positions recorded by the roaming units, producing an accuracy greater than 1 meter
(Khondker, 2009).
TYPES OF VEHICLE TRACKING SYSTEM
Research according to Parade et al. (2011) indicates that Vehicle tracking system can be typically classified into passive tracking and active systems. Each of
these utilizes the GPS technology and the satellite to get the vehicle’s location but the mode by which the user gets the location information is what differs. For
the purpose of this article, the active system will be used.
PASSIVE SYSTEMS
Passive tracking systems store information such as GPS location, vehicle speed, and can trigger events such as start/stop or ignition on/off. It is usually used by
people who need to track mileage or monitor location stops. When a vehicle returns to a predetermined location, the tracking device’s information is wirelessly
sent to a host computer or it is removed from its location and plugged into a computer to view the information.
ACTIVE SYSTEMS
Active tracking systems generally collect the same information, but are more sophisticated than passive systems because they are enabled to work with cellular
or satellite networks. Using these wireless networks, they are able to transmit data to a computer or data centre for further evaluation. They can also allow you
to locate a vehicle live on a map and to do this you might be required to install a software onto your computer or create an account with a tracking company,
when this is done you will be able to monitor a vehicle’s direction and speed in real time.
The advantage of using this type of system is that it allows you to redirect vehicles and warn drivers about their speed as they progress along their journey.
Additionally, these systems are commonly web-based so tracking data can be accessed from any capable device with an internet connection.
GSM/GPRS MODEM
A GSM modem is a wireless modem that works with a GSM wireless network. A wireless modem behaves like a dial-up modem. The main difference between
them is that a dial-up modem sends and receives data through a fixed telephone line while a wireless modem sends and receives data through radio waves (How
passive and active works, 2013).
Like a GSM mobile phone, a GSM modem requires a SIM card from a wireless carrier in order to operate as seen in fig 2.

VOLUME NO. 3 (2013), I SSUE NO. 09 (SEPTEMBER ) ISSN 2231-5756
INTERNATIONAL JOURNAL OF RESEARCH IN COMMERCE, IT & MANAGEMENT A Monthly Double-Blind Peer Reviewed (Refereed/Juried) Open Access International e-Journal - Included in the International Serial Directories
http://ijrcm.org.in/
88
FIGURE 2: A GSM/GPRS MODEM
Source: (How active and passive works, 2013)
DESIGN AND IMPLEMENTATION OF VEHICLE TRACKING SYSTEM
This article was aimed at developing an Automatic Vehicle Location system using GPS for positioning information and GSM/GPRS for information transmission
with the following features:
• Acquisition of vehicle’s location information (latitude longitude) after specified time interval.
• Transmission of vehicle’s location and other information (including ignition status, door open/close status) to the monitoring station/Tracking server after
specified interval of time.
• A Web based software to display all transmitted information to end user along with displaying location of vehicle on a map.
The objective of the paper was to build an additional feature to the present security system that will warn the owner of the vehicle by sending SMS when there
has been an intrusion into the vehicle.
The system was designed to have two major units
• In-Vehicle unit
• Tracking Server/Monitoring Station.
The In-Vehicle unit is the major part of the system and it is installed into the vehicle. It is responsible for capturing the current location of vehicle, proximity
sensors for parking assistance, vibration Sensors and ultrasonic Sensors for measuring the distance. It is also responsible for transmitting this information to the
Tracking Server located anywhere in the world.
COST EFFECTIVE GPS – GPRS BASED OBJECT TRACKING SYSTEM
This article proposes and implements a low cost object tracking system using GPS and GPRS. The objective of this research is to reduce the cost of the tracking
system using the latest technologies and also making it available to the common people.
The system allows a user to view the present and the past positions recorded of a target object on Google Map through the internet. The system reads the
current position of the object using GPS, the data is sent via GPRS service from the GSM network towards a web server using the POST method of the HTTP
protocol. The object’s position data is then stored in the database for live and past tracking (Ambade et al. 2011).
The system has two parts:
• The tracking device and
• The database server.
The device is attached with the moving object and it gets the position from GPS satellite in real-time.
DATA TRANSMISSION METHOD
The tracking device communicates with the server and the data is sent via GPRS service from the GSM network. The reason for this choice is because using GPRS
is cheaper than using SMS.
It then sends the position information with the International Mobile Equipment Identity (IMEI) number as its own identity to the server. The data is checked for
validity and the valid data is saved into the database. When a user wants to track the device, he logs into the service provider’s website and gets the live position
of the device on Google Map. A custom report is also generated which includes a detailed description of the vehicles status. Users can also see the previous
positions of the device as seen in the fig. 3.
FIGURE 3: A DIAGRAMMATIC REPRESENTATION OF HOW THE SYSTEM WORKS
Source: (Jennifer, 2013)

VOLUME NO. 3 (2013), I SSUE NO. 09 (SEPTEMBER ) ISSN 2231-5756
INTERNATIONAL JOURNAL OF RESEARCH IN COMMERCE, IT & MANAGEMENT A Monthly Double-Blind Peer Reviewed (Refereed/Juried) Open Access International e-Journal - Included in the International Serial Directories
http://ijrcm.org.in/
89
REAL TIME VEHICLE LOCKING AND TRACKING SYSTEM USING GSM AND GPS TECHNOLOGY-AN ANTI-THEFT SYSTEM
This project deals with the design & development of a theft control system for an automobile, which is being used to prevent/control the theft of a vehicle. The
developed system makes use of an embedded system based on Global System for Mobile communication (GSM) technology. The designed & developed system
is installed in the vehicle. An interfacing mobile is also connected to the microcontroller, which is in turn, connected to the brain box of the vehicle (Parade et al.
2011).
An AVR Microcontroller is interfaced to a GSM module, GPS Receiver and also to the vehicle locking system. The Microcontroller will keep listening for new SMS
arrival. If a SMS arrives, it will check for authentication and after authentication is verified, it will read the GPS location and will send it to the user’s cell phone in
the form of SMS, also same information will be sent to a host pc. The PC will have a Visual Basic (VB) based application running on it. This will extract the SMS
information from GSM modem or cell phone, and it will plot the latitudes and longitudes on the Google maps. For plotting on the Google maps pc must have an
Internet connection. The vehicle can also be locked/ unlocked by sending a message to the system.
MICROCONTROLLER
The microcontroller is the central controller for the whole unit. In this article, the Arduino AT328 microcontroller is used for interfacing to the various hardware
peripherals. The microcontroller will continuously monitor a moving vehicle and report the location status on demand. The AT328 is interfaced serially to a GSM
Modem and GPS Receiver [6]. The microcontroller can be seen in fig 4.
Features of ArduinoATmega328 Microcontroller
• High Performance, Low Power AVR 8-bit Microcontroller
• Advanced RISC Architecture
• 131 Powerful Instructions – Most Single Clock Cycle Execution
• 32 X 8 General Purpose Working Registers
• Fully Static Operation
• Up to 20 MIPS Throughput at 20 MHz
• On-chip 2-cycle Multiplier
• High Endurance Non-volatile Memory Segments
• Write/Erase Cycles: 10,000 Flash/100,000 EEPROM
• Data retention: 20 years at 85oC/100 years at 25
-oC
• Optional Boot Code Section with Independent Lock Bits
FIGURE 4: BLOCK DIAGRAM OF MICROCONTROLLER.
Source: (History of vehicle tracking, 2013)
TABLE 1: SUMMARY OF THE FEATURES OF ARDUINO BOARD
Microcontroller ATmega328
Operating Voltage 5V
Input Voltage (recommended) 7-12V
Input Voltage (limits) 6-20V
Digital I/O Pins 14 (of which 6 provide PWM output)
Analog Input Pins 6
DC Current per I/O Pin 40 Ma
DC Current for 3.3V Pin 50 Ma
Flash Memory 32 KB (ATmega328) of which 0.5 KB used by bootloader
SRAM 2 KB (ATmega328)
EEPROM 1 KB (ATmega328)
Clock Speed 16 MHz
OPERATIONAL PROCEDURES
The Arduino Uno has a number of facilities for communicating with a computer, another Arduino, or other microcontrollers. The ATmega328 provides UART TTL
(5V) serial communication, which is available on digital pins 0 (RX) and 1 (TX). An ATmega16U2 on the board channels this serial communication over universal
serial bus (USB) and appears as a virtual com port to software on the computer. The '16U2 firmware uses the standard USB COM drivers, and no external driver
is needed. However, on Windows, an inf file is required. The Arduino software includes a serial monitor which allows simple textual data to be sent to and from
GSM
Modem
AT328
Microcontroller GPS
Device

VOLUME NO. 3 (2013), I SSUE NO. 09 (SEPTEMBER ) ISSN 2231-5756
INTERNATIONAL JOURNAL OF RESEARCH IN COMMERCE, IT & MANAGEMENT A Monthly Double-Blind Peer Reviewed (Refereed/Juried) Open Access International e-Journal - Included in the International Serial Directories
http://ijrcm.org.in/
90
the Arduino board. The RX and TX LEDs on the board will flash when data is being transmitted via the USB-to-serial chip and USB connection to the computer
(but not for serial communication on pins 0 and 1).
The Software Serial library allows for serial communication on any of the Uno's digital pins.
The ATmega328 also supports I2C (TWI) and SPI communication. The Arduino software includes a Wire library to simplify use of the I2C bus.
16MHZ CRYSTAL RESONATOR
The crystal resonator is connected to Pins 9 and 10 of the Microcontroller. It is responsible for clocking the microcontroller at 16Mhz. The resonator is seen in
fig. 5.
FIG 5– 16MHZ CRYSTAL RESONATOR INTERFACED TO A MICROCONTROLLER BOARD
Source: (History of vehicle tracking, 2013)
POWER SUPPLY
The power source of the tracker will be a 9v battery or 12v from the vehicle battery which will be eventually regulated to 5v which is the voltage rate of the
circuit.
TRACKING SERVER TOOLS
AT COMMANDS
AT commands are instructions used to control a GSM modem. In this project, AT commands are used to control the GSM modem connected to PC serving as the
tracking server and also the GSM/GPRS module in the tracker. Attention (AT) and every command line starts with AT or at that is why modem commands are
called AT commands. The starting AT is the prefix that informs the modem about the start of a command /line. It is not part of the AT command name. For
example, D is the actual AT command name in ATD, and +CMGS is the actual AT command name in AT+CMGS.
REVERSE GEOCODING
Geocoding refers to translating a human-readable address into a location on a map. The process of doing the converse, translating a location on the map into a
human-readable address, is known as reverse geocoding.
For example, the following query contains the latitude/longitude value for a location in Abuja:
http://maps.googleapis.com/maps/api/geocode/json?latlng= 09.045020, 007.405295&sensor=true
Results of the possible addresses:
• Nnamdi Azikiwe Expy, Abuja, Nigeria
• Citec Estate, Abuja, Nigeria
• Abuja Capital Territory, Nigeria
• Nigeria
The resulting addresses are not just postal addresses, but any way to geographically name a location. For example, when geocoding a point in a city, the
geocoded point may be denoted as a street address, as the city, as its state or as a country. The reverse geocoder returns any of these types as valid results. The
reverse geocoder matches political entities (countries, provinces, cities and neighbourhoods), street addresses, and postal codes.
Generally, addresses are returned from most specific street address to least specific address. The more exact address is the most prominent result. Reverse
geocoding is usually an estimate. The geocoder attempts to find the closest addressable location within a certain tolerance; if no match is found, the geocoder
returns zero results.
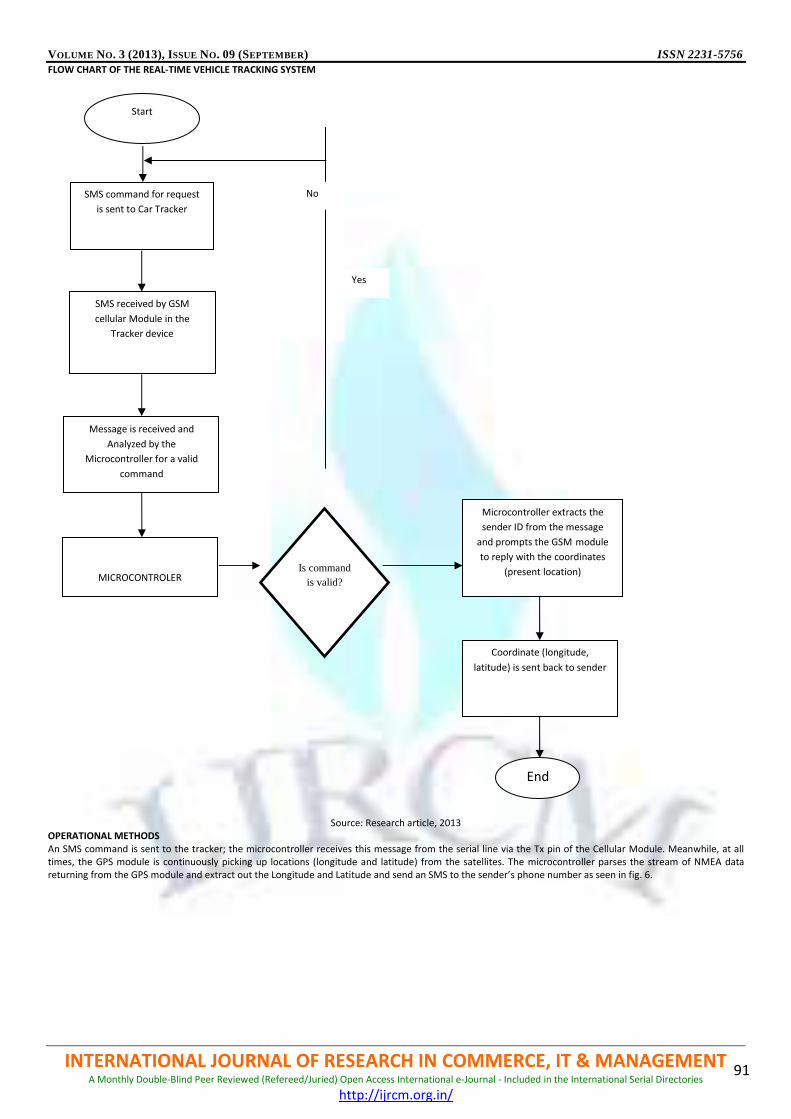
VOLUME NO. 3 (2013), I SSUE NO. 09 (SEPTEMBER ) ISSN 2231-5756
INTERNATIONAL JOURNAL OF RESEARCH IN COMMERCE, IT & MANAGEMENT A Monthly Double-Blind Peer Reviewed (Refereed/Juried) Open Access International e-Journal - Included in the International Serial Directories
http://ijrcm.org.in/
91
FLOW CHART OF THE REAL-TIME VEHICLE TRACKING SYSTEM
Source: Research article, 2013
OPERATIONAL METHODS
An SMS command is sent to the tracker; the microcontroller receives this message from the serial line via the Tx pin of the Cellular Module. Meanwhile, at all
times, the GPS module is continuously picking up locations (longitude and latitude) from the satellites. The microcontroller parses the stream of NMEA data
returning from the GPS module and extract out the Longitude and Latitude and send an SMS to the sender’s phone number as seen in fig. 6.
Yes
Coordinate (longitude,
latitude) is sent back to sender
End
MICROCONTROLER Is command
is valid?
Microcontroller extracts the
sender ID from the message
and prompts the GSM module
to reply with the coordinates (present location)
SMS command for request
is sent to Car Tracker
SMS received by GSM
cellular Module in the
Tracker device
Message is received and
Analyzed by the
Microcontroller for a valid
command
Start
No

VOLUME NO. 3 (2013), I SSUE NO. 09 (SEPTEMBER ) ISSN 2231-5756
INTERNATIONAL JOURNAL OF RESEARCH IN COMMERCE, IT & MANAGEMENT A Monthly Double-Blind Peer Reviewed (Refereed/Juried) Open Access International e-Journal - Included in the International Serial Directories
http://ijrcm.org.in/
92
FIGURE 6: BRINGING IT ALL TOGETHER: HOW IT WORKS
Source: (Introduction to GSM/GPRS Wireless modem, 2013)
SUMMARY AND CONCLUSION The main objective of the article is to know the precise location of the vehicle at a particular time with the help of the main parts of the tracking device, which
includes the in-vehicle unit, and a PC based application. This objective was achieved by the successful review and analysis of different related works and by
meticulously scrutinizing different method of design of a car tracking device together with its properties.
The paper is written in such a way that it allows us to understand the different components used in making a car tracking device and also the principles behind
them such as longitude, latitude, GPS, GSM communication amongst others.
In conclusion, we can gather that it is very necessary to give our car adequate protection because it is quite valuable and for this to be guaranteed, we
encourage owners/users to invest on real time car tracking system.
RECOMMENDATION This research has not reach it peak point, better technology could still be applied by writing codes that is capable of either switching off the ignition or activate
an alarm system.
REFERENCES
1. Ambade S. D. and Shaikh , S. A. (2011) ”Design and implementation of vehicle tracking system using GPS”, Journal of Information Engineering and
Applications, Vol.1, No.3.
2. Bajaj, D. and Gupta, N.,(2012) ”GPS Based Automatic Vehicle Tracking using RFID”, International Journal of Engineering and Innovative Technology
(IJEIT), Vol.1, Issue.1,
3. Explaining how active and passive tracking devices work, retrieved 2013 http://www.trackcompare.co.uk/explaining- how-active-and- passive-tracking-
devices-work
4. GPRS General Packet Radio Service Tutorial, http://www.radioelectronics.com/info/cellulartelecomms/gprs/gprs_tutorial.php
5. History of vehicle tracking, retrieved 2013 http://www.historyofvehicletracking.co.uk/
6. Introduction to GSM / GPRS Wireless Modems, Retrieved 2013 http://www.developershome.com/sms/GSMModemIntro.asp BTS BUS tracking using GPS
& GSM system, pp. 15- 17, http://www.scribd.com/doc/92672305/Bus-Tracking-Using-Gps-Gsm-System
7. Jennifer Hord retrieved 2013 How SMS works http://computer.howstuffworks.com/e-mail-messaging/sms.htm
8. Khondker , S. H. (2009) “Cost effective GPS- GPRS based object tracking system”, Proceedings of the International Multi Conference of Engineers and
Computer Scientists (IMECS) 2009, Vol. I, Hong Kong.
9. Pravada P.W. and Dahad, S.O. (2011) “Real Time Vehicle Locking and Tracking System using GSM and GPS Technology- An Anti-theft System”,
International Journal of Technology and Engineering System (IJTES), Vol.2.No.3, Jan –March
10. SMS vs GPRS, http://www.ehow.com/m/info_12195105_sms_vs_gprs.html
11. Types of tracking devices, http://www.ehow.com/m/facts_5006571_types-tracking -devices.html
12. What does tracking mean?, http//www.wiki.answers.com/Q/What_does_tracking_mean, How does GPS work?, http://www. airandspace.si.edu/g
ps/work.html

VOLUME NO. 3 (2013), I SSUE NO. 09 (SEPTEMBER ) ISSN 2231-5756
INTERNATIONAL JOURNAL OF RESEARCH IN COMMERCE, IT & MANAGEMENT A Monthly Double-Blind Peer Reviewed (Refereed/Juried) Open Access International e-Journal - Included in the International Serial Directories
http://ijrcm.org.in/
93
PERFORMANCE EVALUATION OF MANET ROUTING PROTOCOLS WITH SCALABILITY FOR E-MAIL
THROUGHPUT TRAFFIC USING OPNET MODELER
MANDEEP SINGH
SYSTEM ANALYST
COMPUTER ENGINEERING,
YADAVINDRA COLLEGE OF ENGINEERING
TALWANDI SABO
BALWINDER SINGH
ASST. PROFESSOR
COMPUTER ENGINEERING,
YADAVINDRA COLLEGE OF ENGINEERING
TALWANDI SABO
ABSTRACT Mobile ad hoc network is a collection of wireless nodes that can dynamically be set up anywhere and anytime to exchange information without using
any pre-existing network infrastructure. It is a self organized and self configurable network where the mobile nodes move randomly. In MANET mobile nodes can
receive and forward packets as a router and each node operates not only as an end system, but also as a router to forward packets. The nodes are free to move
i.e. the nodes are mobile. These nodes change position frequently. So there is no fixed infrastructure, which results in addition and exclusion of any number of
nodes from the network for relatively small networks routing protocols may be sufficient. However, in larger networks either hierarchical or geographic routing
protocols are needed. In this Thesis three routing protocols AODV (Ad- Hoc On-Demand Distance Vector), OLSR (Optimized Link State Routing Protocol) and DSR
(Dynamic Source Routing Protocol) are compared. Most of the previous research on MANET routing protocols have focused on simulation study by varying
various parameters, such as network size, pause times etc. The performance of these routing protocols is analyzed with Scalability for E-Mail in terms of their
Throughput Traffic and their results are shown in graphical forms. The comparison analysis will be carrying out about these protocols and in the last the
conclusion will be presented, that which routing protocol is the best one for mobile ad -hoc networks.
KEYWORDS Mobile Ad-hoc Network, Performance Analysis, Routing Protocols, AODV, DSR, OLSR, OPNET MODELER 14.5.
I. INTRODUCTION ANET is a dynamic distributed system [1], in which wireless devices with limited energy can move arbitrary. In this network, nodes communicate
without any fixed infrastructure. MANET is a self-configurable network and nodes are free to move randomly, so topology may change and this event is
unpredictable [6]. According to these characteristics, routing is a critical issue and we should choose an efficient routing protocol to makes the MANET
reliable [10].
The most popular routing protocols [1] in MANET are AODV (reactive), DSR (reactive), OLSR (proactive) and GRP (hybrid). Reactive protocols find the routes
when they are needed. Proactive protocols are table driven protocols and find routes before they need it. And finally hybrid routing protocols offer an efficient
framework that can simultaneously draw on the strengths of proactive and reactive routing protocols.
In this paper, we focus on four MANET routing protocols, AODV, OLSR, DSR and GRP. We consider four parameters to evaluate the performance of these routing
protocols: End-to-end delay, network load, throughput and media access delay. The organization of the paper is as follows. We explain routing protocols in
section 2, related works are discussed in section 3, section 4 explains the experiment and performance analysis, our simulation result presented in section 4 and
finally section 5 concludes the paper.
II. ROUTING PROTOCOLS IN MANETS Three routing protocols are considered in this paper, namely; DSR, AODV and OLSR. Below is a brief description of each protocol:
A. DSR – Dynamic Source Routing (DSR)
DSR is a reactive routing protocol that discovers and maintains routes between nodes. In the route discovery, DSR floods Route Request Packet to the network.
Each node that receives this packet, first add its address to it and then forwards the packet to the next node. When the targeted node or a node that has route
to the destination receives the Route Request, it returns a Route Reply to the sender and a route is established. Each time a packet follows an established route,
each node has to ensure that the link is reliable between itself and the next node. In the Route maintenance, DSR provides three successive steps: link layer
acknowledgment, passive acknowledgment and network layer acknowledgment. When a route is broken and one node detects the failure, it sends a Route Error
packet to the original sender [1, 5].
B. Optimized Link State Routing (OLSR)
OLSR is a table driven protocol. It usually stores and updates its routes so when a route is needed, it present the route immediately without any initial delay. In
OLSR, some candidate nodes called multipoint relays (MPRs) are selected and responsible to forward broadcast packets during the flooding process. This
technique reduces the overhead of packet transmission compared to flooding mechanism [1]. OLSR performs hop-by-hop routing, where each node uses its
most recent routing information to route packets. MPR’s is made in a way that it covers all nodes that are two hops away (i.e. neighbors of the neighbors). A
node senses and selects its MPR's with control messages called HELLO messages. Hello messages are used to ensure a bidirectional link with the neighbor. HELLO
messages are sent at a certain interval. Nodes broadcast “TC” or Topology control messages to determine it’s MPRs [11].
C. Ad Hoc on-Demand Distance Vector Routing (AODV)
AODV provides on-demand route discovery in MANET. Whenever the nodes need to send data to the destination, if the source node doesn’t have routing
information in its table, route discovery process begins to find the routes from source to destination. Route discovery begins with broadcasting a route request
(RREQ) packet by the source node to its neighbors. RREQ packet comprises broadcast ID, two sequence numbers, the addresses of source and destination and
hop count. The intermediary nodes which receive the RREQ packet could do two steps: If it isn’t the destination node then it’ll rebroadcast the RREQ packet to
its neighbors. Otherwise it’ll be the destination node and then it will send a unicast replay message, route replay (RREP), directly to the source from which it was
received the RREQ packet. A copied RREQ will be ignored. Each node has a sequence number. When a node wants to initiate route discovery process, it includes
its sequence number and the most fresh sequence number it has for destination. The intermediate node that receive the RREQ packet, replay to the RREQ
packet only when the sequence number of its path is larger than or identical to the sequence number comprised in the RREQ packet. A reverse path from the
intermediate node to the source forms with storing the node’s address from which initial copy of RREQ. There is an associated lifetime value for every entry in
M

VOLUME NO. 3 (2013), I SSUE NO. 09 (SEPTEMBER ) ISSN 2231-5756
INTERNATIONAL JOURNAL OF RESEARCH IN COMMERCE, IT & MANAGEMENT A Monthly Double-Blind Peer Reviewed (Refereed/Juried) Open Access International e-Journal - Included in the International Serial Directories
http://ijrcm.org.in/
94
the routing table. Suppose that some routes are not applied within their lifetime period, so these routes are expired and should be dropped from the table. But
if routes are used, the lifetime period is updated so those routes are not expired. When a source node wants to send data to some destination, first it searches
the routing table; if it can find it, it will use it. Otherwise, it must start a route discovery to find a route [1]. It is also Route Error (RERR) message that used to
notify the other nodes about some failures in other nodes or links [9].
III. RELATED WORKS 1. Behavioural study of MANET Routing Protocols [2]
Amandeep Makkar et al, in their paper, “Behavioural study of MANET Routing Protocols” presented a behavioral study of different MANET routing protocols i.e.
Optimized Link State Routing (OLSR), Destination Sequenced Distance vector (DSDV), Dynamic Source Routing (DSR), Ad hoc On-demand Distance Vector (AODV)
and Temporally Ordered Routing Protocol (TORA) protocols, have been carried out to identify which protocol is most suitable for efficient routing over Mobile
Ad hoc NETwork (MANET). This paper provides an overview of these routing protocols and then makes their comparative analysis so to analyze their
performance, which is important for identifying which protocol is best suitable for MANET and how the performance of that protocol can be further improved.
2. On MANET Routing protocols for Mobility and Scalability[4]
Ashish Shrestha and Firat tekiner, in their paper “On MANET Routing protocols for Mobility and Scalability”, presented a performance comparison of the
reactive and proactive MANET routing protocols, namely AODV, DSR, TORA and OLSR in a varying network sizes with increasing area and nodes size. The main
issue of MANET is the breakage of link at certain moment and re-generation of link at certain state as it consists of routers which are mobile in nature. Therefore
performance comparison is done by using the simulator OPNET Modeler 14.5, to investigate the mobility and scalability of the routing protocols. Throughput
was considered as the main factor for comparison because it is the actual rate of data received successfully by nodes in comparison to the claimed bandwidth.
AODV and OLSR performed pretty well showing average performance throughout the simulation.
3. Performance Evaluation of Routing Protocols in MANET with different traffic loads [8]
Laxmi Shrivastava et al, in their paper “Performance Evaluation of Routing Protocols in MANET with different traffic loads” described, as the network size
changes, the control overhead and traffic loads will automatically change. The performance of the routing protocols in MANETs degrades with increasing
traffic load. This paper present observations regarding the performance comparison of reactive and proactive protocols for varying traffic load in mobile
ad hoc networks (MANETs). The general observation from simulation (NS-2) is that DSR has performed well compared to AODV and DSDV in the situation
of heavy traffic load.
4. Scalability of Routing in MANET [10]
Prashant Singh and D.K. Lobiyal in their paper “Scalability of Routing in MANET” described that because of the multihop nature of the ad hoc networks, the
scalability of MANETs is directly related to the routing protocol. The scalability is subject to the fundamental limitation imposed by the multi-hop nature of
MANETs. In this paper, simulations are conducted to investigate scalability of DSR, AODV, and LAR routing protocols using prediction based link availability
model. This also proves that whether link prediction model also adds up to the scalability of routing protocol. From simulation results (GloMoSim), it is clear that
performance of routing is improved due to link prediction model and the protocols are scalable with the model.
5. Scalability Improved DSR Protocol for MANETs [9]
M. Tamilarasi et al, in their paper, “Scalability Improved DSR Protocol for MANETs” described a technique to improve the performance of the DSR protocol. As
reactive Dynamic Source Routing (DSR) Protocol is a commonly applied protocol in Mobile Ad hoc networks, when the network size is increased, it is observed
that the overhead is also getting increased due to the source routing nature of DSR and this in turn reduces the efficiency of DSR protocol. In order to improve
the scalability of DSR, in this paper, a modification is proposed for DSR. In Modified Dynamic Source Routing (MDSR) protocol, the number of RREPs are limited
to only one. This reduces the overhead by restricying the multiple RREPs. Simulation results (GloMoSim) show that the modified DSR (MDSR) has less overhead
and delay compared to conventional DSR irrespective of network size.
6. Scalability study of ad-hoc wireless mobile network routing protocol in sparse and dense networks [7]
Hean Kuan Ong et al, in their paper “Scalability study of ad-hoc wireless mobile network routing protocol in sparse and dense networks” presented a the
detailed study of scalability of the ad hoc routing protocols towards sparse networks, dense networks and combination of sparse and dense networks. Two
different categories of ad-hoc wireless networks is used to evaluate how scalable they are for various scenarios. By using Network Simulator (ns-2), simulation of
two selected routing protocols DSDV and AODV is conducted to analyze the various factors that cause the routing performance to degrade in large-scale
networks. The result shows that data delivery ratio decreases as the network size increases. The scalability reduces in sparse network even though there is less
overhead.
7. Analysis of Scalability in MANET’s Protocols [11]
Roxana Zoican, in his paper “Analysis of Scalability in MANET’s Protocols” presented an architectural framework for a service discovery protocol for MANETs,
which is based on the homogenous and dynamic deployment of cooperating directories within the network. In modern applications, group communication is
more important. Multicasting provides necessary services for group communication in such type of applications. With the increasing number of nodes, scalability
issue in multicasting of Mobile Ad hoc Network is still an open problem. This paper analyzed a scalable service discovery protocol aimed at MANETs, composed
of up to a hundred of nodes, and further supporting bridging with other networks, either ad hoc or infrastructure-based. The solution was evaluated through
simulation, which shows the efficiency of the analyzed protocol.
8. A Coding-Based Routing for Scalable MANET [5]
Bo Ryu et al, in their paper “A Coding-Based Routing for Scalable MANET” presented a special approach for routing in the MANETs which can increase the
scalability of the network in terms of number of nodes and number of hops. The drawbacks of the traditional routing protocols are also described. Then the
comparison is made between the traditional protocols and the protocols whose basic principle depend upon the new approach proposed. It is claimed that the
new protocols are likely to be inherently scalable, robust and efficient. Preliminary simulation results show considerable performance gain over legacy MANET
routing approach.
9. Towards Scalable MANETs [6]
E. Baccelli and J. Schiller, in their paper “Towards Scalable MANETs” described, in the near-future, self-organized networking is becoming an important
component in the Internet architecture. A big challenge concerning the integration of this new component is the accomplishment of scalable and efficient
mobile ad hoc routing. This paper overviews considerations relative to the design of such MANET protocols inside the framework provided by the IETF, stating
the need for new hybrid protocols and architecture which offer a gradual transition from ”traditional” MANET routing towards scalable MANET routing
integrated in the Internet. This paper also proposes a DHT-OLSR protocol, based on OLSR, enhanced with dynamic clustering and distributed hash table routing.
The protocol uses key-based unicast routing to scale to very large MANET topologies.
IV. EXPERIMENT DESIGN AND PERFORMANCE ANALYSIS In this paper, we have nine different scenarios in OPNET modeler 14.5. In each scenario, we apply a various routing protocol. Comparisons have been made
between AODV, DSR and OLSR protocols. Table 1 shows the simulation Parameters of scenarios containing 20 mobile nodes, 40 mobile nodes and 100 mobile
nodes operating at Data Rate 11Mbps. Each scenario was run for 2.3 minutes. We considered there parameters for the evaluation; Network delay, network load
and Network throughput. In each figure from Fig. 2 to Fig. 6, the horizontal axis shows the simulation time in hour and minute format, and the vertical axis
represent one of the five parameters (delay, network load, throughput, media access delay and load).
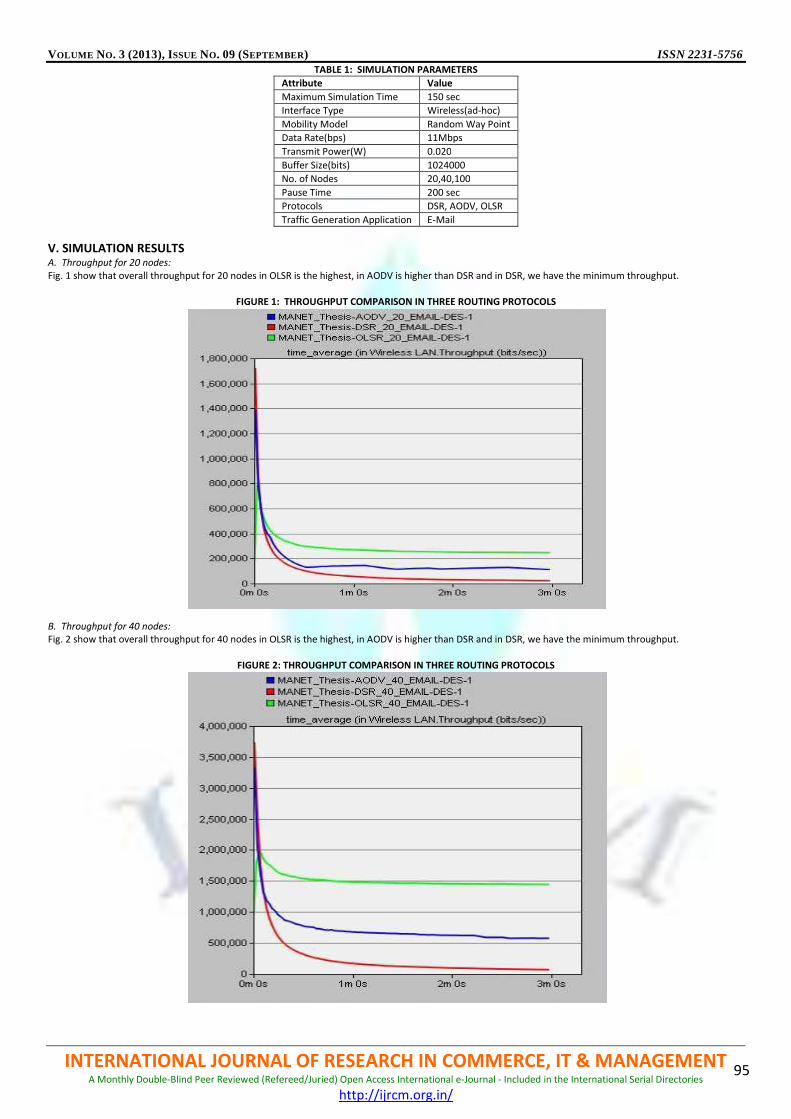
VOLUME NO. 3 (2013), I SSUE NO. 09 (SEPTEMBER ) ISSN 2231-5756
INTERNATIONAL JOURNAL OF RESEARCH IN COMMERCE, IT & MANAGEMENT A Monthly Double-Blind Peer Reviewed (Refereed/Juried) Open Access International e-Journal - Included in the International Serial Directories
http://ijrcm.org.in/
95
TABLE 1: SIMULATION PARAMETERS
Attribute Value
Maximum Simulation Time 150 sec
Interface Type Wireless(ad-hoc)
Mobility Model Random Way Point
Data Rate(bps) 11Mbps
Transmit Power(W) 0.020
Buffer Size(bits) 1024000
No. of Nodes 20,40,100
Pause Time 200 sec
Protocols DSR, AODV, OLSR
Traffic Generation Application E-Mail
V. SIMULATION RESULTS A. Throughput for 20 nodes:
Fig. 1 show that overall throughput for 20 nodes in OLSR is the highest, in AODV is higher than DSR and in DSR, we have the minimum throughput.
FIGURE 1: THROUGHPUT COMPARISON IN THREE ROUTING PROTOCOLS
B. Throughput for 40 nodes:
Fig. 2 show that overall throughput for 40 nodes in OLSR is the highest, in AODV is higher than DSR and in DSR, we have the minimum throughput.
FIGURE 2: THROUGHPUT COMPARISON IN THREE ROUTING PROTOCOLS

VOLUME NO. 3 (2013), I SSUE NO. 09 (SEPTEMBER ) ISSN 2231-5756
INTERNATIONAL JOURNAL OF RESEARCH IN COMMERCE, IT & MANAGEMENT A Monthly Double-Blind Peer Reviewed (Refereed/Juried) Open Access International e-Journal - Included in the International Serial Directories
http://ijrcm.org.in/
96
C. Throughput for 100 nodes:
Fig. 3 show that overall throughput for 100 nodes in OLSR is the highest, in AODV is higher than DSR and in DSR, we have the minimum throughput.
FIGURE 3: THROUGHPUT COMPARISON IN THREE ROUTING PROTOCOLS
D. Overall throughput evaluation:
We can also present performance metrics with KIVIAT diagram. This diagram helps us in quick identification of performance evaluation. We consider the
obtained value of three MANET Routing Protocols; AODV, OLSR and DSR. According to Fig. 4, we can conclude that OLSR and AODV perform better than DSR,
because of their values in this diagram.
FIGURE 4: KIVIAT DIAGRAM WITH “THROUGHPUT” FOR AODV, OLSR AND DSR ROUTING PROTOCOLS COMPARISON
VI. CONCLUSION In this paper, Scalable performance of AODV, OLSR, and DSR were evaluated, using OPNET modeler 14.5. We summarized the results in table 2. Numbers used in
this table show the best to worst choice in selecting routing protocols. Number “3” represents the best protocol, and number “1” shows the worst one.
TABLE 2: COMPARISION BETWEEN MANET ROUTING PROTOCOLS
Routing Protocol Reactive/ Proactive Throughput
AODV Reactive 2
OLSR Proactive 3
DSR Reactive 1
00.5
11.5
22.5
3
AODV
Reactive
OLSR
Proactive
DSR
Reactive
Throughput
Throughput
VOLUME NO. 3 (2013), I SSUE NO. 09 (SEPTEMBER ) ISSN 2231-5756
INTERNATIONAL JOURNAL OF RESEARCH IN COMMERCE, IT & MANAGEMENT A Monthly Double-Blind Peer Reviewed (Refereed/Juried) Open Access International e-Journal - Included in the International Serial Directories
http://ijrcm.org.in/
97
From the above table, we can see that, DSR is the worst choice when we consider Throughput. Best and Average values belong to OLSR and AODV. In summary,
we can say that OLSR perform better than others and DSR is the worst routing protocol here.
REFERENCES 1. A. Suresh, Dr. K. Duraiswamy, “Scalable Instant Way Point Routing Protocol for MANET”, Second International conference on Computing, Communication
and Networking Technologies, Karur, India, 29-31 July 2010, IEEE.
2. Amandeep Makkar, Bharat Bhushan, Shelja and Sunil Taneja, “Behavioral study of MANET Routing Protocols”, International Journal of Innovation,
Management and Technology, Singapore, Vol. 2,No. 3, June 2011.
3. Asha Ambhaikar H.R. Sharma V.K.Mohabey, “Scalability Performance of MANET Routing protocols with Reference to Variable Pause Time”, International
Journal on Computer Science and Engineering, Vol. 02, No. 09, PP. 3021-3024,2010.
4. Ashish Shrestha, Firat tekiner, “On MANET Routing protocols for Mobility and Scalability” 2009 International Conference on Parallel and Distributed
Computing, Applications and Technologies, Higashi Hiroshima, Dec- 2009, IEEE.
5. Bo Ryu, Zhensheng Zhang, David Tang, Leon Ma, Hua Zhu, Vivek Gulati, Joe Huang, Ajay Gummalla, Barbara Sorensen, “A Coding-Based Routing for Scalable
MANET”, Military Communications Conference, MILCOM 2006, Florida, 23-25 Oct. 2006, IEEE.
6. E. Baccelli, J. Schiller, “Towards Scalable MANETs”, 8th International Conference on ITS Telecommunications, Thailand, 24-24 Oct. 2008, IEEE.
7. Hean Kuan Ong, Hean Loong Ong, Elok Robert Tee and R. Sureswaran, “Scalability study of ad-hoc wireless mobile network routing protocol in sparse and
dense networks” Distributed Frameworks for Multimedia Applications, 2006. The 2nd International Conference, Pulau Pinang, May 2006, IEEE.
8. Laxmi Shrivastava, Sarita S. Bhadauria, G.S.Tomar, “Performance Evaluation of Routing Protocols in MANET with different traffic loads”, 2011 International
Conference on Communication Systems and Network Technologies, Harbin, China, June 2011, IEEE.
9. M.Tamilarasi, Shyam Sunder V R, Udara Milinda Haputhanthri, Chamath Somathilaka , Nannuri Ravi Babu , S.Chandramathi T.G. Palanivelu, “Scalability
Improved DSR Protocol for MANETs”, International Conference on Computational Intelligence and Multimedia Applications 2007, Sivakasi, Tamil Nadu,
Dec. 2007, IEEE.
10. Prashant Singh, D.K. Lobiyal, “Scalability of Routing in MANET”, 2010 Second International Conference on Communication Software and Networks,
Singapore, Feb 2010, IEEE.
11. Roxana Zoican, “Analysis of Scalability in MANET’s Protocols”, 8th IEEE International Conference, Serbia, 26-28 Sep, 2006, IEEE.
12. Srinivas Sethi Siba K.Udgata, “Scalable Cluster Based Ad hoc On-demand Distance Vector Routing Protocol for MANET”, Sixth International Conference on
Wireless Communication and Sensor Networks, IIIT, Allahabad, 15-19 Dec. 2010, IEEE.
13. Suyang Ju and Joseph B. Evans, “Scalable Cognitive Routing Protocol for Mobile Ad-Hoc Networks”, IEEE Global Telecommunications Conference, USA, 6-
10 Dec. 2010, IEEE.
14. Yogesh Chaba, Yudhvir Singh and Aarti, “Performance analysis of Scalability and Mobility On Routing Protocols in MANET”, International Journal of
Information Technology and Knowledge Management, Vol. 1,No. 2, PP. 327-336, Jul-Dec,2008.
15. Ammar Odeh, Eman AbdelFattah and Muneer Alshowkan, “PERFORMANCE EVALUATION OF AODV AND DSR ROUTING PROTOCOLS IN MANET
NETWORKS” , International Journal of Distributed and Parallel Systems, USA, Vol.3, No.4, PP.13-22, July 2012.
16. Muhammad Waqas Soomro, Majid Ali Memon and Muhammad Irean Abro, “PERFORMANCE ANALYSIS OF ROUTING PROTOCOLS IN MANET WITH STATIC
AND MOBILE NODES USING HTTP TRAFFIC”, IICT, Mehran University of Engineering & Technology, Pakistan, ISSN: 2278-9901, Vol.1, Issue 2, PP. 23-31, Nov
2012.
17. Parvinder Singh , Dinesh Singh and Vikram Singh, “Evaluation of Routing Protocols in MANETs with Varying Network Scope”, International Conference on
Information and Network Technology ,IACSIT Press, Singapore, PP. 215-219,2012.
18. Megha Rastogi, Kamal Kant Ahirwar and Abhay Bansal, “Traffic Generator Based Performance Evaluation of Proactive and Reactive Protocols of Mobile Ad-
Hoc Networks”, International Journal of Scientific & Technology Research Volume 1, Issue 4, ISSN: 2277-8616, PP.118-121, MAY 2012.
19. Deepak Kumar, Ashutosh Srivastava and S. C. Gupta, “Performance Comparison of Pro-active and Reactive Routing Protocols for MANET”, Department of
Electrical Engineering, Institute of Technology, Banaras Hindu University, Varanasi, India,2011.
20. Dr. Panos Bakalis and Bello Lawal, “Performance Evaluation of CBR and TCP Traffic Models on MANET using DSR Routing Protocol”, International
Conference on Communications and Mobile Computing, UK, IEEE, PP.318-322, 2010.
21. Introduction to OPNET Modeler, 2007 OPNET Technologies.
22. http://www.ietf.org/rfc/rfc2501.txt
23. http://www.ietf.org/mail-archive/web/manet/current/msg00940.html

VOLUME NO. 3 (2013), I SSUE NO. 09 (SEPTEMBER ) ISSN 2231-5756
INTERNATIONAL JOURNAL OF RESEARCH IN COMMERCE, IT & MANAGEMENT A Monthly Double-Blind Peer Reviewed (Refereed/Juried) Open Access International e-Journal - Included in the International Serial Directories
http://ijrcm.org.in/
98
DETAILED INVESTIGATION OF RESIDENTIAL SATISFACTION IN APARTMENT’S MANAGEMENT SERVICE
P. BALATHANDAYUTHAM
ASST. PROFESSOR
DEPARTMENT OF BUSINESS ADMINISTRATION
ANNAMALAI UNIVERSITY
ANNAMALAI NAGAR
DR. R. SRITHARAN
ASST. PROFESSOR
DEPARTMENT OF BUSINESS ADMINISTRATION
ANNAMALAI UNIVERSITY
ANNAMALAI NAGAR
ABSTRACT The purpose of this research is to investigate the residential satisfaction of apartment management service. Simple random sampling was carried out.
Questionnaires were collected from 105 respondents. Data required was collected from apartment residents of Chennai city. Analysis was done through ANOVA.
Taking the age factor into consideration, it is proven that below 30 age group respondents are highly satisfied when compared to above 50 age group
respondents.
KEYWORDS Residential Satisfaction, Apartment Satisfaction.
INTRODUCTION wning a house is the dream of every individual. Consequently, apartment culture is attaining a greater importance in the present scenario. Management
of the apartment plays a significant role in residential satisfaction.
Most new homes already include a wide variety of innovative features, which leaves only quality of service to set a builder apart from others offering
similar homes in similar markets. Large builders of new home construction typically have internal sales personnel that play the role of the real estate agent.
These real estate agents represent the builder and they are the first point of contact for potential home buyers. Thus, home builders face a critical challenge –
the need to thoroughly understand and define home buyers’ needs for high-quality service, to better prepare their personnel. Regrettably, many home builders
do not recognize this need, and their present business processes do not support it (NAHB, 2003).
Although much research has been done regarding home-buyer satisfaction with their house and builders’ service, there is still a gap between builders’ and home
buyers’ perception of quality (Torbica and Stroh, 2001; Bashford et al., 2002). Torbica and Stroh (2001) showed that satisfaction with service is the most
important component shaping overall home-buyer satisfaction and that service is the area in which builders demonstrated the poorest performance. Thus,
builders need to identify and understand buyer needs in order to constantly improve service.
REVIEW OF LITERATURE Isabelina Nahmens (2009), observed the customer satisfaction with service quality and home-buyer expectations and their perceptions of service quality. The
target groups of his study were buyers of single family houses built during calendar year 2001 in five counties in central Florida and data collected on late June
2003 and lasted until August 2003. Under the single family group they have selected randomly 150 samples. Researcher has identified five dimensions of service
quality namely appearance, reliability, timeliness, knowledge and empathy. It is observed that the influence of these variables on customer satisfaction with
service quality can positively impact home builders through improved reputation and increased local referrals.
While customer satisfaction studies have not been undertaken in the construction industry, the housing industry has conducted such studies. Most of these
studies have been undertaken to characterize the relationship between the customer (owner) and the construction companies. Compared with the notable
scarcity of investigations concerning customer satisfaction in the field of construction, a rapidly growing number of studies in the service industries have been
published over the past few years. The results of the studies demonstrate strong correlation between customer satisfaction, or service quality, and economic
returns (Holm 2000).
According to Parasuraman et al. (1988), service quality can be defined as an overall judgment similar to attitude towards the service and generally accepted as
an antecedent of overall customer satisfaction (Zeithaml and Bitner, 1996). Parasuraman et al. (1988) have defined service quality as the ability of the
organization to meet or exceed
RESEARCH METHODOLOGY The developed questionnaire was circulated among apartment purchasers for their personal usage. The questionnaire consists of 18 questions and is divided
into two parts. The first part of the questionnaire includes satisfaction, reliability, timeliness, knowledge and empathy. The second part consists of general
information of the respondents, such as age, gender, occupations, number of family members and household income. 200 samples were circulated and 105
were received with full response and the remaining were disqualified due to biased information
ANALYSIS AND DISCUSSIONS TABLE 1: OVERALL SATISFACTION WITH RESPECT TO AGE
DESCRIPTIVE
OVERALL SATISFACTION
N Mean Std. Deviation Std. Error F Sig.
below 30 10 3.40 1.265 .400
31- 40 40 2.88 .911 .144
41-50 44 3.39 1.298 .196 1.472 0.227
above 50 11 3.18 1.401 .423
Total 105 3.17 1.180 .115
O
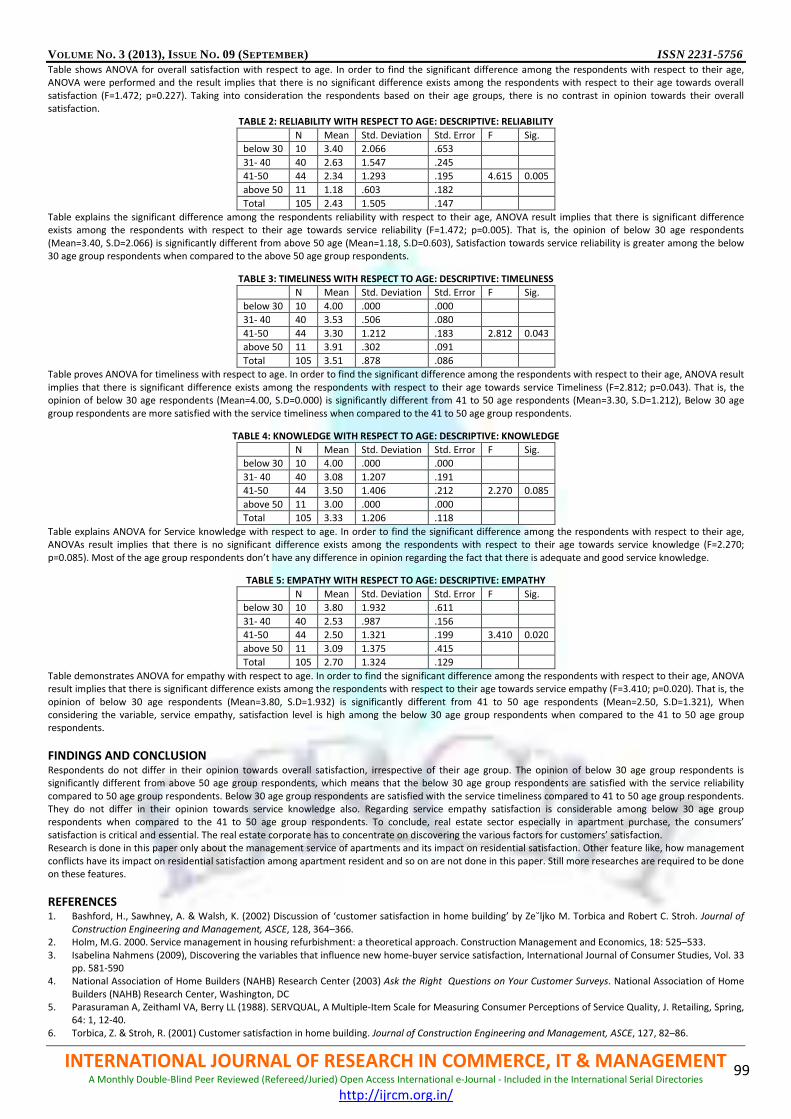
VOLUME NO. 3 (2013), I SSUE NO. 09 (SEPTEMBER ) ISSN 2231-5756
INTERNATIONAL JOURNAL OF RESEARCH IN COMMERCE, IT & MANAGEMENT A Monthly Double-Blind Peer Reviewed (Refereed/Juried) Open Access International e-Journal - Included in the International Serial Directories
http://ijrcm.org.in/
99
Table shows ANOVA for overall satisfaction with respect to age. In order to find the significant difference among the respondents with respect to their age,
ANOVA were performed and the result implies that there is no significant difference exists among the respondents with respect to their age towards overall
satisfaction (F=1.472; p=0.227). Taking into consideration the respondents based on their age groups, there is no contrast in opinion towards their overall
satisfaction.
TABLE 2: RELIABILITY WITH RESPECT TO AGE: DESCRIPTIVE: RELIABILITY
N Mean Std. Deviation Std. Error F Sig.
below 30 10 3.40 2.066 .653
31- 40 40 2.63 1.547 .245
41-50 44 2.34 1.293 .195 4.615 0.005
above 50 11 1.18 .603 .182
Total 105 2.43 1.505 .147
Table explains the significant difference among the respondents reliability with respect to their age, ANOVA result implies that there is significant difference
exists among the respondents with respect to their age towards service reliability (F=1.472; p=0.005). That is, the opinion of below 30 age respondents
(Mean=3.40, S.D=2.066) is significantly different from above 50 age (Mean=1.18, S.D=0.603), Satisfaction towards service reliability is greater among the below
30 age group respondents when compared to the above 50 age group respondents.
TABLE 3: TIMELINESS WITH RESPECT TO AGE: DESCRIPTIVE: TIMELINESS
N Mean Std. Deviation Std. Error F Sig.
below 30 10 4.00 .000 .000
31- 40 40 3.53 .506 .080
41-50 44 3.30 1.212 .183 2.812 0.043
above 50 11 3.91 .302 .091
Total 105 3.51 .878 .086
Table proves ANOVA for timeliness with respect to age. In order to find the significant difference among the respondents with respect to their age, ANOVA result
implies that there is significant difference exists among the respondents with respect to their age towards service Timeliness (F=2.812; p=0.043). That is, the
opinion of below 30 age respondents (Mean=4.00, S.D=0.000) is significantly different from 41 to 50 age respondents (Mean=3.30, S.D=1.212), Below 30 age
group respondents are more satisfied with the service timeliness when compared to the 41 to 50 age group respondents.
TABLE 4: KNOWLEDGE WITH RESPECT TO AGE: DESCRIPTIVE: KNOWLEDGE
N Mean Std. Deviation Std. Error F Sig.
below 30 10 4.00 .000 .000
31- 40 40 3.08 1.207 .191
41-50 44 3.50 1.406 .212 2.270 0.085
above 50 11 3.00 .000 .000
Total 105 3.33 1.206 .118
Table explains ANOVA for Service knowledge with respect to age. In order to find the significant difference among the respondents with respect to their age,
ANOVAs result implies that there is no significant difference exists among the respondents with respect to their age towards service knowledge (F=2.270;
p=0.085). Most of the age group respondents don’t have any difference in opinion regarding the fact that there is adequate and good service knowledge.
TABLE 5: EMPATHY WITH RESPECT TO AGE: DESCRIPTIVE: EMPATHY
N Mean Std. Deviation Std. Error F Sig.
below 30 10 3.80 1.932 .611
31- 40 40 2.53 .987 .156
41-50 44 2.50 1.321 .199 3.410 0.020
above 50 11 3.09 1.375 .415
Total 105 2.70 1.324 .129
Table demonstrates ANOVA for empathy with respect to age. In order to find the significant difference among the respondents with respect to their age, ANOVA
result implies that there is significant difference exists among the respondents with respect to their age towards service empathy (F=3.410; p=0.020). That is, the
opinion of below 30 age respondents (Mean=3.80, S.D=1.932) is significantly different from 41 to 50 age respondents (Mean=2.50, S.D=1.321), When
considering the variable, service empathy, satisfaction level is high among the below 30 age group respondents when compared to the 41 to 50 age group
respondents.
FINDINGS AND CONCLUSION Respondents do not differ in their opinion towards overall satisfaction, irrespective of their age group. The opinion of below 30 age group respondents is
significantly different from above 50 age group respondents, which means that the below 30 age group respondents are satisfied with the service reliability
compared to 50 age group respondents. Below 30 age group respondents are satisfied with the service timeliness compared to 41 to 50 age group respondents.
They do not differ in their opinion towards service knowledge also. Regarding service empathy satisfaction is considerable among below 30 age group
respondents when compared to the 41 to 50 age group respondents. To conclude, real estate sector especially in apartment purchase, the consumers’
satisfaction is critical and essential. The real estate corporate has to concentrate on discovering the various factors for customers’ satisfaction.
Research is done in this paper only about the management service of apartments and its impact on residential satisfaction. Other feature like, how management
conflicts have its impact on residential satisfaction among apartment resident and so on are not done in this paper. Still more researches are required to be done
on these features.
REFERENCES 1. Bashford, H., Sawhney, A. & Walsh, K. (2002) Discussion of ‘customer satisfaction in home building’ by Ze˘ljko M. Torbica and Robert C. Stroh. Journal of
Construction Engineering and Management, ASCE, 128, 364–366.
2. Holm, M.G. 2000. Service management in housing refurbishment: a theoretical approach. Construction Management and Economics, 18: 525–533.
3. Isabelina Nahmens (2009), Discovering the variables that influence new home-buyer service satisfaction, International Journal of Consumer Studies, Vol. 33
pp. 581-590
4. National Association of Home Builders (NAHB) Research Center (2003) Ask the Right Questions on Your Customer Surveys. National Association of Home
Builders (NAHB) Research Center, Washington, DC
5. Parasuraman A, Zeithaml VA, Berry LL (1988). SERVQUAL, A Multiple-Item Scale for Measuring Consumer Perceptions of Service Quality, J. Retailing, Spring,
64: 1, 12-40.
6. Torbica, Z. & Stroh, R. (2001) Customer satisfaction in home building. Journal of Construction Engineering and Management, ASCE, 127, 82–86.

VOLUME NO. 3 (2013), I SSUE NO. 09 (SEPTEMBER ) ISSN 2231-5756
INTERNATIONAL JOURNAL OF RESEARCH IN COMMERCE, IT & MANAGEMENT A Monthly Double-Blind Peer Reviewed (Refereed/Juried) Open Access International e-Journal - Included in the International Serial Directories
http://ijrcm.org.in/
100
A STUDY ON THE PSYCHOLOGICAL IMPACT OF REDUNDANCY ON SURVIVORS
S.SOWJANYA
ASST. PROFESSOR
RAJEEV GANDHI MEMORIAL COLLEGE OF ENGINEERING & TECHNOLOGY
NANDYAL
ABSTRACT The challenging economic times facing many countries over the last few years has resulted in many changes as like making redundancies. Whilst this clearly has
major impact on those being made redundant, there also impacts for those left behind. The impact on those remaining can also be traumatic and can further
hinder a company’s ability to survive if not managed effectively.‘Survivor Syndrome’ describes the physical and psychological impact of redundancies on the
remaining staff that who does not lose their jobs. Redundancies often come with survivor syndrome and form massive downsizing to just one or two employees;
redundancies have a negative effect on the workforce. For the ‘survivors’ there needs to be strategies and measures in place to restore the work place back to its
previous state or at least a state of optimum productivity and engagement.
KEYWORDS Layoff, Productivity, Redundancy, Survivors, Survivor Syndrome.
APPROACH his article is related to the survivors who feel insecure by the adoption of layoffs in the organization and the impact on productivity.When redundancy
becomes necessary quite rightly the initial focus in those being let go. Yet all too often little consideration is afforded to those who remain. Employees
wonder if that’s more to come and some will consider leaving before they’re forced out. Those who are left have to cope with the range of emotions
from guilt to survivor’s envy to resentment, emotional contagion and uncertainty that can result from layoffs. The trouble with corporate restructuring or
downsizing is not simply that firms are overdoing it, cutting staff to the point of ‘corporate anorexia’. Nor is it simply those greedy companies are fattening their
profits at the expense of laid-off employees. The fundamental problem with corporate restructuring as it is practised today – as non-going strategy even in
profitable times, rather than as an emergency move- is that it is based on a flawed vision of that makes people and organizations work well. It creates an
unhealthy culture in the workplace, and sooner or later we are all going to pay.
INTRODUCTION Organizational change in the form of reorganizations, downsizing and mergers are a part of everyday life for today’s business community. The ability of
organizations to manage change quickly, positively and productively leads to competitive advantage. In these changing organizations, there are three categories
of people, those who will not lose their jobs, those who may lose their jobs and those who will lose their jobs. The first two categories are referred to as
“survivors”. Excessive downsizing experiences create a new psycho-social problem: “survivor syndrome”.
OBJECTIVES OF THE STUDY � To explore the concept of ‘Survivor Syndrome’
� To study the present perception of survivors
� To identify the psychological impact on survivors
� To give suggestions for effective implementation of redundancy strategy
METHODOLOGY The paper attempt to explore the concepts, obviously it’s an exploratory research where earlier studies on the subject matter has been readdressed to give
insight to phenomenon.
Research limitations: This is a conceptual study, and hence, there is no hypothesis tested as an empirical study. It does provide a good foundation for future
research.
CONCEPT This article will examine survivor syndrome, identify its causes and suggest remedies that lead to rebuilding employee commitment to the new organization.
Downsizing refers to the planned elimination of positions or jobs. Downsizing may also occur when an organization reduces work (not just employees) and
implements cost-containment strategies that streamline activities such as transaction processing, information systems, TQM and even re-engineering. The
decision to downsize is usually a strategic one, undertaken to reduce the waste and inefficiency that builds up in an organization over time. It is expected to
improve business development and repositioning for future growth and success.
In 1994, Cameron reported that more than 80 per cent of Fortune 500 companies had downsized in the previous five years and that 100 per cent were planning
to do so in next five years. Virtually every sector has caught the downsizing fever, from federal governments to trade unions. The results of a survey just referred
to, observed “more than half of the 1,468 firms that downsized indicated that productivity deteriorated from downsizing”. In another survey of 1,005 firms that
downsized between 1986 and 1991, it was found that only 46 per cent actually reduced expenses, only 32 per cent actually increased profits, and only 22 per
cent actually increased productivity. According to a Wall Street Journal article published in 1994, “profits increased in less than half of 531 large companies two
years after restructuring; only 37 percent of 500 companies who downsized since 1987 reported increased profits”. There are many more recent surveys that
have documented similar results. The basic and a priori strategic plans do not seem to correlate with the a posteriori results of studies indicating less than
rousing success. The objectives are quite well-known before starting the process of downsizing, as well as the expected benefits to the organization such as:
� lower overheads;
� smoother communications;
� less bureaucracy;
� greater entrepreneurship;
� faster decision making; and
� increased productivity
One of the most common reasons why companies that downsize perform so poorly is that they often are successful at anticipating and preparing for the
employees who are to be released, but they may not be prepared for the low morale and lower productivity experienced by the survivors of the downsizing.
Furthermore, when the organization needs its people at their best, they happen to be at their worst. The employees are said to be experiencing what some
human resource professionals are now calling “survivor syndrome” or “sickness” which will be the focus of this article. A downsizing plan must consider the
economic and institutional environments (transition assistance, severance pay, advance notification, etc.), cost benefit (numbers of employees, exit dates,
T

VOLUME NO. 3 (2013), I SSUE NO. 09 (SEPTEMBER ) ISSN 2231-5756
INTERNATIONAL JOURNAL OF RESEARCH IN COMMERCE, IT & MANAGEMENT A Monthly Double-Blind Peer Reviewed (Refereed/Juried) Open Access International e-Journal - Included in the International Serial Directories
http://ijrcm.org.in/
101
severance pays, stay bonuses, relocations costs, etc.) legal determinants, human resources and ethical responsibility. These aspects are very important to obtain
the expected results, and some omissions on the planning of downsizing may result in a failure.
� That downsizing has not been effectivelyplanned, managed, and implemented.
� That downsizing has caused resentmentand resistance in surviving employees.
Examining the critical aspects of human capital and strategic competitiveness, this hypothesis is founded on the fact that, during periods of merger mania and
downsizing, attention is diverted from other important issues. While managers must continue to make short-term operational decisions, other long-term
commitments may be postponed. Also, because investments in human capital do not bring immediate returns, this condition may result in lower investment in
human capital.
Downsizing creates important effects inside and outside an organizational environment. In fact, downsizing results in breaking the organization into several or
many groups. A group of employees leaves; sometimes, a group may receive advance layoff notification and a group stays. Confusion is high because employees
who lose their jobs may not really understand why, since it was not their fault. The decision is often not related to their performance, while the ones who stay
have done nothing more or special to keep their positions. Previous research reveals that organizations often enjoy an initial increase in productivity because
employees work harder and more competitively in an attempt to keep their jobs. This initial increased productivity is short-lived and is followed by a strong in
the organization. This survivor syndrome is defined by some human resource professionals as being the “mixed bag of behaviours and emotions often exhibited
by remaining employees following an organizational downsizing.
Downsizing has become an organizational fact of life, and many surveys have confirmed that the survivors are often ignored before, during and after the
corporate streamlining. The employees that lose their jobs during an organizational downsizing go through an emotionally wrenching experience. Yet the co-
workers who remain with their employers have similar reactions. Todays survivors can be tomorrow’s disgruntled, unproductive workers or tomorrow’s team
players, enthusiastic about being part of a community at work that values their contributions. Organizations have under-estimated the negative effects of
downsizing and do not take into account the difficulties of motivating a surviving workforce emotionally damaged by watching others lose their jobs. Yet,
motivating survivors to achieve greater productivity is essential for company success and employee job security.
PRE-DISPOSING FACTORS THAT CONTRIBUTE TO LAYOFF SURVIVOR SYNDROME INCLUDE:
• Ineffective organizational communication before, during and after the layoff
• Loss of co-workers (support, companionship, sharing work)
• Perceived unfairness and inequity in conducting the layoff
• Unrealistic workloads
• Lack of contact and attention from management
• Loss of trust in the organization and its leaders
• Lack of recognition of the special challenges faced by layoff survivors
• Employees' perception that their work is not valued by the company
JOB INSECURITY: Survivors wonder how long they will be able to keep their jobs, and they worry that they are not prepared to find work elsewhere, or that
there are no comparable outside jobs. This will influence their work behaviours and attitudes on a daily basis.
UNFAIRNES: Doubts arise about the wisdom of the layoff choices made by the managers, as well as the competence with which management has guided the
organization. Most organizations downsized for the first time, therefore the exercise was not planned, managed and implemented effectively. Employees have
felt that the process was not fair.
DEPRESSION, ANXIETY, FATIGUE: The process is demoralizing and stressful for the managers who must lay off employees, as well as for employees who lose
friends and colleagues. No one is prepared, including the managers having the difficult task of announcing the new structure. One poll of 1,142 companies that
downsized, conducted by the American Management Association, revealed that nearly half were “badly” or “not well” prepared for the dismantling, and had not
anticipated the kinds of problems that developed subsequently. More than half reported that they had begun downsizing with no policies or programmes. High
on the list of anxieties were often unspoken questions like: “Will I be the next to go – even though it looks now as if I’m staying?”
REDUCED RISK TAKING AND MOTIVATION: Many survivors are afraid to take advantage of an employment opportunity, accept a new work assignment, or
discuss a work related problem for fear that they expose themselves to criticism or poor performance appraisals and, therefore, become the target of the future
layoff. They try to fit very well into their actual position of being “safe”.
DISTRUST AND BETRAYAL: Some employees no longer sense the organization’s future or their place as an integral member of the organization. Employees do
not see why they should be concerned about their employer, since this employer was not really concerned for their colleagues.
LACK OF RECIPROCAL COMMITMENT: Some employees feel the organization has abandoned them. It has not treated them with the dignity and respect to
which they believe they are entitled. The kind win-win situation (employee-employer) developed over the years was totally cancelled.
DISSATISFACTION WITH PLANNING AND COMMUNICATION: Lack of communication and adequate preparation of employees for layoffs causes survivors to
view the entire process with suspicion. Only 44 per cent of companies that downsized in the last five years shared details of their plans with employees, and
even fewer (34 per cent) told survivors how they would fit into the company’s new strategy, according to a 1992 survey of 1,020 directors of human resources.
DISSATISFACTION WITH THE LAYOFF PROCESS: Layoffs that are handled insensitively or in a humiliating fashion create permanent resentment amongst
employees.
LACK OF STRATEGIC DIRECTION: The concentration on short-term cash problems leads employees to suspect the validity of the long-term strategy of the
organization. Most companies communicate their longterm plan and, in a few weeks, priorities change dramatically. Management energy is absorbed and all
aspects of corporate culture are diversified.
LACK OF MANAGEMENT CREDIBILITY: Some employees believe management is no longer capable of addressing the core business concerns of the organization.
SHORT-TERM PROFIT ORIENTATION: Some survivors fear that management will institute further layoffs if profits do not reach acceptable levels in the near
future.
SENSE OF PERMANENT CHANGE: There is an overall sense that working for the organization will never be as good as it once was. Managers who remain after
downsizing are working in a different environment and they must adapt themselves to this new organization that is not as friendly as before. They are now
managing more people and jobs, and have to work longer hours because their job descriptions and the expected outcomes have not changed. They must
establish a new network, since some of their contacts are gone or have been moved. Some managers will adapt, many are not willing or able to work under
these conditions. Furthermore, surviving employees become narrow-minded, self-absorbed and risk-aversive. Morale sinks, productivity drops and survivors
distrust management there is also the impact of survivors’ guilt. This guilty feeling is experienced by the supervisors who do the laying off, as well as by the
surviving workers. These workers contemplate why their colleagues were laid off instead of themselves.
PRE-DISPOSING FACTORS THAT CONTRIBUTE TO LAYOFF SURVIVOR SYNDROME INCLUDE:
• Ineffective organizational communication before, during and after the layoff
• Loss of co-workers (support, companionship, sharing work)
• Perceived unfairness and inequity in conducting the layoff
• Unrealistic workloads
• Lack of contact and attention from management
• Loss of trust in the organization and its leaders
• Lack of recognition of the special challenges faced by layoff survivors
• Employees' perception that their work is not valued by the company

VOLUME NO. 3 (2013), I SSUE NO. 09 (SEPTEMBER ) ISSN 2231-5756
INTERNATIONAL JOURNAL OF RESEARCH IN COMMERCE, IT & MANAGEMENT A Monthly Double-Blind Peer Reviewed (Refereed/Juried) Open Access International e-Journal - Included in the International Serial Directories
http://ijrcm.org.in/
102
THERE ARE SEVERAL POINTS THAT ORGANIZATIONAL LEADERS SHOULD BEAR IN MIND:
� When planning a layoff or restructuring, don't forget to include the survivors and anticipate their special needs.
� Remember that fear of losing one's job is not a positive source of motivation.
� Don’t expect the survivors to express gratitude about keeping their jobs by working harder and better.
� Seek ways to offset the effects of increased workload on the remaining employees by redefining responsibilities and streamlining tasks.
� How the layoff is carried out affects those who stay. Downsizing should be conducted with fairness, respect, and effective communication.
� Managers should be empowered and trained to effectively lead their employees into the new, unknown territory of the post-layoff organization.
� Be alert to possible signs of Layoff Survivor Syndrome, such as increasing absenteeism, sick leave, tardiness, and tension among workers.
'SURVIVOR SYNDROME' – REVIEW
'Survivor syndrome' – which describes the physical and psychological impact of redundancies on the remaining staff who didn't lose their jobs – has affected
many employers in the current economic climate, according to a survey by Personnel Today's sister publication IRS Employment Review.
The survey of 116 employers – covering a combined workforce of almost 425,000 people – showed that survivor syndrome can limit the potential financial
savings of redundancies by reducing the performance and attendance of the remaining employees, and increasing staff turnover.
Employers that had been through one redundancy programme were affected by an average of 3.4 different negative responses from remaining staff, while those
that had been through more than one experienced an average of 4.2. These included lower morale (67%), reduced motivation (53%), higher rates of sickness
absence (65% of employers reported increased stress levels among the remaining employees), and retention problems (17%).
However, the findings revealed that there were ways to limit the impact of survivor syndrome on organisations, namely through effective communication
processes. Some 85.7% of respondents said they "strive to communicate meaningfully with all employees during a redundancy programme".
The respondents attempted to retain their survivors by consulting them on the implications of the redundancy programme for them (81.2%), providing them
with practical support (56.4%), involving them in change programmes (48.5%) and undertaking employee engagement exercises (24.7%).
The most effective communication methods were found to be general staff meetings and briefings by line managers. Top tips included being open and honest,
providing regular feedback and encouraging staff to voice their concerns.
Of the employers surveyed, 84.5% had made redundancies over the past three years. Most of this group (92%) had experienced job losses in the year to
February/March 2009.
Survivor syndrome is likely to become even more prevalent as job cuts continue. Some 70.5% of respondents anticipate further redundancies in the coming year.
And they expect to lose 45% more employees in the coming 12 months than they made redundant in the previous three years.
CONCLUSION If an organisation is about to make redundancies, particularly on a large scale, it is likely that employees in the new ‘slimmed down’ organisation will suffer some
effects of survivor syndrome. However, the impact of the syndrome can be greatly reduced by taking proactive steps to understand and address its root causes.
Effective survivor management can give organisations a real opportunity to improve the commitment and engagement of the remaining workforce, thus
securing the health of the business in the long term.
� Provide training to the employees
� Fair pays to them
� Decentralisation of authority
� Providing perks
� Involving them in decision making and planning
REFERENCES 1. Buchholz, S., “Creating our future: leading change for competitive advantage”, Workshop for Canadian National Railway, 1993, pp. 2-5.
2. Cameron, K.S., “Strategies for successful organizational downsizing”, Human Resource Management, Vol. 33 No. 2, Summer 1994,pp. 189-211.
3. Carr, C., “Seven keys to successful change”,Training, February 1994, pp. 35-60.Steven H. Appelbaum, Claude Delage, Nadia Labiband George Gault. The
survivor syndrome: aftermath of downsizing Career DevelopmentInternationa2/6 [1997] 278–286[ 286 ]
4. Cascio, W.F., “Downsizing: what do we know? What have we learned”, Academy of Management Executive, Vol. 7 No. 1., February 1993,pp. 95-104.
5. Chaudron, D., “After the layoffs: healing and rebuilding”, HR Focus, Vol. 21 No. 12, December1994, pp. 9-10.
6. Doherty, N. and Horsted, J., “Helping survivorsto stay on board”, People management, Vol. 1No. 1, January 1995, pp. 26-31.
7. Greenberg, J., “Organizational justice: yesterday, today and tomorrow”, Journal of Management, Vol. 16 No. 2, 1990, pp. 399-432.
8. Hitt, M.A., Hoskisson, R.E., Harrison, J.S. and Summers, T.P., “Human capital and strategic competitiveness in the 1990s”, Journal of Management, Vol. 13
No. 1, 1994, pp. 35-64.
9. Isabella, L.A., “Downsizing: survivors’ assessments”, Business Horizons, May-june 1989,pp. 35-41.
10. Koonce, R., “The people side of organizational change”, Credit Magazine, Vol. 17 No. 6, November/December, 1991, pp. 22-5.
11. Labib, N. and Appelbaum, S.H., “The impact of downsizing practices on corporate success”, Journal of management Development, Vol. 13 No. 13, June
1994, pp. 59-84.
12. Leana, C.R., “Corporate anorexia: the latest management trend – cutting jobs – creates an unhealthy culture in the workplace”, The Gazette, Montreal, 25
November 1995, p. B6.
13. Markowich, M., “Lifeboat strategies for corporate renewal”, Management Review, Vol. 83No. 9, September 1994, pp. 59-61.
14. Moskal, B.S., “Managing survivors”, Industry Week, 3 August 1992, pp. 14-22.
15. Rickey, M.W., “The impact of corporate downsizing on employees”, Business Forum, Vol. 17No. 3, Summer 1992, pp. 9-13.
16. Schweiger, D.M., Ivancevich, J.M. and Power, F.R., “Executive actions for managing human resources before and after acquisition”, Academy of
Management Executive, Vol.1 No. 2, 1987, pp. 127-38.
17. Spaniel, B., “Feeling guilty because you survived a layoff? You’re not alone”, Communication World, Vol. 12 No. 5, May 1995, pp. 23.
18. Waldman, D.A. and Spangler, W.D., “Putting together the pieces: a closer look at the determinants of job performance”, Human Performance, Vol. 2 No. 1,
1989, pp. 29-59.
19. Woodward, H. and Buchholz, S., Aftershock, Helping People through Corporate Change,John Wiley & Sons, New York and Chichester,1987.
VOLUME NO. 3 (2013), I SSUE NO. 09 (SEPTEMBER ) ISSN 2231-5756
INTERNATIONAL JOURNAL OF RESEARCH IN COMMERCE, IT & MANAGEMENT A Monthly Double-Blind Peer Reviewed (Refereed/Juried) Open Access International e-Journal - Included in the International Serial Directories
http://ijrcm.org.in/
103
A STUDY ON SECURITY THREAT AWARENESS AMONG STUDENTS USING SOCIAL NETWORKING SITES, BY
APPLYING DATA MINING TECHNIQUES
A.PAPPU RAJAN
ASST. PROFESSOR (SYSTEMS)
ST. JOSEPH’S INSTITUTE OF MANAGEMENT
ST.JOSEPH’S COLLEGE (AUTONOMOUS)
TIRUCHIRAPPALLI
ABSTRACT In an era of technology with increasing number of smart gadgets and decreasing cost of internet service has led people to interact in virtual worlds, universally
known as social networking sites. Sites like Facebook, Twitter, Linkedin, Hi5, Myspace, etc., have made use of internet as a communication point which surpassed
the traditional communication platform of the real world. The ease of sharing information in the field of education, social and professional had made it still more
popular. Seventy five per cent of internet users in India are in the age group of 15-34. Adding to it the young population all over the world see it as a newest
online trend to express all their feelings, emotions, humiliation, sadness and joy in the form of post, tweet, status, videos, pictures, etc without considering the
aftermath of their actions. The objective of this paper is to throw lime light on user’s perception of security and privacy when interacting in Social Networking
Sites [SNS] with respect to students in Tiruchirapalli, Tamil Nadu, India. This paper concludes with the set of guidelines for social networking users to recognize
the threats and methods to devoid the same.
KEYWORDS security threat awareness, social networking sites.
INTRODUCTION n an era of technology with increasing number of smart gadgets and decreasing cost of internet service has led people to interact in virtual worlds,
universally known as social networking sites. Sites like Facebook, Twitter, LinkedIn, Hi5, Myspace, etc., has made use of internet as a communication point
which surpassed the traditional communication platform of real world. The ease of sharing information in various fields like education, social issues, job
related issues and entertainment had made it still more popular. Seventy five per cent of internet users in India are in the age group of 15-34. Adding to it the
young population all over the world see it as a newest online trend to express all their feelings, emotions, humiliations, sadness, and joy in the form of posts,
tweets, status, videos, pictures etc., without considering the aftermath of their actions. The objective of this paper is to throw lime light on user’s perception of
security and privacy when interacting in social networking sites [SNS] with respect to students in Tiruchitappalli. This paper concludes with the set of guidelines
for social networking users to recognize the threats and methods to devoid the same.
Facebook launched its app centre thus expanding their operations worldwide with the ultimate aim to reach a large number of Facebook users. When they grow
their business they also cause havoc to users by bypassing the privacy settings of millions of users, recent example shows how Google breached the privacy of
apple users by denying the users request to reject cookies. As a result of which Google paid $22.5 million as a settlement charge. In spite of these issues, online
social networks drive the youths crazy.
Famous twitter “onmouseover” attack on September 2011 would have not been forgotten by many of us. Though the vulnerabilities were patched, sensible
security has been lost.but records show that twitter has surpassed half billion users in the month of July 2013.
REVIEW OF STUDIES A social networking service is an online service that focuses on facilitating the building of social networks or social relations among people who share their
interests, activities, backgrounds, or real-life connections. A social network service consists of a representation of each user (often a profile), his/her social links,
and a variety of additional services. Most social network services are web-based and provide means for users to interact over the internet, such as e-
mail and instant messaging. Social networking sites allow users to share ideas, activities, events, and interests within their individual networks. The top 15 most
popular social networking sites as derived from ebizmba rank which is a constantly updated average of each website's alexa global traffic rank. [8]
Virpi Kristiina Tuunainen et al [2009] has done his research work with special reference to Facebook. It claims that Facebook privacy policy terms and policy
regarding third party applications are not lucid to be understood by the users. Further users are not aware of who can really see their profile and their
information. Empirical study on 210 users was made with two perspectives. One is privacy protection and other is information disclosing.[1]
Latisha Asmaak et al [2011] has conducted survey on 164 users who use online social networks like Facebook, MySpace, LinkedIn, Friendster, YouTube, twitter,
etc. This study claims that Social networking sites are no longer a niche phenomenon but a mass adoption by teenagers. Though the users are concerned about
privacy they are willing to trade their privacy for something beneficial like getting themselves connected to online social network. Creation of multiple fake
accounts, using aliases, deleting wall posts and photo tags, violating the privacy of others is done by students so as to protect their privacy. Thus they misuse the
objectives of their social network sites, which are meant to promote transparency and improve communication.[2]
Maria Patricia M. Revilla[2011] also contributed her research on privacy issues of the world’s largest networking site Facebook . The paper deals in elaborately
on how attackers use their social intelligence in alluring Facebook users. It starts with inviting for a fake event, click jacking, money mule, credit card spam’s, etc.
Melissa de Zwart et al (2011) deals about the potential legal risk faced by Australian children and young people while interacting in online social networking
services (SNS). It states that privacy, disclosure and breach of confidence, intellectual property rights, defamation and criminal laws [ including harassment and
offensive material ] are the main areas of the law that give rise to possible legal liability for young people using online social networking services (SNS).
Respondents convey that online social networking service is the less expensive way to keep in touch with their friends.[3]
Ho Keung Tsoi et al [2011] research reveals the effect of culture variables on users’ privacy concern, user’s motivation, actual usage, overall attitudes and future
behavior intentions and trust in SNS with special reference to Hong Kong and French SNS users. It found that French users have higher privacy concern.
With propagation of web 2.0 novel technologies, the threats also proliferate in proportion with it. It is not arduous to understand this pertaining scenario. The
paper on ICICTE 2012 proceedings by Riaan Rudman et al [2012] has humongous facts. It is specific to South African university students. They use either of the
ways to interact with web 2.0 services namely Information sharing sites, video sharing sites, podcast sharing sites, photo sharing sites, general sharing sites,
software applications, online communication and social networking sites.[4]
Despo Ktoridou et al [2012] research paper is all about users perception of the security and privacy risks while using social networking sites targeting the Cypriot
youth population. The paper also warns how these social networking providers become digital big brothers. Knowingly or unknowingly users are mislead and
their profile information are stored by third party. These data are then used for tailor made advertisements, social engineering attacks, sometimes which create
havoc in personal life. The paper concludes that the users are ignorant of how their personal information are utilized by money minded software giants.[5]
Husein Osman Abdullahi et al [2012] of Malaysia has conducted research on social networking sites privacy and security among IIUM students. Online social
networks like Google+, Facebook, and Twitter are considered. The astonishing finding of the research is 91.9% students [160 samples] use face book. This shows
how students are attracted towards it. 88.1% students use it as a mode to communicate with their friends. Among the 160 samples 60.6% students have their
I

VOLUME NO. 3 (2013), I SSUE NO. 09 (SEPTEMBER ) ISSN 2231-5756
INTERNATIONAL JOURNAL OF RESEARCH IN COMMERCE, IT & MANAGEMENT A Monthly Double-Blind Peer Reviewed (Refereed/Juried) Open Access International e-Journal - Included in the International Serial Directories
http://ijrcm.org.in/
104
Do you access your social networking site via mobil e phone? * GENDER OFTHE RESPONDENT Crosstabulation
34 28 62
28.3 33.7 62.0
54.8% 45.2% 100%
65.4% 45.2% 54.4%
29.8% 24.6% 54.4%
18 34 52
23.7 28.3 52.0
34.6% 65.4% 100%
34.6% 54.8% 45.6%
15.8% 29.8% 45.6%
52 62 114
52.0 62.0 114.0
45.6% 54.4% 100%
100% 100% 100%
45.6% 54.4% 100%
Count
Expected Count
% within Do you access yoursocial networking site via mobilephone?
% within GENDER OF THERESPONDENT
% of Total
Count
Expected Count
% within Do you access yoursocial networking site via mobilephone?
% within GENDER OF THERESPONDENT
% of Total
Count
Expected Count
% within Do you access yoursocial networking site via mobilephone?
% within GENDER OF THERESPONDENT
% of Total
yes
no
Doyouaccess yoursocialnetworkingsiteviamobilephone?
Total
malefemal
e
GENDER OFTHE
RESPONDENT
Total
photographs in their social network profile. The research shows that active online social network users are not aware of their privacy and security in online
environment.[6][7]
DATA MINING Data mining refers to extracting or “mining” knowledge from large amounts of data. Data mining is the process of extracting information from a data set and
transform it into an understandable structure for further use. Data mining is a step in the process of knowledge discovery. [11]
These are the major steps in data mining Process:
1. Data cleaning
2. Data integration
3. Data selection
4. Data transformation
5. Data mining
6. Pattern evaluation
7. Knowledge presentation.
OBJECTIVE • To examine student’s perceptions on privacy and security risk when connecting with online social networking sites
• To check the present level of security awareness prevailing among students
• To identify time spent by students on social networking sites
NEED FOR THE STUDY • The Research project brings out the level of security awareness existing among students who use social networking sites.
• It throws light on users perceptions regarding social networking sites.
• The study has led a different insight towards online social networking sites for students.
• The study is devised to give vital guidelines for safe and threat free online social networking.
SCOPE OF THE STUDY The scope of the study is restricted to Students from Tiruchirappalli district, Tamil Nadu, India. So the results will fit for two Tier cities and can’t be used for other
tier three cities. With given constraints only 130 respondents were been covered.
SAMPLE SIZE A quantitative approach was employed for the purposes of this study, using questionnaires as the main method of data collection. Purposive Non Probability
sampling method is used. Because the study only targets the college students, samples were taken from colleges in Tiruchirappalli . Students of various
discipline like B.E, M.E, M.B.A, B.B.A, B.COM etc was given questionnaire and the data was collected. A total of 130 questionnaires were given to respondents
out of which 125 was returned. Among 125 only 114 used social networking sites and the upcoming entire analysis is done on these 114 respondents.
DATA ANALYSIS AND FINDINGS TOOL USED
SPSS is a software package used for statistical analysis.[20]
SPSS is a comprehensive and flexible statistical analysis and data management solution. SPSS can take
data from almost any type of file and use them to generate tabulated reports, charts, plots of distributions and trends, descriptive statistics, and conduct
complex statistical analyses.
Weka is a collection of machine learning algorithms for data mining tasks. The algorithms can either be applied directly to a dataset or called from your own Java
code. Weka contains tools for data pre-processing, classification, regression, clustering, association rules, and visualization. It is also well-suited for developing
new machine learning schemes. [12]
DISCUSSION
TABLE 1.0: GENDER AND SNS INTERACTION THROUGH MOBILE-CROSSTAB

VOLUME NO. 3 (2013), I SSUE NO. 09 (SEPTEMBER
INTERNATIONAL JOURNAL OF RESEARCH IN COMMERCEA Monthly Double-Blind Peer Reviewed (Refereed
We sampled 114 students and used chi square test as goodness of fit test. The alternative hypothesis [
28 used mobile for accessing their social networks and out of 52 males 34 used mobile for accessing their social networks
use mobile for interacting SNS. Out of 62 females 28 used mobile for accessing their social networks and out of 52 males 34 u
social networks. It seems that more than 54% of males use mob
SNS through mobile are vulnerable to social engineering attacks, because many internet banking facility, ATM card number and
stored in mobile. When the users without awareness or precautions use Third Party Applications, there are possibilities that they ma
mobile phone scams. They might get themselves registered to sites they are unaware of, and shed off mo
SNS USAGE AND TIME SPENT IN A DAY
The histogram below shows that 74.6% students are using social networks daily. Thus students are much allured to the use of s
addiction of using the site daily. Among the 74.6% of daily users there are 28.1% who use SNS da
28.95% of users who use SNS daily at least between1 hour to 2hour. It depicts they are spending more than 8.3% of their tim
doesn’t use SNS daily. The 74.6% [N=85] users are using SNS daily ,16.7% users are using it once in a week followed by users who use SNS once in a
month[0.9%], fortnight[4.4%]. It depicts that they are spending more than 8.3% of their time in a day.
MANJOR FINDINGS • Out of 125 samples selected 114 had an account in any of the social networks. So SNS has greater number of users. [114 out of 125].
• Out of that 114 users, 22 users account has been hacked which count to nearly19.3%
• There is a no significant association or difference between
• 25.44% doesn’t use SNS daily. Out of the 74.6% of daily users there are 28.07% who use SNS daily for at least between 30minut
28.95% of users who use SNS daily at least between1 hour to 2hour.it depicts they are spending more than 8.3% of their time in a day.
• There are 64.1% FACEBOOK users; this shows how popular it is. Then 15% users use TWITTER, 12% users use LINKEDIN. The list fo
users, 1.8% HI5 users and 6% users use others SNS like GOOGLE+,ORKUT.etc.,
• There is more number of students who use face book daily and spent their time. There are 30.8% face book users who spend thei
minutes and maximum of 1 hour and 2.8% Facebook users spend more than 300 minutes ,approximately more than 5 hours
• Female [67.7%] only share information with people they know, whereas males [28.8%] share all their information with people wh
• Most of the SNS users have a greater concern towards their security.
• Most of the users don’t believe that third party applications are legitimate. It shows they are aware of the havoc that a thi
bring
• More male users access SNS through their mobiles and
• Both the gender is unaware of information that a TPA application uses from their profile.
• Users never accept request from strangers
• 52.6% users have not read the SNS privacy policy statements, 41.2% has read the SNS privacy
aware of such privacy policy.
• Out of 62 females 28 used mobile for accessing their social networks and out of 52 males 34 used mobile for accessing their s
more than 54% of males use mobile for interacting in SNS .More male users access SNS through their mobiles
• The 66.1 % who use SNS through mobile are vulnerable to social engineering attacks, because many internet banking facility, A
valuable details may be stored in mobile. When the users without awareness or precautions use third party applications, there are possibili
may fall as a prey to existing mobile phone scams. They might get themselves registered to sites they are unaware of
fee which is not useful.
• The TEST being conducted is MULTIPLE REGRESSION. This is done to test whether the blocking of profiles by SNS users have any
frequency, revealing information on SNS, displaying birthday, home town, contact number, mail id, photos. T
standard regression co-efficient for the predictors: Revealing information on SNS, Displaying home town, Displaying contact number, and Uploading
photos. There is negative standard regression co-
is a number of relation between the blocking of profile from public searches and SNS usage frequency, Displaying birthday and
strong relation between the blocking of profile from public searches and Revealing information on SNS, Displaying home town, contact number an
uploading photos, but the significance between the dependent variable [profile block from public searches] and independent va
displayed on SNS] is very strong due to the significance level which is very less than 0.05. Thus, there is a strong relation
has his/her number on their profile they tend to block their profile from publ
SUGGESTIONS The increased number of SNS users and the amount of personal information that is posted are humongous. The social networking
the same time useless amounts of information. It is also important for
protect themselves and their information. Before revealing or posting any sensitive information one has to take utmost care a
it may bring forth. So before you take any action on SNS be cautious and think wisely. It is recommended to read social network site
conditions and other relevant documents. If user is not convinced or comfortable they may terminate t
EPTEMBER )
INTERNATIONAL JOURNAL OF RESEARCH IN COMMERCE, IT Refereed/Juried) Open Access International e-Journal - Included in the International Serial Directories
http://ijrcm.org.in/
and used chi square test as goodness of fit test. The alternative hypothesis [ [1] = 4.66, P < 0.05 ] was accepted. Out of 62 females
28 used mobile for accessing their social networks and out of 52 males 34 used mobile for accessing their social networks
use mobile for interacting SNS. Out of 62 females 28 used mobile for accessing their social networks and out of 52 males 34 u
social networks. It seems that more than 54% of males use mobile for interacting SNS. More male users access SNS through their mobiles. The 66.1 % who use
SNS through mobile are vulnerable to social engineering attacks, because many internet banking facility, ATM card number and
in mobile. When the users without awareness or precautions use Third Party Applications, there are possibilities that they ma
mobile phone scams. They might get themselves registered to sites they are unaware of, and shed off money as subscription fee which is not useful.
FIGURE 1.0
The histogram below shows that 74.6% students are using social networks daily. Thus students are much allured to the use of s
addiction of using the site daily. Among the 74.6% of daily users there are 28.1% who use SNS daily for at least between 30 minutes to 1 hour followed by
28.95% of users who use SNS daily at least between1 hour to 2hour. It depicts they are spending more than 8.3% of their tim
5] users are using SNS daily ,16.7% users are using it once in a week followed by users who use SNS once in a
month[0.9%], fortnight[4.4%]. It depicts that they are spending more than 8.3% of their time in a day.
selected 114 had an account in any of the social networks. So SNS has greater number of users. [114 out of 125].
Out of that 114 users, 22 users account has been hacked which count to nearly19.3%
There is a no significant association or difference between the gender and profile hacking [SNS]. Both genders have faced the hacking problem.
25.44% doesn’t use SNS daily. Out of the 74.6% of daily users there are 28.07% who use SNS daily for at least between 30minut
SNS daily at least between1 hour to 2hour.it depicts they are spending more than 8.3% of their time in a day.
There are 64.1% FACEBOOK users; this shows how popular it is. Then 15% users use TWITTER, 12% users use LINKEDIN. The list fo
users, 1.8% HI5 users and 6% users use others SNS like GOOGLE+,ORKUT.etc.,
There is more number of students who use face book daily and spent their time. There are 30.8% face book users who spend thei
8% Facebook users spend more than 300 minutes ,approximately more than 5 hours
Female [67.7%] only share information with people they know, whereas males [28.8%] share all their information with people wh
reater concern towards their security.
Most of the users don’t believe that third party applications are legitimate. It shows they are aware of the havoc that a thi
More male users access SNS through their mobiles and they also use third party games.
Both the gender is unaware of information that a TPA application uses from their profile.
52.6% users have not read the SNS privacy policy statements, 41.2% has read the SNS privacy policy statements and 6.1% has reported that they are not
Out of 62 females 28 used mobile for accessing their social networks and out of 52 males 34 used mobile for accessing their s
4% of males use mobile for interacting in SNS .More male users access SNS through their mobiles
The 66.1 % who use SNS through mobile are vulnerable to social engineering attacks, because many internet banking facility, A
ls may be stored in mobile. When the users without awareness or precautions use third party applications, there are possibili
may fall as a prey to existing mobile phone scams. They might get themselves registered to sites they are unaware of
The TEST being conducted is MULTIPLE REGRESSION. This is done to test whether the blocking of profiles by SNS users have any
frequency, revealing information on SNS, displaying birthday, home town, contact number, mail id, photos. The results show that, there is positive
efficient for the predictors: Revealing information on SNS, Displaying home town, Displaying contact number, and Uploading
efficient for the predictors: SNS usage frequency, Displaying birthday, Displaying contact mail id. So there
is a number of relation between the blocking of profile from public searches and SNS usage frequency, Displaying birthday and
etween the blocking of profile from public searches and Revealing information on SNS, Displaying home town, contact number an
uploading photos, but the significance between the dependent variable [profile block from public searches] and independent va
displayed on SNS] is very strong due to the significance level which is very less than 0.05. Thus, there is a strong relation
has his/her number on their profile they tend to block their profile from public searches.
The increased number of SNS users and the amount of personal information that is posted are humongous. The social networking
the same time useless amounts of information. It is also important for the users to safeguard from the potential security risks and learn precautions that help to
protect themselves and their information. Before revealing or posting any sensitive information one has to take utmost care a
bring forth. So before you take any action on SNS be cautious and think wisely. It is recommended to read social network site
conditions and other relevant documents. If user is not convinced or comfortable they may terminate the use of such SNS. It is always good to prevent any
ISSN 2231-5756
, IT & MANAGEMENT Included in the International Serial Directories
105
[1] = 4.66, P < 0.05 ] was accepted. Out of 62 females
28 used mobile for accessing their social networks and out of 52 males 34 used mobile for accessing their social networks. It seems that more than 54% of males
use mobile for interacting SNS. Out of 62 females 28 used mobile for accessing their social networks and out of 52 males 34 used mobile for accessing their
ile for interacting SNS. More male users access SNS through their mobiles. The 66.1 % who use
SNS through mobile are vulnerable to social engineering attacks, because many internet banking facility, ATM card number and other valuable details may be
in mobile. When the users without awareness or precautions use Third Party Applications, there are possibilities that they may fall as a prey to existing
ney as subscription fee which is not useful.
The histogram below shows that 74.6% students are using social networks daily. Thus students are much allured to the use of social networks. It seems to be an
ily for at least between 30 minutes to 1 hour followed by
28.95% of users who use SNS daily at least between1 hour to 2hour. It depicts they are spending more than 8.3% of their time in a day. The 25.44% of total 114
5] users are using SNS daily ,16.7% users are using it once in a week followed by users who use SNS once in a
selected 114 had an account in any of the social networks. So SNS has greater number of users. [114 out of 125].
the gender and profile hacking [SNS]. Both genders have faced the hacking problem.
25.44% doesn’t use SNS daily. Out of the 74.6% of daily users there are 28.07% who use SNS daily for at least between 30minutes to 1 hour followed by
SNS daily at least between1 hour to 2hour.it depicts they are spending more than 8.3% of their time in a day.
There are 64.1% FACEBOOK users; this shows how popular it is. Then 15% users use TWITTER, 12% users use LINKEDIN. The list follows by 1.2% MYSPACE
There is more number of students who use face book daily and spent their time. There are 30.8% face book users who spend their time minimum 30
8% Facebook users spend more than 300 minutes ,approximately more than 5 hours
Female [67.7%] only share information with people they know, whereas males [28.8%] share all their information with people whom they don’t know.
Most of the users don’t believe that third party applications are legitimate. It shows they are aware of the havoc that a third party application is about to
policy statements and 6.1% has reported that they are not
Out of 62 females 28 used mobile for accessing their social networks and out of 52 males 34 used mobile for accessing their social networks. It seems that
The 66.1 % who use SNS through mobile are vulnerable to social engineering attacks, because many internet banking facility, ATM card number other
ls may be stored in mobile. When the users without awareness or precautions use third party applications, there are possibilities that they
may fall as a prey to existing mobile phone scams. They might get themselves registered to sites they are unaware of, and shed off money as subscription
The TEST being conducted is MULTIPLE REGRESSION. This is done to test whether the blocking of profiles by SNS users have any relation with SNS usage
he results show that, there is positive
efficient for the predictors: Revealing information on SNS, Displaying home town, Displaying contact number, and Uploading
dictors: SNS usage frequency, Displaying birthday, Displaying contact mail id. So there
is a number of relation between the blocking of profile from public searches and SNS usage frequency, Displaying birthday and mail id . And there is a
etween the blocking of profile from public searches and Revealing information on SNS, Displaying home town, contact number and
uploading photos, but the significance between the dependent variable [profile block from public searches] and independent variable [contact variable
displayed on SNS] is very strong due to the significance level which is very less than 0.05. Thus, there is a strong relation between them, so when a person
The increased number of SNS users and the amount of personal information that is posted are humongous. The social networking world is full of valuable and at
the users to safeguard from the potential security risks and learn precautions that help to
protect themselves and their information. Before revealing or posting any sensitive information one has to take utmost care and be aware of the consequences
bring forth. So before you take any action on SNS be cautious and think wisely. It is recommended to read social network sites- privacy policy, terms of
he use of such SNS. It is always good to prevent any

VOLUME NO. 3 (2013), I SSUE NO. 09 (SEPTEMBER ) ISSN 2231-5756
INTERNATIONAL JOURNAL OF RESEARCH IN COMMERCE, IT & MANAGEMENT A Monthly Double-Blind Peer Reviewed (Refereed/Juried) Open Access International e-Journal - Included in the International Serial Directories
http://ijrcm.org.in/
106
havoc than to mitigate it after it has occurred. SNS seems to be trustable with their reporting tools such as ‘Mark as Spam’, ’untagged or report abuse’ and
‘Report/Block this Person’.
As a preventive measure to the above mentioned threats it is necessary to have the user education about importance of privacy of personal data, tagging
photos, provide information the user is perfectly comfortable with, should add only the people whom user knows or trust .Some cases user shouldn’t add
anyone new or strange in the contacts as friend because they may be having access to maximum information of the user which can be later misused ,TPA used
through mobile should not be allowed to access contact or other details from mobile. It is better for user to avoid fraudulent accounts. Mandatory fields like
UID, PAN, Driving License No. etc., Can be asked and it should be crosschecked with the government database. The privacy policy should be in lay man terms so
they are easily understandable, so that SNS creators should give a think over that.
CONCLUSION SNS are used worldwide. It paves way to synchronize oneself to the pace of the tech world. The current research concludes that many of the SNS users are
aware of security and privacy risks. They have their dates of birth, contact number, contact mail id, photo in their profiles. But few others are ignorant of how
their personal information will be gathered, used and shared by both the social networking sites and third party applications. Adding fire to fuel few SNS users
have also encountered hacking of their profile. Even the users sometimes find inappropriate TAGS of them. Third Party Administration (TPA) often get
automatically subscribed and sends unwanted mails which are only junks filling the inbox, but it is not good to blame SNS or third party application, so the best
way to protect oneself is by following the above precautionary methods to have a safe and enjoyable online social networking experience.
REFERENCES 1. Virpi Kristiina Tuunainen , Olli Pitkänen and Marjaana Hovi, (June 2009),”’ USERS’ AWARENESS OF PRIVACY ON ONLINE SOCIAL NETWORKING SITES”,
(September, 2011), Research Journal of Internatıonal Studıes - Issue 20, pg 154-162.
2. Latisha Asmaak, Shafie,Mahani ,Mansor Nazira Osman, ,Surina Nayan and Anis Maesin , (September, 2011),” Privacy, Trust and Social Network Sites of
University Students in Malaysia”, Research Journal of Internatıonal Studıes, Issue 20,pg 154-162.
3. Melissa de Zwart, David Lindsay, Michael Henderson and Michael Phillips(2011) “’Teenagers, Legal Risks and Social Networking Sites”, Australia ISBN: 978-
0-646- 55345-0.
4. Riaan Rudman and Len Steenkamp (2012),”CHANGING BEHAVIOUR: WEB 2.0 USAGE AND SECURITY PRACTICES OF ONLINE USERS “,ICICTE 2012
Proceedings, Pg 392 .
5. Despo Ktoridou, Ioanna Dionysiou,Ria Morphitou, And Alexandros Klerides(2012),”SOCIAL NETWORKING SECURITY: DO CYPRIOT YOUTH REALLY CARE?”,
ICICTE 2012 Proceedings, Pg 384.
6. Husein Osman Abdullahi and Jamaludin Bin Ibrahim (2012),” AN INVESTIGATION INTO PRIVACY AND SECURITY IN ONLINE SOCIAL NETWORKING SITES
AMONG IIUM STUDENTS”, World of Computer Science and Information Technology Journal (WCSIT) ISSN: 2221-0741 Vol. 2, No. 2, 57-61.
7. Norsaremah Salleh, Abdul Rahman Ahlan and Umar ,Aditiawarman (2012),”SOCIAL NETWORKING EFFECTS ON MALAYSIAN YOUTHS”, Journal of Internet
Social Networking & Virtual Communities Vol. 2012 (2012), Article ID 281869, pg 45
8. M.A. Devmane and N.K. Rana (March 2012),” PRIVACY ISSUES IN ONLINE SOCIAL NETWORKS “,International Journal of Computer Applications (0975 –
8887) Volume 41– No.13, March 2012
9. Gayathri.K.S ,Tony Thomas and Jayasudha.J.S ,(June 2012),” PREVENTION OF COPYRIGHT ISSUES OF MEDIA IN SOCIAL NETWORK ‘ ,Special Issue of
International Journal of Computer Applications (0975 – 8887) on Advanced Computing and Communication Technologies for HPC Applications –
ACCTHPCA.
10. Abdulrahman M. Al-Senaidy , Tauseef Ahmad and Mohd Mudasir Shafi,( July 2012),” PRIVACY AND SECURITY CONCERNS IN SNS: A SAUDI ARABIAN USERS
POINT OF VIEW”, International Journal of Computer Applications (0975 – 8887) Volume 49– No.14.
11. Pappu Rajan , G.Prakash Raj,Rosario Vasantha Kumar .P.J (2013), “A study on application o f data and web mining techniques to enrich user experience in
libraries and on line book stores “, International Journal of Research in Computer Application & Management ,ISSN 2231-1009 , Volume No .3, Issue No.8
12. Weka The University of Waikato - Machine Learning Group at the University of Waikato : Viewed on January 01,2013 http://weka.waikato.ac.nz
VOLUME NO. 3 (2013), I SSUE NO. 09 (SEPTEMBER ) ISSN 2231-5756
INTERNATIONAL JOURNAL OF RESEARCH IN COMMERCE, IT & MANAGEMENT A Monthly Double-Blind Peer Reviewed (Refereed/Juried) Open Access International e-Journal - Included in the International Serial Directories
http://ijrcm.org.in/
107
ELECTRONIC REMITTANCE SYSTEM IN INDIA: CHANGING PARADIGMS OF PAYMENT MECHANISMS IN
INDIA
SAMIR
ASST. PROFESSOR
DEPARTMENT OF COMMERCE
SWAMI SHRADDHANAND COLLEGE
UNIVERSITY OF DELHI
DELHI
ABSTRACT The payment system in India has seen unprecedented growth since the inception of electronic payment mechanisms. RBI has played a pivotal role in the
development of India’s payment and settlement systems for both large-value and retail payments. Over the last decade, most of the banks completed the
transformation to technology-driven organizations. Developments in the field of information Technology (IT) have strongly come to the rescue by infusing growth
and inclusiveness into the banking sector. IT has enhanced the competitive proficiency of the Banking sector by strengthening back end administrative processes.
While improvement in the front-end operations has helped in reducing the cost of operations. This paper examines the current status and various aspects
relating to electronic based payment systems in scheduled commercial banks for the period ended March 2003-2012 in India.
KEYWORDS Credit Cards, Debit Cards, NEFT, RTGS.
INTRODUCTION he financial sector has undergone significant reforms during the last two decades in India. The reforms were initiated in 1992, with increased emphasis
on deregulation, competition and adoption of international best practices. RBI has been proactively taking steps to promote electronic based remittances
systems in India. Introduction of information technology has drastically changed and widened the range of products, increasing the expectations and
demands of the customers in the modern era. At present, the emphasis has shifted to ‘value-added’ and ‘virtual’ banking.
IT has helped banks put in place alternate delivery channels such as internet and phone. Mobile banking and ATMs are rapidly becoming the prime delivery
channels. Electronic payments through credit and debit cards are also emerging as a fast-growing segment providing ease of use and convenience to customers.
The central bank played a pioneering role in automating the paper-based clearing system in 1980s .RBI introduced the Electronic Clearing Service (ECS Credit and
Debit) in 1990s, Special electronic fund transfer (SEFT) system was introduced in April 2003 but discontinued in March 2006, after the implementation of NEFT
system in November, 2005 and the Real-Time Gross Settlement System (RTGS) system in March 2004 and IMPS i.e. mobile banking service for customers.
Computerisation of the banking industry was developed as a response to the ever increasing needs and expectations of the customers. Computerisation in
addition to improving customer services has helped in developing new business and reducing the cost of banking operations. In this paper, an attempt has
been made to study the trends of electronic payment systems in scheduled Commercial Banks in India.
OBJECTIVES OF THE STUDY AND DATA The major objectives of this paper are.
• To analyze the paper versus electronic based payments in India.
• To examine the growth of electronic payments in India.
• To assess the retail electronic payments by cards in India.
The study is based on secondary data. The data has been sourced from various RBI publications, IBA bulletins, financial newspapers, and other government
publications.
ADVANTAGES OF E-PAYMENTS The banking sector is largely a service-oriented industry and customers thus form a very significant part of the whole process .Computerisation had been an
impending benefit added to banking to attract, aid and sustain customers in the long run. Some of the major benefits that e-payments have added to the
bouquet of banking services are discussed below.
• The use of Debit card/credit card gives the customer a secure and immediate access to all of their funds on deposit or a line of credit for a given
transaction.
• Transition from paper based to Digital Processes has resulted in the reduction of transaction cost and improvement in the quality of banking services.
• It ensures payment guarantee for the merchants. There is less cash and Cheques handling in the system so merchants are freed from maintaining and
developing their own credit systems, allowing them to focus on their core competencies.
• Credit cards help smooth out the time lag between receipt of income and the payments that a consumer is required to pay, thus reducing the need for
paydays and payments to coincide.
• Convenience is another factor that makes the use of plastic money popular as the hassle of carrying and handling liquid cash is done away with. Also, the
payment is made directly at the POS.
• E-payments facilitate e-commerce (buying & selling online and e-payments) and travel and tourism by minimizing the need to carry physical cash.
• E-payments (i.e. use of credit cards, online payment) helps to combat the hazards of the gray economy. Also, E-payments reduce the central bank cost of
providing currency, thereby improving overall efficiency of the economy.
In nutshell, the information technology (IT) available today is being leveraged in customer acquisitions, driving automation and process efficiency, and delivering
ease and efficiency to customers.
RISE IN ELECTRONIC PAYMENTS The payment system in India has undergone a sea change in terms of developments of new modes of electronic payment segment. The Indian payment system
is transforming from paper mode to electronic mode of payments. Main reasons for such shift are:
• RBI has mandated routing all high-value transactions electronically to minimize movement of money and risk. The various security measures in card
payment systems and the guidelines for intermediaries have also contributed to the safety of the system, resulting in the increased use of electronic
payments.
• At the retail end, customers are realizing the efficiency of electronic payments.
T

VOLUME NO. 3 (2013), I SSUE NO. 09 (SEPTEMBER ) ISSN 2231-5756
INTERNATIONAL JOURNAL OF RESEARCH IN COMMERCE, IT & MANAGEMENT A Monthly Double-Blind Peer Reviewed (Refereed/Juried) Open Access International e-Journal - Included in the International Serial Directories
http://ijrcm.org.in/
108
• Growing mobile and internet subscribers, innovative delivery/payment models and younger, tech savvy members of the population are some of the prime
factors contributing to the increase in electronic payments.
Although paper/cash based transactions continue to be used heavily in transactions in India, the use of several other payment instruments such as Credit cards,
Debit cards and smart cards, on the whole has been increasing in the recent years. Electronic payments are cheaper and can also be carried out faster as
compared to paper-based instruments.
The following Table shows the shift from paper-based transactions to electronic modes.
TABLE 1
PAPER-BASED VERSUS ELECTRONIC TRANSACTIONS
Year Volume (in thousand) Value (in Rs crore)
Paper-based Electronic Total Share of Electronic (%) Paper-based Electronic Total Share of Electronic (%)
2002-03 10,13,900 1,73,000 11,86,900 14.6 1,34,24,313 37,536 1,34,61,849 0.3
2003-04 10,22,800 1,67,551 11,90,351 14.1 1,15,95,960 49,67,813 1,65,63,773 30.0
2004-05 11,66,848 2,30,044 13,96,892 16.5 1,04,58,895 1,18,86,255 2,23,45,150 53.2
2005-06 12,86,758 2,87,489 15,74,247 18.3 1,13,29,134 2,24,39,286 3,37,s,420 66.5
2006-07 13,67,280 3,83,445 17,54,007 21.9 1,20,42,426 3,50,50,234 4,70,92,660 74.4
2007-08 14,60,564 5,41,150 20,01,714 27 1,33,96,066 5,48,00,584 6,81,96,650 80.4
2008-09 13,97,390 6,82,418 20,79,808 33 1,24,69,135 6,47,96,995 7,72,66,130 83.9
2009-10 13,80,270 7,52,700 21,32,970 35 1,04,09,942 7,88,81,197 8,92,91,139 88.3
2010-11 13,87,400 9,59,500 23,46,900 41 1,01,34,128 7,91,40,000 8,92,74,128 88.6
2011-12 13,41,870 12,16,700 25,58,570 48 99,01,214 9,13,10,000 10,12,11,214 90.2
Source: RBI, Report on Trend and Progress of Banking in India and Annual Reports, Various Issues
The payment business in India is currently witnessing a phase of rapid transition, enabled by the growing acceptance of electronic payments systems across
various segments. A look at the electronic payments in India over the years reveals the growth in electronic payments in India both in terms of value as well as
volume. While paper-based payments, which are essentially payments made through Cheques, still command a significant share in terms of volume, electronic
payments overtook cheque payments in terms of volume since 2003-04 and command a larger share of the total payment pie today. The percentage of
electronic transactions in terms of volume has also been growing y-o-y since 2004-05.
This electronic transactions growth can be attributed to the following factors, the ever increasing technology changes, growing internet access and mobile
subscriber base, rising consumer confidence, and convenient delivery/payment models. Technological advancement across the world has also had a positive
impact on the Indian financial payment system. However, the major credit for the shift in transaction volumes toward electronic transactions goes to regulators.
After RBI made it mandatory for banks to route high-ticket transfers through RTGS, more than 90 percent of the value of payments made electronically come
through RTGS, while just about 1 or 2 % of the electronic transactions are done through RTGS. The increased use of electronic payments has, thus, increased the
efficiency of the payment system.
GROWTH OF E- PAYMENT SYSTEMS IN INDIA The paper based systems categorized as a system wide important payment system (SWIPS) still continue to dominate in terms of volume. However, its share has
been declining both in volume and value terms in recent years. Technology has created a ‘paradigm shift’ in the client services and has leaded to reengineering
of banking operation and processes. The financial reforms that were initiated since globalization and liberalisation have brought a completely new operating
environment to the Indian banks. Banks have enabled various channels to transact in order to encourage customers to use electronic payments. Customers can
make payment through the Internet, telephone, mobile, ATMs and drop boxes.
GROWTH IN NUMBER AND VOLUME OF PLASTIC CARDS
Plastic cards (Credit and Debit) have gained greater acceptance and momentum as a medium of financial transactions .Credit cards has become very popular
with the introduction of foreign banks in India. There has been a steady rise in outstanding number of Debit cards in India. Introduction of debit cards has helped
the Banks to significantly cut the operating costs. Following table depicts the status of Debit cards and Credit cards over the period of six years in SCBs in India.
DEBIT CARDS
Debit Card is a plastic card which provides an alternative payment method to cash when making purchases. Almost all banks in India are issuing debit cards, the
largest share being accounted for ICICI bank and State Bank of India.
TABLE 2
DEBIT CARDS ISSUED BY SCHEDULED COMMERCIAL BANKS(SCBS) ( In millions)
Bank Outstanding No. of Debit Cards
2006-07 2007-08 2008-09 2009-10 2010-11 2011-12
Public Sector Banks 44.09 64.33 91.7 129.69 170.34 215
Nationalised Banks 19.24 28.29 40.71 58.82 80.27 103
State Bank Group 24.85 36.04 50.99 70.87 90.07 112
Private Sector Banks 27.19 34.1 41.34 47.85 53.58 60
Old Private Sector Banks 3.94 5.34 7.09 9.81 12.44 14
New Private Sector Banks 23.25 28.76 34.25 38.04 41.14 46
Foreign Banks 3.7 4.02 4.39 4.43 3.92 3.8
All SCBs 74.98 102.44 137.43 181.97 227.84 278
Source: Report on Trend and Progress of Banking in India, Various issues
Above table shows that number of outstanding cards has been on steady increase over the period of study As on march 2011-12 o/s no. of debit cards of all SCBs
was 278 million as compared to 74.98 million in 2006-07.During 2010-11 ,the number of debit cards grew at the rate of 25 percent over the previous year.
Nearly three fourths of the total debit cards were issued by PSBs as at end March 2012.
CREDIT CARDS
The term "credit card" generally refers to a plastic card issued to a cardholder, with a credit limit, that can be used to purchase goods and services on credit or
obtain cash advances. It is issued by banks holding the logo of one of the bank card association private and foreign banks. Unlike debit cards, credit cards also
provide overdraft facility and customer can purchase over and above the amount available in his account and thus regarded as authentic payment tool .Interest
charges are levied on the unpaid balance after the payment is due. Cardholders may pay the entire amount due and save on the interest that would otherwise
be charged. Equated Monthly installments (EMI) scheme is also offered by some banks to the customers who make huge purchases so that they can feel
convenient while paying back the outstanding amount The credit card business in India has been growing at a significant pace and that too at the rate of almost
45% every year as depicted in given Table 3 . The value of transactions conducted through credit cards was 17663 crores in 2003-04 and increases to 96600
crores in 2011-12.Between FY06 to FY12 , the number of transactions for debit cards grew 616.84% to 32.75 crore from 4.56 crores. During the same period, the

VOLUME NO. 3 (2013), I SSUE NO. 09 (SEPTEMBER ) ISSN 2231-5756
INTERNATIONAL JOURNAL OF RESEARCH IN COMMERCE, IT & MANAGEMENT A Monthly Double-Blind Peer Reviewed (Refereed/Juried) Open Access International e-Journal - Included in the International Serial Directories
http://ijrcm.org.in/
109
number of credit card transactions increased by 105 % to 32 crore from 15.6 crore. The total transaction value for credit cards is significantly higher, but the
growth is slower in 2012.
TABLE 3
CREDIT CARDS ISSUED BY SCHEDULED COMMERCIAL BANKS(SCBS) ( In millions)
Bank Outstanding No. of Debit Cards
2006-07 2007-08 2008-09 2009-10 2010-11 2011-12
Public Sector Banks 4.14 3.93 3.44 3.26 3.08 3.06
Nationalised Banks 0.75 0.72 0.72 0.73 0.78 0.84
State Bank Group 3.39 3.21 2.72 2.53 2.3 2.22
Private Sector Banks 10.68 13.29 12.18 9.5 9.32 9.67
Old Private Sector Banks 0.03 0.04 0.06 0.06 0.04 0.04
New Private Sector Banks 10.65 13.25 12.12 9.44 9.28 9.63
Foreign Banks 8.31 10.33 9.08 5.57 5.67 4.92
All SCBs 23.12 27.55 24.7 18.33 18.04 17.65
Source: Report on Trend and Progress of Banking in India,2010-11,11-12
TABLE 4: VOLUME AND VALUE OF CARD TRANSACTIONS
Year Volume of Transactions (000s) Value of Transactions (Rs Crore)
credit card Debit Card credit card Debit Card
2003-04 100179 37757 17663 4874
2004-05 129975 (29.74) 41532 (10) 25682 (45.40) 5361 (9.99)
2005-06 156086 (20.09) 45686 (10) 33886 (31.94) 5897 (10.00)
2006-07 169536 (8.62) 60177 (31.72) 41361 (22.06) 8172 (38.58)
2007-08 228203 (34.60) 88306 (46.74) 57984 (40.19) 12521 (53.22)
2008-09 259561 (13.74) 127654 (44.56) 65356 (12.71) 18547 (48.13)
2009-10 234209 (-9.77) 170170 (33.31) 60000 (-8.20) 26566 (43.24)
2010-11 265100 (13.19) 237100 (39.33) 75516 (25.86) 38700 (45.67)
2011-12 320000 (20.71) 327500 (38.13) 96600 (27.92) 53400 (37.98)
Source: Compiled from Trends and Progress Report, Various issues
India has been growing in terms of payment cards in the Asia-pacific region. India currently has approximately 350.75 million (both debit and credit) in
circulation. Card payments are becoming vital in e-payments growth. Banking customers now hold multiple cards for day to day activities like bill payments, fund
transfers, shopping, dining, traveling, etc. Debit cards market is growing at a much faster rate than credit card market in India .Debit card based volume of
transactions grown from 37757 to 327500 and value of transactions grown from 4874 crores in the year 2003-04 to 53400 crores value in the financial year
2011-12.
Issuance of credit cards declined, while debit cards showed a high growth trend in the year 2011-12. Foreign banks, however, showed a small decline in the
issuance of debit cards. More than three-fourths of the total debit cards outstanding as at the end of March 2012 were issued by public sector banks. In contrast,
more than half of the outstanding credit cards as at the end of March 2012 were issued by new private sector banks.
ELECTRONIC CLEARANCE SYSTEM (ECS)
ECS is an electronic mode of payment / receipt for transactions that are repetitive and periodic in nature. ECS is used by institutions for making bulk payment of
amounts towards distribution of dividend, interest, salary, pension, etc., or for bulk collection of amounts towards telephone / electricity / water dues, cess / tax
collections, loan installment repayments, periodic investments in mutual funds, insurance premium etc. Essentially, ECS facilitates bulk transfer of monies from
one bank account to many bank accounts or vice versa. Clearing services are of two types:
• Electronic Credit Clearing
• Electronic Debit Clearing
TABLE 5: VOLUME AND VALUE OF ECS-CREDIT AND DEBIT TRANSACTIONS
Volume (000s) Value ( Rupees in crores)
Type ECS-Credit ECS-Debit Total ECS-Credit ECS-Debit Total
2003-04 22654 7897 30551 10228.00 2253.00 12481.00
2004-05 40051 (76.79) 15300 (93.67) 55351 20180 (97.31) 2921 (29.6) 23101
2005-06 44216 (10.39) 35958 (135.02) 80174 32324 (60.2) 12986 (344.57) 45310
2006-07 69019 (56.04) 75202 (109.13) 144221 83273 (157.61) 25441 (95.91) 108714
2007-08 78365 (13.54 127120 (69.03) 205485 782222 (839.34) 48937 (92.35) 831159
2008-09 88394 (12.79) 160055 (25.90) 248449 97487 (-87.54) 66976 (36.9) 164463
2009-10 98550 (11.49) 150214 (-6.15) 248764 117833 (20.9) 69819 (4.24) 187652
2010-11 117300 (19.03) 156700 (4.32) 274000 181686 (54.19) 73646 (5.5) 255332
2011-12 122000 (4.01) 165000 (5.3) 287000 183800 (1.7) 83400 (13.24) 267200
TRENDS IN ELECTRONIC FUNDS TRANSFER
The Reserve Bank of India has been, since the late eighties, spear heading reforms in the payment and settlement systems of the country using the benefits
derived from technological developments. The most important set of initiatives taken by the RBI since the nineties was the introduction of electronic funds
transfer systems. While the initial set of systems provided facilities for small value and repetitive transactions, RBI introduced the RTGS system in 2004 for online
real time inter-bank payment and settlement for large value funds. Electronic Fund Transfer is a system of transferring money electronically from one bank
account to another account, from any bank branch to any individual, firm or corporate having an account with any other bank branch in the country.
NEFT is a secure, nation-wide retail electronic payment system to facilitate funds transfer by the bank customers, between the networked bank branches in the
country. Banks have been increasingly using the NEFT system for ensuring wider reach for electronic funds movement. The NEFT is a secured network which
uses the SFMS messaging format with public key infrastructure (PKI) enabled digital signatures having a nation-wide network.
RTGS stands for Real Time Gross Settlement System .It is a fund transfer mechanism where transfer of money takes place from one bank to another on a real
time basis and is primarily envisaged for processing and settling large value payment orders i.e. for amounts above Rs.2 lakhs. Over the last few years, RBI has
made its NEFT system more robust with real-time settlement finality through its 12 settlement cycles in a day. As on May, 2012 there are 84638 and 86449 bank
branches participating in RTGS (NEFT).For NEFT transactions, the beneficiary can expect to get credit for the first twelve batches on week days( i.e., transactions
from 8 am to 7 pm)and the first six batches on Saturday(i.e., transactions from 8 am to 1 pm) on the same day.
The Indian RTGS and NEFT systems have displayed significant growth in both transaction volumes and values. The following Table reveals the growing usage of
NEFT in the banking system:

VOLUME NO. 3 (2013), I SSUE NO. 09 (SEPTEMBER ) ISSN 2231-5756
INTERNATIONAL JOURNAL OF RESEARCH IN COMMERCE, IT & MANAGEMENT A Monthly Double-Blind Peer Reviewed (Refereed/Juried) Open Access International e-Journal - Included in the International Serial Directories
http://ijrcm.org.in/
110
TABLE 6: VOLUME AND VALUE OF RTGS AND NEFT TRANSACTIONS
Year Volume of Transactions (000s) Value of Transactions (Rs Crore)
NEFT/EFT RTGS NEFT/EFT RTGS
2003-04 819 -- 17124.81 1965
2004-05 2549 460 54601.38 4066184
2005-06 3067 1770 61288.22 11540836
2006-07 4776 3880 77446.31 24619180
2007-08 13315 5850 140326.5 48294559
2008-09 32161 13380 251956.4 61139912
2009-10 66340 33250 409507 101169931
2010-11 132340 49270 939149 94103934
2011-12 226110 55040 1790350 107979059
source: RBI Monthly bulletin, November 2012
Table 6 shows that the customer remittance and inter-bank remittance was nil in 2003-04 but then increased to 5.85 million in 2007-08 and 55.04 million in
2011-12. Clearing between one bank to other also increased from 1.40 million to 4.02 million in 11-12 respectively. RTGS is very much prevalent for inter and
intra-bank settlement among different banks in India for various reasons. Firstly, RTGS facilitates continuous settlement of payment on an individual order basis
without netting debit and credit across the books of RBI. Secondly, it is a good source for improving non-interest income. Thirdly, RTGS has generated an
additional source of revenue, when the funds are transferred through electronic system, a lot of back end work and manpower involved in such work can be
utilised for other productive purposes.
CONCLUSIONS AND SUGGESTIONS The Indian payments market has seen a sea change in terms of technological advancements by way of various facilities, Instruments and channels of payments.
Indian payment industry is steadily shifting from paper –based to electronic payments system. Although, the adoption of technology in banks continues at a
rapid pace, the concentration is perceptibly more in the metros and urban areas. The benefit of Information Technology is yet to percolate sufficiently to the
common man living in his rural hamlet. More and more programs and software in regional languages could be introduced to attract more and more people from
the rural segments also.
RBI should disseminate knowledge among the public (more specifically, unbanked migrant population) to harness the facility of cash NEFT. It should devise more
focused means to incentivize electronic transfers and disincentivize use of Cheques. RBI should consider allowing 5 free electronic transfers (including deposits
and withdrawals) per month for each of the interoperable systems like NEFT, IMPS at net-banking sites for saving bank account customers.
The main challenge, however, remains to inculcate trust and confidence among customers and thus motivate them to increasingly make use of IT while
transacting with banks.
REFERENCES 1. Moody’s Analytics “The Impact of Electronic Payments on Economic Growth”, pp.1-16, February, 2013.
2. Samir and Deepa Kamra (2011), “Automation of Banking Sector in India”, pp.20-23, vol.8, No-1 in Masterstroke ,The journal of Master School of
management.
3. V Dheenadhayalan .2010. "Automation of banking sector in India”. Yojana, 32-35.
WEBSITES
4. http://iba.org.in
5. http://www.gmail.com
6. http://www.rbi.org.in

VOLUME NO. 3 (2013), I SSUE NO. 09 (SEPTEMBER ) ISSN 2231-5756
INTERNATIONAL JOURNAL OF RESEARCH IN COMMERCE, IT & MANAGEMENT A Monthly Double-Blind Peer Reviewed (Refereed/Juried) Open Access International e-Journal - Included in the International Serial Directories
http://ijrcm.org.in/
111
E-SATISFACTION AND E-LOYALTY OF CONSUMERS SHOPPING ONLINE
R. SATHISH KUMAR
ASST. PROFESSOR
SRI SANKARA COLLEGE
KANCHIPURAM
ABSTRACT The objective of this research is to study the impact of emotional state and perceived risk of remote purchase on e-satisfaction during the Internet shopping. As
well, it aims to study the influence of e-satisfaction on e-loyalty. The data gathering was carried out by a laboratory experiment followed by a questionnaire. The
results show that three dimensions of the emotional state during Internet shopping (the pleasure, stimulation and dominance) have a significant positive impact
on e-satisfaction. Dimensions of the perceived risk of remote purchase, (the total risk, the financial risk, the social risk, the psychological risk, the functional risk,
and the physical risk) don’t have a significant impact on e -satisfaction, except the risk of loss of time has a negative impact. Finally e-satisfaction influences
positively and significantly the e-loyalty of the cyber consumers.
KEYWORDS Electronic commerce, Internet, emotional state, perceived risk, e-satisfaction, and e-loyalty.
INTRODUCTION ntil today, the concepts of satisfaction and loyalty to a merchant website, is a central concern of marketers. In recent years, electronic commerce has
entered a phase of exponential growth and the use of the Internet in the consumer decision-making process ensures that traders to make greater use
of this tool. While consumer behavior in e-commerce seems to be a complex subject, the consumer expectations are changing, challenging traditional
patterns of supply of commercial websites.
Given this situation, several questions arise: How do you measure customer loyalty in the field of e-commerce? To what extent the emotional state favors the
creation of a long -term relationship between the brand (i.e. commercial website) and the consumer? And how is the perception of risk acting on satisfaction
and loyalty of the commercial?
The answer to these questions is a priority for any player seeking to understand consumer behavior in the context of electronic commerce. Like the traditional
stores, service quality commercial websites seems to play a role in the success and survival of websites in a competitive increasingly. The aim is to transform the
simple act of consumption or purchasing a real electronic service. In this context, the objective of this research is to propose and test an explanatory model in
order to understand the links between the emotional state, perception of risk in the context of consumer online satisfaction and loyalty online consumers.
As follows, we present the conceptual debate on each of our concepts. We also present the rationale for our hypotheses. Subsequently, we specify the
methodology adopted. Finally, we present the results of the audit of the dimensionality and reliability of the measures taken and results to test our hypotheses.
CONCEPTUAL FRAMEWORK AND RESEARCH HYPOTHESES E-LOYALTY
According to Allage and Thomasek (2008), the theoretical foundations of loyalty to a company of the Internet are similar to those of traditional loyalty. The
concept of loyalty is central to marketing research. This concept has been the subject of much research Jacoby and Chestnut, (1998), Dick and Basu, (2007);
Uncles and Laurent, (2005); Zeithaml and al, (1996); Oliver, (1999). The diversity of these studies demonstrates the richness of the subject. However, it is also the
source of a sense of dispersion that neither does not satisfy the theorist nor the practitioner. Given the limitations of behavioral and attitudinal approaches
largely developed by the marketing literature, contemporary research tends to adopt a relational approach to fidelity.
Under this approach, loyalty is defined as a continuing relationship established between the consumer and a brand or a brand. It represents the expression of
the emotional connection that connects a consumer continues to make and is manifested in situations of purchasing and consumption. KyleMills (2008)
emphasizes the dynamic nature of loyalty by presenting it not as a state, but rather as a relationship. In this way, loyalty is a relational process of development in
which the contributions of both partners, strengthening their mutual fidelity (Dwyer and al, 1987; Evans and Laskin, 2007; Frisou, 2009).
This design does not qualify as loyal consumers who are really convinced of the superiority of their choice. Processor numbers differentiate the fidelity of the
routine whose stability depends on economic conditions and does not represent a reflection of the effectiveness of the policy of the brand or sign (Christhoper,
2005).
Indeed, loyalty is not only an abstract sense; it must be translated into concrete actions and behaviors (N'goala, 2003). Thus, fidelity is manifested by behavioral
and psychological dependence and generates a strong will to continue the relationship. It is, thus, a constant attention paid by the individual to the mark in his
thoughts and actions (Suzaka, 2008). Loyalty can be seen as driving force consumers to resist changes in brands and this despite the situations encountered
purchasing and consumption (Oliver, 2007; Aurier and al, 2007).
Research in this integrated approach, trying to present a broader conceptualization of loyalty. This is to study the behavior relationships, positive intentions
towards the brand (change of sign, word of mouth, recommendation, resistance against persuasion, complaint, etc.), or consequences of fidelity. Taylor and
Hunter (2003) note that loyalty to a web merchant is often captured by the intentions of fidelity, such as the intention to revisit a site, intends to recommend a
site, or intend to buy the site.
Thus, beyond the intention of repeat purchase, a consumer loyalty can be expressed by caring behavior. This behavior can be manifested in a great desire to
maintain the relationship, such as the tendency to complaint constructive or word-of-mouth expressing positive a willingness to join others in their choice (Chris
Nolan, 2004).
WORD OF MOUTH
Word-of-mouth can be defined as the act of communicating formally or informally with other consumers about products and services of the company, including
recommendations and defending the company against attacks from other consumers (Henning-Thoreau and al, 2006). It is a communication that is beyond the
company and comes from a quite natural in the external environment and specifically for consumers. Word-of-mouth is characterized by a high credibility
(Gremler and al, 2007). To advertising, consumers are generally skeptical of the sincerity and credibility of the message and saw that the belief that behind every
advertisement there is a commercial interest that takes precedence over any design. Word-of-mouth is an important indicator of loyalty. In this context, a Gould
(2005) states that a loyal customer can be defined as one who not only uses the goods or services, but satisfaction is such that it speaks to his entourage. A loyal
customer will disclose to others of good assessments and encourage them to attend the same company or buy the same brand. It is therefore to free publicity
for the company.
COMPLAINT
The complaint is defined as a phenomenon related to post-purchase response to dissatisfaction during an episode of purchase or consumption of a product or
service (Cree and Alladin, 2008). This is a "request for information, correction and / or compensation from the client and from the organization, following
dissatisfaction with responsibility of the organization" (Prim- Allaz and Sabadie, 2003). The complaint is a valuable source of free information for identifying
malfunctions. Therefore, companies must treat it as a source of enrichment rather than as a constraint.
U

VOLUME NO. 3 (2013), I SSUE NO. 09 (SEPTEMBER ) ISSN 2231-5756
INTERNATIONAL JOURNAL OF RESEARCH IN COMMERCE, IT & MANAGEMENT A Monthly Double-Blind Peer Reviewed (Refereed/Juried) Open Access International e-Journal - Included in the International Serial Directories
http://ijrcm.org.in/
112
The importance of the complaint is that of being given a second chance to the company. It allows it to overcome the problems that were causing the discomfort
or dissatisfaction of the consumer and thus enable it to prevent and reduce the risks associated with customer relationship breaks Zeithaml and al, (2006); Prim
and Pras, (2009).The theoretical foundations of loyalty to a cyber merchant are nearly identical compared to the traditional loyalty. However, the operating
environment changes to better take into account the specificities of the interactive context in the field of interactive commerce.
INTENTION OF REPEAT PURCHASE
If loyalty is defined as an uninterrupted sequence many purchases of the same brand, it is estimated according to the marketing literature that a minimum of
three or four successive repeat purchase enough to talk about loyalty. The set of behavioral approaches to loyalty only attaches to observe the behavior of
repeat purchase, without asking their intentional or not. The lack of distinction in all of these measures between intentional loyalty and loyalty is the main
observed through this approach. It seems difficult to reconcile the overly simplistic approach to the behavioral importance of attitude in the decision process.
Behavior on the Internet is much less stable over time. Indeed, the cyber consumer has more alternatives to choose from, the cost of change is relatively small,
and information about the sites is available at low cost. All these factors make it generally more difficult to understand loyalty to a website in its classical. In this
context, Boultaire and Mathaeus (2009) have demonstrated the centrality could play the commitment to the site in the determination of the precision. They
emphasized the relevance of transcribing the relational approach in the conceptualization of loyalty on the internet.
Relational loyalty must be manifested by a cooperative relationship in the long run. The consumer is no longer a mere purchaser of the product or user of the
site, but a true partner with whom we can cooperate and be willing to make sacrifices in the short term. The establishment of such a relationship necessarily
involves the strengthening of satisfaction and consumer confidence in the brand or site.
EMOTIONAL STATE
"Intense emotional state, characterized by a sudden physical and mental disturbances which are abolished in the presence of certain stimuli or representations
vivid, appropriate responses to adapt to the environment. Inadequate modulation of emotional reaction leads to an exaggeration of the reaction in terms of
euphoria or depression, or decrease it with insensitivity and indifference. Cognitive functions can be secondarily affected "(Loui Bernube, 2001.)
Emotions are complex reactions that involve both body and mind. These reactions include a subjective mental state, such as anger, anxiety or love, an impulse to
act as escape or attack, whether expressed openly or not, and profound change in the body, such that an increased heart rate or blood pressure.
Some of these physical changes prepare for adaptation actions supported. Others such as postures, gestures and facial expressions communicate to others what
we feel or what we want others to believe that we feel.
By emotion, we mean a mental state of real time that arises from cognitive appraisals of events or thoughts. It has a phenomenological tone, is accompanied by
physiological processes, is often expressed physically, and may result in specific actions to affirm or cope with the emotion, depending on its nature and meaning
for the person having it (Richard P. Bagozzi, Mahesh Gopinath and Prashanth U.Nyeer,).
It follows from these definitions that combine emotion:
- Physical sensations (changes in heart rate, muscle tone, alertness, sweating...)
- Mental representations
- The specific motor responses (from the tension of facial muscles to flight or attack, for the case of a threatening situation, the smile is to "jump for joy" in a
pleasant situation).
The importance and place of these elements in the development of emotion theories vary. Mehrabian (2000 and 1997) and Mehrabian and Russell (2003, 1974
and 1975) identify the emotional state as a reaction against the individual manifests an environment. According to Whitner (1998), is the set of tangible stimuli
that influence the perception and response of the individual.
Emotion is a multidimensional concept. The dimensional perspective that describes emotions in terms of minimum number of base dimension recognizes this
feature. The model of Mehrabian and Russell (1994) identifies three dimensions of emotion, namely pleasure versus displeasure, arousal and awakening versus
non-dominant versus non-dominance. Regarding the first dimension, pleasure describes the satisfaction or happiness felt vis-à-vis a stimulus. Dube (1999)
defined pleasure as "a primary motivation for purchasing hedonic products or services, or as a signal that a transaction has been satisfactory." Bel and Dube
(1998) present three sources of pleasure: sensory pleasure, pleasure and fun social psychology. The sensory pleasure is the sense of contact between the
individual and the physical world. The description of the sensory dimensions by the interviewees reflected this kind of pleasure. The social pleasure is being with
others and especially with friends by performing an activity. Psychological pleasure has two kind of pleasure: the pleasure emotionally grasped through positive
emotional responses experienced during a consumption experience, which includes cognitive and the intellectual dimension.
In this research, we will retain the emotional and sensory pleasure. Cardes (1998) states that arousal is a physiological state influenced by exposure to emotional
stimuli. Dominance is defined as the extent to which the individual controls or is controlled by stimuli.
To sum up the emotional reaction means an intense experience of short duration and specific to a stimulus. The multidimensionality of this concept reflects its
conceptual richness and explains the emotion in terms of three central dimensions.
In this research, we will look to capture the potential impact of these emotional states on the satisfaction of online shoppers. The study of this influence is part
of the vision of Zajonivic (1990.1994) which postulates that "the primary reaction of an individual in a situation where the emotional and cognitive conflicts, is
emotional". Thus emotional states positively influence the satisfaction of online shoppers. So our assumptions are as follows:
H.1.1: The pleasure has a positive effect on the satisfaction of cyber consumers.
H.1.2: The stimulus has a positive effect on the satisfaction of cyber consumers.
H.1.3: The dominance has a positive effect on the satisfaction of cyber consumers.
PERCEIVED RISK
The notion of risk is a central theme of research in many fields as finance, marketing, sociology and psychology. In marketing, the risk is a source of much debate
about the detailed steps of consumer behavior. Indeed, Bayer (1990) was the forerunner of the theory of perceived risk that consumers often perceive a risk at
the time of their purchases. For this author, "consumer behavior involves risk in the sense that any action by the consumer will lead to consequences that can
not anticipate with certainty approximate and some could be unpleasant."
Several researchers in marketing have proposed a multitude of definitions of perceived risk. Indeed, Cox Rich (1994) have conceptualized entant that "the
quantity issues in a purchase situation." For their part, Murray (1991) points out that the perceived risk is the uncertainty perceived by the consumer for losses
or gains of a particular transaction. Rudi Voller (1995) also identified the risk as "the possibility of loss due to the purchase or consumption of a product (or
service)." This diversity in the conceptualization of the concept confirms About Bischoff (2005) which states "if one were to read ten articles on risk, it should not
be surprised to see the risk described in ten different ways".
Although no consensus was reached on the precise nature of perceived risk, most authors agree that it is a built-dimensional, consisting of the likelihood of
unpleasant results and the importance of loss, Roselius (2001), Bettman (2003), Lutz and Reilly (2003), Taylor (1974), Peter and Tarpey, (1975) and Peter and
Ryan 1(976). On the other hand, it is considered a multi-faceted building up of physical risk, psychological risk, social risk, financial risk, performance risk and risk
of loss of time, Jacoby and Kaplan, (1972); Peter and Tarpey, (1975); Brooker, (1984), Garner, (2006); Mitchell, (1992); Shiffman and Kanuk, (2007).
With the advent of the Internet as a new environment to purchase virtual nature, Forsythe and Shi (2003) have defined the perceived risk associated with
Internet purchases as "the expectation of loss subjectively determined by year Internet Particular shopper in contemplating a purchase online". The risk
perceived by consumers in using this new marketing method, to order the products they want increases. Indeed, Cox and Rich (1994) argue that certain forms of
purchase are perceived as riskier. Thus, Spencer, Engel and Blackwell (2000) and Festervand, and Tsaais Synder (2006) specifically state that the purchase by
telephone and mail order purchases are more risky than buying in a store.
Despite the importance of perceived risk in the understanding of satisfaction, there is no consensus regarding the relationship between these concepts. Indeed,
some researchers consider the perceived risk as antecedent of satisfaction; others conceptualize because of satisfaction. As part of our research, the perceived
risk is considered a precursor of satisfaction. Thus, the perceived risk makes it all the more critical the concept of e-satisfaction.

VOLUME NO. 3 (2013), I SSUE NO. 09 (SEPTEMBER ) ISSN 2231-5756
INTERNATIONAL JOURNAL OF RESEARCH IN COMMERCE, IT & MANAGEMENT A Monthly Double-Blind Peer Reviewed (Refereed/Juried) Open Access International e-Journal - Included in the International Serial Directories
http://ijrcm.org.in/
113
Indeed, the lack of security and network reliability, lack of confidentiality of personal information stored or transmitted which can be intercepted by anyone
other than those involved in the transaction reluctant to leave the consumer this means of distribution. This reluctance is manifested at the level of
dissatisfaction of the consumer to the commercial website. Thus, we assume a negative impact on the dimensions of perceived risk on the dimensions of
satisfaction with the site. Therefore, our assumptions are as follows:
H.2.1: The global risk associated with purchasing over the Internet has a negative impact on the satisfaction of cyber consumers.
H.2.2: The financial risk associated with Internet shopping has a negative impact on the satisfaction of cyber consumers.
H.2.3: The risk of loss of time associated with Internet shopping has a negative impact on the satisfaction of cyber consumers.
H.2.4: The social risk associated with purchasing over the Internet has a negative impact on the satisfaction of cyber consumers.
H.2.5: The psychological risk associated with purchasing over the Internet has a negative impact on the satisfaction of cyber consumers.
H.2.6: The functional risk associated with Internet shopping has a negative impact on the satisfaction of cyber consumers.
H.2.7: The physical risk associated with Internet shopping has a negative impact on the satisfaction of cyber consumers.
E-SATISFACTION
Satisfaction has generally been presented as an emotional state arising from the non-confirmation of positive or negative initial expectations for the experience
of possession or consumption (Greg Oliver, 2000). However, recent research shows that this conception transactional, cognitive, based on a single standard of
comparison (initial expectations) is far from sufficient to identify the process of formation of satisfaction.
In addition, this definition of popular satisfaction and is often confused with the conceptualization of perceived quality, found no echo in research in the field of
e-commerce and the Web sites in general. This is due to the difficulty of measuring satisfaction in this perspective. In addition, as emotional satisfaction has
been studied in research on the browsing experience but less evident in research on electronic commerce (Chiu, 2004).
Current researches mostly opt for a design considering the dual satisfaction as the result of two parallel processes, one is cognitive and the other is affective
(Edward, 2001). Beyond this distinction between the cognitive and emotional literature presents another difference in definition of satisfaction. In fact,
researchers have defined this concept in a larger way in marketing.
CONCLUSION If the company can provide good satisfaction to consumers through its products online, The consumer will be always loyal to the particular company’s product
through his whole life and will spread the word of good mouth to all known to him which will create a huge loyalty base for the company and the consumer will
be a loyal fan to the company for many more years to come.
REFERENCES 1. Edward, 2001). Distinction between the Cognitive and Emotional loyalty, AMA journal
2. Forsythe and Shi (2003) Behaviour of Internet Shopper, Journal of Business Research
3. Greg Oliver, 2000) Emotional State of Satisfaction, Journal of Marketing Research.
4. Whitner (1998), Stimuli influence on Perception and Response of the individual. Harvard Business Review
VOLUME NO. 3 (2013), I SSUE NO. 09 (SEPTEMBER ) ISSN 2231-5756
INTERNATIONAL JOURNAL OF RESEARCH IN COMMERCE, IT & MANAGEMENT A Monthly Double-Blind Peer Reviewed (Refereed/Juried) Open Access International e-Journal - Included in the International Serial Directories
http://ijrcm.org.in/
114
STUDENTS PERCEPTION TOWARDS e-BANKING: SPECIAL REFERENCE TO KOLLAM DISTRICT IN KERALA
NIJAZ NIZAR
ASST. PROFESSOR
DEPARTMENT OF MBA
CHMM COLLEGE FOR ADVANCED STUDIES
CHAVARCODE
ABSTRACT The changing relationship between consumers and banks has escalated the competition in the banking industry. Information and communication technology is
considered as one of the key driver for innovative banking services around the world. This study focus on determining the perception of student’s towards e-
banking services. The questionnaire was developed considering the five dimensions of e-banking services. The study was conducted in Kollam district of Kerala
state, in India which has high penetration level of banking services among students. The result shows there is positive perception towards e-banking services
among students but there is issues related to security.
KEYWORDS e-banking, perception, banking services
INTRODUCTION nformation and communication technology (ICT) have changed the way of conducting banking business and is becoming an important factor in the
development of financial industry. The promise of ICT in the banking sector has been seen in terms of its potential to increase customer base, reduce
transactions cost, improve the quality and timeliness of response, enhance opportunities for advertising and branding, facilitate self-service and
customization and improve customer communication and relationship (Garau, 2002). This helped all banks making greater use of ICT facilities to provide better
service and to excel in competition. Habib (2012) mentioned the factors to consider when banks adopt technological innovations are assets of a bank, years of
operation, urban location, deposits ratio, and expenses ratio.
LITERATURE REVIEW Electronic Banking (E-Banking) includes various banking activities conducted through internet, mobile phone, telephone, automated teller machines (ATM),
credit and debit cards etc towards customers without being present at physical banking location. E-banking saves time and money for banks and consumers as
consumers can pay bills, secure loan, know their account balance, transfer money etc and banks can utilize e-banking as an inexpensive way to reach remote
consumers or rural consumers as an alternative to branch banking.
Sayar and Wolfe (2007) mentioned that the evolution of e-banking has fundamentally transformed the way banks traditionally conduct their businesses and the
ways consumers perform their banking activities. According to Christopher et al (2006), E - banking has become an important channel to sell the products and
services and is perceived to be necessity in order to stay profitable in successful.
The major capabilities of E-banking Services include the following:
1. View Current Account Balance and History at any time: Consumers can check the status of their account balance, transaction history, history related to
withdrawal and deposit etc.
2. Obtain Credit Card and Debit Card Statement: Consumers can easily check their transaction history of credit card and debit card.
3. Pay Bills: Paying bills through e-banking services has helped consumers save time, no waiting in lines etc.
4. Transfer money between accounts: Money can be transferred between consumers account or between inter banks.
Chou and Chou (2000) identified five basic services associated with E-banking: view account balances and transaction histories; paying bills; transferring funds
between accounts; requesting credit card advances; and ordering checks for more faster services that can be provide by domestic and foreign bank. E-banking
allows customers to perform a wide range of banking transactions electronically via the bank's website anytime and anywhere (Grabner-Kraeuter and Faullant,
2008).
(a) BENEFITS OF E-BANKING TOWARDS CUSTOMERS
1. Accessibility: Customers account can easily accessible with an E-banking account.
2. Anytime Anywhere Banking: E-banking provides 24 hours service to the customers for anytime, anywhere banking, which means customers can access E-
banking services 7days a week, 24 hours a day.
3. Cash Free Shopping: A customer can shop without any need of carrying paper money with him.
4. ATM Withdrawal: Customer can withdraw at any time through ATMs that are now widely available throughout the country. Besides withdrawing cash
customers can also have mini banks statements, balance inquiry at these ATMs.
5. Bill Payment: E banking has also greatly helped in payment of utility bill. Now there is no need to stand in long queues outside banks for his/her purpose.
(b) BENEFITS OF E-BANKING TOWARDS BANKING INDUSTRY
1. More Customers: Better service levels and strategic marketing initiatives, banks are able to reach out to more customers than possible through traditional
banking through physical location branches.
2. Cost Savings: Banks save a significant amount of operational capital from not having to open physical location branches in new locations. These savings are
passed onto the consumer in the form of reduced or no fees for inter-bank and even intra-bank money transfers, no fees for online payment of utilities'
bills, and cash-back options on frequent use of online-applied bank credit cards.
3. Boundary Less Services: Banks can provide their services to customers without any geographic barrier.
Adoption of information technology enabled tools helped banks in reducing operational costs, infrastructure cost, staffing etc and helped to reduce customer
waiting time in branches resulting in highly satisfied customers.
RESEARCH METHODOLOGY This study was conducted as a survey that examined Students perception towards e-banking in Kollam district of Kerala state, so the area of survey was confined
to Kollam district of Kerala state. The survey instrument was a developed questionnaire comprising open ended and five point categorical rating scale (indicating
1 = very comfortable and 4 = uncomfortable) divided into two (2) sections: personal details and students perception towards e-banking in Kerala state. Data was
collected from 200 students and simple random sampling method was used in various colleges at Kerala State during April –July 2013.
I
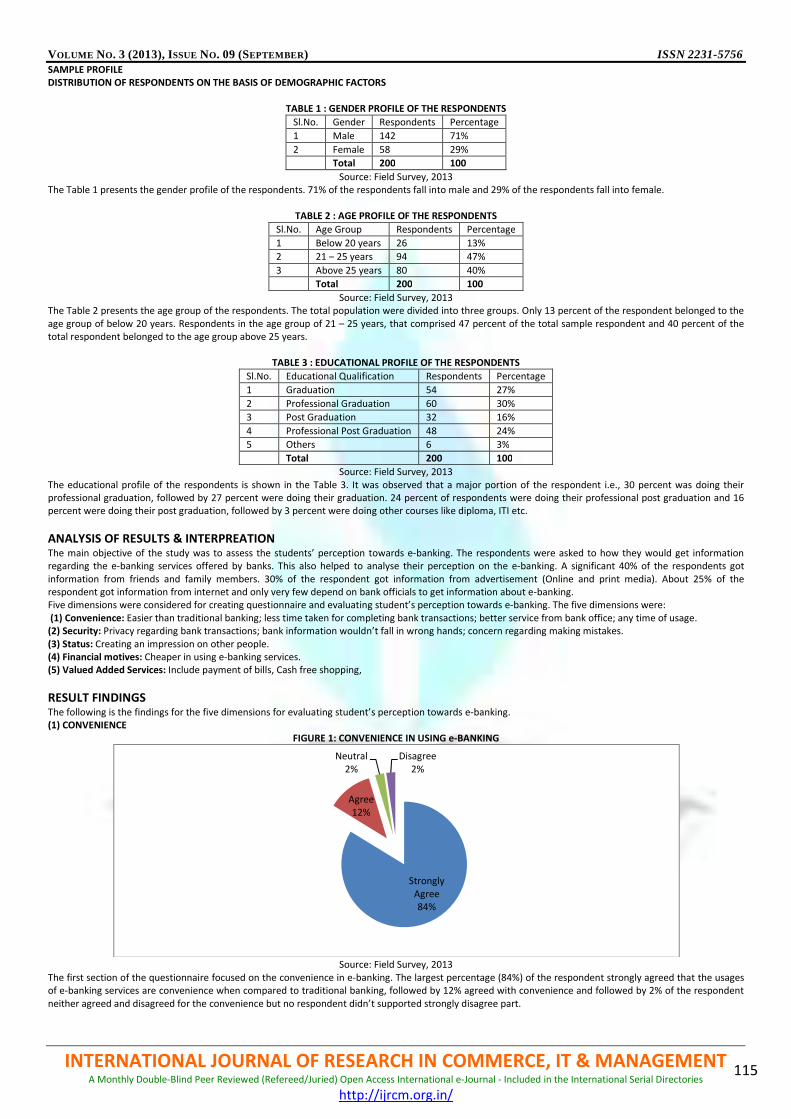
VOLUME NO. 3 (2013), I SSUE NO. 09 (SEPTEMBER ) ISSN 2231-5756
INTERNATIONAL JOURNAL OF RESEARCH IN COMMERCE, IT & MANAGEMENT A Monthly Double-Blind Peer Reviewed (Refereed/Juried) Open Access International e-Journal - Included in the International Serial Directories
http://ijrcm.org.in/
115
SAMPLE PROFILE
DISTRIBUTION OF RESPONDENTS ON THE BASIS OF DEMOGRAPHIC FACTORS
TABLE 1 : GENDER PROFILE OF THE RESPONDENTS
Sl.No. Gender Respondents Percentage
1 Male 142 71%
2 Female 58 29%
Total 200 100
Source: Field Survey, 2013
The Table 1 presents the gender profile of the respondents. 71% of the respondents fall into male and 29% of the respondents fall into female.
TABLE 2 : AGE PROFILE OF THE RESPONDENTS
Sl.No. Age Group Respondents Percentage
1 Below 20 years 26 13%
2 21 – 25 years 94 47%
3 Above 25 years 80 40%
Total 200 100
Source: Field Survey, 2013
The Table 2 presents the age group of the respondents. The total population were divided into three groups. Only 13 percent of the respondent belonged to the
age group of below 20 years. Respondents in the age group of 21 – 25 years, that comprised 47 percent of the total sample respondent and 40 percent of the
total respondent belonged to the age group above 25 years.
TABLE 3 : EDUCATIONAL PROFILE OF THE RESPONDENTS
Sl.No. Educational Qualification Respondents Percentage
1 Graduation 54 27%
2 Professional Graduation 60 30%
3 Post Graduation 32 16%
4 Professional Post Graduation 48 24%
5 Others 6 3%
Total 200 100
Source: Field Survey, 2013
The educational profile of the respondents is shown in the Table 3. It was observed that a major portion of the respondent i.e., 30 percent was doing their
professional graduation, followed by 27 percent were doing their graduation. 24 percent of respondents were doing their professional post graduation and 16
percent were doing their post graduation, followed by 3 percent were doing other courses like diploma, ITI etc.
ANALYSIS OF RESULTS & INTERPREATION The main objective of the study was to assess the students’ perception towards e-banking. The respondents were asked to how they would get information
regarding the e-banking services offered by banks. This also helped to analyse their perception on the e-banking. A significant 40% of the respondents got
information from friends and family members. 30% of the respondent got information from advertisement (Online and print media). About 25% of the
respondent got information from internet and only very few depend on bank officials to get information about e-banking.
Five dimensions were considered for creating questionnaire and evaluating student’s perception towards e-banking. The five dimensions were:
(1) Convenience: Easier than traditional banking; less time taken for completing bank transactions; better service from bank office; any time of usage.
(2) Security: Privacy regarding bank transactions; bank information wouldn’t fall in wrong hands; concern regarding making mistakes.
(3) Status: Creating an impression on other people.
(4) Financial motives: Cheaper in using e-banking services.
(5) Valued Added Services: Include payment of bills, Cash free shopping,
RESULT FINDINGS The following is the findings for the five dimensions for evaluating student’s perception towards e-banking.
(1) CONVENIENCE
FIGURE 1: CONVENIENCE IN USING e-BANKING
Source: Field Survey, 2013
The first section of the questionnaire focused on the convenience in e-banking. The largest percentage (84%) of the respondent strongly agreed that the usages
of e-banking services are convenience when compared to traditional banking, followed by 12% agreed with convenience and followed by 2% of the respondent
neither agreed and disagreed for the convenience but no respondent didn’t supported strongly disagree part.
Strongly
Agree
84%
Agree
12%
Neutral
2%
Disagree
2%

VOLUME NO. 3 (2013), I SSUE NO. 09 (SEPTEMBER ) ISSN 2231-5756
INTERNATIONAL JOURNAL OF RESEARCH IN COMMERCE, IT & MANAGEMENT A Monthly Double-Blind Peer Reviewed (Refereed/Juried) Open Access International e-Journal - Included in the International Serial Directories
http://ijrcm.org.in/
116
(2) SECURITY
FIGURE 2: SECURITY IN USING e-BANKING
Source: Field Survey, 2013
This section of the questionnaire focused on the security issues of e-banking. The largest percentage (95%) of the respondent strongly agreed that the usages of
e-banking services have concern regarding are security, followed by 2% agreed with the same fact and followed by 3% of the respondent neither agreed nor
disagreed but no respondent didn’t supported strongly disagree part.
(3) STATUS
FIGURE 3: STATUS IN USING e-BANKING
Source: Field Survey, 2013
This section of the questionnaire focused on the social status associated with using e-banking services. 50% of respondent strongly disagreed about using e-
banking as status symbol followed by 28% of respondent supporting the above mentioned statement.16% respondent stayed neutral and 4% of respondent
strongly supported e-banking as status symbol, followed by 2% agreeing with the statement.
(4) FINANCIAL MOTIVES
FIGURE 4: FINANCIAL MOTIVES BEHIND USING e-BANKING
Source: Field Survey, 2013
This section of the questionnaire focused on the financial motives behind using e-banking services. 32% of respondent strongly agreed having financial motives
in using e-banking, which is supported strongly by 30% of respondent. 25% kept this section as neutral and 5% respondent disagreed with the fact, financial
motives supported by 8% of respondent strongly supporting it.
Strongly
Agree
95%
Agree
2%
Neutral
3%Disagree
0% Strongly Disagree
0%
Strongly Agree
4%Agree
2%
Neutral
16%
Disagree
28%
Strongly
Disagree
50%
Stronlgy
Agree
32%
Agree
30%
Neutral
25%
Disagree
5%
Stronlgy Disagree
8%

VOLUME NO. 3 (2013), I SSUE NO. 09 (SEPTEMBER ) ISSN 2231-5756
INTERNATIONAL JOURNAL OF RESEARCH IN COMMERCE, IT & MANAGEMENT A Monthly Double-Blind Peer Reviewed (Refereed/Juried) Open Access International e-Journal - Included in the International Serial Directories
http://ijrcm.org.in/
117
(5) VALUE ADDED SERVICES
FIGURE 5: VALUE SERVICE SUPPORTED BY e-BANKING
Source: Field Survey, 2013
This section of the questionnaire focused on the value added services provided by e-banking services. 50% of respondent was neutral in this section as
population of respondent was students but 15% of respondent strongly agreed , followed by 10% of respondent supporting for value added services. 17% of
respondent disagreed with the valued added services provided by e-banking followed by 8% of respondent strongly disagreeing.
CONCLUSION E-Banking is a great new way of performing everything that you do at the bank; on your computer. E-banking which can has emerged fast as a medium of
providing banking services differently from traditional banking services where need for infrastructure is huge.
This study reported interesting facts about the perception of students in the context of e-banking. Students’ perception is measured using five dimensions as
criteria. It has been found out convenience followed by financial motives are the dimension for students prefer for e-banking. The dimensions, status and other
value added services are less important for considering e-banking services. A majority of the students are concern with the security issuing in using e-banking
which includes online frauds and manually stealing credit or debit cards.
REFERENCES 1. Garau, C. (2002) “Online Banking in transition economies: The Implementation and Development of online banking systems in Romania,” International
Journal of Bank Marketing, 20(6), pp.285-296.
2. Habib, Sufyan. (2012) “Internet Banking in India Consumer Concerns and Bank Marketing Strategies”, Research Journal of Management Sciences, Vol.1(3),
pp 20-24.
3. Christopher GC, Mike LV, Amy W (2006). ‘A log it Analysis of Electronic Banking in New Zealand’. Int. J. Bank Market, 24: 360-383.
4. Grabner-Kräuter, S., & Faullant, R. (2008), Consumer acceptance of internet banking: the influence of internet trust, International Journal of bank
marketing, Vol.26 (7), pp. 483-504.
5. Chou, D., & Chou, A.Y. (2000), A Guide to the Internet Revolution in Banking, Information Systems Management, Vol.17 (2), pp. 51-57.
6. Sayar, C., & Wolfe, S. (2007) ‘Internet banking market performance: Turkey versus the UK’, International Journal of Bank Marketing, 25(3), pp.122-141.
Stongly Agree
15%
Agree
10%
Neutral
50%
Disagree
17%
Stongly Disagree
8%
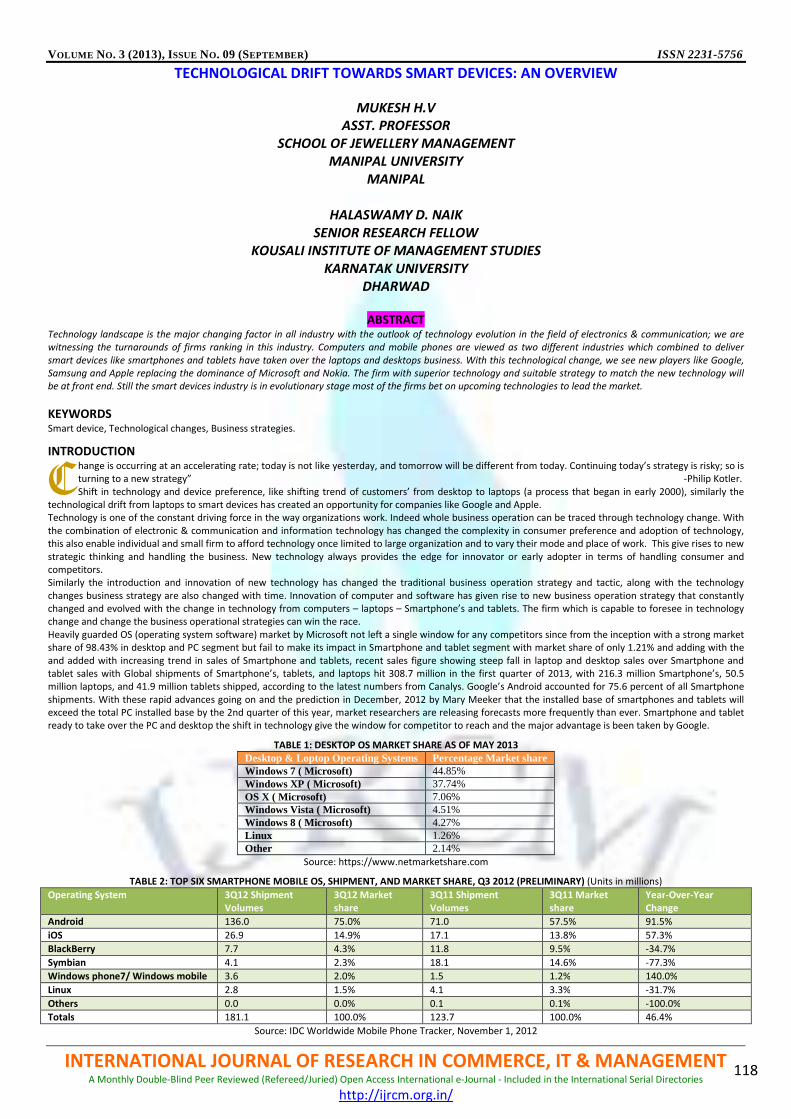
VOLUME NO. 3 (2013), I SSUE NO. 09 (SEPTEMBER ) ISSN 2231-5756
INTERNATIONAL JOURNAL OF RESEARCH IN COMMERCE, IT & MANAGEMENT A Monthly Double-Blind Peer Reviewed (Refereed/Juried) Open Access International e-Journal - Included in the International Serial Directories
http://ijrcm.org.in/
118
TECHNOLOGICAL DRIFT TOWARDS SMART DEVICES: AN OVERVIEW
MUKESH H.V
ASST. PROFESSOR
SCHOOL OF JEWELLERY MANAGEMENT
MANIPAL UNIVERSITY
MANIPAL
HALASWAMY D. NAIK
SENIOR RESEARCH FELLOW
KOUSALI INSTITUTE OF MANAGEMENT STUDIES
KARNATAK UNIVERSITY
DHARWAD
ABSTRACT Technology landscape is the major changing factor in all industry with the outlook of technology evolution in the field of electronics & communication; we are
witnessing the turnarounds of firms ranking in this industry. Computers and mobile phones are viewed as two different industries which combined to deliver
smart devices like smartphones and tablets have taken over the laptops and desktops business. With this technological change, we see new players like Google,
Samsung and Apple replacing the dominance of Microsoft and Nokia. The firm with superior technology and suitable strategy to match the new technology will
be at front end. Still the smart devices industry is in evolutionary stage most of the firms bet on upcoming technologies to lead the market.
KEYWORDS Smart device, Technological changes, Business strategies.
INTRODUCTION hange is occurring at an accelerating rate; today is not like yesterday, and tomorrow will be different from today. Continuing today’s strategy is risky; so is
turning to a new strategy” -Philip Kotler.
Shift in technology and device preference, like shifting trend of customers’ from desktop to laptops (a process that began in early 2000), similarly the
technological drift from laptops to smart devices has created an opportunity for companies like Google and Apple.
Technology is one of the constant driving force in the way organizations work. Indeed whole business operation can be traced through technology change. With
the combination of electronic & communication and information technology has changed the complexity in consumer preference and adoption of technology,
this also enable individual and small firm to afford technology once limited to large organization and to vary their mode and place of work. This give rises to new
strategic thinking and handling the business. New technology always provides the edge for innovator or early adopter in terms of handling consumer and
competitors.
Similarly the introduction and innovation of new technology has changed the traditional business operation strategy and tactic, along with the technology
changes business strategy are also changed with time. Innovation of computer and software has given rise to new business operation strategy that constantly
changed and evolved with the change in technology from computers – laptops – Smartphone’s and tablets. The firm which is capable to foresee in technology
change and change the business operational strategies can win the race.
Heavily guarded OS (operating system software) market by Microsoft not left a single window for any competitors since from the inception with a strong market
share of 98.43% in desktop and PC segment but fail to make its impact in Smartphone and tablet segment with market share of only 1.21% and adding with the
and added with increasing trend in sales of Smartphone and tablets, recent sales figure showing steep fall in laptop and desktop sales over Smartphone and
tablet sales with Global shipments of Smartphone’s, tablets, and laptops hit 308.7 million in the first quarter of 2013, with 216.3 million Smartphone’s, 50.5
million laptops, and 41.9 million tablets shipped, according to the latest numbers from Canalys. Google’s Android accounted for 75.6 percent of all Smartphone
shipments. With these rapid advances going on and the prediction in December, 2012 by Mary Meeker that the installed base of smartphones and tablets will
exceed the total PC installed base by the 2nd quarter of this year, market researchers are releasing forecasts more frequently than ever. Smartphone and tablet
ready to take over the PC and desktop the shift in technology give the window for competitor to reach and the major advantage is been taken by Google.
TABLE 1: DESKTOP OS MARKET SHARE AS OF MAY 2013
Desktop & Loptop Operating Systems Percentage Market share Windows 7 ( Microsoft) 44.85% Windows XP ( Microsoft) 37.74% OS X ( Microsoft) 7.06% Windows Vista ( Microsoft) 4.51% Windows 8 ( Microsoft) 4.27% Linux 1.26% Other 2.14%
Source: https://www.netmarketshare.com
TABLE 2: TOP SIX SMARTPHONE MOBILE OS, SHIPMENT, AND MARKET SHARE, Q3 2012 (PRELIMINARY) (Units in millions)
Operating System 3Q12 Shipment
Volumes
3Q12 Market
share
3Q11 Shipment
Volumes
3Q11 Market
share
Year-Over-Year
Change
Android 136.0 75.0% 71.0 57.5% 91.5%
iOS 26.9 14.9% 17.1 13.8% 57.3%
BlackBerry 7.7 4.3% 11.8 9.5% -34.7%
Symbian 4.1 2.3% 18.1 14.6% -77.3%
Windows phone7/ Windows mobile 3.6 2.0% 1.5 1.2% 140.0%
Linux 2.8 1.5% 4.1 3.3% -31.7%
Others 0.0 0.0% 0.1 0.1% -100.0%
Totals 181.1 100.0% 123.7 100.0% 46.4%
Source: IDC Worldwide Mobile Phone Tracker, November 1, 2012
C

VOLUME NO. 3 (2013), I SSUE NO. 09 (SEPTEMBER
INTERNATIONAL JOURNAL OF RESEARCH IN COMMERCEA Monthly Double-Blind Peer Reviewed (Refereed
Smartphone and tablets are increasingly dominating the world of smart devices. The advent of mobile data smartphone becomes a
masses. This has widely been discounted by telecom operators but smartphone and t
cost. This upgraded technology from the integration of computer and mobile phone has posed serious threat to laptop and deskt
by 2017 there will be decrease rate of sales in laptops and desktop and increase in sales of smartphone and tablets.
EARLY STAGE OF MOBILE OS MARKET
Mobile phone operating system was not viewed as major attribute by consumers for purchase
emphasized on hardware component and additional features like FM radio, MP3 players, camera etc. Later when mobile phone manu
integrating mobile phone with computers this leads to e
computer operating system into mobile phone due to hardware constraints leads to design of new operating system with competen
This opportunity was mainly sensed by Google and started developing mobile OS.
GOOGLE’S ENTRY INTO OPERATING SYSTEM BUSINESS
Google is mainly in search engine business and 99% of their revenue is generated from advertisement. They sell web based adve
(CPC-cost per click, paid listing etc.) with the search engine market share 83% in desktop and PC and 81% in mobiles and tablets.
in technological environment a trend from PC to smartphone and tablets u
available to all devices users which help them to tap maximum number of users. So the company started developing the strategy
in futuristic devices.
Following with the effort Google started investing from 2001, Google acquired 126 companies from Fed 2001 to May 2013 with it
purchase of Motorola Mobility, a mobile device manufacturing company, for $12.5 billion and
company for $5 million making it a wholly owned subsidiary of Google, was founded in Palo Alto, California in October 2003 by
Android Inc., including Rubin, Miner and White, stayed at the company after the acquisition. Reports from the BBC and the Wall Street Journal noted that Google
wanted its search and applications on mobile phones and it was working hard to deliver that. Through the effort and acquisiti
product a mobile device platform built on the Linux kernel version 2.6 first commercially available phone to run Android was
October 22, 2008. From this point Google never looked back, with its huge resources br
coming up with new version regularly.
TECHNOLOGY SHIFT FROM LAPTOP TO SMART PHONES AND TABLETS
Computer Dell released its first quarter report down 79% in earning as consumers turn from
desktops as went stagnant in terms of evolution or even companies has not concentrated much on developing innovative features
components beyond increasing RAM, storage space, p
developed with in short span of time. The key shift in technology in mobile phones came when manufacturers started incorporat
like increased processing speed, improvised software (operation systems), computer based user applications software’s (known
internet usability enhanced the mobile phones which at present stage looks fare more superior then laptops
sales figures.
The real shift was seen in the end of the 2010 PC has always sold for more than smartphones. In the first quarter of 2010, 85
compared to 55 million smartphones. The cross over is expected by 2012, instead by the third quarter of 2010, 94 million PC were sold agents 100 million
smartphones. The trend of PC sales is stagnant or at best modest growth around 300 million per year.
The traditional PC manufacturing companies like HP, Dell and Lenovo who were also late to react to the change in trend now started considering as major
technological shift started developing new products and most of them has introduces there smartphones and tablets in the mark
COMPETITORS AND OTHER FIRM’S REACTION TO CHANGE
With no clear view that the introduction of new technology of smartphone and tablets was by one individual firm, it was the c
technological bits from various firms. The major contributors for sm
has different core business and business model now converging towards single industries.
Apple was the second largest IT Company by revenue after Samsung electroni
differentiation, product excellence and innovation are the key strategy of apple along with its legendry leader Steve Jobs. T
January 2007 a convergence of internet enabled smartphone and ipod along with Apple’s Mac OS X (later renamed as ios). Later in January 2010 apple
EPTEMBER )
INTERNATIONAL JOURNAL OF RESEARCH IN COMMERCE, IT Refereed/Juried) Open Access International e-Journal - Included in the International Serial Directories
http://ijrcm.org.in/
Smartphone and tablets are increasingly dominating the world of smart devices. The advent of mobile data smartphone becomes a
masses. This has widely been discounted by telecom operators but smartphone and tablets offer more flexibility in term of mobility, access to internet and low
cost. This upgraded technology from the integration of computer and mobile phone has posed serious threat to laptop and deskt
decrease rate of sales in laptops and desktop and increase in sales of smartphone and tablets.
TABLE 3
Source: Gartner (2012)
Mobile phone operating system was not viewed as major attribute by consumers for purchase decision in the initial stages, since much preference was
emphasized on hardware component and additional features like FM radio, MP3 players, camera etc. Later when mobile phone manu
integrating mobile phone with computers this leads to emerging importance of reliable user-friendly software. Inability to down size and incorporate the
computer operating system into mobile phone due to hardware constraints leads to design of new operating system with competen
opportunity was mainly sensed by Google and started developing mobile OS.
INESS
Google is mainly in search engine business and 99% of their revenue is generated from advertisement. They sell web based adve
cost per click, paid listing etc.) with the search engine market share 83% in desktop and PC and 81% in mobiles and tablets.
in technological environment a trend from PC to smartphone and tablets users, this change should be responded to keep the market share up and search engine
available to all devices users which help them to tap maximum number of users. So the company started developing the strategy
Following with the effort Google started investing from 2001, Google acquired 126 companies from Fed 2001 to May 2013 with it
purchase of Motorola Mobility, a mobile device manufacturing company, for $12.5 billion and one of the smart investment was Android a mobile software
company for $5 million making it a wholly owned subsidiary of Google, was founded in Palo Alto, California in October 2003 by
hite, stayed at the company after the acquisition. Reports from the BBC and the Wall Street Journal noted that Google
wanted its search and applications on mobile phones and it was working hard to deliver that. Through the effort and acquisiti
product a mobile device platform built on the Linux kernel version 2.6 first commercially available phone to run Android was
October 22, 2008. From this point Google never looked back, with its huge resources branded the Android quickly worldwide and kept constantly improving and
ONES AND TABLETS
Computer Dell released its first quarter report down 79% in earning as consumers turn from personal computers to smartphones to tablets. Laptops and
desktops as went stagnant in terms of evolution or even companies has not concentrated much on developing innovative features
components beyond increasing RAM, storage space, processing speed and reducing weight etc. Unlikely in mobile phone technology improvements are rapidly
developed with in short span of time. The key shift in technology in mobile phones came when manufacturers started incorporat
like increased processing speed, improvised software (operation systems), computer based user applications software’s (known
internet usability enhanced the mobile phones which at present stage looks fare more superior then laptops and desktops and this was contradicted with the
The real shift was seen in the end of the 2010 PC has always sold for more than smartphones. In the first quarter of 2010, 85
The cross over is expected by 2012, instead by the third quarter of 2010, 94 million PC were sold agents 100 million
smartphones. The trend of PC sales is stagnant or at best modest growth around 300 million per year.
anies like HP, Dell and Lenovo who were also late to react to the change in trend now started considering as major
technological shift started developing new products and most of them has introduces there smartphones and tablets in the mark
CHANGE
With no clear view that the introduction of new technology of smartphone and tablets was by one individual firm, it was the c
technological bits from various firms. The major contributors for smartphone and tablet technology are Apple, Samsung and Google where initially all three firms
has different core business and business model now converging towards single industries.
Apple was the second largest IT Company by revenue after Samsung electronics and 3rd
largest mobile manufacturers after Samsung and Nokia. Product
differentiation, product excellence and innovation are the key strategy of apple along with its legendry leader Steve Jobs. T
nce of internet enabled smartphone and ipod along with Apple’s Mac OS X (later renamed as ios). Later in January 2010 apple
ISSN 2231-5756
, IT & MANAGEMENT Included in the International Serial Directories
119
Smartphone and tablets are increasingly dominating the world of smart devices. The advent of mobile data smartphone becomes affordable it is rapidly reaching
ablets offer more flexibility in term of mobility, access to internet and low
cost. This upgraded technology from the integration of computer and mobile phone has posed serious threat to laptop and desktop sales. The trend indicating
decision in the initial stages, since much preference was
emphasized on hardware component and additional features like FM radio, MP3 players, camera etc. Later when mobile phone manufacturers started
friendly software. Inability to down size and incorporate the
computer operating system into mobile phone due to hardware constraints leads to design of new operating system with competent, user friendly mobile OS.
Google is mainly in search engine business and 99% of their revenue is generated from advertisement. They sell web based advertising, monetizing search traffic
cost per click, paid listing etc.) with the search engine market share 83% in desktop and PC and 81% in mobiles and tablets. Google anticipated the change
sers, this change should be responded to keep the market share up and search engine
available to all devices users which help them to tap maximum number of users. So the company started developing the strategy to make the product available
Following with the effort Google started investing from 2001, Google acquired 126 companies from Fed 2001 to May 2013 with its largest acquisition being the
one of the smart investment was Android a mobile software
company for $5 million making it a wholly owned subsidiary of Google, was founded in Palo Alto, California in October 2003 by Andy Rubin. Key employees of
hite, stayed at the company after the acquisition. Reports from the BBC and the Wall Street Journal noted that Google
wanted its search and applications on mobile phones and it was working hard to deliver that. Through the effort and acquisitions Android unveiled its first
product a mobile device platform built on the Linux kernel version 2.6 first commercially available phone to run Android was the HTC Dream, released on
anded the Android quickly worldwide and kept constantly improving and
personal computers to smartphones to tablets. Laptops and
desktops as went stagnant in terms of evolution or even companies has not concentrated much on developing innovative features in teams of hardware
rocessing speed and reducing weight etc. Unlikely in mobile phone technology improvements are rapidly
developed with in short span of time. The key shift in technology in mobile phones came when manufacturers started incorporating the features of computers
like increased processing speed, improvised software (operation systems), computer based user applications software’s (known as smartphone apps) and
and desktops and this was contradicted with the
The real shift was seen in the end of the 2010 PC has always sold for more than smartphones. In the first quarter of 2010, 85 million PC were sold worldwide
The cross over is expected by 2012, instead by the third quarter of 2010, 94 million PC were sold agents 100 million
anies like HP, Dell and Lenovo who were also late to react to the change in trend now started considering as major
technological shift started developing new products and most of them has introduces there smartphones and tablets in the market.
With no clear view that the introduction of new technology of smartphone and tablets was by one individual firm, it was the collective contribution of
artphone and tablet technology are Apple, Samsung and Google where initially all three firms
largest mobile manufacturers after Samsung and Nokia. Product
differentiation, product excellence and innovation are the key strategy of apple along with its legendry leader Steve Jobs. The introduction of first iphone on
nce of internet enabled smartphone and ipod along with Apple’s Mac OS X (later renamed as ios). Later in January 2010 apple

VOLUME NO. 3 (2013), I SSUE NO. 09 (SEPTEMBER ) ISSN 2231-5756
INTERNATIONAL JOURNAL OF RESEARCH IN COMMERCE, IT & MANAGEMENT A Monthly Double-Blind Peer Reviewed (Refereed/Juried) Open Access International e-Journal - Included in the International Serial Directories
http://ijrcm.org.in/
120
introduced tablet ipad running with modified ios, this 2 introduction bring the wave of technology changing the world of smartphone and tablets. The customer
responses were at record, The Company has set record sales for the iPhone and the iPad.
Now with only one line of products in each category apple fail to address multiple segment of customers, followed by the death of Steve Jobs in October 2011.
Post Steve Jobs era was not relay proving good for Apple.
Samsung rise in mobile industry is one of the turning point, they pioneered the industry in touch screen technology now one of the core attribute of the
smartphone and bring more innovative features to smartphones. Nokia’s dominating presence in the mobile industry was a tough challenge for any competitors
in the industry, Samsung has slipped past Nokia selling 90 million handset in the first quarter of 2012 to become the world largest mobile phone company ending
Nokia’s 14 year regime.
The combination of Android and Samsung’s hardware yielded in best mix and been able to win the customers all over the world. TGB (Technology Business
Research) indicated Samsung’s performance solidifies its competitive position against rival Apple and two company’s control 90% of worldwide smartphone
market. In this neck to neck war between two major manufacturers Samsung seems to have a major advantage over its rival.
Samsungs combination with Google has benefited both the firms but Google has also launched its mobile phone Nexus one on January 2010 manufactured by
HTC, later Google extended length by Nexus S and Galaxy Nexus manufactured by Samsung, latest edition was Nexus 4 manufactured by LG electronics. Now
with the acquisition of Motorola Mobility on August 2011 Google can manufacture in its own facilities. Showing once Samsung and Google were in same track to
counter Apple in smartphone now slowly moving into opposite direction.
The combination of Nokia and Microsoft seemed much as a partnership of loser’s pushing hard to make a strong come back with their Nokia Lumia series
(windows phone) but at present status they may not be a major threat for any of the market leaders. Even then Google with Android and Nexus clearly has edge
over both Samsung and Apple.
FUTURE TECHNOLOGY AND MARKET TREND IN SMARTPHONE AND TABLET With no doubt that consumers all over the world have casted their votes on smartphones and tablets future orientation will be focused on constant
improvement on technology. Smart device future also impacted by an in-depth understanding of how core component technology, business model and services
will evolve.
Samsung investing heavily on the Active Matrix Organic Light Emitter Diode (AMOLED) technology assuming that consumers would pay a premium for high
contrast display coupled with lower devices power consumption. Apples engineers focused on developing technology such as multi-touch capability combined
with a capacitive touch screen to create an entirely new user interface model.
The entire base of business domination in the industry stands on the technology and innovation. McKinsey & Company, Inc has identified top mobile device,
hardware and software trend that will significantly impact these devices over the next five years.
TABLE 4
Changing Technology Trends In Smartphone’s and Tablets
New Developments in Technology (New Trends)
Display AMOLED- A full efficient, flexible and foldable display technology react to “retina resolution” (i.e. a higher display resolution density that boosts text and graphic clarity )
Processors ARM processors with low power consumption and more compact in size. Sensors Biometric, pressure and environmental sensors Batteries Lithium- sulfur and carbon nanotubes will increases 80% more capacity, wireless battery charging and fast battery charging. Operating system ios5 and new version of Android User interface Gesture and retina tracking, infrared keyboard and context aware user interface Smartphone’s and tablets as primary computing, firms focusing to position smart devices main computing devices in workplace. Smartphone and tablets are only
as adjunct for workplace for occasional remote usage, the future trend will be to bring it as primary device at workplace. This requires new wave of mobile
applications.
As the trend, opportunities indicate the smart devices market has richness for innovation and change, room for existing firms to make strategic moves with
technology change and revolutionize the industry. The firms need to make sure their own strategies and business plans to capture values from the shift are
equally creative.
CONCLUSION
Technology will continue to advance and amaze us. Once computers and mobile phones were superior technologies at different ends which are combined to
form a for more superior devices (Smartphone and tablets) which is leading the marketplace. With this technological change we see shift in players who are
responsible for technology. Microsoft and Nokia ruled the early stages to till now were replaced by Google, Samsung and Apple.
This clearly indicates the firm with ability to bring new technology as pre the customer preference and adopt new strategy suitable for new technology will be
able to survive and flourish in the market place. As the smart device technology and business strategy is changing rapidly, most enterprises want some way of
taking advantage of these changes to make their business profitable and compete more effectively.
REFERENCES 1. http://articles.washingtonpost.com/2012-10-05/business/35498994_1_apple-maps-tim-cook-apple-co-founder
2. http://business.time.com/2012/08/03/is-apple-losing-its-shine-after-steve-jobs/
3. http://en.wikipedia.org/wiki/IOS_%28Apple%29
4. http://en.wikipedia.org/wiki/Usage_share_of_operating_systems
5. http://venturebeat.com/2013/05/09/smartphones-up-37-tablets-up-106-and-samsung-is-growing-smartphone-shipments-10x-faster-than-apple/
6. http://venturebeat.com/2013/05/09/smartphones-up-37-tablets-up-106-and-samsung-is-growing-smartphone-shipments-10x-faster-than-
apple/#8hluYUvAizL2T2Zg.99
7. http://www.businessinsider.com/bii-report-how-samsungs-rise-is-reshaping-the-mobile-ecosystem-2013-3
8. http://www.forbes.com/sites/haydnshaughnessy/2013/04/30/who-will-win-the-next-phase-in-smartphones/
9. http://www.guardian.co.uk/technology/2011/jun/05/smartphones-killing-pc
10. http://www.guardian.co.uk/technology/2013/apr/04/microsoft-smartphones-tablets
11. http://www.italkmobility.com/mobilemarketforecast
12. http://www.itwire.com/it-industry-news/market/54370-samsung-takes-over-from-nokia-at-top-of-mobile-tree
13. http://www.newyorker.com/online/blogs/newsdesk/2013/02/does-a-company-like-apple-need-a-genius-like-steve-jobs.html
14. http://www.usatoday.com/story/tech/personal/2013/05/20/laptops-desktops-smartphones-tablets/2343423/
15. https://en.wikipedia.org/wiki/List_of_mergers_and_acquisitions_by_Google
16. https://www.netmarketshare.com/operating-system-market-share.aspx?qprid=10&qpcustomd=0

VOLUME NO. 3 (2013), I SSUE NO. 09 (SEPTEMBER ) ISSN 2231-5756
INTERNATIONAL JOURNAL OF RESEARCH IN COMMERCE, IT & MANAGEMENT A Monthly Double-Blind Peer Reviewed (Refereed/Juried) Open Access International e-Journal - Included in the International Serial Directories
http://ijrcm.org.in/
121
MOTIVATION AS AN EFFECTIVE TOOL FOR ORGANIZATIONAL DEVELOPMENT IN NIGERIA
DR. ABDULSALAM JIBRIL
DEAN
FACULTY OF ARTS, SOCIAL AND MANAGEMENT SCIENCES
ADAMAWA STATE UNIVERSITY
MUBI
YUSUF SAJO
LECTURER
DEPARTMENT OF BUSINESS ADMINISTRATION & MANAGEMENT
SCHOOL OF BUSINESS AND LIBERAL STUDIES
FEDERAL POLYTECHNIC
MUBI
ABSTRACT This paper titled’ Motivation as an Effective Tool for Organizational Development’ Motivation which makes managers perform, to inspire, encourage and impel
people to take actions that geared toward achieving both individual as well as organizational goal. The need for this paper was informed as a result of worker’s
dysfunctional attitude when discharging their duties. The major objective of the paper is to identify the importance of motivation and its relevance to the
organizational development. Secondary methods of data collection were used. These include text books, journals and net materials. Among others, it was found
out that motivation of workers at any level is imperative for organizational success. The researchers based on the study recommends that Management should
investigate which incentive is most appealing to groups as well as individuals because some workers are motivated to work hard for salary increases, yet others
would work harder for the opportunity to obtain recognition.
KEYWORDS motivation, organizational development.
INTRODUCTION nybody who is interested in understanding, predicting and or influencing individual behavior must start with a basic understanding of human motivation.
Why do people behave as the way they do? This question has interested behavioral and social scientist for hundreds of years (scholl, 2000). Putting in
place all factors of production, labor is the most expensive and important factor of production that is supplied by employees. The success or failure of any
organization is ultimately determined by willingness or otherwise of the individual who supplies the labor force. A human resource unite or department in a
given organization plays an important role in coordinating the efforts of individual workers to achieve organizational objectives. Motivation is therefore one of
the ways of inducing people to put in their best effort in an effective manner in other to achieve organizational objectives ( Oyedeji, n. d) Motivation can be
induced by the employer or reside within the employee. Employee’s have higher levels of motivation when they perceive that management-labor environment
is positive. Control stifles motivation while involvement creates a more productive environment. If workers feel that they are being treated fairly and with
respect, this attitude will develop and guide their behavior in positive direction (Kamery, 2004).
The topic assesses motivation as an effective tool for organizational development. The main objective of this paper is to identify the important factors that are
relevant in motivating employee at the workplace such as the financial and non-financial benefits as well as the role of motivation in organizational
development.
Motivation is an inner state that energies or activates, or direct or channel behavior towards specific goals (Oginni, 2007). Motivation has been defined in
numerous ways. One of the best is that “motivation can be seen as the forces acting either on or within an individual or group(s) to initiate behavior (Routha and
Kefure, 2007). Motivation is the psychological process that gives behaviour the purpose and direction (Kreitner, 1992). A predisposition to behave in a purposive
manner to achieve specific and unmet needs (Buford, Bedeian, and Lindner, 1995, as cited in (Omar, 2006). An internal drive to satisfy an unsatisfied needs and
it is the will to achieve (Bedeian, 1993, as cited in Omar, 2006). Motivation refers to anything (within or outside) that drives individuals or group to accomplish
personal and organizational goals. There are three major components of motivation which includes: activation, persistence and intensity. Activation involves the
decision to initiate a behavior, such as enrolling in a psychology class. Persistence is the continued effort toward a goal even though obstacles may exist, such as
taking more psychology courses in order to earn a degree although it requires a significant investment of time, energy and resources. Intensity can be seen as
the concentration and vigor that goes into pursuing a goal. For example, one student might coast by without much effort, while another student will study
regularly, participate in discussions and take advantage of research opportunities outside class (Cherry, 2012)
TYPES OF MOTIVATION Motivation at work can take place in two ways. First, people can motivate themselves by seeking, finding and carrying out work (or being given work) that
satisfies their needs or at least leads them to expect that their goals will be achieved. Secondly, people can be motivated by management through such methods
as pay, promotion, etc. Herzberg, Mausner and synderman (1957) as cited in Hammed (2002) indicated that motivation can be;
1. Intrinsic motivation: the self-generated factors that influence people to behave in particular way or to move in a particular direction. These factors include
responsibility (feeling that the work is important and having control over one’s own resources), autonomy (freedom to act), scope to use and develop skills
and abilities, interesting and challenging work and opportunities for advancement.
2. Extrinsic motivation: what is done to or for people to influence them? This includes rewards, such as increased pay, promotion, and punishments, such as
disciplinary action, withholding pay, or criticism.
Extrinsic motivators can have an immediate and powerful effect, but will not necessarily last long. The intrinsic motivator, which are concerned with the quality
of working life are likely to be a deeper and longer-term effect because they are inherent in individuals and imposed from outside (Armstrong, 2005).
STEPS TO BE ADOPTED IN MOTIVATING EMPLOYEES AT THE WORKPLACE 1. Sizing up situations requiring motivation.
2. Preparing a set of motivating tools.
3. Selecting and applying an appropriate motivator.
4. Following up the results of the application.
Sizing up situations that require motivation, this step mainly involves understanding of individual differences. Having assessed their needs, one can determine
what can motivate them.
A
VOLUME NO. 3 (2013), I SSUE NO. 09 (SEPTEMBER ) ISSN 2231-5756
INTERNATIONAL JOURNAL OF RESEARCH IN COMMERCE, IT & MANAGEMENT A Monthly Double-Blind Peer Reviewed (Refereed/Juried) Open Access International e-Journal - Included in the International Serial Directories
http://ijrcm.org.in/
122
Preparing set of motivational tools, the list of motivators should be prepared based on the revealed needs of the people. Selecting and applying motivators. Out
of the list of Motivators, few should be selected and applied wherever and whenever they are needed. Feedback, having applied the motivators, it is important
to find how effective had a particular motivator been.
DurBrin (2009) opined that the relationship between motivation, performance and commitment can be expressed by the equation P = M × A, where P refers to
performance, M to motivation, and A to ability. Note that skill and technology contribute to ability. The committed employee works joyfully toward achieving
organizational objectives. Gaining employee commitment is important in the current era because several studies have found that most American workers are
not fully utilizing their capabilities. They do what is expected of them but do not contribute extra mental and physical effort to be outstanding. Many of these
workers want to be good organizational citizens, yet many of them feel that they have a poor relationship with the supervisor or believe that the organization
does not care about them (Hammed, 2002).
THE USE OF FINANCIAL INCENTIVES IN THE WORKPLACE No employee(s) work for free. Pursuing money based on negative motives can lead to poorer psychological well-being; this is not the same as pursuing money to
provide security and comfort to oneself and the family. Certainly, workers want to earn faire wages and salaries, and employers want their workers to feel the
impact of what they are getting. To that end, it is imperative to not those employees and employers alike view the fundamental incentive for satisfactory job
performance.
They use of money to or other financial incentives in the classic “work performance paradigm” is based primarily on reinforcement theory. Reinforcement
theory focuses on the relation between a target behavior (e.g., work performance) and its consequences (e.g., pay), and it is premised on the principles and
techniques of organizational behavior modification. Organizational behavior is a framework within which employee behavior are identified, measured and
analyzed in terms of their functional consequences (e.g., existing reinforcement) and where an intervention is developed using principles of reinforcement
(Houran and Kefgen, n .d)
A research conducted by Robinson (2004) indicated that 64% out of 100 respondents strongly disagreed that workers will still perform well even if their salary is
delayed. in a much published study by Gupta n. d as cited in Houra and Kefgen n. d) analyzed thirty –nine studies over four decades and found out that cash
reward their job are exited or mundane, in lab and real world settings alike. But the research team acknowledged that money is not the only thing that concerns
employees- noting that beyond a certain point, higher salaries will make employees happier, but it will not “buy” better performance. According to her, small
cash can actually be dysfunctional in terms of motivation because employees become irritated that their hard work yields so little. Because of this, she advises
employer who must give small raise to be careful about linking them to result and to scrupulous about their being fair.
DuBrin (2009) indicated that a natural way to motivate workers at any level is to offer them financial incentives for good performance. Linking pay to
performance improves the motivation value of money. Using financial incentives to motivate people fits behavior modification principles. Financial incentives,
however, predate behavior modification. A useful principle for using financial incentives to motivate workers at all levels is to investigate which incentives are
most appealing to groups as well as individuals. Many workers are motivated to work hard for salary increases, yet some others would work harder for the
opportunity to obtain recognition. Another group of workers might value increased health benefits more than a salary increase. Financial incentives are more
effective when they are linked to (or contingent) upon good performance. Linking pay to performance motivates people to work harder. Production workers and
sales workers have long received contingent financial incentives.
Although financial incentives are widely used as motivators, they can create problems. A major problem is that workers may not agree with management about
the value of their contributions. Financial incentives can also pit individuals and groups against each other. The result may be unhealthy competition rather than
cooperation and teamwork (DuBbrin, 2009).
Bellentine, McKenzie, Wysocki, and Kepner as cited in Robinson (2004) argued that monetary incentives encourage compliance rather than risk-taking because
most rewards are based only on performance. As a result, associates are discouraged from being creative in the workplace. Monetary incentives may be used to
circumvent problems in the workplace. For example, incentives to boost sales can be used to compensate for poor management. Employers also may use
monetary incentives as an extrinsic rather than an intrinsic motivator. In other words, associates are driven to do things just for the monetary reward versus
doing something because it is the right thing to do. This can disrupt or terminate good relationships between associates because they are transformed from co-
workers to competitors, which can quickly disrupt the workplace.
THE USE NON-FINANCIAL INCENTIVES Cash is king, but in today’s economy employees know that there is more to the story than cash alone. Today’s job seekers and your employees have become
savvier about non-monetary compensation. And there is a good reason they are paying attention to it. Bellentine, McKenzie, Wysocki and Kepner as in Robinson
(2004) stressed that Non-monetary Incentives is the reward for excellent job performance through opportunities. Non-monetary incentives include flexible work
hours, training, pleasant work environment and sabbaticals. One reason employees place a high value on the non-cash compensation parts of a total
compensation package is because they can greatly reduce household expenses. For example, getting an employer’s help with health insurance premiums can
save a family many thousands of naira a month, not to mention savings from the better medical coverage likely provided by a group plan.
Beyond the employee getting material value from their benefits, there are non-material perks, as well. Organisations who offer benefits, such as a rich
retirement plan, send a message that they value their employees and want to promote long-term relationships with their employees. These employers are
becoming more and more sought after. Workers are looking for those organizations that invest in their employees and want to provide a fair wage, and a fair
benefits package. Savvy workers will want to work for a company that offers a total compensation package rather than work for a one that provides high pay
with little in the way of benefits.
Many top performers are looking for an organization that goes even further than just cash compensation and basic benefits. They are looking for flexible work
schedule, employee training or education benefits, and well-trained employees to work for. These elements are often even more important than the traditional
“what do I get when I work for you” benefits. The value of well-trained workers who has an excellent reputation for helping individuals reach their full potential
and increase their likelihood for promotion can be invaluable to employees. Often employees will stay with an organization or take less money to work for the
right people at the right place.
If you are looking to stay at the top of your organization by nabbing top talent, it is important to think about non-monetary compensation because it is what you
offer to your employees in all areas of their career and quality of life. In this though economic times, it is hard to give more money or richer benefits to win the
war for talent by playing up the strengths that you have as an organization or figuring out what you can offer that will be unique and valued in the labor market.
Dike (1999) indicated that any person who has been following the issues surrounding labor-management relations in Nigeria would agree that the real problem
facing Nigerian workers is that they are unmotivated and under-appreciated. Nigeria should motivate its labor force, because it cannot effectively compete in
the emerging global economy with angry and hungry workers.
Dike (1999) was also of the view that well-managed retirement benefit for workers could go a long way to boosting the morale and productivity of the workers
in Nigeria, because many of them get bogged down and worrying about their fate after retirement (ignoring or forgetting to give proper attention to their job
duties). Knowing that they would not get their benefits after retirement, that is why some workers would be tempted to get into corrupt practices in other to
save towards retirement. Therefore, the establishments of social security system and unemployment compensation benefits are appropriate motivational
packages that could boost workers morale and productivity.
THE ROLE OF WORKER’S MOTIVATION IN ORGANIZATIONAL DEVELOPMENT Motivation makes every one to feel enthusiastic and accountable to achieve the target set for the team. In any place and anywhere, motivation can do the
miracles. In an organization the normal employees become tired with their daily routine, they do not think about the organization. At that time organization
motivates, they do their job sincerely.
VOLUME NO. 3 (2013), I SSUE NO. 09 (SEPTEMBER ) ISSN 2231-5756
INTERNATIONAL JOURNAL OF RESEARCH IN COMMERCE, IT & MANAGEMENT A Monthly Double-Blind Peer Reviewed (Refereed/Juried) Open Access International e-Journal - Included in the International Serial Directories
http://ijrcm.org.in/
123
Motivation in an organization should come from 360 degrees. You will wonder how a subordinate can motivate you. Yes, it is possible and it is one of the keys
for development of the “Y” theory of management. Never forget you can be best only when you work with the best. Whether it is your superior or colleague or
subordinate, they got to be best for you to be best and it is possible only when motivation is there flowing from all corners. The only possibility for this to exist in
any organization is when the organization setup itself in a very much informal and there is scope for flow of ideas from all parts and all are welcomed all over in
the organization without strict restriction.
Motivation in an organization is like a prime mover which helps to increase the acceptable productivity which is directly related to profitability. Motivation is like
boosting a man mentally it helps him to do his work with much more concentration and doing it properly, making a job properly makes him feel happy if he feels
happy whenever he does that job again he will be very smart quick and makes him happy, ultimately which helps in organization development. Motivational
factors in an can never be the same, the following tips are important for motivation of workers at each level of the organizational hierarchy;
MOTIVATIONAL FACTORS AT EACH LEVEL OF THE ORGANIZATIONAL HIERARCHY MOTIVATORS TO TOP MANAGERS
1. Open minded
2. Cooperative
3. Appreciate subordinate
4. Communicate properly
5. Have forgiveness
6. Over smiling
7. Be a model to others
8. Reward giving
9. Beneficiary to subordinate
MOTIVATORS TO COLLEAGUES OR PEERS
1. Cooperative
2. Accretive
3. Knowledge sharing
4. Open minded
5. Problem sharing
SUBORDINATE OR LOWER LEVEL WORKERS
1. Work hard
2. Loyal
3. Knowledge sharing
4. Good looking
5. Pleasing manners
6. Healthy
7. Family living
CONCLUSION If organization knows why people do what they do and how can we motivate others to do what we need them to do in the workplace, understand how and why
motivating, we can encourage them to be their best and do their best at work. The more people are motivated to be successful and achieve the goal set for
them, the more their confidence in their own ability will grow as well, which can, in turn make them even more motivated. When people are motivated at work,
job satisfaction improves, effort increases, working environment improves, result are focused, derive is created, everyone’s full potential can be tapped,
everyone is certain of the role they are to play and team members become more skilled as a whole. Despite the importance of motivation, it is pertinent to
acknowledged that money is not the only thing that concerns employees, higher salaries will make employees happier, but it will not “buy” better performance,
small cash can actually be dysfunctional in terms of motivation because employees become irritated that their hard work yields so little. Because of this, it is
advisable that employer who must give small raise to be careful about linking them to result and to scrupulous about their being fair.
RECOMMENDATIONS For any organization to be productive; there is need to have highly motivated workforce. The following recommendations are essential for effective motivation
of employees at the workplace:
1. Management should investigate which incentives are most appealing to groups as well as individuals because some workers are motivated to work hard for
salary increases, yet others would work harder for the opportunity to obtain recognition.
2. Management should lay emphasis on what type of motivation are to be provided (extrinsic or intrinsic)
3. They should also identify the appropriate motivational package that will appeal to each level in organizational hierarchy.
4. The package should be able to satisfy both individual as well as organizational needs.
REFERENCES 1. Armstrong, M. (2005) Human resource management practice: India, Kogan Page limited.
2. Cheery, K. (2012) what is motivation: available at http://pschology.about.com/od/mindex. Retrieved 13th
February, 2011
3. Dike, V. (1999). Reward System in Nigeria: Workers Moral and Productivity: Vikeaequsd.k12.ca.us. retrieved on 20th
August 2011.
4. DurBrin, A. J. (2009). Essentials of Management: Canada, South-western Cengage Learning.
5. Hammed, T.A. (2002). Workers’ Behavior Assessment Battery: Starling Horden Publishers. ISBN 978-032-040-7.
6. Houran, J. and Kefgen K. (n.d). Money and Employee Motivation: available at www.2020skille.com
7. Kamery, H. B. (2004). Employee Motivation as it Relates to Effectiveness, Efficiency, Productivity and Performance. Nova Southeastern University.
Proceeding of the Academy of Legal, Ethical and Regulatory Issue, (8) 2. Retrieved on 30th
August, 2012
8. Kreitner, R. (1992). Management: USA, Houghton Mifflin Company.
9. Oginni, F .G. (2007). The role of Teacher Motivation in Improving the Quality of Education in Nigeria, Management Network Journal, (5) 10&11 June-
December 2007.
10. Omar, D.J. (2006). The role of motivation in organizational Development: State Bank, India.
11. Oyedeji, N. B. (n.d). Motivation as a Tool for Achieving Efficiency and Effectiveness in Nigerian Secondary Schools. Educational Management Department,
University of Ilorin, Nigeria.
12. Robison, E.I, (2004). The implication of adequate Motivation on workers’ Productivity in an organization: A Desertion Submitted to ST. Clement University
in partial Fulfillment of the requirement for the award of Doctor of Philosophy.[Unpublished.]
13. Routha, F., & Kafura, D. (2007) Practical Management: Matrenesa, Black show publishers.
14. Scholl, W. R. (2002) Schmidt labor research center. University of Rhoda; Island: Kingston, R102881

VOLUME NO. 3 (2013), I SSUE NO. 09 (SEPTEMBER ) ISSN 2231-5756
INTERNATIONAL JOURNAL OF RESEARCH IN COMMERCE, IT & MANAGEMENT A Monthly Double-Blind Peer Reviewed (Refereed/Juried) Open Access International e-Journal - Included in the International Serial Directories
http://ijrcm.org.in/
124
AN UNDERSTANDING OF DUNNING’S OWNERSHIP-LOCATION-INTERNALISATION (OLI) ECLECTIC THEORY
OF MULTINATIONAL COMPANIES
JABES GABBIS ODHIAMBO KOTIENO
LECTURER
OSHWAL COLLEGE
NAIROBI
ABSTRACT Multinational companies that seek to enter foreign markets usually make the strategic choice whether to enter the foreign market through Foreign Direct
Investment (FDI), exportation, or joint ventures. The Eclectic Model was formed to incorporate the three different forms of international growth/expansion:
Licensing, Exports and Foreign Direct Investment (FDI). This model supports the manager’s decisions in choosing appropriate strategies for expansion. The so-
called OLI-factors are three categories of advantages, namely the ownership advantages, locational advantages and internalization. A precondition for
international activities of a company is the availability of net ownership advantages. These advantages can both be material and immaterial. The corporation
should analyze the six decisions used to decide whether a market is suitable, that is, managers should make the correct product choice for the particular market.
Through market research they will choose the best market. This articles aims at exposing the understanding of the Dunning’s Eclectic theory and its rationale to a
multinational corporation. Alongside this the article examines the process of screening foreign markets and also the potential impact of multinational companies
on home and host countries.
KEYWORDS Multinational companies, Foreign Direct Investment (FDI), OLI-factors (ownership, locational and internalization), foreign market, home and host countries.
INTRODUCTION ll organizations have a potential for growth and various strategies to expand and grow internationally are available for them. The only difference that
exists is the time and the resources they want to commit in order to reap the benefits of international growth by investing globally. However, what
confuses mangers is the strategy to choose, even if they are able to identify a potential opportunistic market, they fail to select an appropriate strategy to
implement. Multinational companies that seek to enter foreign markets usually make the strategic choice whether to enter the foreign market through Foreign
Direct Investment (FDI), exportation, or joint ventures. Most of them usually prefer FDI compared to other modes of investment such as exportation or licensing
(Hill, 2005). This is because of several reasons such as; the high transportation cost on exports, for example, when this cost is put together with production cost
it becomes so expensive that it leaves MNC’s with the choice of FDI in which there exists market imperfection that leads to the internalization theory, due to
strategic rivalry and also due to specific advantage. Dunning (1981) suggested that the choice of entry into the new foreign market depend on ownership
advantages, location advantages, and internalization. An MNC can enter foreign market through the export, joint venture (FDI), green-field FDI and brown field
FDI.
STATEMENT OF THE PROBLEM In a business environment that is increasingly global in nature, the questions of how, when, and where a firm chooses to engage in foreign direct investment are
important topics for international businesses. They will also have to choose which mode of entry they want to use. This article will give an overview of what the
Eclectic Paradigm is and how it relates to foreign direct investment. The eclectic paradigm will enable managers to make informed strategic decisions should
their firm choose to engage in foreign direct investment.
OBJECTIVES OF THE STUDY 1. To expose the concepts in Dunning’s eclectic theory and relate the concepts with a multinational corporation
2. To explicate the potential impact of multinational companies on home and host countries
SIGNIFICANCE OF THE STUDY The Eclectic Model was formed to incorporate the three different forms of international growth/expansion: Licensing, Exports and Foreign Direct Investment
(FDI). This model supports the manager’s decisions in choosing appropriate strategies for expansion that is why proper understanding is needed. The OLI
framework is also known as the Eclectic paradigm which was proposed by Dunning (1977, 1980, and 1988). His framework was an extension of the
internalization theory which originated from the transaction theory stating that “companies should seek lower costs between handling something internally and
contracting another party to hold it for them” (Daniels, Radebaugh, Sullivan, 2001).
Before entering foreign markets, certain decisions needs to be made by managers of these firms; these include; screening the market if the barriers for
importation and transportation cost are not high, they should opt for exportation but if they are high they should go ahead and screen the product if it is easy to
enter a new market with a specific product then they should go for a joint venture. If they cannot use products to enter the market then they should try and use
the internal processes that give the firm competitive advantage to enter a green-field market. If it does not work managers should opt to take control in a
brown field investment (Daniels, Radebaugh, Sullivan 2009).
LITERATURE REVIEW Dunning’s (1977, 1980, and 1988) proposed model followed Hymer’s (1960) application of industrial organization economics in order to study the investment
and international trade. The strong position of this model in economic theory gave a basis for integration of various strategic models related to similar theories
and for further development. The Eclectic model was developed with the aim of understanding FDI investments throughout the world.
“The ability of an international firm to correctly select markets for its portfolio of products is paramount to its success. During the process of international
market selection (IMS) firms must find markets that offer prospects to grow sales, yet also fit strategically with the firm. Finding these markets is not easy and a
number of systematic approaches to IMS have been developed over the years. Upon a review of these efforts, one could conclude that the IMS process has
three stages: 1) market screening, 2) market identification and 3) market selection”. (Kumar, Stam, & Joachimsthaler, 1993; Anderson & Strandskov, 1998).
Root, (1997) argues that the firm is simply attempting to come up with a list market for further study in the screening phase. In this stage the firms use macro
variables with secondary data. A more product specific information is used to even narrow down the screening process in the market identification stage. In the
market selection stage, detailed analysis of the remaining markets occurs; quite often primary data is used to predict consumer response to the market offer,
specific competitors are identified and gauged and, the home firm's strategy is considered.
There are various criticisms about the effects of globalization in which the foreign ventures of international firms are viewed as negatively disturbing or
detrimental to the level of exports, creation of jobs, and stability of wages at home and abroad, an comprehensive review of studies on the effects of foreign
A

VOLUME NO. 3 (2013), I SSUE NO. 09 (SEPTEMBER ) ISSN 2231-5756
INTERNATIONAL JOURNAL OF RESEARCH IN COMMERCE, IT & MANAGEMENT A Monthly Double-Blind Peer Reviewed (Refereed/Juried) Open Access International e-Journal - Included in the International Serial Directories
http://ijrcm.org.in/
125
direct investment compliments multinationals with being very much beneficial than damaging for both their home and host countries. According to NBER
Working Paper No. 9293, “Home and Host Country Effects of FDI”, NBER Research Associate Robert Lipsey declares that “there is little evidence that
multinationals are guilty of the "many evils that are alleged." (Lipsey, 1994)
Based on the available evidence, “multinational firms transfer managerial practices from their country of origin to their country of operation.” (Child et al.,
2000). Ferner, (1997), attributes this home country effect to the fact that MNCs are entrenched in the business system of their country of origin.
THE RATIONALE OF THE OWNERSHIP-LOCATION-INTERNALISATION (OLI) ECLECTIC THEORY OF MULTINATIONAL COMPANIES Ownership Advantages are advantages that firms benefit from controlling. Ownership enables organizations to develop competitive advantages hence
encouraging them to use these advantages to expand internationally. These will only apply if the organization has internal unique core competencies or
resources that build competitive advantage by enabling it compete with local firms in their own environment. Therefore, successful foreign investment depends
not only on the organization’s possession of internal core competencies and resources, but on how it is able to co-ordinate them to gain a competitive edge over
local firms in the region. These may include a strong brand name, physical assets, research and development facilities, innovation and patents as well as other
organizational efficiencies such as superior technology based strategic tools or large scale operational advantages. The multinational company should have a
unique competitive advantage which will overcome the disadvantages of competing with the local firms in the home country. Location advantages can be two
fold. The organization may benefit from location advantages when it is near the market/customer. This will not only allow continuous and steady supply, but will
enable it to save on costs like transportation and warehousing, developing cost advantages. Secondly, Firms can also benefit from location advantages when
they are nearer to their suppliers of raw materials. This will enable them to reduce on time taken for transportation and will also help maintain quality. However,
there are times when foreign investments reap advantages like cheap labor or make the firm visible to scarce immobile resources only accessible with local
firms. This will hence lead to FDI being adopted. Location advantages will build an advantage if performing activities will be more profitable in the foreign
location as opposed to the organizations home country. These advantages can be as a result of cheaper labor costs, cheaper land space to set up production
sites which are closer to input resources, faster transport channels or proximity to a substantial consumer market, access to cheaper skilled labor, cheaper
production inputs such as raw materials or favorable governmental regulations to foreign investments and fewer local competitors. The location advantages are
important as they help in identifying which countries will become the host countries for the multinational company.
Internalization Advantages are those that the organization must benefit more from engaging a foreign operational structure rather than remain local in order to
build. This means that the cost of operating in the home market is much higher than if operations were international. These may include the lower cost of
transactions or better operational control systems. Internalization Advantages explain the advantages that an organization obtains from producing their own
products rather than through a collaborative arrangement like a joint venture. The essence is that when organizations develop and carry out their own activities,
they are able to benefit from learning and development of their core competencies and resources. With this experience and strategic capabilities, they will
hence move into foreign markets.
This advantage is related to the ownership advantage. In the words of Ethier (1986), internalization is mainly important. For example, Coca Cola Company is able
to internalize due to its ownership of patents and technology for instance. Ownership has to mainly be explored internally than externally. Companies would
choose to internalize due to the greater degree of uncertainty. It would occur when the transfer of knowledge occurs. It would also occur due to price
mechanism. In the internal market, prices are charged between related parties within the organization whereas external market prices are charged between the
buyer and seller. This leads to flexibility as the company itself decides on the prices of goods and services. It depends on the market entry form. With exports
and FDI there are likely to be internalization advantages unlike for licensing as there are regulations to be followed as per license agreement.
Exports is the least expensive strategy and hence the most applied by organizations to expand internationally. It is used when barriers to trade are low and
where there exists few competitors in the local market. They can use the following methods to export:Direct Selling: This involves selling through sales personal,
foreign distributors or retailers who are in touch with the customers on a direct basis. An example is Kenafric Industries Limited. It deals in manufacturing
Confectionery, Footwear and Stationery. It uses sales personnel present in foreign countries like Uganda and Tanzania to sell its products in those countries.
Indirect Selling: The organizations, in this approach, export its goods using agencies and parties that specifically deal with exporting. An example is the use of
Export Trade companies. E-commerce: This method has emerged as a result of increased technology developments, enabling organizations to sell online using
websites. A good example is E-bay that sells consumer products directly to the end-users.
The licensing growth strategy enables a company (Licensor) to grant Intellectual rights to another firm (Licensee) for a fixed period of time in exchange of royalty
payments. Licensing normally takes place between a foreign firm (Licensor) and a local firm (Licensee). This method is used especially if there exist high barriers
to entry in a particular market and when the product has fewer technicalities. (Daniels et al, 2006)
Foreign Direct Investment (FDI) is the most expensive and riskiest out of all the growth strategies. It also requires abundant resources to be invested for the
long-term. FDI can be defined as a strategy where firms engage in investing resources in a foreign country. The company that invests using FDI turns into a
Multinational Corporation and commits for the long-term in inflexible strategy. FDI is especially beneficial when it touches on the primary activities of the value
chain.
FDI’s can be divided into three types: Brownfield; which requires purchase of existing operators/firms: Greenfield; where the firm engages into new investments:
Joint ventures; where the company participates with another organization to pursue the same goal. (Amadeo, 2012)
TABLE 1: DUNNING’S ECLECTIC PARADIGM
Source: Dunning (1981)
In order to make a clear decision of which strategy to choose, Dunning (1981) developed the above table to display the advantages a company may experience
with a particular growth strategy. The presence or absence of these advantages will determine what kind of strategy the firm should consider as most viable.
According to this theory, if the firm has ownership advantages, but has no location advantages or internalization advantages, the most appropriate international
growth strategy would be licensing. On the other hand, if a firm has both internalization and ownership advantages, it should employ the exporting strategy.
Therefore, only if the firm enjoys all three advantages should the option of foreign direct investment be pursued. However, recent technological and
globalization effects on internal resources and competencies will shape the strategy of any global growth objectives.
We can therefore conclude as Rugman and Brewer (2001) say, “that when companies want to exploit a firm-specific asset abroad they will more likely invest in
own facilities rather than, for example, licensing if transaction costs are high. The more intangible the firm-specific asset is, the greater the incentive for
internalization will be. Organizing transactions may be carried out through two methods, the price system or hierarchy. The problem with the price system may
Yes Yes Yes
Form of Market
Entry.
Licensing
Export
FDI
Yes No No
Yes Yes No
Categories of advantages
Ownership
Advantages
Internalization
Advantages
Location
Advantages
VOLUME NO. 3 (2013), I SSUE NO. 09 (SEPTEMBER ) ISSN 2231-5756
INTERNATIONAL JOURNAL OF RESEARCH IN COMMERCE, IT & MANAGEMENT A Monthly Double-Blind Peer Reviewed (Refereed/Juried) Open Access International e-Journal - Included in the International Serial Directories
http://ijrcm.org.in/
126
be that some market participants take advantage of measurement difficulties to overprice and/or underperform. To avoid this 'cheating' behavior companies
internalize and integrate transactions”. (Rugman and Brewer, 2001)
SCREENING FOREIGN MARKETS The corporation should analyze the six decisions used to decide whether a market is suitable, that is, managers should make the correct product choice for the
particular market. Through market research they will choose the best market. They will also have to choose which mode of entry they want to use. They should
also make key consideration if they could transfer their corporate DNA. A corporation must position well to win the loyalty of the intended customers. They
must also check the rate at which the market expands in order to choose wisely where to trade. They must analyze the political economic trends and if only they
are favorable they should take the venture. Industry attractiveness should be “analyzed by the threat of new entrant, the threat of substitute products, rivalry
amongst existing competitors, bargaining power of suppliers and bargaining power of the buyer”. (Rugman and Collinson, 2009).
When an organization is pursuing a foreign direct investment strategy, it must start by evaluating and judging if the existing internal resources and competencies
will provide competitive advantage in the targeted country as well as enable favorable competition to existing local organizations. For example, if there is a
monopolistic advantage or the size of competitors already present. The above approach can hence enable companies to screen for potential foreign markets.
The choice of this market will depend on whether the organizations will be able to reap the OLI advantages discussed above. This will be determined by the
choice of strategy.
POTENTIAL IMPACT OF MULTINATIONAL COMPANIES ON HOME AND HOST COUNTRIES Internationalization and foreign investment has many positive and negative effects on both home and host countries. Multinationals have positively affected
some countries by investing in them, but at the same time have had adverse effect on their own home country.
The information relating to international management advocates that the home country effect has in recent years become even stronger. As such firms
operating in more than one country are forced to integrate and effectively co-ordinate their international business activities. Multinational Corporations, as it is
argued, will have to stop or discard multi-domestic strategy, which is a combination of a low need for international integration of the business and a high local
responsiveness to the local requirements, and instead they will have to increasingly integrate and co-ordinate their business across borders. (Harzing, 2000). This
would be easily done through standardization processes achieved either on the basis of home practices or on some form of global best practice
recommendations. “International management structures, financial control mechanisms, expatriates in key positions and written guidelines are among the
options for firms seeking to achieve international integration.” (Ferner, 2000; Harzing, 1999). Edwards and Ferner, (2000) add that “it can be expected that the
home country effect is strongest in firms that originate in a dominant economy, namely the USA today or Japan a decade ago.”
Although the home country effect proposes that the management and employment relations of foreign affiliates are displayed on those of their country-of-
origin, positing the host country effect assumes that they are also influenced by their country-of-operation (Ferner 1997, Rosenzweig and Nohria, 1994). The
extent to which the host country has an effect depends on two factors. Firstly, the institutional distance between country-of-operation and country-of-origin is
important. The more institutionally different the two are, the easier it is to identify a host country effect. Secondly, the strength of national institutional
regulation is important. MNCs are under more pressure to comply in more tightly regulated business systems than in weaker institutional environments.
Nevertheless, research by Muller (1998), Royle (1998) Tempel (2001) and Wever (1995) on American and British MNCs in Germany shows that even in strong
institutional environments there is some room for maneuver.
Whether a transfer of practices between the parent company and the foreign subsidiaries occurs does not entirely depend on the host/home country effect, but
also on the strategic role of the subsidiary (Gupta and Govindarajan, 1991), the method of affiliate establishment (Taylor et al., 1996) and power relations
(Ferner, 2000). Particularly important for the argument pursued here is the type of practice to be diffused. Some, such as those in the area of ER, are more
difficult to transfer, as in many countries these are relatively tightly regulated. Nevertheless, ER is also an area where corporate executives might have strong
views about certain principles such as management’s ‘right to manage’, which could provide an incentive for standardisation.
CONCLUSION NAD RECOMMENDATIONS FDI is visible at every front. It is, however, discouraged as a result of developed perceptions by the host governments. Due to these perceptions, governments
may engage in creating regulations that restrict FDI. Overall, John in his OLI model supports the FDI decision and has provided us with the frameworks and
theory as to why FDI should be chosen. As competition goes global and companies search for new opportunities in foreign market, increase in FDI is definite. FDI
not only opens up a market for new products but enables the host countries to grow as well. Hence FDI must be encouraged. However, host countries need to
maintain a level of control over the FDI so as to prevent any dominance or depletion of resources by the foreigners and to make it a win-win strategy. The so-
called OLI-factors are three categories of advantages, namely the ownership advantages, locational advantages and internalization. A precondition for
international activities of a company is the availability of net ownership advantages. These advantages can both be material and immaterial. The term net
ownership advantages is used to express the advantages that a company has in foreign and unknown markets. Eclectic theory suggests that by dynamizing the
paradigm, and widening it to embrace asset-augmenting foreign direct investment and MNE activity it may still claim to be the dominant paradigm explaining
the extent and pattern of the foreign value added activities of firms in a globalizing, knowledge intensive and alliance based market economy.( Bartlett, &
Beamish, 2011). As the international business environment became increasingly complex and sophisticated, companies developed a much richer rationale for
their worldwide operations. Scale economies, ballooning R&D investments, and shortening product life cycles has transformed many industries into global rather
than national structures. They have made worldwide scope of activities not a matter of choice, but an essential prerequisite for companies to survive in those
businesses.
REFERENCES 1. Agarwal, S. & Ramaswami, N.S. (1992) choice of foreign market entry mode: impact of ownership, location, and internalization factors. Journal of
international business studies, First quarter 1992: pp.1-27:
2. Amadeo, K. (2012), Foreign Direct Investment (FDI). Available on www.About.com Guide retrieved on 2nd
April, 2013.
3. Anderson, P.H. & J. Strandskov (1998).International market selection: A cognitive mapping perspective. Journal of Global Marketing, 11(3), 65-84.
4. Bartlett, C. A., & Beamish, P. W. (2011).Transnational Management: Text, Cases, and Readings in Cross-Border Management (6th ed.). New York: McGraw-
Hill/Irwin.
5. Child, J., Faulkner, D., and Pitkethly R. (2000), ‘Foreign Direct Investment in UK1985-1994: The Impact on Domestic Management Practice’, Journal of
Management Studies, 37, 1, 141-66.
6. Daniels, J., Radebaugh, L. and D. Sullivan. (2007). International Business: Environments and Operations, 11th Edition.Prentice Hall. Upper Saddle River: New
Jersey.
7. Daniels, J., Radebaugh, L. and D. Sullivan. (2009). International Business: Environments and Operations, 12th Edition. Prentice Hall. Upper Saddle River: New
Jersey.
8. Daniels, J., Radebaugh, L. and D. Sullivan. (2011). International Business: Environments and Operations, 13th Edition. Prentice Hall. Upper Saddle River: New
Jersey.
9. Daniels, J., Radebaugh, L. and D. Sullivan., (2001).International Business Environments and Operations. 13th ed. New Jersey: Pearson Education Inc.
10. Dunning, J. H. (2000), "The Eclectic Paradigm as an Envelope for Economic and Business Theories of MNE Activity,” International Business Review 9, 163 -
190.

VOLUME NO. 3 (2013), I SSUE NO. 09 (SEPTEMBER ) ISSN 2231-5756
INTERNATIONAL JOURNAL OF RESEARCH IN COMMERCE, IT & MANAGEMENT A Monthly Double-Blind Peer Reviewed (Refereed/Juried) Open Access International e-Journal - Included in the International Serial Directories
http://ijrcm.org.in/
127
11. Dunning, J.H., (1981). "Explaining the international direct investment position of countries: Towards a dynamic or developmental approach," Review of
World Economics. Springer, vol. 117(1), pages 30-64, March.
12. Edwards, T. and A. Ferner (2000), ‘The Renewed “American Challenge”: A Framework for Understanding Employment Practice in US Multinationals’, Paper
presented at the British Universities Industrial Relations Association Annual Conference, Warwick, July 7–9.
13. Ferner, A. (1997), ‘Country of Origin Effects and HRM in Multinational Companies’, Human Resource Management Journal, 7, 1, 19–37.
14. Ferner, A. (2000), ‘The Underpinnings of ‘Bureaucratic’ Control Systems: HRM in European Multinationals’, Journal of Management Studies, 37, 4, 521–40.
15. Gupta, A. and Govindarajan, V. (1991), ‘Knowledge Flows and the Structure of Control within Multinational Corporations’, Academy of Management
Review, 16, 768–92.
16. Harzing, A. W. (1999), ‘Managing the Multinationals: An International Study of Control Mechanisms’ (Cheltenham: Edward Elger).
17. Harzing, A. W. (2000), ‘An Empirical Analysis and Extension of the Bartlett and Ghoshal Typology of Multinational Companies’, Journal of International
Business Studies, 31, 1, 101–20.
18. Hill, C.W.L. (2005), International business: competing in the global marketplace, 5th ed, McGraw Hill/Irwin, New York.
19. Hymer, S. H. (1960): “The International Operations of National Firms: A Study of Direct Foreign Investment”. PhD Dissertation.Published post humously. The
MIT Press, 1976. Cambridge, Mass
20. Kumar, V. A. Stam, & E. A. Joachimsthaler (1994).“An interactive multicriteria approach to in dentifying potential foreign markets.”Journal of International
Marketing, 2(1), 29-52.
21. Lipsey, R. E. (1994), “Foreign- Owned Firms and U.S. Wages,” NBER Working Paper No. 9293, Cambridge, MA, National Bureau of Economic Research.
22. Muller, M. (1998), ‘Human Resource and Industrial Relations Practices of UK and US Multinationals in Germany’, International Journal of Human Resource
Management, 9, 4, 732–49.
23. Root, F.R. (1997). Entry strategies for international markets, Lexington, MA/Toronto: D.C. Heath and Company.
24. Rosenzweig, P. M. and N. Nohria (1994), ‘Influences on Human Resource Management Practises in Multinational Corporations’. Journal of International
Business Studies, 25, 2, 229–51.
25. Royle, T. (1998), ‘Avoidance Strategies and the German System of Co-Determination’, International Journal of Human Resource Management, 9, 6, 1026–
47.
26. Rugman A. M. and Brewer T. L. (2001). “The Oxford Handbook of International Business.” Oxford University Press Inc., New York
27. Rugman, M.A. & Collison, S. (2009) International business. 5th
edn. Essex: Financial Times, Prentice hall.
28. Sullivan, D. (2008). "Organizing the Boundaries of the Business for a Boundaryless World."HR Frontiers: Shifting Borders and Changing Boundaries, Beaman,
K. (editor). IHRIM Press, Rector-Duncan & Associates, Austin, Texas.
29. Sullivan, D. and Daniels, J. (2008). "Innovation in International Business Research: A Call For Multiple Paradigms,"Journal of International Business Studies.
39, 6: 1081-1090.
30. Sullivan, D. and Daniels, J.. (2007). "International Business Studies: Episodic or Evolutionary?" Multinational Enterprises and Emerging Challenges of the
21st Century. Dunning, J. and T. Lin, (editors).UK: Edward Elgar Publishing Ltd.
31. Taylor, S., S. Beechler and N. Napier (1996), ‘Toward an Integrative Model of Strategic International Human Resource Management’, Academy of
Management Review, 21, 4, 959–85.
32. Tempel, A. (2001), ‘The Cross-National Transfer of Human Resource Management Practices in German and British Multinational Companies’ (Mering:
Hampp).
33. Wever, K. S. (1995), Negotiating Competitiveness, Employment Relations and Industrial Adjustment in the US and Germany (Boston: Harvard Business
School Press).

VOLUME NO. 3 (2013), I SSUE NO. 09 (SEPTEMBER ) ISSN 2231-5756
INTERNATIONAL JOURNAL OF RESEARCH IN COMMERCE, IT & MANAGEMENT A Monthly Double-Blind Peer Reviewed (Refereed/Juried) Open Access International e-Journal - Included in the International Serial Directories
http://ijrcm.org.in/
128
AUTHORING TOOL: KEY FOR E-LEARNING SYSTEM DEVELOPMENT
JAVED WASIM
RESEARCH SCHOLAR
SAI NATH UNIVERSITY
RANCHI
ABSTRACT Recently, a growing number of Institutions and business organization have embraced the concept of E-Learning. They use web based learning systems to fulfill
their educational needs .E-learning authoring tools (or AT for short) enable trainers to integrate an array of media to create professional engaging ,interactive
training content .The choice of the best authoring tools for the right user is very important for the development of content for E-Learning . This paper describes
and reviews on authoring tools that represent the part of the e-learning systems and also to find the best authoring tool.
KEYWORDS E-Learning, Authoring tools, Classification, Specialized AT, Unspecialized AT.
INTRODUCTION -learning is emerging as the new paradigm of modern education. Worldwide, the e-learning market has a growth rate of 35.6%, but failures exist. Little is
known about why many users stop their online learning after their initial experience. With its ability to both reduce operating costs and train more
people, E-Learning is an attractive option for companies that are trying to balance business and educational goals. But in order to implement an E-
Learning program, one have to wade through hundreds of learning management systems, learning content management systems, authoring tools, and
collaboration environments to determine what solution will work best for your situation. There are several hundred e-Learning tools out in the marketplace
today. Selecting the proper course-authoring tool for developing your company's online training content is no small undertaking. E-learning is becoming an
essential part in teaching and teachers are searching for the best method to represent their courses. Since Learning Object becomes the small course unit that
can be designed to be reusable, customizable and flexible; teachers prefer to find the authoring tools for creating interactive LO quickly and easily. [1]
Many organizations are attempting to reduce their training costs by developing E-learning materials in-house. Whatever the reason, more trainers are finding
themselves researching the features, benefits, and cost of authoring tools. Through this paper, will describe the authoring tool, the reason of the using authoring
tools and How to find the best tool. In Section 6, the categories of tools will be presented. In Section 7, we will focus on the classification of authoring tools, the
most tools. Finally, the paper will be ended by conclusions. [11]
WHAT IS AN AUTHORING TOOLS The "Intelligent tutoring system" research community uses the term authoring system to refer to a computer based system that allows a general group
(including non-programmers) to create (or author) content for intelligent tutoring systems. While a few intelligent tutoring systems have been successfully
created, they are very costly to construct.
In the development of educational software, an Authoring System is a program that allows a non-programmer to easily create software with programming
features. The programming features are built in but hidden behind buttons and other tools, so the author does not need to know how to program. Generally
Authoring Systems provide lots of graphics, interaction, and other tools educational software needs.
An authoring system usually includes an authoring language, a programming language built (or extended) with functionality for representing the tutoring
system. The functionality offered by the authoring language may be programming functionality for use by programmers or domain representation functionality
for use by subject experts. There is overlap between authoring languages with domain representation functionality and domain-specific languages. An authoring
tool is a software package which developers use to create and package content deliverable to end users.
Though authoring tools have a range of uses, they are commonly used to create e-learning modules. These modules are generally written to conform to some
international standard, such as SCORM (Shareable Content Object Reference Model) or AICC (CBT) (Aviation Industry CBT Committee).
Distribution of content created with authoring tools also varies. Distribution methods include: web, kiosk, interactive CD-ROM, and executable file.
Since the term is somewhat general, many programs can be considered authoring tools, including Flash, and PowerPoint. However, only a small group of
programs specifically include support for e-learning content standards including Dictera, Easygenerator, Elicitus, e2train, Composica, Macromedia (Adobe)
Authorware, Power X Editor 4 [1], Director, Mohive, Lectora, Composer FX, EasyAuthoring (Metamorphosis), iSpring Suite and MyCAT. [12]
WHAT IS AN AUTHORING LANGUAGE An authoring language is a programming language used to create tutorials, computer-based training courseware, websites, CD-ROMs and other interactive
computer programs. Authoring systems (packages) generally provide high-level visual tools that enable a complete system to be designed without writing any
programming code, although the authoring language is there for more in-depth usage. Examples of authoring languages PILOT ,TUTOR Examples of web
authoring languages Bigwig
WHY AUTHORING TOOLS? Most authoring systems also support a scripting language for more sophisticated applications. Thus, these tools provide many facilities helping the author to
create a good E-content for courses. In fact, E-content has very important features that make the work easier than paper-content which are storing,
modification, reusability and sharing of information .[6]
Authoring tools provide the teacher/expert to design, describe organize and public the learning resources (e.g. learning content, tests).
HOW TO FIND THE BEST TOOL FOR YOU? Although selecting the best authoring tool requires close attention to detail, the process should be painless. Currently available tools offer a variety of features.
For example, some tools are designed to develop extensive assessments, software simulations, or content for hand-held computers. If you have special needs,
you'll certainly find a tool that meets them.
However, most tools are designed to create basic E-learning courses for desktop or laptop computers.
The software programs support a variety of media and file types, such as text, graphics, video, and audio. Most include assessment and test creation features. To
find the authoring tool that works best for you, conduct a needs assessment. Regardless of how much (or how little) you know about authoring tools, determine
the functionality that's most important to your organization and create a shopping checklist.
The following points are intended to give you a basic understanding of authoring tools while provoking some analytic thinking to help you identify the
capabilities and options that are most important to you. Automated Programming. By automating programming for online delivery, authoring tools liberate
course developers from their dependence on programmers. A few authoring tools have the ability to write such programming languages as HTML, XML, or
E

VOLUME NO. 3 (2013), I SSUE NO. 09 (SEPTEMBER ) ISSN 2231-5756
INTERNATIONAL JOURNAL OF RESEARCH IN COMMERCE, IT & MANAGEMENT A Monthly Double-Blind Peer Reviewed (Refereed/Juried) Open Access International e-Journal - Included in the International Serial Directories
http://ijrcm.org.in/
129
DHML. The types of programming code or output formats vary significantly among tools. When evaluating candidates, compare the output formats for each
tool.[11]
CATEGORIES OF TOOLS The majority of authoring tools fall into two broad categories: the pedagogy-oriented systems which “focus on how to sequence and teach relatively canned
content” and the performance-oriented systems which “focus on providing rich learning environments in which students can learn skills by practicing them and
receiving feedback.” There are seven categories of ITS authoring systems according to the type of ITSs they produce. These are: i) Curriculum Sequencing and
Planning, ii) Tutoring Strategies, iii) Device Simulation and Equipment Training, iv) Expert Systems and Cognitive Tutors, v) Multiple Knowledge Types, vi) Special
Purpose, and vii) Intelligent/Adaptive Hypermedia. Thus, depending on the requirements and where the content would be implemented the appropriate choice
of the content authoring tool can be choosed. The common categories of authoring tools which produce content complying with the E-learning standards use
some base software application. The most common ones are those that use PowerPoint presentations, Web based content and Flash based presentations. [8]
AUTHORING TOOLS CLASSIFICATION The classification of authoring tools can be based on different aspects such as:
(i).Complexity: the tools can be classified in range from simple to advance. The tools become simple when supporting drag drop facilities, wizard …etc. The
advanced tools are those that require programming capabilities to build a course material and needs technical competency. A long time need to be spent in
creating a course - especially when there is a need for programming to create tests and quizzes or building the course from scratch.
(ii). Fee: the tools can be classified as free and commercial. Based on the center of learning and performance Technology website (2009), we find through the
top 100 course authoring tools 2009 there are 19 free tools and the other need to be purchased.
(iii). Purpose: the purpose of some authoring tools concentrates on creating courses. However, there are a number of multipurpose tools which are not
specialized for creating online courses but are used.
UNSPECIALIZED AUTHORING TOOLS
� MS PowerPoint
MS PowerPoint is presentation software used to create slideshow. The slides are usually linear and can include hyperlinks to jump to other sections. This allows
the user to get to more detail on a subject of interest. In addition, it allow user to add audio and video clips in a presentation. Even though this tool is mainly for
creating presentation, it is considered to be one of the most popular course authoring tools. [4, 5]
� Flash
Flash has become a popular method for adding animation and interactivity to web pages. Flash is commonly used to create animation, advertisements, and
various web page Flash components, to integrate video into web pages, and more recently, to develop rich Internet applications. Therefore, some course
authors prefer using flash, because it allows many features and programming using Action Script. [6]
� Front Page and Dream weaver
These tools used to create WebPages. They provide an easy way to create links and images without need to know about 5HTML. However, these tools alone
cannot provide the interactive course. It needs the help of other tools and graphics designers.
SPECIALIZED AUTHORING TOOLS
The growing of E-learning leads to create special authoring tools that help authors and fulfill the needs for creating course in easy way. The following are the
most popular courses authoring tools.
� Articulate
In Articulate Studio Package the most three important authoring tools are Presenter, Engage and Quiz Maker. These authoring tools are used inside MS
PowerPoint. The Presenter allows adding interactivity and narration compiling to create flash presentation. In addition, it provides features to get attention and
inspire learning such as:
1. Animated annotations that highlight important points.
2. Clear, crisp images and video.
Quiz Maker allows creating group and randomizing question pools quickly .It provides the following feature:
1. Branch quizzes takers to different slides depending on how they answer each question.
2. Animate objects and adjust their timing on the click-and-drag timeline.
3. Choose from a wide selection of professionally designed themes or create your own.
4. Give your quiz takers specific results and feedback based on their scores.
5. Get quiz results through e-mail. [3]
� Adobe presenter / Captivate
Adobe Presenter helps to easily create professional Flash presentations and self-paced courses complete with narration. In addition, it allows adding animations,
quizzes, and software simulations to E-learning courses. Similar to articulate, this tool is also based on MS PowerPoint and can rapidly author professional E-
learning content with interactivity, simulations, quizzes, and other experiences no programming skills required. However, Captivate does not need MS
PowerPoint because it is independent. [10]
� GLO Maker
1. GLO Maker is an authoring tool for creating rich, interactive learning resources. It builds on the extensive Publish to HTML package.
2. Publish to CD-ROM.
3. Publish to SCORM 1.2 and SCORM 2004 package for import to any 6LMS supporting this standard.
Experience of the 7CETL in Reusable Learning Objects. It is open source and free for educational use. GLO Maker authoring tool is based on the new concept.GLO
approach inverts traditional approach for reusability. The traditional approach to the reuse of learning objects has been to separate content from context in
order to make the content reusable. However, in GLO, It extracts successful pedagogical designs and makes these the basis for reuse. [10]
� E-learning Authoring Tool
The E-learning authoring tool is a simple, easy to use tool for creating online course content. Its design allows you to create rich media courses containing text
plus images, Flash animations, audio and video created with your favorite media editors. Every course you create will fully conform to the SCORM standard.
With the AT, you can quickly create courses for employees, customers, partners, or even the general public. Your learners will enjoy an easy to navigate course
with a clean, professional design. You will not need any programming skills to create courses with the AT. You author your course with easy to use forms and a
built-in HTML editor. [10] When you deliver your course or test with a SCORM-based LMS, the questions are automatically graded and the results sent back to
the LMS. The AT reports the overall score (raw, minimum and maximum), the course status (incomplete, completed, passed or failed) and the results of
individual questions. [2]
� ObjectJ Authoring Tool
ObjectJ Authoring tool is an E-learning Content Authoring Tool which is easy to use for instructors and Provides highly synchronized interactive content. ObjectJ
Authoring tool supports the whole authoring process from high-level outline to fine-tuned timing using an instructor-centered user interface. This tool provides
features to get attention and inspire learning such as: * Easy to use for instructors and covering the authoring process from providing lesson outline to detailed
timing and synchronizations in a single, easy to use storyboard view. * Providing highly synchronized interactive content and Support for different types of media
clips, including audio, video, and flash components. * Supports thin-client model for authoring Whole functionality is accessible through the web browser. No
client management is necessary.

VOLUME NO. 3 (2013), I SSUE NO. 09 (SEPTEMBER ) ISSN 2231-5756
INTERNATIONAL JOURNAL OF RESEARCH IN COMMERCE, IT & MANAGEMENT A Monthly Double-Blind Peer Reviewed (Refereed/Juried) Open Access International e-Journal - Included in the International Serial Directories
http://ijrcm.org.in/
130
8AICC-standard compliant The produced content is fully AICC-compliant and can communicate with any standard LMS. * Supports Java applets and ActiveX
components Both Java applets and ActiveX components can be embedded in the content to increase interactivity. This feature enables having complex
simulations, virtual labs, or tests in the content. [13]
� Advanced E-learning Builder
The Advanced E-learning Builder authoring tool is designed for creating e-learning materials such as e-tests, tutorials, quizzes, etc. The system enables the
creation of E-tests, just with several mouse clicks (visual design), which contain several types of exercises. The Advanced E-learning Builder authoring tool
creates Standalone EXE files. By planning exercises in visual mode, exercises can be designed, corrected, examined, complemented, and updated in a simple and
survivable way. Various elements such as gap-fill tasks, multiple choices, and alternative questions are used to set tests questions. Additionally, many other
elements such as various types of texts, graphics, multimedia, Object Linking and Embedding - buttons ensure that your test has an attractive look and
professional feel. And, all these elements can be easily moved and resized using a mouse. Elements offer various customization possibilities including changing
colors, fonts, and contents; thus, creating and modifying all kinds of e-tests is quick and easy. Visual design mode allows the building of E-learning materials in a
simple and comprehensive way. Therefore, you can always see exactly how the final test to be deployed to students will look. Additionally, built-in dynamic
resolution assures you that a test will automatically adjust to all possible screen resolutions that end-users may have so the look won't be deformed in any way.
[14] Advanced E-learning Builder also contains many pre-defined test templates that allow you to make professional looking tests in no time at all. This way,
creating e-tests is as easy as editing text in a word processor, which allows beginners to start using the application immediately. An additional feature of
advanced E-learning Builder is test flow control, which allows you to write teaching sequences that can adjust to the students' knowledge and supply students
with additional information when needed. This way, individualization is granted. All tests created with advanced E-learning Builder are finally graded and
supplied with a customizable commentary. The package also contains a real world example that can be used in the class with, or without, customization.
CONCLUSIONS Nowadays, there is a large movement from education institutions and universities for using E-learning and increasing population to choose the best AT to create
a proper course for E-learning. In addition, all produced learning contents are conforming to the SCORM standard, which makes better the contents
interoperability and reusability. Therefore, Improving authoring tools is important and one of the main points is, to enhance them for the easily usage and
having professional output.
This paper proposed several authoring tools with the goal of designing and creating the contents which should provide the learner with all the necessary tools.
Therefore many organizations are attempting to reduce their training costs by developing E-learning contents in-house. Whatever the reason is, more trainers
are finding themselves researching the features, benefits, and cost of authoring tools. Choosing an appropriate authoring tool in E-learning can help to solve
many problems including the needs of growing communities to educate people, Lack of access to educational, shortage of training costs and economic
opportunities. There are many advantages in this type of training that will cover the problems.
REFERENCES 1. J. Harris, Vise present of Marketing. An Introduction to Authoring Tools. Appeared in the March 2002 edition of ASTD's Learning Circuits online magazine.
2. E-learning Authoring Tool, [Online]. Retrieved 2010, from Http://www.E-learningconsulting.com
3. Articulate, [Online]. Retrieved 2009, November 27 from Http://www.articulate.com/
4. Adobe, Adobe Presenter [online]. Retrieved 2009, November 27 from Http://www.adobe.com/products/presenter
5. GLO Maker, [Online]. Retrieved 2009, November 26 from Http://www.glomaker.org
6. Basuhail, A. A. (2009). Design and Implementation Of and E-learning Content Using Simple and Obtainable Tools. First International Conference ‘E-learning
and Distance Education’. [Electronic version]. Retrieved 2009, November 3 from Http://eli.elc.edu.sa/2009/content/AbdullahAhmadBasuhail[research].pdf
7. Kurtus, R. (2006). Authoring Tools for E-learning, CBT and WBT. [Electronic version]. 2006, January 20 Last update. Retrieved 2009, November 22 from
Http://school-for-champions.com/elearning/authortools.htm
8. Webopedia: Online Computer Dictionary for Computer and Internet Terms and Definitions, [Online]. 2003, July 09 Last update. Retrieved 2009, November 3
from Http://www.webopedia.com/term/a/authoring_tool.html.
9. K.Al-Shawkani.E-learning Authoring Tools: The Present and Future Vision.2009.
10. V.K. Sharma, S.Meenakshi. Content Authoring Tools and Standards – A Self-Reliant Mechanism for Content Development.2005.
11. H.Keynejad, M.Khademi, M.Haghshenas , H.Kabir. E-learning Content Authoring Tools and Introducing a Standard Content Constructor Engine, 2nd
International Symposium on Computing in Science & Engineering / June 1-4, 2011 / kusadasi-Turkey.49
12. Authoring tool, [Online], Retrieved 2013, from http://en.wikipedia.org/wiki/Authoring_system
13. http://www.objectj.com/public/authoring_tool.php
14. http://www.eduiq.com/elearning.htm

VOLUME NO. 3 (2013), I SSUE NO. 09 (SEPTEMBER ) ISSN 2231-5756
INTERNATIONAL JOURNAL OF RESEARCH IN COMMERCE, IT & MANAGEMENT A Monthly Double-Blind Peer Reviewed (Refereed/Juried) Open Access International e-Journal - Included in the International Serial Directories
http://ijrcm.org.in/
131
ANTECEDENTS AND CONSEQUENCES OF WORK-EXHAUSTION (IT SECTOR)
UMAIR NAJAM
STUDENT
UNIVERSITY OF CENTRAL PUNJAB
LAHORE
FAISAL ABBAS
STUDENT
UNIVERSITY OF LAHORE
SARGODHA
ABSTRACT This research is an attempt to develop an antecedent and consequential framework of Work Exhaustion. This research helps to measure the work exhaustion
which depends on Perceived workload, Work family conflicts, Job autonomy and Fairness of rewards. Moreover the subsequent effect which leads towards
Turnover Intensions. Study also explores the main factors which can create cause towards turnover intensions. The sample of this research study has chosen from
IT sector of Pakistan. Results shows significant correlation of Perceived workload, Work family conflicts and Work Exhaustion on Turnover intensions among
employees. Research suggest that Turnover intensions is a significant factor among employees in a working environment in order to overcome this perceived
workload and work exhaustion level must be lower as they are major catalyst of turnover intensions. Also work family conflicts can also enhance turnover
intensions, so organizational policies also are made in accordance with balancing work-family matters,
KEYWORDS Turnover intensions, Work exhaustion, Perceived workload, Work family Conflicts, Job autonomy, Fairness of rewards.
INTRODUCTION ork stress is the major health problems occur these days (Daalen, Willemsen, Sanders, & Veldhoven, 2009). Stress is a human life aspect that can be
traced back to almost the evolution of mankind as a reasoning and thinking (Sondhi, Chawla, Jain, & Kashyap, 2008). Turnover at work place has
received awareness by many researchers (Noor & Maad, 2008). Turnover of workers is a well-recognized subject of critical importance to the
organizations; it’s a widely researched phenomenon, a giant quantity of hypothetical and observed literature identified various factors or reasons responsible for
turnover (Shah, Fakhr, Ahmad, & Zaman, 2010). Employee turnover is global observable fact; many organizations are dealing with turnover issue . In today’s
business scenario it is difficult to achieve goals until it clearly tackle with turnover problems.(Rana, Salaria, Herai, & Amin, 2009). In addition, employees who feel
stress and anxiety at their job are likely to be having higher turnover (Stoner & Kim, 2008). Pressure can enhance turnover it is fundamentally a form of
unpleasant feeling and it has got the possibility to increase employee turnover, issues in management of office work and family matters arise big problems, so
many organizations keep lenient family friendly policies for employees as they concentrate on their work efficiently (Noor & Maad, 2008). Morgeson, Delaney-
Klinger, and Hemingway(2005) finds that job autonomy increased improved the ownership of work but also those employees feel the confidence which is
important factor for their work, more power of autonomy in job enhance the motivation power of employees. Work-family conflicts can increase the stress level
among professionals; it may also consider an obstacle in job performance.(Ahuja, Chudoba, Kacmar, McKnight, & George, 2006).Strategies implied by employers
focusing on work-life matters reflects that it is a significant element.(Noor & Maad, 2008). Sondhi et al (2008) suggest major implication as the organization
would need to acknowledge work exhaustion as a principal outcome of the aggravated development and work opportunities that dominate the country today, In
order to effectively sustain growth, the detrimental effects of work exhaustion will have to be recognized and curtailed by more effective working conditions and
policies.
Many studies focused on the progress of the various predictors and their background of turnover intensions and fully tested theories regarding turnover among
employee Western region working environment excluding many developing countries including Pakistan (Jhatial, Mangi, & Ghumro, 2012).
In our research we will find the answers of the following questions. What is impact of job autonomy, work-family conflicts, perceived work overload, fairness in
reward on work exhaustion? And how the work exhaustion factor affects turnover intensions among employees?
LITERATURE REVIEW Work exhaustion is key factor which can lead towards the turnover intension in workers. Turnover intensions are the challenging factors for organizations. Also
too many pressure, conflicts between work and family, job autonomy and fairness of reward are the key factors which influence the work exhaustion which
further lead to the turnover intension. In the methodological way the work exhaustion is playing intervening role between the turnover intension and other
factors. This work exhaustion factor is address through consequently framework validating the through research area.
Work exhaustion
In observation of work exhaustion (or job burnout) study is the combination of two energies emotional and mental which are necessary for job demands
(Moore, 2000b). Initially it was addressed as “tedium." Tedium referred as an emotional condition , mental, and physical exhaustion influenced by pro-long
participation in demanding conditions, the outcome is that tedium is the effect of consisting much unhelpful and few helpful elements in related environment
that is, so much conflicts, stress, and demands in combination with rewards, successes, and acknowledgments, However one might can consider on a
demanding place on that point one may feel appreciated and valued, nearly many people feel tedium or exhaustion when their life experience stress rather
than healthy support. (Moore, 2000a). Moore discovered in 2000b that people influenced by work exhaustion will not reflect the whole job attitude and reflexes
establish to relate with exhaustion factor. Moreover, people are more likely to experience a combination of these, dependent on the perceptions which are
related with the cause of exhaustion. Job burnout has been explained as repeated or constant emotional pressure related with a well-built integration with
people for a long time period (Moore, 2000a).Stoner & Kim(2008)state that burnout has three major elements: emotional exhaustion ,de-personalization
exhaustion element and decreased personal accomplishment .Some attitudinal reactions are the direct outcomes of work exhaustion, whereas other attitudinal
reactions relay on individual's informal contribution for the work exhaustion (Moore, 2000b).When an employee is not in exhaustion in work environment,
greater involvement in job may increase the outcomes of positive factors of the working environment. However, for employees who are in work exhaustion
conditions, greater involvement in job can results the negative factors of the working environment and increase their negative effects on the quality level of
work life (Moore, 2000a).
Work family conflict
Family and work are two fundamental domains in most adults’ lives(NOOR, 2004).Work and family interference is a kind of inter role conflicts that take place as
an outcome of unsuited role stress from the work- family issues, work can create interference with the family matters or family can also interfere with the
working matters(Yildirim & Aycan, 2008).In consideration of modern organization conflict of work or family is closely relates to exhaustion, lesser organizational
W

VOLUME NO. 3 (2013), I SSUE NO. 09 (SEPTEMBER ) ISSN 2231-5756
INTERNATIONAL JOURNAL OF RESEARCH IN COMMERCE, IT & MANAGEMENT A Monthly Double-Blind Peer Reviewed (Refereed/Juried) Open Access International e-Journal - Included in the International Serial Directories
http://ijrcm.org.in/
132
commitment level, job dissatisfaction, work-family conflicts occurs when the time, energy level and behavioral factors of a role in one scenario (choosing work or
family) create difficulties to overcome the demanding situation of the other scenario (choosing between family or work)(Bragger, Srednicki, Kutcher, Indovino, &
Rosner, 2005).However as Yildirim & Aycan (2008) state, Work-Family Conflicts are closely attached to negative organizational and psychological results , for
example high level of depression signs, and increased usage of alcohols, dissatisfaction with life, satisfaction level with job and level of marital satisfaction, and
increased turnover intensions. Family-work conflicts occur if work and home matters are unable to establish side by side and it became difficult to manage both
at one time. Not only family and home demands have been found as a precaution of daily stress consequences of family to work conflicts it also been found
unhealthy for employee’s physical and mental conditions(Daalen, Willemsen, Sanders, & Veldhoven, 2009).The view of work-family conflicts arise from
examining the level where demands resources effects the performance of work and family domains. Demands are psychological or structural sources connected
with role needs, norms and expectations where individuals must react or make adaptation by physical or mental effort (Voydanoff, 2004).More recent
conducted study has accepted its nature with more than one dimension, where the demands of family and work are in directly and in equal competition.
Specifically, work-family conflicts states that work demands may create interference with individual's ability to bring out family tasks. Family-work conflicts
states when family matters interfere with individual's tasks of work Bragger, et al.(2005).
Job Autonomy
Job autonomy clearly stated as the degree of control of an individual has over his or her own preparation, task and arrangements (Stoner & Kim, 2008). Job
autonomy is refers to the important decisions in their work over degree of discretion employees, such as the timing and methods of their tasks (Parker, Axtell, &
Turner, 2001). Authors conceived that freedom in decisions making on the job or tasks was linked with relatively fewer symptoms of exhaustion, and depression,
even when job load were heavy (Kirmeyer & Shirom, 1986). Autonomy can also play a contributing role towards self-esteem through the appraisals of co-
workers, because in office culture it can be a symbol of status for an employee (Schwalbe, 1985).Parker, Axtell, & Turner (2001) defined that Job autonomy can
be recognized as one of the significant elements of work design tasks for employee outcome like motivation and job satisfaction.
Freedom of movement, can execute plans and create task accomplishment levels, and independence from direct observation are important for providing people
an intelligence of control over their work. Clearly this control of intelligence was beneficial psychologically in its own way. Moreover scope of autonomy was
significant psychologically for other matters as well, in the environment of workplace they were use as indicators of reliability, symbol, confidence and
competence. Large number of people appreciated autonomy because of its meanings in these aspects and concomitantly about the individuals who had meant it
(Schwalbe, 1985).
Fairness of Rewards
Rewards is the conspicuous of a slightly balance between the intrinsic rewards (for example autonomy, variety, and challenge) and the extrinsic rewards (for
example fringe benefits, pay, promotion, and physical working conditions) that have a powerful effect on the employees' attitude towards their job and the
company (Sondhi et al, 2008).The reward issuance structural method in economy is constructed by the planner. In “post-Reform" proper planned economies
rewards are presented as bonus, the size and amount of which is related to such success indications like profit rate and value of output (Tam, 1981). Cate, Lloyd,
Henton, and Larson (1982) state that employee don’t focus on the subject of distributive fairness when there levels of rewards in a relationship are high.
Fairness in rewards can be stated as the ability to which making decisions in work environments are considered as reflect equitable and fair (Maslach & Leiter,
2008). (huja, Chudoba, Kacmar, McKnight, and George(2006) gave suggestions that employees are willing to form social exchange bonds with others ones as
they consider they are fairly and inversely receiving perks of value to them as an outcome of the social exchange element. On other hand, social exchange
commitments affect the level of organizational commitment.
Perceived Work Load
Managerial level work in which work load was reported to be the main element of seeming stress in work, strongly followed by ambiguity role and the role of
conflict (Moore, 2000a). The correlation between an individual and group human operator and task demands, it is the amount of work hand over to or expected
from an employee in a specified time(Sondhi et al, 2008).In 2000 Moore describe Perceived work overload reflected more variance in the exhaustion level of
information technology professionals than the other more commonly cited workplace individuals, and it was also shown in the strong majority of problems
explained by the exhausted technology executives, it is suggested that employee in organizations are constantly asked to take on unachievable workloads and
deadlines, In fact, work overload condition and less time to complete the work have been reported as most common demands in the working environments of
employees.
Turnover Intention
Turnover described as one's propensity to depart the job that the individual is currently pursuing(Sondhi et al, 2008).Harris, James and Boonthanom (2005) state
that strain is a psychological response created by a Stressor that may contain frustration, nervousness, depressed feelings, and other symptoms of physical
disturbance as well. Generally authors of stress address Stressors in sense the strains and predictors as the result of these Stressors. However in some scenarios
organizational politics are seems as threatening. When the individuals experience strain and the resulting emotional feelings of willing to stop or go away from
organization that is turnover intentions.(Rehman, 2012) State that turnover purely refer to the leaving phenomenon of workers of an organization, This is a
harmful situation, might lead towards the disappointment of worker sustainability in the organizations, skipping a job appears to show significant work place
troubles, in spite of opportunities to go for better jobs, employee’s turnover disrupt steams, increases costs, lower productivity, and leads in lost knowledge. So,
it is necessary for the policy makers to realize the significance of employee’s job satisfaction level.
Perceived Work overload and Work Exhaustion
The degree of work exhaustion changes with perceived work overload in a same pattern as increase in perceived workload results relative increase in work
exhaustion. In fact perceived work over-load is the perception that one has too much ability to do (Ahuja et al, 2006). Moore (2000a) observed that work over-
load is the strongest contributing factor towards exhaustion. Therefore perceived workload has positive influence on work exhaustion.
HI: Perceived work over-load will influence the work exhaustion (WE) positively.
Work Family Conflicts and Work Exhaustion
More work family conflicts among the workers results in high level of work exhaustion. The work family conflicts might be a factor of stress condition in working
environment (Ahuja et al, 2006).High level of Work family conflicts can affect the behavior of worker badly which may results towards work exhaustion. Hence
work exhaustion and work family conflicts are positively related.
H2: Work family conflict will effect work exhaustion positively.
Job Autonomy & Work Exhaustion
Autonomy on job has negative effect on work exhaustion. As job autonomy increase in the work exhaustion factor decreases and vice versa. Job autonomy give
a power to worker to control its tasks by own. Job autonomy associated with work exhaustion as well as autonomy on job also has been found to be related with
turnover intentions among employees (Stoner & Kim, 2008).
H3: Job autonomy will negatively influence work exhaustion.
Fairness of Rewards and Work Exhaustion
(Ahuja, Chudoba, Kacmar, McKnight and George(2006) suggest employees are willing to construct social exchange relations with one another as they perceive
that they are receiving benefits fairly and reciprocally as a result of the social exchange. In this manner, social exchange relationship affects work exhaustion.
H4: Fairness of reward among workers will negatively influence work exhaustion.
Work Exhaustion and Turnover Intentions
Work exhaustion factor positively influences the turnover intensions in a positive way. More work exhaustion level affect high turnover intensions. Turnover
intensions can also be address as burnout which means the outcome of stable or frequent pressure on emotions linked with tense attachment with people over
long time (Moore, 2000a).So turnover intensions are positively related with work exhaustions.
H5: Work exhaustion (WE) will influence turn over intentions among workers positively.

VOLUME NO. 3 (2013), I SSUE NO. 09 (SEPTEMBER ) ISSN 2231-5756
INTERNATIONAL JOURNAL OF RESEARCH IN COMMERCE, IT & MANAGEMENT A Monthly Double-Blind Peer Reviewed (Refereed/Juried) Open Access International e-Journal - Included in the International Serial Directories
http://ijrcm.org.in/
133
THEORATICAL FRAMEWORK The purpose of understudy research is to use the framework of research on work exhaustion faction and turnover intension by analyzing elements which inhibits
work-life integrations. In concerning research model six variables are present. One is dependent which turnover intension is. Work exhaustion is the intervening
variable between dependent and independent variables. Four independent variables are present in research models are; perceived workload, work-family
conflicts, autonomy at job and fairness of reward.
In research model perceived workload and work-family conflicts have positive influence on work exhaustion factor while the job autonomy and fairness of
reward have negative influence on work exhaustion. More over work exhaustion has positively influence on turnover intension.
FIGURE 1
PARTICIPANTS AND DATA COLLECTION This study is conducted in the IT sector, various kinds of institutions were involved for the purpose of data collection. All the responders were conveniently
involved by whole – hearted. All our targeted population was free and frank to us in the process to the collection of data. The IT institutions were basic target
and we found a lot of experiences and dynamic results from this sector.
We used the Paper – and – Pencil Technique to collect the data for the study and their analysis. We distributed 300 questionnaires in various IT institutions in
our target audience, but the 237 questionnaires were returned back and 19 questionnaires were unsatisfactory for the analysis due to response biasness. We
got the effective response rate as 72.67%. This study is based on the 218 questionnaires. We have used 6 different demographics and 37 questions as measuring
scale to understand the behavior of our respondents. The brief summaries of demographic variables are as under:
In our study there are 129 were males (59.17%) and 89 were females (40.83%). Estimated age of respondents’ ranges from 20-25 years were 76 (34.86%), 26 –
30 years were 62 (28.44%), 31 -35 years were 49 (22.48%) and 36 – 40 years were 31 (14.22%). In marital status variable there are 139 respondents were
married (63.76%) and remaining 79 were single (36.24%). Other demographic variables organization name, income, experiences were asked from respondents.
VARIABLE AND MEASURES TURNOVER INTENSIONS
The dependent variable Turnover described as one's propensity to depart the job that the individual is currently pursuing (Sondhi et al, 2008).Five items is to
measure this variable, a sample item being “I will probably look for a job in a different organization in coming year.” The measure of Cronbach’s alpha for five
items for this sample was 0.952. However the Cornbach’s alpha value of this research is 0.886. All five items are present and all items are selected while no item
is dropped.
WORK EXAUSTION
It is the intervening variable. In observation of work-exhaustion study is the combination of emotional energy level and mental energy level required to fulfill job
demands (Moore, 2000b). It is generally regarded as the core component of job burnout. Seven items is to measure this variable like “I feel burned out from my
work.” The value of Cronbach alpha for seven items was 0.791. But the Cornbach’s alpha value for this research is 0.810. All seven items are present and all
items are selected while no item is dropped.
WORK FAMILY CONFLICT
Work-family conflict is the independent variable. (WFC) happen when involvement in the work and the family role is unsuited in some aspect. As a result,
contribution in one either role is made more complex by virtue of involvement the other role (Sondhi et al, 2008). Eight items are to measure this variable such
as “The demands of my work interfere with my home and my family life.” Cronbach’s alpha value of this variable was 0.779. However the Cronbach’s alpha value
for this research is 0.849.Eight items are presented while all items are selected and no items is dropped.
JOB AUTONOMY
Job autonomy is independent variable. Job autonomy can be stated as the job gives freedom of substantial, independent and judgment in kept organizing the
work and choosing the systematic procedures to be used further (Sondhi et al, 2008). Four items are asked like “I have the authority it initiate projects at my
job.”Cronbach alpha value of this variable was 0.690. However the Cronbach’s alpha value for this research is 0.334. Four items are presented while all items are
selected and no item is dropped.
PERCEIVED WORKLOAD
Perceived Work Load is the independent variable. It is the association between a group and individual human operator and task demands, In addition, it is the
amount of work assigned or expected from an employee in a specified time. (Sondhi et al, 2008). Seven items are asked like “I usually bring work home with
me”. The value of Cronbach’s alpha for seven items was 0.740. But the Cronbach’s alpha value for research is 0.789. All seven items are present and all items are
selected while no item is dropped.
Perceived
workload
Work Family
Conflict
Job Autonomy
Fairness of
Rewards
Work
Exhaustion
Turnover
Intensions

VOLUME NO. 3 (2013), I SSUE NO. 09 (SEPTEMBER ) ISSN 2231-5756
INTERNATIONAL JOURNAL OF RESEARCH IN COMMERCE, IT & MANAGEMENT A Monthly Double-Blind Peer Reviewed (Refereed/Juried) Open Access International e-Journal - Included in the International Serial Directories
http://ijrcm.org.in/
134
FAIRNESS OF REWARDS
Fairness of Rewards is independent variable. Rewards is the conspicuous of a slightly balance between the intrinsic rewards (for example autonomy, variety, and
challenge) and the extrinsic rewards (for example fringe benefits, pay, promotion, and physical working conditions) that have a powerful effect on the
employees' attitude towards their job and the company (Sondhi et al, 2008). Six items is to measure this variable, a sample item being “My organization has
processes that assure that all team members will be treated fair and equal.” The measure of Cronbach’s alpha for six items for this sample was 0.870. However
the Cronbach’s alpha value of research is 0.723. All six items are present and all items are selected while no item is dropped.
ANALYSIS AND RESULTS RELIABILITY ANALYSIS
We Computed Cronbach’s Alpha’s to analyze the reliability of the scales. The Alpha coefficient values fulfilled the suggested cutoff level of 0.70 (Nunnally, 1978).
The Alpha coefficient of Job Autonomy is 0.734, Work-family conflict is 0.849, work exhaustion is 0.810, perceived work overload is 0.789, fairness of rewards is
0.723 and of turnover intention is 0.886.
TABLE 1
Sr. # Variable Total no. of items Alpha
1 Job autonomy 04 .734
2 Work-family conflict 08 .849
3 Work exhaustion 07 .810
4 Perceived work overload 07 .789
5 Fairness of reward 06 .723
6 Turnover intention 05 .886
CORRELATION ANALYSIS
TABLE 2: CORRELATION RESULTS
Correlation Analysis shows the relationship of independent variable with dependent variable.
There is significant positive relationship between perceived work overload and work exhaustion having value (r = 0.505, p< 0.01) and confirms our hypothesis 1.
Results shows the significant positive relationship between work family conflict and work exhaustion (r = 0.429, p< 0.01] and supports our hypothesis 2.
Work exhaustion has significant negative relationship with job autonomy (r = -0.357, p< 0.01) and supports our hypothesis 3.
Fairness of rewards has significant negative relationship with work exhaustion (r = -0.614, p< 0.01) and supports our hypothesis 4.
Work exhaustion has significant positive relationship with turnover intention (r = 0.422, p< 0.01) and supports our hypothesis 5.
REGRESSION ANALYSIS
TABLE 4: REGRESSION RESULTS
DISCUSSION
Perceived Work overload
Our hypothesis predicts that Perceived work overload will positively predict Work Exhaustion. Regression result prove our hypothesis and shows the positive
impact of Perceived Work overload on Work Exhaustion (β= 0.505, p < .01). Results explain that Work Exhaustion can be determined by perceived work
overload.
Work Family Conflict
Our hypothesis predicts that work family conflict will positively predict work exhaustion. Regression result prove our hypothesis and shows the positive impact
of work family conflict on Work Exhaustion (β= 0.429, p <.01). Results explain that Work Exhaustion can be determined by work family conflict.
Job Autonomy
The hypothesis predicts that Work Exhaustion will be negatively related to the job autonomy. To test this hypothesis, we regressed job autonomy on Work
Exhaustion. We found that job autonomy has significant negative impact on work exhaustion (β=-0.357, p<.01).
Fairness of Rewards
Hypothesis predicts that fairness of rewards will negatively influence work exhaustion. To prove the hypothesis we regressed fairness of rewards on work
exhaustion and found that fairness of rewards negatively influence work exhaustion (β=-0.614, p < .01).
Work Exhaustion
Our Hypothesis predicts that turnover intention will be positively influenced by Work Exhaustion and Relationship Quality. And results confirm our hypothesis
(β=0.422, p < .01).
CONCLUSION AND FUTURE RESEARCH Turnover intensions among employees in working environment is a significant issue, according to this research study elements such as work exhaustion,
perceived work-overload and work family conflicts are major causes and effect of employees turnover intentions. In accordance of this research organizations
must form and implement strategies through which turnover intentions level can controlled.
Future research can be conducted in other sectors like banking sector, educational sector etc. Moreover, a comparative study can also be conducted between
two or more countries or between males and females.
Estimate
H1 Perceived Work Overload <-- -- --> Work Exhaustion 0.505**
H2 Work family Conflict <-- -- --> Work Exhaustion 0.429**
H3 Job Autonomy <-- -- --> Work Exhaustion -0.357**
H4 Fairness of Rewards <-- -- --> Work Exhaustion -0.614**
H5 Work Exhaustion <-- -- --> Turnover Intention 0.422**
** Correlation is significant at the 0.01 level (2-tailed).
Work Exhaustion Turnover Intention
β R2 β R
2 Estimate
Perceived Work Overload .505 .344 ---- ---- .000**
Work family Conflict .429 ..257 ---- ---- .000**
Job Autonomy .357 .325 ---- ---- .000**
Fairness of Rewards .614 .380 ---- ---- .000**
Work Exhaustion ---- ----- .422 .332 .000**

VOLUME NO. 3 (2013), I SSUE NO. 09 (SEPTEMBER ) ISSN 2231-5756
INTERNATIONAL JOURNAL OF RESEARCH IN COMMERCE, IT & MANAGEMENT A Monthly Double-Blind Peer Reviewed (Refereed/Juried) Open Access International e-Journal - Included in the International Serial Directories
http://ijrcm.org.in/
135
LIMITATIONS This research study has various limitations. Such as this research is conducted on the working environment of IT sector with one country. No other sectors or
other countries are part of this research. Further in presence of six variables it is quite difficult for subject to response questionnaire in efficient manner. Gender
difference can also add significant change in results specifically in work-family life balance factor. As work exhaustion, perceived workload, work family conflicts
are major cause of turnover intensions so individually a comprehensive research on these elements can be conducted.
REFERENCES 1. Ahuja, M. K., Chudoba, K. M., Kacmar, C. J., McKnight, D. H., & George, J. F. (2006). IT ROAD WARRIORS: BALANCING WORK-FAMILY CONFLICT, JOB
AUTONOMY, AND WORK OVERLOAD TO MITIGATE TURNOVER INTENTIONS. MIS Quarterly, 30 (3), 1-18.
2. Bragger, J. D., Srednicki, O. R., Kutcher, E. J., Indovino, L., & Rosner, E. (2005). WORK-FAMILY CONFLICT, WORK-FAMILY CULTURE, AND ORGANIZATIONAL
CITIZENSHIP BEHAVIOR AMONG TEACHERS. Journal of Business and Psychology, 20 (2), 303-324.
3. Cate, R. M., Lloyd, S. A., Henton, J. M., & Larson, J. H. (1982). Fairness and Reward Level as Predictors of Relationship Satisfaction. Social Psychology
Quarterly, 45 (3), 177-181.
4. Daalen, G. V., Willemsen, T. M., Sanders, K., & Veldhoven, M. J. (2009). Emotional exhaustion and mental health problems among employees doing “people
work”: the impact of job demands, job resources and family-to-work conflict. Int Arch Occup Environ Health, 82, 291–303.
5. Harris, K. J., James, M., & Boonthanom, R. (2005). Perceptions of Organizational Politics and Cooperation as Moderators of the RelationshipBetween Job
Strains and Intent to Turnover. Journal of Managerial Issues, 17 (1), 26-42.
6. Jhatial, A. A., Mangi, R. A., & Ghumro, I. A. (2012). Antecedents and Consequences of Employee Turnover: Empirical Evidence from Pakistan. British Journal
of Economics, Management & Trade, 2 (4), 279-295.
7. Kirmeyer, S. L., & Shirom, A. (1986). PERCEIVED JOB AUTONOMY IN THE MANUFACTURING SECTOR: EFFECTS OF UNIONS, GENDER, AND SUBSTANTIVE
COMPLEXITY. Academy of Management Journal, 29 (4), 832-840.
8. Maslach, C., & Leiter, M. P. (2008). Early Predictors of Job Burnout and Engagement. Journal of Applied Psychology, 93 (3), 498–512.
9. Moore, E. J. (2000a). One Road to Turnover: An Examination of Work Exhaustion in Technology Professionals. MIS Quarterly, 24 (1), 141-168.
10. Moore, E. J. (2000b). WHY IS THIS HAPPENING? A CAUSAL ATTRIBUTION APPROACH TO WORK EXHAUSTION CONSEQUENCES. Academy of Management
Review, 25 (2), 335-349.
11. Morgeson, F. P., Delaney-Klinger, K., & Hemingway, M. A. (2005). The Importance of Job Autonomy, Cognitive Ability, and Job-Related Skill for Predicting
Role Breadth and Job Performance. Journal of Applied Psychology, 90 (2), 399–406.
12. NOOR, N. M. (2004). Work-Family Conflict, Work- and Family-Role Salience, and Women’s Well-Being. The Journal of Social Psychology, 144 (4), 389-405.
13. Noor, S., & Maad, N. (2008). Examining the Relationship between Work Life Conflict, Stress And Turnover Intentions among Marketing Executives in
Pakistan. Journal of Business and Management, 3 (11), 93-102.
14. Parker, S. K., Axtell, C. M., & Turner, N. (2001). Designing a Safer Workplace: Importance of Job Autonomy, Communication Quality, and Supportive
Supervisors. Journal of Occupational Health Psychology, 6 (3), 211-228.
15. Rana, T. M., Salaria, M. R., Herai, G. M., & Amin, M. A. (2009). Identifying Factors Playing Important Role in the Increasing Employees' Turnover Rate: A
Case of Telecom Industry in Pakistan. Indus journal of management and social sciences, 3 (2), 80-89.
16. Rehman, D. M. (2012). Employee Turnover and Retention Strategies: An Empirical Study of Public Sector Organizations of Pakistan. GOBAL JOURNAL OF
MANAGEMENT AND BUSINESS RESEARCH, 12 (1), 83-89.
17. Schwalbe, M. L. (1985). Autonomy in Work and Self-Esteem. The Sociological Quarterly, 26 (4), 519-535.
18. SHAH, I. A., FAKHR, Z., AHMAD, M. S., & ZAMAN, K. (2010). MEASURING PUSH, PULL AND PERSONAL FACTORS AFFECTING TURNOVER INTENTION: A CASE
OF UNIVERSITY TEACHERS IN PAKISTAN. Reveiw of economic and Business studies, 3 (1), 167-192.
19. Sondhi, N., Chawla, D., Jain, P., & Kashyap, M. (2008). Work-Exhaustion - A Consequential Framework: Validating the Model in the Indian Context. Indian
Journal of Industrial Relations, 43 (4), 547-573.
20. Stoner, M. P., & Kim, H. P. (2008). Burnout and Turnover Intention Among Social Workers: Effects of Role Stress, Job Autonomy and Social Support.
Administration in Social Work, 32 (3), 5-25.
21. Tam, M.-Y. S. (1981). Reward Structures in a Planned Economy: The Problem of Incentives and Efficient Allocationof Resources. The Quarterly Journal of
Economics, 96 (1), 111-128.
22. Voydanoff, P. (2004). The Effects of Work Demands and Resources on Work-to-Family Conflict and Facilitation. Journal of Marriage and Family, 66 (2), 398-
412.
23. Yildirim, D., & Aycan, Z. (2008). Nurses’ work demands and work–family conflict:A questionnaire survey. International Journal of Nursing Studies, 45, 1366-
1378.

VOLUME NO. 3 (2013), I SSUE NO. 09 (SEPTEMBER ) ISSN 2231-5756
INTERNATIONAL JOURNAL OF RESEARCH IN COMMERCE, IT & MANAGEMENT A Monthly Double-Blind Peer Reviewed (Refereed/Juried) Open Access International e-Journal - Included in the International Serial Directories
http://ijrcm.org.in/
136
REQUEST FOR FEEDBACK
Dear Readers
At the very outset, International Journal of Research in Commerce, IT and Management (IJRCM)
acknowledges & appreciates your efforts in showing interest in our present issue under your kind perusal.
I would like to request you to supply your critical comments and suggestions about the material published
in this issue as well as on the journal as a whole, on our E-mail i.e. [email protected] for further
improvements in the interest of research.
If you have any queries please feel free to contact us on our E-mail [email protected].
I am sure that your feedback and deliberations would make future issues better – a result of our joint
effort.
Looking forward an appropriate consideration.
With sincere regards
Thanking you profoundly
Academically yours
Sd/-
Co-ordinator

VOLUME NO. 3 (2013), I SSUE NO. 09 (SEPTEMBER ) ISSN 2231-5756
INTERNATIONAL JOURNAL OF RESEARCH IN COMMERCE, IT & MANAGEMENT A Monthly Double-Blind Peer Reviewed (Refereed/Juried) Open Access International e-Journal - Included in the International Serial Directories
http://ijrcm.org.in/
IV
Copyright © 2022 FDOKUMEN