Ijrcm-4-IJRCM-4 vol-3 2013 issue-8
166
VOLUME NO. 3 (2013), ISSUE NO. 08 (AUGUST) ISSN 2231-5756 A Monthly Double-Blind Peer Reviewed (Refereed/Juried) Open Access International e-Journal - Included in the International Serial Directories Indexed & Listed at: Ulrich's Periodicals Directory ©, ProQuest, U.S.A., EBSCO Publishing, U.S.A., Cabell’s Directories of Publishing Opportunities, U.S.A., Open J-Gage, India [link of the same is duly available at Inflibnet of University Grants Commission (U.G.C.)], Index Copernicus Publishers Panel, Polandwith IC Value of 5.09 &number of libraries all around the world. Circulated all over the world & Google has verified that scholars of more than 2718 Cities in 161 countries/territories are visiting our journal on regular basis. Ground Floor, Building No. 1041-C-1, Devi Bhawan Bazar, JAGADHRI – 135 003, Yamunanagar, Haryana, INDIA http://ijrcm.org.in/
Transcript of Ijrcm-4-IJRCM-4 vol-3 2013 issue-8

VOLUME NO. 3 (2013), ISSUE NO. 08 (AUGUST) ISSN 2231-5756
A Monthly Double-Blind Peer Reviewed (Refereed/Juried) Open Access International e-Journal - Included in the International Serial Directories Indexed & Listed at:
Ulrich's Periodicals Directory ©, ProQuest, U.S.A., EBSCO Publishing, U.S.A., Cabell’s Directories of Publishing Opportunities, U.S.A.,
Open J-Gage, India [link of the same is duly available at Inflibnet of University Grants Commission (U.G.C.)],
Index Copernicus Publishers Panel, Polandwith IC Value of 5.09 &number of libraries all around the world.
Circulated all over the world & Google has verified that scholars of more than 2718 Cities in 161 countries/territories are visiting our journal on regular basis.
Ground Floor, Building No. 1041-C-1, Devi Bhawan Bazar, JAGADHRI – 135 003, Yamunanagar, Haryana, INDIA
http://ijrcm.org.in/

VOLUME NO. 3 (2013), ISSUE NO. 08 (AUGUST) ISSN 2231-5756
INTERNATIONAL JOURNAL OF RESEARCH IN COMMERCE, IT & MANAGEMENT A Monthly Double-Blind Peer Reviewed (Refereed/Juried) Open Access International e-Journal - Included in the International Serial Directories
http://ijrcm.org.in/
ii
CONTENTS Sr. No. TITLE & NAME OF THE AUTHOR (S) Page
No.
1. A COMPARATIVE FINANCIAL ANALYSIS OF INDIAN BANKING SECTOR IN CONTEXT OF NPA MANAGEMENT ALPESH GAJERA & DR. VIJAY PITHADIA
1
2. IMPACT OF INFORMATION COMMUNICATION TECHNOLOGY (ICT) ON EMPLOYEES PERFORMANCE: A STUDY OF MTN NIGERIA TELECOMMUNICATION LIMITED DR. ADEWOYE, JONATHAN OYERINDE
5
3. KNOWLEDGE INCUBATION PRACTICES PREVALENT IN HIGHER EDUCATION SYSTEM: A REVIEW OF SELECT PRIVATE INSTITUTIONS IN BANGALORE DR. A ELANGOVAN & VALARMATHI.B
10
4. A STUDY ON INTER-MANDAL AND INTER-DIVISIONAL VARIATIONS IN RURAL FEMALE WORK PARTICIPATION RATE IN CHITTOOR DISTRICT (ANDHRA PRADESH) DR. E. LOKANADHA REDDY
13
5. IMPACT OF MICROFINANCE ON WOMEN’S LIVES: A STUDY OF LUDHIANA DISTRICT DR. M. L. GUPTA & MUNISH KAPILA
17
6. IMPACT OF ANTECEDENTS OF BEHAVIOURAL INTENTION OF STUDENTS’ IN HIGHER EDUCATION DR. M. KALPANA, DR. D SUDHARANI RAVINDRAN & DR. K.RAMYA
21
7. ENERGY USES IN INDIA: A CASE OF ELECTRICITY M.ANANDAN & S.RAMASWAMY
27
8. THE EXAMINATION OF CONNECTION OF BOTH BALANCE SHEET FINANCING AND ACCEPTED COMPANIES PERFORMANCE IN TEHRAN STOCK EXCHANGE USING MARKET VALUE TO BOOK DR. ABOLFAZL GHADIRI MOGHADAM, DR. MOHAMMAD HOSSEIN VADIEI NEUGHABI, DR. HADI JABARI NEUGHABI & YOUSSEF HAGHIGHI
34
9. TEAM BUILDING IN INFORMATION TECHNOLOGY (IT) INDUSTRIES SIRISHA DAMARAJU, DR. P. SAI RANI & DR. T. NARAYANA REDDY
39
10. IMPROVED PARALLEL THINNING ALGORITHM FOR NUMERAL PATTERNS GAURAV KUMAR & AASISH OBEROI
43
11. AWARENESS AND INDIVIDUAL DIFFERENCES ON ORGANIC FOOD PRODUCTS IN ERODE DISTRICT, TAMILNADU M. GOMATHI & DR. S. KALYANI
48
12. THE IMPACT OF ONLINE MARKETING IN INDIA KUSHINI PRASAD & KONDA SANTOSH KUMAR
52
13. A STUDY ON EMPLOYEE ENGAGEMENT ACTIVITIES AT EFD KANIMOZHI.R
55
14. NATURE AND TRENDS OF PUBLIC EXPENDITURE IN MANIPUR (2000-2010) HUIDROM IMOBI SINGH
59
15. CHALLENGES TO RETAIL SECTOR: A STUDY OF DISTRICT RAJOURI IN JAMMU AND KASHMIR STATE AASIM MIR
68
16. BLENDING WITH THE BEST: EVALUATION OF SERVICE QUALITY OF HOTEL INDUSTRY DR. LEENA NITIN FUKEY
75
17. A CRITICAL ASSESSMENT ON MEASURES OF EMOTIONAL INTELLIGENCE MEETA MANDAVIYA
83
18. IMPACT OF INFLATION ACCOUNTING ON FINANCIAL STATEMENTS AND EARNING PER SHARE MONIKA KHEMANI
88
19. A STUDY OF EFFECT OF PERFORMANCE APPRAISAL ON THE ORGANIZATION AND THE EMPLOYEE IN NIDHI TECHNOLOGIES AVINASH GOYAL
94
20. A STUDY ON IMPACT OF GLOBAL RECESSION ON INDIAN ECONOMY WITH REFERENCE TO INDIA’S EXPORTS DR. A.MUTHUSAMY
104
21. KNOWLEDGE, ATTITUDE, PRACTICE AND PREVENTION ABOUT HIV/AIDS AMONG MEN WHO HAVE SEX WITH MEN (MSM) IN KARNATAK: AN EMPIRICAL STUDY OF BELGAUM DISTRICT UMESH T, SEEMA DEVADIGA & DHAVALESHWAR C U
112
22. RELATIONSHIP BETWEEN INFORMATION SECURITY AWARENESS AND INFORMATION SECURITY THREAT WILLIAMS SOLOMON ADEDAYO & AKANMU SEMIU AYOBAMI
115
23. WHY MBA STUDENTS ARE NOT EMPLOYABLE? (WITH REFERENCE TO DAVANGERE MBA STUDENTS) ASIFULLA A
120
24. AN EVALUATION OF AUDIT EXPECTATION GAP IN NIGERIA OLOLA OLAYEYE ADUWO
124
25. ROLE OF FINANCIAL INCLUSION FOR INCLUSIVE GROWTH: AN INDIAN SCENARIO BHARGAB KUMAR KALITA
131
26. PROBLEMS OF SELF HELP GROUPS WITH SPECIAL REFERENCE TO STATE MICRO FINANCE VISION 2011, ARUNACHAL PRADESH AKEPI LINGGI EHILI
137
27. INDEBTEDNESS AND FARMERS SUICIDES IN RURAL PUNJAB DR. GURMEET KAUR
141
28. PRESERVATION AND MAINTENANCE OF THE COLLECTION OF SRI VENKATESWARA ORIENTAL RESEARCH INSTITUTE LIBRARY, TIRUPATI: A USER SURVEY B. DEENADHAYALU, A. SIVAKESAVULLU & M.BHANUMURTHY
147
29. USE OF INFORMATION AND COMMUNICATION TECHNOLOGY (ICT) PRODUCTS AND SERVICES IN UNIVERSITY LIBRARIES OF TIRUPATI (A. P.): AN ANALYTICAL STUDY DR. D. KONAPPA
150
30. SATISFACTION ON FACILITIES AND SERVICES OF J. B. WOMEN’S ENGINEERING COLLEGE LIBRARY IN TIRUPATI: AN USER SURVEY B. VEENA KUMARI
155
REQUEST FOR FEEDBACK 159

VOLUME NO. 3 (2013), ISSUE NO. 08 (AUGUST) ISSN 2231-5756
INTERNATIONAL JOURNAL OF RESEARCH IN COMMERCE, IT & MANAGEMENT A Monthly Double-Blind Peer Reviewed (Refereed/Juried) Open Access International e-Journal - Included in the International Serial Directories
http://ijrcm.org.in/
iii
CHIEF PATRON PROF. K. K. AGGARWAL
Chairman, Malaviya National Institute of Technology, Jaipur (An institute of National Importance & fully funded by Ministry of Human Resource Development, Government of India)
Chancellor, K. R. Mangalam University, Gurgaon Chancellor, Lingaya’s University, Faridabad
Founder Vice-Chancellor (1998-2008), Guru Gobind Singh Indraprastha University, Delhi Ex. Pro Vice-Chancellor, Guru Jambheshwar University, Hisar
FOUNDER PATRON LATE SH. RAM BHAJAN AGGARWAL
Former State Minister for Home & Tourism, Government of Haryana Former Vice-President, Dadri Education Society, Charkhi Dadri Former President, Chinar Syntex Ltd. (Textile Mills), Bhiwani
CO-ORDINATOR AMITA
Faculty, Government M. S., Mohali
ADVISORS DR. PRIYA RANJAN TRIVEDI
Chancellor, The Global Open University, Nagaland
PROF. M. S. SENAM RAJU Director A. C. D., School of Management Studies, I.G.N.O.U., New Delhi
PROF. M. N. SHARMA Chairman, M.B.A., Haryana College of Technology & Management, Kaithal
PROF. S. L. MAHANDRU Principal (Retd.), Maharaja Agrasen College, Jagadhri
EDITOR PROF. R. K. SHARMA
Professor, Bharti Vidyapeeth University Institute of Management & Research, New Delhi
CO-EDITOR DR. BHAVET
Faculty, Shree Ram Institute of Business & Management, Urjani
EDITORIAL ADVISORY BOARD DR. RAJESH MODI
Faculty, Yanbu Industrial College, Kingdom of Saudi Arabia
PROF. SANJIV MITTAL University School of Management Studies, Guru Gobind Singh I. P. University, Delhi
PROF. ANIL K. SAINI Chairperson (CRC), Guru Gobind Singh I. P. University, Delhi

VOLUME NO. 3 (2013), ISSUE NO. 08 (AUGUST) ISSN 2231-5756
INTERNATIONAL JOURNAL OF RESEARCH IN COMMERCE, IT & MANAGEMENT A Monthly Double-Blind Peer Reviewed (Refereed/Juried) Open Access International e-Journal - Included in the International Serial Directories
http://ijrcm.org.in/
iv
DR. SAMBHAVNA Faculty, I.I.T.M., Delhi
DR. MOHENDER KUMAR GUPTA Associate Professor, P. J. L. N. Government College, Faridabad
DR. SHIVAKUMAR DEENE Asst. Professor, Dept. of Commerce, School of Business Studies, Central University of Karnataka, Gulbarga
ASSOCIATE EDITORS PROF. NAWAB ALI KHAN
Department of Commerce, Aligarh Muslim University, Aligarh, U.P.
PROF. ABHAY BANSAL Head, Department of Information Technology, Amity School of Engineering & Technology, Amity
University, Noida
PROF. A. SURYANARAYANA Department of Business Management, Osmania University, Hyderabad
DR. SAMBHAV GARG Faculty, Shree Ram Institute of Business & Management, Urjani
PROF. V. SELVAM SSL, VIT University, Vellore
DR. PARDEEP AHLAWAT Associate Professor, Institute of Management Studies & Research, Maharshi Dayanand University, Rohtak
DR. S. TABASSUM SULTANA Associate Professor, Department of Business Management, Matrusri Institute of P.G. Studies, Hyderabad
SURJEET SINGH Asst. Professor, Department of Computer Science, G. M. N. (P.G.) College, Ambala Cantt.
TECHNICAL ADVISOR AMITA
Faculty, Government M. S., Mohali
FINANCIAL ADVISORS DICKIN GOYAL
Advocate & Tax Adviser, Panchkula
NEENA Investment Consultant, Chambaghat, Solan, Himachal Pradesh
LEGAL ADVISORS JITENDER S. CHAHAL
Advocate, Punjab & Haryana High Court, Chandigarh U.T.
CHANDER BHUSHAN SHARMA Advocate & Consultant, District Courts, Yamunanagar at Jagadhri
SUPERINTENDENT SURENDER KUMAR POONIA

VOLUME NO. 3 (2013), ISSUE NO. 08 (AUGUST) ISSN 2231-5756
INTERNATIONAL JOURNAL OF RESEARCH IN COMMERCE, IT & MANAGEMENT A Monthly Double-Blind Peer Reviewed (Refereed/Juried) Open Access International e-Journal - Included in the International Serial Directories
http://ijrcm.org.in/
v
CALL FOR MANUSCRIPTS We invite unpublished novel, original, empirical and high quality research work pertaining to recent developments & practices in the areas of Computer Science & Applications; Commerce; Business; Finance; Marketing; Human Resource Management; General Management; Banking; Economics; Tourism Administration & Management; Education; Law; Library & Information Science; Defence & Strategic Studies; Electronic Science; Corporate Governance; Industrial Relations; and emerging paradigms in allied subjects like Accounting; Accounting Information Systems; Accounting Theory & Practice; Auditing; Behavioral Accounting; Behavioral Economics; Corporate Finance; Cost Accounting; Econometrics; Economic Development; Economic History; Financial Institutions & Markets; Financial Services; Fiscal Policy; Government & Non Profit Accounting; Industrial Organization; International Economics & Trade; International Finance; Macro Economics; Micro Economics; Rural Economics; Co-operation; Demography: Development Planning; Development Studies; Applied Economics; Development Economics; Business Economics; Monetary Policy; Public Policy Economics; Real Estate; Regional Economics; Political Science; Continuing Education; Labour Welfare; Philosophy; Psychology; Sociology; Tax Accounting; Advertising & Promotion Management; Management Information Systems (MIS); Business Law; Public Responsibility & Ethics; Communication; Direct Marketing; E-Commerce; Global Business; Health Care Administration; Labour Relations & Human Resource Management; Marketing Research; Marketing Theory & Applications; Non-Profit Organizations; Office Administration/Management; Operations Research/Statistics; Organizational Behavior & Theory; Organizational Development; Production/Operations; International Relations; Human Rights & Duties; Public Administration; Population Studies; Purchasing/Materials Management; Retailing; Sales/Selling; Services; Small Business Entrepreneurship; Strategic Management Policy; Technology/Innovation; Tourism & Hospitality; Transportation Distribution; Algorithms; Artificial Intelligence; Compilers & Translation; Computer Aided Design (CAD); Computer Aided Manufacturing; Computer Graphics; Computer Organization & Architecture; Database Structures & Systems; Discrete Structures; Internet; Management Information Systems; Modeling & Simulation; Neural Systems/Neural Networks; Numerical Analysis/Scientific Computing; Object Oriented Programming; Operating Systems; Programming Languages; Robotics; Symbolic & Formal Logic; Web Design and emerging paradigms in allied subjects.
Anybody can submit the soft copy of unpublished novel; original; empirical and high quality research work/manuscript anytime in M.S. Word format after preparing the same as per our GUIDELINES FOR SUBMISSION; at our email address i.e. [email protected] or online by clicking the link online submission as given on our website (FOR ONLINE SUBMISSION, CLICK HERE).
GUIDELINES FOR SUBMISSION OF MANUSCRIPT 1. COVERING LETTER FOR SUBMISSION:
DATED: _____________ THE EDITOR IJRCM
Subject: SUBMISSION OF MANUSCRIPT IN THE AREA OF.
(e.g. Finance/Marketing/HRM/General Management/Economics/Psychology/Law/Computer/IT/Engineering/Mathematics/other, please specify)
DEAR SIR/MADAM
Please find my submission of manuscript entitled ‘___________________________________________’ for possible publication in your journals.
I hereby affirm that the contents of this manuscript are original. Furthermore, it has neither been published elsewhere in any language fully or partly, nor is it under review for publication elsewhere.
I affirm that all the author (s) have seen and agreed to the submitted version of the manuscript and their inclusion of name (s) as co-author (s).
Also, if my/our manuscript is accepted, I/We agree to comply with the formalities as given on the website of the journal & you are free to publish our contribution in any of your journals.
NAME OF CORRESPONDING AUTHOR: Designation: Affiliation with full address, contact numbers & Pin Code: Residential address with Pin Code: Mobile Number (s): Landline Number (s): E-mail Address: Alternate E-mail Address:
NOTES: a) The whole manuscript is required to be in ONE MS WORD FILE only (pdf. version is liable to be rejected without any consideration), which will start from
the covering letter, inside the manuscript. b) The sender is required to mentionthe following in the SUBJECT COLUMN of the mail:
New Manuscript for Review in the area of (Finance/Marketing/HRM/General Management/Economics/Psychology/Law/Computer/IT/ Engineering/Mathematics/other, please specify)
c) There is no need to give any text in the body of mail, except the cases where the author wishes to give any specific message w.r.t. to the manuscript. d) The total size of the file containing the manuscript is required to be below 500 KB. e) Abstract alone will not be considered for review, and the author is required to submit the complete manuscript in the first instance. f) The journal gives acknowledgement w.r.t. the receipt of every email and in case of non-receipt of acknowledgment from the journal, w.r.t. the submission
of manuscript, within two days of submission, the corresponding author is required to demand for the same by sending separate mail to the journal.
2. MANUSCRIPT TITLE: The title of the paper should be in a 12 point Calibri Font. It should be bold typed, centered and fully capitalised.
3. AUTHOR NAME (S) & AFFILIATIONS: The author (s) full name, designation, affiliation (s), address, mobile/landline numbers, and email/alternate email address should be in italic & 11-point Calibri Font. It must be centered underneath the title.
4. ABSTRACT: Abstract should be in fully italicized text, not exceeding 250 words. The abstract must be informative and explain the background, aims, methods, results & conclusion in a single para. Abbreviations must be mentioned in full.

VOLUME NO. 3 (2013), ISSUE NO. 08 (AUGUST) ISSN 2231-5756
INTERNATIONAL JOURNAL OF RESEARCH IN COMMERCE, IT & MANAGEMENT A Monthly Double-Blind Peer Reviewed (Refereed/Juried) Open Access International e-Journal - Included in the International Serial Directories
http://ijrcm.org.in/
vi
5. KEYWORDS: Abstract must be followed by a list of keywords, subject to the maximum of five. These should be arranged in alphabetic order separated by commas and full stops at the end.
6. MANUSCRIPT: Manuscript must be in BRITISH ENGLISH prepared on a standard A4 size PORTRAIT SETTING PAPER. It must be prepared on a single space and single column with 1” margin set for top, bottom, left and right. It should be typed in 8 point Calibri Font with page numbers at the bottom and centre of every page. It should be free from grammatical, spelling and punctuation errors and must be thoroughly edited.
7. HEADINGS: All the headings should be in a 10 point Calibri Font. These must be bold-faced, aligned left and fully capitalised. Leave a blank line before each heading.
8. SUB-HEADINGS: All the sub-headings should be in a 8 point Calibri Font. These must be bold-faced, aligned left and fully capitalised.
9. MAIN TEXT: The main text should follow the following sequence:
INTRODUCTION
REVIEW OF LITERATURE
NEED/IMPORTANCE OF THE STUDY
STATEMENT OF THE PROBLEM
OBJECTIVES
HYPOTHESES
RESEARCH METHODOLOGY
RESULTS & DISCUSSION
FINDINGS
RECOMMENDATIONS/SUGGESTIONS
CONCLUSIONS
SCOPE FOR FURTHER RESEARCH
ACKNOWLEDGMENTS
REFERENCES
APPENDIX/ANNEXURE
It should be in a 8 point Calibri Font, single spaced and justified. The manuscript should preferably not exceed 5000 WORDS.
10. FIGURES &TABLES: These should be simple, crystal clear, centered, separately numbered & self explained, and titles must be above the table/figure. Sources of data should be mentioned below the table/figure. It should be ensured that the tables/figures are referred to from the main text.
11. EQUATIONS:These should be consecutively numbered in parentheses, horizontally centered with equation number placed at the right.
12. REFERENCES: The list of all references should be alphabetically arranged. The author (s) should mention only the actually utilised references in the preparation of manuscript and they are supposed to follow Harvard Style of Referencing. The author (s) are supposed to follow the references as per the following:
All works cited in the text (including sources for tables and figures) should be listed alphabetically.
Use (ed.) for one editor, and (ed.s) for multiple editors.
When listing two or more works by one author, use --- (20xx), such as after Kohl (1997), use --- (2001), etc, in chronologically ascending order.
Indicate (opening and closing) page numbers for articles in journals and for chapters in books.
The title of books and journals should be in italics. Double quotation marks are used for titles of journal articles, book chapters, dissertations, reports, working papers, unpublished material, etc.
For titles in a language other than English, provide an English translation in parentheses.
The location of endnotes within the text should be indicated by superscript numbers.
PLEASE USE THE FOLLOWING FOR STYLE AND PUNCTUATION IN REFERENCES: BOOKS
Bowersox, Donald J., Closs, David J., (1996), "Logistical Management." Tata McGraw, Hill, New Delhi.
Hunker, H.L. and A.J. Wright (1963), "Factors of Industrial Location in Ohio" Ohio State University, Nigeria. CONTRIBUTIONS TO BOOKS
Sharma T., Kwatra, G. (2008) Effectiveness of Social Advertising: A Study of Selected Campaigns, Corporate Social Responsibility, Edited by David Crowther & Nicholas Capaldi, Ashgate Research Companion to Corporate Social Responsibility, Chapter 15, pp 287-303.
JOURNAL AND OTHER ARTICLES
Schemenner, R.W., Huber, J.C. and Cook, R.L. (1987), "Geographic Differences and the Location of New Manufacturing Facilities," Journal of Urban Economics, Vol. 21, No. 1, pp. 83-104.
CONFERENCE PAPERS
Garg, Sambhav (2011): "Business Ethics" Paper presented at the Annual International Conference for the All India Management Association, New Delhi, India, 19–22 June.
UNPUBLISHED DISSERTATIONS AND THESES
Kumar S. (2011): "Customer Value: A Comparative Study of Rural and Urban Customers," Thesis, Kurukshetra University, Kurukshetra. ONLINE RESOURCES
Always indicate the date that the source was accessed, as online resources are frequently updated or removed. WEBSITES
Garg, Bhavet (2011): Towards a New Natural Gas Policy, Political Weekly, Viewed on January 01, 2012 http://epw.in/user/viewabstract.jsp

VOLUME NO. 3 (2013), ISSUE NO. 08 (AUGUST) ISSN 2231-5756
INTERNATIONAL JOURNAL OF RESEARCH IN COMMERCE, IT & MANAGEMENT A Monthly Double-Blind Peer Reviewed (Refereed/Juried) Open Access International e-Journal - Included in the International Serial Directories
http://ijrcm.org.in/
1
A COMPARATIVE FINANCIAL ANALYSIS OF INDIAN BANKING SECTOR IN CONTEXT OF NPA MANAGEMENT
ALPESH GAJERA ASST. PROFESSOR
DEPARTMENT OF M.B.A. SHRI SUNSHINE GROUP OF INSTITUTIONS
RAJKOT
DR. VIJAY PITHADIA DIRECTOR
SHRI H. D. GARDI COLLEGE OF MBA RAJKOT
ABSTRACT
NPA involves the necessity of provisions, any increase in which bring down the overall profitability of banks.NPA is the indicators of banking health in a country. In this present research paper, an attempt to evaluate the operational performance of the banking sector. i.e., all schedule commercial banks which are segregated into public sector banks, old private sector banks, new private sector banks and foreign sector banks NPAs trends and issues through secondary data. In the paper, it has been try to analyze how efficiently different sector banks have been managing NPA with various financial tools and techniques. All the Indian banks are facing hard time managing their NPA. The paper has been also derived findings from the analysis which is help to select banking sector for NPA management.
KEYWORDS NPA, Profitability, Trend, Financial tools.
INTRODUCTION Non-performing asset (NPA) is defined as a credit facility in respect of which the interest and/or installment of principal has remained ‘past due’ for a specified period of time. A loan or lease that is not meeting its stated principal and interest payments. Banks usually classify as nonperforming assets any commercial loans which are more than 90 days overdue and any consumer loans which are more than 180 days overdue. More generally, an asset which
is not producing income. RBI norms stipulate that where there is threat of loss or the recoverability of the advances is in doubt, the asset should be treated as NPA. Banks are prohibited to book income on accrual basis in respect of any security where the interest/ principal is in arrears for more than 90 days. In the present scenario, it has become all the more important for RBI’s mandatory inspection to act as an effective deterrent for banks not to resort to non-adherence to applicable prudential norms and less provisioning for NPAs. The present research paper focuses on NPA management in public sector, old private sector, new private sector and foreign sector banks.
LITERATURE REVIEWS Kalita (2004), in his article titled, “Post-1991 Banking Sector Reforms in India: Policies and Impact” stated that the banking sector reforms in India were started as a follow up measure of the economic liberalization and financial sector reforms in the country. Jain (2006), in his article titled, “Ratio Analysis: An Effective Tool for Performance Analysis in Banks” discussed various ratios relating to profitability of the banks. The author classified the various ratios under three categories, viz. Costing Ratio, Returns / Yield Ratio and Spread Ratios. Arora and Kaur (2006) made an attempt to review the performance of banking sector in India during the post-reforms period. Banking sector being an integral part of Indian financial system has undergone dramatic changes reflecting the ongoing economic and financial sector reforms. An article on NPA Management by B.M. Nandwana the deputy General Manager of Recovery department of Central Bank of India impact of NPA on Indian Banks. It gives the information regarding the norms of RBI and other code of conduct which bank have to follow to manage its NPA.
OBJECTIVES 1. To study the financial performance of schedule commercial banks in context of NPA. 2. To compare financial performance of public sector, old private sector, new public sector ban and foreign sector banks in context of NPA. 3. To analyze the financial performance of public sector, old private sector, new public sector ban and foreign sector banks against industry performance (all
schedule commercial banks) in context of NPA.
HYPOTHESES OF STUDY According to above objectives, the researcher have been framed the following hypotheses. H0 = There is no significant difference of NPA of all schedule commercial banks, public sector, old private sector, new public sector and foreign sector banks. (µ1= µ2= µ3= µ4= µ5) H0 = There is no significant difference in year to year performance of NPA of all schedule commercial banks, public sector, old private sector, new public sector and foreign sector banks. (µ1= µ2= ………. = µ15= µ16)
RESEARCH DESIGN THE SAMPLE The universe of the study consist all the public sector banks. For this research paper all commercial banks has been taken into consideration which are divided into four main categories. 1. Public sector banks 2. Old private sector banks 3. New private sector banks 4. Foreign sector banks THE DATA COLLECTION AND PERIOD OF THE STUDY The study has been carried out for a sixteen year, i.e., during 1996 – 97 to 2011 – 12. The reason behind selecting this period is best suitable for comparability when we are talking about Indian banking sector. The study is based on secondary data; the data has been collected from the website of database on Indian economy.
A

VOLUME NO. 3 (2013), ISSUE NO. 08 (AUGUST) ISSN 2231-5756
INTERNATIONAL JOURNAL OF RESEARCH IN COMMERCE, IT & MANAGEMENT A Monthly Double-Blind Peer Reviewed (Refereed/Juried) Open Access International e-Journal - Included in the International Serial Directories
http://ijrcm.org.in/
2
TOOLS AND TECHNIQUES As per the nature of study following tools and techniques are used for testing the hypotheses: • Tool:- Ratio Analysis • Statistical Techniques: - Mean, Standard deviation and ANOVA Test
DATA ANALYSIS & INTERPRETATION For analysis of NPA of SCBs four parameters has been selected which will be analyzed with the help of ANOVA Test GROSS NPA TO GROSS ADVANCE RATIO
TABLE 1
Year Schedule Commercial Banks Public Sector Banks Old Private Sector Banks New Private Sector Banks Foreign Banks
1996-97 15.7 17.8 10.7 2.6 4.3
1997-98 14.4 16 10.9 3.5 6.4
1998-99 14.7 15.9 13.1 6.2 7.6
1999-00 12.7 14 10.8 4.1 7
2000-01 11.4 12.4 10.9 5.1 6.8
2001-02 10.4 11.1 11 8.9 5.4
2002-03 8.8 9.4 8.9 7.6 5.3
2003-04 7.2 7.8 7.6 5 4.6
2004-05 5.2 5.5 6 3.6 2.8
2005-06 3.3 3.6 4.4 1.7 1.9
2006-07 2.5 2.7 3.1 1.9 1.8
2007-08 2.3 2.2 2.3 2.5 1.8
2008-09 2.3 2 2.4 3.1 1.8
2009-10 2.4 2.2 2.3 2.9 4.3
2010-11 2.4 2.3 2 2.3 2.5
2011-12 2.4 2.2 2.2 2.5 2.8
ANOVA
Source of Variation SS df MS F F crit
Rows 973.83 15 64.92 12.26 1.84
Columns 218.87 4 54.72 10.34 2.53
Error 317.66 60 5.29
Total 1510.36 79
From above ANOVA table one can take two conclusions as F is higher than F critical null hypothesis is rejected which indicates that there is significance difference in Gross NPA to advance ratio of selected sector banks. Another conclusion is there also significance difference in Gross NPA to advance ratio of selected sector banks in year to year performance. GROSS NPA TO TOTAL ASSETS RATIO
TABLE 2
Year Schedule Commercial Banks Public Sector Banks Old Private Sector Banks New Private Sector Banks Foreign Banks
1996-97 7 7.8 5.2 1.3 2.1
1997-98 6.4 7 5.1 1.5 3
1998-99 6.2 6.7 5.8 2.3 3.1
1999-00 5.5 6 5.2 1.6 3.2
2000-01 4.9 5.3 5.1 2.1 3
2001-02 4.6 4.9 5.2 3.9 2.4
2002-03 4.1 4.2 4.3 3.8 2.4
2003-04 3.3 3.5 3.6 2.4 2.1
2004-05 2.5 2.7 3.1 1.6 1.4
2005-06 1.8 2.1 2.5 1 1
2006-07 1.5 1.6 1.8 1.1 0.8
2007-08 1.3 1.3 1.3 1.4 0.8
2008-09 1.3 1.2 1.3 1.7 1.5
2009-10 1.4 1.3 1.3 1.6 1.6
2010-11 1.4 1.4 1.2 1.3 1
2011-12 1.3 1.4 1.3 1.4 1.2
ANOVA
Source of Variation SS df MS F F crit
Rows 160.63 15 10.71 10.91 1.84
Columns 48.15 4 12.04 12.27 2.53
Error 58.87 60 0.98
Total 267.64 79
From above ANOVA table one can take two conclusions as F is higher than F critical null hypothesis is rejected which indicates that there is significance difference in Gross NPA to total assets ratio of selected sector banks. Another conclusion is there also significance difference in Gross NPA to total assets ratio of selected sector banks in year to year performance.

VOLUME NO. 3 (2013), ISSUE NO. 08 (AUGUST) ISSN 2231-5756
INTERNATIONAL JOURNAL OF RESEARCH IN COMMERCE, IT & MANAGEMENT A Monthly Double-Blind Peer Reviewed (Refereed/Juried) Open Access International e-Journal - Included in the International Serial Directories
http://ijrcm.org.in/
3
NET NPA TO NET ADVANCE TABLE 3
Year Schedule Commercial Banks Public Sector Banks Old Private Sector Banks New Private Sector Banks Foreign Banks
1996-97 8.1 9.2 6.6 2 1.9
1997-98 7.3 8.2 6.5 2.6 2.2
1998-99 7.6 8.1 9 4.5 2.9
1999-00 6.8 7.4 7.1 2.9 2.4
2000-01 6.2 6.7 7.3 3.1 1.8
2001-02 5.5 5.8 7.1 4.9 1.9
2002-03 4 4.5 5.2 1.5 1.7
2003-04 2.8 3.1 3.8 1.7 1.5
2004-05 2 2.1 2.7 1.9 0.8
2005-06 1.2 1.3 1.4 0.8 0.8
2006-07 1 1.1 1 1 0.7
2007-08 1 1 0.7 1.2 0.8
2008-09 1.1 0.9 0.9 1.4 1.8
2009-10 1.1 1.1 0.8 1.1 1.8
2010-11 1 1.1 0.5 0.6 0.7
2011-12 1 1.1 0.6 0.7 0.8
ANOVA
Source of Variation SS df MS F F crit
Rows 335.27 15 22.35 12.76 1.84
Columns 80.94 4 20.24 11.55 2.53
Error 105.13 60 1.75
Total 521.35 79
From above ANOVA table one can take two conclusions as F is higher than F critical null hypothesis is rejected which indicates that there is significance difference in Net NPA to net advance ratio of selected sector banks. Another conclusion is there also significance difference in Net NPA to net advance ratio of selected sector banks in year to year performance. NET NPA TO TOTAL ASSETS RATIO
TABLE 4
Year Schedule Commercial Banks Public Sector Banks Old Private Sector Banks New Private Sector Banks Foreign Banks
1996-97 3.3 3.6 3.1 1 0.9
1997-98 3 3.3 2.9 1.1 1
1998-99 2.9 3.1 3.6 1.6 1.1
1999-00 2.7 2.9 3.3 1.1 1
2000-01 2.5 2.7 3.3 1.2 0.8
2001-02 2.3 2.4 3.2 2.1 0.8
2002-03 1.8 1.9 2.5 0.7 0.8
2003-04 1.2 1.3 1.8 0.8 0.7
2004-05 0.9 1 1.4 0.8 0.4
2005-06 0.7 0.7 0.9 0.4 0.4
2006-07 0.6 0.6 0.6 0.5 0.3
2007-08 0.6 0.6 0.4 0.7 0.3
2008-09 0.6 0.6 0.5 0.8 0.7
2009-10 0.6 0.7 0.5 0.6 0.7
2010-11 0.6 0.7 0.3 0.3 0.3
2011-12 0.6 0.7 0.4 0.4 0.5
ANOVA
Source of Variation SS df MS F F crit
Rows 48.91 15 3.26 11.89 1.84
Columns 16.36 4 4.09 14.92 2.53
Error 16.45 60 0.27
Total 81.72 79
From above ANOVA table one can take two conclusions as F is higher than F critical null hypothesis is rejected which indicates that there is significance difference in Net NPA to total assets ratio of selected sector banks. Another conclusion is there also significance difference in Net NPA to total assets ratio of selected sector banks in year to year performance
FINDINGS 1. Gross NPA compare to gross advance of public sector banks and old private sector banks is higher than new private sector banks and foreign sector banks. 2. Gross NPA compare to total assets of public sector banks and old private sector banks is higher than new private sector banks and foreign sector banks. 3. Net NPA compare to net advance of public sector banks and old private sector banks is higher than new private sector banks and foreign sector banks. 4. Net NPA compare to net assets of public sector banks and old private sector banks is higher than new private sector banks and foreign sector banks. 5. Form the analysis of all four parameter one of the important finding is over the year from 1996-97 to 2011-12 NPA is decreasing, which is considering as a
good sign for Indian banking sector.
REFERENCES 1. Arora, S.; and Kaur, S. (2006), “Financial Performance of Indian Banking Sector in Post-Reform Era”, The Indian Journal of Commerce, Vol.59, No.1, pp.96-
105.
VOLUME NO. 3 (2013), ISSUE NO. 08 (AUGUST) ISSN 2231-5756
INTERNATIONAL JOURNAL OF RESEARCH IN COMMERCE, IT & MANAGEMENT A Monthly Double-Blind Peer Reviewed (Refereed/Juried) Open Access International e-Journal - Included in the International Serial Directories
http://ijrcm.org.in/
4
2. Jain, V. (2006), “Ratio Analysis: An Effective Tool for Performance Analysis in Banks”, PNB Monthly Review, November, pp.27-29. 3. Kalita, B. (2004), “Post-1991 Banking Sector Reforms in India: Policies and Impact”, http://ssrn.com/abstract=1089020. 4. Report on Trend and Progress of Banking in India 2010-2011. WEBSITES 5. www.dbie.rbi.org.in 6. www.rbi.org.in

VOLUME NO. 3 (2013), ISSUE NO. 08 (AUGUST) ISSN 2231-5756
INTERNATIONAL JOURNAL OF RESEARCH IN COMMERCE, IT & MANAGEMENT A Monthly Double-Blind Peer Reviewed (Refereed/Juried) Open Access International e-Journal - Included in the International Serial Directories
http://ijrcm.org.in/
5
IMPACT OF INFORMATION COMMUNICATION TECHNOLOGY (ICT) ON EMPLOYEES PERFORMANCE: A STUDY OF MTN NIGERIA TELECOMMUNICATION LIMITED
DR. ADEWOYE, JONATHAN OYERINDE ASSOCIATE PROFESSOR & DEPUTY DEAN
DEPARTMENT OF MANAGEMENT & ACCOUNTING FACULTY OF MANAGEMENT SCIENCES
AKINTOLA UNIVERSITY OF TECHNOLOGY OGBOMOSO
ABSTRACT
ICT and employee performance may be regarded as complementary factors. To be successful, firms typically need to adopt ICT as part of a “system” or “cluster” of mutually reinforcing organizational approaches. It was in line with this that this research work aim at examining the impact of information and communication technology (ICT) on employee performance-a study of MTN Nigeria telecommunication limited. The study was carried out in Lagos state with One hundred and twenty (120) Questionnaires administered and distributed to both senior & junior staff of the organizations, eighty two (82) Questionnaires were found useful for the purpose of the study representing 85% of the total questionnaire distributed. Data collected was analyzed using frequency table, percentage and mean score analysis while the non-parametric statistical Pearson Correlation Coefficient was used to test the formulated hypothesis using STATA 10 data analysis software to examine the impact of ICT on employee performance and also to look at the relationship between ICT and employee performance respectively. However, the results of the findings shows that ICT practices produce a skilled and motivated work force that can adapt to and take advantage of new technologies and changing markets. ICT practices cover a range of personnel management areas including performance-based pay, job rotation, flexible job designs, employee involvement, skills training, and communication procedures. To this end, it is recommended that investment in organization and human resources skills is crucial in achieving higher levels of employee performance and business management goals.
KEYWORDS Employee Involvement, Employee Performance, Job Rotation, ICT.
1.0 INTRODUCTION he world has been revolutionized by the rapid development and implementation of Information and Communication Technology (ICT). Therefore, ICT combines the disciplines of information technology and communication technology. The digital conversion of these two technologies leads to data transmission through the Internet. Likewise, the adoption of ICT is expected to influence all fields including labor relations and creation of employment in
labor market, the labor process, quality of labor, and eventually income distribution. As such, systematic research on the relationship between ICT and employee performance is of paramount importance. In recent decades, Information and Communication Technologies (ICT) such as computer terminals, e-mail and the Internet and their applications have become the major drivers of innovation, growth and social change. Moreover, Colecchia and Schreyer (2001) pointed out that, in times of crisis there must be a focus on the contribution of ICT to innovation and growth. The ongoing diffusion of new ICT and e-business technologies among firms is a current example of the dynamics of technological change and economic development (Koellinger 2006). Economic theory suggests that the diffusion of new technologies can have far reaching consequences. Most fundamentally, it may change the type of products and services that are offered and traded and it may change the production costs of existing products. Hence, virtually all economic spheres can be affected by such changes, including innovation dynamics, productivity and growth, the development of market structures, firm performance, and the demand for certain types of labor. Therefore, Organizations that continuously improve quality, recruit skilled employees and train employees within the ICT environment do better than others and have competitive advantages. In a similar vein, OECD (2002) argues that ICT improves employee’s performance by enabling organizational innovation. The greatest benefits from ICT appear to be realized when ICT investment is combined with other organisational assets, such as new strategies, new business processes, new organisational structures and better employees skills. Empirical evidence suggests that organizational changes may improve employee performance through their mutually-reinforcing relationship with ICT. OECD (2002) argues further that ICT is key to facilitating new organisational approaches, from lean production to teamwork to customer relations. Also, ICT enable firms to introduce significant organisational changes in the areas of re-engineering, decentralization, flexible work arrangements and outsourcing. It allows firms to produce with greater flexibility and shortened product cycles to satisfy shifting consumer preferences. In fact, ICT and employee performance may be regarded as complementary factors. To be successful therefore, firms typically need to adopt ICT as part of a “system” or “cluster” of mutually reinforcing organizational approaches (Milgrom and Roberts, 1990). Fundamentally, information and communication technology (ICT) has received a great deal of attention, not only from the academic field, but also from the business world, because of its implementation in an increasing number of companies. Nevertheless, the results found in the literature are contradictory. There is still some degree of theoretical consensus about the existence of a positive relationship between ICT and employees performance. In particular, some authors argue that the implementation of ICT provides higher productivity, more satisfaction for the customer, more value creation, etc. Other authors have found null or negative ICT effects on benefits, yield and share value. However, recently there is a growing new evidence that ICT adoption would generate positive return on labour productivity but these returns will vary among firms, depending on differences in region, characteristics, organizational and human resources. It is generally accepted that ICT alone is not a panacea and there still a debate about how ICT adoption can improve firms performance. On this note, more research is still needed in developing countries like Nigeria where there is dearth of data and research on the impact of ICT on organizational performance in terms of improved labour productivity. More research is needed based on data from the country to ascertain how and when ICT adoption will increase labour productivity or production efficiency Thus the main objective of this paper is to examine the impact of ICT on employee performance in the telecommunication industry. However, the study will answer the following research questions;
Is there any relationship between ICT and employee performance?
How does the use of ICT influence the performance of employee in an organisation? The null hypotheses below were generated in an attempt to develop findings about the variables. H0: there is no significant relationship between Information Communication Technology (ICT) and employee performance
2.0 LITERATURE REVIEW According to Prasad and Harker, (1997), Information Communication Technology (ICT) is the acquisition, dissemination, processing and storage of numerical, vocal, textual and pictorial information by a microelectronics-based combination of computing and telecommunications. ICT plays a dominant role in our present environment, enabling humans to understand the increasingly technological changing society. ICT provides learners with understanding, skills and scientific
T

VOLUME NO. 3 (2013), ISSUE NO. 08 (AUGUST) ISSN 2231-5756
INTERNATIONAL JOURNAL OF RESEARCH IN COMMERCE, IT & MANAGEMENT A Monthly Double-Blind Peer Reviewed (Refereed/Juried) Open Access International e-Journal - Included in the International Serial Directories
http://ijrcm.org.in/
6
knowledge needed for scientific research, fostering technological and economic growth in the society, where they live thus improving the standards of living. However, ICT also enables learners to acquire problem-solving and decision-making skills that provides ways of thinking and inquiry which helps in radical changes. Basically, there have been many challenges and variations in the forces for globalization during the last decade. One that has garnered substantial attention over the past few years is concerned with the impact of information and communication technology on employee performance (OECD, 2004). The widespread diffusion of the Internet, the mobile phone and the broadband networks shows how pervasive these technologies have become. According to much theoretical and empirical evidence, ICT offers benefits for a wide range of business processes and improves information and knowledge management within the firm, leading to better performance. Firms can manage their processes more efficiently and, as a consequence, they increase their operational efficiency. Moreover, ICT reduces the coordination costs of the firm because of lower procurement and inventory costs and closer coordination with suppliers (Tachiki et al., 2004; OECD, 2003, 2004). In addition, communication based on ICT and the Internet can also improve external communication, reducing the inefficiencies resulting from lack of co-ordination between firms, and increasing the speed and reliability of information processing and transfer. In general, ICT reduces transaction and coordination costs, maximizing the value of the transactions (OECD, 2004). However, according to the literature review on the impact of ICT at the firm level, we can confirm the diversity of theoretical approaches and empirical evidence on the role of ICT in the improvement of the employee performance. Much of the early literature on ICT, mainly in the 1980s and early 1990s, theoretically justified the advantages of information technologies, but they obtained contradictory empirical evidence, especially weak or with no link between ICT and employee performance (Brynjolfsson, 1993). 2.0.1 ICT AND FIRMS PERFORMANCE The impacts of ICT on employee performance are subject to debate because not all studies have demonstrated clear payoffs from ICT investments (Chan, 2000, Kohli and Devaraj, 2003). Also, the results vary depending on how employee performance and ICT payoffs are measured and analyzed. For example, one empirical study finds positive impacts of ICT investments on employee performance, but not on profits (Harris, S.E. and Katz, J.L. 1991). Another study did not find positive effects of ICT capital on employee performance, while ICT labor positively contributed to output and profitability (Prasad and Harker, 1997). An analysis of the profitability of ICT investments in an empirical study that explicitly considered the competitive dynamics in a market showed that the profits of non-adopters of ICT are reduced as other organizations that adopt new ICT. Furthermore, the gross profit gains of ICT adoption are related to firm and industry characteristics and the number of other users of the technology (Stoneman and Kwon, 1996). Along similar lines, another study suggests that early adopters of ICT are likely to benefit, but once the technology becomes common the competitive advantage is lost (Weill, 1992). These somewhat ambiguous results on the impact of ICT on employee performance can be explained if we drop the assumption that there is a direct link between ICT investments and employee performance. In other words, the new economy mantra “more ICT equals better performance” must be rejected. Instead, a more comprehensive approach is needed to explain these findings. However, recently empirical literature has begin to re assess the association between ICT ,productivity and a wide range of complimentary factors.(Arvanitis and Loukis, 2009; Aral and Weill, 2007) It was agreed that in order for ICT to be properly utilized , it must be used in conjunction with complimentary resources such as organizational structure, human and organizational resources.( Peppard and Ward, 2004; Aral et. al., 2010). On this note, this paper aim to examine the impact of ICT on employee performance in the telecommunication industry in Nigeria 2.0.2 EMPLOYEE PERFORMANCE Employee's performance is a rating system used in most corporations to determine the abilities and output of an employee. Performance is divided into five components: Planning, monitoring, developing, rating and rewarding. In the planning stage, goals are set to help measure the employee's work time to see if they are able to maintain the goals set or reach new goals. Monitoring is the phase in which the goals are looked at to see how well one is doing to meet them. This can also be a feedback stage in which employers determine if progress is being seen or not. During the developing stage an employee is supposed to improve any poor performance that has been seen during the time frame one has been working within the organization. Generally employee's performance ratings are given out each year. The rating is to summarize the performance based on a number system to determine where on the scale a person is. At the end of the cycle is rewarding stage. This stage is designed to reward and recognize outstanding behavior such as that which is better than expected. Organisation sees employee's performance as a way to appraise the employee for their effectiveness in the company. 2.0.3 INFLUENCE OF ICT’S ON EMPLOYEE PERFORMANCE What precisely are the impacts that ICT can have on employee performance and growth? Three effects can be distinguished. Firstly, as a capital good, investment in ICT contributes to overall capital deepening and therefore helps raise labour productivity. Secondly, rapid technological progress in the production of ICT goods and services may contribute to more rapid multifactor productivity (MFP) growth in the ICT-producing sector. And thirdly, greater use of ICT may help firms increase their overall efficiency, and thus raise MFP. Moreover, the application of ICT may contribute to network effects, such as lower transaction costs, higher productivity of knowledge employee and more rapid innovation, which will improve the overall efficiency of the Organisation. However, organisation uses ICT practices as a strategic tool to achieve business objectives such as cost reduction as well as product development. ICT practices produce a skilled and motivated work force that can adapt to and take advantage of new technologies and changing markets. ICT invention cover a range of personnel management areas including performance-based pay, job rotation, flexible job designs, employee involvement, skills training, and communication procedures. 2.0.3.1 PERFORMANCE-BASED PAY: This links employees’ pay in part to either the performance of the firm, or individual performance. It is designed to strengthen employee incentives and increased trust and commitment. There are many ways to relate pay to performance: individual incentive systems, productivity/quality gain sharing and other group incentives, profit sharing and merit pay, and skill-based pay. There is ample evidence to suggest that performance-based pay can help motivate, attract and retain outstanding performers (Lawler et. al., 1998). Performance-based pay is being used by substantial firms, particularly companies which are implementing a range of organizational changes (OECD, 2002). 2.0.3.2 FLEXIBLE JOB DESIGN AND EMPLOYEE INVOLVEMENT: A key objective of ICT policies is to get employees more involved in their jobs. Freeman, et al. (2000) argue that many organisation use ICT policies such as self-directed teams, quality circles, profit sharing, and diverse other programs, to involve employees in their jobs. ICT practices such as teamwork and job rotation seem to raise skill demands primarily for behavioral and interpersonal skills such as the ability to get along with others and work in teams (Cappeli and Neumark, 1999). In this paper, we consider a number of individual ICT practices including employee suggestion programs, flexible job design and job rotation, job enrichment/enlargement, and job redesign, information sharing with employees, quality circles and problem-solving teams, self-directed work groups, and joint labour management committees. 2.0.3.3 DEVELOPING EMPLOYEE SKILLS: ICT practices focus on “high skill” strategies that make better use of and continuously renew human capital (OECD, 1998). In any organisation, work requires creative thinking, self-motivation, and academic basics. Problem-solving, decision-making, business, financial, negotiating, and interpersonal skills, in addition to technical skills are essential for employee (Newton, 1996). A recent OECD (2002) study notes that firms are now developing their own customized training strategies, which are increasingly on-line. Some large firms are involved in setting up corporate universities using ICT technologies and offering some combinations of satellite-based learning, web based training, virtual reality and virtual campuses, sometimes in conjunction with more traditional methods. ICT are playing a key role in the growth of customer relations management (CRM) practices. For example, to communicate with clients, sales forces in the field are supplemented by interactive web sites and call centres. In addition, advanced database technology, world-wide web integration, sales force automation and multi-media-based front office applications are emerging as key elements of CRM. Evidence from surveys of managers and case study literature shows that the most important reasons for investing in ICT are product quality improvements, especially customer service, timeliness, and convenience (Bresnahanet.al., 2002).

VOLUME NO. 3 (2013), ISSUE NO. 08 (AUGUST) ISSN 2231-5756
INTERNATIONAL JOURNAL OF RESEARCH IN COMMERCE, IT & MANAGEMENT A Monthly Double-Blind Peer Reviewed (Refereed/Juried) Open Access International e-Journal - Included in the International Serial Directories
http://ijrcm.org.in/
7
2.0.4 FACTORS AFFECTING THE IMPACT OF ICT ON EMPLOYEE PERFORMANCE The effects of Information Communication Technology (ICT) is far reaching and cannot be overemphasized. The impact of ICT looks at how our lives have been changed, for better and for worse, by the impact of ICT. It includes both positive effects and negative effects and examine at how individuals, organisations and society are affected. However, these effects occur primarily, or only, when accompanied by other changes and investments, including investment in skills and organisational change. This is also confirmed by many empirical studies that suggest that ICT primarily affects firms where skills have been improved and organisational changes have been introduced. The role of these complementary factors was raised by Bresnahan and Greenstein (1996), who argued that users help make investment in technologies, such as ICT, more valuable through their own experimentation and invention. Without this process of "co-invention", which often has a slower pace than technological invention, the economic impact of ICT may be limited. Aral et, al., (2010) observed that to achieve a more competitive position the firm should complement ICT investments with an appropriate use of these technologies, for implicit technology resources are required. It is the complimentary investments in labor skills, organization change and innovation that are essential to making these technologies work. This section looks at some of the factors that affect the uptake of ICT and the main complementary factors for ICT investment. Cost: the cost of using ICT may cause a number of problems for organisations. A lot of ICT hardware and software is expensive, both to purchase and to maintain. An ICT system usually requires specialist staff to run it and there is also the challenge of keeping up with ever-changing technology. These extra costs should be offset by the positive effects of using ICT, but if an organisation gets its cost-benefit analysis wrong it may lose money. Competition: this is usually thought of as being a good thing, but for some organisations being exposed to greater competition can be a problem. If the organisation is competing for customers, donations, or other means of funding nationally or even internationally, they may lose out to other organisations that can offer the same service for less money. Security: this is always a problem for any organisation that uses ICT. Data must be kept secure, Internet connections must be protected from attack, new viruses and other forms of malware are released nearly every day. Organisations will usually have legal obligations to protect data such as customer information. Even if the organisation does not have to comply with a specific data protection law it will usually be in the organization’s interest to protect data from rivals. 2.0.5 ORGANISATIONAL CHANGE IS KEY TO MAKING ICT WORK Closely linked to human capital is the role of organisational change. Studies typically find that the greatest benefits from ICT are realized when ICT investment is combined with other organisational changes, such as new strategies, new business processes and practices and new organisational structures. Several studies with official statistics have addressed this link to human capital and organisational change. For example, Black and Lynch (2001) found that the implementation of human resource practices is important for productivity, e.g. giving employees greater voice in decision-making, profit-sharing mechanisms and new industrial relations practices. In another study (2000), they found that firms that re-engineer their workplaces to incorporate high-performance practices experience higher productivity and higher wages.
3.0 METHODOLOGY The theoretical population of this study consist the whole GSM telecommunication companies operating in Nigeria. The regulatory body which is Nigerian Communication Commission (NCC) has divided the Operators into Four (4) different categories i.e. MTN Nigeria, Globacom ltd, Airtel and Etisalat telecommunication limited respectively. Therefore, for the purpose of this study, the researcher restricted to MTN Nigeria telecommunication limited only in the above categories. The sampling frame of this study comprises of senior and junior staff in the relevant departments of the above selected GSM operators in Nigeria. The selection of companies was done using purposive sampling while staffs were selected at random. One hundred and sixty (120) Questionnaires were administered and distributed to the staff of the MTN Nigeria limited. Eighty two (82) were found useful for the purpose of the study representing 85% of the total questionnaire distributed. The major instrument used in the collection of data for this research work was questionnaire. The questionnaire consists of questions that are related to the impact of ICT on employee performance as identified in the literature. Likert five point scales ranging from 1-5 (strongly agree=5, agree=4, undecided=3, disagree=2, strongly disagree=1) were used as a basis of the questions. Data collected was analyzed using frequency table, percentage and mean score analysis while the non-parametric statistical- Pearson correlation coefficients was used to test the formulated hypothesis using STATA 10 data analysis package/software.
4.0 RESULTS AND DISCUSSIONS Table1 below reveals that, 61.0% of respondents were male, and 39.0% were females. Therefore, it shows that majority of the staff in the sample organization are males. Similarly, the table shows that 32.93% of the respondents were aged between 25-35, 26.83% of the respondents were aged 36-45, 40.24% of the respondents were aged between 46-55, and none was between 56 and above. Hence the data above shows that majority of the respondents were of between 25-35 years. However, in addition, the table signifies that 57.30% of the respondents were between level 1 & 2, while 42.70% were in cadre of level 3-4. Finally, the table support that most of the respondents are between 1-3 years in service with 45.1%. Hence this shows that majority of the respondents have not served the sector for a long time.
TABLE1: FREQUENCY AND MEAN SCORE DISTRIBUTION OF RESPONDENT DEMOGRAPHIC PROFILE
Variables Number Percentage Cumulative Percentage
Sex: Male Female
50 32
61.0 39.0
61.0 100.0
Age: 25-35 36-45 46-55 56 & Above
27 22 33 0
32.93 26.83 40.24 00.00
32.93 59.76 100.00 100.00
Staff Status: Level 1-2 Level 3-4
47 35
57.30 42.70
57.3 100.00
Year of Service: Below 1 year 1-3 4-6 7-8
10 37 27 8
12.2 45.1 32.9 9.8
12.20 57.3 90.2 100.00
Source: Author’s Field Survey (2013) STATA10

VOLUME NO. 3 (2013), ISSUE NO. 08 (AUGUST) ISSN 2231-5756
INTERNATIONAL JOURNAL OF RESEARCH IN COMMERCE, IT & MANAGEMENT A Monthly Double-Blind Peer Reviewed (Refereed/Juried) Open Access International e-Journal - Included in the International Serial Directories
http://ijrcm.org.in/
8
H0: there is no significant relationship between Information Communication Technology (ICT) and employee performance.
Hypotheseis No of Respondents Mean Standard Deviation Pearson Correlation
Relationship between ICT and Employees performance. 82 4.1199 0.8512 +0.8307
a. Predictors: (constant), ICT-Information Communication technology b. Dependent variable: Employees performance
Source: Stata 10 Printout, 2013 ANALYSIS OF THE HYPOTHESIS The above table shows that the average mean for the hypothesis is 4.1199. This falls within the categories of agree and the standard deviation is 0.8512, which is less than 1. This implies that majority were in support of the statement that there is a relationship between ICT and employee performance. However, the correlation coefficient is +0.8307 and that most of the variables within the group are correlated. We therefore reject the null hypothesis (Ho) and accept the alternative hypotheses (H1) which state that there is a correlation between ICT and employee performance.
TABLE 2: LIST OF STATEMENT AND CORRESPONDING RESPONSES ON THE IMPACT OF ICT ON EMPLOYEE’S PERFORMANCE
S/N STATEMENT RESPONSE
RELATIONSHIP BETWEEN ICT AND EMPLOYEE PERFORMANCE SA A UD D SD
1 Deployment of technology has increased employee performance over time? 55% 40% 5% - -
2 An organization with ICT has competitive advantage over other firms without ICT? 35% 50% 10% 5% -
3 Introduction of ICT tend to bring about staff reduction in an organization? 3% 7% 5% 39% 46%
4 ICT does not positively influence service delivery of employee performance? - - - 25% 75%
5 Introduction of new technology enhance employees performance? 33% 46% 15% 4% 2%
6 ICT create more job opportunity within and outside the organization? 52% 37% 6% 2% 3%
7 Work performance of employees depends on the type of ICT availability? 41% 48% 8% 3% -
8 The use and adoption of ICT has increased the skills and efficiency of employee’s performance? 38% 53% - 5% 4%
9 ICT work environment has a great impact on employees work performance? 26% 33% 15% 13% 13%
10. Cost, security and competition are factors affecting ICT within an organization? 59% 36% 5% - -
Source: Author’s Computation, 2013 THE IMPACTS OF ICT ON EMPLOYEE PERFORMANCE From the Table 2 above, the response shows that (55%) of the total respondents strongly agreed; 40% of them agreed, and 5% of the respondent are undecided to the motion that the deployment of ICT increase employee performance. Hence, this shows that there is a positive relationship between ICT and employee performance. However, the table indicate that an appreciable number of respondents, i.e. (35%) of the respondents strongly agreed that an organization with ICT has competitive advantage over other firms without ICT, (50%) of them agreed, (10%) undecided, while (5%) also disagreed to the motion. Also, the table2 indicate that a large number of respondents, i.e. (46%) of the respondents, strongly disagree that Introduction of ICT tend to bring about staff reduction in an organization, (39%) of them disagreed, while (5%), (7%) and (3%) were undecided, agree and strongly agree respectively motion. Subsequently, the statements that ICT does not positively influence service delivery of employee performance was strongly disagreed by (75%) and 25% disagree respectively by respondents. Furthermore, 33% of the respondents strongly agreed, 46% agreed, 15% were undecided; another 4% disagreed, while the last 2% strongly disagreed that Introduction of new technology enhance employees performance. Hence, this show that majority is of the opinion that there is a whole lot of positive intervention of ICT on employee performance in an organization. Similarly, from table2, 52% of the respondents strongly agreed that ICT create more job opportunity within and outside the organization, 37% agreed, 6% undecided, 2% disagree, while 3% strongly disagreed to it. Hence, it is concluded that ICT create more jobs for employees in and out of the organization. Likewise, 41% of the respondents strongly agreed, 48% agreed, 8% were undecided and 3% disagree that work performances of employee depends on the type of ICT availability. Hence, these signify that majority support that work performance of employee depends on the type of ICT availability. Also, 38% of the respondents strongly agreed, 53% agreed, 5% disagree while 4% were strongly disagree the use of ICT has increased the skills and efficiency of employee. Hence, the majority respondents signify that increased in employee skills and efficiency largely depends on ICT use. Also the Table2 indicate that 26% of the respondents strongly agreed, 33% agreed, 15% undecided, 13% disagreed, and while 13% strongly disagree that ICT work environment has a great impact on employees work performance. Hence, the majority respondents imply that the introduction of ICT work environment will have impact on employee performance at work. Finally 59% of the respondents strongly agree, 36% agree, while 5% were undecided that cost, security and competitions are some of the factors affecting ICT within an organization. Hence majority believes that ICT can be marred with these aforementioned factors.
5.0 CONCLUSION The main goal of this research has been to gain a better comprehension of how information and communication technologies (ICT) impact employee’s performance, and of the importance of other complementary factors. Since there are few studies that investigate the impact of ICT on employee’s performance, as a result these present study attempts to fill this gap. The invention of ICT over the past decade as a key technology has the potential to transform economic and social activity. It has already led to more rapid growth in organisations where appropriate policies to reap the benefits from ICT have been put in place. Indeed, economic performance is not the result of a single policy or institutional arrangement, but a comprehensive and co-ordinated set of actions to create the right conditions for future change and innovation. Policies to strengthen economic and social fundamentals are thus of over-riding importance in drawing the benefits from ICT. The result of the findings and the hypothesis tested showed that introduction of ICT in an organization, has a positive impact on employee performance in areas like, performance-based pay, job rotation, flexible job designs, employee involvement, skills training, and communication procedures. However, the empirical evidence offered highlights the need to consider organizational aspects, such as human resources and strategic adjustment, in order to raise the potential benefits of ICT. According to this evidence, we conclude that investment in organization and human resources skills is crucial in achieving higher levels of employee performance. Business management capabilities are growing in importance, rather than ICT alone. Thus, we can make certain practical recommendations that will be useful for all responsible agents in the management of ICT and other complementary factors. Future prospects are also favorable. To a large extent, this is in the hands of firms and depends on the extent to which they choose to further develop their business strategies and capabilities. There are some specific issues that governments should continue to address. However, because the factors affecting ICT use and productivity gains are complex and diffuse, the appropriate stance for governments is largely to ensure that the general business environment supports the innovative use of ICT.
REFERENCES 1. Aral, S Brynjolfsson, E and Wu, L. (2010). Assessing Three-way complimentaries: Performance Pay, Monitoring and Information Technology. Management
science, Forthcoming. Available at SSRN: http://ssrn.com/abstract=1665945.

VOLUME NO. 3 (2013), ISSUE NO. 08 (AUGUST) ISSN 2231-5756
INTERNATIONAL JOURNAL OF RESEARCH IN COMMERCE, IT & MANAGEMENT A Monthly Double-Blind Peer Reviewed (Refereed/Juried) Open Access International e-Journal - Included in the International Serial Directories
http://ijrcm.org.in/
9
2. Aral, S. and Weill, P (2007). IT Assets, Organizational Capabilities and Firm Performance: How resource Allocations and Organizational Differences Explain Performance Variation. Organisation Science, Vol. 18, No.5, pp. 1-18.
3. Arvanitis , S, and Loukis , E.(2009). Information and Communication Technologies, Human Capital, Workplace Organisation and labour Productivity: A Comparative Study based on Firm-level Data for Greece and Switzerland, Information Economics and Policy, Vol. 21, No . 1, pp43-61.
4. Black, S.E. and L.M. Lynch (2001). “How to compete: the impact of workplace practices and information technology on productivity”, The Review of Economics and Statistics, August, Vol. 83, No. 3, pp. 434-445.
5. Bresnahan, F.B., and M. Trajtenberg (1995). “General Purpose Technologies, ‘Engine of Growth’’ Journal of Econometrics, 65:83-108. 6. Bresnahan, T.F. and S. Greenstein (1996). "Technical Progress and Co-Invention in Computing and the Use of Computers", Brookings Papers on Economic
Activity: Microeconomics, pp. 1-77. 7. Brynjolfsson, E. (1993). The Productivity Paradox of Information Technology. Communications of the ACM, Vol.36, No.12, pp. 66-77. 8. Chan, Y., (2000). IT values the great divide between qualitative and quantitative and individual and organizational measures. Journal of Management
Information Systems 16(4), 225-261. 9. Colecchia, A. And P. Schreyer (2001). “The Impact of Information Communications Technology on Output Growth”, STI Working Paper 2001/7, OECD,
Paris. 10. Harris, S.E. and Katz, J.L. (1991). Organizational performance and information technology investment intensity in the insurance industry. Organization
Science 2(3), 263-295. 11. Koellinger, P. (2006). Technological Change - An Analysis of the Diffusion and Implications of e-Business Technologies. Humboldt-Universitätzu Berlin,
http://edoc.huberlin. 12. Kohli, R. and Devaraj, S. (2003). Measuring information technology payoff: A meta- analysis of structural variables in firm-level empirical research.
Information Systems Research 14(2), 127-145. 13. Milgrom, P. and J. Roberts (1990). “The Economics of Modern Manufacturing: Technology, Strategy, and Organization,” American Economic Review, 80(3),
pp. 511-528. 14. Newton, K. (1996). “The Human Factor in Firms’ Performance: Management Strategies for Productivity and Competitiveness in the Knowledge-Based
Economy,” Industry Canada, Occasional Paper No. 14, Nov. 15. Organisation for Economic Cooperation and Development (1998). High-Performance Workplaces and Intangible Investment, Paris. (OECD). 16. Organisation for Economic Cooperation and Development (2002). Organizational Change and Firm Performance, DSTI/DOC (2002)14, Paris. 17. Organisation for Economic Cooperation and Development (2002). Organizational Change and Firm Performance, DSTI/DOC (2002)14, Paris (OECD). 18. Organisation for Economic Cooperation and Development (2003). ICT and Economic Growth - Evidence from OECD Countries, Industries and Firms OECD,
Paris. ISBN 92-64-10128-4. 19. Organisation for Economic Cooperation and Development (2004). The Economic Impact of ICT Measurement, Evidence and Implications. Organisation for
Economic Co-operation and Development, Paris. Available at: http://www1.oecd.org/publications/e-book/9204051E.PDF (OECD). 20. Peppard, J. and Ward, J. (2004). Beyond Strategic Information Systems: Towards an IS Capability. Journal of Strategic Information Systems. Vol.13, pp 167-
194. 21. Prasad, B. and Harker, P.T. (1997). Examining the contribution of information technology toward productivity and profitability in U.S. retail banking.
Wharton School Working Paper 97-07, University of Pennsylvania, Philadelphia. 22. Stoneman, P. and Kwon, M.J. (1996). Technology adoption and firm profitability. Economic Journal 106(437), 952-962. 23. Tachiki, D., Hamaya, S. and Yukawa, K. (2004). Diffusion and Impacts of the Internet and Ecommerce in Japan Center for Research on Information
Technology and Organizations (CRITO). Globalization of I.T. Paper 339. 24. Weill, P. (1992). The relationship between investment in information technology and firm performance: A study of the valve manufacturing sector.
Information Systems Research 3(4), 307-333.

VOLUME NO. 3 (2013), ISSUE NO. 08 (AUGUST) ISSN 2231-5756
INTERNATIONAL JOURNAL OF RESEARCH IN COMMERCE, IT & MANAGEMENT A Monthly Double-Blind Peer Reviewed (Refereed/Juried) Open Access International e-Journal - Included in the International Serial Directories
http://ijrcm.org.in/
10
KNOWLEDGE INCUBATION PRACTICES PREVALENT IN HIGHER EDUCATION SYSTEM: A REVIEW OF SELECT PRIVATE INSTITUTIONS IN BANGALORE
DR. A ELANGOVAN PROFESSOR & HEAD
DEPARTMENT OF COMMERCE PERIYAR UNIVERSITY
SALEM
VALARMATHI.B ASST. PROFESSOR
DEPARTMENT OF COMMERCE CHRIST UNIVERSITY
BANGALORE
ABSTRACT Knowledge is the understanding, insight, experience one posses. Knowledge management practice involves basically five stages namely knowledge incubation, knowledge deposition, knowledge dissemination, knowledge evaluation and knowledge application. Knowledge incubation is a process how higher educational institutions acquire, or create knowledge. The private sector has played an instrumental role in this growth, with private institutions now accounting for 64% of the total number of institutions and 59% of enrollment in the country, as compared to 43% and 33%, respectively, a decade ago. This study focuses on how private institutions are involved in the process of incubating knowledge. Higher education being knowledge economy has to work towards updating its knowledge base. All sectors look up to educational institutions to bring a change in the system they function. The study highlights how private institutions are constantly involved in the process of creating knowledge, to enhance the quality to information it possess.
KEYWORDS higher educational institutions (HEI), knowledge incubation, professional network Public institutions, private institutions.
INTRODUCTION ndia has one of the largest higher education systems in the world, and has witnessed growth in its number of institutions and enrollment in the last few decades. The private sector has played an instrumental role in this growth, with private institutions now accounting for 64% of the total number of institutions and 59% of enrollment in the country, as compared to 43% and 33%, respectively, a decade ago. Private institutions lead in terms of number of
institutions and student enrollment. The importance of knowledge as a strategic source of competitive advantage (Appelbaum and Gallagher, 2000; Karma, 2006; Petruzzelli, 2008) Knowledge-based economies are said to be economies which are directly based on the production, distribution and use of knowledge and information, and the term „knowledge-based economy' emphasizes a fuller recognition of the role of knowledge and technology in economic growth (OECD, 1996). To stay competitive, HEIs must be able to rely on data, information and knowledge about the changing environments and external pressures, as well as their internal core competencies to effectively achieve their mission. The fact of the matter, contends Stankosky (2005), is that we live in a knowledge-based-economy, where knowledge assets are the principal factors of production, and nations and organisations have to deal with knowledge assets, if they want to attain a competitive advantage. (KM) refers to a system of acquiring, creating, applying, storing and disseminating knowledge to every individual to achieve institutional objectives. Knowledge management is essential for ensuring quality in higher education. Educational institution has ample opportunity to manage the intellectual resources available to achieve the set goal.
Source: Ministry of Education of People’s Republic of China, Twelfth Five Year Plan: Chapter on higher education, UNESCO: Global Education Digest 2011. National Center for Education Statistics USA .
MEANING OF KM According to Swan et al. 1999 “.... Any practice of creating, acquiring, capturing, sharing and using knowledge, wherever it resides, to enhance learning and performance in organisations”. or “Knowledge Management refers to an enterprise that consciously and comprehensively gathers, organizes, shares and analyzes its knowledge to achieve its goals.” TYPES OF KNOWLEDGE Explicit Knowledge: Expressed in words and numbers and shared in the form of data, scientific formulae, product specifications, articles and manuals, universal principles, reports, patents, pictures, video images, software, and so forth. Deeply rooted in an individual's action and experience, subjective and personal insights, intuitions, etc. Tacit Knowledge a) Technical Dimension- Informal and hard-to-pin-down skills or crafts. b) Cognitive Dimension-Beliefs, perceptions, ideals, values, emotions and mental models.
OBJECTIVES OF THE STUDY To find out whether knowledge is acquired through professional networks in private institutions. To understand whether private institutions are willing to update knowledge through journals, hiring new staff, and handbooks. To analyze whether they undertake research to develop knowledge base.
RESEARCH METHODOLOGY REASEARCH DESIGN The study is conducted with the help of investigative questionnaire distributed to faculty members of select private institutions in Bangalore. SAMPLE DESIGN Convenient sampling technique is used to select respondents from private institutions which are accredited with ‘A’ grade by NAAC.100 faculty members from five private institutions were selected.
I

VOLUME NO. 3 (2013), ISSUE NO. 08 (AUGUST) ISSN 2231-5756
INTERNATIONAL JOURNAL OF RESEARCH IN COMMERCE, IT & MANAGEMENT A Monthly Double-Blind Peer Reviewed (Refereed/Juried) Open Access International e-Journal - Included in the International Serial Directories
http://ijrcm.org.in/
11
KNOWLEDGE INCUBATION/CREATION Knowledge creation, which is considered to be the most important process in knowledge management. Only if the institutions create and incubate knowledge it can be stored and transferred to all the members of institutions. Knowledge creation involves developing, or replacing old knowledge with, new knowledge (Nonaka, 1994). In addition, Nonaka and Takeuchi (1995) contend that knowledge creation involves addition to knowledge , or the correction of the existing knowledge. This study focuses only on five main activities for knowledge incubation. They are 1. Institutions are engaged in external professional network to acquire new knowledge. 2. Information and feedbacks are collected from all the stake holders when ever required. 3. Institutions hire new staff that possesses the required training and knowledge and skill to discharge their responsibilities efficiently. 4. Institutions are willing to subscribe to journals and magazines which help to gain understanding on current changes in the industry. 5. Institution is ready to undertake relevant research which will create knowledge base.
DATA ANALYSIS MEMBERS ARE ACTIVELY INVOLVED IN EXTERNAL PROFESSIONAL NETWORK
Percentage
Strongly agree 32
Agree 40
Neutral 18
Disagree 10
Strongly disagree 0
Total 100
INFORMATION AND FEEDBACK FROM STAKEHOLDERS
Percentage
Strongly agree 26
Agree 52
Neutral 16
Disagree 4
Strongly disagree 2
Total 100
INSTITUTION BUYS JOURNALS AND MAGAZINES REQUIRED
Percentage
Strongly agree 48
Agree 44
Neutral 6
Disagree 2
Strongly disagree 0
Total 100
INSTITUTION IS WILLING TO HIRES NEW STAFF THAT POSSESS THE REQUIRED SKILL AND KNOWLEDGE
Percentage
Strongly agree 46
Agree 24
Neutral 20
Disagree 6
Strongly disagree 4
Total 100
INSTITUTION UNDERTAKES RESEARCH FOR FUTURE POSSIBILITIES
Percentage
Strongly agree 40
Agree 50
Neutral 6
Disagree 2
Strongly disagree 2
Total 100
FINDINGS 1. Members of private institution are actively involved in external professional network -72 % of the respondents agree to this statement only 10% of the
respondents disagree. 2. Private institutions connect with all the stake holders to get feedback and required information for institutional change.-78% of the respondents agrees to
this and only 8% disagree. 3. Institution are willing to subscribe journals and magazines in required number -90 % of the respondent agree only 4 % disagree. 4. Private institution hire new staff who have the required skill and expertise in particular field. – 70 % of the respondents agree, 20 % neither agree nor
disagree and 10% of the respondents disagree. 5. Institution undertakes research for future possibilities- 90% of the respondents agree and only 4% disagree.
CONCLUSION Private higher educational institution occupies a higher position when compared to public institution in terms of enrollment and number of institution. The quality of higher education in India depends on how the private institution performs. The popularity of private institution is mainly because they are actively involved in research, willing to make the required change in the system to cater societal needs, update the knowledge base through strong research culture, and provide good infrastructure, library facilities. Thus private institution is demanded even though the cost of education in this institution is comparatively high.

VOLUME NO. 3 (2013), ISSUE NO. 08 (AUGUST) ISSN 2231-5756
INTERNATIONAL JOURNAL OF RESEARCH IN COMMERCE, IT & MANAGEMENT A Monthly Double-Blind Peer Reviewed (Refereed/Juried) Open Access International e-Journal - Included in the International Serial Directories
http://ijrcm.org.in/
12
REFERENCES 1. Ashish, Arun, 2006, “IT Based KM in Indian Higher Education System: Addressing Quality Concerns and Setting the Priorities Right”, Journal of Knowledge
Management Practice, 7(3): 1-5. 2. Butler, T and C. Murphy. 2007. “Implementing Knowledge Management Systems in Public Sector Organizations: A Case Study of Critical Success Factors”. 3. Coukos-Semmel, E. D. 2002. Knowledge management: processes and strategies used in United States research universities. ProQuest Digital Dissertations.
UMI3041708. 4. Edmonds, G and R. Pusch. 2002. Creating shared knowledge :instructional knowledge management systems. Educational Technology & Society, 5 (1): 100-
104. 5. Holsapple, C and K. Joshi. 2000. An investigation of factors that influence the management of knowledge in organizations. Journal of Strategic Information
System, 9 (2-3): 235- 261 6. Ranjan, J and S. Khalil. 2007. “Application of Knowledge Management in Management Education : A Conceptual Framework”, Journal of Theoretical and
Applied Information Technology, 1: 15-25. 7. Rebecca McNeil 2011. Application of Knowledge Management for Sustainable Development in Institutions of Higher Education Dalhousie Journal of
Interdisciplinary Management Volume 7 – Spring 2011. 8. Rowley, J. 2000. “Is Higher Education Ready for Knowledge Management”, The International Journal of Educational Management, 14 (7): 325-333. 9. Sallis, E and G. Jones. 2002. Knowledge Management in Education London: Kogan. 10. Tajuddin. M. 2008. Knowledge management of Educational. Architecture and Architectural Heritage in a Democratic Society. University Technology
Malaysia, Malaysia.

VOLUME NO. 3 (2013), ISSUE NO. 08 (AUGUST) ISSN 2231-5756
INTERNATIONAL JOURNAL OF RESEARCH IN COMMERCE, IT & MANAGEMENT A Monthly Double-Blind Peer Reviewed (Refereed/Juried) Open Access International e-Journal - Included in the International Serial Directories
http://ijrcm.org.in/
13
A STUDY ON INTER-MANDAL AND INTER-DIVISIONAL VARIATIONS IN RURAL FEMALE WORK PARTICIPATION RATE IN CHITTOOR DISTRICT (ANDHRA PRADESH)
DR. E. LOKANADHA REDDY PROFESSOR
SRI VENKATESWARA COLLEGE OF ENGINEERING & TECHNOLOGY CHITTOOR
ABSTRACT
Women in India play a crucial and contributory role in the field of agricultural production. Rural Indian women are extensively involved in agricultural activities. However, the operations performed by female labour in agriculture are varying from region to region and from one social group to another social group. There are number of studies on the agricultural sector in Chittoor district. Among these studies, the research on agricultural labour is very limited. The empirical investigations are needed to study the agricultural labour problems. Hence this empirical and scientific investigational study of rural female work participation rate in the rural economy of Chittoor district is an important phenomena. This study aims to study the Inter–Mandal variations in rural female work participation rate in three revenue divisions of Chittoor District, Andhra Pradesh. Also, study looks at the Inter–Mandal inequalities in the employment status of female agricultural workers in three revenue divisions of Chittoor District, Andhra Pradesh. For highlighting the Inter-mandal and Inter-divisional variations in Rural Female Work Participation Rate, Co-efficient of variation has been calculated, which will reflect the variations in Rural Female Work Participation Rate. The Inter-mandal and Inter-divisional inequalities in the real agricultural employment status of rural females have been shown by the co-efficient of equality. In the present study, the relevant data for explanatory and explained variables is collected from the Census of India 1991 : Population Census. Inter-Mandal variations of Rural Female Work Participation Rate and co-efficient of equality in the three revenue divisions namely Chittoor, Tirupati and Madanapalle of Chittoor District was studied. The co-efficient of variation confirmed less inter-mandal variations in Rural Female Work Participation Rate. The value of co-efficient of variation also confirmed that majority of the mandals have the high level of the real agricultural employment status of rural females. The average co-efficient of equality for rural females in the district was calculated. The results obtained revealed that less variation is noticed in real employment status of rural female agricultural workers in Chittoor division followed by Madanapalle and Tirupati divisions.
JEL CODE Q19
KEYWORDS Co-efficient of Equality, Co-efficient of Variation, Female Agricultural Workers and Rural Female Work Participation Rate.
INTRODUCTION griculture is an important engine of growth and poverty reduction. Female population constitutes nearly half of the total rural population. The size of female population indicates the potential strength of women in the total human resources in the rural economy. Women in India play a crucial and contributory role in the field of agricultural production. Historians believe that it was women who first started cultivation of crop plants and initiated the
art and science of farming. Beyond economic benefits, women’s participation in the labour force can be seen as a signal of declining discrimination and increasing empowerment of women (Mammen and Paxson, 2000). Rural Indian women are extensively involved in agricultural activities. However the nature and extent of their involvement differs with the variations in agro production systems. The mode of female participation in agricultural production varies with the landowning status of farm households. Their roles range from managers to landless labourers. In over all farm production, women’s average contribution is estimated at 55% to 66% of the total labour with percentages, much higher in certain regions. In the Indian Himalayas a pair of bullocks works 1064 hours, a man 1212 hours and a woman 3485 hours in a year on a one hectare farm, a figure that illustrates women’s significant contribution to agricultural production. (Shiva FAO, 1991) The operations performed by female labour in agriculture are varying from region to region and from one social group to another social group. There are number of studies on the agricultural sector in Chittoor district. Among these studies, the research on agricultural labour is very limited. The empirical investigations are needed to study the agricultural labour problems. Hence the empirical and scientific investigational study of rural female work participation rate in the rural economy of Chittoor district is an important phenomena. This study aims to analyze these variations of Rural Female Work Participation Rate (RFWPR) and inequalities in the employment status of female agricultural workers in three revenue divisions of Chittoor district, Andhra Pradesh.
OBJECTIVES The following are the objectives of the study: - To study the Inter–Mandal variations in rural female work participation rate in three revenue divisions of Chittoor District, Andhra Pradesh. - To study the Inter–Mandal inequalities in the employment status of female agricultural workers in three revenue divisions of Chittoor District, Andhra
Pradesh.
METHODOLOGY Rural Female Work Participation Rate (RFWPR) is the percentage of rural female workers engaged in agricultural sector. The females normally remain outside the labour market and are engaged in household duties except when the economic compulsions drive them to take up jobs. It is logical to expect that, if females take up wage employment, almost all of their male family members in working age groups will also do so. For, in Indian cultural value system, it is difficult to expect males to be dependent on the earnings of their females. So, the rural female work participation rate is low as compared to rural male work participation rate. Total female agricultural workers RFWPR = ------------------------------------------------------ x 100 Total agricultural workers To study the Inter-mandal and Inter-divisional variations in Rural Female Work Participation Rate (RFWPR), the following methodology is adopted. For highlighting the Inter-mandal and Inter-divisional variations in RFWPR, Co-efficient of variation has been calculated, which will reflect the variations in RFWPR. The Inter-mandal and Inter-divisional inequalities in the real agricultural employment status of rural females have been shown by the co-efficient of equality. Standard Deviation Co-efficient of variation (C.V.) = ----------------------------------- x 100 Mean
A

VOLUME NO. 3 (2013), ISSUE NO. 08 (AUGUST) ISSN 2231-5756
INTERNATIONAL JOURNAL OF RESEARCH IN COMMERCE, IT & MANAGEMENT A Monthly Double-Blind Peer Reviewed (Refereed/Juried) Open Access International e-Journal - Included in the International Serial Directories
http://ijrcm.org.in/
14
Percentage share of rural females in rural agricultural employment Co-efficient of Equality for rural females = --------------------------------------------------------------------------------------------------------------- x 100 Percentage share of rural females in rural population In the present study, the relevant data for explanatory and explained variables is collected from the Census of India 1991 : Population Census.
FINDINGS Women play a crucial role in the development of rural economy. They occupy nearly 50 percent of the total population. A majority of female workers in rural areas are engaged in the agricultural sector. The contribution of female labour is significant in agriculture. The operations performed by female labour in agriculture are varying from region to region and from one social group to another social group. To analyse these variations of RFWPR in three revenue divisions of Chittoor district, the co-efficient of variation is considered. The co-efficient of variation is calculated to find out the variations in Rural Female Work Participation Rate (RFWPR). To detect the inequalities in the employment status of female agricultural workers, the co-efficient of equality is computed. Inter-Mandal variations of RFWPR and co-efficient of equality in the three revenue divisions namely Chittoor, Tirupati and Madanapalle of Chittoor District are studied. The RFWPR in Chittoor division is 34.85 percent and it ranges from 30.02 percent for S.R. Puram Mandal to 37.57 percent for Vijayapuram Mandal. Eleven mandals out of 20 Mandals having RFWPR between 30 and 35 percent and remaining 9 mandals are having RFWPR between 35 and 40 percent. The co-efficient of variation is 5.54, which confirms less inter-mandal variations in RFWPR.
TABLE-1: RFWPR AND CO-EFFICIENT OF EQUALITY FOR RURAL FEMALES : CHITTOOR DIVISION – 1991
Sl.No. Name of the Mandal RFWPR Co-efficient of Equality for Rural Females
1. Chittoor 34.57 70.34
2. Gudipala 33.95 67.64
3. Yadamarri 34.06 69.68
4. G.D. Nellore 34.94 70.94
5. Penumur 33.88 69.47
6. Puthalpattu 32.02 65.15
7. Bangarupalyam 34.83 71.02
8. Thavanampalle 36.20 73.29
9. Irala 32.06 65.16
10. Puttur 36.45 73.58
11. Narayanavanam 35.80 71.97
12. Karvetinagaram 35.90 72.22
13. Vedurukuppam 37.19 76.04
14. Ramachandrapuram 36.08 72.74
15. Vadamalapeta 33.89 68.56
16. Palasamudram 33.55 67.94
17. S.R. Puram 30.02 61.32
18. Nagari 37.26 75.49
19. Nindra 36.76 74.56
20. Vijayapuram 37.57 76.41
Chittoor Division 34.85 70.68
C.V. 5.54 5.44
The co-efficient of equality for rural females in various mandals of Chittoor division also exhibits a similar consistent pattern as shown in the table-1. The co-efficient of equality for Chittoor division is 70.68 and varies from 61.32 for S.R. Puram to 76.41 for Vijayapuram mandal. It is clear from the table that the variations in the co-efficient of equality is same as the variations in RFWPR. In eight mandals out of 20 mandals, the co-efficient of equality lies in between 60 and 70 and in the remaining 12 mandals it is above 70 but below 80. It leads to the conclusion that in majority of the mandals, the real agricultural employment status of the rural females is more than 61 percent. The value of co-efficient of variation for rural agricultural employment status of the rural females is 5.44.
TABLE-2: RFWPR AND CO-EFFICIENT OF EQUALITY FOR RURAL FEMALES : TIRUPATI DIVISION – 1991
Sl.No. Name of the Mandal RFWPR Co-efficient of Equality for Rural Females
1. Tirupati (Urban) 41.41 85.84
2. Tirupati (Rural) 35.91 72.12
3. Chandragiri 36.61 75.22
4. Pakala 30.86 62.84
5. Pulicherla 32.27 66.25
6. Renigunta 33.20 67.95
7. Yerpedu 33.54 67.92
8. Srikalahasti 36.16 73.83
9. Thottambedu 39.82 80.87
10. K.V.B. Puram 37.41 76.83
11. B.N. Kandriga 38.81 78.31
12. Varadaiahpalem 39.64 80.26
13. Sathyavedu 38.91 78.02
14. Nagalapuram 42.82 86.02
15. Pitchatur 41.11 82.15
Tirupati Division 37.23 75.63
C.V. 9.3 9.06
Table-2 shows the RFWPR and co-efficient of equality for rural females in various mandals of Tirupati division. The RFWPR in Tirupati division is 37.23 percent and it ranges from 30.86 percent for Pakala to 42.82 percent for Nagalapuram mandal. Four mandals out of 15 mandals have RFWPR below 35 percent, 8 mandals are having RFWPR between 35 and 40 percent and in remaining 3 mandals the RFWPR is above 40 percent but below 45 percent. The co-efficient of variation is 9.3, which indicates less inter-mandal differences in RFWPR. The co-efficient of equality for rural females in Tirupati division is 75.63 and it ranges from 62.84 for Pakala mandal to 86.02 for Nagalapuram mandal. In four mandals out of 15 mandals in the division, the co-efficient of equality for rural females is below 70 but above 60, whereas in 6 mandals it ranges between 70 and 80 and in remaining 5 mandals it is above 80 but below 90. The co-efficient of variation is 9.06. It reveals that there are less variations in the real agricultural employment status of rural females.

VOLUME NO. 3 (2013), ISSUE NO. 08 (AUGUST) ISSN 2231-5756
INTERNATIONAL JOURNAL OF RESEARCH IN COMMERCE, IT & MANAGEMENT A Monthly Double-Blind Peer Reviewed (Refereed/Juried) Open Access International e-Journal - Included in the International Serial Directories
http://ijrcm.org.in/
15
TABLE-3: RFWPR AND CO-EFFICIENT OF EQUALITY FOR RURAL FEMALES : MADANAPALLE DIVISION – 1991
Sl.No. Name of the Mandal RFWPR Co-efficient of Equality for Rural Females
1. Madanapalle 39.98 82.31
2. Nimmanapalle 43.13 88.04
3. B. Kothakota 40.59 83.45
4. Kurabalakota 44.61 90.47
5. Thamballapalle 43.08 87.49
6. Peddamandyam 41.69 85.26
7. Molakalacheruvu 40.33 82.59
8. Peddathippasamudram 40.82 83.48
9. Vayalpad 41.87 85.15
10. Gurramkonda 40.57 82.16
11. Kalikiri 42.13 85.91
12. Kalakada 43.07 88.04
13. K.V. Palle 35.17 72.71
14. Piler 39.66 81.14
15. Rompicharla 36.39 74.10
16. C.G. Gallu 34.92 71.50
17. Yerravaripalem 36.45 73.67
18. Punganur 43.32 87.52
19. Ramasamudram 42.67 86.48
20. Chowdepalle 41.04 83.62
21. Peddapanjani 38.62 77.91
22. Somala 34.89 69.84
23. Sodam 39.45 80.05
24. Palamaner 36.38 73.55
25. Gangavaram 37.55 75.54
26. Baireddipalle 39.91 82.75
27. V. Kota 38.95 66.41
28. Ramakuppam 39.26 80.11
29. Santhipuram 39.03 79.06
30. Kuppam 33.04 67.06
31. Gudupalle 44.95 89.67
Madanapalle Division 39.79 80.55
C.V. 7.53 8.20
Chittoor District 37.71 76.44
C.V. 9.43 9.59
Table-3 Shows the RFWPR and co-efficient of equality for rural females in Madanapalle division. The RFWPR in Madanapalle division is 39.79 percent and ranges from 33.04 percent for Kuppam mandal to 44.95 percent for Gudupalle mandal. Three mandals out of 31 mandals have RFWPR below 35 percent in Madanapalle division, 13 mandals have RFWPR between 35 and 40 percent. RFWPR is above 40 percent but below 45 percent in remaining 15 mandals. The co-efficient of variation is 7.53, which shows less inter-mandal differences in RFWPR. The co-efficient of equality for rural females in Madanapalle division is 80.55 and ranges from 66.41 for V.Kota Mandal to 90.47 for Kurabalakota mandal. In 3 mandals out of 31 mandals the co-efficient of equality is below 70, whereas in 8 mandals it ranges between 70 and 80, in 19 mandals it ranges between 80 and 90 and in the remaining one mandal it is 90.47. It leads to the conclusion that in majority mandals in Madanapalle division, the real agricultural employment status of the rural females is at high level. The co-efficient of variation is 8.20. The RFWPR in Chittoor district is 37.71 percent and it ranges from 30.02 percent for S.R. Puram to 44.95 percent for Gudupalle mandal. Eighteen out of 66 mandals in the district have the RFWPR below 35 percent, in 30 mandals it is between 35 and 40 percent and in remaining 18 mandals the RFWPR is above 40 percent but blow 45 percent. The co-efficient of variation is less order 9.43. The co-efficient of equality for rural females in Chittoor district is 76.44 [Table-1, 2 and 3]. It varies widely from 61.32 for S.R. Puram to 90.47 for Kurabalakota mandal. It is apparent from the tables [1, 2 and 3] that, there are less variations in the real agricultural employment status of the rural females. In 15 mandals out of 66 mandals, the co-efficient of equality is below 70 but above 60, 26 mandals have the co-efficient of equality between 70 and 80, in 24 mandals it is between 80 and 90 and in the remaining one mandal it is 90.47. The value of co-efficient of variation is 9.59, confirming that majority of the mandals have the high level of the real agricultural employment status of rural females.
TABLE-4: RFWPR AND CO-EFFICIENT OF EQUALITY FOR RURAL FEMALES
Sl.No. Particulars RFWPR Co-efficient of equality
Average Lowest Highest C.V. Average Lowest Highest C.V.
1. Chittoor Division 34.85 30.02 37.57 5.54 70.68 61.32 76.41 5.44 2. Tirupati Division 37.23 30.86 42.82 9.3 75.63 62.84 86.02 9.06 3. Madanapalle Division 39.79 33.04 44.95 7.53 80.55 66.41 90.47 8.20 4. Chittoor District 37.71 30.02 44.95 9.43 76.44 61.32 90.47 9.59
Source: Tables-1, 2 and 3 Table-4 shows the RFWPR and the co-efficient of equality for rural female agricultural workers in the three revenue divisions of Chittoor district and for the entire district. Among the three revenue divisions, Tirupati division recorded highest variation in RFWPR followed by Madanapalle and chittoor divisions. It is noticed that entire district as a whole, recorded highest variation than these three divisions. Among the three revenue divisions, Tirupati division recorded highest variation in co-efficient of equality followed by Madanapalle and Chittoor divisions. Further entire district as a whole, recorded 9.59 percent of variation in co-efficient of equality. Chittoor division shows less variation in RFWPR. The co-efficient of variation is 5.54, whereas the variation in co-efficient of equality for rural female agricultural employment is less in Chittoor division [Table-4]. The co-efficient of variation for real agricultural employment status of rural females is 5.44.
CONCLUSIONS Pertaining to the co-efficient of variation, the highest variation in Rural Female Work Participation Rate (RFWPR) is recorded in Tirupati division (9.3) followed by Madanapalle (7.53) and Chittoor (5.54) divisions. The variation in the entire Chittoor district is recorded as 9.43. It reveals that the real agricultural employment status of rural female is less in Chittoor division and more in Tirupati division. Regarding the co-efficient of equality, the highest variation in RFWPR is recorded in Tirupati division (9.06) followed by Madanapalle (8.2) and Chittoor (5.44) divisions. The district as a whole recorded 9.59 percent of variation.

VOLUME NO. 3 (2013), ISSUE NO. 08 (AUGUST) ISSN 2231-5756
INTERNATIONAL JOURNAL OF RESEARCH IN COMMERCE, IT & MANAGEMENT A Monthly Double-Blind Peer Reviewed (Refereed/Juried) Open Access International e-Journal - Included in the International Serial Directories
http://ijrcm.org.in/
16
The highest average RFWPR is recorded in Madanapalle division (39.79) followed by Tirupati (37.23) and Chittoor (34.85) divisions. In the case of district as a whole, 37.71 percent of average variation in RFWPR is recorded. The average of co-efficient of equality for rural females is maximum in Madanapalle division (80.55) followed by Tirupati (75.63) and Chittoor (70.68) divisions. The average co-efficient of equality for rural females in the district is 76.44 percent. The results obtained reveal that less variation is noticed in real employment status of rural female agricultural workers in Chittoor division followed by Madanapalle and Tirupati divisions.
REFERENCES 1. Amaraja Nerurker. (1980). Segmentation of Labour Market in India with Special Reference to Women. The Indian Journal of Labour Economics, Vol.XXXII,
Nos. 1 & 2, April-July, pp.52-65. 2. Bardhan, P.K., Vidyanathan, A., Alagh., T., Bhalla, G.S. and Bhaduri, A. (1978). Labour Absorption in Indian Agriculture : Some Exploratory Investigations
(ILO, ARTEP, Bangkok). 3. Dadi M.D. (1974). Variations in Labour Force Participation : An Inter-Regional Analysis. Indian Journal of Industrial Relations, Vol.10, July. 4. Guy Standing., and Glen Sheehan. (1977). Labour Force Participation in Srilanka. Indian Journal of Industrial Relations, Vol. XXIII, No.1, July, pp.27-38. 5. Indira Hirway. (1979). Female Employment in Rural Gujarat : Some Issues. The Indian Journal of Labour Economics, vol.XXIII, No.3, October, pp.161-170. 6. Leela Gulati. (1975). Female work participation : A Study of Inter-State differences. Economic and Political Weekly, vol.X, Nos.1&2, January, pp.35-42. 7. Misra, V.N. (1970). Labour Market in Agriculture : A Study of Gujarat District. Indian Journal of Agricultural Economics, Vol.XXV, No.3, July – September,
pp.8-15. 8. Papola, T.S., and Misra, V.N. (1980). Labour Supply and Wage determination in Rural Uttarpradesh. Indian Journal of Agricultural Economics, vol.XXXV,
No.1, January-March, pp.106-120. 9. Pranab.K. Bardhan. (1986). Demand for Hired Labour in Land, Labour and Rural poverty, Essays in Development Economics. Oxford University Press, New
Delhi, pp.38-46. 10. Reddy, D.N. (1979). Female Work Participation in India – Facts, Problems and Policies. Indian Journal of Industrial Relations, vol.15, No.2, October, pp.196-
212. 11. Rohini Nayyar. (1987). Female Participation Rates in Rural India. Economic and Political Weekly, vol.XXII. 12. Sawant, S.D. (1992). Women’s work Participation with special reference to Maharastra State. R.K. Dunia (edn) Women in Agriculture (their status and role),
vol.1, Northern Centre, New Delhi, pp.121-135. 13. Sawant, S.D., Ritu Dewan. (1979). Rural Female Labour and Economic Development. Economic and Political Weekly, Vol.XIV, No.26, June. 14. Saxena, P.K. (1989). Rural Female Work Participation Rate in Gujarat : An Inter-District Analysis. Margin, vol.22, No.12, October, pp.124-132. 15. Singh, K.P. (1980). Economic Development and Female Labour force participation : The case of Punjab. Social Action, vol.XXX, No.2, April – June, pp. 128-
137. 16. Sinha, J.N. (1975). Female Work Participation: A Comment. Economic and Political Weekly, vol.10, No.16, April. 17. Sudhakar Reddy, S. (1990). Poverty, Unemployment and Labour Force Participation in Child and Women in Andhra Pradesh : A Situation Analysis. ed.,
Subramanyam, S., (CESS and UNICEF). 18. Usha Rao, N.J. (1978). Female Labour Participation Rates among scheduled Castes of Karnataka. The Indian Journal of Labour Economics, vol.XXI, Nos. 1&2,
April-July, pp.76-100. 19. Usha Setakopan and Shamala Devi, L.N. (1983). Female Labour Force Participation Rates : Concepts and Estimates in India. The Indian Journal of Labour
Economics, Vol.XXVI, No.3, October.

VOLUME NO. 3 (2013), ISSUE NO. 08 (AUGUST) ISSN 2231-5756
INTERNATIONAL JOURNAL OF RESEARCH IN COMMERCE, IT & MANAGEMENT A Monthly Double-Blind Peer Reviewed (Refereed/Juried) Open Access International e-Journal - Included in the International Serial Directories
http://ijrcm.org.in/
17
IMPACT OF MICROFINANCE ON WOMEN’S LIVES: A STUDY OF LUDHIANA DISTRICT
DR. M. L. GUPTA PROFESSOR
PEC UNIVERSITY CHANDIGARH
MUNISH KAPILA
ASST. PROFESSOR GURU NANAK INSTITUTE OF MANAGEMENT & TECHNOLOGY
LUDHIANA
ABSTRACT The study attempts to analyze impact of microfinance on the lives of the women in Ludhiana district of Punjab. For the purpose of the study data was collected from 120 SHG members of Delon, Khanna and Ludhiana-II block of Ludhiana district through an interview cum schedule method. Data was analyzed to meet the objectives of the study and the results indicate that joining of SHGs have a positive impact on level of income, expenditure and savings of the household. Further, increase in income has helped in increasing savings of the household thus improving the economic position of the household in general and women in particular. Finally, increase in income has a direct positive impact on women role in decision making in the family. Thus joining of SHGs has positive impact on the lives of the women.
KEYWORDS Microfinance, Self Help Group, Women.
INTRODUCTION lthough women form integral part of society, yet they are most under privileged and vulnerable and constitute a sizeable segment of those who belong to below poverty line in rural areas. In a male dominated society, women have always been underestimated and discriminated in all spheres of life be it their family and social life or their economic and political life. The development of the country is possible only if women folk are also developed. Here
Microfinance, which has been introduced for poor of the society targeting especially the women, assumes a great significance. Microfinance provides small amount of loans which shows quick and visible results to the poor people, especially women. In India, where nearly 70% of population live in the villages and the majority (51.4%) i.e. 45.9 million out of 89.3 million farmer households do not have access to credit either from institutional or non-institutional sources, microfinance emerged as a major intervention aimed at poverty reduction through an innovative scheme of lending to the poor people, especially women(NABARD,2008).The idea behind microfinance is that poor people, who cannot provide any collateral security, should have access to some sort of financial services. In microfinance, small amounts of loan ,coupled with financial discipline, ensure that loans are given more frequently; thus credit needs for variety of purposes and at shorter time interval can be met (Vatta, 2003) .In India, microfinance is usually offered to women with the mediation of Self Help Groups. A typical SHG in India is formed by a group of 15 to 20 people, (often women only) meeting once every week/fortnight/month. The very act of meeting together every week helps clients know each other better and become more willing to help out a group member who faces a temporary difficulty (Pande, 2010). SHGs usually pledge to some informal rules, then open a bank account in the group’s name, select two or three leaders and conduct saving and credit activities (Premchander,2009). Under this programme collateral free small loans are given to a group of poor people who make savings regularly. The whole group remains responsible for the repayment of the loan and the peer pressure within the group helps the successful and timely repayment of the loans. These loans may be used for starting some income generating economic activities to create self-employment which further helps in transforming lives of women.
REVIEW OF LITERATURE The basic idea of microfinance is to provide credit to the poor people who otherwise would not have access to credit services. In order to find the impact of microfinance programme, impact assessment studies have been done by many authors in different countries like Bangladesh, India, Pakistan, Nepal and many parts of Africa. The literature on microfinance offers a diversity of findings relating to the type and level of impact of the programme. There are various studies which confirm that microfinance programme has a significant positive impact in increasing employment and reducing poverty (Bansal, 2011).Advocates of microfinance argue that Microfinance is a powerful to alleviate poverty. This is consistent with the UNCDF’s (2009) claim that microcredit provides a potent tool for expanding economic opportunities and reducing the vulnerabilities of the poor (Samuel Adams, 2010).(Yahaya, 2011 ) posit that microfinance banks supply micro loans, savings and other financial services to the poor and low income population on a sustainable basis and help in the alleviation of poverty and examined the effectiveness of microfinance banks in alleviation of poverty in Kwara State of Nigeria. The data collected were analyzed through the use of t-test and Analysis of Variance (ANOVA). From the research findings, results revealed that microfinance has significant role to play in the economy, as it helps reduce poverty by providing financial services to the active poor, help in generating employment and also provide small loans to grow small businesses. Similarity, (Abur, 2012) investigated on microcredit as a strategy for poverty reduction in Benue state, Nigeria. Data of 274 respondents was analyzed through use of Ginni Coefficient and logit regression model. The result shows that 0.52 and 0.022 incidence of sever poverty existed before and after microcredit. The Gini coefficient also indicates a high and low income inequality of 0.6 and 0.04 existed before and after microcredit. The result from logit regression techniques indicates that the computed value of R2 is as high as 0.723, which implies that microcredit influence the poverty status of the respondents. The study concluded that microcredit institutions in the study area are bisected with myriad of problems. However, microcredit has help in reducing poverty among the respondents. The study recommended that the capital base of microcredit institutions should be increased so as to meet up with the required demand of respondents and also ensures that microcredit are judiciously use. Likewise, (D.K.Panda, 2009) Assessing the Impact of Participation in Women Self-Help Group-Based Microfinance: Non-Experimental Evidences from Rural Households in India A quasi-experimental design was made under which the target group was compared with a selected control group across a set of household variables like income, assets positions, savings, consumption, employment, literacy and migration. A multistage random sampling was used to select 150 cross-sectional samples from Orissa, Jharkhand and Chhattisgarh states of India. Descriptive statistics, test of significance by z-statistics and probit model under econometrics were used to measure the impact of participation in the self-help group-based microfinance. The distribution of household income and assets was measured by Gini coefficient and Lorenz curve. The 'household' was taken as the unit of analysis. The study concluded with the positive impact on the increase in income, assets position, savings and literacy and in the reduction of migration of rural households. Weak evidence of significant impact of the group based microfinance on the distribution of household income and assets was found. The participation of women in the self-help group was strongly determined by household income, employment, migration, saving and literacy positions. Supporting this claim, (Ahmed, Chamhvri, & Alni, 2011) assessed the impact of rural development schemes on rural poor's livelihood using primary data collected from 1,020 clients working across the country. Results showed that household income, productivity of crops and livestock, expenditure, and employment had increased significantly due to the influence of
A

VOLUME NO. 3 (2013), ISSUE NO. 08 (AUGUST) ISSN 2231-5756
INTERNATIONAL JOURNAL OF RESEARCH IN COMMERCE, IT & MANAGEMENT A Monthly Double-Blind Peer Reviewed (Refereed/Juried) Open Access International e-Journal - Included in the International Serial Directories
http://ijrcm.org.in/
18
invested money. Further, results of the Logit-model showed that clients' socio-economic factors like age, number of family members in farming, total land size and clients' ethics and morals had a positive and significant influence on household income. Gender activists also argue in favor of microfinance as a means of empowerment by supporting women’s economic participation. (S.Noreen, 2011) used regression analysis based on primary data of Bahawalpur, Pakistan to check the relationship of different socio economic determinants on women empowerment by constructing simple index using five indicators related to child health, education, selection of spouse of children, purchase of basic goods and decision about the use of loan. The results showed that women empowerment is considerably influenced by age, education of husband, father inherited assets, marital status, number of sons alive and microfinance. It concluded that as microfinance is major explanatory variable in this study has some positive role in empowerment but not as much as was expected. However, not all the researchers feel that microfinance has a significant impact on poverty; many studies do suggest that the reality promise of microfinance may be less attractive as it looks. (D.Roodman,2009) asserts that microcredit might actually leave people worse off, just as credit cards and mortgages have made people poorer in developed countries. (A.Karnani, 2007) made a similar statement in his critique of microfinance programs and argued that though microcredit yields some non-economic benefits, it does not significantly alleviate poverty and that the promise of microfinance is less attractive than the reality. Further, (Sachs,2013) claims that microfinance may not be appropriate in every situation and advices against one size fits all strategy in the use of microfinance in poverty alleviation. Sachs explained that the poor governance infrastructure, dispersed populations in the rural areas might limit the potential benefits of microfinance.
NEED FOR RESEARCH Many studies have been undertaken to study the impact of microfinance on women clients in southern region. But, not much attention has been paid to study the impact of microfinance in northern region. The present study seeks to investigate the impact of joining SHG on lives of women in Ludhiana district of Punjab. The research is believed to generate data about Self Help Groups and its impact it may have brought on the life of the clients.
OBJECTIVES The objectives of the present study include: 1. To study the impact of joining SHG on economic conditions on the women household. 2. To study the relationship between increase in income and increase in savings. 3. To study the impact of increase in income on women role in household decision making process of SHG members.
RESEARCH QUESTION In order to pursue the objective of the study, the following research questions were formulated namely: 1. Do Self Help groups impact the economic conditions of women household? 2. Does there is any relation between income and savings? 3. Does increase in income helps in empowering socially? Hypotheses were thereby formulated and stated in the null form as stated below: Ho1: There is no significant impact of joining SHG on economic situation of women household i.e. income, expenditure and savings. H02: There exist no significant direct relation between level of income and level of savings. H03: There is no significant impact of increase in income of women on women role in household decision making
MATERIAL AND METHODS The study was conducted in Ludhiana district between October, 2012 and December, 2012. For the purpose of data collection, multi-stage random sampling was used. In the first stage 12 blocks of Ludhiana were divided into three categories i.e. blocks with highest, medium and lowest number of self help groups and one block was randomly selected from each category. Thus, three blocks namely; Khanna, Ludhiana-II and Delon were selected. In the second stage 10 SHGs were randomly selected from each block, thus, selecting 30 SHGs from the three blocks selected. In the last stage four members were randomly selected from each SHG and were interviewed using a schedule especially designed for the purpose of research. Data regarding pre and post situation of member of SHG in were collected, where Pre situation is the situation of member before joining SHG and post situation is the situation after one year of joining of SHG. Data generated from the survey were analyzed using descriptive and inferential statistics such as percentage, and Paired-t test, pearson correlation and simple linear regression at 0.05 and 0.01alpha levels to study the impact of joining SHG on income, expenditure, saving and decision making in family.
RESULTS AND DISCUSSIONS DEMOGRAPHIC PROFILE OF RESPONDENTS Table 1 provides the information about the demographic profile of the respondents. In terms of age, 38.33 % of the respondents were in the age group of 30 to 40 years. 26.67% were less than 30 years of age and remaining 35 % were 40 years and above .In terms of category wise distribution 38.33% of the members belong to general category 34.17% belong to SC category and 27.5% belong to BC category. We also classified the respondents in terms of their education. It could affect the way in which they manage and live their daily lives and manage the household and business. From this survey, we realized that majority of our sample respondents had at least basic primary education, which represents 42.5% of our sample, one the other side there are 16.67 % of the sample women who have no education background. In respect to number of members in the family 27.5% of the respondents have large families having members more than five and 35.83 % of respondents have less than 3 family members. In microfinance it is believed that large families sometime become added advantage for income generating activities because family members sometime provide valuable contribution towards small-scale business as additional workers. Our analysis also reveals that 61.67% of respondents had no business experience before joining the SHG and rest of 38.33 % had previous business experiences. It indicates that SHG are contributing a lot to start the new small-scale businesses as well as in the expansion of old businesses. Therefore, we can see that more than 50% of the respondents were part of the large families, and at the same time higher proportion of the people did not have any business experience before joining SHG. So indirectly, SHG were able to reach and benefit more people than those formally linked to them, as when they provide the business opportunity to a large family, other members are also benefited naturally.

VOLUME NO. 3 (2013), ISSUE NO. 08 (AUGUST) ISSN 2231-5756
INTERNATIONAL JOURNAL OF RESEARCH IN COMMERCE, IT & MANAGEMENT A Monthly Double-Blind Peer Reviewed (Refereed/Juried) Open Access International e-Journal - Included in the International Serial Directories
http://ijrcm.org.in/
19
TABLE 1: DEMOGRAPHIC INFORMATION OF THE RESPONDENTS
Variables Measuring Group Frequency Percentage
Age (years) Below 30 32 26.67
30 - 40 46 38.33
Above 40 42 35
Total 120 100
Social Status Scheduled caste 41 34.17
Backward class 33 27.5
General 46 38.33
Total 120 100
Marital Status Married 52 43.33
Widow 32 26.67
Divorcee 29 24.17
Unmarried 7 5.83
Total 120 100
Educational Level Illiterate 20 16.67
Primary 51 42.5
Middle 33 27.5
High 12 10
Secondary and above 4 3.33
Total 120 100
No. of Family Members Below 3 43 35.83
3 to 5 44 36.67
Above 5 33 27.5
Total 120 100
Working Experience before Joining SHG Yes 46 38.33
No 74 61.67
Total 120 100
IMPACT ON ECONOMIC CONDITION OF WOMEN’S HOUSEHOLD The SHG programme has improved the level of household income of the women. table -2 provides that the average yearly income of the household is Rs. 40,910 per annum in the post SHG as compared to Rs.26, 680 per annum in pre-SHG situation. Similarly, there is rise in annual expenditure of the family from 19,864 in pre-SHG situation to 27,505 in post-SHG situation. As a result of increase in income the savings of the household has also improved nearly two times after joining SHG as in pre-SHG situation mean savings were 3,599 which further increased to 6,870 in post-SHG situation. A paired sample t-test is used to measure the significance of difference between the mean incomes, expenditures and savings of the participants. In this regard, our null hypothesis is that there is no significant impact of joining SHG on economic situation of women household i.e. .income, expenditure and savings. The test shows that the difference between the mean incomes, expenditures and savings of the participants of the programme in the pre- and post-SHG situation is significantly different at five per cent level which means SHG are creating positive impact on economic conditions of participant women household.
TABLE-2: RESULT OF PAIRED T - TEST FOR ECONOMIC VARIABLES
Sr. No Economic Indicators Pre SHG Mean
Pre SHG Standard Deviation Post SHG Mean Post SHG Standard Deviation
T Value Hypothesis
1 Annual Household Income 26680 4958.16 40910 6556.81 24.085 Rejected
2 Annual Household Expenditure 19864 5124.79 27505 6004.41 18.468 Rejected
3 Annual Savings 3599 1750.69 6870 2362.35 25.198 Rejected
*** Significant at 5per cent level. IMPACT OF INCREASE IN INCOME ON SAVINGS Generally, women of SHGs take the loan to change their economic position by investing in some income generating activity (IGA).It is believed that economic conditions of women can change only if rise in income leads to rise in savings. After meeting all the family expenditure, whatever women save helps in making their future secure on one hand and helps in improving their living standard on the other hand. Therefore, we tried to find out the relationship between increase of income and increase of saving using the Pearson correlation test. Using SPSS, we computed a Pearson correlation test between two variables increase of income and increase of savings. In this regard, our null hypothesis is that there exists no relationship between increase in the level of income and the increase in the level of savings. The above table-3 shows that our null hypothesis is rejected and it is statistically significant and the relation between these two variables is strongly positive. Thus, increase in household income of women has resulted in increase in their level of savings and hence making lives of women more secure for future.
TABLE 3: CORRELATION TEST BETWEEN THE INCOME AND SAVING
Increase of income Increase of savings
Increase of income Pearson Correlation 1 0.710(**)
Sig. (1-tailed) 0.000
N 120 120
Increase of savings Pearson Correlation 0.710(**) 1
Sig. (1-tailed) 0.000
N 120 120
** Correlation is significant at the 0.01 level. IMPACT OF INCREASE IN INCOME ON DECISION MAKING IN FAMILY The impact of increase of income on the role of decision-making in a family was analyzed using simple linear regression. Here, our null hypothesis is that there is no relationship between the increase of income and women role in decision making in a family. The results of bivariate regression analysis are shown in the above table 4. The table labeled Model summary shows that R square for the regression model is 0.358 which states that increase in income accounts for 35.8% increase in women role in family decision.

VOLUME NO. 3 (2013), ISSUE NO. 08 (AUGUST) ISSN 2231-5756
INTERNATIONAL JOURNAL OF RESEARCH IN COMMERCE, IT & MANAGEMENT A Monthly Double-Blind Peer Reviewed (Refereed/Juried) Open Access International e-Journal - Included in the International Serial Directories
http://ijrcm.org.in/
20
TABLE 4: REGRESSION ANALYSIS BETWEEN INCREASE OF INCOME AND ROLE IN DECISION-MAKING PROCESS (MODEL SUMMARY)
Adjusted Std. Error of
Model R R Square R Square the Estimate
1 0.487(a) 0.358 0.319 0.652
a) Predictors: (Constant), increase of income b) Dependent Variable: Role in decision-making process Further, the ANNOVA table shows the F ratio for the regression models. This statistics assesses the statistical significance of the overall regression models. Larger the F ratio, the more variance in the dependent variable is explained by the independent variable. The F ratio 14.347 indicates the model is highly significant at the 0.000 level. According to above analysis, our null hypothesis is rejected which indicates that as the income level of women in the family increases her say in important family matters increases. Therefore joining of SHGs can create a social change as when women has a say in decision making she may choose to send her child to school or she may refuse for early marriage for children or she may choose not to bear a child which may directly help in population control.
TABLE 5: REGRESSION ANALYSIS BETWEEN INCREASE OF INCOME AND ROLE IN DECISION-MAKING PROCESS (ANOVA)
Model Sum of df Mean F Sig.
Squares Square
1 Regression 7.604 1 7.604 14.347 0.000(a)
Residual 63.128 119 0.530
Total 70.732 120
a) Predictors: (Constant), increase of income b) Dependent Variable: Role in decision-making process
CONCLUSION The analysis of data using the survey shows that almost 61% of women had no business before joining SHG and most of them have primary education or are illiterate. After the joining of SHG most of the women took loan from SHG and invested in some income generating activities (IGAs).Through these (IGAs) they were able to generate some additional income which helped in providing financial help to their families thus improving economic position of their family. Further, Increase in family income led to increase in expenditure creating positive impact on their living standard. The study also show that income and savings are directly correlated which implies that rise in income leads to rise in savings. Savings are termed as an important factor for quality of life as, if saving increases there will be positive impact on financial situation of the family which will have direct impact on quality of life of its members. Another important impact of SHGs is creation of employment opportunity as women who did not have any business experience before joining SHG has started their own business. Further, results of regression analysis reveals that apart from improving their lives economically, joining SHG has also created a positive impact on their social situation as they have started taking active part in the decision making process of the family. To sum up, it can be concluded from our analysis that there is a significant and positive impact of microfinance activities on lives of women both economically and socially thus SHG serves as a tool to create positive change in the lives of Women.
REFERENCES 1. Abur, C. C. (2012). Microcredit as a Strategy for Poverty Reduction in Makurdi Local Government . International Journal of Humanities and Social Science
Vol. 2 No. 12 , 178-186. 2. Ahmed, Chamhvri, & Alni, S. N. (2011). Sustainable Llivelihood Among Rural Women through Micro-Credit Programme in Bangladeh. Australian Journal of
Baisc and Applied Sciences , 116-120. 3. Bansal, D. (2011). IMPACT OF MICROFINANCE ON POVERTY,EMPLOYMENT AND WOMEN EMPOWERMENT IN RURAL PUNJAB. Thesis submitted to Punjabi
University,Patiala , 13. 4. Karnani.A. ( Summer 2007). Microfinance Misses its Mark. Stanford Social Innovation Review . 5. NABARD. (2008). Report of Committee on Financial Inclusion. NABARD. 6. Noreen.S. (2011). Role Of Microfinance In Empowerment Of Female Population Of Bahawalpur District. International Conference On Economics And
Finance Research (pp. 318-325). Singapore: Iacsit Press. 7. Panda D.K.. (2009). Assessing The Impact Of Participation In Women Self-Help Group-Based Microfinance: Non-Experimental Evidences From Rural
Households In India. . International Journal Of Rural Management , 5 (2) . 8. Pande F.B.. (2010). Building Social Capital Through Microfinance. NBER Working paperW16018 . 9. premchander(2013)http://www.bioculturaldiversity.net/Downloads/Papers%20participants/Premchander.pdf. Retrieved april 13, 2013, from http://www.
bioculturaldiversity.net/. 10. Rokonuzzamon, & Kuhinur. (2009). Impact of Grameen Bank on Chage in livelihood Status of women Benificaries. Bangladesh Agril University , 381-386. 11. Roodman.D. (2013.). What do we Really Know about Microfinance? Retrieved may 27, 2013, from http://blogs.cgdev.org. 12. sachs, j. (2013.) http://www.kiva.org. Retrieved may 25, 2013 13. Samuel Adams, T. b. (2010). The Impact of Microfinance on Maize Farmers in Nkoranza (Brong Ahafo Region of Ghana). Journal of Management Research
Vol 2 No.2 , 1-13. 14. Vatta, K. (2003). Microfinance and Poverty allevation. Economic and political weekly , 432-433. 15. Yahaya, K. A. (2011 ). Effectiveness Of Microfinance Banks In Alleviating Poverty In Kwara State Nigeria. Global Journal of Management and Business
Research , volume11 issue 4.

VOLUME NO. 3 (2013), ISSUE NO. 08 (AUGUST) ISSN 2231-5756
INTERNATIONAL JOURNAL OF RESEARCH IN COMMERCE, IT & MANAGEMENT A Monthly Double-Blind Peer Reviewed (Refereed/Juried) Open Access International e-Journal - Included in the International Serial Directories
http://ijrcm.org.in/
21
IMPACT OF ANTECEDENTS OF BEHAVIOURAL INTENTION OF STUDENTS’ IN HIGHER EDUCATION
DR. M. KALPANA ASST. PROFESSOR
DEPARTMENT OF HUMANITIES PSG COLLEGE OF TECHNOLOGY
COIMBATORE
DR. D SUDHARANI RAVINDRAN PROFESSOR
PSG INSTITUTE OF MANAGEMENT PSG COLLEGE OF TECHNOLOGY
COIMBATORE
DR. K.RAMYA ASST. PROFESSOR
AVINASHILINGAM SCHOOL OF MANAGEMENT & TECHNOLOGY AVINASHILINGAM INSTITUTE FOR HOME SCIENCE & HIGHER EDUCATION FOR WOMEN
COIMBATORE
ABSTRACT This study focuses on the impact of antecedents of behavioural intention of students’ in higher education. The constructs service quality, overall satisfaction of students, attitude towards the institution and their behavioural intention was measured using structured questionnaire among 180 post graduate students pursuing MBA programme in Coimbatore city. Service quality was measured based on SERVQUAL (Parasuramanan, 1985) and other constructs such as overall satisfaction, attitude and behavioural intention were measured using items derived from previous studies by Cronin et al., (2000), Ajzen and Fishbein (1980), Athiyaman (1997) and Zeithaml et al., (1996). Non-probability convenience sampling was used in selecting the respondents. It is found from the study that service quality influence the satisfaction of students, satisfaction influence the attitude, attitude influence the behavioural intention. Further the analysis also reveals that the relationship between attitude of students’ and behavioural intention is stronger than any other constructs. Focusing on the results concerning to behavioural intention, our study indicates that by ensuring a high level of service quality, administrators of the institutions will be able to trigger positive customers’ reactions that are key for the sustainable development of the higher educational institutions. Findings of this study provide administrators an insight into the service quality of B-Schools by which they can attract the students towards their institutions.
KEYWORDS Service quality, Students’ Satisfaction, Attitude, Behavioural intention.
1. INTRODUCTION ustomer satisfaction has been considered as a central issue in the marketing literature (Churchill and Suprenant, 1982). Academicians and practitioners have studied and developed various strategies to maintain strong relationships with customers, as satisfied customers usually result in customer retention and customer loyalty (Zeithaml, et al., 1996). One such strategy is to offer high quality products and this strategy commonly results in
competitive advantage that leads to success for many organisations (Sureshchander, et al., 2002). Crosby (1991) maintains that providing a high level of quality lowers costs and retains satisfied customers, and ultimately generates higher profit margins for an organisation. The service sector has grown immensely since 1970s, and this growth has attracted researchers and encouraged them to study service quality and customer satisfaction issues in service industries (Rust and Oliver, 1994; Sureshchander et al., 2002). However, because services exhibit several exclusive characteristics, identified as intangibility, inseparability, heterogeneity, perishability and lack of ownership (Clemes et al., 2000, DeShields et al., 2005), researchers have difficulty in defining and measuring service quality and customer satisfaction (Parasuraman et al., 1988; Giese and Cote, 2000). The higher education sector has also faced reduced subsidies and intense global competition. In response, the sector has shifted its focus to market-related marketing mechanisms as like many other service industries (DeShields et al., 2005). The higher education sector needs to deliver a high quality of service and satisfy its customers to achieve sustainability in a competitive market environment (DeShields et al., 2005). Past research (Parasuraman et al., 1990; Cronin and Taylor 1992) has shown the importance of understanding what the customer expects which will help the organisation to achieve the first step in delivering service quality and satisfaction. Now, more than ever, higher education institutions have embraced the marketing concept and the idea of the student as consumer, the customer who is involved in the purchase of higher education programs and services (Kotler and Levy 1969). Today’s students search for institutions that will provide them with unique, memorable, and personal educational experiences. Also, he/she is a customer, seeking an educational program that will prepare him/her for a successful career and gainful employment. A satisfied customer might well become a regular buyer and also spreads positive word of mouth communication which might result in creating new customers and negative word-of-mouth communication leads to reduction in customer satisfaction (Richins, 1983) Service quality in the service setting is one of the major aspects of customer satisfaction. On the other hand for this issue, there is some disagreement, as whether customer satisfaction is a precursor of service quality. One of the ideas refers service quality as a comprehensive evaluation, regarding service category in a specific establishment (Parasuraman et al., 1988). In 1985, a research conducted by Parasuraman, Ziethaml and Bitner, exemplified cases where respondents were impressed to some extent but the service did not meet their expectations because most events of customer satisfaction narrate a specific assessment of a service experiences, customer’s pleasure is analyzed as it relates to a particular transaction (Howard and Sheth 1969; Hunt 1979; Singh 1988). From this perspective, customer satisfaction is mere a minor aspect, it’s the service quality that counts most. Responsiveness of the service is a major issue including staff being prompt, courteous, knowledgeable, and neat in appearance, helpful and attentive to customers’ needs. This study attempts to analyse the relationship between service quality, students’ satisfaction, attitude and behavioural intention constructs hoping to shed new light on the research question: Is there a significant relationship between service quality, students’ satisfaction, attitude and behavioural intention in higher education?
C

VOLUME NO. 3 (2013), ISSUE NO. 08 (AUGUST) ISSN 2231-5756
INTERNATIONAL JOURNAL OF RESEARCH IN COMMERCE, IT & MANAGEMENT A Monthly Double-Blind Peer Reviewed (Refereed/Juried) Open Access International e-Journal - Included in the International Serial Directories
http://ijrcm.org.in/
22
2. LITERATURE REVIEW 2.1 SERVICE QUALITY AND STUDENTS’ SATISFACTION The most important features of the service firm that drive customer satisfaction is service quality. Bitner et.al, (1990) defines service quality as the individual’s general attitude towards the service firm. Delivery of higher levels of service quality is the strategy that is increasingly being offered as a key to service providers, efforts to position themselves more effectively in the market place (Parasuraman, Zeithaml, and Berry 1988). It is fact to accept that service quality is a matter that has engaged academics leading to extensive debate over its conceptualization. As a result, in service literature similar views are expressed by many authors and numerous studies are seen addressing the diverse issues related to service quality in education (Donaldson and Ruciman 1995, Cook 1997, Mai 2005, Abdulla 2006, Barnes 2007, Nadiri et al 2009, Quinn et al 2009). Owing to the unique characteristics of services, namely intangibility, heterogeneity, inseparability and perishability, service quality cannot be measured objectively (Patterson and Johnson, 1993). Hence service quality in education is measured by “students’ perception of service quality”. Service quality literature shows that in most of the studies, service quality of higher education is measured either by SERVQUAL (Parasuraman et at., 1998) or SERVPERF (Cronin and Taylor, 1992) measuring instruments. It is interesting to identify about the applicability of SERVQUAL to education sector. Numerous studies have adapted this measurement in higher educational institutions (HEI) such as service quality in business schools and other higher educational institutions (Cuthbert, 1996; Soutar and McNeil, 1996; Saaditul et.al., 2000). The service quality is mostly recognized by the cooperation of the administrative staff and academic staff of the institution. Majority of the students’ get de-motivated if they found that the staff is not compassionate and kind. Spooreen et.al, (2007), posited a view that the organizational harmony, teachers’ intellectual ability, professional development, transparency in students’ evaluation, feedback and training are the important features that mentally develop the students. According to Hasan et.al., (2008), for quality assurance an institution must train its staff members in a way that it may create a sense of facilitation by means of coordination, cooperation, compassion and empathy. The traditional service quality research had been further enhanced through work in the domain of customer satisfaction (Spreng et al., 1996; Oliver, 1997). Kotler and Clarke (1987) define satisfaction as the expected outcome of a task or job that pleases one’s esteem. According to Zeithaml (1988), satisfaction is the resultant outcome of an institution’s administrative as well as educational system’s coherent performance. Student satisfaction refers to the favorability of a student’s subjective evaluation of the outcomes and experiences associated with education (Oliver and DeSarbo 1989). The availability of other academic facilities like intellectual faculty, advisors, carrier counseling department are the features that an institution needs for its students’ better performance and satisfaction (Bolton and Drew, 1991). Student satisfaction is being shaped continually by repeated experiences in campus life. Moreover, the campus environment is seemingly a web of interconnected experiences that overlap and influence student’s overall satisfaction (Elliott and Shin 2002). In general, perceived service quality is an antecedent to satisfaction (Spreng and Mckoy, 1996). Thus, a proper understanding of the antecedents and determinants of customer satisfaction can be seen as to have an extraordinarily high monetary value for service organization in a competitive environment (Lassar et al., 2000). High service quality results in higher customer satisfaction which results in high customer loyalty and eagerness to advice to others (Bolton and Drew, 1991; Boulding, 1993; Rust, 1994; Nadiri and Hussain, 2009). Oliver (1993) argued that customers must have some experiences of quality in order to decide whether they are satisfied or not. In this line, service quality is akin to the concept of appraisal, and satisfaction becomes an affective concept. That is, appraisal functions as the antecedent, or cause, of affective reactions (Oliver, 1989). Likewise, most studies have considered service quality as the antecedent of customer satisfaction (e.g. Anderson et al., 1994; Cronin et al., 2000; Fornell, 1992; Fornell et al. 1996). Rust and Oliver (1994) suggested that quality is subordinate to satisfaction; quality is one specific service dimension consumer’s factor in their satisfaction judgments. Bigne, Moliner and Sanchez (2003) found that the overall service quality have a significant relationship with satisfaction at R= 0.66. Ham and Hayduk (2003) have confirmed that, even in the higher educational settings, there is a positive correlation between perception of service quality and students’ satisfaction, and analyzing upon the relationship based on each of the dimension of service quality, reliability (R=0.547; sig. = 0.000) has the strongest relationship followed by responsiveness and empathy (R=0.5431; sig. = 0.000), assurance (R=0.492; sig. = 0.000) and tangibility (R=0.423; sig.= 0.000). In this study, we adopt most of the arguments and findings of the various prior studies (e.g. Anderson et al., 1994; Cronin et al., 2000), and take quality of service to be a determinant of customer satisfaction. We, therefore, suggest that: H1: Service quality has a positive influence on students’ satisfaction towards the institution. 2.2 STUDENTS’ SATISFACTION AND ATTITUDE TOWARDS THE INSTITUTION According to Seymour (1993), developing many happy satisfied customers, whether they are students, parents of students, alumni, or industry employer, should be a primary goal of higher education. Thus, focusing on enhancing the customer satisfaction at colleges and universities is crucial in developing customer value. Burton et al., (2001) argued that “a consumer’s overall attitude derived from the totality of their beliefs should be dependent on their total satisfaction, which will in turn be influenced by evaluations based on both direct experience and information received from external sources or cues”. In relation to consumer satisfaction and attitudes, it has been found that satisfied consumers develop positive brand attitudes and brand preferences (Roest and Pieters, 1977; Oliver,1980; Bolton, 1998) towards the object they are satisfied with. When satisfaction is treated as a post purchase constructs, the literature supports the argument that the liking or relative favourable attitude of the consumer will be developed on the basis of cumulatively satisfying usage occasions of the service (Bearden and Teel, 1983; Dick and Basu, 1994; O’Cass and Grace, 2004). According to Oliver (1981), customer satisfaction is relatively transient and is consumption specific, whereas attitudes are relatively enduring. Oliver (1980) found that satisfaction derived from past experience precedes and influences post purchase attitude. Bolton and Drew (1991) treated attitudes as a consequence of satisfaction; and Suh and Yi (2006) had established the same inference. In a subsequent empirical validation, Bitner (1990) treated perceived quality and attitude as synonyms and successfully validated the direct positive affection of satisfaction on perceived quality (attitude). Students’ attitudes will be expressed either as positive or negative (Keaveney, 1999) based on how far students’ expectations on the delivery of the services have been met by the institution. If a negative attitude is formed it will be difficult to achieve overall satisfaction and could result in complaints, decreasing loyalty and negative word of mouth (WOM) promotion (Kau and Loh 2006, Maxham 2001). Based on the previous studies (Bitner, 1990; Bolton and Drew, 1991) students’ satisfaction is considered as an antecedent to attitude in this study. Therefore, the hypothesis is framed as H2: Students’ satisfaction has a positive influence on attitude towards the institution. 2.3 ATTITUDE TOWARDS THE INSTITUTION AND BEHAVIOURAL INTENTION Consumer decision-making process is a complex and comprehensive process. Consumers not only evaluate the quality they receive. They develop attitudes based on the satisfaction felt by the services received. Further, in consumer behaviour there is a general consensus that attitudes impact consumer’s behavioural intention (Fishbein and Ajzen, 1975; Mackenzie and Lutz, 1989, Sudharani and kalpana, 2011). The underlying assumption for most of the previous attitude behaviour research is that the development of positive attitude will provide corresponding behaviour associated with the attitude object (Griffin and O’Cass, 2004) It has been shown that attitude formed through personal experiences are more likely to predict behaviour than attitudes formed through indirect marketing communication (Fazio et al, 1989; Grace and O’Cass, 2005). Just like customers in the market, students may have favorable behavioral intentions (FBIs) and unfavorable behavioral intentions (UFBIs) toward institution. FBIs could encompasses re-enrollment intention, provision of positive word-of-mouth, and encouraging friends and relatives to apply for admission; and UFBIs could cover intention to withdraw from university, provision of negative word-of-mouth, and discouraging friends and relatives to apply for admission. Boulding et al. (1993), in an investigation involving university students, identified strong links between service quality and FBIs; and Ham (2003), in a work involving university students, found a significant correlation between quality, satisfaction and student loyalty intentions / complaints. In terms of higher education, the main consequences found by some researchers were; loyalty, complaints and word of mouth actions (Athiyaman, 1997). A student loyal to his or her educational institutions must have a positive cognitive and emotional attitude towards the institution, one that provides the underlying motivation for his or her behaviour (Hennig- Thurau, T., et al 2001). Student loyalty is a key objective for many higher educational institutions as the advantages of the student loyalty are not limited to the time that the student spends in the institution. According to (Hennig-Thurau, T., et al 2001) Student

VOLUME NO. 3 (2013), ISSUE NO. 08 (AUGUST) ISSN 2231-5756
INTERNATIONAL JOURNAL OF RESEARCH IN COMMERCE, IT & MANAGEMENT A Monthly Double-Blind Peer Reviewed (Refereed/Juried) Open Access International e-Journal - Included in the International Serial Directories
http://ijrcm.org.in/
23
loyalty covers different behavioural intention: (1) word of mouth promotions (2) Repurchasing intention (3) Referral intentions and (4) Alumni-related intentions. According to Ajzen and Fishbein (1980), individuals have strong intention to engage in a behavior if they positively assess that behavior and believe that others think they should engage in that behavior. Hence, this study considers attitude towards institution as the antecedent to behavioural intention. We, therefore frame the following hypothesis: H3: Attitude towards the institution influence behavioural intention.
3. OBJECTIVES The objectives of the study have been framed as follows: 1. To study the relationship between service quality, satisfaction, attitude and behavioural intention. 2. To study the impact of service quality on satisfaction of students’ 3. To study the impact of satisfaction of students’ on attitude 4. To study the impact of attitude of students’ on behavioural intention
4. METHODOLOGY For the purpose of studying the objectives and testing the hypotheses, a questionnaire was framed as an instrument to collect the data. The questionnaire consisted of two parts so as to fulfil the objectives of the study. The first part captured the demographic characteristics of the respondents and the second part captured their response towards service quality, overall satisfaction, attitude towards the institution and their behavioural intention. Service quality was measured based on SERVQUAL (Parasuramanan, 1985) and other constructs such as overall satisfaction, attitude and behavioural intention were measured using items derived from previous studies by Cronin et al., (2000), Ajzen and Fishbein (1980), Athiyaman (1997) and Zeithaml et al., (1996). However the questionnaire was subjected to validity and reliability test. Through a process of item validation using a panel of expert judges in the field of higher education, various alterations were undertaken relating to the content of the questionnaire. Further, the experts were requested to offer their feedback on each of the items. The experts suggested a 5-point rating scales for all the items that capture service quality, overall satisfaction, attitude towards the institution and behavioural intention. A few statements were also simplified so as to enable the respondents to understand it better. The convergent validity of each construct is checked by examining the “Average Variance Extracted (AVE)” values. Constructs which have AVE values greater than 0.5 are said to have convergent validity or unidimentionality. (Chin et al., 2003; Barclay et al., 1995; Anderson and Gerbing, 1988). After the data is collected, Reliability of constructs is tested using Cronbach’s alpha. (Cronbach,1951). An alpha score larger than 0.7 is generally acceptable as sufficient accuracy for a construct (Nunnally, 1978). Table 1 presents the reliability and validity results by AVE scores and Cronbach’s alpha scores on each of the four constructs Service quality, Overall satisfaction, Attitude and Behavioural intention.
TABLE 1: CONSTRUCT AVE SCORE AND CRONBACH’S ALPHA VALUE
Construct AVE Cronbach's alpha
Service Quality 0.686781 0.909407
Overall satisfaction 0.824101 0.920120
Attitude 0.789637 0.839943
Behavioural Intention 0.732609 0.799318
The survey was administered among 180 MBA graduates in Coimbatore city. The main reason for choosing Coimbatore city is that, it is considered to be the educational hub with more than 100 institutions offering management education. Non-probability convenience sampling technique was used to choose the respondents. The study uses PLS path modeling technique. This method does not make any assumptions about the distribution of the data and is non parametric in nature. Path analysis is done using Visual PLS to calculate the construct scores.
5. HYPOTHESIS TESTING AND DISCUSSION
FIG. 1: PROPOSED MODEL OF SERVICE QUALITY AND STUDENTS’ BEHAVIOURAL INTENTION
H1 (+) H2 (+) H3 (+) A construct level correlation analysis was used as a preliminary check for the three hypotheses proposed in section 3. Visual PLS is used to calculate the construct scores. These scores are checked for significant correlation using SPSS package. The correlation scores are shown in Table 2. It is seen that all the correlations are significant. Only the correlation between overall satisfaction and attitude towards institution seems to be low (though significant). This may be explained by the fact that the attitude towards institution depends on a number of other factors like economic conditions, personality, job trends, etc that have not been considered in this research study.
TABLE 2 : CORRELATION OF CONSTRUCTS USED IN THE MODEL
Hypothesis Independent Variable Dependent Variable Pearson Correlation Sig (2 tailed)
H1 Service Quality Overall Satisfaction 0.756 0.000
H2 Overall Satisfaction Attitude 0.412 0.000
H3 Attitude Behavioural Intention 0.614 0.000
Although the bivariate correlations are significant for most hypotheses when considered in pairs, it is still needed to check whether they are still significant when the constructs are put together in a structural model as a causal effect. A rigorous test of the significance of various proposed relations can be tested using the bootstrap function in Visual PLS. It is possible to use resampling methods (bootstrap and jack knife) to obtain the significance of the various paths in the model (Efron 1979; Efron and Gong 1983). Bootstrap is more reliable in estimating the significance of paths. So this research has considered and used bootstrap for the purpose of determining causal relations proposed in the model. In boot strap used in this research, random samples sized 180 (the respondent number) were taken, and 500 such samples were taken (to get best estimates a resample number of 500 is recommended although in theory an infinite resample is needed for the purpose). The results were examined for significance. At 5% level of significance the cutoff t-statistic is 1.96. In general it is assumed that if the t statistic is more than 2, the path is significant.
Overall
Satisfaction Service Quality Behavioural
intention Attitude

VOLUME NO. 3 (2013), ISSUE NO. 08 (AUGUST) ISSN 2231-5756
INTERNATIONAL JOURNAL OF RESEARCH IN COMMERCE, IT & MANAGEMENT A Monthly Double-Blind Peer Reviewed (Refereed/Juried) Open Access International e-Journal - Included in the International Serial Directories
http://ijrcm.org.in/
24
TABLE 3: PROPOSED MODEL BOOT STRAP SUMMARY
Hypothesis Entire Sample estimate Mean of Sub samples Standard error T-Statistic R Square Result
H1 0.812 0.8543 0.0385 36.9547 0.782 Significant
H2 0.625 0.6371 0.0174 11.1092 0.585 Significant
H3 0.848 0.8115 0.0222 22.7225 0.316 Significant
H1: Service quality has a positive influence on student’s satisfaction towards the institution. From the Table 3 it is found that the relationship is significant (beta = 0.812, t=36.9547) The R Sq value is also very high (0.782). This show that when students are satisfied with the service quality of the institution the overall satisfaction level increases accordingly. The results are in line with the findings of Mahiah., S. et al. (2006),who found that the overall service quality have a significant relationship with satisfaction at R= 0.66. Further, the result supports the findings of Ham and Hayduk (2003) who found that even in the higher educational settings, there is a positive correlation between perception of service quality and student satisfaction. Parasuraman et al., (1985), exemplified cases where respondents were, impressed to some extent but the service did not meet their expectations, because most events of customer satisfaction narrate a specific assessment of a service experiences where customer’s pleasure is analyzed as it relates to a particular transaction (Howard and Sheth 1969; Hunt 1979; Singh 1988). From this perspective, customer satisfaction is mere a minor aspect, it’s the service quality that counts most. It is important for the higher educational institutions to concentrate on the service quality and improve the satisfaction level of students. H2: Students’ satisfaction has a positive influence on attitude towards the institution. From the Table 3, it is found that the relationship is significant (beta = 0.625, t=11.1092) The R Sq value is also high (0.585). This show the overall satisfaction level of students towards the institutions positively affects the students’ attitude towards the institution. This is in support of the findings by Oliver (1980) who found that satisfaction derived from past experience precedes and influences post purchase attitude. Further, Bolton and Drew (1991) treated attitudes as a consequence of satisfaction; and Suh and Yi (2006) had established the same inference. H3: Attitude towards the institution influence behavioural intention. From the Table 3, it is found that the relationship is significant (beta = 0.848, t=22.7225) The R Sq value is also high (0.316). This shows that the students’ attitude towards the institution will affect their behavioural intention. The result is supported by Mackenzie and Lutz (1989) who has concluded that attitudes impact consumers’ behavioural intention. This indicates that the attitude of the customer determines the behavioural intention like being a regular buyer, spreading positive word of mouth communication which might result in creating new customers and negative word-of-mouth communication leading to reduction in customer satisfaction (Richins, 1983).
FIG. 2: PROPOSED MODEL VALIDATION TERMS USED IN MODEL Ser_qual : Service quality, Over_Sat : Overall satisfaction,Attitude: Attitude, Beh_inte : Behavioural intention
6. FINDINGS The results of the structural equation model analysis indicate that the satisfaction level on service quality influence the overall satisfaction, overall satisfaction influences the students’ attitude; students’ attitude towards institution influences the behavioural intention as given in the proposed model. Further the analysis also reveals that the relationship between attitude of students’ and behavioural intention is stronger than any other constructs. Focusing on the results concerning to behavioural intention, our study indicates that by ensuring a high level of service quality, administrators of the institutions will be able to trigger positive customers’ reactions that are key for the sustainable development of the higher educational institutions. In fact, it has been widely suggested that key success factors for higher educational institutions are based on the brand awareness and building customer loyalty (Zeithaml et al., 2002).
7. RECOMMENDATIONS, SUGGESTIONS AND CONCLUSION The higher education sector today faces intense global competition and forced to focus on marketing strategies for their long term survival. It is essential for the administrators to develop the institutions which may result in building a sustainable competitive advantage. To achieve that it is necessary to understand the attitude of customers and their behavioural intention. An attempt is made to analyse the relationship between service quality, overall satisfaction, attitude and behavioural intention. The result of the study shows that service quality, overall satisfaction, attitude and behavioural intention have stronger relationship which indicates that by ensuring a high level of service quality, administrators of the institutions will be able to trigger positive customers’ responses that are necessary for the sustainable development of the higher educational institutions. The result of the current research study provides several implications for higher educational institution administrators and marketers. First, the quality of service should be good and that should meet the expectations of the customer. Second, the institutions can train the staff members to attract and satisfy the students through appropriate behaviour. Third, they should reinforce the word of mouth activities from satisfied customers by organising various alumni meets and other programs.
8. LIMITATIONS AND SCOPE FOR FUTURE RESEARCH As in the case with any research effort, this study is not free of limitations. However, these limitations serve as avenues for future research. First, the study had taken only service quality influence on the satisfaction of the students whereas there could be influence of other factors related of the institution which might influence the satisfaction, attitude and behavioural intention of the students. Second, this was a quantitative study. It used a survey to collect data from the respondents. This type of data collection technique limited the nature of the responses given by the participants. Third, the data was collected from a sample that only included students from institutions in a single geographic region. Fourth, the variables used in the study are drawn from the literature on service quality, satisfaction, attitude and behavioural intention. However, the existence of other external factors cannot be ruled out. This study only tested the proposed model using Visual PLS path analysis as framed after the analysis of related literature. The study considered only service quality dimensions of the institution. Future research can be carried out with all the other factors related to the institution which may influence satisfaction, students’ attitude towards the institution and their behavioural intention. The study restricts only to the higher educational institutions in Coimbatore city. Therefore, future study could be conducted in different regions. There is also scope for a comparative study with different categories of institutions. Further effort could be taken to measure the gap between the expectation and satisfaction level of students with regard to the institution they study.
0.8128 0.625 0.8482
(11.1092)
(22.7225)
Ser_qual Over_Sat
(36.9547)
Attitude Beh_inte
RSq = 0.782 RSq = 0.585
RSq = 0.316

VOLUME NO. 3 (2013), ISSUE NO. 08 (AUGUST) ISSN 2231-5756
INTERNATIONAL JOURNAL OF RESEARCH IN COMMERCE, IT & MANAGEMENT A Monthly Double-Blind Peer Reviewed (Refereed/Juried) Open Access International e-Journal - Included in the International Serial Directories
http://ijrcm.org.in/
25
REFERENCES 1. Abdulla. F. (2006), “The development of HEdPERF: a new measuring instrument of service quality for the higher education sector”, International Journal of
consumer studies, Vol. 30, Issu – 6, (November), pp. 569-581. 2. Ah-Keng Kau and Elizabeth Wan-Yiun Loh (2006), “The effects of service recovery on consumer satisfaction”, Journal of Services Marketing, Volume 20 ·
Number 2 · 2006 · 101–111. 3. Ajzen, I. and Fishbein, M. (1980), Understanding Attitudes and Predicting Social Behaviour, Prentice-Hall, Englewood Cliffs, NJ. 4. Anderson J.C. and Gerbing D.W. (1988), 'Structural Equation Modeling in Practice: A Review and Recommended Two-Step Approach,' Psychological
Bulletin, 103(3), 411-423. 5. Anderson, E., Fornell, C and Lehmann, D. (1994), “Customer satisfaction, market share and profitability”’ Journal of Marketing, Vol. 56, July, pp.53–66. 6. Athiyaman, A. (1997) Linking student satisfaction and service quality perceptions: the case of university education. European Journal of Marketing, 31(7),
528-540. 7. Barclay D., Higgins C. and Thompson R. (1995), 'The Partial Least Squares (PLS) Approach to Causal Modeling': Personal Computer Adoption and Use as an
Illustration. Technology Studies, volume 2, issue 2, 285-309 8. Barnes B.R. (2007), “Analysing service quality: The case of post-graduate Chinese students”’ Total quality management, Vol.18, Iss- 3 May, pp;313-331. 9. Bearden, w. and Teel, J. (1983), “Selected determinants of consumer satisfaction and complaint reports”, Journal of marketing research, Vol.-2, Iss.-
February, pp.21-28. 10. Bigne, E., Moliner, M. A., & Sanchez, J. (2003). Perceived quality and satisfaction in multi service organizations: The case of Spanish public services. The
Journal of Services Marketing, 17 (4), 420-442. 11. Bitner, M. J., 1990, Evaluating service encounters: the effects of physical surroundings and employee responses, Journal of Marketing, 54(2), 69-82. 12. Bolton, R. (1998), “a dynamic model of the duration of the customer’s relationship with a continous service provider: the role of satisfaction”, Marketing
science, Vol.-17, Iss.-1, 45-65. 13. Bolton, R.N. and Drew, J.H. (1991). A multistage model of customer’s assessment of service quality and value. Journal of Consumer Research, 17(4), 365-84. 14. Boulding, W., Kalra, A., Staelin, R. and Zeithaml, V. A., 1993, A dynamic process model of service quality: from expectations to behavioral intentions,
Journal of Marketing Research, 30(1), 7-27. 15. Burton, J., Easingwood, C., and Murphy, J. (2001), “Using qualitative research to define service quality models”’ qualitative Market Research: An
international Journal, vol. 4, No.4, pp. 217-223. 16. Carlo Simulation Study and an Electronic-Mail Emotion / Adopion Study', Information Systems Research, vol. 14, no. 2, pp. 189-217. 17. Chen, S. C., Chen, H. H. and Chen, M. F., 2009, Determinants of satisfaction and continuance intention towards self-service technologies, Industrial
Management and Data System, 109(9), 1248-1263. 18. Chin Wynne W., Marcolin Barbara L. and Newsted Peter R. (2003), 'A Partial Least Squares Latent Variable Modeling Approach for Measuring Interaction
Effects. Results from a Monte 19. Churchill, O. A., Jr., & Surprenant, C. (1982), “An investigation into the detetminants of customer satisfaction”, Journal of Marketing Research, 19(4),491-
504. 20. Clemes, M., Mollenkopf, D., & Bum, D. (2000). An investigation of marketing problems across service typologies. The Journal of Services Marketing, 14(7),
573-594. 21. Cook. M.J.(1997),”A student’s perspective of service quality in Education”’ Total quality management, Vol.8, Iss 2&3, pp. 120-128. 22. Cronbach L.J. (1951), 'Coefficient Alpha and Internal Structure of Tests' , Psychometrika, 16, pp.297-334. 23. Cronin, J., Brady, M., Thomas, G and Hult, M (2000), “Assessing the effects of quality, value and customer satisfaction on consumer behavioural intention in
service environments”’ Journal of Retailing, Vol. 76, No.2. pp. 193-221. 24. Cronin, J.,& Taylor, S. A. (1992). Measuring Service Quality: A reexamination and extension. Journal of Marketing, 56(3), 55-68. 25. Crosby, L. (1991). Expanding the role ofCSM in total quality. International Journal of Service Industry Management, 2(2),5-19. 26. Cuthbert, P. F. (1996). Managing service quality in Higher Education: is SERVQUAL the answer? Part 2. Managing Service Quality, 6(3), 31-35. 27. Dalton, H. & Denson, N. (2009). Student evaluation: what predicts satisfaction? in The Student Experience. Proceedings of the 32nd HERDSA Annual
Conference, Darwin, 100-110. 28. DeShields, O. W. J., Kara, A., & Kaynak, E. (2005). Detenninants of business student satisfaction and retention in higher education: applying Herzberg's two-
factor theory. The International Journal of Educational Management, 19(2/3), 128-139. 29. Dick, A. and Basu, K. (1994), “Customer loylty: toward an integrated conceptual framework”, Journal of the academy of marketing science, Winter, pp.99-
113. 30. Donaldson.B and Runciman, F (1995), “Service quality in further education: an insight into management perceptions of service quality and those of the
actual service provider”, Journal of marketing management, Vol.-11, pp.243-256. 31. Efron B. and Gong G. (1983). 'A Leisurely Look at the Bootstrap, the Jackknife, and Cross-Validation' The American Statistician, 37(1), pp.36-48. 32. Efron B.,(1979), 'Bootstrap methods: Another look at the jackknife', Annals of Statistics, vol. 7, number 1, pp. 1-26. 33. Elliot, K. & Shin, D. (2002). Student satisfaction: An alternative approach to assessing this important concept. Journal of Higher Education Policy and
Management, 24, 197-209. 34. Fazio, R., Powell, M. and Williams, C. (1989), “The role of attitude accessibility in the attitude –to- behaviour process”, Journal of consumer research, Vol.-
16, pp. 280-289. 35. Fishbein, M. and Ajzen, I (1975), Beliefs, attitude, intention and behaviour: An introduction to theory and research, Addison – Wesley, Reading, MA. 36. Fornell, C.(1992) A national customer satisfaction barometer: the Swedish experience, Journal of Marketing, 56(1), pp.6–21. 37. Fornell, C., Johnson, M.D., Anderson, E.W, Cha, J.& Bryant, B.E.(1996), American customer satisfaction index: nature, purpose, and findings, Journal of
Marketing, 60(4),pp.7–18. 38. Giese, J. L., & Cote, J. A. (2000). Defining consumer satisfaction. Academy of Marketing Science Review, 2000, 1. 39. Grace, D. and O’Cass, A. (2004), “Exploring consumer experiences with a service brand”, Journal of product & brand management, Vol.-13, Iss.-4, pp. 257-
268. 40. Grace, D. and O’Cass, A. (2005), “Examining the effects of service brand communications on brand evaluation”, Journal of product & brand management,
Vol.-14, Iss.-2, pp. 106- 116. 41. Griffin, D. and O’Cass, A. (2004), “Exploring anti-smoking and anti-binge drinking issues in the context of generally accepted consumer theory”, Journal of
non-profit and public sector marketing, Vol.-12, Iss.-2, pp. 105-127. 42. Ham, L., & Hayduk, S. (2003). Gaining competitive advantages in higher education: analyzing the gap between expectations and perceptions of service
quality. International Journal of Value-Based Management, 16 (3), 223-242. 43. Hasan, H. F. A., Ilias, A., Rahman, R. A. & Razak, M. Z. A. (2008). Service Quality and Student Satisfaction: A Case Study at Private Higher Education
Institutions. International Business Research, 1(3), 163-175. 44. Hennig-Thurau,T., Langer, M.F., & Hansen, U. (2001), “Modeling and managing a student loyalty: An approach based on the concept of relationship
quality”, Journal of Service Research, 3(4), pp. 331 -344. 45. Howard, J. A., & Sheth , J. N. (1969). The Theory of Buyer Behavior, New York: John Wiley and Sons, Inc. 46. Hunt, H.K. (1979). Conceptualization and Measurement of Consumer Satisfaction and Dissatisfaction, Cambridge, MA: Marketing Science Institute.

VOLUME NO. 3 (2013), ISSUE NO. 08 (AUGUST) ISSN 2231-5756
INTERNATIONAL JOURNAL OF RESEARCH IN COMMERCE, IT & MANAGEMENT A Monthly Double-Blind Peer Reviewed (Refereed/Juried) Open Access International e-Journal - Included in the International Serial Directories
http://ijrcm.org.in/
26
47. Jacob, J. & Chestnut, R. W. (1978). Brand Loyalty: Measurement and Management. New York: Wiley. 48. Keaveney, Susan M. and Clifford E. Young (1997), “The Student Satisfaction and Retention Model (SSRM),” working paper, University of Colorado at
Denver. 49. Kotler, P. & Clarke, R.N. (1987). Marketing for health care organizations. Englewood Cliffs, NJ: Prentice-Hall. 50. Kotler, P. & Levy J. Sydney (1969), “Broadening the concept of Marketing”’ Journal of Marketing, Vol. 13, January, pp. 19-25. 51. MacKenzie, S and Lutz, R. (1989), “An empirical examination of the structural antecedents of attitude toward the ad in an advertising pretesting context”,
Journal of marketing, Vol.-53, April, pp.48-65. 52. Mahiah., S., Suhaimi., S., & Ibrahim., A.(2006). Measuring the level of customer satisfaction among employees of human Resource Division. Advances in
Global Business Research 2006. Vol. 3. No.1. ISSN: 1549-9332. 53. Mai .L (2005), “Student satisfaction in higher education and its influential factors a comparative study between UK and US”, Journal of marketing
management, Vol.-21, pp.469-480. 54. Maxham, J.G. (2001), “Service recovery’s influence on consumer satisfaction, positive word-of-mouth and purchase intentions”, Journal of Business
Research, Vol. 54, pp. 11-24. 55. Nadiri.H, Kandampully J. and Hussain K. (2009), “Perceptions of service quality in higher education”, Total quality management, Vol.20, Iss- 5, May pp.523-
535. 56. Nunnally, L., 1978, Psychometric Theory, McGraw-Hill, New Jersey. 57. Oliver, R. (1980), “ a cognitive model of the antecedents and consequences of satisfaction decisions”, Journal of marketing research, Vol.-17, Iss.-4, pp.460-
469. 58. Oliver, R. L., 1981, Measurement and evaluation of satisfaction process in retail setting, Journal of Retailing, 57(3), 25-48. 59. Oliver,R.L.(1993)Conceptualmodelofservicequalityandservicesatisfaction:compatiblegoals,differentconcepts.In:T.A.Swartz,D.E.Bowen&S.W.Brown(Eds)Adv
ancesinServiceMarketingandManagement:ResearchandPractice (Greenwich:JAI). 60. Oliver,R.L., (1997), “Satisfaction A behavioyral perspective on the consumer”’Irwin, N.J: Mc Graw – Hill. 61. Oliver. R. L and DeSarbo. W.S (1989), “Processing of the satisfaction response in consumption: a suggested framework and research proposition”’ Journal
of consumer satisfaction, dissatisfaction and complaining behaviour, Vol.2, pp.1-16. 62. Parasuraman, A., Berry, L.L. and Zeithaml, V.A. (1990), Delivering Quality Service, The Free Press, New York, NY. 63. Parasuraman, A., Zeithaml, V. A., & Berry, L. L. (1985). A conceptual model of service quality and its implications for future research. Journal of Marketing,
49(4), 41-50. 64. Parasuraman, A., Zeithaml, V. A., & Berry, L. L. (1988). SERVQUAL: A multiple-item scale for measuring consumer perceptions of service quality. Journal of
Retailing, 64(1), 12-37. 65. Patterson, P.G., and Johnson, L.W.(1993), “Disconfirmation of expectations and the gap model of service quality: an integrated paradigm”, Journal of
satisfaction dissatisfaction and complaining behaviour, Vol. -6, Iss.-1, pp.90-99. 66. Qinn H. and Prybutok, V.R. (2009), “Service quality, customer satisfaction and behavioural intention in fast food restaurants”, International journal of
quality and social sciences, Vol.-1, Iss.1. 67. Rad, A. M. M. & Yarmohammadian, M. H. (2006). A study of relationship between managers’ leadership style and employees’ job satisfaction. Leadership in
Health Services, 19(2), 11-28. 68. Richins, M. L. (1983) Negative word-of-mouth by dissatisfied customers: a pilot study, Journal of Marketing, Vol. 47, Issue 1, pp. 68 -78. 69. Roest, H. and Pieters, R. (1997), “The nomological net of perceived service quality”, International journal of service industry management, Vol.-8, Iss.-4, pp.
336-351. 70. Rust, R. T., & Oliver, R. L. (1994). Service quality: Insights and managerial implications from the frontier. In R. T. Rust & R. L. Oliver (Eds.), Service quality:
New Directions in theolY and· practice (pp. 1-19): Thousand Oaks: Sage Publications 71. Rust, R. T., Zahorik, A. J., & Keiningham, T. L. (1995). Return on quality (ROQ): Making service quality financially accountable. Journal of Marketing, 59(2),
58-70. 72. Saaditul Ibrahim, Shamsinar Md SIdin & Wong Chee Meng (2000). Customer satisfaction towards service quality of higher education in Malaysia. Seminar
FEP 2000 Pulau Pinang, 20 - 23 October 2000. Retrieved November 9th, 2004, from http://www.econ.upm.edu.my/ repport/mgm11b.html. 73. Seymour, Daniel T. (1993), On Q: Causing Quality in Higher Education, Phoenix, AZ: Orxy Press, 42. 74. Shevlin, M., Banyard, P., Davies, M. & Griffiths, M. (2000). The validity of student evaluation of teaching in higher education: Love me, love my lectures?
Assessment and Evaluation in Higher Education, 25, 397-405. 75. Singh, J. (1988). Consumer Complaint Intentions and Behavior: Definitional and Taxonomical Issues. Journal of Marketing, 52, 93-107 76. Soutar, G. & McNeil, M. (1996). measuring service quality in a tertiary institution. Journal of Educational Administration, 34(1), 72-82. 77. Spooren, P., Mortelmans, D. & Denekens, J. (2007). Student evaluation of teaching quality in higher education: development of an instrument based on 10
Likert-scales. Assessment and Evaluation in Higher Education, 32, 667-679. 78. Spreng, R., Harrell, G. amd Mackoy, R. (1996), “Service recovery: impact on satisfaction and intentions”, Journal of service marketing, Vol.-9, No.1, pp.15-
23. 79. Sproule, R. (2000). Student evaluations of teaching: A methodological critique of conventional practices. Education Policy Analysis Archives, 8(50), 125-142. 80. Sudharani Ravindran D and M. Kalpana (2011) “Students’ Attitude and Behavioural Intention towards Higher Educational Institutions”, International journal
of applied research, Vol.12. 81. Suh, J. C. and Yi, Y., 2006, When brand attitudes affect the customer satisfaction-loyalty relation: the moderating role of product involvement, Journal of
Consumer Psychology, 16(2), 145-155. 82. Sureshchandar, G. S., Chandrasekharan, R., & Anantharaman, R. N. (2002). The relationship between service quality and customer satisfaction - A factor
specific approach. The Journal of Services Marketing, 16(4),363-379. 83. Tse, D. K. and Wilton, P. C., 1988, Models of consumer satisfaction: an extension, Journal of Marketing Research, 25(2), 204-212. 84. Wachtel, H. K. (1998). Student evaluation of college teaching effectiveness: A brief review. Assessment and Evaluation in Higher Education. 23(2), 191-212. 85. Zeithaml, V. A., Berry, L. L., & Parasuraman, A. (1996). The behavioral consequences of service quality. Journal of Marketing. 60(2), 31-46. 86. Zeithaml, V.A. (1988). Consumer perceptions of price, quality, and value: a means-end model and synthesis of evidence. Journal of Marketing, 52, 2-22,

VOLUME NO. 3 (2013), ISSUE NO. 08 (AUGUST) ISSN 2231-5756
INTERNATIONAL JOURNAL OF RESEARCH IN COMMERCE, IT & MANAGEMENT A Monthly Double-Blind Peer Reviewed (Refereed/Juried) Open Access International e-Journal - Included in the International Serial Directories
http://ijrcm.org.in/
27
ENERGY USES IN INDIA: A CASE OF ELECTRICITY
M.ANANDAN RESEARCH SCHOLAR
DEPARTMENT OF ECONOMICS THE GANDHIGRAM RURAL INSTITUTE-DEEMED UNIVERSITY
DINDIGUL
S.RAMASWAMY PROFESSOR
DEPARTMENT OF ECONOMICS THE GANDHIGRAM RURAL INSTITUTE-DEEMED UNIVERSITY
DINDIGUL
ABSTRACT The global economy is set to grow four-fold between now and 2050 and growth could approach ten-fold in developing countries such as India and China. This promises economic benefits and huge improvements in people’s standard of living, but it implies a much greater use of energy. Indian electricity supply and demand is projected to increase four to five-fold between now and 2050 (IEA-2008). This development requires massive investments, but it also creates unique opportunities to dramatically change the CO2 intensity of Indian electricity supply. However, the expansion of the power sector in India faces many barriers such as a spatially uneven distribution of natural resources, financial constraints and high system losses. Accelerated development of natural resources and more transmission and distribution (T&D) capacity are needed in order to overcome the current problems. Increased competition, additional equipment supply capacity and other actions to increase the private sector interest can help to accelerate investments (Dolf Gielen et al, 2009). Hence, Government of India is giving the highest priority to the development of power sector. Initiatives are being taken to bring about comprehensive reforms in the power sector to facilitate and attract investments and bring about improvements in the efficiency of delivery systems. Energy demand, in particular electricity production has resulted in creation of fossil fuel based power plants that let out substantial green house gas, carbon emission into the atmosphere causing climate change and global warming. Further, shortages and constraints in availability of fossil fuels, also necessitates concentrating on the renewable energy in order to bring down the gap between demand and supply. The energy sector is merging as a vital sector in the Indian economy and in the next few years is likely to see a significant growth in power generation capacity in the country. This is likely to happen through a combination of Public Private Partnerships, private sector investments as well as through Government investment in the Public Sector. The growth would be across a wide spectrum of technologies, with significant capacity addition expected in both hydro as well as coal based thermal sectors. With the civil nuclear co-operation deal a reality, there would be capacity additions in the nuclear energy sector. New initiatives on gas based power plants are expected. Most importantly, new and renewable energy, including wind power, bio-mass and solar power would play an important part. As a result, the power scenario in different states is likely to change significantly. This study attempts to look at the power crisis situation in southern region states in India, and demand supply gap to look at alternative opportunities, policies and strategies.
KEYWORDS Indian electricity, energy uses.
INTRODUCTION lectricity power is a critical components as well as determinant of a nation’s development. It is the most widely used industry, agriculture, domestic and commercial sector. It has become an inevitable necessity influencing every aspect of life and forming an increasing proposition of consumption, particularly in developing countries. As a key infrastructure component, it provides access to communication across the world, and creates externalities in
production, distribution and exchange activities both as an intermediate input and as a component of final demand. It is the most economical and therefore essential form of energy for industrial and agriculture growth. The electricity sector in India had an installed capacity of 207.85 GW as of September 2012, the world's fifth largest. Captive power plants generate an additional 31.5 GW. Thermal power plants constitute 66.0 per cent of the installed capacity, hydroelectric about 19.0 per cent and rest being a combination of wind, small hydro, biomass, waste-to-electricity, and nuclear. In terms of fuel, coal-fired plants account for 56.0 per cent of India's installed electricity capacity, compared to South Africa's 92.0 per cent; China's 77.0 per cent; and Australia's 76.0 per cent. After coal, renewal hydropower accounts for 19.0 per cent, renewable energy for 12.0 per cent and natural gas for about 9 per cent. As December 2011, over 300 million Indian citizens had no access to electricity. Over one third of India's rural population lacked electricity, as did 6 per cent of the urban population. Of those who did have access to electricity in India, the supply was intermittent and unreliable. In 2010, blackouts and power shedding interrupted irrigation and manufacturing across the country. The per capita average annual domestic electricity consumption in India in 2009 was 96 kWh in rural areas and 288 kWh in urban areas for those with access to electricity, in contrast to the worldwide per capita annual average of 2600 kWh and 6200 kWh in the European Union. India's total domestic, agricultural and industrial per capita energy consumption estimates vary depending on the source. Two sources place it between 400 to 700 kWh in 2008–2009. As of January 2012, one report found the per capita total consumption of electricity in India to be 778 kWh. India currently suffers from a major shortage of electricity generation capacity, even though it is the world's fourth largest energy consumer after United States, China and Russia. The International Energy Agency (IEA) estimates that India needs an investment of at least $135 billion to provide universal access of electricity to its population. The IEA estimates that India will add between 600 GW to 1200 GW of additional new power generation capacity before 2050. This added new capacity is equivalent to the 740 GW of total power generation capacity of European Union (EU-27) in 2005. The technologies and fuel sources India adopts, as it adds this electricity generation capacity, may make significant impact to global resource usage and environmental issues. India's electricity sector is amongst the world's most active players in renewable energy utilization, especially wind energy. As of December 2011, India had an installed capacity of about 22.4 GW of renewal technologies-based electricity. India's network losses exceeded 32 per cent in 2010 including non-technical losses, compared to world average of less than 15 per cent. Both technical and non-technical factors contribute to these losses, but quantifying their proportions is difficult. But the Government pegs the national T&D losses at around 24 per cent for the year 2011 and has set a target of reducing it to 17.1 per cent by 2017 to 14.1 per cent by 2022. Some experts estimate that technical losses are about 15 per cent to 20 per cent, a high proportion of non‐technical losses are caused by illegal tapping of lines, but faulty electric meters that underestimate actual consumption also contribute to reduce payment collection. Key implementation challenges for India's electricity sector include new project management and execution, ensuring availability of fuel quantities and qualities, lack of initiative to develop large coal and natural gas resources present in India, land acquisition, environmental clearances at state and central government level, and training of skilled manpower to prevent talent shortages for operating latest technology plants.
E

VOLUME NO. 3 (2013), ISSUE NO. 08 (AUGUST) ISSN 2231-5756
INTERNATIONAL JOURNAL OF RESEARCH IN COMMERCE, IT & MANAGEMENT A Monthly Double-Blind Peer Reviewed (Refereed/Juried) Open Access International e-Journal - Included in the International Serial Directories
http://ijrcm.org.in/
28
POOR ACCESS OF ELECTRICITY Energy-as a driver of development-plays a central role in both fighting poverty and addressing climate change. World as whole 1.4 billion people of the no access to electricity and India accounts for over 300 million, besides Some 800 million Indians use traditional fuels – fuelwood, agricultural waste and biomass cakes – for cooking and general heating needs. These traditional fuels are burnt in cook stoves, known as chulah or traditional chulha in some parts of India. According to WHO, claim 300,000 to 400,000 people in India die of indoor air pollution and carbon monoxide poisoning every year because of biomass burning and use of traditional in efficient chullahs. Traditional fuel burning in conventional cook stoves releases unnecessarily large amounts of pollutants, between 5 to 15 times higher than industrial combustion of coal, thereby affecting outdoor air quality, haze and smog, chronic health problems, damage to forests, ecosystems and global climate. Burning of biomass and firewood will not stop, these reports claim, unless electricity or clean burning fuel and combustion technologies become reliably available and widely adopted in rural and urban India. The growth of electricity sector in India may help find a sustainable alternative to traditional fuel burning. To ensure that everyone has access to quality power and a planet that can sustain future life on it. Energy poverty is one of the most serious problems that the country faces today. While the government has set a timeline of 2012 for providing “electricity to all”, 78 million households still lack access to electricity and many more millions have access only in principle and not in reality. India is yet to develop the energy infrastructure to power the entire country and therefore has an opportunity to build the infrastructure of the future.
ELECTRICITY DEMAND As in previous years, during the year 2010–11, demand for electricity in India far outstripped availability, both in terms of base load energy and peak availability. Base load requirement was 861,591 MU against availability of 788,355 MU, a 8.5 per cent deficit. During peak loads, the demand was for 122 GW against availability of 110 GW, a 9.8 per cent shortfall. (Central Electricity Authority -2011) expected, for 2011–12 year, a base load energy deficit and peaking shortage to be 10.3 per cent and 12.9 per cent respectively. The peaking shortage would prevail in all regions of the country, varying from 5.9 per cent in the North-Eastern region to 14.5 per cent in the Southern Region. India also expects all regions to face energy shortage varying from 0.3 per cent in the North-Eastern region to 11.0 per cent in the Western region. India's Central Electricity Authority expects a surplus output in some of the states of Northern India, those with predominantly hydropower capacity, but only during the monsoon months. In these states, shortage conditions would prevail during winter season. According to this report, the five states with largest power demand and availability, as of May 2011, such as Maharashtra, Andhra Pradesh, Tamil Nadu, Uttar Pradesh and Gujarat. In 2011, Gujarat was declared a power surplus state, with about 2–3 GW more power available than its internal demand. The state was expecting more capacity to become available. It was expecting to find customers, sell excess capacity to meet power demand in other states of India, thereby generate revenues for the state (Ministry of Power, GOI). According to Electric Power Survey Report 17th 2010–11, despite an ambitious rural electrification program, 80 per cent of Indian villages have at least an electricity line; just 52.5 per cent of rural households have access to electricity. In urban areas, the access to electricity is 93.1 per cent in 2008. The overall electrification rate in India is 64.5 per cent while 35.5 per cent of the populations still live without access to electricity. India's industrial demand accounted for 35.0 per cent of electrical power requirement, domestic household use accounted for 28.0 per cent, agriculture 21.0 per cent, commercial 9.0 per cent, public lighting and other miscellaneous applications accounted for the rest. The electrical energy demand for 2016–17 is expected to be at least 1392 Tera Watt Hours (TWh), with a peak electric demand of 218 GW. The electrical energy demand for 2021–22 is expected to be at least 1915 TWh, with a peak electric demand of 298 GW. If current average transmission and distribution average losses remain same 32.0 per cent, India needs to add about 135 GW of power generation capacity, before 2017, to satisfy the projected demand after losses.
RATIONALE OF THE STUDY The development of power industry in India was started at the stage of 19th century, but it was fully recognized and evolved the full-fledged power policy only after independence. The power industry was nationalized and State Electricity Board was setup in each state. The Central Electricity Authority was established to evolve national power policy and ensure coordinated development of the power sector in India. It has great potentiality in the field of power generation through its number of hydro, Thermal, Gas turbine and Wind Sources. Power industry has played a vital role in the economic development of a country. The plus of the economy can be felt through the health of the power industry. When power industry is prospered, in turn it will encourage the all round development of the economy. Similarly, if the power industry is crippled it will in turn arrest the running wheels of the economy. Therefore, power is the be all and end all of socio economic change. Electricity power is a critical component as well as determinant of national and international development. It has become an inevitable necessity, which influences every aspect of life, farming, industry and increasing profession of consumption activities particularly in developing countries. Power is as a key infrastructure component, it provides access to communication across the world, and creates externalities in production, distribution and exchange activities both as an intermediate input and as a component of final demand. It is the most economical and therefore essential form of energy for industrial and agriculture growth.
OBJECTIVES OF THE STUDY » To study the overall growth of Electricity consumption of different sectors in India » To analysis of supply and demand gap between southern regions in India » To suggest ways means and means to improve the performance of Power Sector In Indian Economy
METHODOLOGY The present study is an empirical and analytical exercise based on the secondary data. The overall financial performance of southern region and evaluated on the basis of the availability of a comprehensive set of data from the various published and unpublished sources, the data are collected from the administrative report, statistical at a glance of the Ministry of Power, Energy Statistics. The main aim of the study is to analysis the performance appraisal Ministry of Power and Southern regions and TNEB.
ANALYSIS OF THE STUDY The study used only Secondary data for analytical purpose. Secondary data are obtained from published and unpublished sources such as Energy statistics, Ministry of Power Statistical report, TNEB Statistical Hand book, Central Electricity Authority, Electric Power Survey Report and various annual reports. The Statistical tools used in the study were percentages, Simple linear regression and Growth model. INSTALLED GENERATING CAPACITY OF ELECTRICITY The geographical distribution of Installed generating capacity of electricity as on 2011; Western Region (both central and state sector) accounted for the highest share 30.98 per cent followed by Southern Region 27.35 per cent, Northern Region 26.88 per cent, Eastern Region 13.45 per cent and North Eastern Region 1.35 per cent. Region wise growth in the installed capacity during 2010-11 reveals that Eastern Region registered the highest growth of about 18.21 per cent, followed by Northern Region 10.1 per cent and Western Region 6.65 per cent. Among the States in the Eastern Region that accounted for the highest growth of 18 per cent, Odisha registered the highest 47.7 per cent followed by Jharkhand 27.1 per cent. Among all the states Delhi registered highest growth 105.1 per cent in the installed capacity followed by Odisha 48 per cent and Jharkhand 27 per cent.

VOLUME NO. 3 (2013), ISSUE NO. 08 (AUGUST) ISSN 2231-5756
INTERNATIONAL JOURNAL OF RESEARCH IN COMMERCE, IT & MANAGEMENT A Monthly Double-Blind Peer Reviewed (Refereed/Juried) Open Access International e-Journal - Included in the International Serial Directories
http://ijrcm.org.in/
29
TABLE -1: TRENDS IN INSTALLED GENERATING CAPACITY OF ELECTRICITY UTILITIES AND NON-UTILITIES IN INDIA (In MW)
Year Utilities Total Non –Utilities Total Grand Total
Thermal Hydro Nuclear Railways Self Generating Industries
1971 7,906 6,383 420 14,709 45 1,517 1,562 16,271
1981 17,563 11,791 860 30,214 60 3,041 3,101 33,315
1991 45,768 18,753 1,565 66,086 111 8,502 8,613 74,699
2001 73,613 25,153 2,860 101,626 - 16,157 16,157 117,783
2011 131,279 37,567 4,780 173,626 - 32,900 32,900 206,526
Growth rate of 2010-11 11.28 1.91 4.82 8.93 - 15.54 15.54 9.93
CAGR 1970-2011 7.09 4.42 6.11 6.21 - 7.79 7.72 6.39
Source: Central Electricity Authority-2012 The total installed capacity for electricity generation in the country has increased from 16,271 MW 1971 to 206,526 MW as on 2011, registering a compound annual growth rate (CAGR) of 6.4 per cent (Table-1). There has been an increase in generating capacity of 18654 MW over the last one year, which is 10 per cent more than the capacity of last year. The highest rate of annual growth (11.3 per cent) from 2009-10 to 2010-11 in installed capacity was for Thermal power followed by Nuclear Power (4.8 per cent). The total Installed capacity of power utilities in the country increased from 14,709 MW in 1970-71 to 173,626 MW as on 2011, with a CAGR of 6.2 per cent over the period. The highest CAGR 7.1 per cent was in case of Thermal utilities followed by Nuclear 6.1 per cent and Hydro 4.4 per cent. At the end of March 2011, thermal power plants accounted for an overwhelming 64 per cent of the total installed capacity in the country, with an installed capacity of 131.2 thousand MW. Hydro power plants come next with an installed capacity of 37.6 thousand MW, accounting for 18.2 per cent of the total installed Capacity. Besides, non-utilities accounted for 15.9 per cent (32.9 Thousand MW) of the total installed generation capacity. The share of Nuclear energy was only 2.31 per cent (4.78 MW).
FIGURE-1
TABLE -2: TRENDS IN AVAILABILITY OF PRIMARY SOURCES OF CONVENTIONAL ENERGY IN INDIA
Year Crude Petroleum (MT) Electricity (GWh) Electricity in %
1970-71 18.51 27666 7.15
1980-81 26.76 49543 12.80
1990-91 53.72 77782 20.11
2000-01 103.44 91264 23.59
2010-11 206.15 140524 36.33
Growth rate of 2010-11 over 6.94 12.14 -
CAGR 1970-71 to 2010-11(%) 6.06 4.04 -
Source: Central Electricity Authority 2012 Since thermal electricity is not a primary source of energy, being produced either from coal or natural gas in India, electricity availability is considered only for that electricity which is generated from Hydro and Nuclear sources. Without taking into account the transmission and distribution losses, the total availability is equal to the total generation, and this figure increased from 27,666 GWh during 1970-71 to 1,40,524 GWh during 2010-11, registering a CAGR of 4.0 per cent over the period (Table-2)
TABLE-3: CONSUMPTION OF ELECTRICITY (FROM UTILITIES) BY SECTORS IN INDIA (In GWh)
Year Industry Agriculture Domestic Commercial Traction and Railways Others Total Electricity Consumed
1970-71 29,579 4,470 3,840 2,573 1,364 1,898 43,724
1980-81 48,069 14,489 9,246 4,682 2,266 3,615 82,367
1990-91 84,209 50,321 31,982 11,181 4,112 8,552 190,357
2000-01 107,622 84,729 75,629 22,545 8,213 17,862 316,600
2010-11 272,589 131,967 169,326 67,289 14,003 39,218 694,392
Growth rate of 2010-11 15.14 9.78 15.91 11.04 12.85 7.17 13.34
CAGR 1970-71 to 2010-11 5.57 8.61 9.67 8.29 5.84 7.67 6.98
Source: Central Electricity Authority 2012
R² = 0.939
R² = 0.878
-20,000
0
20,000
40,000
60,000
80,000
100,000
120,000
140,000
160,000
180,000
200,000
1970-7
1
1980-8
1
1990-9
1
2000-0
1
2010-1
1
Me
ga W
att
Year
Trends in Installed Generating Capacity of Electricity utilities and Non-utilities in India
Electricity Utilities
Electricity Non-Utilities
Linear (Electricity Utilities)
Linear (Electricity Non-Utilities )

VOLUME NO. 3 (2013), ISSUE NO. 08 (AUGUST) ISSN 2231-5756
INTERNATIONAL JOURNAL OF RESEARCH IN COMMERCE, IT & MANAGEMENT A Monthly Double-Blind Peer Reviewed (Refereed/Juried) Open Access International e-Journal - Included in the International Serial Directories
http://ijrcm.org.in/
30
FIGURE -2
The estimated electricity consumption increased from 43,724 GWh during 1970-71 to 6,94,392 GWh during 2010-11, showing a CAGR of 6.98 per cent (Table-3). The increase in electricity consumption is 13.34 per cent from 2009-10 (6,12,645 GWh) to 2010-11 (6,94,392 GWh). In the case of total electricity sales in 2010-11, industry sector accounted for the largest share (38.6 per cent), followed by domestic (23.8 per cent), agriculture (19.6 per cent) and commercial sector (9.89 per cent). However, it is seen that electricity consumption in domestic sector and agriculture sector has increased at a much faster pace compared to other sectors during 1970-71 to 2010-11, with CAGRs of 9.67 per cent and 8.61 per cent respectively and loss of electricity due to transmission and distribution has increased from 17.55 per cent during 1970-71 to 32.86 per cent during 2000-01 and declined to 18.04 per cent during 2010-11. SOUTHERN REGION IN INDIA Tamil Nadu is facing power shortage due to inadequate tie-ups with long term sources of power generation and there is no possibility of bridging the huge gap between demand and supply through short or medium term purchases (Ministry of Power-2012). The ministry also referred to the delay in commissioning of 12 power generation projects (Six under Central Sector, four in State sector and two In Private sector) in the State due to reason such as slow progress of civil works, non availability of labour and delayed supplies of Plant equipment.
TABLE -4: POWER SUPPLY POSITION IN THE SOUTHERN REGION 2011-12
State Requirement Availability Surplus/Deficit(-) Peak Demand Peak Met Surplus/Deficit(-)
MU MU MU In % MW MW MW In %
Andhra Pradesh 91730 85149 -6581 -7.2 14054 11972 -2082 -14.8
Karnataka 60830 54023 -6807 -11.2 10545 8549 -1996 -18.9
Kerala 19890 19467 -473 -2.1 3516 3337 -179 -5.1
Tamil Nadu 85685 76705 -8980 -10.5 12813 10566 -2247 -17.5
Puducherry 2167 2136 -31 -1.4 335 320 -15 -4.5
Lakshadweep 37 37 0 0 8 8 0 0
Southern Region 260302 237480 -22822 -8.8 37599 32188 -5411 -14.4
Source: The Hindu 2012
FIGURE -3
0
50,000
100,000
150,000
200,000
250,000
300,000
1970-71 1980-81 1990-91 2000-01 2010-11
In G
iga W
att
hour
Year
Consumption of Electricity in Differnt Sectors in India
Industry
Agriculture
Domestic
Commercial
Traction and Railways
others
-16%
-27%
-5%
-24%
-3%0%
-21%
Energy Surplus/Deficit
Andhra Pradesh
Karnataka
Kerala
Tamil Nadu
Puducherry
Lakshadweep
Southern Region

VOLUME NO. 3 (2013), ISSUE NO. 08 (AUGUST) ISSN 2231-5756
INTERNATIONAL JOURNAL OF RESEARCH IN COMMERCE, IT & MANAGEMENT A Monthly Double-Blind Peer Reviewed (Refereed/Juried) Open Access International e-Journal - Included in the International Serial Directories
http://ijrcm.org.in/
31
FIGURE-4
According to the Ministry, Tamil Nadu was not the only state to be reeling under power shortage as Andhra Pradesh, Karnataka, Kerala as well as Puducherry were also facing similar problems. Lakshadweep was the only place in the southern region where the supply met the demand (table-4 and figures 3 and 4). Electricity being a concurrent subject, supply and distribution of electricity is the responsibility of the State government concerned or Power Utilities of the State. GoI supplement the efforts of the State Governments by setting up Power Plants and bulk Transmissions systems (The Hindu -2012). Energy Shortage of Andhra Pradesh was 3.0 per cent in April-September during 2011, where as it was 16.3 per cent during the corresponding period this year. The figures of Tamil Nadu were 5.5 per cent to 15. Another southern State reeling under power shortage is Karnataka, whose energy shortage went up from 8.1 per cent to 13.6 per cent. To compound the matter, the southern region is not inter connected with other regions in the country and going by present indications, work on interconnectivity will be over only by early 2014 (CEA-2012). A NOTE ON ENERGY CRISIS IN TAMIL NADU Electricity is a critical infrastructure for the socio economic development of the State. The State has a total installed capacity of 10,237 MW from conventional sources and 6,007 Mega Watts (MW) from renewable sources. In spite of having such a huge capacity, the State is facing severe power shortage of about 3500-4000 MW due to the rapid industrialization and the demand for power is growing at the rate of 10.0 per cent per annum. The State Government is planning to launch large scale installation of captive solar power plants to the tune of 3,000 MW in order to reduce the pressure on conventional sources of energy. Focus on production of energy from renewable sources like wind and solar and non-conventional sources like bio-mass would be encouraged in over the plan period (GoT, 2012)
TABLE -5: RISING DEMAND, STAGNATING SUPPLY AND GAP IN TAMIL NADU
Source: The Hindu 2012
FIGURE -5: RISING DEMAND, STAGNATING SUPPLY AND GAP IN TAMIL NADU
The table-5 found that the fundamental problem is the widening gap between demand and supply. A capacity addition has not been in tune with increase in demand. The rise in demand could be attributed directly to the high growth rates that the state posted in last three years 8.96 per cent in 2009-10; 11.3 per cent
-20%
-25%
-7%
-23%
-6%0%
-19%
Peak Surplus/Deficit
Andhra Pradesh
Karnataka
Kerala
Tamil Nadu
Puducherry
Lakshadweep
Southern Region
-2000
0
2000
4000
6000
8000
10000
12000
Installed Capacity (MW)
Sustained Peak Demand (MW)
Installed Capacity and Sustained Peak Demand Gap (MW)
Year Installed Capacity (MW)
Sustained Peak Demand (MW)
Installed Capacity and Sustained Peak Demand Gap (MW)
Maximum Daily Consumption (MU)
2002-03 8268 6957 1311 139.8
2003-04 9319 7228 2091 146.2
2004-05 9531 7473 2058 159.1
2005-06 10031 8209 1822 172.4
2006-07 10098 8803 1295 191.3
2007-08 10122 8969 1153 190.1
2008-09 10214 9459 755 202.7
2009-10 10214 10046 168 223.9
2010-11 10237 10670 -433 233.9
2011-12 10364 10713 -349 238

VOLUME NO. 3 (2013), ISSUE NO. 08 (AUGUST) ISSN 2231-5756
INTERNATIONAL JOURNAL OF RESEARCH IN COMMERCE, IT & MANAGEMENT A Monthly Double-Blind Peer Reviewed (Refereed/Juried) Open Access International e-Journal - Included in the International Serial Directories
http://ijrcm.org.in/
32
in 2010-11 and 9.39 per cent in 2011-12. Given the fact that, services sector witnessed two digit growth rate since 2008, it was possible that there had been perceptible changes in the lifestyle of people which, in turn, led to the hike in demand. This was apart from industrial growth which varied from 6.8 to 6 per cent in the three years (The Hindu-2012).
TABLE -6: CONSUMPTION OF ELECTRICITY IN TAMILNADU 2010-11
Category Consumption (M.U) In %
Industries 25622 41.4
Agriculture 12625 20.4
Domestic 16312 26.3
Commercial 4586 7.4
Public Lighting and Water Works 1592 2.6
Sales of Licensees and Sales to Other States 429 0.7
Miscellaneous 731 1.2
Total 61897 100
Source: The Chief Engineer (Planning) Tamil Nadu Generation and Distribution Corporation Ltd, Chennai
Tamil Nadu ranks third in terms of volume of energy sold and power generating capacity. It has the highest capacity of wind power and has been in the forefront of rural electrification. Its aggregate technical and commercial loss of 18.5 percent which is one of the lowest in the country. The state witnesses a power shortfall, ranging 3500-4000MW. The gross energy consumption has grown at 6.2 percent per annum during 2004-05 to 2010-11 and the state electricity consumption (Million units) in per cent share of during periods 2011 are: industries (41.4), agriculture (20.4), domestic (26.3), commercial (7.4), Public Lighting and Water works (2.6), Sales of Licensees and Sales to Other States (0.7) and Miscellaneous (1.2) (Table-6 and Figure-6) Unless the state becomes power surplus, it will be difficult to attract of industrial investments and accelerate the growth. Currently, the share of renewable energy is 40 percent of the total grid capacity. The capacity addition made in 2010-11 was 1315 WM. Tamil Nadu still has rich potential of tapping renewable energy. Many global players already build their plants in Tamil Nadu, the also generating third largest amount of biomass energy. With these, Tamil Nadu becomes the biggest renewable energy state in the country.
PROBLEMS WITH INDIA'S POWER SECTOR India's electricity sector faces many issues and problems some of them are: » Government giveaways such as free electricity for farmers, partly due to political favor, have depleted the cash reserves of state-run electricity-distribution
system. This has financially crippled the distribution network, and its ability to pay for power to meet the demand. This situation has been worsened by government departments that do not pay their bills.
» Despite abundant reserves of coal, India is facing a severe shortage of coal. The country isn't producing enough to feed its power plants. Some plants do not have reserve coal supplies to last a day of operations. India's monopoly coal producer, state-controlled Coal India, is constrained by primitive mining techniques. Coal India has consistently missed production targets and growth targets. Poor coal transport infrastructure has worsened these problems. To expand its coal production capacity, Coal India needs to mine new deposits. However, most of India's coal lies under protected forests or designated tribal lands. Any mining activity or land acquisition for infrastructure in these coal-rich areas of India has been rife with political demonstrations, social activism and public interest litigations.
» Poor pipeline connectivity and infrastructure to harness India's abundant coal bed methane and shale gas potential. » The giant new offshore natural gas field has delivered less fuel than projected. India faces a shortage of natural gas. » Hydroelectric power projects in India's mountainous north and northeast regions have been slowed down by ecological, environmental and rehabilitation
controversies, coupled with public interest litigations. » Average transmission, distribution and consumer-level losses exceeding 30 per cent. » Over 300 million people in India have no access to electricity. Of those who do, almost all find electricity supply intermittent and unreliable. » Lack of clean and reliable energy sources such as electricity is, in part, causing about 800 million people in India to continue using traditional biomass
energy sources – namely fuelwood, agricultural waste and livestock dung – for cooking and other domestic needs. Traditional fuel combustion is the primary source of indoor air pollution in India, causes between 300,000 to 400,000 deaths per year and other chronic health issues.
» India’s coal-fired, oil-fired and natural gas-fired thermal power plants are inefficient and offer significant potential for greenhouse gas (CO2) emission reduction through better technology. Compared to the average emissions from coal-fired, oil-fired and natural gas-fired thermal power plants in European Union (EU-27) countries, India’s thermal power plants emit 50 to 120 percent more CO2 per kWh produced.
POLICIES AND STRATEGIES India's Ministry of Power launched Rajiv Gandhi Grameen Vidyutikaran Yojana (RGGVY) as one of its flagship programme in March 2005 with the objective of electrifying over one lakh (100,000) un-electrified villages and to provide free electricity connections to 2.34 Cr (23.4 million) rural households. This free
41%
20%
26%
8%3%1%1%
Figure -6Consumption Of Electricity In Tamilnadu 2010-11
Industries
Agriculture
Domestic
Commercial
VOLUME NO. 3 (2013), ISSUE NO. 08 (AUGUST) ISSN 2231-5756
INTERNATIONAL JOURNAL OF RESEARCH IN COMMERCE, IT & MANAGEMENT A Monthly Double-Blind Peer Reviewed (Refereed/Juried) Open Access International e-Journal - Included in the International Serial Directories
http://ijrcm.org.in/
33
electricity program promises energy access to India's rural areas, but is in part creating problems for India's electricity sector. The following strategies are essentials to achieve the target solve the electricity problems. (i) Renewable Energy Policy : To address all issues relating to renewable energy; Policy reforms to further unbundling of distribution at more decentralized way; Solar Power Policy; Sustainable Energy Security Policy in villages. (ii) Capacity Addition;(a)Taking up new projects; example Thermal power and Ultra Mega Power project etc., Speeding up and expediting the completion of all ongoing projects. (b) Exploring the possibility of adding 10000 MW wind energy through various promoters; Setting up offshore wind power plants; (c) Setting up of Solar Parks;(d) Attract private investments on a commensurate scale.(iii) Transmission and Distribution: (a) Enhancing transformer capacities in the existing sub stations; (b) divergence of high tension overloaded feeders and installation of capacitor banks at distribution transformers for injection of reactive power; (c) Conversion of low voltage lines to high voltage lines along with feeder separation to reduce the distribution line losses;(d) separation of agricultural loads from industrial, commercial, and domestic loads; (e) Adequate transmission network to evacuate the power generated from new plants and to distribute the customers; (iv) Energy Conservation: (a) Implementing Bachat Lamp Yojana (BLY) scheme to increase energy efficiency in domestic sector; (b) Improve the efficiency of the agricultural pump sets using appropriate incentive scheme; (c) Solar powered home lighting in 3 lakh Green houses; 1 lakh street lights through solar power; (d) Energy conservation building code; Energy Star Labeling in Equipments (v) Fiscal Health of Power Sector: Make the distribution system financially viable during the Twelfth Plan by rational pricing, bringing modern systems of management, use of IT, enforcement of accountability and privatization or franchising.
CONCLUSION Energy sector in India particularly power sector faces number of issues and problems and they are: shortage of power due to excess demand over supply caused by industrialization, urbanization, mechanization and modernization. More over governments initiatives in inviting MNCs to put up their production centres and guarantee them to provide uninterrupted power supply; Population explosion causing more number of households related to increasing demand for electricity; T&D losses caused by problems and grid; over staffing in SEBs related to heavy wage bill; Theft of electricity by industries; subsidies in providing electricity particularly to agriculture, some time free of cost; Nonpayment of electricity bill by public sector under takings; Corruptions from top to bottom of SEBs; Lack of poor encouragement of government to provide sector for captive power generation; Lack of modernization of thermal power station by the governments. Poor awareness on energy education etc, above issues and problems can be solved with concerted efforts in formulating and implementing power sector reforms that form part of economic reforms of Indian economy
REFERENCES 1. Ailawadi et.al (2006) “Access to energy services by the poor in India: Current situation and need for alternative strategies” Natural Resources Forum,
vol.30, pp. 2–14 2. Annual Plan (2010‐11) Planning Commission Government of India New Delhi 3. BP Statistical Review of World Energy, British Petroleum, 2001 4. Dolf Gielen et.al (2009) “Technology Development Prospects for the Indian Power Sector: The Impact of the Spatial Resource Distribution” International
Energy Agency Working Paper Series 5. Eleventh Five Year Plan (2007-12) Planning Commission, GOI, New Delhi 6. Garg (2012) “Energy Scenario and Vision 2020 in India” Journal of Sustainable Energy & Environment, vol. 3, pp. 7-17 7. Garima Jain (2005) “Alleviating Energy Poverty: Indian Experience” The Energy and Resources Institute (TERI), New Delhi 8. Government of Tamil Nadu Twelfth Five Year Plan (2012-17) 9. Mahendra Lalwani, and Mool Singh (2010) “Conventional and Renewable Energy Scenario of India: Present and Future” Canadian Journal on Electrical and
Electronics Engineering, Vol. 1, No. 6, pp 122-140. 10. Maithani (2008) “Renewable energy policy framework of India”, India: Narosa Publication Delhi, p. 41–54. 11. Ministry of Petroleum & Natural Gas Government of India New Delhi (Economic Division) (2009-10) Basic Statistics on Indian Petroleum & Natural Gas 12. MNRE (2009) Ministry of New and Renewable Energy, Govt. of India, Annual report 13. OECD (2010) Key World Energy Statistics 2010, OECD Publishing. 14. Raja Ramanna (2010) “Indian Power Supply Position 2010” Center for study Science, Technology and Policy (CSTEP), working Paper No.1 NEWSPAPERS & MAGAZINE 15. The Hindu, November.12, 2012, p.4 16. Times of India (November 2011) 17. World energy outlook, 2010 WEBSITES 18. http://www.earthtrendsdelivered.org 19. http://www.eia.doe.gov 20. http://www.globalissues.org 21. http://www.igcar.ernet.in

VOLUME NO. 3 (2013), ISSUE NO. 08 (AUGUST) ISSN 2231-5756
INTERNATIONAL JOURNAL OF RESEARCH IN COMMERCE, IT & MANAGEMENT A Monthly Double-Blind Peer Reviewed (Refereed/Juried) Open Access International e-Journal - Included in the International Serial Directories
http://ijrcm.org.in/
34
THE EXAMINATION OF CONNECTION OF BOTH BALANCE SHEET FINANCING AND ACCEPTED COMPANIES PERFORMANCE IN TEHRAN STOCK EXCHANGE USING MARKET VALUE TO BOOK
DR. ABOLFAZL GHADIRI MOGHADAM PROFESSOR OF ACCOUNTANCY
UNIVERSITY FERDOWSI OF MASHHAD IRAN
DR. MOHAMMAD HOSSEIN VADIEI NEUGHABI
PROFESSOR OF ACCOUNTANCY UNIVERSITY FERDOWSI OF MASHHAD
IRAN
DR. HADI JABARI NEUGHABI PROFESSOR OF STATISTICS
UNIVERSITY FERDOWSI OF MASHHAD IRAN
YOUSSEF HAGHIGHI
STUDENT OF ACCOUNTING UNIVERSITY FERDOWSI OF MASHHAD
IRAN
ABSTRACT The purpose of this study is that to compare the companies performance before and after balance sheet financing. Criteria used to achieve the above objective, financing (through debt and equity) as the independent variable and P/E and P/B and Q-Tobin has used as dependent variables. After analyzing about 130 years from 2000 to 2007 using Klmvgrf- Smirnovf the samples was not a normal distribution, and to investigate the different performance of test Wilcoxon Signed Ranks which don't sensitive to the distribution instead of being paired T-Test was used. The results suggest that companies year performance after the financing has to deal with the loss. Also the effect of financing ways is used from test Man-Whitney, and the borrowing impact is impressed more than from the share issue performance after financing.
KEYWORDS balance sheet financing, borrowing, share issue. Tehran Stock Exchange.
INTRODUCTION conomic institutions and businesses, especially active in the industry, to survive and their productive activities and the expanding of activities need to huge investment also. Also, this economic institutions and corporations to fund their requirements are highly dependent on the financial markets. The role of this markets is providing capital for institutions and companies. One of this general points that is interesting to financial managers of economic
firms is that the financing methods and rate. One of the important objectives of financial management is to maximize stockholder wealth. To this end, the target of financial managers to find financing ways to achieve this goal. the financing is most important issues in financial management and concerns of financial managers .companies using different methods can financing. The awarenece of managers from the financing various methods and tools and effect on companies cause that the continuity of operations be possible and operations facilitate. Having an precise understanding of the impact and Financing and operational performance connections help managers in the company's strategic and fundamental decisions and good information provides for those interested to invest in this companies. On the other hand, companies performance is interest main topic of managers ,investors, creditors and other interest parties also. And the results of come in is basic many decision, at the juncture, criteria and specific tools have been proposed and each beneficiary according to his view has used this criteria to evaluate the companies performance. Since these criteria are not perfect. Thus, the criticisms is entered and applied tries to it in order to fix defects or present new standard.
THE TYPE OF PERFORMANCE APPRAISAL APPROACHES To evaluate the companys performance is used different approaches , main approaches can be divided into four groups as follows.
1) Accounting data such as earnings per share, return on equity, the amount of the sales process change. 2) The data of the financial management such as return on per share, return on earning shares, the equation of the capital market line and the capital asset
pricing model. 3) Economic data such as EVA, EVA modified. 4) Integrated approach (combination or market value to book), which the result of market value combination and accounting information. Like the ratio of
P/E, dividend price index, Q-Tobin and the market value ratio of per share to book value per share.
Due to deficiencies in the accounting and economic information and market exist for appraisal performance ,using the market values approach data to book has been used for performance evaluation. In addition to the use of financial information from data and market value used also, that taking appraisal be connect.
THE RESEARCH QUESTION Growth and continue companies activities require financial resources that providing these sources usually is restricted. So, to continue the process of the attractivenece of resources, how to use it is to provide an appropriate share of the value for suppliers and users of the resources . What couraged financer to use their resources in certain activities is optimum performance, that it is up increase the value of the company and there by stockholder wealth. Financing is common practice in large firms. company management , to provide funds for capital expenditures and company operations holds different sources and ways of various financing. Financing can be done through the issuance of stock or debt securities. Some of the theories have been done why companies
E

VOLUME NO. 3 (2013), ISSUE NO. 08 (AUGUST) ISSN 2231-5756
INTERNATIONAL JOURNAL OF RESEARCH IN COMMERCE, IT & MANAGEMENT A Monthly Double-Blind Peer Reviewed (Refereed/Juried) Open Access International e-Journal - Included in the International Serial Directories
http://ijrcm.org.in/
35
certain financing ways select and how such choices on company's past and future performance is reflected so that after financing, performance of company are affected by this activity and in the performance show decline and decrease. Also, the groups of theorists, including Haley and Pylpv have stated, the managers decision on the ground of raise capital through new shares, containing new information from the company's future to Investors be. Therefore the main research question is that whether the companies performance is different after and before financing?
NECESSARY TO RESEARCH Performance measurements, based on investment and financing decisions. Creditors in order to decide on the amount and rate of the credit taking appraisal performance. Investors to determine the success rate of management in Appling their investment is interesting to the examination of performance. in the present, the appraisal of performance of many companies and organizations will be based on financial indicators. But their managers and shareholders should be notice that a company may be profitable because of monopoly situation or formal relationships. Therefore, measures should be considered alongside financial indicators that through them can company situation examine. at this point the increase of investors and creditors awarenece to detect performance using other indicators of credits is essential. using this way they are able either evaluate the Company's performance, or make decisions, to allocate credit to firms . Currently, the stock exchange market in Iran as only market investment has basic and important function in financing required funds and the attractivenece of investment for listed companies .Hence, the increase of awarenece and investors knowledgement interested in investing In capital market, research and survey on the activities of listed companies on the Stock Exchange is a fundamental necessity. The present study has tried to analyze financial statements approved in stock Exchange the difference of performance After financing and in three period, studding before and after financing.
REVIEW OF LITERATURE Mayers and Majlof (1984) argued, More information that managers about institutional outside investors on the Performance of the company have, amount to the company's stock price is actually less than that. In such circumstances, that there is information asymmetry Companies prefer their needs funds to provide from domestic resources in stead of share issue. Heron and lee (2004) argued, if the company has not capital financing, the motivation of managers to manage earnings be more weak .more Obvious differences, the use of financing through debt vic versa capital. Due to the hazardous nature of capital stock, and thus price instability that be influence from changes in expected future in operating performance ,the Company's management when financing through capital take measure the management of financing through Debts significantly. Bradshv, Richardson and Sloan(2006) survey Relationship between Activities of financing and return and future profitability of companies .they affirmed the studied methods BRS to assess the amount of net cash generated in operating financing, the use of data from cash flows and by evaluating methods of financing(debt or equity)selected by the company. The BRS research analysis the efficiency and profitability around finances, analyzes profits anticipation in the short term and the long term in addition to forecasted growth and the value of companies also. The results this studies has showed a negative correlation and relatively importance between net financing and stock returns and future profitability of the companies .The activities of external financing was effective on predictions analyzers also. Chi and Pjt (2006),were examined operating performance changes of Chinese companies after the initial offering of shares And the relationship between operational performance and efficiency of these companies. The findings suggest that the initial stock offering cause Significant decrease in the profitability, The company's sales growth rate and efficiency. The companies that before the initial offering of shares have, higher return on assets, experienced Greater reduction in performance after the initial offering of shares. bles and J. (2007) In a 5 period years, have studied companies performance on Re-publishing of stocks when companies didn’t have. The results showed that companies experienced a positive abnormal returns when the shares issued. This indicate that performance on issue have the importance weak than other time greatly. Cheng et al, (2007), have studied The relationship between corporative goverence and operational performance after the initial offering of shares in Chinese companies. Evidence showed that These firms have better operating performance before the initial offering of shares to the same industry.
THE RESEARCH HYPOTHESIS 1) The between P/E concerning the balance sheet date before and after the balance sheet financing, there is a significant difference. 2) The between P/B concerning the balance sheet date before and after financing there is a significant difference. 3) the between Q-Tobin concerning the balance sheet date before and after balance sheet financing There is a significant difference. 4) The between P/E in the years before and after balance sheet financing, there is a significant difference. 5) The between P/B in the years before and after balance sheet financing, there is a significant difference. 6) The between Q-Tobin in the years before and after balance sheet financing, there is a significant difference.
THE METHOD OF THE RESEARCH Population, sample and sampling of The companies listed on the Stock Exchange with constraints are as follows: 1) The listed companies on population is manufacturing firms and neither the investment nor mediated company. This limits of the population is because this
study of corporate performance in terms of measures of price to earnings (P/E) ratio of market value to value book per share (P/B) ratio of Q Tobin Therefore, this criteria for evaluating performance the companies of production is true better.
2) The companies should at least from year fiscal 1376, have accepted in stock exchange and represent the basic financial statements and at this present, they are working. This selection is caused that this study, with respect to the research methodology to test the research hypotheses, financial information is needed in the 3 years before and after financing .thus, this companies should at least be listed from years 76 till they have financial statements for 7 consecutive years.
3) Companies should be have financial and essential information to calculate the independent(net balance sheet financing) and dependent (performance measures) variables with regard to the methodology.
4) the companies must be financed both the financing and shares issue. 5) changes in financing should be positive. The population of the Survey is Number of 1290 firms Of listed companies in Tehran Stock Exchange during the fiscal years2000 to 2007.the number of 130 years firm have selected in the population that All the information needed for this research has been And were Tehran Stock Exchange firms that have selected as sample. Now comes the question whether can to expand the results of the company's 130 years to The total listed companies on Tehran Stock Exchange(population) or not? Can be said, with regard to the population size, population distribution considered normal and sample size using The following formula can be calculated:
n =Nz2s2
Nd2 + t2s2 (1)

VOLUME NO. 3 (2013), ISSUE NO. 08 (AUGUST) ISSN 2231-5756
INTERNATIONAL JOURNAL OF RESEARCH IN COMMERCE, IT & MANAGEMENT A Monthly Double-Blind Peer Reviewed (Refereed/Juried) Open Access International e-Journal - Included in the International Serial Directories
http://ijrcm.org.in/
36
129.7 =1290 ∗ 1.96 2 ∗ (0.84 ∗ 0.16)
1290 ∗ (0.06)2 + 1.96 2 ∗ (0.84 ∗ 0.16)
In the same study, 95% confidence interval And the estimated error of equation 12% are considered in order to increase number of sample we considered the estimated error of equation 6% and 95% confidence interval 130 year firm that has selected as a final sample, that 48 years firm had less than 10% financing and 82 years firm had more than 10% financing that be considered as control and original the sample Because the financing way in this study with dependent variables examine also. the companies must both be classified and tested by way of financing. 130 years of companies that have both, 32 years of companies financed through debt rather than share issue And 98 years of companies have through share issue rather than deb.
VARIABLES Independent variables: A balance sheet financing to assess The balance sheet financing can be use either approach to balance sheet or cash flow statements approach. In the balance sheet approach the financial net is defined as the sum of the capital and debt change thus can compare the effect measure of each financing source on firm performance with other financing sources. ∆𝑋𝐹𝐼𝑁 = ∆𝐸𝑄𝑈𝐼𝑇𝑌 + ∆𝐷𝐸𝐵𝑇 (2) Change in the financing= Changes in capital+ Changes in debt ∆𝐸𝑄𝑈𝐼𝑇𝑌 = ∆𝐶𝐸𝑄𝑈𝐼𝑇𝑌 + ∆𝑃𝐸𝑄𝑈𝐼𝑇𝑌 (3) Change in capital = Changes in common stock+ change preferred stock in capital ∆𝐷𝐸𝐵𝑇 = ∆𝐼𝐼𝑇𝐷𝐸𝐵𝑇 + ∆𝐶𝑉𝐷𝐸𝐵𝑇 + ∆𝑁𝑂𝑇𝐸 (4) Change in debt = long-term debt +convertible debts(in stock) +Changes in payables document To calculate The independent variable in this study (balance sheet financing net) is used from the balance sheet approach. This approach be used similarly by. also According to the above approach balance sheet financing net of the firms is calculated as: ∆𝑋𝐹𝐼𝑁 = ∆𝐸𝑄𝑈𝐼𝑇𝑌 + ∆𝐷𝐸𝐵𝑇 (5) net financial in the balance sheet=Changes in long-term debt+ change in capital in The calculation of balance sheet financing net has the following: 1. the meaning of a ΔEQUITY is the capital stock changes the stem of publication and new shares sales of receivables and cash contributions of shareholders. 2. In calculating ΔEQUITY, the increase in capital resulting from the conversion of reserves and retained earnings and changes in the stock nominal money, is
not considered. 3. The ΔDEBT, Changes in the balance of long-term debt That may resulting from long-term liabilities, including borrowings And received loans or repayment
of long-term liabilities. 4. In order to neutralize the effect of large and small companies, in every company, financing net and its components are defined based on its their average
assets. So ΔXFIN, has modified as follows. ∆𝑋𝐹𝐼𝑁 = ∆𝐸𝑄𝑈𝐼𝑇𝑌/𝑎𝑣𝑒𝑟𝑎𝑔𝑒 𝑎𝑠𝑠𝑒𝑡𝑠 + ∆𝐷𝐸𝐵𝑇/𝑎𝑣𝑒𝑟𝑎𝑔𝑒 𝑎𝑠𝑠𝑒𝑡𝑠 (6) The needed data for the calculation of external financing net have been derived from companies' balance sheet year1376 to 1389. DEPENDENT VARIABLES is The company's function, in this study to evaluate the companies performance are considered three criteria: 1) The ratio of price to earnings(P/E) 𝑃
𝐸=
the latest share price on board rate in the year
𝑝𝑒𝑟 𝑠𝑎𝑟𝑒 𝑒𝑎𝑟𝑛𝑖𝑛𝑔 𝑜𝑓 𝑎𝑛𝑛𝑜𝑢𝑛𝑐𝑒𝑑 𝑏𝑦 𝑐𝑜𝑚𝑝𝑎𝑛𝑦 (7)
2) the ratio of market value to book value per share(P/B) 𝑃
𝐵=
the latest share price on board rate in the year
𝑏𝑜𝑜𝑘 𝑣𝑎𝑙𝑢𝑒 𝑜𝑓 𝑝𝑒𝑟 𝑐𝑜𝑚𝑚𝑜𝑛 𝑠𝑎𝑟𝑒 𝑜𝑓 𝑐𝑜𝑚𝑝𝑎𝑛𝑦 (8)
3) the ratio of Q-Tobin , this ratio by dividing the company's market value to book value of company's assets that how it is calculated as follows.
𝑄 =MV CS + MV PS + BV LTD + BV SLD
B𝑉 𝑇𝐴 (9)
In which: MV(CS)=year end market value of common stock of the company MV(PS)= year end value estimated of the preferred stock in the company BV(LTD)=year-end book value of the company's long-term debt BV(SLD)=year-end book value of corporate debt with maturities of less than one year BV(TA)=book value of total assets at year-end of corporate Component scan be considered as a simple model of Q-Tobin is extracted from the balance sheet. Financial information required for the calculation of the company's performance years investigated In this study, have been extracted financial statements(profit , loss, balance sheet) of the company over the years1997 to 2010.
THE INVESTIGATION OF RESEARCH HYPOTHESIS To test the hypothesis, After data collection and information with interring of data to EXCEL from functions of this software is used to calculate variables. Then the results from the measured variables in order to calculate statistical enter software SPSS and The data were analyzed using appropriate statistics. The companies That have chosen as sample Should their yield information About three years ago and after balance sheet financing may be available till they can this stage will pass. Then upon the change of The balance sheet financing , are classified into three groups 1) ΔXFIN ≥ 10% 2) 0<ΔXFIN < 10% 3) Δ XFIN 0≥ The first group that balance sheet financing net is average more than 10% of assets, the companies of be financing; The second group are firms with weaker finances. The third group of distributor companies that have redeemed shares or reimbursed. In this study, to select the sample and control firms, All companies in the sample examined, Those which have financed more than 10% as the original sample and less than 10% will be selected as a control sample. The hypothesis is based on two main subjects to be studied and controlled. THE TEST OF THE FIRST THREE HYPOTHESES To test the three hypotheses of the first case of normal samples, statistical be a simple linear regression model and T pairs took advantage of the lack of data normality test Wilcoxon Signed Ranks 2 is used. Meanwhile, Mann-Whitney 3 test will be used to explore the financing influence if samples be abnormal . ∆𝑋𝐹𝐼𝑁 = balance sheet financing chenge of year company from year T to year T − 1 (10) ∆𝐸𝑄𝑈𝐼𝑇𝑌 = (𝑐𝑎𝑝𝑖𝑡𝑎𝑙 𝑖𝑛 𝑡𝑒 𝑦𝑒𝑎𝑟𝑠 𝑡 − 𝑐𝑎𝑝𝑖𝑡𝑎𝑙 𝑖𝑛 𝑡𝑒 𝑦𝑒𝑎𝑟𝑠 𝑇 − 1)/𝑎𝑣𝑒𝑟𝑎𝑔𝑒 𝑎𝑠𝑠𝑡𝑠 (11) ∆𝐷𝐸𝐵𝑇 = (𝑙𝑜𝑛𝑔 − 𝑡𝑒𝑟𝑚 𝑑𝑒𝑏𝑡𝑠 𝑖𝑛 𝑡𝑒 𝑦𝑒𝑎𝑟 − 𝑙𝑜𝑛𝑔 − 𝑡𝑒𝑟𝑚 𝑑𝑒𝑏𝑡𝑠 𝑖𝑛 𝑡𝑒 𝑦𝑒𝑎𝑟 𝑇 − 1)/𝑎𝑣𝑒𝑟𝑎𝑔𝑒 𝑎𝑠𝑠𝑒𝑡𝑠 (12)

VOLUME NO. 3 (2013), ISSUE NO. 08 (AUGUST) ISSN 2231-5756
INTERNATIONAL JOURNAL OF RESEARCH IN COMMERCE, IT & MANAGEMENT A Monthly Double-Blind Peer Reviewed (Refereed/Juried) Open Access International e-Journal - Included in the International Serial Directories
http://ijrcm.org.in/
37
THE TEST OF SECOND THREE HYPOTHESIS To test the three hypothesis can be used a simple linear regression model And t-paired if statistical model be normal and test Wilcoxon is used if the data be abnormal Besides, test Mann-Whitney test (test u) will be used to explore the influence financing if the samples be abnormal . ∆𝑋𝐹𝐼𝑁 = balance sheet financing chenge of year company from year T to year T − 1 (13) ∆𝐸𝑄𝑈𝐼𝑇𝑌 = (𝑐𝑎𝑝𝑖𝑡𝑎𝑙 𝑖𝑛 𝑡𝑒 𝑦𝑒𝑎𝑟𝑠 𝑡 − 𝑐𝑎𝑝𝑖𝑡𝑎𝑙 𝑖𝑛 𝑡𝑒 𝑦𝑒𝑎𝑟𝑠 𝑇 − 1)/𝑎𝑣𝑒𝑟𝑎𝑔𝑒 𝑎𝑠𝑠𝑡𝑠 (14) ∆𝐷𝐸𝐵𝑇 = (𝑙𝑜𝑛𝑔 − 𝑡𝑒𝑟𝑚 𝑑𝑒𝑏𝑡𝑠 𝑖𝑛 𝑡𝑒 𝑦𝑒𝑎𝑟 − 𝑙𝑜𝑔 − 𝑡𝑒𝑟𝑚 𝑑𝑒𝑏𝑡𝑠 𝑖𝑛 𝑡𝑒 𝑦𝑒𝑎𝑟 𝑇 − 1)/𝑎𝑣𝑒𝑟𝑎𝑔𝑒 𝑎𝑠𝑠𝑒𝑡𝑠 (15) In the above hypothesis, If nothing is done in balance sheet financing, thus The performance on the concerning, values in a period of fiscal -1 to +1, operational performance during the pre ¬1 to-3, operational performance during the post are +1 to +3. Δ, variable changes from T to T-1 (t denotes the year in which it has been providing financing ).
THE FINDINGS OF RESEARCH To explore The first three hypotheses was used comparison test of two sample Thus the prior year balance sheet financing and after has been studied. To explore The second three hypothesis of the study was used averages Comparison test Thus the Average of performance in the three years prior to the Balance Sheet Financing with Three years later, has been studied THE RESULTS OF THE FIRST HYPOTHESIS TEST IN RELATION TO CONTROLS AND ORIGINAL SAMPLE According to figure 1, where p-value of more than the test, i.e. α=5% .the results indicate that in level 95% of the among agents tested, including P/E before and after the sheet balancing financing concerning the balance sheet date no significant difference. THE RESULTS OF SECOND HYPOTHESIS TEST IN RELATION TO CONTROL AND ORIGINAL SAMPLE According to figure 1, where p-values the original and the controls sample below the test level of the α=5%. the results indicate that in the level 95% of the among tested agents, including P/B before and after a balance sheet financing on the balance sheet date there were no significant differences.
FIGURE 1
THE RESULTS OF THIRD HYPOTHESIS TEST IN RELATION TO MAJOR AND CONTROL SAMPLE According to figure 1, where p-value major and control sample is less than test level α=5%. the results indicate that in level 95% of the among tested agents , The Q-Tobin before and after balance sheet financing on the balance sheet date there were significant differences. THE RESULTS OF FOURTH HYPOTHESIS TEST IN RELATION TO MAJOR AND CONTROL SAMPLE According to figure 1, where p-values be more than test level of the α=5%. Results indicate that in level 95% of the among tested agents, Such as P/E before and after balance sheet financing there is no significant difference concerning the balance sheet date. THE RESULTS OF FIVE HYPOTHESES TEST IN RELATION TO MAJOR AND CONTROL SAMPLE According to figure 1, where p-values be more than the test level α=5%. Results indicate that in level 95% of the among tested agents, including The P/B before and after balance sheet financing concerning the balance sheet date, there is no significant difference.
FIGURE 2: RESULTS OF RESEARCH
Z= the standard average THE RESULTS OF SIXTH HYPOTHESES TEST IN RELATION TO MAJOR AND CONTROL SAMPLE According to figure 1, where p-value major and control sample is less than the test level α=5%. the results indicate that level 95% among the tested agents, including Q-Tobin after and before balance sheet financing on the balance sheet date there were significant differences. Three case of the six results of the statistical hypothesis, second, Third and sixth is similar with research hypothesis, it meant that the performance Before and after of a balance sheet financing differs . at This method, financing method effect should be explored. THE INVESTIGATION OF METHODS EFFECT OF FINANCING THE SECOND HYPOTHESIS Now that the P/B on the balance sheet date in the original and control sample before and after financing there is a significant difference, Should review whether the financing methods(through debt and capital) at this difference was impressive or not. According to figure 2,because the p-value is less than the test level of the α=5% , at error level of 5 percent can say moderate P/B on the balance sheet date before and after the financing in the method both debt and capital is different. And in term of the stated rank average in figure 2,difrance P/B on the balance sheet date before and after the financing in control sample using debt be more than capital. And in the prototype the methods effect there is no significant difference THE INVESTIGATION OF THE FINANCING METHODS EFFECT IN THE THIRD HYPOTHESIS OF RESEARCH now that between Q on balance sheet date in The original and control sample before and after financing there is a significant difference, Should review whether financing methods(through debt and capital) at this difference was impressive or not. According to figure 2,because the-p value is less than the test level of the α=5% , at error level of 5% percent can say moderate Q on the balance sheet date before and after the financing in the method both debt and capital is different. And ,in term of the stated rank average in table 2, the difference Q on the balance sheet date before and after the financing in a control sample using debt is more than capital, And in the prototype the methods effect there is no significant difference between it.
The results of the concerning to first hypothesis
The results of the concerning to second hypothesis
The results of the concerning to third hypothesis
year after and later of the balance sheet
z
P-valu
e
year after and later of the balance sheet
Z
p-valu
e
year after and later of the balance sheet
z
-p- va0
lue Sample P/E2<
P/E1
P/E2> P/E1
P/E2= P/E1
P/B2< P/B1
P/B2> P/B1
P/B2= P/B1
Q.T2< Q.T1
Q.T2> Q.T1
Q.T2= Q.T1
Control 38/21 69/29 0 549/0- 583/0 85/24 73/23 0 380/2- 017/0 21/25 79/22 0 759/2- 006/0
Major 27/43 9/39 0 065/0- 948/0 24/46 71/33 0 035/3- 002/0 43 77/36 0 317/3- 001/0
The results of the concerning to four hypothesis
The results of the concerning to five hypothesis The results of the concerning to six hypothesis
The average of years after and later of the balance sheet
z
P-valu
e
The average of years after and later of the balance sheet
Z
p-valu
e
The average of years after and later of the balance sheet
z
p-valu
e
Sample P/E2< P/E1
P/E2> P/E1
P/E2= P/E1
P/B2< P/B1
P/B2> P/B1
P/B2= P/B1
Q.T2< Q.T1
Q.T2> Q.T1
Q.T2= Q.T1
control 03/22 12/26 0 738/1- 082/0 55/22 02/26 0 174/1- 240/0 51/24 27/20 0 469/3- 001/0
Major 11/40 78/41 0 264/0- 792/0 67/42 08/40 0 01/1- 312/0 16/45 11/32 0 452/4- 000/0

VOLUME NO. 3 (2013), ISSUE NO. 08 (AUGUST) ISSN 2231-5756
INTERNATIONAL JOURNAL OF RESEARCH IN COMMERCE, IT & MANAGEMENT A Monthly Double-Blind Peer Reviewed (Refereed/Juried) Open Access International e-Journal - Included in the International Serial Directories
http://ijrcm.org.in/
38
THE INVESTIGATION OF FINANCING METHODS EFFECT IN THE THIRD HYPOTHESIS OF RESEARCH Now that the between Q-Tobin in the years before and after the balance sheet date in the original and control sample there is a significant difference, should review the whether financing methods(through debt and capital) at this difference impressive or not. According to figure 2, because the p-value be less than the test level of the α=5% , at the error level of 5% percent can say moderate Q of years before and later balance sheet date before and after the financing in the method both debt and capital are different. And the stated rank average of in figure 2, Q difference the years before and later the balance sheet date before and later financing in the major and control sample in the debt be more than capital.
FIGURE 2: THE RESULTS OF CONCERNING TO FINANCING METHOD EFFECT
The type of hypothesis The explanation of sample Rank average Mann-Whitney statistic z-Statistic P-Value
Debt Capital
Second hypothesis control 42 33/23 15 236/2- 025/0
major 17/36 42/44 614 498/1- 134/0
Third hypothesis control 67/41 36/23 16 194/2- 028/0
major 66/34 25/45 570 925/1- 054/0
Sixth hypothesis control 17/41 39/23 5/17 13/2- 033/0
major 16/32 61/46 5/497 629/2- 009/0
CONCLUSIONS The result of the research in the evaluated years company indicate that the performance of companies after financing in the original and control sample are facing the loss and none of the sample the companies have been faced with the increase of performance. While financing through debt more than share issue after the balance sheet financing has met performance with failure.
SUGGESTIONS During the research process, was felt necessary to do research in the following fields: 1. As mentioned in the research records, A balance sheet financing activities in addition to operational performance, productivity and value of as well as
issues in communication. 2. As that cash flow presents useful information to users ,Therefore, the Instead of using information and accruals, The same study was carried out using cash
flow approach. 3. Since at this study has not considered large and small companies, Recommended the relation both A balance sheet financing and operational performance
of the company in term of the company's size and industry type as the one effective agent be done. Since at this study has not considered large and small companies, Recommended the relation both A balance sheet financing and operational performance of the company in term of the company's size and industry type as the one effective agent be done.
REFERENCES 1. Bay less. M. Jay.N.(2007), "A multiperiod evaluation of returns following seasoned equity offerings", Journal of Economics and Business. 2. Bradsha, Mark T. Richardson, Scott A, Sloan. G. Richard.(2006),"The relation between corporate financing activities, analysts forecasts and stock returns",
Journal of Accounting and Economics,vol,42,P:53-85. 3. Casser, Gavin John.(2005),"External Financing and Firm Operating Performance", Working paper university of California,Berkeley. 4. Cheng, peng, jean jinghan Chen, and Xinrong Xia.(2007),"Expropriation, Weak corporate Governance and Post-IPO Performance: Chinese Evidence",
Advances in Financial Economics, Vol 12, P:237-267. 5. Chi‚ Jing‚ &Carol Padgett .(2006),"operating performance and Its Relationship to Market performance of Chinese Initial Public Offerings", The Chinese
Economy,Vol.39,Iss.5;p:28. 6. Cohena Danret A ، Lvs Thomas.(2006), "weghing the evidence on the relation between external corporate financing activities accruals and stock returns",
journal of Accounting and Economics،P:87-105. 7. Healy M . P. and K.G. palepu.(1990),"Earning and Risk Changes Surrounding Primary Stock Offers", Journal Accounting Research ,P:25-48. 8. Heron, Randall A, and Erik Lee.(2004)," A comparison of the motivation for and the information content of different types of equity offerings", Journal of
Business ,vol,77, P:605-632. 9. Hunt, James.(1991),"Leadership", New Barypark. C.A. 10. Lia D.Dichev and Joseph D. piotroski(1999)," The performance of Long-run stock Returns Following Issues Of public and private Debet", Journal of Business
finance.p1103-1132 11. Myers, Stewart C., and Nicholas S. Majluf.(1984),"Corporate financing and investment decision when firms have information that investors do not have",
Journal of Financial Economic.

VOLUME NO. 3 (2013), ISSUE NO. 08 (AUGUST) ISSN 2231-5756
INTERNATIONAL JOURNAL OF RESEARCH IN COMMERCE, IT & MANAGEMENT A Monthly Double-Blind Peer Reviewed (Refereed/Juried) Open Access International e-Journal - Included in the International Serial Directories
http://ijrcm.org.in/
39
TEAM BUILDING IN INFORMATION TECHNOLOGY (IT) INDUSTRIES
SIRISHA DAMARAJU RESEARCH SCHOLAR
JAWAHARLAL NEHRU INSTITUTE OF ADVANCED STUDIES SECUNDERABAD
DR. P. SAI RANI
ASSOCIATE PROFESSOR JAWAHARLAL NEHRU INSTITUTE OF ADVANCED STUDIES
SECUNDERABAD
DR. T. NARAYANA REDDY ASSOCIATE PROFESSOR
JNT UNIVERSITY ANANTAPUR
ABSTRACT
In the present scenario of Information Technology (IT) industries, maintaining a team is fairly considered as a challenging task. Organizations are striving hard to bring individuals into a team which in turn gives them high productivity, with conflict resolution among themselves which works with a common morale. Organizations spend huge amounts of money on training individuals to cope up with the ever changing business environments, in the hope of building teams which coordinate themselves and create wonders in accomplishment of projects by the company. This paper grasps the status as the study establishes the bond between the team development, individual development, conflict resolution when they arise and team building as its main motive. The Evaluation of the study used a detailed questionnaire for conducting a survey on different teams to understand the research questions & team effectiveness in the organization. To evaluate the team is a continuous process is what understood from the study.
KEYWORDS Evaluation, Individual Development, IT Industries, Team building, Team Work.
INTRODUCTION eam building by definitions is defined as follows: “Philosophy of job design in which employees are viewed as members of interdependent teams instead of as individual workers”. “Ability to identify and motivate individual employees to form a team that stays together, works together, and achieves together”.
'Team is a group of individuals with complementary skills who work together for accomplishing common goals. Working in teams helps build synergy between its members and, as a result, the work, at hand, gets efficiently done.' Teamwork plays a most essential part for any organizations growth and development in today’s context. Some Industries mainly Information technology (IT) industries in which a team plays a vital role in achieving any goal or project which comes to them, without teamwork many organizations in the present scenario cannot sustain. Initially team members doesn’t know a particular individuals capability in achieving goals, till they know each other when they maintain open communication the team manager or mentor should also take all possible initiatives to involve each team member in different tasks they have to hold and let them know the rules and regulations abided to be. Also giving the team members space to take individual decisions for the tasks allotted to them by being more a mentor than a manager. Team making is not something done because it creates pleasant work groups, or is well-ordered to do but it is an approach to collaborate individuals by It is a way to balancing their talents, skills, and essential vision of varied people. It is a way to use these individuals influence each other’s skills, time, and resources for their own benefit and that of the organizations.
REVIEW OF LITERATURE Psychologist “Bruce Tuckman” developed his team development model in the 1970s and it has five essential stages of team development: Forming, storming, norming, performing, adjourning. Team building is an effort in which a team studies its own process of working together and acts to create a climate that encourages and values the contributions of team members. Their energies are directed toward problem solving, task effectiveness, and maximizing the use of all members' resources to achieve the team's purpose. Sound team building recognizes that it is not possible to fully separate one's performance from those of others. Harvard psychologist Richard Hackman, a preeminent scholar of team effectiveness, established the power of team structures in enabling team performance. According to this influential perspective, well-designed teams are those with clear goals, well thought-out tasks that are conducive to teamwork, team members
OBJECTIVES 1. To know the problem solving and goal setting process in the teams present in the organization. 2. To know how the team follows use of talents, procedures and quality of decision making process 3. To know whether the team works for common moral of the organization 4. To know whether the team builds a process for conflict resolution if and when they arise.
HYPOTHESIS 1. Existence of use of talents, procedures doesn’t facilitate effective implementation of decision making process. 2. There is no significant relationship between team development and individual development in teams selected.
RESEARCH METHODOLOGY A total number of 100 questionnaires were distributed for various teams of different IT industries. Each team is of different size .Team functioning and efficiency was measured on the factors like team goal setting, interpersonal trust, team communication, team conflict resolution. The study is both empirical and
T

VOLUME NO. 3 (2013), ISSUE NO. 08 (AUGUST) ISSN 2231-5756
INTERNATIONAL JOURNAL OF RESEARCH IN COMMERCE, IT & MANAGEMENT A Monthly Double-Blind Peer Reviewed (Refereed/Juried) Open Access International e-Journal - Included in the International Serial Directories
http://ijrcm.org.in/
40
analytical. The study relies on both primary data and secondary data were collected and used to draw interferences. Primary data consists of distribution of questionnaires; secondary data is through books, references from journals.
RESULTS AND FINDINGS 1. The problem solving & Goal setting process in your team is… a) Good b) Very good c) Concern d) Dysfunctional
TABLE 1: PROBLEM SOLVING AND GOAL SETTING IN THEIR TEAM
Details No. of Respondents % of Respondents
Good 33 33%
Very Good 28 28%
Concern 36 36%
Dysfunctional 3 3%
FIGURE 1
Interpretation: As per the data given the graphical presentation shows the response from different team members for problem solving & goal setting process taken place in their organization. 33% of respondents say problem solving & goal setting in their team is good,28% say it as very good,36% say it need to be concerned and 3% of respondents say its dysfunctional in their team. 2. How well your team follows use of talents, procedures and the quality of decision making process? a) Good b) Very good c) Concern d) Dysfunctional
TABLE 2: DECISION MAKING PROCESS IN THEIR TEAM
Details No. of Respondents % of Respondents
Good 24 24%
Very Good 30 30%
Concern 28 28%
Dysfunctional 16 16%
FIGURE 2
Interpretation: As per the graphical presentation it shows that the decision making process in the team is very good by 31% of respondents, 24% of respondents say the decision making process in there team is good, whereas 2% if respondents say it need to be concerned and 16% say its dysfunctional. 3. Does your team believe in Team development is Individual development? a) Agree b) Strongly Agree c) Disagree d) Neutral
TABLE 3: BELIEF IN TEAM DEVELOPMENT IS INDIVIDUAL DEVELOPMENT
Details No. of Respondents % of Respondents
Agree 40 40%
Strongly Agree 21 21%
Disagree 16 16%
Neutral 23 23%
33%
28%
36%
3%
Problem Solving & Goal Setting
Good
V.Good
24%
31%29%
16%
Decision Making Process
Good
Very good

VOLUME NO. 3 (2013), ISSUE NO. 08 (AUGUST) ISSN 2231-5756
INTERNATIONAL JOURNAL OF RESEARCH IN COMMERCE, IT & MANAGEMENT A Monthly Double-Blind Peer Reviewed (Refereed/Juried) Open Access International e-Journal - Included in the International Serial Directories
http://ijrcm.org.in/
41
FIGURE 3
Interpretation: As per the data collected the team members response for team development is individual development is 40% of team members agree that team development is individual development is considered in their team ,21% strongly agree ,16% disagree with the statement and 23% respondents say its neutral. 4. Does your team build a process for conflict resolution if and when they arise? a) Agree b) Strongly Agree c) Disagree d) Neutral
TABLE 3: BUILDING CONFLICT RESOLUTION PROCESS
Details No. of Respondents % of Respondents
Agree 9 9%
Strongly Agree 3 3%
Disagree 26 26%
Neutral 62 62%
FIGURE 4
Interpretation: As per the respondents the conflict resolution in their respective teams are solved upto 9% agree for the statement,3% strongly agree with the statement ,whereas 26% disagree and 62% respondents say its neutral. The data is collected from various teams in different departments to know about the team building process and progress in the organization. When it comes to problem solving and goal setting, team members are satisfied up to 28% and 36% show concern about the same. When it comes to decision making process 31% of team members are satisfied with their team. 21% strongly agree that team development is individual development whereas when it comes to conflict resolution in their respective teams, up to 3% team members agree. Concern must merely show in conflict resolution in teams to increase productivity, team collaboration and individual goal achievement which leads to their own benefit and that of organizations.
CONCLUSION A teambuilding is nothing but a team which works together with mutual understanding among the team members and accurate guidance from the team mentor and trust most importantly that team development is both for organizational and individual growth. Therefore the team should be working together for problem solving, conflict resolution, decision making process in order to achieve team’s purpose. In order build a good team, team members are to be cheered to work for common moral of the organization .Team should be well-informed about the different phases of expansion teams can be expected to go through. Team should believe in Team development is Individual development. Information technology engineering is basically teamwork. Team building and working within a team and towards team goals plays a major role in the success of any Project.
LIMITATIONS Even after a thorough study there are limitations to the study because of the time limit provided by the organization, interaction with each member of the teams was not possible directly which affected the accuracy of the study. The limited heterogeneity in respondent’s demographic characteristics could have affected both the nature and the extent of the interpreter variables attaching themselves to the references process.
SCOPE FOR FURTHER RESEARCH The study consists of various aspects related to team building, conflict resolution, team development and individual development, decision making process which are vast concepts and can be evaluated with different methods taking different types of teams in IT Industry. The areas such as conflict resolution is never ending process and they may occur between individual team members or team heads or between management or the employees all such conflicts have a vast scope of study which can be covered in further studies. Many professionals like Salesmen, Managers and customer service representative’s deals with people on daily basis. In contrast most of the technical professionals working in the information technology industry work on either software or hardware or applications and less with people. So team building
40%
21%
16%
23%
Team Development & Individual
Development
Agree
Strongly Agree
Disagree
9%3%
26%62%
Conflict Resolution
Agree
Strongly Agree
Disagree

VOLUME NO. 3 (2013), ISSUE NO. 08 (AUGUST) ISSN 2231-5756
INTERNATIONAL JOURNAL OF RESEARCH IN COMMERCE, IT & MANAGEMENT A Monthly Double-Blind Peer Reviewed (Refereed/Juried) Open Access International e-Journal - Included in the International Serial Directories
http://ijrcm.org.in/
42
activities and tools developed for other professionals may not suit directly for IT employees and these team building tools need to be adapted for this specific industry to get better results. And there is lot of scope and requirement for such specific tools targeting IT professionals. Results of the team building activities are hard to measure as these are not testable skills. Therefore there is lot of scope for research in developing methods to measure the effectiveness of team building activities and tools.
REFERENCES BOOKS 1. Clutterbuck, David, (2007) “Coaching the Team at Work.” Nicholas Brealey Publishing, USA. 2. Dyer, W., Gibb, Dyer, Jeffrey H., (2013), “Team Building: Proven Strategies for Improving Team Performance.” Wiley, USA. 3. Edmondson, Amy C., (2012), “Teaming: How Organizations Learn, Innovate, and Compete in the Knowledge Economy.” Jossey-Bass, USA. JOURNAL AND OTHER ARTICLES 4. Cohen, S.G and Bailey, D.E. (1997), “What Makes Teams Work: Group Effectiveness Research from the Shop floor to the Executive Suite,” Journal of
Management, Vol.23, No.3, pp. 239-90. 5. Neha Verma, Santosh Rangnekar, Mukesh Kumar Barua, “Team Effectiveness in Indian Organizations A comparative Analysis of Public and Private Sectors,”
Delhi Business Review, Vol.13, No. 2, (July-December 2012). WEBSITES 6. Kalavati (2007): Definitions of Team Building, The Fresh Start Boot camp, Viewed April, 2013 http://www.kalavati.org/definition-of-team-building.html 7. Miranda Morley: Team-building Activities for Improving Workplace Communication, Chron, Viewed May 2013 http://smallbusiness.chron.com/
teambuilding-activities-improving-workplace-communication-22841.html 8. YuvaEngineers.com : Learning to think like an Engineer : http://www.yuvaengineers.com/?p=1061 9. Team Building, Business Dictionary.com, Viewed May 2013 http://www.businessdictionary.com/definition/team-building.html

VOLUME NO. 3 (2013), ISSUE NO. 08 (AUGUST) ISSN 2231-5756
INTERNATIONAL JOURNAL OF RESEARCH IN COMMERCE, IT & MANAGEMENT A Monthly Double-Blind Peer Reviewed (Refereed/Juried) Open Access International e-Journal - Included in the International Serial Directories
http://ijrcm.org.in/
43
IMPROVED PARALLEL THINNING ALGORITHM FOR NUMERAL PATTERNS
GAURAV KUMAR STUDENT
M. M. UNIVERSITY MULLANA
AASISH OBEROI
ASSOCIATE PROESSOR M. M. UNIVERSITY
MULLANA
ABSTRACT Thinning has been a part of morphological image processing for a wide variety of applications. Thinning algorithms have played an important role in the preprocessing phase of OCR systems.. Many algorithms for vectorization by thinning have been devised and applied to a great variety of pictures and drawings for data compression, pattern recognition and raster-to-vector conversion. The vectorization algorithms often used in pattern recognition tasks also require one-pixel-wide lines as input. But parallel thinning algorithms which generate one-pixel-wide skeletons can have difficulty in preserving the connectivity of an image or generate spurious branches. A few most common thinning algorithms have been implemented and evaluated on the basis of performance parameters.
KEYWORDS Digital image, parallel thinning algorithm, structuring element elimination rule, connectivity, execution time, spurious branches, character recognition.
1. INTRODUCTION TO THINNING hinning is a morphological operation that is used to remove selected foreground pixels from binary images and is particularly useful for skeletonization. Thinning is normally only applied to binary images, and produces another binary image as output. The term ‘skeleton’ has been used in general to denote a representation of a pattern by a collection of thin arcs and curves. Other nomenclatures have been used in different context.
For example the term ‘medial axis’ is used to denote the locus of centers of maximal blocks Some authors also refer to a ‘thinned image’ as a line drawing representation of pattern. In recent years, it appears that thinning and skeletonization have become synonyms in the literature, and the term ‘skeleton’ is used to refer to the result, regardless the shape of the original pattern or the method employed. Thus, “THINNING” is defined as process of reducing the width of pattern to just a single pixel. This concept is shown in figure 1. Like other morphological operators, the behavior of the thinning operation is determined by a structuring element. The choice of structuring element determines under what situations a foreground pixel will be set to background, and hence it determines the application for the thinning operation. For example, consider the structuring elements as shown in figure 2.
FIG. 1: A SET OF OBJECTS WITH SKELETONS SUPERIMPOSED
FIG. 2. STRUCTURING ELEMENT FOR THINNING
T

VOLUME NO. 3 (2013), ISSUE NO. 08 (AUGUST) ISSN 2231-5756
INTERNATIONAL JOURNAL OF RESEARCH IN COMMERCE, IT & MANAGEMENT A Monthly Double-Blind Peer Reviewed (Refereed/Juried) Open Access International e-Journal - Included in the International Serial Directories
http://ijrcm.org.in/
44
FIGURE 3: SHOWS THE RESULT OF THIS THINNING OPERATION ON A SIMPLE BINARY IMAGE.
Fig. 3. Thinning of a simple binary shape, using the above structuring elements. Note that the resulting skeleton is connected. 1.1 Why thinning In real world there is a need for thinning of images due to following reasons: 1. To reduce the amount of data required to be processed. 2. To reduce the time required to be processed. 3. Extraction of critical features such as end-points, junction-points, and connection among the components . 4. The vectorization algorithms often used in pattern recognition tasks also require one-pixel-wide lines as input. 5. Shape analysis can be more easily made on line like patterns. 1.2 Applications
• Handwritten and printed characters
• Fingerprint patterns
• Chromosomes & biological cell structures
• Circuit diagrams
• Engineering drawings.
2. SOME PRELIMINARY DEFINITIONS Input image is represented by black pixels and white pixels. Black pixels and white pixels are denoted as 1's and 0's, respectively. Definition 1: A pixel p has 4- neighbours denoted as X3, X5, X7 and X9 as shown in fig 4. Definition 2: In addition to four neighbours described in definition 1, a pixel p has four diagonal neighbours denoted as X2, X4, X6 and X8 as shown in fig 4. These are collectively known as 8- neighbours of a pixel p. Definition 3 : Two pixels p1 and p2 with a common value aresaid to be 8- connected(4-connected) if a sequenceof pixels a0(=p1), a1,
FIG. 4: NEIGHBOR PIXELS OF N (p)
….,an (=p2) exists such that each ai is 8-neighbour(4-neighbour) of ai-1 ( 1≤ i ≤ n) and all ai have the same values as p1 and p2.
Definition 4 : Connectivity has been defined by the following : two 1’s are connected if they are 8- connected, and two 0’s are connected if they are 4 connected. Definition 5 : A pixel p is deletable if its removal does not change 8-connectivity of p, otherwise the pixel is said to be undeletable.
3. THINNING ALGORITHMS According to the way we examine pixels, these algorithms can be classified as ‘Sequential’ and ‘Parallel’. In sequential algorithm, the pixels are examined for deletion in a fixed sequence in each iteration, and the deletion of p in the nth iteration depends on all the operations performed so far, i.e. on the results of (n-1)th iteration; as well as on the pixels already processed in (n)th iteration. In a parallel algorithm, the deletion of pixels in the nth iteration depends only on the result of nth iteration; therefore, all the pixels can be examined independently in the parallel manner in each iteration. Many thinning algorithms (or modifications of existing ones) have been proposed in recent years. Here we discuss two parallel algorithms that can be applied to numerals. 3.1 Fast Parallel Algorithm For thinning digital patterns A binary digitized picture is defined by a matrix IT where each pixel IT(i,j) is either 1 or 0. the pattern consists of those pixels that have value 1. Each stroke in the pattern is more than one element thick. Iterative transformation are applied to matrix IT point by point according to values of a smallset of neighbouring points. In parallel picture processing the new value given to a point at nth iteration depends on its own value as well as those of its 8 neighbours at the (n-1)th iteration, so that all picture points can be processed simultaneously. It is assumed that a 3X3 windiow is used, and that each element is connected with its 8-neighbouring elements. This algorithm requires only simple calculations.The method for extracting the skelton of a picture consists of removing all the contour points of the picture except those points that belong to the skelton. In order to preserve the connectivity of skelton,each iteration is divided in to two sub-iterations.In the first sub iteration, the contour point p1 is deleted from the digital pattern. If it satisfies following conditions: (a) 2≤B(p1)≤6 (b) A(p1) = 1 (c) p2 x p4 x p6 = 0 (d) p4 x p6 x p8 = 0 where A(p1) is the number of 01 patterns in the ordered of p2,p3,p4,…p8,p9 that are the eight neighbourss of p1 (fig. Below), and B(p1) is the non-zero neighbourss of p1, that is B(p1) = p2+p3+…+p9.
FIG. 5: DESIGNATION OF 9 PIXELS IN 3X3 WINDOW:
P9 (i-1,j-1)
p2 (i-1,j)
p3 (i-1,j+1)
P8 (i,j-1)
p1 (i,j)
p4 (i,j+1)
P7 (i+1,j-1)
p6 (i+1,j)
p5 (i+1,j+1)
X4
X3 X2
X5 p X9
X6 X7 X8
VOLUME NO. 3 (2013), ISSUE NO. 08 (AUGUST) ISSN 2231-5756
INTERNATIONAL JOURNAL OF RESEARCH IN COMMERCE, IT & MANAGEMENT A Monthly Double-Blind Peer Reviewed (Refereed/Juried) Open Access International e-Journal - Included in the International Serial Directories
http://ijrcm.org.in/
45
If any condition is not satisfied then p1 is not deleted from the picture.In the seond subiteration, only condition (c) and (d) are changed as follows (c’) p2 x p4 x p4 = 0 (d’) p2 x p6 x p8 = 0 and the rest remain the same. By condition (c) and (d) of the first subiteration it will be shown that the first subiteration removes only the south- east boundry points and the north-west corner points which do not belong to an ideal skelton. By condition (a), the end-points of a skelton line are preserved. Also, condition (b), prevents the deletion of those points that lie between the end-point of skelton line. The iterations continue until no more points can be removed. 3.2 PREPROCESSING THINNING ALGORITHM This algorithm reduces the hand-written character into the unitary thin form. Each element is assigned the value ‘1’ if it is covered by part of the character, and the value ‘0’ otherwise. This algorithm involves two sub iterations *9+. In the first sub iteration the skeleton is scanned horizontally by the 3*4 pixels window. Any two points which are horizontally adjacent to each other and horizontally isolated from other points, are detected. With p1 and p4 representing terse two points, apply the following test whether one of them is redundant. P1 is deleted if one of the following conditions is true: 1. SP1 and p6=1: 2. SP2 and p2=1: 3. [( P2 and P3) or ( P3 and P2 and P9)] and [(P5 and P6) or (P5 and P6 and P7)] Where SP1=P3 or P2 or P9. SP2= P6 or P5 or P7. ‘and’ and ‘or’ are logical ‘AND’ and logical ‘OR’ respectively. If p1 is not redundant then p4 must be deleted if the following condition is not true: (P3 and P10) or (P5 and P12).
FIG. 6: A 3×4 PIXEL WINDOW
P9 P2 P3 P10
P8 P1 P4 P11
P7 P6 P5 P12
In the second sub iteration the thin is scanned vertically by the 4*3 pixel window. Any two points which are vertically adjacent to each other and vertically isolated from other points are detected. With p1 and p6 representing these points, apply the following tests to locate the redundant point P1 is deleted if one of the following conditions is true: 1. SP11 and p4=1: 2. SP22 and p8=1: 3. [( P8 and P7) or (P7 and P8 and P9)] and [( P4 and P5) or ( P5 and P4 and P3)] Where SP11 =P9 or P8 or P7, SP22= P3 or P4 or P5, ‘and’ and ‘or’ are logical ‘AND’ and logical ‘OR’ respectively. If p1 is not redundant then p6 must be deleted if the following condition is not true: (P7 and P12) or (P5 and P10)
FIG 7: A 4×3 PIXEL WINDOW
P9 P2 P3
P8 P1 P4
P7 P6 P5
P12 P11 P10
4. PERFORMANCE EVALUATION PARAMETERS AND COMPARISON OF TWO THINNING ALGORITHMS Due to the proliferation of these algorithms, the choice of algorithm for an application has become very difficult, and a researcher in this area is often faced with the question of which algorithm to use. For this reason, we propose to evaluate the performance of two thinning algorithms and to examine the effects based on real-life data. The algorithms are chosen for their significance and representation of different modes of operation in parallel thinning. The performance of these algorithms is evaluated on the basis of following parameters: 1. Convergences of the thinned image to a unit width skeleton. 2. connectivity. 3. spurious branches 4. Processing time. We compare these algorithms are compared in terms of: 1. Convergences of the thinned image to a unit width skeleton 2. Connectivity of pixels in the thinned image. 3. Spurious branches that may be produced. 4. The time taken for execution. The algorithms are chosen for their significance and representation of different modes of operation in parallel thinning. In order to conduct an experiment of considerable scope, the following procedure has been adopted: 1) Each algorithm is implemented using a suitable programming language with a verification of the results. 2) Each algorithm is used to thin the pattems of hand written regional language. 3) Results and observations are recorded from thinning these large sets of data. The main features of parallel algorithms are as described below: 4.1 Measures of convergence to unit width A thinning algorithm is perfect if it can generates one-pixel-wide skeletons.It is obvios that if the converged skeleton SM does not contain any one of the pattern QK as shown in figure 8, then SM is one pixel wide. To measure the width of the resultant skelton , mt is defined as:
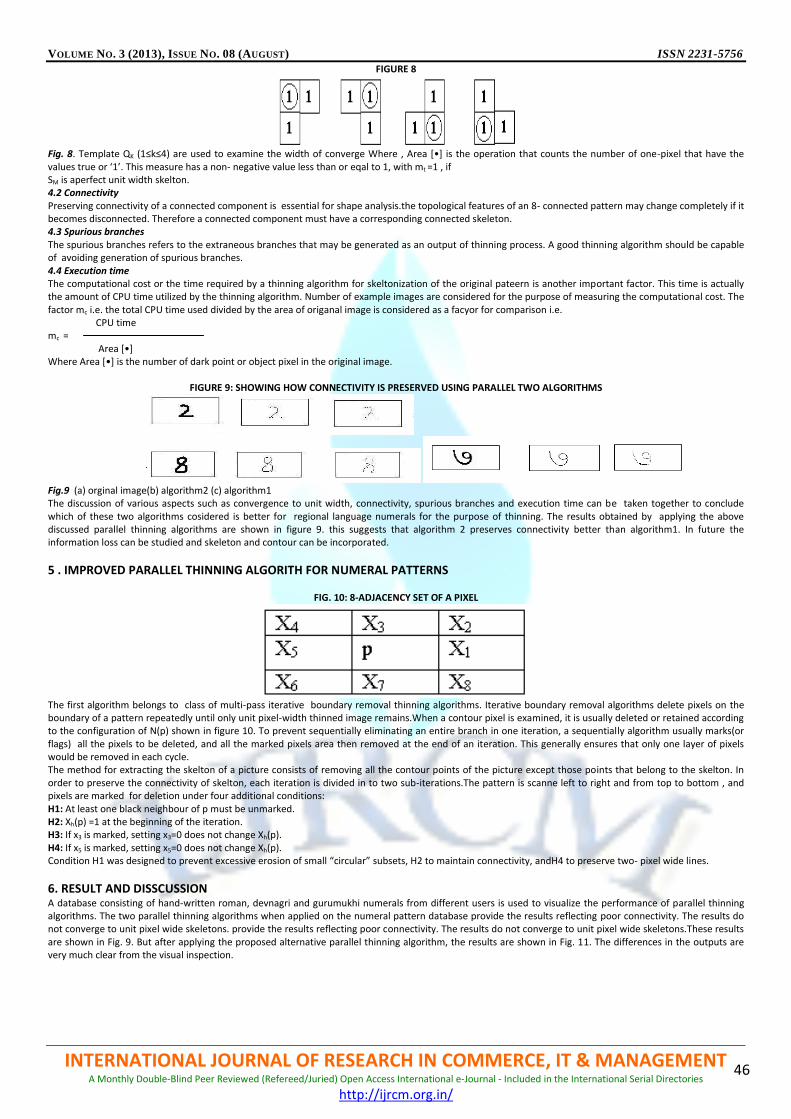
VOLUME NO. 3 (2013), ISSUE NO. 08 (AUGUST) ISSN 2231-5756
INTERNATIONAL JOURNAL OF RESEARCH IN COMMERCE, IT & MANAGEMENT A Monthly Double-Blind Peer Reviewed (Refereed/Juried) Open Access International e-Journal - Included in the International Serial Directories
http://ijrcm.org.in/
46
FIGURE 8
Fig. 8. Template QK (1≤k≤4) are used to examine the width of converge Where , Area *•+ is the operation that counts the number of one-pixel that have the values true or ‘1’. This measure has a non- negative value less than or eqal to 1, with mt =1 , if SM is aperfect unit width skelton. 4.2 Connectivity Preserving connectivity of a connected component is essential for shape analysis.the topological features of an 8- connected pattern may change completely if it becomes disconnected. Therefore a connected component must have a corresponding connected skeleton. 4.3 Spurious branches The spurious branches refers to the extraneous branches that may be generated as an output of thinning process. A good thinning algorithm should be capable of avoiding generation of spurious branches. 4.4 Execution time The computational cost or the time required by a thinning algorithm for skeltonization of the original pateern is another important factor. This time is actually the amount of CPU time utilized by the thinning algorithm. Number of example images are considered for the purpose of measuring the computational cost. The factor mc i.e. the total CPU time used divided by the area of origanal image is considered as a facyor for comparison i.e. CPU time mc = Area *•+ Where Area *•+ is the number of dark point or object pixel in the original image.
FIGURE 9: SHOWING HOW CONNECTIVITY IS PRESERVED USING PARALLEL TWO ALGORITHMS
Fig.9 (a) orginal image(b) algorithm2 (c) algorithm1 The discussion of various aspects such as convergence to unit width, connectivity, spurious branches and execution time can be taken together to conclude which of these two algorithms cosidered is better for regional language numerals for the purpose of thinning. The results obtained by applying the above discussed parallel thinning algorithms are shown in figure 9. this suggests that algorithm 2 preserves connectivity better than algorithm1. In future the information loss can be studied and skeleton and contour can be incorporated.
5 . IMPROVED PARALLEL THINNING ALGORITH FOR NUMERAL PATTERNS
FIG. 10: 8-ADJACENCY SET OF A PIXEL
The first algorithm belongs to class of multi-pass iterative boundary removal thinning algorithms. Iterative boundary removal algorithms delete pixels on the boundary of a pattern repeatedly until only unit pixel-width thinned image remains.When a contour pixel is examined, it is usually deleted or retained according to the configuration of N(p) shown in figure 10. To prevent sequentially eliminating an entire branch in one iteration, a sequentially algorithm usually marks(or flags) all the pixels to be deleted, and all the marked pixels area then removed at the end of an iteration. This generally ensures that only one layer of pixels would be removed in each cycle. The method for extracting the skelton of a picture consists of removing all the contour points of the picture except those points that belong to the skelton. In order to preserve the connectivity of skelton, each iteration is divided in to two sub-iterations.The pattern is scanne left to right and from top to bottom , and pixels are marked for deletion under four additional conditions: H1: At least one black neighbour of p must be unmarked. H2: Xh(p) =1 at the beginning of the iteration. H3: If x3 is marked, setting x3=0 does not change Xh(p). H4: If x5 is marked, setting x5=0 does not change Xh(p). Condition H1 was designed to prevent excessive erosion of small “circular” subsets, H2 to maintain connectivity, andH4 to preserve two- pixel wide lines.
6. RESULT AND DISSCUSSION A database consisting of hand-written roman, devnagri and gurumukhi numerals from different users is used to visualize the performance of parallel thinning algorithms. The two parallel thinning algorithms when applied on the numeral pattern database provide the results reflecting poor connectivity. The results do not converge to unit pixel wide skeletons. provide the results reflecting poor connectivity. The results do not converge to unit pixel wide skeletons.These results are shown in Fig. 9. But after applying the proposed alternative parallel thinning algorithm, the results are shown in Fig. 11. The differences in the outputs are very much clear from the visual inspection.

VOLUME NO. 3 (2013), ISSUE NO. 08 (AUGUST) ISSN 2231-5756
INTERNATIONAL JOURNAL OF RESEARCH IN COMMERCE, IT & MANAGEMENT A Monthly Double-Blind Peer Reviewed (Refereed/Juried) Open Access International e-Journal - Included in the International Serial Directories
http://ijrcm.org.in/
47
FIG.11: (A) ALGO1 (B) ALGO2 (C) ALGO3
The results shown in Fig. 11 shows that the proposed alternative parallel thinning algorithm provides better pixel connectivity and convergence to unit pixel width. Presently, the algorithm has been implemented and tesed for BMP format of numeral patterns. In future, the algorithm can be generalized for other commonly available image formats also. Further studied can be carried out to eliminate the spurious branches and to improve the time complexity of the proposed algorithm.
REFRENCES 1. A. Dutta and S. K. Parui, A robust parallel thinning algorithm for binary images, Pattern recognition,Vol, 27, No. 9, pp, 1181-1192,1994 2. A. K. Jain, Fundamentals of Digital Image Processing, Prentice-Hall, 1986. 3. Fingerprint minutiae extraction based on principal curves, Pattern Recognition Letters Volume 28, Issue 16, 1 December 2007, Pages 2184-2189 4. M. Ahmad and R. Ward,” An Expert system for General Symbol Recognition,” Pattern Recognition, vol. 33, no. 12, pp. 1975-1988,2000. 5. M. Ahmed, R. Ward, A Rotation Invariant Rule-Based Thinning Algorithm for Character Recognition December 2002 (Vol. 24, No. 12) pp. 1672-1678 6. R. Gonzalez and R. E. Woods, Digital Image Processing, Prentice Hall, 2002. 7. T.J., Zhang and C.Y. Suen, A fast parallel algorithm for thinning digital pattern, Comm. Of ACM 27 , 236-239 N .H. Han, C. W.La, and P.K.Rhee, “An Efficient
Fully Parallel Thinning Algorithm,” in Proc. IEEE Int.Conf.Document Analysis and Recognition, Vol. 1,pp.137-141(1997). 8. W. H. Abdulla, A.O.N. Saleh and A.H.Morad, A preprocessing algorithm for hand-written character recognition, pattern recognition letters 7,1998

VOLUME NO. 3 (2013), ISSUE NO. 08 (AUGUST) ISSN 2231-5756
INTERNATIONAL JOURNAL OF RESEARCH IN COMMERCE, IT & MANAGEMENT A Monthly Double-Blind Peer Reviewed (Refereed/Juried) Open Access International e-Journal - Included in the International Serial Directories
http://ijrcm.org.in/
48
AWARENESS AND INDIVIDUAL DIFFERENCES ON ORGANIC FOOD PRODUCTS IN ERODE DISTRICT, TAMILNADU
M. GOMATHI ASST. PROFESSOR
DEPARTMENT OF MANAGEMENT STUDIES SURYA ENGINEERING COLLEGE
ERODE
DR. S. KALYANI ASST. PROFESSOR
DEPARTMENT OF COMMERCE LRG GOVT ARTS COLLEGE FOR WOMEN
THIRUPUR
ABSTRACT Consumers’ food consumption patterns are changing rapidly. Consumers become more concern about the food they consume. They tend to consume foods that are nutritious, healthy, safe and friendly to the environment and animals. An individual with a positive attitude towards a organic food product is more likely to make a purchase. This makes the study of consumer opinion is highly important for a sellers. The present study examines the awareness and individual differences of consumers towards the organic food products .With a sample of 500 respondents the data obtained from the survey were analyzed with the help of convenience sampling method in Erode District of Tamil nadu state of India.
KEYWORDS Consumer awareness, Consumer opinion, Environmental friendly, Organic food.
INTRODUCTION ow a days the food products which are produced by farmers are pesticides mixed products due to get more productivity. It caused to cancer, reproductive dysfunction, diabetes, autism, asthma, birth defects, Parkinson's and Alzheimer's diseases and more. To free from those harmful diseases, organic food products are grown up. Organic products are grown without the use of synthetic fertilizers and pesticides, plant growth regulators
(hormones), and genetically modified organisms. Organic agriculture relies on natural products and processes to grow crops, improve soil quality, control pests and promote bio-diversity. As far as possible, organic farmers rely on crop rotation, green manure, compost, and biological pest control to maintain soil productivity and control pests. A well-balanced and biologically active soil will provide the crop with sufficient nutrients for optimum growth and yields, with a minimum of pest and disease problems. Organic foods are foods that are produced using methods of organic farming – that do not involve modern synthetic inputs such as synthetic pesticides and chemical fertilizers. Organic foods are also not processed using irradiation, industrial solvents, or chemical food additives. Allen, Gary J. & Albala, Ken, ed. (2007)(1)The organic farming movement arose in the 1940s in response to the industrialization of agriculture known as the Green Revolution. Drinkwater, Laurie E. (2009)(2) 1.1 ORGANIC CERTIFICATION “Certified Organic” is a term given to food products produced according to a set of standards. Organic standards define a set of practices for production and handling which must be followed for the farmer’s products to be labeled and sold as “Organic”. Before a product can be labeled “Organic”, a Government-approved certifier inspects the farm where the food is grown to make sure the farmer is following all the rules necessary to meet the national organic standards. Companies that handle or process organic food before it goes to market must also be certified.As part of complying with the standards, an audit trail, or record keeping system, is kept by the farmer, handlers and processors by which a crop may be traced from field to storage to sale. All certification bodies require an accurate audit trail as proof that acceptable organic management practices have been followed.
REVIEW OF LITERATURE Soler et al., 2008; Freeland-Graves and Nitzke, 2002 states that Awareness and knowledge has become critical factor in changing the attitude and behaviour of consumers towards organic foods, which in turn is expected to drive the growth in the organic food markets. Gracia and Magistris, 2007; Tsakiridou et al., 2006; Lockie et al., 2004; Millock et al., 2004; Briz and Ward, 2009 revealed in their study there are several factors which affects the awareness level on organic foods among the consumers. It has been empirically investigated that socio-demographic profiles, food buying behaviour and nutritional knowledge of the consumers are most likely to affect the awareness level and purchase decisions of organic foods. Vermeir and Verbeke, 2004 research result showed that Consumers do not always buy sustainable products as consequences of environmental concern or to benefit the community or due to personal beliefs but mainly to give priority to health, to be part of the social group, to distinguish from others and to accomplish the need to try out new technologies Hanna Stolz (2011) found in research work reported that positive assessments of organic production referred to ‘better taste’, ‘healthier’, ‘no artificial additives’, and ‘no chemical synthetic pesticides’, ‘limited use of antibiotics’, and ‘no GMOs’, etc. Aryal et al (2009); Briz and Ward 2009; Gil and Soler 2006; found that more information about the organic food market, which increases consumers’ organic food knowledge, is important because it positively influences consumers’ attitudes towards organic food products. Storstad and Bjorkhaug 2003; Voon, Ngui, and Agrawal 2011; Sangkumchaliang and Huang 2010 found that variety of factors that can potentially influence organic food con-sumption. Concern for health, environmental protection, concern for the chemical residues in conventional food products, pesticides, nutritional concern, as well as improved taste and flavour in organic food products are some of the factors identified. Siti Nor Bayaah Ahmad and Nurita Juhdi (2007)Research result indicated that people do aware of what is happening to the surroundings with regards to the environment and ecology problems and most consumers perceived that organic food product is healthier. They portray a positive attitude towards organic food and exhibit willingness to pay at certain amount of price. However there are still fewer facts to show whether consumers’ knowledge and awareness would influence their actual purchase intention towards organic food.
STATEMENT OF THE PROBLEM The pesticides mixed food product are caused to cancer, reproductive dysfunction, diabetes, autism, asthma, birth defects, Parkinson's and Alzheimer's diseases and more. The Organic food has been grown without the use of toxic chemicals, pesticides or fertilizers. The food is as natural as can be, safer for the environment and usually tastes better too. Organic food has plenty of advantages when compared to the non-organic food that have been processed with
N

VOLUME NO. 3 (2013), ISSUE NO. 08 (AUGUST) ISSN 2231-5756
INTERNATIONAL JOURNAL OF RESEARCH IN COMMERCE, IT & MANAGEMENT A Monthly Double-Blind Peer Reviewed (Refereed/Juried) Open Access International e-Journal - Included in the International Serial Directories
http://ijrcm.org.in/
49
artificial preservatives and chemicals. But still people are not aware quietly. Even though organic food plays a vital role however some factors are influencing them at the time of purchase which has been given most priority and to know the consumers’ future opinion is indispensable for the retailers.
OBJECTIVE OF STUDY To know the awareness of the respondents on organic food products
To Analyses the Opinion of the respondents towards the organic food product
To identify factors that might influence to purchase of organic food among consumers
To find the Reasons for not to purchase Organic food products by non users of organic food products
HYPOTHESIS OF THE STUDY The main aim of the study is to test the following hypothesis: H1: There is significant difference between Gender and awareness towards Organic products H2: There is significant difference among different age groups and awareness on organic product. H3: There is significant difference among different Academic Qualification and awareness on organic product H4: There is significant difference among male marital status and awareness on organic products. H5:There is significant difference among male Occupation and awareness on organic products H6:There is significant difference among male Residential area and awareness on organic products. H7:There is significant difference among different income group and awareness on organic products. H8:There is significant difference among Residential area and reason for not to purchase organic food products.
RESEARCH METHODOLOGY The study was carried out in Erode District of Tamil nadu state of India. A total of 500 respondents were taken up for the study by convenience sampling method .Primary data were collected from the respondents by means of a pre-tested questionnaire which was designed to obtain socioeconomic indices, information on consumer awareness, past and future opinion about organic products, Factors influencing to purchase of organic products & Reason for not to purchase organic products .
FINDINGS & SUGGESTIONS RELATIONSHIP BETWEEN DEMOGRAPHIC FACTORS AND AWARENESS LEVEL OF THE RESPONDENTS ON ORGANIC FOOD PRODUCTS Source: Primary Data From the above table, the results of chi-square tests revealed that there is a significant relationship between four independent variables (Age, education level, Occupation and Family income) and aware level of organic foods products. As far as age concern the middle age group of 21-30 years of respondents are more aware on organic food products. In education concern, graduates those who completed degrees are more aware. In the occupation concerned business people are more aware than others and family income concerned people those belong to the income group of 30,001-40,000 are more aware than other income groups.
OPINION OF THE RESPONDENTS TOWARDS ORGANIC PRODUCTS IN FUTURE
Source: Primary Data From the above table,29% of the respondents are buy the organic products regularly.26.8% of the total respondents not bought in the past and definitely planning to buy in the future. Moreover 22.8% of the respondents have not bought in the past and about buy sometimes in the near future,14% of the respondents are Occasional buyers and 7.2% of the respondents not bought organic foods in the past and about buying organic foods now.
Opinion of the Respondents Frequency Percent Valid Percent
Cumulative Percent
I have not bought organic foods in the past and I am not thinking about buying organic foods now 36 7.2 7.2 7.2
I have not bought organic foods in the past and I am thinking about buying organic foods sometimes in the near future
114 22.8 22.8 30.0
I have not bought organic foods in the past and I am definitely planning to buy organic foods in the future 134 26.8 26.8 56.8
I buy organic foods, but not regularly (Occasional buyers) 71 14.2 14.2 71.0
I regularly buy organic products 145 29.0 29.0 100.0
Total 500 100.0 100.0

VOLUME NO. 3 (2013), ISSUE NO. 08 (AUGUST) ISSN 2231-5756
INTERNATIONAL JOURNAL OF RESEARCH IN COMMERCE, IT & MANAGEMENT A Monthly Double-Blind Peer Reviewed (Refereed/Juried) Open Access International e-Journal - Included in the International Serial Directories
http://ijrcm.org.in/
50
FACTORS INFLUENCING THE PURCHASING ORGANIC PRODUCTS
Source: Primary Data ROTATED COMPONENT MATRIX(A) KMO AND BARTLETT'S TEST
Kaiser-Meyer-Olkin Measure of Sampling Adequacy. .647
Bartlett's Test of Sphericity Approx. Chi-Square 685.122
df 45
Sig. .000
Based on KMO measure of sampling adequacy test , it was found that the factor analysis data was appropriate with the value of 0.647, which falls between the ranges of being great and appropriate of factor analysis data. Bartlett’s Test was utilized with the result which indicates a highly significant result with p=0.000 (p<0.05) and therefore factor analysis is appropriate. People responses on 10 factors were reduced to 3 sets of related factors through principal component analysis, namely Environmental Attitude Factors, Safety Aspects Factors and Healthy Aspects Factors .It revealed that Environmental factors are influenced more to buy organic food products as it had a higher loading factor compare than rest two factors.
REASON FOR NOT TO PURCHASE ORGANIC FOOD PRODUCTS
Source: Primary Data
Details Awareness (%) Unawareness Percentage(%) Total Percentage(%) Chi-Square df Sign
Gender Male Female
184 165
53 47
56 95
37 63
240 260
48 52
10.324
1
0.001
Age Below 20 years 21 - 30years 31- 40 years 41-50 years Above 50 years
60 98 97 47 47
17 28 28 14 14
28 48 39 18 18
19 32 26 12 12
88 146 136 70 60
18 29 27 14 12
1.425
4
0.840
Education qualification No formal education School level College level Diploma
53 72 171 52
15 21 49 15
36 26 50 39
24 17 33 26
89 98 221 91
18 20 44 18
2.438
4
0.385
Marital status Married Unmarried
254 95
73 27
89 62
59 41
343 157
69 31
9.371
1
0.002
Occupation Agriculture Business Employed Professional House wife
65 115 84 41 44
19 33 24 12 13
30 64 24 16 17
20 42 16 11 11
95 179 108 57 61
19 36 22 11 12
6.246
4
0.182
Area of residence Rural Semi-Urban Urban
71 178 100
20 51 29
32 54 65
21 36 43
103 232 165
21 46 33
11.930 2
0.003
Family income per month BelowRs. 10,000 Rs10,001-20,000 Rs20,001-30,000 Rs30,001-40,000 Morethan 40,000
49 48 92 122 38
14 14 26 35 11
26 23 29 54 19
17 15 19 36 13
75 71 121 176 57
15 14 24 35 11
3.387 4
0.495
Types of Factors Factors Factors loading Cronbach’s Alpha
Environmental Attitude Factors Protect from illness .920 .9052
Environmentally friendly .917
Absence of growth hormones .891
Safety Aspects Factors Hygienic & protective .889 .9770
Safe to consume -.761
No side effects .259
Healthy Aspects Factors Good Taste -.693 .9910
Healthy and Nutritious .660
Not used harmful fertilizers .601
No chemical residues .511
Residential area Reason for not to purchase
High price No trust on purity Not availability No healthy no taste Total
Rural %with in reason for not to purchase
8 26%
5 13%
7 23%
4 24%
3 20%
27 21%
Semi-Urban %with in reason for not to purchase
16 52%
25 64%
13 43%
10 59%
11 73%
75 57%
Urban %with in reason for not to purchase
7 23%
9 23%
10 33%
3 18%
1 7%
30 23%
Total no.of respondents %with in reason for not to purchase
31 24%
39 30%
30 23%
17 13%
15 11%
132 100%
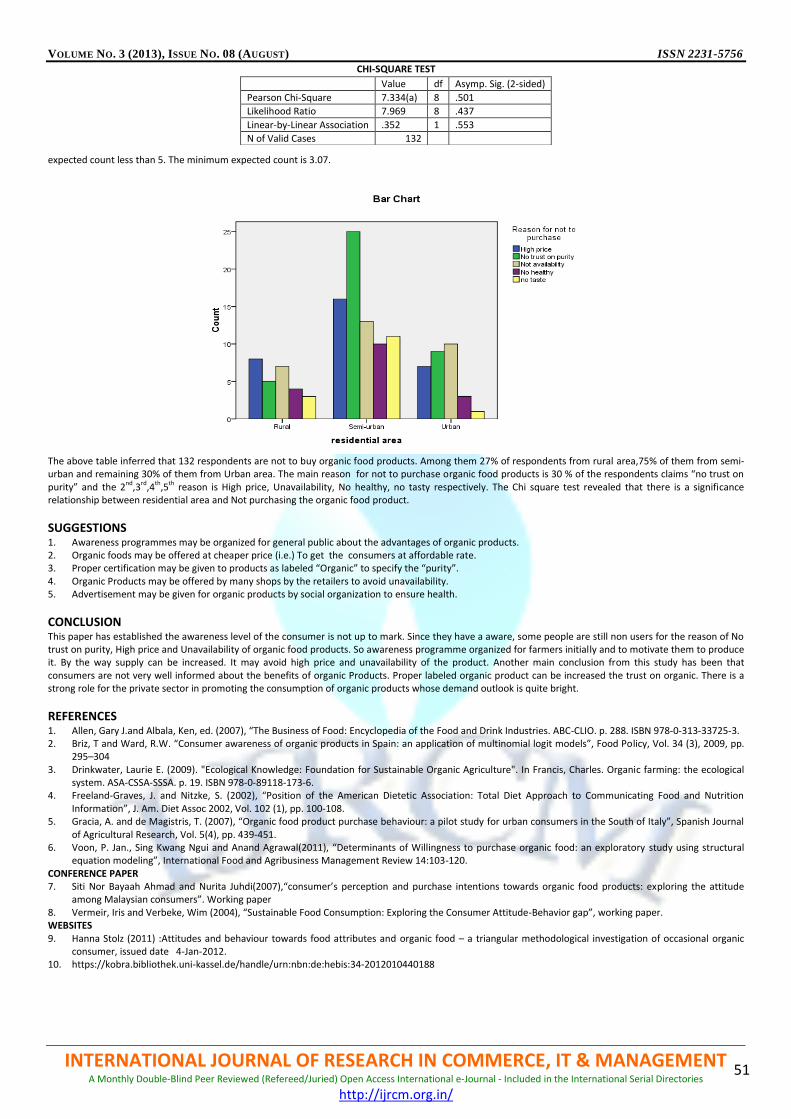
VOLUME NO. 3 (2013), ISSUE NO. 08 (AUGUST) ISSN 2231-5756
INTERNATIONAL JOURNAL OF RESEARCH IN COMMERCE, IT & MANAGEMENT A Monthly Double-Blind Peer Reviewed (Refereed/Juried) Open Access International e-Journal - Included in the International Serial Directories
http://ijrcm.org.in/
51
CHI-SQUARE TEST expected count less than 5. The minimum expected count is 3.07.
The above table inferred that 132 respondents are not to buy organic food products. Among them 27% of respondents from rural area,75% of them from semi-urban and remaining 30% of them from Urban area. The main reason for not to purchase organic food products is 30 % of the respondents claims “no trust on purity” and the 2nd,3rd,4th,5th reason is High price, Unavailability, No healthy, no tasty respectively. The Chi square test revealed that there is a significance relationship between residential area and Not purchasing the organic food product.
SUGGESTIONS 1. Awareness programmes may be organized for general public about the advantages of organic products. 2. Organic foods may be offered at cheaper price (i.e.) To get the consumers at affordable rate. 3. Proper certification may be given to products as labeled “Organic” to specify the “purity”. 4. Organic Products may be offered by many shops by the retailers to avoid unavailability. 5. Advertisement may be given for organic products by social organization to ensure health.
CONCLUSION This paper has established the awareness level of the consumer is not up to mark. Since they have a aware, some people are still non users for the reason of No trust on purity, High price and Unavailability of organic food products. So awareness programme organized for farmers initially and to motivate them to produce it. By the way supply can be increased. It may avoid high price and unavailability of the product. Another main conclusion from this study has been that consumers are not very well informed about the benefits of organic Products. Proper labeled organic product can be increased the trust on organic. There is a strong role for the private sector in promoting the consumption of organic products whose demand outlook is quite bright.
REFERENCES 1. Allen, Gary J.and Albala, Ken, ed. (2007), “The Business of Food: Encyclopedia of the Food and Drink Industries. ABC-CLIO. p. 288. ISBN 978-0-313-33725-3. 2. Briz, T and Ward, R.W. “Consumer awareness of organic products in Spain: an application of multinomial logit models”, Food Policy, Vol. 34 (3), 2009, pp.
295–304 3. Drinkwater, Laurie E. (2009). "Ecological Knowledge: Foundation for Sustainable Organic Agriculture". In Francis, Charles. Organic farming: the ecological
system. ASA-CSSA-SSSA. p. 19. ISBN 978-0-89118-173-6. 4. Freeland-Graves, J. and Nitzke, S. (2002), “Position of the American Dietetic Association: Total Diet Approach to Communicating Food and Nutrition
Information”, J. Am. Diet Assoc 2002, Vol. 102 (1), pp. 100-108. 5. Gracia, A. and de Magistris, T. (2007), “Organic food product purchase behaviour: a pilot study for urban consumers in the South of Italy”, Spanish Journal
of Agricultural Research, Vol. 5(4), pp. 439-451. 6. Voon, P. Jan., Sing Kwang Ngui and Anand Agrawal(2011), “Determinants of Willingness to purchase organic food: an exploratory study using structural
equation modeling”, International Food and Agribusiness Management Review 14:103-120. CONFERENCE PAPER 7. Siti Nor Bayaah Ahmad and Nurita Juhdi(2007),“consumer’s perception and purchase intentions towards organic food products: exploring the attitude
among Malaysian consumers”. Working paper 8. Vermeir, Iris and Verbeke, Wim (2004), “Sustainable Food Consumption: Exploring the Consumer Attitude-Behavior gap”, working paper. WEBSITES 9. Hanna Stolz (2011) :Attitudes and behaviour towards food attributes and organic food – a triangular methodological investigation of occasional organic
consumer, issued date 4-Jan-2012. 10. https://kobra.bibliothek.uni-kassel.de/handle/urn:nbn:de:hebis:34-2012010440188
Value df Asymp. Sig. (2-sided)
Pearson Chi-Square 7.334(a) 8 .501
Likelihood Ratio 7.969 8 .437
Linear-by-Linear Association .352 1 .553
N of Valid Cases 132

VOLUME NO. 3 (2013), ISSUE NO. 08 (AUGUST) ISSN 2231-5756
INTERNATIONAL JOURNAL OF RESEARCH IN COMMERCE, IT & MANAGEMENT A Monthly Double-Blind Peer Reviewed (Refereed/Juried) Open Access International e-Journal - Included in the International Serial Directories
http://ijrcm.org.in/
52
THE IMPACT OF ONLINE MARKETING IN INDIA
KUSHINI PRASAD ASST. PROFESSOR
VAAGDEVI COLLEGE OF ENGINEERING BOLLIKUNTA, WARANGAL
KONDA SANTOSH KUMAR
ASST. PROFESSOR VARDHAMAN COLLEGE OF ENGINEERING
KACHARAM VILLAGE, SHAMSHABAD
ABSTRACT This work is entitled an impact of online marketing on India it is mainly focused on the growth of Indian internet users, their attitude and the purchase pattern of customers, now days the people are started using internet as modem of shopping for everything. The major reason for doing online marketing is convenience, user friendly websites, and safe electronic payment system. Online shoppers have been increasing day by day The banking reforms also helped the online shopping since they are encouraging customers to use of online banking/internet banking/mobile banking and use of ATM (Auto Mated Teller Machines) for shopping, few of the online shopping sites has introduced a unique payment system COD Cash on Delivery this concept has build the confidence level and the trustworthiness about online shopping.
KEYWORDS online marketing, promotion.
INTRODUCTION he internet is a medium that is increasing its polarity in almost every surface of the world and is used for innumerable reasons by students, individuals, corporate companies, governments, banks, universities and businesses. As far as entrepreneurs are concerned, the internet has been subject to a variety of operations/transactions that seek to determine the feasibility of using the internet to improve business in various areas especially in computer
industry in India. One particular aspect of business is that the internet marketing has immense impact on computer industry in India. The purpose of this research is to examine the effect of internet on customers’ perception towards online marketing from the past decade. Now more than in excess of a billions of Internet users in Asia Pacific which is nearly 46% of worlds total, Asia Digital Marketing Association (ADMA), a non-profit organization with a mission to grow the use of digital for effective marketing investment released its ‘Asia Pacific Digital Marketing Yearbook 2012’ with collective data and trends across the Asia Pacific Markets. The statistic & insights are provided to help marketers get more personal, local and effective in their digital marketing strategies.
OBJECTIVES OF THE STUDY 1. To study the online marketing system in India:- The internet users have been increasing from the past decade and the companies are using a powerful
modem to promote/sell their products by developing a user friendly web sites and providing secure payment systems like net banking, credit/debit card usage and Cash on Delivery.
2. To discuss the problems of online marketing: - The major challenges of online marketing are customer can not touch the product physically and lack of awareness or trustworthiness on company.
3. To analyse the statistical data of online marketing in India
In 2011 E-Retailing industry was Rs Crores 3600 world wide
The number of transaction presently in India is 10 million, which is expected to increase by 38 million by 2015
In 2012 Amazon entered into India with Junglee.com.
In 2011 growth in online sale of Tesco recorded was 15.2%.
No. of employee in FLIPKART is 3500, this number is 800 in snapdeal.com 4. To present prospects of online marketing.
Filling the detailed online application form mandatory fields are name, address, cell no, email-id, zip code.
Select the category (Books, music)
Select the product
Add to cart
Select the method of payment (net banking, debit card/credit card, Cash on delivery)
Make the payment
INTERNET MARKETING POWERFUL THAN TRADITIONAL MARKETING When we think of customary/orthodox marketing methods of advertising we imagine straight away of mass media (Print and electronic) ads in the print media (both national and international), page space in a variety of publications, when it comes to electronic media maybe radio air- time or even TV exposure. And, of course, as industry people with budgets to believe, we think of the costs of such ventures; the truth is that none of the above mentioned forms of promotion can be economical although they are considered some of the most successful forms of promotion. Internet marketing is evolving with lightning speed of with user friendly website design and usability advances, it develop enhancement for a company to increase geographical coverage beyond heartland, new customers can be reached. Today Internet marketing is developing into a broader mix of components a company can use as a means of increasing sales - even if your business is done completely online, partly online, or completely offline. So the differentiation between traditional marketing and internet marketing? In traditional marketing methods like television or paper ads are expensive and may not be effective because of latest technologies implement in our televisions so they skip the ads And that magazine you paid a high price for coverage in has a short life too; I its sell by date is up after a week, a month, or a bimonthly period at best. Your online coverage, once there, is there for as near as you can get to forever, archived and ready to be found on searches whenever a prospective client looks for it. The Internet is open 24/7. The differences between traditional methods and Internet marketing really lie in effectuality, ease and cost. India’s fast augment in 2011 as a global internet player has pressed the country into a foremost growth market of 2012. We are seeing a strong interest from many of our customers about online marketing in India as the country pushes development despite the global economic decline. India has been a fast
T

VOLUME NO. 3 (2013), ISSUE NO. 08 (AUGUST) ISSN 2231-5756
INTERNATIONAL JOURNAL OF RESEARCH IN COMMERCE, IT & MANAGEMENT A Monthly Double-Blind Peer Reviewed (Refereed/Juried) Open Access International e-Journal - Included in the International Serial Directories
http://ijrcm.org.in/
53
developing country for many years now, with rapid growth across many areas including communications and IT. On the other hand India has seen a significant raise in online activity due to two most important factors. The first is that the internet has become more gladly available. Recent government-backed net entrepreneurs have provided internet access across most major cities, allowing a high increase in internet penetration for the large middle class sector. The second boost is technology. There has been a significant increase in internet-based technology in India, which has allowed internet access for less. Internet marketing is a business imperative because the Internet is an immutable and inexorable trend. Even if you have a traditional business, you'll lose valuable customers without an online presence. People routinely search for goods and services with their computers in lieu of the yellow pages. If your business isn't on the Web, customers will likely choose another company with whom to do business. Also, online marketing is cheap. Advertising in the newspaper is expensive, especially if you want an ad that has a presence on the page. An ad in an Internet directory is generally free, and you can include links directing customers to your Web site for more information. And because you can provide customers with a wealth of information, they no longer have to pick up the phone to have their questions answered. Although you don't need a Web site to register your site in an online directory, your marketing efforts will be much more effective if you have your own site. The first thing to do is to register a domain name. The name of your business is usually a good place to start, because it can help to build your brand and will be easy for customers to remember. If that's not available, you may have to settle for another name. Before you commit, give your domain name serious consideration; the name you choose will be your company's online identity for years to come. The below mentioned table show Number of internet users expected
TABLE 1: DEMOGRAPHICS (INDIA)
Demographics Value Source
Number of internet users 121 Million IAMAI
Internet penetration rate 8.20 % Burson Marsteller
Active internet users(Going online at least once a month) 97 Million IAMAI
Active users from main cities 73 Million IAMAI
Active users from main areas 24 Million IAMAI
Estimated internet users in India by 2015 221.6 Million Emarketer
Number of households connected to broadband 13.3 Million TRAI
Expected number of broadband connections in 2015 175 Million MCIT
Expected number of broadband connections in 2020 600 Million MCIT
Internet Audience between 15-34 Years of Age 75% Comscore
Total percentage of female internet users 15% IAMAI
STATISTICS FOR ECOMMERCE IN INDIA Indian e-commerce market hosted US$3 billion of transactions in 2011 (Source: IAMAI)
It is forecast that more than US$20 billion worth of transactions will be carried out online over next five to seven years in India and 12-15% of the country’s shopping activities will move online. (Source: IAMAI)
A total of 9 million Indian internet users carried out online transactions in 2011. This number is predicted to reach 38 million by 2015. (Source: Avendus)
India’s B2C market is expected to grow at a CAGR of 34.2% between now and 2015 (Source: Emarketer)
Online retail sales will reach US$2.4 billion (excluding online travel) in 2012, with the number of online buyers in the country expanding to 21.5 million (Source: Emarketer)
In November 2011, approximately 60% on Indian online users visited retail sites, with 7.6 million and 7.1 million users visiting coupon and consumer electronics sites respectively (Source: Comscore)
TABLE 2: TOP RETAIL SITES (Source Comscore Media Matrix, March 2012; Total Audience)
TABLE 3: PURCHASE (Source: Global WebIndex)
INDIA’S TOP RETAIL SITES
Site Total unique visitors (000) % Reach
Total Retail Sites 34,076 60.5
Amazon sites 8,016 14.2
Flipkart04,857 4,857 8.6
Apple worldwide sites 4,381 7.8
Myntra 3,959 7
Samsung Group 3,918 7
Naaptol 2,849 5.1
Alibaba Coporation 2,610 4.6
Homeshop 18 2,438 4.3
Bookmyshow 2,370 4.2
Priceindia.in 2,367 4.2
Purchase % of users Purchase % of users
Desktop computer 8.98 Laptop 7.26
Portable media player 6.71 Notebook 2.97
Mobile Phone 16.39 Blu Ray Player 3.36
Flat Screen TV 7.49 E-Book 3.36
Games Console 5.46 Bevarages 9.52
DVD Player 7.81 Spirits 7.81
Satellite/Cable TV 7.34 Sports Equipment 9.6
Broadband/High speed Internet 10.07 cloths 26.23
White Goods 4.92 Shoes 16.86
Automobile 4.68 Travel 17.02
Furniture 6.24 Music 15.93
Holiday (india) 9.45 Films 17.25
Holiday (Abroad) 5 Books 20.22
Personal items (watches etc) 15.07 Gift for someone 19.52
Financial products 9.29 Tablet Device 3.74
None of the above 26.7

VOLUME NO. 3 (2013), ISSUE NO. 08 (AUGUST) ISSN 2231-5756
INTERNATIONAL JOURNAL OF RESEARCH IN COMMERCE, IT & MANAGEMENT A Monthly Double-Blind Peer Reviewed (Refereed/Juried) Open Access International e-Journal - Included in the International Serial Directories
http://ijrcm.org.in/
54
Of the India’s general internet population, 9% of go online via mobile. (Source: IMRB)
At the beginning of Q4 2011, the number of mobile internet users reached 43 million. (Source: IMRB)
By 2015, India’s 4G service is projected to account for 28 million connections. (Source: Avendus)
India could become one of the top five countries for smartphones by 2016, representing almost 10% of the entire world supply. In 2011 it represented 2.2% of it. (Source: IDC/Campaign Asia Pacific)
Online Advertising in India is currently generating $410 million a year and represents 7% of total advertising spent. By 2015, it is expected to generate $1.6 billion and comprise 10-15% of India’s overall Ad spent. (Source: Economic Times)
Mobile Advertising spent came to US$56.5 million in 2011. It is forecast to reach $247 million by 2015. (Source: Emarketer)
India’s total social networking audience now totals 43.5 million according to one survey. (Source: Comscore)
There are more than 33 million users who on more than one social networking sites in India. These sites are attracting more than 45,000 news users every day. (Source: Scribble/Techonzo
CONCLUSION
The complexities of modern life are changing the way consumers purchase goods today. The lack of time to spend searching around marketing areas, combined with the increased number of choices, as a result of market globalization, put considerable pressure on the consumer to make fast yet wise purchase decisions. Internet, and especially the World Wide Web, has opened the possibility of electronic commerce (e-shopping), allowing consumers to shop at any time from their own home, thus saving traveling time and in many cases the price comparison overhead. Searching or browsing an online catalogue can be much faster than walking through the aisles of a shopping mall. There are no geographical boundaries and products can be bought from almost any part of the world. However, e-shopping has certain limitations that for some people may become major barriers. There is an obvious need for computer equipment, a broadband Internet connection and some level of basic training for using online tools. Even for customers that are willing to try an online purchase, transaction security is a major concern. The need to provide personal information including credit card numbers prevents many traditional consumers from accepting online commerce. In addition, many people doubt the quality of products offered online, especially when coming from not well known sources. There is no way to try or test a product with on-line shopping, so customers can rely only on pictures, reviews, or word of mouth. For products such as clothes or shoes, a consumer can never be sure how they will fit on him/her. Furthermore, the enjoyment of spontaneous street shopping is lost Online marketing is exactly as it sounds, a way to market your products or services on the internet. Many make the mistake of believing that all it takes to be considered an internet marketer is to have a website. That is far from the truth. There are millions of websites added online every day. What makes a website adequately compete in internet marketing goes far beyond registering a domain name and uploading content. It takes skillful strategy and an evolving knowledge of the internet marketing industry. In order for your business to really thrive, there must be an internet marketing campaign in place. The internet is extremely competitive but it is worth it to find your place amongst the competition. The possibilities for your business when it is successful marketed on the internet are limitless. With this platform, your business is given the opportunity to reach a clientele far beyond the bounds of your business physical location. Then internet allows for your business to be accessed around the world
REFERENES 1. www.avendus.com 2. www.comscore.com 3. www.economictimes.indiatimes.com 4. www.emarketer.com 5. www.google.com 6. www.iamai.in 7. www.imrbint.com 8. www.scribd.com 9. www.slideshare.net 10. www.wikipedia.org

VOLUME NO. 3 (2013), ISSUE NO. 08 (AUGUST) ISSN 2231-5756
INTERNATIONAL JOURNAL OF RESEARCH IN COMMERCE, IT & MANAGEMENT A Monthly Double-Blind Peer Reviewed (Refereed/Juried) Open Access International e-Journal - Included in the International Serial Directories
http://ijrcm.org.in/
55
A STUDY ON EMPLOYEE ENGAGEMENT ACTIVITIES AT EFD
KANIMOZHI.R ASST.PROFESSOR
DEPARTMENT OF BUSINESS ADMINISTRATION THIRUVALLUVAR ARTS & SCIENCE COLLEGE
KURINJIPADI
ABSTRACT Employee Engagement activities is one of the major criterion to know about the success of any organization whether it is a small or big one. The study on the employee engagement activities at EFD – eFunds Corporation (P) Ltd, explores the expectations of the associates to get entertained by their engagement activities. From the study on the employee engagement activities at EFD, it was found that the most of the associates are highly engaged with the company both intellectually & emotionally. Also this paper infers that the associates are more pleased about the birthday bashes celebrations and external agencies giving presentations/seminar at EFD, however they expect more increased entertainment programs. Therefore the concern has to concentrate more on increasing the entertainment programs & recognize their personally preferred topics for external agencies presentations. This paper shows that the associates of EFD-eFunds Corporation (P) Ltd are very much impressed about the Company and the only thing is that they have to incorporate the fewer changes in existing engagement activities and there such that they can satisfy their associates.
KEYWORDS Associates, Intellectually, Emotionally, Entertainment programs, Feedback.
INTRODUCTION mployee engagement is a barometer that determines the association of a person with the organization.” It is a concept that is generally viewed as managing discretionary effort, that is, when employees have choices, they will act in a way that furthers their organization’s interests. An engaged employee is a person who is fully involved in, and enthusiastic about, his or her work.
Most organizations today realize that a ‘satisfied’ employee is not necessarily the ‘best’ employee in terms of loyalty and productivity. It is only an ‘engaged employee’ who is intellectually and emotionally bound with the organization, feels passionate about its goals and is committed towards its values who can be termed thus. He goes the extra mile beyond the basic job responsibility and is associated with the actions that drive the business. Moreover, in times of diminishing loyalty, employee engagement is a powerful retention strategy. The fact that it has a strong impact on the bottom-line adds to its significance.
FIG. 1
The key ingredients of an engaged employee seem to be:
Tenure with the organization
Display of emotional involvement in what he does
Doing more than what is expected
Displaying pride in the place he work Global studies suggest that there are three basic aspects of employee engagement:
The employees and their own unique psychological makeup and experience
The employers and their ability to create the conditions that promote employee engagement
Interaction between employees at all levels A Road Map for Employee Engagement:
Enhance leadership.
Involve your people and value their input.
Look after the organization’s reputation.
Managers do not see communication as part of their day job.
A manifesto for outstanding organizational performance Factors Influencing Employee Engagement
A culture of respect where outstanding work is valued
Availability of constructive feedback and mentoring
Opportunity for advancement and professional development
Fair and appropriate reward, recognition and incentive systems
Availability of effective leadership
E

VOLUME NO. 3 (2013), ISSUE NO. 08 (AUGUST) ISSN 2231-5756
INTERNATIONAL JOURNAL OF RESEARCH IN COMMERCE, IT & MANAGEMENT A Monthly Double-Blind Peer Reviewed (Refereed/Juried) Open Access International e-Journal - Included in the International Serial Directories
http://ijrcm.org.in/
56
Clear job expectations
Adequate tools to complete work responsibilities
High levels of motivation The Keys to Employee Engagement Getting and keeping your employees engaged comes down to three simple factors: -
Leadership by example
A willingness to listen
Being prepared to learn. Importance of Employee Engagement
An organization’s capacity to manage employee engagement is closely related to its ability to achieve high performance levels and superior business results.
Engaged employees will stay with the company,
Be an advocate of the company and its products and services, and
Contribute to bottom line business success.
Engaged employees also normally perform better and are more motivated.
There is a significant link between employee engagement and profitability.
Employee engagement is critical to any organization that seeks
Not only to retain valued employees, but also increase its level of performance.
WAYS TO ATTAIN EMPLOYEE ENGAGEMENT FIG. 2
Listen to your employees and remember that this is a continuous process.
The information your employees supply will provide direction.
Insist upon increased engagement at the managerial level and create and deploy a customized employee satisfaction survey from alpha measure to assess your current level of employee engagement.
Identify problem areas, make a plan and take action towards improvement. Organization Initiatives for Employee Engagement Most organizations have a range of programs to improve the engagement level of their employees. Below are the lists of initiatives can be made by the organization, starting right at the selection stage:
Choosing the right fit and giving a realistic job preview
Strong induction and orientation program
Rigorous training and development, from technical to soft skills to leadership development programs.
To keep up the morale of people and drive them towards excellent performance, through various incentives such as recognition letters, profit sharing schemes, long performance awards, ESOPS, building assets like own home.
Regular feedback to all people
Communication forums like the in-house magazine, In touch, an e-forum to develop entrepreneurship, and regular surveys and conferences
To maintain the quality of work-life and a balance between personal/professional lives, there are recreational activities like festivities, get-togethers, sports, etc
An open and transparent culture to empower its people and develop entrepreneurs. Measuring Employee Engagement
Employee engagement can be revealed in several ways, including ‘pulse’ to annual surveys, tracking changes in the attrition rate, increase in the number of employee referrals, and growth in productivity and business.
“E-Funds measures employee engagement by conducting an Employee Engagement Survey (EES) once every two years in association with a leading global consultant. The survey is conducted at the same time across all eFunds sites worldwide. “This exercise is also supplemented by conducting dipsticks on several issues concerning employee engagement and morale,” informs Kunwar.” Conducting a survey without planning how to handle the result can lead employees to disengage. It is therefore not enough to feel the pulse—the action plan is just as essential” Signs of Low Employee Engagement
The turnover rate is high
Productivity is down
Deadlines are being missed
Morale is low

VOLUME NO. 3 (2013), ISSUE NO. 08 (AUGUST) ISSN 2231-5756
INTERNATIONAL JOURNAL OF RESEARCH IN COMMERCE, IT & MANAGEMENT A Monthly Double-Blind Peer Reviewed (Refereed/Juried) Open Access International e-Journal - Included in the International Serial Directories
http://ijrcm.org.in/
57
Conflicts are happening frequently
Absenteeism is up
Punctuality is a problem
Miscommunication is happening frequently
Theft is a problem Remedies
Hire a team-building expert and arrange a one-day retreat
Host a meeting where you listen to feedback and ideas. Promise to implement at least one of the recommendations – the one that is chosen as the most critical and there is a clear, reasonable solution that can be implemented without putting a high demand on resources.
Create an anonymous feedback mechanism
Meet daily for very short meetings (10 minutes maximum) and share daily priorities and news. Keep the agenda the same every day – 5-6 items.
Create a code of conduct and a set of values as a team and reward staff for demonstrating the code or the values.
Create an incentive plan to encourage positive behavior
Provide feedback and guidance
Make real time to discuss problems
Seek ideas and input from everyone
Provide the resources to solve problems or to do a job well
Give real recognition and/or reward
Provide opportunities for people to develop their potential
Keep the pressure to perform and achieve more with less realistic
Provide opportunities for social interaction
Train people how to resolve interpersonal conflicts
Promote joy and appropriate humour within the office
Be flexible; help people to actively balance work and home responsibilities Engagement Activities Learning and Development Opportunities
Leadership Development Programs
Technical Training
Behavioural Training
Brown Bags & Quests Awards & Recognition Programs
Performance Management
Awards Work Life
Integration within the Company
o Buddy Programs
o Induction Programs
Fun at work place
Birthday bashes
OBJECTIVES Primary Objective To study the effectiveness of employee engagement activities in EFD organization. Secondary Objectives
To evaluate the effectiveness of the employee welfare activities.
To measure the employee perception of the team – HR
To assess the employee satisfaction towards the workplace.
METHODOLOGY The type of research used in this paper is descriptive in nature. Survey method is considered the best method for data collection of data and the tools used for data collection are Questionnaire. Two sources of data collection namely Primary & Secondary were used. Universe is 800 and the sample size is 30 derived by simple random sampling. Coefficient of Variation Let X be the HR approachability Let Y be the happening of Skip level & Town hall meetings]
X
X-X = X
X²
Y
Y-Y=Y
Y²
23 17 289 29 23 529
6 0 0 1 -5 25
1 -5 25 0 -6 36
0 -6 36 0 -6 36
0 -6 36 0 -6 36
∑ X=30
∑ X=0
386
∑X=30
∑X=0
662
C.V. = /X * 100 X = ∑ X/N = √X²/N X = 3.93 C.V. = /Y * 100 Y = ∑ Y/N =√Y²/N Y = 5.14

VOLUME NO. 3 (2013), ISSUE NO. 08 (AUGUST) ISSN 2231-5756
INTERNATIONAL JOURNAL OF RESEARCH IN COMMERCE, IT & MANAGEMENT A Monthly Double-Blind Peer Reviewed (Refereed/Juried) Open Access International e-Journal - Included in the International Serial Directories
http://ijrcm.org.in/
58
Inference: From the value of Coefficient of variance it is inferred that the meetings conducted by the HR is less than their Approachability. Therefore the Team HR is approachable.
LIMITATIONS The study is based upon small sample size of 30 samples. Inconvenience in meeting all the associates and collect data. The study is based on employee’s side only. It does not explore the pros and corns on the side of employers.
CONCLUSION To conclude, this paper explores the employee engagement activities at EFD infers that the employees have a good will within the organization and the concern has to focus on the key areas where the associate’s needs has to be satisfied to lower the attrition rate , to provide a high-energy working environment and to improve the overall organizational effectiveness
REFERENCES 1. Arun Monappa “Personal Management” Second Edition 2. Gupta, S.P., “Statistical Methods”, Thirty Fourth Editions, 2005 3. Kothari C.R., “Research Methodology – Methods & Techniques “ Publishers- New Age International (P) Ltd., New Delhi, 2nd edition. WEBSITES 4. http://en.wikipedia.org/wiki/Employee_engagement 5. http://hrdigest.in/hrd-employee engagement-india/ 6. http://www.infosysbpo.com/offerings/functions/human-resources-outsourcing/white-papers/Documents/employee-engagement.pdf 7. http://www.oncontract.com/blog/employee-engagement/

VOLUME NO. 3 (2013), ISSUE NO. 08 (AUGUST) ISSN 2231-5756
INTERNATIONAL JOURNAL OF RESEARCH IN COMMERCE, IT & MANAGEMENT A Monthly Double-Blind Peer Reviewed (Refereed/Juried) Open Access International e-Journal - Included in the International Serial Directories
http://ijrcm.org.in/
59
NATURE AND TRENDS OF PUBLIC EXPENDITURE IN MANIPUR (2000-2010)
HUIDROM IMOBI SINGH ASST. PROFESSOR
DEPARTMENT OF ECONOMICS DON BOSCO COLLEGE
MARAM
ABSTRACT This paper assesses how the State’s Expenditure and its component influences economic development in the State economy of Manipur. It uses for analysis the available data on State’s Expenditure during the periods 2000 to 2010. It examines the volume and trends of government expenditure. It analyses the developmental and non-developmental expenditure, Plan and Non-plan expenditure in the State. A multiple regression model employing all the expenditure variables was applied in the analysis. The findings will provide useful information for policy makers and reformers that can help broaden their understanding of the relationship between Government Expenditure and economic development. A right direction of Expenditure is the urgent needs in the state economy and this finding could aid policy formulation.
KEYWORDS Developmental and Non-developmental expenditure, GSDP Public Expenditure, Plan and Non-plan Expenditure.
1. INTRODUCTION ne of the powerful instruments of fiscal policy in underdeveloped countries, especially the underdeveloped economy of Manipur is public expenditure. Government’s expenditure is called a powerful instrument of fiscal policy for underdeveloped countries in which welfare of the people is examined through utilization of resources for the maximization of public satisfaction. Expenses incurred by government Central-State and Local either for the
development or non-development activities can be termed as public expenditure. It has two account, revenue and capital expenditure. The volume of public expenditure has been increasing year by year in the government budget; it is because of the dynamic and continuous expansion of government activities. Prof. B.N.P. Singh has asserted that “In modern times public expenditure has become popular like mineral oil without which the car of economic development cannot run speedily so as to achieve a rapid transformation from backward agricultural state to a modern industrial power. So, this rapid transformation cannot be possible without huge expenditure on the economic front”1. The volume of public expenditure relates to the economic development and the structure of the economy. The relationship between economic development and the magnitude of public expenditure has been a debatable among the policy reformers and economists. As the development goes forward, the public expenditure has to be increased. In fact, public expenditure has increasing in a high volume in India and in the context of Manipur. There was less importance of public expenditure in the nineteenth century, since the policy of non-intervention of government and free enterprise economy were existed. The importance of public expenditure has increasing in the twentieth and twenty first century. The volume and magnitude of the expenditure of the government affects the social and economic life of the people in various ways. It's importance on education, health, social infrastructure, agricultural and industrial setup etc. were increasing and affect the entire economic structure. It can improve the standard of living of masses-shifting the consumptions, production and distribution in the economy. The Government of Manipur prepares its annual budget every year and presents the same in the State Assembly during the month of March. All the Ministries of the State prepare their annual requirement and submit it to the Finance Ministry for inclusion into the budget. However, the financial requirement of all the ministries are carefully studied on the basis of their priorities and ultimately funds are allotted to spend for various socio- economic development of the State. “The RBI has been classifying budget heads into functional categories such as, developmental and non-developmental items under expenditures from the beginning of the early 1950s (krisnaswamy 1953) and taxes on commodities and services, on the tax side, as from the 1980s. All expenditures under revenue and capital accounts are broadly categorized into general services, economic services and social services.”2 The Expenditure on Economic Services includes, Agriculture and rural development, Industry, Physical infrastructure etc. and social services belonging health, education, housing, labour welfare etc constitute developmental expenditures, while those on general services of an administrative nature including pensions as well as interest payments and debt redemptions are covered under the category of non-developmental expenditure. Under developmental expenditure both revenue and capital, there are direct expenditure for social and economic services, but there are also loans and advances by State’s Government described as developmental advances (5 to 6% of total developmental expenditures). Again, each category of revenue and capital accounts as well as developmental and non-developmental heads, is decomposed into PLAN and NON-PLAN expenditure categories, relates to expenditure on annual plan projects, programmes and schemes approved by the planning commission and time phased under each year of a State’s five year plan; these include Centrally Sponsored Schemes(CSS) or Central sector plan schemes routed through State budget with or without matching State expenditures; the latter are outsides the state plan outlays.3 Non-plan expenditure is a generic term, which is used to cover all expenditures of the government not included in its annual plan programme; it may either be revenue expenditure and capital expenditure. Such non-plan expenditure is incurred under both developmental and non-developmental heads.4 “There are two possible explanations of the ineffectiveness of government expenditure in the State’s economy. First, a high ‘import-intensity’ of consumption, with a large proportion of both private as well as public expenditure being met out of goods and services bought from the rest of the country. Second, leakages on account of terrorism-related extortion and corruption. Funds siphoned out through terrorism related extortion or corruption results in ‘actual’ expenditure being substantially less than the reported expenditure. Reported expenditure siphoned out through such unholy channels gets parked outside Manipur and fails to impart and impetus to either capital formation or to the growth momentum in Manipur... ”5 A careful analysis of the government expenditure is necessary in such critical juncture. A redirection of expenditure on the economic growth fronts is necessary. For the effective utilization of the available funds, a suitable expenditure policy coherent with the economy is the urgent requirement. The government, the NGOs and the private individuals should initiate a new investment project for generating employment with the aim of producing more output for own consumption and export. Expenditure for creating productive capacity and high yield production from all the sectors of the economy is the means for faster economic growth and government has certain responsible for that. Therefore, a right direction and proper management of government expenditure is required for economic development in Manipur.
1 Singh, B.N.P. - Public Expenditure and Economic Development in India, Capital Publishing House, Delhi, 1983, P.30 2 Krishnaswamy,K.S (1953): Finances of part A and B States, Reserve Bank of India Bulletin, May, as quoted by EPWRF, A Study of States Finance, July 10, 2004,p.10, 3 . Eleven Finance Commission Report (2000), p32 4 Government of India (Feb 2003) - Expenditure Budget 2003-04, Vol 2. 5 Lahiri, A.K., Chattopadhyay, S. & Singh, E. Bijoykumar (2001) - A Study of State Fiscal Reforms in Manipur, National Institute of Public Finance and Policy New Delhi-110067, p28
O

VOLUME NO. 3 (2013), ISSUE NO. 08 (AUGUST) ISSN 2231-5756
INTERNATIONAL JOURNAL OF RESEARCH IN COMMERCE, IT & MANAGEMENT A Monthly Double-Blind Peer Reviewed (Refereed/Juried) Open Access International e-Journal - Included in the International Serial Directories
http://ijrcm.org.in/
60
2. DEVELOPMENTAL AND NON-DEVELOPMENTAL EXPENDITURE Government of an economy performs various activities in the business of social life. They are spending huge amount of money for growth and development. It is under the category of expenses incurred by the government for Developmental and Non-developmental expenditure. These are included in the budget and coming from two accounts namely, revenue and capital account. The detail analyses of developmental and non-developmental expenditure from the two accounts of the state economy are as follows. 2.1 DEVELOPMENTAL EXPENDITURE The expenditure for the development of the different sectors of the economy can be considered as developmental expenditure. Actually, the expenditure which can promote growth should be termed as developmental expenditure. It comprises the expenditure on economic and social services. Economic services refer to the services for the development of the three sectors of the economy. It includes Agriculture and allied services, Industry and mining, Rural development, Water and power development, Transport and communication, Science & Technology, Environment and General economic services. Social services includes Education, Art and culture, Sports, Health services, Labour and employment, Social security and welfare including STs, SCs and OBCs, Housing and urban development, Natural calamities, Information and publicity etc. Again developmental expenditure consists of two accounts. The revenue and capital account. The developmental expenditure on revenue account includes education, art & culture, medical, family welfare, public health, labour and employment, science and technology and other community services. These are known as social and community services. It also includes expenditure on economic services. “Grants–in-aid to the states and union territories Governments for financing developmental projects also forms part of the developmental expenditure on the revenue account. Broadly, speaking the expenditure on social and economic services, Grant-in-aid to the states and union territories Governments is termed as developmental expenditure on revenue account.”6 The developmental expenditure on capital account refers to the expenditure on 1) Social services. 2) Economic services. 3) Loans & advances for financing developmental projects and 4) Loans & advances to finance public enterprises.7 2.2 NON-DEVELOPMENTAL EXPENDITURE The expenditure which does not promote growth can be termed as non-developmental expenditure. But, in real practice, it is difficult to consider that the expenditure classified as non-developmental does not in any way the promotion of growth. Non-developmental expenditure includes General administrative services, Fiscal services, Debt services and grants-in-aid to local institutions & bodies. The non-developmental expenditure on revenue account includes Audit, collection of taxes and duties, interest payments, administrative services. Pension and retirement benefits and defence expenditure. The non-developmental expenditure on capital account includes defence, trading scheme etc. Defence is both revenue and capital expenditure- a part from revenue account and another from capital account.
3. DEVELOPMENTAL AND NON-DEVELOPMENTAL EXPENDITURE UNDER REVENUE ACCOUNT It is general fact and understanding that developmental expenditure should be greater share than the non-developmental expenditure. Now, let us see the trends in developmental and non-developmental expenditure during the periods of 2000 to 2010 in the state economy. The total expenditure under the revenue account in the fiscal year 2000-01 is Rs.1,12,343.73 lakhs (Table 1.1). The respective shares in the developmental and non-developmental expenditure are Rs. 60,861.95 lakhs and Rs. 51,481.78 lakhs. In the mid of the analysis, the fiscal year 2005-06 the total expenditure rose to Rs.1,84,973.39 lakhs , Rs.1,28,162.80 lakhs in the developmental and Rs.73,386.46 lakhs in the non-developmental expenditure. The Total expenditure touches Rs. 3,18,977.80 lakhs in the fiscal year 2009-10 and the developmental expenditure becomes Rs. 1,98,744.30 lakhs. In the budget estimate of the fiscal year 2010-11, the total expenditure is Rs.3,36,031.98 lakhs and the respective shares in the developmental & non-developmental expenditure are Rs. 2,05,992.99 lakhs & Rs. 1,30,038.99 lakhs.
TABLE 1.1 - DEVELOPMENTAL AND NON-DEVELOPMENTAL EXPENDITURE UNDER REVENUE ACCOUNT (Rs. In lakhs)
Years Developmental Non-Developmental Total Expenditure
2000-01 60,861.95 51,481.78 1,12,343.73
2001-02 77,561.08 56,234.55 1,33,795.63
2002-03 76,451.68 65,058.88 1,41,510.56
2003-04 83,731.18 62,615.87 1,46,347.05
2004-05 98,371.99 69,038.01 1,67,410.00
2005-06 1,28,162.80 73,386.46 1,84,973.39
2006-07 1,54,129.77 87,334.92 2,41,464.69
2007-08 1,36,057.65 93,194.66 2,29,252.31
2008-09 1,52,766.10 1,09,462.04 2,62,228.14
2009-10 1,70713.66 1,30725.75 3,01439.41
2010-11 2,32215.11 175585.55 407800.66
Source: 1. Government of Manipur(2005-06), Economic Survey, Directorate of Economics & Statistics, Imphal, Manipur. 2. Government of Manipur, Economic Survey (2010-11), Directorate of Economics & Statistics, Imphal, Manipur.
FIGURE 1.1- TREND LINE OF DEVELOPMENT AND NON-DEVELOPMENT EXPENDITURE
6 Tyagi, B.P. (1985) – Public Finance, Jai Prakhas Nath Publication,Meerut, p.916. 7 ibid, p.917
0
50000
100000
150000
200000
250000
300000
350000
400000
Year
s
20
00
-01
20
01
-02
20
02
-03
20
03
-04
20
04
-05
20
05
-06
20
06
-07
20
07
-08
20
08
-09
20
09
-10
20
10
-11
Linear forecast trend lineDevelopmental
Non-Developmental
Total Expenditure
Linear ( Developmental)
Linear (Non-Developmental)
Linear ( Total Expenditure )

VOLUME NO. 3 (2013), ISSUE NO. 08 (AUGUST) ISSN 2231-5756
INTERNATIONAL JOURNAL OF RESEARCH IN COMMERCE, IT & MANAGEMENT A Monthly Double-Blind Peer Reviewed (Refereed/Juried) Open Access International e-Journal - Included in the International Serial Directories
http://ijrcm.org.in/
61
The linear forecast trend line shows the increasing trends in the three variables, namely the Developmental, Non-Developmental and the Total Expenditure. During the periods of ten years, 2000 to 2010 the government expenditure increases a lot in the state’s economy. Again, the developmental expenditure is classified into Economic and Social services. We can analyse the share of economic services, the share of Social services and the share of non-developmental to the total expenditure. For the economic growth and more GSDP, it requires more expenditure share on the Economic services. Economic services consist of the following; 1. Agriculture and allied activities 2. Rural development and special area programme 3. Irrigation and flood control 4. Energy 5. Industry and minerals 6. Transport 7.Science, Technology and Environment. 8. General economic services. Social services consisting of the following categories; Education including Arts & Culture ,Health and Family welfare ,Housing & Urban Development including water supply & sanitation ,Information & Broadcasting ,Social security & Welfare ,Labour & Employment and Natural calamities & others. Non-developmental expenditure generally is the expenditure on the General services of the economy and consisting of the following items: Organs of the state, Fiscal services, Interest payment & servicing of debt, Administrative services and Pension & Miscellaneous General services.
TABLE 1.2 – TOTAL REVENUE EXPENDITURE ON THREE DIFFERENT HEADS
Years (Rs. In lakhs) Economic Services Social Services Non- Developmental Total Expenditure
2000-01 21049.72 39812.23 51481.78 1,12,343.7
2001-02 32544.52 45016.56 56234.55 1,33,795.6
2002-03 30308.4 46143.28 65058.88 1,41,510.5
2003-04 37140 46591.18 62615.87 1,46,347.0
2004-05 41520.95 56851.04 69038.01 1,67,410.0
2005-06 59788.18 68374.62 73386.46 1,84,973.3
2006-07 87734.02 66395.75 87334.92 2,41,464.6
2007-08 64234.72 71822.93 93194.66 2,29,252.3
2008-09 72462.32 80803.78 109462.04 2,62,228.1
2009-10 81597.89 89115.77 130725.75 301439.41
2010-11 108368.25 123846.86 175585.55 407800.66
(Source: Same as Table 1.2)
FIGURE 1.2 – LINEAR TREND LINE OF REVENUE EXPENDITURE INTO THREE HEADS
The share of non-developmental expenditure under the revenue account was being highest during the periods 2000 to 2010 compare to expenditure on social service and expenditure on economic service. Among the three categories of expenditure the share on economic service was minimum during the periods 2000-01 to 2005-06.
4. DEVELOPMENTAL AND NON-DEVELOPMENTAL EXPENDITURE UNDER CAPITAL ACCOUNT The developmental and non-developmental expenditure has also done from the capital account and termed as Capital Expenditure. Unlike the Revenue Expenditure, the Capital Expenditure is mainly for development and has bigger share on the developmental expenditure. The development expenditure has two categories, namely 1) Social and Community Services and 2) Economic Services. The non-development expenditure is the expenditure not for special development in the economy but mainly for General Services and other public works. The development expenditure for Social and community services includes the following; 1. Education, Art & Culture 2. Medical, Family Planning, Health, Sanitation and Water Supply 3. Housing and Urban Development 4. Others Social and Community Services. The Economic Services includes eight sub-categories; 1. General Economic Services 2. Agriculture & Allied Services 3. Industry and Mineral 4. Water and power Development 5. Transport & Communication 6. Special Area Development Programme 7. Science, Technology & Environment 8. Rural Development.
0
20000
40000
60000
80000
100000
120000
140000
Economic Services
Social Services
Non-Developmental
Linear (Economic Services)
Linear (Social Services)
Linear ( Non-Developmental)

VOLUME NO. 3 (2013), ISSUE NO. 08 (AUGUST) ISSN 2231-5756
INTERNATIONAL JOURNAL OF RESEARCH IN COMMERCE, IT & MANAGEMENT A Monthly Double-Blind Peer Reviewed (Refereed/Juried) Open Access International e-Journal - Included in the International Serial Directories
http://ijrcm.org.in/
62
TABLE 1.3 – DEVELOPMENTAL & NON-DEVELOPMENTAL EXPENDITURE UNDER CAPITAL ACCOUNT
Sources: Government of Manipur (2005-06), Economic Survey Manipur, Directorate of Economics & Statistics, Imphal and Government of Manipur (2011-12), Economic Survey Manpur, Directorate of Economics & Statistics, Imphal.
FIGURE 1.3 – LINE GRAPH OF CAPITAL EXPENDITURE
The above line graph depicts the trends in Capital Expenditure on Developmental and Non-developmental activities during 2000 to 2010. TCE, DEES, DESCS and N-D are the respective line graph of Total Capital Expenditure, Developmental Expenditure on Economic Services, Developmental Expenditure on Social & Community Services and Non-developmental Expenditure.
TABLE 1.4 - PLAN AND NON-PLAN EXPENDITURE OF MANIPUR
Source: Government of Manipur, Finance Account, Various issues and Government of Manipur, 2010-11, Annual financial statement.
0
50000
100000
150000
200000
250000
Year
20
00
-01
20
01
-02
20
02
-03
20
03
-04
20
04
-05
20
05
-06
20
06
-07
20
07
-08
20
08
-09
20
09
-10
20
10
-11
C
a
p
i
t
a
l
E
x
p
e
n
d
i
t
u
r
e
Line Graph of Developmental & Non-developmental Expenditure
Developmental Expen Social & Com Services
Developmental Expen Economic Servics
Non-Developmental
Total Capital Expenditure
TCE
DEES
DESCS
N-D
Developmental Expenditure Non-Developmental Expenditure Total Capita Expenditure Social & Comm. Services Economic Services
Year (Rs. In lakhs)
2000-01 3995 10563 192 14750
2001-02 4836 12281 429 17546
2002-03 7475 8077 519 16071
2003-04 9729 13389 922 24040
2004-05 25803 24864 1452 52119
2005-06 13042 29766 18774 61582
2006-07 27050 46502 13145 86697
2007-08 37831 62542 10419 110792
2008-09 54715 86486 5479 146680
2009-10 55910 92567 10301 158778
2010-11 60073 105257 26476 191806
Plan Non-plan Centrally Sponsored plan Scheme Total Expenditure
Year (Rs. In lakhs)
2000-01 28831.68 93739.61 4521.97 127093.26
2001-02 28723.07 113819.1 8799.92 151342.1
2002-03 19728.85 127638.3 10213.93 157581.08
2003-04 28832.04 127552.1 14002.55 170386.65
2004-05 63478.71 139697.3 14061.01 217237.03
2005-06 83210.3 159231.3 19591.17 262032.74
2006-07 103706.3 199706.7 24749.05 328161.98
2007-08 129972 181092.8 28979.23 340044.06
2008-09 160137.1 213523.3 35247.74 408908.2
2009-10 174321.67 230371.0 55525.36 460218.23
2010-11 247052.89 298043.0 54510.37 599606.36

VOLUME NO. 3 (2013), ISSUE NO. 08 (AUGUST) ISSN 2231-5756
INTERNATIONAL JOURNAL OF RESEARCH IN COMMERCE, IT & MANAGEMENT A Monthly Double-Blind Peer Reviewed (Refereed/Juried) Open Access International e-Journal - Included in the International Serial Directories
http://ijrcm.org.in/
63
5. THE PLAN AND NON-PLAN EXPENDITURE IN MANIPUR The dichotomy between plan and non-plan expenditures has been discussed at great length in the Report of the Eleventh Finance Commission. Quoting a Union Finance Minister’s observations, the Report argues that with excessive focus on plan expenditure, there has occurred a corresponding neglect of maintenance of past projects which is classified as non-plan. Thus, in the 1998-99 budget speech, a task force was proposed to examine the question of eliminating “the plan and non-plan distinction in the budget and to make recommendations for a functionally viable and more focused presentation of government expenditure in the budget”8. Table 1.4 shows that total expenditure comprising plan, non-plan and centrally sponsored plan increased from Rs.127093.26 lakhs in 2000-01 to Rs.478140.99 lakhs in 2010-11. Among the three types of expenditure non-plan expenditure contributing more share. In the fiscal year 2000-01, the plan expenditure is Rs.28831.68 (22.68%) lakhs, the non-plan expenditure is Rs.93739.61 (73.76%) lahks and centrally sponsored plan scheme is Rs.4521.97 (3.56%) lakhs respectively. In the fiscal year 2005-06, the total expenditure is Rs.262032.74 lakhs. The respective share of Plan, Non-plan and Centrally sponsored plan scheme are Rs.83210.3 lakhs, Rs.159231.3 lakhs and Rs.1991.17 lakhs at the percentage of 31.75%, 60.77% and 7.48% respectively (Table 1.4). At the end of the period and in the fiscal year 2010-11, the respective percentage share of Plan, Non-plan and Centrally sponsored plan are 37.95%, 57.15% and 4.9%.
FIGURE 1.4 – LINE GRAPH OF PLAN AND NON-PLAN EXPENDITURE
The figure shows that the largest share of Non-plan Expenditure to the Total Expenditure which is increasing during the period 2000 to 2010. The economy is more emplacing on the Non-plan expenditure.
TABLE NO. 1. 5: PLAN AND NON-PLAN EXPENDITURE OF MANIPUR (% to the total Expenditure)
Source: Government of Manipur (2005-06), Economic Survey Manipur, Directorate of Economics and Statistics, Imphal and Government of Manipur, Planning Commission, Ninth, Tenth and Eleven Plan.
The Bar Diagram shows the contribution made in percentage by the Plan, Non-plan and centrally sponsored plan Scheme during 2000 to 2010. Among the three types of Expenditure the percentage share of Non-plan Expenditure to the Total Expenditure is highest throughout the period. It shows that the State is spending more amounts in non-plan activities and little care on the Plan Expenditure. A right direction and adequate amount is necessary in a Plan Mechanism for the growth of the economy. It is supposed that the economy has less knowledge of the advantages from planning. It is desirable and much better in the economy that the amount of expenditure under the Plan must be bigger share.
8 The Eleventh Finance Commission (2000), Report of the Eleven finance commission,P.33and199
0
100000
200000
300000
400000
500000
600000
700000
Year
20
00
-01
20
01
-02
20
02
-03
20
03
-04
20
04
-05
20
05
-06
20
06
-07
20
07
-08
20
08
-09
20
09
-10
20
10
-11
Plan
Non-plan
Centrally Sponsored plan Scheme
Total Expenditure
Year Plan % Non-plan % Centrally Sponsored Plan Scheme
2000-01 22.68 73.76 3.56
2001-02 18.98 75.21 5.81
2002-03 12.52 81 6.48
2003-04 16.92 74.86 8.22
2004-05 29.22 64.31 6.47
2005-06 31.75 60.77 7.48
2006-07 31.6 60.86 7.54
2007-08 38.22 53.26 8.52
2008-09 39.16 52.22 8.62
2009-10 37.87 50.05 12.08
2010-11 40.70 50.20 9.1

VOLUME NO. 3 (2013), ISSUE NO. 08 (AUGUST) ISSN 2231-5756
INTERNATIONAL JOURNAL OF RESEARCH IN COMMERCE, IT & MANAGEMENT A Monthly Double-Blind Peer Reviewed (Refereed/Juried) Open Access International e-Journal - Included in the International Serial Directories
http://ijrcm.org.in/
64
FIGURE 1.5 –BAR CHART SHOWING THE % OF PLAN AND NON-PLAN EXPENDITURE
6. EXPENDITURE ON ECONOMIC SERVICES AND GSDP The total expenditure from revenue and capital account on the economic services and their respective GSDP is an important area for analysis. The expenditure on economic services is specially the expenditure to the three sectors i.e., the primary sector, the secondary sector and the tertiary sector. Primary sector includes Agriculture and allied activities, special area development and rural development. The expenditure on primary sector from revenue account was Rs. 8676.63 lakhs and Rs.493.97 lakhs from Capital account, a total of Rs.9170.60 lakhs as primary sector expenditure in the fiscal year 2000-01 (Table 1.6). The contribution of Primary Sector to the GSDP is Rs.93267.99 lakhs as termed as Primary DP in the fiscal year 2000-01 as shown in the table 1.6 below. The ratio of expenditure both from revenue and capital account to the GSDP is 10.82% in that year. Secondary sector consists of industry and mineral, Water and Power development. The expenditure on secondary sector in the fiscal year 2000-01 is Rs.16611.14 Lakhs and Secondary sector DP (Contribution of Secondary sector to the GSDP) is Rs.56328.73 lakhs. Similarly, the expenditure on tertiary sector is Rs.5831.29 lakhs and the Tertiary sector DP is Rs.142413.30 lakhs in the fiscal year 2000-01. The tertiary sector includes Transport & communication, Science, technology & Environment and General Economic Services.
TABLE – 1.6: EXPENDITURE ON ECONOMIC SERVICES AND GSDP
Source: Compiled and computed from Government of Manipur (2005-06), Economic Survey Manipur, Directorate of Economics & Statistics, Imphal & Government of Manipur (2007-08), A Picture of Manipur Budget, Directorate of Economics & Statistics, Imphal
The Expenditure on Primary sector, Secondary sector and the Tertiary sector (Economic Services) during the periods of 2000 to 2004 as shown below is very small compare to their respective Domestic product. So, the Total Expenditure on Economic services is very small amount compare to GSDP which is also less than the overall total expenditure of the economy.
0
20
40
60
80
100
120
Centrally Sponsored Plan Scheme
Non-plan %
Plan %
(Rs. In lakhs) 2000-01 2001-02 2002-03 2003-04 2004-05
PRIMARY EXP. 9170.6 14719.01 11075.49 15050.23 20382.62
SECONDARY EXP. 16611.14 21676.35 17847.18 25307.5 31760.62
TERTIARY EXP. 5831.29 8440.13 9462.42 10176.56 12654.05
TOTAL EXPENDITURE 31613.03 44835.49 38385.09 50534.29 64797.29
GSDP at current price 292010 334423 350671 397924 513336
PRIMARY DP 93267.99 98621.34 103938.9 117825.3 127050.7
SECONDARY DP 56328.73 67252.47 71010.88 102584.8 188189
TERTIARY DP 142413.3 168883.6 175721.2 177513.9 198096.4
TE-GSDP Ratio 10.82601 13.40682 10.94618 12.69948 12.62278
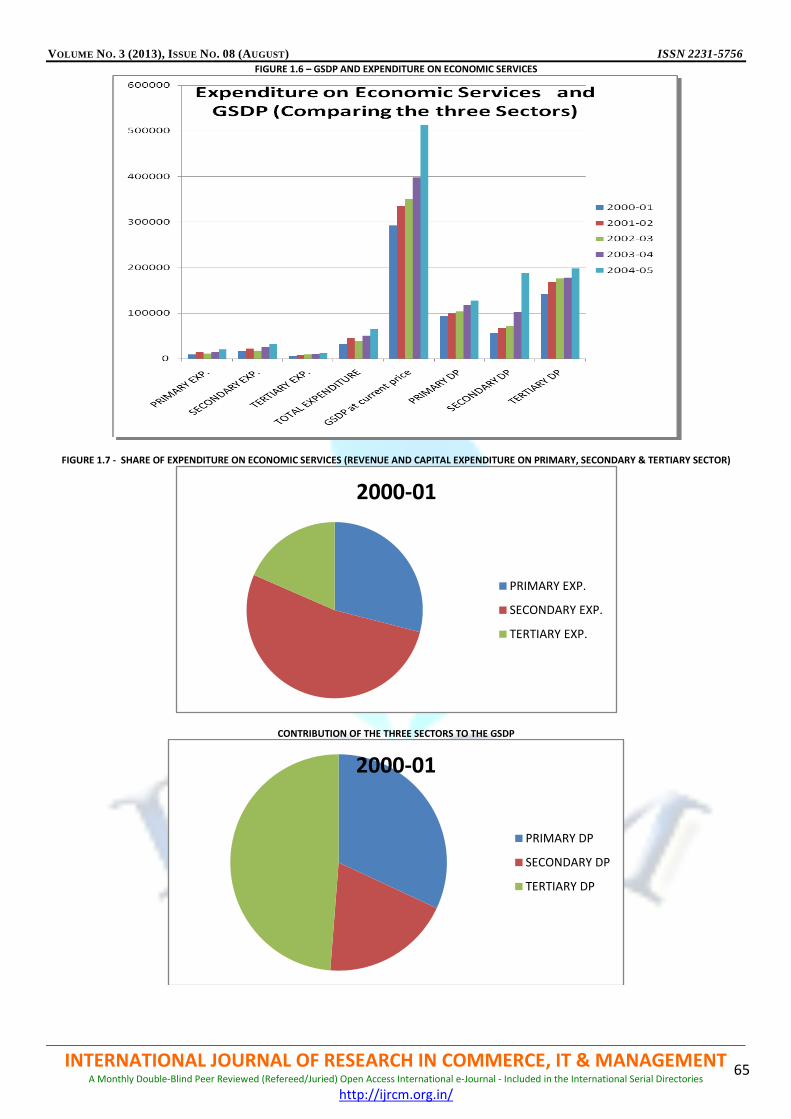
VOLUME NO. 3 (2013), ISSUE NO. 08 (AUGUST) ISSN 2231-5756
INTERNATIONAL JOURNAL OF RESEARCH IN COMMERCE, IT & MANAGEMENT A Monthly Double-Blind Peer Reviewed (Refereed/Juried) Open Access International e-Journal - Included in the International Serial Directories
http://ijrcm.org.in/
65
FIGURE 1.6 – GSDP AND EXPENDITURE ON ECONOMIC SERVICES
FIGURE 1.7 - SHARE OF EXPENDITURE ON ECONOMIC SERVICES (REVENUE AND CAPITAL EXPENDITURE ON PRIMARY, SECONDARY & TERTIARY SECTOR)
CONTRIBUTION OF THE THREE SECTORS TO THE GSDP
2000-01
PRIMARY EXP.
SECONDARY EXP.
TERTIARY EXP.
2000-01
PRIMARY DP
SECONDARY DP
TERTIARY DP

VOLUME NO. 3 (2013), ISSUE NO. 08 (AUGUST) ISSN 2231-5756
INTERNATIONAL JOURNAL OF RESEARCH IN COMMERCE, IT & MANAGEMENT A Monthly Double-Blind Peer Reviewed (Refereed/Juried) Open Access International e-Journal - Included in the International Serial Directories
http://ijrcm.org.in/
66
FIGURE 1.8 – RATIO OF TOTAL ECONOMIC SERVICES EXPENDITURE TO GSDP
The above trend line indicates that the total expenditure on Economic services is around 10% to 13% of the GSDP. There is increasing trend in the expenditure (Revenue & Capital) on the Economic services during 2000-01 to 2004-05. The highest ratio of 13.40% of the GSDP was in the fiscal year 2001-02.
7. MANAGEMENT AND DIRECTION OF PUBLIC EXPENDITURE In the foregoing analysis, we have seen that the various types of government expenditure for different activities are in increasing trends. The plan and non-plan on the one side, the developmental and non-developmental classification on the other are all at the increasing direction. But, the alarming question is how far the expenditure direction and magnitude were managing efficiently for growth and maximum satisfaction of the society. Government expenditure has some certain role for the development of the economy, especially the underdeveloped and developing economies. Public Expenditure is the means for generating further resources in the economy and government can raise more revenue from it. Regarding the direction of expenditure in the present scenario of Manipur, we need to consider the percentage of plan expenditure to the total expenditure. We have seen that the plan expenditure share is very low which indicates that the state has no proper planning system. Planning is very important to chalk out the proper direction of expenditure. Only 12.52% of the total expenditure in the fiscal year 2002-03, was for the plan expenditure. It suggests that more than 80% of the Total expenditure must from the plan expenditure. During the periods 2000 to 2010 the planning share is below 40%. Another point regarding the direction of expenditure is the consideration of expenditure on economic services. More expenditure on economic services is being needs of the time. Expenditure on Primary, Secondary and Tertiary sector should be increase for more production and higher GSDP. The direct expenditure on the three sectors is below 15% of the GSDP. It suggests that 30% of the GSDP should be expenditure on the Economic Services. Recommendations of the High Level Expert Committee on Public Expenditure: The Planning Commission constituted a High Level Expert Committee on Efficient Management of Public Expenditure (Chairman: Dr.C Rangarajan) for plan financing in India. The Committee submitted its report in July 2011.The Committee has recommended that while the process of preparing Five Year Plans the distinction between Plan and non-Plan expenditure may be continued and may be removed from the budgets of the Union and State Governments to present a more holistic view of expenditure rather than the present segmented view. The recommendation of the Group includes the following: 9 • One-to-one correspondence between the annual budgetary component of the plan of the Centre and States and the government budgets of the Centre and States, respectively. • A shift in the budgeting approach from a one-year horizon to a multi-year horizon and from input-based budgeting to outputs and outcomes. • Changes in organizational structure, mandates and processes as well as appropriate interventions in human resource development and information technology in order to accommodate the shift to holistic view of expenditure. • Defining and delineating the role of the Ministry of Finance, the Planning Commission, administrative ministries and the State governments. • Changes in the Annual Budget process. Comprehensive Framework of Transfers to States • A new multi-dimensional budget and accounting classification to present a comprehensive view of Central transfers to States. • The proposed classification to provide uniform codes for central programmes, sub programmes and schemes being implemented in the States. • The Central Plan Scheme Monitoring System (CPSMS) to be extended to enable tracking of expenditure for all central schemes using both treasury route and society route. This may require interface of CPSMS with core banking solutions of banks, systems of State treasuries and accountant general offices. • Empowering citizens with information on the flow of resources and their utilization through a portal, thereby promoting transparency and accountability. The direction given by the expert committee for the efficient management of public expenditure need to be consider and analyzed by an expert body of eminent economists, forecasters and fiscalists in Manipur. For the holistic view of public expenditure, the government need to be organized and should employ developed human resources and information technology. A redirection of expenditure based on output and outcomes of the particular sector is the present requirement. The committee suggested a multi-year horizon budgetary approach through shifting the one-year horizon of budgeting approach. The finance department, the planning commission and the various ministers should have a delineating role for a proper direction of expenditure in the state.
8. CONCLUSION The State economy is growing with the growth of government expenditure. All the expenditure components are at the increasing direction. But, the share of expenditure on Economic Services to the total expenditure and GSDP is very low. Government need to consider on this sector for more growth of GSDP. The expenditure on directly productive activities especially in the field of industrial sector is the immediate means for higher GSDP growth in the State.
9 Government of India - High Level expert Committee, Planning Commission, Sept 2, 2012, Press Imformation Bureau.
0
2
4
6
8
10
12
14
16
1 2 3 4 5
Year 2000-01 2001-02 2002-03 2003-04 2004-05
TE-GSDP Ratio(Expenditure on Economic Services)
TE-GSDP Ratio
Linear (TE-GSDP Ratio)

VOLUME NO. 3 (2013), ISSUE NO. 08 (AUGUST) ISSN 2231-5756
INTERNATIONAL JOURNAL OF RESEARCH IN COMMERCE, IT & MANAGEMENT A Monthly Double-Blind Peer Reviewed (Refereed/Juried) Open Access International e-Journal - Included in the International Serial Directories
http://ijrcm.org.in/
67
REFERENCES 1. Ebimobowei, A. (2010) – The Relationship Between Fiscal Policy and Economic Growth in Nigeria (1991-2005) International Journal of Economic
Development Research and Investment, Vol. 1 Nos. 2 & 3, 2010. 2. Government of India (2012) - High Level expert Committee, Planning Commission, Sept 2, 2012, Press Imformation Bureau. 3. Government of Manipur (2010-11) - Economic Survey, Directorate of Economics & Statistics, Imphal, Manipur. 4. Government of Manipur (2012-13) - A Picture of Manipur Budget, Directorate of Economics & Statistics, Imphal. 5. Krishnaswamy,K.S (1953): Finances of part A and B States, Reserve Bank of India Bulletin, May, 6. Lahiri, A.K., Chattopadhyay, S. & Singh, E. Bijoykumar (2001) - A Study of State Fiscal Reforms in Manipur, National Institute of Public Finance and Policy
New Delhi-110067. 7. Salvatore, D. and Reagle, D. (2002) – Theory and Problems of Statistics and Econometrics, 2nd edition, McGraw Hill, Schaum’s Outline Series, www.LisAri.
Com. 8. Singh, B.N.P. (1983) - Public Expenditure and Economic Development in India, Capital Publishing House, Delhi. 9. Tyagi, B.P. (1985) – Public Finance, Jai Prakhas Nath Publication, Meerut.

VOLUME NO. 3 (2013), ISSUE NO. 08 (AUGUST) ISSN 2231-5756
INTERNATIONAL JOURNAL OF RESEARCH IN COMMERCE, IT & MANAGEMENT A Monthly Double-Blind Peer Reviewed (Refereed/Juried) Open Access International e-Journal - Included in the International Serial Directories
http://ijrcm.org.in/
68
CHALLENGES TO RETAIL SECTOR: A STUDY OF DISTRICT RAJOURI IN JAMMU AND KASHMIR STATE
AASIM MIR ASST. PROFESSOR
SCHOOL OF MANAGEMENT STUDIES BGSB UNIVERSITY
RAJOURI
ABSTRACT Retail industry is one of the most important and essential pillars of world economy. Most of the developed as well as developing economies have a very strong retail segment present in them. India is one among those countries which have a very strong retail segment and contributes near about 14 to 15 percent of its GDP. The India retail market is estimated to be US $ 450 billion and is one of the top five retail markets in the world in terms of economic value. Recent Govt. step to introduce FDI in retail sector in Indi will now boost this sector to a great extent and also generate heavy profit for masses besides good employment opportunities. Present study seeks to identify various challenges faced by retailers in Rajouri district of Jammu and Kashmir. The study also helps in developing a framework which will be useful for retailers to modify their business practices in Rajouri district. The study further recommends various strategies which could be used at times to cope up with the modern challenges faced by retailers in Rajouri district of Jammu and Kashmir. The study also conducts a survey of 250 people who are lined with retail business in Rajouri district.
KEYWORDS Retail Industry, Employment opportunities, Potential customers, Product portfolio, Economic Value.
INTRODUCTION ndia is one of the most growing economies in the world and also an economy with maximum number of middle class families thus constitutes the maximum purchasing power parity. The middle class society in India is spread well as per the geographical location and thus it can be used as a greater hub for business by small and big firms in every part. The Indian retail industry has been categorized as organized and unorganized. Organized retailing refers to
trading activities undertaken by licensed retailers that are those retailers who are registered for sales tax, income tax etc. These include publicly traded super markets, corporate backed supermarkets, retail chains and also the privately owned large retail businesses. Unorganized retailing on the other hand refers to the traditional formats of low cost retailing such as local corner shops, owner managed general stores, convenience stores, hand cart, pavement vendors etc. The organized retailing is absent in most rural and small towns of India and Supermarkets and similar organized retail accounts for more than 8 to 10 percent of the market. India’s retail and logistics industry, organized and unorganized in combination employs about 42 million Indians which constitutes about 3.3 percent of the total Indian population. Moreover over 14 million outlets operate in the country and only 4 percent of them have a larger size than 500 square feet. However Indian retail industry is growing at a larger pace but it has faced multiple challenges from time to time which acted as hurdles in its proper growth. Lack of proper infrastructure facility was one of the biggest challenges and even today Indian retail industry has only 6000 stand alone cold storages having a capacity of only 25 million metric tons and out of which 80 percent is used for potatoes only. There are also other challenges which affects the future growth of retail industry in India such as Inventory and Logistics Management, customization trend, changing purchasing needs and habits, high level of expectancy from buyer, wholesaler commission etc. This paper examines the various such challenges and their impact on retail segment.
MATERIAL AND METHODS Present study has been carried out with the help of both primary as well as secondary data. The primary data has been collected with the help of a pretested questionnaire from people who are directly or indirectly linked to the retail sector in Rajouri district of Jammu and Kashmir. The secondary data has been collected from various schedules and reports prepared on the status of retailers in Rajouri district of Jammu and Kashmir from time to time. The data and information so collected has been analyzed statistically and certain cartographic have been applied to determine the ground reality.
OBJECTIVES 1. To analyze the various challenges faced by retailers in Rajouri district of Jammu and Kashmir. 2. To analyze the perception of people regards retail business in Rajouri district of Jammu and Kashmir. 3. To determine the nature of impact of each challenging factor on retail business. 4. To devise procedures which will enhance value in various retail activities in Rajouri district. 5. To recommend various strategies which could be used to cope up with the challenges of retail sector in Rajouri district.
RESULT AND DISCUSSION Indian retail sector have been witnessing and coping up with multiple challenges from time to time. These challenges are different for different market segments and business areas. In some markets and areas one factor acts as a major challenge which is not much applicable in other markets and areas. This all depends on various factors which are related to markets as well as customers and consumers. Some of the major challenges to retail segment in district Rajouri that have been identified from the study are given as follows: A) CHANGING PURCHASING HABITS The values for factors” Changing purchasing habits” have been shown in graph 1 and also tabulated in table 1. The analysis of values reveals that 25% respondents strongly believe that this factor is one of the biggest challenges to retailers while 37% respondents believe up to a certain level. However 18% respondents have a neutral opinion. Moreover a total of 20% respondents don’t consider this factor as a challenge to retail segment in district Rajouri of Jammu and Kashmir State.
I

VOLUME NO. 3 (2013), ISSUE NO. 08 (AUGUST) ISSN 2231-5756
INTERNATIONAL JOURNAL OF RESEARCH IN COMMERCE, IT & MANAGEMENT A Monthly Double-Blind Peer Reviewed (Refereed/Juried) Open Access International e-Journal - Included in the International Serial Directories
http://ijrcm.org.in/
69
FIG. 1
TABLE 1: CHANGING PURCHASING HABITS
Strongly Agree Agree Neutral Disagree Strongly Disagree
62 93 44 26 25
25% 37% 18% 10% 10%
B) HIGH SERVICE EXPECTANCY FROM BUYERS The values for factor “High service expectancy from buyers” have been shown in graph 2 and also given in table 2. The analysis of values reveals that a majority of respondents i.e. 62% consider this factor as a challenge for retailers in district Rajouri while 13% respondents have a neutral opinion. Moreover a total of 25% respondents don’t consider this factor as a challenge to retail segment.
FIG. 2
TABLE 2: HIGH SERVICE EXPECTANCY FROM BUYERS
Strongly Agree Agree Neutral Disagree Strongly Disagree
59 96 33 35 27
24% 38% 13% 14% 11%
C) RETAILER- WHOLESALER CONFLICT The values for this factor have been represented in graph 3 as well as tabulated in table 3. The analysis of values reveals that only 23% respondents consider the validity of this factor as to be considered as a challenge for retail segment while 16% respondents have no decided opinion. Moreover a total of 61% respondents consider this factor as a big challenge for retail business in district Rajouri of Jammu and Kashmir.

VOLUME NO. 3 (2013), ISSUE NO. 08 (AUGUST) ISSN 2231-5756
INTERNATIONAL JOURNAL OF RESEARCH IN COMMERCE, IT & MANAGEMENT A Monthly Double-Blind Peer Reviewed (Refereed/Juried) Open Access International e-Journal - Included in the International Serial Directories
http://ijrcm.org.in/
70
FIG. 3
TABLE 3: RETAILER- WHOLESALER CONFLICT
Strongly Agree Agree Neutral Disagree Strongly Disagree
28 29 41 82 70
11% 12% 16% 33% 28%
D) MANAGING PRODUCT PORTFOLIO The values for factor “Managing product portfolio” have been projected in graph 4 and also tabulated in table 4. The analysis of values reveals that only a total of 30% respondents believe that this factor could act as a challenge to retail segment in Rajouri district while a greater number of respondents i.e.42% have no decided opinion. Moreover a total of 28% respondents don’t consider this factor as a challenge to retailers in Rajouri district.
FIG. 4
TABLE 4: MANAGING PRODUCT PORTFOLIO
Strongly Agree Agree Neutral Disagree Strongly Disagree
34 39 106 41 30
14% 16% 42% 16% 12%
E) ONLINE SALE BY COMPANIES The values for factor “Online sale by Companies” have been presented in graph 5 and also tabulated in table 5. The analysis of values reveals that a greater percentage of respondents i.e. 65% consider this factor as a major challenge to retail segment of district Rajouri while only 14% respondents have no decided opinion. Moreover about 21% respondents don’t consider this factor as a challenge.

VOLUME NO. 3 (2013), ISSUE NO. 08 (AUGUST) ISSN 2231-5756
INTERNATIONAL JOURNAL OF RESEARCH IN COMMERCE, IT & MANAGEMENT A Monthly Double-Blind Peer Reviewed (Refereed/Juried) Open Access International e-Journal - Included in the International Serial Directories
http://ijrcm.org.in/
71
FIG. 5
TABLE 5: ONLINE SALE BY COMPANIES
Strongly Agree Agree Neutral Disagree Strongly Disagree
60 101 36 41 12
24% 41% 14% 16% 5%
F) DIFFICULTY TO ENTER NEW MARKETS The values for factor” Difficulty to enter new markets” have been shown graphically in graph 6 and also tabulated in table 6. The analysis of values reveals that 36% respondents believe that this factor could affect the business of retailers I district Rajouri while 35% respondents have a neutral opinion. Moreover a total of 29% respondents consider that this factor could not affect the business of retailers in district Rajouri of Jammu and Kashmir.
FIG. 6
TABLE 6: DIFFICULTY TO ENTER NEW MARKETS
Strongly Agree Agree Neutral Disagree Strongly Disagree
43 48 88 39 32
17% 19% 35% 16% 13%
G) CUSTOMIZATION TREND The values for this factor have been shown in graph 7 and tabulated in table 7. The analysis of values reveals that a total of 20% respondents consider this factor as a challenge while other 16% have no decided opinion. Moreover a total of 64% respondents don’t consider this factor as a challenge to retailers in Rajouri district of Jammu and Kashmir.

VOLUME NO. 3 (2013), ISSUE NO. 08 (AUGUST) ISSN 2231-5756
INTERNATIONAL JOURNAL OF RESEARCH IN COMMERCE, IT & MANAGEMENT A Monthly Double-Blind Peer Reviewed (Refereed/Juried) Open Access International e-Journal - Included in the International Serial Directories
http://ijrcm.org.in/
72
FIG. 7
TABLE 7: CUSTOMIZATION TREND
Strongly Agree Agree Neutral Disagree Strongly Disagree
20 29 40 78 83
8% 12% 16% 31% 33%
H) INVENTORY AND LOGISTICS MANAGEMENT The values for “Inventory and Logistics Management “have been shown in graph 8 and tabulated in Table 8. The analysis of values reveals that a total of 51% respondents are in favor that this factor is a big challenge to retail segment while 20% have no decided opinion. Moreover a total of 29% respondents don’t consider this factor as a challenge.
FIG. 8
TABLE 8: INVENTORY AND LOGISTICS MANAGEMENT
Strongly Agree Agree Neutral Disagree Strongly Disagree
52 76 50 47 25
21% 30% 20% 19% 10%
I) RIVALRY/COMPETITION The values for this factor have been reprented graphically in graph 9 and aslo tabulated in table 9. The analysis of values reveals that a total of 42% respondents consider this factor as a major challenge while 23% respondents have neutral opinion about this factor. Moreover a total of 35% respondents consider this as invalid factor for consideration as a challenge to retail segment in district Rajouri of Jammu and Kashmir.
FIG. 9

VOLUME NO. 3 (2013), ISSUE NO. 08 (AUGUST) ISSN 2231-5756
INTERNATIONAL JOURNAL OF RESEARCH IN COMMERCE, IT & MANAGEMENT A Monthly Double-Blind Peer Reviewed (Refereed/Juried) Open Access International e-Journal - Included in the International Serial Directories
http://ijrcm.org.in/
73
TABLE 9: RIVALRY/COMPETITION
Strongly Agree Agree Neutral Disagree Strongly Disagree
60 45 58 40 47
24% 18% 23% 16% 19%
J) LIMITED INVESTMENT The values for factor “Limited investment” have been shown in graph 10 and tabulated in table 10. The analysis of values reveals that 35% respondents consider the validity of this factor as a challenge to retail segment of district Rajouri while 33% respondents have a neutral opinion. Moreover 32% respondents don’t consider this factor as a challenge to retailers.
TABLE 10: LIMITED INVESTMENT
TABLE 10
Strongly Agree Agree Neutral Disagree Strongly Disagree
36 51 83 47 33
14% 21% 33% 19% 13%
CONCLUSION Retail segment in Rajouri district of Jammu and Kashmir is been effected by multiple challenges these days. There are some factors which act as major challenges while some others have a moderate effect on retail business in the district under consideration. The factors which effect largely to retail segment of district Rajouri have been identified as changing purchasing habits of consumers, High level of service expectancy from buyers and Online sale by manufacturer companies however there are other factors which as per respondents cannot be considered as challenges in the segment under consideration have been identified as Retailer- Wholesaler conflict, customization trend and rivalry/competition. Some of the other factors have also been identified from the study which as per most of the respondents has neutral opinion. These factors are managing product portfolio, difficulty in entering new markets and lack of heavy investment.
RECOMMENDATIONS 1. Quality management is one of the major issues involved in retail business so it is essential for all retailers to maintain proper quality standards in their
business practices. 2. Giving all proper information regarding various products and brands make it easier for consumers and customers to buy a good product so if all the
retailers will use this technique they will surely see an increasing trend in their sales. 3. The availability of demanded product is also a very necessary aspect under consideration and all the retailers must keep an up to date stock of all items
they are selling to customers and consumers. 4. Forecasting demand also is very necessary as it makes retailers analyze and predict the demand for particular product and then they can make good
arrangements so that those products remain available in adequate quantity. 5. Manufacturers are producing new and new products in the market on daily basis and also promoting them through advertisement so it good for all
retailers to keep all those products available as consumer will definitely be attracted towards them. 6. Retailers are more knowledgeable about products they sell than other consumers who come to buy them. If retailers will guide consumers in buying
products it will increase the level of brand equity. 7. Customer relationship management is a vital approach used by all big as well as small organizations. Retailers need to keep a track of all their consumers
and also their level of satisfaction that they draw from products that were sold by retailers to them. 8. There are risks such as financial, psychological, physical associated with the products that retailers sell, so it is necessary for retailers to adopt practices
which will keep their offerings out of this type of dilemma. 9. After sale service is also a major issue and most of the satisfaction level of consumers depends on this. It is good for retail segment to adopt a good and
feasible after sale service procedure. 10. As retailers sell products and other brands which are associated with particular manufacturers and so local retailers don’t have their own identity in the
market so those retailers must adopt local level promotional media which will give them a brand identity in the market. 11. Retailers must also keep parts of the products which could be assembled at the time customer places an order. Such type of operations will bring a high
level of customization in retail segment itself. 12. Retailers must also choose new markets and offer their products accordingly to get more and more consumers as existing markets will reach at maturity
after some time. 13. Trade and sale promotions tools and techniques are most helpful in generating high sales and profits in non peak hours and also make it easier for retailers
to sell sock which was not earlier purchased by consumers. 14. It will also be beneficial for retailers to adopt a procedure of providing items on credit to some identified regular and loyal customers.
VOLUME NO. 3 (2013), ISSUE NO. 08 (AUGUST) ISSN 2231-5756
INTERNATIONAL JOURNAL OF RESEARCH IN COMMERCE, IT & MANAGEMENT A Monthly Double-Blind Peer Reviewed (Refereed/Juried) Open Access International e-Journal - Included in the International Serial Directories
http://ijrcm.org.in/
74
15. The retailers in collaboration must organize local level trade shows and events to promote products and their offerings with the help of local administration on regular basis.
16. Now day’s companies have open ways for retailers by which they can directly buy products and brands from companies, so retailers must grab this procedure so they can sell products at some cheaper rate because it will cut wholesalers margin and product will automatically become cheaper.
17. Government has also devised and implemented various schemes through which people can get funds for establishing new business or expanding existing business. So retailers must also approach such agencies and get funds from them as it is a much cheaper source to get funds than any other source.
18. Regular infrastructure growth is also one of the major issue under consideration. Retailers in district Rajouri must put their best efforts to managing a proper level of infrastructure which could remove the hurdles for poor storage and sales.
REFERENCES 1. Agarwal, Vibhuti; Bahree, Megha (7 December 2011). "India puts retails reforms on hold". The Wall Street Journal. 2. Aldridge, D and Harrison, A (2000): “Implementing agile methods in retail supply chains: a scenario for the future”, International Journal of Agile
Manufacturing, 3 (2), pp 37–44 3. Amatual Baseer (2007), “Emerging Trends in India”, Indian Journal of Marketing, Vol. XXXVII, No.11. 4. Bill Pritchard, C. P. Gracy and Michelle Godwin: “The Impacts of Supermarket Procurement on Farming Communities in India: Evidence from Rural
Karnataka” , Development Policy Review, 2010, 28 (4): 435-456. 5. Burt, S L, Dawson, J A and Larke, R (2003):” Inditex-Zara: re-writing the rules in apparel retailing”. Paper presented at the Second SARD Workshop, UMDS,
Kobe, April 2003 6. Carter, C R and Ellram, L M (1998): “ Reverse logistics: a review of the literature and framework for future investigation”, Journal of Business Logistics, 19
(1), pp 85–102 7. Debajani Sahoo, Hari Govind Mishra,"Organized Retail in India: A case study of Wal-Mart", Indian Journal of Marketing, Jnuary, 2008, pp. 35-36 8. Disney, S.M., and Towill, D.R. 2003. “Bullwhip Reduction in Supply Chains: The Impact of VMI”, International Journal of Operations and Production
Management. Vol. 23: No. 6: 625-651. 9. Fernie, J and Hart, C (2001): “UK packaging waste legislation: implications for food retailers” , British Food Journal, 103 (3), pp 187–97 10. Fernie, J, Pfab, F and Marchant, C (2000): “Retail grocery logistics in the UK” , International Journal of Logistics Management, 11 (2), pp 83–90 11. Hariharan.G. (2008), “Profile and perception of retail consumers”, Indian Journal of Marketing, Vol. XXXVIII, No.2. 12. Jim Dion, Ted Topping, (2011) : ICICI Bank Research Report on Retailing, “Retailing”, Jaico Publishing House, pp. 127-150. 13. Laxmi Prabha.G. (2007), “The prospects and problems of Indian Retailing”, Indian Journal of Marketing,Vol. XXXVII, No.10. 14. Mason-Jones, R, Naylor, B and Towill, D R (2000): “Lean, agile or leagile? Matching your supply chain to the market place”, International Journal of
Production Research, 38 (17), pp 4061–70. 15. Michael R. Solomon. Elnora. W Stuart, “Marketing Real people, Real choices”, Pearson Education, Ltd. pp. 563-564, 2005. 16. Naylor, J B, Naim, M M and Berry, D (1997): ” Leagility: integrating the lean and agile manufacturing paradigm in the total supply chain, International
Journal of Production Economics, 62, pp 107–18. 17. "Retailing in India unshackling the chain stores". The Economist. 29 May 2008. 18. Ring, L J and Tigert, D J (2001): “Viewpoint: the decline and fall of Internet grocery retailers” , International Journal of Retail and Distribution
Management, 29 (6), pp 266–73. 19. Sparks, L (1998): “The retail logistics transformation, of Logistics and Retail Management”, ed J Fernie and L Sparks, Kogan Page, London, Chapter 1 ( pp
1–22). 20. Thomas Reardon and Ashok Gulati “The Supermarket Revolution in Developing Countries, Policies for “Competitiveness with Inclusiveness”, IFPRI Policy
Brief 2 • June 2008.

VOLUME NO. 3 (2013), ISSUE NO. 08 (AUGUST) ISSN 2231-5756
INTERNATIONAL JOURNAL OF RESEARCH IN COMMERCE, IT & MANAGEMENT A Monthly Double-Blind Peer Reviewed (Refereed/Juried) Open Access International e-Journal - Included in the International Serial Directories
http://ijrcm.org.in/
75
BLENDING WITH THE BEST: EVALUATION OF SERVICE QUALITY OF HOTEL INDUSTRY
DR. LEENA NITIN FUKEY ASST. PROFESSOR
CHRIST UNIVERSITY BANGALORE
ABSTRACT
Assessing and improving service quality has become an important task for many organizations. While the services sector has grown, service providers have become aggressive and service quality has become an emphasis of their attention. The concept and the conceptual model of service quality is indispensable if we wish to understand the origin of service quality and probable gaps in quality. This paper aims to review existing literature on service quality management in the hotels, its process, concepts, dimensions, and the effective service quality management framework. The purpose of this paper is to show the importance of service quality in hotel industry from both the conceptual standpoint and that of service quality measurement models and encourages hotels to improve its management to better satisfy their guests. The research aim is to gain and understanding of the service quality models in hotel industry and provides industry with sound research from which to develop effective model to facilitate best practices in improving overall service quality Purpose of this study is to examine whether hotel industries service quality efforts are a reason why guest choose a hotel. Do business travellers and meeting planners expect certain quality standards and engagement while staying at the hotel? Do the overall service quality affect their hotel stay? These are the emerging questions the hotel industry faces to better service and satisfy guests. This study also includes understanding the technological changes and needs of the guest and why they choose the hotel. The objective of the research is to discover whether there is need for hotels to seriously look into the practices in operations and management and improve overall service delivery.
KEYWORDS Service Quality, Hotel Industry, Technology, Guest Satisfaction and Total Quality Management.
INTRODUCTION he Concept of service quality originates from consumer behaviour and confirmation and/or disconfirmation paradigm (Gronroos, 1992). Consumers all over the world have become more quality conscious; hence there has been an increased customer demand for higher quality service. Service operations worldwide are affected by this new wave of quality awareness and emphasis (Lee, 2004). So service-based companies like the Hotels, Travel business etc.
are bound to provide exceptional services to their customers in order to have sustainable competitive advantage, especially in the current trend of trade liberalization and globalization. Service quality is one of the heavily researched topics in management research with various studies having been conducted to study different factors that constitute service quality and its effect on customer perceptions (Parasuraman, et al., Zeithaml, 1988; 1988; Sureshchandar et al., 2003; O’Neill, et al., 2004). Researchers have defined service quality in relation to the concept of customer perceived quality, which is based exclusively on the perspective of customers. Such a awareness is built in a place where an organization supplies goods and services to customers in a manner that satisfies them and where they examine service quality (Babajide, 2011; Zeithaml, et al., 1996; Choi, et al., 1998; Mei, et al., 1999; Cronin, et al., 2000; Gounaris, et al., 2003; O’Neill, 2001; Mill, 2002; Saleh, et al., 1991; Oberoi, et al., 1990; Presbury, et al., 2005; Qu, et al., 1998; Rust, et al., 1993; Carman, 1990; Christie, et al., 2002). Quality has been defined differently by different authors. According to the researchers some prominent definitions include conformance to requirements (Crosby, 1984), fitness for use (Juran, 1988) or one that satisfies the customer (Eiglier, et al., 1987). As per the Japanese production beliefs quality implies zero defects in the firm’s contributions. Service quality has been continually recognized as a significant research focus for the hospitality industry (Bojanic, et al., 1994; Saleh, et al., 1991; Min, et al., 2002; Kincaid, et al., 2010; Fink, et al., 1991). It has been correlated to attract new customers that are employee satisfaction and commitment, customer loyalty, positive word-of-mouth, reduced costs, enhanced corporate image, and increased business performance (Sureshchander, et al., 2002; Berry, et al., 1989). In spite of the increasing importance of the service sector and of the consequence of quality as a spirited factor, service quality concepts are not well developed (Ghobadian, et al., 1994). As such, there is substantial debate in the relevant fiction as to how best to conceptualize this occurrence (Akbaba, 2006). Service quality is a key element in service industry. Good quality service can increase attract customers to repeatedly consume, customer satisfaction, prompt profit and market share , and establish customer loyalty (Hackl, et al., 2000). In the highly competitive hospitality industry, service quality will not only give confidence to customer satisfaction, but also increase sales and profit (Nadiri, et al., 2005). Thus, hotel managers need to understand and meet consumer needs. (Saravan, et al., 2007), service quality remains significant in the service industries, as businesses struggle to maintain a competitive advantage in the marketplace and achieving customer satisfaction. Service industries compete in the marketplace with generally undifferentiated products; therefore service quality becomes a primary competitive weapon (Stafford, 1996). Literature has proven that providing quality service delivery to attracts new ones, customers retains them, lead to positive referral by word of mouth, enhances corporate image, and above all guarantees survival and profitability (Ladhari, 2009; Negi, 2009).
HOTEL INDUSTRY, TOTAL QUALITY MANAGEMENT AND SERVICE QUALITY Hotels play the major role of providing guests a dwelling away from home. This facility facilitates the further attraction of guests towards a place because it makes their visit more expedient. A hotel refers to a commercial company providing lodging and meals on momentary basis to its customers. In 1902 the "Indian hotels company" was incorporated by the founder of the Tata group Mr. Jamshedji Nusserwanji Tata and the company opened up its first property The Taj Mahal Palace and Tower in Mumbai. After this there was an increase in the Indian hotel industry as many other Indians followed the footprints of Mr. Tata, Mr. Mohan Singh Oberoi who started by taking over the grand hotel Calcutta and expanded his business. Afterwards companies like ITC and Air India also ventured into this field. In the last few years the hotel industry has transformed and urbanized significantly in terms of the services it provides. India is an eye-catching destination for tourists because of its rich heritage, which includes the famous Taj Mahal, various temples and caves and many other famous monuments. Also there are a lot of businessmen and officials who visit India for business purposes because of the buy and sell dealings that our country has with the world. Likewise within our country also there are people who travel from one state to another or from one city to another for business or vacation. Ludhiana is known as the Manchester of India which is a major business city with industries like hosiery, textiles, bicycle and bicycle parts, hand tools etc. It is like a home to some big companies like Hero Cycles, Oswal, Trident, Vardhaman etc. Because of it being a business city it has a lot of business travellers from all over the world. Hence it requires not only a good number of hotels but also good quality hotels to accommodate these travellers (Thapar, 2007). All these hotels differ in the type and amount of services they provide like lodgings, food and beverage services, amusement, leisure, communication, transportation, room service, laundry service, conference and meeting schedule, first aid, etc. Quality is measured to be of very great importance in the hotel industry. (Mill, 1986) the researcher identifies the aim of service quality as being able to ensure a satisfied customer. Still, the focus of quality initiatives has been primarily on selection and training of front line staff. (Kerr, et al., 1988) The Mayfair Crest Hotel in Brisbane, Queensland, has developed an approach to service quality which resembles TQM. The researcher describes this approach on the basis of an overall mission of the hotel. The particular mission was flowing all the way through the hotel by each department and subsequently each worker being asked to describe the meaning of this mission in their own framework. Thus in general direction of the staff of the hotel was brought together to develop the teamwork that is vital to TQM. Growth of quality management in the hospitality industry has mainly followed the
T
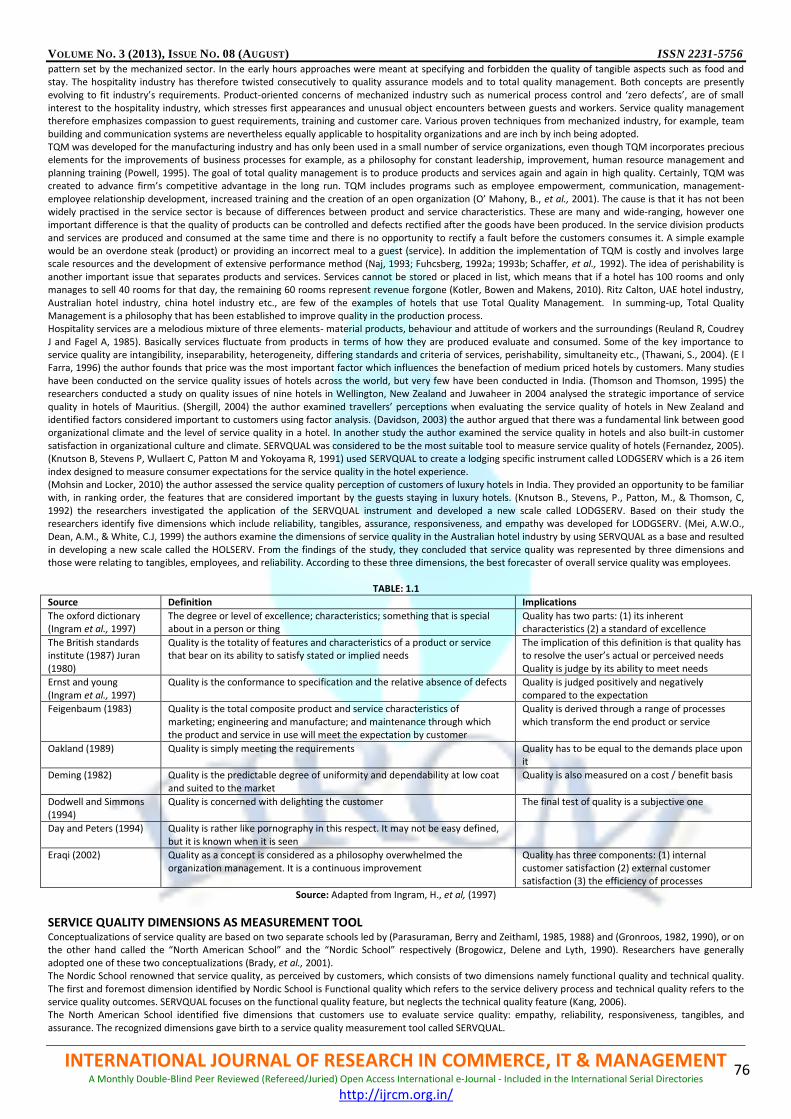
VOLUME NO. 3 (2013), ISSUE NO. 08 (AUGUST) ISSN 2231-5756
INTERNATIONAL JOURNAL OF RESEARCH IN COMMERCE, IT & MANAGEMENT A Monthly Double-Blind Peer Reviewed (Refereed/Juried) Open Access International e-Journal - Included in the International Serial Directories
http://ijrcm.org.in/
76
pattern set by the mechanized sector. In the early hours approaches were meant at specifying and forbidden the quality of tangible aspects such as food and stay. The hospitality industry has therefore twisted consecutively to quality assurance models and to total quality management. Both concepts are presently evolving to fit industry’s requirements. Product-oriented concerns of mechanized industry such as numerical process control and ‘zero defects’, are of small interest to the hospitality industry, which stresses first appearances and unusual object encounters between guests and workers. Service quality management therefore emphasizes compassion to guest requirements, training and customer care. Various proven techniques from mechanized industry, for example, team building and communication systems are nevertheless equally applicable to hospitality organizations and are inch by inch being adopted. TQM was developed for the manufacturing industry and has only been used in a small number of service organizations, even though TQM incorporates precious elements for the improvements of business processes for example, as a philosophy for constant leadership, improvement, human resource management and planning training (Powell, 1995). The goal of total quality management is to produce products and services again and again in high quality. Certainly, TQM was created to advance firm’s competitive advantage in the long run. TQM includes programs such as employee empowerment, communication, management-employee relationship development, increased training and the creation of an open organization (O’ Mahony, B., et al., 2001). The cause is that it has not been widely practised in the service sector is because of differences between product and service characteristics. These are many and wide-ranging, however one important difference is that the quality of products can be controlled and defects rectified after the goods have been produced. In the service division products and services are produced and consumed at the same time and there is no opportunity to rectify a fault before the customers consumes it. A simple example would be an overdone steak (product) or providing an incorrect meal to a guest (service). In addition the implementation of TQM is costly and involves large scale resources and the development of extensive performance method (Naj, 1993; Fuhcsberg, 1992a; 1993b; Schaffer, et al., 1992). The idea of perishability is another important issue that separates products and services. Services cannot be stored or placed in list, which means that if a hotel has 100 rooms and only manages to sell 40 rooms for that day, the remaining 60 rooms represent revenue forgone (Kotler, Bowen and Makens, 2010). Ritz Calton, UAE hotel industry, Australian hotel industry, china hotel industry etc., are few of the examples of hotels that use Total Quality Management. In summing-up, Total Quality Management is a philosophy that has been established to improve quality in the production process. Hospitality services are a melodious mixture of three elements- material products, behaviour and attitude of workers and the surroundings (Reuland R, Coudrey J and Fagel A, 1985). Basically services fluctuate from products in terms of how they are produced evaluate and consumed. Some of the key importance to service quality are intangibility, inseparability, heterogeneity, differing standards and criteria of services, perishability, simultaneity etc., (Thawani, S., 2004). (E l Farra, 1996) the author founds that price was the most important factor which influences the benefaction of medium priced hotels by customers. Many studies have been conducted on the service quality issues of hotels across the world, but very few have been conducted in India. (Thomson and Thomson, 1995) the researchers conducted a study on quality issues of nine hotels in Wellington, New Zealand and Juwaheer in 2004 analysed the strategic importance of service quality in hotels of Mauritius. (Shergill, 2004) the author examined travellers’ perceptions when evaluating the service quality of hotels in New Zealand and identified factors considered important to customers using factor analysis. (Davidson, 2003) the author argued that there was a fundamental link between good organizational climate and the level of service quality in a hotel. In another study the author examined the service quality in hotels and also built-in customer satisfaction in organizational culture and climate. SERVQUAL was considered to be the most suitable tool to measure service quality of hotels (Fernandez, 2005). (Knutson B, Stevens P, Wullaert C, Patton M and Yokoyama R, 1991) used SERVQUAL to create a lodging specific instrument called LODGSERV which is a 26 item index designed to measure consumer expectations for the service quality in the hotel experience. (Mohsin and Locker, 2010) the author assessed the service quality perception of customers of luxury hotels in India. They provided an opportunity to be familiar with, in ranking order, the features that are considered important by the guests staying in luxury hotels. (Knutson B., Stevens, P., Patton, M., & Thomson, C, 1992) the researchers investigated the application of the SERVQUAL instrument and developed a new scale called LODGSERV. Based on their study the researchers identify five dimensions which include reliability, tangibles, assurance, responsiveness, and empathy was developed for LODGSERV. (Mei, A.W.O., Dean, A.M., & White, C.J, 1999) the authors examine the dimensions of service quality in the Australian hotel industry by using SERVQUAL as a base and resulted in developing a new scale called the HOLSERV. From the findings of the study, they concluded that service quality was represented by three dimensions and those were relating to tangibles, employees, and reliability. According to these three dimensions, the best forecaster of overall service quality was employees.
TABLE: 1.1
Source Definition Implications
The oxford dictionary (Ingram et al., 1997)
The degree or level of excellence; characteristics; something that is special about in a person or thing
Quality has two parts: (1) its inherent characteristics (2) a standard of excellence
The British standards institute (1987) Juran (1980)
Quality is the totality of features and characteristics of a product or service that bear on its ability to satisfy stated or implied needs
The implication of this definition is that quality has to resolve the user’s actual or perceived needs Quality is judge by its ability to meet needs
Ernst and young (Ingram et al., 1997)
Quality is the conformance to specification and the relative absence of defects Quality is judged positively and negatively compared to the expectation
Feigenbaum (1983) Quality is the total composite product and service characteristics of marketing; engineering and manufacture; and maintenance through which the product and service in use will meet the expectation by customer
Quality is derived through a range of processes which transform the end product or service
Oakland (1989) Quality is simply meeting the requirements Quality has to be equal to the demands place upon it
Deming (1982) Quality is the predictable degree of uniformity and dependability at low coat and suited to the market
Quality is also measured on a cost / benefit basis
Dodwell and Simmons (1994)
Quality is concerned with delighting the customer The final test of quality is a subjective one
Day and Peters (1994) Quality is rather like pornography in this respect. It may not be easy defined, but it is known when it is seen
Eraqi (2002) Quality as a concept is considered as a philosophy overwhelmed the organization management. It is a continuous improvement
Quality has three components: (1) internal customer satisfaction (2) external customer satisfaction (3) the efficiency of processes
Source: Adapted from Ingram, H., et al, (1997)
SERVICE QUALITY DIMENSIONS AS MEASUREMENT TOOL Conceptualizations of service quality are based on two separate schools led by (Parasuraman, Berry and Zeithaml, 1985, 1988) and (Gronroos, 1982, 1990), or on the other hand called the “North American School” and the “Nordic School” respectively (Brogowicz, Delene and Lyth, 1990). Researchers have generally adopted one of these two conceptualizations (Brady, et al., 2001). The Nordic School renowned that service quality, as perceived by customers, which consists of two dimensions namely functional quality and technical quality. The first and foremost dimension identified by Nordic School is Functional quality which refers to the service delivery process and technical quality refers to the service quality outcomes. SERVQUAL focuses on the functional quality feature, but neglects the technical quality feature (Kang, 2006). The North American School identified five dimensions that customers use to evaluate service quality: empathy, reliability, responsiveness, tangibles, and assurance. The recognized dimensions gave birth to a service quality measurement tool called SERVQUAL.

VOLUME NO. 3 (2013), ISSUE NO. 08 (AUGUST) ISSN 2231-5756
INTERNATIONAL JOURNAL OF RESEARCH IN COMMERCE, IT & MANAGEMENT A Monthly Double-Blind Peer Reviewed (Refereed/Juried) Open Access International e-Journal - Included in the International Serial Directories
http://ijrcm.org.in/
77
The early SERVQUAL measurement tool (survey instrument) was developed basic information. Their responses fell into ten key dimensions which were later revised to five dimensions according to Parasuraman, Berry and Zeithaml (1988). The definitions of the ten dimensions by Parasuraman, Berry and Zeithaml (1985) are as follows
TABLE: 1.2
Dimensions Definitions
Tangibles Appearance of communication materials, equipment, personnel and physical facilities
Reliability Capability to perform the promised service dependably and accurately
Responsiveness Enthusiasm to help customers and provide punctual service
Competence Ownership of the required skills and knowledge to perform the service
Courtesy Friendliness, respect, Politeness and consideration of contact personnel
Credibility Honesty, believability and Trustworthiness of the service provider
Security Risk or doubt, Freedom from danger
Communication Maintain customers well-versed in the language that they can understand and listening to them
Access Accessibility and ease of contact
Understanding the customer Creating the effort to know customers and their needs
Source: Adapted from Parasuraman, Berry and Zeithaml (1985) In later stages only the responsiveness, tangibles and reliability dimensions from the original SERVQUAL (1985) remained while the communication, courtesy, security, competence and credibility dimensions formed the assurance dimension which is defined as knowledge and courtesy of employees and their ability to convey trust and assurance. The access and understanding the customer dimensions shaped the empathy dimension which is defined as kind, individualized notice the firm provides its customers (Parasuraman, et al., 1988). SQ for each of the five dimensions is captured by a gap score which is the comparison of expectations and perceptions (Jiang, et al., 2003). The purpose of the SERVQUAL tool is to provide a basic “skeleton” (group of core evaluation criteria) fundamental service quality, which would rise above multiple dimension contexts and provide managers with deeper insights concerning areas for development (Yap, D., et al., 2007). There are five dimensions of SQ namely,
Tangibility (Zeithaml & Bitner, 2003; Kang & James, 2004; Cronin & Taylor, 1992b; Saleh & Ryan, 1991)
Reliability (AlRousan, 2011; Parasuraman. et al., 1988a; Kotler, et al., 1984; Ladhari, 2009)
Responsiveness (Cheung & Law, 1998; Knuston et al., 1991; Antony & Ghosh, 2004; Upal, 2008)
Assurance (Cronin & Taylor, 1992a; Al Khattab, 2011; Powapaka, 1996; Pitt, et al., 1994)
Empathy (Harvey, 1998; Parasuraman. et al., 1988a; Mohsin, 2011; Qu & Nelson, 1998; Zeithaml et al., 1993) Numerous studies have recognized SERVQUAL, but Parasuraman were the initial to point out that the direction of marketing services is one of the considerations in guest management. Service quality in the hotel industry is very difficult to understand compared with product quality because the previous is insubstantial. Numerous studies reported that the SERVQUAL scale is not worldwide because the dimensionality of service quality seems that depends on the type of service examined (Ladhari, 2009). There has been changeable help for the soundness of the SERVQUAL model in the hotel service industry (Wilkins et al., 2007). (Akan, 1995) the applicability of the SERVQUAL model in the Turkish hospitality industry and identifies seven dimensions in the model such as courtesy and competence of the person, communication and transactions, tangibles, knowledge and understanding of the customer, accuracy and speed of service, study of the hotel industry, solutions to problems and accuracy of hotel reservations. (Mei, et al., 1999) studied the dimensions of service quality in the Australian hotel industry and develop a new scale of service quality in the hospitality industry, called “HOLSERV,” which consist of three dimensions such as reliability, tangibles and employees. (Saleh, et al., 1991) report five dimensions of service quality that vary from those in the SERVQUAL model such as conviviality, tangibles, reassurance, avoidance of sarcasm and empathy. (Oberoi, et al., 1990) service quality plays a significant role in meeting hotels in the United Kingdom and reported that service quality perception has only two dimensions such as tangibles and intangibles. (Getty, et al., 1994) explains the validity of the SERVQUAL dimensions in the hotel division and reported that only two of the dimensions that is tangibles and reliability are basic. The author tested the dimensions of service quality in the hotel industry in the United States and develop a new scale called “lodging quality index” (LQI) which consist of five service quality dimensions such as responsiveness, confidence, tangibility, communication and reliability. (Al Roussan, 2011) examines Parasuraman model for hotel service quality and customer loyalty in Jordanian hotels using the Marriott hotel chain as a case for study. The study discusses the five gaps in excellence of service in the background of Jordan and applies this model to the Marriott hotel chain to test its service quality. The advantage of this structure is applying the rudiments of various concepts into a clarified hotel and tourism industry management.
TABLE : 1.3
Concept No:
Dimension Author Application
1 Tangibility Parasuraman et al., 1985; AlRousan, 2011 Tangibility is the service dimension that makes a product or service sensible and usable for customers
2 Reliability Parasuraman et al., 1985; AlRousan, 2011; Tat, et al., 1999
Reliability is defined as the aptitude of a service supplier to punctually deliver a good service quality. Observing service delivery complaints handling, pricing, and contracts are all important for a business.
3 Assurance Parasuraman et al., 1985; AlRousan, 2011 Assurance is with deliberation to the service quality custody which understands on the ability to activate trust and confidence of the product or service provided
4 Responsiveness Parasuraman et al., 1985; Knutson et al., 1990; Al Rousan, 2011
Responsiveness is the thoughtfulness to help guest by providing instant service as soon as a request is arrived. The service guests will provide soon and punctual attention to all their guest question, suggestion and requests
5 Empathy Parasuraman et al., 1985; AlRousan, 2011 Empathy is the service quality mode that stresses on the contacting of guest’s as modified
(HM government, 2007) although good research can be used for performance management and to meet statutory requirements which is the most successful guest measurement programmes that is motivated by the desire to put customer focus at the spirit of an organisation. Guest focused organisations view guest satisfaction measurement as a means rather than an end part of a cycle of continuous improvement in service delivery and as a part of the wider toolkit of guest insight techniques. Many hotels regularly track their level of guest satisfaction to monitor performance over time and measure the impact of service improvement activity. Guest satisfaction measurement allows hotels to understand the issues or key drivers that cause the satisfaction or dissatisfaction with a service experience. When hotel is able to understand how to satisfy its guest and why, it can focus its time and resources more effectively. Guest satisfaction measurement can help hotels to understand what it can and cannot control. Most importantly, guest satisfaction measurement helps hotels to focus on its customers, and should stimulate research staff, policy, strategy, customer-facing staff and service owners around the aim of improving the customer experience.

VOLUME NO. 3 (2013), ISSUE NO. 08 (AUGUST) ISSN 2231-5756
INTERNATIONAL JOURNAL OF RESEARCH IN COMMERCE, IT & MANAGEMENT A Monthly Double-Blind Peer Reviewed (Refereed/Juried) Open Access International e-Journal - Included in the International Serial Directories
http://ijrcm.org.in/
78
GUEST ENGAGEMENT AND SATISFACTION In the hotel industry satisfaction of guests is based on the customer happiness with the service and the customer relations developed by hotel staff (Parasuraman et al., 1985; Al Rousan, 2011). Guest satisfaction is considered as one of the most vital outcomes of all marketing activities in a market oriented firm. The clear objective of satisfying a customer is to to gain higher market share, expand a business and to obtain repeat and transfer business, all of which lead to improved abundance (Carev, 2008; Barsky, 1992). on the other hand, the guest satisfaction concept refers to judgement that depends on both good service quality and fitness of service to the needs of guests (Tse, et al., 1988). (Parasuraman, et al., 1988) guest satisfaction is the level in which expectation of a guest is to meet or exceed. Guest satisfaction is the assessment of a guest to meet his expectations. If the performance falls below expectations it makes guests dissatisfied (Kottler, et al., 2006). (Carev, 2008) defines service quality satisfaction based on the whole thought by a guest of the compensation of a service taking into account perceptions of what is engaged and what is specified. (Parasuraman. et al. 1988b) service providers should be able to understand the performance and needs of guests to be able to know how to satisfy them. (Cheung, et al., 1998) developed a new model for the measurement of hospitality service quality that incorporates performance of hotel employees in the service quality level. Service quality for the customer satisfaction model can be directly integrated into the hospitality total quality operation because service quality is a basic component of total quality (Cheung, et al., 1998). Hence the three main aspects that is TQM, service quality and guest satisfaction are interlinked and to be given the maximum importance in service operations in the hotel industry. The Forum for People Performance Management and Measurement released a research paper, “Testing the Internal Marketing Model: an Empirical Analysis of the Relationship between Employee Attitudes, Customer Attitudes, and Customer Spending,” which studied the factors that influence guest satisfaction and spending. According to the research paper, the answer to improving guest satisfaction comes from the attitude of the staff, which can have a significant negative or positive impact on the guest experience. Digital touch points will no doubt continue to increase; each one needs greater personalization and dynamic targeting to deliver greater relevance and timely content for customers. This can only be delivered through greater data management, insight and quality management of hotel company interactions with customers. This is within the control of a brand; it needs to manage this and then seek ways to track and react. The blend of the two is what the new world of customer engagement and satisfaction will be about. The conventional approach to building guest satisfaction tends to be throughout the use of material labour and to some extent this is still the crate. Still technology has provided hotels with many opportunities to improve the level of service throughout the guest journey or stay at the hotel. It is very important to consider an amount of recent technological advances and the remuneration which provides to hotels and guest service quality. Even though technology is used in hotel rooms and throughout the hotel and its facilities, perhaps it plays a far more significant role in assembling guest information to increase guest satisfaction. This is predominantly the crate for big full service hotels which needs guest information in order to surpass expectations and build trustworthiness. Technology which is at the vanguard of the hotel industry includes the use of touch print technology and Closed-circuit television (CCTV). The use of finger prints that is linked to property management systems that provide many benefits for both the hotel and the guest (Kang, et al, 2007). The guest will be capable to use a finger to check-in, pay for items in multiple outlets, enter their room and check out. This will allow the guest to be free from carrying forms of payment, identification details and room keys while staying at the hotel. The hotel will also see a lot of benefits from this particular technology. Initially, room keys or key cards will not require to be purchased, which frequently are costly to buy (Kang, et al, 2007). Hotels will also be able to collect forms of guest cleverness on rudiments such as retails purchases, food and beverage preferences, time spent in room and in hotel amenities. This provides opportunities to examine guest preferences and eventually exceed guest expectations (Domke-Damonte, et al., 2002; Chathoth, 2006). CCTV works very much in the similar way yet it adds an amount of remuneration as guest’s performance in the hotel can be twisted into data and figures. For example Crowne Plaza at Dulles Airport has experienced the use of CCTV to add signage to the hotel to avoid guest irritation. This would also allow hotel managers to reconsider amenities and assess how effectual they are when peaking periods are and how guests experience the hotel (Kirby, 2009). Other forms of technology include self-service check-in facilities which can be trim down check-in time from more or less 10 minutes to 60 seconds (Caterer, et al., 2009). In a number of cases a guest can check-in using wireless devices once inward bound at the hotel (Chathoth, 2006). This possibly will be made easier for guests in the future who could check-in from home and working on a similar system as airline companies. If this works in digression with finger print technology then it is expected that a guest will be given a time for when the room will be ready and the guest will be able to sidestep any form of check-in procedure once arriving at the hotel. This would work predominantly well in business where guests can frequently arrive very late in the sunset. These forms of technology benefit the operations of the hotel (Mintzberg, 1979). (Sigala, et al, 2000) promotes these forms of technology as standardisation of work. This also involves fundamentals of reduce the level of skill required to carry out the job (deskilling) which need less technical input from physical labour. A famous example of deskilling is McDonalds who challenge to deskill every level of its operations to promote competence (Ritzer, 2006). This provides a amount of remuneration for hotels including increased efficiency, reduce dependence for skilled labour and reduced labour costs. Nevertheless, in several cases this may not have any significant impact on guest satisfaction as it can be argued that it is very much charge on the type of hotel and the guests which it attracts. Technology Based Self-Service replacing Traditional Human Touch Service has become a trend in hospitality industry. There are many reasons that show the way to this trend, though there are values in Traditional Human Touch Service that are unique by the Technology Based Self-Service. Those values might not be spoken clearly through numbers such as return on asset or output but then they are still very important to generate customer satisfaction and customer loyalty. In actual fact, there seems to be a positive relationship between customer satisfaction and customer loyalty customer profitability (Helgesen, 2006). Consequently, Traditional Human Touch Service can still be very profitable. While hoteliers try to keep up with the Technology Based Self-Service trend, they must understand its effect on customers and the industry. In adding up, hoteliers must not forget the benefits of Traditional Human Touch Service, particularly those unique elements that cannot be replaced by the technologies. Technology Based Self-Service is a shape of service that delivers by the customers to themselves through communication with technological systems (Beatson, et al., 2006). Even though sometime customers might still check with employees for the use of the self service systems, self service technology has helped to reduce the amount of workers used in the hospitality industry. (Shaw, 2004), people are not recognizable to this kind of service; some revolutionary hotels had already implemented the self check in kiosks to test the customer’s response. Technologies helped to contribute to the front desk workload and speeded up the service therefore, hoteliers wished to add more service to the kiosks. Though, there was an anxiety that too many service options might increase the time people stand in front of the kiosks and indirectly lead to long line in front of the kiosks, lengthen the service process and time. Nowadays, more hotels have joined this practice but the service options in self service kiosks around front desks stay very simple. Though, there are more self service technologies in the hotel industry, such as self condition systems and self check out system on room service ordering system, hotel television, self serving in room mini bar, flight check-in kiosks and boarding pass printing. Traditional Human Touch Service is the type of service that most people are well-known with, which is the service that are provided by the front line workers to the customers (Bitner, 1990). Front line workers act together with customers to learn about customer’s needs, troubles and other information then deliver the requested service to the guests. Nowadays some services providers will ask their workers to go above and beyond to shock or wow their customers. They will try to do more than the guests have asked and expected, therefore to increase customer satisfaction. According to researchers “people factor” can be the most crucial factor that affect overall customers’ satisfaction and repurchase intention (Ganesh, et al., 2000).
HOTEL INDUSTRY AND SERVICE QUALITY MODELS Service quality models aim is to enable the organization or management to understand and improve the quality of the organization and its contribution (Seth, N., Deshmukh, S. G., 2004). Researchers and managers succeed in learning details about components of service quality in their organization of clear reasons of customer satisfaction, increased profitability etc. Service quality models gain specific importance as it not only helps in learning the factors linked with it but also will provide a way for improvements. The main purpose of service quality model is to find out how applicable these models are in the context of how consumers perceive service quality and whether they are satisfied with services offered by the service providers (Daniel, C, N., et al., 2010). The below models can be applicable to the hotel industry and they are;

VOLUME NO. 3 (2013), ISSUE NO. 08 (AUGUST) ISSN 2231-5756
INTERNATIONAL JOURNAL OF RESEARCH IN COMMERCE, IT & MANAGEMENT A Monthly Double-Blind Peer Reviewed (Refereed/Juried) Open Access International e-Journal - Included in the International Serial Directories
http://ijrcm.org.in/
79
TABLE: 1.4
Models Authors applications
Technical and functional quality model
Gronroos, 1984
Service quality depends on image, technical and functional quality of the organization. Well-designed (functional) quality is more important than the technical quality because functional quality is the outcome of technical quality.
GAP model Berry, et al., 1985
The model is an investigative tool. It enables the management to identify methodically service quality gaps between a numbers of variables affecting the quality of the contribution. The outcome of the model is outwardly focused. It is capable of supporting the management to identify the relevant service quality factors from the viewpoint of the consumer
Attribute service quality model
Haywood, et al., 1988
This model provides a pedestal of segregating service organization on three dimensions for better management of quality. The model has the possible to enhance understanding of the concepts of service quality and help to guide about targeting towards the right customer section. The outcome of the model is useful for both in the design stage and periodically as the service and possibly customer taste develop.
Performance only model
Cronin, et al., 1992
Service quality should be conceptualized and calculated as an attitude. The performance based SERVPERF is well-organized in comparison with SERVQUAL, as it in a straight line reduces the number of items by 50 per cent and the results are improved. The outcome of the model is service quality is a precursor of customer satisfaction and may have an enhanced effect on purchase intentions than service quality.
Ideal value model of service quality
Mattsson, 1992
This model incorporates and explains the importance of varied components of the service encounter to be calculated. This model provides a new knowledge viewpoint on how an ideal standard can be formed and how it can be continued mentally. The outcome of the model highlights attention to the importance of negative disconfirmation experience as a determinant for satisfaction result.
IT alignment model Gupta and Berkley, 1994
This model describes how IT can be used to get better customer service along with key service quality dimensions including security, responsiveness, competence, reliability, communication, understanding the customer and access. The model outcome can help the organizations to understand the complete advantage of using information systems for delivering improved service quality. Allows managers to appreciate the usually used technologies in their industry and decide appropriate technology suiting their needs.
Attribute and overall affect model
Dabholkar, 1996
The quality based model is favoured in forming the evaluations of service quality for TBSS options. On the whole effect, this model outcome is also supported but it does not add further descriptive power to the attribute based model.
Model of perceived service quality and satisfaction
Spreng, et al., 1996
This model results that service quality and customer satisfaction are separate and desires congruency does influence customer satisfaction. A key determinant of customer satisfaction and service quality is meeting customer requirements. Increasing expectations have a positive effect on customer satisfaction perceptions of presentation, but they also have a negative effect on customer satisfaction through disconfirmation.
PCP (Pivotal, Core, Peripheral) attribute model
Hazlett, et al., 1997
This model results provides an effective, general and simple framework of assessing service quality for any service sector. Things to see the area of improvements for service quality depending on the incidence of meet. The dimensions to these three levels of attributes are individual sector dependent and with reference to customer.
Service quality, customer value and customer satisfaction model
Oh, 1999 The model can be used as a structure for understanding customer decision process as well as evaluating company recital. This model provides an outcome instructions and targets for customer oriented company labours.
Antecedents and mediator model
Dabholkar, et al., 2000
Customers assess different factors related to the service but also shape a separate overall evaluation of the service quality. The antecedent’s model can provide complete sympathetic of service quality and how these evaluations are formed. Customer satisfaction is a better forecaster of behavioural intentions. The model outcomes a strong mediating role was established, confirming that it is significant to calculate customer satisfaction independently from service quality when trying to determine customer evaluations of service.
Internal service quality model
Frost, et al., 2000
The model results the perceptions and outlook of internal customers and suppliers engage in recreating a main role in recognizing the level of internal service quality professed.
Internal service quality DEA (Data Envelop Analysis) model
Soteriou, et al., 2000
The model result indicates the possessions, which can be better utilized to create higher service quality levels.
IT-based model Zhu, et al., 2002
IT-based services have a direct impact on the assurance, responsiveness and reliability dimensions and an indirect impact on customer happiness and perceived service quality IT can help service providers achieve higher level of customer Satisfaction. The model results the customer evaluation of IT-based services is affected by preference towards past experience in IT-based services, perceived IT policies and traditional services
Model of e-service quality
Santos, 2003 The model results provides a better perceptive of e-service quality and consequently to attain high customer preservation, profitability, and customer satisfaction. This e-service quality model can be of help to all companies that connect e-commerce or plan to do so.
Source: Adapted from Seth, N., Deshmukh, S. G., (2004) The models wrap the domain from conservative personalized services to the internet-enabled services including the organizational and behavioural aspects. These models provide a useful framework for service quality. There are certain factors which are seemed to be suitable for comparative evaluations of the service quality models and they are: a) Recognition of factors affecting service quality. b) Appropriateness for variety of services in consideration. c) Flexibility to account for changing nature of customers perceptions. d) Directions for improvement in service quality. e) Suitability to develop a link for measurement of customer satisfaction. f) Diagnosing the needs for training and education of employees. g) Flexible enough for modifications as per the changes in the environment/conditions. h) Suggests suitable measures for improvements of service quality both upstream and downstream the organization in focus. i) Identifies future needs (infrastructure, resources) and thus provide help in planning. j) Accommodates use of IT in services. k) Capability to be used as a tool for benchmarking. A firm in order to compete fruitfully must have an understanding of customer perception of the quality and the way service quality is prejudiced. Service quality is a function of the differences between expectation and performance along the quality dimensions (Berry, et al., 1985). To conclude with these models can be

VOLUME NO. 3 (2013), ISSUE NO. 08 (AUGUST) ISSN 2231-5756
INTERNATIONAL JOURNAL OF RESEARCH IN COMMERCE, IT & MANAGEMENT A Monthly Double-Blind Peer Reviewed (Refereed/Juried) Open Access International e-Journal - Included in the International Serial Directories
http://ijrcm.org.in/
80
useful in hotel industry and it is noted that the models have a focus only on one link that is either marketer to consumer or front-line staff to supporting staff. (Caruana, et al., 1997; Reynoso, et al., 1995) on other side, researchers have continuously pointed out the positive correlation of internal service quality considering all the processes and operations associated in delivery of product or service with business performance and the service quality delivered to the customer including the marketing, distribution and other support functions.
CONTRIBUTION TO KNOWLEDGE AND INDUSTRY AND CONCLUDING REMARKS From the diverse service quality tools, dimensions and models, the study states that right through the 1980s it was accepted that meeting customer’s expectations would lead to customer satisfaction and which would lead to repeat business. But in 1990s research began to show that achieving customer satisfaction may not lead to customer loyalty. As a result researchers began to find new models to study and formulate model for improvement of customer engagement, satisfaction and retention. This preliminary study focuses on the theory, well-known and popular service quality tool (SERVQUAL), models and dimensions together and also highlights on various issues, debates, strengths and weaknesses pertaining to the service quality. This study also focuses on how essential is guest engagement, satisfaction and technology in further improving service quality and hence improving total quality management in Hotel Industry . This study proposes to explore the scope to which a service quality improvement model can be widely used in hotel sector specifically in Indian Hotel Industry. The study institutes how the benefits of service quality from this research can be utilized and extends the understanding of improving service and provide strong base to industry for further enhancement of service quality .This study discusses the dimensions and different models and theories to help develop service improvement model which will facilitate employee satisfaction to enhance job performance and also guest engagement and satisfaction to boost business and further sparks the present hospitality players to improve upon their service quality. The limitation of this study is the preliminary study did not cover all available service quality literature and dimensions of SERVQUAL.
GLOSSARY 1. TQM – total quality management; it is an integrative viewpoint of an organization for continuously improving the quality of products and processes. 2. SERVQUAL – service quality; SERVQUAL or RATER is a service quality structure. SERVQUAL means to measure the scale of quality in the service sectors. 3. SERVPERF- service performance; SERVPERF is a service quality structure and it is to measure the scale of service performance in the service sector. 4. LQI – Lodging quality index; Scale of lodging quality in the service sector. 5. HOLSERV- Holiday service; Scale of service in hospitality industry. 6. CCTV – closed circuit television 7. TBSS – Technology based self-service; it is a form of service that delivers by the customers to themselves through communication with technological
systems. 8. THTS – Traditional Human Touch Service; it is the service that are provided by the front line workers to the customers
REFERENCES 1. Akbaba, A. (2006). Measuring service quality in the hotel industry: A study in a business hotel in Turkey, International Journal of Hospitality Management,
25, 2,170-192. 2. Al Khattab, S. S. J. (2011). Perceptions of Service Quality in Jordanian Hotels. International Journal of Business and Management, 6(7).
http://dx.doi.org/10.5539/ijbm.v6n7p226 3. Al Rousan, R. M. R. (2011). Hotel service quality and customer loyalety in Jordanian hotels: A case study of marriott hotels chain. University Saiance
Malaysia Pula Pinang. 4. Antony, J. F., & Ghosh, S. (2004). Evaluating service quality in a UK hotel chain: a case study. International Journal of Contemporary Hospitality
Management, 16(6), 380-384. http://dx.doi.org/10.1108/09596110410550833 5. Babajide, O. (2011). Breakfast service quality in Restaurant Gui Hilton Helsinki Airport hotel. Bachelor’sThesis, HAAGA- HELIA University of applied sciences.
Retrieved from https://publications.theseus.fi/bitstream/handle/10024 6. Barsky, J.D., 1992. Customer satisfaction in the hotel industry: Meaning and measurement. Hospitality Research Journal 16, 51Ð73 7. Beatson, A., Coote, L. V., & Rudd, J. M. (2006). Determining consumer satisfaction and commitment through self-service technology and personal service
usage. Journal of Marketing Management, 22(7), 853-882. 8. Berkley, B.J. and Gupta, A. (1994), “Improving service quality with information technology”, International Journal of Information Management, Vol. 14, pp.
109-21. 9. Berry, L.L., Bennet, D.R., & Brown, C.W. (1989). Service Quality: A Profit Strategy for Financial Institutions, Dow-Jones-Irwin, Homewood, IL. 10. Bitner, M., Booms, B. H., & Tetreault, M. (1990). The service encounter: Diagnosing favourable and unfavorable incidents. Journal of Marketing, 54(1), 71-
84. 11. Bojanic, D. C. & Rosen, L.D. (1994). Measuring service quality in restaurants: an application of the SERVQUAL instrument, Journal of Hospitality and Tourism
Research Journal, 18,1, 3-14. 12. Brady, M.K. and Cronin, J.J. Jr (2001), “Some new thoughts on conceptualizing perceived service quality: a hierarchical approach”, Journal of Marketing,
Vol. 65, pp. 34-49. 13. Brogowicz, A.A., Delene, L.M. and Lyth, D.M. (1990), “A synthesized service quality model withmanagerial implications”, International Journal of Service
Industry Management, Vol. 1 No. 1, pp. 27-46 14. Carev, D. (2008). Guest satesfaction and gest loyalety study for hotel industry. College of Applied Science and Technology, Pro Quest. database. 15. Carman, J. M. (1990). Consumer perceptions of service quality: an assessment of the SERVQUAL dimensions. Journal of Retailing, 66(1), 33-55. 16. Caruana, A. and Pitt, L. (1997), “INTQUAL: an internal measure of service quality and the link between service quality and business performance”, European
Journal of Marketing, Vol. 31 No. 8, pp. 604-16. 17. Chathoth, P. (2006), The impact of information technology on hotel operations, service management and transaction costs: A conceptual framework for
full-service hotel firms, International Journal of Hospitality Management, 26 (2), 395-408. 18. Cheung, C., & Law, R. (1998). Hospitality service quality and the role of performance appraisal. Journal of managing service quality, 8(6), 402-406 19. Choi , T. Y., & Chu , R. K. S. (1998). Consumer perceptions of the quality of services in three hotel categories in Hong Kong. Journal of Vacation Marketing,
5(2), 176-189. 20. Christie, R. M. (2002). A Comprehensive Model of Customer Satisfaction in Hospitality and Tourism: Strategic Implications for Management. International
Business &Economics Research Journal, 1(6), 8-18. 21. Cronin, J. J., Brady, M. K., & Hult, G. T. (2000). Assessing effects of the quality, value, and customer satisfaction on consumeral behavioral intentions in
service environments. Journal of Retailing, 76(2), 193- 218. http://dx.doi.org/10.1016/S0022-4359(00)00028-2 des Services, Paris: McGraw-Hill 22. Crosby, P B (1984). Paper presented to the “Bureau de Commerce,” Montreal, Canada (Unpublished), November Juran, J M (1988). Juran on Planning for
Quality. New York:The Free Press Eiglier, P and Langeard, E (1987). Servuction, Le Marketing des Services, Paris: McGraw-Hill. 23. Daniel,Nde Chingang & Berinyuy, Paul Lukong(2010). Using the SERVQUAL Model to assess Service Quality and Customer Satisfaction - An empirical study
of grocery stors in Umea p 40-50 , p. 77-89 24. Davidson M C G a (2003) An Integrated Approach to Service Quality in Hotels. J Quality Assurance in Hospitality and Tourism 4: 71-85.

VOLUME NO. 3 (2013), ISSUE NO. 08 (AUGUST) ISSN 2231-5756
INTERNATIONAL JOURNAL OF RESEARCH IN COMMERCE, IT & MANAGEMENT A Monthly Double-Blind Peer Reviewed (Refereed/Juried) Open Access International e-Journal - Included in the International Serial Directories
http://ijrcm.org.in/
81
25. Domke-Damonte, D. J. & Levsen, V. B. (2002). The effect of internet usage on cooperation and performance in small hotels. SAM Advanced Management Journal, 67 (3), 31-38.
26. Fernández, M.C.L. & Bedia, A.M.S. (2005). Applying SERVQUAL to Diagnose Hotel Sector in a Tourist Destination. Journal of Quality Assurance in Hospitality & Tourism, 6(1): 9-24.
27. Fink, G.R. & Ritchie, J.R.B. (1991). Measuring service quality in the travel and tourism industry, Journal of Travel Research, 30, 2, 2-9.. 28. Ganesh, J., Arnold, M. J., & Reynolds, K. E. (2000). Understanding the customer base of service providers: An examination of the differences between
switchers and stayers. Journal of Marketing, 64(3), 65-87. 29. Getty, J.M., & Getty, R.L., (2003). Lodging quality index (LQI): Assessing customers’ perceptions of quality deliver. International Journal of Contemporary
Hospitality Management, 15(2), 94-104. 30. Ghobadian, A, Speller, S., & Jones, M. (1994). Service quality: concepts and models, International Journal of Quality & Reliability Management, 11, 9, 43-66. 31. Gounaris, S. P., Stathakopoulos, V., & Athanassopoulos, A. D. (2003). Antecedents to perceived service quality: an exploratory study in the banking
industry. The International Journal of Bank Marketing, 21(4/5), 168-190. http://dx.doi.org/10.1108/02652320310479178 32. Gronroos, C. (1990), Service Management and Marketing, Lexington Books, Lexington, MA. 33. Hackl P. & Westlund A. H. (2000). On Structural Equation Modelling for Customer Satisfaction Measurement. Total Quality Management, 11(4/5/6), 820-
825. 34. Harvey, J. (1998). Service quality: a tutorial. Journal of Operations Management, 16, 583-597. http://dx.doi.org/10.1016/S0272-6963(97)00026-0 35. Helgesen, Ø. (2006). Are loyal customers profitable? Customer satisfaction, customer (action) loyalty and customer profitability at the individual level.
Journal of Marketing Management, 22(3), 245-266. 36. http://www.experian.co.uk/assets/business-strategies/white-papers/wp-customer-engagement-a-new-paradigm.pdf 37. Kang, G. D., & James, J. D. (2007). Revisiting the concept of a societal orientation: Conceptualization and delineation. Journal of Business Ethics, 73(3), 301-
318. 38. Kerr, v., kehoe, b. & dwan, t. (1988) Mayfair crest international hotel-a case study, proceedings of the qualcon 88 conference, Sydney, Australia. 39. Kincaid, C., Seyhmus, B., Mao, Z., & Busser, J. (2010). What really bring them back? The impact of tangible quality on affect and intention for casual dining
restaurant patrons. International Journal of Contemporary Hospitality Management, 22, 2, 209-220. 40. Kirby, A. (2009). Hotels get app happy: Mobile downloads are the new frontier for online booking. Hotels. Retrieved from
http://www.hotelsmag.com/article/CA6686816.html? industryid=47565 41. Knutson, B., Stevens, P., Wullaert, C., Patton, M., & Yokoyama, F. (1990). LODGSERV: a service quality index for the lodging industry. Hospitality Research
Journal, 14(2), 227-284. 42. Kotler, P., & Bloom, P. N. (1984). Marketing professtional services. Engleewood cliffs, NJ: Prentice - Hall. 43. Kotler, P., Roberto, N., & Leisner, T. (2006). Alleviating poverty: A Macro/Micro marketing perspective. Journal of Macromarketing, 26(2), 233-239.
doi:10.1177/0276146706291039 44. Ladhari, R. (2008). A review of twenty years of SERVQUAL research, International Journal of Quality and Service Sciences, Vol. 1(2).P.172-198. 45. Mei, A. W. O., Dean, A. M., & White, C. J. (1999). Analyzing service quality in the hospitality industry. Journal of Managing Service Quality, 9(2), 136-143.
http://dx.doi.org/10.1108/09604529910257920 46. Mill, R.C. (1986) Managing the service encounter, The Cornell HRA Quarterly, February, pp. 39-45. 47. Mintzberg, H. (1979). The Structuring of Organizations. Englewood Cliffs, N. J.: Prentice-Hall 48. Mohsin, A., & Lockyer, T. (2010). Customer perceptions of service quality in luxury hotels in New Delhi, India: a exploratory study. International Journal of
Contemporary Hospitality Management, 22(2), 160-173. http://dx.doi.org/10.1108/09596111011018160. 49. Nadiri H. & Hussain K. (2005). Perceptions of Service Quality in North Cyprus Hotels. International Journal of Contemporary Hospitality Management, 17(6),
469-480. 50. Negi, R. (2009), Determining customer satisfaction through perceived service quality: A study of Ethiopian mobile users, International Journal of Mobile
Marketing, Vol. 4(1), pp. 31-38. 51. O’Neil, M. and Palmer, A. (2004), “Cognitive dissonance and the stability of service quality perceptions”, The Journal of Services Marketing, Vol. 18 Nos 6/7,
pp. 433-47.. 52. Oberoi, U., & Hales, C. (1990). Assessing the quality of the conference hotel service product: towards an empirically based model. Service Industries
Journal, 10(4), 21 700.http://dx.doi.org/10.1080/02642069000000083. 53. O'Mahony, G. B. & Sillitoe, J. F. (2001). Identifying the Perceived Barriers to Participation in Tertiary Courses among Hospitality Employees', International
Journal of Contemporary Hospitality Management, 13(1), 21-29. 54. Parasuraman., Zeithaml, V. A., & Berry, L. L. (1988) SERVQUAL: a multiple item scale for measuring consumer perceptions of service quality. Journal of
Retailing, 64(1), 12-40. 55. Philip, G. and Hazlett, S.A. (1997), “The measurement of service quality: a new P-C-P attributes model”, International Journal of Quality & Reliability
Management, Vol. 14 No. 3, pp. 260-86. 56. Pitt, L. F., & Jeantrout, B. (1994). Management of customer expectations in service firms: A study and a checklist. The Service Industries Journal, 14(2), 170-
189. http://dx.doi.org/10.1080/02642069400000021 57. Powapaka, S. (1996). The role of outcom quality as adeterminantof overall service quality in different categories of service industries: an empirical
investigation. Journal of Services Marketing, 10(2), 5-25 http://dx.doi.org/10.1108/08876049610114230 58. Powell, C. T. (1995). Total Quality Management as competitive advantage: A review and empirical study. Strategic Management Journal, 16, 15-37. 59. Presbury, R., Fitzgerald, A., & Chapman, R. (2005). Impediments to improvements in service quality in luxury hotels. Managing Service Quality, 15(4), 357-
373. http://dx.doi.org/10.1108/09604520510606835 60. Reuland, R., J. Coudrey, and A. Fagel.1985. ‘Research in the Field of Hospitality.’International Journal of Hospitality Management 4 (4):141–46.. 61. Ritzer. G., (1993), The McDonaldization of Society, Thousand Oaks, CA, Pine Forge 62. Rust, R. T., & Zahorik, A. J. (1993). Customer satesfaction, customer retention, and market share. Journal of Retailing, 69(2), 103-125.
http://dx.doi.org/10.1016/0022-4359(93)90003-2 63. Saleh, F., & Ryan, C. (1991). Analysing service quality in the hospitality industry using the SERVQUAL model. Services Industries Journal, 11(3), 324-343.
http://dx.doi.org/10.1080/02642069100000049 64. Saravanan, R. &Rao, K. S. P. (2007), Measurement of service quality from the customer‟s perspective – An empirical study, Total Quality Management, Vol.
18(4), pp. 435-449. 65. Seth, N. & Deshmukh, S.G. (2005). Service quality models: a review. International Journal of Quality & Reliability Management, 22(9), 913-949. 66. Shaw, R. (2004). Hotels test self-serve kiosk acceptance. Hotel & Motel Management, 219(1), 1-55. 67. Shergill G (2004) Tourists perceptions towards hotel services in New Zealand. International Journal of Hospitality Tourism Administration 5: 1-29. 68. Sigala, M., Airey, D., Jones, P., & Lockwood, A. (2000). The diffusion and application of multimedia technologies in the tourism and hospitality industries.
Information and Communication Technologies in Tourism 2000, Wien: Springer, 396-407. 69. Sureshchandar, G.S., Rajendran, C. and Anantharaman, R.N. (2003), “Customer perceptions of service quality in the banking sector of a developing
economy: a critical analysis”, The International Journal of Bank Marketing, Vol. 21 Nos 4/5, pp. 233-41.

VOLUME NO. 3 (2013), ISSUE NO. 08 (AUGUST) ISSN 2231-5756
INTERNATIONAL JOURNAL OF RESEARCH IN COMMERCE, IT & MANAGEMENT A Monthly Double-Blind Peer Reviewed (Refereed/Juried) Open Access International e-Journal - Included in the International Serial Directories
http://ijrcm.org.in/
82
70. Tat, Y. C., & Raymound, K. S. C. (1999). Consumer perceptions of the quality of services in three hotel categories in Hong Kong. Journal of Vacation Marketing, 5(2), 176-189. http://dx.doi.org/10.1177/135676679900500206
71. Thapar J (2007) A study of service quality of hotel industry in Ludhiana. Research Project Report, Department of Business Management, Punjab Agricultural University, Ludhiana
72. Thawani, S. (2004), “Six sigma – strategy for organizational excellence”, Total Quality Management, Vol. 15 Nos 5-6, pp. 655-64. 73. Thomson E L and Thomson S C (1995) Quality issues in nine New Zealand hotels: A research study. TQM Magazine 7: 16-20. 74. Upal, M. (2008). Telecommunication Service Gap: Call Center Service Quality Perception and Satisfaction. Journal of Communications of the IBIMA, 3. 75. Wilkins, H., Merrilees, B., & Herington, C. (2007). Towards an understanding of total service quality in hotels. Hospitality Management, 26(4), 840-853. 76. Zeithaml., & Bitner, M. J. (2003). Services Marketing: Integrating Customer Focus Across the Firm. New York: McGraw-Hill.

VOLUME NO. 3 (2013), ISSUE NO. 08 (AUGUST) ISSN 2231-5756
INTERNATIONAL JOURNAL OF RESEARCH IN COMMERCE, IT & MANAGEMENT A Monthly Double-Blind Peer Reviewed (Refereed/Juried) Open Access International e-Journal - Included in the International Serial Directories
http://ijrcm.org.in/
83
A CRITICAL ASSESSMENT ON MEASURES OF EMOTIONAL INTELLIGENCE
MEETA MANDAVIYA ASST. PROFESSOR
MARWADI EDUCATION FOUNDATION GROUP OF INSTITUTES RAJKOT
ABSTRACT
Emotional intelligence is getting attention from both academic-press and popular-press in its challenges to previously-held normative theories. One developing paradigm is that of Emotional Intelligence-based Leadership that has become popular for identifying potentially effective leaders, and as a tool for developing effective leadership skills. Despite this popularity, there is only limited theoretical discussion and empirical study, and reports are dichotomized between popular-press and academic-press. This paper integrates both the popular and scholarly theories and empirical research of Emotional Intelligence-based Leadership into a comprehensive review.
KEYWORDS Emotional Intelligence, Measures of EI, Competency, Human behavior and Perceptions.
INTRODUCTION aniel Goleman challenged the fundamentals of the pervading dominant theories of organisational leadership by proposing that “IQ and technical skills are important, but emotional intelligence is the sine qua non1 of leadership” (Goleman, 1998a, p. 93). Extending the reaches of his top selling book Emotional Intelligence (Goleman, 1996) into management theory and its fields of leadership and human capital development, Goleman brought the
limelight of the corporate world onto a relatively undeveloped field of psychology, developing it’s paradigmatic structure (Goleman, 2001b; Kuhn, 1996). This paper seeks to explore (1) the concepts of emotional intelligence (EI) and the models that encapsulate them; (2) the need for leaders to use emotional intelligence; (3) the model of EI-based leadership; and (4) the empirical support for EI-based leadership.
WHAT IS EMOTIONAL INTELLIGENCE? Emotional intelligence is “the ability to perceive emotions, to access and generate emotions to assist thought, to understand emotions and emotional knowledge, and to reflectively regulate emotions so as to promote emotional and intellectual growth” (Caruso, Mayer, & Salovey, 2002, p. 56). Essentially, EI refers to one’s ability to recognize and regulate emotions in oneself and others (Goleman, 2001a). George (2000) defines the term ‘emotion’ by distinguishing the difference between emotion and mood as intensity. Moods are more pervasive and generalized feeling states that are relatively independent of the events or circumstances that may have caused the mood in the first place and are low intensity feelings that do not interrupt activities (George, 2000). Conversely, emotions are high intensity feelings that are triggered by either internal or external stimuli, demand attention, and interrupt cognitive processes and behaviours. While, this intensity causes them to be more fleeting than moods, they are generally the underlying causal factor of moods. Once the emotional intensity has subsided because the individual has cognitively or behaviourally dealt with the cause, the emotion can linger on in a less intense feeling or mood (George, 2000). While the sampling provided here is brief and indicative of a wider theory, it can be concluded that, feelings and emotions are intimately connected to the human experience and are intricately bound up in the ways that people think, behave, and make decisions (George, 2000)2. The abilities to manage these emotions are categorised into emotional abilities and competencies by two dominant models of EI, Salovey and Mayer’s (1990) Ability model and Goleman’s (1996) Competency (Mixed) model and their refined versions. SALOVEY & MAYER’S ABILITY MODEL OF EMOTIONAL INTELLIGENCE The Ability model of EI was first constructed by Salovey and Mayer (1990) and begins with the idea that emotions contain information about relationships and whether these relationships are actual, remembered, or imagined, they coexist with emotions - the felt signals of the relationship’s status (Mayer, Salovey, Caruso, & Sitarenios, 2001). Salovey & Mayer’s four branch Ability model of EI facilitates an ability to recognise the meanings of emotions and their relationships, and employ them to enhance cognitive activities (Mayer et al., 2001). The Ability model divides EI into four branches: (1) perceiving emotions, (2) using emotions to facilitate thought, (3) understanding emotions, and (4) managing emotions in a manner that enhances personal growth and social relations (Dulewicz & Higgs, 2000; Mayer et al., 2001; Salovey & Mayer, 1990). The model has undergone continual improvement since its construction and the most recent version is offered by Caruso, Mayer, and Salovey (Caruso et al., 2002), represented in Table 1. The Perceiving branch addresses the perceptual skills of self-identification of emotions in thoughts, identifying emotions in other people, accurate expression of emotions, and the ability to differentiate and discriminate between accurate/real and inaccurate/phoney emotions (Caruso et al., 2002). The second branch, Using Emotions, advocates their use in prioritising thinking by directing attention to important events/factors, to generate emotions that assist judgement and facilitate decision making, to utilise self-mood swings to change perspective, and to use different emotional states to promote different means to problem solving (Caruso et al., 2002). The third branch, Understanding Emotions, is based on the ability to understand complex emotions and emotional ‘chains’, the transition of emotions through stages, the ability to understand relationships among emotions, and interpret the meanings emotions convey (Caruso et al., 2002). The fourth branch, Managing Emotions, encompasses the ability to reflectively monitor emotions and stay open to them, and the ability to engage or detach from emotions. The branch also advocates the ability to determine whether an emotion is clear or typical, and the ability to solve emotion-based problems without necessarily suppressing the negative emotions (Caruso et al., 2002).
D

VOLUME NO. 3 (2013), ISSUE NO. 08 (AUGUST) ISSN 2231-5756
INTERNATIONAL JOURNAL OF RESEARCH IN COMMERCE, IT & MANAGEMENT A Monthly Double-Blind Peer Reviewed (Refereed/Juried) Open Access International e-Journal - Included in the International Serial Directories
http://ijrcm.org.in/
84
GOLEMAN’S EMOTIONAL COMPETENCIES MODEL In Goleman’s (1998b) book, Working With Emotional Intelligence, he builds on his first book (Goleman, 1996) and provides the first concrete and authoritative fusion of emotional intelligence and the organisation. Where psychological theorisation has defined EI in terms of individual traits, emotions, values, and behaviour (Dulewicz & Higgs, 2000), Goleman (1998b) aligns psychological and organisational management theory by using Boyatzis’ (1982) concept of competency: an underlying personal characteristic such as motive, trait, skill, self-image, or knowledge, that one uses for performance. Goleman (1998b) defines emotional competence as a learned capability based on emotional intelligence that results in outstanding work performance. Goleman’s (1998b) competency theory of EI includes 25 competencies that were grouped into five categories similar to his earlier work: (1) Self-Awareness: emotional awareness, accurate self-assessment, selfconfidence; (2) Self-Regulation: self-control, trustworthiness, conscientiousness, adaptability, innovation; (3) Motivation: achievement, commitment, initiative, optimism; (4) Empathy: understanding others, developing others, service orientation, leveraging diversity, [socio-] political awareness; and (5) Social Skills: influence, communication, conflict management, leadership, change catalyst, building bonds, collaboration and cooperation, team capabilities. The theory postulates that the more competencies one has, the more emotionally intelligent they are. In Goleman’s latest publications, The New Leaders (Goleman, Boyatzis, & McKee, 2002) and An EI-Based Theory of Performance (Goleman, 2001a), he presents a new version of his original model that is more organisationally aligned to provide a means of EI-based performance, and specifically for leaders, as demonstrated in Table 2. The change reflects statistical analyses (Boyatzis, Goleman, & Rhee, 2000; Goleman et al., 2002) that supported collapsing the twenty-five competencies into twenty competencies and the five domain groupings into four domains (Goleman, 2001b). These four domains are further categorized into Personal Competence and Social Competence (Goleman et al., 2002). Personal Competence capabilities determine how we manage ourselves and is categorized by two domains and their associated competencies: (1) Self-Awareness: emotional selfawareness, accurate self-assessment, self-confidence; and (2) Self-Management: emotional self-control, transparency: honesty/integrity/trustworthiness, adaptability/flexibility, achievement/drive for performance, initiative, optimism (Goleman et al., 2002). Social Competence capabilities determine how we manage relationships and is contained within two domains: (1) Social Awareness: empathy towards others, awareness of organisational-level currents, decision networks and politics; service to others; and (2) Relationship Management: inspirational leadership, influence tactics, developing others, change catalyst, conflict management, building bonds, teamwork and collaboration/cooperation (Goleman et al., 2002)
VOLUME NO. 3 (2013), ISSUE NO. 08 (AUGUST) ISSN 2231-5756
INTERNATIONAL JOURNAL OF RESEARCH IN COMMERCE, IT & MANAGEMENT A Monthly Double-Blind Peer Reviewed (Refereed/Juried) Open Access International e-Journal - Included in the International Serial Directories
http://ijrcm.org.in/
85
EVALUATION OF THE EMOTIONAL INTELLIGENCE MODELS Both models have been empirically validated and have been empirically tested with regard to leadership, which will be examined later in this review. The Ability model is narrower in scope than the Competency model and, as presented academically, it does not postulate as a complete theory of workplace management. It is a model of a type of intelligence, and is purported to coexist with, supplement, and clarify existing models of intelligence, and especially, leadership (Caruso et al., 2002). Comparatively, the Competency model is described as mixed as it includes a multitude of traits, is wide in scope, covers most of the current theory on effectiveness, and is an amalgamation of many of the standard competency models in use by Human Resource practitioners (Caruso et al., 2002). While Caruso, Mayer, and Salovey (2002) are purportedly biased in their comparative review of both models and temptingly dichotomous in their comparison towards their Ability model, it is evident that the Competency model is equally as dominant in the academic theorisation. The majority of the empirical testing of emotional intelligence’s effect on leadership use both Goleman’s (1998b) competency model4 and Salovey and Mayer’s (1990) model as the basis for their studies. To provide a more-encompassing model of EI for testing some studies have combined the models as they are not so seemingly dichotomous, but with further testing, perhaps complementary. However, their proponents attribute both models to effective leadership. For this review, the notion of complementarity is strongly concurred with and is demonstrated through the use of the separation of the models to explain two different but complementary questions: (1) Why do leaders need emotional intelligence? (2) How do leaders use emotional intelligence?
WHY DO LEADERS NEED EMOTIONAL INTELLIGENCE? The Ability model of EI provides a suitable medium for examining why leaders need emotional intelligence through asking why leaders need to be able to (1) identify, (2) use, (3) understand, and (4) manage emotions. Caruso, Mayer, and Salovey (2002) report that studies have found that the ability for a leader to identify emotions and feelings within themselves also allows them to accurately identify the emotions of peers and groups, to express emotions accurately, and to differentiate between honest and phoney emotional expressions. Empathy, the ability to understand and experience another person’s feelings or emotions, is an important component of EI and facilitates a leader’s social support and positive inter-personal relationships (George, 2000). In their study comparing emotional and cognitive competencies as a basis of subordinate perceived effective leadership, Kellet, Humphrey and Sleeth (2002) report that empathy (a substantial EI component) bore the strongest correlation with perceived effective leadership. This suggests that perceiving others’ feeling and empathising with them may establish an affective bond that is beneficial for leadership. Leaders use of emotions can enhance cognitive processes and decision making (George, 2000), and allows leaders to understand and motivate others by making emotions available, engaging in multiple perspectives that facilitate more flexible planning, and more creative, open-minded, and broader thinking and perspectives (Caruso et al., 2002; George, 2000). George (2000) reports research findings that when people are in positive moods they tend to be more optimistic and have more positive perceptions and perspectives, compared with negative moods, that result in the converse of pessimism and negativism. Understanding EI provides functional insights into human behaviour and perceptions. This understanding includes the ability to recognise relationships between emotions, determine emotions’ underlying meaning, comprehend complex feelings and recognise and accept emotional fluctuation (Caruso et al., 2002). Identification, use and understanding of emotions facilitates effective management of emotions. In a longitudinal study of 382 team members comprising 48 self-managing teams, Wolff, Pescosolido, and Druskat (2002), found that empathy is the foundation for the cognitions and behaviours that support the emergence of leadership. Overall, they conclude their results suggest that emotional intelligence, particularly empathic competency, is a dominant factor of the leadership emergence in self-managed teams. Managing emotions allows leaders to dissipate and alleviate the effects of negative events and provide redirection and focus towards more positive events and moods (Caruso et al., 2002; George, 2000), termed by Mayer and Salovey (1997, cited in George, 2000) as meta-regulation of mood. Lewis (2000) reports that her laboratory study found that the emotional tone of a CEO level leader has a significant effect on follower affect and perception of leader effectiveness. Indeed EI leadership prescribes not just the ability to manage self-feelings and moods, but ability to manage moods and emotions of others (George, 2000). In a field study on the emotional dynamics of 20 self-managed groups, Pescosolido (2002) reports that emergent leaders within groups adopt the role of managing the group’s emotional state. They use their emotionally intelligent behaviour, (empathy, emotional perception of self and others, emotional management of self and others, emotional expression, emotional communication, inspirational leadership, role modelling) to communicate messages to group members regarding group performance and contextual events. Resultantly, group members read their leader’s behaviour and crafted emotional interpretations of the situation, which then guided their own behaviour. This empirical evidence has demonstrated the strong relationships between emotional intelligence and performance, the existence of a relationship between emotional intelligence and leadership style, and the need to combine emotional intelligence abilities and competencies with leadership skill. Goleman et al. (2002) provide this linkage with the EIbased model of leadership.
HOW DO LEADERS USE EI? - THE EI-BASED MODEL OF LEADERSHIP EI-based leadership is based around the concept of emotional contagion (see Hatfield, Cacioppo, & Rapson, 1992; Hatfield, Cacioppo, & Rapson, 1994; Neumann & Strack, 2000; Wild, Erb, & Bartels, 2001), which refers to the ‘contagiousness’ of emotions where moods and emotions of one individual are transferred to nearby individuals (Caruso et al., 2002; Goleman et al., 2002; Kelly & Barsade, 2001). Through relatively automatic and unconscious mimicking and synchronisation of facial expressions, vocalisations, postures, and movements with those of another person (Kelly & Barsade, 2001), emotional synchronization (Goleman et al., 2002) occurs. Newcombe and Ashkanasy’s (2002) study of subordinates’ perceptions of leaders found that a leader’s positively expressed emotion led to higher member ratings of the leader, and that members’ perceptions of leaders are associated with the level of congruency between the leader’s verbal message and their nonverbally expressed emotion. Subordinates’ level of positive affect was highly influenced by leaders’ emotional and affect expression (Newcombe & Ashkanasy, 2002). Based on this concept of emotional contagion, Goleman et al. (2002) propose that due to a leader’s authoritative position, they become the role model from which subordinates synchronise and attune their behaviour because they look to their leader for stimulus. The positivity or negativity of the leader’s affect, moods, and emotions is detrimental to the moods of their subordinates, and consequently, their performance. However, they do acknowledge that because not all leaders are emotionally intelligent, the role of emotional leader may fall to a de-facto leader who provides the emotional support for a group (Goleman et al., 2002). Taking this notion of synchronisation and attunement, Goleman et al. (2002) extends it into the concept of resonant and dissonant leadership. The term resonance is defined in the Oxford English Dictionary as “the reinforcement or prolongation of sound by reflection or by synchronous vibration”. In simple terms, resonance is used in EI-based Leadership to describe when synchronous vibrations of emotions occur – that is they are on the same wavelength emotionally; what can be described as in synch, e.g. we both share the same goals and values and are together happy in working towards them (Goleman et al., 2002). A group would be described as resonant when they are a reflection of their leader’s enthusiasm and dedication to the task. When a group of people are resonant, there are less negative emotions and ill feelings, which result in greater cohesiveness (sticking together) and better results. The resonant group will share ideas, energy levels, enthusiasm, dedication, values, norms, motivation and a mutual comfort level (Goleman et al., 2002) Conversely, the word dissonance is a musical term for an unpleasant, harsh sound – a lack of harmony. Dissonant leadership produces groups that are emotionally discordant; that is, they share no bond, togetherness or cohesion. Therefore they share unproductive goals, values and norms, low motivation, dedication, and satisfaction, and produce poor results (Goleman et al., 2002). A dissonant leader is critical, negative, rude, uninspiring, arrogant, selfish etc. etc. – the list is endless. Basically, a dissonant leader utilises position as their dominant power base (see Yukl, 1994) and ignores the other power bases for gaining respect and leading. The effect of this is a disharmonious team. There is no unity, motivation, happiness, pride, self-development, hard work etc. The group atmosphere is very negative and unenjoyable, and consequently resultant lower or poor performance (Goleman et al., 2002). Continuing the musical analogical interpretation, I propose the metaphor of the orchestra to demonstrate the effective ideal of EI-based leadership. Atik (1994) provides an empirical and functional study of leadership within an orchestra, but doesn’t explicate the true potential of this forum for leadership theory. An orchestra is a micro-example of an organisation as it consists of differentiated but interdependent sections of specialised instrumentalists that use different tools, skills, and means of production (e.g. bow on strings versus blowing brass or woodwind), and have sectionalised leadership. Each section plays different

VOLUME NO. 3 (2013), ISSUE NO. 08 (AUGUST) ISSN 2231-5756
INTERNATIONAL JOURNAL OF RESEARCH IN COMMERCE, IT & MANAGEMENT A Monthly Double-Blind Peer Reviewed (Refereed/Juried) Open Access International e-Journal - Included in the International Serial Directories
http://ijrcm.org.in/
86
notes in different melodies and rhythms but with the objective of contributing their differentiated sectionalized parts together in a totally synchronised and interdependent fashion that results in resonance and idealistically, harmony. Each part is interdependent, for with a part missing, there is a harmonical gap in the sound. At the core of this orchestration is the conductor. Underlying the whole concept of music is the expression of emotion. The conductor literally leads the orchestra in an emotionally contagious fashion so that the various sections become emotionally synchronised and feed off each other’s emotional output – the quality and emotionality of their playing. The result is a glorious nirvana of resonant harmonious sound that is both literally and figuratively in synch. Without an effective leader/conductor, the differentiated sections will play their notes and rhythms in accordance with the notated music, but struggle to keep in tune or in synch –in effect, they become dissonant. Hence, why orchestras have conductors. To be an effective, competent and resonant leader and promote harmony and resonance over dissonance, EI-based leadership promotes the understanding and development of emotional competencies (Goleman et al., 2002) that are reflected in a repertoire of leadership styles. Research drawing on data from a Hay/McBer study of 3,781 executives (Goleman, 2000) leads Goleman (2000; 2001a; Goleman et al., 2002) to categorise the role of EI competencies in leadership effectiveness into a typology of six distinct styles of EIbased leadership outlined in Table 3. The visionary, affiliative, democratic, and the coaching styles, generally drive organisational climate in a positive direction. Conversely, the coercive and pacesetting styles tend to negatively effect organisational climate, however, in the appropriate situation, they can reap positive benefits (Goleman, 2001a). Visionary leaders possess the emotional competencies of self-confidence, empathy, change catalyst, and visionary leadership. The affiliative leader is empathic and competent in building relationships and conflict management. The democratic leader is a strong communicator and listener, and encourages teamwork and collaboration. And the coaching leader is empathic and emotionally self-aware, and competent in developing others’ potential into skill (Goleman, 2000, 2001a; Goleman et al., 2002). The commanding leader relies on a position power base (see Yukl, 1994) where autocracy dictates conformance to their commands. The commanding leader may be strong in achievement drive, initiative, and emotional self-control, these are countered by a lack of empathy. The pacesetting leader’s objective is performance and exemplification to an exceptionally high standard. While the pacesetting leader may be highly conscientious, achievement-oriented and highly initiative, they are generally highly critical and tend to micromanage or take over from subordinates instead of helping them to reach the high standard (Goleman, 2000, 2001a; Goleman et al., 2002). The most effective leaders integrate four or more of the six styles regularly, switching to one that is most appropriate for the situation (Goleman, 2001a). This presents the question of how do these leadership styles fit within the current leadership theory?
EI-BASED LEADERSHIP’S FIT WITHIN CURRENT LEADERSHIP THEORY Neither Goleman et al., (2002) nor Caruso et al. (2002) specifically align their EI-based leadership models within the commonly accepted leadership models such as those presented by Yukl (1994), Burns (1978), and Bass (1990). Caruso et al. (2002) consider EI as an underlying component of leadership functions that facilitates effective leadership practice. George (2000) proposes that from an ability model position, EI-based leadership is based on no specific leadership theory, but instead has its roots in a variety of theoretical traditions. However, Goleman et al.’s (2002) model of EI-based leadership draws the strongest explications towards particular leadership theories, specifically, the transformational/transactional leadership model. The complementary transformational/transactional leadership model (Bass, 1990) is the general framework used for examining the empirical relationships between emotional intelligence and effective leadership (Gardner & Stough, 2002). Burns (1978) distinguishes the transformational leader as one who raises the needs and motivations of followers and promotes change/development in individuals, groups and organisations, and the transactional leader as one who meets subordinates’ current needs by focus on extrinsically motivated based exchanges (Gardner & Stough, 2002). Bass (1990) defines the transformational leader as “one who arouses awareness and interest in the group or organisation, increases the confidence of the individuals or groups, and attempts to move the concerns of subordinates to achievement and growth rather than existence” (Gardner & Stough, 2002, p. 68). Bass’s (1990) concept of transformational leadership is fundamentally driven by a leader’s emotional intelligence as each factor represents the emotional competencies of Goleman’s (1998b) models, and the abilities of Caruso et al.’s (2002) model. Bass (1990) proposes that transformational leadership is characterised by four factors termed the “four I’s”: (1) idealized influence; (2) inspirational motivation; (3) intellectual stimulation; and (4) individualized consideration (Bass, 1990; Sivanathan & Fekken, 2002). Applying the transformational leadership model to Goleman et al.’s (2002) typology of effective EI-based leadership styles, it is evident that the visionary, affiliative, democratic, and coaching styles are the most complicit within transformational theory. Contrastingly, transactional leadership theory (see Bass, 1990; Burns, 1978; Yukl, 1994) which proposes a leader-member exchange relationship of need fulfilment for performance, is most strongly complicit with the commanding and pace-setting styles of Goleman et al.’s (2002) leadership typology. Empirical research supports the current hypotheses surrounding the superiority of transformational versus transactional models and Bass (2002) reports that extensive empirical evidence finds significant correlations between ‘transformational’ leadership theory and the ‘traits’ of emotional intelligence. McKoll-Kennedy and Anderson (2002) found that employee perceptions of a highly transformational leadership style are positively correlated to directly increasing a subordinate’s optimism, and consequentially, indirectly increasing their performance. Comparatively, subordinate’s perceptions of a low level of transformational leadership are related to high levels of frustration and negative influence on the workers’ performance. Pirola-Merlo, Hartel, Mann and Hirst (2002) report from their study of leadership influence on affective events, team climate and performance, that transformational leadership through effective management of the teams’ affective climate (based on EI skills) is positively correlated to positive team performance. They conclude that leaders need to focus on developing emotion management skills, demonstrating emotional awareness, regulation, and intelligence, and in doing so, may exact superior performance from their teams. While empirical evidence supports Gardner and Stough’s (2002) proposition that transformational leadership style is considered to be more effective than transactional style. Goleman et al.’s (2002) final proposition that the emotionally intelligent leader integrates four or more of the leadership styles and operates them based on the situation, is largely reflective of the transformational/transactional paradigm’s extension to the situational approach to leadership (see Bass, 1990; Burns, 1978; Yukl, 1994). Fundamentally, based on this premise, Goleman et al.’s (2002) theory is that the emotionally intelligent leader’s ability to effectively perceive, use, manage, and understand their own and their followers emotions, consequentially facilitates their reading of the situational factors and subsequent leadership style adjustment from one of the six types, will determine the effectiveness, or resonance, of their leadership. Effectively, they have the ability to use the positive factors of both transformational and transactional styles.
EMPIRICAL EVIDENCE AND SUPPORT A growing body of empirical support is building for the case of emotional intelligence and its positive relationship with leadership. In a study on competence models drawn from 121 organisations worldwide by Goleman (1998b), it was found that 67 percent of the abilities regarded as essential for effective performance were emotional competencies. In a similar study, Chen, Jacobs and Spencer (1998, cited in Fatt, 2002) found that emotional competencies were 53 percent more frequent in organisational ‘star performers’ than other competencies, such as cognitive competencies, which only rated 27 percent. Cavallo & Brienza (2000) conducted a study on 358 managers across the Johnson & Johnson Consumer & Personal Care Group globally to distinguish leadership competencies of successful performers from low performers. 1400 employees were also surveyed to measure perceived successful leadership competencies, particularly those of emotional intelligence. A strong relationship was found between superior performing leaders and emotional competence, which suggests that emotional intelligence is a distinguishing factor in effective leadership (Cavallo & Brienza, 2000). Recent empirical studies (Barling, Slater, & Kelloway, 2000; Gardner & Stough, 2002; Palmer, Walls, Burgess, & Stough, 2001; Sivanathan & Fekken, 2002) have all demonstrated that EI-based leadership is most strongly related to effective transformational leadership style and that emotional intelligence is a fundamental causal-factor of effective transformational leadership.

VOLUME NO. 3 (2013), ISSUE NO. 08 (AUGUST) ISSN 2231-5756
INTERNATIONAL JOURNAL OF RESEARCH IN COMMERCE, IT & MANAGEMENT A Monthly Double-Blind Peer Reviewed (Refereed/Juried) Open Access International e-Journal - Included in the International Serial Directories
http://ijrcm.org.in/
87
Barling et al. (2000) and Palmer et al. (2001) suggest that the higher the level of emotional intelligence a leader has, predisposes them to use transformational behaviours. Based on the concept of idealised influence from Bass (1990), these authors suggest that because leaders act as role models for their followers, the leaders ability to understand and manage their emotions and display self-control strongly effects the followers’ trust and respect. Barling et al. (2000) and Palmer et al. (2001) also propose that leaders who are competent at understanding emotions are more likely to have better perceptions of followers’ expectations, and thus more effective at using inspirational motivation (Gardner & Stough, 2002). Thirdly, an emotionally intelligent leader’s ability to manage emotions and relationships results in greater individualised consideration as they are more able to understand and react to followers’ needs (Barling et al., 2000; Gardner & Stough, 2002; Palmer et al., 2001). In their study of 49 managers, Barling et al. (2000) found that emotional intelligence is positively related to three components of transformational leadership (idealised influence, inspirational motivation, and individualised consideration) and one component of transactional leadership, contingent reward. Further supporting the case for emotional intelligence’s relationship with transformational leadership, they also found that EI is not a component of laissez-faire leadership (see Yukl, 1994) or the two other components of transactional leadership: management-by-exception active and management-by-exception passive (Barling et al., 2000; Gardner & Stough, 2002). Emotional intelligence and inspirational motivation were the most strongly correlated and suggests the importance of the EI dimension in understanding emotions for effective leadership (Barling et al., 2000; Gardner & Stough, 2002). Palmer et al.’s (2001) study of 43 managers found that the leaders’ ability to both manage and monitor their own and others emotions were both significantly correlated with the inspirational motivation and individualised consideration components of transformational leadership (Gardner & Stough, 2002; Palmer et al., 2001). Significant correlation was also found between the ability to monitor own and others’ emotions with the transformational leadership components of idealised attributes and idealised behaviours, which when combined reflect charisma (Gardner & Stough, 2002; Palmer et al., 2001). Extending Palmer et al’s (2001) methodology and studying 110 senior level managers, Gardner and Stough (2002) found that EI correlated highly with all components of transformational leadership and the strongest correlation was found between individual consideration and understanding emotions external (Gardner & Stough, 2002). A positive relationship between contingent rewards and emotional intelligence was found, but no correlations were found between other components of transactional leadership and emotional intelligence (Gardner & Stough, 2002). They conclude that leaders with the ability to manage positive and negative self, and others’ emotions are more able to articulate a strategic vision, talk optimistically, provide encouragement and meaning, stimulate in others new ways of doing things, encourage expression of new ideas and resolve problems constructively (Gardner & Stough, 2002). In sum, a leader’s emotional intelligence is important in enabling them to take advantage of and use their positive emotions to facilitate and induce organisational performance (Gardner & Stough, 2002). A major criticism of these three studies is that they all used self-reported data as the basis of their studies. Sivanathan and Fekken (2002) address this issue by using self-other reporting where subordinates and superiors rated leadership behaviours and effectiveness and emotional intelligence was rated by the leaders themselves. Supporting their hypotheses, Sivanathan and Fekken (2002) found that leaders reporting greater emotional intelligence were perceived by the subordinates as displaying greater transformational behaviours, and additionally, as more effective. These findings replicate Barling et al.’s (2000) and Palmer et al.’s (2001) findings and supports Goleman’s (1996; 1998b) propositions (Sivanathan & Fekken, 2002).
CONCLUSION The emotional intelligence paradigm is relatively new and its transposition into management theory provides some exciting areas for future study, especially within the realms of human capital development, and specifically, leadership development. Leading on from this paper, this author considers two areas of study for future consideration: a thorough review of the concept of emotional contagion and its normative implications for management theory, and a comprehensive literature survey examining the fit of EI-leadership competencies within those already held as fundamental within current leadership theory. It must be noted that the empirical support for EI-based leadership is still only minor and further rigorous and wider study is required before it can be fully considered a dominant model of leadership. However, the empirical evidence offered in this review does provide support for the contention that EI-based leadership is proving to be more effective than other models of leadership and is resulting in better performance. This paper has brought the EI-based leadership model within the bounds of current leadership theory by demonstrating the empirical relational linkage of its traits/competencies/abilities with the practices of transformational versus transactional and laissez faire leaders. Both the Ability model and the Competency model provide thorough and rigorous models for examining EI and its empirical effects, relationships and consequences. By possessing or gaining the emotional intelligence abilities and competencies, and using them as the basis of organizational leadership, it is proposed that these leaders will be more effective.
REFERENCES 1. Arthur, J. B. (1994). Effects of Human Resource Systems on Manufacturing Performance and Turnover. Academy of Management Journal, 37(3), 670-687. 2. Bass, B. M. (1990). Bass & Stogdill's Handbook of Leadership: Theory, Research, and Managerial Applications (3rd ed.). New York: The Free Press. 3. Bass, B. M. (2002). Cognitive, Social, and Emotional Intelligence of Transformational 4. Goleman, D. (1996). Emotional Intelligence. London: Bloomsbury. (December), 93-102. 5. Goleman, D. (1998b). Working With Emotional Intelligence. London: Bloomsbury. 6. Goleman, D. (2000). Leadership That Gets Results. Harvard Business Review(March-April), 78-90. 7. Goleman, D. (2001a). An EI-Based Theory of Performance. In D. Goleman (Ed.), The Emotionally Intelligent Workplace: How to Select for, Measure, and
Improve Emotional Intelligence in Individuals, Groups, and Organizations (pp. 27-44). San Francisco: Jossey-Bass. 8. Salovey, P., & Mayer, J. (1990). Emotional Intelligence. Imagination, Cognition & Personality, 9, 185-211. 9. Sivanathan, N., & Fekken, G. C. (2002). Emotional Intelligence, Moral Reasoning and Transformational Leadership. Leadership & Organization Development
Journal, 23(4), 198-204. 10. Wolff, S. B., Pescosolido, A. T., & Druskat, V. U. (2002). Emotional Intelligence as the Basis of Leadership Emergence in Self-Managing Teams. The
Leadership Quarterly, 13, 505-522. 11. Yukl, G. (1994). Leadership In Organizations (3rd ed.). Englewood Cliffs, NJ: Prentice Hall.

VOLUME NO. 3 (2013), ISSUE NO. 08 (AUGUST) ISSN 2231-5756
INTERNATIONAL JOURNAL OF RESEARCH IN COMMERCE, IT & MANAGEMENT A Monthly Double-Blind Peer Reviewed (Refereed/Juried) Open Access International e-Journal - Included in the International Serial Directories
http://ijrcm.org.in/
88
IMPACT OF INFLATION ACCOUNTING ON FINANCIAL STATEMENTS AND EARNING PER SHARE
MONIKA KHEMANI ASST. PROFESSOR
DEPARTMENT OF COMMERCE SHYAM LAL COLLEGE
DELHI UNIVERSITY NEW DELHI
ABSTRACT
Inflation is a common phenomenon in developing countries like India. Recently its influence on financial statements has increased on account of constant decline in purchasing power of money. The primary objective of accounting is to make financial statements give a true and fair view and such an objective is marred if the impact of changing value of money is not considered in the accounts. Inflation accounting is of utmost importance during depreciating value of money. Historical Cost Accounting (HCA) doesn’t give a correct view and the profit is either understated or overstated and so is the financial position. The purpose of this study is to address the impact of inflation on financial statements and Earning Per Share (EPS) for improving the confidence of the shareholders and credibility of the financial statements.
JEL CODE M 41
KEYWORDS Earning Per Share, Historical Cost Accounting, Inflation Accounting, and Purchasing Power of Money.
INTRODUCTION nflation is defined as an increase in the price of a basket of goods and services that is representative of the economy as a whole. It has negative effects in social structure of a country as it affects all components of the economy. Inflation is a macroeconomic phenomenon that captures the decrease in purchasing power of a currency unit over time because of a general increase in the prices of goods and services (Beaver & Landsman, 1983). Financial
statements are one of the most important tools in giving information about the enterprises to the business environment. The accounting information must assist managers, investors and other stakeholders in making decisions to use resources efficiently and effectively in the enterprise’s operations in the furtherance of its profit goals. It must also provide appropriate information to assist stakeholders in evaluating the profit performance and financial position of the enterprise resulting from the use of those resources (Barton, 2000). The information provided in financial statements has to be understandable, relevant, reliable and comparable (Mirza, 2002). To have these characteristics in the financial statements, the accounting data have to be produced according to the accounting theory (generally accepted accounting principles and accounting standards) and reported according to the accounting practices (reporting system and uniform account plan). Information derived by accounting is vital in decision-making. The usefulness of conventional financial reports based on the assumption of a stable monetary unit has become the subject of debate. The assumption of stable monetary unit is neither accurate nor realistic. Historic cost does not reflect the 'value to the business' of the assets used and owned, nor does it show the correct profit figure, or indicate the real growth of the business. It is argued that the conventional accounting reporting system does not adequately accommodate the economic reality of price changes, and that the impact of price changes on business needs to be recognized if financial reporting is to be useful for decision- making. In hyperinflationary economies, these statements are far away from reflecting the financial position and performance of the enterprises. These statements cannot meet the expectations of a wide range of users of these financial statements. The analysis of these statements cannot generate useful information in making economic decisions by shareholders, creditors, investors etc. The financial statements should be restated in hyperinflationary economies. India is one of the countries that lived with high inflation rates during the past many years. Therefore, many writers have emphasized the need to adjust company accounts to reflect changes in price-levels. In most of the countries, primary financial statements are prepared on the historical cost basis of accounting (Whittington, Singh and Saporta, 1997) without regard either to changes in the general level of prices or to increases in specific prices of assets. In a hyperinflationary economy, reporting of operating results and financial position in the local currency without restatement is not useful. Money loses purchasing power at such a rate that comparison of amounts from transactions and other events that have occurred at different times, even within the same accounting period, is misleading. Ever since the German hyperinflation of the 1920’s, accountants have noted that high inflation causes historical cost accounting measures of income and wealth to become virtually useless (Diewert, 1998). It is also known that, in the latter half of the twentieth century, one of the greatest controversies in accounting theory and practice concerned the limitations of conventional historical cost accounting. Financial Accounting Standards Board (FASB, 1979) stated three reasons as to why the effects of changing prices should be measured and disclosed in financial statements: a. The effects depend on the transactions and circumstances of an enterprise and users do not have detailed information about those factors; b. Effective financial decisions can take place only in an environment in which there is an understanding by the general public of the problem caused by changing prices; that understanding is unlikely to develop until business performance is discussed in terms of measures that allow for the impact of changing prices; c. Statements by business managers about the problems caused by changing prices will not have credibility until specific quantitative information is published about those problems. The FASB Concepts Statement No. l (1978), Objectives of Financial Reporting by Business Enterprises, states that "financial reporting should provide information to help investors, creditors, and others assess the amounts, timing, and uncertainty of prospective net cash flows into the enterprise" Arnold, Boyle, Carey, Cooper and Wild (1991) stated that "financial reports must now meet the wider need of informing present and future economic decisions. This is not the purpose for which the historical cost model was designed, and it is an objective which it is unlikely to achieve". The amount originally paid to acquire the asset is its historical cost. This amount may be different from what we have to pay today to replace it. Especially in hyperinflationary economies, the difference between these two amounts (for example for fixed assets) will be considerable. As a result of this situation, the degree of the reliability, the comparability and the relevance of the accounting data and financial statements will decrease. The financial statements will not reflect the financial and economic position and the result of the operations of the enterprise truly. These incorrect and insufficient data will not meet the requirements of the internal and external users of the information. For example; the managers could not make true decisions for providing a long life for the enterprise, the investors in capital markets could make wrong investment decisions, the creditors could give credits to insufficient companies and these credits could not turn back, the government could not collect taxes in a fair and equitable way and also in long term. In a hyperinflationary economy, reporting of operating results and financial position in the local currency without restatement is also not useful. It is generally accepted that accounting systems ought to be financial measurement and communication systems which provide useful information about the enterprises to various users of the information (Barton, 2000).
I

VOLUME NO. 3 (2013), ISSUE NO. 08 (AUGUST) ISSN 2231-5756
INTERNATIONAL JOURNAL OF RESEARCH IN COMMERCE, IT & MANAGEMENT A Monthly Double-Blind Peer Reviewed (Refereed/Juried) Open Access International e-Journal - Included in the International Serial Directories
http://ijrcm.org.in/
89
In this sense, accounting has often been called as the language of business (Combarros, 2000). It is basically about collecting, organizing and reporting the financial data and finally analyzing the financial reports particularly the financial statements. Under HCA the amounts are recorded by business at the price at which they are acquired and there will be no change in their values even if the market values of such assets change. The most significant and persistent complaint about published financial statements in recent years has been that they do not recognize the economic facts of life. In most countries, primary financial statements are prepared on the historical cost basis of accounting without regard to changes in the general level of prices. HCA is all right, if monetary unit is stable and there is no erosion in its value as a result of inflation. Inflation refers to state of continuous rise in prices. It brings downwards changes in the purchasing power of money unit. Thus, financial statements prepared without taking into account the change in purchasing power of the monetary unit lose their significance. Inflation accounting is a system of recording all transaction on their current market price which is calculated by price index.” Inflation is a reality throughout the world. Yet its effects go unrecognized in financial statements prepared in accordance with generally accepted accounting principles in most of the countries. Ignoring general price level changes in financial reporting creates distortions in financial statements such as: 1. Reported profits may exceed the earnings that could be distributed to shareholders without impairing the company’s ongoing operations. 2. The asset values of inventory, equipment and plant do not reflect their economic value to the business. 3. Future earning is not easily projected from historical earnings. 4. The impact of price changes on monetary assets and liabilities is not clear. 5. Future capital needs are different to forecast and may lead to increased leverage, which increases the business’s risk. 6. When real economic performance is distorted, these distorted lead to social and political consequences that damage business. In periods of unstable prices, accounts prepared under the Historical Cost convention are considered to suffer from serious deficiencies described by the Accounting Standards Committee (ASC, 1986) as follows: 1. reported results may be distorted as a result of the matching of current revenues with costs incurred at an earlier date. The full distribution of profits calculated on that basis may result in the distribution of sums needed to maintain capital; 2. the amounts reported in a balance sheet in respect of assets may not be realistic, up to date measures of the resources employed in the business; 3. as a result of (1) and (2), calculations to measure return on capital employed may be misleading; 4. because holding gains or losses attributable to price level changes are not identified, management's effectiveness in achieving operating results may be concealed; 5. there is no recognition of the loss that arises through holding assets of fixed monetary value and the gain that arises through holding liabilities of fixed monetary value; and, 6. a misleading impression of the trend of performance over time may be given because no account is taken of changes in the real value of money. FASB (1979) issued Statement of Financial Accounting Standards No. 33 (FAS 33), 'Financial Reporting and Changing Prices'. This statement requires mandatory supplementary information pertaining to the effects of changing prices on business operations to improve the relevant information content of financial statements. In UK, the standard on inflation accounting is SSAP 16 (Statement of Standard Accounting Practices no. 16). SSAP 16 requires current cost income statement and current cost balance sheet. Thus it can be seen that inflation accounting is widely practiced around the world. Keeping in view of these facts, the Institute of Chartered Accountants of India (ICAI) issued a guidance note on accounting for changing prices in 1982, in the hope that it will stimulate thought and encourages a wider use of the method of accounting for incorporating price level changes. It advocated the adoption of current cost accounting (CCA) method for incorporating the price level changes. But there is no separate mandatory accounting standard for inflation accounting in India. Accounting, as it has come to be developed over the centuries, uses historical costs as the basis for income measurement and asset valuation. However, during seventies when a high rate of annual inflation had become a way of life in many countries including India, it was felt that the historical cost information should be supplemented by adequate information reflecting the effects of inflation on an enterprise. Consequently, accountants all over the world had made determined efforts to develop suitable methods for measuring the impact of changing prices on the profitability and financial condition of an enterprise. Various methods had been developed - two of them, current purchasing power accounting (CPPA) method and CCA method had gained wide exposure. The 'Guidance Note on Accounting for Changing Prices' considers the need and methods of accounting for changing prices in depth and encourages a wider use of methods of accounting for changing prices for preparation and presentation of information reflecting the effect of changing prices as a supplementary information.
REVIEW OF LITERATURE Sweeney (1936) proposed a systematic recognition of price level changes to adjust for the distortion caused by changes in the purchasing power of money. He developed a technique which is referred to as stabilised accounting, which is the antecedent of constant purchasing power (CPP) accounting. He provided detailed descriptions and numerical examples of how to stabilise either historical costs or replacement costs by adjusting for general price level movements. His preferred approach was to apply the CPP adjustment to replacement cost values rather than Historical Cost values, as this took account of both specific and general price level changes. His publication went on to influence substantially later work, including, Accounting Research Study number six, Reporting the Financial Effects of Price Level Changes, and current purchasing power in the United States. Sweeny’s publication failed to receive the attention because the problem of inflation accounting was superseded by the problem of recession and was rejected by Griffith (1937) on the grounds that it was impossible to determine which price index should be used. Accounting Principles Board (APB, 1969) stated that the effects of inflation on a business enterprise and on its financial statements depend on the change in the general price level and the composition of its assets and liabilities. Since money loses its purchasing power during inflation, assets which are held as monetary amounts, like cash and accounts receivable, decline in real value. On the other hand, non-monetary assets like plant, equipment, and inventory appreciate in nominal terms. The same effects are valid for monetary and non-monetary liabilities. FASB (1979) has a standard on inflation accounting, SFAS 33, which stated that there is an urgent need for enterprises to provide information about the effects on their activities of general inflation and other price changes. It believes that users' ability to assess future cash flows will be severely limited until such information is included in financial reports. It was widely believed that inflation accounting data would improve the predictive ability of accounting measures. It also recommended that the inflation accounting data should be presented in supplementary statements, as it felt users understanding of this data might be enhanced if they were able to compare it with the Historical Cost Accounting measurements included in the primary statements. Bierman (1981) found that historical cost statements are based on accounts measured in dollars which have different levels of purchasing power. CPPA converts these into money amounts with the same purchasing power. Purchasing power of money is determined at a certain point in time through the use of price indices. The overall objective of the method is to determine the real changes in the well-being of the business and to exclude all effects resulting from the fluctuations in the value of money which do not represent real changes in financial position of a business. Greek Management Association (1982) stated that in Greece, as in most non industrialized countries, inflation accounting research is non-existent. In spite of the fact that inflation rates over the last fifteen years were high and varied from 15 percent to 32 percent, neither the State nor the accounting profession has managed to introduce an acceptable system of monetary correction. Instead, the State has allowed businesses to revalue certain depreciable assets at a predetermined price index. So far, no research has been conducted on the impact of the price indexing policy upon the information contents of the financial statements published. Tisshaw (1982) stated that the investor is regarded as the most skilled and dynamic of all users, and their needs subsume those of most other user groups. Thus, the issue of relevance is particularly important to this category of users. For this reason, this study focuses on this user group to evaluate the utility of inflation accounting data. He, in his valuation study, found a positive association between dividends and share values. These findings can be explained by investors viewing dividends as a return on their investment. In addition, he asserted that investors have a preference for immediate income due to their desire to reduce uncertainty.

VOLUME NO. 3 (2013), ISSUE NO. 08 (AUGUST) ISSN 2231-5756
INTERNATIONAL JOURNAL OF RESEARCH IN COMMERCE, IT & MANAGEMENT A Monthly Double-Blind Peer Reviewed (Refereed/Juried) Open Access International e-Journal - Included in the International Serial Directories
http://ijrcm.org.in/
90
Cross (1982) pointed out, since inflation affects companies differently, the accounting measurement errors will not be systematic across companies. Therefore, financial reports which ignore the impact of inflation undermine the utility of reported income and balance sheet totals. This led to criticism of conventional reporting practices. Tweedie and Whittington (1984) stated that the greatest contribution that reporting the financial effects of price level changes made was to make know the actions that various corporations had undertaken with regard to price level changes. Many organizations were found to have altered not necessarily the primary financial statements but the information given to users as a whole, so as to deal with the effect of price level changes. Although, the methods had varied, they all had one common objective, to account adequately for movements in the general level of prices, and accurately measure vital information. To ignore the effects of inflation was considered to be impractical particularly when considering that decision making in business matters is a constant process; past decisions are under constant review in the light of current circumstances. No manager, or investor, or other interested party can find useful accounts which reflect the prevailing economic circumstances only once every twenty years. The Accounting Standards Committee (ASC, 1986) commented that dividend payments, investment and financing decisions, and pricing and pay policies should not be decided upon without taking account of the effects of changing prices. Some companies have attempted to compensate for the imperfections of Historical Cost Accounting by adopting modified Historical Cost accounts, under which certain assets are included in the balance sheet at revalued amounts. However, most of these companies undertake revaluations comparatively infrequently and do not revalue all their assets. Thies and Sturrock (1987) conducted a research over a sample of 50 large manufacturing firm using replacement cost data for the period 1977-1983. The findings showed that rankings of historical cost based financial ratios did not match well with rankings of replacement cost-based ratios. The data also indicated that historical cost based financial ratios often grossly misrepresent the relative financial strengths of companies. Okumus (2002) evaluated the effect of inflation on measures of profitability in Turkish Banking. In his paper, profitability ratios based on pre inflation and post inflation adjusted financial statements, are compared for the Turkish banking industry over the period 1989-1995. It appears that inflation adjustment, based on the Current Purchasing Power procedure, decreased the level profitability and altered the ranking of profitability ratios by bank groups significantly. This reflects the importance of considering the potentially distorting effects of inflation. Karapinar and Zaif (2005) did the first empirical study on the effects of inflation on financial ratios. In their study, they examined the effects of inflation accounting practice on companies’ financial ratios. Their sample covered the 73 non-financial companies listed Istanbul Stock Exchange as of 2003. The ratios were calculated on both historical and adjusted numbers of financial statements to form two sets of ratios. Results showed that there was no significant change in liquidity, financial, profitability and activity ratios except fixed asset turnover ratios. Akdoğan, Aktas and Unal (2009) extended the number of companies in the sample of Karapınar and Zaif. The results covering 146 companies were consistent with the findings of Karapınar and Zaif’s study. Their results revealed that a statistically significant change for the whole sample occurs only on Total Assets Turnover. Other ratios did not show any considerable difference.
IMPORTANCE OF THE STUDY Inflation accounting is a methodology proposing to restate the books at current purchasing power and is of high importance during price increase. It requires statements to be adjusted according to price indices, rather than relying on historical cost. Companies operating in countries like India, where inflation is very high should update their statements periodically to make financial data relevant to current economic and financial conditions. A great deal of research has focused on inflation accounting and few consistent conclusions have yet to be reached about the antecedents and outcomes of inflation accounting. This research study establishes that the value of financial reporting will improve and thereby boosting the decision making abilities of the multiple users apart from enhancing the standing of financial statements. The basic aim of this research paper is to see the difference in overall profitability and EPS under historical cost and inflation accounting.
OBJECTIVES OF STUDY The following objectives are formulated for the present study: 1. To ensure a true and fair view of the financial statements in terms of operating results and financial position of the business. 2. To conceptualize the CPP method through which financial accounts can be adjusted for changing prices. 3. To review the conceptual framework within which the utility to the investors of accounting data in general, and inflation accounting data in particular,
might be evaluated. 4. To identify the impact of inflation accounting on the credibility and fairness of the financial statements. 5. To study the resultant differences in EPS based on adjusted and historical financial data.
CURRENT PURCHASING POWER (CPP) METHOD AND FINANCIAL STATEMENTS In the tables given below the author has done a study of a private company based on hypothetical financial data for studying the impact of inflation on its profitability and EPS. It is evident in the given case study the real profit is halved under inflation accounting so is the EPS (Please refer to annexure given at the end of the study).
CONCLUSION To conclude, inflation is inevitable and there is need to revamp existing accounting practices negating its impact on the financials of the companies. Financial Statement is of utmost importance to various stakeholders like external agencies and owners of the company and should assist various parties in evaluating the business and decision making. Financials lose its vigour in the period of rising prices as the value of money is eroded and the basic objective of maximization of wealth of shareholders is defeated. Inflation accounting has the philosophy of keeping the value of money intact and is of quite significance in the case of rising prices as the results based on historical accounting are misleading and actually undermine the profitability and shareholders’ value. Inflation accounting should be mandatorily followed and relevant accounting standard should be mandatorily followed by corporate bodies. Financial Statements should be unfazed with the movement in prices and inflation accounting is a tactic to combat the depreciating value of money and boost the confidence of investors.
RECOMMENDATIONS FOR FUTURE RESEARCH The present research paper focuses on the theoretical framework behind inflation accounting and its related application. The author recommends for future research on the following lines: 1. To study the impact of restated financials of listed companies on their EPS and related market capitalization in comparison with historical accounting. 2. To corroborate the impact of inflation on erosion of shareholders’ equity of select companies. 3. Studying stock price of listed companies as true index of economy driven by real purchasing power of money. 4. Develop explicit plans to diffuse the impact of inflation on accounting. 5. Making Indian Accounting Standard 29 mandatory for Indian Companies.
REFERENCES 1. Accounting Principles Board (APB, 1969) Statement No. 3, General Price-Level Financial Statements.Accounting Standards Committee (1980), ‘SSAP 16:
Current Cost Accounting’, Statement of Standard Accounting Practice, London: ASC. 2. Accounting Standards Committee (1986). Accounting for the Effects of Changing Prices: A Handbook, London: ASC, 11-13.

VOLUME NO. 3 (2013), ISSUE NO. 08 (AUGUST) ISSN 2231-5756
INTERNATIONAL JOURNAL OF RESEARCH IN COMMERCE, IT & MANAGEMENT A Monthly Double-Blind Peer Reviewed (Refereed/Juried) Open Access International e-Journal - Included in the International Serial Directories
http://ijrcm.org.in/
91
3. Akdoğan N., Aktas R. & Unal S., (2009), “Effect of Inflation Accounting on Financial Ratios: An Empirical Analysis of Non-Financial Firm Listed on Istanbul Stock Exchange”. The ICFAI University Journal of Accounting Research , 2, 47-62.
4. Arnold, J., Boyle, P., Carey, A., Copper, M. & Wild, K. (1991). The Future Shape of Financial Reports, London: ICAE&W, & ICAS, 14. 5. Barton, Allan (2000) “Reflections of an Australian Contemporary: The Complementary of Entry and Exit Price Current Value Systems”, ABACUS, 36( 3), 298-
312. 6. Beaver, W. & Landsman, W. (1983). “Incremental Information Content of Statement 33.Disclosures.” FASB Research Report, Stamford, Connecticut. 7. Bierman, H., (1981) Financial Management and Inflation, The Free Press, New York. 8. Combarros, José Luis López (2000) “Accounting and Financial Audit Harmonization in the European Union”, European Accounting Review, 9(4), 643 – 654. 9. Cross, S. M. (1982). Economic Decisions under Inflation: The Impact of Accounting Measurement Errors, Greenwich, CT: JAI Press, 109. 10. Diewert, W. Erwin (1998). “High Inflation, Seasonal Commodities, and Annual Index Numbers”, Macroeconomic Dynamics, 456–471. 11. Financial Accounting Standards Board (FASB, 1978) Concepts Statement No.l , Objectives of Financial Reporting by Business Enterprises, FASB, Stamford. 12. Financial Accounting Standards Board (FASB, 1979). SFAS 33: Financial Reporting and Changing Prices, Stamford, CT: FASB. 13. Greek Management Association (GMA, 1982): Inflation and efficiency (In Greek). Athens:GMA. 14. Griffith, D.K. (1937). "Weakness of index – number accounting", Accounting Review, 12, June, 123-132. 15. Karapinar A. & Zaif F., (2005), “Enflasyon Muhasebesinin Finansal Tablolar Analizine Etkisi, (The Effect of Inflation Accounting on Financial Statement
Analysis)” Yaklaşım Dergisi 26, 49–72. 16. Mirza, Abbas Ali (2002). “Corporate Governance Financial Disclosures”, 19th Session of ISAR, UNCTAD, Geneva, September 25-27, 2002. 17. Okumus, H. S. (2002), “The Effects of Inflation on Measures of Profitability in Turkish Banking ”, 13(2). 18. Sweeny, H. W. (1936) Stabilized Accounting, Holt, Rinehart and Winston (reprint),1964. 19. Thies, C. F., & Sturrock, T. (1987). What did Inflation Accounting Tell Us? Journal of Accounting, Auditing and Finance, 2(4), 375−391. 20. Tisshaw, H. J. (1982). "A study in to the relationship between accounting information and share prices", unpublished Ph .D. dissertation, City University
London, 2. 21. Tweedie, D. & Whittington G. (1984). The Debate on Inflation Accounting, Cambridge University Press. 22. Whittington, G., Singh A. & Saporta V (1997). The Effects of Hyper-Inflation on Accounting Ratios: Financing of Corporate Growth in Industrialising
Economies, Technical Paper3, IFC, Washington.
ANNEXURE Table 1 shows the Balance Sheet of Extrovert Consulting for Financial Years ended on 31st March 2011 and 2012.
TABLE 1
(Amount in Rs.)
As On
31st March 2012
As On
31st March 2011
I. EQUITY AND LIABILITIES
1 Shareholders' Funds
a) Share capital 136,000 136,000
b) Reserves and surplus 39,341,092 30,725,740
c) Money received against share warrants - -
2 Share Application Money Pending for Allotment - -
3 Non-Current Liabilities
a) Long-term borrowings 6,588,544 4,168,177
b) Deferred tax liabilities - -
c) Other long term liabilities 13,298,583 7,189,500
d) Long-term provisions - -
4 Current Liabilities
a) Short-term borrowings - -
b) Trade payables 2,156,525 6,820,059
c) Other current liabilities 8,395,637 8,782,186
d) Short-term provisions 12,846,491 9,542,279
Total 82,762,872 67,363,941
II. ASSETS
1 Non-Current Assets
a) Fixed assets
i) Tangible assets 14,341,769 9,834,216
b) Non-current investments - -
c) Deferred tax assets (net) 146,087 (39,916)
2 Current Assets
a) Current investments 60,000 85,000
b) Inventories - -
c) Trade receivables 24,929,516 28,556,321
d) Cash and cash equivalents 11,750,845 8,244,752
e) Short-term loans and advances 31,534,655 20,683,568
f) Other Current Assets
Total 82,762,872 67,363,941
Extrovert Consulting Private LimitedBalance Sheet as at 31st March 2012
Particulars

VOLUME NO. 3 (2013), ISSUE NO. 08 (AUGUST) ISSN 2231-5756
INTERNATIONAL JOURNAL OF RESEARCH IN COMMERCE, IT & MANAGEMENT A Monthly Double-Blind Peer Reviewed (Refereed/Juried) Open Access International e-Journal - Included in the International Serial Directories
http://ijrcm.org.in/
92
Table 2 calculates the loss on account of monetary items being restated at closing index price 115 and average rate of 107 against the base price of 100. The gain or Loss is the difference between value of net monetary assets at historical cost and at current purchasing price.
TABLE 2
Table 3 shows the calculation of net monetary assets used in Table 2.
TABLE 3
Table 4 brings into account the real profit by following inflation accounting and the related impact on EPS. The data given below indicates the profit has actually gone down from 86 lakhs to 32 lakhs as the inflation has eroded the shareholders wealth and the profit as per historical accounting is overstated. Further consequent to correction in profits the EPS has gone down by Rupees 400 per share which is quite alarming and unfolds the significance of inflation accounting on the business.
INR
Historical C.F. CPP
Net Monetary Assets as
on 31.3.11 32,425,117 1.15 37,288,884
Less Expenses (76,233,863) 1.07 (81,552,504)
Taxes (4,228,090) 1.00 (4,228,090)
Add Sales 92,758,782 1.07 99,230,324
Income 154,417 1.07 165,190
Net Monetary Assets 44,876,363 50,903,805
Net Monetary Assets HC 44,876,363
Difference* 6,027,442
*Stands for Monetary Loss on account of Inflation
Calculation of Monetary Gain (Loss)
31st March
2012
31st March
2011
Current investments 60,000 85,000
Trade receivables 24,929,516 28,556,321
Cash and cash equivalents 11,750,845 8,244,752
Short-term loans and advances 31,534,655 20,683,568
Current Assets 68,275,016 57,569,641
Trade payables 2,156,525 6,820,059
Other current liabilities 8,395,637 8,782,186
Short-term provisions 12,846,491 9,542,279
Current Liabilities 23,398,653 25,144,524
Net Monetary Assets 44,876,363 32,425,117
Statement of Net Monetary Assets

VOLUME NO. 3 (2013), ISSUE NO. 08 (AUGUST) ISSN 2231-5756
INTERNATIONAL JOURNAL OF RESEARCH IN COMMERCE, IT & MANAGEMENT A Monthly Double-Blind Peer Reviewed (Refereed/Juried) Open Access International e-Journal - Included in the International Serial Directories
http://ijrcm.org.in/
93
TABLE 4
Income Statement Comparative as per Historical Cost and CPP Method for the year ended 31st March 2012
(Amount in Rs.)
For The Year Ended
31st March 2012 Factor
For The Year Ended
31st March 2012
I. Revenue from operations 92,758,782 1.07 99,230,324
II. Other income 154,417 1.07 165,190
III. Total Revenue (I +II) 92,913,198 99,395,515
IV. Expenses:
Employee benefits expense 28,413,860 1.07 30,396,222
Financial costs 1,661,008 1.07 1,776,892
Depreciation and amortization expense 3,679,682 1.15 4,231,635
Other expenses 46,158,995 1.07 49,379,390
Total Expenses 79,913,545 85,784,139
V. Profit before exceptional and extraordinary items and tax
(III - IV) 12,999,653 13,611,376
VI. Exceptional items -
VII. Profit before extraordinary items and tax (V - VI) 12,999,653 13,611,376
VIII. Extraordinary items -
IX. Profit before tax (VII - VIII) 12,999,653 13,611,376
14%
X. Tax expense:
1) Current tax 4,507,791 4,507,791
2) Deferred tax (186,003) (186,003)
3) Previous Year Tax 62,514 62,514
XI. Profit/(Loss) for the perid from continuing operations 8,615,352 9,227,074
XII. Loss on Purchasing Power (6,027,442)
XV. Profit/(Loss) for the period (XI + XIV) 8,615,352 3,199,632
XVI. Earnings per equity share:
Basic & Diluted 633 235
Extrovert Consulting Private Limited
Particulars

VOLUME NO. 3 (2013), ISSUE NO. 08 (AUGUST) ISSN 2231-5756
INTERNATIONAL JOURNAL OF RESEARCH IN COMMERCE, IT & MANAGEMENT A Monthly Double-Blind Peer Reviewed (Refereed/Juried) Open Access International e-Journal - Included in the International Serial Directories
http://ijrcm.org.in/
94
A STUDY OF EFFECT OF PERFORMANCE APPRAISAL ON THE ORGANIZATION AND THE EMPLOYEE IN NIDHI TECHNOLOGIES
AVINASH GOYAL ASST.PROFESSOR
GURU NANAK INSTITUTIONS IBRAHIMPATNAM
ABSTRACT
Performance Appraisal has been considered as the most significant an indispensable tool for an organization, for an organization, for the information it provides is highly useful in making decisions regarding various personnel aspects such as promotion and merit increases. Performance measures also link information gathering and decision making processes which provide a basis for judging the effectiveness of personnel sub-divisions such as recruiting, selection, training and compensation. This research will concentrate on examine the effect of the performance appraisal on an individual as well as on the organizations. The sample size of 100 has been chosen from the north Indian states. The data used for the study is primary data collected through the help of questionnaire filled by the samples. The data was evaluated with the help of statistical tools i.e., descriptive statistics, regression, correlation, residual analysis and chi square test. The findings of the research show that there is a noticeable effect of the performance appraisal on the organization as well as on the Individual.
KEYWORDS Performance Appraisal, Organization, Individual, Regression, Correlation, Residual analysis, Chi square test.
1. INTRODUCTION OF THE STUDY erformance appraisal is the process of obtaining, analyzing, and recording information about the relative worth of an employee to the organization. Performance appraisal is an analysis of an employee's recent successes and failures, personal strengths and weaknesses, and suitability for promotion or further training. It is also the judgment of an employee's performance in a job based on considerations other than productivity alone.
Performance' appraisal is a formal structured system of measuring and evaluating an employee’s job related behaviors and outcomes to discover how and why the employee is presently performing on the job and how the employee can perform more effectively in the future so that the employee organization and society all benefit. Performance Appraisal has been considered as the most significant an indispensable tool for an organization, for an organization, for the information it provides is highly useful in making decisions regarding various personnel aspects such as promotion and merit increases. Performance measures also link information gathering and decision making processes which provide a basis for judging the effectiveness of personnel sub-divisions such as recruiting, selection, training and compensation. Accurate information plays a vital role in the organization as a whole. They help in finding out the weaknesses in the primary areas.
Electronic copy available at: http://ssrn.com/abstract=1852017
ADVANTAGES OF PERFORMANCE APPRAISAL It is said that performance appraisal is an investment for the company which can be justified by following advantages: Promotion: Performance Appraisal helps the supervisors to chalk out the promotion program’s for efficient employees. In this regards, inefficient workers can be dismissed or demoted in case. Compensation: Performance Appraisal helps in chalking out compensation packages for employees. Merit rating is possible through performance appraisal. Performance Appraisal tries to give worth to a performance. Compensation packages which include bonus, high salary rates, extra benefits, allowances and pre-requisites are dependent on performance appraisal. The criteria should be merit rather than seniority. Employees Development: The systematic procedure of performance appraisal helps the supervisors to frame training policies and programs. It helps to analyze strengths and weaknesses of employees so that new jobs can be designed for efficient employees. It also helps in framing future development programs. Selection Validation: Performance Appraisal helps the supervisors to understand the validity and importance of the selection procedure. The supervisors come to know the validity and thereby the strengths and weaknesses of selection procedure. Future changes in selection methods can be made in this regard. Communication: For an organization, effective communication between employees and employers is very important. Through performance appraisal, communication can be sought for in the following ways: • Through performance appraisal, the employers can understand and accept skills of subordinates. • The subordinates can also understand and create a trust and confidence in superiors. • It also helps in maintaining cordial and congenial labor management relationship. • It develops the spirit of work and boosts the morale of employees. All the above factors ensure effective communication. Motivation: Performance appraisal serves as a motivation tool. Through evaluating performance of employees, a person’s efficiency can be determined if the targets are achieved. This very well motivates a person for better job and helps him to improve his performance in the future. Following are the tools used by the organizations for Performance Appraisals of their employees. • Ranking • Paired Comparison • Forced Distribution
Electronic copy available at: http://ssrn.com/abstract=1852017 • Confidential Report • Essay Evaluation • Critical Incident • Checklists • Graphic Rating Scale • BARS • Forced Choice Method • MBO • Field Review Technique • Performance Test The present study will investigate the effect of the performance appraisal on the organizations performance and on the employees of the organizations.
P

VOLUME NO. 3 (2013), ISSUE NO. 08 (AUGUST) ISSN 2231-5756
INTERNATIONAL JOURNAL OF RESEARCH IN COMMERCE, IT & MANAGEMENT A Monthly Double-Blind Peer Reviewed (Refereed/Juried) Open Access International e-Journal - Included in the International Serial Directories
http://ijrcm.org.in/
95
2. OBJECTIVES OF THE STUDY • To find out the effectiveness of performance appraisal used by the organizations on the performance of the organization. • To find out the effect of the performance appraisal on the employees. • To critically evaluate the techniques used by the organizations for the purpose of performance evaluation.
3. REVIEW OF LITRATURE Performance appraisal is an analysis of an employee's recent successes and failures, personal strengths and weaknesses, and suitability for promotion or further training.Many researchers have conduct research on this topic as given follows. Number of researchers study the topic of performance appraisal. Eichel and Bender (1984), Levinson (1992) Mbiti (1994), Davis (1995), Edwards & Ewin(1996) Richi (1996),( Wagner and Goffin 1997), Quchi(1997) Strebler(1997); Akinyele and Obamiro (2005), Makiney and Levy (1998) Cascio (1998),Moulder (2001) and Armstrong (2001) did research on performance appraisal in different parts of the world. Eichel and Bender (1984) study an imperial rater method to evaluate the performance of the members of the official family. Levinson (1992) investigate the importance of the processes of identification of the employee with manager . Mbiti (1994) evaluates the human temperaments as the reasons why we need to appraise employees. (Edwards & Ewin, 1996) study the topic 360 Feedback from multiple sources and its effect. ), Richi (1996) appraise a skill- based method of performance management. Quchi (1997) evaluates that many companies in Nigeria conduct performance appraisals, regardless of their level of sophistication. Strebler, 1997; Akinyele and Obamiro 2005) study that Performance appraisal has become a key feature of an organization. Makiney and Levy (1998) evaluate the influence of positive and negative information. Cascio (1998) conducts study on performance appraisal as a process to improve employee’s work . Moulder (2001) investigate the programs and practices of performance appraisal system for employees. Armstrong (2001),evaluates human resource practices and performance appraisal. Eichel and Bender (1984) reveals performance evaluations were designed primarily as tools for the organization to use in controlling employees. He states that past performance was used to guide or justify manager His method of appraisal was subjective, which is still common with EPAS in many agencies today (Vroom, 1990). Levinson (1992) conceals that to help the development of the process of identification it is necessary for the manager to also examine his own process and needs of interacting with the subordinates. He also states several barriers which may come in the way of such legitimate process of identification as; lack of time, intolerance, of mistakes, complete rejection of dependency needs repression of rivalry, and unexamined relationship. Mbiti (1994) uncover employee into four major vegetations and rejecters. Mbiti describes vegetations as people who care for nothing except their pay at the end of the month. They have no initiative; they will take the slightest excuse to be off duty; because this gives them pleasures than writing. They require constant supervision without appraising them; they will try to hide amongst others while they do nothing. it reveals that design an acceptable, easy-to-use but reliable appraisal instrument that helps in improvement and employees development. Davis (1995), disclose that performance management is a joint process that involves both the supervisor and the members of staff, who identify common goals, which correlate to the higher goals of the institution, management’s actions in dealing with the employee and performance appraisal provided the basis for salary, retention, discharge, or promotional decisions. as used to guide or justify management’s actions in dealing with the employee. Davis (1995), finds that If employees are effectively appraised, then the organization will experience increased productivity and improved quality of output and for effective development and utilization of the human talent, performance appraisal plays a key role as it enables an organization to identify objectively the employee’s strengths and weaknesses. (Edwards & Ewin, 1996) reveals that feedback from multiple sources, such as superiors, peers, subordinates and others has a more powerful impact on people than information from a single source, such as their immediate supervisor. Employees view performance information from multiple sources as fair, accurate, credible and motivating. They are more likely to be motivated to change their work habits to obtain the esteem of their co-workers than the respect of their supervisors. Richi (1996) disclose that the skill-based management measures skill and tracks and combines them into job that creates a work environment that allows employees to develop the skills they need to meet business goals descriptions, identifies employee skills gaps and then provides resources to upgrade abilities. Quchi(1997) uncover that get policies and procedures manuals and train the entire organization on target setting, monitoring and review, ( Wagner and Goffin 1997) unearth “that the comparative rating method was more accurate than the absolute rating method and that the global item type results in considerably greater accuracy with respect to [differential accuracy] and [stereotype accuracy] components but specific items were more advantageous in terms of [differential elevation] and [elevation] accuracy” (p. 99). The results of this experiment suggest that comparing employees against one another will yield a more accurate depiction of ones work than rating employees against a set of standards. Strebler, (1997; Akinyele and Obamiro 2005). Uncover the development of integrated performance management system (PMS) based on a competency framework. Makiney and Levy (1998) gathered a group of volunteers, 120, all of whom have participated in performance reviews in the past. The volunteers were given work habits of employees at a bookstore and were then told to create an initial judgment on the employee in question The results of the experiment were not unexpected. “Negatively discrepant information elicited significantly lower ratings than did positively discrepant information” and “that the additional information more strongly influenced performance judgments when the additional information was provided by the peer of the profiled employee, than when the additional information was provided by the profiled employee himself”. Cascio (1998) disclose, it is an inexact, human process that is utilized differently in almost every organization regardless of industry. Moulder (2001) Moulder reveals that appraisals are useful insetting goals and in fostering improved communications among work groups and between employees and supervisors. This study predicts that performance appraisals are valued for defining expectations and measuring the extent to which expectations are met. It states state that appraisals can make clear to employees where they are having success and where they need to improve performance. Armstrong (2001) conceals that performance management provides an integrated and continuous approach to the management of performance thanis provided by traditional performance appraisal schemes. Unlike traditional methods of management by command, performance management is based on the principle of management by agreement. Furthermore, Armstrong (2001) postulates that performance management can provide for an integrated and coherent range of human resource management processes that are mutually supportive and contribute as a whole to increasing organizational effectiveness. Numerous of studies has been done by the researchers on the topic “performance appraisal, considering various aspects in different areas but no body concentrated on “factors like effective tool for development, co-operation and team work and competition” that I have considered and the present research will concentrate on the above said topic.
4. RESEARCH METHODOLOGY In this research, we study the effect performance appraisal on the production of the organization as well as on the employees of the organizations. The sample size of 100 has been chosen for the purpose of study. The sample has been chosen from the North India (Chandigarh, Panchkula, Ambala, Amritsar, Sirhind & Ludhiana).The data used for the evaluation is primary data collected through questionnaire filled by the samples. Following tools are used for data analysis. The mean is a particularly informative measure of the "central tendency" of the variable if it is reported along with its confidence intervals. Mean = (Sxi)/n
Usually we are interested in statistics (such as the mean) from our sample only to the extent to which they can infer information about the population. The confidence intervals for the mean give us a range of values around the mean where we expect the "true" (population) mean is located (with a given level of certainty). The standard deviation is a commonly used measure of variation. The standard deviation of a population of values is computed as: s = [S(xi-m)2/N]1/2 where

VOLUME NO. 3 (2013), ISSUE NO. 08 (AUGUST) ISSN 2231-5756
INTERNATIONAL JOURNAL OF RESEARCH IN COMMERCE, IT & MANAGEMENT A Monthly Double-Blind Peer Reviewed (Refereed/Juried) Open Access International e-Journal - Included in the International Serial Directories
http://ijrcm.org.in/
96
m is the population mean and N is the population size The sample estimate of the population standard deviation is computed as: s = [S(xi-x-bar)2/(n-1)]1/2 where x-bar is the sample mean and n is the sample size The variance of a population of values is computed as: s2 = S(xi-m)2/N where m is the population mean and N is the population size The unbiased sample estimate of the population variance is computed as: s2 = S(xi-xbar)2/n-1 where xbar is the sample mean and n is the sample size Skewness measures the deviation of the distribution from symmetry. If the skewness is clearly different from 0, then that distribution is asymmetrical, while normal distributions are perfectly symmetrical. Skewness = n*M3 /[(n-1)*(n-2)*s3] where
M3 is equal to: S(xi-Meanx)3
s3 is the standard deviation (sigma) raised to the third power
n is the valid number of cases.
Kurtosis measures the "peakedness" of a distribution. If the kurtosis is clearly different than 0, then the distribution is either flatter or more peaked than normal; the kurtosis of the normal distribution is 0. Kurtosis is computed as: Kurtosis = [n*(n+1)*M4 - 3*M2*M2*(n-1)] / [(n-1)*(n-2)*(n-3)*s4] where:
Mj is equal to: S(xi-Meanx) j
n is the valid number of cases
s4 is the standard deviation (sigma) raised to the fourth power
The general purpose of multiple regression is to learn more about the relationship between several independent or predictor variables and a dependent or criterion variable. A line in a two-dimensional or two-variable space is defined by the equation Y=a+b*X; in full text, the Y variable can be expressed in terms of a constant (a) and a slope (b) times the X variable. The constant is also referred to as the intercept, and the slope as the regression coefficient or B coefficient. Multiple regression procedures will estimate a linear equation of the form: Y=a+b1*X1+b2*X2+...+bp*Xp The regression line expresses the best prediction of the dependent variable (Y), given the independent variables (X). However, nature is rarely (if ever) perfectly predictable, and usually there is substantial variation of the observed points around the fitted regression line. The deviation of a particular point from the regression line (its predicted value) is called the residual value. The standardized residual value is the observed minus predicted divided by the square root of the residual mean square. The Mahalanobis distance is the distance of a case from the centroid in the multidimensional space, defined by the correlated independent variables (if the independent variables are uncorrelated, it is the same as the simple Euclidean distance). Thus, this measure provides an indication of whether or not an observation is an outlier with respect to the independent variable values. The deleted residual is the residual value for the respective case, had it not been included in the regression analysis, that is, if one would exclude this case from all computations. If the deleted residual differs greatly from the respective standardized residual value, then this case is possibly an outlier because its exclusion changed the regression equation. Cook’s Distance is another measure of impact of the respective case on the regression equation. It indicates the difference between the computed B values and the values one would have obtained, had the respective case been excluded. All distances should be of about equal magnitude; if not, then there is reason to believe that the respective case(s) biased the estimation of the regression coefficients. Further, chi square test used for check the feasibility of the variables. Chi-square is a statistical test commonly used to compare observed data with data we would expect to obtain according to a specific hypothesis. For example, if, according to Mendel's laws, you expected 10 of 20 offspring from a cross to be male and the actual observed number was 8 males, then you might want to know about the "goodness to fit" between the observed and expected. Were the deviations (differences between observed and expected) the result of chance, or were they due to other factors. How much deviation can occur before you, the investigator, must conclude that something other than chance is at work, causing the observed to differ from the expected? The chi-square test is always testing what scientists call the null hypothesis, which states that there is no significant difference between the expected and observed result.
The formula for calculating chi-square 2) is:
2= (o-e)2/e That is, chi-square is the sum of the squared difference between observed (o) and the expected (e) data (or the deviation, d), divided by the expected data in all possible categories.

VOLUME NO. 3 (2013), ISSUE NO. 08 (AUGUST) ISSN 2231-5756
INTERNATIONAL JOURNAL OF RESEARCH IN COMMERCE, IT & MANAGEMENT A Monthly Double-Blind Peer Reviewed (Refereed/Juried) Open Access International e-Journal - Included in the International Serial Directories
http://ijrcm.org.in/
97
5. FINDINGS & ANALYSIS 1. DESCRIPTIVE STATISTICS
TABLE 5.1
System Organization productivity contribution Managing
Mean 4.51 4.95 4.41 4.43 4.45
Median 5.00 4.00 4.00 4.00 4.00
Mode 5 4 4 4 4
Std. Deviation .503 5.108 .495 .518 .500
Variance .253 26.089 .245 .269 .250
Skewness -.021 9.795 .354 .493 .185
Std. Error of Skewness .243 .243 .243 .243 .243
Kurtosis -2.041 96.924 -1.914 -1.254 -2.007
Std. Error of Kurtosis .481 .481 .481 .481 .481
Table 5.1 shows descriptive statistics of all the variables. In table 5.2 we calculated the mean, median , mode, std deviation, variance, skewness, std error of skewness, kurtosis, and std error of kurtosis. From the table 5.1 we can see that the mean for the variable system is 4.51 and median is 5.00 and mode is 5 and std deviation is .503 and variance is .253 , skewness is -.021 , std error of skewness is .243 , kurtosis is -2.041 and std error of kurtosis is .481.And the results for the other variables you can see from the table 5.1
TABLE 5.2
development cost reward Capabilities co-ordination
Mean 4.01 4.48 4.44 4.18 3.84
Mode 4 4 4 4 4
Std. Deviation .776 .502 .499 .629 .923
Variance .602 .252 .249 .395 .851
Skewness -.687 .062 .227 -.407 -.784
Std. Error of Skewness .243 .243 .243 .243 .243
Kurtosis .505 -2.038 -1.989 .607 -.060
Std. Error of Kurtosis .481 .481 .481 .481 .481
Table 5.2 shows descriptive statistics of all the variables. In table 5.2 we calculate the mean, median, mode, std deviation, variance, skewness, stds error of skewness, kurtosis and std error of kurtosis.From table 5.2 we can see the mean for variable development is 4.01, median is 4.00, mode is 4, std deviation is .776, variance is .602,skewness is -.687, std error of skewness is .243 , kurtosis is .505 and std error of kurtosis is .481.And the results for the other variables you can see from the table.
TABLE 5.3
competition Promotion complex Burden judgement
Mean 4.17 4.51 4.10 4.32 4.32
Median 4.00 5.00 4.00 4.00 4.00
Mode 4 5 4 4 4
Std. Deviation .640 .542 .707 .603 .712
Variance .409 .293 .500 .364 .507
Skewness -.643 -.414 -.853 -.281 -1.083
Std. Error of Skewness .243 .243 .243 .243 .243
Kurtosis 1.505 -1.038 1.537 -.618 1.650
Std. Error of Kurtosis .481 .481 .481 .481 .481
Table 5.3 shows the descriptive statistics of all the variables. From table 5.3 we calculate the mean, median ,mode, std deviation, variance, skewness, std error of skewness, kurtosis , and std error of kurtosis. From the table 5.3 we can see the mean for variable competition is 4.17, median is 4.00, mode is 4 , std deviation is .640, variance is .409,skewness is -.643.std error of skewness is .243. And the result for other variables you can see from the table.
TABLE 5.4
compare performance co-operation ratings SWOT
Mean 4.44 3.33 4.44 4.41
Median 4.00 4.00 4.00 4.00
Mode 4 4 4 4
Std. Deviation .539 .857 .499 .553
Variance .290 .735 .249 .306
Skewness -.174 -.309 .227 -.573
Std. Error of Skewness .243 .243 .243 .243
Kurtosis -1.152 -.950 -1.989 1.605
Std. Error of Kurtosis .481 .481 .481 .481
Table 5.4 shows the descriptive statistics of all the variables. From table 5.4 we calculate the mean, median, mode, std. deviation, variance, skewness, std error of skewness, kurtosis, std error of kurtosis. From table 5.4 we can see the mean for variable performance is 4.44, median is 4.00 and mode is 4, std deviation is .539, variance is .290, skewness is -.174, std error of skewness is .243, kurtosis is -1.152, std error of kurtosis is .481.And the result for other variables you can see from the table.

VOLUME NO. 3 (2013), ISSUE NO. 08 (AUGUST) ISSN 2231-5756
INTERNATIONAL JOURNAL OF RESEARCH IN COMMERCE, IT & MANAGEMENT A Monthly Double-Blind Peer Reviewed (Refereed/Juried) Open Access International e-Journal - Included in the International Serial Directories
http://ijrcm.org.in/
98
TABLE 5.5
grievances Methodology
Mean 3.82 4.54
Median 4.00 4.00
Mode 4 4
Std. Deviation 1.004 5.167
Variance 1.007 26.700
Skewness -.490 9.695
Std. Error of Skewness .243 .243
Kurtosis -.788 95.600
Std. Error of Kurtosis .481 .481
Table 5.5 shows the descriptive statistics of all the variables. From the table 5.5 we calculate the mean, median, mode, std deviation, variance, skewness, std error of skewness, kurtosis, std error of kurtosis. From the table we can see the mean for variable grievances is 3.82,median is 4.00, mode is 4, std deviation is 1.004, variance is 1.007, skewness is -.490, std error of skewness is .243 ,kurtosis is -.788, std error of kurtosis is .481. And the result for other variables you can see from the table. CORRELATION ANALYSIS
CORRELATIONS
syste m
orga nisat ion
prod uctiv ity
Cont ribu tion
man agin g
deve lop men t
cost
rewa rd
capa biliti es
co- ordi nati on
com petit ion
pro moti on
com plex
burd en
Judg eme nt
com pare perf orm ance
co- oper artio n
ratin gs
SW OT
grie vanc es
met hod olog y
Syst em 1.00
-0.08
-0.03
0.01
-0.03
0.17
0.11
0.15
-0.04
0.05
0.14
-0.08
-0.12
0.03
0.05
0.10
0.01
-0.13
-0.10
0.08
0.11
Org anis atio n
-0.08
1.00
-0.08
-0.10
-0.09
-0.13
-0.09
-0.08
-0.03
0.02
-0.02
-0.11
-0.02
-0.05
-0.33
-0.28
0.08
0.12
0.11
0.11
0.02
Prod ucti vity
-0.03
-0.08
1.00
0.05
0.06
0.04
0.00
0.11
0.05
-0.08
-0.00
0.05
-0.00
-0.01
0.25
-0.01
0.08
-0.17
0.11
0.01
- 0.07
Cont ribut ion
0.01
-0.10
0.05
1.00
0.14
-0.01
-0.11
-0.04
0.07
0.08
0.11
0.01
0.02
-0.06
0.06
0.07
-0.15
-0.08
0.08
-0.06
0.12
man agin g
-0.03
-0.09
0.06
0.14
1.00
0.07
0.09
-0.00
0.09
-0.06
0.07
0.16
0.04
-0.12
0.01
0.04
-0.05
0.08
-0.06
-0.16
0.12
Dev elop men t
0.17
-0.13
0.04
-0.01
0.07
1.00
0.22
0.04
0.02
-0.07
-0.07
-0.01
-0.08
-0.01
0.07
0.11
-0.08
-0.22
-0.03
-0.12
0.12
Cost 0.11 -0.09 0.00 -0.11 0.09 0.22 1.00 0.07 -0.09 0.08 -0.10 -0.05 -0.02 -0.02 0.19 -0.09 -0.19 -0.05 -0.29
0.14 0.10
Rew ard
0.15
-0.08
0.11
-0.04
-0.00
0.04
0.07
1.00
0.07
-0.04
-0.02
-0.16
0.16
-0.08
0.11
-0.06
-0.28
-0.10
-0.08
0.04
- 0.09
capa biliti es
-0.04
-0.03
0.05
0.07
0.09
0.02
-0.09
0.07
1.00
-0.12
0.05
0.24
0.35
0.00
-0.02
0.03
0.06
0.03
0.05
0.00
0.14
co- ordi nati on
0.05
0.02
-0.08
0.08
-0.06
-0.07
0.08
-0.04
-0.12
1.00
0.05
-0.18
0.10
-0.03
-0.12
0.00
-0.05
-0.02
0.09
0.11
0.01
Com petit ion
0.14
-0.02
-0.00
0.11
0.07
-0.07
-0.10
-0.02
0.05
0.05
1.00
-0.02
0.12
-0.07
-0.08
0.04
0.10
0.14
0.09
-0.01
- 0.03
pro moti on
-0.08
-0.11
0.05
0.01
0.16
-0.01
-0.05
-0.16
0.24
-0.18
-0.02
1.00
0.08
0.03
0.05
-0.01
0.05
0.07
-0.02
0.04
- 0.09
com plex
-0.12
-0.02
-0.00
0.02
0.04
-0.08
-0.02
0.16
0.35
0.10
0.12
0.08
1.00
-0.05
0.10
-0.04
0.03
0.13
-0.08
-0.02
- 0.01
Bur 0.03 -0.05 -0.01 -0.06 -0.12 -0.01 -0.02
-0.08 0.00 -0.03 -0.07 0.03 -0.05 1.00 0.06 0.06 0.01 -0.28 -0.22
0.17 0.11

VOLUME NO. 3 (2013), ISSUE NO. 08 (AUGUST) ISSN 2231-5756
INTERNATIONAL JOURNAL OF RESEARCH IN COMMERCE, IT & MANAGEMENT A Monthly Double-Blind Peer Reviewed (Refereed/Juried) Open Access International e-Journal - Included in the International Serial Directories
http://ijrcm.org.in/
99
Cont.
den
judg eme nt 0.05
-0.33
0.25
0.06
0.01
0.07
0.19
0.11
-0.02
-0.12
-0.08
0.05
0.10
0.06
1.00
0.05
-0.09
-0.01
-0.03
-0.00
0.09
com pare perf orm ance 0.10
-0.28
-0.01
0.07
0.04
0.11
-0.09
-0.06
0.03
0.00
0.04
-0.01
-0.04
0.06
0.05
1.00
-0.01
-0.06
0.06
-0.32
0.10
co- oper artio n 0.01
0.08
0.08
-0.15
-0.05
-0.08
-0.19
-0.28
0.06
-0.05
0.10
0.05
0.03
0.01
-0.09
-0.01
1.00
0.06
-0.04
-0.09
- 0.15
Rati ngs -0.13
0.12
-0.17
-0.08
0.08
-0.22
-0.05
-0.10
0.03
-0.02
0.14
0.07
0.13
-0.28
-0.01
-0.06
0.06
1.00
-0.01
0.00
- 0.09
SW OT -0.10
0.11
0.11
0.08
-0.06
-0.03
-0.29
-0.08
0.05
0.09
0.09
-0.02
-0.08
-0.22
-0.03
0.06
-0.04
-0.01
1.00
0.03
0.10
Grie vanc es 0.08
0.11
0.01
-0.06
-0.16
-0.12
0.14
0.04
0.00
0.11
-0.01
0.04
-0.02
0.17
-0.00
-0.32
-0.09
0.00
0.03
1.00
0.04
Met hod olog y 0.11
0.02
-0.07
0.12
0.12
0.12
0.10
-0.09
0.14
0.01
-0.03
-0.09
-0.01
0.11
0.09
0.10
-0.15
-0.09
0.10
0.04
1.00
Table 5.6 shows the correlation between different variables. From the table we can see that the two variables that are positively correlated are accepted as they have positive effect on each other. From the table we can see that the correlation of variable system is 0.01 with variable contribution, 0.17 with variable development, 0.05 with variable coordination. And the correlation of variable organization is 0.02 with variable co- ordination, 0.05 with variable co-operation; the correlation of variable SWOT is 0.11 with variable organization, 0.01 with variable productivity and 0.04 with variable promotion. And the other result of correlation between two variables you can see from the above table. PREDICTED AND RESIDUAL VARIABLES Predicted & Residual Values (B2:CV100)) Dependent variable: productivity
Observed - Value
Predicted – Value Residual
Standard - Pred. v.
Standard - Residual
Std.Err. - Pred.Val
Mahalanobis – Distance
Deleted - Residual
Cook's – Distance
1 4.000000 4.330101 -0.330101 -0.41644 -0.65143 0.186842 12.33333 -0.38204 0.003680
2 5.000000 4.530313 0.469687 0.57565 0.92689 0.204073 14.90408 0.56061 0.009452
3 5.000000 4.634126 0.365874 1.09006 0.72202 0.218194 17.17973 0.44915 0.006936
4 4.000000 4.085417 -0.085417 -1.62889 -0.16856 0.247723 22.43053 -0.11224 0.000558
5 5.000000 4.605156 0.394844 0.94651 0.77919 0.223479 18.07071 0.49018 0.008666
6 4.000000 4.131281 -0.131281 -1.40162 -0.25907 0.205971 15.20105 -0.15726 0.000758
7 4.000000 4.183808 -0.183808 -1.14134 -0.36273 0.212140 16.18545 -0.22287 0.001614
8 4.000000 4.435164 -0.435165 0.10417 -0.85876 0.239701 20.93818 -0.56060 0.013041
9 5.000000 4.501680 0.498320 0.43377 0.98339 0.259061 24.62353 0.67465 0.022060
10 4.000000 4.238749 -0.238749 -0.86910 -0.47115 0.175782 10.80270 -0.27141 0.001644
11 4.000000 4.221505 -0.221505 -0.95455 -0.43712 0.190883 12.91597 -0.25813 0.001753
12 5.000000 4.308609 0.691391 -0.52293 1.36440 0.206751 15.32402 0.82947 0.021240
13 5.000000 4.303353 0.696647 -0.54897 1.37477 0.188767 12.60925 0.80889 0.016838
14 4.000000 4.411025 -0.411025 -0.01544 -0.81112 0.191809 13.05116 -0.47976 0.006116
15 4.000000 4.641324 -0.641324 1.12573 -1.26560 0.194296 13.41767 -0.75186 0.015412
16 5.000000 4.527518 0.472482 0.56180 0.93240 0.222296 17.86940 0.58507 0.012216
17 5.000000 4.545687 0.454313 0.65183 0.89655 0.229928 19.18660 0.57210 0.012496
18 4.000000 4.688822 -0.688822 1.36109 -1.35933 0.222235 17.85909 -0.85286 0.025944
19 4.000000 4.118220 -0.118220 -1.46634 -0.23330 0.209981 15.83778 -0.14273 0.000649
20 4.000000 4.084763 -0.084763 -1.63213 -0.16727 0.232124 19.57392 -0.10727 0.000448
21 5.000000 4.400052 0.599948 -0.06982 1.18395 0.213649 16.43071 0.72965 0.017550
22 4.000000 4.306897 -0.306897 -0.53141 -0.60563 0.190081 12.79938 -0.35715 0.003328
23 5.000000 4.303831 0.696169 -0.54661 1.37383 0.276344 28.15502 0.99084 0.054146
24 4.000000 4.306397 -0.306397 -0.53389 -0.60465 0.222068 17.83065 -0.37923 0.005122
25 4.000000 4.126122 -0.126123 -1.42719 -0.24889 0.227628 18.78491 -0.15801 0.000934
26 5.000000 4.467125 0.532875 0.26254 1.05158 0.241969 21.35512 0.69026 0.020146
27 4.000000 4.247130 -0.247130 -0.82757 -0.48769 0.249151 22.70129 -0.32592 0.004762
28 4.000000 4.378201 -0.378201 -0.17809 -0.74635 0.254285 23.68774 -0.50549 0.011932
29 4.000000 4.319445 -0.319445 -0.46924 -0.63040 0.218190 17.17921 -0.39215 0.005287
30 4.000000 4.530527 -0.530527 0.57671 -1.04695 0.206502 15.28477 -0.63618 0.012464
31 4.000000 4.443908 -0.443908 0.14750 -0.87601 0.215593 16.74912 -0.54202 0.009862

VOLUME NO. 3 (2013), ISSUE NO. 08 (AUGUST) ISSN 2231-5756
INTERNATIONAL JOURNAL OF RESEARCH IN COMMERCE, IT & MANAGEMENT A Monthly Double-Blind Peer Reviewed (Refereed/Juried) Open Access International e-Journal - Included in the International Serial Directories
http://ijrcm.org.in/
100
32 4.000000 4.614818 -0.614818 0.99439 -1.21329 0.185142 12.09199 -0.70953 0.012463
33 5.000000 4.902471 0.097529 2.41976 0.19247 0.202148 14.60562 0.11599 0.000397
34 5.000000 4.582171 0.417829 0.83262 0.82455 0.216789 16.94659 0.51143 0.008878
35 5.000000 4.464432 0.535568 0.24920 1.05690 0.276145 28.11298 0.76180 0.031960
36 5.000000 4.454016 0.545984 0.19759 1.07745 0.218052 17.15612 0.67005 0.015417
37 4.000000 4.430089 -0.430088 0.07902 -0.84874 0.207656 15.46714 -0.51689 0.008320
38 5.000000 4.516958 0.483042 0.50947 0.95324 0.212209 16.19666 0.58577 0.011159
39 5.000000 4.230577 0.769423 -0.90960 1.51839 0.230826 19.34448 0.97087 0.036270
40 4.000000 4.476296 -0.476296 0.30799 -0.93993 0.194582 13.46005 -0.55867 0.008534
41 4.000000 3.671322 0.328678 -3.68080 0.64862 0.267666 26.35326 0.45587 0.010753
42 4.000000 4.320812 -0.320812 -0.46247 -0.63309 0.194994 13.52134 -0.37657 0.003894
43 4.000000 4.278543 -0.278543 -0.67192 -0.54968 0.195156 13.54553 -0.32705 0.002942
44 5.000000 4.435205 0.564795 0.10437 1.11457 0.246177 22.13914 0.73927 0.023920
45 4.000000 4.614944 -0.614945 0.99502 -1.21354 0.210744 15.96018 -0.74355 0.017733
46 4.000000 4.611555 -0.611555 0.97822 -1.20685 0.210736 15.95886 -0.73944 0.017536
47 5.000000 4.935986 0.064014 2.58583 0.12633 0.231191 19.40881 0.08084 0.000252
48 5.000000 4.456359 0.543641 0.20919 1.07283 0.222285 17.86752 0.67318 0.016171
49 5.000000 4.461462 0.538538 0.23448 1.06276 0.222945 17.97963 0.66780 0.016008
50 4.000000 4.353038 -0.353038 -0.30278 -0.69669 0.237647 20.56400 -0.45258 0.008354
51 4.000000 4.386379 -0.386379 -0.13757 -0.76249 0.286059 30.24026 -0.56710 0.019006
52 4.000000 4.522556 -0.522556 0.53721 -1.03122 0.226659 18.61697 -0.65325 0.015833
53 5.000000 4.315962 0.684038 -0.48650 1.34989 0.216102 16.83309 0.83610 0.023577
54 5.000000 4.703638 0.296362 1.43451 0.58485 0.250584 22.97466 0.39229 0.006979
55 4.000000 4.116161 -0.116161 -1.47655 -0.22923 0.219820 17.45155 -0.14309 0.000714
56 5.000000 4.751251 0.248749 1.67044 0.49089 0.214821 16.62238 0.30325 0.003065
57 5.000000 4.702947 0.297053 1.43108 0.58621 0.274721 27.81366 0.42070 0.009647
58 4.000000 4.083806 -0.083806 -1.63687 -0.16538 0.502931 95.54391 -5.60157 5.731791
59 4.000000 4.534518 -0.534518 0.59649 -1.05482 0.229634 19.13499 -0.67265 0.017231
60 4.000000 4.678280 -0.678280 1.30886 -1.33853 0.224487 18.24302 -0.84390 0.025919
61 5.000000 4.190169 0.809831 -1.10982 1.59813 0.241436 21.25679 1.04766 0.046206
62 4.000000 4.533895 -0.533895 0.59340 -1.05359 0.183878 11.91397 -0.61485 0.009231
63 4.000000 4.399994 -0.399994 -0.07010 -0.78935 0.232134 19.57561 -0.50623 0.009973
64 4.000000 4.373966 -0.373966 -0.19907 -0.73799 0.178414 11.15847 -0.42688 0.004189
65 4.000000 4.556113 -0.556113 0.70349 -1.09744 0.197488 13.89491 -0.65570 0.012110
66 4.000000 4.239849 -0.239849 -0.86365 -0.47332 0.307480 35.09264 -0.37962 0.009840
67 4.000000 4.553123 -0.553123 0.68868 -1.09154 0.274827 27.83580 -0.78362 0.033495
68 4.000000 4.324168 -0.324168 -0.44583 -0.63972 0.232680 19.67239 -0.41078 0.006598
69 4.000000 4.199316 -0.199316 -1.06450 -0.39333 0.209329 15.73332 -0.24033 0.001828
70 4.000000 4.543590 -0.543590 0.64144 -1.07273 0.195487 13.59481 -0.63863 0.011256
71 5.000000 4.583557 0.416443 0.83948 0.82181 0.237865 20.60359 0.53414 0.011658
72 4.000000 4.483106 -0.483106 0.34173 -0.95337 0.230788 19.33775 -0.60954 0.014292
73 5.000000 4.473131 0.526869 0.29231 1.03973 0.204710 15.00346 0.62962 0.011997
74 5.000000 4.391919 0.608081 -0.11012 1.20000 0.221081 17.66375 0.75104 0.019910
75 4.000000 4.228298 -0.228298 -0.92089 -0.45053 0.229688 19.14458 -0.28733 0.003146
76 4.000000 4.289113 -0.289113 -0.61954 -0.57054 0.190706 12.89016 -0.33682 0.002980
77 5.000000 4.643072 0.356928 1.13439 0.70437 0.194712 13.47937 0.41876 0.004801
78 5.000000 4.294000 0.706000 -0.59532 1.39323 0.203246 14.77558 0.84135 0.021118
79 4.000000 4.317539 -0.317539 -0.47868 -0.62664 0.196860 13.80046 -0.37398 0.003914
80 5.000000 4.672043 0.327957 1.27795 0.64719 0.207761 15.48380 0.39423 0.004845
81 4.000000 4.433212 -0.433212 0.09450 -0.85491 0.221592 17.75013 -0.53564 0.010174
82 4.000000 4.256194 -0.256194 -0.78266 -0.50558 0.227238 18.71730 -0.32068 0.003835
83 4.000000 4.424087 -0.424087 0.04928 -0.83690 0.264589 25.72828 -0.58304 0.017187
84 4.000000 4.099587 -0.099587 -1.55867 -0.19653 0.195505 13.59754 -0.11700 0.000378
85 5.000000 4.530083 0.469917 0.57451 0.92734 0.220210 17.51711 0.57932 0.011753
86 5.000000 4.456656 0.543343 0.21067 1.07224 0.242443 21.44286 0.70464 0.021077

VOLUME NO. 3 (2013), ISSUE NO. 08 (AUGUST) ISSN 2231-5756
INTERNATIONAL JOURNAL OF RESEARCH IN COMMERCE, IT & MANAGEMENT A Monthly Double-Blind Peer Reviewed (Refereed/Juried) Open Access International e-Journal - Included in the International Serial Directories
http://ijrcm.org.in/
101
Table 5.9 shows the observed value, predicted value, residual value and mahalanobis - distance. From the table we can see that observed value of variable 1 is 4.000000, predicted value is 4.330101, residual value is -0.330101 and mahalanobis – distance is 12.33333 and observed value of variable 2 is 5.000000, predicted value is 4.605156 and residual value is 0.394844 and the mahalanobis –distance is 18.07071. And the results for other variables you can see from the above table. REGRESSION ANALYSIS
MODEL SUMMARY
Model R R Square Adjusted R Square Std. Error of the Estimate
1 .408a .166 -.048 .507
ANOVA
Model Sum of Squares df Mean Square F Sig.
1 Regression 3.991 20 .200 .777 .732a
Residual 20.029 78 .257
Total 24.020 98
Table 5.7, shows the mean square, df , sig. level of regression and residual. From the table we can see that mean squqre of regression is .200 and sig. is .732 and mean square of residual is .257 and total of sum of squares is 24.020 and total of df is 98.
87 5.000000 4.453598 0.546401 0.19552 1.07828 0.218422 17.21781 0.67108 0.015517
88 4.000000 4.718357 -0.718357 1.50744 -1.41761 0.203720 14.84914 -0.85684 0.022005
89 5.000000 4.593256 0.406745 0.88754 0.80267 0.244832 21.88708 0.53061 0.012188
90 5.000000 4.493702 0.506298 0.39424 0.99914 0.243029 21.55130 0.65754 0.018442
91 5.000000 4.654921 0.345079 1.19311 0.68098 0.220815 17.61895 0.42596 0.006389
92 4.000000 4.150469 -0.150469 -1.30654 -0.29694 0.245376 21.98886 -0.19656 0.001680
93 5.000000 4.627535 0.372465 1.05740 0.73503 0.243490 21.63692 0.48428 0.010042
94 4.000000 4.216117 -0.216117 -0.98125 -0.42649 0.210904 15.98594 -0.26140 0.002195
95 4.000000 4.515859 -0.515859 0.50403 -1.01800 0.171251 10.20265 -0.58237 0.007183
96 4.000000 4.243156 -0.243156 -0.84726 -0.47985 0.248630 22.60226 -0.32025 0.004579
97 4.000000 4.007941 -0.007941 -2.01279 -0.01567 0.504625 96.19501 -0.95479 0.167649
98 5.000000 4.375332 0.624668 -0.19231 1.23273 0.308721 35.38433 0.99337 0.067922
99 5.000000 4.497178 0.502822 0.41146 0.99228 0.203332 14.78886 0.59932 0.010725
Mini mum
4.000000 3.671322 -0.718357 -3.68080 -1.41761 0.171251 10.20265 -5.60157 0.000252
Maxi mum
5.000000 4.935986 0.809831 2.58583 1.59813 0.504625 96.19501 1.04766 5.731791
Mean 4.414141 4.414142 -0.000000 -0.00000 -0.00000 0.228441 19.79798 -0.05722 0.071577
Media n 4.000000 4.435164 -0.126123 0.10417 -0.24889 0.220815 17.61895 -0.19656 0.010174

VOLUME NO. 3 (2013), ISSUE NO. 08 (AUGUST) ISSN 2231-5756
INTERNATIONAL JOURNAL OF RESEARCH IN COMMERCE, IT & MANAGEMENT A Monthly Double-Blind Peer Reviewed (Refereed/Juried) Open Access International e-Journal - Included in the International Serial Directories
http://ijrcm.org.in/
102
Coefficients
Unstandardized Coefficients Standardized Coefficients
Model B Std. Error Beta T Sig.
1 (Constant) 2.689 1.857 1.448 .151
System -.071 .112 -.072 -.635 .528
Organization .002 .011 .020 .167 .868
Contribution .035 .106 .037 .331 .741
Managing .081 .110 .081 .733 .465
Development .006 .072 .009 .081 .935
Cost .021 .120 .021 .172 .864
Reward .124 .118 .125 1.049 .297
Capabilities .039 .093 .050 .421 .675
co-ordination -.017 .060 -.032 -.283 .778
Competition .022 .085 .029 .263 .793
Promotion .022 .104 .025 .215 .830
Complex -.036 .083 -.051 -.426 .671
Burden -.021 .097 -.026 -.217 .829
Compare performance -.002 .108 -.002 -.020 .984
co-operartion .087 .067 .151 1.306 .195
Ratings -.195 .116 -.197 -1.686 .096
SWOT .119 .107 .133 1.112 .269
Grievances .021 .058 .042 .359 .721
Methodology -.010 .011 -.102 -.894 .374
Table 5.8 shows unstandardized coefficients and standardized coefficients. From the table we can see beta and significance level of various variables. From the table we can see that beta of variable system is -.071, sig. is .151 and the result for other variables you can see from the table. CHI-SQUARE TEST
TEST STATISTICS System Organization Productivit y Contributio n managing development
Chi-Square .010a 92.798b 2.919a 50.424c .818a 57.404b
Df 1 3 1 2 1 3
Asymp. Sig. .920 .000 .088 .000 .366 .000
a. 0 cells (.0%) have expected frequencies less than 5. The minimum expected cell frequency is 49.5.
b. 0 cells (.0%) have expected frequencies less than 5. The minimum expected cell frequency is 24.8.
c. 0 cells (.0%) have expected frequencies less than 5. The minimum expected cell frequency is 33.0.
Cost reward capabilities co-ordination competition promotion Complex
Chi- Square .091a 1.222a 83.747b 52.232b 90.131b 44.424c 81.889b
Df 1 1 3 3 3 2 3
Asymp. Sig. .763 .269 .000 .000 .000 .000 .000
a. 0 cells (.0%) have expected frequencies less than 5. The minimum expected cell frequency is 49.5.
b. 0 cells (.0%) have expected frequencies less than 5. The minimum expected cell frequency is 24.8.
c. 0 cells (.0%) have expected frequencies less than 5. The minimum expected cell frequency is 33.0.

VOLUME NO. 3 (2013), ISSUE NO. 08 (AUGUST) ISSN 2231-5756
INTERNATIONAL JOURNAL OF RESEARCH IN COMMERCE, IT & MANAGEMENT A Monthly Double-Blind Peer Reviewed (Refereed/Juried) Open Access International e-Journal - Included in the International Serial Directories
http://ijrcm.org.in/
103
TEST STATISTICS
Burden Judgment compare performance cooperation Ratings SWOT
Chi-Square 33.697c 70.172b 44.061c 36.636b 1.222a 48.727c
Df 2 3 2 3 1 2
Asymp. Sig. .000 .000 .000 .000 .269 .000
a. 0 cells (.0%) have expected frequencies less than 5. The minimum expected cell frequency is 49.5.
b. 0 cells (.0%) have expected frequencies less than 5. The minimum expected cell frequency is 24.8.
c. 0 cells (.0%) have expected frequencies less than 5. The minimum expected cell frequency is 33.0.
TEST STATISTICS
grievances Methodology
Chi-Square 15.141b 58.051b
Df 3 3
Asymp. Sig. .002 .000
b. 0 cells (.0%) haveexpected frequencies less than 5. The minimum expected cell frequency is 24.8.
Table 5.10, 5.11, 5.12, 5.13 shows the chi-square and df of various variables. Except system, cost rating, managing and productivity all the results for the chi square is coming positive, because in the case of chi square if the significance value will come less than 0.05 we consider it as the positive result. In this case we can generalize the findings in the case of universe so except the above said four variables, which got rejected in the chi square test, we can generalize the findings of the other variable in the case of universe.
6. CONCLUSION Te research shows that performance appraisal plays an important part in an organizational system. Performance appraisal helps in evaluating and assessing the employees performance in comparison to standards fixed. It helps in assessing the capabilities of various employees and employees’ contribution towards the organization. It helps in determining the training needs for the employees. From the employee point of view he will get to know that what are his strength and weaknesses and which improvements he have to do. It helps an individual to determine the proper career path. To conclude we can say that performance appraisal is an indispensable part that provides very advantages both to the individuals and the organization.
7. REFERENCES 1. Armstrong, M. 2001. A handbook of human resource management practice 8t h ed. London: Kogan Page 2. Cascio, W. F. (1998). Managing Human Resources.Boston. McGraw Hill Publishing Company. 3. Davis R (1995). Choosing performance management, holistic approach Journal, Cupa Publication, New Delhi- India. 4. Edwards, M. R., and Ewen, A. J., (1996). 360-Degree Feedback: The Powerful NewModel For Assessment And Performance Improvement. New York:
AMACOM 5. Eichel, E. & Bender, H. E. (1984). Performance Appraisal A Study of Current Techniques. New York. American Management Association. 6. Levinson HA (1992). Psychologist look at executive development, Harvard Business Review. 7. Makiney, Jeanné D. & Levy, Paul E.(1998). The Influence of Self Ratingsversus Peer Ratingson Supervisors’ Performance Judgments. Organizational
Behavior And Human Decision .Processes, Vol. 74, No. 3, 212228 8. Mbiti R (1994). Performance Appraisal System, Personnel Hand book 9. Moul4.Davis R (1995). Choosing performance management, holistic approach Journal, Cupa Publication, New Delhi- India. 10. Quchi W (1997) . A conceptual framework f or the design of organization and control mechanism, Management Science, 25:33-48 11. Richi.LH (1996). A skillful Approach to high productivity, HR Magazine, Vol.3 12. Stebler M (1997). Getting the best out of the institute of employmentstudies, Harvard Business Review. http://uinnedu/ohv/policies/performance 13. Wagner, Stephen H. & Goffin, Richard D. (1997). Differences in Accuracy of Absoluteand Comparative Performance Appraisal Methods. Organizational
Behavior AndHuman Decision Processes, Vol. 70, No. 2, 95 – 103.

VOLUME NO. 3 (2013), ISSUE NO. 08 (AUGUST) ISSN 2231-5756
INTERNATIONAL JOURNAL OF RESEARCH IN COMMERCE, IT & MANAGEMENT A Monthly Double-Blind Peer Reviewed (Refereed/Juried) Open Access International e-Journal - Included in the International Serial Directories
http://ijrcm.org.in/
104
A STUDY ON IMPACT OF GLOBAL RECESSION ON INDIAN ECONOMY WITH REFERENCE TO INDIA’S EXPORTS
DR. A.MUTHUSAMY ASST. PROFESSOR
DEPARTMENT OF INTERNATIONAL BUSINESS & COMMERCE ALAGAPPA UNIVERSITY
KARAIKUDI
ABSTRACT India accepted globalization and liberalization in the year 1991, since then India’s foreign trade has undergone substantial changes. India’s major exports include manufacturing and engineering goods. There has been a gradual increase in India’s export and imports trades and also there is a rise in trade deficit. India has good trading relations with all the major countries in the world. Foreign trade has played a crucial role in India’s economy growth. Financial crisis hit the real economy and became a global economic crisis; it was rapidly transmitted to many developing countries. The economic crisis leads to a decreased demand for goods and services, which in turn leads to a decrease in production, lay-offs and a sharp rise in unemployment. In the age of globalization, no country can remains isolated from the fluctuations of world economy. India was affected less by external world depressions as it relived more on internal consumption, savings , import substitutions and exports.
KEYWORDS global recession, Indian economy, Indian exports.
INTRODUCTION he global economic recession has taken its toll on the Indian economy that has led to multi-core loss in business and export orders, especially in key sectors like the Information Technology, Automobiles, Small and Medium Enterprises,100% Export oriented units and Export-oriented firms etc., In economics, a recession is a business contraction, a phase of business cycle contraction. It is a general slowdown in economic activity over a fair long
period of time. During recessions, many bunches of macro-economic indicators vary in a similar way. Production as measured by Gross Domestic Product (GDP), employment, investment spending, capacity utilization, household incomes, business confidence indices, stock indices, business profits and prices fall during recession; while bankruptcies, business closures, the unemployment rate, etc., The world is presently facing economic crisis due to which economics world over are considered to be entering into prolonged slowdown in economic activities. The intensity of present economic crisis is so high that is being compared with the global economic recession in 1873, great depression of 1930s and East Asian crisis of 1990s. The current economic slowdown is considered to be sub-prime mortgage crisis in the financial sector of United States. Indian economy also passed through these stages during the year 2008. The economic growth rate, which was above 8% for consecutive period of three years since 2006, suddenly plunged to an average of 5.5%. Earlier India was affected less by external world depressions as it relived more on internal consumption, saving and import substitutions. However, after 1991 India opened up its economy to global players, share of exports, both goods and services, in GDP grew significantly. The effects of the global financial crisis have been more severe than initially forecast. By virtue of globalization, the moment of financial crisis hit the real economy and became a global economic crisis; it was rapidly transmitted to many developing countries. India too is weathering the negative impact of the crisis. There is, however, an important difference between the crisis in the advanced countries and the developments in India. While in the advanced countries the contagion traversed from the financial to the real sector, in India the slowdown in the real sector is affecting the financial sector, which in turn, has a second-order impact on the real sector.
IMPORTANCE OF THE STUDY A recession is a decline in a country's Gross Domestic Product (GDP) growth for two or more consecutive quarters of a year. Recession normally takes place when consumers lose confidence in the growth of the economy and spend less. This leads to a decreased demand for goods and services, which in turn leads to a decrease in production, lay-offs and a sharp rise in unemployment. In the age of globalization, no country can remains isolated from the fluctuations of world economy. Heavy losses suffered by major International Banks is going to affect all countries of the world as these financial institutes have their investment interest in almost all countries. The major industries also affect the global recession. So in the present paper the attempt has been made to throw light upon the impact of recession on exports in different sectors of Indian economy.
RESEARCH METHODOLOGY The present study an attempt has been made to examine the impact of recession on exports of different sectors of Indian economy. This study is purely based on secondary data. The secondary data collected through various sources such as websites and books. PERIOD OF THE STUDY This study is made in order to find out the contribution of the impact of global recession on Indian economy from 2006-2007 to 2010-2011. THE RECESSION PERIOD December 2007-July 2009:19 months
EXPORTS IN DIFFERENT SECTORS OF INDIAN ECONOMY The sector – wise exports performance and its impact on global crisis are present below. MERCHANDISE EXPORT The country’s exports fell by 9.9 per cent to $11.5 billion in November 2008, as compared with $12.76 billion in the same month in 2007. In October 2008, exports declined by 12.1 per cent for the first time in more than five years. Economists expect that the slowdown in exports will continue in the coming months. However, in rupee terms, overseas sale of Indian goods expanded 12 per cent, which could be attributed to the 26 per cent depreciation of the Indian rupee against the US dollar in the 12 months up to November 30, 2008. The following table highlights percentage of merchandise exports during the study period.
T

VOLUME NO. 3 (2013), ISSUE NO. 08 (AUGUST) ISSN 2231-5756
INTERNATIONAL JOURNAL OF RESEARCH IN COMMERCE, IT & MANAGEMENT A Monthly Double-Blind Peer Reviewed (Refereed/Juried) Open Access International e-Journal - Included in the International Serial Directories
http://ijrcm.org.in/
105
TABLE 1: MERCHANDISE EXPORTS
Particulars 2006 (%) 2007 (%) 2008 (%) 2009 ( %) 2010 (%) 2011 (%) Value(core) Growth Rate
Exports 178.2 -2.5 245.6 37.8 54.2 41.2 79 45.7
Oil 28 1.7 42.5 51.8 8.7 96.8 14 60.9
Non-oil 150.2 -3.2 203.1 35.2 45.5 33.9 65 42.9
Imports 287.4 -3.8 350.5 21.9 84.2 35 110.6 31.4
Oil 87.1 -7 101.6 16.6 25.9 55.3 30.5 17.8
Non-Oil 200.3 -2.4 248.9 24.2 58.4 27.6 80.1 37.2
Trade Balance -50.1 0.4 -45.8 -8.6 -12.9 9.1 -15.1 17.1
CHART 1: MERCHANDISE EXPORTS - GROWTH RATE
The above table 1 shows that Oil exports were increased from 28% in 2006 to 96.8 in 2011. But others exports are decreased such as non-oil exports decreased from 150.2 % in 2006 to 33.9 % in 2011, imports are goes down from 35% in 2006 to 287.4% in 2011. In the recession period of 2008 exports and imports are increased when compared to other years. The trade balance of the recession period is - 45.8%. IRON ORE MINE EXPORTS India’s iron ore exports also affected due to economic recession. The following table 2 explains the export of Iron Ore Mine exports during the study period.
TABLE 2: IRON ORE MINE EXPORTS
Particulars Year CAGR 2006-07 % 2007-08 % 2008-09 % 2009-10 % 2010-11 %
Iron and Steel 5.0497 3.6991 4.4313 4.0249 5.2015 0.59 %
Copper and Articles of Copper 1.1305 1.4751 2.4067 1.7903 2.9627 21.15 %
Aluminums and Articles of Aluminums 0.6480 0.5880 0.6513 0.6894 0.7352 2.65 %
Percentage Share of Metals 2.2760 1.9207 2.4964 2.1682 2.8664 4.56 %
Percentage of India’s Export 27.94 21.60 25.28 14.71 28.19 0.16 %
CHART 2: IRON ORE MINE EXPORTS
In above table 2 reveal that the India’s exports are not much more affected by world Recession when compared to USA, UK. In 2008 Iron ore mine were increased as 4.4343, copper articles were increased as 2.4067, Aluminum articles were decreased as 0.6513 in 2008 when compared to 2007, share metals percentage were increased as 2.4964 in 2008. Finally percentage of India’s export is increased as 25.28 in 2008.

VOLUME NO. 3 (2013), ISSUE NO. 08 (AUGUST) ISSN 2231-5756
INTERNATIONAL JOURNAL OF RESEARCH IN COMMERCE, IT & MANAGEMENT A Monthly Double-Blind Peer Reviewed (Refereed/Juried) Open Access International e-Journal - Included in the International Serial Directories
http://ijrcm.org.in/
106
SHRIMP EXPORTS Recession in Europe has taken a toll on ‘luxury’ shrimp consumption during 2008, which could have serious implications for Indian seafood exports in one of its biggest export destinations. The retail chain segment has reduced its orders significantly across Europe and shrimp stocks are said to be piling up as a result of consumers’ lessening purchasing power and reluctance to buy comparatively expensive products. Shrimp, a major component in the seafood export basket, seems to be the worst hit. Shrimp exports account for more than 50 percent of the total seafood exports in both volume and value. Export of shrimp has fallen by 6 percent in volume and 15.5 percent in value during the first half of 2008-09. Unit realization of the species has fallen to $6.8 per kg as against $6.9 per kg registered during the first half of 2007-08.
TABLE 3: SHRIMP EXPORTS
Years Export Value (Rs in crores) Growth Rate
2006-07 4271.51 1.20
2007-08 4506.08 5.50
2008-09 3970.29 -13.49
2009-10 3779.80 -4.79
2010-11 4382.35 10.65
CAGR 36.65 % -
CHART 3: SHRIMP EXPORTS
The above table 3 reveals that the Exports value is decreased as 3970.29 crores in 2008-2009 when compared to 2007-08. But the Growth rate of exports value is going negatively as -13.49. LEATHER EXPORTS The leather products are made according to standards and specifications in Europe and America, of which there is not much demand in India. Other export industries of Uttar Pradesh like silk, carpets and brassware are also facing a similar situation. The economic slowdown in US and Europe has hit the Uttar Pradesh leather industry hard. In spite of a cheaper rupee, the demand is falling, leaving the exporters scared. So far, the leather industry, concentrated in Kanpur and Agra, had annual revenue of Rs 4,500 crore and enjoyed an annual growth of 18 to 20 per cent. In many cases, goods are lying at ports and the buyers are not releasing the consignments.
TABLE 4: LEATHER EXPORTS
S.NO YEAR LEATHER EXPORTS (in million US $) %OFGROWTH RATE
1 2006-2007 309.91 8.20
2 2007-2008 345.34 8.66
3 2008-2009 426.17 10.29
4 2009-2010 428.62 12.73
5 2010-2011 400.83 -6.48
Table 4 shows that the export of leather garments in the year 2006-2007 is US $ 309.91 at the growth rate of 8.20%. In the year 2008-2009, it is US $ 426.17 million at the growth rate of 10.29% and in the year 2010-2011, it is US $ 400.83 million and the growth rate has decreased to-6.48%.
CHART 4: LEATHER EXPORTS

VOLUME NO. 3 (2013), ISSUE NO. 08 (AUGUST) ISSN 2231-5756
INTERNATIONAL JOURNAL OF RESEARCH IN COMMERCE, IT & MANAGEMENT A Monthly Double-Blind Peer Reviewed (Refereed/Juried) Open Access International e-Journal - Included in the International Serial Directories
http://ijrcm.org.in/
107
CAR EXPORTS Indian car exports recorded a substantial year-on-year growth of 57% in FY 2008-09. In FY 2008- 09, 331,539 cars were exported from India as compared to the export of 211,112 cars in FY 2007-08. The decline in the value of rupee that declined over 20% in FY 2008-09 made the Indian cars relatively inexpensive in the overseas market; thereby, further boosting the car exports from India.
TABLE 5: CAR EXPORTS
Year 2006-2007 2007-2008 2008-2009 2009-2010 2010-2011 CAGR
Motor Vehicle Production 8,467,853 9,743,503 11,087,997 10,853,930 11,175,479 5.54
Industry Revenue USD Million 24,379 26,969 30,507 32,383 33,342 6.34
Exports (Units) 629,544 806,222 1,011,529 1,238,333 1,530,660 19.43
CHART 5: CAR EXPORTS
The above table 5 Motor vehicle production in 2008-2009 is increased as 11,087,997 when compared to 2007-2008 and 2009-2010. Industry revenue US $ increased from 26,969 in 2007 to 30,507 in 2008, but when compared to 2009 it is decreased. Export units are decreased as 806,222 in 2007-08. TWO WHEELER EXPORTS Indian two wheeler segment also saw substantial increase in exports. In FY 2008-09, total 1,004,174 units of two wheelers were exported, representing an increase of 22.50 % from 819,713 units in FY 2007-08. As a result, total vehicle exports from the country during the year surged by 23.60% at 15,30,660 units whereas in FY 2007-08, the export figure stood at 12,38,333 units.
TABLE-6: COMPANY-WISE TWO-WHEELER EXPORTS
Particulars FY2006 FY2007 FY2008 FY2009 FY2010 CAGR (FY2006-11) FY2012
Bajaj Auto 14924 16112 28527 53366 90210 56.8 87225
HHML 10061 10324 13023 21165 39254 40.5 43441
HMSI 0 0 1293 10916 31414 n.a 27734
TVS 7265 6621 7765 9636 28093 40.2 36666
Yamaha 15197 20446 20321 45546 32906 21.3 27539
Others 35790 57635 32752 39053 42792 4.6 33773
Total 83237 111138 103681 179682 264669 33.5 256378
FY-Financial Year NA-NOT AVAILABLE
CHART 6: COMPANY-WISE TWO-WHEELER EXPORTS
The above 6 Table reveals that the export of two wheeler for the year 2008 Bajaj auto, HHML, HMSI, TVS, Yamaha, Others is increased as 28527, 13023, 1293, 7765, 20321, 32752, 103681 when compared to 2007. But 2008 exports of two wheelers are decreased when compared to 2009.

VOLUME NO. 3 (2013), ISSUE NO. 08 (AUGUST) ISSN 2231-5756
INTERNATIONAL JOURNAL OF RESEARCH IN COMMERCE, IT & MANAGEMENT A Monthly Double-Blind Peer Reviewed (Refereed/Juried) Open Access International e-Journal - Included in the International Serial Directories
http://ijrcm.org.in/
108
SPICES EXPORTS The present global turmoil has badly affected the Indian spices export sector especially to Europe and USA. Traditional importers of Indian spices like Canada have considerably reduced their off take, while there had been an improvement in exports to non-traditional countries like Japan, Korea and Taiwan.
TABLE 7: SPICES EXPORTS FROM INDIA
Year Total Export Agriculture & Allied Products % of Total Export Spices Export % of Spices Export Spices Export Earning to Agri exports
2006-07 103077 1022.5 9.90 477.87 0.46 5.1
2007-08 126263 12673.55 10.03 697.34 0.55 4.94
2008-09 159085 18068.79 11.35 1037.77 0.65 4.68
2009-10 341970 8723.64 12.38 477.67 0.59 5.5
2010-11 352937 3984.80 11.52 525.62 0.62 5.74
CAGR 27.88 31.29 3.01 1.73 6.03 2.29
The above table 7 reveals that Agriculture exports is increased from 12673.55 in 2007-08 to 18068.79 in 2008-09, total exports are increased as 159085 in 2008-09 when compared to 2007-08, spices exports are increased as 1037.77 in 2008-09 when compared to 2007-08 and 2009-10.
CHART 7: SPICES EXPORTS FROM INDIA
FISH EXPORTS Fisheries are one of the main export oriented Industries in India, as it earns billions of dollars from world markets through its fish and other seafood exports. The worldwide recession has also taken a toll on the fishing industry also.
TABLE 8: SEA FOODS EXPORTS
Years Sea Foods Exports (Rs in Crores) Growth rate
2002-03 5957.05 10.04
2003-04 6810.31 -11.47
2004-05 6646.69 9.12
2005-06 7245.30 9.01
2006-07 8363.53 9.01
2007-08 7476.00 15.43
2008-09 8607.94 -11.87
2009-10 10048.53 15.14
2010-11 11682.69 16.73
CAGR 7.68 -
CHART 8: SEA FOODS EXPORTS FROM INDIA
The export of marine products has steadily grown over the years- from a mere Rs.5957.05 in 2002-03 to 8607.94 in 2008-09. Marine products account for approximately 1.1 % of the total exports from India.

VOLUME NO. 3 (2013), ISSUE NO. 08 (AUGUST) ISSN 2231-5756
INTERNATIONAL JOURNAL OF RESEARCH IN COMMERCE, IT & MANAGEMENT A Monthly Double-Blind Peer Reviewed (Refereed/Juried) Open Access International e-Journal - Included in the International Serial Directories
http://ijrcm.org.in/
109
TABLE 9: TOTAL MARINE PRODUCTS (Rs. in crores)
Year Total Export of Marine Products
Frozen Shrimp
Frozen Fin Fish
Frozen Cutler Fish
Frozen Squid Fish
Dried Items Live Items
Child Items
2006 5957.05 4139092 (69.50%)
713.11 (12%)
280.07 (4.7%)
329.67 (5.5%)
67.69 (1.14%)
40.57 (0.70%)
63.66 (1.06%)
2007 68810.3 4608031 (67%)
841.65 (12.2%)
417.18 (6.6%)
384.37 (5.58%)
84.23 (1.2%)
53.66 (0.78%)
59.14 (0.86%)
2008 6091.95 4013.07 (65.87%)
620.73 (10.2%)
435.18 (7.14%)
372.92 (6.12%)
145.68 (2.40%)
51.10 (0.82%)
64.04 (1.05%)
2009 6646.69 54220.67 (63.5%)
759.27 (11.4%)
549.15 (7.60%)
477.26 (7.20%)
121.01 (1.82%)
50.75 (0.76%)
68.14 (1.02%)
2010 7245.30 4271.51 (58.93%)
998.70 (13.8%)
797.37 (9.53%)
575.52 (7.94%)
132.56 (1.83%)
61.71 (0.85%)
81.56 (1.12%)
2011 8363.53 4506.08 (53.83%)
1452.08 (17.3%)
474.01 (7.14%)
568.32 (6.80%)
183.16 (2.18%)
64.06 (0.81%)
117.30 (1.40%)
2012 7476.00 3970.29 1210.07 747.6 373.8 224.28 74.76 74.76
CHART 9: TOTAL MARINE PRODUCTS
The above table 9 shows that the share of item -wise export on total export of sea foods from India. In 2006-07 the frozen shrimps export from India was Rs.4139.92 crores with the contribution of 69.50 %. The next place goes to frozen fin fish export followed by frozen cuttle fish. The other sea foods exports contributed around 5 % in total sea foods exports. COFFEE EXPORTS Indian coffee also important exports segment in the global market. As a recession result, coffee exports have declined over 21 per cent during the first 10 months of the current coffee year (October 2008- September 2009). Exports between October 2008 and July 2009 stood at 152,681 tonnes, as against 194,058 tonnes in the corresponding period of the previous coffee year.
TABLE 10: INDIA’S EXPORT OF COFFEE
year Quantity Value(in Rs in crore) Growth Rate
2006-07 249029 2007.90 9.8
2007-08 218998 2046.29 -8.19
2008-09 197171 2242.64 -12.62
2009-10 181225 1944.98 8.6
2010-11 273826 2832.62 7.25
CAGR 1.74 7.11 -
CHART 10: INDIA’S EXPORT OF COFFEE
Table 10 reveals that the quantities of coffee exports are decreased from 218998 tonne in 2007-08 to 197171 tonne in 2008-09. Value of coffee exports in the recession period of 2008, is increased as 2242.64 crores when compared to 2007-08. Growth rate of coffee exports is comes down as negatively -12.62 in 2008.
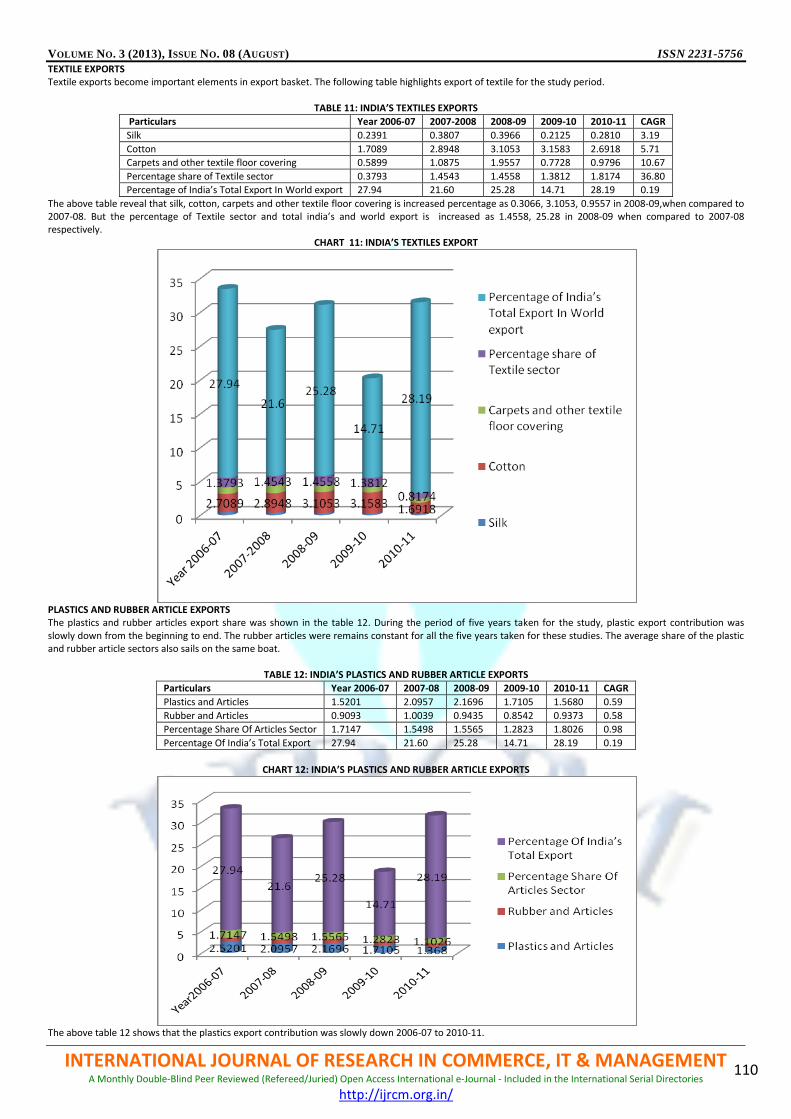
VOLUME NO. 3 (2013), ISSUE NO. 08 (AUGUST) ISSN 2231-5756
INTERNATIONAL JOURNAL OF RESEARCH IN COMMERCE, IT & MANAGEMENT A Monthly Double-Blind Peer Reviewed (Refereed/Juried) Open Access International e-Journal - Included in the International Serial Directories
http://ijrcm.org.in/
110
TEXTILE EXPORTS Textile exports become important elements in export basket. The following table highlights export of textile for the study period.
TABLE 11: INDIA’S TEXTILES EXPORTS
Particulars Year 2006-07 2007-2008 2008-09 2009-10 2010-11 CAGR
Silk 0.2391 0.3807 0.3966 0.2125 0.2810 3.19
Cotton 1.7089 2.8948 3.1053 3.1583 2.6918 5.71
Carpets and other textile floor covering 0.5899 1.0875 1.9557 0.7728 0.9796 10.67
Percentage share of Textile sector 0.3793 1.4543 1.4558 1.3812 1.8174 36.80
Percentage of India’s Total Export In World export 27.94 21.60 25.28 14.71 28.19 0.19
The above table reveal that silk, cotton, carpets and other textile floor covering is increased percentage as 0.3066, 3.1053, 0.9557 in 2008-09,when compared to 2007-08. But the percentage of Textile sector and total india’s and world export is increased as 1.4558, 25.28 in 2008-09 when compared to 2007-08 respectively.
CHART 11: INDIA’S TEXTILES EXPORT
PLASTICS AND RUBBER ARTICLE EXPORTS The plastics and rubber articles export share was shown in the table 12. During the period of five years taken for the study, plastic export contribution was slowly down from the beginning to end. The rubber articles were remains constant for all the five years taken for these studies. The average share of the plastic and rubber article sectors also sails on the same boat.
TABLE 12: INDIA’S PLASTICS AND RUBBER ARTICLE EXPORTS
Particulars Year 2006-07 2007-08 2008-09 2009-10 2010-11 CAGR
Plastics and Articles 1.5201 2.0957 2.1696 1.7105 1.5680 0.59
Rubber and Articles 0.9093 1.0039 0.9435 0.8542 0.9373 0.58
Percentage Share Of Articles Sector 1.7147 1.5498 1.5565 1.2823 1.8026 0.98
Percentage Of India’s Total Export 27.94 21.60 25.28 14.71 28.19 0.19
CHART 12: INDIA’S PLASTICS AND RUBBER ARTICLE EXPORTS
The above table 12 shows that the plastics export contribution was slowly down 2006-07 to 2010-11.

VOLUME NO. 3 (2013), ISSUE NO. 08 (AUGUST) ISSN 2231-5756
INTERNATIONAL JOURNAL OF RESEARCH IN COMMERCE, IT & MANAGEMENT A Monthly Double-Blind Peer Reviewed (Refereed/Juried) Open Access International e-Journal - Included in the International Serial Directories
http://ijrcm.org.in/
111
MISCELLANEOUS EXPORTS Miscellaneous manufactured Articles like Toys, Games and Sports requesites ; parts and Accessories , Furniture; Bedding, Mattresses, Mattresses supports, Cushions and Similar stuffed furnishing; Lamps and Lighting Fittings etrc.
TABLE 13: INDIA’S MISCELLANEOUS EXPORTS
Particulars Year 2006-07 2007-08 2008-09 2009-10 2010-11 CAGR
Miscellaneous Manufactured Articles 0.1329 0.1724 0.1545 0.1445 0.1727 5.54
Toys, Games, and Sports Requisites 0.1222 0.1285 0.1002 0.0819 0.1764 7.56
Other miscellaneous 0.3146 0.2888 0.3663 0.3385 0.3982 4.73
Percentage Share Of Miscellaneous 0.2032 0.1966 0.2070 0.1873 0.2691 5.71
Percentage Of India’s Export 27.94 21.60 25.28 14.71 28.19 0.19
CHART 13: INDIA’S MISCELLANEOUS EXPORTS
The above table 13 reveal that the share of miscellaneous manufactured articles item includes Toys, Games requisites, Furniture, Bedding, Mattressess. During the year 2006-07 and during the year 2010-2011 miscellaneous manufactured articles has been reduced slowly in export of commodities.
CONCLUSION The Global Economic Recession is the important issue that has to be considered by the entire world as it has its slowdown effects in all Industrial Sectors. Country must reduce Inflation to show increase in GDP rate . Recessions are generally believed to be caused by a widespread drop in spending. Governments usually respond to recessions by adopting expansionary macro-economic policies, such as increasing money supply, reducing cost and funds, increasing government spending and decreasing taxation.
REFERENCES 1. ‘Economist – A Helping Hand to Homeowners’. Economist.com. 2008-10-23.Retrieved 2009-02-27. 2. Healy, Paul M. & Palepu, Krishna G ; “ The Fall of Enron” – Journal of Economics perspective, Volume 17, Number 2. (Spring 2003), p.13. 3. IMF – World Economic Outlook April 2009. 4. Rampell, Catherine Reform Speech June 17,2009, ‘Great Recession’: A Brief Etymology. 5. “The End of the Affair”. Economist. 2008-10-30. Retrieved 2009-03-27. WEBSITES 6. www.economywatch.com 7. www.google.com 8. www.indiaonestep.com 9. www.ministryofcommerceandindustry.com 10. www.yahoo.com

VOLUME NO. 3 (2013), ISSUE NO. 08 (AUGUST) ISSN 2231-5756
INTERNATIONAL JOURNAL OF RESEARCH IN COMMERCE, IT & MANAGEMENT A Monthly Double-Blind Peer Reviewed (Refereed/Juried) Open Access International e-Journal - Included in the International Serial Directories
http://ijrcm.org.in/
112
KNOWLEDGE, ATTITUDE, PRACTICE AND PREVENTION ABOUT HIV/AIDS AMONG MEN WHO HAVE SEX WITH MEN (MSM) IN KARNATAK: AN EMPIRICAL STUDY OF BELGAUM DISTRICT
UMESH T TEACHING ASSISTANT
DEPARTMENT OF SOCIAL WORK SANJEEV MSW COLLEGE
LINGASGUR
SEEMA DEVADIGA ICTC COUNSELLOR
FAMILY PLANNING ASSOCIATION OF INDIA BELAGAVI BRANCH
BELAGAVI
DHAVALESHWAR C U FACULTY
DEPARTMENT OF SOCIAL WORK RANI CHANNAMMA UNIVERSITY
BELAGAVI
ABSTRACT The continuum of care for HIV/AIDS of MSM has been advanced mostly in developed countries, mostly due to the prolonging of life and an improved prognosis for those testing HIV-positive due to the advent of triple therapy and ART. This continuum has come to include a set of modalities including prevention, treatment of opportunistic infections, HIV syndrome treatment, antiviral drugs, social/psychological care, and palliative care. Here researcher made an attempt to know the MSM’s knowledge, attitude and practice aspects related with the HIV/AIDS, paper covered definition; HIV/AIDS control programs and MSM measurement issues, suggestions and recommendations with the social work perspective to prevent HIV among the MSM’s
KEYWORDS HIV/AIDS, MSM.
INTRODUCTION ndia has the second largest number of persons living with HIV/AIDS in the world after South Africa. India has an estimated number of 3.7 million (2.1 to 4.3 million) HIV-infected people at the end of 1999 (UNAIDS, 2000), and 3.86 million at the end of 2000 (NACO: http://naco.nic.in/vsnaco/indianscene/ update.htm: accessed on 23rd September 2001). In India, national statistics shows that HIV spread is mainly through heterosexual transmission (NACO,
1999). As a result, awareness campaigns and prevention programs of Govt. of India have been focused on the general heterosexual population.
OBJECTIVES 1. Knowledge, Attitude, Practice and Prevention about HIV, Among Men Who Have Sex With Men (MSM) 2. Intervention of social work for welfare of MSM,S
METHODOLOGY Tools of data collection interview schedule, 25 respondents the study covered the Belgaum district in Karnataka state. The selection of universe by purposeful sampling method and selection of respondent made by simple random sampling method for insuring that the unit selected has equal potentiality to be chosen as a sample. The all 15 respondents are MSM; s from various socioeconomic backgrounds was interviewed. The questionnaire was administrated to them during January February of 2013 for this purpose. Face to face interviews were carried out with them. They were asked about income sources, working conditions, health issues knowledge of HIV/AIDS, Attitude of them and their sexual practices. The interviews were held in their routine meeting fields and/or in their homes providing the opportunity to gather additional information by observation.
DEFINITIONS
Men who have Sex with Men (MSM): This term is used to denote all those men who have sex with other men regardless of their sexual identity. This is because a man may have sex with other men but still consider him to be a heterosexual or may not have any specific sexual identity at all. This means one has to concentrate on behavior, in addition to the sexual categories, in the area of HIV/STD prevention. Males who have sex with Males (MSM): This is used as an umbrella term under which all biological males who have sex with other males are included, regardless of their sexual/gender identity. Thus literally it also includes transgender/transsexual (male to female) persons since they are actually biological males. *Note: Some transgendered/transsexual persons (male to female) don’t want themselves to be included under this term, even though this term mainly serves as a working definition. To denote such persons, recently, the term “Transgender persons who have Sex with Men” (TSM) has been introduced.(HIV prevention among MSM in India, (2002), spiritual, cultural, and moral concerns). Same-sex sexuality: Currently, this term is being used as an alternative to the term ‘homosexuality’ (though some would like to use only this term instead of the term ‘homosexuality’). Similarly, the term ‘homosexual behavior’ is being replaced by the terms - same-sex behavior, same-sex sexual behavior, same-gender sexual behavior. (Note: In this document the terms ‘homosexuality’ and ‘homosexual behavior’ are used because of their ‘familiarity’ and without any negative connotations).
HIV/AIDS CONTROL PROGRAMS AND MSM MEASUREMENT ISSUES Current methods for collecting data on the dynamics of HIV/AIDS in India have proven limited. Clinical reporting of disease as a source of data is dependent on the willingness of providers and patients to provide data collection agencies with detailed and accurate information. Survey-based approaches have also not
I

VOLUME NO. 3 (2013), ISSUE NO. 08 (AUGUST) ISSN 2231-5756
INTERNATIONAL JOURNAL OF RESEARCH IN COMMERCE, IT & MANAGEMENT A Monthly Double-Blind Peer Reviewed (Refereed/Juried) Open Access International e-Journal - Included in the International Serial Directories
http://ijrcm.org.in/
113
accurately captured the role of MSM in the epidemiology of HIV/AIDS in India: questionnaires that use the variable of “marital status” in the absence of other variables relating to sexual preference will not capture useful information regarding MSM. Similar problems are encountered with non-examination-based information regarding anal and oral Manifestations of STIs. BEHAVIORAL CHANGE A great deal has been learned around the world about behavior change in relationship to HIV risk. The application in India and elsewhere of behavior-change interventions has been most effective when appropriate modifications were made to suit the unique construction of homosexual behavior as well as the local cultural norms. Specific interventions around particular places and behaviors should be favored over generic behavior-change approaches. Promotion of safer sex and condom use must take into account the discomfort many men feel while buying condoms in a public commercial setting. Encouragement of non-penetrative sex requires open discussion of sexuality in safe settings; therefore, identification of appropriate settings for such activities is vital. As part of information, education and communication (IEC) efforts to promote behavior change, condom distribution, and related education and outreach in public places (such as parks) have been successful. However, such work is currently restricted by police practices that do not allow public distribution of condoms in some parks. As mentioned earlier, there is a lack of acceptance of condoms as an STI prevention method, since condoms are strongly associated with heterosexual sex and with family planning, a trend observed elsewhere as well. An atmosphere of extremely limited discussion around anal STIs and HIV/AIDS among MSM compounds problems associated with low use of condoms and lubricants. PUBLIC EDUCATION Widespread IEC interventions in India have already led to an increase in understanding among the general population as to how the disease is spread. The next steps in such efforts need to address issues of destigmatization of HIV/AIDS; this is especially necessary among the MSM population that suffers already from considerable stigma. While models from a number of countries already exist, specific public education around issues of MSM is of doubtful utility in India at present. The intervention needs to weigh the potential benefit against the damage wrought by public backlash and insensitively handled education efforts. Although the increasing tolerance for sexually oriented public discussion may help foster constructive IEC efforts, it is the belief of the authors that direct public discussion of MSM may be premature in most areas of the subcontinent. MSM-oriented interventions need to be conducted cautiously and in confidential, safe settings. At present, the most successful model has been to frame the discussion as concerning risk behaviors associated with HIV/AIDS and men’s sexual health. This provides an adequate context within which MSM-oriented interventions can be conducted. There is widespread consensus within the MSM community on this issue, which provides validity to investigators working in this area. ACT ACT is an essential aspect of many HIV/AIDS prevention activities; it needs to become a norm for MSM-related HIV/AIDS interventions as well. The lack of knowledge of one’s HIV status allows the virus to continue to spread without recognition or response. Those who test HIV positive tend to adopt safer-sex practices, and ACT has been understood as a crucial part of changing social norms, which has slowed the spread of the disease in many countries. Since public knowledge of how the disease spreads has not in and of itself been proven to change behavior, more focused approaches, such as aggressive ACT, may therefore be important strategies to be undertaken in India. THE CONTINUUM OF CARE FOR HIV/AIDS PATIENTS Anal STIs may have special relevance to MSM with regards to medical care: anal warts, anal gonorrhea, and other sexually transmitted infections are, according to NGO-based clinics and the authors’ experiences, common among MSM and represent special treatment needs in the context of HIV/AIDS. However, knowledge among medical professionals regarding anal STIs (whether in men or women) is generally lacking. In addition, it is unlikely that patients who are MSM will offer this information to doctors except in safe settings. The provision of care for MSM in India is therefore problematic because of the hidden nature of MSM as well as the inadequate information among public health medical professionals. While it is likely that a resource limitation also exists with regards to such care, the basic foundation of the care continuum is so underdeveloped that issues of healthcare financing have not yet been approached or discussed to any significant degree.
RESULTS BASIC INFORMATION 1. 40% of respondents are literate and they have passed their Secondary school education 2. Occupation vise 80% 0f respondents working in Private sector and earning good salary 3. Very interestingly 10 (85%) respondents married and even they happy with their family life along with their male partner. 4. MSMs’ having their own group of equal minded people and group is not biased with any factors like, religion and caste and class. KNOWLEDGE Knowledge and information of HIV/AIDS of MSM’s is concern, all the respondents are having great knowledge and updated information, the area Belgaum itself covered with the good literacy level, and the source of information is the health workers (73.3% )even few of them updating themselves by electronic and print media. Respondents know about laboratory investigation to confirm HIV/AIDS, however, They all aware with the roots of transmit ion of HIV, and knew about consequences by unprotected sex, unsafe blood transmission, mother to child impact, using same syringe for group during drug injection. Along with these views they are with very good information, that how the disease not spread, and manifestation of HIV like; Weight loss, Persistent cough, Diarrhea on/ off at least for one month, Skin lesions, Prolonged fewer, etc. Since they are from one of the developed are of Karnataka, obviously, they know that, HIV/AIDS is not a contagious disease, not even curable, but it can be preventable, by using condom and other preventive measures, whereas, they know how to use the condom. ATTITUDE Attitude plays vital role in molding the personality of human being in right way, to smooth practice, for self dignity and protection from legal issues, MSM’s (100%) demand for the legalize the their activities, by that they want to come out from the inferiority and stigmatization from the society. Followed by this members of family/neighborhood should show empathy at MSM’ who infected by HIV/AIDS, and this is better way to show moral, emotional support to them to live quality life and sustainable future. Further, they opine that The job and the position of the infected fellow should retain forever, he shouldn’t be removed from job due to infection, any one should not feel discomfort, irritate, and biased of infection during; sharing the food, bathroom, toilet, shake hands, and to hug. Some respondents opine (20%)and conclude with the human rights concept that all the infected have all the right to live full and dignified life with their own family and children, infected one also can have his family and his/her offspring. But majority (80%) respondents reluctant to have family and children as they feel after them, no one come forward to look after their orphan kids. PRACTICE 1. When the practices are concern 80% of respondents used the condoms for first sexual act and rest of them not used, though knowing all the
consequences, they feel condom interrupt them to meet ejaculation condition. But after that unsafe sex of first attempt, respondents realized the worth of life and now they using condoms for every new attempt also they encourage their partners to use on regular basis.
2. Interestingly, majority of respondents (53.3%) opine that their partners reluctant use the condoms. Remaining (46.7%) respondents partners willingly ask to use the condoms for every new attempt.
3. 14 (93.3%) respondents have their regular partners and among them, 13(86.7%) respondents using condoms regularly, remaining 2 (13.3%) respondents not at all bother about to be infected of HIV.
4. Majority of them very health conscience, they wish to know the HIV status of their new partners, whereas they do very risk practice of both anal and oral sexual act (60%) and remaining 40% do only anal sex.
5. 93.3% respondents are bisexual, among them 93.3% wish to get marriage with woman; considerable thing is that they also want to continue relation with their male partners.

VOLUME NO. 3 (2013), ISSUE NO. 08 (AUGUST) ISSN 2231-5756
INTERNATIONAL JOURNAL OF RESEARCH IN COMMERCE, IT & MANAGEMENT A Monthly Double-Blind Peer Reviewed (Refereed/Juried) Open Access International e-Journal - Included in the International Serial Directories
http://ijrcm.org.in/
114
6. All are very eager to have their own children after marriage, and 73.3% never goes to FSW, habits are concern majority of (60%) them don’t have any bad habits.
SUGGESTIONS AND RECOMMENDATIONS WITH THE SOCIAL WORK PERSPECTIVE IMPROVE THE NETWORKS Special interventions that work through confidential networks may be a useful tool to study this dimension of the epidemic. Groups working with MSM have access to networks in which behaviors and diseases can be studied, but these groups have not been made a part of official government AIDS control programs yet. For example, successful models exist in the subcontinent that can be used to increase our understanding of highly stigmatized behavior and the spread of STIs: these include interpersonal communication, creating networks of at-risk MSM, and community-based outreach efforts. INFORMATION EDUCATION AND COUNSELING (IEC) IEC methods that utilize a variety of media, such as radio and television (mass media) and peer outreach (community-based media), have served as cornerstones of behavior change in countries that have had success in curbing STIs and HIV/AIDS. In particular, the promotion of anonymous and voluntary counseling and testing (ACT) are means of prevention that hold significant promise in the Indian context. In developed nations, testing is linked closely to treatment such as protease inhibitors and highly active antiretroviral therapy (HAART). However, the utility of testing and counseling as a method of behavior change in and of itself must not be neglected. In addition public look at the issue should be very critical and such people treated without biases and discriminations therefore social workers and personnel who have engage with the IEC programmes should look after these all. Public awareness programmes and acceptability are the best tools to find remedy with the discrimination and to avail MSM s in public utility activities and to lead social life without any taboo. TO PROVIDE AND IMPROVE THE HEALTH SERVICES Due largely to the hidden nature of the behaviors and the stigmatized nature of HIV/AIDS in India, MSM will generally not come forward for counseling and testing unless anonymity is ensured. Therefore, the distinction between “confidential,” when anonymity is attempted but not ensured, and true “anonymity,” when no recording of names is made, needs to be clarified to the audience targeted for such services. Modification of clinical practice in large public clinics is essential if the clinics are to play a positive role in the control of the epidemic. NGO and private sector healthcare have for a long time played a major role in the treatment of STIs in India: all social classes rely on the private sector for a large proportion of their care. The government and international development agencies can play a role by encouraging the private sector with education programs for healthcare professionals, providing quality control criteria to private laboratories, and assisting in the development of best practices for counseling and outreach. These ends can be reached by setting examples and by setting standards of practice for the private sector. LEGALIZATION OF MSM’S PRACTICES Legalization of such practices would be constructive remedy to prevent HIV/AIDS; also to promote marital relationship among them is the key to promote their health and peaceful life. It is need of the hour that Indian govt should take such rational step to prove its step towards welfare of MSM,s and implications of legalizing MSM practices.
REFFERENCES 1. According to Section 377, unnatural offenses include voluntary carnal intercourse against the order of nature with any man, woman, or animal. Unnatural
offenses are punishable by imprisonment and/or fine. Penetration is sufficient to constitute the carnal intercourse necessary to the offense described in this section.
2. D. Altman, “HIV, Homophobia, and Human Rights,” Health and Human Rights 2, no. 4 (1998): 15-22. 3. J. Cleland and B. Ferry, Sexual Behavior and AIDS in the Developing World (Geneva, Switzerland: World Health Organization, 1995); Sexually Transmitted
Infections Prevalence Study Methodology: Guidelines for the Implementation of STI Prevalence Surveys (Geneva, Switzerland: 4. J. Richters et al., “Condom Use and ‘Withdrawal’: Exploring Gay Men’s Practice of Anal Intercourse,” International Journal of STD and AIDS 11, no. 2
(February 2000): 96-104. 5. M. McGarry and F. Wasserman, Becoming Visible: An Illustrated History of Lesbian and Gay Life in Twentieth-Century America (New York: Penguin, 1998). 6. M.J. Friedrich, “HAART Stopping News: Experts Examine Structured Therapy Interruption for HIV,” Journal of the American Medical Association 283, no. 22
(14 June 2000): 2917-2918. 7. O.A. Khan, “The Role of Information, Education and Communication (IEC) in HIV/AIDS Prevention and Control in Pakistan,” WHO Eastern Mediterranean
Region AIDS News 2, no. 2 (June 1998); J.M. MacNeil and J. Hogle, “Applying Social, Behavioral and Evaluation Research to Developing Country HIV Prevention Programs,” AIDS 12 (1998): S99-108.
8. S. Desai, “Angry at Gay-nesh!” Pukaar 29 (April 2000): 16-24. 9. Venkatesan Chakrapani, Ashok Row Kavi, L Ramki Ramakrishnan, Rajan Gupta, Claire Rappoport, Sai Subhasree Raghavan (April 2002), HIV Prevention
Among Men Who Have Sex With Men (MSM) In India: Review Of Current Scenario And Recommendations WEBSITE 10. http://naco.nic.in/vsnaco/indianscene/update.htm

VOLUME NO. 3 (2013), ISSUE NO. 08 (AUGUST) ISSN 2231-5756
INTERNATIONAL JOURNAL OF RESEARCH IN COMMERCE, IT & MANAGEMENT A Monthly Double-Blind Peer Reviewed (Refereed/Juried) Open Access International e-Journal - Included in the International Serial Directories
http://ijrcm.org.in/
115
RELATIONSHIP BETWEEN INFORMATION SECURITY AWARENESS AND INFORMATION SECURITY THREAT
WILLIAMS SOLOMON ADEDAYO STUDENT
SCHOOL OF COMPUTING UNIVERSITI UTARA MALAYSIA
MALAYSIA
AKANMU SEMIU AYOBAMI RESEARCH SCHOLAR
SCHOOL OF COMPUTING UNIVERSITI UTARA MALAYSIA
MALAYSIA
ABSTRACT Information security threat has been reported to be on the increase among users of internet technologies, especially the academic communities, comprising the students, lecturers and tutors. In attending to this situation, past studies have either conceptually discussed or empirically studied some related factors to information security threat generally, with few (if at all any) studied information security awareness’ relationship within the conceptual framework of community training, vulnerability to threat, perceived threat severity and compliance to security policies with information security threat. And none has studied this among the Universiti Utara Malaysia community. This paper studies these factors in view of the relationship between information security awareness and information security threat among the Universiti Utara Malaysia students’ community. This study uses Quantitative method, with Pearson correlation as the statistical tool. The findings of this study showed that community training; vulnerability to threat, perceived threat severity and compliance to security policies within the concept of information security awareness is positively related to information security threats.
JEL CODE M15
KEYWORDS community training, information awareness, information security threats, perceived threat severity, vulnerability to threat.
INTRODUCTION he development that takes place in internet and computer networking technology has consequently led to security challenges as evident in the increase of information threats. This development has undoubtedly necessitated new security measure and policies to reduce the intensity of the threat and the challenges being encountered from the emergence of the new technology (Alshboul 2010).
It is noticed that new technology is very easy to adopt and be adapted with, but most institutions do forget to put a security measure in place in order to safeguard the organization information from being tampered with. Information Integrity is essential, and this is about trustworthiness, origin, completeness and correction of information, with due obstruction of unauthorized modification of information (Al-Awadi et al., 2007; Baker & Wallance, 2007). The integrity of information security in this context is not concerned about organizations only, but also expands to the integrity of the source of information and the users who are in charge of the organizations’ information systems. Most importantly, it is observed that threats of information leakage are experienced more when the students share the data of the organization and is compromised by an intruder’s intervention. Many encountered problems of threats and viruses in Universiti Utara Malaysia (UUM) are sometimes as a result of negligence on the part of the staff or the administrators that are in charge of the organization information and data mart. Mikko (2000) disclosed that when an unauthorized personality or user has the access to information system and discloses the content of the confidential document or information, it has a bad effect in the security and privacy of the community. Therefore, the UUM management has a role to play in the security of information of the UUM community, and the users should be fully aware of such incoming threat so as to safeguard their respective information from intruder (Sraub and Welke, 1998). In the same vein, Siponen (2000) and Benzel et al., (2012) affirmed that the organization top manager, meddle manager and even the workers do ignore the issues bothered on security, and the outcome of this neglect in any organization as seen in UUM system are worst damaged more than the expectation.
REVIEW OF LITERATURE THE RELATIONSHIP BETWWEN COMMUNITY TRAINING AND INFORMATION SECURITY THREATS Dutta & Mcrohan (2002) suggested that establishing the concept of network security is important. Therefore, users of the information system must be actively engaged in education and training that will enhance security awareness. They stated that the education should mainly aim at how the security policy safeguards the organization information from the intruders. He explained that the organization should be conducting training that will inform the community of specific actions that are necessary to be put in place to protect them against the security threats or violence. Training should involve specific technical equipment that will mitigate information security threat on information system. Dhillon (2000) stated that the organization should engage in the basic education and training program to achieve expected result from the implementation of information security policy. Lampson (2002)’s view is that the negligent of the employees on duty could consequently give the hackers a full privilege to perpetrate their illicit act on the organization system. More carelessness in log off while on break or closing period recording passwords on sticky note on the computer system or sharing the confidential document with unauthorized person. The expected effort is to get the community trained on basic thing they have to know. Giving a basic training and making them to know the consequence of security threat, this could make them to be fully aware and be conscious of hackers and intruders. THE RELATIONSHIP BETWEEN VULNERABILITY TO THREATS AND INFORMATION SECURITY THREATS Claar (2011) and Brahim and Zhao (2009) argued that vulnerability of the user or individual judgment about the danger of his or her information is inside the computer system. Vulnerability to threats is the weakness of information and information system. This can consequently lead to attack, modification and destruction. The new threat occurs when an organization relies on it. Johnston (2010) expanded on threat as a symbol that indicates the incoming dangers. Kumar & Subramanian (2008) argued it to be a condition of vulnerability that could result to insecurity of an organization security. Alshboul (2010) and Humaidi & Balakrishnan (2004) examined the information system security measures: protecting organization asset from malicious attack. The research constructed a method that gave the definition of information security level in organization. Given the definition of information security this level
T

VOLUME NO. 3 (2013), ISSUE NO. 08 (AUGUST) ISSN 2231-5756
INTERNATIONAL JOURNAL OF RESEARCH IN COMMERCE, IT & MANAGEMENT A Monthly Double-Blind Peer Reviewed (Refereed/Juried) Open Access International e-Journal - Included in the International Serial Directories
http://ijrcm.org.in/
116
affirms with measuring security layers which are network security, physical security and personal security in the companies. The study tried to find the correlation between the company’s assets, security vulnerability, security attack and determining the security level, so as to protect the integrity, availability and also the confidentiality of the organization’s asset. THE RELATIONSHIP BETWEEN PERCEIVED THREATS SEVERITY AND INFORMATION SECURITY THREATS In the words of Joo et al. (2011), the determinants of information security that are affecting the adoption of web-based information systems are analyzed. For this reason, a theoretical model was designed to examine the relationship between organization factors deterrent efforts and severity; preventive effort and individual factor of information security threat; security awareness and intention to actively use the web-based IIS. The outcome of the analysis stated that deterrent severity is not related with proactive used intention of ISS while the preventive effort has a relationship with proactive use of intention of IIS. Stephanou et al (2008) and Casmir (2005) examined the insider misuse of information system resource. According to him, the information system misuse has been posing a great challenge to organizations. Their aim was to present the extended deterrence theory model that consists of study from criminology, information system and psychology. The model shows that the awareness of security countermeasures directly influences the perceived severity and certainty of punishment that come with information systems misuse which can make the information system to reduce misuse intention. The outcome of the study suggested that three practices deter information misuse, training and awareness program; user awareness of security policies, security education and computer monitoring. The outcome also suggested that the perceived severity of sanction may be more efficient in bringing down the information security misused more than certain sanctions. THE RELATIONSHIP BETWEEN COMPLIANCE TO SECURITY POLICIES AND INFORMATION SECURITY THREATS Siponen et al (2007) studied employees’ failure in compliance with the information system security. To address the compliance of the employees, he integrated habit which is the form of the behaviors. The empirical test showed that the habitual information system security with compliance will adaptively persuade the process. He also found out that nearly all the components are positively related to employees’ intention to agree with information system security policies. The result thus shows that there is a relationship between the two. Significantly, it highlights the reason for addressing employee’s past and automatic behavior so that there will be an improvement in compliance. Herath & Rao’s (2009) study on a theoretical contract model and information security model. This model was tested to evaluate and determine the relationship between penalties, pressure, the perceived and effectiveness of employees’ responses and the understanding of employees’ compliances to information security policies. The result of the examination shows that security behavior can act both as intrinsic and extrinsic motivators. The pressure applies by subjective tradition and friend behaviors influence employee’s information security habit. The intrinsic motivation of workers perceived effectiveness of their respective action is discovered to have a crucial role to play in security policy and compliance intention. The findings showed that the penalties and the assurance of detection were found to have a significant role while the severity of punishment has a negative effect on a security habit of compliance intention. The result showed that the severe punishment is negatively related to compliance of employees in any companies’ information security. Because of this, the adoption of awareness could be better applied than the severity punishment.
THE RESEARCH MODEL FIGURE 1: BELOW GIVES THE CONCEPTUAL RESEARCH MODEL OF THIS STUDY.
IMPORTANCE OF THE STUDY This study derives its niche from the limitations of previous studies as stated above, and these consequently form the base of this particular research. This study critically and empirically looks at the relationship between information security awareness and the information security threat. The contents of the awareness will be used and evaluated are the training, vulnerability, perceived severity of the security threat and compliance with security policies. This study’s contribution and significances are: (1) the conceptualization of information security awareness using training, vulnerabilities, perceived severity of security threat and compliance with security policies, then (2) the empirical study of their relationship and its contextual application to the Universiti Utara Malaysia’s community.
STATEMENT OF THE PROBLEM The limitation from previous studies and the recommendation by Herath & Rao’s (2009) on the need to re-conceptualized information security awareness necessitate this study. Lampson (2002) argued that organization will continuously be facing the issue of threat and insecurity due to the high cost maintenance of security facilities, and its sustenance. It is on this premise that this study want to answer a central question that: What is the relationship between information security awareness and information security threats in University Utara Malaysia’s community, conceptualizing information security awareness using community training, vulnerability to threat, perceived threat severity and compliance to security policies?
OBJECTIVES The objectives of this study are to study the relationship between: i. Community training and information security threat, ii. Vulnerability to threat and information security threat, iii. Perceived threats severity and information security threat; and iv. Compliance to security policies and information security threats.
HYPOTHESES The hypotheses to be tested by this study are four; these are: H1 Community training has a relationship with information security threats H2 Vulnerability to threats has a relationship with information security threats.
COMMUNITY TRAINING
VULNERABILITY TO THREATS
PERCEIVED THREATS SEVERITY
COMPLIANCE TO SECURITY POLICIES
INFORMATION SECURITY THREATS
INFORMATION
SECURITY AWARENESS

VOLUME NO. 3 (2013), ISSUE NO. 08 (AUGUST) ISSN 2231-5756
INTERNATIONAL JOURNAL OF RESEARCH IN COMMERCE, IT & MANAGEMENT A Monthly Double-Blind Peer Reviewed (Refereed/Juried) Open Access International e-Journal - Included in the International Serial Directories
http://ijrcm.org.in/
117
H3 Perceived threats severity has a relationship with Information security threats. H4 Compliance to security policies has a relationship with information security threats.
RESEARCH METHODOLOGY Research methodology involves four different phases: the definition of the problem, data collection, data analysis, and reporting (Sekaran, 2006). These are designed and tailored to precisely answer the research questions, test the hypotheses and achieve the research objectives. The data collection being an important stage of the research process highlights the appropriate selective mode showing the correct use of instrument. This study utilizes an adapted self administered Questionnaire as an instrument of data collection. The data analysis is be done with the appropriate statistical tools in SPSS, and with the descriptive analysis and correlation to answer the earlier posed research questions and achieve the research objectives. The last stage of the research is the Reporting, it constitutes of the research findings and analysis, and the interpretation of the analysis, conclusion of the research. It is important that at the study’s conclusion, the stated objectives and elicited questions of this study would have been appropriately answered. POPULATION AND SAMPLING Population in the research context is understood as the total number of the elements in a study, and the sampling is the process of appropriately deciding on the representative selected group from the bigger population (Babbie, 2010). Kumar (2011) argued that random sampling as the appropriate form of probability sampling; that is for a study that has access to a demarcated and accessible study population. Babbie (2010) affirmed the correctness of random sampling and suggested different ways on how to go about selecting respondent randomly. The population used in this study is graduate students of school computing and multimedia comprising of both the Master students and PhD students which amount to 440. The population comprises of UUM’s post graduate students with regular use of internet and thus has full knowledge of what information security is all about. According to Krejcie and Morgan (1970), a population range between 440 will have a sample size of 205. To ensure the accuracy of this study’s findings, the researcher makes use of 205 as the sample size, but a response rate of 73% was made, hence made the number of the respondents to be 150. CONSTRUCT VALIDITY Construct validity is by testing how reliable is the instrument items under each variable constructed of the questionnaire. This is done with the use SPSS reliability test. The Cronbach’s Alpha level is then interpreted to determine the reliability of the item of each variable construct.
RESULTS AND DISCUSSION RESULTS The results of the statistical analysis are presented in this section. The results of the reliability tests, hypothesis 1, 2, 3 and 4 are given in tables 1, 2, 3 and 4 respectively. RELIABILITY TEST The reliability test for this study is done using construct reliability after the original data of the study is gathered from the respondents. The result is then compared with that of the pilot study using a uniform scale validation so as to examine the consistency of the study instrument. Table 1 presents the reliability testing with the pilot testing.
TABLE 1. RELIABILITY TEST
No Variable No. of Item Pilot Test Main Test
1 Community Training 5 0.798 0.781
2 Vulnerability to Threats 5 0.732 0.703
3 Perceive Threat Severity 5 0.745 0.702
4 Compliance to Security Policies 5 0.738 0.703
TABLE 2: RESULT FOR HYPOTHESIS 1
**Correlation is significant at the 0.01 level (2-tailed).
TABLE 3: CORRELATION RESULT FOR HYPOTHESIS 2
INFORMATION SECURITY THREATS
Vulnerability to threats Pearson Correlation 793**
Sig. (2-tailed) .000
N 150
**Correlation is significant at the 0.01 level (2-tailed).
TABLE 4: CORRELATION RESULT FOR HYPOTHESIS 3 **Correlation is significant at the 0.01 level (2-tailed).
TABLE 5: CORRELATION RESULT FOR HYPOTHESIS 4
INFORMATION SECURITY THREATS
Compliance to security policies Pearson Correlation 751**
Sig. (2-tailed) .000
N 150
**Correlation is significant at the 0.01 level (2-tailed).
INFORMATION SECURITY THREATS
Community training Pearson Correlation Sig. (2-tailed) N
.791**
.000 150
INFORMATION SECURITY THREATS
Perceived threats severity Pearson Correlation 741**
Sig. (2-tailed) .000
N 150

VOLUME NO. 3 (2013), ISSUE NO. 08 (AUGUST) ISSN 2231-5756
INTERNATIONAL JOURNAL OF RESEARCH IN COMMERCE, IT & MANAGEMENT A Monthly Double-Blind Peer Reviewed (Refereed/Juried) Open Access International e-Journal - Included in the International Serial Directories
http://ijrcm.org.in/
118
DISCUSSION From the descriptive analysis of this study, the respondents’ demographics were not essentially captured because they are not of importance in studying the relationship between information security awareness and information security threats. The part attended to was the gender distribution, and this study recorded more male respondents than the female. However, the gender frequency is of no specific interest, therefore, the descriptive statistics has no importance. Specifically, they are postgraduate students, thus conforms with the need to make the enquiry from a set of respondents that can objectively and accurately respond to the set of items in the questionnaire. This will ensure precise answers to the research questions expected to be answered in testing the hypotheses of this study. COMMUNITY TRAINING HAS RELATIONSHIP WITH INFORMATION SECURITY THREATS This study has inferred from its findings that community training relationship with information security threats. Siponen et al (2007) findings supported the empirical findings of this study, stating that awareness through training has a relationship with information security threat. The contents of the awareness was explicitly said to be training and compliance with security policies. VULNERABILITY TO THREATS HAS RELATIONSHIP WITH INFORMATION SECURITY THREATS In support of the finding of this study that vulnerability to threat is related to information security threat, Joo et al (2011) reported that there is an association between the company’s assets, security vulnerability, security attack and determining the security level, in protecting the integrity, availability and also the confidentiality of the organization’s asset. The study also agreed that vulnerability to threat endangers the company’s confidentiality, hence increases information security threats. PERCEIVED THREATS SEVERITY HAS RELATIONSHIP WITH INFORMATION SECURITY THREATS This study, from the empirical findings found that perceived threat severity has a relationship with information security threats. From past related works, Joo et al (2011) in their study reported that deterrent severity is not related with the proactive used intention of Information systems while the preventive effort influences the proactive use of Information systems security. Siponen et al (2007) from their findings submitted that the awareness of security countermeasures has a relationship with the perceived severity and certainty of punishment that comes with information systems. Also, Herath & Rao (2009) found that severity of punishment have a negative relationship on a security habit of comply intention. It is further stated that severe punishment influences the employees’ compliance in any companies to information security. Thus, submitted that the adoption of awareness could be better applied than the severity punishment. COMPLIANCE TO SECURITY POLICIES HAS A RELATIONSHIP ON INFORMATION SECURITY THREATS The result of this study is that compliance to security policies has impact on information security threats. Notably, past studies have not singly pointed to compliance to securiy policies as a factor leading to information security threats. Like Siponen (2000), Herath & Rao (2009) and SD'Arcy et al. (2009), perceived severity has been studied to have a direct linkage with compliance to security policies, subsequently affecting information security threat. This study, among other few ones studied the impact of compliance to security policies directly on information security threat, and also found that they are related with compliance to security policies having impact on information security threats.
FINDINGS RESEARCH HYPOTHESES’ TESTING As earlier stated, this study analyses and test the study’s hypothesis using SPSS. Pearson product-moment correlation was used to test the research hypotheses as related in the relationship between the independent and dependent variables. This is done after due data screening and cleaning. The inferential analysis is to study the relationship between the independent variables and the dependent variable. In doing this, Correlation as a statistical tool was used (Sekaran, 2006; Hair et al, 2008; and Pallant 2011). H1 Community training has a relationship with information security threats The hypothesis of the relationship of community training on information security threats as elicited in this study uses Pearson product-moment correlation for its testing. A high directional (positive) correlation between community training and information security threat was found, this equation explains the result of the correlation [r—0.791, n-150, p<.05]. It is thus shown that the 79% variance in community training could be explained by 79% changes in information security threats variable. With the significance less than 0.05, it shows that the tested hypothesis is accepted. The result presented in Table 4.3 is therefore achieves the first research objective. H2 Vulnerability to threats has a relationship with information security threats. The second hypothesis of this study is also tested with Pearson product-moment correlation, confirming the hypothesis of the relationship of vulnerability to threats variable on information security threat. The correlation result as shown in Table 4.4 shows a high positive relationship between vulnerability to threat and information security threat, [r—0.793, n-150, p<.05]. This can be interpreted that the 79% variance in vulnerability to threat is associated to 79% variances in the information security variable. This achieves the second research objective, and the hypothesis is accepted. H3 Perceived threats severity has a relationship with Information security threats. The third hypothesis of this study is equally tested with Pearson product-moment correlation, and the result of the correlation is presented in Table 4.5. The result states that there is a correlation coefficient between perceived threats severity as a variable, and speaking anxiety. The result is further explained with the following correlation equation [r—0.741, n-150, p<0.05]. It shows that 74% variances in perceived threats severity is explainable by 74% variances in its relations with Information security threats. This answers the third research question, and shows the research objective is achieved. H4 Compliance to security policies has a relationship with information security threats. The fourth hypothesis of this study is tested with Pearson product-moment correlation also, and the result of the correlation is presented in Table 4.6, showing that there is a correlation coefficient between compliance to security policies and information security threats. This result can be further explained using the following correlation equation [r—0.751, n-150, p<0.05]. It is that 75% variances in compliance to security policies explain 75% variances in the relations with Information security threats variable. This result answers the last question of the study that: What is the impact of compliance to security policies on information security threats?, hence achieves the fourth research objective.
RECOMENDATIONS RECOMMENDATIONS FOR FUTURE STUDY Continuous nature of research is an unavoidable happening, as one research’s conclusion opens the necessity for another research. From the conclusion of this study, the future studies recommended are: 1. Using other SPSS statistical tool like Regression to further examine the effect of dependent variables on the independent variables 2. Employment of more statistical analysis tool like Structural Equation Modelling to strengthen the inferential analysis of this study 3. Employment of mixed method research, by consolidating the research findings with Qualitative methods to examine further studies.
CONCLUSION From the literature review, the data analysis, results and the research findings agreed with the hypotheses tested by this study. This study objectively established the facts that each of the independent variables of this study: community training, vulnerability to threats, perceived threat severity, and compliance to security policies is positively related to the dependent variable; Information security threat. This study has further added to the weight of previous studies on the relationship of community training, vulnerability to threats, perceived threat severity, and compliance to security policies on information security threat with due empirical findings. This study has further strengthened past related works that

VOLUME NO. 3 (2013), ISSUE NO. 08 (AUGUST) ISSN 2231-5756
INTERNATIONAL JOURNAL OF RESEARCH IN COMMERCE, IT & MANAGEMENT A Monthly Double-Blind Peer Reviewed (Refereed/Juried) Open Access International e-Journal - Included in the International Serial Directories
http://ijrcm.org.in/
119
submitted similar findings as regards information security threat reduction, and becomes important for policy makers, information security experts and information technology users in fostering information security. Conclusively, this study delivers an empirical result that community training, vulnerability to threats, perceived threat severity and compliance to security policies summing up to information security awareness have impact on information security threat among the Univerisiti Utara Malaysia’s students community.
REFERENCES 1. Al-Awadi, M., & Renaud, K. (2007), “Success factors in information security implementation in organizations,” Paper presented at International conference
on e-society. 2. Alshboul, A. (2010), “Information Systems Security Measures and Countermeasures: Protecting Organizational Assets from Malicious Attacks,”
Communications of the IBIMA. 3. Babbie, E. (2010), “The Practice of Social Research”, 12th Edition. Wadsworth Cengage Learning, USA. 4. Baker, W. H., & Wallace, L. (2007), “Is information security under control?: Investigating quality in information security management. Security & Privacy,”
IEEE, 5(1), 36-44. 5. Benzel, T. V., Irvine, C. E., Levin, T. E., Bhaskare, G., Nguyen, T. D., & Clark, P. C. (2012), “ Design principles for security,” IEEE Transaction on Security, 29-38 6. Brahim, A., & Zhao, l. (2009),”Supporting the osgi service platform with mobility and service distribution in ubiquitous home environments”, The Computer
Journal, 52(2), pp 210-239. 7. Casmir, R. (2005): “Dynamic and adaptive information security awareness (DAISA) approach”, Dissertation, University of Stockholm. 8. Claar, C. L. (2011): “The Adoption of Computer Security: An Analysis of Home Personal Computer User Behavior Using the Health Belief Model”,
Dissertation, Utah State University. 9. Dhillon, G., & Backhouse, J. (2000), “Technical opinion: Information system security Management in the new millennium”, Communications of the ACM,
Vol. 43(7), pp 125-128. 10. Dutta, A., & McCrohan, K. (2002), “Management’s role in information security in a Cyber Economy,” California Management Review, Vol. 45(1), pp 67-87. 11. Gaston, S.J. (1996), “Information security: security strategy for successful management”. CICA Publishing, Toronto. 12. Hair, J.F., Black, W., Babin, B., & Anderson, R. (2009), “Multivariate Data Analysis”. Prentice Hall, UK. 13. Herath, T., & Rao, H. R. (2009), “Encouraging information security behaviors in organizations: Role of penalties, pressures and perceived effectiveness”,
Decision Support Systems, Vol. 47(2), pp 154-165. 14. Humaidi, N., & Balakrishnan, V. (2004), “The Influence of Security Awareness and Security Technology on Users’ Behavior towards the Implementation of
Health Information System: A Conceptual Framework”, Communications of the ACM, Vol. 40(3), pp 57-59 15. Johnston, A. C., & Warkentin, M. (2010), “Fear appeals and information security Behaviors: an Empirical study. Mis Quarterly, Vol. 34(3), 549. 16. Joo, J., Kim, M. J., Normatov, I., & Kim, L. (2011), “Determinants of Information Security Affecting Adoption of Web-based Integrated Information Systems”,
IEEE, Vol. 5(1), pp 36-44. 17. Krejcie, Robert V., Morgan, Daryle W. (1970), “Determining Sample Size for Research Activities”, Educational and Psychological Measurement. 18. Kumar, R. (2011), “Research Methodology, a step-by-step guide for beginners”. SAGE Publication, Singapore. 19. Kumar, R. L., Park, S., & Subramaniam, C. (2008)”, “Understanding the value of countermeasure”, ICT Journal, pp. 80-89 20. Papadopoulou, P., Kanellis, P., & Martakos, D. (2000), “Trust formation in e-commerce relationships, Paper presented at the 7th Research conference,
Spain 21. Sekaran, U. (2006), “Research methods for business: A skill building approach.” John Wiley & Sons, UK. 22. Siponen, M. T. (2000), “A conceptual foundation for organizational information security awareness. Information Management & Computer Security, Vol.
8(1), pp 31-41. 23. Siponen, M. T., & Oinas-Kukkonen, H. (2007), “A review of information security Issues and Respective research contributions, ACM Sigmis Database, Vol.
38(1), pp 60-80. 24. Stephanou, A. T., & Dagada, R. (2008), “The Impact of information Security Awareness Training on Information Security Behaviour: The Case for Further
Research.” Information Security, South Africa. 25. Straub, D. W., & Welke, R. J. (1998), “Coping with systems risk: security planning Models for Management decision making”, Management Information
Systems Quarterly, Vol. 22, pp 441-470.

VOLUME NO. 3 (2013), ISSUE NO. 08 (AUGUST) ISSN 2231-5756
INTERNATIONAL JOURNAL OF RESEARCH IN COMMERCE, IT & MANAGEMENT A Monthly Double-Blind Peer Reviewed (Refereed/Juried) Open Access International e-Journal - Included in the International Serial Directories
http://ijrcm.org.in/
120
WHY MBA STUDENTS ARE NOT EMPLOYABLE? (WITH REFERENCE TO DAVANGERE MBA STUDENTS)
ASIFULLA A LECTURER
INSTITUTE OF MANAGEMENT STUDIES DAVANGERE UNIVERSITY
TOLHUNSE
ABSTRACT “Education Is the Key to Unlock the Golden Door” this beautiful quote is only good to hear but in reality education is not creating a golden opportunities for students to get a better job after their completion of studies. There are many reasons that why students has failed in getting a job. We have highlighted in this article about the reasons for the failure of student’semployability. We have shown one model about the factors influencing a student to become employable. Many of the research scholars and professors have proved that management education in India is in crisis due to the lack of student’s employability. Aim of the paper is to know the reasons for the failure of MBA students in getting a job and to know their perception about the MBA program. We have chosen 100 respondents (MBA Pursuing students) as our sample size. In survey we used Stratified and Simple Random sampling technique is used and to analyze data we have used Likert Scale of 5 point rating, Garrett Ranking Method and Chi-square for hypothesis analysis. After the data analysis we found that most of the MBA students have perception that, MBA is to get better job and high pay. But, they are not focused to their development of skills required or expected by the industries.
KEYWORDS Employability, Model, Perception, Skills.
INTRODUCTION anagement education is in great demand especially after the change towards liberalization, privatization and globalization. Management education need to be made value based, rather than money based. India is facing a crisis of quality management education. As compared to international standards the Indian management institutions (with a few exceptions) are far behind. There is a need to fill this gap. The Changing Scenario; Industry
and Academia Interface; Teaching and Evaluation in Management Education; Developing Competence of Management Teachers: Management Education and Up gradation of Students Skills; Management Education and Indian Ethos. Presently there are more than 3000 management colleges exists across the India and many among them like Indian Institute of Management(IIM) are counted among the best of the world. India's entry in the globalization process also acted like a catalyst in this management education boom. Because of the increasing number of global and Indian multinationals, trained management graduates are in demand and this demand too actively fuelling the interest of more number of students every day. There are several challenges of management education which require change in the character and structure of management education with corporate sector, up gradation of curriculum and course content, designing of different programs for executives, maintenance of an efficient and effective regulatory system to check mushrooming, and emphasis on research. [5][6]
LITERATURE REVIEW The definition of employability emphasizes skills and dispositions that might make an individual attractive to potential employers, often although not necessarily focusing on short-term employment outcomes. [22] The confederation of British industry (1999) defined employability as being ‘the possession by the individual of the qualities and competencies required to meet the changing needs of employers and customers, [21] Joseph Gerocs, Junior, SanDiego state university. (2002) the Australian chamber of commerce and industry(ACCI) and the Business Council of Australia (BCA) represents employability skills as ‘skills required not only to gain employment, but also to progress within an enterprise so as to achieve one’s potential and contribute successfully to enterprise strategic directions(ACCI and BCA, 2002).“To me my success in the classroom depends on the teacher. If the teacher is prepared and knowledgeable about their particular field, I know I can expect to learn from their knowledge as well as known what is expected of me”, *17+ B.R Purkait (June, 2000), proved that the unhealthy growth of higher education should be restricted as it has produced undesirable results. The internal efficiency of the higher education system is very low. In most cases university education has degenerated into dictation of unrevised notes prepared years ago they impart dead theoretical information without reference to practical facilities for corporate life. [3] E.G Vedanayagam (2000) has proved that, students should become attentive to what is to be learned. Student’s attention and interest can be captured by lecturers with humor, nonverbal communication, logical statements and enthusiasm. [12] Dr. G.Sudhakar (2000) has identified that, there should be proper flow up and the quality control of the curriculum should be maintained at appropriate levels. [7] Dr. K.Joshi (2000) stated that, at the higher level of education pursuit should be through the means of widest inspiration, critical examination and free experimentation. [9] Arvin Dhond (2012) has proved that, the employability of graduates is a subject matter of great concern, and which is not done by the higher educational institutions. [2] Dr. Noor Afza (2012) has proved that, business curricula shall be redesigned very frequently once in a year if not practicable at least once in a year. [10] Dr. V.Murugaiah and Ravi Kumar H.B (2012) has identified that, Management education can play a crucial role in Job and Wealth creation for the nation. [11] Dr. Giridhar K.V and Mr. Rajeev D (2012) they proved that, it is imperative for business schools to bring academia and industry closer and build strong collaborative relationship in order to develop students. [8] Miss. Rashmi M (2012) has recommended that, higher education always needs research and development activities. [14] B.Shivraj (1997) has mentioned that, there is an urgent need to reorient and re-engineer management education in India. [4] R.Bandyopadhyay (1991) has stated that, management of management institutions must improve to ensure credibility. A total program of improvement or structural changes must be designed keeping future challenges in mind. [2] M.S Narayan (1994) has proved that, India is not underdeveloped but only under managed due to lack of sufficient well qualified managers, there is a death of leadership in Indian industry such a death of leadership can be filled upthrough reorientation of management education in the country.[15]
NEED OF THE STUDY There is a need to undertake the study to understand the key areas in which students are failing to be become employable. There is a need to understand the factors affecting students to become unemployable and their perception towards MBA program.
M

VOLUME NO. 3 (2013), ISSUE NO. 08 (AUGUST) ISSN 2231-5756
INTERNATIONAL JOURNAL OF RESEARCH IN COMMERCE, IT & MANAGEMENT A Monthly Double-Blind Peer Reviewed (Refereed/Juried) Open Access International e-Journal - Included in the International Serial Directories
http://ijrcm.org.in/
121
STATEMENT OF THE PROBLEM Learning Domain/Discipline has more dimensions added into it for effective learning. It is imperative to understand, explore and describe what critical factors like leadership, culture, Attitude, motivation; Communication skills, etc. will have greater impact on successful learning and overall development of the students. To sustain and survive in corporate world, management students are facing many challenges and problems to get hired from the best companies. The reasons for the failure of students need to be identified. There is a need to understand and identify the real issues or problems facing by management students to become employable.
OBJECTIVE OF THE STUDY To know the factors making students to become less confidence.
To know the major reasons for students failure in getting better job.
HYPOTHESIS OF THE STUDY H01: There is no significant relationship between getting better job and joining to MBA Program.
RESEARCH METHODOLOGY SAMPLING TECHNIQUE: Stratified and Simple Randomsampling technique is used. MEASUREMENT:The questionnaire was designed specially to make use of Likert Scale to determine the student’s attitude towards employability and their perception towards MBA program. Respondents were asked to express opinions about the education provided to them by their institutes and to know the factors affecting students to become unemployable. SCOPE OF THE STUDY: Our study is geographically restricted to Davangere city with the sample size of 100. And have considered 07 MBA institutes for our sample size. Among the whole sample size we have stratified two groups they are Students pursuing MBA Program and Students Completed.
FOUNDATION OF MODERN EDUCATION IN INDIA India has an age old heritage of education but it was largely based on caste and social status rather than being equally available to all. Traditional Hindu education served the needs of the Brahmin families. Brahmin teachers would teach boys to read and write. Under the Mughals, education was similarly elitist, favoring the rich rather than those from high-caste backgrounds. These pre-existing elitist tendencies were reinforced under British rule. British colonial rule brought with it, the concept of a modern state, a modern economy and a modern education system. By linking entrance and advancement in government service to academic education, colonial rule contributed to the legacy of an education system while preserving the position and prerogatives of the more privileged. In the early 1900s, for the first time demand for technical and vocational training in education was raised by the Indian National Congress. Pt. Jawahar Lal Nehru (the first prime minister of Independent India) envisaged India as a secular democracy with a state-led command economy. Education for all and industrial development were seen as crucial tools to achieve economic prosperity and social equity. Following independence, school curricula were, thus, imbued with the twin themes of inclusiveness and national pride. It is through the first five year plan in 1950-51; India began its program for providing free and compulsory education to all children by transforming the elite oriented system of school education inherited from the colonial rulers to a mass education program. The Indian Constitution resolves to provide quality education to all. In the effort to fulfill educational needs of the country, specifically for the diverse societies and cultures of the country the government has chalked out different educational categories namely, Elementary Education, Secondary Education, Higher Education, Adult Education, Technical and Vocational Education. Institutions of excellence in higher education were formed with a view to provide subsidized quality higher education to build a self-reliant and modern India. Even at present these institutions are recognized among the best in the world. [17] [18] [19] A MODERN DAY BUSINESS MANAGER IS REQUIRED TO HAVE PROFICIENCY IN: • Inter-personal skills. • Knowledge of functional interdependencies and adaptability. • Communication skills. • Self-confidence and motivational skills. • Drive to succeed and control with initiatives. • Entrepreneurial Skills • Management skills
TABLE 01:GROWTH OF MANAGEMENT EDUCATION IN INDIA IN LAST FIVE YEARS
Year Management Institutes (AICTE approved)
2006-07 1132
2007-08 1149
2008-09 1523
2009-10 1940
2010-11 2262
2011-12 2385
Source: Contemporary Management Education Edited book (Tumkur University) 2012 The above table depicts that, there is a continuous growth in establishing new management institutes in India which are approved by AICTE. On an average nearly 400 institutes are newly started in every year since from the year 2006-07. This growth shows the demand of students showing interest to join management program in India. [25][24] MODEL SHOWING, FACTORS INFLUENCE A STUDENT TO BECOME EMPLOYABLE STUDENT The above model explains about the relationship between all three major elements to become employable. If a student has only communication skills he cannot be confident. Along with the communication skills he/she must have subject knowledge too. If both elements are balanced then only a student can become confident and if confidence is built then they become employable.
Communication Skills Subject Knowledge
Confident
Employable

VOLUME NO. 3 (2013), ISSUE NO. 08 (AUGUST) ISSN 2231-5756
INTERNATIONAL JOURNAL OF RESEARCH IN COMMERCE, IT & MANAGEMENT A Monthly Double-Blind Peer Reviewed (Refereed/Juried) Open Access International e-Journal - Included in the International Serial Directories
http://ijrcm.org.in/
122
DATA ANALYSIS TABLE: 02 SHOWING THE DEMOGRAPHICS OF THE RESPONDENTS.
Characteristics Frequencies Percent %
Gender Female Male
42 58
42 58
Age Group 20-25 Years 26-30year and above
84 16
84 16
Qualification: MBA(Pursuing) MBA(Completed) Total
70 30 100
70 30 100 %
Source: Primary Data
TABLE: 03 SHOWING THE MOST IMPORTANT FACTORS INFLUENCING TO JOIN MBA. WE HAVE USED GARETT RANKING METHOD
Factors Score Rank
For Getting Better Job 48 I
To sustain life 06 IV
To improve Knowledge 12 III
To get higher pay 32 II
To serve better for company 02 V
Source: Primary Data. The above table depicts that students are more concerned about getting better job and it’s ranked I by them. 32% of them are doing MBA to get better job and its ranked II. After looking out the result it’s clear that students have no objective of serving for the development of company.
TABLE: 04 TO KNOW THE FACTORS MAKING STUDENTS TO BECOME LESS CONFIDENT
Factors Responses Percentage
Communication skills 36 36
Subject knowledge 18 18
Competency level 16 16
Soft skills 10 10
Computer Proficiency 18 18
References 02 01
Source: Primary Data Interpretation: the above table depicts that students are lacking in communication skills and also the subject knowledge. Because of this gap they are less confident and may not be able to get a job.
TABLE 06: TO KNOW THE MAJOR REASONS FOR STUDENTS FAILURE IN GETTING BETTER JOB
Response Strongly Agree Agree No Comment Disagree Strongly Disagree Total
Lack of Communication skills in students 57 16 08 16 03 100
Students get stressed at the time of interview 30 12 20 28 10 100
Lack of proper knowledge leads to less confidence 22 24 41 10 13 100
Negligence is more in management students 23 22 36 10 08 100
Source: Primary Data Interpretation: most of the students lack in communication skills, for this reason they might get stressed in interviews. 46% of students agree that they lack in proper knowledge about subjects and 41% of them have not commented for the same. 45% of them agree they are neglected in studies only 10 % have disagreed for it. HYPOTHESIS TESTING H0: There is no significant relationship between getting better job and joining to MBA Program.
TABLE 07: DESCRIPTIVE STATISTICS
N Mean Std. Deviation Minimum Maximum
Students Join MBA to get better Job 100 3.3500 1.49325 1.00 5.00
Source: Primary data The mean value is 3.35 and standard deviation is 1.49.
TABLE 08: STUDENTS JOIN MBA TO GET BETTER JOB
Observed N Expected N Residual
Strongly disagree 16 20.0 -4.0
Disagree 17 20.0 -3.0
No comment 17 20.0 -3.0
Agree 16 20.0 -4.0
Strongly agree 34 20.0 14.0
Total 100
Source: Primary Data
TABLE 09: TEST STATISTICS
Source: Primary Data.
Students Join MBA to get better Job
Chi-Square(a) 12.300
df 4
Asymp. Sig. .015

VOLUME NO. 3 (2013), ISSUE NO. 08 (AUGUST) ISSN 2231-5756
INTERNATIONAL JOURNAL OF RESEARCH IN COMMERCE, IT & MANAGEMENT A Monthly Double-Blind Peer Reviewed (Refereed/Juried) Open Access International e-Journal - Included in the International Serial Directories
http://ijrcm.org.in/
123
Interpretation: the above hypothesis analysis elucidate that, the calculated chi-square value is less than the table value at df 4. Null hypothesis is rejected and we can say that there is a relationship between students joining MBA to get better job.
FINDINGS Students are more concerned about getting better job and it’s ranked me by them. 32% of them are doing MBA to get better job and its ranked II.
46% of students agree that they lack in proper knowledge about subjects and 41% of them have not commented for the same.
From the analysis of data we found that, most of the students have wrong perception about MBA program. They feel that by joining MBA they get high pay from companies and a better job.
44% of the students said that they are lacking in proper knowledge of current business scenario and are less aware about the emerging issues of business firms
From the analysis we also find that most of students are lacking in communication skills, computer proficiency, and skilled faculties at their institutes.
SUGGESTIONS Institutes need to take an initiation to increase the competency level of students in UG as well as in PG program.
There is a strong need and requirement in student’s development in the areas like, developing their communication skills and conducting personality development programs etc.
There is a gap among students between their knowledge and communication which leads to their confidence level, this gap has to be filled by all faculties and professors of institutes.
Industrial visits needed to be conducted for making students to understand the difference between theoretical and practical work.
There is a wrong perception among all that if they join MBA program they may get high pay after joining a company. Professors need to educate them that there is less opportunities for getting a high pay after immediate completion of their MBA.
CONCLUSION “Education is the key to unlock the golden door”. Faculties and professors play a major role in developing students. They are the major source to develop students by building competency level among students, making students employable by developing communication, knowledge and application of theory to all students. All these things can help students to open their golden door and make them to grab golden opportunities to sustain in their life by serving for companies in a better and efficient way.
LIMITATIONS OF THE STUDY Study is restricted to only Davangere city of Central Karnataka, India. Due to lack of sufficient time we have choose 100 as our sample size. Some of students were not able to disclose some issues of institutes.
REFERENCES 1. Arvind Dhond (2012). ‘an empirical study of employability of management graduates fromself-financing degree courses in Mumbai region’, ‘contemporary
management education edited book’2012, pp6-12. 2. Bandyopadhyay, R., (1991))"Indian Management Education: Need for a ConstructiveDebate”, Economic and Political Weekly, Vol.26,
No.48, pp.M118-M122. 3. B.R Purkait (June, 2000). ‘The national education policy, 1986’, ‘reading Material of 40thorientation program, university of Mysore’
pp.01-17. 4. B.Shivraj (1997) ‘Re-inventing MBA’, ‘The Hindu News Line july-24-1997’ 5. Bowonder, B. and Rao, S.L., (2004)"Management Education in India its evolution and some contemporary issues ", available at : http://www.aima-ind.org
/pdf/ Director_ Conclave_ Paper.pdf (accessed 25 October 2010). 6. Crowther, D.andCarter., (2002)"Legitimating Irrelevance: management education inhigher education in institutions", The International Journal of
EducationalManagement, Vol.16, No.6, pp.268-278. 7. Dr. G.Sudhakar (2000) ‘Curriculum Design’, ‘reading Material of 40th orientation program, university of Mysore’ pp.54-63. 8. Dr.Giridhar K.V and Mr.Rajeev D (2012) ‘enhancing student employability of management and workforce development’ ‘contemporary
management education edited book’2012, pp97-103. 9. Dr. K.Joshi (2000) ‘higher education and Pursuit of values’, ‘reading Material of 40thorientation program, university of Mysore’ pp.6882. 10. Dr. Noor Afza (2012) ‘quality assurance through customized imparting of concurrent knowledge and skills in management education’
‘contemporary management education edited book’2012, pp43-49. 11. Dr.V.Murugaiah and Ravikumar H.B (2012) ‘problems and prospects of MBA in government colleges of Karnataka state’ Paper presented at Tumkur
University in national conference‘contemporarymanagement education editedbook’2012, pp75.82. 12. E.G Vedanayagam (2000), ‘Learning in Higher education’, ‘reading Material of 40thorientation program, university of Mysore’ pp.18-53. 13. Engwall, L., (2007)"The anatomy of management education", Scandinavian Journalof Management, Vol.23, pp.4–35. 14. Miss. Rashmi M (2012) ‘challenges of management education in India’, ‘contemporary management education edited book’2012,
pp315-319. 15. M.S Narayan a (1994) ‘Marketing of Management education in India’, ‘Indian Journal of marketing’, Vol XX111 (sep.1994) pp.22. 16. MacNamara, M., Meyler, M. & Arnold, A., (1990)"Management Education and the Challenge of Action Learning", Higher Education, Vol.19, No.4, pp.419-
433. 17. Matthai, R. J., (1980)"The Organization and the Institution: Management Education in India”, Economic and Political Weekly, Vol.15, No.22, pp.M69-M72. 18. Ravichandran,N.,(2009)"A perspective on management education in India”, available at:http://www.financialexpress.com/printer/news/527793 (accessed
24 October 2010) 19. R.Bandyopadhyay (1991) ‘Indian Management education’, ‘Economic and Political Weekly, nov-30-1991’. 20. Thorat, S., (2005)"Higher Education in India Emerging Issues Related to Access, Inclusiveness and Quality”, paper presented at the Nehru Memorial Lecture,
26 November, University of Mumbai, Mumbai. Available at: http//www.ugc.ac.in/ chairman _nehru_lecture.pdf (Accessed 29October2010). 21. "Management Education in India.", available at http: //www .sooperarticles.com / educationarticles/international-studies-articles/management-education-
india-30505.html (accessed on 24October 2010) 22. Rao S.L. 2005. Management Education in India, Recommendations for action, All India Management Association. WEBSITES 23. http://www.education.nic.in/stats/statpub.asp (accessed on 8 December 2010) 24. http://www.aicte-india.org/misappgrowth.htm (accessed on 8 December 2010)

VOLUME NO. 3 (2013), ISSUE NO. 08 (AUGUST) ISSN 2231-5756
INTERNATIONAL JOURNAL OF RESEARCH IN COMMERCE, IT & MANAGEMENT A Monthly Double-Blind Peer Reviewed (Refereed/Juried) Open Access International e-Journal - Included in the International Serial Directories
http://ijrcm.org.in/
124
AN EVALUATION OF AUDIT EXPECTATION GAP IN NIGERIA
OLOLA OLAYEYE ADUWO ASST. LECTURER
DEPARTMENT OF ACCOUNTING FACULTY OF MANAGEMENT SCIENCES
EKITI STATE UNIVERSITY ADO-EKITI
ABSTRACT
The audit expectation gap refers to the differences between what the public expects from an audit function and what the auditing profession accepts as the objective of auditing. The existence of audit expectation gap is likely to affect the value of auditing and auditing profession as the society art actually realized the role performed by auditing exercise. This has necessitated lead to numerous professional and regulatory forms aimed at protecting shareholders rely on the financial statements for economic decision. In spite of the existence of research pointing to what to the difference between what the public expects from audit and what the audit profession believes as the objective of auditing, there appears to be paucity of research on how to tackle this issue in Nigeria. Therefore, this research investigates audit expectation gap and perception of stakeholders on audit functions. Respondents view was also sought on how the gap could be narrowed. Four hypotheses were formulated and tested using chi-square. The study reveals that an audit expectation gap exist in Nigeria, with reference to auditor’s responsibility it was also observed that there are significant differences in the perception of respondent groups on the existence of the audit expectation gap in Nigeria. Therefore, the study recommends that the public should be enlightened about the objectives of an audit, auditors’ role and responsibilities in order to reduce the existence of audit expectation gap.
KEYWORDS Audit, expectation gap, Auditing, Shareholders, Audit function.
1. INTRODUCTION n the late 19th and early 20th Century the concept of Auditor independence witnessed change due to large shift from capital coming from sources to capital deriving from domestic sources. The auditors primary duties was to protect proprietary interest such as shareholders and general public. The establishment of Security and Exchange Commission (SEC) for financial reporting auditing. Therefore, auditor has to discharge his / her duty to achieve
objectivity and achieve objectivity and credibility of financial reporting. The verification of accounts in the public limited liability companies by an auditor is obligatory by law or statute which defines auditor’s duties, rights and powers. It is imperative because of the separation of ownership from the control in the corporate sector as the former needs someone who can keep a professional watch on the latter and to whom they can trust for the reliability of accounts. It is the duty of management to prepare financial statement. The concept of independence is fundamental to the reliability of auditors reports and as such the auditor is liable for his audit report. If audit reports are not acceptable, this would affect the investors and creditors confidence in believing the audit report independence is considered as hallmark of auditing profession. Independence is viewed as the most essential factor in business sector in protecting the interest of several parties. The usefulness of auditor is to lend credibility to the financial statements prepared by directors. According to Porter et al (1997), the quality of information in the statement would be improved by the added credibility after being audited. There is a general assumptions that the public and auditors hold different views and perception about the auditors duties and responsibilities and the message convey by audit report. The difference between the external auditors understanding their role and duties and expectation of various users groups and the general public regarding the process and the outcome of external audit is called audit expectation gap. The users of financial statement include shareholders, creditors, government, financial analyst, the general public and among others. The Auditing Profession, and the Companies and Allied Matters Act 1990 provision requires management to prepare financial statements An Audit only provides reasonable assurance that Financial Statements are free of material mistatement and audit is no guarantee of solvency or financial performance transaction but it does not make economic sense in today’s world, to check all transactions. Auditor conduct an audit engagement with an attitude of professional skeptism recognizing that circumstances such as frauds man exist that will cause the financial statements to be materially mis– stated, an audit does not guarantee that fraud would be detected. In legal term, the auditor is regarded as watchdog not a bloodhound. But auditors understand these requirements and limitations which may not be known and understood in the same way by audit product consumers. Therefore, it appears that the members of the public expect that and it or should accept prime responsibility for the audit of financial statements, guarantees the accuracy of financial statements, auditors should perform 100% check and are supposed to detect fraud. Indeed, External Auditing plays a vital role, in the modern capitalist system of economy. In a capitalist economy credible information is needed for economic decision making in order to achieve efficient allocation of scarce resources (Koo and Sim, 1999). Such information can be obtained through audited financial statements. The credibility of external auditors is however, increasingly being in doubt in many countries around the world as noticed by widespread of criticism and litigation directed against auditors (Porter, 1993). According to Ekwueme (2000) the accounting profession in Nigeria has been under intensive pressure due to the series of financial scandals that occurred during the recessionary years of the late 80’s and early 90’s. these happenings called into a question whether there are differences in expectations between the auditor, his client and public concerning auditor’s duties and responsibility. In view of the widespread of the existence of audit expectation gap in other countries the institute of Chartered Accountants of Nigeria (ICAN) only set up public enlightenment committee and made a few public enlightenment campaigns Lin Jun and Chem (2004) opined that audit expectation gap is a crucial issue associated with the independent auditing function and has significant implications on the development of auditing standards and practice and the business environment. Investigations on the Link between Auditor’s independence and audit expectation gap have been relatively limited. This study intends, therefore to fill the gap by examine the relationship between stakeholder’s public perception of auditors role and existence of audit expectation gap in the content of Nigerian business environment. This research work is organized into five parts. Following this introductory section is section two which covers the literature review. Section three shall covers research methodology used. Section four deals with analysis and interpretation of results while the last section deals with summary, conclusion and recommendation.
1.1 STATEMENT OF THE PROBLEM Audit report is meant to convey assurance to the stakeholders that the financial statements represent true and fair view of an enterprise. However, after auditor issued a clean audit report, thereafter organization experienced economic crisis made the public to doubt the audit report as misleading for economic decision. The audit expectation gap is a cancer worm to auditing profession as long as this made the public to disbelief audit report, lower credibility and prestige associated with audit work. Audit expectation gap is detrimental to the stakeholders such as the potential investors public, and creditors in making economic decision. Therefore, it becomes crucial to investigate the perception of all major stakeholders that rely on the outcome of audit report and the impact audit expectation gap could have on audit profession.
I

VOLUME NO. 3 (2013), ISSUE NO. 08 (AUGUST) ISSN 2231-5756
INTERNATIONAL JOURNAL OF RESEARCH IN COMMERCE, IT & MANAGEMENT A Monthly Double-Blind Peer Reviewed (Refereed/Juried) Open Access International e-Journal - Included in the International Serial Directories
http://ijrcm.org.in/
125
1.2 OBJECTIVES OF THE STUDY The objective of this study is to provide evidence on the existence of audit expectation gap in Nigeria, by investigating the perception of selected stakeholders. The broad objective of this study is to investigate the perception of selected stakeholders on the existence of Audit expectation gap in Nigeria. In order to accomplish this objective the study has the following specific objectives: (a) To investigate the stakeholders’ perception on the existence of audit expectation gap in Nigeria (b) To ascertain the effect of expectation gap on the credibility of audit report in Nigeria. (c) To examine the effect of expectation gap on the credibility of auditing profession in Nigeria. (d) To determine the perception of stakeholders’ and public on the statutory duties and responsibilities of auditors in Nigeria.
1.3 RESEARCH HYPOTHESIS The following null hypotheses shall be tested in order to provide answers to the research questions: Ho1: Stakeholder does not perceive the existence of audit expectation and completely understand the statutory duties and responsibilities of auditors. H02: There is no positive relationship between the credibility of audit report and audit expectation gap in Nigeria. Ho3: Audit expectation gap does not affect the credibility of auditing profession in Nigeria. H04: Public do not understand the existence of Audit Expectation Gap in Nigeria
2 REVIEW OF RELATED LITERATURE 2.1 AUDITING DEFINED Many authors have defined auditing from both professional and academic point of view. Auditing according to Elumilade (2010) is the independent examination and investigation of the evidence from which a financial statement has been prepared with a view to enabling the independent examiner to report whether, in his opinion and according to the best of the information and explanation obtained by him, the statement properly drawn up and gives a true and fair view of what it purports to show and if not , to report in what respects he is not satisfied”. Aguolu, (1998) view auditing as the independent examination of the financial statements of an organization with a view to expressing an opinion as to whether these statements give a true and fair view and comply with the relevant statutes and the International Financial Reporting Standards (IERS). In can be informed from the above definitions that the purpose of auditing is to allow an external examiner (auditors) to attest to the financial statements that they have been prepared from and in agreement with the financial records in conformity with the relevant statutes and the accounting standards and also to ascertain the validity of the original transactions. 2.2 DUTIES AND RESPONSIBILITIES OF AUDITORS IN NIGERIA The Companies and Allied Matters Act (CAMA), CAPC 20, LFN 2004 is the law which regulate the incorporate and conduct of business activities in Nigeria. The main duty of the auditors according to section 360 of Companies and Allied Matters is to report to the members on the accounts examined by them, and on every balance sheet, every profit and loss account all group account laid before then company in general meeting during their tenure of office. In addition, auditors must report clearly that in their opinion the accounts give a true and fair of the state of the Company’s affairs and of its profit or loss, and comply with the requirement of the companies Acts of 1948 and 1967. 2.3 AUDIT EXPECTATION GAP The concept of “Audit Expectation Gap (AEG) has played important role in accounting profession since 1970s and continues to be a subject of debate till today. The major corporate financial irregularity and related fraud which occurred in Nigeria in recent times have called the attention of users of financial statements alike. The search for mechanism to ensure reliable, high quality financial reporting has majorly focused on narrowing the audit expectation. The stakeholders in the auditing profession has been up and doing to improve audit quality by issuing standards focused on discovery and independence. Due to this, there has been a concerted effort to devise ways of enhancing auditor’s independence (Corporate Governance Code of Nigeria, 2005). One of the first discussions of an expectation gap in financial statements was by Liggion (1914). He posited that since the late 1960 the accounting profession had been under attract regarding the quality of its professional performance. He suggested two reasons for this: a greater willingness to hold others especially professionals - accountable for perceived misconduct and the expectation gap as ‘a factor of the levels of expected performance as envisioned by both the independent accountant and by the users of financial statement. The difference between these levels of expected performance is the expectation gap (Salehi and Nasilo, 2009). This definition was extended a little in the Cohen Commission’s (1978) terms of reference. The commission was changed, inter alia, to consider whether a gap might exist between what the public expected or needed and what auditor could and should reasonably do. It was submitted that gap which gives rise to criticism of auditors is that between what society expects from auditors and what is perceives its receives from them. It was therefore suggested that the gap is more appropriately entitled “the audit expection performance gap” . it was then defined as the gap between society’s expectation of auditors and auditors’ performance as perceived by society. It can be seen from the definition that the gap has tow components: A gap between what society expects auditor to achieve and what they can reasonably be expected to accomplish (designated the reasonableness gap). A gap between what society can reasonably expect auditors to accomplish and what they can are perceived to achieve (designated the performance gap) The term ‘expectation gap’ is commonly used to describe the situation where a difference in expectation exists between a group with certain expertise. The public perception of an auditor’s responsibility differs from that of the profession and this difference is referred to as the expectation gap. 2.4 THEORETICAL FRAMEWORK Role Theory: Provides a theoretical underpin for the existence of an audit expectation gap. According to this theory, an auditor can be seen as occupying a status or position as a profession in the social system. Due to the position of a ‘profession’, auditors are expected to comply with the prescriptions ascribed to them by the society failure to conform to the ascribed role or to meet role expectations creates the risk of social action to enforce conformity and to penalize non compliance. In his word, Davidson (1975) argued that the role of auditor is subject to the interactions of the normative expections of the various interest groups in the society. He noted that these interest groups i.e. management, accountants, auditors, financial analysts and securities and exchange commission may expect different expectations of the auditor and these expectations may differ from time to time their own role requirements and the interaction of other forces in the society. Hence, auditors suffer a multi – role and multi expectation menace. Agency Theory: In agency theory, a principal delegates his / her responsibilities or duties to an independent person called an agent; in the case of a company the agents are the directors and managers these group of people manage the affairs of an undertaking on behalf of the owner / owners. The theory implies entrusting resources to the agent and he / she is expected to give account of steward in both quantitative and qualitative manner. Those in which authority to take decision has been delegated to are generally regard and as having a duty of accountability a duty to give account on the management of resources entrusted to them. Audit plays a crucial role by promoting confidence and reinforcing trust on the financial statements. Agency theory is of great importance especially its roles on economic theory of accountability, its helps in explaining the development to audit. The theory (Agency) reviews that agents have more information than principals and that this information asymmetry negatively affects the principals’ ability to monitor whether or not their interests are being properly served by the agents. Agency theory is based theory is based on this relationship between investors (Principals and managers (agent).An audit provides an independent check on the work of agents and of the information provided by an agent which help to maintain confidence and trust, (ICAEW, 2005). The position of the agency role is on the assumption that no agent is trust worth and that agent will cheat on his principal if given the opportunity. Audit, however serve as a check on agent’s activities.

VOLUME NO. 3 (2013), ISSUE NO. 08 (AUGUST) ISSN 2231-5756
INTERNATIONAL JOURNAL OF RESEARCH IN COMMERCE, IT & MANAGEMENT A Monthly Double-Blind Peer Reviewed (Refereed/Juried) Open Access International e-Journal - Included in the International Serial Directories
http://ijrcm.org.in/
126
2.5 EMPIRICAL STUDIES Rehana, (2010) empirically examine the audit expectation gap and role of auditing education in Bangladesh by employing descriptive statistics test. The result revealed that audit education has significant effect in reducing the audit expectation gap. In addition, the result showed that the audit expectation gap needs to be addressed from a number of different perspectives. In order to eliminate deficient performance by auditors to hidden the scope to em-compass reasonable expectations and reduce expectations where they are deemed to be unreasonable. Saleh, Al, and Zhila, (2009) examined audit independence and expectation gap in Iran using Mann – Whitey U test. The findings revealed that there is significant expectation gap between auditors and investors on actual level of audit independence in Iran – they concluded that accounting and auditing regulators should develops scope of audit independence and investors should be aware of the responsibilities as well as limitations of audit independence.The author recommended that, better communication between the two parties may reduce the gaps. Kangarlouei, Morteza, Yaghoub, Asghar, and Vali (2012) examined the audit expectation gap between users of audit reports and independent auditors about the features of independent Auditors Using Analysis of Valence Techniques (ANOVA). The results indicated that there was a significant difference between users of audit reports and independent auditors about the features of independent auditors. They concluded that there was difference between users of audit report and independent auditors’ perception about auditor’s feature, which in turn influence on audit report. They recommended that users should have more knowledge about independent auditors’ duties and adjust their expectation based on it.Ehimobowei, (2010) evaluated the audit expectation issues and challenges by exploring normative descriptive approach in data analysis. The auditors discovered that the audit expectation gap is a very fundamental issue in every society in the world and that perception of users of financial statements as the responsibilities of auditors and the audit objective is the major cause of the gap. However, the author suggested that minimizing education research, formulate legislation, organize free seminars would minimize audit expectation gap. In addition, he emphasized the need to maintain audit quality control. Enyi, Iihrueze and Racheal, E. (2012) studies the audit expectation gap problem in Nigeria by employing cross sectional Chi square analysis and analysis of variance (ANOVA). The authors submitted that, the function is crucial in providing users with assurance about the information provided by the management on the financial statement.In addition, it was discovered that the audit expectation gap is associated with the independent audit function. Idris, and Ehiml (2010) studied the existence and nature of audit expectation gap using Chi- square to analyse the data obtained from the study, the study revealed that there was difference between what the auditors perceived as their duties and what the users perceived as auditors duties and responsibilities. The authors concluded that there is a wide expectation gap in the areas of auditors responsibility for fraud prevention and detection. They recommended that auditors duties and responsibilities should be extended to include fraud detection. In addition, they suggested that financial statement users need to be tutored to know the actual statutory role of auditors. Salehi and Zhila (2008) employed Mann – Whitnery U test to examine fraud detection and audit expectation gap. The result indicated that there was significant gap between auditors and bankers in areas of auditors responsibilities to detect fraud and illegal acts. The authors came to conclude that the bankers have reasonable expectation gap from auditors. Okafor, John (2013) employed statistical package for the social sciences (SPSS) to ascertain the role of auditing profession in narrowing the audit expectation gap. The result showed that the public is ignorant of the duties of the auditors. Base on the findings, the authors submitted that, the public need more education o understand the duties and responsibilities of the auditor. The auditor’s report should be expanded to include disclaimer clauses clearly showing that it is not a guarantee for the financial soundness of the auditee. Adeyemi, and Olayinka, (2011) investigated the audit expectation gap in Nigeria by emploring analysis of variance (ANOVA) statistical tool. The Authors observed from the result that there was significant differences in the perceptions of respondent groups on the existing duties and responsibilities of auditors in Nigeria. As a result of their findings they recommended that the existing duties and responsibilities of auditors should be clearly defined and widened to include fraud detection. Also, the users of financial statements should be educated about the objects of an audits, auditors role and responsibilities. They agreed that quality control in audit firms should be put in place to ensure quality performance of the auditors thereby ensuring investors confidence. James, O. and Izedonmi, F. I. O. (2012) examined the relationship between audit expectation gap and users of financial reports in Nigeria by using t – test and Microsoft office excel. The auditors found that selection of audit procedures and auditors found that selection of audit procedures and auditors are responsible for preventing and detecting frauds and errors. Low, (1980) examined the relationship between audit expectation gap and auditor’s detection responsibility. The study revealed that there are differences in the percep Humphrey et. al (1993) empirically investigated the existence of audit expectation gap in Britain through the use of a questionnaire survey comprising a series of mini – cases. The authors submitted that there are noted differences between auditors and respondents in their views on the nature of auditing, the respondents sampled in the study consist of chartered accountants in public practice, corporate finance directors, investment analysts, bank lending officers and financial journalists. Mohamed and Muhamad – Sori (2002) examined the possibility of the existence of audit expectation gap in Malaysia. Their findings confirmed the existence of audit existence of audit expectation gap and also its contributory factors were highlighted as follows: uncertainties concerning the actual role of auditor; the satisfaction of clients with services provided by the auditors and the audit firm’s lack of independence and objectivity. A more elaborate study was carried out by Faozly and Ahmad (2004) to investigate the audit expectation gap among auditors and the relevant users of financial statement: bankers, investors, and stockbrokers. The study of Fadzly, el al (2004), Lee and Palaniappan (2006) and Lee et al (2007) conducted to examine the existence of audit expectation gap in analysis by the use of survey questionnaire complement this findings. Dixon et al (2006) examined the existence of audit expectation gap between the auditors and the users of financial statements in Egypt. The author submitted that there is indeed an expectation gap in the nature of audit function, the perceived performance of auditors their duties their independence and the non – audit services. Lee et al. (2010) examined the nature of the audit expectation gap in Thailand using Porter’s (1993) framework. The study confirmed that the expectation of auditees and audit beneficiaries as regard auditors’ duties differs from that of auditors themselves. Audit expectation gap has been comprehensively studied in developed countries. These studies (Best et al, 2001; Hojskov, 1998; Gay et al. 1997) mostly used survey questionnaires to identify the nature of the gap or where the gaps are, impacts of the gap, and how to reduce the gap.
3. METHODOLOGY THE STUDY AREA The research was carried out in Ondo state, Nigeria. Ondo state was chosen because of the relative convenience for the administration of the research instrument THE RESEARCH DESIGN The researcher adopted cross-sectional survey research design for investigating evaluation audit expectation gap in Nigeria . 3.1 POPULATION SAMPLE SIZE AND SAMPLING TECHNIQUES The population of the study comprised all the stakeholders or users of financial statement in Nigeria. Convenience sampling technique was adopted to include respondents that are easiest to reach in the sample. The obvious advantage of convenient sampling techniques is to engage the participant in the sample that the researcher feet that are most convenient to obtain information (Quinlan, 2011) This study investigated the audit expectation gap among the auditors and major users of financial statement in Nigeria (such as auditors, investors, stockbrokers, bankers, auditing firms, policy makers and management) One hundred and sixty respondents were chosen from the population of which they are required to indicate the degree of their agreement or disagreement with each of the statement on a score of one (1) to five (5). A score of one (1) represents strongly disagree with the statements while a score of five (5) represent strong agreement with the statement. This type of scaling was suggested when items are to be judged on a single dimension and arrayed on a scale with equal interval (Alreck and Settle, 1995)

VOLUME NO. 3 (2013), ISSUE NO. 08 (AUGUST) ISSN 2231-5756
INTERNATIONAL JOURNAL OF RESEARCH IN COMMERCE, IT & MANAGEMENT A Monthly Double-Blind Peer Reviewed (Refereed/Juried) Open Access International e-Journal - Included in the International Serial Directories
http://ijrcm.org.in/
127
INSTRUMENT FOR DATA ANALYSIS Both primary and secondary data were used in this study. The primary data were collected from the responses obtained from a structured questionnaire while the secondary were collected from journals, textbook and internet sources 3.2 METHOD OF DATA ANALYSIS Descriptive statistical tools were used for the data presentation which include tables and frequency distribution. The inferential statistical used for testing the hypotheses formulated in the study was the chi-square technique. Since the data used in the study were not in absolute value but in frequency distribution, chi-square (X2) was considered to be most appropriate. Chi-square measures the difference between the expected and the observed frequency and was calculated as follows: X2 = ∑(O-E)2
E Where: O = Observed frequency E = Expected Frequency Decision rule at any level of significant is that the null hypothesis is rejected if the chi-square (X2) calculated is greater than or equal to the critical value from the chi-square (X2) table, otherwise the alternative hypothesis is accepted
4. DATA ANALYSIS AND INTERPRETATION OF RESULT Respondents were grouped into four namely auditors, investors, Stockbrokers and management. Sample size of first fifty (50) is targeted for each respondent group making a total of two hundred and Sixty (260) copies of questionnaires administered to the four categories of respondents. A total of one hundred and sixty (160) copies were returned and used for analysis. This represents an overall response rate of ninety percentages (90%) for all the groups. The respondents responses were used in providing answers to the questions raised in the study using Likert scale which measure the extent to which a respondent agrees or disagrees with the sample questionnaires. The Likert scale used ranges from 1 to 5. In the interpretation, strongly disagree stands for ‘1’; disagree stands for 2, Neutral stands for 3 and Agreed stands for 4 and strongly agreed stands for 5. 4.1 TEST OF RESEARCH HYPOTHESES HYPOTHESIS ONE Ho1: Stakeholders does not perceive the existence of audit expectation gap and Completely understand the statutory duties and responsibilities of auditors. This null Hypothesis states that there is no significant relationship between audit expectation gap and stakeholders perception of the duties and responsibilities of Auditors. HYPOTHESIS ONE H0: Stakeholders do not believe that audit expectation gap exist in Nigeria
TABLE 4.1: CHI-SQUARE (X2) ANALYSIS SHOWING STAKEHOLDERS BELIEVE OF AUDIT EXPECTATION GAP IN NIGERIA
RESPONSES O E O-E (O-E)2 (O-E)2
SD 4 33 -29 841 25.48
D 20 33 -13 169 5.12
NS 49 33 16 256 7.76
A 82 33 49 2401 72.76
SA 10 33 -23 529 16.03
X2 127.15
Source: Researcher’s Computation X2 calculated = 127.15 X2 table = 9.488 Since X2 calculated (127.15) is greater than X2 tabulated (9.488) at 0.05 level of significance. The null hypothesis (Ho) is rejected. This implies that stakeholders do believe that audit expectation gap exist in Nigeria HYPOTHESIS TWO H02: There is no positive relationship between the credibility of audit report and Audit expectation gap in Nigeria. This hypothesis states that audit expectation does not affect the credibility of audit report. Ho: Audit Expectation Gap has no effects on the credibility of audit report
TABLE4.2: CHI-SQUARE (X2) ANALYSIS SHOWING THE AUDIT EXPECTATION GAP AFFECTS THE CREDIBILITY OF AUDIT REPORT
RESPONSES O E O-E (O-E)2 (O-E)2
SD 7 33 -26 676 20.48
D 37 33 04 16 0.48
NS 64 33 31 961 29.12
A 46 33 13 169 5.12
SA 11 33 -22 484 14.67
X2 69.87
Source: Researcher’s Computation X2 calculated = 69.87 X2 table = 9.488 Since X2 calculated (69.87) is greater than X2 tabulated (9.488) at 0.05 level of significance and 4 degree of freedom. The null hypothesis (Ho) is rejected. This implies that Audit Expectation Gap affects the credibility of Audit report HYPOTHESIS THREE H03: Audit expectation gap does not affect the credibility of Auditing profession in Nigeria. This hypothesis states that there is no correlation between Audit expectation gap and auditing profession in Nigeria. Hypothesis Three Ho3: Audit expectation gap affects the credibility of auditing profession in Nigeria

VOLUME NO. 3 (2013), ISSUE NO. 08 (AUGUST) ISSN 2231-5756
INTERNATIONAL JOURNAL OF RESEARCH IN COMMERCE, IT & MANAGEMENT A Monthly Double-Blind Peer Reviewed (Refereed/Juried) Open Access International e-Journal - Included in the International Serial Directories
http://ijrcm.org.in/
128
TABLE4.3: CHI-SQUARE (X2) ANALYSIS SHOWING THAT AUDIT EXPECTATION GAP AFFECTS THE CREDIBILITY OF AUDITING PROFESSION
RESPONSES O E O=E (O-E)2 (O-E)2
E
SD 11 33 -22 484 14.67
D 41 33 08 64 1.94
NS 63 33 30 900 27.27
A 37 33 04 16 0.48
SA 13 33 -20 400 12.12
X2 56.48
Source: Researcher’s computation X2 calculated = 56.48 X2 tabulated (9.488) Since X2 calculated (56.48) is greater than X2 tabulated (9.488) at 0.05 level of significance and 4 degree of freedom. The null hypothesis (Ho) is rejected. This implies that the stakeholders do understand the statutory duties and responsibilities of auditor HYPOTHESIS FOUR Ho: Public does not understands the existence of Audit Expectation Gap in Nigeria
TABLE 4.4: CHI-SQUARE (X2) ANALYSIS SHOWING PUBLIC UNDERSTANDS THE EXISTENCE OF AUDIT EXPECTATION GAP IN NIGERIA
RESPONSES O E O-E (O-E)2 (O-E) E
SD 29 33 -4 16 0.48
D 43 33 10 100 3.03
NS 47 33 14 196 5.94
SA 12 33 -21 441 13.36
X2 22.84
Source: Researcher’s Computation X2 calculated =22.84 X2 table = 9.488 Since X2 calculated (22.84) is greater than X2 tabulated at 0.05 level of significance and 4 degree of freedom. The null hypothesis (H0) is rejected. This implies that public understands the existence of Audit Expectation gap in Nigeria
5. CONCLUSION AND RECOMMENDATION The study investigated audit expectation gap in Nigeria and opinions of various groups ranging from auditors, stakeholders, stockbrokers, users of financial statements, management and the public were sought on the existence of audit expectation gap. The propositions formulated in the study were tested. It is therefore concluded that public believe in the existence of audit expectation gap as regard the roles of auditors in fraud prevention and detection. The audit expectation gap has negative consequences on the credibility of audit report and audit profession. Researchers and Accounting Profession have responded in different ways to the audit expectation gap. They agreed to the existence of wide audit expectation gap of areas of auditors’ responsibility for fraud prevention and detection. However, it must accepted that the expectation gap regards as a result of poor performance. The audit expectation gap is harmful to the auditing profession as it has negative influence on the value of auditing. We established that if auditors are to retain the public perception of them as providing a valuable service in the society, the gap between the public expectations of auditors’ performance must be minimized. The study investigates the audit expectation gap and perception of stakeholders on audit functions. The result(s) of the first hypothesis revealed that stakeholders believed in the existence of audit expectation gap The results of second hypothesis revealed that audit expectation gap affects the credibility of audit report. However, the result of third hypothesis revealed that stakeholders understand the statutory duties and responsibilities of auditor in the same vein, hypothesis four revealed that public understands the statutory roles of auditor and understands the existence of audit expectation gap in Nigeria Based on the research findings, the following recommendations are made:
The existing duties and responsibilities of auditors should be clearly defined and widened for fraud detection
The users of financial statement should be educated about the objects of an audit auditors’ role and responsibilities.
The auditors should discharge his duties objectively and stick to the professional and ethical conduct in order maintain public confidence on audit report.
Mandatory continuing professional programme should be put in place to educate the auditing practitioners in discharging their lawful duties.
Professional body Government and should attempt to establish a monitoring group to oversee the implementation of audit regulations in Nigeria.
The functions of auditors should be clearly distinguished to enable the various users understand without prejudice the main audit functions
REFERENCES 1. Adeyemi, S. B., and Olayinka, M. U. (2011), An Empirical Investigation of the Audit Expectation Gap in Nigeria, African Journal of Business Management,
5(9) 79ce4 – 7971.http: //www.academicjournals.org/AJBM 2. Aguolu, O (1998), Fundamentals of Auditing, 3rd ed. Enugu, Institute for Development Studies. 3. Alreck, P. I. and Settle , R. B. (1995), The Survey Research Handbook, 2nd edl Chicago, Richard D. Irwin Inc. 4. Best, P.J., Buckby, S., and Tan, C. (2001), Evidence of the Expection Gap in Singapore, Management Audit Journal, 16(3), 134 -144. 5. Davidson, L. (1975), The Role and Responsibilities of the Auditors: Perspective, Expectations and Analysis, Unpublished Background Paper for the
Commission on Auditors Responsibilities. 6. Dixon, R. Woodlead, AD., Soliman, M. (2006), An Expectation of the Expectation Gap in Egypt, Management Audit Journal, 21 (3), 293 – 302. 7. Ebimobowei, A. (2010), An Evaluation of Audit Expectation gap: Issues and Challenges International Journal of Economic Development Research and
Investment, 1 (2 & 3), 129 – 144. 8. Elumilade, D. O., (2010), Auditing and Investigation, 1st edition, Ile – Ife, Olugbolade Omisade Printers and Publisher. 9. Ekwueme, S. C. (2000), Auditing: Bridging the Expectation Gap. ICAN NEWS, April June. 10. Enyi, V. C., Ifufueze, M.S. , and Racheal E. (2012), The Audit Expectation Gap Problem in Nigeria: The perception of some selected stake holder groups
Research journal of finance and Accounting, 3(7), 140 – 150. 11. Gag, G. Schelluch, P. and Reid, I. (1997), Users and Auditors Materiality for the Prevention, Detection and Reporting of Fraud, other illegality and Error,
Aust. Account, 8, 25 – 28. 12. Hoiskov, L. (1998), The Expectation Gap between Users and Auditors Materiality Judgments in Denmark, Paper presented of the second Asian Pacific
Interdisciplinary Research in Accounting Conference. 13. Humphrey C. G., Meizer, P. and Turley, W. S. (1993), The Audit Expection Gap in Britain: An Empirical Investigation, Account Bus. Res, 395 – 411.
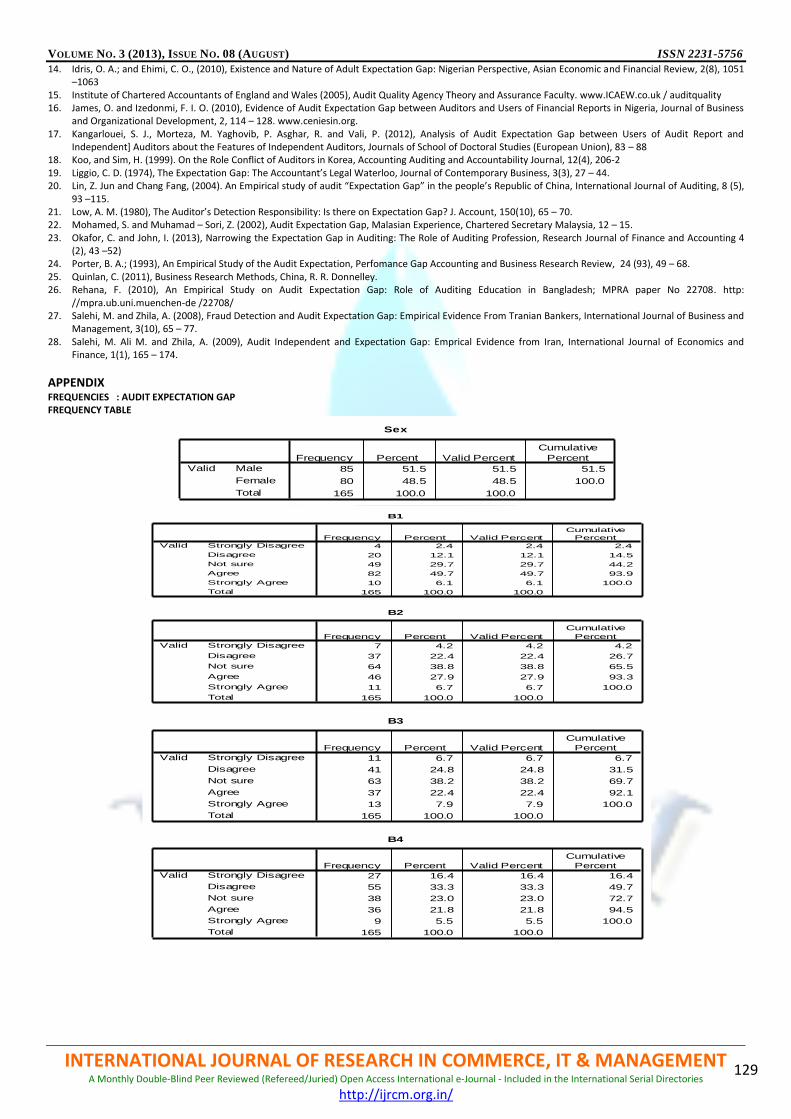
VOLUME NO. 3 (2013), ISSUE NO. 08 (AUGUST) ISSN 2231-5756
INTERNATIONAL JOURNAL OF RESEARCH IN COMMERCE, IT & MANAGEMENT A Monthly Double-Blind Peer Reviewed (Refereed/Juried) Open Access International e-Journal - Included in the International Serial Directories
http://ijrcm.org.in/
129
14. Idris, O. A.; and Ehimi, C. O., (2010), Existence and Nature of Adult Expectation Gap: Nigerian Perspective, Asian Economic and Financial Review, 2(8), 1051 –1063
15. Institute of Chartered Accountants of England and Wales (2005), Audit Quality Agency Theory and Assurance Faculty. www.ICAEW.co.uk / auditquality 16. James, O. and Izedonmi, F. I. O. (2010), Evidence of Audit Expectation Gap between Auditors and Users of Financial Reports in Nigeria, Journal of Business
and Organizational Development, 2, 114 – 128. www.ceniesin.org. 17. Kangarlouei, S. J., Morteza, M. Yaghovib, P. Asghar, R. and Vali, P. (2012), Analysis of Audit Expectation Gap between Users of Audit Report and
Independent] Auditors about the Features of Independent Auditors, Journals of School of Doctoral Studies (European Union), 83 – 88 18. Koo, and Sim, H. (1999). On the Role Conflict of Auditors in Korea, Accounting Auditing and Accountability Journal, 12(4), 206-2 19. Liggio, C. D. (1974), The Expectation Gap: The Accountant’s Legal Waterloo, Journal of Contemporary Business, 3(3), 27 – 44. 20. Lin, Z. Jun and Chang Fang, (2004). An Empirical study of audit “Expectation Gap” in the people’s Republic of China, International Journal of Auditing, 8 (5),
93 –115. 21. Low, A. M. (1980), The Auditor’s Detection Responsibility: Is there on Expectation Gap? J. Account, 150(10), 65 – 70. 22. Mohamed, S. and Muhamad – Sori, Z. (2002), Audit Expectation Gap, Malasian Experience, Chartered Secretary Malaysia, 12 – 15. 23. Okafor, C. and John, I. (2013), Narrowing the Expectation Gap in Auditing: The Role of Auditing Profession, Research Journal of Finance and Accounting 4
(2), 43 –52) 24. Porter, B. A.; (1993), An Empirical Study of the Audit Expectation, Perfomance Gap Accounting and Business Research Review, 24 (93), 49 – 68. 25. Quinlan, C. (2011), Business Research Methods, China, R. R. Donnelley. 26. Rehana, F. (2010), An Empirical Study on Audit Expectation Gap: Role of Auditing Education in Bangladesh; MPRA paper No 22708. http:
//mpra.ub.uni.muenchen-de /22708/ 27. Salehi, M. and Zhila, A. (2008), Fraud Detection and Audit Expectation Gap: Empirical Evidence From Tranian Bankers, International Journal of Business and
Management, 3(10), 65 – 77. 28. Salehi, M. Ali M. and Zhila, A. (2009), Audit Independent and Expectation Gap: Emprical Evidence from Iran, International Journal of Economics and
Finance, 1(1), 165 – 174.
APPENDIX FREQUENCIES : AUDIT EXPECTATION GAP FREQUENCY TABLE
Sex
85 51.5 51.5 51.5
80 48.5 48.5 100.0
165 100.0 100.0
Male
Female
Total
Valid
Frequency Percent Valid Percent
Cumulative
Percent
B1
4 2.4 2.4 2.4
20 12.1 12.1 14.5
49 29.7 29.7 44.2
82 49.7 49.7 93.9
10 6.1 6.1 100.0
165 100.0 100.0
Strongly Disagree
Disagree
Not sure
Agree
Strongly Agree
Total
Valid
Frequency Percent Valid Percent
Cumulative
Percent
B2
7 4.2 4.2 4.2
37 22.4 22.4 26.7
64 38.8 38.8 65.5
46 27.9 27.9 93.3
11 6.7 6.7 100.0
165 100.0 100.0
Strongly Disagree
Disagree
Not sure
Agree
Strongly Agree
Total
Valid
Frequency Percent Valid Percent
Cumulative
Percent
B3
11 6.7 6.7 6.7
41 24.8 24.8 31.5
63 38.2 38.2 69.7
37 22.4 22.4 92.1
13 7.9 7.9 100.0
165 100.0 100.0
Strongly Disagree
Disagree
Not sure
Agree
Strongly Agree
Total
Valid
Frequency Percent Valid Percent
Cumulative
Percent
B4
27 16.4 16.4 16.4
55 33.3 33.3 49.7
38 23.0 23.0 72.7
36 21.8 21.8 94.5
9 5.5 5.5 100.0
165 100.0 100.0
Strongly Disagree
Disagree
Not sure
Agree
Strongly Agree
Total
Valid
Frequency Percent Valid Percent
Cumulative
Percent

VOLUME NO. 3 (2013), ISSUE NO. 08 (AUGUST) ISSN 2231-5756
INTERNATIONAL JOURNAL OF RESEARCH IN COMMERCE, IT & MANAGEMENT A Monthly Double-Blind Peer Reviewed (Refereed/Juried) Open Access International e-Journal - Included in the International Serial Directories
http://ijrcm.org.in/
130
NPAR TESTS CHI-SQUARE TEST FREQUENCIES
CHI-SQUARE TEST
B5
29 17.6 17.6 17.6
43 26.1 26.1 43.6
47 28.5 28.5 72.1
34 20.6 20.6 92.7
12 7.3 7.3 100.0
165 100.0 100.0
Strongly Disagree
Disagree
Not sure
Agree
Strongly Agree
Total
Valid
Frequency Percent Valid Percent
Cumulative
Percent
B1
4 33.0 -29.0
20 33.0 -13.0
49 33.0 16.0
82 33.0 49.0
10 33.0 -23.0
165
Strongly Disagree
Disagree
Not sure
Agree
Strongly Agree
Total
Observed N Expected N Residual
B2
7 33.0 -26.0
37 33.0 4.0
64 33.0 31.0
46 33.0 13.0
11 33.0 -22.0
165
Strongly Disagree
Disagree
Not sure
Agree
Strongly Agree
Total
Observed N Expected N Residual
B3
11 33.0 -22.0
41 33.0 8.0
63 33.0 30.0
37 33.0 4.0
13 33.0 -20.0
165
Strongly Disagree
Disagree
Not sure
Agree
Strongly Agree
Total
Observed N Expected N Residual
B4
27 33.0 -6.0
55 33.0 22.0
38 33.0 5.0
36 33.0 3.0
9 33.0 -24.0
165
Strongly Disagree
Disagree
Not sure
Agree
Strongly Agree
Total
Observed N Expected N Residual
B5
29 33.0 -4.0
43 33.0 10.0
47 33.0 14.0
34 33.0 1.0
12 33.0 -21.0
165
Strongly Disagree
Disagree
Not sure
Agree
Strongly Agree
Total
Observed N Expected N Residual
Test Statistics
127.152 69.879 56.485 34.242 22.848
4 4 4 4 4
.000 .000 .000 .000 .000
Chi-Square a
df
Asymp. Sig.
B1 B2 B3 B4 B5
0 cells (.0%) have expected frequencies less than 5. The minimum
expected cell frequency is 33.0.
a.
Test Statistics
127.152 69.879 56.485 34.242 22.848
4 4 4 4 4
.000 .000 .000 .000 .000
Chi-Square a
df
Asymp. Sig.
B1 B2 B3 B4 B5
0 cells (.0%) have expected frequencies less than 5. The minimum
expected cell frequency is 33.0.
a.

VOLUME NO. 3 (2013), ISSUE NO. 08 (AUGUST) ISSN 2231-5756
INTERNATIONAL JOURNAL OF RESEARCH IN COMMERCE, IT & MANAGEMENT A Monthly Double-Blind Peer Reviewed (Refereed/Juried) Open Access International e-Journal - Included in the International Serial Directories
http://ijrcm.org.in/
131
ROLE OF FINANCIAL INCLUSION FOR INCLUSIVE GROWTH: AN INDIAN SCENARIO
BHARGAB KUMAR KALITA RESEARCH SCHOLAR
DEPARTMENT OF ECONOMICS GAUHATI UNIVERSITY
JALUKBARI
ABSTRACT The term ‘Financial Inclusion’ means the transfer of banking services at a reasonable cost to the huge sections of deprived and low income group. ‘Inclusive Growth’ by its definition implies an impartial distribution of resources with profits gained to every sections of the society. Financial inclusion and inclusive growth are the two sides of a coin. Both are interrelated and interdependent. For growth to be inclusive, all people should be come under access to financial services. In India, we can see that growth is hampered by Financial Exclusion, which is just the opposite of financial inclusion. Many a times, banking services etc. are not delivered adequately; specially in rural areas. So, there is a need to examine or verify the contribution of financial inclusion (i.e. delivery of financial services to poor) to mould the growth of India which is inclusive i.e. proper allocation of resources to every corners of the country. This paper will be studied with the help of secondary data collected from various journals, Reports, Articles, Reports of various Committees, Plans etc. We will be looking to see a positive relationship between financial inclusion and inclusive growth in India. So, let us hope that this paper reflects a true picture of India in case of access to financial services and building a strong case for inclusive growth.
JEL CLASSIFICATION G00, G20, G21.
KEYWORDS Banking Services, Financial Inclusion, Financial Exclusion, Inclusive Growth.
INTRODUCTION inancial Inclusion’ literally means the transfer of banking services at a reasonable cost to the huge sections of deprived and low income group. The services which normally comes under Financial Inclusion, include – credit, savings, insurance, payments and most importantly remittance facilities. Financial Inclusion is likely to connect the masses to banks with significant benefits. Amartya Sen (2000) argued that poverty is not only insufficient
income, but it is the deprivation of various capabilities, which includes security and ability to participate in Economic as well as Political systems. Again, “Inclusive Growth” implies an impartial distribution of resources with profits gained to every sections of the society. When we say about Financial Inclusion, we cannot ignore growth aspect, especially for India. Financially covered people or may be areas can accentuate the growth of a country, where India is also not the exception. So, the aim of this paper is to generate a relationship of financial inclusion towards inclusive growth of India or what may be the role or part or position played by Financial Inclusion towards inclusive or broad based growth of a country like India.
REVIEW OF LITERATURE The literature available for Financial Inclusion is not limited. Various studies have been done in this regard. Across the world, nearly 3 billion people are deprived from the formal financial services. Thus, over the years, numerous definitions of Financial Inclusion have evolved. Banks have taken out several strategies to enlarge the outreach of their services in order to accelerate financial inclusion. The cost effective manner of this is through forming bond with Microfinance Institutions and local committees. Banks should be encouraged to give wide publicity of “No Frills Account”. Banks need to restructure their business strategies to integrate specific plans to promote Financial Inclusion of low income group (V.Leeladhar, 2005). Access to financial services allows low income groups to save money safely, prevents holding of economic power with a few individuals and alleviate the risk that poor people face as a result of economic shocks (Beck, Demirguc-Kunt and Peria 2006). Many people with low income, cannot access to the conventional financial products like- bank accounts, and low cost loans, which may hamper in their livelihood (H.M. Treasury, 2007). In the context of India, Rangarajan Committee [Report of the Committee on Financial Inclusion in India (2008)] defines as – the Financial Inclusion is a process of guaranteeing access to Financial Services and punctual and sufficient credit where required by vulnerable groups such as weaker sections and low income groups at a reasonable cost. The establishment of systems for Financial Inclusion in India started with the setup of Credit Cooperatives, following the making of the Cooperative Societies Act in 1904 (Kelkar,2010). In developed countries it is seen that the formal financial sector serves most of the population, in developing countries, a large section of the society, mostly the low-income group, has little access to financial services, either formal or semi-formal. As a result, people have to depend either on their own ways or sources or in formal sources of finance, which are normally at a high cost (Swamy and Vijayalakshmi, 2010). A working paper for RBI by Sadhan Kumar Chattopadhyay on Financial Inclusion in India about a case- study of West Bengal (2011), has carefully examined the extent of Financial Inclusion in West Bengal. The study reveals that there has been an improvement in outreach activity in the banking sector, but the achievement is not significant. An index of Financial Inclusion (IFI) has been formulated in the study using data on three dimensions of Financial Inclusion viz- Banking Penetration (BP), availability of the banking services (BS) and usage of the banking system (BU). The paper reflects a comparable picture between different states on the basis of IFI rankings. So, following the above mentioned literature, our present study focuses on the role of Financial Inclusion towards attaining inclusive growth- in context of India.
NEED OF THE STUDY We all know that India has more number of villages than town and out of total population, 72% lives in villages. But, a considerable proportion of 6, 50,000 villages do not have a single bank branch leading to financial exclusion of rural people. As India’s development to a significant extent, depends on this section’s economic growth, so it is the need of the hour to bring the unbanked population within the ambit of banking. What seen is that, financially excluded people depend on moneylenders even for their everyday needs, borrowing at excessive rates to finally get caught in the debt trap. These people are completely unaware of financial products like- insurance, which may guard them in adverse situations. So, with this background, a systematic and meaningful study is required to meet the living condition of poor for ensuring the growth of the economy as a whole.
F
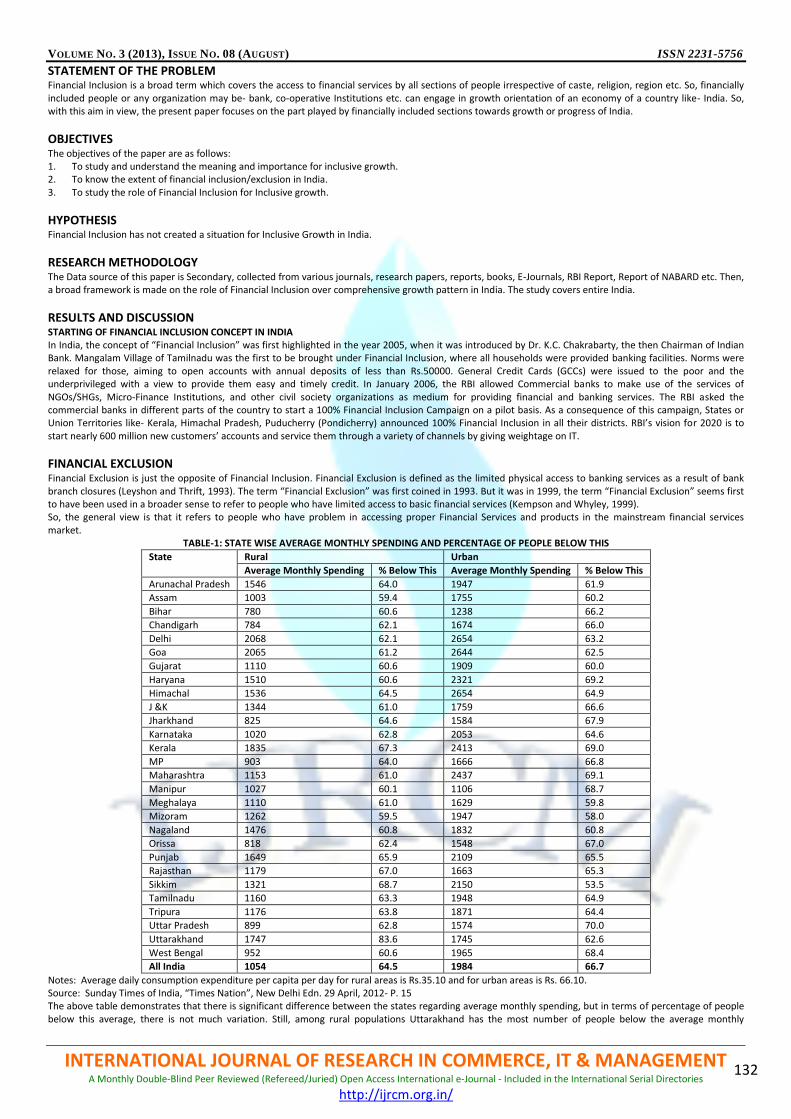
VOLUME NO. 3 (2013), ISSUE NO. 08 (AUGUST) ISSN 2231-5756
INTERNATIONAL JOURNAL OF RESEARCH IN COMMERCE, IT & MANAGEMENT A Monthly Double-Blind Peer Reviewed (Refereed/Juried) Open Access International e-Journal - Included in the International Serial Directories
http://ijrcm.org.in/
132
STATEMENT OF THE PROBLEM Financial Inclusion is a broad term which covers the access to financial services by all sections of people irrespective of caste, religion, region etc. So, financially included people or any organization may be- bank, co-operative Institutions etc. can engage in growth orientation of an economy of a country like- India. So, with this aim in view, the present paper focuses on the part played by financially included sections towards growth or progress of India.
OBJECTIVES The objectives of the paper are as follows: 1. To study and understand the meaning and importance for inclusive growth. 2. To know the extent of financial inclusion/exclusion in India. 3. To study the role of Financial Inclusion for Inclusive growth.
HYPOTHESIS Financial Inclusion has not created a situation for Inclusive Growth in India.
RESEARCH METHODOLOGY The Data source of this paper is Secondary, collected from various journals, research papers, reports, books, E-Journals, RBI Report, Report of NABARD etc. Then, a broad framework is made on the role of Financial Inclusion over comprehensive growth pattern in India. The study covers entire India.
RESULTS AND DISCUSSION STARTING OF FINANCIAL INCLUSION CONCEPT IN INDIA In India, the concept of “Financial Inclusion” was first highlighted in the year 2005, when it was introduced by Dr. K.C. Chakrabarty, the then Chairman of Indian Bank. Mangalam Village of Tamilnadu was the first to be brought under Financial Inclusion, where all households were provided banking facilities. Norms were relaxed for those, aiming to open accounts with annual deposits of less than Rs.50000. General Credit Cards (GCCs) were issued to the poor and the underprivileged with a view to provide them easy and timely credit. In January 2006, the RBI allowed Commercial banks to make use of the services of NGOs/SHGs, Micro-Finance Institutions, and other civil society organizations as medium for providing financial and banking services. The RBI asked the commercial banks in different parts of the country to start a 100% Financial Inclusion Campaign on a pilot basis. As a consequence of this campaign, States or Union Territories like- Kerala, Himachal Pradesh, Puducherry (Pondicherry) announced 100% Financial Inclusion in all their districts. RBI’s vision for 2020 is to start nearly 600 million new customers’ accounts and service them through a variety of channels by giving weightage on IT.
FINANCIAL EXCLUSION Financial Exclusion is just the opposite of Financial Inclusion. Financial Exclusion is defined as the limited physical access to banking services as a result of bank branch closures (Leyshon and Thrift, 1993). The term “Financial Exclusion” was first coined in 1993. But it was in 1999, the term “Financial Exclusion” seems first to have been used in a broader sense to refer to people who have limited access to basic financial services (Kempson and Whyley, 1999). So, the general view is that it refers to people who have problem in accessing proper Financial Services and products in the mainstream financial services market.
TABLE-1: STATE WISE AVERAGE MONTHLY SPENDING AND PERCENTAGE OF PEOPLE BELOW THIS
State Rural Urban
Average Monthly Spending % Below This Average Monthly Spending % Below This
Arunachal Pradesh 1546 64.0 1947 61.9
Assam 1003 59.4 1755 60.2
Bihar 780 60.6 1238 66.2
Chandigarh 784 62.1 1674 66.0
Delhi 2068 62.1 2654 63.2
Goa 2065 61.2 2644 62.5
Gujarat 1110 60.6 1909 60.0
Haryana 1510 60.6 2321 69.2
Himachal 1536 64.5 2654 64.9
J &K 1344 61.0 1759 66.6
Jharkhand 825 64.6 1584 67.9
Karnataka 1020 62.8 2053 64.6
Kerala 1835 67.3 2413 69.0
MP 903 64.0 1666 66.8
Maharashtra 1153 61.0 2437 69.1
Manipur 1027 60.1 1106 68.7
Meghalaya 1110 61.0 1629 59.8
Mizoram 1262 59.5 1947 58.0
Nagaland 1476 60.8 1832 60.8
Orissa 818 62.4 1548 67.0
Punjab 1649 65.9 2109 65.5
Rajasthan 1179 67.0 1663 65.3
Sikkim 1321 68.7 2150 53.5
Tamilnadu 1160 63.3 1948 64.9
Tripura 1176 63.8 1871 64.4
Uttar Pradesh 899 62.8 1574 70.0
Uttarakhand 1747 83.6 1745 62.6
West Bengal 952 60.6 1965 68.4
All India 1054 64.5 1984 66.7
Notes: Average daily consumption expenditure per capita per day for rural areas is Rs.35.10 and for urban areas is Rs. 66.10. Source: Sunday Times of India, “Times Nation”, New Delhi Edn. 29 April, 2012- P. 15 The above table demonstrates that there is significant difference between the states regarding average monthly spending, but in terms of percentage of people below this average, there is not much variation. Still, among rural populations Uttarakhand has the most number of people below the average monthly

VOLUME NO. 3 (2013), ISSUE NO. 08 (AUGUST) ISSN 2231-5756
INTERNATIONAL JOURNAL OF RESEARCH IN COMMERCE, IT & MANAGEMENT A Monthly Double-Blind Peer Reviewed (Refereed/Juried) Open Access International e-Journal - Included in the International Serial Directories
http://ijrcm.org.in/
133
expenditure line and Assam showed better percentage. Among urban population, Uttar Pradesh has the maximum number of people below the average monthly expenditure and Sikkim has the least percentage.
TABLE-2: STATE WISE INFORMATION ON NUMBER OF HOUSEHOLDS AVAILING BANKING FACILITIES
Sl. No.
State Population (based on census 2011)
Number of Branches as on 31.3.2012
Total no. of households
Percentage of households availing banking services
No. of households availing banking services
No. of households not availing banking services
1 ANDAMAN & NICOBAR
379944 43 93376 89.3 83363 10013
2 ANDHRA PRADESH 84665533 7785 21024534 53.1 11163283 9861251
3 ARUNACHAL PRADESH
1382611 88 261614 53.0 138730 122884
4 ASSAM 31169272 1549 6367295 44.1 2807169 3560126
5 BIHAR 103804637 4373 18940629 44.4 8409554 10531075
6 CHANDIGARH/UT 1054686 290 235061 80.1 188304 46757
7 CHHATTISGARH 25540196 1471 5622850 48.8 2744180 2878670
8 DADRA&NAGAR HAVELI/UT
342853 39 73063 56.7 41412 31651
9 DAMAN & DIU 242911 31 60381 65.4 39516 20865
10 DELHI 16753235 2631 3340538 77.7 2595302 745236
11 GOA 1457723 476 322813 86.8 280259 42554
12 GUJARAT 60383628 5172 12181718 57.9 7049297 5132421
13 HARYANA 25353081 2807 4717954 68.1 3214296 1503658
14 HIMACHAL PRADESH
6856509 1106 1476581 89.1 1315900 160681
15 JAMMU & KASHMIR
12548926 1062 2015088 70.0 1410565 604523
16 JHARKHAND 32966238 2009 6181607 54.0 3334876 2846731
17 KARNATAKA 61130704 6598 13179911 61.1 8054677 5125234
18 KERALA 33387677 4681 7716370 74.2 5728876 1987494
19 LAKSHADWEEP 64429 12 10703 85.3 9127 1576
20 MADHYA PRADESH 72597565 4495 14967597 46.6 6975245 7992352
21 MAHARASHTRA 112372972 8927 23830580 68.9 16414892 7415688
22 MANIPUR 2721756 84 507152 29.6 150009 357143
23 MEGHALAYA 2964007 224 538299 37.5 201812 336487
24 MIZORAM 1091014 101 221077 54.9 121285 99792
25 NAGALAND 1980602 100 399965 34.9 139523 260442
26 ORISSA 41947358 3126 9661085 45.0 4351103 5309982
27 PUDUCHERRY 1244464 159 301276 64.0 192695 108581
28 PUNJAB 27704236 4012 5409699 65.2 3527688 1882011
29 RAJASTHAN 68621012 4581 12581303 68.0 8557822 4023481
30 SIKKIM 607688 84 128131 67.5 86457 41674
31 TAMILNADU 72138958 6988 18493003 52.5 9712804 8780199
32 TRIPURA 3671032 247 842781 79.2 667765 175016
33 UTTAR PRADESH 199581477 11261 32924266 72.0 23711472 9212794
34 UTTARAKHAND 10116752 1344 1997068 80.7 1611901 385167
35 WEST BENGAL 91347736 5703 20067299 48.8 9783629 10283670
ALL INDIA 1210193422 93659 246692667 58.7 144814788 101877879
TABLE-3: SUMMARY OF HOUSEHOLDS AVAILING BANKING SERVICES
2001 2011
Areas Total no. of households
Number of households availing Banking services
Percent Total no. of households
Number of households availing Banking services
Percent
Rural 138271559 41639949 30.1 167826730 91369805 54.4
Urban 53692376 26590693 49.5 78865937 53444983 67.8
Total 191963935 68230642 35.5 246692667 144814788 58.7
Source of Table 2 & Table 3: Census of India and RBI Table 2 signifies that some states of India still have lesser number of people availing banking services and Table 3 states that compared to 2001, 2011 shows better percentage of people access to banking services in rural, urban & total.
IMPORTANCE OF FINANCIAL INCLUSION 1. It is a necessary requirement for acquiring growth with equity. 2. It protects the poor from the clutches of selfish or greedy moneylenders. 3. It mobilizes the savings of the poor into the formal financial intermediation and channels them into investment.
FINANCIAL INCLUSION IN INDIA Financial Inclusion in India has been estimated by various Committees in response to its people access to get benefit from banking services. It is noticed that only 34% of India’s population has access to banking services (Pandey and Katiyar). The Eleventh Five Year Plan (2007-12) visualized inclusive growth as a key feature. It is a task to achieve Inclusive growth in India as it very difficult to bring together 600 million people of rural India into the mainstream. So, one of the best means to achieve Inclusive growth is through Financial Inclusion. In India, the process of Financial Inclusion can be broadly classified into three phases:
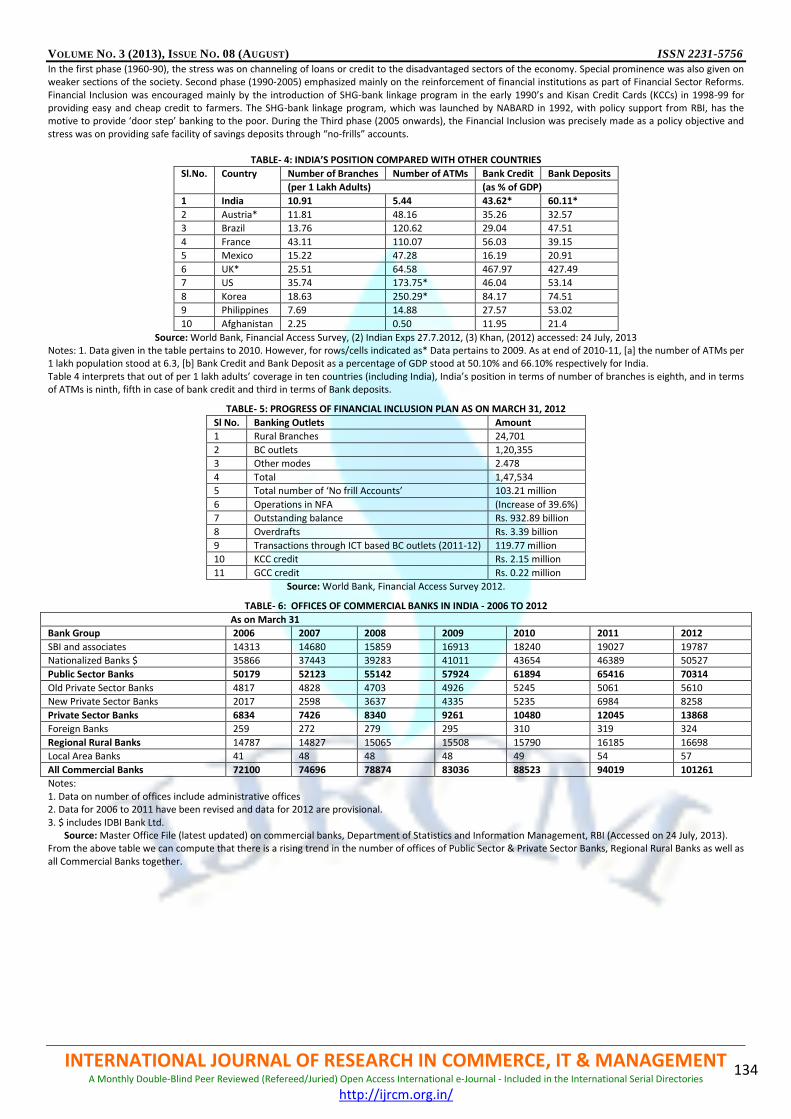
VOLUME NO. 3 (2013), ISSUE NO. 08 (AUGUST) ISSN 2231-5756
INTERNATIONAL JOURNAL OF RESEARCH IN COMMERCE, IT & MANAGEMENT A Monthly Double-Blind Peer Reviewed (Refereed/Juried) Open Access International e-Journal - Included in the International Serial Directories
http://ijrcm.org.in/
134
In the first phase (1960-90), the stress was on channeling of loans or credit to the disadvantaged sectors of the economy. Special prominence was also given on weaker sections of the society. Second phase (1990-2005) emphasized mainly on the reinforcement of financial institutions as part of Financial Sector Reforms. Financial Inclusion was encouraged mainly by the introduction of SHG-bank linkage program in the early 1990’s and Kisan Credit Cards (KCCs) in 1998-99 for providing easy and cheap credit to farmers. The SHG-bank linkage program, which was launched by NABARD in 1992, with policy support from RBI, has the motive to provide ‘door step’ banking to the poor. During the Third phase (2005 onwards), the Financial Inclusion was precisely made as a policy objective and stress was on providing safe facility of savings deposits through “no-frills” accounts.
TABLE- 4: INDIA’S POSITION COMPARED WITH OTHER COUNTRIES
Sl.No. Country Number of Branches Number of ATMs Bank Credit Bank Deposits
(per 1 Lakh Adults) (as % of GDP)
1 India 10.91 5.44 43.62* 60.11*
2 Austria* 11.81 48.16 35.26 32.57
3 Brazil 13.76 120.62 29.04 47.51
4 France 43.11 110.07 56.03 39.15
5 Mexico 15.22 47.28 16.19 20.91
6 UK* 25.51 64.58 467.97 427.49
7 US 35.74 173.75* 46.04 53.14
8 Korea 18.63 250.29* 84.17 74.51
9 Philippines 7.69 14.88 27.57 53.02
10 Afghanistan 2.25 0.50 11.95 21.4
Source: World Bank, Financial Access Survey, (2) Indian Exps 27.7.2012, (3) Khan, (2012) accessed: 24 July, 2013 Notes: 1. Data given in the table pertains to 2010. However, for rows/cells indicated as* Data pertains to 2009. As at end of 2010-11, [a] the number of ATMs per 1 lakh population stood at 6.3, [b] Bank Credit and Bank Deposit as a percentage of GDP stood at 50.10% and 66.10% respectively for India. Table 4 interprets that out of per 1 lakh adults’ coverage in ten countries (including India), India’s position in terms of number of branches is eighth, and in terms of ATMs is ninth, fifth in case of bank credit and third in terms of Bank deposits.
TABLE- 5: PROGRESS OF FINANCIAL INCLUSION PLAN AS ON MARCH 31, 2012
Sl No. Banking Outlets Amount
1 Rural Branches 24,701
2 BC outlets 1,20,355
3 Other modes 2.478
4 Total 1,47,534
5 Total number of ‘No frill Accounts’ 103.21 million
6 Operations in NFA (Increase of 39.6%)
7 Outstanding balance Rs. 932.89 billion
8 Overdrafts Rs. 3.39 billion
9 Transactions through ICT based BC outlets (2011-12) 119.77 million
10 KCC credit Rs. 2.15 million
11 GCC credit Rs. 0.22 million
Source: World Bank, Financial Access Survey 2012.
TABLE- 6: OFFICES OF COMMERCIAL BANKS IN INDIA - 2006 TO 2012
As on March 31
Bank Group 2006 2007 2008 2009 2010 2011 2012
SBI and associates 14313 14680 15859 16913 18240 19027 19787
Nationalized Banks $ 35866 37443 39283 41011 43654 46389 50527
Public Sector Banks 50179 52123 55142 57924 61894 65416 70314
Old Private Sector Banks 4817 4828 4703 4926 5245 5061 5610
New Private Sector Banks 2017 2598 3637 4335 5235 6984 8258
Private Sector Banks 6834 7426 8340 9261 10480 12045 13868
Foreign Banks 259 272 279 295 310 319 324
Regional Rural Banks 14787 14827 15065 15508 15790 16185 16698
Local Area Banks 41 48 48 48 49 54 57
All Commercial Banks 72100 74696 78874 83036 88523 94019 101261
Notes: 1. Data on number of offices include administrative offices 2. Data for 2006 to 2011 have been revised and data for 2012 are provisional. 3. $ includes IDBI Bank Ltd.
Source: Master Office File (latest updated) on commercial banks, Department of Statistics and Information Management, RBI (Accessed on 24 July, 2013). From the above table we can compute that there is a rising trend in the number of offices of Public Sector & Private Sector Banks, Regional Rural Banks as well as all Commercial Banks together.

VOLUME NO. 3 (2013), ISSUE NO. 08 (AUGUST) ISSN 2231-5756
INTERNATIONAL JOURNAL OF RESEARCH IN COMMERCE, IT & MANAGEMENT A Monthly Double-Blind Peer Reviewed (Refereed/Juried) Open Access International e-Journal - Included in the International Serial Directories
http://ijrcm.org.in/
135
TABLE- 7: EXPANSION OF BANK BRANCHES IN INDIA
Year Rural Semi-Urban Urban & metropolitan Total Rural share (%)
1969 1833 3342 3087 8262 22
1970 3063 3718 3350 10131 30
1975 6807 5598 6325 18730 36
1980 15105 8122 9192 32419 47
1985 30185 9816 11384 51385 59
1990 34791 11324 13637 59752 58
1995 33004 13341 16022 62367 53
2000 32734 14407 18271 65412 50
2005 32082 15403 20870 68355 47
2010 32554 21053 34834 88441 37
2011 33813 23236 36750 93799 36
2012 35653 25542 38698 99884 36
Source: RBI The above table clearly shows the increase in the number of Bank branches in rural, semi-urban and urban areas, although rural share declines from 1990 onwards.
TABLE- 8: COVERAGE OF BANKING SERVICES IN INDIA
Sl No. Region Current Account Savings Account Total Population Total no. of Accounts Total no. of Accounts (%)
1 North 4215701 52416125 32676462 56631826 17.65
2 North East 476603 6891081 38495089 7367684 2.3
3 East 1814219 47876140 227613073 49690359 15.48
4 Central 2202217 64254189 255713495 66456406 20.71
5 West 3178102 49525101 149071747 52703203 16.42
6 South 4666014 83386898 223445381 88052912 27.44
All India 16552856 304349534 1027015247 320902390 100
Source: National Sample Survey Organisation (2012). Table 8 indicates that, among the entire region, South India has maximum number (27.44%) of total Account.
MAJOR ISSUES, CHALLENGES & STRATEGIES IN FINANCIAL INCLUSION There are various issues, challenges and strategies to achieve or sustain the target of complete Financial Inclusion. These may be: 1. Change in the Tactic of banks. 2. Relaxation in governing framework. 3. SHG-Bank Linkage Program (SLBP) 4. Mutual Fund Institutions. 5. Business Facilitators (BFs)/Business Correspondents (BCs). 6. Mobile Banking Service. 7. Aadhar Enabled Payment System. 8. Financial Literacy & Awareness. 9. Consumer protection and customer service. 10. Issues and challenges in ICT based Financial Services. 11. Financial Inclusion as a business opportunity.
FINDINGS So, now we can get a clear picture of What Financial Inclusion is and how it helps in attaining Inclusive growth. Here, our above specified Objectives of the study are fulfilled to a certain extent i.e. we have got a clear picture of what inclusive growth is and the extent of Financial Inclusion as well as Exclusion in India; also the role of Financial Inclusion for Inclusive Growth. Again, our stated Hypothesis is rejected, since we have got enough evidence to show that Financial Inclusion has created a situation or environment for Inclusive or equitable growth in India. So, Specific Findings of the study are: 1. India’s position in terms of Bank credit and deposits as percentage of GDP has improved significantly in line with other developed countries which may
enable the growth process of the country. 2. Various schemes like Kisan Credit Card (KCC) & General Credit Card (GCC) etc. emerged which can generate enough assistance to the small as well as
marginal farmers, poor citizens of the country. 3. Branches of Public as well as Private sector banks, Regional Rural Banks have increased tremendously over the years which is the sign of ‘Inclusion’ in
Financial term, that is more financial coverage of people is now possible region wise, which is the sign of prosperity of the nation. 4. Altogether number of Bank branches has increased in rural, semi-urban & urban areas which is a good sign for country’s financial up gradation. 5. Coverage of Banking Services has shown an encouraging result. Southern India has gained the most in terms of total number of accounts (Current &
Saving). 6. Business Correspondents (BC) outlets have been established in rural centers to drive the government’s financial inclusion programme. 7. Also we have seen from the above results that -transactions are now done through ICT based BC outlets for evolving an effective financial inclusion
delivery mechanism. 8. Various Technology options such as- ATMs, Mobile Banking, Aadhar Enabled Payment Systems (AEPS) etc. have been started to help in the speedy delivery
of cash. So, from these findings we can say one thing easily that Financial Inclusion i.e. coverage of people from rural to urban financially has been established in India which can easily create an environment for growth with equity.
SUGGESTIONS 1. Use of technology in banking sector has developed fast enough and more interestingly the notion that the poor can be brought under the shadow of
banking has arrived. Government should implement various instant measures in a more effective manner. 2. Strengthening of Microfinance Institutions, business facilitators & business correspondents, which can give easy access to banking services especially for
rural poor. 3. Financial awareness should be enhanced. For that government should timely inform their new schemes, benefits to the people by advertising the same, so
that more & more people should be covered financially. 4. More number of rural bank branches should be established in the rural areas.

VOLUME NO. 3 (2013), ISSUE NO. 08 (AUGUST) ISSN 2231-5756
INTERNATIONAL JOURNAL OF RESEARCH IN COMMERCE, IT & MANAGEMENT A Monthly Double-Blind Peer Reviewed (Refereed/Juried) Open Access International e-Journal - Included in the International Serial Directories
http://ijrcm.org.in/
136
5. Credit to the rural poor especially to small & marginal farmers should be given at cheap interest rate. For that Microfinance Institutions or NGOs may be established along with rural banks.
6. Most importantly, equitable distribution of financial services is the key for Inclusive Growth, which Government should take into consideration.
CONCLUSION Inclusive Growth depends mainly on equitable distribution of growth benefits and opportunities and Financial Inclusion is one of the most critical parts, which need to be equitably distributed in the country in order to attain comprehensive growth. It needs to be assumed by the state that to bring higher growth, there should be inclusive finance irrespective of all sections of people. Unquestionably, the issue of enlarging the geographical and demographic reach creates challenges from the viability or sustainability perspectives and suitable business models are still developing and various delivery mechanisms are being tested with by the numerous government agencies at the central & state level. But, it is felt that the efforts taken are not good enough to meet this overwhelming issue of Financial Inclusion. Financial Literacy and Awareness continue to remain a matter of concern with regard to usage of financial services or products. It appeals for harmonization of all the participants like- Banks, Governments, Civil Societies, and NGOs etc. to reach the objective of Financial Inclusion.
LIMITATIONS Although this study is carefully prepared, but there are certain limitations or shortcomings of this study exist. These may be: 1. To cover entire India by Secondary Sources of data is always misleading to a certain extent. Since secondary data cannot always tell the real picture of
Financial Inclusion, a Primary field survey is required, but due to time constraint it cannot be possible, which may sometimes question the authenticity of data generated.
2. Financial Inclusion cannot be possible in a short span of time. It requires a longer time period to get a comprehensive result. But, in this study we may not be able to show this in a longer time span and get a clear picture of growth due to non-availability of data. But whatever we have tried to show may bring the desired outcome, i.e. a good picture of Financial Inclusion with inclusive growth.
3. There can be more parameters of Financial Inclusion which may be missing in this study.
SCOPE FOR FURTHER RESEARCH Financial Inclusion is a key term in Financial Literature, which can take the rural poor to the clutches of banking habits. But for Inclusive growth, i.e. equitable distribution of financial services to all sections of society, only banks cannot fulfill the requirement of people, but various NGOs and Mutual Fund Institutions should come forward. So, there is ample scope for gathering information regarding their role towards Financial Inclusion, which can be a good area for further research. Also, at present Technology can change the world into one system. Various alternative ways of financial inclusion like- Mobile Banking Service, establishment of ATMs etc. have been introduced, which can give new avenues for research in this field.
REFERENCES 1. Beck, Asli Demirguc- Kunt and Peria (2006), “Banking Services for Everyone? Barriers to Bank Access and use Around the world, World Bank Policy Research
Working Paper no. 4079, Dec. 2006, Accessed on 17 July 2013. 2. Chandran, Sarath, “Financial Inclusion strategies for Inclusive Growth in India”, retrieved from ,HYPERLINK http://papers.ssrn.com/sol3/papers.cfm?
abstract_id=1930980} September 20, 2011. Accessed on 21 July, 2013. 3. Chattopadhyay, Sadhan Kumar, (2011), RBI Working Paper on Financial Inclusion in India- A case study of West Bengal July 2011 retrieved
from:{HYPERLINK http://www.rbi.org.in/scripts/PublicationsView.aspx?id=13517}; Accessed on 21 July, 2013. 4. Dixit, Radhika and Ghosh, Munmun, “Financial Inclusion for Inclusive Growth in India- A study of Indian Status”, International Journal of Business
Management & Research (IJBMR), Vol. 3, Issue 1, March 2013, pp. 147-156, ISSN: 2249-6920. Accessed on 19 July, 2013. 5. Dr.Vighneswara Swamy and Dr. Vijayalakshmi, Role of Financial Inclusion for Inclusive Growth in India- Issues & Challenges, 2010. Accessed on 16 July,
2013. 6. Gandhi, M.M, “Financial Inclusion in India- Issues and challenges”, view of space: International Multidisciplinary Journal of Applied Research, Vol. 1, Issue:
3, June 2013, ISSN 2320-7620. Accessed on 21 July, 2013. 7. GoI-FM, (2012), Circular dated May 15, 2012 issued by the Ministry of Finance, Govt. of India, mandating all banks for Opening one bank account per
family. 8. H.M. Treasury, (2007): “Financial Inclusion: the way forward”, H.M. Treasury, UK, March. Accessed on 16 July, 2013. 9. Indian Express, (2012), “Financial Inclusion - India vs World” a news-item published in the supplement - ‘Business’, of the daily newspaper ‘The Indian
Express’, July 27, 2012, Pune Edn., pp. 15. Retrieved from ,Hyperlink http://epaper.indianexpress.com/49172/Indian-Express-Pune/27-July-2012#page /15/2}; Accessed on 26 July 2013.
10. Kelkar, Vijay, “Financial Inclusion for Inclusive Growth”, ASCI Journal of Management 39(1): 55-68; September 2009. Accessed on: 16 July, 2013. 11. Kempson, E. and Whyley, C. (1999). “Kept Out or Opted Out? Understanding and combating Financial Exclusion. Bristol: Policy Press. Retrieved from:
{HYPERLINK http://www.pfrc.bris.ac.uk/Reports/Kept_out_opted_out.pdf}; Accessed on 22 July, 2013. 12. Khan, Harun R., (2012) Dy Governor RBI, his Speech on ‘Issues & Challenges in Financial Inclusion : Policies, Partnerships, Processes & Products’ June 30,
2012 in a Symposium on Financial Inclusion in Indian Economy organized by Indian Institute of Public Administration, Bhubaneswar retrieved from: {HYPERLINK http://rbidocs.rbi.org.in/rdocs/Bulletin/PDFs/ 7ICFINC 100812F.pdf}; Accessed on 16 July, 2013.
13. Leeladhar, V. (2005), “Taking Banking Services to Common Man: Financial Inclusion”, Commemorative Lecture by Shri Leeladhar, Deputy Governor, RBI, Fedbank Hormis Memorial Foundation, Ernakulam, December 2, 2005. Accessed on 17 July, 2013.
14. Leyshon A. and Thrift N. (1995). “Geographies of financial exclusion: financial abandonment in Britain and the United States”. Transactions of the Institute of British Geographers, Volume 20, Number 3, September 1995 , pp. 312-341, Royal Geographical Society. Accessed on 22 July, 2013.
15. Pandey and Katiyar, “Financial Inclusion in Indian Scenario”, International Journal of Management Research and Development, Shakti Publication. Accessed on: 17 July, 2013.
16. Paramasivan and Ganeshkumar, “Overview of Financial Inclusion in India”, International Journal of Management and Development Studies, Vol. 2(2013), Issue No. 3 (March). ISSN (Online): 2320-0685. Accessed on 21 July, 2013.
17. Report of the Committee on Financial Inclusion in India (Chairman: C. Rangarajan), 2008, Government of India. Accessed on 16 July, 2013. 18. Sharma and Kukreja, “An Analytical Study: Relevance of Financial Inclusion for Developing Nations”, International Journal of Engineering and Science. ISSN:
2278-4721, Vol.2, Issue.6 (March 2013), pp.15-20. Accessed on 21 July, 2013. WEBSITES 19. http://financialservices.gov.in/banking/circulars/2012/Opening%20of%20One%20Bank%20account%20per%20family28aug.pdf. 20. http://rbidocs.rbi.org.in/rdocs/Publications/PDFs/00STB071112FLS.pdf.

VOLUME NO. 3 (2013), ISSUE NO. 08 (AUGUST) ISSN 2231-5756
INTERNATIONAL JOURNAL OF RESEARCH IN COMMERCE, IT & MANAGEMENT A Monthly Double-Blind Peer Reviewed (Refereed/Juried) Open Access International e-Journal - Included in the International Serial Directories
http://ijrcm.org.in/
137
PROBLEMS OF SELF HELP GROUPS WITH SPECIAL REFERENCE TO STATE MICRO FINANCE VISION 2011, ARUNACHAL PRADESH
AKEPI LINGGI EHILI RESEARCH SCHOLAR
RAJIV GANDHI UNIVERSITY DOIMUKH
ABSTRACT
The Self Help Group (SHG)-Bank Linkage Programme, in the past nineteen years, has become a well known tool for bankers, developmental agencies and even for corporate houses. SHGs, in many ways, have gone beyond the means of delivering the financial services as a channel and turned out to be focal point for purveying various services to the poor. The programme, over a period, has become the common vehicle in the development process, converging important development programmes. With the small beginning as Pilot Programme launched by NABARD by linking 255 SHGs with banks in 1992, the programme has reached to linking of 69.5 lakh saving-linked SHGs and 48.5 lakh credit-linked SHGs and thus about 9.7 crore households are covered under the programme, envisaging synthesis of formal financial system and informal sector. In view of the large outreach and pre-dominant position of the microfinance programme, it is important to keep a continuous track of the status, progress, trends, qualitative and quantitative performance comprehensively. To achieve this objective, Reserve Bank of India and NABARD issued guidelines in the year 2006-07 to Commercial Banks, Regional Rural Banks and Cooperative Banks to furnish data on progress under microfinance. The data so collected covers various parameters like savings of SHGs with banks, bank loan disbursed to SHGs, bank loan outstanding against SHGs, gross nonperforming assets of bank loans to SHGs, recovery performance of loans to SHGs. Further, the banks also furnished the data regarding bank loans provided to Micro Finance Institutions (MFIs). NABARD has been bringing out the consolidated document annually. This research presents the bird eye view regarding the small achievement the microfinance vision 2011 of Government of Arunachal Pradesh has made progress under microfinance sector under the model, SHG – Bank Linkage model, the problems encountered by the members of SHGs in moving ahead for the common good of the groups.
KEYWORDS Micro Finance, Arunachal Pradesh, SHG, NABARD.
INTRODUCTION ll that is necessary to save the poor from poverty is to create a functioning environment. Once the poor can unleash their energy and creativity poverty will vanish quickly”. Muhammad Yunus: 10 December 2006 Poverty is the disease which every government wants to eradicate. Every government wants to see that the people come out of the clutches of the abject
poverty. India is a country of small villages, where most of our people live in it and carry on the occupation of farming. Over the years the contribution of farm sector has been declining, but still a large chunk of the population is still dependents on this occupation to sustain their livelihood. The average per capita income of the country has been improving over the period through five year plans and continuous economic reforms. After the new economic policy of 1990s, the country has seen so much progress in all front, say in service sectors, manufacturing, but it has also seen decline in the agriculture sector. New players have emerged in the market; new economic fronts have come up. India’s gross domestic products have improved over a period of time. It seems all these developments have not percolated in all places and development has not been balance as would have been desired by the founding father of the nation.
REVIEW OF LITERATURE The review of the study conducted in areas of “problems of self help groups with special reference to state micro finance vision 2011, Arunachal Pradesh” a sincere attempt has been made to accumulate the related literature to review the research work that has been done in the past periods. Verrier Elwin (1958) A philosophy for NEFA explains the tribal people of India as very special challenge. Their simplicity, which is most lovable; their art, which often gives them the dignity of princes but is so easily destroyed; their courtesy and hospitality, discipline and self- reliance; their ability to work hard and co-operatively, their occasional bewilderment before the advance of an unfamiliar world, and yet their welcome and friendliness to that world; these things win the heart and call for the very best in those who try to serve them. Nothing can be too good for them, but with what care that good has to be shared. Novel Laureate Amarty Sen. (1987) “Food and Freedom” explains that the provision of food is indeed a central issue in general social ethics, since so much in human life does depend on the ability to find enough to eat. In particular, the freedom that people enjoy to lead a decent life, including freedom from hunger, from avoidable morbidity, from premature mortality, etc., is quite centrally connected with the provision of food and related necessities. Also, the compulsion to acquire enough food may force vulnerable people to do things which they resent doing, and may make them accept lives with little freedom. The role of food in fostering freedom can be an extremely important one. Novel Laureate Amarty Sen (1993) explains that the freedom to lead different types of life is reflected and the person’s capabilities set. The capability of a person depends on variety of factors including personal characteristics and social arrangements. Mayoux (1998) suggest that empowerment is a process of internal change of power within argumentation of capabilities or power to collective mobilisation of women and when possible men or power with, the purpose of questioning and changing the sub-ordination connection with gender or power over. Puhazhendhi (1999) analysed the functioning SHGs, in performance, sustainability, empowerment of women, economic impact on the members, future potentials etc. He observed that SHGs in Tamil Nadu are performing well towards social change and transformation. The emerging trends are leading to positive direction of empowerment of members and promotion of micro finance. Myrada (2000) "SHG the concept” explains the basis of the self help group exists prior to any intervention. The members are linked by a common bond like caste, sub-caste, blood, community, place of origin or activity. These natural groups are commonly called “affinity groups". Even when group members are engaged in a similar traditional activity, like basket weaving, the basis of the group's affinity is a common caste or origin. V.M. Rao (2002) maintains that a review of the genesis and development of SHGs in India reveals that the existing formal financial institutions have failed to provide finances to landless, marginalised and disadvantage groups. The origin of SHG’s could be treated to mutual aid in Indian village community. SHG’s encourage saving and promote income generating activities through small loans. The experience available in the country and elsewhere suggests that SHG’s are sustainable, stimulate savings and in the process help borrowers to come out of vicious circle of poverty. C. S Reddy (2005), APMAS CEO Sandeep Manak, APMAS Intern, Self Help Groups: A keystone of Microfinance in India – Women empowerment and Social Security. The paper throws lights regarding the models of SHGs, its state of affairs in India, Impact of SHGs in political, social harmony and justices, community and livelihood of the people.
A

VOLUME NO. 3 (2013), ISSUE NO. 08 (AUGUST) ISSN 2231-5756
INTERNATIONAL JOURNAL OF RESEARCH IN COMMERCE, IT & MANAGEMENT A Monthly Double-Blind Peer Reviewed (Refereed/Juried) Open Access International e-Journal - Included in the International Serial Directories
http://ijrcm.org.in/
138
NEED/IMPORTANCE OF THE STUDY The state of Arunachal Pradesh located at the tip of North Eastern Indian and it lies between 26 30’ North latitude and 91 30’ East latitude. It covers an area of 83,743 square km, which is endowed with tropical mountains and hilly terrains. As per the 2011 provisional census data 77% of the total population of Arunachal Pradesh lives in Rural Areas. Alleviation of poverty remains a major challenge before the Government. The Microfinance Vision 2011 of Arunachal Pradesh has been implemented with the objective to generate rural self employment among the mass thought SHG movement. The vision in its course of action has been trying it’s best to achieve the goal of reaching 5000 new SHGs by the end of the mission period, but it seems the potentiality of the vision could not be realized as desired by the vision statement. Thinking on this line, this paper is an attempt to study the various causes for not achieving its vision.
OBJECTIVES 1. To study the progress made in the microfinance vision 2011 – Arunachal Pradesh 2. To highlight the problem faced by SHGs in the achievement of microfinance vision 2011 3. Suggestion and recommendation with regard to SHG movement in Arunachal Pradesh.
RESEARCH METHODOLOGY SELECTION OF SAMPLE The samples selected are basically from those districts where the capacity building training was conducted by the team members of Support Centre State Micro Finance Vision 2011. These districts are Lower Dibang Valley, Lohit, Lower Subansiri, Papum Pare and Tirap districts of Arunachal Pradesh. Mostly training was provided at the district head quarter. SELECTION AND DEVELOPMENT OF TOOLS Accuracy of the study depends upon the appropriateness of tools with which data are collected. For collection of data in the present study the investigator used mostly participatory observation by which the behavioral aspects of beneficiaries and other respective respondents were analysed. The investigator also participated in training programmers’ for the self help groups at the village level to get the ground realities of the situation. COLLECTION DATA PRIMARY DATA Primary data were collected through field visit, by organising of training, workshops and exhibitions for promoting the SHGs under the banner of State Microfinance Vision. Interview schedule and questionnaires were used to collect data from the SHG members. Case Study methods were also used to document the success stories and the problem face by the SHGs. Group discussion was one of the most effective tools used for the present study. SECONDARY DATA Secondary data were collected after consultation with key departments like Department of Social Welfare, Women and Child Development, Integrated Child Development Services, NABARD, Apex Bank, other commercial banks and NGOs working in the promotion of the SHGs in the study area.
RESULT & DISCUSSION THE PROPGRESS MADE IN THE MICROFINANCE VISION 2011 – ARUNACHAL PRADESH SHGs are expected to focus on the poor for poverty reduction and women's empowerment, specifically including those who have been by-passed by the banking system1. Discussions around the data for SHG outreach accordingly tend to assume that SHG members are all from poor families. Yet, there is usually not much evidence for such an assumption. Nor can it be assumed that all those by-passed by the banking system are "absolute have-nots". According to the Census of India (2001), 70% of the total rural population does not have access to banking services (savings or credit through the formal banking system). If we compare this with the estimates of poverty in India - 25-50% of the rural population2 it is clear that it is not only the poor who are excluded from banking services. The value SHG has brought into the social life of the people of Arunachal Pradesh in terms of economic benefits, education, tackling the issues which concerns most of the village people can only be felt in long run, but in the short run it has affected some pockets of the population in a positive way. 1,6263 SHGs have been formed under the microfinance vision 2011 till 31.03.2011. No data was available after that. On an average each SHG consist of 10 members, which means 16,260 women folks have come together to share and benefits’ from each other’s mutual self help. As per the table 1, women population of the state this comes to 2.45 % of the women population and 1.18 % of the total state population. The SHG movement still has to a go long way, but with efforts from the policy makers and bankers this can be achieved in near future with ease. THE PROBLEMS IN SHG MOVEMENT Every state has some unique problems. The state of Arunachal Pradesh with its diverse culture too has many unique problems. The problems related to SHG movement through Microfinance Vision 2011 are discussed below. THE PROBLEM OF INFRASTRUCTURE The problem of infrastructure means that since the places are very far off and population of the state very sparsely populated i.e.13 per square km as per provisional census 2011. This creates a unique problem of first bringing in together some people for group formation, the other being providing them regular support base from the department and as well as the NGOs. THE PROBLEM OF TOO MANY GOVERNMENT SCHEMES TARGETING THE SAME PEOPLE This may not be unique to the state alone, but the problem is aggravated due to the state’s low population. The SHG movement started in the state very long back, hence in a way it seems different departments and agencies of the government targeting the same set of people. The common observation regarding the SHGs is that those SHGs who have availed some government subsides etc seems getting subsides in some way or other way. There were also some SHGs who are able to avail credits from the bank, whereas there are many who are yet to see the door of the banks. THE PROBLEM OF POLITICAL INTERFERENCE Nobody can escape the clutches of politician and the state and people of Arunachal Pradesh are no exception to this. Many a time, government schemes are directed through the panchayat leaders as they are considered to be near to the people of the village. They are assumed to be known to all the rural masses of their areas. They are elected to help the grass root level of people and nurture the grassroots level democracy, but this seems going the other way in some cases where there exist the political differences. Some of the SHGs have complained about the behavior of their panchayat leaders as they are from different parties. They felt that whatever due to them was denied due to the political differences with the authorising person i.e. the panchayat leader.
TABLE 1 POPULATION OF ARUNACHAL PRADESH
Po
pu
lati
on
Urban Total Rural Total
Person 3,13,446 13,82,611 10,69,165 13,82,611
Male 1,65,928 7,20,232 5,54,304 7,20,232
Female 1,47,518 6,62,379 5,14,861 6,62,379
Source: Census of India 2011 Provisional

VOLUME NO. 3 (2013), ISSUE NO. 08 (AUGUST) ISSN 2231-5756
INTERNATIONAL JOURNAL OF RESEARCH IN COMMERCE, IT & MANAGEMENT A Monthly Double-Blind Peer Reviewed (Refereed/Juried) Open Access International e-Journal - Included in the International Serial Directories
http://ijrcm.org.in/
139
An another story is like this, the SHG started its activities long ago and over a period of time these members accumulated more than Rs 8 lakhs as their savings in the bank accounts. The problem started when the members started supporting opposing candidates during the MLA election. Members got divided on the basis of the candidates they supported in the MLA election. The problem started after the election, the groups within the groups do not interact with each other and the money is just lying in the bank. So the moral of the story is that due care should be given in keeping a respecting the views of the members and move forward rather than settle down with petty issue. THE PROBLEM OF LIMITED ECONOMIC ACTIVITIES The problem as discussed in the earlier paragraphs, the state has very less economic opportunities because of which there seems to be too much lending of money to non members at very high rate of interest. In village like Bizari of Lower Dibang Valley district the only activities taken up by the SHGs members are of working for wage, over a period of time these SHGs have accumulated savings of more than 5 lakhs of rupees but the problem of banking has made these groups to keep the money with themselves and to lend to others for taking up ginger cultivations etc., which is at the mercy of the nature and the market situation. THE PROBLEM OF LIMITED EDUCATION The average education level of the women members of the SHGs is very low. This has created problems in the way of maintaining the books and records of the SHGs. Many of the SHG members have to depend upon the availability of the educated members or outsiders in recording their records, which leads to delay in proper utilisation of their funds. THE PROBLEM OF LIMITED SUPPORT FROM MALE COUNTERPARTS Many of the man folks do not support their women folks going to other places for training and other economic activities. Therefore encouraging the man folks to be a part of the SHG movement is the need of the hour else the over a long run the movement may loss steam. THE PROBLEM OF DIFFERENT INCOME LEVEL In many cases the SHGs are formed, but since the income levels of the members differ, their objective also differs. Some members may have joined the groups only for the sake of availing the subsidy, where as some may have joined to take some venture. It has been seen that income variables do affect the functioning of the SHG activities. The better way of avoiding this situation is to bring in people of same economic status rather than only concentrating in the tribe, community, village level etc.
FINDINGS The Micro Finance Vision 2011 started off with some apprehension from the some quarters of the government department, but picked up its momentum. It failed to achieve its target of 5000 SHGs but in the mean time it did guide many of the member of SHGs in getting them trained in book keeping, economic activities etc., thus paving the way for next big government project – the rural livelihood mission. The target may not have been achieved in the areas of bank linkage and credit linkage but the limited level of interaction has given the opportunities to the banks to think about and come up with ideas which will suit the economic models of the state. It will also make the bankers to think about the objectives and purpose of their actions with regard to their business in Arunachal Pradesh. The role of the government with regards to policy framing and duplication of work needs to be looked into and further refinement has to be brought in for better economic benefit value to the poor masses of the state and nation as a whole. The need for bringing in better coordination and time bound target achievement were lagging in the Microfinance Vision 2011. Some of the districts had no records of SHGs as there was no compulsion on the part of the officer to achieve the target. The targets framed were just advisory in nature and answerability for the failure and fixing the responsibility was lagging in the project. Political interferences with regards to the functioning of SHGs were observed in some cases. Better educations about the rights of SHGs have to be encouraged to make these groups better equipped to fight for their rights.
SUGGESTION & CONCLUSION The suggestions for the government will be that polices and schemes have to be first customised for the local conditions before the implementation of the process or schemes. Proper ground works have to be carried out before launching any government schemes in such a big way. The target set should also look be from the angle of human value it has added by way of improving the living conditions, nutrition etc. rather than only thinking of linking the groups with bank and providing them with loans. The suggestions for the SHGs will be to develop new economic avenues rather than depend on easy way of earning like giving loan at high rate. Respect for each members view even if it is political or other matters should be given much attentions else it will hamper the economic benefits of all the members. The suggestions to the students that there is still scope for further researcher in this field in relation to the state of Arunachal Pradesh with regards to financial inclusion, marketing problems, banking etc. Self Help Groups in Arunachal Pradesh is a mixed bag and Microfinance Vision, 2011 has many success stories amidst its failure of achieving its statistical targets.
REFERENCES 1. Ahuja, R 2001, Research Methods, 2009th edn, Rawat Publications, Jaipur, India. 2. Alan Bryman, EB 2003, Business Research Methods, Oxford University Press, New York. 3. Department of Planning 2008, 'A Development Profile of Arunachal Pradesh', Deparment of Planning, Government of Arunachal Pradesh, Itanagar. 4. Directorate of Economics and Statistics 2006, 'Statistical Atlas of Arunachal Pradesh', Directoate of Economics and Statistics, Government of Arunachal
Pradesh, Itanagar - 791 113. 5. Elwin, V 1957, A Philosophy for NEFA, 1959th edn, Directorate of Research Government of Arunachal Pradesh, Itanagar, Arunachal Pradesh, India. 6. Fernandez, AP 1998, Alternate management system for saving credit of the rural poor, SRS Publications, Bangalore. 7. Jr. Royce A Singleton, BCS 2005, Approaches to Social Research, Oxford University Press, New York. 8. Karmakar, KG 1999, Rural Credit and Self Help Group - Micro finance needs and concepts in India, SAGE, New Delhi. 9. Kothari, CR 1985, Research Methodology, Methods and Techniques, 2004th edn, New Age International Publishers, Jairpur. 10. Kri, S (ed.) 2010, Gazetteer of India Arunachal Pradesh , State Gazetteer of Arunachal Pradesh, Government of Arunachal Pradesh Gazetteers Department,
Itanagar, Arunachal Pradesh, India. 11. Kumar, R 2011, RESEARCH METHODOLOGY, a step-by-step guide for beginners, 3rd edn, SAGE Publication Inc, New Delhi, India. 12. Loseke, DR 2012, Methodological Thinking, Basic Principles of Social Research Design, South Asia Edition edn, SAGE Publication Inc, New Delhi. 13. Mathukutty M Monippally, BSP 2010, ACADEMIC WRITING, A Guide for Management Students and Researchers, Response Books, New Delhi. 14. Oliver, P 2008, Writing Your Thesis, 2nd edn, SAGE Publication India Pvt. Ltd., New Delhi. 15. Rajiv Gandhi University 2005, 'Arunachal Pradesh Hunam Development Report', Department of Planning Government of Arunachal Pradesh, Itanagar. 16. Research, Reference and Training Division 2013, India 2013 A Reference Annual, Ministry of Information and Broadcasting, Government of India, New
Delhi. 17. S.K., CKGAV 2004, Women's own the Selp-Help, Common Wealth Publishers, New Delhi. 18. Support Centre Micro Finance Vision Arunachal Pradesh 2011, 'Umang Arun SHG', A Quarterly bulletin, 2011.

VOLUME NO. 3 (2013), ISSUE NO. 08 (AUGUST) ISSN 2231-5756
INTERNATIONAL JOURNAL OF RESEARCH IN COMMERCE, IT & MANAGEMENT A Monthly Double-Blind Peer Reviewed (Refereed/Juried) Open Access International e-Journal - Included in the International Serial Directories
http://ijrcm.org.in/
140
END NOTES 1. Including sometimes individuals ('social entrepreneurs') or SHG leaders
2. It is not a study of 'impact' for members of SHGs
3. Data compiled from the data provided from Support Centre Microfinance vision 2011, Arunachal Pradesh.

VOLUME NO. 3 (2013), ISSUE NO. 08 (AUGUST) ISSN 2231-5756
INTERNATIONAL JOURNAL OF RESEARCH IN COMMERCE, IT & MANAGEMENT A Monthly Double-Blind Peer Reviewed (Refereed/Juried) Open Access International e-Journal - Included in the International Serial Directories
http://ijrcm.org.in/
141
INDEBTEDNESS AND FARMERS SUICIDES IN RURAL PUNJAB
DR. GURMEET KAUR EX. RESEARCH SCHOLAR IN ECONOMICS
PUNJABI UNIVERSITY PATIALA
ABSTRACT
The present paper attempts to examine the extent and determinants of indebtedness among the different farmer categories in the rural areas of the Punjab state. Indebtedness is really a worrisome phenomenon. There is an urgent need to examine it in the context of weaker sections of the rural society. The high rate of suicides by farmers and agricultural labourers in the village has a link with the rising level of indebtedness. The most tragic aspect of the phenomenon has been the increasing number of marginal and small farmers resorting to take large amount of loans at high rates of interest. However, the problem of indebtedness depends upon the amount, nature and purpose of the loan taken. The commission agents come out to be the largest contributor towards loans in all the farmers’ categories. They provided loans for productive as well as unproductive purposes due to the reason that they are easily approachable at odd hours and their simple way of lending. The major amount of loan has been taken by farmers for productive purposes. The major proportions of non-productive loans are spent on social- religious ceremonies. Loans taken for productive purposes are increasing as we from small farmer category to large farmer category. It has been observed that the amount of productive loans is increasing with the increase of farm size. As the farm size is increased, the proportion of debt on unproductive purposes decreased. Proportion of non farm income and education level of the farmers has inverse relationship with indebtedness.
KEYWORDS Commission agents, f-ratio, Indebtedness, suicides, Wasteful expenditure.
INTRODUCTION griculture has a crucial role in the economic development of India. It is the backbone of Indian economy. Indian agriculture accounts for almost 22.32 per cent of the total GDP. On agriculture about 60 per cent of the country’s population depends (Government of Punjab, 2008-09). At the time of independence Indian agriculture was in a hopeless and deplorable condition. Generally farmers were in heavy debt to the village money-lenders.
Agriculture was carried on subsistence basis. Since the early-sixties India has been using a new technology in agriculture. The new agricultural technology was in the form of package programme which included the use of high yielding varieties of seeds, assured irrigation and chemical fertilizers, insecticides and pesticides. As a consequence of this technology agricultural production increased considerably, this was known as green revolution. In the post green revolution period the annual growth in food grains in 1967-68 was 2.62 per cent a little above the rate of population growth (Economic survey, 1994-95). After green revolution income of the farmers increased but a significant proportion of the gross income of the progressive farmers is ploughed back into agriculture by the use of new inputs such as HYV seeds, fertilizers and irrigation (Shah and Aggrawal, 1970). The expenditure on crop production is increased because of costly inputs. Farmers have to spend huge amounts of cash on purchasing market supplied farm inputs and machinery to carry out their production operations (Shergill, 1998). Farmers need finance for carrying out the cultivation as well as for subsistence. Farmers borrow year after year yet he is not in a position to clear off the loans either because the loans are larger or his agricultural output is not large enough to pay of this debt (Tewari, 1969). Many times farmers fail to repay the full amount or a part of loans and major chunk remains outstanding. Apart from these outstanding loans farmers borrow money for next crop operation, but farmers are not able to repay their loans mainly due to widening the gap between the prices of farm inputs and farm produce. Excessive expenditure on domestic consumption and social ceremonies and frequent crop failures are the other reasons of non-repayment of crop loans. Hence farmers are becoming indebted .Now the condition of most of the farmers is worse than that of the condition of pre- green revolution period (Bhalla and Singh, 2009). The spate of reports on farmers’ suicides in Rural Punjab during 1995-98 as also to a lesser extent during 2001-04, has received attention as these occurred in a state with high levels of per capita income and low levels of rural poverty. However, the entire discourse on suicides tended to focus on the levels of rural indebtedness and the availability or otherwise of institutional credit. Simplistic analysis tended to link these three aspects in a causal relationship and assign the direct blame for farmers’ suicides to the lack of institutional credit. The current spate of farmer’s suicides, highlighted by the media in rural Punjab, is certainly a disturbing phenomenon. What makes this trend all the more worrisome is the reported common cause of such suicides: the burden of debt and further three main causes of indebtedness are failure of cotton crop, high cost of pesticides, overuse of pesticides and use of fake pesticides supplied by dealers, and over mechanization of agriculture . Punjab peasantry especially small farmers could not afford farm investment from their own savings to transform traditional agriculture into scientific farming. The loans obtained for investment in machinery, irrigation structure, fertilizers and agrochemicals were partly spent for their bare subsistence and for fulfillment of their social obligations. Consequently, they got fresh loans from non- institutional agencies at higher rate of interest to pay back the old dues. As a result, the burden of their debt continued to accumulate. Moreover, the commercialization of agriculture has created cultural links of rural population especially big farmers with cities resulting in the race of maintaining good standard of living. In this race farmers have been caught in debt trap ( Singh and Toor, 2005) The high rate of suicides by farmers and agricultural labourers in the village has a link with the rising level of indebtedness. The most tragic aspect of the phenomenon has been the increasing number of marginal and small farmers resorting to take large amount of loans at high rates of interest (Iyer and Singh, 2000).The most important reason for the indebtedness of the Punjab farmer is the use of excessive mechanization in agriculture. The use of various farm inputs such as chemical fertilizers, seeds, tube wells, tractors, combines, hired labour and rent for leased land, etc., has led to an overall increase in the cash expenditure of farmers. Yet the per capita income of farmers has not grown at the same rate as input prices and sheer cost of agricultural production. As a result, farmers have little surplus cash at their disposal and are forced to huge amounts. This has led to a spurt in the growth of agricultural credit (Human Development Report, 2004). The small size of land holding, poor resource base and varying monsoon behavior are exposing majority of the farmers particularly, the small and marginal, leading some of them finally to commit suicide because of mounting debts (Kumari, 2005). This paper attempts to examine the indebtedness among the suicide victims’ farmers and alternative viable policy options with what we hope will be a fresh perspective. The paper is divided into four sections. Section I comprised of introduction which we have already discussed, section II deals with the methodology of the study, section III and section IV will highlight the findings of the study and suggestions respectively.
RESEARCH METHODOLOGY The present study is based on primary as well as secondary data. The survey has been conducted in Sangrur, Mansa, Faridkot and Bathinda districts of Punjab state during the year 2007 - 08. Three villages have been selected from each block of the selected districts based on the list of suicide victim farmers in the villages as made available by Bharitya Kissan Union. Out of this list, 42 villages where number of suicide victims was comparatively high have been selected for the survey - 15 villages from Sangrur district, 12 villages from Mansa district, 9 villages from district Bathinda and 6 from Faridkot district. The sample comprising of total 455 affected families was taken for investigation. The next step is to determine the proportion of farmers to be chosen from each village. On the basis of proportions 343 small farmers, 102 medium farmers and 10 large farmers from all the 42 villages have been selected. We have divided the sampled farmers who have committed suicides into three categories on the basis of their farm size, small farmers are those who own land upto 5 acres. Medium farmers are those
A

VOLUME NO. 3 (2013), ISSUE NO. 08 (AUGUST) ISSN 2231-5756
INTERNATIONAL JOURNAL OF RESEARCH IN COMMERCE, IT & MANAGEMENT A Monthly Double-Blind Peer Reviewed (Refereed/Juried) Open Access International e-Journal - Included in the International Serial Directories
http://ijrcm.org.in/
142
farmers who own land between 5 to 10 acres and large farmers are those farmers who own land above 10 acres. A detailed questionnaire was prepared for collecting information about the farmers. Standard statistical tools like mean values and proportions have been used while carrying out tabular analysis. Techniques like correlation coefficients and multiple regression analysis have also been used to support the findings of the study.
FINDINGS OF THE STUDY While studying the indebtedness problem of farmers of the Punjab state, Darling (1925) wrote,” the bulk of the cultivators of the Punjab are born in debt, live in debt and die in debt.” Though this was written more than eight decades back, the problem of indebtedness not only remains true today but it has aggravated in the recent years. Even after more than six decades after independence and more than four decades after nationalization of banks the farmers of this agriculturally developed state are still in the clutches of commission agents. Historically, the commission agents or arhtias have been part and parcel of the agricultural cycle in Punjab. These commission agents operate as an informal credit system to the farmers for short term borrowing. SOURCES OF LOANS In this section we will talk about those farmers who have committed suicide but refer as them as farmers in the text. The role of various sources of debt in the area under study has been analysed and the results are presented in table 1. The table shows that on an average farmer household (where farmer has committed suicide) in the Punjab has taken Rs. 275611 of debt from non- institutional sources while the debt was Rs. 166716 from institutional sources. The overall debt of an average farmer in the state worked out to be Rs. 442327. However, there were some variations observed in different categories of farmers. Small farmers were under a debt of Rs. 786303, out of which Rs. 577423 were taken from non-institutional sources and the remaining Rs. 208880 from institutional sources. While out of the total loan medium farmers have taken Rs. 234373 from non- institutional sources and Rs. 295572 from institutional sources. Whereas the corresponding figures for large farmers are Rs. 215000 and Rs.431000 respectively. The table reveals that the small farmers take the major amount of loans from non- institutional sources. The medium and large farmers take the major amount of loans from institutional sources. Among the institutional sources, commercial banks and regional rural banks are the major sources of loans and in the non-institutional sources the commission agents/moneylenders are the major sources for all the categories. The share of commission agents /money lenders was the highest because they provided loans for consumption and other non- productive credit requirements of the farmers besides meeting their production requirements. Here, the facts are established that farmers are still ignorant about the formalities and procedures to obtain loan from institutional sources. Rather they find it easy to get loans from private institutions, mainly from moneylenders/commission agents.
TABLE 1: AMOUNT OF LOAN TAKEN BY SAMPLED FARMERS (WHO HAVE COMMITTED SUICIDE) IN PUNJAB, DURING 1988-2007 (Rupees Per household)
Sources of Loan Small Medium Large Total
A. Institutional sources
Commercial banks 62797 96136 153000 56540
Cooperative institutions 78621 67352 112000 48802
Regional Rural Banks 59173 104976 84000 49492
Land Development Banks 8289 27108 82000 11882
Total Institutional Debt 208880 295572 431000 166716
B. Non-Institutional Sources
Commission agents/Money Lenders 428362 163998 168000 206499
Friends/Relatives 43296 23531 15000 19974
Cloth Merchants and Grocers 36491 26743 0 23619
Landlords 60873 3817 32000 18381
Traders 8401 16284 0 7138
Total Non-Institutional Debt 577423 234373 215000 275611
Total Debt 786303 529945 646000 442327
Source: Field survey, 2007-2008 The relative share of loans taken by the different categories of the farmers households are given in table 2. Maximum amount of loans was taken from non-institutional sources and remaining from institutional sources and the pattern was the same across the three farmers’ categories. Cloth merchants and grocers rank second, friends/relatives and landlords rank third and followed by housing finance corporation and traders. Among institutional sources commercial banks have provided maximum amount of loans i.e. 12.78 percent, large farmers take maximum loans from this source followed by medium and small farmers i.e. 18.14 and 7.99 percent respectively. Medium farmers take maximum loans from regional rural banks i.e. 19.81 percent followed by large and small farmers. Small farmers take maximum loans from cooperative institutions among institutional sources but they borrow mainly from non institutional sources more than two-thirds i.e. 73.44 percent. Among the non-institutional sources, the village moneylenders were the most important sources. The commission agents/money lenders provided 46.68 percent of the total loans to the farmers Commission agents/money lenders provide maximum out of non-institutional sources i.e. 54.58 percent followed by medium and large farmers i.e. 30.95 and 26.01 percent respectively. In case of institutional sources, magnitude of borrowing is increasing as the farm size is increasing means large farmers borrow the most from institutional sources as compared to other categories and reverse is seen in case of non-institutional sources. The commission agents/ money lenders provided loans for productive as well as unproductive purposes due to the reason that they are easily approachable at odd hours and their simple way of lending.
TABLE 2: PERCENTAGE SHARE OF AMOUNT OF LOAN TAKEN BY SAMPLED FARMERS (WHO HAVE COMMITTED SUICIDE) IN PUNJAB, DURING 1988-2007
Source: Field survey, 2007-2008
Sources of Loan Small Medium Large Total
A. Institutional sources
Commercial banks 7.99 18.14 23.68 12.78
Cooperative institutions 10.00 12.71 17.34 11.03
Regional Rural Banks 7.53 19.81 13.00 11.19
Land Development Banks 1.05 5.12 12.69 2.69
Total Institutional Debt 26.56 55.77 66.72 37.69
B. Non-Institutional Sources
Commission agents/Money Lenders 54.48 30.95 26.01 46.68
Friends/Relatives 5.51 4.44 2.32 4.52
Cloth Merchants and Grocers 4.64 5.05 0.00 5.34
Landlords 7.74 0.72 4.95 4.16
Traders 1.07 3.07 0.00 1.61
Total Non-Institutional Debt 73.44 44.23 33.28 62.31
Total Debt 100.00 100.00 100.00 100.00

VOLUME NO. 3 (2013), ISSUE NO. 08 (AUGUST) ISSN 2231-5756
INTERNATIONAL JOURNAL OF RESEARCH IN COMMERCE, IT & MANAGEMENT A Monthly Double-Blind Peer Reviewed (Refereed/Juried) Open Access International e-Journal - Included in the International Serial Directories
http://ijrcm.org.in/
143
OUTSTANDING DEBT Outstanding Loan according to different sources is shown in table 3. The table reveals that the total outstanding debt (institutional and non-institutional) is Rs. 330267. In case of institutional sources the total outstanding debt was Rs. 135092, the respondents owed Rs. 50633 to the commercial banks followed by cooperative institution (Rs. 42174), regional rural banks (Rs. 33156) and land development banks ( Rs. 9129). In case of non-instructional sources the total outstanding debt is Rs. 195175, the respondent owed Rs. 144549 to the commission agents/ money lenders which is the maximum outstanding debt, followed by cloth merchants and grocers (Rs. 17668), landlords (Rs. 15057), friends/relatives (Rs. 14864) and housing finance corporation and traders (Rs. 3037). There are considerable variations in the farmers’ categories; the small farmers have maximum outstanding loans of Rs.666138, the medium and large farmers’ categories have outstanding loans of Rs. 322719 and Rs. 345900respectively.
TABLE 3: DISTRIBUTION OF SELECTED HOUSEHOLDS OF SUICIDE VICTIMS (FARMERS) ACCORDING TO OUTSTANDING LOAN IN PUNJAB, DURING 1988-2007
(RUPEES PER HOUSEHOLD)
Sources of Loan Small Medium Large Total
A. Institutional sources
Commercial banks 62498 79500 106400 50633
Cooperative institutions 77880 49218 90000 42174
Regional Rural Banks 41153 79509 58000 33156
Land Development Banks 8245 18633 61500 9129
Total Institutional Debt 189776 226860 315900 135092
B. Non-Institutional Sources
Commission agents/Money Lenders 360359 53359 28000 144549
Friends/Relatives 33260 12972 2000 14864
Cloth Merchants and Grocers 29946 15188 0 17668
Landlords 49797 2264 0 15057
Traders 3000 12076 0 3037
Total Non-Institutional Debt 476362 95859 30000 195175
Total Debt 666138 322719 345900 330267
Source: Field survey, 2007-2008 The proportional share of outstanding loan according to different sources is shown in table 4. It is observed that the total non-institutional outstanding debt of non-institutional sources is 59.10 percent, the small farmers’ outstanding debt is 71.51 percent which is the maximum outstanding debt, followed by medium (29.70 percent) and large farmers (8.68 percent). In case of institutional sources, the total outstanding debt is 40.90 percent, the large farmers’ debt is 91.33 percent which is the maximum outstanding debt followed by small (28.49) and medium farmers (70.30 percent). The maximum outstanding debt is of commercial banks i.e. 15.33 percent among the institutional sources and amongst the non institutional sources, maximum outstanding debt is of commission agents i.e. 43.77 percent. TABLE 4: PERCENTAGE DISTRIBUTION OF SELECTED HOUSEHOLDS OF SUICIDE VICTIMS (FARMERS) ACCORDING TO OUTSTANDING LOAN IN PUNJAB, DURING
1988-2007 (RUPEES PER HOUSEHOLD)
Sources of Loan Small Medium Large Total
A. Institutional sources
Commercial banks 9.38 24.63 30.76 15.33
Cooperative institutions 11.69 15.25 26.02 12.77
Regional Rural Banks 6.18 24.64 16.77 10.04
Land Development Banks 1.24 5.77 17.78 2.76
Total Institutional Debt 28.49 70.30 91.33 40.90
B. Non-Institutional Sources
Commission agents/Money Lenders 54.10 16.53 8.09 43.77
Friends/Relatives 4.99 4.02 0.58 4.50
Cloth Merchants and Grocers 4.50 4.71 0.00 5.35
Landlords 7.48 0.70 0.00 4.56
Traders 0.45 3.74 0.00 0.92
Total Non-Institutional Debt 71.51 29.70 8.67 59.10
Total Debt 100.00 100.00 100.00 100.00
Source: Field survey, 2007-2008 PURPOSES OF LOANS The purpose for which the loans are taken is an important indicator of its potential for repayment. The various purposes for which different farmer categories were taking loans are presented in table 5. An average farmer household in the state incurred a debt of Rs. 301945 and Rs. 171302 for productive and unproductive purposes respectively. The table elucidates that the major amount of loans has been taken by an average farmer for productive purposes in all the categories of farmers. The large farmer category spent the major amount (Rs. 567000) of loans for productive purposes followed by medium and small farmers. The highest debt was spent on unproductive purposes like socio-religious ceremonies and dwelling house, the same trend has been seen in different categories of farmers. It has been observed that the amount of productive loans is increasing with the increase of farm size. As the farm size is increased, the proportion of debt on unproductive purposes decreased. The NSSO data too confirms that in Punjab, of every Rs 1,000 of outstanding loans taken by farmers, Rs 264 was for capital expenditure in farm business, Rs 360 for current expenditure in farm business, Rs 44 for non-farm business, Rs 85 for consumption, Rs 102 for marriages and ceremonies and Rs 126 for medical and other expenditure. For the country as a whole, the NSSO concluded that more than 50 percent of indebted farmer households had taken loans for the purposes of capital or current expenditure (NSSO, 2005).

VOLUME NO. 3 (2013), ISSUE NO. 08 (AUGUST) ISSN 2231-5756
INTERNATIONAL JOURNAL OF RESEARCH IN COMMERCE, IT & MANAGEMENT A Monthly Double-Blind Peer Reviewed (Refereed/Juried) Open Access International e-Journal - Included in the International Serial Directories
http://ijrcm.org.in/
144
TABLE 5: PURPOSE-WISE LOAN TAKEN BY SAMPLED FARMERS WHO HAVE COMMITTED SUICIDE IN PUNJAB, DURING 1988-2007 (RUPEES PER HOUSEHOLD)
Source: Field survey, 2007-2008 The proportional share of loans for the different purposes is presented in table 6. It is clear from the table that 63.80 percent of total loans are spent on productive purposes by the farmers households, out of which 23.33 percent is spent for purchase of inputs, 18.10 percent is spent for investment regarding land and 16.45 percent purchase of machinery. Slightly less than one third i.e., 36.20 percent of the total loan is spent on unproductive purposes, out of which the highest proportion of the order of 24.21 percent is spent on marriages followed by dwelling house, expenditure on health and education. Almost the same trend is observed for the individual farmers’ categories. For purchase of inputs, making any other investment regarding land and purchase of machinery, large farmers borrow the maximum i.e.33.07, 20.35 percent and 19.93 percent respectively and small farmers take loans the least for the same i.e. 21.26, 15.35 and 16.15 respectively. For purchase of cattle small farmers borrow the most as compared to the other categories. Loans taken for unproductive purposes is maximum in small farmers category i.e. 40.27 percent followed by medium and large farmers. Maximum loans are taken for socio-religious ceremonies i.e. 24.21 percent but small farmers category borrow the most i.e. 26.64 for the same. For health and education large farmers do not take any loans but medium and small farmers borrow, medium farmers take 0.88 percent and 0.51 percent respectively and small farmers take 0.73 percent and 0.23 percent respectively. Loans taken for productive purposes are increasing as we from small farmer category to large farmer category and reverse is the case in loans taken for productive purpose.
TABLE 6: PERCENTAGE SHARE OF PURPOSE-WISE LOAN TAKEN BY SAMPLED FARMERS WHO HAVE COMMITTED SUICIDE IN PUNJAB, DURING 1988-2007
Purpose of Loan Small Medium Large Total
Productive
Purchase of Inputs 21.26 28.40 33.07 23.33
Purchase of Machinery 15.35 18.68 19.93 16.45
Purchase of Cattle 6.98 5.30 3.88 5.93
Any other investment regarding land 16.15 19.91 20.35 18.10
Sub Total 59.73 72.29 77.23 63.80
Unproductive
Dwelling House 12.66 8.31 12.01 11.10
Socio-Religious Ceremonies 26.64 18.01 10.76 24.21
Education 0.23 0.51 0.00 0.28
Health 0.73 0.88 0.00 0.61
Sub Total 40.27 27.71 22.77 36.20
Total 100.00 100.00 100.00 100.00
Source: Field survey, 2007-2008 REASONS OF NON-REPAYMENT OF LOANS Although some of the farmers or their families have repaid the loans mainly by selling their lands yet there are in large number who are unable to repay due to certain reasons. Distribution of respondent households according to the reasons of non-repayment of loans is shown in table 7. Data indicates that majority of the suicide victims i.e., 28.90 per cent were unable to repay their debt due to natural calamities (flood/draught/illness/pest attack) followed by due to poor financial position (24.24 per cent), while 21.21 per cent of the victims due to low income, due to reduction in yield (13.05 per cent ), excess expenditure on social events (11.44 per cent ), drug addiction (0.93 per cent ) and more cost of production (0.23 per cent) farmers were unable to repay their loans. The table further reveals that natural calamities were the main reason for non- repayment of loan for all farmers. The small farmers had not repaid loan due to poor financial position (28.15 per cent), followed by low income (23.82 per cent) and natural calamities (23.46 per cent). Equal percentage of farmers (11.40 per cent) of that category had not repaid loan because of reduction in yield, excess expenditure on social events. A few percent of farmers of that category (1.08 per cent) had not repaid loan due to drug addiction, 20.00 per cent of the medium farmers had not repaid loan due to reduction in yield followed by 14.73 per cent, 13.68 per cent, 12.65 and 1.05 per cent due to low income, excess expenditure on social events, poor financial position and cost of production is more respectively. In case of large farmers 22.23 per cent had not repaid loan due to excess expenditure on social events, none of the farmers of that category had repaid loan due to reduction in yield, drug addiction, poor financial position, low income and cost of production is more.
Purpose of Loan Small Medium Large Total
Productive
Purchase of Inputs 197712 136122 187500 110417
Purchase of Machinery 142725 89527 113000 77846
Purchase of Cattle 64933 25400 22000 28044
Any other investment regarding land 150158 95452 115400 85637
Sub Total 555528 346501 437900 301945
Unproductive
Dwelling House 117775 39850 68100 52535
Socio-Religious Ceremonies 247763 86320 61000 114550
Education 2182 2450 0 1313
Health 6779 4200 0 2904
Sub Total 374499 132820 129100 171302
Total 930027 479321 567000 473247

VOLUME NO. 3 (2013), ISSUE NO. 08 (AUGUST) ISSN 2231-5756
INTERNATIONAL JOURNAL OF RESEARCH IN COMMERCE, IT & MANAGEMENT A Monthly Double-Blind Peer Reviewed (Refereed/Juried) Open Access International e-Journal - Included in the International Serial Directories
http://ijrcm.org.in/
145
TABLE 7: DISTRIBUTION OF THE SAMPLED FARMERS WHO COMMITTED SUICIDES ACCORDING TO THE REASONS OF NON-REPAYMENT OF LOAN IN PUNJAB, DURING 1988-2007 (MULTIPLE RESPONSES)
Reasons of Non-repayment of Loan Small Medium Large Total
Natural calamities (Flood/draught/illness/pest attack)
81 (24.92)
36 (37.89)
7 (77.78)
124 (28.90)
Reduction in yield 37 (11.38)
19 (20.00)
0 (0.00)
56 (13.05)
Excess expenditure on social events 36 (11.08)
13 (13.68)
2 (22.22)
51 (11.89)
Drug addiction 4 (1.23)
0 (0.00)
0 (0.00)
4 (0.93)
Poor financial position 90 (27.69)
12 (12.63)
0 (0.00)
102 (23.78)
Low income 77 (23.69)
14 (14.74)
0 (0.00)
91 (21.21)
Cost of production is more 0 (0.00)
1 (1.05)
0 (0.00)
1 (0.23)
Total 325 (100.00)
95 (100.00)
9 (100.00)
429 (100.00)
Source: Field survey, 2007-08 Note: Figures in parentheses indicate percentages DETERMINANTS OF INDEBTEDNESS Multiple regression analysis is used to identify the factors affecting indebtedness among respondents which determine and influence indebtedness. The regression model used is:- Y= ax1b1, x2 b2, ----------xnbn Where Y is the dependent variable. X1-X2 are independent variables. The function is linear in logarithmic form. Due to the fact that indebtedness is the main cause of suicide, factors affecting indebtedness are also the factor determinants suicide. The specification of the regression model is given below:- I = Indebtedness I = f ( x1, x2, x3, x4, x5, x6, x7, x8 ) X1 = age X2 = education X3 = farm size X4 = proportion of non- institutional loans o/s X5 = proportion of unproductive loans X6 = non farm income X7 = dependency ratio X8 = proportion of wasteful expenditure The amount of debt at a given point of time is influenced by several economic and non-economic factors. The various economic factors, important as they are in the policy framework, are subjected to analysis. It is hypothesized that indebtedness depends upon farm size, family size, ratio of credit from non-institutional sources to that from institutional sources, expenditure on unproductive purposes and education level. The estimated co-efficient are given in table 8. A look into the coefficients of explanatory variables reveals that the coefficients for regression for age and dependency ratio is positive but statistically non- significant. Regression coefficients for education and proportion of non farm income are negative and statistically significant at 5 per cent and 10 per cent level. If one percent of any one of these increases, indebtedness decreases. The regression coefficients for farm size, proportion of non- institutional outstanding loans are positive and statistically significant at 10 per cent and 5 per cent level respectively. Proportion of unproductive outstanding loans and proportion of wasteful expenditure is positive and statistically significant at 1 per cent and 5 per cent respectively. If anyone of these increases, indebtedness increases. The explanatory variables explain 81 percent variations in indebtedness.
TABLE 8: FACTORS AFFECTING INDEBTEDNESS AMONG SAMPLED FARMERS (WHO COMMITTED SUICIDES) IN PUNJAB, DURING 1988-2007: REGRESSION
ANALYSIS APPROACH
Factors Regression t-value
Coefficient
Constant 37891.1452 3.49
Age 3162.1546 1.37
Education -12987.6529 2.41**
Farm Size 35948.2288 3.67***
Proportion of Non-Institutional Loan O/S 4705.6731 2.37**
Proportion of Unproductive Loan O/S 5554.2371 1.79*
Proportion of Non-Farm Income -7728.6146 4.21***
Dependency Ratio 4182.8205 1.53
Proportion of Wasteful Expenditure 3764.3852 2.12**
R-square 0.8145
F-ratio 244.74***
Source: Field survey, 2007-2008 Relationship between indebtedness and others socio-economic factors is shown in table 9. The table reveals that correlation coefficient i.e. r- value for age is positive in all categories, r- value for education is negative but significant at 5 per cent level for medium and large farmers means 1 per cent of increase in education level will decrease indebtedness by 0.20 per cent for medium farmers and 0.71 per cent for large farmers. Proportion of non-institutional outstanding loan is having r- value positive and significant at 5 per cent level for all the categories, r- value of proportion of unproductive outstanding loan is positive; it is significant at 1 per cent for small farmers, insignificant for medium and large farmers. Proportion of non farm income is having r- value negative for all categories, significant at 10 per cent and 5 per cent level for small farmers respectively but insignificant for medium and large farmers. It means as the non farm income increases indebtedness decreases. Dependency ratio is having r- value positive, significant at 5 per cent and 10 per cent level for small farmers. Proportion of wasteful expenditure is having r-value positive and significant at 5 per cent level for medium and large farmers.

VOLUME NO. 3 (2013), ISSUE NO. 08 (AUGUST) ISSN 2231-5756
INTERNATIONAL JOURNAL OF RESEARCH IN COMMERCE, IT & MANAGEMENT A Monthly Double-Blind Peer Reviewed (Refereed/Juried) Open Access International e-Journal - Included in the International Serial Directories
http://ijrcm.org.in/
146
TABLE 9: RELATIONSHIP BETWEEN INDEBTEDNESS AND OTHER SOCIO-ECONOMIC FACTORS WHICH AFFECTED SAMPLED FARMERS (WHO COMMITTED SUICIDE) IN PUNJAB, DURING 1988-2007
Factors r-value with indebtedness
Small Medium Large Total
Age 0.148 0.132 0.426 0.152
Education -0.147 -.206** -.713** -217**
Farm Size .441***
Proportion of Non-Institutional Loan O/S .242** .211** .649** .231**
Proportion of Unproductive Loan O/S .362*** 0.117 0.321 .171*
Proportion of Non-Farm Income -.234** -0.129 -0.242 -.367***
Dependency Ratio .173* 0.097 0.119 0.123
Proportion of Wasteful Expenditure 0.106 .229** .641** .219**
Source: Field survey, 2007-2008 ***: Significant at 1% level ** : Significant at 5% level * : Significant at 10% level
CONCLUSION AND SUGGESTIONS Punjab farmers are in the clutches of severe indebtedness. To overcome the problem of indebtedness, effective measures should be taken. The government should exercise a strong check on the activities of non-institutional credit agencies and provide institutional credit facilities to the farming community at low rates of interest with easy repayment facilities. although the non-institutional sources charge exorbitant rate of interest yet farmers borrow from them due to simple procedures to be followed. So in the institutional sources with simplification of procedures of borrowing should be encouraged. In case of special cases like at the time of natural calamities or crop failure, the time for the repayment of loans should be extended so that the farmers can pay the money back in small installments and they can be saved from being declared defaulter. Adequate loans should be made available to the farmers whenever there is a need without consuming much of the time so that they can use it for the right purpose and do not have to depend on the commission agents. In future, the ‘arthiya’ and other moneylenders should be registered and licensed. Only such registered and license holder arthiya should be authorized to do the business of money-lending. The co-operative sector should be developed/strengthened in the state. The sale of agricultural chemicals, fertilizers and quality seeds should be promoted through village level primary agricultural co-operative societies. It will help in checking diversion of loans as well as use of spurious chemicals purchased from the commission agents. The development of non-farm sector should be given top priority in the state to provide the rural people with diverse employment opportunities at the village level. Since the income levels of the small and marginal farmers are insufficient to even meet their basic necessities of life the government must take strong initiative for creating sufficient employment opportunities for farmers and income level can be increased by increasing or developing subsidiary occupations like dairying, poultry and fisheries etc. There is an urgent need to educate the farmers through social-religious system to reduce their consumption expenditure on marriages and other social religious ceremonies and non-essential items like liquor, tobacco etc. To reduce the gap between their consumption expenditure and income, this would help in reducing the magnitude of indebtedness.
REFERENCES BOOKS 1. Darling, M.L. (1925): “The Punjab Peasant in Prosperity and Debt”, South Asia Book, Columbia, MQ, U.S.A, Reprinted 1978, pp. 246. 2. Iyer, Dr.K. Gopal, Dr. Mehar Singh Manick (2000), “Indebtedness Impoverishment and Suicides in Rural Punjab”, India Publishers Distributors Delhi. 3. Shergill, H.S. (1998), “Rural credit and indebtedness in Punjab”, PP. IV, 1998. JOURNALS 4. Bhalla, G. S. and Gurmail Singh (2009), “Economic liberalization and India Agriculture: a state wise analysis”, Economic and political weekly, December 26,
2009, Vol. xl1, No 52, PP- 56-63. 5. Government of India, Economic survey, Years 1994-95, PP 122. 6. Government of India, NSSO (2005), “Indebtedness of farmer households”, NSSO 59th round, January-December 2003, report no 498(59/33/1). 7. Government of Punjab, Human Development Report (2004) PP. 189-193. 8. Shah, S.L. and R.C. Aggrawal, (1970), “Impact of new technology on the level of income, pattern of income, distribution and savings of farmers in central
Uttar Pradesh”, Indian Journal Agricultural Economics, vol. 25(3), July-September, 1970, PP. 155. 9. Singh, Sukhpal (2005), “Changing structure and organization of agriculture and small farmers in India”, Social Change, December 2005: Vol. 35.No 4. 10. Singh, Sukhpal and M.S. Toor (2005), “Agrarian Crisis with Special Reference to Indebtedness Among Punjab Farmers”, Indian Journal of Agriculture
Economics, Vol. 60, No. 3, July- September, 2005. 11. Tewari, S.C. (1969), “Agriculture Indebtedness in hilly farmers of UP”, Indian Journal of Economics, 39(195), April, 1969, PP. 447-452. DISSERTATION 12. Kumar, R.V. (1993), “Debt Position of Farmers of District Ludhiana- A Case Study”, An unpublished Ph. D. Dissertation of Punjab Agricultural University,
Ludhiana.

VOLUME NO. 3 (2013), ISSUE NO. 08 (AUGUST) ISSN 2231-5756
INTERNATIONAL JOURNAL OF RESEARCH IN COMMERCE, IT & MANAGEMENT A Monthly Double-Blind Peer Reviewed (Refereed/Juried) Open Access International e-Journal - Included in the International Serial Directories
http://ijrcm.org.in/
147
PRESERVATION AND MAINTENANCE OF THE COLLECTION OF SRI VENKATESWARA ORIENTAL RESEARCH INSTITUTE LIBRARY, TIRUPATI: A USER SURVEY
B. DEENADHAYALU RESEARCH SCHOLAR
DEPARTMENT OF LIBRARY & INFORMATION SCIENCE S. V. UNIVERSITY
TIRUPATI
A. SIVAKESAVULLU RESEARCH SCHOLAR
DEPARTMENT OF LIBRARY & INFORMATION SCIENCE S. V. UNIVERSITY
TIRUPATI
M.BHANUMURTHY STUDENT
DEPARTMENT OF LIBRARY & INFORMATION SCIENCE S. V. UNIVERSITY
TIRUPATI
ABSTRACT Sri Venkateswara Oriental Research Institute (SVORI) was started in July 1939 by the management of Tirumala Tirupati Devasthanams (T.T.D) with a view that it should be a first-rate research and training centre with appropriate divisions for the study of Sanskrit and other languages of the Hindu religion and philosophy and of the Hindu culture generally. The users of the library consist of M.Phil and Ph.D. scholars and teaching staff members and P.G students of S.V. University. The present study is restricted to make the survey of users of M.Phil and Ph.D scholars and students only. Further, the paper suggests the affective measures for improving the techniques of preservation and organization of manuscripts in SVORI.
KEYWORDS Manuscripts, Oriental Journals, SVORI, Digitization.
1. INTRODUCTION ndhra Pradesh, the land of temples and shrines, has the distinction of exquisite and priceless manuscript heritage of textual and illustrated diction. In Andhra Pradesh, there was a traditional practice of writing the scripts on Palm Leaves, which are popularly known as ‘Thalapatra Grandhas’ in olden days. Many of them were destroyed during the period of British Rule in India. However, our ancestors were able to protect some important Thalapatra
Grandhas, which have high cultural and social values. The government of Andhra Pradesh and Tirumala Tirupati Devasthanams are jointly instrumental in collecting and preserving these rare Thalapatra Grandhas in different Manuscript Libraries in Andhra Pradesh. Books are the life-blood of great thinkers of the past and present. They represent the life-long labors and researches under taken by philosophers, sages, scientists and litterateurs. It is a very pleasant, though difficult, task of a librarian to preserve the treasure of knowledge which is found in the form of books and documents. It is rather his religious duty to conserve this knowledge in an appropriate manner. Books like human beings have got a body and soul. Its body is represented by material of which the book is made. Paper, ink and binding are the physical construction of the book. The soul of the book consists of the actual thought content to be found in the written pages of the books. The soul can be freed from the mortal bandage only their message is conveyed to every living being. 1.1 MANUSCRIPTS The term ‘manuscript’ derived from the Latin word ‘Manuscripptus’ is a combination of two words that is ‘Manu means by hand and ‘Scripts means to write. Etymologically manuscript means writing by hand. 1.2. In the context of library science, a manuscript is defined as “any hand written item in the collections of a Library or an archive; For example, a library’s collection of the letters or a diary that some historical personage wrote”.
2. HISTORY OF SRI VENKATESWARA ORIENTAL RESEARCH INSTITUTE, TIRUPATI The Oriental Research Institute was established by Tirumala Tirupati Devastanams (T.T.D) in the year 1939 and handed over it to Sri Venkateswara University in 1956 to achieve multifaceted development on modern lines in Indological research and to propagate correct ideas in Indian Culture and Heritage. Thus the Oriental Research Institute has become a nucleus land indispensable authority in the University campus with its richest collection of 50,000 palm leaf and paper manuscripts. Fully qualified research staff has been working in the institute, on editing of palm leaf and paper manuscripts. Further, they also guide M.Phil and Ph.D scholars in the fields of Sanskrit, Telugu, Philosophy and History. The official organ of the institute; Sri Venkateswara University Oriental Journal brought out 16 volumes and a new series of 46 volumes so far in its old series. Right from its inception several learned Scholars of International repute have worked in the Oriental research Institute. To name a few Sri Manavalli Ramakrishna Kavi, popularly known as Sri M.R.Kavi a doyen of Indological research and Manuscriptologist who prepared Bhartakosa and brought out a critical edition of Bharat Bharata’s Natya Sastra with Abhivanana Gupta’s commentary “Abinava Bharti’ for the first time. Likewise Sri Veturi Prabhakara Sastri a great Scholar in the field of Telugu literature and research Sri Rallapalli Anatha Krishna Sarma a unique scholar in the field of classical Music and Literature who edited Annamacharya Sankirthanas. In the field of Tamil Sri T.P. Palaniappa pillai and in Sanskrit Prof D.T. Tatacharya and in Agama Sastra, Rompicharla Parthasarathi Bhattacharya etc. The Institute has so far established 40 books both in critical Editions and Monographs. 2.1. AIMS AND OBJECTIVES OF SRI VENKATESWARA ORIENTAL RESEARCH INSTITUTE, TIRUPATI Sri Venkateswara Oriental Research Institute, Tirupati has the following Aims and Objectives: 1. To prepare well-documented and authenticated reference works like historical dictionaries, encyclopedic indexes, anthologies and chrestomathies; 2. To prepare critical editions with notes to promote higher textual criticism;
A

VOLUME NO. 3 (2013), ISSUE NO. 08 (AUGUST) ISSN 2231-5756
INTERNATIONAL JOURNAL OF RESEARCH IN COMMERCE, IT & MANAGEMENT A Monthly Double-Blind Peer Reviewed (Refereed/Juried) Open Access International e-Journal - Included in the International Serial Directories
http://ijrcm.org.in/
148
3. To publish Oriental journal with original research articles on topics of Indology relevant to modern society translations, monographs, and rare manuscripts. 4. To promote inter- disciplinary research leading to M.Phil and Ph.D degrees; 5. To maintain an up-to date library with important research journals and printed books mostly in Sanskrit, English and Telugu with all the modern facilities
like a reading room, microfilm reader, Xerox copier, etc.; 6. To maintain manuscript library with lists and descriptive catalogues; 7. To prepare descriptive catalogues for the manuscripts collected in the ORI Library; 8. To conduct diploma courses relevant to the Indological Studies; and organize Seminars and Summer Schools to spread correct ideas of Indian Culture.
TABLE-1: COLLECTION DETAILS IN SVORI LIBRARY
Sl.No Type of material Total Percentage
1 Printed books 37,650 65.36
2 Ideological(oriental)journals 5000 8.68
3 Manuscripts 14,954 25.96
4 Total 57, 604 100
[Source: Official Records of Sri Venkateswara Oriental Research Institute, Tirupati, 2012] It is evident from the table that among the library material printed books (65.36%) are more followed by back volumes of Ideological oriental journals (8.68%) and manuscripts (25.96%) 2.2. PROCESSING The SVORI Library has been following its own scheme of Classification prepared by Sadhu Subramanyam Sastri in 1940 for printed books. It is not following the library classification scheme for journal and manuscripts. 2.3. CARE AND MAINTENANCE OF SVORI LIBRARY MATERIAL The following preservation techniques are being used: 1. Chemical treatment (Naphthalene balls, lemon gross oil and citronella oil) is used protecting manuscripts. 2. Dusting, cleaning regular intervals is used for protecting the printed books, journals and manuscripts. 3. Pest control is used for to protect the printed books, journals and manuscripts. 4. Air conditioners are used for to protect from the manuscripts. 2.4. SECURITY MANAGEMENT 1. SVORI library building is constructed with purpose of library and it is adequately roofed and it is adequate space outside for the library possible expansion
and there is no security personal at the library exit. 2. The library building consists of fire extinguisher and Air conditioner for disaster management. 3. The SVORI library is not insured the library material.
3. OBJECTIVES OF THE PAPER 1. To know the frequency of visit to SVORI library by the users. 2. To know the satisfaction regarding arrangement of library material. 3. To know the satisfaction of the physical facilities in the SVORI Library. 4. To know the opinion about care and maintenance of the SVORI Library.
4. HYPOTHESES
1. Majority of the respondents are visiting the library once in a week. 2. Majority of the respondents are satisfied with the library materials. 3. Majority of the users or not satisfied with the physical facilities of the library. 4. Majority of the respondents are expressed that they are not satisfied with the care and maintenance of the library.
TABLE -2: FREQUENCY OF VISIT TO SVORI LIBRARY
Reply No. of Visit Percentage
Students R.S. Total
Every day 16 5 21 14.00
Once in two days 48 16 64 42.66
Weekly once 32 7 39 26.00
Once in two weeks 16 2 18 12.00
Occasionally 8 - 8 5.33
Total 120 30 150 100
It is evident from the above table that majority of the users 42.66% visit the SVORI library once in two days. It is also evident from the table that 14% of the users visit the SVORI library everyday, 26% of the users visits the library weekly once and 12% of the users visits the library once in two weeks and only 5.33% of the users visits the library occasionally.
TABLE -3: SATISFACTION REGARDING ARRANGEMENT OF LIBRARY MATERIAL
Response Users of SVORI Percentage
Students R.S Total
Yes 76 19 95 63.33
No 44 11 55 36.67
Total 120 30 150 100
It is evident from the above table that 63.33% of the users are satisfied with the arrangement of library material, remaining 36.67% of the users are not satisfied regarding the arrangement of the material.
TABLE -4: SATISFACTION WITH THE LIBRARY MATERIAL
Library material Users of SVORI
Printed books Back volumes of Ideological (Oriental) journals Manuscripts
No % No % No %
Highly Satisfied 81 54.00 72 48.00 57 38.00
Satisfied 62 41.33 73 48.67 82 54.67
Not Satisfied 7 4.67 5 3.33 11 7.33
Total 150 100 150 100 150 100

VOLUME NO. 3 (2013), ISSUE NO. 08 (AUGUST) ISSN 2231-5756
INTERNATIONAL JOURNAL OF RESEARCH IN COMMERCE, IT & MANAGEMENT A Monthly Double-Blind Peer Reviewed (Refereed/Juried) Open Access International e-Journal - Included in the International Serial Directories
http://ijrcm.org.in/
149
It is clear from the above table that most of the respondents (54.00%) are highly satisfied with the printed books, 48.67% of the users are satisfied with the back volumes of ideological journals and 54.67% of the users are satisfied with the manuscripts.
TABLE -5: PHYSICAL FACILITIES OF THE SVORI LIBRARY It is clear from the above table that most of the respondents (56.00%) are highly satisfied with the library building, 48.00% of the respondents are satisfied with the lighting and ventilation facility and 46.67% of the users are satisfied with the furniture, 50.67% of the respondents satisfied with the toilets facility in the library.
TABLE -6: OPINION ABOUT CARE AND MAINTENANCE OF THE SVORI LIBRARY
Reply Users of SVORI Percentage
Students R.S Total
Highly satisfied 16 8 24 16.00
Satisfied 76 18 94 62.67
Not satisfied 28 4 32 21.33
Total 120 30 150 100
It is evident from the above table that most of the respondents 62.67% are satisfied with the care and maintenance of the library material, 21.33% of the respondents are highly satisfied and 16.00% of the respondents are not satisfied with the care and maintenance of the library material.
5. PROBLEMS IN THE LIBRARY The Library has the following problems: 1. Lack of adequate space for storage of Manuscripts; 2. The facilities for pest control measures are not available; 3. Lack of sufficient funds exclusively for conservation of Manuscripts; 4. Lack of adequate professional and supporting staff; and 5. Fumigation Chamber is not available to protect Manuscripts effectively.
6. CONCLUSIONS OF THE STUDY The following are the major observations that can be derived from the study. 6.1. ENVIRONMENTAL CONDITIONS Storage rooms do not follow standard preservation practices. They possess no climate control, although the climate remains extremely stable at high humid levels. The wooden storage cabinets contain dust and insects but do provide a measure of locked security. The institution has no emergency planning or preservation policy due to lack of specialists and funding. 6.2. PHYSICAL CONDITION OF THE MANUSCRIPTS The manuscripts and the early printed books show damage due to abuse, biological infestation, and moisture. Folders of ancient vintage protect only a fraction of the items. Some manuscripts need immediate restoration. 6.3. OTHER PRODUCTS There is no proper electronic database produced for the preservation assessment that allows researcher-scholars to search and classify all manuscripts by origin, title, date of creation, language, medium, size, pagination, presence of black folder, damages and overall condition.
7. RECOMMENDATIONS The following recommendations have been proposed to modernize and update the techniques of preservation and organization of Manuscripts in SVORI. 7.1. FURTHER DIGITIZATION Though no funding exists now for any of these recommendations, SVORI must purchase a digital camera, color printer, and CD-ROM burner. The staff must digitize the most endangered manuscripts, the most extraordinary examples of Indian Art, and those items mostly frequently used. The images must be stored on redundant copies of CD’s at archival quality, without the use of compression algorithms that lose data. 7.2. WEB PRESENCE OF MANUSCRIPTS A Web- site should be created featuring examples of Manuscripts and providing historical context to them. Some of those manuscripts will undergo computer processing, description, and SGML encoding under the auspices of the S.V. University and T.T.D. (Tirumala Tirupati Devasthanams) Thus, the digital images of the manuscript pages and the decorative elements will link to a database to recreate the manuscript on the Web. 7.3. DISASTER PLANNING SVORI must develop a detailed disaster plan and train its staff in disaster reaction. As funds accrue, SVORI must purchase smoke alarms and disaster items such as gloves, mops, buckets, paper towels, respirators, replacement filters, flashlights and batteries, sponges, and plastic bags, kept under lock and key. 7.4. RESTORATION AND CONSERVATION Many manuscripts require emergency restoration, but all of them require cleaning and disinfection 7.5. RECOMMENDATIONS IN REGARD TO THE PLACE, READING ROOM, AND LIBRARY The reading room must accommodate the researcher-scholars and the director should have his own office. The SVORI reference collection requires up dating to serve the research needs of the scholarly community, including subscription to specialized journals. 7.6. GAINING SUPPORT Finally, SVORI must enhance its support from its parent organizations i.e., S.V. University and T.T. D., and also try to gain support from other governmental bodies in order to continue to fulfill its mission as primary research institution.
REFERENCES 1. Marcel Decker and Allent keni. Encyclopedia of library and information Science. Vol.17 2. Mittal, R.L. Library administration theory and practice. Metropolitan Book. Co(pvt) Ltd. Delhi. 3. SVORI (2000): A profile of Sri Venkateswara Oriental Research Institute, S. V. University, Tirupati. 4. SVORI (2012): Official Records of Sri Venkateswara Oriental Research Institute, S.V. University, Tirupati. 5. Thompson, Della (1995): The concise oxford Dictionary, 9th edition, Oxford University press, New Delhi. 6. http://www.wickypedia.com/manuscript/
Physical facilities Users of SVORI
Building Lighting/ventilation Drinking water Furniture Toilets
No % No % No % No % No %
Highly satisfied 84 56.00 69 46.00 60 40.60 48 32.00 30 20.00
Satisfied 60 40 72 48.00 67 44.67 70 46.67 76 50.67
Not satisfied 6 4.00 9 6.00 23 15.33 32 21.33 44 29.33
Total 150 100 150 100 150 100 150 100 150 100

VOLUME NO. 3 (2013), ISSUE NO. 08 (AUGUST) ISSN 2231-5756
INTERNATIONAL JOURNAL OF RESEARCH IN COMMERCE, IT & MANAGEMENT A Monthly Double-Blind Peer Reviewed (Refereed/Juried) Open Access International e-Journal - Included in the International Serial Directories
http://ijrcm.org.in/
150
USE OF INFORMATION AND COMMUNICATION TECHNOLOGY (ICT) PRODUCTS AND SERVICES IN UNIVERSITY LIBRARIES OF TIRUPATI (A. P.): AN ANALYTICAL STUDY
DR. D. KONAPPA LIBRARIAN
P. V. K. K. INSTITUTE OF TECHNOLOGY ANANTAPURAMU
ABSTRACT
The present study has been undertaken with an attempt to evaluate the use of Information and Communication Technology (ICT) products and services made available in the Tirupati (A.P) University Libraries amongst the P.G students of Science and Technology with special reference to Sri Venkateswara University, Sri Padmavathi Mahila Viswa Vidyalayam, Acharya N.G. Ranga Agricultural University and Rastriya Sanskrit Vidyapeeth which represent truly population. For that purpose, survey method has been adopted by the investigators, which comprises of administration of questionnaire, observation of the participants, and interview of some of the participants for knowing the opinion of the respondents in respect of use of ICT) products and services for their academic and research activities.
KEYWORDS ICT, information technology, Internet, P.G students of Science and Technology.
INTRODUCTION n this information explosion era, libraries play a pivotal role in preserving and serving the information requirements of the users. In the present scenario, libraries are the main facilitators in the scholarly communication system. The communicated information has been selected, acquired, processed, stored and retrieved by the library for current use and for prosperity. Therefore, the library is a place where books and other sources of information kept for
teaching, learning, research and extension activities. Owing to ICT enabled products & services, and the availability of online information resources have changed the way the services academic institutions and libraries now provide to their users. ICT is the integration of computer and communication technology used to process, store and disseminate information. It has changed the traditional practices of library and information centers in delivery of services to the end users. In the present scenario, users can have access to a variety of information and digital archives of libraries from any corner. It also helps to users to access, manage, integrate, evaluate, create, and communicate with other users more easily than ever. The significant developments in ICT have forever changed the way of information gathering, processing and disseminating. While the ICT products and services processing, storage and retrieval facilities are provided by computers, telecommunication provides the facilities for the transfer or communication of information.
MEANING OF ICT The term ‘Information and Communication Technology’ (ICT) first appeared in the mid 1980s and was defined as "All kinds of electronic systems used for broadcasting telecommunications and mediated communications", with examples including personal computers, video games, cell phones, internet and electronic payment systems and computer S/W etc. The ICT is made of computer and communication technology. The computer technology is the tool for storing and processing information in digital form while communication technology helps us to transfer and disseminate digital information. Additionally ICT means a variety of technological applications in the process and communication of information. The word ICT is a combination of two words information, communication & technology. Information means knowledge and technology means use of computer & communication. The term ICT can be defined as “the integration of computing, networking and information processing technologies and their applications”. Thus, ICT means a combination of computer applications’ and communication technology for gathering, processing, storing and disseminating of Information.
BENEFITS OF ICT BASED PRODUCTS & SERVICES The ICT products & services are beneficial for the libraries in the following ways: 1. It provides efficient and accurate services; 2. It saves the time, space, energy and resources; 3. It helps for controlling the tremendous escalation of information; 4. It assist to provide high quality of services and increases the range of services; 5. It has invented the ways of resource sharing by co-operation and co-ordination; 6. It helps for the betterment of library image by providing better services in modern ways.
OBJECTIVES The primary objective of the present study is to examine the use of ICT products and services in university libraries of Tirupati. The specific objectives are:
To find out the level of use and purpose of using various ICT products and services.
To know the frequency of use of ICTs and time spent.
To find out the level of expertise of users regarding the use of ICTs.
To study the Methods of learning to use ICTs in university libraries.
To find out the problems encounter by the users while using ICTs.
SCOPE AND LIMITATIONS OF THE STUDY The scope of the present study is limited to four Universities, viz. Sri Venkateswara University (SVU), Rastriya Sanskrit Vidyapeeth (RSVP), Sri Padmavathi Mahila Viswa Vidyalayam (SPMVV) and Acharya N.G. Ranga Agricultural University (ANGRAU). The population of this study consists of P.G. Students of Science and Technology.
METHODOLOGY The survey method was adopted for the present study and a questionnaire was used as a data collection tool. The majority of the questions were objective type designed keeping the objective of the study in view. The questionnaire was distributed to all the P.G. Students of Science and Technology. In total 837
I

VOLUME NO. 3 (2013), ISSUE NO. 08 (AUGUST) ISSN 2231-5756
INTERNATIONAL JOURNAL OF RESEARCH IN COMMERCE, IT & MANAGEMENT A Monthly Double-Blind Peer Reviewed (Refereed/Juried) Open Access International e-Journal - Included in the International Serial Directories
http://ijrcm.org.in/
151
questionnaires were distributed among the P.G. Students of Science and Technology and responded with the response rate is 636 (75.99%), and asked of fill-up the same by allowing sufficient time.
DATA ANALYSIS A total 636 out of 837 regular Postgraduate students are selected four universities they were taken for the study of Tirupati, and responded with the response rate is 75.99%, which is presented in Table 1.
TABLE 1: DISTRIBUTION OF QUESTIONNAIRES AND RESPONSES
S.No Universities PG students Distributed Received Percentage
1 SVU 1856 372 256 68.82
2 RSVP 524 104 87 83.65
3 SPMVV 981 196 171 87.24
4 ANGRAU 827 165 122 73.94
Total 4188 837 636 75.99
As already noted, the total sample of users covered in the study is 636, comprising 75.99% postgraduate students. University wise 87.24% of the Sri Padmavathi Mahila Viswa Vidyalayam, 83.65% of the Rastriya Sanskrit Vidyapeeth 73.94% of the Acharya N.G. Ranga Agricultural University and remaining 68.82% Sri Venkateswara University postgraduate members.
TABLE 2: CLASSIFICATION OF RESPONDENTS BY SEX
S.No Universities Male Female Total
No. % No. % No. %
1 SVU 164 64.06 92 35.94 256 40.25
2 RSVP 56 64.37 31 35.63 87 13.68
3 SPMVV 0 0.00 171 100.0 171 26.89
4 ANGRAU 83 68.03 39 31.97 122 19.18
Total 303 47.64 333 52.36 636 100
Hence this result shows the sex wise distribution of respondents. Of the total 636 respondents surveyed, 303 (47.64%) are male and about 333 (52.36%) respondents are female. It can be inferred from table 2 that female respondents dominate over male respondents.
TABLE 3: LIBRARY COLLECTION DEVELOPMENT OF UNIVERSITY LIBRARIES
S.No Library Collection SVU RSVP SPMVV ANGRAU Total
1 Books 355000 88871 124896 90125 658892
2 Journals 325 175 256 276 1032
3 Thesis/Dissertations 3086 2000 1782 9064 15932
4 Reports/Patents/Standards 251 0 126 30 407
5 CD-ROM Databases - - 630 11536 12166
6 Microfilm/Microfiches 1500 100 276 - 1876
7 Audio/Video Sources 675 12 237 - 924
8 On-line Databases/E-Journals 9000 - 6000 2965 17965
Total 369837 91158 134203 113996 709194
It is obvious, that the total Book collection of Sri Venkateswara University Library being the highest while University clearly sweeps its strength in Journal collection by subscribing 325 scientific journals and also 9,000 of online databases (e-Journal) are subscribed. Sri Venkateswara University Library has collecting the 3086 of theses and dissertations and 675 various Audio/Video Sources. It is pathetic find from the table that, the CD-ROM products, a major information storage and retrieval sources in the Internet era. Acharya N.G Rang Agricultural University (11,536) and Sri Padmavathi Mahila Viswa Vidyalam (630) are the only libraries having CD-ROM Information Technology products. Microfilm/Microfiche readers have in Sri Venkateswara University (1500), Sri Padmavathi Mahila Viswa Vidyalam Library (276) and also Reports/Patents/Standards are collecting of Sri Venkateswara University (251), Sri Padmavathi Mahila Viswa Vidyalam Library (126) and Rasthriya Sanskrit Vidya Peetha Library (30). Respondents were asked to express their level of use of various ICT products for their research work. Table 4 shows that 85.55 percent of Sri Venkateswara University postgraduate science and technology students used computer for their study. On the other hand 78.14% respondents are used computer for their study. A majority of (75.15 per cent) used their personal Laptops. Followed by 64.1% of the respondents are used Internet. As far as various application software are concerned, it was found that while 58.33% of the respondents are used MS Word, 50.63% MS PowerPoint, and 47.80% MS Excel. Only 35.85% of the respondents are use printers. It is interesting to note that 30.35% and 25.16 of the respondents are used DVD/CD/Pen Drive and Scanner.
TABLE 4: USE OF ICT PRODUCTS
S.N
o
ICT Products SVU RSVP SPMVV ANGRAU Total
No. % No. % No. % No. % No. %
1 Computer 219 85.55 65 74.71 126 73.68 87 71.31 497 78.14
2 Laptop 209 81.64 69 79.31 132 77.19 68 55.74 478 75.16
3 Internet 164 64.06 56 64.37 121 70.76 68 55.74 409 64.31
4 MS-Word 178 69.53 43 49.43 89 52.05 61 50.00 371 58.33
5 MS-Power Point 115 44.92 47 54.02 91 53.22 69 56.56 322 50.63
6 MS-Excel 112 43.75 49 56.32 91 53.22 52 42.62 304 47.80
7 Printer 79 30.86 37 42.53 68 39.77 44 36.07 228 35.85
8 Scanner 56 21.88 22 25.29 44 25.73 38 31.15 160 25.16
9 DVD/CD/Pen Drive 67 26.17 36 41.38 59 34.50 31 25.41 193 30.35

VOLUME NO. 3 (2013), ISSUE NO. 08 (AUGUST) ISSN 2231-5756
INTERNATIONAL JOURNAL OF RESEARCH IN COMMERCE, IT & MANAGEMENT A Monthly Double-Blind Peer Reviewed (Refereed/Juried) Open Access International e-Journal - Included in the International Serial Directories
http://ijrcm.org.in/
152
TABLE 5: PURPOSE OF USING ICT PRODUCTS AND SERVICES
S.N
o
Purposes SVU RSVP SPMVV ANGRAU Total
No. % No. % No. % No. % No. %
1 Electronic books 157 61.33 52 59.77 96 56.14 66 54.10 371 58.33
2 Electronic journals 205 80.08 71 81.61 132 77.19 93 76.23 501 78.77
3 E-mail 215 83.98 72 82.76 136 79.53 99 81.15 522 82.08
4 Ongoing study work 162 63.28 56 64.37 121 70.76 68 55.74 407 63.99
5 Preparation of notes 243 94.92 79 90.80 162 94.74 109 89.34 593 93.24
6 Project/Dissertation 126 49.22 42 48.28 89 52.05 57 46.72 314 49.37
7 Writing a article for publication 46 17.97 17 19.54 45 26.32 59 48.36 167 26.26
8 For seminars 62 24.22 19 21.84 39 22.81 64 52.46 184 28.93
9 Search Web OPAC/OPAC 56 21.88 22 25.29 44 25.73 38 31.15 160 25.16
10 Curriculum design 58 22.66 16 18.39 19 11.11 21 17.21 114 17.92
Table 5 describes that Majority of the respondents (93.24%) reported that they use ICT product and services for the purpose of Preparation of notes. 82.08% of respondents are used e-mail; 78.77 per cent for electronic journals; 63.99 per cent to ongoing study work; 58.33 per cent for electronic books. Also 49.37% of the respondent’s use of ICT products and services for their “Project/Dissertation work” and 28.93% of the respondents are using for the purpose of “Attending seminars”. About 26.26% of the respondents use ICT products and services for the purpose of “Writing a article for publication” and only 25.16% of the respondents use the same for “Web OPAC/OPAC”. The less used services among PG students of science and technology were Curriculum design. The investigator feels that the PG students of science and technology might not have got proper training/guidance and assistance from the staffs/librarians which is very necessary for the effective use of ICT products and services.
TABLE 6: FREQUENCY OF USE OF COMPUTER AND INTERNET
S.N
o
Frequency SVU RSVP SPMVV ANGRAU Total
No. % No. % No. % No. % No. %
1 Everyday 88 34.38 39 44.83 59 34.50 34 27.87 220 34.59
2 Twice a week 57 22.27 21 24.14 41 23.98 37 30.33 156 24.53
3 Once in a week 46 17.97 12 13.79 33 19.30 26 21.31 117 18.40
4 Twice a month 37 14.45 8 9.20 24 14.04 14 11.48 83 13.05
5 Once in a month 23 8.98 5 5.75 11 6.43 7 5.74 46 7.23
6 Occasionally 5 1.95 2 2.30 3 1.75 4 3.28 14 2.20
Total 256 100 87 100 171 100 122 100 636 100
Table 6 shows that the majority of 220 (34.59%) respondents are use of ICTs of an everyday. Also 156 (24.53%) of the respondents use ICTs on twice a week and 117 (18.40%) of the respondents are using the ICTs once in a week, 83 (13.05%) of respondents are use ICTs on twice a month and 46 (7.23%) of use it once in a month. Only 14 (2.20%) of the respondents respectively use it occasionally.
TABLE 7: LOCATION OF INTERNET USE FOR ICTs
S.N
o
Location SVU RSVP SPMVV ANGRAU Total
No. % No. % No. % No. % No. %
1 Library 219 85.55 73 83.91 137 80.12 111 90.98 540 84.91
2 Computer centre in campus 176 68.75 43 49.43 89 52.05 61 50.00 369 58.02
3 Department 79 30.86 37 42.53 68 39.77 44 36.07 228 35.85
4 Other places 95 37.11 49 56.32 91 53.22 39 31.97 274 43.08
Table 7 indicates that, Majority (84.91%) of the respondents indicated that they have access to the internet and use it for ICTs also access it from library. While 58.02% access the ICTs through the facility at campus computer centre. The respondents who choose ‘other places’ mainly referred to it as their home and private cyber cafe accessed internets from this location were 43.08%. Only 35.85% of the respondents indicated that they use it from their respective departments.
TABLE 8: EXPERTISE IN USING ICTs
S.No Level of Expertise SVU RSVP SPMVV ANGRAU Total
No. % No. % No. % No. % No. %
1 Very expert 51 19.92 14 16.09 36 21.05 30 24.59 131 20.60
2 Expert 57 22.27 21 24.14 41 23.98 37 30.33 156 24.53
3 Average user 88 34.38 39 44.83 59 34.50 34 27.87 220 34.59
4 Poor 37 14.45 8 9.20 24 14.04 14 11.48 83 13.05
5 Very Poor 23 8.98 5 5.75 11 6.43 7 5.74 46 7.23
Total 256 100 87 100 171 100 122 100 636 100
Table 8 shows that only 20.60% of respondents indicated that they are very expert in using ICTs, while 24.53% of respondents indicated that they are expert users of ICT. 34.59% respondents indicated that they are average users of ICTs. The reasons for less expertise in using ICTs are that a majority of the PG students of science and technology do not have a formal knowledge or a computer training programme.
TABLE 9: METHODS OF LEARNING TO USE ICTs
S.N
o
Methods SVU RSVP SPMVV ANGRAU Total
No. % No. % No. % No. % No. %
1 Self study 209 81.64 69 79.31 132 77.19 68 55.74 478 75.16
2 With the assistance of colleagues/friends 221 86.33 65 74.71 126 73.68 87 71.31 499 78.46
3 Courses offered by institution/college 112 43.75 49 56.32 91 53.22 52 42.62 304 47.80
4 By attending formal courses 98 38.28 41 47.13 72 42.11 63 51.64 274 43.08
5 Guidance from library staff 26 10.16 12 13.79 19 11.11 21 17.21 78 12.26
According to their responses, it was found that learning with the assistance of colleagues/friends (78.46%) and Self study (75.16%) is the most popular methods of electronic information sources learning among the respondents. It was followed by 47.80% of the respondents who learnt to use electronic information sources through courses offered by their institutions. Another 43.08% respondents learnt by attending formal course, either paid or through official training. Guidance or skills offered by the library (12.26%) play a minor role. That does not mean that support from the library is regarded as unimportant.

VOLUME NO. 3 (2013), ISSUE NO. 08 (AUGUST) ISSN 2231-5756
INTERNATIONAL JOURNAL OF RESEARCH IN COMMERCE, IT & MANAGEMENT A Monthly Double-Blind Peer Reviewed (Refereed/Juried) Open Access International e-Journal - Included in the International Serial Directories
http://ijrcm.org.in/
153
TABLE 10: PREFERRED SEARCH ENGINES
S.No Search Engine SVU RSVP SPMVV ANGRAU Total
No. % No. % No. % No. % No. %
1 Google 237 92.58 81 93.10 162 94.74 109 89.34 589 92.61
2 Firefox 168 65.63 56 64.37 121 70.76 68 55.74 413 64.94
3 Yahoo! 116 45.31 42 48.28 89 52.05 57 46.72 304 47.80
4 AltaVista 37 14.45 8 9.20 24 14.04 14 11.48 83 13.05
5 MSN 23 8.98 5 5.75 11 6.43 7 5.74 46 7.23
Regarding the use of search engines respondents were asked to indicate multiple answers according to their use. Table 4 shows that 92.61% of respondents are use Google. Followed by 64.94% of respondents also use Firefox. It is found that 47.80%of respondents use Yahoo!, while 13.05% AltaVista, and only 7.23% MSN.
TABLE 11: PROBLEMS ENCOUNTER WHILE USING ICTs
S.N
o
Items SVU RSVP SPMVV ANGRAU Total
No. % No. % No. % No. % No. %
1 Too few computers with internet facilities 219 85.55 65 74.71 126 73.68 87 71.31 497 78.14
2 Incessant power outage 209 81.64 69 79.31 132 77.19 68 55.74 478 75.16
3 Slow internet connectivity 164 64.06 56 64.37 121 70.76 68 55.74 409 64.31
4 Non-connectivity 56 21.88 22 25.29 44 25.73 38 31.15 160 25.16
5 Inability to use computer 115 44.92 47 54.02 91 53.22 69 56.56 322 50.63
6 Selecting search terms 112 43.75 49 56.32 91 53.22 52 42.62 304 47.80
7 Finding relevant information 79 30.86 37 42.53 68 39.77 44 36.07 228 35.85
8 Lack of ICT skills 178 69.53 43 49.43 89 52.05 61 50.00 371 58.33
The above table showed that few computers with internet facilities were got 78.14% and also incessant power outage (75.16%) highest among the problems encountered by the respondents. More than half of the respondents (64.31% and 58.33%) are indicated to have slow internet connectivity and Lack of IT skills. This was followed by incessant power outage which was ranked at 910 (41.61%) while lack of ICT skills was ranked lowest at 77 (3.52%). Similarly, 50.63% of the respondents are encounter the problem of Inability to use computer, while 47.80% of the respondents are encounter the problem of selecting search terms. 35.85% and 25.16% of the respondents are encountering the problem of “Finding relevant information” and “Non-connectivity of internet” respectively.
TABLE 12: SATISFACTION LEVEL TO USE OF ICTs
S.No Satisfaction level to use of ICTs SVU RSVP SPMVV ANGRAU Total
No. % No. % No. % No. % No. %
1 Highly satisfied 42 16.41 9 10.34 21 12.28 12 9.84 84 13.21
2 Satisfied 57 22.27 16 18.39 37 21.64 32 26.23 142 22.33
3 Neutral 113 44.14 45 51.72 87 50.88 64 52.46 309 48.58
4 Dissatisfied 26 10.16 14 16.09 17 9.94 9 7.38 66 10.38
5 Highly dissatisfied 18 7.03 3 3.45 9 5.26 5 4.10 35 5.50
Total 256 100 87 100 171 100 122 100 636 100
The respondents were asked to rate their overall satisfaction with the level of access to ICTs use on a five-point scale from 1 (Highly satisfied) to 5 (Highly dissatisfied). The respondents are overwhelmingly positive about the level of access for the use of electronic information sources. A majority of the (84.12%) indicated they are moderately to highly satisfied, whereas only 15.88% indicated dissatisfaction. It can be seen from Table 5.13 that 13.21% of the respondents indicated that highly satisfied with the access they have to use ICTs. Followed by 22.33% of respondents were satisfied with the use of ICT products and services. Further, nearly half of the respondents (48.58%) were moderately satisfied whereas only 10.38% were dissatisfied and 5.50% of respondents were highly dissatisfied with the access they are having in using ICT products and services in their universities.
FINDINGS a) The total Book collection of Sri Venkateswara University Library being the highest while University clearly sweeps its strength in Journal collection by
subscribing 325 scientific journals and also 9,000 of online databases (e-Journal) are subscribed. b) More than seventy percent of the respondents are used computer and their personal Laptops of ICT Products. c) Majority of the respondents (93.24%) reported that they use ICT product and services for the purpose of Preparation of notes and 82.08% of respondents
are used e-mail. d) It is found that the majority (220) of respondents is use of ICT products and services an everyday. e) Majority (84.91%) of the respondents indicated that they have access to the internet and use it for ICTs also access it from library. f) The study found that, 34.59% respondents indicated that they are average users of ICTs. The reasons for less expertise in using ICTs are that a majority of
the PG students of science and technology do not have a formal knowledge or a computer training programme. g) The survey found that learning with the assistance of colleagues/friends (78.46%) and Self study (75.16%) of the users, most popular methods of electronic
information resources learning among the respondents. h) The study found that 92.61% of respondents are use “Google” search engine for browsing the ICT products and services. i) It can be inferred from the data that the majority of users do face problems of few computers with internet facilities and incessant power outage. j) The respondents are overwhelmingly positive about the level of access for the use of Information and Communication Technology products and services. A
majority of the (84.12%) indicated they are moderately to highly satisfied.
CONCLUSION The use of information and communication technology (ICT) products and services respondents varied according to their program of study, the need to carry out postgraduate students to excel in their academic endeavour and versatility in the use of information and communication technologies to search for information. The current trends in electronic environment, suggest a complete revolution in the status of collection development. As Information and Communication Technology (ICT) advances, the emphasis of academic libraries has focused upon the intrinsic excellence of collection development suitable to information and communication technology (ICT) products and services. Academic libraries are changing very fast by ICT based products and services. The change enforced by ICT, to adoption of products and services of ICT in libraries are robust indicator of this response. It provides a means for overcoming historically intractable problems of isolation and lack of access to information and knowledge, crucial impediments to libraries development. The ICT products and services have reshaped the educational landscape by transforming the content and modes of release of information. Apart from facilitating the global networked ICT, also enhances knowledge creation and innovation.
VOLUME NO. 3 (2013), ISSUE NO. 08 (AUGUST) ISSN 2231-5756
INTERNATIONAL JOURNAL OF RESEARCH IN COMMERCE, IT & MANAGEMENT A Monthly Double-Blind Peer Reviewed (Refereed/Juried) Open Access International e-Journal - Included in the International Serial Directories
http://ijrcm.org.in/
154
The present study reveals that information and communication technology (ICT) products and services have a positive impact on library users. The future of the library and information services at academic libraries depends upon major factors, like, availability of manpower in adequate proportion, which continuously keeps updating its ICT skills and determination of higher authorities in allocating appropriate recurring grants to procure, update and maintain ICT infrastructure and products and services.
REFERENCES 1. Ahmad Naved and Fatima Nishat, J. (2009). Usage of ICT Products and Services for Research in Social Sciences at Aligarh Muslim University. DESIDOC
Journal of Library &Information Technology, 29(2), p. 25-29. 2. Ahmad Parvez. (2011). Development in library services with the advent of ICT based products & services: a continuous process. International Journal of
Digital Library Services, 1(2), p. 1-9. 3. Kamble Ajay. (2011). Usage of ICT Products and Services for Research [Internet]. Version 1. LIS Compendium. 2011 Nov 24. Available from:
http://liscompendium.wordpress.com/article/usage-of-ict-products-and-services-for-20eckkj3x4w7q-1/. (Accessed on 13-03-2013). 4. Kaur, A. (2000). Internet facility at GNDU: A survey. /In /national Seminar on Academic Libraries in the Modern Era. IASLIC, 4-6 December 2000, Bhopal, p.
119-124. 5. Koganurmath, M.M., and Jange, S. (1999). Use of Internet by social science research scholars: A study in academic libraries in the Internet era. In National
Convention on Academic Libraries in the Internet Era, INFLIBNET, p.478-483. Ahmedabad. 6. Konappa, D., Chandran, D and Sreenivasulu, R. (2013). Use of Electronic Information Resources in University Libraries of Tirupati (A.P): An Analytical Study.
58th ILA International Conference on: Next Generation Libraries: New Insights and Universal Access to Knowledge, Karnatak University, Dharwad, February 24-27, 2013, p. 311-319.
7. Kumbhar, Rajendra. (2009). Use of e-learning in library and information science education. DESIDOC Journal of Library & Information Technology, 29(1), p. 37-41.
8. Mishra, O.P., Yadava, N. and Bisht, K. 2005. Internet utilization pattern of undergraduate students, /University News/, 43(13), p. 8-12.

VOLUME NO. 3 (2013), ISSUE NO. 08 (AUGUST) ISSN 2231-5756
INTERNATIONAL JOURNAL OF RESEARCH IN COMMERCE, IT & MANAGEMENT A Monthly Double-Blind Peer Reviewed (Refereed/Juried) Open Access International e-Journal - Included in the International Serial Directories
http://ijrcm.org.in/
155
SATISFACTION ON FACILITIES AND SERVICES OF J. B. WOMEN’S ENGINEERING COLLEGE LIBRARY IN TIRUPATI: AN USER SURVEY
B. VEENA KUMARI RESEARCH SCHOLAR
DEPARTMENT OF LIBRARY &INFORMATION SCIENCE S. V. UNIVERSITY
TIRUPATI
ABSTRACT The present study has been made analyze and interpret the user’s opinion on the facilities and services provided by J.B.Women’s Engineering College Library. During the preparation of this paper, an attempt was made to collect the required data from all available sources. However, sample survey method is used for the study. 270 questionnaires were distributed out of which 210 were received from the respondents.
KEYWORDS library services, J.B. Women’s Engineering College.
INTRODUCTION he library is one of society’s forms of cultural self-expression. In India, the development of higher education is closely associated with the steady growth and development of the library in the institution of higher learning. An academic library is affiliated with an academic institution, be it a school, college, or university. A college library, of which an engineering college library is one example, is a service component of its parent body, and since it is a non-
profit organization, it must manage its finances in a judicious manner. At the same time, library services are increasingly expensive.
DEFINITION OF ENGINEERING/TECHNOLOGY Engineering is a branch of science and technology that deals with the designing of Technology and feasibility of applications to the human kind in the easiest possible way. Engineering is one of the oldest and preferred streams in our education system. This has been a favored career option among students after 10+2. Engineering offers students an opportunity to work in technical, scientific and mathematical areas in order to meet the growing demands of human needs.
ENGINEERING COLLEGE LIBRARY Libraries which are attached to engineering colleges are known as engineering college libraries. These are entrusted with a host of predetermined tasks like acquiring, organizing, preserving, retrieving and disseminating information to the users. Due to developments in Information and Communication Technology (ICT), these libraries are undergoing significant changes today not only in their outlook but also in their functions, services, methods and techniques for collection development, processing and dissemination of information.
THE ENGINEERING COLLEGE LIBRARY COLLECTION The majority of the engineering college library collection is in the form of books and periodicals, while non-book materials may not so well-represented, with the possible exception of maps. In Indian college libraries, book selection is based on the curriculum and on the syllabi of the courses conducted at the college. A textbook collection and a separate “book bank” are important sources for these college libraries.
FUNCTIONS OF ENGINEERING LIBRARY The core function of engineering college library is to provide books and other library materials to the clientele at the right time.
The development of the collection of books, periodicals and other items.
Maintenance of index files or selected subject references.
Dissemination of currently published information by means of personal notifications, preparation and distribution of library bulletins or by using centralized services.
Circulation of books and routing of periodicals.
Filing and indexing of internal reports and technical correspondences.
Maintenance of reference services to supply instant services.
Compilation of bibliographies.
Editorial assistance with internal publications.
Translation of foreign language publications.
Personalized service of various types.
ABOUT J.B. INSTITUTE OF WOMEN’S ENGINEERING COLLEGE LIBRARY J.B. Institute of Women’s Engineering College, Tirupati established from the academic year 2008-09. The library functions during all working days the library operates from 8.30 a.m. to 4.30 p.m. The college library on the campus caters to the needs of 254 students, 28 faculty’s. The Library has huge collection of books was 6,289 and 26 Indian and 20 foreign Journals were subscribed for the library. The college library is true to its word. It is a typical house of knowledge and provides a calm and serene ambience to our students. Our Library has more than sufficient number of books, journals and periodicals in addition to 12 daily News papers and magazines.
OBJECTIVES OF THE STUDY To evaluate the use of various services available in the library;
To find out the ways and methods adopted by users in approaching the information sources; and
To find out the various physical facilities available to the users.
T

VOLUME NO. 3 (2013), ISSUE NO. 08 (AUGUST) ISSN 2231-5756
INTERNATIONAL JOURNAL OF RESEARCH IN COMMERCE, IT & MANAGEMENT A Monthly Double-Blind Peer Reviewed (Refereed/Juried) Open Access International e-Journal - Included in the International Serial Directories
http://ijrcm.org.in/
156
METHODOLOGY The present study is confined only one engineering college in Tirupati, Andhra Pradesh. As the target population, i.e. third year and fourth year students, is scattered in engineering college, survey method is adopted to collect data for the present study.
ANALYSIS OF DATA The data thus collected is presented in the form of Tables.
TABLE – 1: BRANCH WISE DISTRIBUTION OF RESPONDENTS
Branch Number of users Percentage
IT 66 31.4
EEE 75 35.7
ECE 69 32.9
Total 210 100
It can be observed from Table -1 that majority of the respondents (35.7%) are from EEE branch followed by 32.9% ECE, and 31.4% IT branches.
TABLE – 2: FREQUENCY OF VISIT TO LIBRARY
Frequency Branch wise Respondents Total(N=210) IT(N=66) EEE(N=75) ECE(N=69)
No % No % No % No %
Daily 32 48.5 35 46.8 36 52.2 103 49.0
Once in two days 19 28.3 22 29.3 21 30.5 62 29.6
Twice in a week 6 9.1 10 13.3 9 13.1 25 11.9
Weekly once 7 10.6 7 9.3 1 1.4 15 7.1
Monthly 2 3.0 1 1.3 1 1.4 4 1.9
Occasionally 0 0.0 0 0.0 1 1.4 1 0.5
It is evident from the above Table-2 that 49.0% of the respondents are visiting the library daily, 29.6% once in two days, 11.9% twice in a week, 7.1% weekly once, 1.9% monthly, and the remaining 0.5% of the respondents are visiting occasionally. It can be concluded that most of the respondents are visiting the library weekly once.
TABLE – 3: PURPOSE OF VISITING THE LIBRARY
Frequency Branch wise Respondents Total(N=210)
IT (N=66) EEE (N=75) ECE (N=69)
No % No % No % No %
To read newspaper 32 48.5 26 34.7 21 30.4 79 37.6
To spend leisure time 10 15.2 17 22.7 16 23.2 43 20.4
To borrow books 24 36.3 32 42.6 32 46.4 88 42.0
It is evident from Table- 3 that majority of the respondents (42.0%) mentioned that they are visiting library to borrow books, followed by 37.6% to read newspapers, 20.4% to spend leisure time. It can be concluded that majority of the respondents visit the library to borrow books.
TABLE – 4: SATISFACTION REGARDING WORKING HOURS
Frequency Branch wise Respondents Total (N=210)
IT (N=66) EEE (N=75) ECE (N=69)
No % No % No % No %
Yes 58 87.8 69 92.0 56 81.2 183 87.1
No 8 12.2 6 8.0 13 18.8 27 12.9
It is evident from the above Table that 87.1% of the respondents are satisfied regarding the existing working hours while the remaining 12.9% expressed that they are not satisfied regarding working hours. It can be concluded that majority of the respondents are satisfied with the present working hours of the library.
TABLE – 5: AWARENESS OF THE LIBRARY COLLECTION
Collection Branch wise Respondents Total (N=210)
IT (N=66) EEE (N=75) ECE (N=69)
Yes No Yes No Yes No Yes No
Text books 52 (78.8) 14 (21.2) 56 (74.7) 19 (25.3) 40 (57.9) 29 (42.1) 148 (70.5) 62 (29.5)
Magazines 46 (69.7) 20 (30.3) 39 (52.0) 36 (48.0) 26 (37.7) 43 (62.3) 111 (52.9) 99 (47.1)
Journals 60 (90.9) 6 (09.1) 49 (65.3) 26 (34.7) 22 (31.9) 47 (68.1) 131 (62.4) 79 (37.6)
Reference books 56 (84.8) 10 (15.2) 54 (72.0) 21 (28.0) 48 (69.6) 21 (30.4) 158 (75.2) 52 (24.8)
Dictionaries 20 (30.3) 46 (69.7) 26 (34.7) 49 (65.3) 12 (17.4) 57 (82.6) 58 (27.6) 152 (72.4)
Directories 56 (84.8) 10 (15.2) 25 (33.3) 50 (66.7) 22 (31.9) 47 (68.1) 103 (49.0) 107 (51.0)
Encyclopedias 15 (22.7) 51 (77.3) 10 (13.3) 65 (86.7) 15 (21.7) 54 (78.3) 40 (19.0) 170 (81.0)
Year books 22 (33.3) 44 (66.7) 12 (16.0) 63 (84.0) 20 (28.9) 49 (71.1) 54 (25.7) 156 (74.3)
Fictions 5 (07.6) 61 (92.4) 6 (08.0) 69 (92.0) 11 (15.9) 58 (84.1) 22 (10.5) 188 (89.5)
(Parentheses indicated percentages) It can be observed from Table-5 that majority of the respondents (75.2%) mentioned that they are aware of reference books followed by 70.5% text books, 62.4% journals, 52.9% magazines, 49.0% directories, 25.7% year books, 19.0% encyclopedias and leaguer number of the respondents 10.5% with fictions. It can be concluded that most of the respondents that they are aware of reference books.
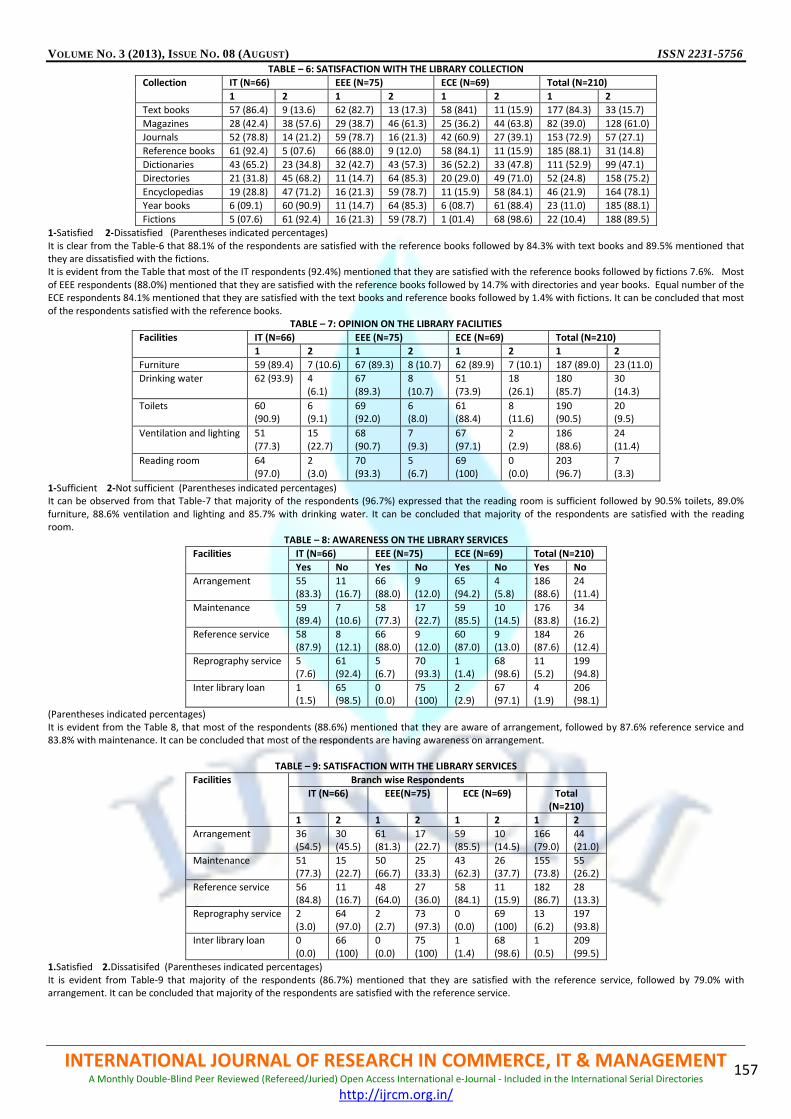
VOLUME NO. 3 (2013), ISSUE NO. 08 (AUGUST) ISSN 2231-5756
INTERNATIONAL JOURNAL OF RESEARCH IN COMMERCE, IT & MANAGEMENT A Monthly Double-Blind Peer Reviewed (Refereed/Juried) Open Access International e-Journal - Included in the International Serial Directories
http://ijrcm.org.in/
157
TABLE – 6: SATISFACTION WITH THE LIBRARY COLLECTION
Collection IT (N=66) EEE (N=75) ECE (N=69) Total (N=210)
1 2 1 2 1 2 1 2
Text books 57 (86.4) 9 (13.6) 62 (82.7) 13 (17.3) 58 (841) 11 (15.9) 177 (84.3) 33 (15.7)
Magazines 28 (42.4) 38 (57.6) 29 (38.7) 46 (61.3) 25 (36.2) 44 (63.8) 82 (39.0) 128 (61.0)
Journals 52 (78.8) 14 (21.2) 59 (78.7) 16 (21.3) 42 (60.9) 27 (39.1) 153 (72.9) 57 (27.1)
Reference books 61 (92.4) 5 (07.6) 66 (88.0) 9 (12.0) 58 (84.1) 11 (15.9) 185 (88.1) 31 (14.8)
Dictionaries 43 (65.2) 23 (34.8) 32 (42.7) 43 (57.3) 36 (52.2) 33 (47.8) 111 (52.9) 99 (47.1)
Directories 21 (31.8) 45 (68.2) 11 (14.7) 64 (85.3) 20 (29.0) 49 (71.0) 52 (24.8) 158 (75.2)
Encyclopedias 19 (28.8) 47 (71.2) 16 (21.3) 59 (78.7) 11 (15.9) 58 (84.1) 46 (21.9) 164 (78.1)
Year books 6 (09.1) 60 (90.9) 11 (14.7) 64 (85.3) 6 (08.7) 61 (88.4) 23 (11.0) 185 (88.1)
Fictions 5 (07.6) 61 (92.4) 16 (21.3) 59 (78.7) 1 (01.4) 68 (98.6) 22 (10.4) 188 (89.5)
1-Satisfied 2-Dissatisfied (Parentheses indicated percentages) It is clear from the Table-6 that 88.1% of the respondents are satisfied with the reference books followed by 84.3% with text books and 89.5% mentioned that they are dissatisfied with the fictions. It is evident from the Table that most of the IT respondents (92.4%) mentioned that they are satisfied with the reference books followed by fictions 7.6%. Most of EEE respondents (88.0%) mentioned that they are satisfied with the reference books followed by 14.7% with directories and year books. Equal number of the ECE respondents 84.1% mentioned that they are satisfied with the text books and reference books followed by 1.4% with fictions. It can be concluded that most of the respondents satisfied with the reference books.
TABLE – 7: OPINION ON THE LIBRARY FACILITIES
Facilities IT (N=66) EEE (N=75) ECE (N=69) Total (N=210)
1 2 1 2 1 2 1 2
Furniture 59 (89.4) 7 (10.6) 67 (89.3) 8 (10.7) 62 (89.9) 7 (10.1) 187 (89.0) 23 (11.0)
Drinking water 62 (93.9) 4 (6.1)
67 (89.3)
8 (10.7)
51 (73.9)
18 (26.1)
180 (85.7)
30 (14.3)
Toilets 60 (90.9)
6 (9.1)
69 (92.0)
6 (8.0)
61 (88.4)
8 (11.6)
190 (90.5)
20 (9.5)
Ventilation and lighting 51 (77.3)
15 (22.7)
68 (90.7)
7 (9.3)
67 (97.1)
2 (2.9)
186 (88.6)
24 (11.4)
Reading room 64 (97.0)
2 (3.0)
70 (93.3)
5 (6.7)
69 (100)
0 (0.0)
203 (96.7)
7 (3.3)
1-Sufficient 2-Not sufficient (Parentheses indicated percentages) It can be observed from that Table-7 that majority of the respondents (96.7%) expressed that the reading room is sufficient followed by 90.5% toilets, 89.0% furniture, 88.6% ventilation and lighting and 85.7% with drinking water. It can be concluded that majority of the respondents are satisfied with the reading room.
TABLE – 8: AWARENESS ON THE LIBRARY SERVICES
Facilities IT (N=66) EEE (N=75) ECE (N=69) Total (N=210)
Yes No Yes No Yes No Yes No
Arrangement 55 (83.3)
11 (16.7)
66 (88.0)
9 (12.0)
65 (94.2)
4 (5.8)
186 (88.6)
24 (11.4)
Maintenance 59 (89.4)
7 (10.6)
58 (77.3)
17 (22.7)
59 (85.5)
10 (14.5)
176 (83.8)
34 (16.2)
Reference service 58 (87.9)
8 (12.1)
66 (88.0)
9 (12.0)
60 (87.0)
9 (13.0)
184 (87.6)
26 (12.4)
Reprography service 5 (7.6)
61 (92.4)
5 (6.7)
70 (93.3)
1 (1.4)
68 (98.6)
11 (5.2)
199 (94.8)
Inter library loan 1 (1.5)
65 (98.5)
0 (0.0)
75 (100)
2 (2.9)
67 (97.1)
4 (1.9)
206 (98.1)
(Parentheses indicated percentages) It is evident from the Table 8, that most of the respondents (88.6%) mentioned that they are aware of arrangement, followed by 87.6% reference service and 83.8% with maintenance. It can be concluded that most of the respondents are having awareness on arrangement.
TABLE – 9: SATISFACTION WITH THE LIBRARY SERVICES
Facilities Branch wise Respondents
IT (N=66) EEE(N=75) ECE (N=69) Total (N=210)
1 2 1 2 1 2 1 2
Arrangement 36 (54.5)
30 (45.5)
61 (81.3)
17 (22.7)
59 (85.5)
10 (14.5)
166 (79.0)
44 (21.0)
Maintenance 51 (77.3)
15 (22.7)
50 (66.7)
25 (33.3)
43 (62.3)
26 (37.7)
155 (73.8)
55 (26.2)
Reference service 56 (84.8)
11 (16.7)
48 (64.0)
27 (36.0)
58 (84.1)
11 (15.9)
182 (86.7)
28 (13.3)
Reprography service 2 (3.0)
64 (97.0)
2 (2.7)
73 (97.3)
0 (0.0)
69 (100)
13 (6.2)
197 (93.8)
Inter library loan 0 (0.0)
66 (100)
0 (0.0)
75 (100)
1 (1.4)
68 (98.6)
1 (0.5)
209 (99.5)
1.Satisfied 2.Dissatisifed (Parentheses indicated percentages) It is evident from Table-9 that majority of the respondents (86.7%) mentioned that they are satisfied with the reference service, followed by 79.0% with arrangement. It can be concluded that majority of the respondents are satisfied with the reference service.

VOLUME NO. 3 (2013), ISSUE NO. 08 (AUGUST) ISSN 2231-5756
INTERNATIONAL JOURNAL OF RESEARCH IN COMMERCE, IT & MANAGEMENT A Monthly Double-Blind Peer Reviewed (Refereed/Juried) Open Access International e-Journal - Included in the International Serial Directories
http://ijrcm.org.in/
158
TABLE – 10: AVAILABILITY OF INTERNET FACILITY IN THE LIBRARY
Facility Branch wise Respondents Total (N=210) IT (N=66) EEE(N=75) ECE (N=69)
No % No % No % No %
Yes 3 4.5 5 6.7 2 2.9 10 4.7
No 63 95.5 70 93.3 67 97.1 200 95.3
It is evident from Table-10 that majority of the respondents (95.3%) mentioned that there is no internet facility in the library, and 4.7% of the respondents mentioned that there is internet facility in the library. It can be concluded that majority of the respondents mentioned that there is no internet connectivity in the library.
TABLE – 11: OPINIONS ON PROVISION OF ORIENTATION PROGRAMME
Orientation Branch wise Respondents Total (N=210) IT (N=66) EEE(N=75) ECE (N=69)
No % No % No % No %
Yes 64 97.0 71 94.7 62 89.9 197 93.8
No 2 3.0 4 5.3 7 10.1 13 6.2
It is evident from the above Table-11 that majority of the respondents (93.8%) expressed that orientation is required for utilization of sources and services, while the remaining respondents (6.2%) opined negatively. It can be concluded that majority of the respondents expressed that orientation is required for effective utilization of sources and services.
TABLE –12 METHOD OF ORIENTATION It is evident from Table-12 that majority of the respondents (85.2%) mentioned that among the methods of orientation the lecture method is suitable, followed by library tour (8.6%) and library guides (6.2%). It can be concluded that majority of the respondents felt that the lecture method is suiTable among the methods of orientation.
TABLE – 13: FREQUENCY OF TAKING ASSISTANCE FROM THE LIBRARY STAFF
Library staff Branch wise Respondents Total (N=210) IT (N=66) EEE(N=75) ECE (N=69)
No % No % No % No %
Frequently 58 87.9 69 92.0 61 88.4 188 89.5
Rarely 5 7.6 5 6.7 4 5.8 14 6.7
Never 3 4.4 1 1.3 4 5.8 8 3.8
It is evident from Table-13 that majority of the respondents (89.5%) mentioned that they have taken assistance from the library staff frequently, rarely (6.7%) and never (3.8%). It can be concluded that majority of the respondents have taken assistance from the library staff frequently.
FINDINGS Most of the respondents (49.0%) mentioned that they are visiting library daily. Majority of the respondents (42.0%) mentioned that they are visiting library for to borrow books. 87.1% of the respondents (96.7%) are satisfied regarding the existing working hours. Majority of the respondents (75.2%) mentioned that they are aware of reference books. Majority of the respondents (88.1%) mentioned that they are satisfied with reference books. Majority of the respondents are satisfied with the reading room. Most of the respondents (88.6%) mentioned that they are awareness of arrangement. Majority of the respondents (86.7%) mentioned that they are satisfied with the reference service. Majority of the respondents (95.3%) mentioned that there is no internet facility in the library. Majority of the respondents (93.8%) expressed that orientation is required for utilization of sources and services. Majority of the respondents (85.2%) mentioned that among the methods of orientation the lecture method is suiTable. Majority of the respondents (89.5%) mentioned that they have taken assistance from the library staff frequently.
RECOMMENDATIONS The following are the recommendations made by the investigator on the basis of analysis of responses of users and on the basis of their suggestions. As majority of the respondents visit the library daily to consult recommenced books, the library has to acquire more number of text books recommended
by the committee to meet the information demands of the respondents. Library staff must have concern as majority of the respondents prefer to take assistance from them; orientation programmes are to be conducted to make
best use of the library. Though most of the respondents expressed their satisfaction regard the facilities available the opinions of the dissatisfied users must also be taken into
consideration and prepare measures are to be taken to improve the situation
REFERENCES 1. Alexander, Abraham and Karishiddappa, C.R. “A Survey of Library Services. 2. Ali, Naushad, P.M. and Hasan Eshan, M.D. “The use of Electonic Services at IIT Library, Delhi: A Study of User’s Opinion”. IASLIC Bulletin 48. (2003): 71-82. 3. Baradol, A.K. Selective dissemination of information services in science libraries in Karnataka. New Delhi: Vikas, 1955. 172. 4. Kumar Krishna Reference Service. New Delhi: Vikas, 1996.1-2. 5. Lancaster, E W and Sandore, Beth. Technology and management in library and information services. London, Library Association. 2011. 6. Mount, Ellis. University science and engineering college libraries-Greenwood press, 1985. 7. Onadiran, G.T. and Onadiran, R.W. “Nigerian University Library Services: Student’s Opinion”. Journal of Library and Information Science 11. (1986):45-60. 8. Ranganthan, S.R. Reference Service. New Delhi: Vikas, 1981.40. 9. Rendered to Science Research Scholars by the Calicut University”. Luknow Librarian 18.1 (1986): 91-95. 10. Saravanan, T.K. “The Economic of Indian Engineering College Library”. Library Philosophy and Practice 4.2 (2002): 1
Response Branch wise Respondents Total (N=210) IT (N=66) EEE(N=75) ECE (N=69)
No % No % No % No %
Lecture method 54 81.8 69 92.0 56 81.2 179 85.2
Library tour 8 12.1 2 2.7 8 11.6 18 8.6
Library guides 4 6.1 4 5.3 5 7.2 13 6.2

VOLUME NO. 3 (2013), ISSUE NO. 08 (AUGUST) ISSN 2231-5756
INTERNATIONAL JOURNAL OF RESEARCH IN COMMERCE, IT & MANAGEMENT A Monthly Double-Blind Peer Reviewed (Refereed/Juried) Open Access International e-Journal - Included in the International Serial Directories
http://ijrcm.org.in/
159
REQUEST FOR FEEDBACK
Dear Readers
At the very outset, International Journal of Research in Commerce, IT and Management (IJRCM)
acknowledges & appreciates your efforts in showing interest in our present issue under your kind perusal.
I would like to request you to supply your critical comments and suggestions about the material published
in this issue as well as on the journal as a whole, on our E-mail i.e. [email protected] for further
improvements in the interest of research.
If you have any queries please feel free to contact us on our E-mail [email protected].
I am sure that your feedback and deliberations would make future issues better – a result of our joint
effort.
Looking forward an appropriate consideration.
With sincere regards
Thanking you profoundly
Academically yours
Sd/-
Co-ordinator

VOLUME NO. 3 (2013), ISSUE NO. 08 (AUGUST) ISSN 2231-5756
INTERNATIONAL JOURNAL OF RESEARCH IN COMMERCE, IT & MANAGEMENT A Monthly Double-Blind Peer Reviewed (Refereed/Juried) Open Access International e-Journal - Included in the International Serial Directories
http://ijrcm.org.in/
IV