VOLUM: 4 ISSUE: 6 YEAR: 2021 - DergiPark
239
VOLUM: 4 ISSUE: 6 YEAR: 2021
-
Upload
khangminh22 -
Category
Documents
-
view
1 -
download
0
Transcript of VOLUM: 4 ISSUE: 6 YEAR: 2021 - DergiPark

VOLUM: 4 ISSUE: 6 YEAR: 2021

HONORARY EDITOR
EDITOR-IN-CHIEF
EDITOR
ASSOCIATE EDITOR
ENGLISH LANGUAGE EDITOR
STATISTICS EDITOR
EDITORIAL BOARD
Osman GÜLERDepartment of General Surgery, School of Medicine, Kastamonu University,
Kastamonu, TURKEY
Aydın ÇİFCİDepartment of Internal Medicine, School of Medicine,
Kırıkkale University, Kırıkkale, TURKEY
Ercan YUVANÇDepartment of Urology, School of Medicine, Kırıkkale University,
Kırıkkale, TURKEY
Bekir UÇANDepartment of Endocrinology and Metabolism, Dışkapı Yıldırım Beyazıt
Training and Research Hospital, University of Health Sciences, Ankara, TURKEY
Yavuz BEYAZİTDepartment of Gastroenterology, School of Medicine, Çanakkale
Onsekiz Mart University, Çanakkale, TURKEY
Murat KEKİLLİDepartment of Gastroenterology, School of Medicine, Gazi
University, Ankara, TURKEY
Alpaslan TANOĞLUDepartment of Gastroenterology, Sancaktepe Şehit Prof. Dr. İlhan
Varank Training and Research Hospital, University of Health Sciences, İstanbul, TURKEY
Mustafa CİVELEKLERDepartment of Ophthalmology, Gülhane Training and Research Hospital,
Ankara, TURKEY
Oğuz EROĞLUDepartment of Emergency Medicine, School of Medicine, Kırıkkale
University, Kırıkkale, TURKEY
Ahsen CEYLANMedical Devices Technical Regulation Expert, Clinical Expert, UDEM,
Ankara, TURKEY
Ayşegül ALTUNKESERDepartment of Radiodiagnostic, Konya Training and Research
Hospital, Konya, TURKEY
Nilgün ALTUNTAŞDepartment of Neonatology, Ankara City Hospital, Yıldırım Beyazıt
University, Ankara, TURKEY
Nuray BAYAR MULUKDepartment of Ear Nose Throat, School of Medicine, Kırıkkale
University, Kırıkkale, TURKEY
Michele CASSANODepartment of Ear Nose Throat,
Foggia, ITALY
Can CEDİDİDepartment of Plastic, Reconstructif and Aesthetic Surgery
Bremen, GERMANY
Ela CÖMERTDepartment of Ear Nose Throat, School of Medicine, Kırıkkale
University, Kırıkkale, TURKEY
Kenan ÇADIRCIDepartment of Internal Medicine, Erzurum Region Training and
Research Hospital, Erzurum, TURKEY
Mustafa ÇAPRAZDepartment of Internal Medicine, School of Medicine, Amasya
University, Amasya, TURKEY
Demetrios DEMETRIADESDepartment of General and Trauma and Critical Care Surgery,
Los Angeles, USA
Mehmet Emin DEMİRDepartment of Nephrology, Gaziosmanpaşa Hospital, Yeni Yüzyıl
University, İstanbul, TURKEY

Bulut DEMİRELDepartment of Emergency Medicine, Royal Alexandra
Hospital, Paisley, Glasgow, UNITED KINGDOM
Süleyman GÖKMENDepartment of Food Engineering, School of Engineering, Karamanoğlu Mehmetbey University, Karaman, TURKEY
Zaim JATICDepartment of Family Medicine,
Sarajevo, BOSNIA-HERZEGOVINA
Muhammed KARADENİZDepartment of Cardiology, School of Medicine, Kırıkkale University,
Kırıkkale, TURKEY
Ranko MLADINADepartment of Ear Nose Throat, Zagrep,
CROATIA
Kaan OKYAYDepartment of Cardiology, Başkent University Ankara Hospital,
Ankara, TURKEY
Ebru OLGUNDepartment of Periodontology, School of Dentistry, Kırıkkale
University, Kırıkkale, TURKEY
Faruk PEHLİVANLIDepartment of General Surgery, School of Medicine, Kırıkkale
University, Kırıkkale, TURKEY
Ünsal SAVCIDepartment of Clinical Microbiology, Hitit University Erol Olçok
Training and Research Hospital, Çorum, TURKEY
Mehmet ŞAHİNDepartment of Romatology, School of Medicine, Süleyman Demirel
University, Isparta, TURKEY
Ziya ŞENCANDepartment of Ear Nose Throat, School of Medicine, Kırıkkale
University, Kırıkkale, TURKEY
Gökçe ŞİMŞEKDepartment of Ear Nose Throat, School of Medicine, Kırşehir Ahi
Evran University, Kırşehir, TURKEY
Yaşar TOPALDepartment of Pediatrics, School of Medicine, Muğla Sıtkı Koçman
University, Muğla, TURKEY
Vedat TOPSAKALDepartment of Ear Nose Throat,Antwerp,
BELGIUM
Ayça TÖREL ERGÜRDepartment of Pediatric Endocrinology, School of Medicine, Ufuk
University, Ankara, TURKEY
Emre VURALDepartment of Ear Nose Throat, Arkansas,
USA
Alpaslan TUZCUDepartment of Endocrinology, School of Medicine, Dicle University,
Diyarbakır, TURKEY
M. İlkin YERALDepartment of Gynecology and Obstetrics, School of Medicine,
Akdeniz University, Antalya, TURKEY
PUBLICATION BOARD
Fevzi ALTUNTAŞDepartment of Hematology, Dr. Abdurrahman Yurtaslan Ankara
Onkoloji Training and Research Hospital, Yıldırım Beyazıt University, Ankara, TURKEY
Bahadır CELEPDepartment of General Surgery and Gastroenterologic Surgery,
Viyana, AUSTRIA
Mustafa CESURDepartment of Endocrinology, Ankara Güven Hospital, Ankara,
TURKEY
Salih CESURDepartment of Infectious Diseases and Clinical Microbiology,
Ankara Training and Research Hospital, Ankara, TURKEY
Roger CHENDepartment of Endocrinology and Metabolism, Sydney,
AUSTRALIA
Aylin ÇAPRAZDepartment of Chest Diseases, School of Medicine, Amasya
University, Amasya, TURKEY
Ayşe ÇARLIOĞLUDepartment of Endocrinology, School of Medicine, Lokman Hekim
University, Ankara, TURKEY
Murat DOĞANDepartment of Internal Medicine, Hitit University Erol Olçok
Training and Research Hospital, Çorum, TURKEY
Meltem HENDEKDepartment of Periodontology, School of Dentistry, Kırıkkale
University, Kırıkkale, TURKEY
Hakan KAYADepartment of Medical Oncology Hematology,
Spokane, USA
Kadri YILDIZDepartment of Orthopedics and Traumatology, School of Medicine,
Kafkas University, Kars, TURKEY

FRANCHISE OWNER
DESIGN
ARTICLE SUBMISSION ADDRESS
CORRESPONDENCE ADDRESS
MediHealth Academy Publishing(www.medihealthacademy.com)
Fatih Şamil ULUDAĞ([email protected])
https://dergipark.org.tr/tr/journal/2316/submission/step/manuscript/new
MediHealth Academy PublishingEmniyet Mah., Yukarı Sk., 6/1, Yenimahalle, Ankara, Turkey
E-mail: [email protected] Phone: +90 312 349 77 77
Fatma NİŞANCI KILIÇDepartment of Nutrition and Dietetic, School of Health Sciences,
Kırıkkale University, Kırıkkale, TURKEY
Neven SKITARELICDepartment of Ear Nose Throat, Zadar,
CROATIA
Engin TUTKUNDepartment of Public Health, School of Medicine, Bozok University,
Yozgat, TURKEY
Özge VERGİLİDepartment of Physiotherapy, School of Health Sciences, Kırıkkale
University, Kırıkkale, TURKEY
Yücel YILMAZDepartment of Cardiology, Kayseri Training and Research Hospital,
Kayseri, TURKEY
Mehmet ZENGİNDepartment of Pathology, School of Medicine, Kırıkkale University,
Kırıkkale, TURKEY

EDITORIAL
Prof. Murat KEKİLLİ, MDEditor
Our dear readers,
We are proud to publish the last issue of our journal for 2021 with 36 articles. In this issue, there are 35 research articles, and 1 case reports. Although COVID-19 pandemic is still goes on, we are studying hard day by day. Our principal aim is to contribute international literature at an increasing scientific level. We would like to thank all authors for submitting articles contributing to both domestic and international literature with their comprehensive scientific content for publication in our journal. We hope that this issue will be useful to our readers.
Sincerely yours

CONTENTS
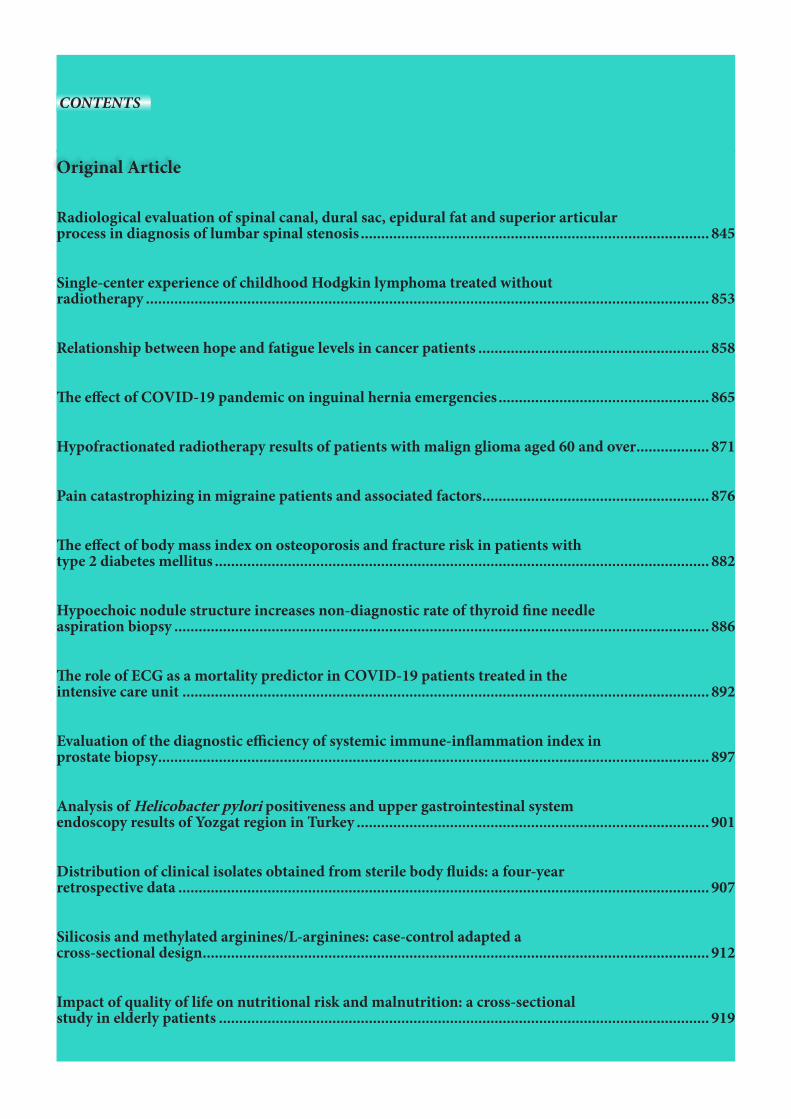
Original Article
Comparison of the effect of the intracameral lidocaine anesthesia and subconjunctival lidocaine anesthesia on the development of intraoperative floppy-iris syndrome in cataract surgery ............................................................................................... 761
Complications with moderate-to-severe COVID-19 during hospital admissions in patients with pneumonia ....................................................................................................................... 766
The relationship of sensorimotor and function with activities of daily living and disease specific parametres in patients with rheumatoid arthritis ....................................................... 784
Knowledge and attitude of physicians for the diagnosis and management of obstructive sleep apnea .......................................................................................................................... 790
First-line palliative chemotherapy clinical benefit is a key determinant of survival in metastatic uterine leiomyosarcoma ....................................................................................................... 795
Evaluation nutritional status and anthropometric parameters in patients with chronic hepatitis B.................................................................................................................................. 809
Clinical and prognostic evaluation of patients admitted to the COVID-19 pandemic unit of the emergency department ........................................................................................................ 835
Volumetric study of tracheal diverticulum: a retrospective analysis in computed tomography ............................................................................................................................................ 840
Is macrocytic erythrocyte a new prognostic parameter in critical COVID-19 disease? ...................... 828
Neutrophil-to-lymphocyte ratio in patients with white-coat hypertension ......................................... 824
Type D personality and self-esteem in conversion disorder: a case-control study ............................... 816
Dapsone can be a new treatment option for reducing the detrimental effect of priapism .................. 800
Aortic arch calcification is strongly associated with obstructive sleep apnea ...................................... 779
The spectrum of underlying diseases in children with autoimmune hemolytic anemia ..................... 772
CONTENTS
Original Article
Radiological evaluation of spinal canal, dural sac, epidural fat and superior articular process in diagnosis of lumbar spinal stenosis ...................................................................................... 845
The effect of body mass index on osteoporosis and fracture risk in patients with type 2 diabetes mellitus .......................................................................................................................... 882
Hypoechoic nodule structure increases non-diagnostic rate of thyroid fine needle aspiration biopsy .................................................................................................................................... 886
The role of ECG as a mortality predictor in COVID-19 patients treated in the intensive care unit .................................................................................................................................. 892
Evaluation of the diagnostic efficiency of systemic immune-inflammation index in prostate biopsy ........................................................................................................................................ 897
Analysis of Helicobacter pylori positiveness and upper gastrointestinal system endoscopy results of Yozgat region in Turkey ....................................................................................... 901
Distribution of clinical isolates obtained from sterile body fluids: a four-year retrospective data ................................................................................................................................... 907
Silicosis and methylated arginines/L-arginines: case-control adapted a cross-sectional design ............................................................................................................................. 912
Impact of quality of life on nutritional risk and malnutrition: a cross-sectional study in elderly patients ......................................................................................................................... 919
Pain catastrophizing in migraine patients and associated factors ........................................................ 876
Hypofractionated radiotherapy results of patients with malign glioma aged 60 and over .................. 871
The effect of COVID-19 pandemic on inguinal hernia emergencies .................................................... 865
Relationship between hope and fatigue levels in cancer patients ......................................................... 858
Single-center experience of childhood Hodgkin lymphoma treated without radiotherapy ........................................................................................................................................... 853

CONTENTS
Original Article
Case Report
A reliable source of information on botulinum toxin injection used in the treatment of spasticity: YouTube ............................................................................................................................ 927
Transplantation for ultra high-risk neuroblastoma patients: effect of tandem autologous stem cell transplantation ..................................................................................................... 943
The relationship between preoperative anxiety level, ABO blood types and birth outcomes in cesarean sections ............................................................................................................... 949
Is there a relationship between the liver SUVmax values in FDG-PET/CT imaging and non-alcoholic fatty liver disease score? ........................................................................................... 954
Evaluation of studies on molecular biology and genetics related to COVID-19 with data mining ............................................................................................................................................. 960
Interference of high dose intravenous vitamin C with blood glucose testing in a patient with COVID-19 infection ...................................................................................................................... 967
Investigation of the effect of watercress via nuclear factor-E2-related factor-2 pathway on 7,12-dimethylbenz[a]anthracene-induced oxidative damage in rat liver ....................................... 936
Evaluation of 25-hydroxy vitamin D levels in COVID-19 positive patients ......................................... 931

HEALTH SCIENCESMEDICINE
Original Article
J Health Sci Med 2021; 4(6): 761-765
This work is licensed under a Creative Commons Attribution 4.0 International License.
DOI: 10.32322/jhsm.919403
Received: 18.04.2021 Accepted: 09.09.2021Corresponding Author: Tayfun Şahin, [email protected]
Comparison of the effect of the intracameral lidocaine anesthesia and subconjunctival lidocaine anesthesia on the development of intraoperative floppy-iris syndrome in cataract surgery
Tayfun Şahin1, Sücattin İlker Kocamış21Hitit University, Faculty of Medicine, Department of Ophthalmology, Çorum, Turkey2Sakarya Yenikent State Hospital, Department of Ophthalmology, Sakarya, Turkey
Cite this article as: Şahin T, Kocamış Sİ. Comparison of the effect of the intracameral lidocaine anesthesia and subconjunctival lidocaine anesthesia on the development of intraoperative floppy-iris syndrome in cataract surgery. J Health Sci Med 2021; 4(6): 761-765.
ABSTRACTAim: To evaluate the effect of intracameral lidocaine anesthesia (ILA) and subconjunctival lidocaine anesthesia (SLA) administered during cataract surgery on the development and prevalence of intraoperative floppy iris syndrome (IFIS). Material and Method: The study involved the medical records of 86 cataract patients having no risk factors other than small pupil size for IFIS whom ILA and/or SLA were applied during phacoemulsification surgery. While 45 patients were administered intracameral lidocaine anesthesia ILA (1%), 41 patients in the other group were administered subconjunctival lidocaine anesthesia (SLA) (2%). Floppy iris syndrome findings such as iris billowing, iris incarceration in the wound site, or progressive myosis, if any, were recorded. The groups were compared in terms of the prevalence of IFIS development. Results: While IFIS ratio was 33.7% in the ILA group, it was 17.1% in the SLA group (p=0.084). Patients with smaller pupil diameter observed a higher IFIS rate ( when pupil diameter threshold value was 6.5 mm p=0.011 and 6 mm p=0.009).Conclusion: During cataract surgery, surgeons should care for the development of IFIS in patients with small pupil diameters. However, the effect of intracameral lidocaine use on the development of IFIS has not been determined.Keywords: Cataract, phacoemulsification, iris diseases, local anesthesia
Ana Metin-Alt bilgi Arası 5mm
Cite-Öz arası 5mm
Başlık-Yazarlar arası 12mmv
Yazar-Kurum arası 2,5 mmvcv
Kurum-Cite arası 5mm
Öz-Abstract arası 7,5mmvc
INTRODUCTION Cataract is the most common cause of blindness worldwide, and cataract surgery is one of the most frequently performed surgeries. Although many causes are counted in the etiology, the mechanisms of cataract formation are not fully elucidated. Today, the only treatment option is surgery. The preferred method in cataract surgery is phacoemulsification combined lens implantation due to reduced complication rates and high success rates (1). Patients could be administered general anesthesia or local anesthesia during cataract surgery. Local anesthesia could be in the form of topical, retrobulbar, peribulbar or sub-Tenon’s blocks. Topical anesthesia could be combined with subconjunctival anesthesia or intracameral anesthesia to increase patient comfort. Unpreserved lidocaine (1%) 0.3-0.5 mL could be used for this purpose in intracameral anesthesia (2,3). Applicability of intracameral anesthesia is easy. This very
commonly used anesthesia method yield good results with the right patient selection (4). Subconjunctival anesthesia could be applied in pterygium excision, conjunctiva surgeries, glaucoma and cataract surgeries (5).
Intraoperative floppy-iris syndrome (IFIS) is a condition associated with iris anomalies that might emerge during cataract surgery. Many factors are considered responsible for its etiology. IFIS could develop depending on the use of various systemic medications. The most important group among these is α-receptor antagonists (6). IFIS could emerge in the forms of floppy iris stroma billowing with the liquid flow, the tendency of iris tissue to be prolapsed from the wound site, and progressive intraoperative pupillary constriction. IFIS was first defined in patients who used tamsulosin (7). Other studies conducted later confirmed that tamsulosin could cause IFIS (8,9). It was also reported that apart from tamsulosin, IFIS

762
Şahin et al. Intracameral lidocaine floppy-iris syndrome J Health Sci Med 2021; 4(6): 761-765
could develop depending on α-1 blockers, 5-α reductase inhibitors, some herbal medicine (saw palmetto), and some antipsychotic medicine (10-14).
The complication ratio is reported to increase during surgery in the eyes with IFIS. Cases that developed IFIS could experience iris trauma due to unexpected iris prolapses and myosis, iris capture during phacoemulsification or irrigation, iridodialysis, hyphema, posterior capsule damage, and vitreous loss (15). Some studies report that complication ratios might not increase if the condition is predicted and patients receive operation from experienced surgeons (16). When IFIS develops during surgery, the use of intracameral epinephrine and iris hooks in tandem could enable to enlarge the pupil adequately and complete the surgery successfully (17). In addition, soft-shell viscoelastic technique, low liquid flow velocity, visco-adaptive viscoelastic use, pupil expansion rings, and staining the capsule with trypan blue are recommended when IFIS develops (18). This study aims to identify whether intracameral lidocaine has effects on the floppy iris syndrome that might develop during surgery.
MATERIAL AND METHOD The study was carried out with the permission of Hitit University Medical Faculty Non-interventional Clinical Researchs Ethics Committee (Date: 01.03.2019, Decision No: 2019-10). All procedures were carried out in accordance with the ethical rules and the principles of the Declaration of Helsinki. The case-control study conducted retrospectively (via file scan) included 86 cataract patients whom ILA and/or SLA were applied during phacoemulsification surgery in the eye clinic of our hospital and having no risk factors (patients who did not have a history of use of drugs such as tamsulosin, α-1 blockers, 5-α reductase inhibitors, saw palmetto and some antipsychotic medicine) other than small pupil size for IFIS. The patients systemic diseases (HT, DM, etc.) were noted. Patients' best-corrected visual acuity, biomicroscopic findings, intraocular pressure (IOP) measured with applanation tonometry, and fundus oculus examination findings were recorded. The patients’ cataracts were classified according to the Lens Opacities Classification System III (19). In our study, the potential of the two anesthesia types to perform IFIS was compared with each other.
The patients who had a history of prostate disease and therefore used α - adrenergic antagonist, who had over the 3.00 D refractive error, who had white cataract, who had grade ≥ 3 nuclear cataract and traumatic cataract (as the total surgery durations of these patients are long, they are at a higher risk of developing myosis during surgery), who had pseudoexfoliation, who had a uveitis findings history, and who had posterior synechia in iris were excluded from the study.
Preoperative dilatation of the patients was enhanced using 1% cyclopentolate, 2.5% phenylephrine and 1% tropicamide dripped 3 times in 10-minute intervals (triple dilatation is routinely performed in our clinic to ensure rapid and long-term dilatation). Preoperative pupil diameters were measured with a caliper with an operating microscope. Topical anesthesia of both groups was done with 0.5 % proparacaine. The operations were performed in the same center, by two experienced surgeons (TŞ,SIK). The surgeons randomly chosed the anesthesia type.
The patients involved in the study were divided into two groups. After the site-port of 45 patients was performed, they were administered 0.3-0.5 ml 1% unpreserved lidocaine in the anterior chamber. After the 41 patients in the second group were administered proparacaine, they were given 2% lidocaine 0.5 ml with a 27 gauge injector from the upper nasal to under conjunctiva. Subconjunctival anesthesia is performed as 0.5 ml lidocaine injection with a 27 gauge needle from 5 mm posterior of the limbus to superior conjunctiva . The type of anesthesia performed during surgery was chosen randomly. The wound site was pressed with cigarette sponge for 1 minute and waited to prevent leakage. Before the capsulorhexis, 3% sodium hyaluronate viscoelastic was used. The phacoemulsification procedure was done using the ‘stop and chop’ technique (Infinity Alcon System, Alcon). Peristaltic pump was used during the phacoemulsification procedure (to keep the pressure control system more stable). The following stages of surgery utilized 1.4% sodium hyaluronate viscoelastic. If any IFIS findings reported in the study conducted by Chang et al. (iris billowing, incarceration in the wound site, or progressive myosis) were seen, these patients were accepted to have developed IFIS (7). The stage when IFIS developed was also recorded. The cases that developed myosis during surgery were given 1 mL (1:1000, 1mg/mL) epinephrine. Despite this, the cases that continued to have myosis were administered iris retractor if necessary. No mydriatic method was applied until the IFIS was detected. If posterior capsule rupture or vitreous loss were experienced during surgery, these were also recorded.
Statistical method: Statistical analyses of the data obtained in the study was performed using SPSS (Version 22.0, SPSS Inc., Chicago, IL, USA) package program. In line with the data distribution, descriptive statistics were reported as median (minimum-maximum) and mean±standard deviation for the continuous variables. Descriptive statistics of the categorical data were presented as numbers and percentages (%). The normality distribution for the statistical test choice was assessed using the Shapiro-Wilk test. A comparison of
763
Şahin et al. Intracameral lidocaine floppy-iris syndromeJ Health Sci Med 2021; 4(6): 761-765
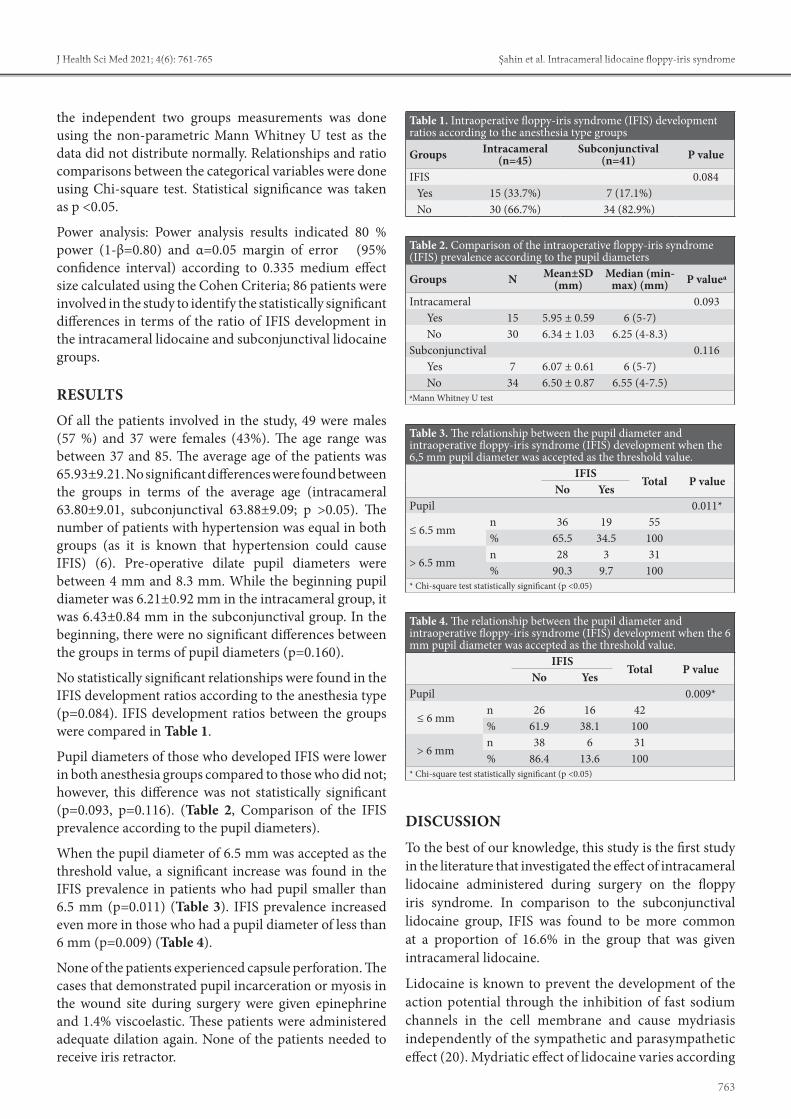
the independent two groups measurements was done using the non-parametric Mann Whitney U test as the data did not distribute normally. Relationships and ratio comparisons between the categorical variables were done using Chi-square test. Statistical significance was taken as p <0.05.
Power analysis: Power analysis results indicated 80 % power (1-β=0.80) and α=0.05 margin of error (95% confidence interval) according to 0.335 medium effect size calculated using the Cohen Criteria; 86 patients were involved in the study to identify the statistically significant differences in terms of the ratio of IFIS development in the intracameral lidocaine and subconjunctival lidocaine groups.
RESULTSOf all the patients involved in the study, 49 were males (57 %) and 37 were females (43%). The age range was between 37 and 85. The average age of the patients was 65.93±9.21. No significant differences were found between the groups in terms of the average age (intracameral 63.80±9.01, subconjunctival 63.88±9.09; p >0.05). The number of patients with hypertension was equal in both groups (as it is known that hypertension could cause IFIS) (6). Pre-operative dilate pupil diameters were between 4 mm and 8.3 mm. While the beginning pupil diameter was 6.21±0.92 mm in the intracameral group, it was 6.43±0.84 mm in the subconjunctival group. In the beginning, there were no significant differences between the groups in terms of pupil diameters (p=0.160).
No statistically significant relationships were found in the IFIS development ratios according to the anesthesia type (p=0.084). IFIS development ratios between the groups were compared in Table 1.
Pupil diameters of those who developed IFIS were lower in both anesthesia groups compared to those who did not; however, this difference was not statistically significant (p=0.093, p=0.116). (Table 2, Comparison of the IFIS prevalence according to the pupil diameters).
When the pupil diameter of 6.5 mm was accepted as the threshold value, a significant increase was found in the IFIS prevalence in patients who had pupil smaller than 6.5 mm (p=0.011) (Table 3). IFIS prevalence increased even more in those who had a pupil diameter of less than 6 mm (p=0.009) (Table 4).
None of the patients experienced capsule perforation. The cases that demonstrated pupil incarceration or myosis in the wound site during surgery were given epinephrine and 1.4% viscoelastic. These patients were administered adequate dilation again. None of the patients needed to receive iris retractor.
DISCUSSIONTo the best of our knowledge, this study is the first study in the literature that investigated the effect of intracameral lidocaine administered during surgery on the floppy iris syndrome. In comparison to the subconjunctival lidocaine group, IFIS was found to be more common at a proportion of 16.6% in the group that was given intracameral lidocaine.
Lidocaine is known to prevent the development of the action potential through the inhibition of fast sodium channels in the cell membrane and cause mydriasis independently of the sympathetic and parasympathetic effect (20). Mydriatic effect of lidocaine varies according
Table 1. Intraoperative floppy-iris syndrome (IFIS) development ratios according to the anesthesia type groups
Groups Intracameral (n=45)
Subconjunctival (n=41) P value
IFIS 0.084Yes 15 (33.7%) 7 (17.1%)No 30 (66.7%) 34 (82.9%)
Table 2. Comparison of the intraoperative floppy-iris syndrome (IFIS) prevalence according to the pupil diameters
Groups N Mean±SD(mm)
Median (min-max) (mm) P valuea
Intracameral 0.093Yes 15 5.95 ± 0.59 6 (5-7)No 30 6.34 ± 1.03 6.25 (4-8.3)
Subconjunctival 0.116Yes 7 6.07 ± 0.61 6 (5-7)No 34 6.50 ± 0.87 6.55 (4-7.5)
aMann Whitney U test
Table 3. The relationship between the pupil diameter and intraoperative floppy-iris syndrome (IFIS) development when the 6,5 mm pupil diameter was accepted as the threshold value.
IFISTotal P value
No YesPupil 0.011*
≤ 6.5 mmn 36 19 55% 65.5 34.5 100
> 6.5 mmn 28 3 31% 90.3 9.7 100
* Chi-square test statistically significant (p <0.05)
Table 4. The relationship between the pupil diameter and intraoperative floppy-iris syndrome (IFIS) development when the 6 mm pupil diameter was accepted as the threshold value.
IFISTotal P value
No YesPupil 0.009*
≤ 6 mmn 26 16 42% 61.9 38.1 100
> 6 mmn 38 6 31% 86.4 13.6 100
* Chi-square test statistically significant (p <0.05)

764
Şahin et al. Intracameral lidocaine floppy-iris syndrome J Health Sci Med 2021; 4(6): 761-765
to the way it is administered and the amount of injection (21). To prevent the IFIS development during surgery in patients who used tamsulosin, a study conducted before administered intracameral lidocaine- epinephrine to a group of patients and administered nothing in the anterior chamber to another group of patients. IFIS development ratio was 38.5% in the group that was administered lidocaine-epinephrine and 25.5% in the other group. Contrary to what was expected, IFIS was found to be higher in the group that was administered lidocaine – epinephrine. This finding was considered to result from the smaller beginning pupil diameter in the group that was administered lidocaine- epinephrine (22). Another study conducted with patients who used tamsulosin and received cataract surgery administered sub-Tenon’s lidocaine (2%) to one group and intracameral lidocaine (1%) to the other group. The group that was administered sub-Tenon’s lidocaine was found to develop IFIS at a proportion of 8.8%, while this ratio was 48.6% in the group administered intracameral lidocaine. It was concluded that this finding resulted from the longer effect of sub-Tenon’s lidocaine due to its accumulation around the eyeball and longer maintenance of mydriasis (23). Savino et al. (20) gave sub-Tenon’s ropivacaine to a group of patients who received strabismus surgery and sub-Tenon’s saline accompanied by general anesthesia to the other group. The group that was given sub-Tenon’s ropivacaine was found to develop mydriasis approximately 5 minutes later. This effect was found to occur as local anesthesia (ropivacaine) caused a blockage in ciliary ganglion and ciliary nerves. Lidocaine amount decreases in a short time in intracameral anesthesia due to high liquid flow in the anterior chamber and viscoelastic substance administration. Mydriatic effect of intracameral lidocaine is known to end within 10-15 minutes (24). We observed that IFIS findings were more common in patients who underwent intracameral anesthesia in our cataract surgeries. In order to understand whether there is a difference between anesthesia types, we excluded the factors (tamsulosin use, …) that may affect IFIS in our study. We think that the reason for intracameral lidocaine to cause IFIS could be explained with this possible mechanism: lidocaine given to the anterior chamber inhibits both circular and meridional fibers of iris, which decreases the parasympathetic system activities dominant in eyes and develops mydriasis. However, tonus of the iris decreases depending on the inhibition of two muscle groups, and iris becomes flask. In this case, the iris becomes more sensitive against fluid flow and manipulations in the anterior chamber, and floppy iris syndrome findings might occur. We thought that this might also be meaningful, but we could not obtain a meaningful result in our study.
In our study, we observed that the IFIS ratio increased as the pupil diameter decreased. However, the difference was not statistically significant. IFIS development was more common in pupil diameters of less than 6.5 mm, and the difference between them was significant. As to the pupil diameters of less than 6 mm, the prevalence of IFIS development was even more. Casuccio et al. (25) reported that a small pupil diameter was a good indicator of IFIS development. In their study that was conducted later, Chen et al. (22) detected that preoperative small pupil diameter (less than 6.5 mm was accepted as small) increased the probability of IFIS development during surgery. It was reported that IFIS might have developed because the iris surface area was more sensitive against the liquid flow in the anterior chamber as the pupil diameter gets smaller. Our study also confirmed that small pupil diameter is a risk factor for IFIS.
This study has some limitations. First, our study was retrospective. Secondly, before the study, a power analysis was performed for the number of patients to be involved in the study. However, we think that prospective studies to be conducted with a higher number of patients would yield more meaningful results.
CONCLUSIONWhile performing cataract surgery, patients with small pupil diameters should be careful about the development of IFIS. The effect of intramaral lidocaine use on IFIS is controversial. Future prospective studies to be conducted with a higher number of cases could be a guide on this issue.
ETHICAL DECLARATIONSEthics Committee Approval: The study was carried out with the permission of Hitit University Medical Faculty Non-interventional Clinical Researchs Ethics Committee (Date: 01.03.2019, Decision No: 2019-10).Informed Consent: Because the study was designed retrospectively, no written informed consent form was obtained from patients.Referee Evaluation Process: Externally peer-reviewed. Conflict of Interest Statement: The authors have no conflicts of interest to declare. Financial Disclosure: The authors declared that this study has received no financial support. Author Contributions: All of the authors declare that they have all participated in the design, execution, and analysis of the paper, and that they have approved the final version.

765
Şahin et al. Intracameral lidocaine floppy-iris syndromeJ Health Sci Med 2021; 4(6): 761-765
REFERENCES1. Yan W, Wang W, van Wijngaarden P, Mueller A, He M. Longitudinal
changes in global cataract surgery rate inequality and associations with socioeconomic indices. Clin Exp Ophthalmol 2019; 47: 453‐60.
2. Shah R. Anesthesia for cataract surgery: Recent trends. Oman J Ophthalmol 2010; 3: 107‐8.
3. Ezra DG, Allan BD. Topical anaesthesia alone versus topical anaesthesia with intracameral lidocaine for phacoemulsification. Cochrane Database Syst Rev 2007; CD005276.
4. Tan CS, Fam HB, Heng WJ, Lee HM, Saw SM, Au Eong KG. Analgesic effect of supplemental intracameral lidocaine during phacoemulsification under topical anaesthesia: a randomised controlled trial. Br J Ophthalmol 2011; 95: 837‐41.
5. Anderson CJ. Subconjunctival anesthesia in cataract surgery. J Cataract Refract Surg 1995; 21: 103‐5.
6. Neff KD, Sandoval HP, Fernández de Castro LE, Nowacki AS, Vroman DT, Solomon KDl. Factors associated with intraoperative floppy iris syndrome. Ophthalmology 2009; 116: 658‐63.
7. Chang DF, Campbell JR. Intraoperative floppy iris syndrome associated with tamsulosin. J Cataract Refract Surg 2005; 31: 664‐73.
8. Cheung CM, Awan MA, Sandramouli S. Prevalence and clinical findings of tamsulosin-associated intraoperative floppy-iris syndrome. J Cataract Refract Surg 2006; 32: 1336‐9.
9. Takmaz T, Can I. Clinical features, complications, and incidence of intraoperative floppy iris syndrome in patients taking tamsulosin. Eur J Ophthalmol 2007; 17: 909‐13.
10. Oshika T, Ohashi Y, Inamura M, et al. Incidence of Intraoperative Floppy Iris Syndrome in Patients on Either Systemic or Topical α1-Adrenoceptor Antagonist. Am J Ophthalmol 2007; 143: 150-1.
11. Issa SA, Dagres E. Intraoperative floppy-iris syndrome and finasteride intake. J Cataract Refract Surg 2007; 33: 2142-3.
12. Goepel M, Hecker U, Krege S, Rübben H, Michel MC. Saw palmetto extracts potently and noncompetitively inhibit human alpha1-adrenoceptors in vitro. Prostate 1999; 38: 208-15.
13. Ünal M, Yücel İ, Tenlik A. Intraoperative floppy-iris syndrome associated with chronic use of chlorpromazine. Eye 2007; 21: 1241-2.
14. Pringle E, Packard R. Antipsychotic agent as an etiologic agent of IFIS. J Cataract Refract Surg 2005; 31: 2240-1.
15. Chang DF, Braga-Mele R, Mamalis N, et al. ASCRS Cataract Clinical Committee. ASCRS White Paper: Clinical review of intraoperative floppy-iris syndrome. J Cataract Refract Surg 2008; 34: 2153-62.
16. Chang DF, Osher RH, Wang L, Koch DD. Prospective multicenter evaluation of cataract surgery in patients taking tamsulosin (Flomax). Ophthalmology 2007; 114: 957-64.
17. Manvikar S, Allen D. Cataract surgery management in patients taking tamsulosin. J Cataract Refract Surg 2006; 32: 1611-4.
18. Goldman JM, Karp CL. Adjunct devices for managing challenging cases in cataract surgery: capsular staining and ophthalmic viscosurgical devices. Curr Opin Ophthalmol 2007; 18: 52-7.
19. Chylack LT, Wolfe JK, Singer DM, et al. The lens opacities classification system III. the longitudinal study of cataract study group. Arch Ophthalmol 1993; 111: 831-6.
20. Savino G, Perrotta V, Colucci D, et al. Mydriasis induced by sub-Tenon’s ropivacaine injection in patients undergoing strabismus surgery. J AAPOS 2010; 14: 124-6.
21. Lincoff H, Zweifach P, Brodie S, et al. Intraocular injection of lidocaine. Ophthalmology 1985; 92: 1587-91.
22. Chen AA, Kelly JP, Bhandari A, Wu MC. Pharmacologic prophylaxis and risk factors for intraoperative floppy-iris syndrome in phacoemulsification performed by resident physicians. J Cataract Refract Surg 2010; 36: 898-905.
23. Klysik A, Korzycka D. Sub-Tenon injection of 2% lidocaine prevents intra-operative floppy iris syndrome (IFIS) in male patients taking oral α-adrenergic antagonists. Acta Ophthalmol 2014; 92: 535-40.
24. Oberg TJ, Sikder S, Jorgensen AJ, Mifflin MD. Topical-intracameral anesthesia without preoperative mydriatic agents for Descemet-stripping automated endothelial keratoplasty and phacoemulsification cataract surgery with intraocular lens implantation. J Cataract Refract Surg 2012; 38: 384-6.
25. Casuccio A, Cillino G, Pavone C, Spitale E, Cillino S. Pharmacologic pupil dilation as a predictive test for the risk for intraoperative floppy-iris syndrome. J Cataract Refract Surg 2011; 37: 1447–54.

HEALTH SCIENCESMEDICINE
Original Article
J Health Sci Med 2021; 4(6): 766-771
This work is licensed under a Creative Commons Attribution 4.0 International License.
DOI: 10.32322/jhsm.946871
Received: 02.06.2021 Accepted: 04.07.2021Corresponding Author: Tuğçe Şahin Özdemirel, [email protected]
Complications with moderate-to-severe COVID-19 during hospital admissions in patients with pneumonia
Tuğçe Şahin Özdemirel1, Esma Sevil Akkurt1, Özlem Ertan1, Mehmet Enes Gökler2, Berna Akıncı Özyürek1
1Health Sciences University, Ankara Atatürk Chest Diseases and Chest Surgery Training and Research Hospital, Department of Chest Disease, Ankara, Turkey2Yıldırım Beyazıt University, Faculty of Medicine, Department of Public Health, Ankara, Turkey
Cite this article as: Şahin Özdemirel T, Akkurt ES, Ertan Ö, Gökler ME, Akıncı Özyürek B. Complications with moderate-to-severe COVID-19 during hospital admissions in patients with pneumonia. J Health Sci Med 2021; 4(6): 766-771.
ABSTRACTIntroduction: Coronavirus disease 2019 (COVID-19), caused by SARS-CoV-2 (severe acute respiratory syndrome coronavirus 2) is an infectious disease that has caused significant mortality and morbidity worldwide. COVID-19 is known to cause complications, such as myocardial damage, acute coronary syndrome, deep vein thrombosis, pulmonary embolism, arrhythmia, heart failure, acute ischemic stroke, liver damage, cytokine storms, ischemia-reperfusion damage and side effects of drug treatments. In our study, we aimed to evaluate the complications that developed during hospitalizations in patients with moderate-to-severe COVID-19 related pneumonia who were hospitalized in our COVID-19 service. Material and Method: This study included patients with moderate-to-severe COVID-19 pneumonia with a positive reverse transcriptase polymerase chain reaction (RT-PCR) test who were treated in our COVID-19 service between November 2020 and January 2021. Their demographic characteristics, treatment regimens, baseline laboratory values and complications during their hospitalization were retrospectively recorded.Results: The study group had a mean age of 62.92± 14.60 years and 40.6% (n= 55) were female. Approximately 35.3% (n= 48) of the patients developed complications due to COVID-19 during their follow-up period. Of the patients with complications, 63.8% (n: 30) were male, most common complications were elevated liver enzymes (47.9%) and pulmonary thromboembolism (20.8%). Of those patients with complications, the most common comorbidities were hypertension (40.4% [n= 19]), diabetes mellitus (25.5% [n=12]) and cardiovascular disease (23.4% [n=11]). There were no significant relationships between the presence of complications and age, sex or comorbid diseases (p>0.05 for each). Conclusion: There are more underlying conditions, such as hypertension, diabetes mellitus, cardiovascular disease, chronic lung disease in hospitalized patients with moderate-to-severe pneumonia compared to outpatients with COVID-19 pneumonia. Complications develop, especially in the management of COVID-19 pneumonia, which affect the treatment process and patient mobilization.
Keywords: COVID-19, pneumonia, complication
Ana Metin-Alt bilgi Arası 5mm
Cite-Öz arası 5mm
Başlık-Yazarlar arası 12mm
Yazar-Kurum arası 2,5 mm
Kurum-Cite arası 5mmv
Öz-Abstract arası 7,5mm
INTRODUCTIONCoronavirus disease 2019 (COVID-19), caused by SARS-CoV-2 (severe acute respiratory syndrome coronavirus 2), began in China at the end of 2019. COVID-19 is an infectious disease that has caused significant mortality and morbidity worldwide. Although it progresses with mild symptoms in most patients, serious complications, such as a cytokine storm, multiple organ failure, septic shock and acute respiratory distress syndrome (ARDS) have been observed in some cases (1-3).
COVID-19 is known to cause complications, such as myocardial damage, myocarditis, acute coronary syndrome, deep vein thrombosis, pulmonary embolism, arrhythmia, heart failure, acute ischemic stroke and cardiogenic shock (4,5). In addition, it has been shown to cause liver damage by systemic inflammatory responses, cytokine storms, ischemia-reperfusion damage and side effects of drug treatments. The liver damage may also stem from an underlying liver disease or by direct actions

767
Şahin Özdemirel et al. COVID-19 pneumonia and complications J Health Sci Med 2021; 4(6): 766-771
on liver cells via angiotensin converting enzyme (ACE) receptors (6). Furthermore, the risk of a spontaneous pneumothorax is increased in patients with COVID-19, with an average incidence of approximately 1% (7,8).
In our study, we aimed to evaluate the complications that developed during hospitalizations in patients with moderate-to-severe COVID-19related pneumonia who were hospitalized and treated in our COVID-19 service.
MATERIAL AND METHODThe study was conducted in compliance with the criteria of the Helsinki Declaration. It was approved by the Ethics Committee of the University of Health Sciences, Kecioren Training and Research Hospital (Date: 2021, Decision No: 2366). Written informed consent was obtained from all participants who participated in this study. Included in this study were patients with moderate-to-severe COVID-19 pneumonia with a positive reverse transcriptase polymerase chain reaction (RT-PCR) test who were treated in our COVID-19 service between November 2020 and January 2021. We followed the Republic of Turkey Ministry of Health COVID-19 Diagnosis and Treatment Guidelines to classify our patients as having moderate-to-severe pneumonia. This included patients with tachypnoea (respiratory rate> 30/min), poor prognostic criteria in blood tests and oxygen saturation levels < 90% in room air or at admission. Other criteria included a blood lymphocyte count < 800/µl; C-reactive protein (CRP)>40 mg/L; ferritin>500 ng/ml; or D-dimer >1.000 ng/ml. Additionally, patients with bilateral pneumonia, as determined with a chest X-ray or a thoracic computed tomography, were recorded as cases with moderate-to-severe pneumonia. Demographic characteristics, treatment regimens, baseline laboratory values and complications during their hospitalization of all patients were recorded retrospectively. Among the complications were elevations in the liver enzymes alanine aminotransferase (ALT) and aspartate aminotransferase (AST) that exceeded the upper limits of the normal values.
Statistical AnalysisData were evaluated using the IBM-SPSS (version 20.0) statistical package. For descriptive statistics, the following values were used: number, percentage, mean, standard deviation (SD), median and interquartile range (IQR: 25–75). Chi-square tests were used to compare categorical data, while Mann-Whitney U tests were used to compare continuous data. A logistic regression model was created with variables found to be significant in the bivariate analysis (p < 0.05). Binary logistic regression analyses (were used in the model analysis. For statistical significance, p < 0.05 was accepted.
RESULTSThe study group had a mean age of 62.92±14.60 years and 40.6% (n=55) were female.. Approximately 35.3% (n=48) of the patients developed complications due to COVID-19 during their follow-up period. Of the patients with complications, the two most common complications were elevated liver enzymes (47.9%) and pulmonary thromboembolism (20.8%) in 63.8% (n=30) of the patients (Table 1). Of those patients with complications, the most common comorbidities were hypertension (40.4% [n=19]), diabetes mellitus (25.5% [n=12]) and cardiovascular disease (23.4% [n=11]). While 14.9% (n=7) of those with complications were diagnosed with chronic obstructive pulmonary disease (COPD), 10.6% (n=5) were diagnosed with asthma. There were no significant relationships between the presence of complications and age, sex or comorbid diseases (p>0.05 for each). Table 2 shows the sociodemographic characteristics of the study group based on the presence of complications.
Table 1. Distribution of complications seen in the study groupComplication n %Acute artery thombosis 1 2.1Acute renal failure 2 4.2Bradicardy 1 2.1Deep vein thrombosis 1 2.1Elevations of liver enzymes 23 47.9Hydrocephalia 1 2.1Pneumotorax 4 8.4Pulmonary thromboembolism 10 20.8Otitis media 3 6.3Cerebrovascular event 1 2.1New diabetes mellitus 1 2.1Total 48 100.0
Table 2. Sociodemographic characteristics of the study group according to the presence of complications
ComplicationpNo Yes
n % n %
Gender Male 49 57.0 30 63.8 0.442Female 37 43.0 18 36.2
Age <65 Age 42 48.8 24 51.1 0.806≥65 Age 44 51.2 23 48.9
COPD No 72 83.7 40 85.1 0.834Yes 14 16.3 7 14.9
Asthma No 78 90.7 42 89.4 0.804Yes 8 9.3 5 10.6
Hypertension No 42 48.8 28 59.6 0.236Yes 44 51.2 19 40.4Diabetes mellitus
No 53 61.6 35 74.5 0.135Yes 33 38.4 12 25.5
Malignancy No 74 86.0 43 91.5 0.356Yes 12 14.0 4 8.5
Hypotyroid No 80 93.0 45 95.7 0.528Yes 6 7.0 2 4.3Romatological disease
No 82 95.3 44 93.6 0.669Yes 4 4.7 3 6.4Cardiovascular disease
No 63 73.3 36 76.6 0.673Yes 23 26.7 11 23.4

768
Şahin Özdemirel et al. COVID-19 pneumonia and complicationsJ Health Sci Med 2021; 4(6): 766-771
Although 38.3% (n=18) of the patients who experienced complications had previously been admitted to intensive care, 34% (n=16) were on pulse steroids. Pulse steroid use and the presence of desaturation were more frequent in those with complications (p=0.012, p=0.009, respectively).
In our study, we observed that 129 of 134 patients were given low molecular weight heparin (LMWH) treatment as venous thromboembolism prophylaxis. No relationship was found between the use of LMWH, acetylsalicylic acid (ASA), colchicine, ground glass in radiological imaging, the presence and extent of consolidation and the development of complications (p > 0.05 for each). Table 3 shows the need for intensive care, drug use and radiological characteristics of the study group based on the presence of complications.
In the group with complications, the length of stay was significantly longer than in the group without complications (p=0.001). White blood cells (WBC), lymphocytes, platelets (PLT), albumin, lactate dehydrogenase (LDH), CRP, troponin, ferritin, D-dimer, pro-brain natriuretic peptide (pro-BNP) and haemoglobin A1c (HgA1c) values were evaluated according to the presence of complications in the study community. There was no correlation between the presence of complications and these parameters (p>0.05 in each case). Table 4 shows the age, duration of hospital stay and laboratory values of the sample group based on the occurrence of complications.
The length of hospital stay (OR: 1.066, 95% CI: 1.004–1.132) was a risk factor for the existence of complications when the significant variables were analysed according to the presence of complications in the logistic regression analysis (Table 5).
Table 3. Intensive care need, drug use and radiological characteristics of the study group according to the presence of complications
ComplicationpNo Yes
n n n n
ICU No 56 65.1 29 61.7 0.695Yes 30 34.9 18 38.3Use of pulse steroid
No 73 84.9 31 66.0 0.012Yes 13 15.1 16 34.0
Desaturation No 24 27.9 4 8.5 0.009Yes 62 72.1 43 91.5
LMWH No 3 3.5 1 2.1 0.661Yes 83 96.5 46 97.9Acetylsalicilic acid
No 59 68.6 31 66.0 0.755Yes 27 31.4 16 34.0
Colchicine No 72 83.7 33 70.2 0.068Yes 14 16.3 14 29.8Ground glass opacity
No 7 8.1 3 6.4 0.713Yes 79 91.9 44 93.6
Consolidation No 32 37.2 11 23.4 0.104Yes 54 62.8 36 76.6Radiological infiltration
<%50 54 62.8 22 46.8 0.075>50 32 37.2 25 53.2
Final Alive 77 89.5 42 89.4 0.975Exitus 9 10.5 5 10.6LMWH: Low molecular weight heparin. ICU: Intensive care unit
Table 4. Age, length of hospital stay and laboratory values of the study group according to the presence of complications Complication
pNo Yesmedian IQR 25 IQR 75 median IQR 25 IQR 75
Age 65.0 55.0 75.0 64.0 53.0 73.0 0.675Length of hospital stay 9.0 6.0 14.0 14.0 8.0 19.0 0.001Length of ICU stay 6.0 2.0 9.0 9.0 5.0 14.0 0.083WBC 7595.0 5680.0 10620.0 8465.0 6120.0 11980.0 0.234Lymphocyte 1015.0 690.0 1780.0 955.0 700.0 1420.0 0.599Lymphocyte % 16.1 8.4 24.6 12.2 7.8 18.7 0.099Platelet 239.0 186.0 301.0 245.5 190.0 330.0 0.474Albumin 33.6 29.0 37.5 31.6 29.8 34.7 0.333LDH 295.5 217.0 423.5 342.0 280.0 487.0 0.106CRP 86.5 28.0 145.0 99.9 47.0 186.8 0.166Troponin 5.9 3.2 17.3 7.7 4.1 20.6 0.413Ferritin 226.5 91.8 555.0 368.1 220.2 589.4 0.085D-dimer .8 .4 1.5 1.0 .6 2.7 0.080Pro-BNP 65.9 35.9 133.0 58.6 30.9 198.8 0.904HgA1C 7.0 5.8 9.7 6.9 6.4 7.9 0.850Number of lung lobes affected 4.0 3.0 5.0 5.0 3.0 5.0 0.079LDH: Lactate dehydrogenase. WBC: White blood cells. pro-BNP:pro-brain natriuretic peptide. HgA1c: Haemoglobin A1c. CRP: C-reactive protein
Table 5. Risk factors determined according to the presence of complications in logistic regression analysis β S.E. p OR %95 CI
The length of hospital stay 0.064 0.031 0.036 1.066 1.004-1.132Use of pulse steroid 0.298 0.509 0.558 1.347 0.497-3.656Desaturation 0.985 0.642 0.125 2.678 0.761-9.421

769
Şahin Özdemirel et al. COVID-19 pneumonia and complications J Health Sci Med 2021; 4(6): 766-771
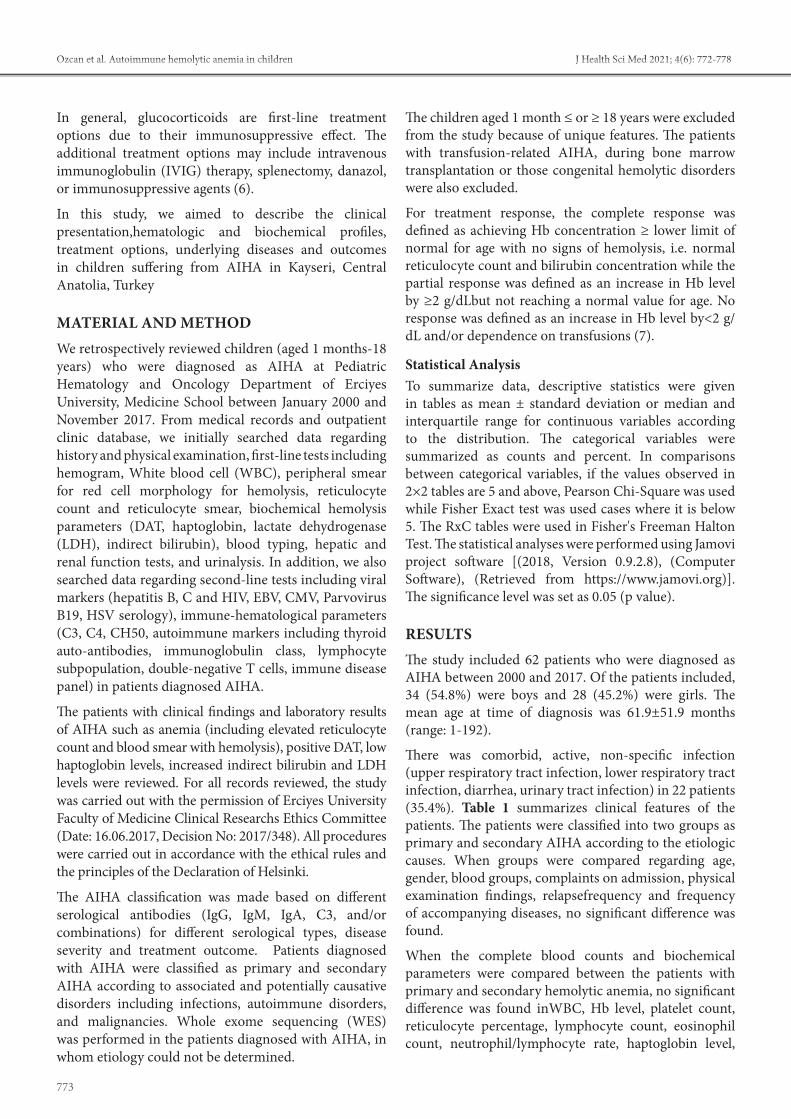
DISCUSSIONIn our study, 134 patients who were RT-PCR positive, had moderate-to-severe COVID-19 pneumonia and were hospitalized between November 2020 and January 2021 were analysed retrospectively. The patients were divided into two groups: those with complications and those without complications. Males comprised 59.3% of our hospitalized COVID-19 patients and 63.8% (n=30) of the patients who developed complications. Previous studies have shown that men experience a more severe disease and have a higher mortality rate compared to women (9). Higher rates of comorbidities, such as hypertension (HT) and diabetes mellitus (DM), are also observed in patients hospitalized for severe disease (1). The most common comorbidities in our study were HT and DM. However, no significant effects of comorbidities on the development of complications were found. Lymphopenia is seen with COVID-19 as in other viral infections. The severity of lymphopenia is related to the severity of the disease and is effective in the decision of hospitalization (7,10). In our study, lymphopenia was present in most of the patients, but no significant relationship was found between this condition and the development of complications.
Moderate liver enzyme elevations (especially AST and ALT) are common in patients with COVID-19. These may be associated with severe disease and increased inflammation, but they generally do not result in liver dysfunction; thus, no liver-directed therapy is required (11). Liver enzyme levels vary between 4%–33% in patients with COVID-19; however, this rate has reached 39% in some studies (12-14). In our study, liver enzyme elevations were observed in 47 patients (47.9% of patients with complications, 35.3% of all patients). The most frequently reported adverse events related to Favipiravir use in clinical studies are increased serum uric acid levels, diarrhoea, decreased neutrophil counts and liver enzyme elevations. In light of these findings, it was difficult to determine if the increases in liver enzymes in our patients were due to the medication or to the moderate-to-severe COVID-19 pneumonia. In patients with COVID-19, pulmonary thromboembolisms occur at a rate of 10%–28%, with the average age of onset being 57–61 years (15,16). In a study by Bompard et al. (17), the cumulative rate for thromboembolism was 24% and 50% in COVID-19 patients followed in intensive care.
D-dimer levels are significantly higher in a group with thromboembolisms (17). In another study, D-dimer values were associated with acute thrombosis, and generally>1 IU was found to be significant (18,19). In two separate studies evaluating 314 and 124 patients with COVID-19 who were hospitalized outside the intensive care unit, the venous thromboembolism
(VTE) rate was 6.4% and 3%, respectively (20,21). In our study, the pulmonary thromboembolism (PTE) rate was 7.5% for all patients and 20.8% in the group with complications. D-dimer values were also higher in the group with complications, but not significantly higher, and a threshold D-dimer value could not be defined for determining the risk of PTE. This is due to the fact that all of our patients were hospitalized with a diagnosis of moderate-to-severe pneumonia. This suggests that high D-dimer levels (> 0.5 IU) may indicate an increased risk of PTE, as well as be associated with the severity of pneumonia. We think our PTE rate was lower than that in the literature since all our patients used prophylactic LMWH.
Studies have shown that COVID-19 has a 1% rate of causing a spontaneous pneumothorax. There are also reports that it is seen less frequently (7,8). The mechanism of a pneumothorax in COVID-19 infections remains unclear. Risk factors for a spontaneous pneumothorax include male sex, slim and tall body build, smoking, trauma and infection. In our study, the four patients who developed a pneumothorax were male. Parenchymal lesions, such as cysts and bullae, were not found in the first thoracic CT images. In the literature, a case with a pneumothorax due to a giant bulla (22) and a case with cystic lung lesions causing a pneumothorax, both resulting from of a COVID-19 infection, were published by Liu K et al. (23). In a study with 3,000 patients, Massa Zantah et al. (8) reported the presence of lymphopenia and increased inflammatory markers, such as CRP, LDH, ferritin, D-dimer and interleukin 6 (IL-6) in almost all patients who developed a spontaneous pneumothorax. When a pneumothorax developed in our patients, inflammatory parameters were high and consistent with the literature, but no significant relationships were found with the development of complications.
In COVID-19, as in other viral infections, there is a risk of infectious particles spreading from the nasopharynx to the middle ear. Viral infections may lead to otitis media either as a single middle ear pathogen or by causing a eustachian tube dysfunction. There have been several cases with otitis media detected during the course of COVID-19 (24,25). In our study, otitis media was detected in three patients (2.2% of all patients and 6.3% of those with complications).
Mao et al. (26) reported that cerebrovascular disease develops in 5.7% of patients with severe infections. In another study by Li Y et al. (27), the incidence of cerebrovascular events in patients with COVID-19 was approximately 5% with a mean age of 71.6 years. In our study, this rate was 2.1% in patients with complications, and 0.7% in the entire study group.

770
Şahin Özdemirel et al. COVID-19 pneumonia and complicationsJ Health Sci Med 2021; 4(6): 766-771
The duration of hospital stay was higher in the group with complications than in the group without complications. This suggests that, with more immobilization, the higher the risk of complications.
The limitations of our study include the limited number of patients in our study, the evaluation of only inpatients, inadequate follow up after discharge and the retrospective nature of the study.
CONCLUSIONThe main points in our study are: The most common complications in our inpatients with covid 19 pneumonia; liver enzyme elevation and pulmonary thromboembolism were consistent with the literature. It was observed that the most common underlying diseases in the development of complications in COVID-19 patients were hypertension, diabetes mellitus and cardiovascular diseases, again in line with the literature. The duration of hospital stay was higher in the group with complications compared to the group without complications. It showed that we should be careful in terms of complication development as the immobilization time gets longer.
There are more underlying conditions, such as hypertension, diabetes mellitus, cardiovascular disease, chronic kidney disease or chronic lung disease in hospitalized patients with moderate-to-severe pneumonia compared to outpatients with COVID-19 pneumonia. Hypertension is the most common underlying condition in patients with moderate-to-severe COVID-19 pneumonia. Complications develop, especially in the management of COVID-19 pneumonia, which affect the treatment process and patient mobilization. Therefore, it is important to perform laboratory follow up in the clinical follow up and to be especially careful in terms of the development of coagulopathy, pneumothorax and neurological events.
ETHICAL DECLARATIONSEthics Committee Approval: It was approved by the Ethics Committee of the University of Health Sciences, Kecioren Training and Research Hospital (Date: 2021, Decision No: 2366).Informed Consent: Written informed consent was obtained from all participants who participated in this study. Referee Evaluation Process: Externally peer-reviewed. Conflict of Interest Statement: The authors have no conflicts of interest to declare. Financial Disclosure: The authors declared that this study has received no financial support.
Author Contributions: All of the authors declare that they have all participated in the design, execution, and analysis of the paper, and that they have approved the final version.
REFERENCES1. Zhou F, Yu T, Du R, et al. Clinical course and risk factors for
mortality of adult inpatients with CO- VID-19 in Wuhan, China: a retrospective cohort study. Lancet 2020; 395: 1054-62.
2. Du Toit A. Outbreak of a novel coronavirus. Nat Rev Microbiol 2020; 18: 123.
3. European Centre for Disease Prevention and Control. Q & A on COVID-19: Basic facts. Available from: https://www. ecdc.europa.eu/en/covid-19/facts/questions-answersbasic-facts Accessed date: 18 Sept 2020.
4. Mahajan P, Dass B, Radhakrishnan N, McCullough PA. COVID-19-Associated Systemic Thromboembolism: A Case Report and Review of the Literature. Cardiorenal Med 2020; 10: 462-9.
5. Boukhris M, Hillani A, Moroni F, et al. Cardiovascular Implications of the COVID-19 Pandemic: A Global Perspective. Can J Cardiol 2020; 36: 1068-80.
6. Tian D, Ye Q. Hepatic complications of COVID-19 and its treatment. J Med Virol 2020; 92: 1818-24.
7. Chen N, Zhou M, Dong X, et al. Epidemiological and clinical characteristics of 99 cases of 2019 novel coronavirus pneumonia in Wuhan, China: a descriptive study. Lancet 2020; 395: 507-13.
8. Zantah M, Dominguez Castillo E, Townsend R, Dikengil F, Criner GJ. Pneumothorax in COVID-19 disease- incidence and clinical characteristics. Respir Res 2020; 21: 236.
9. Jin JM, Bai P, He W, et al. Gender differences in patients with COVID-19: focus on severity and mortality. Front Public Health 2020; 8: 152.
10. Qiu P, Zhou Y, Wang F, et al. Clinical characteristics, laboratory outcome characteristics, comorbidities, and complications of related COVID-19 deceased: a systematic review and meta-analysis. Aging Clin Exp Res 2020; 32: 1869-78.
11. Bertolini A, Van de Peppel IP, Bodewes FAJA, Moshage H, Fantin A, Farinati F. Abnormal liver function tests in patients with COVID-19: Relevance and Potential Pathogenesis. Hepatology 2020; 72: 1864-72.
12. Zhang Y, Zheng L, Liu L, Zhao M, Xiao J, Zhao Q. Liver impairment in COVID-19 patients: A retrospective analysis of 115 cases from a single centre in Wuhan city, China. Liver Int 2020; 40: 2095-103.
13. Cai Q, Huang D, Yu H, et al. COVID-19: Abnormal liver function tests. J Hepatol 2020; 73: 566-74.
14. Fan Z, Chen L, Li J, et al. Clinical features of COVID-19-related liver damage. Clin Gastroenterol Hepatol 2020; 18: 1561-6.
15. Porfidia A, Valeriani E, Pola R, Porreca E, Rutjes A, Di Nisio M. Venous thromboembolism in patients with COVID-19: Systematic review and meta-analysis. Thrombosis research 2020; 196: 67-74.
16. Boonyawat K, Chantrathammachart P, Numthavaj P, et al. Incidence of thromboembolism in patients with COVID-19: a systematic review and meta-analysis. Thrombosis Journal 2020: 23; 18: 34.
17. Bompard F, Monnier H, Saab I et al. Pulmonary embolism in patients with COVID-19 pneumonia. Eur Respir J. 2020; 56: 2001365.
18. Xu Y, Qian Y, Gu Q, et al. Relationship between d-dimer concentration and inflammatory factors or organ function in patients with coronavirus disease 2019. Zhonghua Wei Zhong Bing Ji Jiu Yi Xue 2020; 32: 559–63.
19. Li Y, Zhao K, Wei H, et al. Dynamic relationship between d-dimer and COVID-19 severity. Br J Haematol 2020; 190: e24–7.
771
Şahin Özdemirel et al. COVID-19 pneumonia and complications J Health Sci Med 2021; 4(6): 766-771
20. Middeldorp S, Coppens M, van Haaps TF, et al. Incidence of venous thromboembolism in hospitalized patients with COVID-19. J Thromb Haemost. 2020 Aug;18(8):1995-2002.
21. Lodigiani C, Iapichino G, Carenzo L, et al. Venous and arterial thromboembolic complications in COVID-19 patients admitted to an academic hospital in Milan, Italy. Thromb Res 2020; 191: 9.
22. Sun R, Liu H, Wang X. Mediastinal emphysema, Giant Bulla and pneumothorax developed during the course of COVID-19 pneumonia. Korean J Radiol 2020; 21: 541-44.
23. Liu K, Zeng Y, Xie P, et al. COVID-19 with cystic features on computed tomography: A case report. Medicine (Baltimore) 2020; 99: e20175.
24. Mohan S, Workman A, Barshak M, Welling DB, Abdul-Aziz D. Considerations in Management of Acute Otitis Media in the COVID-19 Era. Ann Otol Rhinol Laryngol 2021; 130: 520-27.
25. Fidan V. New type of corona virus induced acute otitis media in adult. Am J Otolaryngol 2020; 41: 102487.
26. Mao L, Jin H, Wang M, et al. Neurologic manifestations of hospitalized patients with coronavirus disease 2019 in Wuhan, China. JAMA Neurol 2020; 77: 683-90.
27. Li Y, Li M, Wang M, et al. Acute cerebrovascular disease following COVID-19: a single center, retrospective, observational study. Stroke Vasc Neurol 2020; 5: 279-84.

HEALTH SCIENCESMEDICINE
Original Article
J Health Sci Med 2021; 4(6): 772-778
This work is licensed under a Creative Commons Attribution 4.0 International License.
DOI: 10.32322/jhsm.972723
Received: 20.08.2021 Accepted: 06.09.2021Corresponding Author: Alper Özcan, [email protected]
The spectrum of underlying diseases in children with autoimmune hemolytic anemia
Alper Özcan1, Murat Cansever2, Ebru Yılmaz1, Ekrem Ünal1,3, Musa Karakükcü1, Türkan Patıroğlu1,2
1Erciyes University, Faculty of Medicine, Department of Pediatrics, Division of Pediatric Hematology Oncology & Pediatric HSCT Unit, Kayseri, Turkey2Erciyes University, Faculty of Medicine, Department of Pediatrics, Division of Pediatric Immunology, Kayseri, Turkey3Erciyes University, Molecular Biology and Genetic Department, Gevher Nesibe Genom and Stem Cell Institution, Genome and Stem Cell Center (GENKOK), Kayseri, Turkey
Cite this article as: Özcan Ai Cansever M, Yılmaz E, Ünal E, Karakükcü M, patıroğlu T. The spectrum of underlying diseases in children with autoimmune hemolytic anemia. J Health Sci Med 2021; 4(6): 772-778.
ABSTRACTAim: Autoimmune hemolytic anemia (AIHA) is characterized by the production of antibodies directed against red blood cells. We aimed to describe the clinical presentation, hematologic and biochemical profiles, treatment modalities, underlying diseases and outcomes in children suffering from AIHA. Material and Method: In a retrospectively manner, we consecutively recrutied 62 children (aged 1 month-18 years) with AIHA who had been followed in Erciyes University Child Hospital between January, 2000 and November, 2017. Results: The mean age at time of diagnosis was 61.9±51.9 months (range:1-192) in 62 children including 28 girls and 34 boys. The most common complaints included fatigue and fever while the most common findings were jaundice and hepatosplenomegaly. In 22 children (35.4%), there was a comorbid, active, non-specific infection (upper respiratory tract infection, lower respiratory tract infection, diarrhea, urinary tract infection). At time of diagnosis, mean hemoglobin (Hb) level was 6.9±2.5 g/dL (range: 5-9). The glucocorticoid therapy was given in majority of the patients while no medical treatment was given to 4 patients. Of the patients with primary AIHA, 6 patients were unresponsive to the treatment while one patient responded partially. It was found that there were underlying risk factors in 36 patients with secondary AIHA, as immunodeficiency and autoimmune disorders being the most common risk factors. Conclusion: The immunodeficiencies were highly prevalent in children included. By advance of whole exome sequencing technology, we believe that primary immunodeficiencies was the most common underlying disease in our study detected quite high in presented children.
Keywords: Autoimmune hemolytic anemia, children, immunodeficiency
Ana Metin-Alt bilgi Arası 5mm
Cite-Öz arası 5mm
Başlık-Yazarlar arası 12mmv
Yazar-Kurum arası 2,5 mmvcv
Kurum-Cite arası 5mm
Öz-Abstract arası 7,5mmvc
INTRODUCTIONAutoimmune hemolytic anemia (AIHA) is characterized by the production of antibodies directed against red blood cells, in which the red cell lysis occurs either by the mononuclear phagocytic system or by the complement system. The AIHA prevalence is still unknown at childhood, but it likely increases by advancing age as for most autoimmune disorders. In some studies, the AIHA prevalence was estimated as 0.2-0.8per in 100,000 person-years (1,2).
In infantile period, it mostly develops due to viral and bacterial infections or vaccination. However, in teenagers and young adults, there is an increased association with an underlying systemic illnesses, most commonly
with immunodeficiency, malignancy and autoimmune disorders (systemic lupus erythematosus (SLE), collagen vascular diseases) (3).The AIHA diagnosis generally depends on clinical features, positive direct anti-globulin test (DAT) / Coombs test, laboratory analysis for hemolysis,anemia, hyperbilirubinemia, reticulocytosis. (4).In hemodynamically stable patients with Hb level <7 g/dL, the erythrocyte transfusion is based on the American Association of Blood Banks (AABB) guidelines. If an AIHA patient has severe anemia and cardiopulmonary symptoms due to anemia,erythrocyte transfusion is required (5).
773
Özcan et al. Autoimmune hemolytic anemia in children J Health Sci Med 2021; 4(6): 772-778
In general, glucocorticoids are first-line treatment options due to their immunosuppressive effect. The additional treatment options may include intravenous immunoglobulin (IVIG) therapy, splenectomy, danazol, or immunosuppressive agents (6).
In this study, we aimed to describe the clinical presentation,hematologic and biochemical profiles, treatment options, underlying diseases and outcomes in children suffering from AIHA in Kayseri, Central Anatolia, Turkey
MATERIAL AND METHODWe retrospectively reviewed children (aged 1 months-18 years) who were diagnosed as AIHA at Pediatric Hematology and Oncology Department of Erciyes University, Medicine School between January 2000 and November 2017. From medical records and outpatient clinic database, we initially searched data regarding history and physical examination, first-line tests including hemogram, White blood cell (WBC), peripheral smear for red cell morphology for hemolysis, reticulocyte count and reticulocyte smear, biochemical hemolysis parameters (DAT, haptoglobin, lactate dehydrogenase (LDH), indirect bilirubin), blood typing, hepatic and renal function tests, and urinalysis. In addition, we also searched data regarding second-line tests including viral markers (hepatitis B, C and HIV, EBV, CMV, Parvovirus B19, HSV serology), immune-hematological parameters (C3, C4, CH50, autoimmune markers including thyroid auto-antibodies, immunoglobulin class, lymphocyte subpopulation, double-negative T cells, immune disease panel) in patients diagnosed AIHA.
The patients with clinical findings and laboratory results of AIHA such as anemia (including elevated reticulocyte count and blood smear with hemolysis), positive DAT, low haptoglobin levels, increased indirect bilirubin and LDH levels were reviewed. For all records reviewed, the study was carried out with the permission of Erciyes University Faculty of Medicine Clinical Researchs Ethics Committee (Date: 16.06.2017, Decision No: 2017/348). All procedures were carried out in accordance with the ethical rules and the principles of the Declaration of Helsinki.
The AIHA classification was made based on different serological antibodies (IgG, IgM, IgA, C3, and/or combinations) for different serological types, disease severity and treatment outcome. Patients diagnosed with AIHA were classified as primary and secondary AIHA according to associated and potentially causative disorders including infections, autoimmune disorders, and malignancies. Whole exome sequencing (WES) was performed in the patients diagnosed with AIHA, in whom etiology could not be determined.
The children aged 1 month ≤ or ≥ 18 years were excluded from the study because of unique features. The patients with transfusion-related AIHA, during bone marrow transplantation or those congenital hemolytic disorders were also excluded.
For treatment response, the complete response was defined as achieving Hb concentration ≥ lower limit of normal for age with no signs of hemolysis, i.e. normal reticulocyte count and bilirubin concentration while the partial response was defined as an increase in Hb level by ≥2 g/dLbut not reaching a normal value for age. No response was defined as an increase in Hb level by<2 g/dL and/or dependence on transfusions (7).
Statistical AnalysisTo summarize data, descriptive statistics were given in tables as mean ± standard deviation or median and interquartile range for continuous variables according to the distribution. The categorical variables were summarized as counts and percent. In comparisons between categorical variables, if the values observed in 2×2 tables are 5 and above, Pearson Chi-Square was used while Fisher Exact test was used cases where it is below 5. The RxC tables were used in Fisher's Freeman Halton Test. The statistical analyses were performed using Jamovi project software [(2018, Version 0.9.2.8), (Computer Software), (Retrieved from https://www.jamovi.org)]. The significance level was set as 0.05 (p value).
RESULTSThe study included 62 patients who were diagnosed as AIHA between 2000 and 2017. Of the patients included, 34 (54.8%) were boys and 28 (45.2%) were girls. The mean age at time of diagnosis was 61.9±51.9 months (range: 1-192).
There was comorbid, active, non-specific infection (upper respiratory tract infection, lower respiratory tract infection, diarrhea, urinary tract infection) in 22 patients (35.4%). Table 1 summarizes clinical features of the patients. The patients were classified into two groups as primary and secondary AIHA according to the etiologic causes. When groups were compared regarding age, gender, blood groups, complaints on admission, physical examination findings, relapsefrequency and frequency of accompanying diseases, no significant difference was found.
When the complete blood counts and biochemical parameters were compared between the patients with primary and secondary hemolytic anemia, no significant difference was found inWBC, Hb level, platelet count, reticulocyte percentage, lymphocyte count, eosinophil count, neutrophil/lymphocyte rate, haptoglobin level,

774
Özcan et al. Autoimmune hemolytic anemia in childrenJ Health Sci Med 2021; 4(6): 772-778
and LDH level. When the neutrophil counts were compared between groups, it was found that neutrophil count was significantly lower in patients with secondary AIHA than in patients with primary AIHA (p<0.05). It was found that total and free bilirubin levels were higher in patients with primary AIHA compared to those with secondary AIHA (p<0.05).
DAT was performed in all the patients for the presence of antibody. A significant difference was found between DAT positivity and Hb level in patients with both primary and secondary AIHA. When the distribution of antibody types was evaluated in 32 cases (51.6%), the DAT was positive for IgG and negative for C3d,while in 19 cases (30.7%) both were positive. Distributions of AIHA groups, DAT positivity scores, mean treatment durations and response conditions to treatment according to Hb levels were given in Table 2.
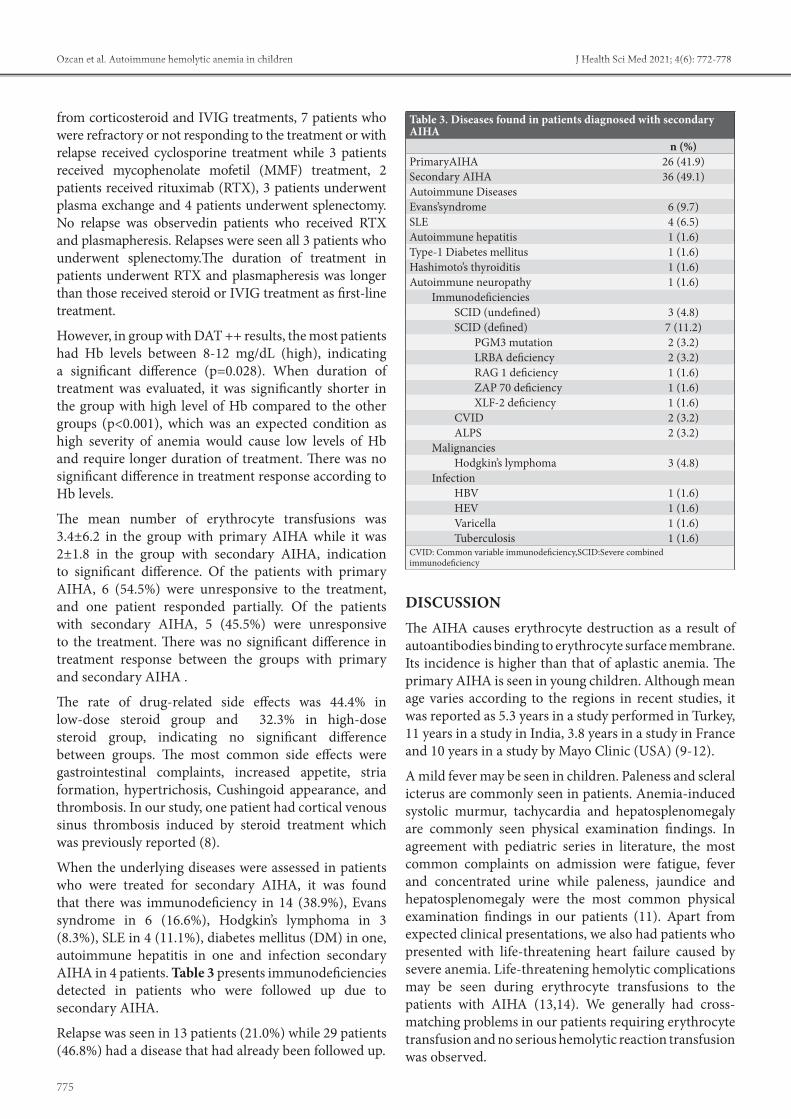
As the first-line treatment, 12 patients (19.4%) received IVIG therapy while 31 patients (50%) received high-dose steroid treatment (10-30 mg/kg/day), and 15 patients (24.2%) received low-dose steroid treatment (2 mg/kg/day). No medical treatment was given to 4 patients (6.4%). The patients unresponsive to IVIG were given high-dose steroid treatment (10-30 mg/kg/day) or low-dose steroid treatment (2 mg/kg/day). Only one patient achieved remission with IVIG treatment. Regarding treatment response, there was no significant difference between the two groups received low-dose steroid treatment (2 mg/kg/day) and high-dose steroid treatment (10-30 mg/kg/day). Eleven patients (17.7%) did not respond to the treatment. One of the patients died. The relapse was seen in 8 patients (29.6%) in the group received IVIG and/or low-dose steroid (2 mg/kg/day) whereas in 5 patients (16.1%) in the group received high dose steroid (10-30 mg/kg/day). There was no significant difference in relapse between groups. The combined treatments were often used in treatment. Apart
Table 1. Mean values of some demographic characteristics, complaints, physical examination findings and some blood values for all patientsAge, month (Range: 1-192 months) 61.9±51.9Gender
Male 34 (54.8%)Female 28 (45.2%)
AIHAPrimary 26(41.9%)Secondary 36(49.1%)
ComplaintsFatigue 12 (19.4)Fever 5 (8.1)Concentrated urine 4 (6.5)Uneasiness 3 (4.8)Loss of appetite 2 (3.2)Diarrhea 1 (1.6)Vomiting 1 (1.6)Pain 1 (1.6)
Convulsion 1 (1.6)Physical examination findings
Icterus 34 (54.8)Hepatosplenomegaly 33 (53.2)Paleness 31 (50)Murmur 17 (27.4)Tachycardia 7 (11.3)Splenomegaly 6 (9.7)Hepatomegaly 3 (4.8)Microcephaly 1 (1.6)
Oral moniliasis 1 (1.6)Laboratory results of AIHA patients
WBC ( 103/µL) 11855.8±7379.5Hgb (g/dL) 6.9±2.5PLT ( 103/µL) 335400±186080.7% RTC 10.8±7.5NEU ( 103/µL) 5972.1±5534.1LYMP ( 103/µL) 3802.9±2634EOS ( 103/µL) 176.1±186.4NEU/LYMPH (%) 2±1.8Monocyte (103/L) 598.2±601.1Total bilirubin (mg/dL) 4.4±4.4Free bilirubin(mg/dL) 0.8±1.3Haptoglobulin (g/L) 16.9±36.9
LDH (u/L) 698.3±872.1
Table 2. Distributions of the groups with AIHA, DAT positivity scores, mean treatment durations and response to treatment conditions according to hemoglobin levels Hemoglobin level (gr/dL) p
0-4 4-8 8-12 TotalAIHA 0.166*
Primary 1(2.9) 24 (70.6) 9 (26.5) 34Secondary 4(14.3) 14 (50) 10 (35.7) 28
DAT 0.028*+ 0(0) 1(50) 1(50) 2++ 2(12.5) 5(31.3) 9(56.3) 16+++ 3(13) 16(69.6) 4(17.4) 23++++ 0(0) 16(76.2) 5(23.8) 21
Duration of treatment (day) 180 (30-180) 142.5 (90-280) 40 (10-75) - <0.001**Response to treatment 0.104*
CR 4(8.3) 29(60.4) 15(31.3) 48NR 1(9.1) 9(81.8) 1(9.1) 11PR 0(0) 0(0) 1(100) 1No treatment 0(0) 0(0) 2(100) 2
* Fisher's Exact Test was used. Descriptive statistics were given as numbers (%). ** Kruskal-Wallis H Test was used. Descriptive statistics were given as median (IQR). CR:Complet Remission, NR:Non response, PR: Poor Response
775
Özcan et al. Autoimmune hemolytic anemia in children J Health Sci Med 2021; 4(6): 772-778
from corticosteroid and IVIG treatments, 7 patients who were refractory or not responding to the treatment or with relapse received cyclosporine treatment while 3 patients received mycophenolate mofetil (MMF) treatment, 2 patients received rituximab (RTX), 3 patients underwent plasma exchange and 4 patients underwent splenectomy. No relapse was observedin patients who received RTX and plasmapheresis. Relapses were seen all 3 patients who underwent splenectomy.The duration of treatment in patients underwent RTX and plasmapheresis was longer than those received steroid or IVIG treatment as first-line treatment.
However, in group with DAT ++ results, the most patients had Hb levels between 8-12 mg/dL (high), indicating a significant difference (p=0.028). When duration of treatment was evaluated, it was significantly shorter in the group with high level of Hb compared to the other groups (p<0.001), which was an expected condition as high severity of anemia would cause low levels of Hb and require longer duration of treatment. There was no significant difference in treatment response according to Hb levels.
The mean number of erythrocyte transfusions was 3.4±6.2 in the group with primary AIHA while it was 2±1.8 in the group with secondary AIHA, indication to significant difference. Of the patients with primary AIHA, 6 (54.5%) were unresponsive to the treatment, and one patient responded partially. Of the patients with secondary AIHA, 5 (45.5%) were unresponsive to the treatment. There was no significant difference in treatment response between the groups with primary and secondary AIHA .
The rate of drug-related side effects was 44.4% in low-dose steroid group and 32.3% in high-dose steroid group, indicating no significant difference between groups. The most common side effects were gastrointestinal complaints, increased appetite, stria formation, hypertrichosis, Cushingoid appearance, and thrombosis. In our study, one patient had cortical venous sinus thrombosis induced by steroid treatment which was previously reported (8).
When the underlying diseases were assessed in patients who were treated for secondary AIHA, it was found that there was immunodeficiency in 14 (38.9%), Evans syndrome in 6 (16.6%), Hodgkin’s lymphoma in 3 (8.3%), SLE in 4 (11.1%), diabetes mellitus (DM) in one, autoimmune hepatitis in one and infection secondary AIHA in 4 patients. Table 3 presents immunodeficiencies detected in patients who were followed up due to secondary AIHA.
Relapse was seen in 13 patients (21.0%) while 29 patients (46.8%) had a disease that had already been followed up.
DISCUSSIONThe AIHA causes erythrocyte destruction as a result of autoantibodies binding to erythrocyte surface membrane. Its incidence is higher than that of aplastic anemia. The primary AIHA is seen in young children. Although mean age varies according to the regions in recent studies, it was reported as 5.3 years in a study performed in Turkey, 11 years in a study in India, 3.8 years in a study in France and 10 years in a study by Mayo Clinic (USA) (9-12).
A mild fever may be seen in children. Paleness and scleral icterus are commonly seen in patients. Anemia-induced systolic murmur, tachycardia and hepatosplenomegaly are commonly seen physical examination findings. In agreement with pediatric series in literature, the most common complaints on admission were fatigue, fever and concentrated urine while paleness, jaundice and hepatosplenomegaly were the most common physical examination findings in our patients (11). Apart from expected clinical presentations, we also had patients who presented with life-threatening heart failure caused by severe anemia. Life-threatening hemolytic complications may be seen during erythrocyte transfusions to the patients with AIHA (13,14). We generally had cross-matching problems in our patients requiring erythrocyte transfusion and no serious hemolytic reaction transfusion was observed.
Table 3. Diseases found in patients diagnosed with secondary AIHA
n (%)PrimaryAIHA 26 (41.9)Secondary AIHA 36 (49.1)Autoimmune DiseasesEvans’syndrome 6 (9.7)SLE 4 (6.5)Autoimmune hepatitis 1 (1.6)Type-1 Diabetes mellitus 1 (1.6)Hashimoto’s thyroiditis 1 (1.6)Autoimmune neuropathy 1 (1.6)
ImmunodeficienciesSCID (undefined) 3 (4.8)SCID (defined) 7 (11.2)
PGM3 mutation 2 (3.2)LRBA deficiency 2 (3.2)RAG 1 deficiency 1 (1.6)ZAP 70 deficiency 1 (1.6)XLF-2 deficiency 1 (1.6)
CVID 2 (3.2)ALPS 2 (3.2)
MalignanciesHodgkin’s lymphoma 3 (4.8)
InfectionHBV 1 (1.6)HEV 1 (1.6)Varicella 1 (1.6)Tuberculosis 1 (1.6)
CVID: Common variable immunodeficiency,SCID:Severe combined immunodeficiency

776
Özcan et al. Autoimmune hemolytic anemia in childrenJ Health Sci Med 2021; 4(6): 772-778
In children, the warm AIHA is generally provoked by viral infections and hemolysis may occur. In the literature, warm AIHA cases caused by basic viral infections such as mycoplasma, parvovirus, HBV and HCV, cytomegalovirus, varicella, toxoplasma and Ebstein-Barr virus were reported (3,9,15-18). While non-specific infections were detected in most of our patients, 1 had varicella, 1 had HBV, 1 had HEV and 1 had tuberculosis infection. Patients who were admitted with AIHA presentation must be questioned for previous infections and serological and microbiological studies must be performed on patients with an active infection in order to reveal a potential agent.
Neutrophil count was significantly lower in the patients diagnosed secondary AIHA than those in patients with primary AIHA. Total bilirubin level was higher in patients with primary AIHA than those in patients with secondary AIHA. When the patients with primary and secondary AIHA were compared regarding hemogram and biochemical parameters, no difference was found. High DAT positivity (+++/++++) was higher in patients with primary AIHA than in patients with secondary AIHA. We considered that low neutrophil count in patients with secondary AIHA may be due to the underlying immunodeficiency and auto-inflammatory disease. DAT positivity and clinical findings suggest the presence of AIHA, however, it should be kept in mind that DAT may be positive in chronic liver diseases, malignancies, patients who frequently undergo transfusion due to drug use and in patients who have underwent bone morrow or organ transplantation. Moreover, DAT may also be positive in auto-inflammatory diseases (SLE, rheumatoid arthritis, etc.) and immunodeficiencies (autoimmune lymphoproliferative disease (ALPS), SCID, etc.) (19-26). DAT may be found as negative in approximately 3-11% of the patients with AIHA.20,25 Patients with negative DAT result, patients who underwent transfusion and patients who underwent a transplantation were excluded.
AIHA caused by warm antibodies is the most common type of AIHA seen in children and occurs with IgG-typeantibodies activated at room temperature or 37oC. In cold AIHA, there are IgM-type antibodies typically binding to erythrocytes at temperatures between 0oC and 37oC. Similar to the series in literature and as expected, the positivity rate of IgG-type antibodies was high. In patients with high positive results of DAT, low levels of Hb were found while need for transfusion was higher; the duration of the treatment was longer; response to the treatment lasted longer; and prognoses were worse. Moreover, DAT positivity was higher in patients with primary AIHA than in patients with secondary AIHA (3,9,11,12).
AIHA may result in death. The therapeutic decisions should be made according to the growth rate and severity of anemia. The recommended treatments rely on patient-based individual experiences. Observation may be sufficient in a patient with moderate level of anemia due to a viral infection. The treatment should be initiated in patients with more severe anemia and in patients with rapid decrease in Hb level (1-4). If the patient has a serious intravascular hemolysis, renal blood flow and the amount urine should be carefully monitored. In children with warm antibody-related AIHA, the treatment should start with monitoring, erythrocyte transfusion and corticosteroid. Intravenous immunoglobulin, plasma exchange in chosen patients, and RTX as targeted treatment can be added to the treatment (4,27). We tried to prefer corticosteroid treatments as first-line treatment in our patients diagnosed with AIHA. In cases (patients with active reactions, etc.) in which corticosteroid therapy could not be used, we preferred IVIG treatment as second option. In patients who were refractory to the treatment or who relapsed, we used other immunosuppressive treatments (MMF, cyclosporine, and RTX), splenectomy and recently plasma exchange. Cushing’s syndrome, stria, hypertrichosis, and gastrointestinal side effects were observed secondary to corticosteroid treatment. Venous sinus thrombosis secondary to high-dose steroid treatment was found in one patient and IVIG treatment was carried on. In cyclosporine treatment, hirsutism, and high blood pressure were found. MMF had fewer side effects and its use was more readily than cyclosporine. Side effects occurring due to the drugs and insufficient treatments affected our treatment alterations. No complication was observed in patients who received RTX. In our study, one patient received 4 doses (375 mg/m2) while another patient received 6 doses (375 mg/m2). Among 4 patients, one underwent 4 plasma exchange sessions whereas 3 underwent 3 plasma exchange sessions. When the literature is reviewed, high-dose steroid, IVIG, cyclosporine, MMF and splenectomy were performed in previous studies while RTX and plasmapheresis have become treatments preferred (28,29). In patients who develop complications due to corticosteroid, RTX , cyclosporine and MMF, immunosuppressive drugs such as azathioprine and campath-1H and chemotherapeutics such as 6-merkaptopurin and cyclophosphamide can be used. Autologous stem cell transplantation may be performed in refractory AIHA (30).
Secondary AIHA is a condition that occurs secondary to inflammatory or autoimmune diseases such as Sjogren’s syndrome, scleroderma, dermatomyositis, ulcerative colitis, Crohn’sdisease, and autoimmune thyroid; however it is most commonly seen in SLE (31). In the study from Mayo Clinic and in the largest pediatric study by Aladjiji et al., autoimmune/inflammatory diseases were the

777
Özcan et al. Autoimmune hemolytic anemia in children J Health Sci Med 2021; 4(6): 772-778
most commonly detected secondary diseases in patients diagnosed with AIHA (11,12). Similarly, the most common causes of AIHA were autoimmune diseases in the study by Vaglio et al. (32) SLE, autoimmune hepatitis, anti-phospholipid syndrome, primary sclerosing cholangitis, Evans' syndrome and rheumatoid arthritis were main autoimmune diseases detected. In the study by Aladjiji et al. (11), secondary AIHA incidence was 63% whereas it was 11% for autoimmune disorders. In our study, secondary AIHA was found in 58% of the patients. The most commonly detected causes of secondary AIHA were immunodeficienciesand autoimmune diseases. Evans syndrome and SLE were the most common autoimmune diseases. While some of our patients were followed up with autoimmune/auto-inflammatory diseases, immunodeficiency was diagnosed in their follow-ups.
In malignancies such as chronic myeloid, leukemia, lymphoma, multiple myeloma and myelodysplasia, AIHA may develop before or during the disease. In the study from Mayo Clinic, one patient had chronic myeloid leukemia but not lymphoma. Three patients had non-Hodgkin lymphoma in the study by La Sapienza and 8 patients had a malignancy (breast cancer, thyroid cancer, lymphoma, colon cancer and acute myeloid leukemia) in the study by Aladjiji et al. (11). In our study, Hodgkin’s lymphoma developed in 3 patients. Two of the patients in whom Hodgkin’s lymphoma was detected were observed to have been followed up with AIHA secondary to ALPS and 1 patient with Evans syndrome. It may also be seen with congenital immunodeficiencies accompanied by immune cytopenia. It is particularly seen in immunodeficiency syndrome that often changes and in Wiskott-Aldrich syndrome. AIHA may also be seen in acquired immunodeficiencies occurring after human immunodeficiency virusor organ transplantation (33). In our study, immunodeficiency was found in 19% of the patients diagnosed with AIHA and in about 43% of the patients diagnosed with secondary AIHA. PMG3 mutation, LRBA deficiency, RAG1 deficiency, ZAP70 deficiency and XLF-2 deficiency were primary immunodeficiencies that can be typed with the use of examinations of all genes-analysis. As a result of WES, LRBA deficiency was found in 2 patients followed up with AIHA secondary to ALPS and ZAP70 deficiency was found in one patient followed up with AIHA secondary to SLE. We had patients followed with immunodeficiency that could not be typed in the era where WES technology was unavailable. In the study by Aladjiji et al (11), humoral immunodeficiency was detected in 17 patients, non-identified primary immunodeficiency in 5, combined immunodeficiency in 2, adenosine deaminase deficiency in 2 and HLA class 2 deficiency in 1 patient.
Evans syndrome and ALPS that should be considered in the distinctive diagnosis of organomegaly, lymphadenopathy, and immunodeficiencies (34,35). Evans syndrome was found in 99 patients in a French study, in 20 patients in the study of Junjie Fan et al. (36) and in 6 patients in the study of Naithani et al. (11, 37). In our study, Evans syndrome was found in 6 patients.
Although immune hemolytic anemia caused by drugs is not common in children. methyldopa, penicillin, cephalosporin, tetracycline, erythromycin, ribavirin, acetaminophen and ibuprofen may also be the cause of hemolytic anemia (38). Paroxysmal nocturnal hemoglobinuria (PNH) which is rarely seen in children should be considered (39,40). In our study, PNH was rarely seen in childhood, and no AIHA caused by drugs was observed.
In conclusion, AIHA may be either primary or secondary to underlying diseases such as autoimmune diseases, malignancies, infections and immunodeficiencies. In our study, the rate of patients with immunodeficiency was quite high. By advent of WES technology, we believe that primary immunodeficiencies may be the most common underlying diseases in patients especially with autoimmune-induced AIHA. Patients diagnosed with AIHA should be examined for immunodeficiencies.
ETHICAL DECLARATIONSEthics Committee Approval: The study was carried out with the permission of Erciyes University Faculty of Medicine Clinical Researchs Ethics Committee (Date: 16.06.2017, Decision No: 2017/348).Informed Consent: Because the study was designed retrospectively, no written informed consent form was obtained from patients.Referee Evaluation Process: Externally peer-reviewed. Conflict of Interest Statement: The authors have no conflicts of interest to declare. Financial Disclosure: The authors declared that this study has received no financial support. Author Contributions: All of the authors declare that they have all participated in the design, execution, and analysis of the paper, and that they have approved the final version. Acknowledgment: The authors thank Prof. Dr. Mehmet Akif Özdemir for their valuable contributions to the study.
REFERENCES1. Liebman HA, WeitzIC. Autoimmune hemolytic anemia. Med
Clin North Am 2017; 101: 351-9.2. Aladjidi N, Jutand MA, Beaubois C, et al. Reliable assessment
of the incidence of childhood autoimmune hemolytic anemia. Pediatr Blood Cancer 2017; 64: 12.

778
Özcan et al. Autoimmune hemolytic anemia in childrenJ Health Sci Med 2021; 4(6): 772-778
3. Sarper N, Çakı Kılıç S, Zengin E, et al. Management of autoimmune hemolytic anemia in children and adolescents: A single center experience. Turk J Haematol 2011; 28: 198-205.
4. Vagace JM, Bajo R, Gervasini G. Diagnostic and therapeutic challenges of primary autoimmune haemolytic anaemia in children. Arch Dis Child 2014; 99: 668-73.
5. Carson JL, Grossman BJ, Kleinman S, et al. Clinical Transfusion Medicine Committee of the AABB. Red blood cell transfusion: a clinical practice guideline from the AABB*. Ann Intern Med. 2012; 157: 49-58.
6. Go RS, Winters JL, Kay NE. How I treat autoimmune hemolytic anemia. Blood.2017; 129: 2971-9.
7. Ladogana S, Maruzzi M, Samperi P, et al. Diagnosis and management of newly diagnosed childhood autoimmune haemolytic anaemia. Recommendations from the Red Cell Study Group of the Paediatric Haemato-Oncology Italian Association. Blood Transfus 2017;15: 259–67.
8. Ozcan A, Canpolat M, Doganay S, et al. Cerebral sinus venous thrombosis and prothrombotic risk factors in children: a single-center experience from Turkey. J Pediatr Hematol Oncol 2018; 40: 369-72.
9. Yaralı N, Bilir ÖA, Erdem AY, et al. Clinical features and treatment of primary autoimmune hemolytic anemia in childhood. Transfus Apher Sci 2018; 57: 665-8.
10. 10.Naithani R, Agrawal N, Mahapatra M, et al. Autoimmune haemolytic anemia in children. Pediatr Hematol Oncol 2007; 24: 309-15.
11. Aladjidi N, Leverger G, Leblanc T, et al. Centre de Référence National des Cytopénies Auto-immunes de l'Enfant (CEREVANCE). New insights into childhood autoimmune hemolytic anemia: a French national observational study of 265 children. Haematologica 2011; 96: 655-63.
12. Sankaran J, Rodriguez V, Jacob EK, et al. Autoimmune hemolytic anemia in children: mayo clinic experience. J Pediatr Hematol Oncol 2016; 38: 120-4.
13. Berentsen S, Sundic T. Red blood cell destruction in autoimmune hemolytic anemia: role of complement and potential new targets for therapy. Biomed Res Int 2015; 2015: 363278.
14. Hill QA, Hill A, Berentsen S. Defining autoimmune hemolytic anemia: a systematic review of the terminology used for diagnosis and treatment. Blood Adv 2019; 3: 1897-906.
15. Apak H, Karaman S, Doğan Y,etal. Varicella-induced haemolytic anemia with hepatitis. Ann Hematol 2006; 85: 64-5.
16. Zhang QL, Jia LJ, Zhang JB, et al. HBV and HCV coinfection associated with warm-type autoimmune hemolytic anemia: a case report. Turk J Haematol 2014; 3: 328-31.
17. Yen YF, Lan YC, Huang CT, et al. Human immunodeficiency virus infection increases the risk of incident autoimmune hemolytic anemia: a population-based cohort study in Taiwan. J Infect Dis 2017; 216: 1000-7.
18. Patiroglu T, Ozcan A, Karakukcu M, et al. Mycophenolate mofetil-induced pseudotumor cerebri in a boy with autoimmune lymphoproliferative disease. Childs Nerv Syst 2011; 27: 853-5.
19. Parker V, Tormey CA. The direct antiglobulin test: indications, interpretation, and pitfalls. Arch Pathol Lab Med 2017; 141: 305-10.
20. Kim TO, Grimes AB, Kirk S, Arulselvanet al. Association of a positive direct antiglobulin test with chronic immune Thrombocytopenia and use of second line therapies in children: A multi-institutional review. Am J Hematol 2019; 94: 461-6.
21. Farmer JR, Foldvari Z, Ujhazi B, et al. Outcomes and treatment strategies for autoimmunity and hyperinflammation in patients with RAG deficiency.J Allergy Clin Immunol Pract 2019; 7: 1970–85.
22. Patiroglu T, Haluk Akar H, Gilmour K, et al. A case of XMEN syndrome presented with severe auto-immune disorders mimicking autoimmune lymphoproliferative disease. Clin Immunol 2015; 159: 58–62.
23. Patiroglu T, Gungor HE, Unal E. Autoimmune diseases detected in children with primary immunodeficiency diseases: results from a reference centre at middle anatolia. Acta Microbiol Immunol Hung 2012; 59: 343–53.
24. Patiroglu T, Akar HH, Gilmour K, et al. Atypical severe combined immunodeficiency caused by a novel homozygous mutation in Rag1 gene in a girl who presented with pyoderma gangrenosum: a case report and literature review. J Clin Immunol 2014; 34: 792–5.
25. Miller J, Cai W, Andrews J, et al. A case series of pediatric patients with direct antiglobulin test negative autoimmune hemolytic anemia. Transfusion 2019; 59: 2528-1.
26. Patiroglu T, Klein C, Gungor HE, et al. Clinical features and genetic analysis of six patients with Wiskott-Aldrich syndrome reporting two novel mutations: experience of Erciyes University, Kayseri, Turkey. Genet Couns 2016; 27: 9–24.
27. Barros MM, Blajchman MA, Bordin JO. Warm autoimmune hemolytic anemia: recent progress in understanding the immunobiology and the treatment. Transfus Med Rev. 2010;24:195-210.
28. Dierickx D, Kentos A, Delannoy A. The role of rituximab in adults with warm antibody autoimmune haemolytic anemia.Blood 2015; 125: 3223-9.
29. von Baeyer H. Plasmapheresis in immune hematology: review of clinical outcome data with respect to evidence-based medicine and clinical experience. Ther Apher Dial 2003; 7: 127-40.
30. Barcellini W. Immune Hemolysis: Diagnosis and Treatment Recommendations. Semin Hematol 2015; 52: 304-12.
31. Hirano Y, Itonaga T, Yasudo H, et al. Systemic lupus erythematosus presenting with mixed-type fulminant autoimmune hemolytic anemia. Pediatr Int 2016; 58: 527-30.
32. Vaglio S, Arista MC, Perrone MP, et al. Autoimmune haemolytic anemia in childhood: serologic features in 100 cases. Transfusion 2007; 47: 50-4.
33. Becheur M, Bouslama B, Slama H, et al. [Autoimmune haemolytic anemia in children]. Transfus Clin Biol 2015; 22: 291-8.
34. Miano M. How I manage Evans Syndrome and AIHA cases in children. Br J Haematol 2016; 172: 524-34.
35. Price V. Auto-immune lymphoproliferative disorder and other secondary immune thrombocytopenias in childhood. Pediatr Blood Cancer. 2013; 60: S12-4.
36. Fan J, He H, Zhao W, et al. Clinical features and treatment outcomes of childhood autoimmune hemolytic anemia: a retrospective analysis of 68 Cases. J Pediatr Hematol Oncol 2016; 38: 50-5.
37. Naithani R, Agrawal N, Mahapatra M, et al. Autoimmune haemolytic anemia in India: clinico-hematological spectrum of 79 cases. Hematology 2006; 11: 73-6.
38. Garratty G. Immune hemolytic anemia caused by drugs. Expert Opin Drug Saf 2012; 11: 635- 42.
39. Albayrak M, Kaya Z, Kocak U, et al. Fatal autoimmune hemolytic anemia in a child with B-cell leukemia. Erciyes Med Journal 2009; 31: 37-40.
40. Parker CJ. Update on the diagnosis and management of paroxysmal nocturnal hemoglobinuria. Hematology Am Soc Hematol Educ Program 2016; 2016: 208-16.
HEALTH SCIENCESMEDICINE
Original Article
J Health Sci Med 2021; 4(6): 779-783
This work is licensed under a Creative Commons Attribution 4.0 International License.
DOI: 10.32322/jhsm.948441
Received: 05.06.2021 Accepted: 01.09.2021Corresponding Author: Çağrı Zorlu, [email protected]
Aortic arch calcification is strongly associated with obstructive sleep apnea
Çağrı ZorluTokat Gaziosmanpaşa University, Department of Cardiology, Tokat, Turkey
Cite this article as: Zorlu Ç. Aortic arch calcification is strongly associated with obstructive sleep apnea. J Health Sci Med 2021; 4(6): 779-783.
ABSTRACTAim: Obstructive sleep apnea (OSA) is a common clinical condition that causes an increase in cardiovascular morbidity and mortality. OSA is likely to show increased arterial stiffness and progressive systemic atherosclerosis. Chest radiography reveals atherosclerotic changes in the aorta.The aim of this study was to investigate the relationship between aortic arch calcification (AAC) on chest radiography and OSA.Material and Method: 204 patients (age: 55±14 years; 78 men) who were diagnosed with OSA by performing night polysomnography were evaluated. On the other hand 200 (age: 48±15 years; 94 men) patients were selected to the group non OSA. AAC was evaluated with chest radiography and inter-observer agreement was analyzed by using kappa statistics. Univariate and multivariate logistic regression analysis was conducted to assess the association of AAC and OSA. P-value <0.05 was considered statistically significant.Result: The prevalence of AAC was 207 (51,2%). OSA group had significantly higher prevalence of AAC (79% vs. 32.5%, p <0.0001) as compared to the normal group. Presence of AAC was a strong and independent predictor of OSA (OR 3.923, 95%CI 2.396 to 6.328) in multivariate analysis.Conclusion: Presence of AAC on plain chest radiography is strongly and independently associated with the presence of OSA. Keywords: Aorta, thoracic, calcinosis, sleep apnea, obstructive.
Ana Metin-Alt bilgi Arası 5mm
Cite-Öz arası 5mm
Başlık-Yazarlar arası 12mmv
Yazar-Kurum arası 2,5 mmvcv
Kurum-Cite arası 5mm
Öz-Abstract arası 7,5mmvc
INTRODUCTIONObstructive sleep apnea (OSA) is a disease that causes complete or partial airway collapse during sleep and thus repetitive ventilation interruptions (1). OSA has been demonstrated to be involved with increased prevalence of cardiovascular disease (CVD) due to intermittent sleep interruptions, intermittent chronic hypoxia, and changes in intra-chest pressure (2,3). Oxidative stress and sympathetic activation occur in OSA due to fast reoxygenation following periods of hypoxia. These also lead to inflammation resulting in endothelial dysfunction and thus subclinical and clinical atherosclerosis (4).
In some studies, the relationship between OSA and coronary artery calcium level has been revealed and, as it is known, coronary artery calcium level is one of the indicators of subclinical atherosclerosis (5). There are previous studies evaluating the relationship between aortic calcification, coronary artery calcium level, and CVD (6). Calcium accumulation in the aortic arch can be
evaluated by chest radiography. Calcification of the aortic arch gives preliminary clues about atherosclerosis. Based on all these, further investigation of the relationship between OSA and subclinical atherosclerosis markers is valuable in that it leads to evaluations for reducing possible future adverse events related to CVD in patients with OSA.
In this study, it was aimed to research its relationship with OSA by evaluating aortic arch calcification (AAC) on chest radiography.
MATERIAL AND METHODThe study was carried out with the permission of Tokat Gaziosmanpaşa University Faculty of Medicine Clinical Researchs Ethics Committee (Date: 19.08.2020, Decision No: 20-KAEK-122). All procedures were carried out in accordance with the ethical rules and the principles of the Declaration of Helsinki.

780
Zorlu Ç. Calcification and obstructive sleep apnea J Health Sci Med 2021; 4(6): 779-783
Study PopulationsThe aortic arch was evaluated with posterior-anterior (PA) chest radiography of all participants included in the study. Patients older than 18 years of age and had night polysomnography from July 2018 to May 2020 were included in the study. The conditions for not being included in the study were as follows: inadequate chest x-ray, known aortic, coronary artery, cerebrovascular and peripheral vascular disease, open chest surgery, heart failure, moderate to severe cardiac valve disease, pregnancy, malignancy, and receiving dialysis. All participants were evaluated by transthoracic echocardiography. Participants were evaluated with medical history, physical examination and laboratory data.
Demographic and Laboratory DataBiochemical parameters were automatically evaluated with the aid of the Beckman Coulter LH-750 Hematology Analyzer (Beckman Coulter, Inc, Fullerton, California). Routine biochemical parameters were evaluated by standard methods. Hypercholesterolemia was described as an initial cholesterol level of> 200 mg/dL and/or a low-density lipoprotein cholesterol level of> 130 mg/dL or pre-diagnosed and treated hypercholesterolaemia. Diabetes mellitus and hypertension were defined as drug users for the treatment of these diseases. In addition to these, presence of diabetes mellitus was determined based on when glucose level was ≥126 mg/dL in several measurements for fasting or glucose level >200 mg/dL at any measurement and hypertension was diagnosed based on when repeated systolic/diastolic blood pressure measurements was ≥140/90 mmHg. Current smoking was defined as smoking in the previous 6 months. Body mass index was expressed as kg/m2.
Evaluation of Obstructive Sleep Apnea All subjects were evaluated using polysomnography overnight using an equipped digital polygraph (SomnoStar Alpha Sleep System, SensorMedics Corp., Yorba Linda, CA, USA). Patients who were diagnosed with OSA according to the accepted definition and scoring methods were included in the study (7). Hypopneas were defined as a 30-80% reduction in nasal pressure flow for at least 10 seconds with oxygen desaturation ≥4%. A flow reduction of 80% in the nasal pressure signal for at least 10 seconds was defined as apneas. Oxygen desaturation scored if there is a ≥4% decrease. The apnea-hypopnea index (AHI) was defined as the number of apnea and hypopneas per hour of the analyzed recording time and it was used to determine the risk of OSA.
The Aortic Arch AssessmentTo all participants included in the study; standard PA chest radiography was taken while the participants were
standing (AXIOM Aristos MX, SIEMENS, Germany). The AAC was evaluated in four categories: grade 0, no visible calcification; grade 1, the calcification appears as a small dot or thin line; grade 2, calcification at one or more points or in the form of a thick line; grade 3, circular prominent calcification of the aortic arch (8). AAC for each patient was assessed by two independent, experienced cardiologists in a blinded fashion.
Echocardiographic ExaminationAll echocardiographic evaluations (General Electric Vivid S5, Milwaukee, WI, USA) were performed on all participants in the left decubitus position using a 2.5-3.5 MHz transducer. The examination was performed using two-dimensional and pulsed Doppler measurements according to the American Echocardiography Association and the European Society of Cardiovascular Imaging criteria. Simpson's method was used to evaluate left ventricular ejection fraction (9).
Statistical AnalysisStatistical analyses were carried out using the SPSS 18.0 Statistical Package Program for Windows (SPSS Inc., Chicago Illinois, USA). Qulitative data are presented as medians with interquartile ranges. Quantitative variables were expressed as a mean value standard deviation and categorical variables as percentages. The distribution of continuous variables was determined with the Kolmogorov-Smirnov test. Student t-test was used to evaluate normally distributed data and Mann-Whitney U test was used to evaluate non-normally distributed data. Fisher’s exact or chi-square tests were used to evaluate categorical variables . Multivariate logistic regression analyses were applied to determine independent factors. Data from univariate and multivariate logistic regression analyses were reported as odds ratios with 95% CI. A p-value <0.05 was considered statistically significant.
RESULTSA total of 404 participitians were included in this study. The mean patient age was 55±14 years, and 172 (42.5%) of the patients were men. Two hundred four patients (50.4%) with OSA were evaluated as an OSA (+) group. Those without OSA diagnosis, symptoms or signs were determined as the OSA (-) group. As compared to the OSA (+) group, the OSA (-) group was older (p<0.001). Basic characteristic features of the groups, demographic and laboratory data were similar except age. Patient characteristics are summarized in Table 1.
In the evaluations made on chest radiography, the frequency of AAC in the group with OSA (+) was statistically higher than the group with OSA (-) (p<0.001) (Table 2).
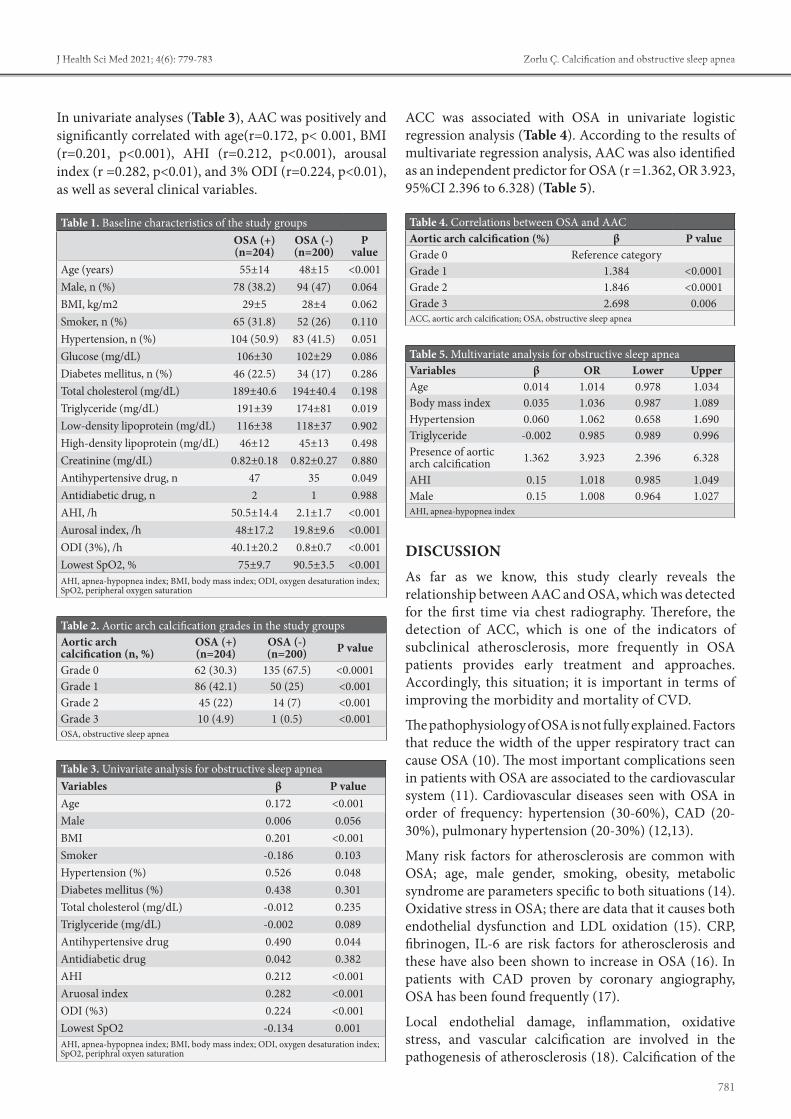
781
Zorlu Ç. Calcification and obstructive sleep apneaJ Health Sci Med 2021; 4(6): 779-783
In univariate analyses (Table 3), AAC was positively and significantly correlated with age(r=0.172, p< 0.001, BMI (r=0.201, p<0.001), AHI (r=0.212, p<0.001), arousal index (r =0.282, p<0.01), and 3% ODI (r=0.224, p<0.01), as well as several clinical variables.
ACC was associated with OSA in univariate logistic regression analysis (Table 4). According to the results of multivariate regression analysis, AAC was also identified as an independent predictor for OSA (r =1.362, OR 3.923, 95%CI 2.396 to 6.328) (Table 5).
DISCUSSIONAs far as we know, this study clearly reveals the relationship between AAC and OSA, which was detected for the first time via chest radiography. Therefore, the detection of ACC, which is one of the indicators of subclinical atherosclerosis, more frequently in OSA patients provides early treatment and approaches. Accordingly, this situation; it is important in terms of improving the morbidity and mortality of CVD.
The pathophysiology of OSA is not fully explained. Factors that reduce the width of the upper respiratory tract can cause OSA (10). The most important complications seen in patients with OSA are associated to the cardiovascular system (11). Cardiovascular diseases seen with OSA in order of frequency: hypertension (30-60%), CAD (20-30%), pulmonary hypertension (20-30%) (12,13).
Many risk factors for atherosclerosis are common with OSA; age, male gender, smoking, obesity, metabolic syndrome are parameters specific to both situations (14). Oxidative stress in OSA; there are data that it causes both endothelial dysfunction and LDL oxidation (15). CRP, fibrinogen, IL-6 are risk factors for atherosclerosis and these have also been shown to increase in OSA (16). In patients with CAD proven by coronary angiography, OSA has been found frequently (17).
Local endothelial damage, inflammation, oxidative stress, and vascular calcification are involved in the pathogenesis of atherosclerosis (18). Calcification of the
Table 1. Baseline characteristics of the study groupsOSA (+) (n=204)
OSA (-) (n=200)
P value
Age (years) 55±14 48±15 <0.001Male, n (%) 78 (38.2) 94 (47) 0.064BMI, kg/m2 29±5 28±4 0.062Smoker, n (%) 65 (31.8) 52 (26) 0.110Hypertension, n (%) 104 (50.9) 83 (41.5) 0.051Glucose (mg/dL) 106±30 102±29 0.086Diabetes mellitus, n (%) 46 (22.5) 34 (17) 0.286Total cholesterol (mg/dL) 189±40.6 194±40.4 0.198Triglyceride (mg/dL) 191±39 174±81 0.019Low-density lipoprotein (mg/dL) 116±38 118±37 0.902High-density lipoprotein (mg/dL) 46±12 45±13 0.498Creatinine (mg/dL) 0.82±0.18 0.82±0.27 0.880Antihypertensive drug, n 47 35 0.049Antidiabetic drug, n 2 1 0.988AHI, /h 50.5±14.4 2.1±1.7 <0.001Aurosal index, /h 48±17.2 19.8±9.6 <0.001ODI (3%), /h 40.1±20.2 0.8±0.7 <0.001Lowest SpO2, % 75±9.7 90.5±3.5 <0.001AHI, apnea-hypopnea index; BMI, body mass index; ODI, oxygen desaturation index; SpO2, peripheral oxygen saturation
Table 2. Aortic arch calcification grades in the study groupsAortic arch calcification (n, %)
OSA (+) (n=204)
OSA (-) (n=200) P value
Grade 0 62 (30.3) 135 (67.5) <0.0001Grade 1 86 (42.1) 50 (25) <0.001Grade 2 45 (22) 14 (7) <0.001Grade 3 10 (4.9) 1 (0.5) <0.001OSA, obstructive sleep apnea
Table 3. Univariate analysis for obstructive sleep apneaVariables β P valueAge 0.172 <0.001Male 0.006 0.056BMI 0.201 <0.001Smoker -0.186 0.103Hypertension (%) 0.526 0.048Diabetes mellitus (%) 0.438 0.301Total cholesterol (mg/dL) -0.012 0.235Triglyceride (mg/dL) -0.002 0.089Antihypertensive drug 0.490 0.044Antidiabetic drug 0.042 0.382AHI 0.212 <0.001Aruosal index 0.282 <0.001ODI (%3) 0.224 <0.001Lowest SpO2 -0.134 0.001AHI, apnea-hypopnea index; BMI, body mass index; ODI, oxygen desaturation index; SpO2, periphral oxyen saturation
Table 4. Correlations between OSA and AACAortic arch calcification (%) β P valueGrade 0 Reference categoryGrade 1 1.384 <0.0001Grade 2 1.846 <0.0001Grade 3 2.698 0.006ACC, aortic arch calcification; OSA, obstructive sleep apnea
Table 5. Multivariate analysis for obstructive sleep apneaVariables β OR Lower UpperAge 0.014 1.014 0.978 1.034Body mass index 0.035 1.036 0.987 1.089Hypertension 0.060 1.062 0.658 1.690Triglyceride -0.002 0.985 0.989 0.996Presence of aortic arch calcification 1.362 3.923 2.396 6.328
AHI 0.15 1.018 0.985 1.049Male 0.15 1.008 0.964 1.027AHI, apnea-hypopnea index

782
Zorlu Ç. Calcification and obstructive sleep apnea J Health Sci Med 2021; 4(6): 779-783
arterial wall is part of atherosclerosis and is not found in normal vessels (19).
Oxidative stress and inflammatory reaction in OSA lead to increased arterial stiffness , carotid intima-media thickness and CAD progression (20-22). OSA is frequently seen in patients with aortic aneurysms and dissection and it has been suggested that negative intrathoracic pressure may play a role in the development or worsening of these pathologies. Additionally, negative intrathoracic pressure is thought to cause basal atherosclerotic changes in the aorta (23,24).
AAC has been presented as a substitution marker for atherosclerosis to better reflect the total burden of atherosclerosis (25). Atherosclerosis may be suspected if ACC is present in the chest radiography evaluation in OSA patients, and so patients can be stratified by their risk of atherosclerosis (26). In addition, Patients with higher risk for atherosclerosis can be distinguished by investigating the presence of ACC in patients with OSA. Most of the parameters that are indicators of subclinical atherosclerosis do not provide additional information other than the prediction of subclinical atherosclerosis (27-29). On the other hand, chest radiography is generally used in OSA, health checks unrelated to OSA, and in various clinical settings.
In this study, we have demonstrated that the presence of AAC is strongly associated with OSA. New studies are also needed to confirm our findings and, in addition, to assess the possible relationship of AAC and OSA by classifying by severity.
Study LimitationsThe main limitation of the study is the small number of participants included in the study. OSA is categorized as no/mild, moderate, and severe. However, we did not examine OSA by classifying it by severity.
CONCLUSIONOUA is strongly and independently associated with ACC presence on plain chest radiography. This simple assessment allows us to distinguish patients with OSA based on their risk of developing subclinical atherosclerosis.
ETHICAL DECLARATIONSEthics Committee Approval: The study was carried out with the permission of Tokat Gaziosmanpaşa University Faculty of Medicine Clinical Research Ethics Committee (Date: 19.08.2020, Decision No: 20-KAEK-122).Informed Consent: Because the study was designed retrospectively, no written informed consent form was obtained from patients.
Referee Evaluation Process: Externally peer-reviewed. Conflict of Interest Statement: The authors have no conflicts of interest to declare. Financial Disclosure: The authors declared that this study has received no financial support. Author Contributions: All of the authors declare that they have all participated in the design, execution, and analysis of the paper, and that they have approved the final version. Congress Information: The abstract text was presented at the 36th Turkish Cardiology Congress with international participation at 03.12.2020.
REFERENCES1. Somers VK, White DP, Amin R. Sleep apnea and cardiovascular
disease. Circulation 2008; 118: 1080–111.2. Kepez A, Niksarlıoğlu EY, Hazırolan T, et al. Evaluation of
association between obstructive sleep apnea and coronary risk scores predicted by tomographic coronary calcium scoring in asymptomatic patients. Anadolu Kardiyol Derg 2011: 428-35.
3. Kasai T, Floras JS, Bradley TD. Sleep apnea and cardiovascular disease: A bidirectional relationship. Circulation 2012; 126: 1495–510.
4. Korkmaz L, Adar A, Korkmaz A, et al. Aortic knob calcification and coronary artery lesion complexity in non-ST-segment elevation acute coronary syndrome patients. Turk Kardiyol Dern Ars 2012; 40: 606-11.
5. Sorajja D, Gami AS, Somers VK. Independent association between obstructive sleep apnea and subclinical coronary artery disease. Chest 2008; 133: 927–33.
6. Pressman GS, Crudu V, Parameswaran-Chandrika A, RomeroCorral A, Purushottam B, Figueredo VM. Can total cardiac calcium predict the coronary calcium score? Int J Cardiol 2011; 146: 202–6.
7. Levey AS, Stevens LA, Schmid CH, et al. A new equation to estimate glomerular filtration rate. Ann Intern Med 2009; 150: 604-12.
8. Silber MH, Ancoli-Israel S, Bonnet MH, et al. The visual scoring of sleep in adults. J Clin Sleep Med 2007; 3: 121-31.
9. Symeonidis G, Papanas N, Giannakis I, et al. Gravity of aortic arch calcification as evaluated in adult Greek patients. Int Angiol 2002; 21: 233-6.
10. Sahn D.J, Maris A, Kisslo J. For the committee on M-mode standardization of the American Society of Echocardiography Recommendation regarding quantitation in M-mode echocardiographic measurements. Circulation 1978; 58: 1072-83.
11. Strauss RS, Browner WS. Risk for obstructive sleep apnea. Ann Intern Med 2000; 132: 758-9.
12. Hedner J, Grote L. Cardiovascular consequences of obstructive sleep apnea. Eur Respir Mon 1998; 10: 227-65.
13. Phillips B. Sleep-disordered breathing and cardiovascula rdisease. Sleep Med Rev 2005; 9: 131-40.
14. Paris JM, Somers VK. Obstructive sleep apnea and cardiovascular disease. Mayo Clin Proc 2004; 79: 1036-46.
15. Yokoe T, Minoguchi K, Matsuo H. Elevated levels of C-reactive protein and interleukin-6 in patients with obstructive sleep apnea syndrome are decreased by nasal continuous positive air way pressure. Circulation 2003;107: 1129- 33.
16. Schäfer H, Koehler U, Ploch T, Peter JH. Sleep-related myocardial ischemia and sleep structure in patients with obstructive sleep apnea and coronary heart disease. Chest 1997; 111: 387-93.
783
Zorlu Ç. Calcification and obstructive sleep apneaJ Health Sci Med 2021; 4(6): 779-783
17. Punjabi NM, Sorkin JD, Katzel LI, Goldberg AP, Schwartz AR, Smith PL. Sleep-disordered breathing and insulin resistance in middle-aged and overweight men. Am J Respir Crit Care Med 2002; 165: 677-82.
18. Coughlin SR, Mawdsley L, Mugarza JA. Obstructive sleep apnea is indepently associated with an increased prevalence of metabolic syndrome Eur Heart J 2004; 25: 735-41.
19. Mintz GS, Popma JJ, Pichard AD, et al. Patterns of calcification in coronary artery disease. A statistical analysis of intravascular ultrasound and coronary angiography in 1155 lesions. Circulation. 1995; 91: 1959-65.
20. Stary HC, Chandler AB, Dinsmore RE, et al. A definition of advanced types of atherosclerotic lesions and a histological classification of atherosclerosis. A report from the Committee on Vascular Lesions of the Council on Arteriosclerosis, American Heart Association. Arterioscler Thromb Vasc Biol 1995; 15: 1512-31.
21. Kinoshita T, Yahaba M, Terada J, et al. Impact of arterial stiffness on WatchPAT variables in patients with obstructive sleep apnea. J Clin Sleep Med 2018; 14: 319-25.
22. Drager LF, Bortolotto LA, Figueiredo AC, Krieger EM, Lorenzi GF. Effects of continuous positive airway pressure on early signs of atherosclerosis in obstructive sleep apnea. Am J Respir Crit CareMed 2007; 176: 706-12.
23. Shpilsky D, Erqou S, Patel SR, et al. Association of obstructive sleep apnea with microvascular endothelial dysfunction and subclinical coronary artery disease in a community-based population. Vasc Med 2018; 23: 331-9.
24. Mason RH, Ruegg G, Perkins J, et al. Obstructive sleep apnea in patients with abdominal aortic aneurysms: highly prevalent and associated with aneurysm expansion. Am J Respir Crit Care Med 2011; 183: 668-74.
25. Korkmaz L, Erkan H, Korkmaz AA, et al. Relationship of aortic knob width with cardio-ankle vascular stiffness index and its value in diagnosis of subclinical atherosclerosis in hypertensive patients: a study on diagnostic accuracy. Anadolu Kardiyol Derg 2012; 12: 102-6.
26. Bos D, Leening MJ, Kavousi M, et al. Comparison of atherosclerotic calcification in major vessel beds on the risk of all-cause and cause-specific mortality: The Rotterdam study. Circ Cardiovasc Imaging 2015; 8: e003843.
27. Tomita Y, Kasai T, Ishiwata S, Daida H, Narui K. Aortic knob width as a novel ındicator of atherosclerosis and obstructive sleep apnea. J Atheroscler Thromb 2020; 27: 501-8.
28. Zylla S, Dörr M, Völzke H, et al. Association of circulating chemerin with subclinical parameters of atherosclerosis: results of a population-based study. Arterioscler Thromb Vasc Biol 2018; 38: 1656-64.
29. Franzago M, Fraticelli F, DiNicola M, et al E. Early subclinical atherosclerosis in gestational diabetes: the predictive role of routine biomarkers and nutrigenetic variants. J Diabetes Res 2018; 2018: 9242579.

HEALTH SCIENCESMEDICINE
Original Article
J Health Sci Med 2021; 4(6): 784-789
This work is licensed under a Creative Commons Attribution 4.0 International License.
DOI: 10.32322/jhsm.960328
Received: 30.06.2021 Accepted: 28.08.2021Corresponding Author: Songül Keskin Kavak, [email protected]
The relationship of sensorimotor and function with activities of daily living and disease specific parametres in patients with rheumatoid arthritis
Songül Keskin Kavak1, Nebahat Sezer2, Lale Aktekin21University of Health Sciences, Dr. Abdurrahman Yurtaslan Ankara Oncology Training and Research Hospital, Department of Physical Therapy and Rehabilitation, Ankara, Turkey2Ankara Yıldırım Beyazıt University Faculty of Medicine, Department of Physical Therapy and Rehabilitation, Ankara, Turkey
Cite this article as: Keskin Kavak S, Sezer N, Aktekin L. The relationship of sensorimotor and function with activities of dailyliving and disease specific parametres in patients with rheumatoid arthritis. J Health Sci Med 2021; 4(6): 784-789.
ABSTRACTObjective: To evaluate the level of effect on the sensorimotor functions of the hand in patients with rheumatoid arthritis (RA) and investigate the relationship between this level and patients’ daily life activities and disease-specific parameters.Material and Method: This case-control study involved the evaluation of 80 patients with RA and 50 healthy volunteers aged 20-65 years. The coarse and fine grip strength of the patients was evaluated with hand dynamometer and pinch meter. The sensory evaluation of the hand was undertaken using the Semmes-Weinstein monofilament test (SWMT). The hand skill level was evaluated with Duru Oz Hand Index (DHI). The daily living activities of the patients were investigated using the Health Assessment Questionnaire (HAQ). The Disease Activity Score 28 (DAS28) was used to evaluate disease activity.Results: The mean DAS28 score of the RA group was at a mild level (DAS 28 <3.2). No statistically significant difference was found between the RA group and the control group in terms of daily life activities (HAQ scores). The grip strength and the hand skill level (DHI) were statistically significantly lower in the RA group compared to the control group. In the sensory examination of the RA group using SWMT, while 83% of the patients were evaluated as normal, 15% were determined to have diminished light touch sensation. However, there was no statistical difference between the RA and control groups in terms of sensory evaluation.Conclusion: As a result of the quantitative evaluations used in our study, the RA group was determined to have impaired fine skills and grip strength. Consistent with the literature, these findings had a negative effect on the daily life activities and function of these patients. In our knowledge there is no study with SMWT in RA patients. In our study, there wasn’t statistical difference between the RA and control groups in terms of sensory evaluation with SMWT. Because of our patients have low disease activity, further studies are needed in patients with higher disease activity for evaluation sensorial functions.Keywords: Rheumatoid arthritis, health assessment questionnaire, disease activity score, Semmes-Weinstein monofilament test
Ana Metin-Alt bilgi Arası 5mm
Cite-Öz arası 5mm
Başlık-Yazarlar arası 12mmv
Yazar-Kurum arası 2,5 mmvcv
Kurum-Cite arası 5mm
Öz-Abstract arası 7,5mmvc
INTRODUCTIONRheumatoid arthritis (RA) is a systemic disease characterized by symmetrical chronic arthritis that can affect all synovial joints, especially the wrist and small joints of the hand (1,2). Impairment of anatomical integrity, limitations in the range of motion, loss of muscle strength, possible sensory problems, pain, and swelling are the main problems that impair the ability to use hands in RA (1,3).
Since the focus is mostly on pain and inflammation control in patients with RA, a sensorimotor evaluation can be overlooked. In this study, we aimed to evaluate the
level of effect on the sensorimotor functions of the hand in patients with RA and to investigate the relationship between this level and patients’ daily life activities and disease-specific parameters (4,5). Accordingly, it is very important to perform detailed motor and sensory examinations in this patient group. Since impairment in the hand functions of these patients can negatively affect their daily lives and make them dependent on others, they should be closely monitored and early rehabilitative treatment methods should be applied before the loss of function (6,7).

785
Keskin Kavak et al. Sensorimotor and function in patients with rheumatoid arthritis J Health Sci Med 2021; 4(6): 784-789
MATERIAL AND METHODThe study was carried out with the permission of Ankara Yıldırım Beyazıt University Faculty of Medicine Clinical Researchs Ethics Committee (Date: 17/12/2014, Decision No: 243). All procedures were carried out in accordance with the ethical rules and the principles of the Declaration of Helsinki.
This case-control study involved the evaluation of 80 patients diagnosed with RA and 50 healthy volunteers that presented to the physical medicine and rehabilitation outpatient clinic of Training and Research Hospital between January 2015 and June 2015. All individuals were informed about the study and signed the informed consent form. Patients who were diagnosed with RA according to the EULAR/ACR criteria and had cognitive function sufficient to comprehend evaluations to be made during the study were included in the sample while those with orthopedic, traumatic, neurological and endocrinological disorders that previously caused sensory or motor impairment in the hand and upper extremities were excluded.
Hand Function AssessmentThe Duru öz Hand Index (DHI) was used to evaluate the fine skill functions of the hands.
DHI is a self-reported questionnaire developed to evaluate the hand function limitations of patients with RA. It consists of 18 items inquiring about hand skills in kitchen, dressing, personal hygiene and work activities and other general movements. The function of both hands is scored as follows= 0-40 for kitchen work, 0-10 for dressing, hygiene and office work, and 0-20 for the ‘other’ category. The score ranges between 0 (no difficulty) and 5 (impossible) in performing daily life activities. (8,9)
The Semmes-Weinstein monofilament test (SWMT) was used for the sensory evaluation of the hands. SWMT is a diagnostic test used to reveal sensory problems and objectively measure the touch threshold. SWMT has two kits of 20 and five pieces. In the current study, the patients were evaluated with a monofilament set consisting of five monofilaments at four different power levels. In this set, the green monofilament (log1.65-2.83) is evaluated as normal, blue monofilament (log3.22-3.61) as diminished light touch, purple monofilament (log3.84-4.31) as diminished protective sensation, red monofilament (log4.56-6.65) as loss of protective sensation, and white monofilament (>log6.65) as un detectable sensation.
Grip strength was evaluated with a digital hand dynamometer and pinch meter. A Baseline® hydraulic hand dynamometer was used to evaluate the coarse grip strength of the hands. Finger grip strength was assessed
with a Baseline® pinch meter. Measurements were made bilaterally from three different positions (lateral, fingertip, and palmar). Each bilateral measurement was performed three times and averaged. (10)
Disease Activity Score (DAS28)In this study, disease activity was evaluated with the DAS28 scoring system. The basic criteria of this system are the sensitivity of the joints, number of swollen joints, sedimentation, and general health assessment using the Visual Analog Scale (VAS). (11)
Health Assessment Questionnaire (HAQ)HAQ was used to evaluate the daily life activities of the patients. HAQ is a health assessment questionnaire developed to evaluate rheumatic diseases, especially RA. It consists of 20 questions under eight activity domains inquiring about daily tasks, namely dressing/general care, sitting/standing up, eating, walking, hygiene, lying down, and grip. Each response is graded from 0 to 3. The HAQ score reflects functional status and its score has been shown to correlate with disease activity indicators. (12)
Statistical AnalysisStatistical analyses were carried out using the Statistical Package for the Social Sciences (IBM SPSS Statistics 14). Frequency tables and descriptive statistics were used in the interpretation of findings. Non-parametric methods were used for measurement values that were not suitable for normal distribution. The Mann-Whitney U test (Z-table value) was employed to compare the measurement values of two independent groups in accordance with the parametric methods. The Spearman correlation coefficient was used to examine the relationships between two non-normally distributed quantitative variables. P value <0.05 was accepted as statistically significant.
RESULTSThe demographic characteristics of the 80 patients with RA and 50 healthy volunteers constituting the control group are given in Table 1.
Table 1. Sociodemographic data tableRA Group Control Group
n % N %Age, years20-35 6 7.5 5 1035-50 22 27.5 22 4450-65 52 65 23 46GenderFemale 66 82.5 39 78Male 14 17.5 11 22 RA, rheumatoid arthritis

786
Keskin Kavak et al. Sensorimotor and function in patients with rheumatoid arthritisJ Health Sci Med 2021; 4(6): 784-789
While 65% of 80 patients with RA were seropositive, 35% were seronegative. There was no patient with systemic involvement. The mean disease duration in the RA group was 7.09±5.64 months. The dominant hand was right in 78 patients (96%) and left in two (4%) while all controls were right-handed. The mean DAS28 value of the patients with RA was 3.17±0.82, and according to this result, their disease activity was detected to be at a mild (<3.2) level. As an inclusion criterion, patients without hand deformities were included in the sample.
The mean HAQ score was 0.37±1.45for the RA group and 0.61±0.42 for the control group. No statistically significant difference was found between the two groups in terms of daily life activities (p> 0.05). The mean DHI was 4.67±7.58 and 0.02±0.14 in the RA and control groups, respectively, indicating a statistically significant deterioration in the fine skills of the hands in the former compared to the latter (p <0.001).
DAS28, HAQ and DHI Scores and Their Relationship with Disease DurationThe relationship of the DAS28, HAQ and DHI scores with disease duration among the 80 patients in the RA group is presented in Table 2. A positive significant correlation was found between disease activity and DHI in the RA group (r=0.483, p=0.001). There was also a significant positive correlation between disease activity and quality of life scores (r=0.504, p=0.001). However, no significant correlation was observed between disease duration and disease activity level (p> 0.05). P value <0.05 was accepted as statistically significant.
Relationship between the SWMT Results, DAS28, DHI and HAQ Scores and Disease Duration in the RA GroupIn the sensory examination of the RA group using SWMT, 83% (n=67) of the patients were evaluated as normal with the green monofilament (log 1.65-2.83), 15% (n=12) as diminished light touch sensation with the blue monofilament (log 3.22-3.61), and only 1.3% (n=1) as diminished protective sensation with the purple filament. For all the healthy controls, the SWMT sensory evaluation result was normal with the green monofilament. However, no statistical difference was found in the sensory evaluation results of the RA and control groups (p> 0.05). P value <0.05 was accepted as statistically significant.
In the RA group, we also divided the SWMT sensory examination results into group 1 (green monofilament/normal) and group 2 (blue monofilament/diminished light touch sensation) for further analyses. We found no statistical difference between groups 1 and 2 in terms of the DAS28, HAQ and DHI scores and disease duration (p> 0.05).
Relationship between Grip and Pinch Values and DAS28, DHI, HAQ Scores of the RA GroupA negative correlation was found between the grip and pinch values and DAS28, DHI and HAQ scores, and this was a statistically significant level (p <0.001). Increased disease activity and decreased hand dexterity significantly affected the grip function of the hands in the patients with RA. P value <0.05 was accepted as statistically significant.
Table 2. DAS28, HAQ and DHI scores and their relationship with each other and disease duration in the RA group
DAS28 HAQ DHIDHI P=0.001
r=0.483p=0.001 r=0.865
DAS28 p=0.001 r=0.504
p=0.001 r=0.483
HAQ p=0.001r=0.504
p=0.001r=0.865
Disease duration p=0.087 r=0.193
p=0.031 r=0.241
p=0.036 r=0.234
RA, rheumatoid arthritis; DAS, Disease Activity Score; HAQ, Health Assessment Questionnaire; DHI, Duru Oz Hand Index
Table 4. Relationship between grip and pinch values and DAS28, DHI, HAQ scores of the RA groupRight hand
gripLeft hand
gripRight lateral
pinchLeft lateral
pinchRight tip
pinchLeft tip pinch Right palmar
pinchLeft palmar
pinchDAS 28 p=0.001
r=-0.497p=0.001 r=-0.526
p=0.001 r=-0.459
p=0.001 r=-0.439
p=0.001 r=-0.371
p=0.001 r=-0.348
p=0.001 r=-0.491
p=0.001 r=-0.450
DHI p=0.001 r=-0.545
p=0.001 r=-0.583
p=0.001 r=-0.601
p=0.001 r=-0.572
p=0.001 r=-0.487
p=0.001 r=-0.402
p=0.001 r=-0.575
p=0.001 r=-0.531
HAQ p=0.001 r=-0.556
p=0.001 r=-0.581
p=0.001 r=-0.566
p=0.001 r=-0.513
p=0.001 r=-0.482
p=0.001 r=-0.452
p=0.001 r=-0.598
p= 0.001 r=-0.575
RA, rheumatoid arthritis; DAS, Disease Activity Score; HAQ, Health Assessment Questionnaire; DHI, Duru Oz Hand Index
Table 3. Relationship between the SWMT results, DAS28, DHI and HAQ scores and disease duration in the RA group
DAS28 DHI HAQ Disease duration
SWMT Group 1 (green) 3.15±077 4.71±7.9 0.4±1.5 6.46±4.7
SWMT Group 2 (blue) 3.26±1.08 4.58±5.48 4.58±5.48 10.5±8.8
P value 0.6 0.54 0.54 0.19RA, rheumatoid arthritis; DAS, Disease Activity Score; HAQ, Health Assessment Questionnaire; DHI, Duru Oz Hand Index; SWMT, Semmes-Weinstein monofilament test

787
Keskin Kavak et al. Sensorimotor and function in patients with rheumatoid arthritis J Health Sci Med 2021; 4(6): 784-789
Relationship between Wrist Dorsiflexion Limitation and HAQ, DHI and DAS28 ScoresThe relationship between wrist dorsiflexion limitation and HAQ, DHI and DAS28 scores was evaluated with the Spearman correlation test. There were no volunteers with wrist dorsiflexion limitation in the control group. In the RA group, we observed that as wrist dorsiflexion limitation increased, the HAQ, DHI and DAS28 scores increased, but this increase was not statistically significant (p>0.05). P value <0.05 was accepted as statistically significant.
DISCUSSIONIn this study, we evaluated hand sensorimotor functions in patients with RA and investigated their relationship with daily life activities and disease specific parameters. In the literature, the sensory evaluation of the hands in patients with RA has not been addressed as much as motor evaluation. However, it has been reported that proinflammatory cytokines and proteolytic enzymes, which are shown to be produced by tenosynovium in patients with RA, may cause sensory disturbances by affecting mechanoreceptors found in the tendons and myotendinous junctions (13). Therefore, the second stage of our study was designed to include a sensory evaluation.
In the literature, many tests and scales have been used in the evaluation of sensorimotor functions. DHI, which was developed by Duru Oz et al. (8,14,15) in 1996, has entered clinical practice as a self-report scale for the assessment and monitoring of functional disability in rheumatoid hands. In a study conducted with 102 patients with RA, Dedeoğlu et al. (16) find a strong relationship between daily life activity (HAQ) and hand function (DHI) . In our study, there was no statistical difference between the RA and control groups in terms of the HAQ scores. However, a significant correlation was detected between daily life activities (HAQ) and hand skill functions (DHI). This finding is an indication that hand functions occupy an important place in daily life activities. In our study, the mean DHI of the RA group was higher than that of the control group. Although there was no difference in the HAQ scores between the two groups, the statistical difference observed in the DHI
averages proves once again that tests evaluating manual skills better reflect hand functions in rheumatoid hands than a general health assessment.
In a study in which 151 female and 45 male patients with RA were included, it was shown that increased disease activity significantly affected the daily life in RA patients (17). In another study 752 patients with RA were followed up for three years and the patients with low DAS28 scores were found to have higher quality of life(18). In our study, consistent with the literature, a significant correlation was observed between the daily life activities and disease activity scores of the patients. Similar to our findings, Birtane et al. (19) who evaluated 48 patients with RA, reported strong correlations between disease activity, daily life activities and hand functions. In another study, Özeri et al. (20) determined that functional impairment of the hand, disability, and joint damage had a strong relationship with disease duration, wrist range of motion, and grip strength in patients with RA.As a result, the authors argued that wrist range of motion and grip strength could be used to predict disability and joint damage in clinical practice.
Silva et al., comparing patients with RA and controls, found that the grip strength decreased in the RA group with high DAS28 activity (21). Similarly, in our study, a significant correlation was found between both fine skill and grip functions of the hands and disease activity scores. The increase in disease activity negatively was observed to negatively affect the quality of life and hand functions the patients.
In a study in which 153 patients with RA were retrospectively evaluated, there was a significant correlation between the HAQ and DAS28 scores, and a strong correlation between increased disease duration and disease activity (22). In our study, daily life activities and hand functions were significantly affected in the RA group among the patients with a longer disease duration, while a weaker correlation was observed between disease duration and activity. We consider this to be due to the low disease activity scores of the RA cases included in our study.
There was a negative correlation between the grip and pinch values and disease activity, daily life activities, and fine skill level in our patients with RA, and this was found to be at a statistically significant level. Consistent with the literature (23), We consider that diminished grip strength significantly affects daily life activities and hand dexterity functions and is an important cause of disability. Supporting our findings, Dedeoğlu et al. (16) also found a significant negative relationship between hand grip strength and finger grip strength, as well as hand functions and general disability level.
Table 5. Relationship between wrist dorsiflexion limitation and HAQ, DHI and DAS28 scores in the RA group
Right wrist dorsiflexion limitation
Left wrist dorsiflexion limitation
HAQ p=0.596 r=0.06 p=0.679 r=0.04DHI p=0.201 r=0.144 p=0.385 r=0.098DAS28 p=0.157 r=0.16 p=0.172 r=0.154RA, rheumatoid arthritis; HAQ, Health Assessment Questionnaire; DHI, Duru Oz Hand Index; DAS, Disease Activity Score

788
Keskin Kavak et al. Sensorimotor and function in patients with rheumatoid arthritisJ Health Sci Med 2021; 4(6): 784-789
It was determined that the increase in wrist dorsiflexion limitation affect the daily life activities and hand functions of the patients and resulted in an increase their disease activity scores. In parallel with our study, in a study conducted by Taştekin et al. (24), limitations in the range of motion and impaired hand functions were determined to cause difficulties in daily life activities.
SWMT is a quantitative method for sensory evaluation. In the literature, it has mostly been employed in diseases such as tendon damage, diabetic neuropathy, and carpal tunnel syndrome (25-27). In a study by Silva et al. (28), patients with systemic sclerosis accompanied by distal phalanx deformities were compared with another patient group without deformity, and the former was found to have diminished light touch. In our knowledge there is no study with SMWT in RA patients. In our study, there was no statistical difference between the RA and control groups in terms of sensory evaluation with SMWT.
Potential limitations of our study are that the number of patients was relatively small and have low disease activity and no hand deformity. Another limitation of our study is that subgroups with chronic diseases such as DM, cervical radicular pain etc. were not differentiated.
CONCLUSIONAs a result of the quantitative evaluations used in our study, the RA group was determined to have impaired fine skills and grip strength. Consistent with the literature, these findings had a negative effect on the daily life activities and function of these patients. SMWT sensory examination results were not statistically different between RA patients and control group. Because of our patients have low disease activity, further studies are needed in patients with higher disease activity for evaluation sensorial functions.
ETHICAL DECLARATIONSEthics Committee Approval: The study was carried out with the permission of Ankara Yıldırım Beyazıt University Faculty of Medicine Clinical Researchs Ethics Committee (Date: 17/12/2014, Decision No: 243).Informed Consent: All patients signed the free and informed consent form.Referee Evaluation Process: Externally peer-reviewed. Conflict of Interest Statement: The authors have no conflicts of interest to declare. Financial Disclosure: The authors declared that this study has received no financial support. Author Contributions: All of the authors declare that they have all participated in the design, execution, and analysis of the paper, and that they have approved the final version.
REFERENCES1. Towheed TE, Anastassiades TP. Rheumatoid hand practical
approach to assessment and management. Can Fam Physician 1994; 40: 1303-9.
2. Dellhag B, Bjelle A. A five-year followup of hand function and activities of daily living in rheumatoid arthritis patients. Arthritis care and research, 1999, 12: 33-41.
3. Bodur H, Yilmaz O, Keskin D. Hand disability and related variables in patients with rheumatoid arthritis. Rheumatology international, 2006, 26.6: 541-544.
4. Calder KM, Martın A, Lydiate J, MacDermid J, Galea V, MacIntyre N. Sensory nerve action potentials and sensory perception in women with arthritis of the hand. J Neuroengineer Rehabil 2012; 9: 27-37.
5. Muramatsu K, Tanaka H, Taguchi T. Peripheral neuropathies of the forearm and hand in rheumatoid arthritis: diagnosis and options for treatment. Rheumatol Int 2008; 28: 951-7. 9.
6. Dellhag B, Hosseini N, Bremel T, Ingvarsson PE. Disturbed grip function in women with rheumatoid arthritis. J Rheumatol 2001; 28: 2624-33. 9.
7. Dellhag B, Burckhardt CS. Predictors of hand function in patients with rheumatoid arthritis. Arthrit Rheumat 1995; 8: 16-20.
8. Duruöz M T, Poiraudeau S, Fermanian J, et al. Development and validation of a rheumatoid hand functional disability scale that assesses functional handicap. Journal Rheumatol 1996; 23: 1167-72.
9. Mathiowetz V, Weber K, Kashman N. Adult norms for the nine hole peg test of finger dexterity. OTJR: Occupat Participat Health 1985; 5: 24-38.
10. Mathiowetz V, Weber K, Kashman N, Volland G, et al. Grip and pinch strength evaluations. J Hand Surg 1984; 9A: 223-5.
11. M Van Riel, Kanıtlanmış romatoid artritli hastaların değerlendirilmesi ve sonuçları. (Karatay S Çev.Ed) Hochberg romatoloji cilt 1. Rota Tıp yayıevi İzmir 2011; 357-64.
12. Küçükdeveci AA, Sahin H, Ataman S, Griffiths B, Tennant A. Issues in cross-cultural validity: example from the adaptation, reliability, and validity testing of a Turkish version of the Stanford Health Assessment Questionnaire. Arthritis Rheum 2004; 51: 14.
13. Erol A M,Ceceli E, Ramadan S, Borman P. Sensory examination of rheumatoid hand and the relationship with magnetic resonance imaging findings. Ege Tıp Derg / Ege J Med 2014; 53: 200-20.
14. Duruöz MT. Romatizmal hastalıkların değerlendirilmesinde kullanılan fonksiyonel el göstergeleri. Türk Fiz Tıp Rehab Derg 1998; 3: 44.
15. Gürçay E, Alanoğlu E, Tuncay R,Uşan H, Çakçı A. Romatoid elde Duruöz el skalasının ve kavrama beceri testinin değerlendirilmesi. Turkiye Klinikleri J Physic Med Rehabilit 2004, 4: 1-6.
16. Dedeoğlu M, Gafuroğlu U, Yılmaz Ö, Bodur H. The relationship between hand grip and pinch strengths and disease activity, articular damage, pain, and disability in patients with rheumatoid arthritis.Turk J Rheumatol 2013; 28: 69-77.
17. Prajs K, Fliciński J, Brzosko I, Przepiera-Bedzak H, Ostanek L, Brzosko M. Quality of life and activity of disease in patients with rheumatoid arthritis. Ann Acad Med Stetin 2006; 52: 39-43.
18. Gullick NJ, Ibrahım F, Scott IC, et al. Real world long term impact of intensive treatment on disease activity, disability and health-related quality of life in rheumatoid arthritis. BMC Rheumatol 2019; 3: 6.
19. Birtane M, Kabayel D, Uzunca K, et al. The relation of hand functions with radiological damage and disease activity in rheumatoid arthritis. Rheumatol Int 2008, 28: 407-12.
20. Özeri Z, Duyur Çakıt B, Taşkın S, Genç H, Saraçoğlu M, Erdem HR. The Relationships Among Functional Impairment, Disability and Articular Damage in Rheumatoid Hand. FTR Bil Der J PMR Sci 2008; 2: 53-8.

789
Keskin Kavak et al. Sensorimotor and function in patients with rheumatoid arthritis J Health Sci Med 2021; 4(6): 784-789
21. Silva G, Lourenço M, Assis M. Hand strength in patients with RA corralates strongly with functıon but not with activity of disease. Adv Rheumatol 2018; 58: 20.
22. Çetin E, Çağlar N, Örnek GT, et al. Demographic and clinical properties and the current medical treatments. Istanbul Med J 2010; 11: 154-8.
23. Wolfe F, Cathey MA. The assessment and prediction of functional disability in rheumatoid arthritis.J Rheumatol 1991; 18: 1298-306.
24. Taştekin N, Uzunca K, Birtane M, Kabayel D, Öztürk G. Romatoid artritli hastalarda, el eklemlerindeki hareket açıklığı ve el kavrama kuvvetlerinin hastalık aktivasyonu, el fonksiyonları ve özürlülük ile ilişkisi. Romatizma 2006; 21: 13-7.
25. Craig AB, Strauss MB, Daniller A, Miller S. Foot sensation testing in the patient with diabetes: introduction of the quick and easy assessment tool. Wounds 2014; 26: 221-31.
26. Raji P, Ansari NN, Naghdi S , Forogh B, Hasson S. Relationship between Semmes-Weinstein monofilaments perception test and sensory nerve conduction studies in carpal tunnel syndrome. J NeuroRehabilitation 2014; 35: 543-52.
27. McCallister WV, Ambrose HC, Katolik LI, Trumble TE. Comparison of pullout button versus suture anchor for zone I flexor tendon repair. J Hand Surg Am 2006; 31: 246-51.
28. Silva PG, Jones A, Araujo PM, Natour JÜ. Assessment of light touch sensation in the hands of systemic sclerosis patients. Clinics (Sao Paulo) 2014; 69: 585.

HEALTH SCIENCESMEDICINE
Original Article
J Health Sci Med 2021; 4(6): 790-794
This work is licensed under a Creative Commons Attribution 4.0 International License.
DOI: 10.32322/jhsm.962703
Received: 05.07.2021 Accepted: 11.08.2021Corresponding Author: İbrahim Güven Çoşğun, [email protected]
Knowledge and attitude of physicians for the diagnosis and management of obstructive sleep apnea
İbrahim Güven Çoşğun1, Şule Çilekar1, Aydın Balcı1, Ersin Günay21Afyonkarahisar Health Sciences University, Department of Pulmonology, Afyonkarahisar, Turkey2Yüksek İhtisas University, Faculty of Medicine, Department of Pulmonology, VM Medical Park Hospital, Ankara, Turkey
Cite this article as: Coşğun İG, Çilekar Ş, Balcı A, Günay E. Knowledge and attitude of physicians for the diagnosis and management of obstructive sleep apnea. J Health Sci Med 2021; 4(6): 790-794.
ABSTRACTIntroduction: Obstructive sleep apnea (OSA) is a disease characterized by recurrent complete (apnea) or partial (hypopnea) upper respiratory tract obstructions episodes during sleep and often a decrease in blood oxygen saturation. The knowledge and attitude of physicians about OSA is very important as it influences the level of clinical suspicion of OSA which can lead to diagnose. Therefore, aim of this study was to evaluate the knowledge of and attitude to OSA of physicians.
Material and Method: This descriptive, cross-sectional survey study included 105 physicians in a university hospital. Participants completed the Obstructive Sleep Apnea Knowledge and Attitudes (OSAKA) questionnaire through the face-to-face interview method.
Results:The study respondents comprised 55 (52.8%) males and 50 (47.6%) females with a mean age of 34.4±7.3 years (range, 23-59 years). The years of experience was mean 10.45±7.37 years (range, 1–35 years). The knowledge level of physicians was mean score of 11.56±2.70 (64.1%). Attitude section, the mean score was 16.34±2.47 from a possible maximum of 25. A positive correlation was determined between the knowledge and the attitude scores of the physicians (r: 0.467 p<0.001).
Conclusion: These findings suggest that importance of the level of knowledge of physicians about OSA for early diagnosis and provision of treatment.
Keywords: Obstructive sleep apnea, physician, knowledge, attitude, survey, questionnaire, assessment
Ana Metin-Alt bilgi Arası 5mm
Cite-Öz arası 5mm
Başlık-Yazarlar arası 12mm
Yazar-Kurum arası 2,5 mmvv
Kurum-Cite arası 5mm
Öz-Abstract arası 7,5mm
INTRODUCTIONObstructive sleep apnea (OSA) is a disease characterized by recurrent complete (apnea) or partial (hypopnea) upper respiratory tract obstructions episodes during sleep and often a decrease in blood oxygen saturation (1). OSA is most common type of sleep-related breathing disorder (2). As a consequence of increasing obesity rates in the general population, the frequency of OSA is also rising (3). Untreated OSA causes cardiovascular diseases, decreases cognitive functioning, glucose intolerance and leads to metabolic diseases (4-7). OSA is an independent risk factor for developing hypertension (8). Daytime tiredness resulting from OSA may also cause traffic accidents resulting in morbidity and mortality (9).
Obstructive sleep apnea is quantified by the apnea–hypopnea index (AHI), which reflects the number of apneas and hypopneas per hour. Apnea–hypopnea index is derived after scoring data obtained using multi-
channel polysomnography (PSG). PSG is considered the gold standard method for diagnosing OSA (10). Many individuals worldwide suffer from undiagnosed OSA (11). At ≥5 events/h apnea-hypopnea index (AHI), the overall population prevalence ranged from 9% to 38% and was higher in men (12). OSA is affecting nearly 9% of women and 24% of men in the general middle-aged population (13). Studies have suggested that educational interventions for physicians are needed to improve the identification and treatment of patients with OSA (14). The knowledge and attitude of physicians about OSA is very important as it influences the level of clinical suspicion of OSA which will lead to diagnose. The knowledge level and attitude of physicians about OSA and it has been emphasized that these differences affect the management of OSA (15-17). This study aims to evaluate the knowledge and attitude of physicians about obstructive sleep apnea.

791
Coşğun et al. Knowledge and attitude of physicians for OSA J Health Sci Med 2021; 4(6): 790-794
MATERIAL AND METHODThis study was designed as a prospective, descriptive, cross-sectional questionnaire study, which was conducted in Afyonkarahisar Health Sciences University Medical Faculty hospital between February 2020 and April 2020.
Ethical ApprovalApproval for this study was granted by the Clinical Researchs Ethics Committee of Afyonkarahisar Health Sciences University (Date: 07.02.20, Decision No: 2020/2 KAEK-2). All procedures were carried out in accordance with the ethical rules and the principles of the Declaration of Helsinki.
Sampling and Data CollectionThe study included 105 physicians who worked in Afyonkarahisar Health Sciences University Medical Faculty Hospital and agreed to participate. In face-to-face interviews, the study participants completed the Obstructive Sleep Apnea Knowledge and Attitudes (OSAKA) questionnaire. The OSAKA questionnaire was developed by Schotland and Jeffe to evaluate the knowledge and attitudes of physicians about OSA syndrome (OSAS) (18). In a study of medical faculty students by Çelik, the Turkish version of the OSAKA questionnaire was determined to be a valid measurement tool with Turkish translation and cultural adaptation according to the criteria of Guillemin et al (19,20).
The OSAKA questionnaire consists of 18 items measuring the level of knowledge of OSAS, and 5 items to evaluate attitudes to OSAS (Table 1). The items which measure the level of knowledge include questions related to epidemiology, pathophysiology, symptoms, diagnosis and treatment, which are answered with 3 options of “true”, “false”, and “I don’t know”. The response of “I don’t know” is accepted as false. In the calculation of the total knowledge points, a correct response is scored with 1 point and false or I don’t know with 0 points. The total points are divided by 18 to provide a percentage. Of the 5 items evaluating attitudes to OSAS, the first 2 items are related to the clinical importance of OSAS. The reponse to these items are scored on a 5-point Likert-type scale from 1 (not important) to 5 (extremely important) (not important=1, somewhat important=2, Important=3, very important=4, extremely important=5).The other 3 items are related to confidence about diagnosis and treatment, with response scored from 1 (I strongly do not agree) to 5 (I strongly agree) (strongly disagree=1, disagree=2, neither agree nor disagree=3, agree=4, strongly agree=5). The demographic characteristics of the study participants were recorded.
Statistical Analysis Data obtained in the study were analyzed statistically using IBM SPSS 25 software (IBM Corpn., Armonk, NY, USA). Descriptive statistics of the data were stated as mean±standard deviation values. Conformity of the data to normal distribution was assessed with the Kolmogorov-Smirnov test. In the analysis of independent quantitative data, the Mann Whitney U-test was used, and for the analysis of qualitative independent data, the Chi-square test was applied. A value of p<0.05 was accepted as statistically significant. It was determined that a sample size of 84 was required to represent the population, with a sampling error of 5% at a 80% power.
RESULTSThe 105 physicians included in the study comprised 55 (52.8%) males and 50 (47.6%) females with a mean age of 34.4±7.3 years (range, 23-59 years). The mean years of experience were recorded 10.45±7.37 years (range, 1–35 years). The demographic data of the study participants are shown in Table 2.
Table 1. The obstructive sleep apnea knowledge questionnaire1. Women with obstructive sleep apnea may present with fatigue
only.2. Uvulopalatopharyngoplasty is curative for a majority of people
with obstructive sleep apnea. 3. The estimated prevalence of obstructive sleep apnea among
adults is between 2% and 10%.4. The majority of patients with obstructive sleep apnea snore. 5. Obstructive sleep apnea is associated with hypertension.6. An overnight sleep study is the gold standard for diagnosing
obstructive sleep apnea. 7. CPAP (continuous positive airway pressure) therapy may cause
nasal obstruction.8. Laser-assisted uvuloplasty is an appropriate treatment for
severe obstructive sleep apnea. 9. The loss of upper airway muscle tone during sleep contributes
to obstructive sleep apnea. 10. The most common cause of obstructive sleep apnea in children
is the presence of large tonsils and adenoids.11. A craniofacial and oropharyngeal examination is useful in the
assessment of patients with suspected obstructive sleep apnea.12. Alcohol at bedtime improves obstructive sleep apnea.13. Untreated obstructive sleep apnea is associated with a higher
incidence of automobile crashes. 14. In men, collar size 17 inches or greater is associated with
obstructive sleep apnea.15. Obstructive sleep apnea is more common in women than in
men.16. CPAP is the first-line therapy for severe obstructive sleep
apnea. 17. Fewer than 5 apneas or hypopneas per hour is normal in
adults. 18. Cardiac arrhythmias may be associated with untreated
obstructive sleep

792
Coşğun et al. Knowledge and attitude of physicians for OSAJ Health Sci Med 2021; 4(6): 790-794
OSAS Knowledge Level The mean score of the OSAKA responses for the knowledge section was 11.56±2.70 (64,1%). The knowledge section points are shown in Table 3. No statistically significant difference was determined between the mean knowledge points of males (11.67±2.86, 64,7%,) and females (11.44±2.54, 63,4%) (p=0.056). No statistically significant difference was determined between the years of professional experience and the knowledge points (p>0,05). The percentages of true and false responses in the knowledge category of the OSAKA questionnaire are shown in Figure 1. The highest rate of correct responses (92%) was given to the item, “untreated OSAS is associated with an increased incidence of traffic accidents”. The lowest rate of correct responses (20%) was given to the item, “uvulopalatopharyngoplasty is curative in most OSAS patients”.
OSAS Attitude Level In the attitude section of the OSAKA questionnaire, the mean score was 16.34±2.47 from a possible maximum of 25. The highest points were determined in response to the item, “OSAS is important as a clinical disorder”, to which 72% of the respondents stated that it was very important and extremely important. The lowest points (23%) were in reponse the item “I am confident in my management of patients receiving CPAP”.
Correlation between the Knowledge and Attitude LevelsA moderate level positive correlation was determined between the knowledge and the attitude scores of the respondents (r: 0.467 p<0.001).
DISCUSSIONThe level of knowledge and attitudes of physicians to OSAS were evaluated in this study. In this study, the total correct mean knowledge score was 64%. Physicians do not routinely engage in formal postgraduate training programs. The level of physicans knowledge at the time of graduation from medical school affect the quality of their practice after graduation. In a study by Schotland and Jeffe (18), who developed the OSAKA questionnaire, the level of knowledge of physicians in a university hospital in the USA was determined to be 76% . Wang et al. (21) measured the level of knowledge of anesthesia specialists in China and reported a score of 62%, while in another study of anesthesia specialists in Italy, the knowledge level score was found to be 66% (22). In a study by Deveraj (23) in Kuala Lumpur, the knowledge level score was determined to be 64.38% for primary level physicians in healthcare clinics treating inpatients and outpatients. Medical Faculty students in Nigeria were evaluated in another study and the knowledge level score was found to be 42% (24). In a previous study in Turkey, the knowledge level score of medical faculty students was reported to be 61% (19).
The score for the level of knowledge obtained in the current study was seen to be lower than that of the study by Schotland and Jeffe. In this study level of knowledge was similar to the scores reported by Wang and Deveraj and the study of medical faculty students in Turkey. Our results was higher than that of the medical faculty students in Nigeria. In the study by Schotland and Jeffe (18), a negative correlation was observed between age and the knowledge level score. No such correlation was determined in the current study, and there was no correlation between the years of professional experience and knowledge level. Furthermore, consistent with the findings of previous studies, there was no statistically significant difference in the knowledge level scores according to gender.
Within the items related to attitude, 72% of the respondents in the current study stated that OSAS was very important or extremely important as a clinical disorder. This response rate was determined to be higher compared to the study by Deveraj (23) (59%) and similar to the rates reported by Southwell (17) (68%) and Ojeda et al. (25) (72%). In the previous study of Turkish medical students, this rate was found to be 79% (18). Of the current study
Table 2. Sociodemographic characteristics of the participantsSocio-demographic characteristics
Frequency. n (%) n=105
Mean (SD)
Age (year) 34.4±7.3Years of Experience 10.45±7.37
Men 55 (52.8%)Women 50 (47.6%)
Table 3. Knowledge scores of participants regarding OSAKnowledge Score, N (%) Mean (SD)Gender
Men (n:55) 64.76 11.67±2.86Women (n:50) 63.49 11.44±2.54
Figure 1. The frequency and percent of correct responses to questions on knowledge among the participants regarding OSA

793
Coşğun et al. Knowledge and attitude of physicians for OSA J Health Sci Med 2021; 4(6): 790-794
participants, 21% stated that they were comfortable with their management of OSAS patients, which was similar to the result of the study by Deveraj (23%). In that same study, 7% of the primary level physicians were confident in their management of CPAP treatment, while this rate was found to be 23% in the current study. The responses of primary level physicians to the same question were determined to be 22% by Ojeda et al. (25) and 26% by Al-Khafaji et al. (16). This rate was determined as 21,3% in the study of Turkish medical students (19). The confident in their management of CPAP obtained in the current study was seen to be similar to the previusly studies.
Previosly studies have demonstrated that the positive correlation between knowledge and attitude scores. Al-Khafaji (16) found that primer care physicians have weak level correlation (r:0.142). Medical Faculty students in Nigeria have weak level correlation (r:0.142) (24). Solanski (14) and Corso (22) evaluated anesthesia specialists they found moderate correlation (respectively r:0.37; r:0.40). In a previous study in Turkey, correlation level of medical faculty students was reported weak (r:0.156) (19). Our results (r:0.467) was higher than that medical faculty students, similar that anesthesia specialists. The positive correlation between knowledge and attitude scores suggests that physicians with a better understanding of OSA-related problems are more confident in selecting the safest method for its management.
LimitationsThis study had some limitations. The findings of this study must be interpreted in light of its limitations. First this was a cross-sectional survey of physicians in a university hospital.
Study group was formed only of physicians in a university hospital, and so there was a relatively low number of participants. Thus, we cannot infer causation from any of the associations we observed, and we also cannot generalize our results to physicians. It is a cross-sectional study and cannot establish the causal relationship between low knowledge and low education programs. Other potential factors, not assessed in this study, that may have influenced responses include the specialization and access to sleep specialists and sleep laboratories. However, a strong aspect of the study was that to avoid systematic prejudice, the questionnaires were completed in face-to-face interviews.
CONCLUSIONThe knowledge and attitudes about OSAS of physicians in a university hospital were evaluated in this study. The results demonstrated a positive correlation between the knowledge level scores and the attitude scores. Although the knowledge and attitude levels were seen to be similar
to those reported in previous studies, they were not at the expected level. This likely contributes to the rate of OSA underdiagnosis. Management of patients with OSA is linked to a variety of factors, including the personal knowledge, clinical experience. The results of this study emphasize the importance of the level of knowledge of physicians about treatment options for OSA for early diagnosis and provision of treatment to be able to bring the disease under control. Physicians need to enhance awareness of OSA. Education of OSA for physicians need to improve knowledge and management of this important and prevalent disorder.
ETHICAL DECLARATIONSEthics Committee Approval: Approval for this study was granted by the Clinical Research Ethics Committee of Afyonkarahisar Health Sciences University (Date: 07.02.20, Decision No: 2020/2 KAEK-2).Informed Consent: Informed consent was obtained from all individual participants included in the study.Referee Evaluation Process: Externally peer-reviewed. Conflict of Interest Statement: The authors have no conflicts of interest to declare. Financial Disclosure: The authors declared that this study has received no financial support. Author Contributions: All of the authors declare that they have all participated in the design, execution, and analysis of the paper, and that they have approved the final version. Acknowledgments: The authors thanks Medical Faculty Student Fatih Sarı, Kadir Can İlhan, Semih Sarı, Onuralp Özalp, Elif Sevim, Hilal Ergün for contributions this study.
REFERENCES1. Roeder M, Sievi NA, Kohler M, Schwarz EI. Predictors of changes
in subjective daytime sleepiness in response to CPAP therapy withdrawal in OSA: A post-hoc analysis. J Sleep Res 2021; 30: e13078.
2. Meszaros M, Tarnoki AD, Tarnoki DL, et al. Obstructive sleep apnea and hypertriglyceridaemia share common genetic background: Results of a twin study. J Sleep Res 2020; 29: e12979.
3. Flegal KM, Carroll MD, Ogden CL, Johnson CL. Prevalence and trends in obesity among US adults. JAMA 2002; 288: 1723–7.
4. Alaçam Z, Pekcan S, Akdağ B, Şenol H. The Relationship of hemogram parameters and night desaturation in patients diagnosed with obstructive sleep apnea syndrome. J Turk Sleep Med 2018; 5: 62-6.
5. Dursunoglu D, Dursunoglu N. Cardiovascular diseases in obstructive sleep apnea. Tuberk Toraks 2006; 54: 382–96.
6. Zhang RH, Zhao W, Shu LP, et al. Obstructive sleep apnea is associated with coronary microvascular dysfunction: A systematic review from a clinical perspective. J Sleep Res 2020; 29: e13046.
7. Alvarez-Sabín J, Romero O, Delgado P, et al. Obstructive sleep apnea and silent cerebral infarction in hypertensive individuals. J Sleep Res 2018; 27: 232-9.

794
Coşğun et al. Knowledge and attitude of physicians for OSAJ Health Sci Med 2021; 4(6): 790-794
8. Floras JS. Hypertension and sleep apnea. Can J Cardiol 2015; 31: 889-97.
9. Turkington PM, Sircar M, Allgar V, Elliott MW. Relationship between obstructive sleep apnoea, driving simulator performance, and risk of road traffic accidents. Thorax 2001; 56: 800-5.
10. Escourrou P, Grote L, Penzel T, et al. ESADA Study Group. The diagnostic method has a strong influence on classification of obstructive sleep apnea. J Sleep Res 2015; 24: 730-8.
11. Young T, Evans L, Finn L, Palta M. Estimation of the clinically diagnosed proportion of sleep apnea syndrome in middle-aged men and women. Sleep 1997; 20: 705-6.
12. Senaratna CV, Perret JL, Lodge CJ, et al. Prevalence of obstructive sleep apnea in the general population: A systematic review. Sleep Med Rev 2017; 34: 70-81.
13. Young T, Palta M, Dempsey J, Skatrud J, Weber S, Badr S. The occurrence of sleep-disordered breathing among middle-aged adults. N Engl J Med 1993; 29; 328: 1230-5.
14. Solanki SL, Karan N, Parab SY. Obstructive sleep apnoea and its knowledge and attitude among Indian anaesthesiolgists - A survey study. Indian J Anaesth 2019; 63: 648-52.
15. Ozoh OB, Iwuala SO, Desalu OO, Ojo OO, Okubadejo NU. An assessment of the knowledge and attitudes of graduating medical students in Lagos, Nigeria, regarding obstructive sleep apnea. Ann Am Thorac Soc 2015; 12: 1358-63.
16. Al-Khafaji H, Bilgay IB, Tamim H, Hoteit R, Assaf G. Knowledge and attitude of primary care physicians towards obstructive sleep apnea in the Middle East and North Africa Region. Sleep Breath 2021; 25: 579-85.
17. Southwell C, Moallem M, Auckley D. Cardiologist's knowledge and attitudes about obstructive sleep apnea: a survey study. Sleep Breath 2008; 12: 295-302.
18. Schotland HM, Jeffe DB. Development of the obstructive sleep apnea knowledge and attitudes (OSAKA) questionnaire. Sleep Med 2003; 4: 443-50. Erratum in: Sleep Med 2008; 9: 705.
19. Çelik, M. An assessment of the knowledge and attitudes of medical students about obstructive sleep apnea syndrome via obstructive sleep apnea knowledge and attitudes questionnaire. KBB Uygulamaları 2020; 8: 89-96.
20. Guillemin F, Bombardier C, Beaton D. Cross-cultural adaptation of health-related quality of life measures: literature review and proposed guidelines. J Clin Epidemiol 1993; 46: 1417-32.
21. Wang CL, Li XZ, Cai XL, Pan XL, Min J. Anesthesiologist's knowledge and attitude about obstructive sleep Apnea: a survey study. Sleep Breath 2012; 16: 41-6.
22. Corso RM, Sorbello M, Buccioli M, et al. G. Survey of knowledge and attitudes about obstructive sleep apnoea among Italian anaesthetists. Turk J Anaesthesiol Reanim 2017; 45: 146-52.
23. Devaraj NK. Knowledge, attitude, and practice regarding obstructive sleep apnea among primary care physicians. Sleep Breath 2020; 24: 1581-90.
24. Ozoh OB, Iwuala SO, Desalu OO, Ojo OO, Okubadejo NU. An assessment of the knowledge and attitudes of graduating medical students in Lagos, Nigeria, regarding obstructive sleep apnea. Ann Am Thorac Soc 2015; 12: 1358-63.
25. Cherrez Ojeda I, Jeffe DB, Guerrero T, et al. Attitudes and knowledge about obstructive sleep apnea among Latin American primary care physicians. Sleep Med 2013; 14: 973-7.
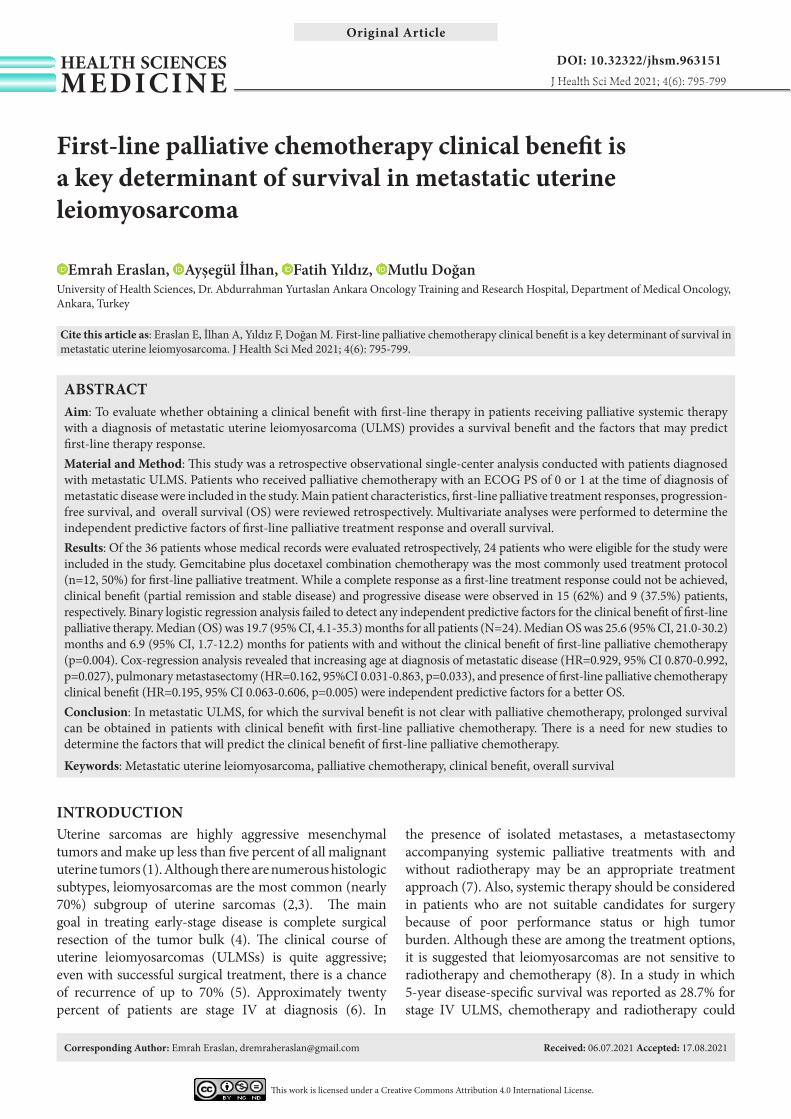
HEALTH SCIENCESMEDICINE
Original Article
J Health Sci Med 2021; 4(6): 795-799
This work is licensed under a Creative Commons Attribution 4.0 International License.
DOI: 10.32322/jhsm.963151
Received: 06.07.2021 Accepted: 17.08.2021Corresponding Author: Emrah Eraslan, [email protected]
First-line palliative chemotherapy clinical benefit is a key determinant of survival in metastatic uterine leiomyosarcoma
Emrah Eraslan, Ayşegül İlhan, Fatih Yıldız, Mutlu DoğanUniversity of Health Sciences, Dr. Abdurrahman Yurtaslan Ankara Oncology Training and Research Hospital, Department of Medical Oncology, Ankara, Turkey
Cite this article as: Eraslan E, İlhan A, Yıldız F, Doğan M. First-line palliative chemotherapy clinical benefit is a key determinant of survival in metastatic uterine leiomyosarcoma. J Health Sci Med 2021; 4(6): 795-799.
ABSTRACTAim: To evaluate whether obtaining a clinical benefit with first-line therapy in patients receiving palliative systemic therapy with a diagnosis of metastatic uterine leiomyosarcoma (ULMS) provides a survival benefit and the factors that may predict first-line therapy response.Material and Method: This study was a retrospective observational single-center analysis conducted with patients diagnosed with metastatic ULMS. Patients who received palliative chemotherapy with an ECOG PS of 0 or 1 at the time of diagnosis of metastatic disease were included in the study. Main patient characteristics, first-line palliative treatment responses, progression-free survival, and overall survival (OS) were reviewed retrospectively. Multivariate analyses were performed to determine the independent predictive factors of first-line palliative treatment response and overall survival.Results: Of the 36 patients whose medical records were evaluated retrospectively, 24 patients who were eligible for the study were included in the study. Gemcitabine plus docetaxel combination chemotherapy was the most commonly used treatment protocol (n=12, 50%) for first-line palliative treatment. While a complete response as a first-line treatment response could not be achieved, clinical benefit (partial remission and stable disease) and progressive disease were observed in 15 (62%) and 9 (37.5%) patients, respectively. Binary logistic regression analysis failed to detect any independent predictive factors for the clinical benefit of first-line palliative therapy. Median (OS) was 19.7 (95% CI, 4.1-35.3) months for all patients (N=24). Median OS was 25.6 (95% CI, 21.0-30.2) months and 6.9 (95% CI, 1.7-12.2) months for patients with and without the clinical benefit of first-line palliative chemotherapy (p=0.004). Cox-regression analysis revealed that increasing age at diagnosis of metastatic disease (HR=0.929, 95% CI 0.870-0.992, p=0.027), pulmonary metastasectomy (HR=0.162, 95%CI 0.031-0.863, p=0.033), and presence of first-line palliative chemotherapy clinical benefit (HR=0.195, 95% CI 0.063-0.606, p=0.005) were independent predictive factors for a better OS.Conclusion: In metastatic ULMS, for which the survival benefit is not clear with palliative chemotherapy, prolonged survival can be obtained in patients with clinical benefit with first-line palliative chemotherapy. There is a need for new studies to determine the factors that will predict the clinical benefit of first-line palliative chemotherapy.
Keywords: Metastatic uterine leiomyosarcoma, palliative chemotherapy, clinical benefit, overall survival
Ana Metin-Alt bilgi Arası 5mm
Cite-Öz arası 5mm
Başlık-Yazarlar arası 12mm
Yazar-Kurum arası 2,5 mm
Kurum-Cite arası 5mm
Öz-Abstract arası 7,5mm
INTRODUCTIONUterine sarcomas are highly aggressive mesenchymal tumors and make up less than five percent of all malignant uterine tumors (1). Although there are numerous histologic subtypes, leiomyosarcomas are the most common (nearly 70%) subgroup of uterine sarcomas (2,3). The main goal in treating early-stage disease is complete surgical resection of the tumor bulk (4). The clinical course of uterine leiomyosarcomas (ULMSs) is quite aggressive; even with successful surgical treatment, there is a chance of recurrence of up to 70% (5). Approximately twenty percent of patients are stage IV at diagnosis (6). In
the presence of isolated metastases, a metastasectomy accompanying systemic palliative treatments with and without radiotherapy may be an appropriate treatment approach (7). Also, systemic therapy should be considered in patients who are not suitable candidates for surgery because of poor performance status or high tumor burden. Although these are among the treatment options, it is suggested that leiomyosarcomas are not sensitive to radiotherapy and chemotherapy (8). In a study in which 5-year disease-specific survival was reported as 28.7% for stage IV ULMS, chemotherapy and radiotherapy could

796
Eraslan et al. Chemotherapy benefit predicts survival in metastatic ULMS J Health Sci Med 2021; 4(6): 795-799
not have been shown to provide a survival benefit (6). Although there is no agreed-upon chemotherapy regimen for the treatment of advanced ULMS, the addition of docetaxel to gemcitabine monotherapy resulted in both better objective treatment response and improved survival for soft tissue sarcomas (9).
In our study, we aimed to evaluate whether obtaining a clinical benefit with first-line therapy in patients receiving palliative systemic therapy with the diagnosis of metastatic ULMS provides a survival benefit and the factors that may predict first-line therapy response.
MATERIAL AND METHODThis study was a retrospective observational single-center analysis conducted with patients with a diagnosis of metastatic ULMS.Ethical approval was obtained University of Health Sciences Dr. Abdurrahman Yurtaslan Ankara Oncology Training and Research Hospital Clinical Researchs Ethics Committee (Date: 13.01.2021, Decision No: 2021-01/942). All procedures were carried out in accordance with the ethical rules and the principles of the Declaration of Helsinki. Patients who received palliative chemotherapy in the medical oncology clinic of the University of Health Sciences Dr. Dr. Abdurrahman Yurtaslan Ankara Oncology Training and Research Hospital between December 2010 and February 2021 were included. Medical records in the hospital data processing system and patient files were reviewed retrospectively. Patients older than 18 years of age and only those with an ECOG PS of 0 or 1 at the time of diagnosis of metastatic disease were included. Patients with an ECOG PS of 2 or more were excluded from the study. Patients’ demographic characteristics, stages at the time of diagnosis, adjuvant treatment modalities, recurrence time, metastatic sites, whether metastasis surgery was performed, systemic palliative treatments, systemic treatment response rates were recorded. Time to metastasis was estimated as the time from surgery to the development of metastasis for patients who underwent curative surgery and zeroed for metastatic patients at diagnosis. Patients who achieved clinical benefit (complete response, partial remission, stable disease) or progressive disease response with first-line therapy were identified. Factors that may affect the clinical benefit of first-line therapy were evaluated. For first-line palliative systemic therapy, progression-free survival was defined as the time from initiation of therapy to progression. Overall survival (OS) was defined as the time from diagnosis of metastatic disease to death or last follow-up. Overall survival analysis was performed of patients with and without clinical benefit from first-line palliative therapy. Prognostic factors that could predict OS were analyzed. Study results were compared with the literature data.
Statistical AnalysisDescriptive statistics were used to show the distribution of the main characteristics of the population. A binary logistic regression model was constructed that includes factors that could predict the clinical benefit of first-line palliative systemic therapy. Survival rates were estimated using the Kaplan-Meier method, and groups were compared using the log-rank test for difference in survival. A Cox regression model was carried out that includes crucial factors that could predict death. Statistical analysis was performed using SPSS software (SPSS for Windows, version 24.0, SPSS Inc., Chicago, USA). All statistical tests were two-sided, and a P <0.05 value was considered statistically significant.
RESULTS Medical records of 36 patients with metastatic ULMS were reviewed retrospectively. Eight patients with an ECOG PS of 2 or higher and four patients with insufficient medical records were excluded. Twenty-four patients with a median age of 54.9 (35.8-70.7) were included in our study. The median follow-up time was 13.3 (range, 2.3-58.8) months. Four (16.7%) patients were in the metastatic stage, and 20 (83.3%) patients underwent curative primary surgical treatment with an early-stage disease at the initial diagnosis. Median time to the metastatic stage was 17.1 (range, 0.0-123.6) months. The most common site of metastasis (n=20, 83.3%) was lung, and 5 (20.8%) patients underwent pulmonary metastasectomy. Main patient and disease characteristics are shown in Table 1.
Table 1. Main patient and disease characteristics
Parameter Number (N=24) Percent (%)
Age, median (range) 54.9 35.8-70.7Menopausal status
Premenopausal 10 41.7Postmenopausal 14 58.3
Stage at first diagnosisStage I 14 58.3Stage II 1 4.2Stage III 4 16.7Stage IV 5 20.8
Presence of metastases at diagnosis 4 16.7Primary surgery 20 83.3Adjuvant chemotherapy 10 41.7Adjuvant radiotherapy 2 8.3Metastasis sites
Lung 20 83.3Peritoneum 7 29.2Bone 4 16.7Liver 4 16.7Lymph node 2 8.3Only Lung 10 41.7Lung with other sites 10 41.7Only extrapulmonary 4 16.7
Metastasectomy 5 20.8

797
Eraslan et al. Chemotherapy benefit predicts survival in metastatic ULMSJ Health Sci Med 2021; 4(6): 795-799
Twenty-four patients included in the study were given various palliative chemotherapy regimens. In addition, patients had received one to four lines of palliative systemic chemotherapy. Gemcitabine plus docetaxel combined chemotherapy was given most frequently (n=20, 50.0%) as first-line treatment. While clinical benefit was obtained with first-line chemotherapy in 15 (62.5%) patients, the first-line treatment response of 9 (37.5%) patients was progressive disease. Median progression-free survival with first-line chemotherapy was 6.1 (95% CI, 1.5-10.7) months. First-line chemotherapy regimens, the responses obtained with first-line treatment, and the number of patients receiving further treatments are shown in Table 2.
Median OS was 19.7 (95% CI, 4.1-35.3) months for all patients (N=24) (Figure 1A). The OS rate at 36 months was 22.3% for all patients. Median OS was 25.6 (95% CI, 21.0-30.2) months and 6.9 (95% CI, 1.7-12.2) months for patients with and without the clinical benefit of first-line palliative chemotherapy, respectively (p=0.004) (Figure 1B). The OS rate at 36 months was 28.3% and 11.1% for patients with and without the clinical benefit
of first-line palliative chemotherapy, respectively. In the binary logistic regression analysis, in which factors (age, menopausal status, stage at diagnosis, primary surgical treatment, adjuvant chemotherapy, adjuvant radiotherapy, site of metastasis, time to metastasis) that may affect the benefit of first-line palliative chemotherapy were included, no independent predictive factor was found to predict the benefit of first-line palliative chemotherapy.
In Cox-regression analysis including factors that may predict OS, increasing age at diagnosis of metastatic disease (HR=0.929, 95% CI 0.870-0.992, p=0.027), pulmonary metastasectomy (HR=0.162, 95%CI 0.031-0.863, p=0.033), and presence of first-line palliative chemotherapy clinical benefit (HR=0.195, 95% CI 0.063-0.606, p=0.005) were independent predictive factors for a better OS (Table 3).
Table 2. Features associated with palliative chemotherapies
Parameter Number (N=24)
Percent (%)
First- line chemotherapy Gemcitabine plus docetaxel 12 50.0IMA 8 33.3Others 4 16.7
Best response with first-line chemotherapyPartial remission 4 16.7Stable disease 11 45.8Progressive disease 9 37.5Clinic benefit rate (CR + PR + SD) 15 62.5
Patients receiving second-line therapy 13 54.2Patients receiving third-line therapy 9 37.5Patients receiving fourth-line therapy 3 12.5IMA, chemotherapy scheme consisting of ifosfamide, mesna and adriamycin; CR, complete response; PR, partial remission; SD, stable disease
Table 3. Cox-regression analysis results including factors that may predict overall survival
Parameter HR95% CI
p-valueLower Upper
Age 0.929 0.870 0.992 0.027Presence of metastases at diagnosis (Yes vs No) 2.706 0.525 13.952 0.234
Time to metastasis 1.005 0.980 1.030 0.726Only extrapulmonary metastasis (Yes vs No) 3.205 0.660 15.549 0.148
Metastasectomy (Yes vs No) 0.162 0.031 0.863 0.033
First-line CTx clinical benefit (Yes vs No) 0.195 0.063 0.606 0.005
CTx, chemotherapy
Figure 1. Kaplan-Meier curves of overall survival, A: Plot of all patients receiving palliative chemotherapy, B: Comparative plot of patients with and without the clinical benefit of first-line palliative chemotherapy.

798
Eraslan et al. Chemotherapy benefit predicts survival in metastatic ULMS J Health Sci Med 2021; 4(6): 795-799
DISCUSSIONIn our study, we observed that OS of patients who achieved clinical benefit with first-line palliative chemotherapy was better than those whose chemotherapy response was in the form of progressive disease. However, we were unable to demonstrate any independent predictive factors that could predict first-line therapy response. In multivariate analysis, we found that increasing age at diagnosis of metastatic disease, metastasectomy, and clinical benefit from first-line palliative chemotherapy were independent predictive factors for a better OS.
Leiomyosarcomas constitute the most common histological subtype of all soft tissue sarcomas (10). However, studies mainly cover all soft tissue sarcomas and include gastrointestinal stromal tumors that differ in their clinical course and treatment. The majority of studies evaluating the efficacy of chemotherapy in patients with advanced or metastatic uterine sarcoma concluded with negative results and no survival benefit (11). Moreover, since ULMS is a very rare disease, it is challenging to conduct a study in this patient group, and the literature data on chemotherapy efficacy for ULMS is limited. In a phase II study in which Hensley et al. (12) evaluated the efficacy of gemcitabine plus docetaxel treatment in 29 patients with metastatic ULMS, they achieved an objective response (complete and partial remission) in 53% of the patients. Also, PFS and OS were reported at approximately six months and 18 months, respectively, in the same study (12). Although the treatment response rate in our study was considerably lower than that of Hensley et al., the PFS and OS in our study were almost the same as in this study. In addition, in another phase II study by Hensley et al. (13), an objective response rate of 35.8%, approximately 4.5 months, and 16 months PFS and OS was obtained with fixed-dose rate gemcitabine plus docetaxel as first-line therapy for metastatic ULMS. The OS range in this study was quite wide, ranging from 4 to 41.3 months, and some patients lived very long with gemcitabine plus docetaxel therapy (13). Similarly, there was a fairly wide OS range in our study. In addition, there is a 17% difference between patients who are alive at the end of the third year compared to patients who have clinical benefit from first-line chemotherapy and those who do not. The literature data as mentioned above and our results suggest that chemotherapy may be beneficial for OS in some patients with metastatic ULMS. To the best of our knowledge, no prospective randomized study in which a significant OS benefit with chemotherapy for metastatic ULMS can be clearly demonstrated. However, in an observational cohort study of 7455 patients based on the 1998-2013 National Cancer Database by Seagle et al. (14), chemotherapy was associated with 8.5 (19.4 vs. 10.9, p<0.001) months increased survival of women with metastatic leiomyosarcoma.
In a phase III study in which patients with a metastatic soft tissue sarcoma diagnosis showed a significant improvement of 12% in the overall response rate and nearly three months in PFS with the addition of ifosfamide to doxorubicin monotherapy, but no significant difference in OS (15). In this study, ULMS was not examined as a separate group, and factors that could predict death were not evaluated statistically. However, in the phase III GeDDiS study involving 257 patients with treatment-naive metastatic soft tissue sarcoma, no difference was observed between patients treated with gemcitabine plus docetaxel and doxorubicin in terms of treatment response rates, PFS, and OS (16). Although a subgroup analysis was performed comparing leiomyosarcomas with other sarcoma subtypes and ULMS with other sarcoma subtypes, no subgroup analysis was performed in terms of factors that would predict treatment response (16). In order to minimize the effect of other factors on survival, we included patients with an ECOG PS of 0 or 1 at the start of treatment. Although we demonstrated in our study that providing disease control with first-line palliative chemotherapy was associated with more prolonged survival, we could not detect any factor that could predict treatment response. This result can be explained by the small number of patients and the retrospective nature of our study. However, there is a lack of literature data regarding the factors that can predict the palliative systemic treatment response in ULMS.
Previous studies have demonstrated that big tumor size, high mitotic index, high grade, advanced stage, advanced age, and inadequate surgical treatment are negative prognostic factors for ULMS (5,6,17,18). However, none of these studies evaluated patients receiving palliative chemotherapy for the advanced disease alone. Our study differs from these studies in that the patient profile is a more specific group, and for this reason, we think that our study is valuable. In our study, increasing age at diagnosis of metastatic disease, metastasectomy, and clinical benefit from first-line palliative chemotherapy were positive prognostic factors. Bernstein-Molho et al. (19) observed a survival difference of approximately 14 months with metastasectomy in a study involving 33 patients with metastatic ULMS. In an analysis of 128 patients with recurrent ULMS, secondary cytoreductive surgery prolonged time to recurrence (20). Moreover, in the same analysis, neither chemotherapy nor radiation showed improved outcomes in patients with recurrent ULMS (20). Also, considering the high hazard ratios in our analysis, we can say that the presence of only extrapulmonary metastases and metastatic disease at the time of diagnosis may be negative prognostic factors. The inadequacy of the number of patients in our study may be the reason for not showing statistical significance for these factors.

799
Eraslan et al. Chemotherapy benefit predicts survival in metastatic ULMSJ Health Sci Med 2021; 4(6): 795-799
CONCLUSIONIn metastatic ULMS, for which the survival benefit is not clear with palliative chemotherapy, prolonged survival can be obtained in patients with clinical benefit with first-line palliative chemotherapy. There is a need for new studies to determine the factors that will predict the clinical benefit of first-line palliative chemotherapy.
ETHICAL DECLARATIONSEthics Committee Approval: Approval for the study was given by the University of Health Sciences Dr. Abdurrahman Yurtaslan Ankara Oncology Training and Research Hospital Clinical Researchs Ethics Committee (Date: 13.01.2021, Decision No: 2021-01/942)Informed Consent: Because the study was designed retrospectively, no written informed consent form was obtained from patients.Referee Evaluation Process: Externally peer-reviewed. Conflict of Interest Statement: The authors have no conflicts of interest to declare. Financial Disclosure: The authors declared that this study has received no financial support. Author Contributions: All of the authors declare that they have all participated in the design, execution, and analysis of the paper, and that they have approved the final version.
REFERENCES1. D’Angelo E, Prat J. Uterine sarcomas: a review. Gynecol Oncol 2010;
116: 131-9.2. Society AC. Cancer facts & figures 2018. Atlanta, GA2018.3. Ricci S, Stone RL, Fader AN. Uterine leiomyosarcoma:
Epidemiology, contemporary treatment strategies and the impact of uterine morcellation. Gynecol Oncol 2017; 145: 208-16.
4. Ganjoo KN. Uterine sarcomas. Curr Probl Cancer 2019; 43: 283-8.5. Giuntoli RL, 2nd, Metzinger DS, DiMarco CS, et al. Retrospective
review of 208 patients with leiomyosarcoma of the uterus: prognostic indicators, surgical management, and adjuvant therapy. Gynecol Oncol 2003; 89: 460-9.
6. Kapp DS, Shin JY, Chan JK. Prognostic factors and survival in 1396 patients with uterine leiomyosarcomas: emphasis on impact of lymphadenectomy and oophorectomy. Cancer. 2008; 112: 820-30.
7. Kanjeekal S, Chambers A, Fung MF, Verma S. Systemic therapy for advanced uterine sarcoma: a systematic review of the literature. Gynecol Oncol 2005; 97: 624-37.
8. Li J, Chen X, Hu X. High-intensity focused ultrasound for treatment of recurrent uterine leiomyosarcoma: a case report and literature review. J Int Med Res 2020; 48: 300060520942107.
9. Maki RG, Wathen JK, Patel SR, et al. Randomized phase II study of gemcitabine and docetaxel compared with gemcitabine alone in patients with metastatic soft tissue sarcomas: results of sarcoma alliance for research through collaboration study 002. J Clin Oncol 2007; 25: 2755-63.
10. Toro JR, Travis LB, Wu HJ, Zhu K, Fletcher CD, Devesa SS. Incidence patterns of soft tissue sarcomas, regardless of primary site, in the surveillance, epidemiology and end results program, 1978-2001: An analysis of 26,758 cases. Int J Cancer 2006; 119: 2922-30.
11. Desar IME, Ottevanger PB, Benson C, van der Graaf WTA. Systemic treatment in adult uterine sarcomas. Crit Rev Oncol Hematol 2018; 122: 10-20.
12. Hensley ML, Maki R, Venkatraman E, et al. Gemcitabine and docetaxel in patients with unresectable leiomyosarcoma: results of a phase II trial. J Clin Oncol 2002; 20: 2824-31.
13. Hensley ML, Blessing JA, Mannel R, Rose PG. Fixed-dose rate gemcitabine plus docetaxel as first-line therapy for metastatic uterine leiomyosarcoma: a Gynecologic Oncology Group phase II trial. Gynecol Oncol 2008; 109: 329-34.
14. Seagle BL, Sobecki-Rausch J, Strohl AE, Shilpi A, Grace A, Shahabi S. Prognosis and treatment of uterine leiomyosarcoma: A National Cancer Database study. Gynecol Oncol 2017; 145: 61-70.
15. Judson I, Verweij J, Gelderblom H, et al. Doxorubicin alone versus intensified doxorubicin plus ifosfamide for first-line treatment of advanced or metastatic soft-tissue sarcoma: a randomised controlled phase 3 trial. Lancet Oncol 2014; 15: 415-23.
16. Seddon B, Strauss SJ, Whelan J, et al. Gemcitabine and docetaxel versus doxorubicin as first-line treatment in previously untreated advanced unresectable or metastatic soft-tissue sarcomas (GeDDiS): a randomised controlled phase 3 trial. Lancet Oncol 2017; 18: 1397-410.
17. Abeler VM, Røyne O, Thoresen S, Danielsen HE, Nesland JM, Kristensen GB. Uterine sarcomas in Norway. A histopathological and prognostic survey of a total population from 1970 to 2000 including 419 patients. Histopathology 2009; 54: 355-64.
18. Mayerhofer K, Obermair A, Windbichler G, et al. Leiomyosarcoma of the uterus: a clinicopathologic multicenter study of 71 cases. Gynecol Oncol 1999; 74: 196-201.
19. Bernstein-Molho R, Grisaro D, Soyfer V, Safra T, Merimsky O. Metastatic uterine leiomyosarcomas: a single-institution experience. Int J Gynecol Cancer 2010; 20: 255-60.
20. Giuntoli RL, 2nd, Garrett-Mayer E, Bristow RE, Gostout BS. Secondary cytoreduction in the management of recurrent uterine leiomyosarcoma. Gynecol Oncol 2007; 106: 82-8.

HEALTH SCIENCESMEDICINE
Original Article
J Health Sci Med 2021; 4(6): 800-808
This work is licensed under a Creative Commons Attribution 4.0 International License.
DOI: 10.32322/jhsm.963439
Received: 06.07.2021 Accepted: 06.08.2021Corresponding Author: Engin Kölükçü, [email protected]
Dapsone can be a new treatment option for reducing the detrimental effect of priapism
Engin Kölükçü1, Bekir Süha Parlaktaş1, Nihat Uluocak1, Faik Alev Deresoy2, Muzaffer Katar3, Velid Unsal4
1Gaziosmanpaşa University, Faculty of Medicine, Department of Urology, Tokat, Turkey2Gaziosmanpaşa University, Faculty of Medicine, Department of Pathology, Tokat, Turkey3Gaziosmanpaşa University, Faculty of Medicine, Department of Biochemistry, Tokat, Turkey4Mardin Artuklu University, Faculty of Health Sciences and Central Research Laboratory, Mardin, Turkey
Cite this article as: Kölükçü E, Parlaktaş BS, Uluocak N, Deresoy FA, Katar M, Unsal V. Dapsone can be a new treatment option for reducing the detrimental effect of priapism. J Health Sci Med 2021; 4(6): 800-808.
ABSTRACT Aim: This study aims to analyze the effect of dapsone against ischaemia-reperfusion injury on corporal tissue in a model of induced-priapism in rats.Material and Method: A total of 24 rats were randomized into three groups. Group 1 was defined as the control group. Ischaemia-reperfusion injury was evaluated following the priapism model in Group 2. Group 3 had similar procedures to the rats in Group 2. Group 3 additionally had 12.5 mg/kg dapsone administered intraperitoneally 30 minutes after priapism.Results: Biochemical analysis of blood indicated a significant increase in Group 3 in terms of superoxide dismutase (SOD), glutathione peroxidase (GSH-Px) activity and total antioxidant status (TAS) values compared with Group 2 (p:0.002, p:0.029 and p:0.009, respectively). The highest values of malondialdehyde (MDA), protein carbonyl (PC) and total oxidant status (TOS) were recorded in Group 2 (p<0.001). Interleukin 1beta (IL-1beta), Interleukin 6 (IL-6) and tumor necrosis factor alpha (TNF alpha) levels were found to be significantly decreased in Group 3 compared with Group 2 (p:0.022, p:0.049 and p<0.001, respectively). Direct microscopic evaluation determined an improvement in inflammation, edema, desquamation and vasocongestion scores in Group 3 compared to Group 2 (p<0.05).Conclusion: Dapsone has a protective effect on ischaemia-reperfusion injury in corporal tissue.
Keywords: Dapsone, priapism, ischaemia reperfusion injury, treatment
Ana Metin-Alt bilgi Arası 5mm
Cite-Öz arası 5mm
Başlık-Yazarlar arası 12mm
Yazar-Kurum arası 2,5 mm
Kurum-Cite arası 5mm
Öz-Abstract arası 7,5mm
INTRODUCTION Priapism is an urgent urologic pathology defined by full or partial tumescence lasting longer than 4 hours without sexual stimulation (1). Priapism is characterised by three different categories as ischaemic (low flow, veno-occlusive), non-ischaemic (high flow, arterial) and stuttering (intermittent, recurrent ischaemic) priapism. Ischaemic priapism is the most common form of priapism that accounts for 95% of the cases (2). It is predicted that the incidence of ischaemic priapism is between 0.34-1.5 per 100,000 person in a year (3). Basic pathophysiology of ischaemic priapism includes venous obstruction, and stasis in penile corpus cavernosa. This clinical presentation, which is known as, penile compartment syndrome, poses a threat for the vitality of penile tissues by developing anoxic, hypercarbic, acidic and glucopenic environment (2). Reoxygenation of penile corpus cavernosa is
essential for restoration of normal sexual functioning. On the other hand, after priapism is corrected with the effective treatment approaches, ischaemia-reperfusion injury occurs which leads to severe cellular damage paradoxically following the revascularization. Several different pathways are involved in the pathophysiology of ischaemia-reperfusion injury. The basic mechanism can be explained by reactive oxygen species (ROS) which are produced rapidly when dense molecular oxygen enters into the cell. ROS, which are abundant in the environment during the ischaemia-reperfusion period, render natural antioxidant mechanisms ineffective. Critically elevated levels of ROS lead to a severe tissue destruction by interacting with several vital units such as membrane lipids, macro proteins and nucleic acids (4). In this regard, keeping the ischaemia-reperfusion injury

801
Kölükçü et al. The effects of dapsone on priapism J Health Sci Med 2021; 4(6): 800-808
due to termination of priapism at the lowest levels holds critical importance for the cases to maintain a healthy sexual life afterwards. Different experimental priapism models of previous years has focused that many different molecules were used to minimise ischaemia-reperfusion injury in penile corpus cavernosa (4-9).
Dapsone (4,4’-diaminodiphenylsulfone) is a derivative of aniline that belongs to the group of synthetic sulfones exhibiting antibacterial and antiparasitic properties. It inhibits the growth of microorganisms by suppressing folic acid synthesis in a competitive manner with paraaminobenzoate, which is a critical substrate of dihydropteroate synthase. Since 1940’s, it has been included in the multidrug therapy protocol for leprosy treatment by World Health Organization (10). Additionally, different infectious diseases are also preferred in Malaria disease and Pneumocystis carinii pneumonia which is manifested in immune-suppressive patients (11). Apart from its antimicrobial properties, Dapsone shows an anti-inflammatory activity by blocking the leukocyte enzyme myeloperoxidase (10). It also activates the scavenging enzyme system and inhibits apoptosis (12,13). Recent studies have revealed that dapsone can be used effectively and safely in infective pathologies, as well as in minimizing tissue damage by exhibiting anti-inflammatory, anti-apoptotic and anti-oxidant properties against oxidative stress in many different systems such as skin, kidney, testis, heart, brain and spinal cord (11-18).
The aim of the present study is to determine the possible protective effect of dapsone against ischaemia-reperfusion injury in penile corpus cavernosa. According to our knowledge, this is the first experimental study in the English literature administering dapsone to rats with an induced-priapism model.
MATERIAL AND METHODAfter obtaining approval from the Tokat Gaziosmanpaşa University Animal Studies Ethics Committee (Date: 08.04.2021, Decision No: 2021-HADYEK-06), a total of twenty four male Wistar albino rats, 7–7.5 months old and weighing 310–350 g, were used in this study. The rats were handled in the laboratory according to institutional guidelines as well as the Guide for Care and Use of Laboratory Animals of the National Research Council. The animals were housed under standard vivarium conditions in a climate-controlled room (18–22°C, 40–60% humidity, and 12-h light/dark cycle), with free access to water and standard rodent chow. Experimental animals were divided into three groups. Group 1 was defined as the control group. Group 2 was designed as the ischaemia-reperfusion group. Group 3 included the treatment group.
All surgical procedures were performed in sterile conditions and under the appropriate depth of anesthesia. To this aim, ketamine 1 mg/kg xylazine and 50 mg / kg ketamine were used intraperitoneally.
Group 1 rats were sham group and only penectomy was performed in this group. Penile tissues were sent to pathology laboratory for histopathological examination. Additionally, blood samples were taken from inferior vena cava for biochemical analysis.
A model of priapism was performed for rats in Group 2. This model was implemented using the method previously defined by Ciftci et al (8). Accordingly, constriction bands were prepared by dividing 16 Fr silicone foley catheter into straight pieces with an approximate length of 2 mm. A 50 cc syringe was used as vacuum erection device on the penises of rats. A full penile erection was achieved by applying negative pressure with the syringe. Afterwards, a priapism model was constructed by placing constriction bands at the root of the penis (Figure 1) (6,8). Constriction bands were removed after maintaining priapism for an hour in total. Rats rested for an hour for the evaluation of ischaemia-reperfusion injury (8). Finally, penectomy was performed for histopathological examination and blood samples were obtained from their inferior vena cava for biochemical analysis.
Group 3 had similar procedures to the rats in Group 2. Group 3 additionally had a single dose of dapsone (12.5 mg /kg) administered intraperitoneally 30 minutes after priapism (11,13). Dapsone was suspended in 4.5% v/v poly (ethylene glycol)/water. Ninety minutes after the administration of dapsone, a blood sample was taken from the inferior vena cava by applying penectomy. Dapsone were provided from Sigma-Aldrich (CAS Number: 80-08-0).
Figure 1. Experimental priapism model in rat

802
Kölükçü et al. The effects of dapsone on priapismJ Health Sci Med 2021; 4(6): 800-808
At the end of the experiment, cervical dislocation was applied to all rats and their vital functions were terminated.
Biochemical Evaluation
Measurement of Malondialdehyde (MDA) Level MDA is the latest product of lipid peroxidation and is a frequently used marker as an indicator of oxidative stress. MDA reacts in an acidic environment under high temperatures with thiobarbituric acid (TBA), forming a pink compound. The optical density of this compound was measured at a wavelength of 532 nm and the MDA level was calculated. The results were measured using a standard graph prepared with standard 1,1,3,3-tetraethoxypropane serial dilutions. MDA level was expressed as μmol/L (19).
Measurement of Protein Carbonyl (PC) Level Evidence of oxidative stress manifests an increase in reactive carbonyl groups in protein oxidation. PC groups were analyzed and assessed by spectrophotometrical means at 370 nm based on the principle that hydrazine occurs as a result of the reaction of carbonyl groups of proteins with 2.4 Dinitrophenylhydrazine (DNPH) (20). PC level was expressed as nmol/ml.
Measurement of Superoxide Dismutase (SOD) ActivityThe principle of this experiment is based on the formation of violet-colored formazan compound via the superoxide radical, which is created through xanthin-xanthin oxidase system, by reducing the nitro-blue tetrazolium (NBT) compound in the environment. This compound gives maximum absorption at a wavelength of 560 nm on a spectrophotometer. In the serum added to the reaction environment, the enzyme SOD removes the formed superoxide radicals from the environment, preventing the reduction of NBT in direct proportion to its activity. Enzyme activity was calculated by comparing the absorption value found by adding SOD to the environment with the absorbent of the blind experiment in which the enzyme was not added (21). The SOD activity unit was expressed as U/L.
Measurement of Glutathione Peroxidase (GSH-Px) Activity The glutathione reductase enzyme downgrades the upgraded GSH while at the same time increasing nicotinamide adenine dinucleotide phosphate (NADPH) and transforming it into nicotinamide adenine dinucleotide (NADP). It provides NADPH absorption at a wavelength of 340 nm on the spectrophotometer. The reduction in absorption due to conversion to NADP allows measurement of GSH-Px activity (22). GSH-Px activity unit was expressed as U/L.
Measurement of Tumour Necrosis Factor-Alpha (TNF-alpha), Interleukin-1 Beta (IL-1 Beta), Interleukin-6 (IL-6) LevelsThe kits were supplied from Atlas Biotechnology (Ankara, Turkey). TNF- alpha (Cat.No E0764Ra), IL-1 beta (Cat.No E0119 Ra), and IL6 (Cat.No E0135Ra) levels measured in serums using ELISA kits according to the instructions of manufacturers. Measurement was carried out with Multiskan™ FC Microplate Photometer device. TNF- alpha and IL-1 beta were expressed as pg/ml while IL-6 ng/ml.
Measurement of Total Antioxidant Status (TAS) and Total Oxidant Status (TOS) LevelTAS and TOS levels were measured using a novel automated colorimetric method developed by Erel (23,24). TAS were expressed as mmol Trolox equivalent/L while TOS μmol H2O2 equivalent/L.
Histopathological EvaluationThe penile tissues of rats were kept in 10% buffered formalin solution for 2 days. Samples were cut by 4 µm by microtome and stained with haematoxylin and eosin solutions following the grossing and tissue preparation. Tissue slides were examined via upright light microscope (Nikon Eclipse E600). Tissue slides were assessed and scored in the categories of vasocongestion, inflammation, desquamation and edema. A semiquantitative scoring system was employed for scoring histopathological alterations in parallel to the one used by Senturk et al. These parameters were scored between 0 and 3 as follows: 0: normal, 1: mild, 2: moderate and 3: severe (25).
Statistical Method Statistical analysis in this study were conducted using the SPSS (SPSS Inc., Chicago, IL, USA) package program. Descriptive statistics were presented as mean ± standard deviation and median (min-max) depending on the data’s normal distribution. Normality distribution of the data was evaluated using the Shapiro-Wilk test. Levene’s test was used to test the homogeneity of variances. ANOVA was used for normally distributed data and Kruskal-Wallis test was used for non-normally distributed data in continuous variable comparisons between three independent groups. In order to determine the different groups after ANOVA analysis, Tukey post-hoc test was used when the assumption of homogeneity of variances was met and Games-Howell post-hoc test was used when the assumption of homogeneity of variances was not met. After the Kruskal-Wallis test, the Mann-Whitney U test with Bonferroni correction post-hoc test was used to determine the different groups. P values < 0.05 were considered statistically significant.

803
Kölükçü et al. The effects of dapsone on priapism J Health Sci Med 2021; 4(6): 800-808
RESULTSOur histopathological results are documented in Table 1. When penile tissue samples in Group 2 were examined in detail, it was determined that inflammation, edema, desquamation and vasocongestion scores were extremely negatively affected compared to Group 1 (p<0.001). The mean inflammation score in Group 3 was calculated as 0.88±0.354 and inflammation scores decreased dramatically compared to Group 2 (p: 0.031) (Figure 2). No penile tissue samples in Group 3 had severe edema and vasocongestion. These scores were significantly lower in Group 3 than in Group 2 (p:0.018 and p:0.037, respectively) (Figure 3 and Figure 4). In Group 2, the desquamation score was observed as 1.88±0.354. This value was significantly higher than Group 3 (p:0.038) (Figure 5).
Our serum biochemical analysis results are detailed in Table 2. In Group 2, MDA and PC levels, the latest products of lipid peroxidation and protein oxidation, were calculated as 1.53±0.33 and 606.4±59.06. These values were recorded as considerably higher than Group 1 (p:0.001 and p<0.001 respectively). In Group 3, it was noted that there was a dramatic decrease in MDA and PC levels compared to Group 2 (p:0.003 and p:0.015, respectively). The levels of the pro-inflammatory cytokines including IL-1 beta, IL-6, and TNF-alpha were observed to be highest in Group 2 (p<0.001). On the other hand, serum samples of rats in Group 3 showed a significant decrease in these inflammatory markers (p:0.022, p:0.049 and p<0.001, respectively). TOS levels were recorded as 11.2±1.78 in Group 2. This level was quite high compared to Group 1 (p<0.001). In Group 3, the TOS level was 8.37±1.58 and these values were recorded as significantly lower than Group 2 (p:0.002). When the antioxidant enzyme level is analyzed, SOD and GSH-px Px activity were significantly higher in Group 3 compared to Group 2 (p:0.002 and p:0.029, respectively). Similarly, the TAS level was noted as 1.39±0.30 in Group 3, which was recorded as significantly increased compared to Group 2 (p:0.009).
Table 1. Comparison of Inflammation, Desquamation, Edema, and Vasocongestion scores between rat groups Groups N Mean±SD Median (min-max) P values Post-hoc P values
Inflammation 1 8 0.25±0.463 0 (0-1)
<0.001a*1-2b: <0.001*
2 8 1.88±0.354 2 (1-2) 1-3b: 0.327 3 8 0.88±0.354 1 (0-1) 2-3b: 0.031*
Desquamation 1 8 0.13±0.354 0 (0-1)
<0.001a*1-2b: <0.001*
2 8 1.88±0.354 2 (1-2) 1-3b: 0.422 3 8 0.75±0.707 1 (0-2) 2-3b: 0.038*
Edema 1 8 0.38±0.518 0 (0-1)
<0.001a*1-2b: <0.001*
2 8 2.88±0.354 3 (2-3) 1-3b: 0.312 3 8 1.13±0.354 1 (1-2) 2-3b: 0.018*
Vasocongestion 1 8 0.5±0.535 0.5 (0-1)
<0.001a*1-2b: <0.001*
2 8 2.75±0.463 3 (2-3) 1-3b: 0.249 3 8 1.38±0.518 1 (1-2) 2-3b: 0.037*
SD: standard deviation, *Statistically significant (p<0.05), a Kruskal Wallis test, b Post-hoc test: Mann Whitney U test with Bonferroni correction
Figure 2. Inflammation between groups a. No inflammation in Group 1. b. Moderate inflammation foci accompanying congested vascular structures and hemorrhage areas in Group 2. c. Local and mild inflammation in Group 3. Magnification is x10 for all images, blue arrows indicate inflammatory cells and neutrophills.
Figure 4. Comparison of vasocongestion between groups. a. Only normal caliber vascular structures (red arrows), scored as no vasocongestion in Group 1. b. Extensive vasocongestion and focal haemorrhage in Group 2 (red arrows). c. Vasocongestion of medium and small sized vascular structures in Group 3 (red arrows). Microscopic magnification is x10 for all photos.
Figure 3. Evaluation of edema between groups. a. No edema in Group 1. b. Extensive edema in Group 2. c. Mild and focal edema in Group 3. Green arrows indicate edematous areas, magnification is x10 for all images.
Figure 5. Desquamation alterations are shown. a. No desquamation in Group 1. b. Medium desquamation occurring in Group 2. c. Focal and mild desquamation detected in Group 3 Black arrows indicate normal thickness epithelium, whereas red arrows show desquamatedareas. Magnification is x20 for both images.
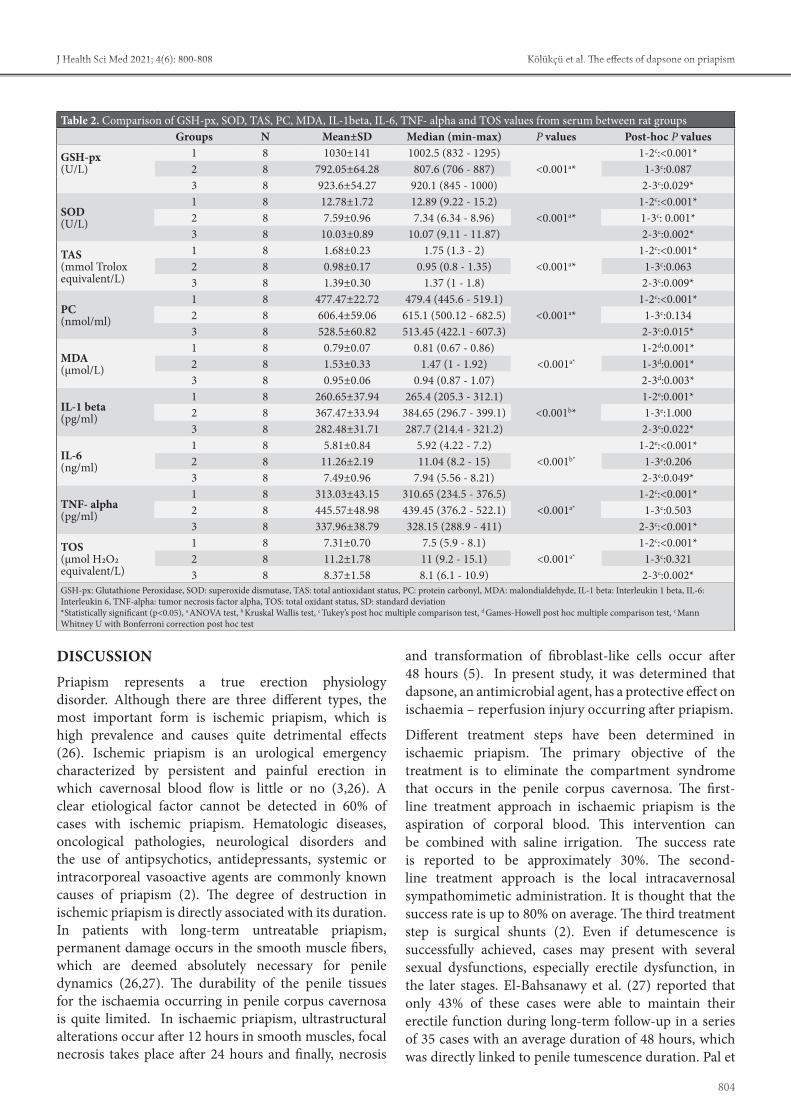
804
Kölükçü et al. The effects of dapsone on priapismJ Health Sci Med 2021; 4(6): 800-808
DISCUSSION Priapism represents a true erection physiology disorder. Although there are three different types, the most important form is ischemic priapism, which is high prevalence and causes quite detrimental effects (26). Ischemic priapism is an urological emergency characterized by persistent and painful erection in which cavernosal blood flow is little or no (3,26). A clear etiological factor cannot be detected in 60% of cases with ischemic priapism. Hematologic diseases, oncological pathologies, neurological disorders and the use of antipsychotics, antidepressants, systemic or intracorporeal vasoactive agents are commonly known causes of priapism (2). The degree of destruction in ischemic priapism is directly associated with its duration. In patients with long-term untreatable priapism, permanent damage occurs in the smooth muscle fibers, which are deemed absolutely necessary for penile dynamics (26,27). The durability of the penile tissues for the ischaemia occurring in penile corpus cavernosa is quite limited. In ischaemic priapism, ultrastructural alterations occur after 12 hours in smooth muscles, focal necrosis takes place after 24 hours and finally, necrosis
and transformation of fibroblast-like cells occur after 48 hours (5). In present study, it was determined that dapsone, an antimicrobial agent, has a protective effect on ischaemia – reperfusion injury occurring after priapism.
Different treatment steps have been determined in ischaemic priapism. The primary objective of the treatment is to eliminate the compartment syndrome that occurs in the penile corpus cavernosa. The first-line treatment approach in ischaemic priapism is the aspiration of corporal blood. This intervention can be combined with saline irrigation. The success rate is reported to be approximately 30%. The second-line treatment approach is the local intracavernosal sympathomimetic administration. It is thought that the success rate is up to 80% on average. The third treatment step is surgical shunts (2). Even if detumescence is successfully achieved, cases may present with several sexual dysfunctions, especially erectile dysfunction, in the later stages. El-Bahsanawy et al. (27) reported that only 43% of these cases were able to maintain their erectile function during long-term follow-up in a series of 35 cases with an average duration of 48 hours, which was directly linked to penile tumescence duration. Pal et
Table 2. Comparison of GSH-px, SOD, TAS, PC, MDA, IL-1beta, IL-6, TNF- alpha and TOS values from serum between rat groupsGroups N Mean±SD Median (min-max) P values Post-hoc P values
GSH-px (U/L)
1 8 1030±141 1002.5 (832 - 1295)<0.001a*
1-2c:<0.001*2 8 792.05±64.28 807.6 (706 - 887) 1-3c:0.0873 8 923.6±54.27 920.1 (845 - 1000) 2-3c:0.029*
SOD (U/L)
1 8 12.78±1.72 12.89 (9.22 - 15.2)<0.001a*
1-2c:<0.001*2 8 7.59±0.96 7.34 (6.34 - 8.96) 1-3c: 0.001*3 8 10.03±0.89 10.07 (9.11 - 11.87) 2-3c:0.002*
TAS (mmol Trolox equivalent/L)
1 8 1.68±0.23 1.75 (1.3 - 2)<0.001a*
1-2c:<0.001*2 8 0.98±0.17 0.95 (0.8 - 1.35) 1-3c:0.0633 8 1.39±0.30 1.37 (1 - 1.8) 2-3c:0.009*
PC (nmol/ml)
1 8 477.47±22.72 479.4 (445.6 - 519.1)<0.001a*
1-2c:<0.001*2 8 606.4±59.06 615.1 (500.12 - 682.5) 1-3c:0.1343 8 528.5±60.82 513.45 (422.1 - 607.3) 2-3c:0.015*
MDA(μmol/L)
1 8 0.79±0.07 0.81 (0.67 - 0.86)<0.001a*
1-2d:0.001*2 8 1.53±0.33 1.47 (1 - 1.92) 1-3d:0.001*3 8 0.95±0.06 0.94 (0.87 - 1.07) 2-3d:0.003*
IL-1 beta (pg/ml)
1 8 260.65±37.94 265.4 (205.3 - 312.1)<0.001b*
1-2e:0.001*2 8 367.47±33.94 384.65 (296.7 - 399.1) 1-3e:1.0003 8 282.48±31.71 287.7 (214.4 - 321.2) 2-3e:0.022*
IL-6(ng/ml)
1 8 5.81±0.84 5.92 (4.22 - 7.2)<0.001b*
1-2e:<0.001*2 8 11.26±2.19 11.04 (8.2 - 15) 1-3e:0.2063 8 7.49±0.96 7.94 (5.56 - 8.21) 2-3e:0.049*
TNF- alpha (pg/ml)
1 8 313.03±43.15 310.65 (234.5 - 376.5)<0.001a*
1-2c:<0.001*2 8 445.57±48.98 439.45 (376.2 - 522.1) 1-3c:0.5033 8 337.96±38.79 328.15 (288.9 - 411) 2-3c:<0.001*
TOS(μmol H2O2 equivalent/L)
1 8 7.31±0.70 7.5 (5.9 - 8.1)<0.001a*
1-2c:<0.001*2 8 11.2±1.78 11 (9.2 - 15.1) 1-3c:0.3213 8 8.37±1.58 8.1 (6.1 - 10.9) 2-3c:0.002*
GSH-px: Glutathione Peroxidase, SOD: superoxide dismutase, TAS: total antioxidant status, PC: protein carbonyl, MDA: malondialdehyde, IL-1 beta: Interleukin 1 beta, IL-6: Interleukin 6, TNF-alpha: tumor necrosis factor alpha, TOS: total oxidant status, SD: standard deviation*Statistically significant (p<0.05), a ANOVA test, b Kruskal Wallis test, c Tukey’s post hoc multiple comparison test, d Games-Howell post hoc multiple comparison test, e Mann Whitney U with Bonferroni correction post hoc test

805
Kölükçü et al. The effects of dapsone on priapism J Health Sci Med 2021; 4(6): 800-808
al. (28) concluded in their study involving 19 patients that 66.7% of the cases of priapism which were successfully treated with intracorporeal phenylephrine injection and corporal aspiration had normal erectile functions in the follow-up. Kulmala et al. (29) reported in their large-scale study of 124 cases that erectile dysfunction was observed in 39% of cases after priapism treatment. In the same study, the rate of erectile dysfunction was 8% in cases with a duration of less than 24 hours, while this rate was 78% in patients with a duration of more than 1 week. An important reason for encountering problems in the sexual life of the majority of the cases in long-term follow-ups after priapism can be explained by ischaemia-reperfusion injury due to revascularization of penile tissues.
Ischaemia-reperfusion injury is observed at a very remarkable level in this clinical implication due to the fact that penile corpus cavernosa is reoxygenated quite quickly after the treatment of ischemic priapism (30,31). Critical metabolic and structural changes occur in penile tissues due to lack of oxygenation during ischemic priapism. The function of cellular oxidative phosphorylation is reduced to low levels. This energy deficiency results in the inhibition of Na+, K+-ATPase pump and intracellular sodium and calcium levels increase. This altered ion balance brings tissue edema and cytotoxic effect. This makes corporal tissues highly vulnerable to ischaemia reperfusion injury (4). During the ischemia period, a significant increase in the level of purine metabolites such as adenosine, hypoxanthine, xanthine and inosine is observed in the by-products of adenosine triphosphate (ATP) catabolism. These molecules accumulated in the tissue under ischemic conditions by using oxygen oxidants, which are abundant in the environment, become unstable and form intensely ROS by revascularization of the tissues (32,33). It is extremely important to keep the duration of the ischaemia short, reducing the amount of reaction that low-energy molecules enter with oxygen and keeping ROS formation at controllable limits (6). On the other hand, ischaemia-reperfusion injury leads to both a local and a systemic acute inflammatory response characterized by neutrophil activation (9,31). With this response, inflammatory cells become a second source for ROS. On the other hand, cystoxic molecules such as protease and myeloperoxidase released from activated neutrophils contribute to tissue damage. For all these reasons, anti-inflammatory molecules are thought to play an extremely important role in protecting cells against tissue damage in ischaemia-reperfusion damage (11). ROS levels are normally kept under control by antioxidant defense systems such as SOD, catalase and GSH-Px. These antioxidant systems are extremely ineffective in cases where oxygen flow is very rapid, such as the termination of priapism. In this context, it is evident
that the use of molecules that show antioxidant efficacy has recently played a significant role in minimizing the harmful effects of ischaemia reperfusion injury (8). In this context, it has been biochemically and histopathologically demonstrated that Dapsone, which is a very strong anti-inflammatory and antioxidant property used in the study, effectively regresses the ischemia-reperfusion damage in penile corpus cavernosa.
In previous experimental studies, the harmful effects of ischemia-reperfusion injury on penile corpus cavernosa tissue have been clearly demonstrated. Although numerous pharmacological agents such as curcumin, dipyridamole, melatonin, pentoxifylline, lycopene, quercetin have been shown to protect against tissue injury in different animal models, treatment routine protocols for ischaemia reperfusion injury in penile corpus cavernosa have not yet been developed across the world (4-9). In the priapism model where Yilmaz et al. evaluated ischaemia reperfusion injury, found that TAS decreased in experimental animals due to ischaemia reperfusion injury, while there was a significant increase in edema, necrosis and hemorrhage scores in penile tissue (4). Similarly, our study indicated a decrease in the level of antioxidant enzymes such as SOD and GSH-Px and in TAS due to ischemia reperfusion injury. Karagüzel et al. documented histopathologically that after ischaemia- reperfusion injury, the endothelial cells covering the penile corpus cavernosa were severely damaged and quite a lot of tears were observed in tunica albuginea (5). In our study, it was observed that desquamation, edema and vasocongestion were detected high levels in penile tissues after ischaemia-reperfusion injury. The experimental study of the Ciftci et al. (8) reported that antioxidant defense systems such as SOD, catalase and GSH-Px were decreased in corporal ischaemia reperfusion injury, while TBARS (thiobarbituric acid reactive substances), an important marker of lipid peroxidation, was increased. Similarly, Uluocak et al. (6) reported that MDA level increased significantly in penile ischemia reperfusion injury. In our study, an increase in MDA and PC levels, the most important markers of lipid peroxidation and protein oxidation, was observed after ischaemia reperfusion injury. In another experimental study, Munarriz et al. (33) found that polymorphonuclear leukocyte infiltration was observed in penile corpus cavernosa with re-oxygenation of post-ischaemia, however, myeloperoxidase activity and lipid peroxidation increased. Similarly, in our study, it was observed that the inflammation scores in penile tissues increased significantly after ischemia reperfusion, and in our serum analysis, there was a dramatic increase in proinflammatory cytokines such as IL-1beta, IL-6 and TNF alpha.

806
Kölükçü et al. The effects of dapsone on priapismJ Health Sci Med 2021; 4(6): 800-808
Dapsone was synthesized from p-nitro-thiophenol in the early 1900s and was heavily used in the chemical industry in the production of azo dyes during its initial use (10,14). In the following periods, it has been discovered that this pharmacological agent plays a important role in maintaining the vital functions of the cell against tissue damage apart from antimicrobial property (16). This activity is performed via many different mechanisms. Inhibition of inflammation has a significant place among these pathways. Previous studies have revealed in great detail that dapsone has anti-inflammatory properties equivalent to nonsteroidal anti-inflammatory drugs (18). Dapsone demonstrates this effect in many different aspects. Dapson inhibits the activity of myeloperoxidase, which converts hydrogen peroxide into water and hypochlorous acid. In this way, it causes the hypochlorous acid level to be reduced, which leads to severe tissue damage (10,18). On the other hand, this pharmacological agent stabilizes neutrophil lysosome, suppresses the expression of proinflammatory cytokines, neutrophil chemotaxis and neutrophil adherence function (34,35).
Liang et al. (15) analyzed the efficacy of dapsone therapy in 79 cases with chronic spontaneous urticaria and experienced improvement in 78% of cases. Abe et al. also reported in their in vivo study examining the pharmacological effect of dapsone on cutaneous lupus erythematosus that this pharmacological agent produced an anti-inflammatory response by suppressing TNF-alpha release from activated mononuclear cells (17). Dapsone, on the other hand, leads to a significant decrease in ROS levels by activating scavenging enzymes such as glutathione reductase, GSH-Px, SOD and catalase (12). In addition to its anti-inflammatory and antioxidant efficacy has been shown to have a strong anti-apoptotic properties in previous studies. Dapson demonstrates this effect by inhibiting both intrinsic apoptosis, which is triggered by the activation of the caspase in direct connection with the exposure of mitochondria to a very high amount of calcium, as well as extrinsic apoptosis, in which inflammatory mechanisms play a leading role (13).
The effects of dapsone on oxidative tissue damage on different tissues have been analyzed in detail in the previous years. Rios et al. (36) reported neuroprotective efficacy by reducing the infarction volume of dapsone therapy by more than 90% in the rat model in which they formed middle cerebral artery occlusion. In their experiment that resulted in intracranial kainic acid toxicity, Diaz-Ruiz et al. (16) demonstrated that dapsone prevents neuronal death of pyramidal cells by showing antioxidative and anticonvulsive properties. In our study, it was observed that dapson caused a significant increase in the level of antioxidant enzymes such as SOD
and GSH-Px, which are a very important defense system against ischemia reperfusion damage after priapzm treatment. A similar experimental study also found that dapsone demonstrated neuroprotective activity in brain ischaemia reperfusion injury by lowering levels of nuclear factor erythroid 2-related factor 2 and reactive oxygen species, as evidenced with magnetic resonance images (37). In our study, a significant increase in TAS and a decrease in oxidative damage were observed after the dapsone treatment. Nezamoleslami et al. (18) observed that dapsone exhibited reno-protective properties on the kidney ischemia reperfusion injury and indicated that there was considerable evidence that this activity was carried out by modulating the inflammatory cascades. Similarly, in the experimental testicular torsion/detorsion model performed by Debjan et al. (11), a significant decrease in TNF-alpha levels of the rats applied dapsone was observed while a significant increase in SOD activity was indicated. In our study determined that TOS decreased to very low levels after dapsone treatment, while proinflammatory cytokine levels such as IL-1beta, 6 and TNF alpha were also reduced dramatically. In the study analyzing the efficacy of dapsone in cardiotoxicity caused by doxorubicin in rats, Sheibani et al. (12) found that dapsone significantly reduced oxidative stress and inflammation. The same study reported that it reversed the elevated cardiac enzyme levels due to cardiotoxicity and papillary muscle contractility. Although penile dynamics could not be evaluated in our study, it was found that edema, desquamation, hemorrhage and inflammation scores that increased due to ischemia-reperfusion damage in the penile corpus cavernosa after dapsone treatment significantly regressed.
The main limitation of our study is to evaluate only the early effects of dapsone treatment after priapism. In our study, dapsone was administered only in a single dose, and its long-term effects could not be demonstrated. Although previous studies have reported that dapsone does not have a dangerous side effect profile, our study failed to document the changes that this pharmacological agent may potentially cause in penile corpus cavernosa in healthy experimental animals. Finally, penile dynamics could not be revealed and immunohistochemical analyses could not be presented due to the technical incapacity of our laboratory conditions.
CONCLUSIONIn the light of the data obtained in our study, we are in the opinion that dapsone therapy can be considered as an alternative approach to minimise ischaemia-reperfusion injury in penile corpus cavernosa during priapism. Although our study adds a new function in the treatment approach of priapism with this use of dapsone, it is

807
Kölükçü et al. The effects of dapsone on priapism J Health Sci Med 2021; 4(6): 800-808
essential to elaborate the molecular mechanism of this activity and determine the dose curves. Furthermore, our study was based solely on the experimental priapism model and our results should be validated by prospective, randomized and controlled clinical trials in the future.
ETHICAL DECLARATIONSEthics Committee Approval: The study was carried out with the permission of Tokat Gaziosmanpaşa University Animal Studies Ethics Committee (Date: 08.04.2021, Decision No: 2021-HADYEK-06). Referee Evaluation Process: Externally peer-reviewed. Conflict of Interest Statement: The authors have no conflicts of interest to declare. Financial Disclosure: The authors declared that this study has received no financial support. Author Contributions: All of the authors declare that they have all participated in the design, execution, and analysis of the paper, and that they have approved the final version.
REFERENCES1. Reddy AG, Alzweri LM, Gabrielson AT, Leinwand G, Hellstrom
WJG. Role of Penile Prosthesis in Priapism: A Review. World J Mens Health 2018; 36: 4-14.
2. Tay YK, Spernat D, Rzetelski-West K, Appu S, Love C. Acute management of priapism in men. BJU Int 2012; 109: 15-21.
3. Ridgley J, Raison N, Sheikh MI, Dasgupta P, Khan MS, Ahmed K. Ischaemic priapism: A clinical review. Turk J Urol 2017; 43: 1-8.
4. Yılmaz Y, Taken K, Atar M, Ergün M, Söylemez H. Protective effect of curcumin on priapism and ischemia-reperfusion injury in rats. Eur Rev Med Pharmacol Sci 2015; 19: 4664-70.
5. Karaguzel E, Bayraktar C, Kutlu O, et al. The possible protective effects of dipyridamole on ischemic reperfusion injury of priapism. Int Braz J Urol 2016; 42: 146-53.
6. Uluocak N, Atılgan D, Erdemir F, et al. An animal model of ischemic priapism and the effects of melatonin on antioxidant enzymes and oxidative injury parameters in rat penis. Int Urol Nephrol 2010; 42: 889-95.
7. Erdemir F, Firat F, Markoc F, et al. The effect of pentoxifylline on penile cavernosal tissues in ischemic priapism-induced rat model. Int Urol Nephrol 2014; 46: 1961-7.
8. Ciftci O, Oguz F, Beytur A, Polat F, Altıntas R, Oguzturk H. Lycopene prevents experimental priapism against oxidative and nitrosative damage. Eur Rev Med Pharmacol Sci 2014; 18: 3320-5.
9. Çevik Ö, Çadırcı S, Şener TE, et al. Quercetin treatment against ischemia/reperfusion injury in rat corpus cavernosum tissue: a role on apoptosis and oxidative stress. Free Radic Res 2013; 47: 683-91.
10. Koca R. Dapsone. Turkiye Klinikleri Dermatology 2014; 7: 43-8.11. Dejban P, Rahimi N, Takzare N, Jahansouz M, Haddadi NS,
Dehpour AR. Beneficial effects of dapsone on ischemia/reperfusion injury following torsion/detorsion in ipsilateral and contralateral testes in rat. Theriogenology 2019; 140: 136-42.
12. Sheibani M, Nezamoleslami S, Faghir-Ghanesefat H, Hossein Emami A, Dehpour AR. Cardioprotective effects of dapsone against doxorubicin-induced cardiotoxicity in rats. Cancer Chemother Pharmacol 2020; 85: 563-71.
13. Ríos C, Orozco-Suarez S, Salgado-Ceballos H, et al. Anti-Apoptotic Effects of Dapsone After Spinal Cord Injury in Rats. Neurochem Res 2015; 40: 1243-51.
14. Wozel G, Blasum C. Dapsone in dermatology and beyond. Arch Dermatol Res 2014; 306: 103-24.
15. Liang SE, Hoffmann R, Peterson E, Soter NA. Use of Dapsone in the Treatment of Chronic Idiopathic and Autoimmune Urticaria. JAMA Dermatol 2019; 155: 90-5.
16. Diaz-Ruiz A, Mendez-Armenta M, Galván-Arzate S, et al. Antioxidant, anticonvulsive and neuroprotective effects of dapsone and phenobarbital against kainic acid-induced damage in rats. Neurochem Res 2013; 38: 1819-27.
17. Abe M, Shimizu A, Yokoyama Y, Takeuchi Y, Ishikawa O. A possible inhibitory action of diaminodiphenyl sulfone on tumour necrosis factor-alpha production from activated mononuclear cells on cutaneous lupus erythematosus. Clin Exp Dermatol 2008; 33: 759-63.
18. Nezamoleslami S, Sheibani M, Jahanshahi F, Mumtaz F, Abbasi A, Dehpour AR. Protective effect of dapsone against renal ischemia-reperfusion injury in rat. Immunopharmacol Immunotoxicol 2020; 42: 272-9.
19. Esterbauer H, Cheeseman KH. Determination of aldehydic lipid peroxidation products: malonaldehyde and 4-hydroxynonenal. Methods Enzymol 1990; 186: 407-21.
20. Levine RL, Garland D, Oliver CN, et al. Determination of carbonyl content in oxidatively modified proteins. Methods Enzymol 1990; 186: 464-78.
21. Sun Y, Oberley LW, Li Y. A simple method for clinical assay of superoxide dismutase. Clin Chem 1988; 34: 497-500.
22. Paglia DE, Valentine WN. Studies on the quantitative and qualitative characterisation of erythrocyte glutathione peroxidase. J Lab Clin Med 1967; 70: 158-69.
23. Erel, O. A novel automated method to measure total antioxidant response against potent free radical reactions. Clinical Biochemistry 2004; 37: 112-9.
24. Erel O. A new automated colorimetric method for measuring total oxidant status. Clinical Biochemistry 2005; 38: 1103-11.
25. Senturk GE, Erkanli K, Aydin U, et al. The protective effect of oxytocin on ischemia/reperfusion injury in rat urinary bladder. Peptides 2013; 40: 82-8.
26. Levey HR, Segal RL, Bivalacqua TJ. Management of priapism: an update for clinicians. Ther Adv Urol 2014; 6: 230-44.
27. El-Bahnasawy MS, Dawood A, Farouk A. Low-flow priapism: risk factors for erectile dysfunction. BJU Int 2002; 89: 285-90.
28. Pal DK, Biswal DL, Ghosh B. Outcome and erectile function following treatment of priapism: An institutional experience. Urol Ann 2016; 8: 46-50.
29. Kulmala RV, Lehtonen TA, Tammela TL. Preservation of potency after treatment for priapism. Scand J Urol Nephrol 1996; 30: 313-6.
30. Sener G, Paskaloğlu K, Sehirli AO, Dülger GA, Alican I. The effects of melatonin on ischemia-reperfusion induced changes in rat corpus cavernosum. J Urol 2002; 167: 2624-7.
31. Wu MY, Yiang GT, Liao WT, et al. Current Mechanistic Concepts in Ischemia and Reperfusion Injury. Cell Physiol Biochem 2018; 46: 1650-67.
32. Taati M, Moghadasi M, Dezfoulian O, Asadian P. Effects of ghrelin on testicular ıschemia/reperfusion-ınduced ınjury. Acta Med Iran 2016; 54: 32-8.
33. Munarriz R, Park K, Huang YH, et al. Reperfusion of ischemic corporal tissue: physiologic and biochemical changes in an animal model of ischemic priapism. Urology 2003; 62: 760-4.
34. Salehzadeh F, Jahangiri S, Mohammadi E. Dapsone as an alternative therapy in children with familial mediterranean Fever. Iran J Pediatr 2012; 22: 23-7.

808
Kölükçü et al. The effects of dapsone on priapismJ Health Sci Med 2021; 4(6): 800-808
35. Lee JH, Choi SH, Lee CJ, Oh SS. Recovery of dementia syndrome following treatment of brain inflammation. Dement Geriatr Cogn Dis Extra 2020; 10: 1-12.
36. Ríos C, Nader-Kawachi J, Rodriguez-Payán AJ, Nava-Ruiz C. Neuroprotective effect of dapsone in an occlusive model of focal ischemia in rats. Brain Res 2004; 999: 212-5.
37. Diaz-Ruiz A, Roldan-Valadez E, Ortiz-Plata A, et al. Dapsone improves functional deficit and diminishes brain damage evaluated by 3-Tesla magnetic resonance image after transient cerebral ischemia and reperfusion in rats. Brain Res 2016; 1646: 384-92.

HEALTH SCIENCESMEDICINE
Original Article
J Health Sci Med 2021; 4(6): 809-815
This work is licensed under a Creative Commons Attribution 4.0 International License.
DOI: 10.32322/jhsm.964768
Received: 08.07.2021 Accepted: 05.08.2021Corresponding Author: Hülya Yılmaz Önal, [email protected]
Evaluation nutritional status and anthropometric parameters in patients with chronic hepatitis B
Hülya Yılmaz Önalİstanbul Atlas University, Department of Nutrition and Dietetics, İstanbul, Turkey
Cite this article as: Yılmaz Önal H. Evaluation nutritional status and anthropometric parameters in patients with chronic hepatitis B. J Health Sci Med 2021; 4(6): 809-815.
ABSTRACT Introduction: Hepatitis B continues to be a major health problem around the world. 257 million people are estimated to be chronically infected with hepatitis B worldwide. Chronic hepatitis B (CHB) patients are likely to develop various comorbidities, including diabetes, insulin resistance, hyperlipidemia, nonalcoholic fatty liver disease, and obesity. Proper nutrition is essential for the management of both hepatitis B and its associated comorbidities. Material and Method: The study was completed a total of 105 patients. The universe of the study comprised of CHB patients who were admitted to the nutrition and dietetics outpatient clinic of a public hospital in Turkey between 1 October 2019 and 31 December 2019. Biochemical and ultrasound results, anthropometric measures, demographic characteristics, dietary habits, and 1-day food records were retrospectively recorded from patient files. Results: Female patients were more likely to consume 2 main meals per day (57.8%) whereas most male subjects (75.6%) consumed 3 meals. Both female and male patients had above-normal Body Mass Index (BMI) (31.2 kg/m2 and 29.2 kg/m2, respectively), and they also had high dietary fat (%) and cholesterol consumption than recommendation. In addition, males had borderline The fasting blood glucose (FBG), total cholesterol, and triglyceride levels, and both sexes were at risk for abdominal obesity. Dietary carbohydrate, fiber, B1, B6, calcium, magnesium, and phosphorus intake were higher in males than in females. Conclusion: This study was found on above-normal BMI values, and high dietary fat (%), and cholesterol consumption in both males and females. Moreover, males had borderline FBG, total cholesterol, and triglyceride levels, and both sexes were at risk for abdominal obesity. In the setting of CHB, it is crucial to maintain an adequate and balanced diet to control body weight, prevent nutritional disorders, protect the liver, and improve overall well-being. More comprehensive studies are needed to better understand the link between nutrition and hepatitis B.Keywords: Chronic hepatitis B virus infection, nutritional status, body composition, body weights and measures
Ana Metin-Alt bilgi Arası 5mm
Cite-Öz arası 5mm
Başlık-Yazarlar arası 12mm
Yazar-Kurum arası 2,5 mm
Kurum-Cite arası 5mm
Öz-Abstract arası 7,5mm
INTRODUCTIONHepatitis B virus (HBV), a major infectious disease, continues to be a leading global public health concern. Despite vaccination efforts, millions of people become infected with the HBV every year (1). According to the World Health Organization (WHO), 257 million people are chronically infected with HBV worldwide as of 2015. As of 2016, 27 million people – only 10.5% of all people estimated to be chronically infected with hepatitis B (HB) – are aware of their infection, while only 4.5 million (16.7%) of the diagnosed individuals are receiving treatment (2). The prevalence of CHB varies among geographical regions. The prevalence of CHB is <2% in Northern America and Western Europe, 2-7% in Mediterranean countries, the Middle East, Japan,
Central Asia, and parts of South America, and is up to ≥8% in South Sudan and West Africa (3). In Turkey, 3.3 million individuals (4.57% of the general population) are estimated to be chronically infected with HB (4).
Hepatitis B infection is often divided into three types: acute, chronic, and occult. The most important indicator for the definitive diagnosis of chronic HBV infection is the presence of HBsAg in the blood for longer than six months (5). All patients with chronic HBV infection are at risk of developing hepatocellular carcinoma (HCC) and cirrhosis depending on host and viral factors (1). Obesity is known to be associated with HCC and also contributes to the development of , non-alcoholic fatty liver disease (NAFLD), hepatic steatosis, and non-

810
Yılmaz Önal H. Nutritional status in patients with chronic hepatitis B J Health Sci Med 2021; 4(6): 809-815
alcoholic steatohepatitis due to its negative effects on the liver (6). The main purpose of HBV treatment is to improve survival and quality of life by preventing the progression of the disease, and therefore the development of HCC (1). CHB infection can be treated with medications, which can slow the progression of cirrhosis, reduce the risk of developing HCC, and improve long-term survival. WHO recommends oral tenofovir or entecavir treatment as the most potent approach to suppress HBV (2).
Patients with CHB may or may not require medication, but adequate and balanced nutrition is essential for liver health and overall well-being. The diet should be rich in protein, energy, and vitamins, and also include fresh fruits, whole grains, fish, lean protein, and plenty of vegetables (7).
In the setting of acute or chronic liver diseases, the risk of developing eating and malabsorption disorders, nausea, anorexia, and malnutrition are increased. Moreover, CHB patients are likely to develop various comorbidities, including diabetes, insulin resistance, hyperlipidemia, nonalcoholic fatty liver disease, and obesity. Proper nutrition is prominent in the management of both HB and the associated comorbidities. There are very few studies on the nutritional status of patients with hepatitis B both in Turkey and worldwide. In this study, we aimed to investigate the general eating habits, nutritional status, and anthropometric parameters of patients with CHB, and to compare the sexes.
MATERIAL AND METHODThis study is a retrospective descriptive cross-sectional study. The universe of the study comprised of CHB patients who were admitted to the nutrition and dietetics outpatient clinic of a public hospital in Turkey between 1 October 2019 and 31 December 2019. Patient files were retrospectively reviewed and biochemical test results, anthropometric measures (body analysis results, height, hip and waist circumference), dietary habits, and food consumption records were retrospectively recorded from patient files. Because the study was designed retrospectively, no written informed consent form was obtained from patients.
This study was granted ethical approval by the İstanbul Okan University Non-Interventional Research Ethics Committee (Date 29.04.2020, Decision No: 56665618-204.01.07). All procedures were carried out in accordance with the ethical rules and the principles of the Declaration of Helsinki.
For every patient that presents to the dietetics outpatient clinic, demographic characteristics, overall nutritional habits, and physical activity, sleep duration, drug use,
and a 1-day food record are electronically recorded prior to the prescription of a diet. Moreover, height and waist and hip circumference and body composition are measured. The BMI was computed by dividing body weight (kg) by height (m2). According to the WHO, the BMI classification was used. The BMI was defined as underweight if it was less than 18.5 kg/m2, normal if it was between 18.5-24.9 kg/m2, overweight if it was between 25.0-29.9 kg/m2, and obese if it was more than 30.0 kg/m2 (8). The midpoint between the lower border of the last palpable rib and the top of the iliac crest was used to calculate waist circumference. Hip circumference was measured the circumference going through the highest point on the hip from the right side of the patients. The waist/hip ratio was determined by dividing the waist circumference (cm) by the hip circumference (cm). The waist/height ratio was assessed according to the classification according to WHO recommendations. Waist circumference measurements were classified as ≥94 cm risky in men, ≥102 cm high risk, ≥80 cm risky in women, and ≥88 cm high risk. A waist/hip ratio >1.0 in men and >0.8 in women was considered android obesity (9).
Body composition parameters were assessed using Tanita BF-350 Total Body Composition Analyzer, and heights were measured with a Seca stadiometer. An inflexible measuring tape was used for waist and hip measurements.
The International Physical Activity Questionnaire (IPAQ-Short Form) was used to determine the patients’ physical activity status. The IPAQ technique was used to score physical activity. Patients with a total score of 600 Metabolic Equivalent Minutes (MET) on the physical activity scale were classified sedantary, patients with 600-3000 MET were classified moderate active, and patients with >3000 MET were classified very active (10).
Daily energy and nutrient intake were analyzed using “Computer Assisted Nutrition Program, Nutritional Information Systems Package Program (BEBIS)” developed for the Turkish population. TUBER was used to evaluate the data collected.
The ultrasonography findings of the patients were used to make the diagnosis of steatosis. The classification was based on ultrasonography data.
The data was analyzed using the Statistical Package for the Social Sciences (SPSS) version 22.0. All statistical analyses were performed with parametric tests. In addition to descriptive statistical methods (mean, standard deviation), the t test was used to determine the difference between two means, and the chi-square test and Pearson’s correlation analysis were used to investigate correlations. p<0.05 was accepted as statistically significant.
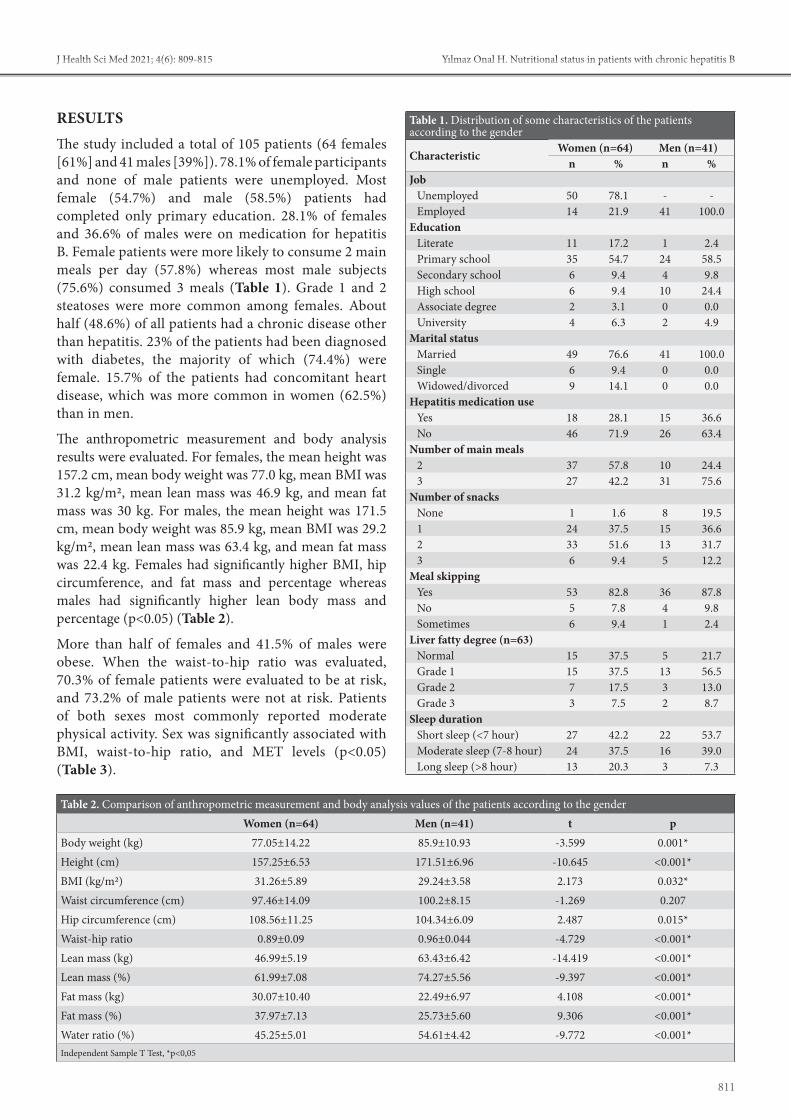
811
Yılmaz Önal H. Nutritional status in patients with chronic hepatitis BJ Health Sci Med 2021; 4(6): 809-815
RESULTSThe study included a total of 105 patients (64 females [61%] and 41 males [39%]). 78.1% of female participants and none of male patients were unemployed. Most female (54.7%) and male (58.5%) patients had completed only primary education. 28.1% of females and 36.6% of males were on medication for hepatitis B. Female patients were more likely to consume 2 main meals per day (57.8%) whereas most male subjects (75.6%) consumed 3 meals (Table 1). Grade 1 and 2 steatoses were more common among females. About half (48.6%) of all patients had a chronic disease other than hepatitis. 23% of the patients had been diagnosed with diabetes, the majority of which (74.4%) were female. 15.7% of the patients had concomitant heart disease, which was more common in women (62.5%) than in men.
The anthropometric measurement and body analysis results were evaluated. For females, the mean height was 157.2 cm, mean body weight was 77.0 kg, mean BMI was 31.2 kg/m2, mean lean mass was 46.9 kg, and mean fat mass was 30 kg. For males, the mean height was 171.5 cm, mean body weight was 85.9 kg, mean BMI was 29.2 kg/m2, mean lean mass was 63.4 kg, and mean fat mass was 22.4 kg. Females had significantly higher BMI, hip circumference, and fat mass and percentage whereas males had significantly higher lean body mass and percentage (p<0.05) (Table 2).
More than half of females and 41.5% of males were obese. When the waist-to-hip ratio was evaluated, 70.3% of female patients were evaluated to be at risk, and 73.2% of male patients were not at risk. Patients of both sexes most commonly reported moderate physical activity. Sex was significantly associated with BMI, waist-to-hip ratio, and MET levels (p<0.05) (Table 3).
Table 1. Distribution of some characteristics of the patients according to the gender
CharacteristicWomen (n=64) Men (n=41)
n % n %Job
Unemployed 50 78.1 - -Employed 14 21.9 41 100.0
Education Literate 11 17.2 1 2.4Primary school 35 54.7 24 58.5Secondary school 6 9.4 4 9.8High school 6 9.4 10 24.4Associate degree 2 3.1 0 0.0University 4 6.3 2 4.9
Marital status Married 49 76.6 41 100.0Single 6 9.4 0 0.0Widowed/divorced 9 14.1 0 0.0
Hepatitis medication use Yes 18 28.1 15 36.6No 46 71.9 26 63.4
Number of main meals 2 37 57.8 10 24.43 27 42.2 31 75.6
Number of snacks None 1 1.6 8 19.51 24 37.5 15 36.62 33 51.6 13 31.73 6 9.4 5 12.2
Meal skipping Yes 53 82.8 36 87.8No 5 7.8 4 9.8Sometimes 6 9.4 1 2.4
Liver fatty degree (n=63) Normal 15 37.5 5 21.7Grade 1 15 37.5 13 56.5Grade 2 7 17.5 3 13.0Grade 3 3 7.5 2 8.7
Sleep duration Short sleep (<7 hour) 27 42.2 22 53.7Moderate sleep (7-8 hour) 24 37.5 16 39.0Long sleep (>8 hour) 13 20.3 3 7.3
Table 2. Comparison of anthropometric measurement and body analysis values of the patients according to the genderWomen (n=64) Men (n=41) t p
Body weight (kg) 77.05±14.22 85.9±10.93 -3.599 0.001*Height (cm) 157.25±6.53 171.51±6.96 -10.645 <0.001*BMI (kg/m2) 31.26±5.89 29.24±3.58 2.173 0.032*Waist circumference (cm) 97.46±14.09 100.2±8.15 -1.269 0.207Hip circumference (cm) 108.56±11.25 104.34±6.09 2.487 0.015*Waist-hip ratio 0.89±0.09 0.96±0.044 -4.729 <0.001*Lean mass (kg) 46.99±5.19 63.43±6.42 -14.419 <0.001*Lean mass (%) 61.99±7.08 74.27±5.56 -9.397 <0.001*Fat mass (kg) 30.07±10.40 22.49±6.97 4.108 <0.001*Fat mass (%) 37.97±7.13 25.73±5.60 9.306 <0.001*Water ratio (%) 45.25±5.01 54.61±4.42 -9.772 <0.001*Independent Sample T Test, *p<0,05

812
Yılmaz Önal H. Nutritional status in patients with chronic hepatitis B J Health Sci Med 2021; 4(6): 809-815
Dietary carbohydrate, fiber, B1, B6, magnesium, and phosphorus intake, and glycemic index were higher in males than in females (p<0.05). Women consumed significantly less calcium than males (648.47±291.39 mg vs. 860.93±423.33 mg). Vitamin D intake was higher in males, but this finding was not statistically significant (p>0.05) (Table 4).
The blood biochemistry results of the patients were analyzed, and it was observed that male patients had elevated FBG levels (106.61±50.33 mg/dL), but the FBG results of two sexes were not significantly different. Males had significantly higher ALT levels, and females had significantly higher HDL levels compared to males (54.16 mg/dL vs. 44.46 mg/dL, p<0.05) (Table 5).
The correlation between steatosis and BMI classes and waist-to-hip ratio was not significantly different for the two sexes (p>0.05). There was a significant positive correlation between BMI and serum cholesterol (r=0.253, p=0.44), LDL cholesterol (0.286, p=0.22), and triglyceride (r=0.341, p=0.006) levels in female patients. BMI was not significantly associated with biochemistry parameters in males.
Table 3. Comparison of BMI, waist/hip risk, MET level classifications of the patients according to gender
Women MenX2 p *
n % n %
BMI 6.092 0.048*
Normal 13 20,3 5 12,2
Overweight 15 23,4 19 46,3
Obese 36 56,3 17 41,5
Total 64 100,0 41 100,0
Waist-hip ratio risk 18.985 <0.001*
Yes 45 70,3 11 26,8
No 19 29,7 30 73,2
Total 64 100,0 41 100,0
MET level 13.520 0.001*
Sedantary 6 9,4 3 7,3
Moderate 58 90,6 30 73,2
Vigorous 0 0,0 8 19,5
Total 64 100,0 41 100,0Chi Square test, *p<0,05
Table 4. Comparison of the mean intakes of energy, macro and micronutrients of the patients according to the gender
NutrientsWomen (n=64) Men (n=41)
t p*Mean±SD Mean±SD
Energy (kcal) 1876.50±1735.46 2387.46±1016.56 -1.705 0.091Protein (g) 70.46±85.15 89.48±43.05 -1.324 0.188Protein (%) 14.98±3.99 15.34±4.42 -0.428 0.669Fat (g) 85.88±136.76 87.30±36.71 -0.065 0.949Fat (%) 38.54±12.96 34.22±10.82 1.776 0.079Carbohydrate (g) 201.49±116.29 304.74±166.89 -3.460 0.001*Carbohydrate (%) 46.54±13.52 50.39±11.43 -1.507 0.135Glycemic Index 194.93±158.60 304.55±239.82 -2.587 0.012*Fiber (g) 20.69±12.42 28.08±16.64 -2.600 0.011*Alcohol 0.01±0.04 0.01±0.08 -0.425 0.672Vitamin E (mg) 12.26±9.61 12.76±9.57 -0.261 0.795Vitamin D (μg) 1.93±2.96 3.16±7.79 -1.140 0.257Vitamin K (mg) 95.05±110.09 83.10±83.43 0.594 0.554Vitamin B12 (μg) 9.26±24.27 3.26±2.17 1.967 0.054Vitamin A (μg) 2382.83±8301.76 1000.70±616.45 1.326 0.189Vitamin C (mg) 108.95±125.9 113.82±125.65 -0.193 0.847Cholesterol (mg) 352.93±365.11 342.56±190.97 0.167 0.867Polyunsaturated fatty acid (g) 13.84±9.74 15.88±9.91 -1.039 0.301Monounsaturated fatty acid (g) 32.58±66.59 30.23±13.64 0.223 0.824Vitamin B1 (Thiamine) (mg) 0.79±0.35 1.09±0.49 -3.467 0.001*Vitamin B2 (Riboflavin) (mg) 1.42±1.11 1.46±0.58 -0.252 0.801Vitamin B6 (mg) 1.05±0.55 1.35±0.71 -2.435 0.017Folate (μg) 283.27±171.08 340.45±138.47 -1.795 0.076Sodium (mg) 4148.37±7377.51 4617.45±2515.63 -0.392 0.696Potassium (mg) 2237.05±1312.10 2762.72±1469.29 -1.911 0.059Calcium (mg) 648.46±291.38 860.92±423.33 -3.047 0.003*Magnesium (mg) 264.18±150.15 349.17±154.05 -2.801 0.006*Phosphorus (mg) 1004.76±576.54 1295.25±542.25 -2.577 0.011*Iron (mg) 10.45±9.97 12.60±5.67 -1.255 0.212Zinc (mg) 10.37±13.08 12.15±5.45 -0.826 0.410Independent Sample T Test, *p<0,05

813
Yılmaz Önal H. Nutritional status in patients with chronic hepatitis BJ Health Sci Med 2021; 4(6): 809-815
DISCUSSIONIn this study, we investigated the anthropometric measures, nutritional status, and eating habits of CHB patients. There was a total of 105 patients, and the mean age was 45.6 years. 64% of the patients were female, and more than half of all participants had completed only primary education. The mean BMI of the patients was 30.47 kg/m2 and there was a statistically significant difference between the mean BMIs of females and males. One study from Pakistan evaluated the educational status of 100 HB patients and found that 71% were illiterate and only 1% had completed post-secondary education. They concluded that educational status was significantly associated with the risk of developing hepatitis B (11). These data suggest that HB may be more common among individuals who are poorly educated.
Waist circumference is an important indicator of visceral obesity and has been cited as a risk factor for numerous metabolic diseases. In one study, it was reported that CHB patients who had steatosis had higher BMI and waist circumference values compared to those who did not (12). Another study found that 67.7% of patients with HCV-associated NAFLD were obese, and 80.2% had a large waist circumference (13). In this study, we found that males were at risk and females at high risk of abdominal obesity. This also suggests that these patients are at risk for developing cardiovascular diseases. Obesity is also associated with an increased risk of cirrhosis-related hospitalization or death, as well as a higher risk of developing HCC (6). There are very few studies on the prevalence of steatosis in the setting of hepatitis B. One such study demonstrated that in CHB patients, steatosis was associated with the diagnostic criteria for metabolic syndrome, and BMI (14). In this study, we were able to access liver ultrasound results of 63 patients and we did not find a significant relationship between steatosis and BMI classes or waist-to-hip ratio. Among these 63 individuals, 68.2% had steatosis of various severity
(grade 1 44.4%, grade 2 15.9%, 2 and grade 3 7.9%). A study on the prevalence of fatty liver in individuals with and without chronic hepatitis found that the prevalence of NAFLD was 13.5% in HB patients and 28.3% in the control group (15). The prevalence of fatty liver was quite high in our study, but this result may be due to not having accessed the ultrasound results of all patients. On the other hand, we found a positive correlation between BMI values and total cholesterol, LDL cholesterol and triglyceride values in female patients. Moreover, male patients had risky triglyceride and total cholesterol levels. Regarding the impact of HBV infection on the lipid profile, one study compared HBV patients with healthy individuals and observed elevated total cholesterol and LDL levels in patients with HBV infection (16). In our study, 15.7% of HB patients had been diagnosed with heart disease. In the 2010 report of the Turkish Nutrition and Health Survey, it is emphasized that a healthy, adequate and balanced diet should include no more than 300 mg of cholesterol intake every day (17). In our study, the cholesterol intake of both female and male patients significantly exceeded this recommended level. Excessive dietary cholesterol raises blood cholesterol levels and increases the risk of cardiovascular disease (17). This underlines the significance of adequate nutrition for patients chronically infected with HB in terms of cardiovascular diseases.
Another chronic disease associated with HB is diabetes. It has been shown that the prevalence of HB is higher among individuals with diabetes compared to non-diabetics (18). In addition, patients with chronic HBV infection have a higher risk of developing diabetes (19). In this study, 23% of patients had been diagnosed with diabetes. Another major factor in the development of diabetes is obesity, and therefore, adequate and balanced nutrition. Bodyweight management, as well as antiviral therapy, is essential for the management of HB (6). According to Turkey-Specific Food and Nutrition Guide
Table 5: Comparison of blood test results of patients according to gender
Blood test resultsWomen (n=64) Men (n=41)
Reference range t p*Mean±SD Mean±SD
The fasting blood glucose (mg/dL) 101.81±23.12 106.61±50.33 70-105 -0.662 0.509Alanine aminotransferase (ALT) (IU/L) 22.72±11.17 34.68±22.22 0-50 -3.198 0.002*Aspartate aminotransferase (AST) (IU/L) 25.69±18.65 26.90±9.80 0-39 -0.384 0.702Total cholesterol (mg/dL) 199.41±48.59 201.85±39.68 0-200 -0.270 0.788LDL cholesterol (mg/dL) 124.88±40.43 136.68±52.87 0-160 -1.293 0.199
HDL cholesterol (mg/dL) 54.16±16.67 44.46±10.38 <40 (risk for male)<50 (risk for female) 3.672 <0.001*
Triglyceride (mg/dL) 111.48±55.63 156.24±193.53 35-150 -1.443 0.156
Vitamin D (ng/mL) 18.96±10.69 19.15±7.710-20 Deficiency
20-30 Insufficiency30-100 Sufficiency
>150 Toxic-0.099 0.921
Independent Sample T Test, *p<0,05
814
Yılmaz Önal H. Nutritional status in patients with chronic hepatitis B J Health Sci Med 2021; 4(6): 809-815
(TUBER), 55-60% of daily calorie intake should come from carbohydrates, 10-15% from protein, and 25-30% from fats (20). In this study, the percentage of energy from carbohydrates was below, and the percentage of energy from fat was above recommended levels for both sexes. This finding was ascribed to fad diets that promote food rich in proteins and fats and poor in carbohydrates.
Physical activity is a significant component of HBV treatment. Adequate physical activity can prevent the development of metabolic syndrome and weight gain and subsequently produce therapeutic effects. One study found that individuals with NAFLD were less physically active compared to healthy individuals (21). In our study, both male and female patients most commonly reported moderate physical activity. Hepatic disease is associated with an increased risk of early mortality. One study demonstrated that every 10 minutes of moderate to vigorous physical activity decreased mortality risk by 89% (22).
The limitations of our study are due to its retrospective nature, including the small sample size, incomplete ultrasound data, and lack of a healthy control group. Further larger controlled studies are needed.
CONCLUSIONTo conclude, we found above-normal BMI values, and high dietary fat (%) and cholesterol consumption in both male and female CHB patients. In addition, males had borderline FBG, total cholesterol, and triglyceride levels, and both sexes were at risk for abdominal obesity. In reference to our findings, we conclude that it is essential to maintain an adequate and balanced diet in order to control body weight and prevent nutrition-related diseases in the setting of CHB.
ETHICAL DECLARATIONSEthics Committee Approval: This study was granted ethical approval by the İstanbul Okan University Non-Interventional Research Ethics Committee (Date 29.04.2020, Decision No: 56665618-204.01.07). Informed Consent: Because the study was designed retrospectively, no written informed consent form was obtained from patients.Referee Evaluation Process: Externally peer-reviewed. Conflict of Interest Statement: The authors have no conflicts of interest to declare. Financial Disclosure: The authors declared that this study has received no financial support. Author Contributions: All of the authors declare that they have all participated in the design, execution, and analysis of the paper, and that they have approved the final version.
REFERENCES1. European Association for the Study of the Liver. EASL 2017
Clinical Practice Guidelines on the management of hepatitis B virus infection. J Hepatology 2017; 67: 370-98.
2. World Health Organization. Global hepatitis report 2017. https://apps.who.int/iris/handle/10665/255016. License: CC BY-NC-SA 3.0 IGO. Accessed date: 17.05.2021.
3. Gerlich WH. Medical virology of hepatitis B: how it began and where we are now. Virol J 2013; 10: 1-25.
4. Toy M, Onder FO, Wormann T, et al. Age- and region-specific hepatitis B prevalence in Turkey estimated using generalized linear mixed models: a systematic review. BMC Infect Dis 2011; 11: 337.
5. Krajden M, McNabb G, Petric M. The laboratory diagnosis of hepatitis B virus. Can J Infect Dis Med Microbiol 2005; 16: 65-72.
6. Lee I-C, Huang Y-H, Chan C-C, et al. Impact of body mass index and viral load on liver histology in hepatitis B e antigen-negative chronic hepatitis B. Clin Nutr 2011; 30: 647-52.
7. Silva M, Gomes S, Peixoto A, et al. Nutrition in Chronic Liver Disease. GE Port J Gastroenterol 2015; 22: 268-76.
8. World Health Organization Europe, 2018. Body mass index-BMI. http://www. euro. who. int/en/health-topics/diseaseprevention/nutrition/a-healthy-lifestyle/body-mass-index-bmi. Accessed date: 03.08.2021.
9. World Health Organization. Waist circumference and waist-hip ratio: report of a WHO expert consultation, Geneva, 8-11 December 2008. https://apps.who.int/iris/handle/10665/44583. Accessed date: 03.08.2021.
10. International Physical Activity Questionnaire. IPAQ scor-ing protocol, 2005. https://www.physio-pedia.com/images/c/c7/Quidelines_for_interpreting_the_IPAQ.pdf. Accessed date: 03.08.2021.
11. Shafiq M, Nadeem M, Sattar Z, et al. Identification of risk factors for hepatitis B and C in Peshawar, Pakistan. HIV/AIDS (Auckl) 2015; 7: 223-31.
12. Hashimoto M, Tashiro H, Kobayashi T, Kuroda S, Hamaoka M, Ohdan H. Influence of higher BMI for hepatitis B-and C-related hepatocellular carcinomas. Langenbecks Arch Surg 2017; 402: 745-55.
13. Ferolla SM, Ferrari TC, Lima ML, et al. Dietary patterns in Brazilian patients with nonalcoholic fatty liver disease: a cross-sectional study. Clinics (Sao Paulo) 2013; 68: 11-7.
14. Peng D, Han Y, Ding H, Wei L. Hepatic steatosis in chronic hepatitis B patients is associated with metabolic factors more than viral factors. J Gastroenterol Hepatol 2008; 23: 1082-8.
15. Wong VW-S, Wong GL-H, Chu WC-W, et al. Hepatitis B virus infection and fatty liver in the general population. J Hepatol 2012; 56: 533-40.
16. Quaye O, Amuzu BG, Adadey SM, Tagoe EA. Effect of hepatitis B virus (HBV) infection on lipid profile in Ghanaian patients. Virology (Auckl) 2019; 10: 1178122X19827606.
17. Turkey nutrition and health survey 2010: Evaluation of nutritional status and habits, final report. Minister of Health 2014. https://hsgm.saglik.gov.tr/depo/birimler/saglikli-beslenme-hareketli-hayat-db/Yayinlar/kitaplar/diger-kitaplar/TBSA-Beslenme-Yayini.pdf. Accessed date: 19.05.2021
18. Schillie S, Xing J, Murphy T, Hu D. Prevalence of hepatitis B virus infection among persons with diagnosed diabetes mellitus in the United States, 1999–2010. J Viral Hepat 2012; 19: 674-6.
19. Cai C, Zeng J, Wu H, et al. Association between hepatitis B virus infection and diabetes mellitus: A meta-analysis. Exp Ther Med 2015; 10: 693-8.

815
Yılmaz Önal H. Nutritional status in patients with chronic hepatitis BJ Health Sci Med 2021; 4(6): 809-815
20. Pekcan G, Şanlıer N, Baş M, et al. Turkey nutrition guide. 2015. https://dosyasb.saglik.gov.tr/Eklenti/10915,tuber-turkiye-beslenme-rehberipdf.pdf. Accessed date: 19.05.2021.
21. Hallsworth K, Thoma C, Moore S, et al. Non-alcoholic fatty liver disease is associated with higher levels of objectively measured sedentary behaviour and lower levels of physical activity than matched healthy controls. Frontline Gastroenterol 2015; 6: 44-51.
22. Loprinzi PD, VanWagner LB. Survival effects of physical activity on mortality among persons with liver disease. Prev Med Rep 2016; 3: 132-4.

HEALTH SCIENCESMEDICINE
Original Article
J Health Sci Med 2021; 4(6): 816-823
This work is licensed under a Creative Commons Attribution 4.0 International License.
DOI: 10.32322/jhsm.967136
Received: 08.07.2021 Accepted: 25.08.2021Corresponding Author: Aslı Kazgan Kılıçaslan, [email protected]
Type D personality and self-esteem in conversion disorder: a case-control study
Aslı Kazğan Kılıçaslan1, Sevler Yıldız2, Osman Kurt3, Sevda Korkmaz41Bozok University, Department of Psychiatry, Yozgat, Turkey 2Binali Yıldırım University, Department of Psychiatry, Erzincan, Turkey 3Fırat University, Medical Faculty, Department of Public Health, Elazığ, Turkey 4Fırat University, Medical Faculty, Department of Psychiatry, Elazığ, Turkey
Cite this article as: Kazğan Kılıçaslan A, Yıldız S, Kurt O, Korkmaz S. Type D personality and self-esteem in conversion disorder: a case-control study. J Health Sci Med 2021; 4(6): 816-823.
ABSTRACTAim: In the present study, we aimed to investigate the differences in type D personality and self-esteem between patients with conversion disorder (CD) and the control group.Material and Method: We carried out the study with 100 patients diagnosed with CD and 100 matching healthy individuals. We used a sociodemographic information form, the Type D Personality Scale (DS-14), and the Rosenberg Self-Esteem Scale (RSES) as the data collection tools. Considering that the scales should have high discriminative powers, we calculated the cut-off points on each scale performing the ROC analysis.Results: The results showed that the patients with CD had significantly higher negative affectivity (NA), social inhibition (SI), and DS-14 total scores than the control group (p<0.001). Also, the patient group obtained significantly higher scores on the RSES than the control group, indicating lower self-esteem among the patients (p<0.001). Finally, we concluded significant positive correlations between the RSES scores and NA (r=0.549 p<0.001), SI (r=0.410 p<0.001) and DS-14 total scores (r=0.521 p<0.001).Conclusion: Overall, we found that CD patients had type D personality traits and low self-esteem. As the patients had decreased self-esteem, their DS-14 scores increased. Uncovering SI and NA to be high in these patients may drive physicians to take measures to mitigate these situations and adopt a different perspective on CD. In addition, the results may contribute to better addressing patients’ conversion symptoms and personality traits compatible with CD.Keywords: Conversion disorder, type D personality, self-esteem
Ana Metin-Alt bilgi Arası 5mm
Cite-Öz arası 5mm
Başlık-Yazarlar arası 12mm
Yazar-Kurum arası 2,5 mm
Kurum-Cite arası 5mm
Öz-Abstract arası 7,5mm
INTRODUCTIONConversion disorder (CD) is a psychiatric disorder that causes functionality loss, usually following a stressful life event, with evidence of divergent symptoms of one or more voluntary motor/sensory function alterations with neurological or general medical conditions (1). The Diagnostic and Statistical Manual of Mental Disorders, Fourth Edition (DSM-IV) covers CD as a diagnosis under somatoform disorders (2). In the fifth edition of the manual (DSM-V), it is defined as “Functional Neurological Symptom Disorder” under “Somatic Symptom Disorders and Related Disorders” (1). The lifetime prevalence of somatoform disorders is 0.1-0.5% (3). Besides, the CD is the most prevalent somatoform disorder; its incidence in Turkey was previously reported to be 4.5-32% (4). Previous large-scale population-based
studies reported the incidence rates to range from 0.04 to 12% (5). The conversion disorder is often accompanied by another mental disorder; major depressive disorder is shown to be the most common accompanying disorder at a rate of 17-29% (6).
Personality is conceived of temperament and character traits (7). Some personality traits are considered significant predisposing factors for psychiatric disorders. In this respect, it was reported that patients with somatic symptoms in somatization disorder have more primitive, dependent, and egocentric traits (7). In the relationship between CD and personality, relevant research showed that difficult temperament causes internalization of behavioral problems in children, whereas easy temperament works in preventing the

817
Kazğan Kılıçaslan et al. Type D personality and self-esteem in conversion disorder J Health Sci Med 2021; 4(6): 816-823
emergence of psychological disorders (8). Another study on the relationship between character traits and CD reported that children with CD had a more dominant negative mood (frustrated, angry, discontented/irritated) compared to controls (9). The same study also mentioned that temperament is a likely factor for CD development in children (9). Yet, there are quite limited studies investigating personality traits in CD in adult groups (10, 11). Some of such studies reported low neurotic tendencies and personal adjustment among the patients (11).
Individuals with type D personality are those who can easily have negative emotions, such as anger and tension, and experience such emotions more than positive ones (12). At the same time, these individuals are likely to be introverted and tend to be disturbed in settings with strangers. Type D personality consists of social inhibition (SI) in conjunction with negative affectivity (NA). NA is defined as a tendency to experience depressive affect, restlessness, irritability, and hostility. SI, on the other hand, is the tendency to prevent the expression of emotions in social spheres. Individuals with high NA experience dysphoria, anxiety, and irritability more frequently. Those with high SI often feel anxious and insecure when they are with others (12). Substantial evidence shows that these individuals have higher levels of stress and experience more physical complaints when compared to the general population (13). A recent study reported that 91% of patients with type D personality had at least one somatic disorder, and 10% had at least three somatic disorders (14). Type D personality prevalence is often reported to be 13%-24% in the general population (15). In addition, the literature points out that type D personality traits are associated with suicidal thoughts in depressive disorder (16, 17). In type D personality, negative thoughts may also impair self-esteem.
Self-esteem is the ability to value oneself and make accurate assessments of oneself; it is a measure of seeking approval, acceptance, and self-confidence (17). It is known that psychological disorders adversely affect self-esteem is affected (18). When it comes to CD, patients embody their feelings and thoughts, which they perceive to be unacceptable, through symptoms. Using these signals, one may attract the attention of those around them and make their own existence accepted (1). Individuals with type D personality traits are often dissatisfied with their lives and have low self-esteem (12).
Although studies exploring CD frequently address temperament and character traits, they seem to miss type D personality patterns in CD (10, 11, 19). Therefore, this study aimed to compare type D personality traits and self-esteem in individuals diagnosed with CD upon DSM-5 criteria with the control group. We hypothesized
that CD patients might show type D personality traits, consisting of a combination of NA and SI, more than healthy controls and that the same group might have lower self-esteem than the control group.
MATERIAL AND METHODThis study was approved by Non-interventional Researchs Ethics Committee of Fırat University (Date: 14.01.2021, Decision No: 2021/01-07). After being informed about the purpose of the study, all the participants provided their written consent to participate in the study voluntarily. All procedures were carried out in accordance with the ethical rules and the principles of the Declaration of Helsinki.
We recruited a total of 100 patients who applied to the Fırat University psychiatry clinic and were treated as either inpatient or outpatient and diagnosed with CD by a psychiatrist according to DSM-5 diagnostic criteria. We carried out the study with only those 18-65 years, without any important physical pathology or physical disorder that may affect the distribution of psychiatric symptoms, without alcohol and substance abuse, and without any other accompanying psychiatric disorder.
For the healthy control group, we selected a total of 100 individuals among healthcare staff and patient relatives who could match the patient group regarding sociodemographic data, such as age, sex, educational attainment, and did not have any psychiatric disorder.
Initially, we reached out to 153 CD patients for the study but could not include five people because they refused to participate in the study voluntarily. Of the remaining 148 patients, we had to exclude 42 due to another comorbid psychiatric disorder. Finally, we did not evaluate the data from 6 patients due to missing data on their questionnaires. A psychiatry specialist collected the data using a sociodemographic information form, the DS-14, and the RSES. It took approximately 35 minutes each to administer the questionnaires to the participants.
Data Collection Tools1) Sociodemographic Information Form: We prepared the form in line with the overall purpose of the study. It is a form covering demographic information, such as age, marital status, educational attainment, place of residence, and employment and economic status, as well as clinical evaluation inquiries, such as duration of the psychiatric disorder, presence of any psychosocial stress factors, inpatient treatment history, and smoking or alcohol use.
2) Type D Personality Scale (DS-14): The scale was developed particularly to assess NA, SI, and Type D personality. The items of DS-14 were derived from DS-16 (20), but the scale also contains new items aimed at

818
Kazğan Kılıçaslan et al. Type D personality and self-esteem in conversion disorderJ Health Sci Med 2021; 4(6): 816-823
enhancing the assessment of NA and SI (12). The DS-14 includes 14 items in total equally distributed to two subscales measuring NA and SI. It is a four-point (0-4) Likert-type scale. The total score ranges from 0 to 28 for both subscales, and the cut-off point is ≥ 10 for each subscale (15). Öncü et al. (21) carried out the validity and reliability study of the scale in the Turkish context. Accordingly, the researchers found Cronbach’s alpha values to be α=0.82 for the NA subscale and α=0.81 for the SI subscale. In this study, we calculated these values to be 0.80 and 0.79, respectively.
3) Rosenberg Self-Esteem Scale (RSES): The scale developed by Rosenberg (22) attempts to determine the self-esteem levels of patients based on their own perceptions. The 63-item scale has 12 subscales; we used only the 10-item “Self-Esteem” subscale in this study. The items on this subscale are rated on a scale ranging from 0 to 6 points. Accordingly, those scoring 0-1, 2-4, and 5-6 on the subscale are considered to have high, moderate, and low self-esteem, respectively. Çuhadaroğlu (23) performed the Turkish validity and reliability study of the scale. In the Turkish version, the researcher found Cronbach’s α value to be 0.76. In this study, we calculated the internal consistency of the “Self-Esteem” subscale to be 0.75.
Statistical AnalysisWe performed all statistical analyses on SPSS (Statistical Package for Social Sciences; SPSS Inc., Chicago, IL). In the study, we presented categorical variables in number and percentage, while continuous variables were shown in mean±standard deviation, median, interquartile range (25-75 percentiles). We run a Chi-square analysis to compare categorical data. Besides, we performed a Kolmogorov-Smirnov test to check whether the continuous variables showed a normal distribution. Then, for non-normally distributed data, we used a Mann-Whitney U test to compare non-normally distributed variables between two groups, while the data were compared using a Kruskal-Wallis test between more than two groups. We calculated Spearman’s correlation coefficients to reveal relationships between continuous variables. We drew Receiver-operating characteristic (ROC) curves to measure the diagnostic values of DS and RSES. Finally, we considered p<0.05 statistically significant in all statistical analyses.
RESULTSWe carried out the study with a total of 200 individuals, 100 CD patients and 100 healthy controls. While the mean age of the patient group was 29.3±7.8 (min=18, max=50), the control group had a mean age of 28.6±7.9 (min=18, max=47). We detected 67% of the patients had a psychosocial stress factor.
The results revealed no significant differences between the patient and control groups by sex, marital status, educational attainment, place of residence, economic status, occupation, and organic disorder (p>0.05) (Table 1).
We found that the patient group had significantly more psychiatric treatment history, family history of psychiatric disorder, and smoking than the control group (p<0.001) (Table 1). In addition, we discovered the participants with secondary school and below education (35.5%) had significantly more multiple symptoms than those with high school and above education (16.2%) (p=0.039).
Table 1. Sociodemographic and disorder-related characteristics of the groups
Patients Controls pn % n %
Age, Median (IQR)
28 (23-35)
28 (22-34) 0.461*
Sex 0.339**Female 70 70.0 76 76,0Male 30 30.0 24 24,0
Marital status 0.777**Single 51 51.0 53 53.0Married 49 49.0 47 47.0
Educational Attainment 0.884**Secondary school and below 62 62.0 61 61.0
High school and above 38 38.0 39 39.0
Place of Residence 0.885**District 40 40.0 41 41.0City 60 60.0 59 59.0
Economic status 1,000**Low 46 46.0 46 46.0Middle 54 54.0 54 54.0
Profession 0.874**Housewife 28 28.0 29 29.0Student 5 5.0 5 5.0Civil servant 16 16.0 16 16.0Worker 28 28.0 22 22.0Unemployed 23 23.0 28 28.0
Physical disorder 0.065**Yes 7 7.0 1 1.0No 93 93.0 99 99.0
Psychiatric treatment history <0.001**Yes 32 32.0 4 4.0No 68 68.0 96 96.0
History of family psychiatric disorder <0.001**Yes 37 37.0 6 6,0No 63 63.0 94 94.0
Smoking <0.001**Yes 31 31.0 6 6,0No 69 69.0 94 94.0
Childhood trauma <0.001**Yes 45 45.0 22 22.0No 55 55.0 78 78.0
Mann Whitney U, ** Chi-square analysis; IQR: Interquartile range

819
Kazğan Kılıçaslan et al. Type D personality and self-esteem in conversion disorder J Health Sci Med 2021; 4(6): 816-823
We discovered that the NA, SI, DS-14 total, and RSES scores of the patient group were significantly higher than those of the control group (p<0.001) (Figure 1). Besides, those with motor symptoms had significantly higher RSES scores than those not showing a motor symptom (p=0.02) (Table 2).
The NA (p=0.01), SI (p=0.031), and DS-14 total scores (p=0.044) of those who had attempted suicide were significantly higher than those who had no suicidal ideation (Table 2). Moreover, we found these scores to be significantly higher in the participants with childhood trauma than those without (p<0.001) (Table 2).
The results of the correlation analysis showed that there was a positive and significant relationship between the age of onset of treatment and age in the patient group (r=0.574 p<0.001). Similarly, in the patient group, the
RSES scores were positively correlated with the NA (r=0.549 p<0.001), SI (r=0.410 p<0.001) and DS-14 total scores (r=0.521 p<0.001) (Figure 1).
The results of the ROC analysis on the DS-14 total scores by conversion disorder revealed the cut-off point to be 18. At this cut-off point, we calculated the sensitivity to be 85%, the specificity to be 63%, the positive predictive value to be 69.67%, and the negative predictive value to be 80.77%. Finally, we concluded the area under the curve to be 0.784. On the other hand, we found the cut-off point to be 1.08 for the RSES scores. At this cut-off point, we calculated the sensitivity to be 57%, the specificity to be 74%, the positive predictive value to be 68.67%, and the negative predictive value to be 63.25%. We found the area under the curve to be 0.659 (Table 3, Figure 2).
Table 2. Participants’ scores by various parametersNA SI DS-14 total RSES
Median (IQR) p Median (IQR) p Median (IQR) p Median (IQR) p
GroupPatient 17 (12-20)
<0.00111 (9-16)
<0.00130 (21-36)
<0.0011.1 (.8-1.7)
<0.001Control 8 (6-12.5) 8 (5-11) 16 (12-22) 1.0 (.8-1.1)
Psychosocial stress factor
Yes 18 (13-23)0.111
11 (9-16)0.685
31 (22-36)0.123
1.2 (1.0-1.8)0.239
No 16 (8-20) 12 (7-17.5) 29 (17-33.5) 1.1 (.8-1.4)
Secondary benefit
Yes 17.5 (11-23.5)0.601
11 (9-16.5)0.830
30 (20.5-36)0.806
1.2 (.9-1.7)0.457
No 17 (13-20) 12 (9-16) 30 (21-35) 1.1 (.8-1.7)
Motor symptomYes 17 (15-20)
0.45711 (10-15)
0.34430 (26-35)
0.4581.3 (1.1-1.8)
0.02No 17.5 (10-21) 11.5 (8-17) 31 (19-36) 1.1 (.8-1.6)
Sensory symptom
Yes 18 (13-20)0.655
12 (9-15)0.926
30 (20-36)0.917
1.1 (.8-1.5)0.330
No 17 (12-20) 11 (9-16) 30 (21-36) 1.2 (.8-1.8)
Pseudo seizureYes 18 (11-23)
0.76911 (8-16)
0.33129.5 (20-36)
0.6941.2 (.8-1.8)
0.259No 17 (13-20) 13 (10-18) 30 (22-35) 1.1 (.8-1.5)
TreatmentNone 16.5 (11-20)
0.19411 (8-17)
0.67129.5 (19-35)
0.3931.2 (.8-1.7)
0.474Irregular treatment 18 (12-24) 14 (9-16) 31 (20-36) 1.1 (1.0-1.5)Regular treatment 18.5 (16-20) 11.5 (10-15) 30.5 (27.5-35) 1.2 (1.0-1.8)
HospitalizationYes 18.5 (14.5-24)
0.26411.5 (9.5-14.5)
0.92030 (24-36)
0.5681.2 (1.1-1.5)
0.516No 17 (11-20) 11 (9-17) 30 (20-36) 1.1 (.8-1.7)
SuicideYes 24 (24-26)
0.0117 (14-20)
0.03135 (31-46)
0.0441.7 (1.2-2.2)
0.174No 17 (12-20) 11 (9-16) 30 (21-36) 1.1 (.8-1.7)
Childhood trauma
Yes 17 (13-20)<0.001
11 (10-15)<0.001
30 (22-34)<0.001
1.3 (1.0-1.8)<0.001
No 9 (7-17) 9 (6-12) 18 (14-29) 1.0 (.7-1.1)Mann-Whitney U test for two-group comparison; Kruskal-Wallis test for three-group comparison; IQR: Interquartile Range; DS-14: Type D Personality Scale; RSES: Rosenberg Self-Esteem Scale; NA: negative affectivity; SI: social inhibition
Table 3. The results of the ROC analysisNA SI DS-14 total RSES
Cut-off point 11 8 18 1.08Sensitivity 76% 78% 85% 57%Specificity 72% 56% 63% 74%Positive predictive value 73.08% 63.93% 69.67% 68.67%Negative predictive value 75% 71.79% 80.77% 63.25%AUC (area under the curve) 0.786 0.720 0.784 0.659AUC 95 % confidence interval 0.722-0.840 0.652-0.781 0.721-0.839 0.589-0.724AUC p value <0.001 <0.001 <0.001 <0.001DS-14: Type D Personality Scale; RSES: Rosenberg Self-Esteem Scale; NA: negative affectivity; SI: social inhibition

820
Kazğan Kılıçaslan et al. Type D personality and self-esteem in conversion disorderJ Health Sci Med 2021; 4(6): 816-823
Figure 1. Comparison and correlation of the DS-14 total and RSES scores
Figure 2. ROC for the DS-14 total and RSES scores
821
Kazğan Kılıçaslan et al. Type D personality and self-esteem in conversion disorder J Health Sci Med 2021; 4(6): 816-823
DISCUSSION The DS-14 total, NA, SI, and RSES scores were significantly higher in the patient group than in the control group, which can be considered the most noteworthy finding of the study. The findings also support our hypothesis that CD patients have prevalent type D personality traits along with low self-esteem.
Individuals with type D personality are generally those who are under chronic stress, prone to negative emotions, such as anxiety and irritability, who cannot find ways to cope with stress, and who often feel socially isolated and lack self-confidence. These people do not share their negative feelings with others for fear of rejection (17). Feeling socially isolated may lead one to feel anxious and suppressed simultaneously, while people with negative affectivity demonstrate more anxiety and physical symptoms (15). Being unable to express negative emotions verbally instead of physically is shown among the causes of conversion disorder (1). Besides, social inhibition is defined as the inhibition tendency in expressing feelings and behaviors due to concerns such as being disliked and not being reciprocated in social relations (12). In our study, we found the SI and NA scores of the patients to be higher than those of the control group. It is already known that anxiety and negative emotions decrease through the symptoms compatible with CD; the same situation may increase one’s social acceptance. In case of stress underlying CD, patients may express their social support needs with somatic complaints. When these needs are not met, these individuals may exhibit social withdrawal, introversion, and low cooperation.
In a study, the researchers examined the personality traits of 72 CD patients using the Hacettepe Personality Inventory. As a result, they found the neurotic tendencies and personal adjustment of the patients to be low and attributed low neuroticism to intense use of conversion as a defense mechanism in coping with anxiety (11). Considering the research findings on personality traits in somatoform disorders, patients with somatoform disorder suppress their feelings of inadequacy and exhibit alexithymia, which is defined as difficulty in recognizing and expressing feelings (7). In addition, it was concluded that harm avoidance is prevalent in those adopting somatization excessively (7). These people are also passive, cowardly, and insecure, as well as exhibiting inhibited and shy behaviors in social environments (24). In research utilizing the Temperament and Character Inventory, CD patients were found to have low levels of self-determination and elevated harm avoidance, as well as showing inadequacy in self-management and cooperation (10). Similar studies with Turkish samples compared CD patients with healthy controls and concluded that CD patients had significantly reduced
self-directedness (25, 26). Nevertheless, except for such limited findings, the research interest seems to miss type D personality traits in individuals with CD.
One’s pessimistic thoughts about the immediate environment can also adversely affect their self-perception. We suppose that one’s poor self-perception may cause low self-esteem and frequent psychosomatic symptoms since it is well-known that high self-esteem reduces psychopathological symptoms (27). In the study, the patient group had significantly lower self-esteem than the healthy controls. Both the CD symptoms and the underlying psychiatric reasons may affect one’s self-confidence.
In our study, the DS-14 scores increased as the patients’ self-esteem decreased. Similarly, previous research reported that type D individuals are dissatisfied with their lives and have low self-esteem (11). Type D personality is closely associated with pessimism, perceived lack of social support, low self-esteem, dissatisfaction, and low quality of life (28). Negative thoughts in type D personality may impair self-esteem and are closely related to how one perceives themselves and events and how they establish healthy relationships with others (11). In addition, it is often mentioned that type D individuals build inadequate rapport with others, contributing to their low self-perception (29).
We discovered the DS-14 total, NA, and SI scores to be significantly higher in CD patients with a previous suicide attempt. Accordingly, type D personality traits may have predicted suicidal behavior in CD. In the literature, a study found major depressive disorder to be associated with suicidal thoughts in CD patients (16). Other studies also determined the rate of type D personality be significantly higher in those with suicidal ideation (17). Therefore, our findings are consistent with what was previously found in the literature.
The DS-14 total, NA, SI, and RSES scores of CD patients with childhood trauma were also significantly higher. Psychosomatic responses are bodily manifestations of psychological factors. Accordingly, adult patients with prevalent psychosomatic symptoms often have a history of childhood trauma (30). In the same context, we found that that a significant part of the patients (45%) had at least one traumatic life event (parental separation or loss, neglect, and abuse (sexual-physical-emotional)), which supports the relevant literature. Individuals having experienced childhood trauma may have learned to avoid trauma by producing physical disorders. Just like in type D personality, this situation may prevent them from cooperating and cause them to withdraw from society, become introverted, and have somatic complaints when facing stress. Traumatic events in the

822
Kazğan Kılıçaslan et al. Type D personality and self-esteem in conversion disorderJ Health Sci Med 2021; 4(6): 816-823
past may lower one’s self-esteem, and such individuals may show symptoms compatible with CD due to their negatively biased cognitive patterns. Traumatic people can also see themselves as worthless and be affected very quickly by any events. Based on our findings, we think that the low self-esteem in the patients may have been because of the adverse effects of self-perception inhibited by past traumas.
Conversion disorder is a disorder that may cause confusion in the diagnosis and fake neurological disorders (1). An auxiliary scale to be used to diagnose CD should have high discriminative power. The results of the ROC analysis on the DS-14 total score by conversion disorder revealed the cut-off point to be 18. At this cut-off point, we calculated the sensitivity to be 85% and the specificity to be 63%. On the other hand, we found the cut-off point to be 1.08 for the RSES score. At this cut-off point, we calculated the sensitivity to be 57% and the specificity to be 74%.
The retrospective nature of this case-control study hinders the generalizability of the results, which can be counted among the limitations to the study. Therefore, conducting experimental and longitudinal studies may help better understand the relationship between self-esteem and type D personality in CD. Another limitation is that the scales used are all based on self-report (we assumed that all participants provided correct and candid responses to the scale items). Finally, just like CD, the fact that type D personality is seen at a higher rate in females (31) can be a disadvantage for the sample group.
CONCLUSIONOverall, we found that CD patients had type D personality traits and low self-esteem. In addition, the DS-14 scores increased as the patients’ self-esteem decreased. The finding that CD patients have low self-esteem may enable us to better deal with their psychosomatic symptoms and social problems. Knowing that SI and NA are high in these patients may drive physicians to take measures to mitigate these situations and adopt a different perspective on CD.
ETHICAL DECLARATIONSEthics Committee Approval: This study was approved by Non-interventional Researchs Ethics Committee of Fırat University (Date: 14.01.2021, Decision No: 2021/01-07).Informed Consent: All patients signed the free and informed consent form.Referee Evaluation Process: Externally peer-reviewed. Conflict of Interest Statement: The authors have no conflicts of interest to declare.
Financial Disclosure: The authors declared that this study has received no financial support. Author Contributions: All of the authors declare that they have all participated in the design, execution, and analysis of the paper, and that they have approved the final version.
REFERENCES1. American Psychiatric Association. Diagnostic and Statistical
Manual of Mental Disorders, 5th Edition (DSM-5). Washington, DC: American Psychiatric Association; 2013.
2. American Psychiatric Association. Diagnostic and Statistical Manual of Mental Disorders, 4th Edition. Washington, DC: American Psychiatric Association; 1994.
3. Koelen JA, Eurelings-Bontekoe EH, van BroeckhuysenKloth SA, Snellen WM, Luyten P. Social cognition and levels of personality organization in patients with somatoform disorders: A case-control study. J Nerv Ment Dis 2014; 202: 217-23.
4. Sağduyu A, Rezaki M, Kaplan İ, Özgen G, Gursoy-Rezaki B. Sağlık ocağına başvuran hastalarda dissosiyatif (konversiyon) belirtiler. Turk Psikiyatri Derg 1997; 8: 161-9.
5. Akagi H, House A. The epidemiology of hysterical conversion. In: Halligan PW, Bass C, Marshall JC, eds. Contemporary approaches to the study of hysteria: clinical and theoretical perspectives. Oxford, UK: Oxford University Press; 2001: 73–8.
6. Van Eck van der Sluijs J, Ten Have M, Rijnders C, Van Marwijk H, De Graaf R, Van der Feltz-Cornelis C. Medically unexplained and explained physical symptoms in the general population: Association with prevalent and incident mental disorders. PLoS ONE 2015; 10: e0123274.
7. Okyayuz ÜH, Berksun O, Çevik A. Psikosomatik serviste yatarak tedavi gören hastaların bazı MMPI bulgularının aleksitimik özellikler açısından incelenmesi ve kontrol grubuyla karşılaştırılması. Ankara Üniversitesi DTCF Derg 1991; 35: 195-203.
8. Tschann JM, Kaiser P, Chesney MA, Alkon A, Boyce WT. Resilience and vulnerability among preschool children: Family functioning, temperament and behavior problems. J Am Acad Child Adolesc Psychiatry 1996; 35: 184- 92.
9. Krishnakumar P, Sumesh P, Mathews L. Temperamental traits associated with conversion disorder. Indian Pediatr 2006; 43: 895-9.
10. Yenilmez Y. The Relationship of temperament and character traits with impulsivity and anger style in conversion disorder. Thesis, Bakirkoy Prof. Dr. Mazhar Osman Training and Research Hospital, Department of Psychiatry, Istanbul; 2011.
11. Uğuz Ş. Other psychopathologies accompanying conversion disorder. Thesis, Çukurova University Faculty of Medicine, Department of Psychiatry, Adana; 1998.
12. TW Smith. Toward a more systematic, cumulative, and applicable science of personality and health: lessons from type D personality. Psychosom Med 2011; 73: 528–32.
13. Allen SF, Wetherell MA, Smith MA. A one-year prospective investigation of type D personality and self-reported physical health. Psychol Health 2019; 34: 773–95.
14. De Vroege L, de Heer EW, van der Thiel E, et al. Type D personality, concomitant depressive and anxiety disorders, and treatment outcomes in somatic symptom and related disorders: an observational longitudinal cohort study. Front Psychiatry 2019; 10: 417.
15. Denollet J. DS14: standard assessment of negative affectivity, social inhibition, and Type D personality. Psychosom Med 2005; 67: 89–97.

823
Kazğan Kılıçaslan et al. Type D personality and self-esteem in conversion disorder J Health Sci Med 2021; 4(6): 816-823
16. Park YM, Ko YH, Lee MS, Lee HJ, Kim L. Type-D personality can predict suicidality in patients with major depressive disorder. Psychiatry Investig 2014; 11: 232-6.
17. Michal M, Wiltink J, Till Y, et al. Type-D personality and depersonalization are associated with suicidal ideation in the German general population aged 35–74: results from the Gutenberg Heart Study. J Affect Disord 2010; 125: 227-33.
18. Denollet J, Trompetter HR, Kupper N. A review and conceptual model of the association of Type D personality with suicide risk. J Psychiatr Res 2021; 138: 291-300.
19. Ayaz S. Body image and self-esteem in patients with stoma: review. J Med Sci 2008; 28: 154–9.
20. Denollet J. Personality and coronary heart disease:the type D scale 16 (DS16). Ann Behav Med 1998; 20: 209-15.
21. Öncü E, Vasısayoğlu KS. D tipi kişilik ölçeğinin Türk toplumunda geçerlilik ve güvenirlilik çalışması. Ankara Med J 2018; 4: 646-56.
22. Rosenberg M. Conceiving The Self. New York: Basic Books; 1979. 23. Çuhadaroğlu F. Self-esteem in adolescents. Thesis, Hacettepe
University Faculty of Medicine, Department of Psychiatry, Ankara; 1986.
24. Russo J, Katon W, Sullivan M, Clark M, Buchwald D. Severity of somatization and its relationship to psychiatric disorders and personality. Psychosomatics 1994; 35: 546-56.
25. Erten E, Yenilmez Y, Fistikci N, Saatcioglu O. The relationship between temperament and character in conversion disorder and comorbid depression. Compr Psychiatry 2013; 54: 354-61.
26. Güleç MY, İnanç L, Yanartaş O, Uzer A, Güleç H. Predictors of suicide in patients with conversion disorder. Compr Psychiatry 2014; 55: 457-62.
27. Garaigordobil M, Perez JI, Mozaz M. Self-concept, self-esteemand psychopatological symptoms. Psicothema 2008; 20: 114-23.
28. Mols F, Denollet J. Type D personality in the general population: A systematic review of health status, mechanisms of disease, and work related problems. Health Qual Life Outcomes 2010; 8: 9.
29. Pederson S, Denollet J. Type D Personality, cardiac events, and impaired quality of life: a review. Eur J Cardiovasc Prev Rehabil 2003; 10: 241-8.
30. Ozcetin A, Belli H, Ertem U, Bahcebasi T, Ataoglu A, Canan F. Childhood trauma and dissociation in women with pseudoseizure-type conversion disorder. Nord J Psychiatry 2009; 63: 462-8.
31. Feinstein A. Conversion disorder: Advances in our understanding. CMAJ 2011; 183: 915–20.

HEALTH SCIENCESMEDICINE
Original Article
J Health Sci Med 2021; 4(6): 824-827
This work is licensed under a Creative Commons Attribution 4.0 International License.
DOI: 10.32322/jhsm.969699
Received: 11.07.2021 Accepted: 28.07.2021Corresponding Author: Gökhan Tazegül, [email protected]
Neutrophil-to-lymphocyte ratio in patients with white-coat hypertension
Esin Avşar, Gökhan Tazegül, Erkan Çoban1Akdeniz University, Faculty of Medicine, Department of Internal Medicine, Antalya, Turkey
Cite this article as: Avşar E, Tazegül G, Çoban E. Neutrophil-to-lymphocyte ratio in patients with white-coat hypertension. J Health Sci Med 2021; 4(6): 824-827.
ABSTRACTIntroduction: White coat hypertension (WCH), a distinct phenotype of hypertension, is defined as elevated office blood pressure (BP) measurements during repeat visits with normal out-of-office BP measurements. The association of WCH with cardiovascular risk remains unclear; however, current data support an association between untreated WCH and the risk for cardiovascular events, cardiovascular mortality, and all-cause mortality. Increased inflammatory processes may explain the underlying pathophysiology of the increased risk for cardiovascular events in WCH; therefore, we evaluated the neutrophil-to-lymphocyte ratio (NLR) of patients with WCH compared with matched normotensive controls. Material and Method: Forty-five eligible subjects with WCH and 45 age, sex, and BMI matched healthy and normotensive subjects were included in the study. The subjects were assessed by office arterial BP and 24-hour ambulatory BP measurements. An automated blood count analyzer measured the NLR values. Results: The mean NLR in the patients-with-WCH group was significantly higher than that in the control group (2.67±0.27 vs. 2.46±0.34, p<0.001, Student’s t-test); however, NLR was not correlated with BP measurements in either the WCH or control group. Conclusion: NLR, a marker of inflammation, was increased in patients with WCH compared to the controls. Inflammation is a triggering mechanism for various cardiovascular and cerebrovascular events. Therefore, NLR has value as a potential independent risk factor that deserves further study, particularly in patients with WCH.Keywords: High blood pressure, systemic hypertension, inflammation, neutrophil-to-lymphocyte ratio, white coat hypertension
Ana Metin-Alt bilgi Arası 5mm
Cite-Öz arası 5mm
Başlık-Yazarlar arası 12mm
Yazar-Kurum arası 2,5 mm
Kurum-Cite arası 5mm
Öz-Abstract arası 7,5mm
INTRODUCTIONHypertension is a major preventable cause of morbidity and mortality worldwide. Due to the increasing use of out-of-office blood pressure (BP) measurements, several distinct hypertension phenotypes have become apparent. One of these is white coat hypertension (WCH), defined as elevated office BP measurements during repeated visits with normal out-of-office BP measurements as assessed by home and/or 24-hour ambulatory BP monitoring measurements. Therefore, current guidelines recommend using out-of-office BP measurements to diagnose phenotypes, such as WCH (1). A systematic review demonstrated that the overall prevalence of WCH, defined by 24-hour ambulatory BP measurements (ABPM), in the general population ranges from 5% to 65%, and the prevalence increases with age (2-5).
Although hypertension is a well-established risk factor for morbidity and mortality, the association of WCH with
cardiovascular risk remains unclear (5, 6). Several previous meta-analyses have reported weak to no associations of WCH with cardiovascular and all-cause mortality (7), especially for treated WCH (4); however, a recent meta-analysis revealed untreated WCH, but not treated WCH, as a risk factor for cardiovascular events, cardiovascular mortality, and all-cause mortality (8). An increase in atherosclerosis possibly causes this increase. Inflammatory processes are increasingly being recognized as playing a central role in the pathogenesis of atherosclerotic diseases and their complications (9). Elevated levels of systemic inflammatory markers have been found to be associated with cardiovascular diseases (10-12), and increased inflammatory processes may explain the underlying pathophysiology of the increased risk for cardiovascular events in WCH. Several previous studies have demonstrated an increase in novel inflammatory markers in WCH and sustained hypertension, such as high-sensitivity c-reactive protein (CRP), soluble CD40 ligand, procalcitonin, and pentraxin-3 (13-16).

825
Avşar et al. NLR in white-coat hypertension J Health Sci Med 2021; 4(6): 824-827
The neutrophil-to-lymphocyte ratio (NLR), routinely determined by complete blood count analysis, has emerged as a novel inflammation marker. It has been documented that NLR may predict inflammatory status for various cardiovascular risk factors, such as hypertension, diabetes mellitus, obesity, and smoking (17-19). Increased NLR is also associated with a poor prognosis of various cancers and ischemic heart disease (20-22). Although it has previously been shown that increased NLR is associated with essential hypertension and its complications, the relationship between NLR and WCH has not been previously studied (23-26). This study aimed to evaluate the NLR in patients with WCH compared with age-, sex-, and body mass index (BMI)-matched normotensive controls.
MATERIAL AND METHOD
Study SettingThis cross-sectional case-control study was conducted in the internal medicine outpatient clinics of the local University Hospital per the Declaration of Helsinki. Approval for this study was obtained from Akdeniz University Medical School Non-Interventional Clinical Researchs Ethics Committee (Date: 08.07.2020, Decision No: 488). All patients provided written informed consent.
Study Design and ParticipantsThis study aimed to evaluate patients with WCH compared to age-, sex-, and body mass index (BMI)-matched normotensive controls. WCH was defined and diagnosed as a measured office BP of greater than 140/90 mmHg with an ambulatory measurement of less than 135/85 mmHg (2). Healthy subjects, recruited from the routine check-up program of the local University Hospital, were used as a control group. Patients with sustained hypertension; diabetes mellitus (fasting glucose >126 mg/dL or hemoglobin A1c >6.5%); a history of smoking or alcohol intake of more than 30 g/day; hyperlipidemia; obesity (BMI ≥30 kg/m²); cardiac, renal, cerebral, and other systemic diseases; and recent major surgery or illness were excluded from the study. Hypertension was defined as systolic BP ≥140 mmHg or diastolic BP ≥90 mmHg, as recommended by the 2013 ESH/ESC guidelines for the management of arterial hypertension (27). Hyperlipidemia was defined as the presence of at least one of the following conditions: increased plasma triglycerides (>200 mg/dL), total cholesterol (>200 mg/dL), low-density lipoprotein cholesterol (>130 mg/dL), or decreased high-density lipoprotein cholesterol (<40 mg/dL for men and <50 mg/dL for women) (28). Forty-five eligible subjects with WCH and 45 age-, sex-, and BMI-matched healthy and normotensive subjects were included in the final analysis.
Assessment InstrumentsThe subjects underwent a comprehensive assessment, including medical history, physical examination, and measurement of laboratory variables. Body weight and height were measured with the subjects wearing light clothes without shoes. BMI was calculated as the weight (kg)/height squared (m)². All the subjects’ resting electrocardiograms were normal. A mercury sphygmomanometer was used to measure arterial BP after the patient had remained in a sitting position for 5 min. For each subject, the average of three readings obtained within 5 min was recorded. For ABPM, a portable non-invasive recorder (SpaceLabs Medical Devices, Inc., Redmond, WA, USA) programed to record BP every 30 min for 24 hours was used for all measurements. This information was then used to calculate the average ambulatory BP over 24 hours for each subject. For laboratory evaluations, blood samples were collected from the antecubital vein without a tourniquet between 08:30 a.m. and 09:00 a.m. after overnight fasting. An automated blood count analyzer measured the total and differential blood cell counts. The NLR was calculated by dividing the absolute neutrophil count by the absolute lymphocyte count. Fasting plasma glucose, creatinine, alanine aminotransferase levels, c-reactive protein and lipid profiles were measured by enzymatic-colorimetric assays (Roche Diagnostic GmbH, Mannheim, Germany).
Statistical AnalysesSPSS statistical software (SPSS for Windows 16.0, Chicago, IL, USA) was used for the analyses. For a type 1 (α) error of 0.05 and a power of 80%, a sample size per group of at least 36 subjects was needed to detect an actual difference. The normality of the distribution was determined by Shapiro–Wilk tests. NLR values between the groups were compared by Student’s t-tests and Pearson’s correlation coefficients. Data for categorical variables were presented as frequency and percentage, and continuous variables were expressed as mean±SD. Statistical significance was defined as p<0.05.
RESULTSAge, gender distribution, and BMI were similar between the WCH and control groups. Office systolic and diastolic BP measurements were significantly higher in patients with WCH (p<0.001, Student’s t-test). The metabolic parameters in the study groups were similar as a result of the participant selection process. The mean NLR in the patients-with-WCH group was significantly higher than that in the control group (2.67±0.27 vs. 2.46±0.34, p<0.001, Student’s t-test). However, NLR was not correlated with BP measurements in the WCH and control groups (Spearman’s rho correlation coefficient 0.16 and 0.09, p value 0.14 and 0.42, respectively) (Table).

826
Avşar et al. NLR in white-coat hypertensionJ Health Sci Med 2021; 4(6): 824-827
DISCUSSIONHypertension is a well-established risk factor for morbidity and mortality, possibly due to its’ relation with atherosclerosis. Atherosclerosis is characterized by a complex multifactorial pathophysiology. Inflammatory processes in vessel walls are increasingly recognized as playing a central role in the initiation, progression, and final steps of atherosclerosis (9,29). WCH, a distinct phenotype of hypertension, was recently demonstrated as a risk factor for cardiovascular events, cardiovascular mortality, and all-cause mortality, especially if left untreated (4,8). Several inflammatory markers have been shown to be increased in WCH (14-16), but the relationship between NLR and WCH has not been previously studied. In this matched case-control study, we aimed to evaluate the NLR in patients with WCH compared to age-, sex-, and body mass index (BMI)-matched normotensive controls. We excluded patients with several confounding factors such as sustained hypertension, diabetes mellitus, smoking or alcohol intake, hyperlipidemia, obesity, cardiac, renal, cerebral, and other systemic diseases, and recent major surgery or illness. In this study population, we have demonstrated that NLR was increased in patients with WCH, compared to age-, sex-, and body mass index (BMI)-matched normotensive controls.
There are several studies in the literature on the relationship between inflammation, including NLR, and essential hypertension (23-26). However, there are limited studies about the relationship between systemic inflammation markers and WCH. Ozdogan et al. (14) reported that in patients with WCH, high-sensitivity CRP, a marker of low-grade inflammation, is higher than normotensive patients, whereas in patients with essential hypertension, high-sensitivity CRP levels were even higher than in patients with WCH. Andrikou et al. (30) confirmed higher high-sensitivity CRP levels and demonstrated that WCH is also associated with arterial stiffening compared with normotensive patients. Similarly, several studies have also reported increased soluble CD40 ligand, procalcitonin, and pentraxin-3 levels in WCH compared to normotensive groups (14-16).
Neutrophil-to-lymphocyte ratio is a novel, non-invasive, easily-calculable, and easily obtained marker as a surrogate for inflammation. NLR has been previously studies and in many hemato-oncologic, immunologic and infectious diseases as well as cardiologic disorders, and the increase has been associated with increased morbidity and mortality. It has been well documented that NLR is associated with increased inflammatory status for various cardiovascular risk factors and essential hypertension and its complications (17-19,23-26). Herein, we add to the literature that an increase in NLR is seen in patients with in WCH, compared to controls, as a novel marker of inflammation. Although WCH as a risk factor for cardiovascular events, cardiovascular mortality, and all-cause mortality is still of debate, an increase in NLR as a surrogate for increased inflammation may suggest that patients with WCH are also at risk for cardiological disorders such as ischemic heart disease.
This study has certain limitations. First, the sample size was small, although higher than the calculated sample size; nevertheless, both groups were homogeneous in terms of age, gender, BMI, and laboratory results. Second, due to the case-control study design, the results may not reflect long-term effects. Third, these findings are limited to a homogeneous group of patients, so the results may not apply to all patients with WCH.
CONCLUSIONWe have demonstrated that NLR, a marker of systemic inflammation, was increased in patients with WCH compared to controls. Inflammation is a triggering mechanism for various cardiovascular and cerebrovascular events; therefore, NLR has value as a potential independent risk factor that deserves further study, particularly in patients with WCH.
Table. Study group characteristics and laboratory results
Parameters WCH group (n=45)
Control group (n=45)
Gender (men/women) 45 (21/24) 45 (22/23)Age (years) 55±3 55±2BMI (kg/m²) 23.7±3.1 23.6±3.2Office systolic BP measurement (mmHg) 146±4.7** 127±5.1
Office diastolic BP measurement (mmHg) 94±5.3*** 81±4.6
Fasting plasma glucose (mg/dL) 86.8±9.7 87.1±9.6
Creatinine (mg/dL) 0.9±0.2 0.9±0.2Alanine aminotransferase (U/L) 25.7±3.5 25.5±3.4
C-reactive protein (mg/dL) 0.23±0.11 0.17±0.07Total cholesterol (mg/dL) 169.4±21.9 169.9±22.1LDL cholesterol (mg/dL) 88.3±12.1 88.9±11.6HDL cholesterol (mg/dL) 48.7±5.4 48.4±5.3Triglyceride (mg/dL) 129.6±15.8 128.9±16.3White blood cell (×10³/mm³) 6.76±1.72 6.69±1.74Neutrophil (×10³/mm³) 4.74±1.55 4.66±1.62Lymphocyte (×10³/mm³) 1.81±0.19* 1.90±0.21Neutrophil to lymphocyte ratio 2.67±0.27*** 2.46±0.34
WCH: White coat hypertension, BMI: Body mass index, BP: Blood pressure, LDL: low-density lipoprotein; HDL: high-density lipoprotein. *p<0.05, **p<0.01, and ***p<0.001, Student’s t-test, WCH group vs. control group.
827
Avşar et al. NLR in white-coat hypertension J Health Sci Med 2021; 4(6): 824-827
ETHICAL DECLARATIONS Ethics Committee Approval: Approval for this study was obtained from Akdeniz University Medical School Non-Interventional Clinical Researchs Ethics Committee (Date: 08.07.2020, Decision No: 488). Informed Consent: All patients signed the free and informed consent form. Referee Evaluation Process: Externally peer-reviewed. Conflict of Interest Statement: The authors have no conflicts of interest to declare. Financial Disclosure: The authors declared that this study has received no financial support. Author Contributions: All of the authors declare that they have all participated in the design, execution, and analysis of the paper, and that they have approved the final version.
REFERENCES1. Muntner P, Shimbo D, Carey RM, et al. Measurement of blood
pressure in humans: a scientific statement from the American Heart Association Hypertension 2019; 73:e35-e66.
2. Cuspidi C, Sala C, Grassi G, Mancia G. White coat hypertension: to treat or not to treat? Curr Hypertens Rep 2016; 18: 80.
3. Campbell PT, White WB. Utility of ambulatory blood pressure monitoring for the management of hypertension. Curr Opin Cardiol 2017; 32: 365-72.
4. Huang Y, Huang W, Mai W, et al. White-coat hypertension is a risk factor for cardiovascular diseases and total mortality. J Hypertens 2017; 35: 677-88.
5. Piper MA, Evans CV, Burda BU, Margolis KL, O’Connor E, Whitlock EP. Diagnostic and predictive accuracy of blood pressure screening methods with consideration of rescreening intervals: a systematic review for the U.S. Preventive Services Task Force. Ann Intern Med 2015; 162: 192-204.
6. Franklin SS, Thijs L, Asayama K, et al. Cardiovascular risk in white-coat hypertension. JACC 2016; 68: 2033-43.
7. Briasoulis A, Androulakis E, Palla M, Papageorgiou N, Tousoulis D. White-coat hypertension and cardiovascular events: a meta-analysis. J Hypertens 2016; 34: 593-9.
8. Cohen JB, Denker MG, Cohen DL, Townsend RR. Cardiovascular events and mortality in white coat hypertension. Ann Intern Med 2019; 171: 603-4.
9. Blake GJ, Ridker PM. Inflammatory bio-markers and cardiovascular risk prediction. J Intern Med 2002; 252: 283-94.
10. Ridker PM. Inflammation, atherosclerosis, and cardiovascular risk: an epidemiologic view. Blood Coagul Fibrinolysis 1999; 10: 9–12.
11. Rifai N. C-reactive protein and coronary heart disease: diagnostic and therapeutic implications for primary prevention. Cardiovasc Toxicol 2001; 1: 153-7.
12. Benzaquen LR, Yu H, Rifai N. High sensitivity C-reactive protein: an emerging role in cardiovascular risk assessment. Crit Rev Clin Lab Sci 2002; 39: 459-97.
13. Ridker PM. High-sensitivity C-reactive protein and cardiovascular risk: rationale for screening and primary prevention. Am J Cardiol 2003; 92: 17K–22K.
14. Ozdogan M, Bozcuk H, Coban E. Low-grade inflammation in white-coat hypertension. Med Sci Monit 2007; 13: CR570-573.
15. Yavuzer H, Cengiz M, Yavuzer S, et al. Procalcitonin and Pentraxin-3: current biomarkers in inflammation in white coat hypertension. J Hum Hypertens 2016; 30: 424-9.
16. Huang YQ, Jie LI, Chen JY, Tang ST, Huang C, Feng YQ. The relationship between soluble CD40 ligand level and atherosclerosis in white-coat hypertension. J Hum Hypertens 2017; 32: 40-5.
17. Imtiaz F, Shafique K, Mirza SS, Ayoob Z, Vart P, Rao S. Neutrophil lymphocyte ratio as a measure of systemic inflammation in prevalent chronic diseases in Asian population. Int Arch Med 2012; 5: 2.
18. Guo X, Zhang S, Zhang Q, et al. Neutrophil:lymphocyte ratio is positively related to type 2 diabetes in a large-scale adult population: a Tianjin chronic low-grade systemic inflammation and health cohort study. Eur J Endocrinol 2015; 173: 217-25.
19. Azab B, Camacho-Rivera M, Taioli E. Average values and racial differences of neutrophil lymphocyte ratio among a nationally representative sample of United States subjects. PloS One 2014; 9: e112361.
20. Templeton AJ, McNamara MG, Šeruga B, et al. Prognostic role of neutrophil-to-lymphocyte ratio in solid tumors: a systematic review and meta-analysis. J Natl Cancer Inst 2014; 106: dju124.
21. Verdoia M, Barbieri L, Giovine GD, Marino P, Suryapranata H, De Luca G. Neutrophil to lymphocyte ratio and the extent of coronary artery disease: results from a large cohort study. Angiology 2016; 67: 75-82.
22. Erturk M, Cakmak HA, Surgit O, Celik O, Aksu HU. The predictive value of elevated neutrophil to lymphocyte ratio for long-term cardiovascular mortality in peripheral arterial occlusive disease. J Cardiol 2014; 43: 61-9.
23. Liu X, Zhang Q, Wu H, et al. Blood neutrophil to lymphocyte ratio as a predictor of hypertension. Am J Hypertens 2015 28: 1339-46.
24. Yayla C, Canpolat U, Akyel A, et al. Association of neutrophil-lymphocyte ratio with impaired aortic elasticity in newly diagnosed and never-treated hypertensive patients. Blood Press Monit 2015; 20: 127-31.
25. Karagoz A, Vural A, Gunaydın ZY, et al. The role of neutrophil to lymphocyte ratio as a predictor of diastolic dysfunction in hypertensive patients. Eur Rev Med Pharmacol Sci 2015; 19; 433-40.
26. Demir M. The relationship between neutrophil lymphocyte ratio and non-dipper hypertension. Clin Exp Hypertens 2013; 35: 570-3.
27. Mancia G, Fagard R, Narkiewicz K, et al. Task Force for the management of arterial hypertension of the European Society of Hypertension and the European Society of Cardiology. Blood Press 2014; 23: 3-16.
28. Expert Panel on Detection, Evaluation, and Treatment of High Blood Cholesterol in Adults (Adult Treatment Panel III). Executive Summary of the Third Report of the National Cholesterol Education Program (NCEP). JAMA 2001; 285: 2486-97.
29. Shrivastava AK, Singh HV, Raizada A, Singh SK. C-reactive protein, inflammation and coronary heart disease Egypt Heart J 2015; 67: 89-97.
30. Andrikou I, Tsioufis C, Dimitriadis K, et al. Similar levels of low-grade inflammation and arterial stiffness in masked and white-coat hypertension: comparisons with sustained hypertension and normotension. Blood Press Monit 2011; 16: 218-23.

HEALTH SCIENCESMEDICINE
Original Article
J Health Sci Med 2021; 4(6): 828-834
This work is licensed under a Creative Commons Attribution 4.0 International License.
DOI: 10.32322/jhsm.971934
Received: 15.07.2021 Accepted: 09.08.2021Corresponding Author: Veysel Garani Soylu, [email protected]
Is macrocytic erythrocyte a new prognostic parameter in critical COVID-19 disease?
Veysel Garani Soylu1, Sedat Gülten2, Ayşe Yılmaz3, Öztürk Taşkın4, Ufuk Demir4, Funda İnan Çatan5
1Kastamonu University Faculty of Medicine, Department of Intensive Care Medicine, Kastamonu, Turkey2Kastamonu University Faculty of Medicine, Department of Medical Biochemistry, Kastamonu, Turkey3Kastamonu Training and Research Hospital, Department of Anesthesiology and Intensive Care Medicine, Kastamonu, Turkey4Kastamonu University Faculty of Medicine, Department of Anesthesiology and Intensive Care Medicine, Kastamonu, Turkey5Kastamonu University Faculty of Medicine, Department of Biostatistics, Kastamonu, Turkey
Cite this article as: Soylu VG, Gülten S, Yılmaz A, Taşkın Ö, Demir U, İnan Çatan F. Is macrocytic erythrocyte a new prognostic parameter in critical COVID-19 disease?. J Health Sci Med 2021; 4(6): 828-834.
ABSTRACTIntroduction: In critical COVID- 19 patients, we aimed to examine the relationship mortality between the parameters and the macrocytic/microcytic erythrocyte population that are routinely evaluated in each patient admitted to the intensive care unit. Material and Method: It is a retrospective cross-sectional study and was conducted in Kastamonu University, Faculty of Medicine, a tertiary hospital intensive care units located in the North of Turkey .198 nonanemic critical COVID-19 patients treated between November 2020 and February 2021 were evaluated. The patients were divided into two groups as survival and non survival. APACHE II score, SAPS II score and routine blood examinations of the patients were evaluated.Results: Among the groups; APACHE II score (p<0.001), SAPS II score (p<0.001), CRP (p<0.001), ferritin (p<0.001), d-dimer (p<0.001), platelet distribution width (p<0.009), mean platelet volume (p=0.005) and large platelet ratio (p=0.02) values were higher, platelet counts (p=0.02) were lower, and these parameters were statistically significant between the two groups. There was no difference in erythrocyte distribution volume and microcytic erythrocyte percentage between the groups, but according to the cox regression analysis, each unit increase in macrocytic erythrocyte percentage was associated with a 1.203-fold increase in mortality. Conclusion: Routine procedures performed in every patient admitted to the intensive care unit can provide information about mortality. Macrocytic erythrocyte percentage, which is not generally considered in non-anemic patients, may be a new marker for mortality.
Keywords: Macrocytic erythrocyte population, intensive care unit, COVID-19, complete blood count, mortality
Ana Metin-Alt bilgi Arası 5mm
Cite-Öz arası 5mm
Başlık-Yazarlar arası 12mm
Yazar-Kurum arası 2,5 mm
Kurum-Cite arası 5mm
Öz-Abstract arası 7,5mm
INTRODUCTIONThe coronavirus disease emerged in the human population in late December 2019 and spread all over the world, and was declared a pandemic by the World Health Organization (WHO) on March 11, 2020 (1-2). Although vaccination studies have started in many countries for COVID-19 disease, this disease still continues worldwide with all its severity. In the literature, it has been stated that the intensive care mortality associated with COVID-19 disease is between 40% and 90% (3). Since the beginning of the pandemic; a lot of research has been done to predict the intensive care prognosis and mortality of critical COVID-19 patients. In these studies, some scoring (4), tomography findings (5)
and inflammatory markers (6-7) were associated with the intensive care prognosis and mortality of critically ill COVID-19 patients. Acute Physiology and Chronic Health Evaluatioon Score II (APACHE II), Simplified Acute Physiology Score II (SAPS II) and blood tests are used in the routine evaluation of patients in both COVID intensive care unit and non COVID intensive care unit admission. Complete blood count provides vital parameters that guide clinical management, including diagnosis, infection or inflammation, anemia, response to treatment, pathogenesis, and inflammatory process (8).

829
Soylu et al. Is macrocytic erythrocyte a new prognostic parameter? J Health Sci Med 2021; 4(6): 828-834
The aim of every patient admitted to the ICU is to reduce mortality and morbidity. The markers that guide us in this regard are very important. CBC, which is among the routine tests, has parameters such as lymphocyte count, platelet count, red cell distribution width, etc. that can be associated with mortality in COVID and nonCOVID ICU patients. These parameters are not only correlated with adverse outcomes of COVID-19 disease, but may also be associated with bone marrow suppression due to malignancy or with previously diagnosed anemia.
Macrocytic erythrocyte populations (Macro R) and microcytic erythrocyte populations (Micro R) are routinely studied parameters in the CBC test. These parameters are used to investigate possible causes of anemia (9). However, these parameters are generally not considered in patients who are not anemic.
In critically COVID-19 patients, we evaluated APACHE II , SAPS II, whole blood tests and Macro R/ Micro R, which are routinely used in the evaluation of every patients admitted to the intensive care unit. We aimed to investigate the relationship between this parameters and prognosis or mortality of patients in intensive care units .
MATERIAL AND METHOD Approval for study was obtained from the Non-interventional Clinical Researchs Ethics Committee of Kastamonu University Faculty of Medicine (Date: 25/02/2021, Decision No: KAEK-2020-143-38). All procedures were carried out in accordance with the ethical rules and the principles of the Declaration of Helsinki.
It is a retrospective cross-sectional study and was conducted in Kastamonu University, Faculty of Medicine, a tertiary hospital intensive care units located in the North of Turkey. In the study, 236 critical COVID-19 patients treated in the third level COVID intensive care unit between November 2020 and February 2021 were evaluated. For a more objective evaluation of CBC parameters; as inclusion criteria for the study; not having any previous diagnosis of malignancy and anemia defined by the World Health Organization (hemoglobin concentration below 12 g/dL in women and 13 g/dL in men) (10). Thirteen patients with a history of malignancy and 25 patients with anemia were excluded from the study, and 198 patients were included in the study. All of the patients included in the study were critical COVID-19 patients according to the COVID-19 Adult Patient Management Guidelines published by the Ministry of Health of the Republic of Turkey (11). All of the patients included in the study were positive in the real-time polymerase chain reaction (RT-PCR) test performed by the hospital laboratory. Patients who were successfully treated and transferred to the service during the intensive
care treatment process were named Survival Group (98 patients) and those who died were named Non- survival Group (100 patients). The medical records and electronic patient data system of the patients included in the study were reviewed retrospectively. Patients; Age, gender, APACHE II scores, SAPS II scores, ferritin, C-reactive protein (CRP), procalcitonin, d-dimer values and 27 parameter CBC values were recorded on the first day of admission to the intensive care unit. . CBC parameters were calculated using an automated hematology analyzer (XN-1000-Hematology-analyzer-Sysmex Corporation, Japan).
Statistical AnalysisThe significance in differences between the means of two continuous and normally distributed variables was determined by independent t-test. Non-normal distributed continuous variables were explained by Mann-Whitney U test. Pearson’s chi-square test was conducted to determine the relationship in proportions of categorical variables between two groups. The optimal cut-off values of continuous Apache and Saps score were calculated by applying the Receiver Operating Curve (ROC9 analysis. The association of biochemical parameters with survival was determined by Cox regression analysis. Cox regression with forward stepwise method was used to determine the impacts of age, gender, and other important biochemical variables. Relative risk was calculated with hazard risk and 95% confidence interval (CI). p<0.05 was considered as statistically significant. All statistical analyses were performed using the SPSS 23.00 (SPSS Inc, Chicago, USA).
RESULTSA total of 198 patients were included in the study. Of the participants, 67 (33.8%) were female and 131 (66.2%) were male. After intensive care treatment, 98 (49.5%) patients were transferred to the service (Survival Group); 100 (50.5%) patients died during the intensive care treatment process (Non- survival Group).
Sixty-two (63.2%) patients in Survival Group and sixty-nine (69%) patients in Non- survival Group were male. The patients included in the study were between the ages of 40-98 and the mean age of patients was 67.05 ± 0.47. In the data analysis made between the groups; the mean age of the patients in Non- survival Group (68.75 ± 8.98) was higher than the mean age of the surviving patients (65.31 ± 11.79).
The patients in Non- survival Group ; age, APACHE II score, SAPS II score, CRP, ferritin, d-dimer, platelet distribution width (PDW), mean platelet volume (MPV) and large platelet ratio (%P-LCR) were higher on the first day of admission to the intensive care unit, but

830
Soylu et al. Is macrocytic erythrocyte a new prognostic parameter?J Health Sci Med 2021; 4(6): 828-834
platelet(PLT) counts were lower than Survival Group
There were statistically significant differences in these parameters between both groups (Age (P< 0.02), APACHE II (P <0.001), SAPS II (P <0.001), Crp (P <0.001), Ferritin (P<0.001), D -dimer (P <0.001), Plt (P = 0.02), PDW (P = 0.009), MPV (P = 0.005) and % P-LCR (P = 0.002)). Red cell distribution width (% RDW) values were similar between both groups; There was no statistical difference between the groups. (( %RDW (P = 0.56)) (Table 1)
Cox regression analysis with stepwise method was used to analyze the risk factors for fatal outcomes in patients with COVID -19. The significant parameters were entered the Cox model to identify independent predictors of
death. Model performed well regarding the result of omnibus test. The results of this test explained that our model is significant (X2=60.75, P<0.001) improvement in fit relative to null. Biochemical variables including Saps II (HR 1.110, CI 1.076-1.146, P<0.001), D-dimer (HR 0.873, CI 0.784-0.973, P=0.014), Procalcitonin (HR 0.877, CI 0.773-0.994, P=0.04) , MONO% (HR 0.902, CI 0.845-0.963, P=0.002) and MacroR (%) (HR 1.203, CI 1.058-1.369, P=0.005) were predictive of fatal outcomes. A one-unit increase in MacroR was associated with a 1.203-fold increase in mortality and was considered a major predictor. An increase in Saps II score was also associated with mortality. Each unit increase in Saps II score was associated with a 1.11-fold increase in mortality rate (Table 2).
Table 1. Socio-demographics and biochemical characteristics of patients (total N=198)
Variables Total n=198 M* ± SD
Survival Group n= 98 M ± SD
Non- survival Group n= 100 M ± SD test P
Age (years) 67.05 ± 0.47 65.31 ± 11.79 68.75 ± 8.98 t= -2.30 0.02Gender 198 62/36** 69/31** X2=0.72 0.39Apache II 22.41 ± 7.82 16.56 ± 5.31 28.14 ± 5.20 t=--15.48 <0.001Saps II 30.69 ± 9.54 23.42 ± 5.89 37.81 ± 6.60 t=-16.16 <0.001Crp (mg/l) 137.22 ± 87.56 114.49 ± 89.01 159.51 ± 80.50 t=--3.73 <0.001Ferritin (ng/ml) 909.32 ± 454.58 690.28 ± 443.31 1123.98±353.00 t=--7.60 <0.001D Dimer (mg/l) 2.60 ± 2.04 1.95 ± 1.65 3.23 ± 2.20 t=--4.61 <0.001Procalcitonin (mg/dl) 1.61 ± 1.88 103.99* 95.10* Z=-1.10 0.27WBC (103/uL) 10.12 ± 5.35 10.20 ± 5.19 10.04 ± 5.53 t=-0.21 0.83RBC (10⁶/uL) 4.47 ± 0.80 102.67* 96.40* Z=-0.77 0.44HGB (g/dL) 14.54 ± 2.14 98.66* 100.32* Z=-0.20 0.83HCT (%) 42.17 ± 6.54 100.03* 98.98* Z=-0.13 0.89MCV (fL) 85.88 ± 6.82 85.81 ± 7.19 85.95 ± 6.48 t=--0.14 0.88MCH (pg) 28.89 ± 11.25 95.51* 103.42* Z=-0.97 0.33MCHC (g/dL) 33.46 ± 10.16 96.21* 102.72* Z=-0.79 0.42PLT (103/uL) 205.42 ± 92.01 108.54* 90.65* Z=-2.19 0.02RDW-SD (fL) 45.39 ± 6.87 44.86 ± 5.96 45.91 ± 7.66 t=--1.07 0.28RDW-CV (%) 14.63 ± 2.53 97.11* 101.85* Z=-0.58 0.56PDW (fL) 12.11 ± 2.26 11.69 ± 2.00 12.52 ± 2.42 t=--2.62 0.009MPV (fL) 10.54 ± 0.95 10.35 ± 0.87 10.73 ± 1.00 t=--2.87 0.005P-LCR (%) 29.10 ± 7.30 27.52 ± 6.65 30.65 ± 7.60 t=--3.08 0.002NRBC# (103/uL) 0.02 ± 0.09 93.35* 105.53* Z=-1.83 0.06NRBC% (%) 0.16 ± 0.70 94.21* 104.68* Z=-1.62 0.10NEUT# (103/uL) 8.46 ± 5.08 8.47 ± 4.96 8.44 ± 5.22 t=0.04 0.96LYMPH# (103/uL) 1.08 ± 0.79 101.20* 97.84* Z=-0.41 0.68MONO# (103/uL) 0.50 ± 0.34 0.53 ± 0.36 0.48 ± 0.32 t=0.91 0.36EO# (103/uL) 0.04 ± 0.12 102.24* 96.71* Z=-0.69 0.48BASO# (103/uL) 0.03 ± 0.03 0.03 ± 0.2 0.03 ± 0.02 t=0.21 0.83NEUT% (%) 81.01 ± 10.97 80.48 ± 11.69 81.51 ± 10.25 t=-0.66 0.51LYMPH% (%) 12.87 ± 9.22 99.31* 99.69* Z=-0.05 0.96MONO% (%) 5.39 ± 3.12 5.51 ± 3.20 5.28 ± 3.05 t=0.51 0.61EO% (%) 0.41 ± 1.24 102.57* 96.49* Z=-0.78 0.43BASO% (%) 0.31 ± 0.22 200.30* 98.72* Z=-0.19 0.84MicroR (%) 5.22 ± 6.47 99.88* 99.13* Z=-0.09 0.92MacroR (%) 4.09 ± 1.35 96.84* 102.11* Z=-0.64 0.51* Median Of Variables, ** Number Of Patients In Terms Of Female Gender t: T test Z: Man whitney u test X2: Chi square test Abbreviations: APACHE II: Acute Physiology and Chronic Health Evaluatioon Score II, SAPS II: Simplified Acute Physiology Score II.CRP: C-reactive protein, WBC: white blood cells, RBC: red blood cell, HGB: hemoglobin, HCT: hematocrit, MCV: mean corpuscular volume, MCH: mean cell hemoglobin, MCHC: mean corpuscular hemoglobin concentration, PLT: Platelets, RDW: red cell distribution width, PDW: platelet distribution width, MPV: Mean platelet volume, P-LCR: platelet-large cell rate, NRBC: Nucleated red blood cells, NEUT: Neutrophils,LYMPH: Lymphocytes, MONO: Monocytes EO: Eosinophils, BASO: Basophils, MicroR: microcytic erythrocyte populations, MacroR: macrocytic erythrocyte populations

831
Soylu et al. Is macrocytic erythrocyte a new prognostic parameter? J Health Sci Med 2021; 4(6): 828-834
The optimal cut-off values of Apache II and Saps II parameters were calculated by the ROC analysis (Figure 1). Areas under the curve (AUC) of Apache II and Saps II were 0.928 and 0.944, respectively (Table 3). They were the potential mortality biomarkers. The sensitivity and specificity were 0.86 and 0.898 for Apache II , and 0.85 and 0.918 for Saps II . In addition to this, the optimal cut-off values of Apache II and Saps II were 22.50 and 30.50, respectively.
DISCUSSIONOur study revealed that age, APACHE II score, SAPS II score, CRP, ferritin, D-dimer and CBC parameters plt, MPV, PDW, %P-LCR values were statistically significant between surviving and non-surviving patients in critical COVID-19 patients. These findings were similar to previous studies (12-13). Contrary to the findings in
the literature, the %RDW values were not statistically different in our study between surviving and non-surviving patients (14). There are few studies on the %Macro R value in the literature. Our study revealed the relationship of increased macro R values with mortality in critical COVID-19 disease, according to the results of the cox regression analysis performed in addition to other studies in the literature. With these results, according to the roc analysis for APACHE II and SAPS II scores; both scores were found to have high sensitivity and specify.
The male patient population is higher among patients treated in intensive care units due to COVID-19 disease. In our study, 66.1% of the total number of patients was male, which was similar to the studies in the literature (12-15). According to the meta-analysis published by Armstrong et al. (16), intensive care mortality in critical COVID-19 disease ranges from 34% to 49.7% . In a study conducted with the participation of more than 17 million COVID-19 patients in England, it was stated that the male gender was 1.6 times more likely to face the risk of mortality compared to the female gender (17). In our study, we found that the ICU mortality was 50.5% and 69% of the patients with mortality were male.
APACHE II and SAPS II scores are important parameters used in the evaluation of prognosis in critically ill patients treated in the intensive care unit. In their study, Xie et al stated that the APACHE II score on the first day of admission to the intensive care unit is an independent risk factor for 28-day mortality in COVID-19 disease. In our study, we found that there was a statistically significant difference in the APACHE II score between patients who survived and died. However, in our study, the APACHE II median values of the patients in both groups were higher than the study by Xie et al. (18). In our study, APACHE II score cut-off value was calculated as 22.5, sensitivity 0.86 and specificity 0.898. This value was found to be consistent with the literature (19). Larcher et al. (20)revealed the relationship between SAPS II scoring and mortality in COVID-19 disease. Duclos et al. (21) found the cut-off value as 31, sensitivity as 1, and specificity as 0.58 for the SAPSII score in their study with critical COVID-19 patients. In our study, the SAPS II score was statistically significant between surviving and non-surviving patients, and the cut-off value was
Figure 1. ROC curve of Apache II and Saps II variables
Table 2. Cox regression analysis for prognostic factors
Variables Β SE p HR95% CI for HR
Lower UpperSaps II 0.105 0.016 <0.001 1.110 1.076 1.146D-Dimer -0.135 0.055 0.014 0.873 0.784 0.973Procalcitonın -0.131 0.064 0.040 0.877 0.773 0.994MONO%(%) -0.103 0.033 0.002 0.902 0.845 0.963MacroR(%) 0.185 0.066 0.005 1.203 1.058 1.369Abbreviations: SAPS II: Simplified Acute Physiology Score II, MONO: Monocytes, MACRO R: macrocytic erythrocyte populations .
Table 3. Areas under the curve (AUC) of Apache II and Saps II variables
Variables Area SE Asymptotic Sig.
Asymptotic 95% CI
Lower UpperApache II 0.928 0.019 <0.001 0.892 0.965Saps II 0.944 0.016 <0.001 0.912 0.975Abbreviations: APACHE II: Acute Physiology and Chronic Health Assessment Score II,SAPS II: Simplified Acute Physiology Score II

832
Soylu et al. Is macrocytic erythrocyte a new prognostic parameter?J Health Sci Med 2021; 4(6): 828-834
30.5, the sensitivity 0.85, and the specificity 0.918. In addition, in the cox regression analysis, we found a 1.11 fold increase in mortality with each point increase in the SAPS II score.
CRP and ferritin markers are inflammatory markers; as stated in a meta-analysis including 83 studies in the literature, it is seen that CRP and ferritin values have a significant relationship with mortality in COVID-19 disease (22). Studies have shown that d dimer, which is one of the coagulopathy markers, is associated with mortality at high values in COVID-19 disease (23). In our study, the CRP, ferritin and d dimer values of the patient group who died during the intensive care unit were higher and there was a statistically significant difference between the groups.
Complete blood count examination is an easily accessible and fast test. CBC examination is the most widely used first laboratory examination (24). There are studies in the literature that indicate the importance of CBC parameters about the prognosis of COVID-19 disease. In most of these studies, it was reported that there was a significant difference in neutrophil count, lymphocyte count, and platelet count between surviving and non-surviving patients (25). Ouyang et al. (26) reported in their study that non-survival patients had lower platelet counts. In our study, there was no statistical difference between the lymphocyte count and neutrophil counts among the non-survival patients, while the non-survival patients had lower platelet counts and there was a statistically significant difference between the groups. MPV, PDW and %P LCR; are some parameters related to platelet cells. In a study conducted with COVID-19 patients, the mean % P LCR values were found to be 21.6% in surviving patients and 26.7% in non-survival patients. In our study, the mean % P LCR values of the non-survival patients were higher and there was a statistically significant difference between the groups. In the study of Güçlü et al. (27) investigating the effect of COVID-19 disease on platelet count and indices, they stated that PDW and MPV values were higher in non-survival patients and there was a statistically significant difference. In our study non-survival patients had higher PDW and MPV values, and similar to this study, there was a statistically significant difference between the groups Thrombocytopenia is an expected finding in COVID-19 patients. Accordingly, as the platelet count decreases, there is an increase in platelet release from the bone marrow. This may explain the increase in MPV, PDWand P LCR.
Rdw is a parameter that reflects the degree of heterogeneity of erythrocyte volume used in the differential diagnosis of bone marrow dysfunction, iron deficiency anemia, and hematological system diseases. Proinflammatory
state and hypoxia impair erythropoiesis and cause an increase in RDW. The studies have shown that RDW elevation is compatible with mortality in COVID-19 disease and in many disease groups (28). In the meta-analysis published by Lee et al. (29) in 2021; It was stated that RDW elevation was correlated with the negative outcomes of COVID-19 disease. However, the effect of anemia-independent RDW elevation in COVID-19 was not clarified in this study. In the study of Rapp et al. (14) with COVID-19 patients, it was revealed that RDW elevation was associated with mortality and morbidity, independent of anemia. However, patients who were not hospitalized were included in this study. The patients included in our study were patients who were not anemic and were treated in the intensive care unit. There was no statistically significant difference in RDW values between survivors and non-survivors.
%Macro R and %Micro R markers are parameters used to investigate possible causes in the etiology of anemia. Apart from investigating the etiology of anemia, they are not the most important markers for clinicians. There are limited publications in the literature stating that %Macro R and %Micro R values are associated with mortality. One of them was the study conducted by Horne et al (30). This study includes the patient group without COVID-19 disease. As a result of the cox regression analysis performed in our study, each unit increase in % Macro R values in COVID-19 patients was found to be compatible with a 1.2-fold increase in mortality. However, the % micro r value was not associated with mortality. There is an inflammatory state and a hypoxic process in COVID-19 disease (28). Depending on these factors, there is an increase in the release of erythropeitn. The increased secretion of erythropoietin causes the release of immature reticulocyte from the bone marrow into the circulation (31). Macrocytic erythrocytes are thought to be immature macrocytic reticulocytes released from the bone marrow due to the stimulation of increased erythropoietin (30). As it is known, COVID-19 disease is hypoxic respiratory failure disease. Depending on the effect of insufficient oxygen on target cells, there may be more erythrocytes and more oxygen transport reflex in the circulation. We think that the increase in the % Macro R value is associated with mortality.
CONCLUSIONThere are many parameters associated with mortality and morbidity in COVID-19 disease. In critical COVID-19 patients who need to be treated in the intensive care unit, APACHE II, SAPS II score, platelet count, PDW, MPV and %P LCR values from CBC parameters can provide information about the prognosis of the patient. Especially in non-anemic patients, the increase in % Macro R value

833
Soylu et al. Is macrocytic erythrocyte a new prognostic parameter? J Health Sci Med 2021; 4(6): 828-834
can be used as a new marker that can be associated with mortality. The small number of participants is a limiting factor for our study. The %Macro R marker, which is used to investigate the etiology of anemia, should be investigated in more participants and different disease groups (especially diseases causing hypoxemia).
ETHICAL DECLARATIONSEthics Committee Approval: Approval for study was obtained from the Non-interventional Clinical Researchs Ethics Committee of Kastamonu University Faculty of Medicine (Date: 25/02/2021, Decision No: KAEK-2020-143-38). Informed Consent: Because the study was designed retrospectively, no written informed consent form was obtained from patients.Referee Evaluation Process: Externally peer-reviewed. Conflict of Interest Statement: The authors have no conflicts of interest to declare. Financial Disclosure: The authors declared that this study has received no financial support. Author Contributions: All of the authors declare that they have all participated in the design, execution, and analysis of the paper, and that they have approved the final version.
REFERENCES1. Zhou P, Yang XL, Wang XG. A pneumonia outbreak associated
with a new coronavirus of probable bat origin. Nature 2020; 579: 270–3.
2. World Health Organization; 2020. Coronavirus disease (COVID -2019) Situation Reports. Available from: https://www.who.int/docs/default-source/coronaviruse/situation-reports/20200311- sitrep-51-COVID-19.pdf?sfvrsn=1ba62e57_10 (Accessed on 3/11/2020).
3. Murthy S, Archambault PM, Atique A, et al. Characteristics and outcomes of patients with COVID -19 admitted to hospital and intensive care in the first phase of the pandemic in Canada: a national cohort study. CMAJ Open 2021; 9: E181-8.
4. Estella Á, Garcia Garmendia JL, de la Fuente C, et al. Predictive factors of six-week mortality in critically ill patients with SARS-CoV-2: A multicenter prospective study. Med Intensiva. 2021; S0210-5691: 00033-4.
5. Li H Luo S, Zhang Y, Xiao X, Liu H. Longitudinal chest CT features in severe/critical COVID-19 cases and the predictive value of the ınitial CT for mortality. J Inflamm Res 2021; 14: 1111-24.
6. Chen R, Sang L, Jiang M, et al. Longitudinal hematologic and immunologic variations associated with the progression of COVID-19 patients in China. J Allergy Clin Immunol 2020; 146: 89-100.
7. Qin C, Zhou L, Hu Z, et al. Dysregulation of ımmune response in patients with coronavirus 2019 (COVID-19) in Wuhan, China. Clin Infect Dis 2020; 71: 762-8.
8. Lanini S, Montaldo C, Nicastri E, et al. COVID-19 disease-Temporal analyses of complete blood count parameters over course of illness, and relationship to patient demographics and management outcomes in survivors and non-survivors:
A longitudinal descriptive cohort study. PLoS One 2020; 15: e0244129.
9. Ashorobi D, Munakomi S. Myelophthisic Anemia. (Updated 2021 May 1). In: StatPearls (Internet). Treasure Island (FL): StatPearls Publishing; 2021 Jan-. Available from: https://www.ncbi.nlm.nih.gov/books/NBK541103/
10. World Health Organization, 1968. Nutritional anaemias: report of a WHO scientific group (meeting held in Geneva from 13 to 17 March 1967).
11. Republic of Turkey Ministry of Health; Available from: (Accessed on 5/07/2021)
12. Grasselli G, Zangrillo A, Zanella A, et al. Baseline characteristics and outcomes of 1591 patients ınfected with SARS-CoV-2 admitted to ICUs of the Lombardy Region, Italy. JAMA 2020; 323: 1574-81.
13. Vogels Y, Pouwels S, van Oers J, Ramnarain D. Characteristics and risk factors associated with mortality in critically ill patients with COVID-19. Cureus 2021; 13: e14442.
14. Rapp JL, Tremblay D, Alpert N, et al. Red cell distribution width is associated with mortality in non-anemic patients with COVID-19. J Med Virol 2021; 93: 4130-2.
15. Kokoszka-Bargieł I, Cyprys P, Rutkowska K, Madowicz J, Knapik P. Intensive care unit admissions during the first 3 months of the COVID-19 pandemic in Poland: a single-center, cross-sectional study. Med Sci Monit 2020; 26: e926974.
16. Armstrong RA, Kane AD, Cook TM. Outcomes from intensive care in patients with COVID -19: a systematic review and meta-analysis of observational studies. Anaesthesia 2020; 75: 1340-9.
17. Williamson EJ, Walker AJ, Bhaskaran K, et al. Factors associated with COVID -19-related death using OpenSAFELY. Nature 2020; 584: 430-6.
18. Xie J, Wu W, Li S, et al. Clinical characteristics and outcomes of critically ill patients with novel coronavirus infectious disease (COVID-19) in China: a retrospective multicenter study. Intensive Care Med 2020; 46: 1863-72.
19. Qu R, Hu L, Ling Y, et al. C-reactive protein concentration as a risk predictor of mortality in intensive care unit: a multicenter, prospective, observational study. BMC Anesthesiol 2020; 20: 292.
20. Larcher R, Besnard N, Akouz A, et al. Admission high-sensitive cardiac troponin t level ıncrease ıs ındependently associated with higher mortality in critically ill patients with COVID-19: a multicenter study. J Clin Med 2021; 10: 1656.
21. Duclos G, Bazalguette F, Allaouchiche B, et al. Can thoracic ultrasound on admission predict the outcome of critically ill patients with SARS-CoV-2? a French multi-centric ancillary retrospective study. Adv Ther 2021; 38: 2599-612.
22. Mahat RK, Panda S, Rathore V, Swain S, Yadav L, Sah SP. The dynamics of inflammatory markers in coronavirus disease-2019 (COVID -19) patients: A systematic review and meta-analysis. Clin Epidemiol Glob Health 2021; 11: 100727.
23. Adam EH, Zacharowski K, Miesbach W. A comprehensive assessment of the coagulation profile in critically ill COVID-19 patients. Thromb Res 2020; 194: 42–4.
24. Horton S, Fleming KA, Kuti M, et al. The top 25 laboratory tests by volume and revenue in five different countries. Am J Clin Pathol 2019; 151: 446-51.
25. Mousavi SA, Rad S, Rostami T, et al. Hematologic predictors of mortality in hospitalized patients with COVID -19: a comparative study. Hematology 2020; 25: 383-8.
26. Ouyang SM, Zhu HQ, Xie YN, et al. Temporal changes in laboratory markers of survivors and non-survivors of adult inpatients with COVID-19. BMC Infect Dis 2020; 20: 952.
27. Güçlü E, Kocayiğit H, Okan HD, et al. Effect of COVID -19 on platelet count and its indices. Rev Assoc Med Bras (1992) 2020; 66: 11227.

834
Soylu et al. Is macrocytic erythrocyte a new prognostic parameter?J Health Sci Med 2021; 4(6): 828-834
28. Bommenahalli Gowda S, Gosavi S, Ananda Rao A, et al. Prognosis of COVID-19: Red cell distribution width, platelet distribution width, and C-reactive protein. Cureus 2021; 13: e13078.
29. Lee JJ, Montazerin SM, Jamil A, et al. Association between red blood cell distribution width and mortality and severity among patients with COVID-19: A systematic review and meta-analysis. J Med Virol 2021; 93: 2513-22.
30. Horne BD, Muhlestein JB, Bennett ST, et al. Extreme erythrocyte macrocytic and microcytic percentages are highly predictive of morbidity and mortality. JCI Insight 2018; 3: e120183.
31. Brecher G, Stohlman F jr. Reticulocyte size and erythropoietic stimulation. Proc Soc Exp Biol Med 1961; 107: 887-91.

HEALTH SCIENCESMEDICINE
Original Article
J Health Sci Med 2021; 4(6): 835-839
This work is licensed under a Creative Commons Attribution 4.0 International License.
DOI: 10.32322/jhsm.972723
Received: 17.07.2021 Accepted: 31.08.2021Corresponding Author: Şenay Öztürk Durmaz, [email protected]
Clinical and prognostic evaluation of patients admitted to the COVID-19 pandemic unit of the emergency department
Şenay Öztürk Durmaz1, Ayşenur Sümer Coşkun2, Ata Nevzat Yalçın31Kepez State Hospital, Department of Infectious Diseases and Clinical Microbiology, Antalya, Turkey2Kepez State Hospital, Department of Anaesthesiology and Reanimation, Antalya, Turkey3Akdeniz University, Faculty of Medicine, Department of Infectious Diseases and Clinical Microbiology, Antalya, Turkey
Cite this article as: Öztürk Durmaz Ş, Sümer Coşkun A, Yalçın AN. Clinical and prognostic evaluation of patients admitted to the COVID-19 pandemic unit of the emergency department. J Health Sci Med 2021; 4(6): 835-839.
ABSTRACTObjective: This study aimed to evaluate to prognosis of patients admitted to the COVID-19 isolation unit of the emergency department and present epidemiological data by examining their demographic, clinical, laboratory and lung tomography findings.Material and Method: A total of 504 patients presenting with COVID-19 symptoms were randomly and retrospectively evaluated based on electronic records obtained from the hospital archive.Results: Of the patients, 216 (42.9%) were female and 288 (57%) were male. The RT-PCR test was positive in 291 (57.7%) patients, and fever was the most common symptom in 280 (55.5%). A total of 133 patients (26.4%) were admitted to the inpatient ward. The WBC, Troponin-t, CRP, AST, ALT, LDH, D-dimer and ferritin levels were high and lymphocyte count was low in patients who were hospitalized. Sixty-one percent of the patients had a comorbid condition; 19% of had diabetes and 18.8% had hypertension as the most common underlying condition. Totally, 312 (61.9%) had favipiravir, 106 (21%) were favipiravir + hydroxychloroquine, 60 (11.9%) used hydroxychloroquine alone, 26 (5.2%) were followed up without treatment and to 147 of them, antibiotics were prescribed in addition to the medicine; 38.5% of the patients followed up in the intensive care unit were diabetic; 26 patients (5.2%) were followed up in the intensive care unit. The mortality rate was found to be 1.9%. At least one comorbid condition was present in all who were hospitalized and died in the intensive care unit.Conclusion: The importance of a healthy diet and regular physical activity for metabolic conditions such as diabetes and hypertension as well as for fighting infections is well known. We consider that the mortality and morbidity rates due to the COVID-19 pandemic can be reduced by developing reliable and safe antiviral treatment options and implementing effective and fair vaccination policies.Keywords: COVID-19, epidemiology, prognosis
Ana Metin-Alt bilgi Arası 5mm
Cite-Öz arası 5mm
Başlık-Yazarlar arası 12mmv
Yazar-Kurum arası 2,5 mmvcv
Kurum-Cite arası 5mm
Öz-Abstract arası 7,5mmvc
INTRODUCTIONCoronavirus 2019 (COVID-19),caused by SARS-COV-2 was first reported in China at the end of 2019 and the World Health Organization (WHO) declared the disease as a pandemic on March 11, 2020. Since then, the number of cases has reached 102 million, and the number of those who died due to the virus has exceeded 2 million. The SARS-COV-2 infection can cause asymptomatic diseases, mild upper respiratory tract infections, respiratory failure, or severe viral pneumonia that may result in death (1-4). Although the real-time reverse transcriptase polymerase chain reaction (RT-PCR) test is the standard method used in the diagnosis of COVID-19, clinical, laboratory and thorax computed tomography (CT) evaluations also provide valuable data (5-8).
In this study, we aimed to analyze the epidemiological data of patients admitted to the COVID-19 isolation unit of the emergency department by evaluating their clinical, laboratory, CT findings, comorbid conditions, and prognoses.
MATERIAL AND METHODThe study was carried out with the permission of Health Science University, Antalya Training and Research Hospital Clinical Researchs Ethics Committee (Date: 01.04.2021, Decision No: 4-8). All procedures were carried out in accordance with the ethical rules and the principles of the Declaration of Helsinki.

836
Öztürk Durmaz et al. Clinical and prognostic evaluation of COVID-19 J Health Sci Med 2021; 4(6): 835-839
The study included a total of 504 patients who presented to the emergency department of our hospital with COVID-19 symptoms between June 1, 2020 and March 1, 2021. The patients' demographic data, medical histories, biochemical parameters including laboratory analysis, hemogram, D-dimer, troponin-T, C reactive protein (CRP) and ferritin, thorax (CT) findings, and treatment protocols recorded in the hospital's archive were electronically scanned in a retrospective manner.
Case definitions were made in line with the recommendations in with the current recommendations of the Turkish Ministry of Health COVID-19 Guidelines (9). Patients with positive SARS-COV-2 real-time reverse transcriptase polymerase chain reaction (RT-PCR) test results based on the respiratory tract sample wereaccepted as definitive COVID-19 cases. If the RT-PCR test was negative, but the patient had complaints related to the disease and findings compatible with viral pneumonia on CT scans, they were accepted as possible cases. Patients with a negative result from two consecutive PCR test performed at a 24-hour interval and normal CT findings were considered not to have COVID-19.
In the interpretation of the thoracic CT findings, the presence of ground-glass density of less than 3 cm in three or less foci was classified as mild pneumonia; consolidation or a ground-glass density of more than three foci or greater than 3 cm was classified as moderate pneumonia, and involvement of all lobes in both lungs and at least three lesions larger than 3 cm classified as severe pneumonia (10).
Conforming to the recommendations of the Turkish Ministry of Health COVID-19 Guidelines, the patients were hospitalized based on the following indications: poor prognosis markers; comorbid conditions, such as hypertension (HT), diabetes mellitus, chronic lung disease (lymphocyte number <850\mm2, ferritin >500 ng\mL, D-dimer >1000 ng\mL) or suspicion of the severe form of the disease (9). Medications to be given to the patients, their doses, and treatment options were arranged in line with the recommendations of the same Guidelines (9).
All statistical analyses were performed using IBM SPSS version 25.0 (SPSS Inc., Chicago, Illinois, USA). Tables are presented as Mean±SD for continuous variables, while categorical variables are presented as number (N) and percentage (%). Comparisons between groups were made using the independent t-test and ANOVA test for continuous variables. Among the Post-Hoc tests, Turkey test was utilized. Chi-square test was applied to compare categorical variables. Pearson correlation analysis was used for the relations of continuous variables with each other and p<0.005 was considered statistically significant.
RESULTSDemographic data of patients given in Table 1. Among 504 patients who presented to the COVID-19 unit of the emergency department, fever was the most common symptom (n=280, 55.5%). Respectively, weakness and malaise in 232 patients (46%), cough in 120 patients (23.8%), muscle-joint pain in 98 patients (19.4%), shortness of breath in 88 patients (17.4%), sore throat in 76 patients (15%), headache in 76 patients (15%), loss of taste and smell in 43 patients (8.5%), chest and back pain in 37 patients (7.3%), diarrhea in 24 patients (4.8%), anorexia in 12 patients (2.4%), abdominal pain and nausea in 6 patients (1.2%) were observed.
For treatment, favipiravir was used in 312 of the patients, favipiravir+hydroxychloroquine in 106, hydroxychloroquine alone in 60, while 26 patients were followed up without treatment, and 147 were additionally prescribed antibiotics.
Table 1. Sociodemographic Data of the Patients (N=504)Demographic Variables
N and/or XOR (min-max)
% and/or Mean ±SD
GenderFemale 216 42.9Male 288 57.1
Age (years) 46.00 (18-105) 46.46±17.57PCR
Positive 291 57.7Negative 121 24.0Possible Case 92 18.3
Tomography (Pneumonia findings)Doesn’t exist 211 41.8Mild 227 45.1Moderate 53 10.5Severe 13 2.6
Hospital Stay (day)1-7 75 60.08-14 45 36.0>14 5 4.0
Treatment ConditionsOutpatient 371 73.6Inpatients (ICU + ward) 133 26.4
ICU hospitalization (day) 8.50 (1.00-40.00) 11.34±10.69
LYM 16000.0 (14.60-150000.0) 1786.43±1101.16Trop T 4.85 (2.00-1280.00) 12.88±63.81WBC 6535.00 (500.0-50000.0) 7806.84±4520.03PLT 216.00 (4.12-206000.0) 1057.34±12746.73CRP 8.90 (0.10-334.00) 33.19±53.27AST 22.00 (4.00-299.00) 29.16±29.59ALT 22.00 (1.00-804.00) 33.04±56.55LDH 204.50 (18.80-2650.00) 235.02±153.65D-dimer 149.00 (10.80-24000.00) 360.10±1357.69Ferritin 97.00 (1.00-10000.00) 216.19±663.44Rate of Death
Alive 494 98.0Dead 10 2.0
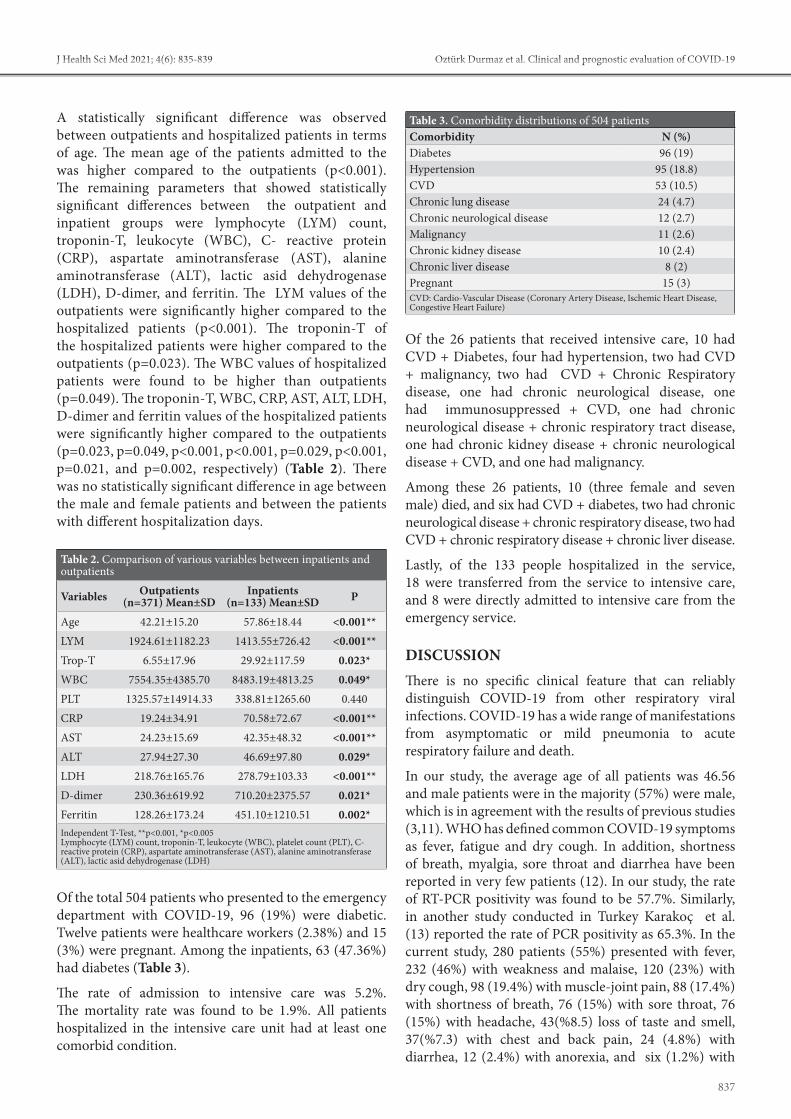
837
Öztürk Durmaz et al. Clinical and prognostic evaluation of COVID-19J Health Sci Med 2021; 4(6): 835-839
A statistically significant difference was observed between outpatients and hospitalized patients in terms of age. The mean age of the patients admitted to the was higher compared to the outpatients (p<0.001). The remaining parameters that showed statistically significant differences between the outpatient and inpatient groups were lymphocyte (LYM) count, troponin-T, leukocyte (WBC), C- reactive protein (CRP), aspartate aminotransferase (AST), alanine aminotransferase (ALT), lactic asid dehydrogenase (LDH), D-dimer, and ferritin. The LYM values of the outpatients were significantly higher compared to the hospitalized patients (p<0.001). The troponin-T of the hospitalized patients were higher compared to the outpatients (p=0.023). The WBC values of hospitalized patients were found to be higher than outpatients (p=0.049). The troponin-T, WBC, CRP, AST, ALT, LDH, D-dimer and ferritin values of the hospitalized patients were significantly higher compared to the outpatients (p=0.023, p=0.049, p<0.001, p<0.001, p=0.029, p<0.001, p=0.021, and p=0.002, respectively) (Table 2). There was no statistically significant difference in age between the male and female patients and between the patients with different hospitalization days.
Of the total 504 patients who presented to the emergency department with COVID-19, 96 (19%) were diabetic. Twelve patients were healthcare workers (2.38%) and 15 (3%) were pregnant. Among the inpatients, 63 (47.36%) had diabetes (Table 3).
The rate of admission to intensive care was 5.2%. The mortality rate was found to be 1.9%. All patients hospitalized in the intensive care unit had at least one comorbid condition.
Of the 26 patients that received intensive care, 10 had CVD + Diabetes, four had hypertension, two had CVD + malignancy, two had CVD + Chronic Respiratory disease, one had chronic neurological disease, one had immunosuppressed + CVD, one had chronic neurological disease + chronic respiratory tract disease, one had chronic kidney disease + chronic neurological disease + CVD, and one had malignancy.
Among these 26 patients, 10 (three female and seven male) died, and six had CVD + diabetes, two had chronic neurological disease + chronic respiratory disease, two had CVD + chronic respiratory disease + chronic liver disease.
Lastly, of the 133 people hospitalized in the service, 18 were transferred from the service to intensive care, and 8 were directly admitted to intensive care from the emergency service.
DISCUSSIONThere is no specific clinical feature that can reliably distinguish COVID-19 from other respiratory viral infections. COVID-19 has a wide range of manifestations from asymptomatic or mild pneumonia to acute respiratory failure and death.
In our study, the average age of all patients was 46.56 and male patients were in the majority (57%) were male, which is in agreement with the results of previous studies (3,11). WHO has defined common COVID-19 symptoms as fever, fatigue and dry cough. In addition, shortness of breath, myalgia, sore throat and diarrhea have been reported in very few patients (12). In our study, the rate of RT-PCR positivity was found to be 57.7%. Similarly, in another study conducted in Turkey Karakoç et al. (13) reported the rate of PCR positivity as 65.3%. In the current study, 280 patients (55%) presented with fever, 232 (46%) with weakness and malaise, 120 (23%) with dry cough, 98 (19.4%) with muscle-joint pain, 88 (17.4%) with shortness of breath, 76 (15%) with sore throat, 76 (15%) with headache, 43(%8.5) loss of taste and smell, 37(%7.3) with chest and back pain, 24 (4.8%) with diarrhea, 12 (2.4%) with anorexia, and six (1.2%) with
Table 3. Comorbidity distributions of 504 patientsComorbidity N (%)Diabetes 96 (19)Hypertension 95 (18.8)CVD 53 (10.5)Chronic lung disease 24 (4.7)Chronic neurological disease 12 (2.7)Malignancy 11 (2.6)Chronic kidney disease 10 (2.4)Chronic liver disease 8 (2)Pregnant 15 (3)CVD: Cardio-Vascular Disease (Coronary Artery Disease, Ischemic Heart Disease, Congestive Heart Failure)
Table 2. Comparison of various variables between inpatients and outpatients
Variables Outpatients (n=371) Mean±SD
Inpatients (n=133) Mean±SD P
Age 42.21±15.20 57.86±18.44 <0.001**LYM 1924.61±1182.23 1413.55±726.42 <0.001**Trop-T 6.55±17.96 29.92±117.59 0.023*WBC 7554.35±4385.70 8483.19±4813.25 0.049*PLT 1325.57±14914.33 338.81±1265.60 0.440CRP 19.24±34.91 70.58±72.67 <0.001**AST 24.23±15.69 42.35±48.32 <0.001**ALT 27.94±27.30 46.69±97.80 0.029*LDH 218.76±165.76 278.79±103.33 <0.001**D-dimer 230.36±619.92 710.20±2375.57 0.021*Ferritin 128.26±173.24 451.10±1210.51 0.002*Independent T-Test, **p<0.001, *p<0.005Lymphocyte (LYM) count, troponin-T, leukocyte (WBC), platelet count (PLT), C- reactive protein (CRP), aspartate aminotransferase (AST), alanine aminotransferase (ALT), lactic asid dehydrogenase (LDH)

838
Öztürk Durmaz et al. Clinical and prognostic evaluation of COVID-19 J Health Sci Med 2021; 4(6): 835-839
abdominal pain and nausea. This clinical spectrum was similar to most other studies (3,14-16).
According to the COVID-19 Guidelines of the Turkey’s Ministry of Health Public Health General Directorate, the disease is classified as uncomplicated, pneumonia and severe pneumonia. Patients without fever, muscle-joint pain, cough, sore throat, nasal congestion, respiratory distress, tachypnea and SpO2 <93%, with no underlying diseases (cardiovascular diseases, diabetes mellitus, hypertension, cancer, chronic lung diseases along with other immunosuppressive conditions), those under 50 years of age, those with normal chest radiography or CT findings, and those without poor prognostic values in blood tests performed at admission (blood lymphocyte count <800/ µl or CRP >40 mg/L or ferritin >500 ng/mL or D-dimer >1000 ng/mL etc.) are defined as uncomplicated diseases, while patients with a respiratory rate of less than 30 per minute are evaluated in the mild pneumonia category, and those with a SpO2 level below 90% in room air, bilateral diffuse pneumonia on chest X-ray or tomography, and poor prognostic values in blood tests at the time of admission are classified as severe pneumonia (17).
The severity of COVID-19 and its mortality course have been shown to be associated with cardiovascular diseases, diabetes, hypertension, chronic lung and kidney diseases, and cancers (14). The fatality rate is higher among those with comorbid conditions. According to the data reported from China, the rate of mortality was 10.5% in patients with cardiovascular diseases, 7.3% in the presence of diabetes, 6.3% in the presence of chronic respiratory failure, 6.0% in the presence of hypertension, and 5.6% in the presence of cancer (18-19). When we evaluated the 504 patients included in our study, those with comorbidities constituted 61% of the whole sample. The most common comorbidities were diabetes (19%) and hypertension (18.8%), followed by CVD (10.5%), chronic lung disease (4.7%), chronic neurological disease (2.7%), and malignancy (2.6%). While the mortality rate was 0.9% among the patients without any comorbidity, it was much higher inthose with comrbidities. In a previous study, the rate of mortality was reported to be 7.4% in patients with diabetes (20). In another study, 32.3% (10/31) of patients that required ICU were diabetic, while the rate of diabetics among those that did not require ICU hospitalization was determined as 9.2% (22). Similarly, in our study 10 of the 26 (38.5%) patients followed up in the intensive care unit were diabetic.
In our study, at least one comorbid condition was present among the 26 patients admitted to the intensive care unit and all 10 patients who died. Of the 10 patients who died, three were female and seven were male, and six had CVD + diabetes, two had chronic neurological disease
+ chronic respiratory disease + HT, and two had CVD + chronic respiratory disease + chronic liver disease. In a case group consisting of 355 patients who died due to COVID-19 in Italy, the presence of underlying chronic diseases was emphasized in all except 3 cases (21). Similarly, in our study, at least one comorbid condition was found in all patients who died.
Since there is no standard treatment regimen for COVID-19, there are differences between countries. For the treatment planning of symptomatic patients, we followed the guidelines of the Turkish Ministry of Health to decide whether they required inpatient or outpatient treatment. In the treatment of our patients, we used favipiravir in 312 (61.9%), favipiravir + hydroxychloroquine 106 (21%), and hydroxychloroquine alone in 60 (11.9%), while we followed up 26 patients without treatment and prescribed additional antibiotics for 147 patients. Chloroquine is a widely used malaria drug that was shown to have potential broad-spectrum antiviral properties in 2006. It has been reported to successfully block SARS-CoV-2 infections at a low concentration. Favipiravir is a new RNA-dependent RNA polymerase (RdRp) inhibitor. In addition to its anti-influenza activity, favipiravir has the ability to inhibit the replication of flavi-, alpha, filo-, bunya-, arena-, neuro-, and other RNA viruses. Therefore, it may have a potential antiviral effect against SARS-CoV-2, which is an RNA virus(22,23).
All the patients who died in our study had the severe form of the disease and required intensive care. In Turkey, the rate of cases diagnosedwith severe COVID-19 is similar to China, and 6% of the total cases detected are followed up in the ICU (24). Similarly, in our study, the rate of patients followed up in the ICU was 5.2%. According to the WHO statement on March 3, 2020, the global fatality rate due to COVID-19 is 3.4% (25). In our study, the mortality rate was found to be 1.9%. In Turkey, the population over the age of 65 years constitutes about 9% of the total population in contrast to 20% in many European countries. The younger population and treatment capacity not being exceeded may be among the reasons for the lower mortality rate observed in our country (26,27).
The small number of patients and limited treatment options, single-center study and retrospective can be considered as the limitations of our study.
In our study, 47.36% of hospitalized patients had diabetes. This indicates the importance of blood glucose regulation in preventing mortality-morbidity due to COVID-19. The mortality rate among our patients was as low as 1.9%, which shows the importance and success of the Turkish health system infrastructure in combating epidemic diseases.
839
Öztürk Durmaz et al. Clinical and prognostic evaluation of COVID-19J Health Sci Med 2021; 4(6): 835-839
CONCLUSIONIn the current study, diabetes, hypertansion and CVD, were the most commonly observed coöorbidities among the patients with COVID-19 that required hospitalization or intensive care. We consider that these health problems can be managed in most people by a healthy diet and regular physical activity. The challenging process created by the COVID-19 pandemic has once again emphasized the importance of nutrition.We believe that the mortality and morbidity caused by the pandemic can only be reduced with the scientific world developing reliable and safe antiviral treatment options and implementing effective and fair vaccination policies.
ETHICAL DECLARATIONSEthics Committee Approval: The study was carried out with the permission of Health Science University, Antalya Training and Researchs Hospital Clinical Research Ethics Committee (Date: 01.04.2021, Decision No: 4-8).Informed Consent: Because the study was designed retrospectively, no written informed consent form was obtained from patients.Referee Evaluation Process: Externally peer-reviewed. Conflict of Interest Statement: The authors have no conflicts of interest to declare. Financial Disclosure: The authors declared that this study has received no financial support. Author Contributions: All of the authors declare that they have all participated in the design, execution, and analysis of the paper, and that they have approved the final version.
REFERENCES1. Hasöksüz M, Kiliç S, Saraç F. Coronaviruses and sars-cov-2. Turk
J Med Sci 2020; 50: 549-56.2. Lai CC, Shih TP, Ko WC, Tang HJ, Hsueh PR. Severe acute
respiratory syndrome coronavirus 2 (SARS-CoV-2) and coronavirus disease-2019 (COVID-19): The epidemic and the challenges. Int J Antimicrob Agents 2020; 55: 105924.
3. Guan WJ, Ni ZY, Hu Y, et al. Clinical characteristics of coronavirus disease 2019 in China. New Engl J Med 2020; 382: 1708-20.
4. Salehi S, Abedi A, Balakrishnan S, Gholamrezanezhad A. Coronavirus disease 2019 (COVID-19): a systematic review of imaging findings in 919 patients. Am J Roentgenol 2020; 215: 87-93.
5. Li Z, Yi Y, Luo X, et al. Development and clinical application of a rapid IgM‐IgG combined antibody test for SARS‐CoV‐2 infection diagnosis. J Med Virol 2020; 92: 1518-24.
6. Hao W, Li M. Clinical diagnostic value of CT imaging in COVID-19 with multiple negative RT-PCR testing. Travel Med Infect Dis 2020; 34: 101607.
7. Wang S, Kang B, Ma J, et al. A deep learning algorithm using CT images to screen for corona virus disease (COVID-19). Eur Radiol 2021: 1-9.
8. Zhai P, Ding Y, Wu X, Long J, Zhong Y, Li Y. The epidemiology, diagnosis and treatment of COVID-19. Int J Antimicrob Agents 2020; 55: 105955.
9. COVID-19 Information Page. Access date: 11, 2020. Access: https://covid19.saglik.gov.tr/TR 66935/genelkoronavirus-tablosu.html
10. British Society of Thoracic Imaging. Thoracic imaging in COVID-19 infection. Guidance for the reporting radiologist. Version 2. 16 March 2020 [Internet]. UK BSTI [Access 15 June 2020].https:\\www.bsti.org.uk\media\resources\files\BSTI_COVID-19_Radiology_Guidance_version_2_16.03.20.pdf.
11. Zhang JJ, Dong X, Cao YY, et al. Clinical characteristics of 140 patients infected with SARS‐CoV‐2 in Wuhan, China. Allergy 2020; 75: 1730-41.
12. World Health Organization. (2020). Coronavirus disease 2019 (COVID-19): situation report, 60. https://www.who.int/health-topics/coronavirus#tab=- tab_3. Access date 01.07.2020.
13. Karakoc ZC, Pinarbasi Simsek B, Asil R, et al. First wave in the COVID-19 pandemic: one center experience. Klimik J/Klimik Derg 202; 33: 3.
14. Zhou F, Yu T, Du R, et al. Clinical course and risk factors for mortality of adult inpatients with COVID-19 in Wuhan, China: a retrospective cohort study. The Lancet 2020; 395: 1054-62.
15. Elshafeey F, Magdi R, Hindi N, et al. A systematic scoping review of COVID‐19 during pregnancy and childbirth. Int J Gynecol Obstet 2020; 150: 47-52.
16. Wang D, Hu B, Hu C, et al. Clinical characteristics of 138 hospitalized patients with 2019 novel coronavirus–infected pneumonia in Wuhan, China. JAMA 2020; 323: 1061-9.
17. Turkey Health Ministry (2020). General Directorate of Public Health, Covid-19 (SARS-CoV-2) guide (Scientific Committee Study). Access date:10 July 2020. Available from: https:\\hsgm.saglik.gov.tr\tr\covid19.
18. Wu Z, McGoogan JM. Characteristics of and important lessons from the coronavirus disease 2019 (COVID-19) outbreak in China: summary of a report of 72 314 cases from the Chinese Center for Disease Control and Prevention. JAMA 2020; 323: 1239-42.
19. Yang JK, Feng Y, Yuan MY, et al. Plasma glucose levels and diabetes are independent predictors for mortality and morbidity in patients with SARS. Diabetic Med 2006; 23: 623-8.
20. Allard R, Leclerc P, Tremblay C, Tannenbaum TN. Diabetes and the severity of pandemic influenza A (H1N1) infection. Diabetes Care 2010; 33: 1491-3.
21. Grasselli G, Pesenti A, Cecconi M. Critical care utilization for the COVID-19 outbreak in Lombardy, Italy: early experience and forecast during an emergency response. JAMA 2020; 323: 1545-6.
22. Wang M, Cao R, Zhang L, et al. Remdesivir and chloroquine effectively inhibit the recently emerged novel coronavirus (2019-nCoV) in vitro. Cell Res 2020; 30: 269-71.
23. Delang L, Abdelnabi R, Neyts J. Favipiravir as a potential countermeasure against neglected and emerging RNA viruses. Antivir Res 2018; 153: 85-94.
24. Turkey Health Ministry (2020). The current situation in Turkey. 2020. Available from https:\\saglik.gov.tr\Access date: June 1, 2020.
25. World Health Organization. (2020). WHO Director-General's opening remarks at the media briefing on COVID-19-11 March 2020.
26. Eraksoy, H. COVID-19 Pandemic: Leaving First Four Months Behind/ COVID-19 Pandemic. KLIMIK J 2020; 33: 1-2.
27. Genç A, Kurtaiş Aytür Y. Acute and Post-acute pulmonary rehabilitation in COVID-19 infection. COVID-19 Pandemisi ve Fiziksel Tıp ve Rehabilitasyon. 1st Edition. Ankara: Türkiye Klinikleri; 2020; 7-12.
HEALTH SCIENCESMEDICINE
Original Article
J Health Sci Med 2021; 4(6): 840-844
This work is licensed under a Creative Commons Attribution 4.0 International License.
DOI: 10.32322/jhsm.973312
Received: 19.07.2021 Accepted: 23.08.2021Corresponding Author: Enes Gürün, [email protected]
Volumetric study of tracheal diverticulum: a retrospective analysis in computed tomography
Enes Gürün1, İsmail Akdulum2, Mustafa Kaya21İskilip Atıf Hoca State Hospital, Department of Radiology, Çorum, Turkey2Gazi University, Department of Radiology, Ankara, Turkey
Cite this article as: Gürün E, Akdulum İ, Kaya M. Volumetric study of tracheal diverticulum: a retrospective analysis in computed tomography. J Health Sci Med 2021; 4(6): 840-844.
ABSTRACTAim: The aim of this study was to retrospectively evaluate the prevalence and morphology (location, diameter, number and volume) of the tracheal diverticulum (TD) on thoracic computed tomography (CT), in a sample of the Turkish population.
Material and Method: The study was conducted over 15 months, from February 2020 to April 2021, and included 3,860 thoracic CT scans, of which 1,891 subjects were men and the rest were women. All of the thoracic CT scans were evaluated retrospectively. All images were reviewed for the presence or absence of the TD in the axial plane, defined as air sacs around the trachea and communication with the trachea. For volume measurement, the TD contour was manually evaluated by a single radiologist, for all patients. Descriptive statistics were reported as mean±standard deviation (SD). A p value of less than 0.05 was considered significant.
Results: The mean age of the patients was 57.87±14.76 (29-84). In this study, the incidence of TD was calculated to be 0.80%. The mean tracheal diverticulum volume (TDV) and maximum transverse diameter (MTD) of TD were 983.62±1 509.80 mm3 and 8.79±6.19 mm, respectively.
Conclusion: In this study, we demonstrated the volumetric measurement of TD and its prevalence. We believe that the frequency of its use in clinical practice should increase, as volumetric measurements provide healthier results than diameter measurements.
Keywords: Volumetry, tracheal diverticula, prevalence, computed tomography
Ana Metin-Alt bilgi Arası 5mm
Cite-Öz arası 5mm
Başlık-Yazarlar arası 12mm
Yazar-Kurum arası 2,5 mm
Kurum-Cite arası 5mm
Öz-Abstract arası 7,5mm
INTRODUCTIONA tracheal diverticulum (TD) is usually asymptomatic and is detected incidentally during imaging procedures, such as thoracic computed tomography (CT). When TD is symptomatic, it can cause respiratory symptoms such as cough, dyspnea, stridor and hemoptysis (1). It may also present with infection, abscess and rupture (2,3). TD is described as thin-walled air sacs in the paratracheal wall, often in contact with the tracheal lumen (4). TD is divided into 2 subgroups: congenital and acquired (5). Congenital TD is more common in males than females and is located 4 to 5 cm inferior to the vocal cords. Congenital TDs are thought to be caused by a developmental defect in the tracheal cartilage (6), whereas acquired TDs occur due to tracheomalacia or surgical complications. Acquired TD may occur as a result of increased intraluminal pressure due to chronic
obstructive pulmonary disease (COPD). They are often located in the posterolateral of the trachea, at the level of the thoracic inlet. In addition, acquired TDs are often larger than congenital TDs (4).
CT is an important tool for the evaluation of the TD and the visualization of other associated pathologies (7,8). CT can be used to assess the location, volume, contour, and wall thickness of the TDs (9). It can also detect communication between the TD and the trachea (5). The TD is often located in the right posterolateral aspect of the trachea and less commonly on the left side (1,4).
The aim of this study was to retrospectively evaluate the prevalence and morphology (location, diameter, number and volume) of the TD on thoracic CT, in a sample of Turkish population.

841
Gürün et al. Volumetric study of tracheal diverticulum in CT J Health Sci Med 2021; 4(6): 840-844
MATERIAL AND METHODThe study was carried out with the permission of Hitit University Non-interventional Researchs Ethics Committee (Date: 28.06.2021, Decision no: 2021-73). All procedures were carried out in accordance with the ethical rules and the principles of the Declaration of Helsinki. Informed consent was waived due to the retrospective nature of the study, as well as the fact that the assessment utilized anonymous research findings. The study was conducted over a period of fifteen months, from February 2020 to April 2021. Many of the patients had respiratory symptoms, such as chest pain, shortness of breath and cough, while others had no symptoms of respiratory problems but were routinely screened for various diseases, such as pulmonary nodules. Patients who did not have acceptable image quality on the computed tomography scans and medical records were not included in the study.
CT studies were performed using a multidetector 16-row helical CT scanner (Alexion, Toshiba Medical Systems, Nasu, Japan). The CT imaging was performed during a breath-hold at deep inspiration. Spirometric gating was not applied. The scans were obtained from the base of the neck down to the diaphragm. A supine or prone position was chosen. Parameters were 100–120 Kv, the field of view was 350 millimeters (mm), beam collimation was 1×16 mm, gantry rotation time was 0.5 seconds and scan time was 11–13 seconds. Thin-section CT data were reconstructed at a slice thickness of 1 mm with 0.8 mm intervals. Image matrix size was 512×512. We used automatic tube-current modulation at a maximum of 225 mAs for exposure dose reduction. All CT examinations were performed without contrast media.
All of the thoracic CT scans were evaluated retrospectively. All the images were reviewed for the presence or absence of the TD in the axial plane, defined as air sacs around the trachea and communication with the trachea (Figure 1). When TDs were observed, the imaging characteristics (emphysema or bronchiectasis), including location (right or left), size (axial diameter and volume) of all cases were noted. Bronchiectasis was defined as present when the diameter of the bronchial lumen was larger than the adjacent pulmonary artery, with no taper in the diameter of the bronchial lumen. Emphysema was defined as small, well or poorly-defined areas of low attenuation, surrounded by normal lungs.
The volume of TDs was analyzed using a Vitrea workstation (Canon Medical Systems Corporation, Otawara, Japan) by a single radiologist (E.G.), with seven years of experience in thoracic radiology. For volume measurement, the TD contour was manually evaluated by the examiner, for all patients. The area in each slice
was then recorded and the volumes were measured automatically by the Vitrea post-processing imaging software (Canon Medical Systems Corporation, Otawara, Japan). Finally, the volume was measured by the software and a three-dimensional reconstruction of the organ was generated (Figure 2). The tracheal diverticulum volume (TDV) was measured in milliliters (ml) or cubic millimeters (mm3): 1 ml was considered as 1 000 mm3. The TD was re-evaluated 5 days after the initial evaluation to assess reproducibility by the same observer.
Statistical AnalysisStatistical analysis was performed using the SPSS v.22 package program (IBM SPSS Statistics, Chicago, IL, USA). The age, gender and radiological characteristics of the participants were noted. Descriptive statistics were reported as mean±standard deviation (SD). The distribution of the data was analyzed using the Kolmogorov-Smirnov test and the relationship between TDV and gender was analyzed using the Mann-Whitney U test. Whether there is a statistically significant difference between the ages of men and women was also examined using the Mann-Whitney U test. The relationship between TDVs and age, and maximum transverse diameter (MTD), was calculated using “Spearman's correlation coefficient test”. The “intraclass correlation coefficient (ICC) test” was used to analyze intraobserver reliability, for repeated measurements with a 95% confidence interval. The ICC was indicated as follows: below 0.50: poor; between 0.50 and 0.75: moderate; between 0.75 and 0.90: good; above 0.90: excellent. A p value of less than 0.05 was considered significant.
RESULTSFrom February 2020 to April 2021, 3,926 adult patients (> 20 years) underwent thoracic CT examinations at our institution. After excluding 49 patients with diagnostically unacceptable image quality resulting from artifacts, and an additional 17 patients without medical records, the thoracic CT examinations of 3,860 adult patients were finally included in this study (1,891 male, 1,969 female) (Table 1).
The mean age of the patients was 57.87±14.76 (29-84). There was no statistically significant difference between the ages of men and women (p=0.091). A total of 46 diverticula were detected in 31 patients (17 male, 14 female). In this study, the incidence of TD was calculated to be 0.80%, all of the TDs were located on the right posterolateral side of the trachea and the prevalence of TD in males and females was 0.89% and 0.71%, respectively. The mean TDV and MTD of TD were 983.62±1509.80 mm3 and 8.79±6.19 mm, respectively. Descriptive statistics are presented in Table 2.

842
Gürün et al. Volumetric study of tracheal diverticulum in CTJ Health Sci Med 2021; 4(6): 840-844
A positive moderate correlation was observed between age and MTD (rho: 0.317; p: 0.032) and volume (rho: 0.327; p: 0.027). There was no statistically significant relationship between gender and mean TDV and MTD (p 0.05).
Intraobserver reliability for repeated measurements yielded an overall ICC of 0.935 (0.921-0.951), with a 95% confidence interval.
DISCUSSIONTDs are air spaces lined with ciliary columnar epithelium and connected to the trachea. Despite the fact that autopsy studies report a prevalence rate of 1%, the prevalence of TDs has been reported as high as 8.1% in previous radiological studies. It is divided into two groups: congenital and acquired (4,5). Acquired or congenital diverticula can be distinguished along with the location of the diverticulum, the age of the patient, the size of the diverticulum and the neck of the diverticulum (10). TDs are usually asymptomatic and are detected incidentally in thoracic CT. Possible symptoms include airway obstruction, recurrent lower respiratory tract infections, mass effect dysphagia, hoarseness, gagging and hemoptysis (4).
The associations between underlying lung diseases, such as emphysema or COPD and the prevalence of TDs, are still controversial. Goo et al. (7) and Boyacı et al. (11) reported an association between COPD and paratracheal air cysts (PTACs). In a study conducted by Polat et al. (12) on 301 patients with PTACs, they found no association between COPD and PTACs. In the study conducted by Cheng et al. (13), no association either was found between COPD and PTACs.
The prevalence of TD has been reported to range from 0.75% to 8% in previous studies (1, 11). In some of these studies however, true diverticula were not differentiated
Table 1. Flowchart shows study population and patient selection process
Table 2. Descriptive statistics for age, MTD of TD, Mean TDV and gender distributions of all casesVariables Total (n=31)Age (year old) 57.87±14.76 (29-84) MTD of TD (mm) 8.79±6.19 (2-30)Mean TDV (mm3) 983.62±1509.80 (20.95-6401.24)Gender (M/F) 17/14Data is expressed as n (number) or the mean± standard deviation (range). F: Female, M: Male, MTD: maximum transverse diameter, TD: Tracheal diverticulum, TD: Tracheal diverticulum volume, ml: milliliters, mm3: cubic millimeters
Figure 1. Non-contrast thoracic CT image in the axial (a) and sagittal (b) plane, showing TD (white arrow) which was located on the right posterolateral side of the trachea.
Figure 2. Calculation of TDs volume and three-dimensional reconstructed CT image of its.

843
Gürün et al. Volumetric study of tracheal diverticulum in CT J Health Sci Med 2021; 4(6): 840-844
according to the presence of a tracheal junction, and PTACs were also included in the studies. In our study, PTACs not connected to the trachea were not included in the study, and true diverticula connected to the lumen of the trachea were included in the study. For this reason, we think that the prevalence of TD in our study was lower compared to previous studies. In the study by Pace et al. (5), 124 TDs were detected in 1,679 CT scans and a prevalence of 5.7% was calculated. Kurt et al. (14) in their study, found 412 TDs belonging to 299 patients. In their study, the prevalence of TD was found to be 2.38%, whereas in our study, the prevalence was calculated as 0.8% (males 0.89% and females 0.71%). We think that the high prevalence that was observed in the study of Pace et al. (5) could be due to the difference in sample groups. The difference in prevalence could be due to the presence of CT scans in our patients to screen for COVID-19 pneumonia. Similar to the study by Pace et al., none of the patients in our series TD had a history of trauma, subcutaneous emphysema, nor visible pneumothorax or pneumomediastinum.
According to previous research, TD has a slight female preference (8,11,15). In contrast to previous studies however, in our study, the male gender was more frequently affected than the female gender, as was also reported by Kurt et al. (14). In general, TDs were found on the right side of the trachea, in accordance with previous studies (5,8). This finding may be explained by the fact that both the esophagus and the aortic arch support the left side of the trachea, in terms of resistance to increasing intratracheal stress. TDs are mostly found at the level of the T2 vertebrae on the right posterolateral side of the trachea, which is the transition zone between the intrathoracic and extrathoracic trachea, and this localization also brings the pressure theory to the forefront, as it is a transition zone (16). In our study, TDs were detected in this localization, in all cases.
Boyacı et al. (11) reported the median size of PTACs to be 5.17×6.60×10.95 mm and Kim et al. (8) reported it as 7.5×4.2×11.5 mm. Goo et al. (7) found a mean axial diameter of 10 mm and a mean vertical length of 14 mm. In our study, the mean TDV and MTD of TD were 983.62±1 509.80 mm3 and 8.79±6.19 mm, respectively. Measurements of diameter may not be accurate due to some variability in the morphology of TD, however volumetric analysis can now provide more standardized evaluations thanks to advances in CT software technology and for this reason, it should be used more widely in practice. Volumetric measurement is important in terms of calculating dimensional size with higher accuracy and predicting potential surgical complications. This is because two-dimensional measurement without three-dimensionality, overlooks the possible difference in volume. In radiological practice, volume measurements
are generally obtained by multiplying the diameters, measured in 3 planes by the spherical formula (R1 x R2 x R3 x 0.52). However, for structures with irregular boundaries, errors in volume measurements may occur. In this study, we evaluated the location and volumes of TD, which were detected during thoracic CT examinations in adults. Using the workstation program, the area of each section was calculated separately by the program and volume measurements were performed automatically.
This study has several limitations. First of all, it included only a limited number of patients and was monocentric: future multicenter studies with a larger number of patients will provide more accurate evidence. Second, interobserver reliability could not be assessed because the evaluations were performed by a single radiologist. Finally, our measurements were performed only in vivo and the actual ex vivo volume was not evaluated.
CONCLUSIONWe demonstrated with this study the volumetric measurement of TD, as well as its prevalence. We believe that the frequency of its use in clinical practice should increase, as volumetric measurements provide healthier results than diameter measurements.
ETHICAL DECLARATIONSEthics Committee Approval: The study was carried out with the permission of Hitit University Non-interventional Researchs Ethics Committee (Date: 28.06.2021, Decision no: 2021-73).Informed Consent: Because the study was designed retrospectively, no written informed consent form was obtained from patients.Referee Evaluation Process: Externally peer-reviewed. Conflict of Interest Statement: The authors have no conflicts of interest to declare. Financial Disclosure: The authors declared that this study has received no financial support. Author Contributions: All of the authors declare that they have all participated in the design, execution, and analysis of the paper, and that they have approved the final version.
REFERENCES1. Huang D, Ma Q, Wang S, Ouyang Q, Chen X. Transcervical
resection of tracheal diverticulum. Head Neck 2017; 39: 187-90.2. O'Leary CN, JW Ryan, Corbett G, Ridge CA. Barotrauma induced
tracheal diverticulum rupture: imaging findings. BMJ Case Rep 2016; 2016: bcr2016217518.
3. Akabane S, Kawachi J, Fukai R, et al. A rare case of an infected tracheal diverticulum requiring emergency intervention: A case report. Int J Surg Case Rep 2016; 24: 7-9.
844
Gürün et al. Volumetric study of tracheal diverticulum in CTJ Health Sci Med 2021; 4(6): 840-844
4. Soto-Hurtado EJ, Penuela-Ruiz L, Rivera-Sanchez I, Torres-Jimenez J. Tracheal diverticulum: a review of the literature. Lung 2006; 184: 303-7.
5. Pace M, Dapoto A, Surace A, et al. Tracheal diverticula: A retrospective analysis of patients referred for thoracic CT. Medicine (Baltimore) 2018; 97: e12544.
6. Srivastava A, Guitron J, Williams VA. Tracheal diverticulum: an atypical presentation. J Thorac Cardiovasc Surg 2014; 148: 3244-5.
7. Goo JM, Im JG, Ahn JM, et al. Right paratracheal air cysts in the thoracic inlet: clinical and radiologic significance. AJR Am J Roentgenol. 1999; 173: 65-70.
8. Kim JS, Kim A-y, Yoon Y. Paratracheal air cysts using low-dose screening chest computed tomography: clinical significance and imaging findings. Jpn J Radiol 2011; 29: 644.
9. Lee MK, Kim EY, Jeong YM, Kim JH, Choi HY. Paratracheal air cysts are uncommon findings in the pediatric population. Jpn J Radiol 2016; 34: 579-84.
10. Shah M, Joshi JM. Tracheal diverticulum. Indian J Chest Dis Allied Sci 2012; 54: 39-40.
11. Boyaci N, Sen Dokumaci D, Karakas E, Yalcin F, Oney Kurnaz AG. Paratracheal air cysts: prevalence and relevance to pulmonary emphysema and bronchiectasis using thoracic multidetector CT. Diagn Interv Radiol 2015; 21: 42-6.
12. Polat AV, Elmali M, Aydin R, Ozbay A, Celenk C, Murat N. Paratracheal air cysts: prevalence and correlation with lung diseases using multi-detector CT. J Med Imaging Radiat Oncol 2014; 58: 144-8.
13. Cheng H-M, Chang P-Y, Chiang K-H, Huang H-W, Lee C-C. Prevalence and characteristics of paratracheal air cysts and their association with emphysema in a general population. Eur J Radiol 2012; 81: 2673-7.
14. Kurt A, Sayit AT, Ipek A, Tatar IG. A multi detector computed tomography survey of tracheal diverticulum. Eurasian J Med 2013; 45: 145-8.
15. Bae HJ, Kang EY, Yong HS, et al. Paratracheal air cysts on thoracic multidetector CT: incidence, morphological characteristics and relevance to pulmonary emphysema. Br J Radiol 2013; 86: 20120218.
16. Zhang Y, Tan Y, Chen J, Fang C. The Role of MRI in diagnosing and managing tracheal diverticulum. Acad Radiol 2021; S1076-6332(21)00323-8.

HEALTH SCIENCESMEDICINE
Original Article
J Health Sci Med 2021; 4(6): 845-852
This work is licensed under a Creative Commons Attribution 4.0 International License.
DOI: 10.32322/jhsm.973905
Received: 24.07.2021 Accepted: 15.08.2021Corresponding Author: Fatih Çankal, [email protected]
Radiological evaluation of spinal canal, dural sac, epidural fat and superior articular process in diagnosis of lumbar spinal stenosis
Fatih Çankal1, Dilara Patat1, Tuğçe Şirinoğlu21Ankara Medipol University, School of Medicine, Department of Anatomy, Ankara, Turkey2Ankara Medipol University, School of Medicine, Department of Biostatistics, Ankara, Turkey
Cite this article as: Çankal F, Patat D, Şirinoğlu T. Radiological evaluation of spinal canal, dural sac, epidural fat and superior articular process in diagnosis of lumbar spinal stenosis. J Health Sci Med 2021; 4(6): 845-852.
ABSTRACTAim: The aim of our study; to investigate the location of hypertrophy in the epidural adipose tissue in the lumbar spinal stenosis clinic, to compare the area measurements of the spinal canal and dural sac in patients with a preliminary diagnosis of lumbar spinal stenosis or radiculopathy, and to determine the place of the superior articular process area measurement in the diagnosis of spinal stenosis.Material and Method: 180 patients aged 50-69 years who underwent Lumbar Magnetic Resonance Imaging were divided into two groups according to the prediagnosis of lumbar spinal stenosis or radiculopathy and retrospectively analyzed. Spinal canal, dural sac, epidural fat, and superior articular process areas were measured. Statistical relationships of the findings were investigated.Results: There was no difference between the stenosis groups of these patients in terms of age and gender (respectively p=0.078; p=0.564). There is a significant difference in terms of the spinal canal, dural sac, superior articular process, and epidural fat widths between spinal stenosis and radiculopathy (p<0.001; p<0.001; p<0.001; p=0.033, respectively). Superior articular process, spinal canal, dural sac, and epidural fat cross-sectional areas were each found significant for their use as a diagnostic test for diagnosing lumbar spinal stenosis (p<0.001; p<0.001; p<0.001; p=0.034, respectively).Conclusion: Spinal stenosis is a problem that greatly affects the quality of life of patients. Measuring only the width of the spinal bony canal does not provide sufficient information in the diagnosis of spinal stenosis. In our study, hypertrophy of the superior articular process was the strongest finding in the diagnosis of lumbar spinal stenosis. Hypertrophy of epidural adipose tissue has also been shown to be a risk factor for lumbar spinal stenosis. In radiological evaluations, other structures that narrow the canal should also be carefully examined.Keywords: Spinal stenosis, dural stenosis, epidural fat, magnetic resonance imaging
Ana Metin-Alt bilgi Arası 5mm
Cite-Öz arası 5mm
Başlık-Yazarlar arası 12mm
Yazar-Kurum arası 2,5 mmvv
Kurum-Cite arası 5mm
Öz-Abstract arası 7,5mm
INTRODUCTIONThe prevalence of lumbar spinal stenosis (LSS) varies between 1.7-13.1% in the population (1). LSS is the most common cause of disability in elderly and middle-aged patients (2). It causes neurogenic intermittent claudication, radicular pain, and sensory and motor disturbance in the lower extremities. Sciatica may also present itself with neurogenic claudication and low back pain complaints (3). Complaints increase with walking (4). However, radiological LSS is not always clinically present (5,6).
Indications for surgery due to LSS are increasing especially in the over 65 age group (7,8). LSS patients benefit from spinal decompression surgery, but non-surgical interventions are preferred primarily (9).
Spinal stenosis is evaluated in three types. The type in which the spinal canal is affected is called central stenosis, the type in which the intervertebral neural foramina are affected is called foraminal stenosis, and the type in which the lateral recesses are affected is called lateral stenosis. (3,10). It is important to determine the location of the LSS in the approach to the patient with neural compression (11).
Spinal stenosis was originally defined as any narrowing of the spinal canal, nerve root canals, or intervertebral foramina (12). It can be congenital, acquired, or mixed (13). Congenital causes are primarily short pedicle structure or facet joint abnormalities. Acquired
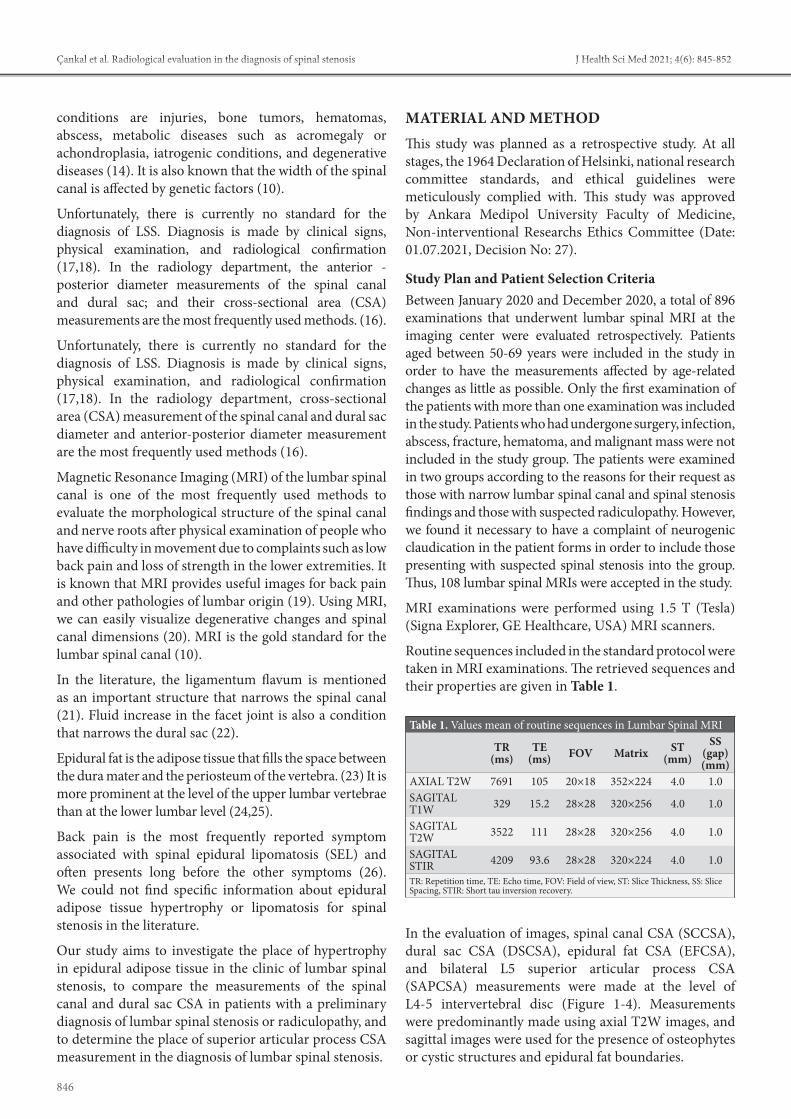
846
Çankal et al. Radiological evaluation in the diagnosis of spinal stenosis J Health Sci Med 2021; 4(6): 845-852
conditions are injuries, bone tumors, hematomas, abscess, metabolic diseases such as acromegaly or achondroplasia, iatrogenic conditions, and degenerative diseases (14). It is also known that the width of the spinal canal is affected by genetic factors (10).
Unfortunately, there is currently no standard for the diagnosis of LSS. Diagnosis is made by clinical signs, physical examination, and radiological confirmation (17,18). In the radiology department, the anterior - posterior diameter measurements of the spinal canal and dural sac; and their cross-sectional area (CSA) measurements are the most frequently used methods. (16).
Unfortunately, there is currently no standard for the diagnosis of LSS. Diagnosis is made by clinical signs, physical examination, and radiological confirmation (17,18). In the radiology department, cross-sectional area (CSA) measurement of the spinal canal and dural sac diameter and anterior-posterior diameter measurement are the most frequently used methods (16).
Magnetic Resonance Imaging (MRI) of the lumbar spinal canal is one of the most frequently used methods to evaluate the morphological structure of the spinal canal and nerve roots after physical examination of people who have difficulty in movement due to complaints such as low back pain and loss of strength in the lower extremities. It is known that MRI provides useful images for back pain and other pathologies of lumbar origin (19). Using MRI, we can easily visualize degenerative changes and spinal canal dimensions (20). MRI is the gold standard for the lumbar spinal canal (10).
In the literature, the ligamentum flavum is mentioned as an important structure that narrows the spinal canal (21). Fluid increase in the facet joint is also a condition that narrows the dural sac (22).
Epidural fat is the adipose tissue that fills the space between the dura mater and the periosteum of the vertebra. (23) It is more prominent at the level of the upper lumbar vertebrae than at the lower lumbar level (24,25).
Back pain is the most frequently reported symptom associated with spinal epidural lipomatosis (SEL) and often presents long before the other symptoms (26). We could not find specific information about epidural adipose tissue hypertrophy or lipomatosis for spinal stenosis in the literature.
Our study aims to investigate the place of hypertrophy in epidural adipose tissue in the clinic of lumbar spinal stenosis, to compare the measurements of the spinal canal and dural sac CSA in patients with a preliminary diagnosis of lumbar spinal stenosis or radiculopathy, and to determine the place of superior articular process CSA measurement in the diagnosis of lumbar spinal stenosis.
MATERIAL AND METHODThis study was planned as a retrospective study. At all stages, the 1964 Declaration of Helsinki, national research committee standards, and ethical guidelines were meticulously complied with. This study was approved by Ankara Medipol University Faculty of Medicine, Non-interventional Researchs Ethics Committee (Date: 01.07.2021, Decision No: 27).
Study Plan and Patient Selection Criteria Between January 2020 and December 2020, a total of 896 examinations that underwent lumbar spinal MRI at the imaging center were evaluated retrospectively. Patients aged between 50-69 years were included in the study in order to have the measurements affected by age-related changes as little as possible. Only the first examination of the patients with more than one examination was included in the study. Patients who had undergone surgery, infection, abscess, fracture, hematoma, and malignant mass were not included in the study group. The patients were examined in two groups according to the reasons for their request as those with narrow lumbar spinal canal and spinal stenosis findings and those with suspected radiculopathy. However, we found it necessary to have a complaint of neurogenic claudication in the patient forms in order to include those presenting with suspected spinal stenosis into the group. Thus, 108 lumbar spinal MRIs were accepted in the study.
MRI examinations were performed using 1.5 T (Tesla) (Signa Explorer, GE Healthcare, USA) MRI scanners.
Routine sequences included in the standard protocol were taken in MRI examinations. The retrieved sequences and their properties are given in Table 1.
In the evaluation of images, spinal canal CSA (SCCSA), dural sac CSA (DSCSA), epidural fat CSA (EFCSA), and bilateral L5 superior articular process CSA (SAPCSA) measurements were made at the level of L4-5 intervertebral disc (Figure 1-4). Measurements were predominantly made using axial T2W images, and sagittal images were used for the presence of osteophytes or cystic structures and epidural fat boundaries.
Table 1. Values mean of routine sequences in Lumbar Spinal MRI
TR(ms)
TE (ms) FOV Matrix ST
(mm)SS
(gap) (mm)
AXIAL T2W 7691 105 20×18 352×224 4.0 1.0SAGITAL T1W 329 15.2 28×28 320×256 4.0 1.0
SAGITAL T2W 3522 111 28×28 320×256 4.0 1.0
SAGITAL STIR 4209 93.6 28×28 320×224 4.0 1.0
TR: Repetition time, TE: Echo time, FOV: Field of view, ST: Slice Thickness, SS: Slice Spacing, STIR: Short tau inversion recovery.

847
Çankal et al. Radiological evaluation in the diagnosis of spinal stenosisJ Health Sci Med 2021; 4(6): 845-852
Images in the collection environment of the center were examined on two separate dates by a radiologist with 22 years of experience using the Picture Archiving and Communication System (PACS). The reliability of the measurements was tested, the intra-observer reliability was found between 0.95-0.98. Results were considered safe and measurements were averaged.
Statistical Analysis In the study, depending on the assumptions for numerical parameters as descriptive statistics, mean±standard deviation or median (minimum-maximum); Number (n) and percentage (%) for categorical data are given. Student's t test was used if parametric test assumptions were met, and Mann-Whitney U test was used if not, in determining whether there was a difference between groups in terms of numerical variables. ROC (Receiver
Operating Characteristic) analysis was performed to test the usability of numerical parameters in estimating stenosis, Area Under Curve (AUC) value and confidence intervals were given, and the cut-off value was found according to Youden index. The analyzes of the study were made in IBM SPSS v22 program. p<0.05 was considered statistically significant.
RESULTS
The study consisted of 108 patients, 54 female, and 54 male. The mean age is 57.20±5.191 years. While 54 of the patients had stenosis, 54 did not have stenosis.
There was no difference between the stenosis groups of these patients in terms of age and gender (respectively p=0.078; p=0.564).
Figure 1. Spinal canal CSA measurement Figure 2. Dural sac CSA measurement
Figure 3. Epidural fat CSA measurement Figure 4. Superior articular process CSA measurement

848
Çankal et al. Radiological evaluation in the diagnosis of spinal stenosis J Health Sci Med 2021; 4(6): 845-852
There was no significant difference between men and women in terms of SCCSA, DSCSA, SAPCSA, and EFCSA (p=0.694; p=0.379; p=0.832; p=0.707, respectively).
There is a significant difference in terms of SCCSA, DSCSA, and SAPCSA, and EFCSA between lumbar spinal stenosis and radiculopathy (p<0.001; p<0.001; p<0.001; p=0.033, respectively) (Table 2).
SAPCSA, SCCSA, DSCSA, and EFCSA were each found significant for their use as a diagnostic test for diagnosing lumbar spinal stenosis. (p<0.001; p<0.001; p<0.001; p=0.034, respectively) (Table 3) (Figure 5).
DISCUSSIONJensen et al. (27), in their systemic review of 55 studies, reported that 11% of the general population complies with the clinical diagnostic criteria of LSS, and this rate varies between 25-39% in the clinical population. Radiological findings in spinal stenosis are more extensive than clinical symptoms and signs (3). Some studies have found a relationship between the degree of spinal stenosis and decreased walking distance and leg pain (28,29).
There are also studies in which variations of the spinal canal and its correlation with somatometric parameters in asymptomatic patients have been performed (13). In these studies, it was reported that the spinal canal measurements did not show any change depending on the age or the height of the patient (13).
For the radiological diagnosis of spinal stenosis, there are different opinions about the pathological limits of the anterior-posterior diameter, although they are close to each other. The generally accepted value for absolute stenosis appears to be 11-13 mm. In studies describing dural stenosis as a separate entity, it was determined as normal stenosis above 10 mm, relative stenosis between 8-10 mm, and absolute stenosis below 8 mm (1,10,30-33).
Korse et al. (34) measured the sagittal diameter of the spinal canal at L4-5 level, 10.06 (5-14) mm (5-14) in cauda equina syndrome (CES) and 12.75 (9-20) mm in sciatica, and stated that there was no correlation between MRI findings and CES symptoms.
Pierro et al. (35) described the sagittal diameter of the dural sac as 13.3±2.1 mm at the L4 level and 12.9±2.4 mm at the L5 level, and no difference was found in the dural sac width between males and females. Since Pierro et al. (35) made the measurements from the middle 1/3 of the vertebra, the results may have been different from the literature. However, it is valuable that it indicates a significant difference between the diameter of the dural sac and the diameter of the spinal canal. In the literature review, it is seen that the spinal canal measurement was made at the disc level in some studies and from the corpus level in others, as in this study. In some publications, DSCSA measurement was performed at the levels where the ligamentum flavum is prominent in the figures showing the measurement, while the bone canal was presented as data (1).
Figure 5. AUC graphs of parameters
Table 2. Comparison in terms of parameters for stenosis
Spinal StenosisP
Negative (n=54) Positive (n=54)
SAP (mm2) 92.93±6.689 119.52±6.068 <0.001a
Spinal Canal (mm2) 198.24±40.646 119.98±25.680 <0.001a
Dural Sac (mm2) 163.37±41.120 82.87±19.204 <0.001a
Epidural Fat (mm2) 14.0(3.0-38.0) 19.0(2.0-42.0) 0.033b
a:Student’s t Test; (Mean±Standard Deviation), b: Mann-Whitney U Test; median (minimum-maximum)
Table 3. Identifying diagnostic tests for stenosisAUC 95% Confidence Interval P Cut-off value Sensitivity Specificity
SAP (mm2) 1.00 1.00 – 1.00 <0.001 106.50 1.00 1.00Spinal Canal (mm2) 0.947 0.909 - 0.984 <0.001 159.50 0.94 0.83Dural Sac (mm2) 0.965 0.937 – 0.993 <0.001 104.50 0.89 0.91Epidural Fat (mm2) 0.618 0.510 – 0.727 0.034 23.50 0.30 0.98

849
Çankal et al. Radiological evaluation in the diagnosis of spinal stenosisJ Health Sci Med 2021; 4(6): 845-852
Panda et al. (10) measured the sagittal diameter of the spinal canal at L4-5 level as 14.66-16.5 mm in the control group; It was found between 10.92-12.99 mm in the case group. In the same study, he states that there is no difference in age between the discopathy patient group and the control group in the measurements he made at all levels according to age groups.
In the literature, it is said that DSCSA is a more sensitive method for spinal stenosis (16). Most studies that present data on spinal canal width are either on symptomatic patients or as comparative studies. According to the data of this study, a DSCSA less than 75 mm2 was determined as absolute spinal stenosis (ASS), and a DSCSA between 75-100 mm2 was determined as relative spinal stenosis (RSS). In previous studies, anteroposterior diameter measurement in the sagittal plane was preferred rather than area measurement. Today, we think that area measurement should be preferred, since MR images of patients are made almost entirely on computer systems.
Verbiest says neurogenic intermittent claudication is common in both ASS and RSS (30). Other studies also mention a relationship between the degree of dural stenosis and specific symptoms for stenosis, such as walking ability (4). According to this latest study, the DSCSA limit value is given as 53 mm2 for walking ability below 100 m, and 69 mm2 for walking ability over 500 m. Walking distances and disability indices were used for such studies (36). In this study of Altinel and Yerli, 70 mm2 Shönnström criteria (typo belongs to the authors) were used for DSCSA, and no reference was given as to where these criteria were taken from. In this study, a close relationship was found between the severity of the narrowing and the complaints and findings of the patients (36). Sirvancı et al. (6) examined the results of 63 patients who had undergone surgery for stenosis and found DSCSA at all levels between 18-232 mm2 and did not detect a correlation between the Oswestry Disability Index and radiological images. Hurri et al. (37), on the other hand, defends the existence of this relationship. In our study, there is a significant relationship between lumbar spinal stenosis clinic and canal diameter. While the mean SCCSA was 119.98 mm2 at the L4-L5 level in patients presenting with spinal stenosis clinic, the mean SCCSA was measured as 198.24 mm2 in patients with clinical signs due to discopathy at other levels. DSCSA was 82.87 mm2 and 163.37 mm2, respectively. Both the spinal canal and dural sac narrowing were statistically significant (p<0.001, p<0.001). However, since Sirvancı et al.'s study includes only patients with clinical data and the decision to operate, it may not be accurate to compare with our results (6). Jail et al. (38), in their study using disability indexes, found DSCSA between 35-50 mm2 in patients with neurogenic claudication and 164
mm2 in patients with mild low back pain and reported a significant statistical difference.
Premchandran et al. (39) measured the DSCSA at the level of the vertebral corpuscles of the patients who were taken out of the clinic and did not have fractures or kyphoscoliosis, with the L4 level of 196.36±44.12 in women; 226.57±51.29 in men; L5 level was 187.11±59.76 in women; published as 215.92+-51.35 in men. Unfortunately, there was no information that the data shared in this study was mm2, although we interpreted it that way. Rapala et al. also measured the vertebral corpus levels, and they described DSCSA as 267.70 mm2 at the L4 level and 303.99 mm2 at the L5 level (40). Our findings also support these studies.
In early CT studies, 10 mm for the ASS and 12 mm for the RSS was used as the lower limit of the sagittal diameter of the spinal canal, and the lower limit was 145-150 mm2 for the DSCSA. However, in recent studies, the lower limit of 75 mm2 is accepted as the lower limit of 100 mm2 relative SS, and it has been reported that symptoms may occur below 130 mm2 (5,6,29,41,42). Schönström et al. (43) defends 100 mm2 as the critical size. In the literature, there are parameters such as normal canal width not less than 145 mm2, anterior-posterior diameter greater than 11.5 mm, ligamentum flavum thickness not exceeding 5 mm, and interpeduncular distance above 16 mm in the evaluation of spinal canal stenosis (13).
The old data on DSCSA normal size are as follows: Ulrich et al. (44) argue that stenosis below 145 mm2, Hamanishi et al. (45) argue that it can be called stenosis below 100 mm2.
Although Danielson et al. obtained significant results with the axial loading technique used in MRI and computed tomography (CT) examinations, this examination has not become widespread in practice. In the same study, they showed that the diameter of the spinal canal increased in flexion and decreased in extension (46). In the axial loading technique, compression is applied to the patients or cadavers from the sole of the foot, so that the vertebrae are exposed to an axial force as when standing. This technique was first described by Schönström and Hansson (47), and in cadaver studies, it was determined that 40-50 mm2 difference occurred when force was applied compared to when it was not applied. In addition, it is stated in this study that compression may occur in the nerve roots with diameters below 75 mm2.
In another dynamic study, it was reported that the sagittal diameter of the spinal canal increased in extension in 33% of patients and decreased in flexion in most patients (3). In the same study, it is stated that there is no significant relationship between the severity of clinical symptoms and the degree of radiological narrowing.

850
Çankal et al. Radiological evaluation in the diagnosis of spinal stenosis J Health Sci Med 2021; 4(6): 845-852
Lim et al. (16) made measurements from several levels. In this study, bone canal and dural sac diameters were measured separately, and DSCSA measurement was found to be more sensitive for the diagnosis of LSS. In our study, all data were found to be significant.
Another recent consideration for the diagnosis of spinal stenosis is the measurement of SAPCSA (2,48,49). This view is quite logical. Because facet hypertrophy may already be the cause of spinal stenosis alone (50). It is said that this measurement can also be a guide before endoscopic spinal surgery (51). An et al. (48) mention that they examined patients over the age of 60 in their study because there were minimal cartilage changes in the superior articular process before the age of 45. The most definitive result of our study was the significant relationship between SAPSCA measurements and the diagnosis of spinal stenosis (p<0.001). The power of this data in diagnosis came as a surprise to us. However, it draws attention to the place of facet joint hypertrophy in the etiology of spinal stenosis. However, it would be appropriate to evaluate it with studies involving more patients. It has been determined that the increase in fluid in the facet joint narrows the dural sac, which becomes evident in axial loading shots (22). Besides the facet joint, the ligamentum flavum is an important structure that narrows the spinal canal (21). We think that it would be more useful to use DSCSA to describe the contractions where the increase in size is prominent in these structures.
Shizas et al. (5) introduced a new classification in which the distribution style of the roots in the neural sac is in the foreground. In this classification, epidural fat is prominent in the posterior in grade C stenosis. This is the first study based on shape in the diagnosis of stenosis. We think that it should be supported by new studies. On the other hand, as suggested by Lim et al. (16), it may be useful to evaluate the presence of CSF obliteration by looking at the shape of the dural sac.
Patients with spinal epidural lipomatosis may be asymptomatic but often present with symptoms secondary to nerve or spinal cord compression (52). Cases, where the EF thickness is over 7 mm, are considered as spinal epidural lipomatosis (26,53).
In studies conducted for EF, measurement was preferred at the thoracic (especially T7) level (54,55). We did not study epidural lipomatosis. Our measurements were made at the L4-5 level.
There is also a study that states that the rate of climbing stairs and feeling well in the elderly increases with the increase in the prominence of epidural fat. However, this association was not found in patients with low back pain in the same study (23). Although it lagged behind other data in our study, there was a significant difference in hypertrophy
of epidural adipose tissue between patients with lumbar spinal stenosis clinic and the other group (p=0.033). Sions et al. measured the epidural fat thickness as 4.4 mm in their study. Since we measured the area, we could not find the opportunity to compare. In our measurements, the mean EFCSA was 19 mm2 in patients with lumbar spinal stenosis, and 14 mm2 in the other group. It may be difficult to evaluate epidural adipose tissue on T2W images taken from the intervertebral disc level for discopathies (Figure 6). We recommend using sagittal T1 images for this.
Figure 6. Posterior epidural fat is evident. Images of the same patient (A- sagittal T1W, B- axial T2W)
B
A

851
Çankal et al. Radiological evaluation in the diagnosis of spinal stenosisJ Health Sci Med 2021; 4(6): 845-852
In our literature review, we found that epidural fat was not evaluated in detail in studies investigating SCCSA and DSCSA. In our study, we tried to find out whether volume changes in epidural fat tissue contribute to LSS formation. We found 23.50 mm2 as the cut-off value.
CONCLUSIONLumbar spinal stenosis is a problem that greatly affects the quality of life of patients. Measuring spinal bone canal width alone does not provide sufficient information in the diagnosis of spinal stenosis. For the diagnosis of dural stenosis, which is at the forefront of the emergence of symptoms, other structures that narrow the canal should be carefully examined in MRI evaluations. Since hypertrophy in the epidural adipose tissue is a condition that can lead to the finding of dural stenosis, we think that it should be especially evaluated. In addition, we would like to confirm that the diameter of the superior articular process is a valuable finding in the diagnosis of lumbar spinal stenosis.
ETHICAL DECLARATIONS Ethics Committee Approval: This study was approved by Ankara Medipol University Faculty of Medicine, Non-interventional Researchs Ethics Committee (Date: 01.07.2021, Decision No: 27). Informed Consent: Because the study was designed retrospectively, no written informed consent form was obtained from patients. Referee Evaluation Process: Externally peer-reviewed.Conflict of Interest Statement: The authors have no conflicts of interest to declare. Financial Disclosure: The authors declared that this study has received no financial support. Author Contributions: All of the authors declare that they have all participated in the design, execution, and analysis of the paper, and that they have approved the final version.
REFERENCES1. Kalichman L, Cole R, Kim DH, et al. Spinal stenosis prevalence
and association with symptoms: the Framingham Study. Spine J 2009; 7: 545–50.
2. Lim TH, Choi SI, Cho HR, et al. Optimal cut-off value of the superior articular process area as a morphological parameter to predict lumbar foraminal stenosis. Pain Res Manag 2017; 7: 7914836.
3. Amundsen T, Weber H, Lilleås F, et al. Lumbar spinal stenosis. Clinical and radiologic features Spine 1995; 20: 1178-86.
4. Ogikubo O, Forsberg L, Hansson T. The relationship between the cross-sectional area of the cauda equina and the preoperative symptoms in central lumbar spinal stenosis. Spine 2007; 32: 1423–8.
5. Schizas C, Theumann N, Burn A, et al. Qualitative grading of severity of lumbar spinal stenosis based on the morphology of the dural sac on magnetic resonance images. Spine 2010; 35: 1919–24.
6. Sirvanci M, Bhatia M, Ganiyusufoglu KA, et al. Degenerative lumbar spinal stenosis: correlation with Oswestry Disability Index and MR imaging. Eur Spine J 2008; 17: 679–85.
7. Deyo RA, Gray DT, Kreuter W, et al. United States trends in lumbar fusion surgery for degenerative conditions, Spine 2005; 30: 1441–5.
8. Yoshihara H, Yoneoka D. National trends in the surgical treatment for lumbar degenerative disc disease: United States, 2000 to 2009. Spine J 2015; 15: 265–71.
9. Wei FL, Zhou CP, Liu R, et al. Management for lumbar spinal stenosis: a network meta-analysis and systematic review Int. J Surg 2020; 85: 19-28.
10. Panda SK, Arora G, Mohanty BB, et al. Evaluation of canal stenosis of herniated lumbar disc and its correlation to anterior-posterior diameter with magnetic resonance imaging morphometry. Int J Health Allied 2015; 4: 253-8.
11. Lai MKL, Cheung PWH, Cheung JPY. A systematic review of developmental lumbar spinal stenosis. Eur Spine J 2020; 29: 2187.
12. Arnoldi CC, Brodsky AE, Cauchoix J, et al. Lumbar spinal stenosis and nerve root entrapment syndromes: definition and classification. Clin Orthop Relat Res 1976; 115: 4-5.
13. Karantanas AH, Zibis AH, Papaliaga M, et al. Dimensions of the lumbar spinal canal: variations and correlations with somatometric parameters using CT. Eur Radiol 1998; 8: 1581–5.
14. Hennemann S, Abreu MR. Degenerative Lumbar Spinal Stenosis. Rev Bras Ortop 2021; 56: 9–17.
15. Verbiest H. The significance and principles of computerized axial tomography in idiopathic developmental stenosis of the bony lumbar vertebral canal. Spine 1979; 4: 369–78.
16. Lim YS, Mun JU, Seo MS, et al. Dural sac area is a more sensitive parameter for evaluating lumbar spinal stenosis than spinal canal area: A retrospective study. Medicine (Baltimore) 2017; 9087.
17. Simel DL, Rennie D. Low back pain, lumbar spinal stenosis. The rational clinical examination: evidence-based clinical diagnosis. McGraw-Hill Education New York 2016.
18. Macedo LG, Bodnar A, Battie MC. A comparison of two methods to evaluate a narrow spinal canal: routine magnetic resonance imaging versus three-dimensional reconstruction. Spine J 2016; 16: 884–8.
19. Roudsari B, Jarvik JG. Lumbar spine MRI for low back pain: Indications and yield. AJR Am J Roentgenol 2010; 195: 550-9.
20. Malfair D, Beall DP. Imaging the degenerative diseases of the lumbar spine. Magn Reson Imaging Clin N Am 2007; 15: 221-38.
21. Hansson T, Suzuki N, Hebelka H, et al. The narrowing of the lumbar spinal canal during MRI: the effects of the disc and ligamentum flavum. Eur Spine J 2009; 18: 679–86.
22. Kanno H, Ozawa H, Koizumi N, et al. Increased facet fluid predicts dynamic changes in the dural sac size on axial-loaded MRI in patients with lumbar spinal canal stenosis. American Journal of Neuroradiology 2016, 37: 730-5.
23. Sions JM, Rodriguez CA, Pohlig RT, et al. Epidural fat and its association with pain, physical function, and disability among older adults with low back pain and controls. Pain Med 2018; 19: 1944–51.
24. Beajeux R, Wolfram-Gabel R, Kehrli P, et al. Posterior lumbar epidural fat as a functional structure? Histologic specificities. Spine 1997; 22: 1264–8.
25. Reina M, Franco C, Lopez A, et al. Clinical implications of epidural fat in the spinal canal. A scanning electron microscopic study. Acta Anaesthesiol Belg 2009; 60: 7–17.
26. Fassett DR, Schmidt MH. Spinal epidural lipomatosis: a review of its causes and recommendations for treatment. Neurosurg Focus 2004; 16: 11.
27. Jensen RK, Jensen TS, Koes B, et al. Prevalence of lumbar spinal stenosis in general and clinical populations: A systematic review and meta-analysis. Eur Spine J 2020; 29: 2143-63.
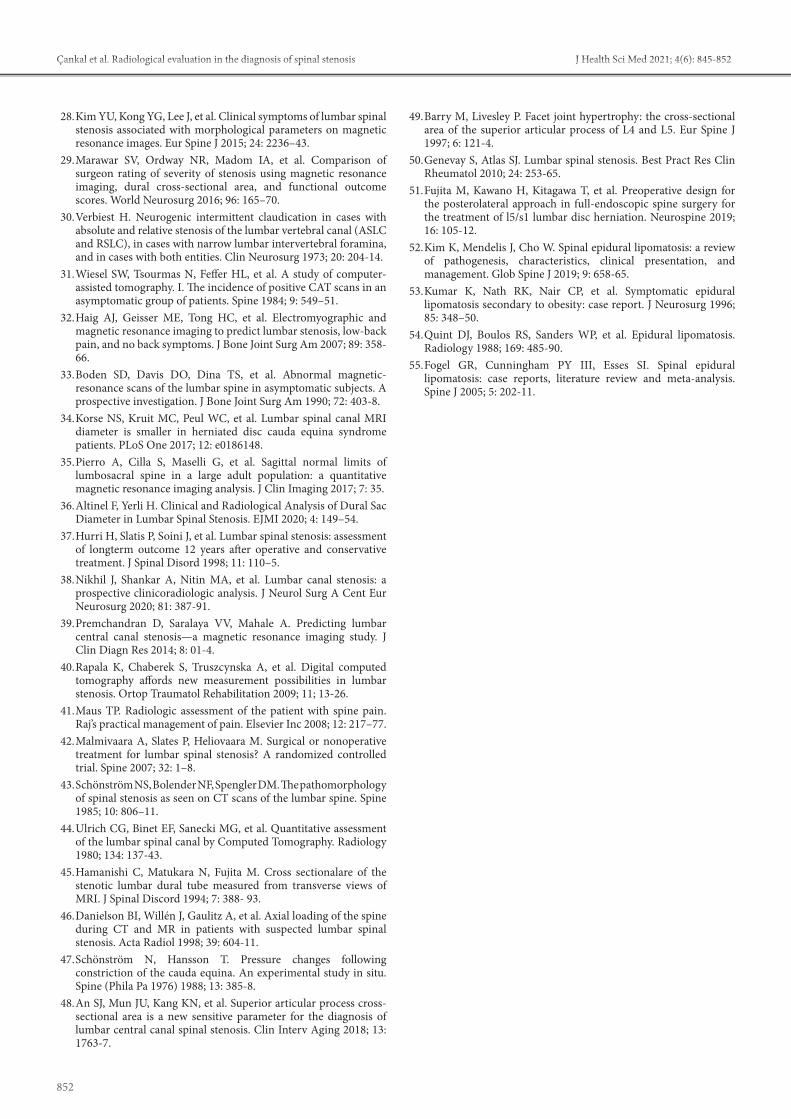
852
Çankal et al. Radiological evaluation in the diagnosis of spinal stenosis J Health Sci Med 2021; 4(6): 845-852
28. Kim YU, Kong YG, Lee J, et al. Clinical symptoms of lumbar spinal stenosis associated with morphological parameters on magnetic resonance images. Eur Spine J 2015; 24: 2236–43.
29. Marawar SV, Ordway NR, Madom IA, et al. Comparison of surgeon rating of severity of stenosis using magnetic resonance imaging, dural cross-sectional area, and functional outcome scores. World Neurosurg 2016; 96: 165–70.
30. Verbiest H. Neurogenic intermittent claudication in cases with absolute and relative stenosis of the lumbar vertebral canal (ASLC and RSLC), in cases with narrow lumbar intervertebral foramina, and in cases with both entities. Clin Neurosurg 1973; 20: 204-14.
31. Wiesel SW, Tsourmas N, Feffer HL, et al. A study of computer-assisted tomography. I. The incidence of positive CAT scans in an asymptomatic group of patients. Spine 1984; 9: 549–51.
32. Haig AJ, Geisser ME, Tong HC, et al. Electromyographic and magnetic resonance imaging to predict lumbar stenosis, low-back pain, and no back symptoms. J Bone Joint Surg Am 2007; 89: 358-66.
33. Boden SD, Davis DO, Dina TS, et al. Abnormal magnetic-resonance scans of the lumbar spine in asymptomatic subjects. A prospective investigation. J Bone Joint Surg Am 1990; 72: 403-8.
34. Korse NS, Kruit MC, Peul WC, et al. Lumbar spinal canal MRI diameter is smaller in herniated disc cauda equina syndrome patients. PLoS One 2017; 12: e0186148.
35. Pierro A, Cilla S, Maselli G, et al. Sagittal normal limits of lumbosacral spine in a large adult population: a quantitative magnetic resonance imaging analysis. J Clin Imaging 2017; 7: 35.
36. Altinel F, Yerli H. Clinical and Radiological Analysis of Dural Sac Diameter in Lumbar Spinal Stenosis. EJMI 2020; 4: 149–54.
37. Hurri H, Slatis P, Soini J, et al. Lumbar spinal stenosis: assessment of longterm outcome 12 years after operative and conservative treatment. J Spinal Disord 1998; 11: 110–5.
38. Nikhil J, Shankar A, Nitin MA, et al. Lumbar canal stenosis: a prospective clinicoradiologic analysis. J Neurol Surg A Cent Eur Neurosurg 2020; 81: 387-91.
39. Premchandran D, Saralaya VV, Mahale A. Predicting lumbar central canal stenosis—a magnetic resonance imaging study. J Clin Diagn Res 2014; 8: 01-4.
40. Rapala K, Chaberek S, Truszcynska A, et al. Digital computed tomography affords new measurement possibilities in lumbar stenosis. Ortop Traumatol Rehabilitation 2009; 11; 13-26.
41. Maus TP. Radiologic assessment of the patient with spine pain. Raj’s practical management of pain. Elsevier Inc 2008; 12: 217–77.
42. Malmivaara A, Slates P, Heliovaara M. Surgical or nonoperative treatment for lumbar spinal stenosis? A randomized controlled trial. Spine 2007; 32: 1–8.
43. Schönström NS, Bolender NF, Spengler DM. The pathomorphology of spinal stenosis as seen on CT scans of the lumbar spine. Spine 1985; 10: 806–11.
44. Ulrich CG, Binet EF, Sanecki MG, et al. Quantitative assessment of the lumbar spinal canal by Computed Tomography. Radiology 1980; 134: 137-43.
45. Hamanishi C, Matukara N, Fujita M. Cross sectionalare of the stenotic lumbar dural tube measured from transverse views of MRI. J Spinal Discord 1994; 7: 388- 93.
46. Danielson BI, Willén J, Gaulitz A, et al. Axial loading of the spine during CT and MR in patients with suspected lumbar spinal stenosis. Acta Radiol 1998; 39: 604-11.
47. Schönström N, Hansson T. Pressure changes following constriction of the cauda equina. An experimental study in situ. Spine (Phila Pa 1976) 1988; 13: 385-8.
48. An SJ, Mun JU, Kang KN, et al. Superior articular process cross-sectional area is a new sensitive parameter for the diagnosis of lumbar central canal spinal stenosis. Clin Interv Aging 2018; 13: 1763-7.
49. Barry M, Livesley P. Facet joint hypertrophy: the cross-sectional area of the superior articular process of L4 and L5. Eur Spine J 1997; 6: 121-4.
50. Genevay S, Atlas SJ. Lumbar spinal stenosis. Best Pract Res Clin Rheumatol 2010; 24: 253-65.
51. Fujita M, Kawano H, Kitagawa T, et al. Preoperative design for the posterolateral approach in full-endoscopic spine surgery for the treatment of l5/s1 lumbar disc herniation. Neurospine 2019; 16: 105-12.
52. Kim K, Mendelis J, Cho W. Spinal epidural lipomatosis: a review of pathogenesis, characteristics, clinical presentation, and management. Glob Spine J 2019; 9: 658-65.
53. Kumar K, Nath RK, Nair CP, et al. Symptomatic epidural lipomatosis secondary to obesity: case report. J Neurosurg 1996; 85: 348–50.
54. Quint DJ, Boulos RS, Sanders WP, et al. Epidural lipomatosis. Radiology 1988; 169: 485-90.
55. Fogel GR, Cunningham PY III, Esses SI. Spinal epidural lipomatosis: case reports, literature review and meta-analysis. Spine J 2005; 5: 202-11.

HEALTH SCIENCESMEDICINE
Original Article
J Health Sci Med 2021; 4(6): 853-857
This work is licensed under a Creative Commons Attribution 4.0 International License.
DOI: 10.32322/jhsm.984394
Received: 19.08.2021 Accepted: 04.09.2021Corresponding Author: Ebru Yılmaz, [email protected]
Single-center experience of childhood Hodgkin lymphoma treated without radiotherapy
Ebru Yılmaz1, Memnune Arslan2, Şefika Akyol1, Alper Özcan1, Gökmen Zararsız3,Ümmühan Abdülrezzak4, Olgun Kontaş5, Özlem Canöz5, Ekrem Ünal1,6, Musa Karakükcü1
1Erciyes University, Faculty of Medicine, Department of Pediatrics, Division of Pediatric Hematology and Oncology & Pediatric HSCT Unit, Kayseri, Turkey2Erciyes University, Faculty of Medicine, Department of Pediatrics, Kayseri, Turkey3Erciyes University, Faculty of Medicine, Department of Biostatistics, Kayseri, Turkey4Erciyes University, Faculty of Medicine, Department of Nuclear Medicine, Kayseri, Turkey5Erciyes University, Faculty of Medicine, Department of Pathology, Kayseri, Turkey6Erciyes University Betül Ziya EREN Genome and Stem Cell, Department of Molecular Biology and Genetics, Kayseri, Turkey
Cite this article as: Yılmaz E, Arslan M, Akyol Ş, et al. Single-center experience of childhood Hodgkin lymphoma treated without radiotherapy. J Health Sci Med 2021; 4(6): 853-857.
ABSTRACTAim: Hodgkin lymphoma (HL) constitutes 40% of childhood lymphomas and approximately 6% of all childhood cancers. It is tried to achieve cure with combined treatment modalities consisting of chemotherapy, radiotherapy, monoclonal antibodies, and new treatment agents such as nivolumab. Radiotherapy-related infertility, secondary cancer, thyroid dysfunction, cardiovascular diseases, pulmonary fibrosis, and local skin reactions can be seen in the pediatric age group with a long life expectancy. In this article, pediatric patients diagnosed with Hodgkin lymphoma without the use of radiotherapy in the treatment were evaluated retrospectively and the survival results were reported as a single-center experience. Material and Method: The patients with Hodgkin Lymphoma in the Pediatrics Hematology-Oncology Center at Erciyes University between January 2010 and December 2019 were included in the study and the data of the patients were evaluated retrospectively. Results: In 68 pediatric patients with a mean age of 10.7 (±4.6) years, the male/female ratio was 1.3. The most detected finding at the time of diagnosis was cervical lymphadenopathy (83.8%). The most common mixed cellular subtype was identified (48.5%). Stage I-II disease was observed in 38.3% of the patients, and stage III-IV disease was observed in 61.7% of the patients. The median follow-up period of the patients was 61 (range, 8.3-161.6) months. Disease-free survival and overall survival were 85.3% and 94.1%, respectively. Treatment modalities to be used in this disease group, which has a high chance of cure after cytotoxic treatment, should be selected considering treatment-related long-term complications.Conclusion: Acceptable good results obtained without radiotherapy are satisfactory and the chance of curative success will increase with the addition of new target agents to the treatment.Keywords: Hodgkin lymphoma, children, radiotherapy
Ana Metin-Alt bilgi Arası 5mm
Cite-Öz arası 5mm
Başlık-Yazarlar arası 12mm
Yazar-Kurum arası 2,5 mm
Kurum-Cite arası 5mm
Öz-Abstract arası 7,5mm
INTRODUCTIONHodgkin lymphoma (HL) constitutes 40% of childhood lymphomas and approximately 6% of all childhood cancers (1). Hodgkin lymphoma generally shows a bimodal distribution, mostly in young adults and older people. Its incidence peaks at 15-35 years of age and above 50 years of age (2). While the most common subtype in developed countries is the 60-70% nodular sclerosing type, mixed cellular type is most common in developing countries (3). It is among the malignant diseases with the best long-term outcome with 80-90% cure rate after
chemotherapy. Relapsed or refractory to treatment is observed in 15-20% of patients (4). It is tried to achieve cure with combined treatment modalities consisting of chemotherapy, radiotherapy, monoclonal antibodies and new treatment agents such as nivolumomab. However, treatment-related side effects should not be ignored. While radiotherapy is an important part of treatment in adults with HL, the risk-benefit ratio in children is discussed. Radiotherapy-related infertility, secondary cancer, thyroid dysfunction, cardiovascular diseases,

854
Yılmaz et al. Single-center experience of childhood Hodgkin lymphoma treated without radiotherapy J Health Sci Med 2021; 4(6): 853-857
pulmonary fibrosis and local skin reactions can be seen in the pediatric age group with a long life expectancy (2,3,5-7). In this article, pediatric patients diagnosed with Hodgkin lymphoma without the use of radiotherapy in the treatment were evaluated retrospectively and the survival results were reported as a single center experience.
MATERIAL AND METHODThe study was carried out with the permission of Erciyes University Clinical Researchs Ethics Committee (Date: 11.12.2019, Decision No: 2019/854). All procedures were carried out in accordance with the ethical rules and the principles of the Declaration of Helsinki.
The patients younger than 18 years of age who were diagnosed with Hodgkin lymphoma in the Pediatrics Hematology-Oncology Center at Erciyes University between January 2010 and December 2019 were included in the study and the data of the patients were evaluated retrospectively. The data of the patients included in the study were obtained from the hospital electronic records and patient files.
In the study, demographic data of the patients, Hodgkin lymphoma subtype, presence of B symptoms, spread regions and stage of the disease, laboratory findings at the time of diagnosis, genetic study results, treatments and response to therapy, complications, relapse status, bone marrow transplantation and results, and prognostic factors were evaluated.
Patients Characteristics and Chemotherapy ProtocolsThe patients were diagnosed with HL by histopathological examination of biopsy samples. Bone marrow aspiration and biopsy, positron emission tomography/computed tomography (PET CT), and symptoms (fever, night sweats and weight loss) was used for staging of all patients. Before starting chemotherapy, the patients were staged according to Cotswolds modification of the Ann Arbor criteria (2).
Cyclophosphamide, vincristine, procarbazine, prednisone (COPP)/ doxorubicin, bleomycin, vinblastin, dacarbazine (ABVD) protocols were used alternately in the initial diagnosis. In early stage (Stage-1A and Stage-2A) HL patients, 2 cycles of ABVD and 2 cycles of COPP protocols were started, and the number of cycles was rearranged to a maximum of 4 for each protocol, according to the response to treatment. In advanced stage (Stage IIB, Stage-3 and Stage-4) HL patients, 3 cycles of ABVD and 3 cycles of COPP were started. According to the response to treatment, 4th cycle ABVD and COPP were given. At least 2 cycles of ifosfamide, carboplatine, etoposide (ICE) protocol were given in refractory or relapsed patients.
Brentuximab was added to the treatment of refractory or relapsed patients diagnosed with HL after 2014. Autologous or allogeneic stem cell transplantation was performed in selected cases according to the underlying disease status such as immunodeficiency or relapse and refractory disease. No patient received radiotherapy.
Statistical AnalysisDescriptive statistics and quantitative variables were expressed as mean±standard deviation or median (minimum-maximum) according to whether the distributions were normal or not, using the Shapiro-Wilk test. Nominal variables were expressed as number of cases and percentage (%). The Kaplan-Meier method was used to estimate survival probabilities and the log-rank test for comparisons.
RESULTSA total of 68 patients, 38 males (56%) and 30 females (44%) diagnosed with HL, were included in the study. Demographic data of the patients are given in Table 1. While HL is 3.3 times more common in boys than girls in the 0-5 age group, it is 1.5 times more common in boys in the 5-10 age group. In addition, the male-female ratio in patients older than 10 years is 0.9.
The majority of our patient group consisted of patients with stage III-IV (61.7%). B symptoms were not observed in 45 patients. Figure 1 shows the ratio of B symptoms according to the stages of the patients. As lymph node,
Table 1. Patient characteristics
Variable Patient (n=68)
Median age (years) 10.7 (±4.6)Gender (male/female) 38/30Diagnosis of Patients Classical Hodgkin lymphoma (n=63) Nodular Sclerosis 27 (39.7%) Mixed Cellularity 33 (48.5%) Lymphocyte-rich 2 (2.9%) Lymphocyte-depleted 1 (1.4%)Nodular lymphocyte-predominant Hodgkin lymphoma 1 (1.4%)Unknown subtype 4 (5.8%)Diagnosis Staging
Stage I 5 (7.3%)Stage II 21 (31%)Stage III 18 (26.3%)Stage IV 24(35.4)
Disease Status Complete remission 1 56 (82.3%)Relaps/refractory lymphoma 12 (17.6%)
Notes: Values are expressed as n (%).

855
Yılmaz et al. Single-center experience of childhood Hodgkin lymphoma treated without radiotherapyJ Health Sci Med 2021; 4(6): 853-857
the most cervical lymph node involvement was observed (83.8%); in the extra-lymphatic system, the most spread to bone/bone marrow was detected (35.3%) (Table 2). Lymph node and non-lymph node involvements are summarized in Table 2. Bulky disease was detected in 10 patients (14.7%) and vena cava superior syndrome and/or upper mediastinal syndrome was detected in 8 patients (11.7%) at the time of admission. None of the patients had tumor lysis syndrome.
STAT-6 mutation in 2 patients, CD27 deficiency in 1 patient, F-BAR domain only protein 1 (FCHO1) mutation in 1 patient, Interleukin-2-inducible T-cell Kinase (ITK) mutation in 1 patient, phosphatidylinositol-4,5-bisphosphate 3-kinase catalytic subunit delta (PIK3CD) mutation in 1 patient, Magnesium transporter 1 (MAGT1) deficiency, X-linked immunodeficiency with magnesium defect, Epstein-Barr virus (EBV) infection, and neoplasia (XMEN syndrome) in 1 patient were found in the genetic analysis of patients with relapse/refractory and reported in several publications (8).
Autologous hematopoietic stem cell transplantation was performed in 9 patients with relapse/refractory, and allogeneic hematopoietic stem cell transplantation was performed in 4 patients with immunodeficiency. One patient who was diagnosed with immunodeficiency and planned for allogeneic stem cell transplantation died due to sepsis. In addition, allogeneic stem cell transplantation is planned for 2 immunodeficiency patients.
The median follow-up period of the patients was 62 (range, 8.3-161.6) months. Disease-free (lymphoma, free) survival (DFS) and overall survival (OS) were 85.3% and 94.1%, respectively (Figure 2 and 3). While DFS was 96.2% and OS was 100% in patients with stage I-II, DFS was 76.2% and OS was 90.5% in patients with stage III-IV. One patient died of lymphoma progression, 2 patients died of sepsis after stem cell transplantation, and one patient died of sepsis secondary to immunodeficiency. Lymphoma-related mortality was 1.5% and overall mortality was 5.8%.
Figure 3. Overall survival graph of patients with Hodgkin lymphoma
Figure 2. Disease-free survival graph of patients with Hodgkin lymphoma
Figure 1. B Symptoms according to the stage of the patients
Table 2. Hodgkin lymphoma involvement sitesSite Patient Cervical LN 57 (83.8%)Mediastinal LN 43 (63.2%)Axillary LN 23 (33.8%)Paraaortic LN 22 (32.3%)Supraclavicular LN 19 (27.9%)Parailiac LN 10 (14.7%)Submandibular LN 7 (10.2%) Inguinal LN 5 (7.3%)Waldeyer ring 11 (16.1)Spleen 23 (33.8%)Bone/bone marrow 24 (35.3%)Lung 10 (14.7%)Liver 4 (5.8%)Intestine 1 (1.4%)Notes: Values are expressed as n (%).

856
Yılmaz et al. Single-center experience of childhood Hodgkin lymphoma treated without radiotherapy J Health Sci Med 2021; 4(6): 853-857
DISCUSSIONHodgkin lymphoma is a malignant disease of unknown specific etiology characterized by enlargement of lymph nodes. Conditions such as genetic diseases, socioeconomic status, positive family history, and Epstein-Barr virus (EBV) infection increase the risk of developing HL (2,9,10). In various studies, the age of incidence in the childhood age group is approximately 6-15.5 years. While Hodgkin lymphoma is more common between 5-10 years of age in developing countries, it has been found to be more common in children over the age of 10 in a study conducted in The United Kingdom (11-13). The mean age of the patients in our study was 10.7 (±4.6) years. 19.1% of the patients were aged 0-5 years, 26.4% were aged 5-10 years, and 54.5% were older than 10 years. The male/female ratio has been reported as 1.3-2.5 (13,14). 56% of our patients were male and 44% were female. The male to female ratio was 1.26, which is consistent with the literature. When we divide the patients into age groups, this ratio is; 3.3 in the 0-5 age group; 1.5 in the 5-10 age group, and 0.9 in patients older than 10 years old.
While nodular sclerosing type HL is observed at a rate of up to 80% in developed countries, mixed cellular type HL is observed at a rate of up to 60% in developing countries (12,13,15). In our study, approximately half of the patients diagnosed with HL (48.5%) were mixed cellular type, while the second most common (39.7%) type was nodular sclerosing type and these findings were comparable with other studies conducted in our country (16,17). The subtypes of the disease vary in relation to the development levels of the countries and the socioeconomic status of the people. Although the mixed cellular type was more common in our study, the incidence of nodular sclerosing type was seriously close to the incidence of the mixed cellular type. Generally, EBV is associated with mixed cellular HL lymphoma and is observed in young children, whereas nodular sclerosing type HL is more common in young adults and adolescents. Tumor cells are infected with EBV in 90% of cases in developing countries and 30% of cases in developed countries (18,19). EBV positivity was detected in tumor cells in 27 of our patients (39.7%).
Positron Emission Tomography (PET CT) is the standard imaging method for staging HL at the time of diagnosis and evaluating the response to treatment. However, it contains ionizing radiation. Nevertheless, in a study comparing magnetic resonance imaging and PET CT, PET CT was shown to be more sensitive in staging at the time of diagnosis and evaluating the response to treatment (20). We used PET CT for staging and evaluation of response to treatment in all of our patients.
Various combination chemotherapy regimens containing vinblastin, vincristine, dacarbazine, procarbazine, bleomycin, etoposide, cyclophosphamide, prednisone, doxorubicin, methotrexate are used in treatment (2). With the increase in survival rates, the focus is on eliminating or reducing the side effects that can be seen in long-term follow-ups. Studies are ongoing to reduce or eliminate anthracyclines due to its cardiotoxic effect, procarbazine for infertility, and radiotherapy due to its multiple side effects . In the studies of Dana Farber and St Jude Consortium, Children's Oncology Group (COG), and the German Society of Pediatric Oncology groups in low-risk patients who received radiotherapy, overall survival and event-free survival were 96.1-100% and 86-95%, respectively. In the studies of COG and the German Society of Pediatric Oncology group, overall survival and event-free survival were 93-98% and 82-94% in patients with medium and high-risk group HL who received radiotherapy (21). In a study using radiotherapy, in which patients with 43.1% early-stage disease and 55.9% advanced-stage disease, 5-year overall survival, and event-free survival were 96.6% and 84.7% respectively (12). In another study in which early-stage 92 patients and advanced-stage 104 patients did not use radiotherapy, 5-year overall survival and event-free survival were found to be 89.6% and 82.1%, respectively (3). Mixed cellular lymphoma was the most common subtype in both studies (3,12). In our study, 38.3% were evaluated as early-stage and 61.7% as advanced-stage. In the early and advanced patient group, 5-year overall survival is 90%.
Autologous hematopoietic stem cell transplantation following high-dose chemotherapy is the standard treatment approach in relapsed and refractory patients. In the study, which included 38 pediatric patients with a diagnosis of HL, 10-year survival and event-free-survival were 71.4% and 67.1%, respectively (22). Allogeneic stem cell transplantation can be performed in relapsed cases after autologous stem cell transplantation or in HL that develops on the basis of disease such as immune deficiency (9,10). In the meta-analysis, overall survival and relapse-free survival after transplantation were 50% (41-58) and 31% (25-37) (21). One of our patients who underwent 10 autologous and 4 allogeneic stem cell transplants died due to post-transplant relapse and 2 died due to sepsis.
Although it varies depending on the stage of the disease in various studies, the total relapse rate has been reported as 11.2-30.4 (11,12,23,24). Relapse is observed in 10% of patients with early stage HL and 25% in those with advanced stage HL after first-line treatment (25,26). The relapse rate was found to be 14.7% in our patients. In relapsed and refractory cases, especially if the age of diagnosis is under 5 years, genetic studies are recommended to investigate diseases predisposing to lymphoma (9,10).

857
Yılmaz et al. Single-center experience of childhood Hodgkin lymphoma treated without radiotherapyJ Health Sci Med 2021; 4(6): 853-857
CONCLUSIONTreatment modalities to be used in this disease group, which has a high chance of cure after cytotoxic treatment, should be selected considering treatment-related long-term complications. Acceptable good results obtained without radiotherapy are satisfactory and the chance of curative success will increase with the addition of new target agents to the treatment.
ETHICAL DECLARATIONSEthics Committee Approval: The study was carried out with the permission of Erciyes University Clinical Researchs Ethics Committee (Date: 11.12.2019, Decision No: 2019/854).Informed Consent: Because the study was designed retrospectively, no written informed consent form was obtained from patients.Referee Evaluation Process: Externally peer-reviewed. Conflict of Interest Statement: The authors have no conflicts of interest to declare. Financial Disclosure: The authors declared that this study has received no financial support. Author Contributions: All of the authors declare that they have all participated in the design, execution, and analysis of the paper, and that they have approved the final version. Acknowledgment: The authors thank Prof. Dr. Mehmet Akif ÖZDEMİR, Prof. Dr. Türkan PATIROĞLU for their valuable contributions to the study.
REFERENCES1. Zupanec S. Lymphoma. In: Tomlinson D, Kline NE, eds. Pediatric
Oncology Nursing. Advanced Clinical Handbook. New York: Springer; 2010: 33–57.
2. Friedman D. Hodgkin Lymphoma. In: Lanzkowsky P, Lipton JM, Fish JD. Lanzkowsky's manual of pediatric hematology and oncology: Academic Press; 2016: 429-41.
3. Ashraf MS, Naz F, Yakoob MY. Characteristics and survival outcomes of children with Hodgkin lymphoma treated primarily with chemotherapy. J Pediatr Hematol Oncol 2019; 41: 452-6.
4. Cuccaro A, Bartolomei F, Cupelli E, Galli E, Giachelia M, Hohaus S. Prognostic factors in hodgkin lymphoma. Mediterr J Hematol Infect Dis 2014; 6: e2014053.
5. Dores GM, Metayer C, Curtis RE, et al. Second malignant neoplasms among long-term survivors of Hodgkin's disease: a population-based evaluation over 25 years. J Clin Oncol 2002; 20: 3484-94.
6. Hancock SL, Donaldson SS, Hoppe RT. Cardiac disease following treatment of Hodgkin's disease in children and adolescents. J Clin Oncol 1993; 11: 1208-15.
7. Hancock SL, Cox RS, McDougall IR. Thyroid diseases after treatment of Hodgkin's disease. N Engl J Med 1991; 325: 599-605.
8. Patiroglu T, Haluk Akar H, Gilmour K, et al. A case of XMEN syndrome presented with severe auto-immune disorders mimicking autoimmune lymphoproliferative disease. Clin Immunol 2015; 159: 58-62.
9. Somekh I, Marquardt B, Liu Y, et al. Novel mutations in RASGRP1 are associated with immunodeficiency, immune dysregulation, and EBV-induced lymphoma. J Clin Immunol 2018; 38: 699-710.
10. Cansever M, Zietara N, Chiang SCC, et al. A rare case of activated phosphoinositide 3-kinase delta syndrome (APDS) presenting with hemophagocytosis complicated with hodgkin lymphoma. J Pediatr Hematol Oncol 2020; 42: 156-9.
11. Trehan A, Singla S, Marwaha RK, Bansal D, Srinivasan R. Hodgkin lymphoma in children: experience in a tertiary care centre in India. J Pediatr Hematol Oncol 2013; 35: 174-9.
12. Sherief LM, Elsafy UR, Abdelkhalek ER, et al. Hodgkin lymphoma in childhood: clinicopathological features and therapy outcome at 2 centers from a developing country. Medicine 2015; 94: 15.
13. Stoneham S, Ashley S, Pinkerton R, Hewitt M, Wallace W, Shankar AJEJoC. Hodgkin’s lymphoma in children aged 5 years or less–The United Kingdom experience. Eur J Cancer 2007; 43: 1415-21.
14. Hsu SC, Metzger ML, Hudson MM, et al. Comparison of treatment outcomes of childhood Hodgkin lymphoma in two US centers and a center in Recife, Brazil. Pediatr Blood Cancer 2007; 49: 139-44.
15. Faizan M, Taj MM, Anwar S, et al. Comparison of presentation and outcome in 100 pediatric Hodgkin lymphoma patients treated at Children Hospital, Lahore, Pakistan and Royal Marsden Hospital, UK. J Coll Physician Surg Pak 2016; 26: 904-7.
16. Karhan AN, Varan A, Akyüz C, et al. Outcome of 102 patients under 5 years of age with Hodgkin lymphoma. Arch Argent Pediatr 2019; 117: 459-65.
17. Cavdar AO, Gozdasoglu S, Yavuz G, et al. Characteristics of “Early Type-I Pattern” (0-6 years) Hodgkin’s Disease in Turkish Children. Turk J Haematol 2002; 19: 55-62.
18. Bazzeh F, Rihani R, Howard S, Sultan I. Comparing adult and pediatric Hodgkin lymphoma in the Surveillance, Epidemiology and End Results Program, 1988-2005: an analysis of 21 734 cases. Leukemia & lymphoma 2010; 51: 2198-207.
19. Naresh KN, Johnson J, Srinivas V, et al. Epstein-Barr virus association in classical Hodgkin’s disease provides survival advantage to patients and correlates with higher expression of proliferation markers in Reed-Sternberg cells. Ann Oncol 2000; 11: 91-6.
20. Shapira-Zaltsberg G, Wilson N, et al. Whole-body diffusion-weighted MRI compared to 18 FFDG PET/CT in initial staging and therapy response assessment of Hodgkin lymphoma in pediatric patients. Can Assoc Radiol J 2020; 71: 217-25.
21. Gómez-Almaguer D, González-Llano O, Jiménez-Antolinez V, Gómez-De León A. Treatment of classical Hodgkin's lymphoma in children and adolescents. Expert Opin Pharmacother 2019; 20: 1227-34.
22. Giulino-Roth L, O'Donohue T, Chen Z, et al. Outcome of children and adolescents with relapsed Hodgkin lymphoma treated with high-dose therapy and autologous stem cell transplantation: the memorial sloan kettering cancer center experience. Leuk Lymphoma 2018; 59: 1861–70.
23. Nachman JB, Sposto R, Herzog P, et al. Randomized comparison of low-dose involved-field radiotherapy and no radiotherapy for children with Hodgkin’s disease who achieve a complete response to chemotherapy. J Clin Oncol 2002; 20: 3765-71.
24. Ali A, Sayed H, Farrag A, El-Sayed MJLr. Risk-based combined-modality therapy of pediatric Hodgkin's lymphoma: A retrospective study. Leukemia Res 2010; 34: 1447-52.
25. Donaldson SS, Link MP, Weinstein HJ, et al. Final results of a prospective clinical trial with VAMP and low-dose involved-field radiation for children with low-risk Hodgkin's disease. J Clin Oncol 2007; 25: 332-7.
26. Schwartz CL, Constine LS, Villaluna D, et al. A risk-adapted, response-based approach using ABVE-PC for children and adolescents with intermediate- and high-risk Hodgkin lymphoma: the results of P9425. Blood 2009; 114: 2051-9.
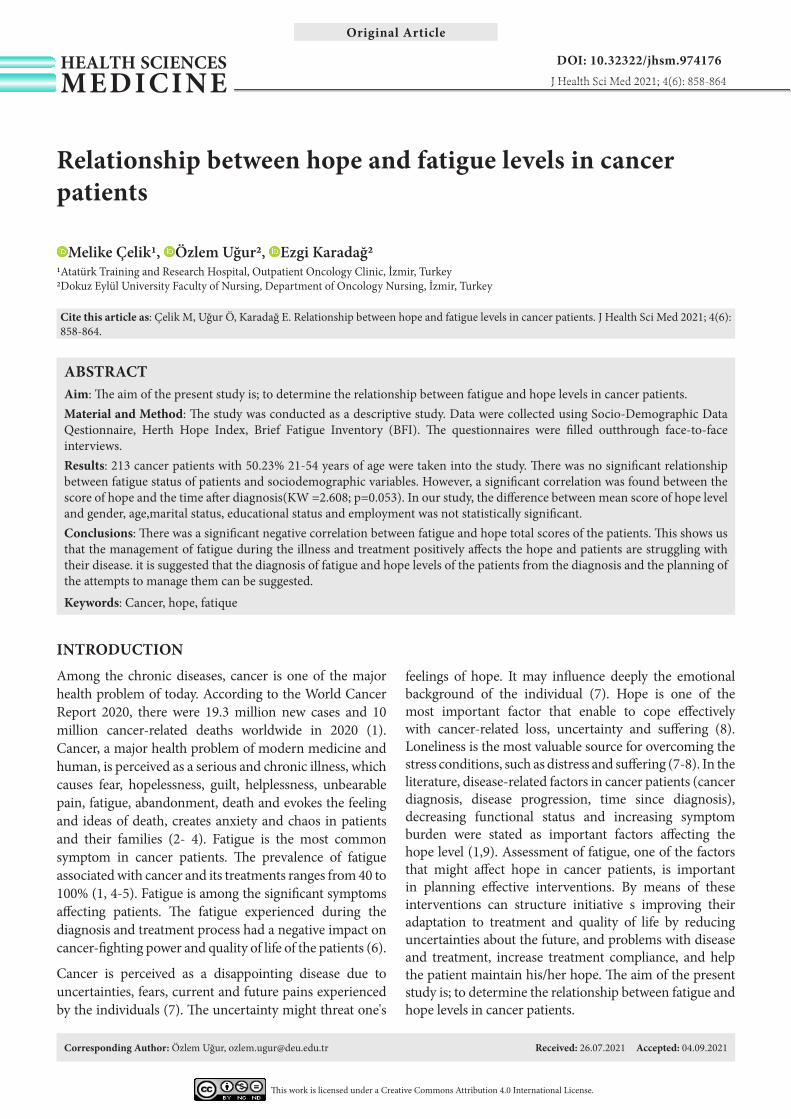
HEALTH SCIENCESMEDICINE
Original Article
J Health Sci Med 2021; 4(6): 858-864
This work is licensed under a Creative Commons Attribution 4.0 International License.
DOI: 10.32322/jhsm.974176
Received: 26.07.2021 Accepted: 04.09.2021Corresponding Author: Özlem Uğur, [email protected]
Relationship between hope and fatigue levels in cancer patients
Melike Çelik1, Özlem Uğur2, Ezgi Karadağ21Atatürk Training and Research Hospital, Outpatient Oncology Clinic, İzmir, Turkey2Dokuz Eylül University Faculty of Nursing, Department of Oncology Nursing, İzmir, Turkey
Cite this article as: Çelik M, Uğur Ö, Karadağ E. Relationship between hope and fatigue levels in cancer patients. J Health Sci Med 2021; 4(6): 858-864.
ABSTRACTAim: The aim of the present study is; to determine the relationship between fatigue and hope levels in cancer patients. Material and Method: The study was conducted as a descriptive study. Data were collected using Socio-Demographic Data Qestionnaire, Herth Hope Index, Brief Fatigue Inventory (BFI). The questionnaires were filled outthrough face-to-face interviews. Results: 213 cancer patients with 50.23% 21-54 years of age were taken into the study. There was no significant relationship between fatigue status of patients and sociodemographic variables. However, a significant correlation was found between the score of hope and the time after diagnosis(KW =2.608; p=0.053). In our study, the difference between mean score of hope level and gender, age,marital status, educational status and employment was not statistically significant. Conclusions: There was a significant negative correlation between fatigue and hope total scores of the patients. This shows us that the management of fatigue during the illness and treatment positively affects the hope and patients are struggling with their disease. it is suggested that the diagnosis of fatigue and hope levels of the patients from the diagnosis and the planning of the attempts to manage them can be suggested.Keywords: Cancer, hope, fatique
Ana Metin-Alt bilgi Arası 5mm
Cite-Öz arası 5mm
Başlık-Yazarlar arası 12mm
Yazar-Kurum arası 2,5 mm
Kurum-Cite arası 5mm
Öz-Abstract arası 7,5mm
INTRODUCTIONAmong the chronic diseases, cancer is one of the major health problem of today. According to the World Cancer Report 2020, there were 19.3 million new cases and 10 million cancer-related deaths worldwide in 2020 (1). Cancer, a major health problem of modern medicine and human, is perceived as a serious and chronic illness, which causes fear, hopelessness, guilt, helplessness, unbearable pain, fatigue, abandonment, death and evokes the feeling and ideas of death, creates anxiety and chaos in patients and their families (2- 4). Fatigue is the most common symptom in cancer patients. The prevalence of fatigue associated with cancer and its treatments ranges from 40 to 100% (1, 4-5). Fatigue is among the significant symptoms affecting patients. The fatigue experienced during the diagnosis and treatment process had a negative impact on cancer-fighting power and quality of life of the patients (6).
Cancer is perceived as a disappointing disease due to uncertainties, fears, current and future pains experienced by the individuals (7). The uncertainty might threat one's
feelings of hope. It may influence deeply the emotional background of the individual (7). Hope is one of the most important factor that enable to cope effectively with cancer-related loss, uncertainty and suffering (8). Loneliness is the most valuable source for overcoming the stress conditions, such as distress and suffering (7-8). In the literature, disease-related factors in cancer patients (cancer diagnosis, disease progression, time since diagnosis), decreasing functional status and increasing symptom burden were stated as important factors affecting the hope level (1,9). Assessment of fatigue, one of the factors that might affect hope in cancer patients, is important in planning effective interventions. By means of these interventions can structure initiative s improving their adaptation to treatment and quality of life by reducing uncertainties about the future, and problems with disease and treatment, increase treatment compliance, and help the patient maintain his/her hope. The aim of the present study is; to determine the relationship between fatigue and hope levels in cancer patients.

859
Çelik et al. Hope and fatigue for cancer patients J Health Sci Med 2021; 4(6): 858-864
MATERIAL AND METHODEthical ConsiderationsThe study was carried out with the permission of İzmir Katip Çelebi University, Non-Interventional Clinical Investigations Committee of Ethics Committee (Date: 21.01.2016, Decision No: 10), Atatürk Training from the General Secretariat of the Southern Region Public Hospitals Association of İzmir Province (No: 23592379/772.02) and the Research Hospital Oncology Day Care Service. All procedures were carried out in accordance with the ethical rules and the principles of the Declaration of Helsinki. That the validity and reliability of scales in Turkey Çınar et al. (10) and Aslan, Sekmen, Kömürcü & Özet (19) written consent (11). Patients who met the study criteria were informed about the study and informed consents were obtained from all volunteers. Design and SamplesThe study was conducted as a descriptive study to examine the relationship between fatigue and hope levels in cancer patients. The study was conducted at the Oncology Outpatient Service of Atatürk Training and Research Hospital, located in a western province of Turkey, between November 2015 - April 2016. Approximately 12,000 patients per year and 60-80 patients per day were admitted to Outpatient Service for treatment. As a selection criterion, patients who were admitted participating in the study, those experienced fatigue within the last 7 days, those over 18 years old, those receiving ambulatory care, those having cancer diagnosis 3 months ago, and those having no perception disorder. Exclusion criterion included patients who had cognitive impairment and mental impairment to disrupt co-operation, and those who did not want to participate in the study. In the G-power statistical program, the required sample size was determined as 210 individuals in a group, at a significance level of 0.05 and 80% power. The sample size was 213.
MeasurementsData were collected using Socio-Demographic Data Questionnaire (Personal Information Form), Herth Hope Index (HHI), Brief Fatigue Inventory (BFI).
Personal Information Form was formed according to the literature by the researchers. The form involved data regarding the age, sex, marital status, educational status, employment, type of cancer, cancer stage, duration of diagnosis and type of treatment of the cases (12-13). There are eight questions in the form.
Brief Fatigue Inventory is a 9-item survey. The form assesses patients’ general level of fatigue and its impact on daily activities over the past 24 hours. The BFI uses a scale of 0, indication ‘no fatigue’ to 10, indicating the greatest interference; 0 point: no fatigue; 1-2: minimal
fatigue; 3-4: low fatigue; 5-6: moderate fatigue; 7-8: too much fatigue 9-10: severe fatigue. The original scale was developed by Mendoza et al. (14) and Cronbach α value was found as 0.96. The Turkish Validity and Reliability study of the scale Çınar et al. (2000). Cronbach's alpha value of BFI; It was calculated as 0.97 (10).
Herth Hope Index (HHI) was developed by Dr. Kaye and it is a 12-item Likert-type scale. The 12-item, 4-point Likert-type HHI scale assesses the overall hope level of adults. Each item is rated with a score between 1 (I do not agree) and 4 (I strongly agree) and the total score range is between 12 and 48. The higher the score, the higher hope level. Herth index Cronbach’s alpha coefficient was 0.98, in patients with acute disease, 0.96 in patients with chronic disease, and 0.94 in patients in terminal stage (15). The validity and reliability studies of Turkish version of the "Herth Hope Scale" was performed by Aslan, Sekmen, Komurcu and Ozet (11). Cronbach’s alpha was 0.75 in the reliability analysis.
There are three subscales within the scope of the scale: "temporary and future", "positive readiness and expectation" and "relations between themselves and their environment". Each sub-dimension consists of 4 questions. Therefore, a participant can score minimum 4 or maximum 16 out of any sub-dimension. The Cronbach alpha values for these three dimensions were 0.77, 0.64 and 0.30, respectively.
Data CollectionData was collected by a researcher from patients who met the criteria for participating in the study and the study was conducted with those who volunteered to participate in the study. The questionnaires were filled out through face-to-face interviews and the information regarding the diagnosis, duration of diagnosis, metastasis, presence of chronic illness, etc. was filled out by using patients’ hospital records. The duration of application for a volunteer was determined as 30-35 minutes.
Data AnalysisThe obtained data were analyzed using in IBM SPSS Version 22. Dependent variables; mean fatigue and hope scores of cancer patients in patients. Independent variables; age, gender, educational status, marital status, employment, body mass index, performance status. The socio-demographic characteristics of the sample group were defined by descriptive statistical methods; one-way analysis of variance (Anova), Mann Whitney U test, and Kruskal Wallis test were used to examine the relationship between age, educational status, gender, marital status, employment, cancer type, duration of diagnosis and mean fatigue scores. Pearson correlation analysis was used to examine the relationship between mean hope and fatigue scores of patients, fatigue level and hope. p significance value was determined as <0.005.

860
Çelik et al. Hope and fatigue for cancer patientsJ Health Sci Med 2021; 4(6): 858-864
RESULTSWhen the socio-demographic characteristics of the patients were examined; 66.7% were female, 77.0% were married, 33.3% were male and the majority were between 21 and 54 years old (50.23%). Of the patients, 56.3% were primary school graduates and 42.2% were unemployed. According to the characteristics of the patients regarding the disease and treatment; 41.7% were diagnosed with breast cancer, 55.9% were diagnosed for 12 months or longer, and 93.9% had received chemotherapy treatment (Table 1).
There was no significant difference between mean scores of patients and gender (t=0.867, p=0.387), age (t=1.418, p=0.158), marital status (t=1.513, p=0.412), educational status (KW=1.307, p=0.268), employment (KW=0.061, p=0.941), type of cancer (KW=0.905, p=0.513), time
since treatment (KW=1.918, p=0.128) and treatment method (U=1.629, p=0.121) (p> 0.05) (Table 2).
According to Table 3, the difference between mean score of hope level and gender (t=-237; p=0.813), age (t=-121; p=0.225), marital status (t=1,80; p=0.073), educational status (KW =0.553; p=0.531), employment (KW =0.184; p=0.832), and type of cancer (KW=1.089, p=0.372) (p >0.05). Similarly, there was no significant difference between temporary dimension of hope and gender (t= -0.237; p= 0.753), age (t= -1.077; p= 0.378), marital status (t= 1.337; p= 0.165), educational status (F=0.481; p=0.804), and employment (KW=0.016; p=0.934) (p >0.05). There was no significant difference between temporary subdimension of hope and gender (t=- 0.027; p= 0.979), age (t= -1.049; p= 0.189), marital status (t=1.357; p=0.086), educational status (KW =2.022; p= 0.083) and employment (KW=0.328; p=0.586) (p>0.05). There was no significant difference between relations with themselves and those around subdimension of hope and gender (t=- 0.220; p= 0.985), age (t =-0.993; p=0.355), marital status (t= 2.041; p= 0.178), educational status (KW=1.579; p= 0.368), and employment (KW=0.110; p=0.754) (p >0.05). There was a significant difference between time after diagnosis and mean total score of hope (KW =2.608; p=0.053) (p<0.05). Accordingly, the total hope score of patients with diagnosis period of 4-6 months was statistically higher than others. The difference between the time after diagnosis and temporary subdimension of hope (KW =1.670; p=0.175), positive readiness (KW =2.367; p=0.721), and relations with themselves and those around (KW =1.295; p=0.175) (p>0.05). There was a significant difference between treatment method and time after diagnosis and mean total score of hope level (U=- 2.534; p=0.011). While there was no significant association between treatment method and temporary subdimension of hope (U=-1.128; p=0.259), a negative correlation was detected between positive readiness (U= -2.535; p=0.011) and relations with themselves and those around (U=-3.779; p=0.00) (p<0.05) (Table 3). When the correlation between total score of brief fatigue inventory and general total score of Hert hope index and subdimensions was analyzed, a statistically negative and significant association was detected (Table 4). Although not shown in the table; the mean score of brief fatigue inventory of the patients was 43.22 ± 25.94 and the general score of hope scale was 43.98 ± 4.20. When the subdimensions of hope was examined, mean score of temporary subdimension of hope was 16.66±2.10, mean score of positive readiness subdimension was 14.72±1.10, and mean score of relations with themselves and those around was 12.60±1.01.
Table 1. Socio-demographic and disease-related characteristics of patientsCharacteristics Number %Gender
Female 142 66.7Male 71 33.3
Marital StatusMarried 164 77Single 49 23.
Age (years)21-54 107 50.255-80 106 49.8
Educational StatusIlliterate 6 2.8Literate 32 15Primary education 120 56.3High school 35 16.4College/Faculty 20 9.4
EmploymentEmployed 36 16.9Retired 87 40.8Unemployed 90 42.2
Type of cancer Breast 89 41.7 Colon 39 18.3 Ovary 19 8.9 Pancreas 11 5.1 Stomach 10 4.6 Rectum 8 3.7 Lung 8 3.7 Connective tissue 5 2.3 Other 24 10.7
Time since diagnosis (months)≤3 18 8.44-6 32 15.07-11 44 20.7≥12 119 55.9
Treatment methodChemotherapy 200 93.9Chemotherapy and radiotherapy 13 6.1

861
Çelik et al. Hope and fatigue for cancer patients J Health Sci Med 2021; 4(6): 858-864
DISCUSSIONCancer patients suffer from limitations in prognosis and treatment. These limitations can often lead to the disappearance of the joy of life (3). In this study, there was no significant difference between mean fatigue scores and mean score of gender, age, marital, educational and employment status of the patients. Although there was no statistical difference, it was found that mean fatigue scores of female and married patients were higher than males and singles, respectively. The reason for this may be due to the high number of females and married individuals taken into the study. In the literature, it was generally stated that mean fatigue scores of females and married individuals were higher (16). This finding may be derived from the several domestic responsibilities of
women because of the traditional family structure in Turkey. Although there was no statistically significant difference in the study, mean fatigue scores of the individuals graduated from primary school. Our findings are consistent with the literature (16-17).
In the study, the difference between mean fatigue score and the cancer type, the time after the diagnosis and mean scores of treatment methods of the patients were not significant. Our finding was consistent with finding Kagure (17). Although there was no statistically significant difference, it was determined that mean fatigue scores of patients with lung cancer were higher. This is due to cough, respiratory distress, and nutritional problems in the patients with lung cancer, which negatively affects the quality of life of the person (16). Cancer-related fatigue
Table 2. Comparison of mean fatigue scores according to socio-demographic data and disease-related characteristics of patients
Characteristics Total Mean Score of Brief Fatigue Inventory
t / KW pn X SD
Gender t= 0.87 p = .387Female 142 39.88 23.69Male 71 36.94 22.70
Age (years) t=1.41 p = .15821-54 107 41.19 21.8855-80 106 36.67 24.35
Marital status t=1.51 p = .412Married 164 40.22 23.39Single 49 34.48 22.90
Educational status KW=1.31 p = .268Illiterate 6 54.02 21.45Literate 32 35.90 22.69Primary education 120 40.47 23.17High school 35 37.24 26.10University 20 32.65 19.77
Employment KW =0.06 p = .941Employed 36 39.47 22.42Retired 87 39.02 24.07Unemployed 90 38.05 23.03
Type of cancer KW= 0.91 p = .513Breast 89 37.63 23.96Colon 39 41.20 27.13Ovary 19 42.37 18.61Pancreas 11 40.79 19.43Stomach 10 45.40 12.61Rectum 8 28.50 24.40Lung 8 51.75 27.33Connective tissue 5 28.60 18.99other 24 38.48 23.14
Time since diagnosis (months) KW=1.92 p=.128≤3 18 28.40 19.874-6 32 35.12 23.267-11 44 42.68 20.88≥12 119 40.11 24.37
Treatment method U=1.63 p = .121Chemotherapy 200 38.81 23.83Chemotherapy and Radiotherapy 13 45.39 13.21
Sd: Standard deviation, t: Independent samples t test, Kw: Kruskal-Wallis test
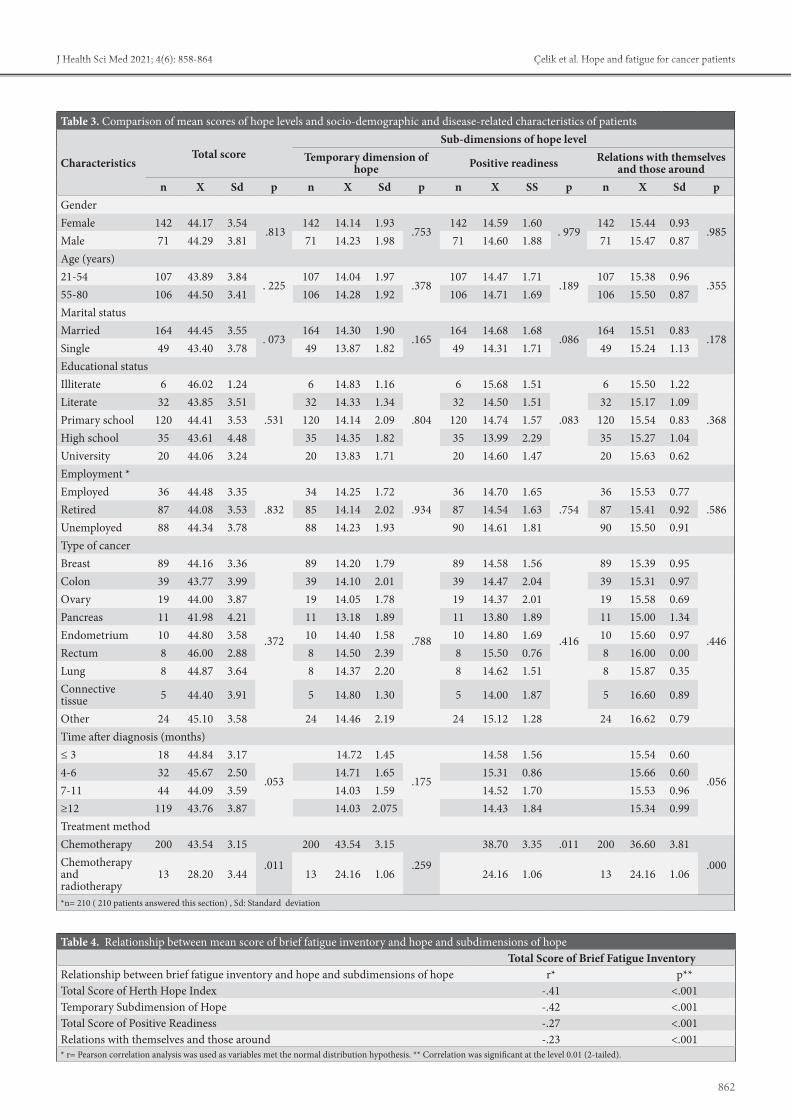
862
Çelik et al. Hope and fatigue for cancer patientsJ Health Sci Med 2021; 4(6): 858-864
Table 3. Comparison of mean scores of hope levels and socio-demographic and disease-related characteristics of patients
CharacteristicsTotal score
Sub-dimensions of hope level Temporary dimension of
hope Positive readiness Relations with themselves and those around
n X Sd p n X Sd p n X SS p n X Sd pGenderFemale 142 44.17 3.54
.813142 14.14 1.93
.753142 14.59 1.60
. 979142 15.44 0.93
.985Male 71 44.29 3.81 71 14.23 1.98 71 14.60 1.88 71 15.47 0.87Age (years)21-54 107 43.89 3.84
. 225107 14.04 1.97
.378107 14.47 1.71
.189107 15.38 0.96
.35555-80 106 44.50 3.41 106 14.28 1.92 106 14.71 1.69 106 15.50 0.87Marital statusMarried 164 44.45 3.55
. 073164 14.30 1.90
.165164 14.68 1.68
.086164 15.51 0.83
.178Single 49 43.40 3.78 49 13.87 1.82 49 14.31 1.71 49 15.24 1.13Educational statusIlliterate 6 46.02 1.24
.531
6 14.83 1.16
.804
6 15.68 1.51
.083
6 15.50 1.22
.368Literate 32 43.85 3.51 32 14.33 1.34 32 14.50 1.51 32 15.17 1.09Primary school 120 44.41 3.53 120 14.14 2.09 120 14.74 1.57 120 15.54 0.83High school 35 43.61 4.48 35 14.35 1.82 35 13.99 2.29 35 15.27 1.04University 20 44.06 3.24 20 13.83 1.71 20 14.60 1.47 20 15.63 0.62Employment *Employed 36 44.48 3.35
.83234 14.25 1.72
.93436 14.70 1.65
.75436 15.53 0.77
.586Retired 87 44.08 3.53 85 14.14 2.02 87 14.54 1.63 87 15.41 0.92Unemployed 88 44.34 3.78 88 14.23 1.93 90 14.61 1.81 90 15.50 0.91Type of cancerBreast 89 44.16 3.36
.372
89 14.20 1.79
.788
89 14.58 1.56
.416
89 15.39 0.95
.446
Colon 39 43.77 3.99 39 14.10 2.01 39 14.47 2.04 39 15.31 0.97Ovary 19 44.00 3.87 19 14.05 1.78 19 14.37 2.01 19 15.58 0.69Pancreas 11 41.98 4.21 11 13.18 1.89 11 13.80 1.89 11 15.00 1.34Endometrium 10 44.80 3.58 10 14.40 1.58 10 14.80 1.69 10 15.60 0.97Rectum 8 46.00 2.88 8 14.50 2.39 8 15.50 0.76 8 16.00 0.00Lung 8 44.87 3.64 8 14.37 2.20 8 14.62 1.51 8 15.87 0.35Connective tissue 5 44.40 3.91 5 14.80 1.30 5 14.00 1.87 5 16.60 0.89
Other 24 45.10 3.58 24 14.46 2.19 24 15.12 1.28 24 16.62 0.79Time after diagnosis (months)≤ 3 18 44.84 3.17
.053
14.72 1.45
.175
14.58 1.56 15.54 0.60
.0564-6 32 45.67 2.50 14.71 1.65 15.31 0.86 15.66 0.607-11 44 44.09 3.59 14.03 1.59 14.52 1.70 15.53 0.96≥12 119 43.76 3.87 14.03 2.075 14.43 1.84 15.34 0.99Treatment methodChemotherapy 200 43.54 3.15
.011
200 43.54 3.15
.259
38.70 3.35 .011 200 36.60 3.81
.000Chemotherapy and radiotherapy
13 28.20 3.44 13 24.16 1.06 24.16 1.06 13 24.16 1.06
*n= 210 ( 210 patients answered this section) , Sd: Standard deviation
Table 4. Relationship between mean score of brief fatigue inventory and hope and subdimensions of hopeTotal Score of Brief Fatigue Inventory
Relationship between brief fatigue inventory and hope and subdimensions of hope r* p**Total Score of Herth Hope Index -.41 <.001Temporary Subdimension of Hope -.42 <.001Total Score of Positive Readiness -.27 <.001Relations with themselves and those around -.23 <.001* r= Pearson correlation analysis was used as variables met the normal distribution hypothesis. ** Correlation was significant at the level 0.01 (2-tailed).

863
Çelik et al. Hope and fatigue for cancer patients J Health Sci Med 2021; 4(6): 858-864
is associated with the duration of diagnosis and showed elevation after the treatments. Although patients receiving both chemotherapy and radiotherapy may be expected to experience more fatigue, the difference between treatment and mean fatigue scores was not significant (18).
Cancer patients pass the adaptation process to their diseases with various reactions. Positive responses influence the healing process positively (3). In our study, the difference between mean score of hope level and gender, age, marital status, educational status and employment was not statistically significant. In literature, although women are reported to be more disadvantaged than males in situations, such as mood disorders, depression and self-annihilation (19), there are also studies indicating no gender difference in terms of hope (16-17). Our findings are consistent with the literature (20). This suggests that the negative health-related changes reduce the hope level of young patients, and they are easily affected by the negative interactions in their environment (21).
The difference between cancer type and total score of hope level was not significant. This finding might be related to the cancer type and stage of the individuals. It is noteworthy that the five-year survival rates of cancer types are relatively high. Five-year survival rate is 87% for breast cancer, 59% for bowel cancer, and 65% for colon cancers (22-23). Moreover Costa et al. (24) found that patients with breast cancer had higher total hope scores, and it was stated that high hope levels helped individuals to flow the changes in their values and caused the questioning of the meaning of life by providing internal self-motivation. However, the data regarding the cancer stages were not obtained from the patient records. This is the limitation of our study. There was a significant difference between the time after the diagnosis and mean total hope score and the subdimension of positive readiness (p <0.05). However, it was determined that total and subdimension scores of hope were lower as the duration of diagnosis was prolonged. It might be concluded that the hope of the cancer patients decreases as the duration of diagnosis and treatment increases. According to the literature, fear and uncertainty caused by cancer, long treatment period and uncontrollable side effects constituted a risk factor in terms of hopelessness, future anxiety and negative thoughts, depression and hopelessness (25-26). Likewise, in the same study, it was found that the scores of temporary subdimension of hope in patients with duration of diagnosis ≤3 months, mean scores of positive readiness and relationship with themselves and their environment in patients with duration of diagnosis between 4-6 months were found to be higher. This shows us that patients maintain positive relationships with their environment to maintain their hope during their disease.
The scores of positive readiness involving fatigue score and hope subdimensions, and the subdimension scores of relationship with themselves and their environment were found to be higher. The fatigue levels of patients were low (mean=43.229) and general hope score was high (mean=432). As patients' fatigue reduce, hope increases. In the literature, while a similar association was found between fatigue and hope (26). In addition, we found a weak negative correlation between subdimensions of positive readiness and relationship between themselves and their environment. The result shows that individuals who are struggling with cancer have confidence to the treatments and maintain their hopes for recovery. In addition, new therapies related to cancer and treatment cause the maintenance of hope feeling for recovery in individuals. This shows us that the management of fatigue during the illness and treatment positively affects the hope and patients are struggling with their disease (27).
Study LimitationsThe study was done in a single hospital, the number of samples, and the fact that the sample of the patient group was not able to reach the cancer stage data was a limitation.
CONCLUSIONThe study was a significant negative correlation between fatigue and hope subdimensions. It was determined that the duration of diagnosis and the treatment method affected the hope and fatigue scores. At the end of this study, it is recommended to perform the fatigue assessment of patients as from the diagnosis, to inform the patients regarding fatigue management, to structure attempts for increasing the hope levels and to plan interventions for developing the coping-skills of patients with disease.
ETHICAL DECLARATIONSEthics Committee Approval: The study was carried out with the permission of İzmir Katip Çelebi University, Non-Interventional Clinical Investigations Committee of Ethics Committee (Date: 21.01.2016, Decision No: 10).Informed Consent: All patients signed the free and informed consent form.Referee Evaluation Process: Externally peer-reviewed. Conflict of Interest Statement: The authors have no conflicts of interest to declare. Financial Disclosure: The authors declared that this study has received no financial support. Author Contributions: All of the authors declare that they have all participated in the design, execution, and analysis of the paper, and that they have approved the final version.

864
Çelik et al. Hope and fatigue for cancer patientsJ Health Sci Med 2021; 4(6): 858-864
REFERENCES1. Sung H, Ferlay J, Siegal RL, et al. Global cancer statistics 2020:
GLOBOCAN estimates of incidence and mortality worldwide for 36 cancers in 185 countries. CA: A Cancer J Clin 2020; 71: 209- 49.
2. Ministry of Health, Directorate General of Public Health, Department of Cancer. http://kanser.gov.tr/daire-faaliyetleri/kanser- is tat is t ik ler i /860-yeni-d%C3%B Cnya-kanser-istat ist ik ler i-yay%C4%B1nland%C4%B1.html#sthash.rVNq4ChN.dpuf Erişim tarihi: 15.12.2020
3. van Baalen NC, Grypdonck M, van Hecke A, Verhaeghe S. Associated factors of hope in cancer patients during treatment: A systematic literature review. J Adv Nurs 2019; 76: 1520- 37.
4. National Comprehensive Cancer Network. NCCN Clinical Practice Guideline in Oncology TM: Cancer-related fatigue. 2017, http://www.nccn.org/professionals/physician_gls/PDF/fatigue.pdf. date of access: 14.12.2017.
5. Tarakçıoğlu, ÇGH. Symptom Management in Oncology Nursing. Gümüşhane University Journal of Health Sciences 2016; 5: 93-100.
6. Spahrkäs SS, Looijmans A., Sanderman R, Hagedoorn M. Beating cancer-related fatigue with the Untire mobile app: Results from a waiting-list randomized controlled trial. Psycho-Oncology 2020; 29: 1823–34.
7. Özdaş, T. and Olgun, N. Hopelessness Level and Affecting Factors of Patients with Bone Marrow Transplantation. HSP 2015; 2: 12-21.
8. Mahendran R, Chua SM, Lim HA, et al. Biopsychosocial correlates of hope in Asian patients with cancer: a systematic review. BMJ Open 2016; 6: 12087.
9. Mohandas H, Jaganathan SK, Mani MP, Ayyar M, Rohini Thevi GV. Cancer-related fatigue treatment: An overview. J Cancer Res Ther 2017; 13: 916-29.
10. Çınar S, Sezerli M, Sarsmaz N, Menteş AÖ. Hemodiyaliz akut yorgunluk sendromuna neden olabilir mi? Hemşirelik Forumu Derg 2000; 3: 28-33.
11. Aslan Ö, Sekmen K, Kömürcü Ş, Özet A. Hope in cancer patients. Journal of Cumhuriyet University School of Nursing 2007; 1: 18-24.
12. Tarhan, S. and Bacan, H. Adaptation of Continuous Hope Scale to Turkish: Validity and reliability study. J Happiness Well-Being 2015; 3: 1-14.
13. Özdelikara, A. The effect of reflexology on nausea, vomiting and fatigue in breast cancer patients. Asia Pac J Oncol Nurs 2017; 4: 241- 9.
14. Mendoza TR, Wang XS, Cleeland, CS, et al. Therapid assessment of fatigue severity in cancer patients. Cancer 1999; 85: 1186- 96.
15. Herth, K. Abbreviated instrument to measure hope: develeopment and psychometric evaluation. JAN 1992; 17: 1251-9.
16. Wright F, Kober MK, Cooper AB, et al. Higher levels of stress and different coping strategies are associated with greater morning and evening fatigue severity in oncology patients receiving chemotherapy. Supportive Care in Cancer 2020; 28: 4697–706.
17. Kogure E, Hara T, Ishii T, Maeda, M. Changes in fatigue and physical function with age for patients with gastrointestinal cancer in the perioperative period:a comparison between older and young patients. J Phys. Ther 2017; 29: 2004–8.
18. South Florida Cancer Association. EPEC. Education in palliative and end-of-life care for oncology. Self-Study Module 3k: Fatigue. http://www.egdutton2.com/resources- for/hp/education/epeco/self-study/module-3/MS_81849.pdf access15.12.2017
19. Baczewska B, Block B, Kropornicka B, et al. Hope in advanced cancer patients in the terminal phase of neoplastic disease and stability of basic mood. J Clin Med 2020; 9: 3550;
20. Ginter CA. The day you lose your hope is the day you start to die”: Quality of life measured by young women with metastatic breast cancer. J Psychosoc Oncol 2020; 38: 418- 34.
21. Baczewska B, Block B, Kropornicka B, et al. Hope in hospitalized patients with terminal cancer. Int J Environ Res Public Health 2019; 16: 3867.
22. Quaresma M, Coleman MP, Rachet B. 40-year trends in an index of survival forall cancers combined and survival adjusted for age and sex for each cancer in England and Wales, 1971-2011: a population-based study. Lancet 2015; 385: 1206-18.
23. White A, Joseph D, Rim SH, Johnson CJ, Coleman MP, Allemani C. Colon cancer survival in the United States by race and stage (2001-2009): Findings from the CONCORD-2 study. Cancer 2017; 24: 5014-36.
24. Costa DT, Silva DMRD, Cavalcanti IDL, Gomes ET, Vasconcelos JLA, Carvalho MVG. Religious/spiritual coping and level of hope in patients with cancer in chemotherapy. Rev Bras Enferm 2019; 72:640-5.
25. Ozen B, Ceyhan Ö, Büyükçelik A. Hope and perspective on death in patients with cancer. Death Studies 2019; 44: 412- 8.
26. Bener A, Alsulaiman R, Doodson L, Agathangelou T. Depression, hopelessness and social support among breast cancer patients: in highly endogamous population. Asian Pac J Cancer Prev 2017; 18: 1889-96.
27. Herbrand KM., Silverman JM. A randomized pilot study of patient-preferred live music addressing fatigue, energy, and pain in adults on a medical oncology/hematology unit. Psychol Music 2020; 1-12.

HEALTH SCIENCESMEDICINE
Original Article
J Health Sci Med 2021; 4(6): 865-870
This work is licensed under a Creative Commons Attribution 4.0 International License.
DOI: 10.32322/jhsm.975266
Received: 27.07.2021 Accepted: 16.08.2021Corresponding Author: Ramazan Topcu, [email protected]
The effect of COVID-19 pandemic on inguinal hernia emergencies
Ramazan Topcu1, Murat Baki Yıldırım1, Murat Bulut Özkan1, Orhan Aslan2, İsmail Sezikli1, Fatih Şahin1
1Hitit University, Faculty of Medicine, Department of General Surgery, Çorum, Turkey2Hitit University, Erol Olçok Training and Research Hospital, General Surgery Clinic, Çorum, Turkey
Cite this article as: Topcu R, Yıldırım MB, Özkan MB, Aslan O, Sezikli İ, Şahin F. The effect of COVID-19 pandemic on inguinal hernia emergencies. J Health Sci Med 2021; 4(6): 865-870.
ABSTRACTIntroduction: COVID-19 has spread all over the world and caused significant changes in healthcare practices. This is why many expert associations have published new guidelines on COVID-19 management. This study aims to investigate whether the COVID-19 pandemic has an effect on Inguinal hernia (IH) emergencies. Material and Method: A total of 63 patients diagnosed with strangulated/incarcerated inguinal hernia who presented to the emergency surgery department of our hospital between April 2020 and January 2021 during the pandemic (DP) and between April 2019 and January 2020 before the pandemic (BP) were retrospectively analyzed and compared. Results:There was no statistically significant difference between both groups in terms of demographic characteristics. The comparison of the number of admissions, admission time, anesthesia type, hospital stay, postoperative complications, ASA score, hernia, WBC, and CRP averages showed no statistically significant difference between the groups. Moreover, there was no statistically significant difference between the two groups in terms of distributions of hernia types, hernia repair types, mesh use, and additional resection requirement. The comparison of the patients who underwent organ resection by admission time in both groups showed no statistically significant difference. It was observed that the number of patients who required small bowel resection were especially high on the 4th day. In DP, small bowel resection was performed on 4 (66.7%) patients and omentectomy was performed in 2 (33.3%) patients. In BP, only one right hemicolectomy was performed. The comparison of the patients with an admission time of 4th day revealed a statistically significant difference (p=0.03). Conclusion: We observed that morbidity increased as the admission time was delayed. Anticipating that the fear of COVID-19 infection will hold back the emergency response during the pandemic period, patients should be informed not to delay early diagnosis and treatment.Keywords: COVID -19 pandemic ,emergency, inguinal hernia
Ana Metin-Alt bilgi Arası 5mm
Cite-Öz arası 5mm
Başlık-Yazarlar arası 12mm
Yazar-Kurum arası 2,5 mmvv
Kurum-Cite arası 5mm
Öz-Abstract arası 7,5mm
INTRODUCTION Coronavirus disease (COVID-19) is an infectious disease caused by the SARS-CoV-2 virus. In December 2019, the World Health Organization declared a covid 19 epidemic. Most COVID-19 patients battle a mild or moderate prognosis, with up to 5-10% going to have a severe, potentially trying course (4). The tide of death is approaching fast, the queue is easy to mess with and it's about close-up events and concerns at close proximity (5).
The COVID-19 pandemic has taken the whole world under its influence in a short time, and unexpected and unprecedented radical changes in health practices have affected all countries. During the COVID-19 pandemic,
surgical units gave priority to emergency procedures and oncological cases and postponed elective cases (6).
Abdominal hernia surgery is one of the most performed surgeries with a rate of 100 to 500 cases per 100,000 per year (7). While mortality rates are around 0.5% in elective hernia surgery, it is around 5% in emergency cases (8). In the cases of incarceration or strangulation, although the final treatment is often surgical, a decision must be made based on the patient's condition (age, accompanying diseases, Computed Tomography finding, SIRS, etc.). If there is a high probability of strangulation, the decision should an urgent surgery.
866
Topcu et al. Pandemic on inguinal hernia emergencies J Health Sci Med 2021; 4(6): 865-870
The goals of emergency hernia surgery can be divided into three parts: saving lives (gangrenous bowel/tissue resection); restoring GI continuity (if bowel resection was performed); repairing the abdominal wall. These goals can be achieved in the same operation, yet a phased approach may also be required. Mortality and morbidity in the emergency department increase 10-20 times compared to elective surgery, and bowel infarction is the major risk factor for this (9).
Inguinal hernia (IH) is a common pathology that has the risk of developing significant complications in the case of strangulation. Strangulated inguinal hernias are a surgical emergency and are associated with high morbidity and mortality (10,11). Delayed diagnosis of patients with incarcerated/strangulated inguinal hernia and not performing surgery in the first 24 hours are associated with increased bowel resection. Therefore, early diagnosis of these patients and timing of treatment gain importance. This study aims to investigate the effect of the pandemic on inguinal hernia emergencies.
MATERIAL AND METHODThe study was approved by the Hitit University Non-interventional Researchs Ethics Committee (Date: 30.04.2021, Decision No:2021-66). All procedures were carried out in accordance with the ethical rules and the principles of the Declaration of Helsinki. Strangulated/incarcerated inguinal hernia patients presented to the emergency department and operated during the April 2019-December 2019 pre-pandemic (BP) period and the April 2020-December 2020 pandemic period (DP) were retrospectively analyzed.
Patients presented to the emergency department of the Hitit University Erol Olçok Training and Research Hospital General Surgery Clinic and operated for incarcerated/strangulated inguinal hernia between the specified dates were retrospectively searched from the hospital system. The data of 63 patients were retrieved. The patients were divided into two groups as BP and DP. There were 35 patients in the BP group and 28 patients in the DP group. The patients' gender, age at admission, comorbidities, ASA scores, presence of ileus symptoms, number of days from incarceration to admission, presence of air-fluid level on erect abdominal radiograph (EAR), white blood cell count (WBC), C-reactive peptide (CRP) level, albumin (Alb) level, hernia type (indirect, direct, femoral), type of surgery performed (anterior repair, McVay, Plug Mesh), mesh use, type of anesthesia used, whether resection was performed, operative time, presence of perioperative morbidity, local complications during hospitalization and length of stay were found from the Hospital Information Management System and included in the study.
Numerical variables such as age, time to admission, WBC, CRP, operative time, length of stay were reported using the mean±standard deviation and median in parentheses. Correlations between numerical measurements were assessed with Pearson or Spearman correlation coefficient in accordance with the data distribution. Categorical variables such as gender, number of comorbidities, ASA score, presence of ileus symptoms, presence of air-fluid level, type of hernia and type of surgery, presence of mesh, anesthesia type, resection type, perioperative morbidity, and local complications were reported as numbers and percentages in parentheses. Normally distributed data were evaluated using the Shapiro-Wilk test. Statistical differences between age, time to admission, CRP, operative time, and length of stay were evaluated with the Mann-Whitney-U test. Ratio comparisons and correlation analyses of categorical variables according to study groups were performed using the Chi-square and Fisher's exact tests. The level of statistical significance was set at p<0.05. All statistical analyses were performed using IBM SPSS Statistics for Windows software (version 26; IBM Corp., Armonk, N.Y., USA).
RESULTS Of the 63 patients included in the study, 50 were male (79.4%), with a mean age of 68.21±17.89 years. The median age was 74 years, the youngest patient was 23 years old, and the oldest patient was 94 years old.
There were 32 patients (50.8%) who had no disease in the entire group, 23 (36.5%) of the patients were evaluated as ASA2, 27 (42.9%) as ASA3, and 13 (20.6%) as ASA4.
The patients presented to the hospital 2±0.89 days after the onset of symptoms, 39 patients (61.9%) had ileus symptoms at admission, but only 30 (47.6%) had air-fluid levels on EAR. The mean and standard deviations of WBC and CRP of the patients at admission were 9.23±3.40 109/L, 20.17±45.03 mg/dL , respectively.
The majority of the patients (41 patients (65.1%)) were evaluated to have an indirect hernia. While 53 (84.1%) hernias were repaired with the anterior approach, 6 (9.5%) were repaired with McVay repair, and 4 (6.3%) with Mesh Plug technique. The rate of mesh use was calculated as 85.7%, with 54 patients. Omentectomy was added to the repair of 7 patients (11.1%), small bowel resection was performed on 8 (12.7%) patients, primary repair of the colon was performed on 1 (1.6%) patient, and right hemicolectomy was performed on 1 (1.6%). Most of the operations (76.2% (46)) were performed under spinal anesthesia, with a mean operative time of 80.40±25 minutes.
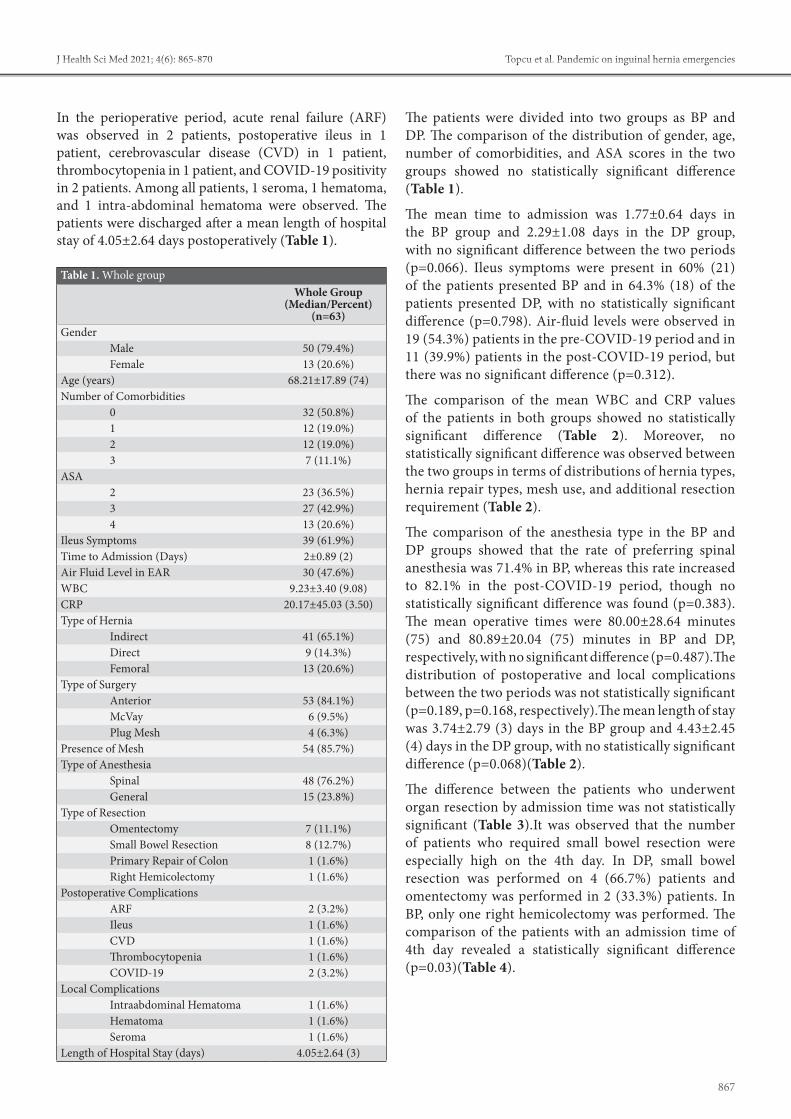
867
Topcu et al. Pandemic on inguinal hernia emergenciesJ Health Sci Med 2021; 4(6): 865-870
In the perioperative period, acute renal failure (ARF) was observed in 2 patients, postoperative ileus in 1 patient, cerebrovascular disease (CVD) in 1 patient, thrombocytopenia in 1 patient, and COVID-19 positivity in 2 patients. Among all patients, 1 seroma, 1 hematoma, and 1 intra-abdominal hematoma were observed. The patients were discharged after a mean length of hospital stay of 4.05±2.64 days postoperatively (Table 1).
The patients were divided into two groups as BP and DP. The comparison of the distribution of gender, age, number of comorbidities, and ASA scores in the two groups showed no statistically significant difference (Table 1).
The mean time to admission was 1.77±0.64 days in the BP group and 2.29±1.08 days in the DP group, with no significant difference between the two periods (p=0.066). Ileus symptoms were present in 60% (21) of the patients presented BP and in 64.3% (18) of the patients presented DP, with no statistically significant difference (p=0.798). Air-fluid levels were observed in 19 (54.3%) patients in the pre-COVID-19 period and in 11 (39.9%) patients in the post-COVID-19 period, but there was no significant difference (p=0.312).
The comparison of the mean WBC and CRP values of the patients in both groups showed no statistically significant difference (Table 2). Moreover, no statistically significant difference was observed between the two groups in terms of distributions of hernia types, hernia repair types, mesh use, and additional resection requirement (Table 2).
The comparison of the anesthesia type in the BP and DP groups showed that the rate of preferring spinal anesthesia was 71.4% in BP, whereas this rate increased to 82.1% in the post-COVID-19 period, though no statistically significant difference was found (p=0.383). The mean operative times were 80.00±28.64 minutes (75) and 80.89±20.04 (75) minutes in BP and DP, respectively, with no significant difference (p=0.487).The distribution of postoperative and local complications between the two periods was not statistically significant (p=0.189, p=0.168, respectively).The mean length of stay was 3.74±2.79 (3) days in the BP group and 4.43±2.45 (4) days in the DP group, with no statistically significant difference (p=0.068)(Table 2).
The difference between the patients who underwent organ resection by admission time was not statistically significant (Table 3).It was observed that the number of patients who required small bowel resection were especially high on the 4th day. In DP, small bowel resection was performed on 4 (66.7%) patients and omentectomy was performed in 2 (33.3%) patients. In BP, only one right hemicolectomy was performed. The comparison of the patients with an admission time of 4th day revealed a statistically significant difference (p=0.03)(Table 4).
Table 1. Whole group Whole Group
(Median/Percent) (n=63)
GenderMale 50 (79.4%)Female 13 (20.6%)
Age (years) 68.21±17.89 (74)Number of Comorbidities
0 32 (50.8%)1 12 (19.0%)2 12 (19.0%)3 7 (11.1%)
ASA2 23 (36.5%)3 27 (42.9%)4 13 (20.6%)
Ileus Symptoms 39 (61.9%)Time to Admission (Days) 2±0.89 (2)Air Fluid Level in EAR 30 (47.6%)WBC 9.23±3.40 (9.08)CRP 20.17±45.03 (3.50)Type of Hernia
Indirect 41 (65.1%)Direct 9 (14.3%)Femoral 13 (20.6%)
Type of SurgeryAnterior 53 (84.1%)McVay 6 (9.5%)Plug Mesh 4 (6.3%)
Presence of Mesh 54 (85.7%)Type of Anesthesia
Spinal 48 (76.2%)General 15 (23.8%)
Type of ResectionOmentectomy 7 (11.1%)Small Bowel Resection 8 (12.7%)Primary Repair of Colon 1 (1.6%)Right Hemicolectomy 1 (1.6%)
Postoperative ComplicationsARF 2 (3.2%)Ileus 1 (1.6%)CVD 1 (1.6%)Thrombocytopenia 1 (1.6%)COVID-19 2 (3.2%)
Local ComplicationsIntraabdominal Hematoma 1 (1.6%)Hematoma 1 (1.6%)Seroma 1 (1.6%)
Length of Hospital Stay (days) 4.05±2.64 (3)

868
Topcu et al. Pandemic on inguinal hernia emergencies J Health Sci Med 2021; 4(6): 865-870
Table 2. Comparison of patients before and after COVID-19 Whole Group (Median/Percent) (n=63) BP-group 1 (n=35) DP- group 2 (n=28) P-valueGender
Male 30 (85.7%) 20 (71.4%) p=0.215Female 5 (14.3%) 8 (28.6%)
Age (years) 66.83±19.89 (74) 69.93±15.20 (72.5) p=0.729Number of Comorbidities
0 17 (48.6%) 15 (53.6%) p=0.7601 7 (20.0%) 5 (17.9%)2 8 (22.9%) 4 (14.3%)3 3 (8.6%) 4 (14.3%)
ASA Score2 14 (40%) 9 (32.1%) p=0.8073 14 (40%) 13 (46.4%)4 7 (20%) 6 (21.4%)
Ileus Symptoms 21 (60%) 18 (64.3%) p=0.798Time to Admission (Days) 1.77±0.64 (2) 2.29±1.08 (2) p=0.066Air Fluid Level in EAR 19 (54.3%) 11 (39.9%) p=0.312WBC (109/L) 8.87±2.94 (9.09) 9.68±3.91 (9.01) p=0.352CRP (mg/dL) 19.81±43.75 (3.13) 20.63±47.37 (4.30) p=0.352Type of Hernia
Indirect 24 (68.6%) 17 (60.7%) p=0.736Direct 5 (14.3%) 9 (14.3%)Femoral 6 (17.1%) 13 (20.6%)
Type of SurgeryAnterior 30 (85.7%) 23 (82.1%) p=0.928McVay 3 (8.6%) 6 (9.5%)Plug Mesh 2 (5.7%) 4 (6.3%)
Presence of Mesh 32 (91.4%) 22 (78.6%) p=0.170Type of Anesthesia
Spinal 25 (71.4%) 23 (82.1%) p=0.383General 10 (28.6%) 5 (17.9%)
Type of ResectionOmentectomy 3 (8.6%) 4 (14.3%) p=0.704Small Bowel Resection 4 (11.4%) 4 (14.3%)Primary Repair of Colon 1 (2.9%) 0 (0%)Right Hemicolectomy 1 (2.9%) 0 (0%)
Operative Time (min) 80.00±28.64 (75) 80.89±20.04 (75) p=0.487Perioperative Morbidity
ARF 2 (5.7%) 0 (0%) p = 0.189Ileus 0 (0%) 1 (3.6%)CVD 0 (0%) 1 (3.6%)Thrombocytopenia 1 (2.9%) 0 (0%)COVID-19 0 (0%) 2 (7.1%)
Local ComplicationsIntraabdominal Hematoma 0 (0%) 1 (3.6%) p=0.168Hematoma 1 (3.6%)Seroma 1 (3.6%)
Length of Hospital Stay (days) 3.74±2.79 (3) 4.43±2.45 (4) p=0.068
Table 3. Comparison of Resection Rates by Days
Admission Day Resection
Whole Group (n=63) Statistical
SignificancePre-COVID-19
(n=35)
Time of COVID-19
(n=28)
1 No 10 (90.9%) 7 (100%) p=1Yes 1 (9.1%) 0 (0%)
2 No 16 (72.7%) 11 (91.7%) p=0.378Yes 6 (27.3%) 1 (8.3%)
3 No 0 (0%) 2 (66.7%) p=1Yes 1 (100%) 1 (33.3%)
4 No 0 (0%) 0 (0%) *Yes 1 (100%) 6 (100%)
Table 4. Comparison of Resection Types on Day 4
Admission Day
Type of Resection
Whole Group (n=7)Statistical
SignificancePre-
COVID-19 (n=1)
Time of COVID-19
(n=6)
4
Omentectomy 0 (0%) 2 (33.3%)
(p=0.03)Small Bowel
Resection 0 (0%) 4 (66.7%)
Right Hemicolectomy 1 (100%) 0 (0%)

869
Topcu et al. Pandemic on inguinal hernia emergenciesJ Health Sci Med 2021; 4(6): 865-870
DISCUSSIONPatients presenting with acute inguinal hernia (IH) remain a common surgical emergency. The popular “watch and wait” policy for IH increases the immediate presentation of such hernias. The management of such patients is associated with significant morbidity, and indeed mortality (12). It is known that especially age > 65 years, prolonged symptom duration, delay in admission, diagnosis and surgery, time from admission to surgery, strangulation more than 24 hours, symptom duration of 3 days or longer, femoral hernia, female gender, ASA class III and IV, and ileus increase mortality and morbidity in patients (11). The COVID-19 pandemic has taken the whole world under its influence in a short time, and unexpected and unprecedented radical changes in health practices have affected all countries. During the COVID-19 pandemic, surgical units gave priority to emergency procedures and oncological cases and postponed elective cases (6). Emergency IH is considered one of the most common emergency surgeries performed in any surgical department because of the high risk of morbidity and mortality associated with delayed repair. On the other hand, elective hernia repair for uncomplicated hernias has been postponed at our institution and in many countries of the world to reduce the risk of viral transmission to operating room personnel and other patients. Therefore, we anticipated an increase in the number of hernia-related complications following the cancellation of elective procedures. However, in DP, the number of emergency applications has decreased in general and a significant decrease has been observed in emergency IHs. However, a study based on German data reported that the decrease in elective inguinal hernia repairs was almost 70% in the weeks when the pandemic reached its peak, however, contrary to expectations, the rate of emergency inguinal hernia surgery did not increase (13). In this study, the number of patients admitted to our institution with the diagnosis of emergency IH in DP and BP was not statistically significant between both groups. While the number of applications to hospital emergencies decreased all over the world, it is seen that the number of applications for inguinal hernia emergencies was not affected in the Germany study. While our study was compatible with the German study, it was not compatible with other studies.
During the pandemic period, patients were concerned about the risk of COVID-19 infection, and the rate of admissions to hospital emergency departments decreased (14,15). Therefore, the admission time and the duration of strangulation were expected to increase emergency IHs. However, in general, this study found no statistically significant difference in terms of admission time to the emergency departments s of hospitals in DP
and BP. Nevertheless, when the admission times were evaluated separately, there was a significant difference between the two groups in terms of patients who had small bowel resection on the 4th day (p=0.03).We think that this result is probably caused by late admission to the hospital due to the risk of COVID-19 infection .
In this study, the number of patients admitted to our institution with the diagnosis of emergency IH in DP and BP was not statistically significant between both groups. In DP, the number of emergency admissions has generally decreased in the world, and there has been a significant decrease in emergency IHs (14). There was no significant difference between the groups in terms of age, hernia type, admission time, and ileus presentation, which affect the mortality of emergency IHs. There was no statistically significant difference between the two groups in terms of the length of hospital stay, local complications, requirement for organ resection, ASA score, selection of anesthesia type, and operative time.
As it is known, SARS-CoV-2 is a virus transmitted by aerosol droplets. Although it has been isolated from many body fluids such as feces, urine and blood, no definite evidence has yet been revealed in terms of direct transmission from the peritoneal cavity. However, it is a fact that has been revealed a long time ago that viruses of similar nature can be transmitted through surgical smoke (16,17).In the guideline published by the European Hernia Society for hernia surgery in adult patients during the COVID-19 pandemic, it is recommended to decide on the use of laparoscopy in emergency cases by considering the balance between risks and benefits.In addition, in the guide published by China in February, the concern that laparoscopy in COVID (+) patients may cause additional lung damage to the existing viral damage through increased intra-abdominal pressure was brought to the agenda. Although this idea remained more of a theoretical hypothesis, it has become a new topic of discussion (18). In this study, direct open surgery was performed in all patients with DP and spinal anesthesia was performed. An important factor in this choice was the concern that pneumoperitoneum desufflation created during laparoscopic surgery might increase viral aerosolization. Moreover, the fact that laparoscopy made general anesthesia inevitable came to the fore as an important factor.In this study, there was no significant difference in terms of anesthesia choice in PE and DP, and the patients were operated under spinal anesthesia in general. Since laparoscopy was used less in both periods, spinal surgery was preferred, especially in DP, to minimize the risk of transmission during intubation.
All patients waiting for elective surgery are important and should be assured. Most of the time, delay in elective

870
Topcu et al. Pandemic on inguinal hernia emergencies J Health Sci Med 2021; 4(6): 865-870
hernia repair may not cause an increase in the risk of complications; nevertheless, patients should be informed about possible complications in case of delay, and the conditions that require admission to the emergency department should be explained thoroughly to ensure that early diagnosis and treatment are not delayed. The role of not delaying emergency services during the pandemic, the correct management of elective surgical procedures in the pre-pandemic period, and rapid diagnosis and use of treatment protocols by surgeons during the pandemic period are important (18,19).
Although there were curfew restrictions during the pandemic period in our country, we think that treatments have been effectively administered without delays and disruptions in the case of surgical emergencies. Pandemic-related morbidity and mortality rates of hernia surgery can be reduced by taking patient-hospital oriented preventive measures to reduce viral transmission. Early diagnosis and treatment undertake a key role.
CONCLUSIONDuring the pandemic period, elective surgical procedures should be managed accurately, patients should be informed about possible complications in case of delay, and the conditions that require admission to the emergency department should be explained thoroughly to patients. We observed that morbidity increased as the admission time was delayed. Anticipating that the fear of COVID-19 infection will hold back the emergency response during the pandemic period, patients should be informed not to delay early diagnosis and treatment.
ETHICAL DECLARATIONS Ethics Committee Approval: The study was approved by the Hitit University Non-interventional Researchs Ethics Committee (Date: 30.04.2021, Decision No: 2021-66).Informed Consent: All patients signed the free and informed consent form.Referee Evaluation Process: Externally peer-reviewed.Conflict of Interest Statement: The authors have no conflicts of interest to declare. Financial Disclosure: The authors declared that this study had received no financial support. Author Contributions: All of the authors declare that they have all participated in the design, execution, and analysis of the paper and approved the final version.Acknowledgment: This article was presented at the 8th Virtual National Hernia Congress. (11-12 March 2021, SB-13 )
REFERENCES 1. Coronavirus Disease (COVID-19) pandemic. https://www.who.
int/emergencies/diseases/novel-coronavirus-2019. Accessed Mar 2020.
2. Wu F, Zhao S, Yu B, et al. A new corona virus associated with human respiratory disease in China. Nature 2020; 579: 265–9.
3. Ren X, Chen B, Hong Y, et al. The challenges in colorectal cancer management during COVID-19 epidemic. Ann Transl Med 2020; 8: 498.
4. Hoffmann C. Treatment. In: Kamps BS, Hoffmann C (eds) COVID Reference, Edition 2020-2. Stein Hauser Verlag; Amedeo, Germany; 2020. Website www.covidreference.com. Accessed 12 Apr 2020.
5. Cao W, Fang Z, Hou G, et al. The psychological impact of the COVID-19 epidemic on college students in China. Psychiatry Res 2020; 11: 29–4.
6. Zheng MH, Boni L, Fingerhut A . Minimally invasive surgery and the novel coronavirus outbreak: lessons learned in China and Italy. Ann Surg 2020; 272: e5-e6
7. Primatesta P, Goldacre MJ . Inguinal hernia repair: incidence of elective and emergency surgery, readmission and mortality. Int J Epidemiol 1996; 25: 835–9
8. Rodríguez-Cuéllar E, Villeta R, Ruiz P. National project for the management of clinical processes. Surgical treatment of inguinal hernia. Cir Esp 2005; 77: 195–2
9. Góngora-Gómez, EM. Strangulated inguinal hernia. Cirugia Y Cirujanos 2012; 80: 357-7.
10. Ohene-Yeboah M, Dally CK. Strangulated inguinal hernia in adult males in Kumasi. Ghana Med J 2014; 48: 101-5.
11. The Hernia Surge Group, Simons MP, Smietanski M. et al. International guidelines for groin hernia management. Hernia 2018; 22: 1–165.
12. Orchard MR, Wright JA, Kelly A, et al .The impact of healthcare rationing on elective and emergency hernia repair. Hernia 2016; 20: 405–9.
13. Köckerling F, Köckerling D, Schug-Pass C. Elective hernia surgery cancellation due to the COVID-19 pandemic. Hernia 2020; 24: 1143-5.
14. D'Urbano F, Fabbri N, Koleva Radica M, et al. Emergency surgery in COVID-19 outbreak: Has anything changed? Single center experience. World J Clin Cases 2020; 8: 3691-6.
15. Martellucci J, Damigella A, Bergamini C, et al. Emergency surgery in the time of Coronavirus: the pandemic effect. Minerva Chir 2020; 10.23736/S0026-4733.20.08545-4.
16. Alp E, Bijl D, Bleichrodt RP, et al. Surgical smoke and infection control. J Hosp Infect 2006; 62: 1–5.
17. Muysoms F, Pawlak M, Reinpold W, et al. European Hernia Society (EHS) guidance for the management of adult patients with a hernia during the COVID-19 pandemic. Hernia 2020; 24: 977-3.
18. Lima DL, Pereira X, Dos Santos DC, Camacho D, Malcher F. Where are the hernias? A paradoxical decrease in emergency hernia surgery during COVID-19 pandemic. Hernia 2020; 24: 1141-2.
19. Stabilini, C, East B, Fortelny R, et al. European Hernia Society (EHS) guidance for the management of adult patients with a hernia during the COVID-19 pandemic. Hernia 2020; 24: 977-3.

HEALTH SCIENCESMEDICINE
Original Article
J Health Sci Med 2021; 4(6): 871-875
This work is licensed under a Creative Commons Attribution 4.0 International License.
DOI: 10.32322/jhsm.975342
Received: 28.07.2021 Accepted: 17.09.2021Corresponding Author: Gülçin Ertaş, [email protected]
Hypofractionated radiotherapy results of patients with malign glioma aged 60 and over
Gülçin Ertaş, Ali Rıza Üçer, Can Azak, Muzaffer Bedri AltundağUniversity of Health Sciences Dr. Abdurrahman Yurtaslan Ankara Oncology Training and Research Hospital, Department of Radiation Oncology, Ankara, Turkey
Cite this article as: Ertaş G, Üçer AR, Azak C, Altundağ MB. Hypofractionated radiotherapy results of patients with malign glioma aged 60 and over. J Health Sci Med 2021; 4(6): 871-875.
ABSTRACTAim: The aim of this study is to examine the treatment results of 25 malign glioma patients, aged >60 who underwent hypofractionated radiotherapy, respectively.Material and Method: Total excision was applied to 14 of the patients, subtotal excision was applied to 5 and biopsy was applied only to 3. Three patients were evaluated as inoperable. Pathological diagnosis is compatible with glioblastoma in 22 patients, gliosarcoma in 2 patients and anaplastic astrocytoma in 1 patient. Hypofractionated radiotherapy was applied to all patients in the dose range 2.66-3.4 Gy x 10-15 fractions. Ten patients were treated concurrent temozolomide with radiotherapy and then 4-6 cures of adjuvant temozolomide. Only concurrent temozolomide treatment was applied to 3 patients, while only adjuvant temozolomide was applied to 4 patients.Results: The median age is 72 years. (min 60–max 86) . The rate of patients with comorbid disease is 44%. The median follow-up period of the patients is 5 months (min 1-max 22). 6-months, 1-year, 18-months overall survival were 47%, 20%, 10%, respectively. Median survival in patients aged >70 is 3 months and 8 months in patients <70 (p=0.025). Median survival is 10 months in patients receiving both concurrent and adjuvant temozolomide treatment, and median survival is 3 months (p=0.007) in patients who do not receive it. Conclusion: Overall survival is statistically better in patients under the age of 70 and patients receiving both concurrent and adjuvant temozolomide therapy with hypofractionated radiotherapy.Keywords: Malignant glioma, hypofractionated dose, chemotherapy, elderly
Ana Metin-Alt bilgi Arası 5mm
Cite-Öz arası 5mm
Başlık-Yazarlar arası 12mmv
Yazar-Kurum arası 2,5 mmvcv
Kurum-Cite arası 5mm
Öz-Abstract arası 7,5mmvc
INTRODUCTIONHigh-grade malignant gliomas are 50% of all brain tumors in adults. Glioblastoma multiforme (WHO grade 4) constitutes 75% of high-grade malignant gliomas, and most of these patients are over 60 years of age (1). The prognosis for patients with glioblastoma is generally poor; age, Karnofsky performance status (KPS), type of surgery are important prognostic factors. Anaplastic gliomas (WHO grade 3, anaplastic astrocytoma, anaplastic oligoastrocytoma, anaplastic oligodendroglioma) constitute approximately 25% of high-grade malignant gliomas in adults. In these patients, besides age, surgical method and KPS, molecular genetic factors are also important in prognosis.The standard treatment approach in patients with high-grade malignant glioma is 60 Gy (2 Gy x 30 fractions) adjuvant radiotherapy (RT) after surgical excision and concomitant temozolomide, followed
by 6 cycles of adjuvant temozolomide.With standard treatment approaches, overall survival in these patients is 16-17 months (2,3).However, this treatment approach may cause problems due to toxic effects, especially in patients over 60 years of age and/or with poor performance status.
Various hypofractionated radiotherapy and chemotherapy approaches have come to the fore in these patients to reduce treatment-related toxicity and shorten the treatment period (4-13). The use of chemotherapy alone in this patient group has also been investigated as another treatment option. (14,15).
The aim of this study is to evaluate the treatment results in patients with malignant glioma aged 60 years and older who received hypofractionated radiotherapy, respectively.

872
Ertaş et al. Hypofractionated radiotherapy in elderly malignant glioma patients J Health Sci Med 2021; 4(6): 871-875
MATERIAL AND METHODThe study was carried out with the permission of University of Health Science Dr. Abdurrahman Yurtaslan Ankara Oncology Training and Researchs Hospital Clinical Research Ethics Committee (Date: 09.06.2021, Decision No: 2021/06-1223). All procedures were carried out in accordance with the ethical rules and the principles of the Declaration of Helsinki.
Patients Twenty-five patients who underwent hypofractionated radiotherapy between February 2012 and December 2020 with the diagnosis of high-grade malignant glioma in our clinic were included in the study. Twenty-two patients had been operated at baseline. The operation type was gross total excision in 14 patients, subtotal excision in 5 patients, and biopsy only in 3 patients. Three patients were initially considered inoperable. Histopathological examination results were consistent with glioblastoma in 22 patients, gliosarcoma in 2 patients, and anaplastic oligoastrocytoma in 1 patient. The most common hypofractionated dose schedule was 2.66 Gy x 15 fractions (15 patients). (Table 1). In addition, 3 Gy x 15 fractions (fx) radiotherapy was applied to 7 patients, 3.4 Gy x 10 fx to 1 patient, 3 Gy x 13 fx to 1 patient, and 3 Gy x 16 fx hypofractionated radiotherapy to 1 patient. Ten patients were treated with temozolomide concomitantly with radiotherapy and then adjuvant 4-6 courses of temozolomide. While 3 patients were treated with only temozolomide concurrently with radiotherapy, only adjuvant temozolomide therapy was applied to 4 patients. Patients were followed up with brain MRI every 3-6 months after radiotherapy.
Statistical AnalysisSPSS version 22 was used for statistical analysis. Kaplan-Meier method was used in the overall survival analysis of the patients. Patient, tumor, and treatment-related variables were evaluated by univariate analysis. p<0.05 was considered statistically significant.
RESULTSTable 2 shows the general characteristics of the patients. Fourteen of the patients were male and 11 were female. The number of patients with comorbid disease was 11 (44%), the most common comorbid disease was hypertension (45%). Comorbid diseases other than hypertension are diabetes mellitus and cerebrovascular disease. A lower lip epidermoid carcinoma was detected in one patient as second primary cancer. The median age of the patients was 72 (min 60-max 86). The average time between operation and RT is 40 days (min 15-max 75).
The median follow-up period is 5 months (min 1-max 22). Overall survival at 6 months, 1 year, and 18 months was 47%, 20%, and 10%, respectively (Figure 1).
In univariate analysis, the median survival was 3 months in patients aged 70 years and older, and 8 months in patients younger than 70 years (p=0.025) (Figure 2). Median survival was 2 months in patients receiving concomitant temozolomide therapy with RT, 1 month in patients receiving only adjuvant temozolomide therapy, and 10 months in patients receiving both concomitant and adjuvant temozolomide therapy (p=0.065). Median survival was 10 months in patients who received both concomitant and adjuvant temozolomide treatment, and 3 months in patients who did not receive it (P=0.007) (Figure 3). In addition, a significant difference was found in the Spearman correlation test between the performance status of the patients and the tolerance of concomitant and adjuvant temozolomide therapy(p=0.05). Median survival was 4 months in patients with a tumor size of 5 cm and above, and 5 months in patients with a tumor size of less than 5 cm, and no statistical difference was found (p=0.36). The median survival was 3 months in patients with an operation-radiotherapy interval of 35 days or more, and 5 months in patients with less than 35 days (p=0.98). The prognostic significance of the IDH mutation could not be evaluated because the number of patients who were examined was insufficient.
Table 2. General characteristics of the patientsNo %
GenderMale 14 56Female 11 44
SurgeryGross total excision 14 56Subtotal excision 5 20Biopsy only 3 12Inoperable 3 12
Comorbid DiseaseYes 11 44No 14 56
Tumor Diameter≥5 cm 9<5 cm 12
Table 1. Radiotherapy and chemotherapy schemes applied to patients
No %Radiotherapy
2.66Gy x 15 fraction 15 603Gy x 15 fraction 7 283Gy x 13 fraction 1 43.4Gy x 10 fraction 1 43Gy x 16 fraction 1 4
ChemotherapyConcomitant 3 12Adjuvant 4 16Concomitant+adjuvant 10 40

873
Ertaş et al. Hypofractionated radiotherapy in elderly malignant glioma patientsJ Health Sci Med 2021; 4(6): 871-875
DISCUSSIONThe standard treatment approach in patients with high-grade malignant glioma is 60 Gy adjuvant radiotherapy and concomitant temozolomide after surgical resection, followed by adjuvant temozolomide therapy. However, shorter-term hypofractionated radiotherapy options have come to the fore due to the difficulties of tolerating and completing standard treatment in patients over 65 years of age and /or with poor performance status.
In Nordic randomized phase 3 study, survival outcomes of 342 patients with glioblastoma who received the standard radiotherapy regimen, temozolomide only, and hypofractionated radiotherapy alone were compared. In this study, it was reported that the survival results were similar compared to standard radiotherapy in the patient groups treated with both temozolomide and hypofractionated radiotherapy. The median survival was shown as 8.3, 7.5 and 6 months, respectively (11).
In the study of Minniti et al. (10), the median overall survival and progression-free survival of patients receiving standard RT (60 Gy) and hypofractionated RT as well as concomitant and adjuvant temozolomide were retrospectively compared. Survival outcomes were similar in both groups (12 and 5.6 months, 12.5 and 6.7 months, respectively). In the study of Kimberly et al. (16), when the survival results of 4498 patients who received standard radiotherapy (93.4%) and hypofractionated radiotherapy (6.6%) were compared, it was reported that the survival results of patients who received standard treatment were better. However, in this study, the fact that chemotherapy and surgical treatment were less applicable due to the higher incidence of comorbid diseases due to the older age of the patients receiving hypofractionated treatment.
In our study, hypofractionated radiotherapy was applied to all patients (2.66-3.4 x10⁻¹⁵ fx) in the dose range, and 10 patients were treated with temozolomide concomitantly with radiotherapy and then adjuvant 4-6 cycles. While 3 patients were treated only with temozolomide concurrently with radiotherapy, only adjuvant temozolomide therapy was applied to 4 patients. The median overall survival of patients is 5 months. However, due to the small number of patients in our study, the inclusion of patients who underwent both biopsy and inoperable in the survival analysis calculation may have caused the analysis to be performed with a heterogeneous group. This should be considered when evaluating the survival analysis results.
In the study of Perry et al. (4), treatment results of 562 patients who received concomitant- adjuvant temozolomide (50%) treatment in addition to hypofractionated radiotherapy (2.66 Gy x 15 fx) and
Figure 1. Overall survival of patients
Figure 2. Survival in patients aged 70 years and older versus under 70 years of age
Figure 3. Survival in patients receiving concomitant and adjuvant temozolomide and patients not taking it

874
Ertaş et al. Hypofractionated radiotherapy in elderly malignant glioma patients J Health Sci Med 2021; 4(6): 871-875
hypofractionated radiotherapy were compared. It was observed that survival results were better in patients who were also treated with temozolomide (median survival 9.3 months-7.6 months). In our study, 40% of the patients who received hypofractionated radiotherapy were administered concomitant and adjuvant temozolomide, and the median survival in these patients was significantly better than the patients who received only adjuvant or only concomitant temozolomide with RT. In addition to the efficacy of the treatment, this may be associated with the better performance status of the patients who can be treated with both concurrent and adjuvant temozolomide treatment compared to the patients who receive only concurrent or only adjuvant temozolomide treatment. While temozolomide treatment was ongoing, treatment-related thrombocytopenia was detected in 2 of the patients, and pulmonary thromboembolism was observed in 1 patient.
In parallel with the type of surgery performed in patients with high-grade malignant glioma, overall and disease-free survival times are prolonged in patients who underwent total excision compared to patients who underwent subtotal excision and biopsy (17,18). In our study, 14 patients underwent total excision, 5 subtotal excision, and 3 patients only biopsy. Gross total excision was performed in most patients. If there is no comorbid disease that will prevent the operation, standard surgical approaches can be applied in elderly patients aged 60 and over, as in younger patients.
One study compared the treatment outcomes of patients who received combined chemoradiotherapy (89.6%) with those who received only radiotherapy (10.4%) in 1479 patients with high-grade malignant glioma who had only undergone biopsy for different reasons. (13). In this study, it was observed that there was a significant survival advantage in the patient group receiving chemoradiotherapy compared to the group receiving only radiotherapy (median 9.2 months-5.6 months). In our study, the number of patients who only underwent biopsy was 3, and only radiotherapy was applied to 1 patient, simultaneous chemotherapy with radiotherapy was applied to 1 patient, and both adjuvant and concurrent chemotherapy was applied to 1 patient. The average survival of these patients is 6 months.
In our study, 3 patients were initially considered to be inoperable and were treated as high-grade malignant glioma according to clinical and radiological findings. In the treatment of these patients, only hypofractionated radiotherapy was applied to 1 patient, and concurrent and adjuvant chemotherapy with RT was applied to 1 patient. In one patient, RT followed by adjuvant temozolomide treatment was given, and the treatment was terminated after the second cycle of temozolomide due to side effects. The average survival of these 3 patients is 6 months.
In patients with high-grade malignant glioma, performance status is an important prognostic factor in addition to age. In our study, the ECOG performance score was at the median level of 2.
CONCLUSIONOverall survival was statistically better in patients receiving both concomitant and adjuvant chemotherapy with hypofractionated radiotherapy. The better performance status of this group of patients facilitated the full administration of both radiotherapy and chemotherapy protocols. In patients under 70 years of age, overall survival is statistically better than the older group.
ETHICAL DECLARATIONSEthics Committee Approval: The study was carried out with the permission of University of Health Science Dr. Abdurrahman Yurtaslan Ankara Oncology Training and Research Hospital Clinical Researchs Ethics Committee (Date: 09.06.2021, Decision No: 2021/06-1223).Informed Consent: Because the study was designed retrospectively, no written informed consent form was obtained from patients.Referee Evaluation Process: Externally peer-reviewed. Conflict of Interest Statement: The authors have no conflicts of interest to declare. Financial Disclosure: The authors declared that this study has received no financial support. Author Contributions: All of the authors declare that they have all participated in the design, execution, and analysis of the paper, and that they have approved the final version.
REFERENCES1. Arvold ND, Reardon D.Treatment options and outcomes for
glioblastoma in the elderly patients. Clin Interv Aging 2014; 9: 357-67
2. Stupp R ME, Hegi WP. Mason et al. Effects of raditherapy with concomitant adjuvan temozolomide versus radiotherapy alone on survival in glioblastoma in a randomised phase III study: 5-year analysis of the EORTC-NCIC trial. Lancet Oncol 2009; 10: 459-66
3. Scoccianti S, Magrini SM, Ricardi U, et al. Patterns of care and survival in a retrospective analysis of 1059 patients with glioblastoma multiforme treated between 2002 and 2007: a multicenter study by the Central Nervous System Study Group of Airo( italian Association of Radiation Oncology). Neurosurgery 2010; 67: 446-58
4. Perry JR, Laperrier NO, Callaghan CJ, et al. Short–course Radiation plus temozolomide in elderly patients with glioblastoma. N Engl J Med 2017; 376,: 1027-37.
5. Glaser SM, Dohopolski MJ, Balasubramani GK, et al. Glioblastoma multiforme (GBM) in the elderly: initial treatment strategy and overall survival. J Neurooncol 2017; 134: 107-18.
6. Kim H, Leiby BE, Shi W, et al .Too little, too soon: short course radiotherapy in elderly patients with glioblastoma. J Clin Oncol 2016; 34: 2191-2.

875
Ertaş et al. Hypofractionated radiotherapy in elderly malignant glioma patientsJ Health Sci Med 2021; 4(6): 871-875
7. Cao JQ, Fisher BJ, Bauman GS, et al. Hypofractioneted radiotherapy with or without concurrent temozolomide in elderly patients with glioblastoma multiforme a review of ten- years ingle instutitional experience. J Neurooncol 2012; 107: 395-405.
8. Nguyen LT, Touch S, Nehme–Schuster H, et al. Outcomes in newly diagnosed elderly glioblastoma patients after concomitant temozolomide administration and hypofractioneted radiotherapy. Cancers (Basel) 2013; 5: 1177-98.
9. Reyngold M, Lassman AB, Chan TA, et al. Abbreviated course of radiation therapy with concurrent temozolomide with high grade glioma in patients of advanced age or poor functional status.J. Neuro Oncol.2012; 110: 369-74.
10. Minniti G, Scaringi C, Gaetano L, et al. Standard (60 Gy) or short–course (40 Gy) irradiation plus concomitant and adjuvant temozolomide for elderly patients with glioblastoma: a propensity match analysis. Int J Radiat Oncol Biol Phys 2015; 1; 91: 109-15.
11. Malmstrom A, Gronberg BH, Marosi C, et al. Temozolomide versus standard 6-week radiotherapy versus hypofractionated radiotherapy in patients older than 60 years with glioblastoma: the Nordic randomised , phase 3 trial. Lancet Oncol 2012; 13: 916-26.
12. Muni R, Minniti G, Lanzetta G, et al. Short–term radiotherapy followed by adjuvant chemotherapy in poor-prognosis patients with glioblastoma.Tumori 2010; 96: 60-4.
13. Kole AJ, Park HS, Neboa DY, et al. Concurrent chemoradiotherapy versus radiotherapy alone for ‘biopsy-only’ glioblastoma multiforme. Cancer 2016; 122: 2364-70.
14. Laigle-Donadey F, Figarella-Branger D, Chinot O, et al. Upfront temozolomide in elderly patients with glioblastoma. J Neurooncol 2010; 99: 89-94.
15. Gallego Perez-Larraya J, Ducray F, Chinot O, et al. Temozolomide in elderly patients with newly diagnosed glioblastoma and poor performance status: an ANOCEF phase II TRIAL. J Clin Oncol 2011; 29: 3050-5.
16. Mak KS, Ankit A, Qureshi MM, et al. Hypofractionated short-course radiotherapy in elderly patients with glioblastoma multiforme: an analysis of the National Cancer Database: Cancer Med 2017; 6: 1192-200.
17. Oszvald A, Guresir E, Setzer M, et al. Glioblastoma therapy in the elderly and the importance of the extent of resection regardless of age. J Neurosurg 2012; 116: 357-64.
18. McGirt MJ, Chaichana KL, Gathinji M, et al. Independent association of extent of resection with survival in patients with malignant brain astrocytoma. J Neurosurg 2009; 110: 156-62.

HEALTH SCIENCESMEDICINE
Original Article
J Health Sci Med 2021; 4(6): 876-881
This work is licensed under a Creative Commons Attribution 4.0 International License.
DOI: 10.32322/jhsm.975669
Received: 28.07.2021 Accepted: 25.08.2021Corresponding Author: Hatice Harmancı, [email protected]
Pain catastrophizing in migraine patients and associated factors
Hatice Harmancı1, Birsel Kul21KTO Karatay University, Faculty of Social Sciences and Humanities, Department of Psychology, Konya, Turkey2Kastamonu Physical Therapy and Rehabilitation Center, Department of Neurology, Kastamonu, Turkey
Cite this article as: Harmancı H, Kul B. Pain catastrophizing in migraine patients and associated factors. J Health Sci Med 2021; 4(6): 876-881.
ABSTRACTAim: We carried out this study to examine the level of pain catastrophizing (PC) among migraine patients and factors possibly affecting PC. Material and Method: The sample of this study comprised 120 patients who applied to the neurology clinic of a state hospital and were diagnosed with migraine by the International Headache Society’s (IHS) criteria between April 2017 – March 2019. Then, we collected the data from those meeting the inclusion criteria using a socio-demographic information form, the Pain Catastrophizing Scale (PCS), and the Barrat Impulsiveness Scale Short Form (BIS-11-SF). Data analysis was performed on the SPSS 25.0 statistics software. To explore the relationships between the variables, we ran one-way ANOVA and multiple regression analyses and calculated Pearson’s correlation coefficients. Results: We divided the participants into three groups: Group 1 included 30 patients who got full benefit from the treatment during a migraine attack (25%); Group 2 included 25 patients who were unable to obtain any benefit from the treatment at all (20.8%); Group 3 included 65 patients with partial benefit from the treatment (54.17%). The PCS scores were higher in Group 1 and Group 3, while Group 2 had significantly higher PCS total and Rumination scores than Group 1. The number of attacks and impulsiveness levels of the patients explained 18.6% of the variance in PC. Conclusion: The cognitive capacity of individuals is essential in identifying the prognosis of migraine. Catastrophizing pain is likely to lower treatment response in migraine patients. Besides, the increased number of attacks and impulsiveness levels of patients influence their PC levels. Finally, migraine is a disorder with a psychiatric aspect; therefore, performing appropriate mental evaluations and offering necessary psychiatric support may enhance the chance of success in migraine treatment.
Keywords: Migraine, pain catastrophizing, clinical aspects, impulsiveness
Ana Metin-Alt bilgi Arası 5mm
Cite-Öz arası 5mm
Başlık-Yazarlar arası 12mm
Yazar-Kurum arası 2,5 mm
Kurum-Cite arası 5mm
Öz-Abstract arası 7,5mmv
INTRODUCTIONThe International Headache Society (IHS) defines migraine as a type of primary headache. While migraine prevalence varies by society, it is estimated between 12.1-16.4% worldwide and more common among females (1,2). In migraine, a headache occurs in attacks, settles on one side, has a throbbing effect, and can continue for up to 72 hours. The pain can be accompanied by some neurologic, autonomic, and gastrointestinal system symptoms (3). The severity of clinical symptoms generally follows a mild to severe course. Headache and other accompanying symptoms adversely impact quality of life among individuals. According to the Global Disease Burden study, migraine ranks the seventh among all diseases that cause disability and the first among neurological disorders (4,5).
The primary symptom affecting the functionality of migraine patients is a headache. The perception of pain depends on bio-psycho-social factors, which determine the prognosis of the disease (6). In parallel with the pain, the concept of pain catastrophizing (PC), which is defined as having negative cognition and emotions about pain, is indicated as a risk in chronicization of migraine symptoms (7). People catastrophizing pain are trapped in constant pain and thoughts about pain. They cannot end their exaggerated negative thinking about pain and believe they have nothing to do to perish the pain (8). Previously, the presence of PC in migraine patients was found to be correlated with the increased number of and prolonged attacks, reduced treatment response, increased number of medical consultations, and impaired quality of life (9,10).

877
Harmancı et al. Pain catastrophizing in migraine patients J Health Sci Med 2021; 4(6): 876-881
According to Goli et al. (11) PC contributes to developing depressive and anxious symptoms in migraine patients. Many studies suggested that PC adversely affects clinic outcomes in migraine; however, few attempted to examine how or why PC occurs.
The research foci are often on the impacts of the psychiatric aspects of migraine and accompanying mental complaints on its prognosis. Substantial evidence showed that the most common accompanying psychiatric disorders to migraine are depression and anxiety disorder (12,13). Moreover, some studies demonstrated that migraine patients have cognitive impairments (14) and more frequently experience negative affections such as embarrassment, anger, and guilt (15). The research exploring the personality traits of migraine patients reports that neurotic and impulsive traits are more common and adversely affect the prognosis of the disorder (16,17). On the other hand, impulsiveness is a thought or behavior pattern that one may externalize without anticipating its outcomes, often leading them into an undesirable situation. It is not solely an indicator of pathology but is shown as a reason for developing many psychopathologies (18). Accordingly, the relevant literature previously suggested that impulsiveness could be a variable influencing PC. Yet, no study has attempted to investigate the relationship between PC in migraine patients and impulsiveness
Ultimately, we carried out the study with migraine patients having obtained benefits from relevant treatment at varying degrees. The main purpose of the study was to examine PC and impulsiveness levels in migraine patients. We also sought answers to how clinical aspects of migraine and impulsiveness affect PC. As it causes chronicization of migraine, understanding the underlying reasons for PC occurrence and development and, thus, creating an appropriate treatment plan will likely increase treatment success.
MATERIAL AND METHOD The sample of the present research, which was a cross-sectional and descriptive study, comprised the patients who applied to the neurology clinic of a state hospital and were diagnosed with migraine based on the IHS criteria between April 2017-March 2019. KTO Karatay University, Non- Pharmaceutical and Non-Medical Device Studies Ethics Committee granted the relevant approval to our study (Date: 30.03.2017, Decision No: 2017/002). All procedures were carried out in accordance with the ethical rules and the principles of the Declaration of Helsinki. We carried out the study with only voluntary individuals diagnosed with migraine and aged between 18-65. Yet, we had to exclude those who had a psychiatric history, had a different, pain-related physical disorder, and had a physical or mental disorder adversely influencing filling out a questionnaire
form. Moreover, we did not consider the data of those leaving their forms missing. Eventually, we recruited a total of 120 patients with ongoing polyclinic follow-ups. All of the patients were on prophylactic migraine treatment and received additional treatments in times of attacks. We grouped the participants into three groups depending on their responses to the therapies: Group 1 included those whose complaints were entirely relieved in an attack period, while Group 2 was composed of those without recovering at all and with continuing persistent pains. Finally, Group 3 comprised the patients whose complaints were partially relieved. We informed the participants about the study, obtained their consent to participate in the study, and asked them to fill out a questionnaire booklet covering a socio-demographic information form, the Pain Catastrophizing Scale (PCS), and the Barrat Impulsiveness Scale Short Form (BIS-11-SF).
Socio-demographic Information Form: We prepared the form to include open-ended questions to the participants about their age, educational attainment, occupation, marital status, clinical aspects of migraine attacks, general health condition, and family history.
Pain Catastrophizing Scale (PCS): Sullivan et al. (19) developed the scale to identify the catastrophizing levels of individuals with pain symptoms. The self-report instrument is a Likert-type 13-item scale with three subscales: Rumination, Magnification, and Helplessness. Ugurlu et al. (20) carried out its Turkish validity and reliability study. In their study, the reliability of the Turkish version of the scale ranged between 0.73-0.93. Also, the researchers calculated its Cronbach’s alpha value to be 0.95 and the internal consistency coefficient to be 0.83. Analyses pertinent to construct validity and internal consistency of the scale suggested that the scale is a valid and reliable data collection tool in the Turkish context.
Barrat Impulsiveness Scale Short Form (BIS-11- KF): The scale developed to measure individuals’ impulsiveness levels was revised by Patton et al. (21). The Likert-type instrument is based on self-report and has 30 items within three subscales: Non-planning Impulsiveness, Motor Impulsiveness, and Attentional Impulsiveness. Tamam et al. (22) adapted the scale into Turkish and found Cronbach’s alpha values to range between 0.64-0.82 and high internal consistency coefficient. Analyses pertinent to construct validity and internal consistency of the scale suggested that the scale is a valid and reliable data collection tool in the Turkish context.
Statistical Analysis We analyzed the data using Statistical Package for Social Sciences (SPSS) for Windows 25.0 (SPSS Inc., Chicago, II, USA). In the study, we utilized parametric analyses since Skewness and Kurtosis values revealed the data to show a

878
Harmancı et al. Pain catastrophizing in migraine patientsJ Health Sci Med 2021; 4(6): 876-881
normal distribution. Then, we ran a one-way ANOVA to compare the scores of the groups on the scales. Next, we calculated Pearson’s correlation coefficients to uncover the relationship between the variables. Finally, we performed a multiple regression analysis to determine the predictive value of pain catastrophizing. Multicollinearity assumption was detected to be met considering Durbin Watson, Tolerance, and VIF values. In all statistical analyses, we accepted p<0.05 to be statistically significant.
RESULTSWe carried out the study with a total of eligible 120 patients diagnosed with migraine and divided them into three groups: Group 1 included 30 patients who got full benefit from the treatment during a migraine attack (25%); Group 2 included 25 patients who were unable to obtain any benefit from the treatment at all (20.8%); Group 3 included 65 patients with partial benefit from the treatment (54.17%). The results revealed that sex (p=.597), educational attainment (p=.293), age (p=.392), accompanying aura (p=.673), number of attacks (p=.225), disease duration (p=.673) did not have an impact on treatment response. In this study, the only variable causing a difference in treatment response was marital status; the results of the Tukey test suggested that married and single individuals did not differ by treatment response, while divorced patients had significantly worse responses to the treatment (p=.028). At the same time, we could not find any significant differences between married and divorced patients (p=.233). Evaluating the patients in 3 groups based on their treatment responses allowed us to explore possible variables that might influence PC and impulsiveness. The descriptive characteristics of the patients are outlined in Table 1.
On the other hand, we determined that the patients in Group 2 catastrophized pain more. In this group, the mean PCS total score was 28.44±13.79, while the participants obtained a mean score of 12.72±6.15 on the Rumination subscale, 6.36±3.32 on the Magnification subscale, and 9.36±5.41 on the Rumination subscale. The patients in
Group 1 had the PCS total and subscale scores, while their PCS total and Rumination scores were significantly lower than those of Group 2 (p=.030 and p=.003, respectively). We could not reach significant differences in the scores of Group 3. When it comes to the BIS-11-SF, Group 2 had the highest scores, while other groups did not show any significant difference in their scores. Yet, there was a significant difference between Group 2 and Group 1 by Non-planning scores (Group 2: 27.64±9.22; Group 1: 22.90±5.89; p=.035). Table 2 present the scores of the groups on the scales.
We then analyzed the variables that might be associated with PC and impulsiveness. Accordingly, we found out that the mean BIS-11-SF total score (number of attacks (r=.351) and impulsiveness level (r=.256)) was positively correlated with PC. Nevertheless, there was no significant relationship between the number of attacks and disease duration and impulsiveness. Table 3 presents the correlation table.
Table 1. Demographic data of patients and clinical features of migraine
Group 1 (n=30)
Group 2 (n=25)
Group 3 (n=65)
Age 39±8.31 32.24±11.42 36.06 ±11.35Sex
Female 28 20 57Male 2 5 8
Marital StatusSingle 5 9 18Married 25 16 47
EducationUneducated 1 0 0Primary education 14 19 32High school 9 9 20University 6 6 13
AuraYes 2 2 6No 28 23 59
Disease duration (year) 12.33±10.19 7.96±8.25 11.12±8.36
Number of attacks (in a year) 4.67±3.75 8.64±3.86 6.57±4.09
Table 2. PCS and BIS–11–SF scale scores of the patientsGroup 1 (1) (n= 30) Group 2 (2) (n= 25) Group 3 (3) (n= 65) p F
PCSTotal 19.03±14.09 28.44±13.79 23.2±13.06 p (1-2); .030* 3.32Helplessness 9.27±7.04 12.72±6.15 10.69±6.16 .140 1.99Magnification 4.70±3.43 6.36±3.32 4.74±3.57 .118 2.18Rumination 5.23±4.38 9.36±5.41 7.51±4.32 p (1-2); .003* 5.65
BIS – 11 – SFTotal 49.70±12.31 57.84±14.85 53.83±11.92 .063 2.83Attentional imp. 10.50±3.32 10.48±2.37 11.34±3.34 .345 1.07Motor imp. 15.97±4.84 18.64±5.1 17.29±4.1 .095 2.41Non-planning imp. 22.90±5.89 27.64±9.22 24.60±6.4 p (1-2); .035* 3.23
p<.05; * Tukey HSD, BIS-11-SF; Barrat Impulsiveness Scale Short Form, imp.; impulsiveness, PCS; Pain Catastrophizing Scale.

879
Harmancı et al. Pain catastrophizing in migraine patients J Health Sci Med 2021; 4(6): 876-881
Finally, we performed a multiple regression analysis to explore the predictive values of impulsiveness, demographic variables, and clinical aspects on PC. In this context, we first sought to satisfy the multicollinearity assumption of the analysis. Accordingly, we computed the Durbin-Watson value to be 2.104 and the corrected R2 value to be 0.186, which indicated no multicollinearity in the model. The results of the multiple regression analysis uncovered that sex, educational attainment, aura, number of attacks, disease duration, and impulsiveness were the factors predicting PC. However, we discovered that sex, educational attainment, aura, and disease duration did not have a significant contribution to the variance, while the number of attacks and impulsiveness explained 18.6% of the variance in PC. In other words, a change of 1 unit in the number of attacks caused a change of 01.9 points in the PCS total score, while a change of 1 unit in the BIS-11-SF total score caused a change of 0.37 points on the PCS. The regression model is demonstrated in Table 4.
DISCUSSIONWe concluded that the level of treatment response changed with varying modes of perception of pain in migraine patients. Accordingly, the patients who did not respond to treatment at all catastrophized their pains more and had more negative ruminative thoughts about pain. Besides, two important factors leading the patients to catastrophize their pains were found to be impulsiveness level and the number of attacks.
Despite available research, there are still areas in the dark about the etiology and treatment of migraine. Differentiations in treatment types and responses are believed to be linked with such uncertainty. Studies on the factors causing migraine to become chronic yielded different results, which might be attributed to the study location, patients’ characteristics, and methodological issues. Wiendels et al. (23) demonstrated that sex does not influence treatment response, while Scher et al. (24) reported that female sex is a risk factor for the chronicization of headache. In addition, Seferoğlu (25) demonstrated that age and sex do not alter the clinic course of migraine, yet individuals with lower educational attainment experience elevated chronicization. Many studies determined that being married enhances adherence to therapy and treatment success (26,27). In this study, among the demographic variables, we found only being divorced to be a factor to deteriorate treatment. Divorce is a process that requires adaptation to a changing situation, which may be challenging to maintain mental health. Therefore, being divorced may be a variable that can trigger headaches and make it harder to respond to the treatment. From this perspective, the results of our study seem to be in parallel to the literature.
Pain catastrophizing is a cognitive error that disrupts patients’ pain perception and clinic progress in pain (28). According to Shim et al. (29) those with poor ability to recognize and express their emotions tend to catastrophize their headache. Bond et al. (9) asserted that an increased number of and prolonged attacks and higher pain sensitivity increase PC level in migraine. Gil-Martinez et al. (30) determined that PC intensifies pain in chronic migraine patients and that individuals with disrupted functionality due to pain are likely to catastrophize it more. Alvarez-Astorga et al. (31) reported that the presence of PC increases the severity of a headache and facilitates the occurrence of mental complaints such as depression and anxiety. Ultimately, previous research suggests that migraine and PC have a reciprocal relationship where PC is a factor that disrupts the clinic course of migraine. In parallel to the literature, we found that PC levels were higher in the patient group with worse treatment response, and this group significantly differed from the group fully responding to the treatment. In disorders characterized by persistent pain, like migraine, individuals can have a negative cognition about pain, which may worsen the pain, ruin treatment response, and, thus, lead the patients to catastrophize pain more.
The relationship between migraine and PC is highly scrutinized in the literature. Yet, studies are limited on the reasons for PC occurrence. Some studies claim
Tablo 3. The relationship between the number of attacks and the duration of the disease with pain catastrophizing and impulsivity
1 2 3 4PCS total (1) 1BIS-11-SF total (2) .351** 1Number of attacks (3) .256** .097 1Disease duration (4) .170 -.009 .070 1*p< .05, **p< .01, BIS-11-SF; Barrat Impulsiveness Scale Short Form, PCS; Pain Catastrophizing Scale.
Table 4. Multiple regression: factors affecting catastrophizing painModel 1
B S.E. βSex 2.272 3.649 .055Education -2.132 1.099 -.186BIS – 11 – SF .398 .093 .373**Aura 1.046 4.377 .021Number of attacks .647 .295 .189**Disease duration .184 .136 .119R .476R2 .227Adj.R2 .186R2 change .227*p<.05, **p<.01, BIS-11-SF; Barrat Impulsiveness Scale Short Form, Adj.R2; Adjusted R2

880
Harmancı et al. Pain catastrophizing in migraine patientsJ Health Sci Med 2021; 4(6): 876-881
that the primary issue in catastrophizing pain is about attention. The inability to distract the focus away from pain may aggregate pain perception and sensitivity to pain (32). According to Borsook et al. (33) the structural and functional changes led by migraine may cause PC. In brain imaging procedures in migraine patients, individuals catastrophizing pain have diminished gray substance under the somatosensory cortex, medial and dorsolateral prefrontal cortex, medial temporal cortex, and frontal cortex (34,35). Mathur et al. (36) demonstrated that insula activity is often distinctively impaired in migraine patients with PC. As imaging procedures are not longitudinal, the question of whether PC occurs because of the structural impairments in the brain or structural-functional impairments remains unanswered. A noteworthy finding of our study was that two variables predicted PC occurrence at the rate of 18.6%: the number of attacks and impulsiveness. The literature hosts some studies on the number of attacks and PC levels among patients (9,37); nevertheless, these studies did not address the impact of the number of attacks on PC. An increased number of attacks may cause individuals to be subject to more pain, foster negative opinions about pain, and adversely affect quality of life. Increasing unpleasant thoughts about pain can also disrupt the pain perception and lead to pain catastrophizing. Again, we did not encounter any study exploring the impacts of impulsiveness on PC in migraine patients
Studies that examined impulsiveness in migraine patients yielded varying results. While some reported migraine patients are more impulsive (38), others suggested impulsiveness along with pain is less common (3). According to Sanchez et al. (40) what determines impulsiveness in migraine patients is the pain becoming chronic. Prolonged pain deteriorates quality of life and represses personality traits, such as novelty seeking, pleasure, and impulsiveness in people. In this study, the impulsiveness scores of the patients did not differ significantly, but only Group 2 had significantly higher scores on the Non-planning Impulsiveness subscale. The regression analysis identified impulsiveness as a factor affecting PC, which may be explained by the desire to get rid of the pain in the shortest time possible and the inability to tolerate migraine pain.
CONCLUSIONPain management is essential in identifying treatment responses in migraine patients. Migraine patients showing non-response to the treatment during pain attacks are likely to catastrophize their pain more. Besides, the number of attacks and impulsiveness affect PC in migraine patients. Identifying factors that might alter pain perception and lead to PC may be
critical for managing migraine. Therefore, psychiatric examinations in addition to neurological treatments, as well as additional pharmacologic or psychotherapeutic treatments, will facilitate pain management and improve quality of life among patients.
ETHICAL DECLARATIONSEthics Committee Approval: The study was carried out following the principles of the Helsinki Declaration and with the approval of the KTO Karatay University Non-Pharmaceutical and Non-Medical Device Studies Ethics Committee (Date: 30.03.2017, Decision No: 2017/002).Informed Consent: Verbal and written informed consent was obtained from all participated in this study.Referee Evaluation Process: Externally peer-reviewed.Conflict of Interest Statement: The authors have no conflicts of interest to declare.Financial Disclosure: The authors declared that this study has received no financial support.Author Contributions: All authors declare that they have all participated in the design, execution, and analysis of the paper and that they have approved the final version.
REFERENCES1. Lipton RB, Stewart WF, Diamond S, Diamond ML, Reed M.
Prevalence and burden of migraine in the United States: Data from the American Migraine Study II. Headache 2001; 41: 646-57.
2. Ertaş M, Baykan B, Kocasoy OE, et al. One-year prevalence and the impact of migraine and tension-type headache in Turkey: A nationwide home-based study in adults. J Headache Pain 2012; 13: 147-57.
3. Olesen J. The International Classification of Headache Disorders, 3rd edition (beta version). Cephalagia 2013; 33: 629-808.
4. GBD 2015 Disease and Injury Incidence and Prevalence Collaborators. Global, regional and national incidence, prevalence, and years lived with disability for 310 diseases and injuries, 1990-2015: A systematic analysis fort he Global Burden of Disease Study 2015. Lancet 2016; 388: 1545-602.
5. GBD 2015 DALYs and HALE Collaborators. Global, regional and national disability-adjusted life-years (DALYs) for 315 diseases and injuries and healty life expectancy (HALE), 1990-2015: A systematic analysis fort he Global Burden of Disease Study 2015. Lancet 2016; 388: 1603-58.
6. George SZ, Wallace MR, Wright TW, et al. Evidence for a biopsychosocial influence on shoulder pain: Pain catastrophizing and catechol-O-methyltransferase (COMT) diplotype predict clinical pain ratings. Pain 2008; 136: 53-61.
7. Barral E, Buonanotte F. Pain catastrophizing and medication overuse in patients with chronic migraine. Rev Neurol 2020; 70: 282-6.
8. Sullivan MJ, Thorn B, Haythornthwaite JA, et al. Theoretical perspectives on the relation between catastrophizing and pain. Clin J Pain 2001; 17: 52-64.
9. Bond DS, Buse DC, Lipton RB, et al. Clinical pain catastrophizing in women with migraine and obesity. Headache 2015; 55: 923-33.
10. Radat F, Lanteri-Minet M, Nachit-Ouinekh F, et al. The GRIM2005 study of migraine consultation in France. III: Psychological features of subjects with migraine. Cephalalgia 2009; 29: 338-50.

881
Harmancı et al. Pain catastrophizing in migraine patients J Health Sci Med 2021; 4(6): 876-881
11. Goli Z, Asghari A, Moradi A. Effects of mood ınduction on the pain responses in patients with migraine and the role of pain catastrophizing. Clin. Psychol. Psychother 2016; 23: 66-76.
12. Corallo F, De Cola MC, Lo Buonu V, et al. Assessment of anxiety, depressive disorders and pain intensity in migraine and tension headache patients. Acta Medica Mediterranea 2015; 31: 615-20.
13. Polat S, Hocaoğlu Ç. Psychiatric aspects of migraine type headache. Klinik Tıp Bilimleri Derg 2018; 6: 19-23.
14. Lo Buono V, Bonanno L, Corallo F, et al. Cognitive functions and psychological symptoms in migraine: a study on patients with and without aura. Int J Neurosci 2019; 129: 588-92.
15. Kaya E, Akan O. Assessment of anger, depression symptoms, offence-related shame and guilt levels in women patients with migraine. Dusunen Adam The Journal of Psychiatry and Nuerological Sciences 2020; 33: 358-65.
16. Aguirre J, Gallardo R, Pareja JA, Miranda MP. Cluster of MMPI personality profiles in chronic tension-type headache and predictable response to fluoxetine. Cephalalgia 2000; 20: 51-6.
17. Arruda MA, Guidetti V, Galli F, Albuquerque RCAP, Bigal AM. Migraine, tension-type headache, and attentipn-deficit/hyperactivity disorder in childhood: A population-based study. Postgraduate Medicine 2010; 122: 18-26.
18. Moeller FG, Barrat ES, Dougherty DM, Schmitz JM, Swann AC. Psychiatric aspects of impulsivity. Am J Psychiatry 2001; 158: 1783-93.
19. Sullivan MJ, Bishop SR, Pivik J. The pain catastrophizing scale: development and validation. Psychol Assess 1995; 7: 524–32.
20. Uğurlu M, Uğurlu GK, Erten S, Çayköylü A. Validity of Turkish form of Pain Catastrophizing Scale and modeling of the relationship between pain-related disability with pain intensity, cognitive, and emotional factors. Psychiatry Clin Psychopharmacol 2017; 27: 189-96.
21. Patton JH, Stanford MS, Barratt ES. Factor structure of the Barratt impulsiveness scale. J Clin Psychol 1995; 51: 768-74.
22. Tamam L, Güleç H, Karataş G. Short form of Barratt ımpulsiveness scale (BIS-11-SF) Turkish adaptation study. Noro Psikiyatr Ars 2013; 50: 130-4.
23. Wiendels NJ, Knuistingh NA, Rosendael FR, et al. Chronic frequent headache in the general population: Prevalenceand associated factors. Cephalalgia 2006; 26: 1434-42.
24. Scher AL, Midgette LA, Lipton RB. Risk Factors for headache chronification. Headache 2008; 48: 16-25.
25. Seferoglu M. Risk factors in progression and chronicity of episodic migraine: A 1-year prospective clinical interview-based study. phD Thesis. Uludag University Faculty of Medicine, Department of Neurology, Bursa; 2010.
26. Scher AL, Stewart WF, Ricci JA, Lipton RB. Factors associated with the onset and remission of chronic Daily headache in a population-based study. Pain 2003; 106: 81-9.
27. Bigal ME, Rapoport AM, Sheftell FD, Tepper SJ, Lipton RB. Transformed migraine and medication overuse in a tertiary headache centre- -clinical characteristics and treatment outcomes. Cephalalgia 2004; 24: 483-90.
28. Harmancı H, Horasanlı JE. Pain catastrophizing in patients with primary dysmenorrhea: Its relationship with temperament traits and impulsivity. Ann Clin Anal Med 2021 July. doi: 10.4328/ACAM.20669
29. Shim AJ, Park A, Park SP. The relationship between alexithymia and headache impact: the role of somatization and pain catastrophizing. Qual Life Res 2018; 27: 2283-94.
30. Gil-Martínez A, Navarro-Fernández G, Mangas-Guijarro MÁ, et al. Comparison Between Chronic Migraine and Temporomandibular Disorders in Pain-Related Disability and Fear-Avoidance Behaviors. Pain Med 2017; 18: 2214-23.
31. Alvarez-Astorga A, García-Azorín D, Hernández M, et al. Pain catastrophizing in a population of patients with migraine. Neurologia 2021; 36: 24-8.
32. Goubert L, Crombez G, Van DS. The role of neuroticism, pain catastrophizing and pain-related fear in vigilance to pain: a structural equations approach. Pain 2004; 107: 234-41.
33. Borsook D, Maleki N, Becerra L, McEwen B. Understanding migraine through the lens of maladaptive stress responses: a model disease of allostatic load. Neuron 2012; 73: 219-34.
34. Hubbard CS, Khan SA, Keaser ML, Mathur VA, Goyal M, Seminowicz DA. Altered brain structure and function correlate with disease severity and pain catastrophizing in migraine patients. eNeuro 2014; 1: e20.14.
35. Galambos A, Szabó E, Nagy Z, et al. A systematic review of structural and functional MRI studies on pain catastrophizing. J Pain Res 2019; 12: 1155-78.
36. Mathur VA, Moayedi M, Keaser ML, et al. High frequency migraine is associated with lower acute pain sensitivity and abnormal ınsula activity related to migraine pain intensity, attack frequency, and pain catastrophizing. Front Hum Neurosci 2016; 10: 1-16.
37. Holroyd KA, Drew JB, Cottrell CK, Romanek KA, Heh V. Impaired functioning and quality of life in severe migraine: the role of catastrophizing and associated symptoms. Cephalalgia 2007; 27: 1156-65.
38. Nylander PO, Schlette P, Brändström S, et al. Migraine: temperament and character. Psychiatry Res 1996; 30: 359-68.
39. Celik DB, Akar H, Idiman F. Anger styles, temperament and character traits of migraine headache patients. J Clin Psy 2010; 13: 23-35.
40. Sánchez-Román S, Téllez-Zenteno JF, Zermeño-Phols F, et al. Personality in patients with migraine evaluated with the ‘Temperament and Character Inventory’. J Headache Pain 2007; 8: 94-104.

HEALTH SCIENCESMEDICINE
Original Article
J Health Sci Med 2021; 4(6): 882-885
This work is licensed under a Creative Commons Attribution 4.0 International License.
DOI: 10.32322/jhsm.975852
Received: 29.07.2021 Accepted: 13.08.2021Corresponding Author: Erol Öten, [email protected]
The effect of body mass index on osteoporosis and fracture risk in patients with type 2 diabetes mellitus
Erol Öten1, Mustafa Çapraz21Amasya University, Faculty of Medicine, Department of Physical Medicine and Rehabilitation, Amasya, Turkey 2Amasya University, Faculty of Medicine, Department of Internal Medicine, Amasya, Turkey
Cite this article as: Öten E, Çapraz M. The effect of body mass index on osteoporosis and fracture risk in patients with type 2 diabetes mellitus. J Health Sci Med 2021; 4(6): 882-885.
ABSTRACTAim: Type 2 diabetes mellitus (DM), osteoporosis and obesity are increasingly common diseases due to the increase in the elderly population and the change in eating habits. However, the relationship between diabetes, obesity and osteoporosis has not been fully clarified in studies in the literature. In our study, it was investigated whether the combination of diabetes and obesity caused osteoporosis and increased fracture risk. Material and Method: Our study was carried out with a total of 95 patients between the ages of 40 and 80, including 24 males and 71 females, who were tested due to the preliminary diagnosis of osteoporosis and diagnosed with type 2 DM in the physical medicine and rehabilitation outpatient clinic. The demographic characteristics, body mass index (BMI), bone mineral density (BMD) measurements, X-ray imaging, and fracture risk assessment scale (FRAX) calculations of patients were performed. Groups were compared in terms of BMD and FRAX according to the BMI classification. Results: BMD and FRAX hip values were higher in the obese group according to the BMI classification compared to the pre-obese/normal group (p<0.05). In the obese group, the number of patients with a history of low-energy fractures and with identified fractures on X-ray scanning was higher compared to the pre-obese/normal group; however, there was no significant relationship between the groups (p>0.05).Conclusion: As a result of our study, it was observed that type 2 DM and obesity were associated with increased fracture risk despite high BMD values.
Keywords: Bone mineral density, osteoporosis, obesity, type 2 diabetes mellitus
Ana Metin-Alt bilgi Arası 5mm
Cite-Öz arası 5mm
Başlık-Yazarlar arası 12mm
Yazar-Kurum arası 2,5 mmvv
Kurum-Cite arası 5mm
Öz-Abstract arası 7,5mm
INTRODUCTIONType 2 diabetes mellitus (DM) is an increasingly widespread metabolic disease that is significantly associated with morbidity and mortality (1). Type 2 DM is characterized by hyperglycemia caused by defects in insulin secretion, efficacy, or both (2). As a result of chronic hyperglycemia and insufficient glycemic control, diabetic complications, including macrovascular (acute coronary syndrome, stroke, claudication intermittence) and microvascular (retinopathy, neuropathy, nephropathy) diseases occur (3).
In addition to macro or microvascular long-term complications, patients with type 2 DM may develop various skeletal system disorders, including osteoporosis and fractures (4). Osteoporosis is the most important metabolic bone disease that develops in type 2 DM patients (4, 5). Patients with type 2 DM show an increased
risk of fractures due to impaired bone quality (6). Obesity is the most important risk factor for type 2 DM (7). Obesity, which is common in type 2 DM, has been found to be associated with high bone mineral density (BMD) (8). However, in some studies, BMD was observed to be low (9) or normal in patients with type 2 DM despite high body weight (10, 11).
Therefore, there is no clear conclusion about the relationship between type 2 DM patients and BMI and BMD in the literature. In this study, it is aimed to investigate whether BMI has a positive or negative effect on vertebral-hip bone mineral density and fragility of bone in patients with type 2 DM and to draw attention to the mutual potential interactions of these common diseases.

883
Öten et al. Body mass index, osteoporosis and fracture risk in type 2 diabetes mellitus patients J Health Sci Med 2021; 4(6): 882-885
MATERIAL AND METHODUsing the hospital automation system, patient data to be used in our study were obtained within the scope of patient information security. In this retrospective study, a total of 95 patients between the ages of 40 and 80 who were diagnosed with type 2 DM and whose BMD values were measured, who applied to the Physical Medicine and Rehabilitation outpatient clinic of Amasya University Hospital between October 2019 and February 2020, were included. The demographic characteristics of the patients are shown in Table 1. Patients who have previously received or were receiving osteoporosis treatment were not included in our study. Ethics committee approval for the study was received from the Amasya University Non-interventional Clinical Researchs Ethics Committee (Date: 03.09.2020, Decision No: 9/104). All procedures were carried out in accordance with the ethical rules and the principles of the Declaration of Helsinki.
Table 1. Demographic features type 2 DM patientsTotal 95
Age 60.589 ±8.20Gender
Male 24 25.3%Famale 71 74.7%
BMIBMI <30 (Pre-obese/Normal) 26 27.4%BMI ≥ 30 (Obese) 69 72.6%
Blood tests (Hemogram, biochemistry, electrolyte levels, vitamin levels) and thoracolumbar spine X-rays are routinely requested from patients who apply to our outpatient clinic for osteoporosis screening. Weight and height are measured and BMI is calculated with the TANITA MC-180MATM (Tanita Corporation, Japan) device. L1-L4 posteroanterior lumbar spine, femur total and femoral neck BMD measurements are then performed on the dual-energy Hologic DXA device. BMD values are calculated by T scores defined according to peak young adult bone density values. According to the World Health Organization (WHO) classification, patients with a T score ≤ -2.5 are considered osteoporotic, those with a score between -2.5 and -1 are considered osteopenic, and those with a score of ≥ -1 are considered normal (12). Fracture risk assessment scale (FRAX) is a fracture assessment tool developed by WHO. FRAX is a scale that can calculate the ten-year fracture risk in terms of hip or major fractures (hip, wrist, humerus or spine fractures) (12). In this scale age, BMI, low-energy fracture history, family history of hip fractures, current smoking, alcohol use (alcohol 3 or more units/day), and other secondary osteoporosis causes are used to calculate. Also, femoral neck T scores are included in the calculation (13) Figure 1 shows the routine evaluation
diagram of the patients who applied to our outpatient clinic in terms of osteoporosis. The patients included in our study were divided into two groups according to their BMI as "pre-obese/normal" for those with a BMI < 30 (n =26), and "obese" for those with a BMI ≥ 30 (n = 69) (14).
SSPS® version 21.0 statistical package program (SPSS Inc., Chicago, IL, USA) was used for statistical analysis. In the statistical analysis, after evaluating whether the data showed normal distribution or not, using the Kolmogorov Smirnov test, independent samples t-test was applied to the parameters showing normal distribution, while the Mann Whitney U test was used for the parameters that did not show normal distribution. P <0.05 values were considered statistically significant.
RESULTSIt was determined that 25.3% of the type 2 DM patients included in the study were male, 74.7% were female, and the general average age was 60.589 (± 8.20). When the demographic characteristics are examined according to the BMI classification in Table 2, the average age of the patients was found to be 60.44 (±9.00) in the obese and 60.96 (±5.68) in the pre-obese/normal. In addition, according to the BMI grouping, the mean duration of disease diagnosis was 12.36 (±8.37) years in the obese group, while it was 14.80(±8.47) years in the pre-obese/normal group, and the p-value between the duration of diagnosis and the BMI groups was found to be 0.215. There was no significant difference between the two groups in terms of smoking.
Table 2. Demographic characteristics according to BMI classificationBMI < 30
(Pre-obese/Normal)BMI ≥ 30 (Obese)
P value
Age (year) 60.96 (±5.68) 60.44 (±9.00) .743Gender (n: female/male) 16/10 55/14 .087
DM time (year) 14.80(±8.47) 12.36 (±8.37) .215Smoking rate 11.5% 7.2% .574
Figure 1. Routine evaluation diagram of patients in terms of osteoporosis

884
Öten et al. Body mass index, osteoporosis and fracture risk in type 2 diabetes mellitus patientsJ Health Sci Med 2021; 4(6): 882-885
FRAX and BMD values according to the BMI classification are shown in Table 3. When the groups were compared in terms of FRAX and BMD values, it was noted that the averages of these values were higher in the obese group. When FRAX and BMD values are examined according to BMI classification in Table 3, FRAX hip, L1-L4 total T score, femoral neck T score, femur total T score and femur total g/cm2 values were found to be significantly higher in the obese group (p<0.05).
Table 3. FRAX and BMD values according to BMI classification
BMI <30 (Pre-obese/Normal)
BMI ≥ 30 (Obese)
p valueMean Std.
Deviation Mean Std. Deviation
FRAX major 6.353 1.875 6.518 3.931 .341FRAX hip 0.542 0.404 0.629 1.203 .018*L1-L4 total T score -0.073 1.578 0.727 1.761 .047*
L1-L4 total g/cm2 1.142 0.202 1.238 0.222 .052
Femoral neck T score -0.719 0.753 0.215 1.919 .019*
Femoral neck g/cm2 0.917 0.120 1.018 0.237 .060
Femur total T score -0.396 0.944 0.755 1.925 .001*
Femur total g/cm2 0.979 0.132 1.108 0.239 .006*
FRAX: Fracture risk assessment scale, BMI: Body mass index, BMD: Bone mineral density, *p-value: Mann Whitney U Test (p<0.05)
In addition, while the history of low-energy fracture was 8.69% in the obese group, there was no fracture history in the pre-obese/normal group. While fractures were seen in the obese group with a rate of 17.39%, in the pre-obese/normal group, fractures were detected in 3.84% in the X-ray scan. Accordingly, although the low-energy fracture history and the number of fractures detected in the X-ray scan were higher in the obese group, no significant difference was observed between the two groups (p> 0.05).
DISCUSSIONIn this study, obese and pre-obese/normal patient groups diagnosed with type 2 DM with similar lifestyles (smoking and alcohol consumption), average age and duration of diagnosis were examined. There was a significant difference between the groups in terms of BMD values (L1-L4 total T score, femoral neck T score, femur total T score, and femur total g/cm2) and FRAX hip fracture. Obesity is a common finding in patients with type 2 DM. Obesity is thought to improve bone quality and mass by increasing the tension on the skeleton, thus protecting it from osteoporosis(15). However, in the study conducted by Nielson et al. (16) on 5918 obese and elderly men, it was found that obesity was not protective against fracture
angle. Again, in the study of Tanaka et al. (17) 1614 on female patients in the postmenopausal period, obesity was associated with an increased incidence of vertebral fractures. Similarly, higher BMD values were found in the patient group with a BMI ≥ 30 in our study. However, in this group, it was observed that the number of patients with a history of fracture, fracture on X-ray and the mean FRAX major and FRAX hip values were higher than the patient group with a BMI <30. Low-energy fracture history, family history of hip fractures, current smoking may be the reason for the high fracture risk according to the FRAX score despite the high BMD values in the obese group in our study.
Although DXA is accepted as the gold standard analysis in measuring BMD (18), it is known that type 2 DM has effects on the bone that cannot be measured by the DXA device (15). Despite high BMD values, there is a high risk of fractures in patients with type 2 DM. Although fragility of bone increases in type 2 DM, FRAX underestimates the risk of bone fracture (19). Obesity, which is common in patients diagnosed with type 2 DM, can be shown as one of the reasons for these effects (20). Type 2 DM and obesity have been found to cause deterioration in bone quality by affecting bone remodeling (20). The practical way to adjust the fracture risk in these patients is to reduce the standard deviation of 0.5 in the BMD T score (21).
Although type 2 DM affects bone metabolism with many mechanisms, its results are controversial. A study conducted in Brazil showed that blood glucose control is not an independent risk factor for vertebral fracture(22). However, an in vivo study by Garcia et al. (23), it was found that high blood glucose levels decrease bone mineral quality by affecting the biomineralization in osteoblasts. Serum levels of osteocalcin, which has an important role in binding calcium and hydroxyapatite crystals to bone, were found to be low in patients with type 2 DM (24).
Melton et al. (25), evaluated bone structure and strength with quantitative computed tomography in their study consisting of diabetic patients and nondiabetic control groups. In this study, it was shown that despite higher BMD values in patients with type 2 DM, this increase was entirely due to trabecular bone. In another cross-sectional study, higher trabecular volume was found in patients with postmenopausal type 2 DM compared to the control group, but cortical bone strength was found to be impaired (26). The mechanisms behind these changes in type 2 DM are mainly related to obesity, diabetic complications, age, duration of diabetes, comorbidities and medications (27). In our study, although BMD values were higher in the obese patient group with a diagnosis of type 2 DM, the average FRAX and the number of patients with fractures were found to be higher than in the pre-obese/normal group.

885
Öten et al. Body mass index, osteoporosis and fracture risk in type 2 diabetes mellitus patients J Health Sci Med 2021; 4(6): 882-885
CONCLUSIONIn our study, when the obese and pre-obese/normal groups diagnosed with type 2 DM were evaluated in terms of BMD values (L1-L4 total T score, femoral neck T score, femur total T score and femur total g/cm2), a significant difference was found between the groups. However, when the patient groups are examined, fracture risk in the obese patient group is higher than in the pre-obese/normal group. More studies are needed to understand the relationship between diabetes, obesity, and fracture.
ETHICAL DECLARATIONS Ethics Committee Approval: The study was carried out with the permission of Amasya University Non-interventional Clinical Research Ethics Committee (Date: 03.09.2020, Decision No: 9/104). Informed Consent: Because the study was designed retrospectively, no written informed consent form was obtained from patients. Referee Evaluation Process: Externally peer-reviewed.Conflict of Interest Statement: The authors have no conflicts of interest to declare. Financial Disclosure: The authors declared that this study had received no financial support. Author Contributions: All of the authors declare that they have all participated in the design, execution, and analysis of the paper and approved the final version.
REFERENCES 1. Kurra S, Siris E. Diabetes and bone health: the relationship
between diabetes and osteoporosis‐associated fractures. Diabetes/Metabolism Research and Reviews 2011; 27: 430-5.
2. De Waard EA, van Geel TA, Savelberg HH, Koster A, Geusens PP, Van Den Bergh JP. Increased fracture risk in patients with type 2 diabetes mellitus: an overview of the underlying mechanisms and the usefulness of imaging modalities and fracture risk assessment tools. Maturitas 2014; 79: 265-74.
3. Association AD. 2. Classification and diagnosis of diabetes. Diabetes Care 2017; 40: S11-S24.
4. Schwartz A. Diabetes mellitus: does it affect bone? Calcified Tissue International 2003; 73: 515-9.
5. Inzerillo AM, Epstein S. Osteoporosis and diabetes mellitus. Rev Endocr Metab Disord 2004; 5: 261-8.
6. Vestergaard P. Discrepancies in bone mineral density and fracture risk in patients with type 1 and type 2 diabetes—a meta-analysis. Osteoporos Int 2007; 18: 427-44.
7. Walsh JS; Vilaca T. Obesity, type 2 diabetes and bone in adults. Calcif Tissue Int 2017; 100: 528-35.
8. Felson DT, Zhang Y, Hannan MT, Anderson JJ. Effects of weight and body mass index on bone mineral density in men and women: the Framingham study. J Bone Miner Res 1993; 8: 567-73.
9. Schwartz AV, Sellmeyer DE, Ensrud KE, et al. Older women with diabetes have an increased risk of fracture: a prospective study. J Clin Endocrinol Metabol 2001; 86: 32-8.
10. Forsen L, Meyer H, Midthjell K, Edna TH. Diabetes mellitus and the incidence of hip fracture: results from the Nord-Trøndelag Health Survey. Diabetologia 1999; 42: 920-5.
11. Janghorbani M, Van Dam RM, Willett WC, Hu FB. Systematic review of type 1 and type 2 diabetes mellitus and risk of fracture. Am J Epidemiol 2007; 166: 495-505.
12. Kanis JA, McCloskey EV, Johansson H, Cooper C, Rizzoli R, Reginster JY. European guidance for the diagnosis and management of osteoporosis in postmenopausal women. Osteoporosis Int 2013; 24: 23-57.
13. Unni S, Yao Y, Milne N, Gunning K, Curtis J, LaFleur J. An evaluation of clinical risk factors for estimating fracture risk in postmenopausal osteoporosis using an electronic medical record database. Osteoporosis Int 2015; 26: 581-7.
14. Organization WH. The Asia-Pacific perspective: redefining obesity and its treatment. 2000.
15. Sealand R, Razavi C, Adler RA. Diabetes mellitus and osteoporosis. Curr Diabetes Rep 2013; 13: 411-8.
16. Nielson CM, Marshall LM, Adams AL, et al. BMI and fracture risk in older men: the osteoporotic fractures in men study (MrOS). J Bone Miner Res 2011; 26: 496-502.
17. Tanaka S, Kuroda T, Saito M, Shiraki M. Overweight/obesity and underweight are both risk factors for osteoporotic fractures at different sites in Japanese postmenopausal women. Osteoporosis Int 2013; 24: 69-76.
18. Eryavuz Sarıdoğan M. Osteoporozun tanımı ve sınıflandırması. Modern Tıp Seminerleri 19: Osteoporoz 2001: 1-5.
19. Fassio A, Idolazzi L, Rossini M, et al. The obesity paradox and osteoporosis. Eat Weight Disord 2018; 23: 293-302.
20. de Paula FJ, Rosen CJ. Obesity, diabetes mellitus and last but not least, osteoporosis. Arq Bras Endocrinol Metabol 2010; 54: 150-7.
21. Pritchard JM, Giangregorio LM, Atkinson SA, et al. Changes in trabecular bone microarchitecture in postmenopausal women with and without type 2 diabetes: a two year longitudinal study. BMC Musculoskelet Disord 2013; 14: 114.
22. Viégas M, Costa C, Lopes A, Griz L, Medeiro MA, Bandeira F. Prevalence of osteoporosis and vertebral fractures in postmenopausal women with type 2 diabetes mellitus and their relationship with duration of the disease and chronic complications. J Diabetes Complications 2011; 25: 216-21.
23. García-Hernández A, Arzate H, Gil-Chavarria I, Rojo R, Moreno-Fierros L. High glucose concentrations alter the biomineralization process in human osteoblastic cells. Bone 2012; 50: 276-88.
24. Kanazawa I, Yamaguchi T, Yamamoto M, et al. Serum osteocalcin level is associated with glucose metabolism and atherosclerosis parameters in type 2 diabetes mellitus. J Clin Endocrinol Metabol 2009; 94: 45-9.
25. Melton III LJ, Riggs BL, Leibson CL, et al. A bone structural basis for fracture risk in diabetes. J Clin Endocrinol Metabol 2008; 93: 4804-9.
26. Burghardt AJ, Issever AS, Schwartz AV, et al. High-resolution peripheral quantitative computed tomographic imaging of cortical and trabecular bone microarchitecture in patients with type 2 diabetes mellitus. J Clin Endocrinol Metabol 2010; 95:5045-55.
27. Lecka-Czernik B. Bone loss in diabetes: use of antidiabetic thiazolidinediones and secondary osteoporosis. Curr Osteoporos Rep 2010; 8: 178-84.

HEALTH SCIENCESMEDICINE
Original Article
J Health Sci Med 2021; 4(6): 886-891
This work is licensed under a Creative Commons Attribution 4.0 International License.
DOI: 10.32322/jhsm.976299
Received: 29.07.2021 Accepted: 01.09.2021Corresponding Author: Zeynep Çetin, [email protected]
Hypoechoic nodule structure increases non-diagnostic rate of thyroid fine needle aspiration biopsy
Zeynep ÇetinAmasya University, Faculty of Medicine, Department of Internal Medicine, Division of Endocrinology and Metabolism, Amasya, Turkey
Cite this article as: Çetin Z. Hypoechoic nodule structure increases non-diagnostic rate of thyroid fine needle aspiration biopsy. J Health Sci Med 2021; 4(6): 886-891.
ABSTRACTAim: Thyroid fine needle aspiration biopsy (FNAB) performed with ultrasonography is an effective method in diagnosing thyroid cancer. Nevertheless, some of them have non-diagnostic results. The aim is to investigate the factors that affect non-diagnostic result.Material and Method: FNABs of 361 nodules of 361 patients were analyzed retrospectively. The patients were divided into two groups as fine needle aspiration biopsy result with and without non-diagnostic. The groups were compared according to demographic, clinical and sonographic data.Results: Non-diagnostic rate was 14.4% in all biopsies. There was no difference in terms of age, gender, previous thyroid surgery history, smoking history, aspirin use, Hashimoto’s thyroiditis, toxic nodule. Sonographic findings of the thyroid glands and nodules were similar. Only the echogenicity of the nodule was found to affect the non-diagnostic result (p=0.015). In the post hoc analysis, the difference was found to be caused by hypoechoic nodules (32.7% versus 15.5). It was observed that the significant relationship found in univariate logistic regression analysis (p=0.009, OR: 3.227, CI: 1.334-7.803) continued in multivariate analysis (p=0.024, OR: 3.175, CI: 1.163-8.668).Conclusion: Only hypoechoic echogenicity increases the risk of non-diagnostic rate. Other factors do not increase the non-diagnostic rate.Keywords: Thyroid fine needle aspiration biopsy, ultrasonography, non diagnostic, hypoechogenicity
Ana Metin-Alt bilgi Arası 5mm
Cite-Öz arası 5mm
Başlık-Yazarlar arası 12mmv
Yazar-Kurum arası 2,5 mmvcv
Kurum-Cite arası 5mm
Öz-Abstract arası 7,5mmvc
INTRODUCTIONThe frequency of thyroid cancer continues to increase with each passing year. With the proliferation of ultrasonography (USG), nodular thyroid disease has been detected more frequently. The most appropriate method for making the necessary surgical decision and avoiding unnecessary surgery and related complications is fine needle aspiration biopsy (FNAB) (1,2). FNAB is an easy, inexpensive and effective diagnostic method. It is more effective when performed with USG. It has a 95% negative, 97-99% positive predictive value. FNAB indication is based on the sonographic features of the thyroid nodule. FNAB should be performed in the case of hypoechogenicity, irregular edge structure, microcalcification, ratio of anterior-posterior diameter to transverse diameter> 1, and central vascularity (3).
FNAB assessment is done according to the Bethesda system and the results are given in 6 categories; benign, non-diagnostic (ND), indeterminate atypia (AUS)/
indeterminate follicular lesion (AUFL), suspicious for follicular neoplasia or follicular neoplasia (FN), suspicious cytology for malignancy and malignancy (4). In the best series, the ND rate is 2-16% (5,6). Fifty five-74% of biopsies are reported as benign, 2-5% as malignant, 2-18% as AUS/AUFL, 2-25% as FN and 1-6% as suspicious for malignancy (6).In order to FNAB to be sufficient, there must be at least 6 groups of follicular cells containing at least 10 well-preserved epithelial cells in one area. It is reported as ND, which does not meet these criteria. It is recommended to repeat FNAB, and if ND comes again, surgery or close follow-up is recommended. While the estimated malignancy risk of the nodule with a biopsy ND is 1-4%, the actual risk of malignancy of this nodule is 9-32% (5). A nodule whose biopsy is 2 times ND has a 25% risk of being malignant (7). Therefore, surgical and medical follow-up decision should be made carefully in nodules whose biopsy is ND.

887
Çetin Z. Non diagnostic thyroid biopsies J Health Sci Med 2021; 4(6): 886-891
Studies investigating the factors affecting FNAB adequacy can be found in the literature. Different causes such as advanced patient age, nodule heterogeneity (8), aspirin (9), radioactive iodine therapy (10) were found to be related to ND. In this study, it was aimed to investigate the factors affecting ND biopsy results in a large sample group.
MATERIAL AND METHODEthical Approval The study was carried out with the permission of Amasya University Non-interventional Clinical Researchs Ethics Committee (Date: 02.05.2019, Decision No: 05-26). All procedures were in accordance with the ethical standards of the institutional research committee and with the 1964 Helsinki declaration and its later amendments or comparable ethical standards. The subjects have given their written informed consent. This study does not contain animals.
Patient SelectionBetween January 1, 2018 and January 1, 2019, 361 patients who underwent FNAB were included. These biopsies were performed by an endocrinologist experienced in terms of USG and FNAB. One FNAB result of each patient was included in the study. Consent was obtained from the participants before and after the FNAB. Demographic, laboratory, ultrasound and FNAB data of the participants were obtained from the hospital information processing system. The age, gender, smoking status, aspirin usage, previous thyroid surgery was recorded. According to thyroid autoantibodies and USG, which patients had Hashimoto’s thyroiditis (HT) was detected. Thyroid scanning was performed by the endocrinologist with thyroid ultrasonography device (Aloka, Mollsfeld, Meerbusch, Germany). Thyroid gland and nodule volumes were calculated according to the formula of anterior-posterior diameter x transverse diameter x longitudinal diameter x 0.52 (11). Whether the nodule is thyrotoxic in hyperthyroid patients was recorded based on thyroid scintigraphy. Biopsy Indications and Results
FNAB was performed according to the size (> 1 cm), content (solid), echogenicity (hypoechoic), edge structure (irregular), vascularity (central), calcification (microcalcification), anterior-posterior diameter/transverse diameter ratio (> 1) of the thyroid nodules (12). Local anesthesia was not applied before biopsy. FNAB was made by aspiration method by 22-gauge needle. During aspiration, the USG probe was turned from the transverse position to the longitudinal position, the needle was inserted into the nodule at a right angle to the neck, the needle was moved 5-6 times to the anterior-posterior and lateral sides. The material was spread to the
slides by the endocrinologist at the bedside. Slides were delivered to the pathology department after being dried in the air. FNAB results were categorized by experienced cytopathologists according to the Bethesda system (4).
Statistical AnalysisStatistical analyzes were made in IBM SPSS for Windows Version 22.0. Numerical variables were summarized with mean±standard deviation. Categorical variables were indicated by number and percentage. The chi-square test or Fisher's exact test was used to determine whether there was any difference between the groups in terms of categorical variables. The Kolmogorov Smirnov test, standard deviation/mean ratio, skewness/kurtosis measures, histogram and detrended normal graphics were used to determine whether the numeric variables showed normal distribution, and the homogeneity of the variance was examined by the Levene test. Differences between two independent groups in terms of numerical variables; In the case of parametric test assumptions, t-test was used for independent groups. In the absence of parametric test assumptions, Mann Whitney U test was used. Post hoc analysis was used to compare more than 2 groups. Univariate and multivariate logistic regression analyses were applied to determinate independent predictors affecting ND result. The significance level was taken as p <0.05.
RESULTSThe results of the FNABs are as shown in Table 1. ND rate was 14.4% among all biopsies. The most reported category was benign, with a rate of 67.6% (Table 1).
All participants were divided into two groups according to whether the FNAB result was ND or not. Data on age, advanced age (>65), gender, previous history of thyroid surgery, smoking status, use of aspirin, presence of HT are shown in Table 2. No significant difference was found between the two groups (Table 2).
Thyroid USG features of all participants are given in Table 3. There was a significant difference in nodule echogenicity between the groups (p=0.015). Post hoc analysis was performed to determine which subtype caused the difference. The difference was caused by hypoechoic subgroup by applying Bonferoni correction and adjusted residual (Table 3).
Table 1. FNAB resultsTotal, n 361Non-diagnostic, n (%) 52 (14.4)Benign, n (%) 244 (67.6)AUS/AUFLª, n (%) 50 (13.9)Follicular neoplasia, n (%) 4 (1.1)Malignant, n (%) 1 (0.2)Suspicious for malignancy, n (%) 10 (2.8)ª: AUS/AUFL: unspecified atypia/indeterminate follicular lesion

888
Çetin Z. Non diagnostic thyroid biopsiesJ Health Sci Med 2021; 4(6): 886-891
Table 2. Baseline clinical characteristics of patients and comparisons of two groupsParameters Total (n=361) Non-NDª group (n=309) NDª group (n=52) pAge, mean±std dev 53.03±11.78 52.66±11.96 54.79±10.35 0.227Age >65, n (%) 58 (16) 49 (15.9) 9 (17.3) 0.792Gender, n (%) 0.417
Male 75 (20.8) 62 (20.1) 17 (25)Female 286 (79.2) 247 (79.9) 39 (75)
Previous thyroid surgery, n (%) 25 (6.9) 22 (7.1) 3 (12) 0.784Smoking, n (%) 60 (16.6) 48 (15.5) 12 (23.1) 0.176Aspirin, n (%) 42 (11.6) 37 (12) 5 (9.6) 0.624HTb, n (%) 92 (25.5) 83 (26.8) 9 (17.3) 0.184TSH, mean±std dev 1.84±7.94 1.89±8.56 1.59±1.71 0.896ª: ND: non-diagnostic, b: HT: Hashimoto’s thyroiditis
Table 3. Baseline sonographic characteristics of patients and comparisons of two groupsParameter Total (n=361) Non-NDª group (n=309) NDª group (n=52) PRight thyroid volume, mL 20.403±15.016 20.429±15.272 20.250±13.525 0.697Left thyroid volume, mL 18.580±14.020 18.381±14.290 19.760±12.354 0.202Istmus, mm 5.71 ± 3.99 5.64 ± 4 6.14 ± 3.95 0.348Parenchym 0.891
Homogeneous 21 (5.8) 17 (5.5) 4 (7.7)Mild heterb 181 (50.1) 157 (50.8) 24 (46.2)Moderate heterb 113 (31.3) 96 (31.1) 17 (32.7)Advanced heterb 46 (12.7) 39 (12.6) 7 (13.5)
Nodule noc, n (%) 0.950Solitary 89 (28.1) 76 (24.6) 13 (25)MNGd 272 (71.9) 233 (75.4) 39 (75)
Nodule size, n (%) 0.332 < 10 mm 15 (4.1) 11 (3.6) 4 (7.7)10.01-39.99 mm 312 (86.4) 270 (87.4) 42 (80.8)> 40 mm 37 (9.5) 28 (9) 6 (11.5)
A-P diame/T diamf 0.142<1 345 (95.6) 293 (94.9) 52 (100)>1 16 (4.4) 16 (5.1) 0 (0)
Content,n (%) 0.113Solid 158 (43.7) 130 (42.1) 28 (53.8)Mixed 203(56.3) 179 (57.9) 24 (46.2)
Echogenity,n(%) 0.015Isoechoic 91 (25.2) 82 (26.5) 9 (17.3)Hypoechoic 65 (18) 48 (15.5) 17 (32.7)Hyperechoic 13 (3.6) 10 (3.2) 3 (5.8)Spongiform 192(53.2) 169 (54.8) 23 (53.2)
Edge, n (%) 0.393Smooth 270 (74.8) 230 (74.4) 40 (76.9)Irregular 61 (16.9) 53 (17.2) 8 (15.4)Undefined 30 (8.3) 26 (8.4) 4 (7.7)
Halo, n (%) 0.284Absent 325 (90) 275 (89) 50 (96.2)Present 36 (10) 34 (11) 2 (3.8)
Calcification,n (%) 0.885Absent 303 (83.9) 261 (84.5) 42 (80.8)Microcalcification 10 (2.7) 9 (2.9) 1 (1.9)Macrocalcification 28 (7.7) 22 (7.1) 6 (11.5)Micro+macrocalc 7 (1.9) 6 (1.9) 1 (1.9)Eggshell calc. 13 (3.8) 11 (3.6) 2 (3.8)
Vascularity, n (%) 0.365Absent 224 (62) 194 (62.8) 30 (57.7)Peripheral 108 (29.9) 89 (28.8) 19 (36.5)Central 3 (0.8) 2 (0.6) 1 (1.9)Periph+central 26 (7.3) 24 (7.8) 2 (3.8)
Toxic nodule, n (%) 50 (13.9) 41 (13.3) 9 (17.3) 0.435ª: ND: non-diagnostic, b: heter: heterogeneity, c: no:number, calc: calcification, d:MNG: multinodular goiter, e:A-P diam: antero-posterior diameter, f:T diam: transvers diameter

889
Çetin Z. Non diagnostic thyroid biopsies J Health Sci Med 2021; 4(6): 886-891
In univariate logistic regression analysis, nodule echogenicity and size were found to have a significant effect on the ND result (p=0.009 and p=0.037). In the multivariate analysis, while the effect of echogenicity on FNAB remained (p=0.024, OR: 3.175, CI: 1.163-8.668), the effect of the nodule size was not detected (p=0.077, OR: 0.311, CI: 0.085-1.137) (Table 4).
DISCUSSIONIn this study, the fine needle aspiration biopsy results performed by the endocrinologist in 1 year were investigated and the factors affecting the ND result were investigated. According to the results of the analysis, it was found that only hypoechogenity was increasing the likelihood of ND results.
In the study, 14.4% of total biopsies were determined as ND. This rate is similar to the literature since the probability of obtaining ND results is 2-16% (5,6). Results in other categories (except for those malignant and suspected of malignancy) are similar to the literature (6). The experience of the endocrinologist performing the biopsies provided the ND rate to be similar to the literature, and the experience is an important factor affecting the success of the biopsy (13).
Patients were divided into two groups as those with and without ND FNABs, and they were compared according to age, gender, previous history of thyroid surgery, smoking, presence of HT, thyroid USG findings.
Inci and his colleagues (8) retrospectively examined the results of FNABs performed by a radiologist (not endocrinologist) of 270 individuals in 2 years, ND rate was 31.9% and they found that advanced patient age is a factor that increases the risk of ND. Based on this study, we compared the groups in terms of age. The average age of the first study was 46 and 53 in our study. In the first study, the number of geriatric patients was not specified. In our case, there are roughly 16% geriatric patients. Contrary to the first study, we did not find a significant difference between the groups in terms of both the average age and the distribution of geriatric population, and we can say that age is not a risk factor for ND result. ND rate of the first study was markedly high, which may have led to such a conclusion about age.
The gender distribution was also similar in terms of the two groups. As in many studies, although the number
of women who underwent FNAB in our center was significantly higher than men, the effect of gender on ND outcome was not detected. For example, in the study of Ozel et al. (14), gender distribution in ND and non-ND groups is similar.
Postoperative recurrent nodular thyroid disease is seen in 2-42% in different series in patients without total thyroidectomy (15). Onal et al. (16) found that, subtotal thyroid surgery increases the risk of ND outcome by causing fibrosis and scar formation. We also considered our patients' history of thyroid surgery. The patients who had previous thyroid surgery were 6.9% and consisted of recurrent MNG cases with FNAB indication in the residual thyroid gland. There was no significant difference in the distribution of these patients into groups (7.1% versus 12%, p=0.784). The conclusion drawn from this is that, unlike the previous study, having a previous thyroid surgery does not increase the risk of ND. However, since the number of patients with operated recurrent nodular goiter in our study was lower compared to other studies (123 patients versus 25 in total), more participatory studies are needed to support this result.
Since smoking exposure has been shown to worsen Graves' ophthalmopathy, studies have been conducted to demonstrate the relationship between smoking and thyroid. Although these studies have shown that smoking increases the risk of nodule formation and thyroid cancer (17,18), there are also studies showing that it is ineffective (19,20). In the literature, as we have determined, there are no studies investigating the effect of cigarette exposure on ND biopsy results. For this reason, we also considered the smoking history of the patients. When the distribution of the patients who ex-smokers and still smokers was compared between the two groups, no significant relationship was found (p=0.176, table 2). However, we did not elaborate on cigarette exposure (duration, amount, passive smoking, etc.). Therefore, more detailed studies to support this finding will help enlighten the issue.
HT is the most common inflammatory thyroid disease. The main diagnosis is made histopathologically, but in daily practice, HT is diagnosed according to thyroid autoantibodies and USG findings (18). According to the studies, the success of FNAB decreases in the presence of HT and it increases the diagnosis ND and AUS/AUFL
Table 4. Univariate and multivariate regression analysisParameter Univariate Multivariate
P ORª 95 % CI P OR 95 % CIbNodule echogenicity 0.009* 3.227 1.334-7.803 0.024* 3.175 1.163-8.668Nodule size (>1-3.99) 0.037* 0.303 0.098-0.930 0.077 0.311 0.085-1.137ª:OR: odds ratio, b:CI: confidence interval, *Univariate and multivariate analyzes were performed on other parameters, since the results were not significant, they were not shown in the Table 4.

890
Çetin Z. Non diagnostic thyroid biopsiesJ Health Sci Med 2021; 4(6): 886-891
(21,22). In our study, while HT was detected in 25.5% of all patients, we could say that HT did not increase the risk of ND since there was no significant difference between the groups in terms of HT.
Toxic nodules previously thought to be protective for thyroid cancer, more FNABs are being performed today and it has been found to carry a risk of malignancy as much as non-toxic nodular goiter (23). Baser et al. (24) examined FNAB results of toxic and non-toxic nodules and showed that they had similar ND ratios. In our study, toxic nodules with FNAB were also included because they had sonographically risky features. The distribution of toxic nodules was similar between the groups, and it was determined that the toxic nodule had no effect on the ND result.
Studies investigating the efficacy/adequacy of thyroid FNAB were mostly based on sonographic findings. In our study, we compared both the general thyroid USG findings of the patients and the features of the nodules undergoing FNAB. There was no difference between the two groups in terms of thyroid gland size, parenchymal structure and number of nodules. The nodule size, the ratio of anterior-posterior diameter to transverse diameter, nodule content, echogenicity, margin arrangement, vascularity and calcification content were compared and only the nodule echogenicity was effective on the ND result. This difference was also shown by post hoc analysis that it was caused by hypoechoic echogenicity (table 3). In both univariate and multivariate logistic regression analyzes, hypoechogenity has been shown to affect the ND biopsy result. So, it was shown in our study that only hypoechoic echogenicity contributed to the ND result. Inci et al. (8) stated that heterogeneous echogenicity leads to more ND results, which may result from the hemorrhagic and necrotic content of the nodule. Ozel et al. (14) concluded that needle size is effective in ND result, and sonographic features of nodule have no effect. Moon and colleagues (25) found hypoechogenity as an independent factor for ND, as in our study. There are many other studies showing that more ND results are obtained in hypoechoic nodules (26,27). The possible reason is that due to the hypoechoic nodules being more fibrotic, sufficient material cannot be taken with fine needle aspiration (26). While cystic content increased the risk of ND in some studies (13,28), it was shown that it did not pose any risk in some (27). In our study, cystic content did not increase the risk of ND. No relation was found between size, vascularity, calcification (especially macrocalcification) and ND, as in many other studies (8,13,27).
Consequently, according to our study, the only factor that adversely affects the FNAB adequacy is the nodule hypoechogenity. Other demographic, clinical and sonographic features do not affect biopsy adequacy.
Our study provided homogeneity, covering a shorter period of time (1 year), by the same expert (1 endocrinologist), using the same USG, the same needle (22 gauge) and the same technique (aspiration). Although it covers 1 year, the number of patients (361) undergoing FNAB is quite high. We believe that this is a detailed study since it includes both demographic, clinical and USG findings.
Our study had limitations, too. We included only 1 biopsy result of 1 nodule of each patient, we did not include the results of re-biopsy. For this reason, we were unable to answer the question of whether the rate of ND will change with re-biopsy. The sample size of the study is also one of the factors limiting the study (361 biopsies performed in 1 year by 1 endocrinologist were examined.). Considering how common thyroid nodules are, analyzes with larger numbers of subjects are needed.
In some studies, the thickness of the needle used for FNAB was also investigated. The general recommendation is to make FNAB with a fine needle.12,28 We performed all biopsies with a 22- gauge needle and we did not compare different needles, so we could not comment on this.
CONCLUSIONSonographic imaging and fine needle aspiration biopsy have an important role in the evaluation of thyroid nodules. The most important factor affecting biopsy adequacy is the echogenicity of the nodule. Performing the biopsy with USG, reduces non-diagnostic results.
ETHICAL DECLARATIONSEthics Committee Approval: The study was carried out with the permission of Amasya University Non-interventional Clinical Researchs Ethics Committee (Date: 02.05.2019, Decision No: 05-26).Informed Consent: All patients signed the free and informed consent form.Referee Evaluation Process: Externally peer-reviewed. Conflict of Interest Statement: The author has no conflicts of interest to declare. Financial Disclosure: The author declared that this study has received no financial support. Author Contributions: The author daclared (design, execution, and analysis) that all stages of the work were done by the author herself.
REFERENCES1. Le AR, Thompson G, Hoyt BJ. Thyroid Fine-needle aspiration
biopsy: an evaluation of its utility in a community setting. J Otolaryngol Head Neck Surg 2015; 44: 12-6.

891
Çetin Z. Non diagnostic thyroid biopsies J Health Sci Med 2021; 4(6): 886-891
2. Huang LY, Lee YL, Chou P, Chiu WY, Chu D. Thyroid fine-needle aspiration biopsy and thyroid cancer diagnosis: a nationwide population-based study. PLoS ONE 2015; 10: e0127354.
3. Olson MT, Zelger MA. Thyroid fine-needle aspiration and cytological diagnosis. In: Jameson JL, De Groot LJ, editors. Endocrinology adult and pediatric. 7th edition Philadelphia: Elsevier Saunders 2016: 1417-22.
4. Ali SZ, Cibas ES. The Bethesda system for reporting thyroid cytopathology. definitions, criteria and explanatory notes. New York-USA: Springer, 2010.
5. Bongiovanni M, Spitale A, Faquin WC, Mazzucchelli L, Baloch ZW. The Bethesda system for reporting thyroid cytopathology: a meta-analysis. Acta Cytol 2012; 56: 333–9.
6. Luu MH, Fischer AH, Pisharodi L, Owens CL. Improved preoperative definitive diagnosis of papillary thyroid carcinoma in FNAs prepared with both ThinPrep and conventional smears compared with FNAs prepared with ThinPrep alone. Cancer Cytopathol 2011; 119: 68–73.
7. Moon HJ, Kwak JY, Choi YS, Kim EK. How to manage thyroid nodules with two consecutive nondiagnostic results on ultrasonography-guided fine-needle aspiration. World J Surg 2012: 586–92.
8. Inci MF, Ozkan F, Yuksel M, Salk I, Sahin M. The effects of sonographic and demographic features and needle size on obtaining adequate cytological material in sonographyguided fine-needle aspiration biopsy of thyroid nodules. Endocrine 2013; 43: 424–9.
9. Khan TS, Sharma E, Singh B, et al. Aspirin Increases the Risk of Nondiagnostic Yield of Fine-Needle Aspiration and Biopsy of Thyroid Nodules. Eur Thyroid J 2018; 7: 129–32.
10. Ziemiańska K, Kopczyński J, Kowalska A. Repeated nondiagnostic result of thyroid fine-needle aspiration biopsy. Contemp Oncol (Pozn) 2016; 20: 491–5.
11. Shabana W, Peeters E, Verbeek P, Osteaux MM. Reducing intraobserver variation in thyroid volume calculation using a new formula and technique. Eur J Ultrasound 2003; 16: 207-10.
12. Haugen BR, Alexander EK, Bible KC, et al. 2015 American Thyroid Association Management Guidelines for Adult Patients with Thyroid Nodules and Differentiated Thyroid Cancer. THYROID 2016; 26: 1-133.
13. Penín M, Martín MA, Millán BS, Garcia J. Learning curve of thyroid fine-needle aspiration biopsy. Endocrinol Diabetes Nutr 2017; 64: 539-43.
14. Ozel D, Ozel BD, Ozkan F. Potential causes for obtaining non-diagnostic results from fine needle aspiration biopsy of thyroid nodules. Radiol Med 2016; 121: 510–4.
15. Gutaj, NS, Ziółkowska P, Sowiński J. Recurrent goiter: risk factors, patient quality of life, and efficacy of radioiodine therapy. Pol Arch Intern Med 2019; 129: 22-27.
16. Onal ED, Saglam F, Sacikara M, Ersoy R, Guler G, Cakır B. The diagnostic accuracy of thyroid nodule fine-needle aspiration cytology following thyroid surgery: a case–control study. Endocr Pathol 2014; 25: 297–301.
17. Cho YA, Kim J. Thyroid cancer risk and smoking status: a meta-analysis. Cancer Causes Control 2014; 25: 1187–95.
18. Kim SJ, Kim MJ, Yoon SG, et al. Impact of smoking on thyroid gland: dose-related effect of urinary cotinine levels on thyroid function and thyroid autoimmunity. Sci Rep 2019; 9: 1–6.
19. Karatoprak C, Kartal I, Kayatas K. Does smoking affect thyroid gland enlargement and nodule formation in iodine-sufficient regions? Ann Endocrinol (Paris) 2012; 73: 542-5.
20. Wu G, Zou D, Cai H, Liu Y. Ultrasonography in the diagnosis of Hashimoto’s thyroiditis. Front Biosci (Landmark Ed) 2016; 21: 1006-12.
21. Meng C, Hinkle, LE, Wang W, Su D, Li X. Hashimoto’s thyroiditis elicits decreased diagnostic efficacy of thyroid nodule ultrasound-guided fine needle aspiration. Int J Clin Exp Pathol 2019; 12: 3474-82.
22. Gao L, Ma B, Zhou L. The impact of presence of Hashimoto's thyroiditis on diagnostic accuracy of ultrasound-guided fine-needle aspiration biopsy in subcentimeter thyroid nodules: a retrospective study from FUSCC. Cancer Med 2017; 6: 1014-22.
23. Smitt JJ, Chen X, Schneider DF. Toxic nodular goiter and cancer: a compelling case for thyroidectomy. Ann Surg Oncol 2016; 20: 1336-40.
24. Baser H, Topaloglu O, Bilginer MC. Are cytologic and histopathologic features of hot thyroid nodules different from cold thyroid nodules? Diagn Cytopathol 2019; 47: 898-903.
25. Moon HJ, Kwak JY, Kim EK, Kim MJ. Ultrasonographic characteristics predictive of nondiagnostic results for fine-needle aspiration biopsies of thyroid nodules. Ultrasound Med Biol 2011; 37: 549-55.
26. Chen SJ, Yu SN, Tzeng JE, et al. Characterization of the major histopathological components of thyroid nodules using sonographic textural features for clinical diagnosis and management. Ultrasound Med Biol 2009; 35: 201– 8.
27. Degirmenci B, Haktanir A, Albayrak R, et al. Sonographically guided fine-needle biopsy of thyroid nodules: the effects of nodule characteristics, sampling technique, and needle size on the adequacy of cytological material. Clin Radiol 2007; 62: 798–803.
28. Choi YS, Hong SW, Kwak JY, Moon HJ, Kim EK. Clinical and ultrasonographic findings affecting nondiagnostic results upon the second fine needle aspiration for thyroid nodules. Ann Surg Oncol 2012; 19: 2304–09.

HEALTH SCIENCESMEDICINE
Original Article
J Health Sci Med 2021; 4(6): 892-896
This work is licensed under a Creative Commons Attribution 4.0 International License.
DOI: 10.32322/jhsm.980551
Received: 09.08.2021 Accepted: 02.09.2021Corresponding Author: Semih Aydemir, [email protected]
The role of ECG as a mortality predictor in COVID-19 patients treated in the intensive care unit
Semih Aydemir1, Ekrem Şahan21Atatürk Pulmonary Disease and Thorax Surgery Training and Research Hospital, Department of Anesthesiology and Reanimation, Ankara, Turkey2Atatürk Pulmonary Disease and Thorax Surgery Training and Research Hospital, Department of Cardiology, Ankara, Turkey
Cite this article as: Aydemir S, Şahan E. The role of ECG as a mortality predictor in COVID-19 patients treated in the intensive care unit. J Health Sci Med 2021; 4(6): 892-896.
ABSTRACTBackground: COVID-19 infection has reached serious morbidity and mortality rates all over the world for a short time. Many studies have investigated the relationship of COVID-19 disease with mortality and morbidity. In this study, we wanted to elucidate the relationship between rhythm character (sinus rhythm vs atrial fibrillation) and QTc and frontal plane QRS-T angle, which parameters are reflecting the depolarization-repolarization kinetics, and mortality, which were not emphasized enough in previous studies.Material and Method: 259 patients admitted to the intensive care unit due to COVID-19 infection between 01.04.2020 and 01.12.2020 was included in the study. The demographic characteristics of the patients, clinical backgrounds, laboratory values at the time of admission to the intensive care unit, and 12 derivation ECG records were obtained from the patient files. Rhythm, PR distance, QRS duration and morphology, QT interval, T wave morphology, presence of atrioventricular (AV) block, QRS axis, presence of ventricular premature contraction, frontal plane QRS-T (f(QRS-T)) angle degree were determined on 12 derivation ECG records. Patient groups were classified as "deceased patient" and "survivors" and the relationship of these parameters with survival was tried to be elucidated.Results: the frequency of atrial fibrillation was significantly higher in the "deceased patient" group. For patients in sinus rhythm, there was no difference between the two groups in terms of PR distance and 1st degree AV block. Severe AV block was not observed in either group. There was no difference between the two groups in terms of QRS morphology, T wave inversion, and ventricular premature contractions. QRS duration, corrected QTc duration, and frotal plane QRS-T angle values were found to be statistically significantly higher in in the "deceased patient" group.Conclusion: Atrial fibrillation, prolonged QTc duration and increased frontal plane QRS-T angle can be considered as mortality predictors in COVID-19 infection whose mortality rate is high all over the world.Keywords: COVID-19, ECG, AF, QRS-T angle, mortality
Ana Metin-Alt bilgi Arası 5mm
Cite-Öz arası 5mm
Başlık-Yazarlar arası 12mm
Yazar-Kurum arası 2,5 mm
Kurum-Cite arası 5mm
Öz-Abstract arası 7,5mm
INTRODUCTIONCOVID-19 disease, caused by the severe acute respiratory syndrome Coronavirus 2 (SARS-Cov-2) virus, continues to affect the whole world for more than a year. The rate of spread of the infection is very high, as the number of infected patients increases, morbidity and mortality numbers also increase (1,2). Pneumonia caused by the COVID-19 disease creates respiratory stress, and the need for non-invasive or invasive mechanical ventilation support may arise. With the treatment administered in the intensive care unit, clinical recovery occurs as well as mortality.
Electrocardiography (ECG) is one of the most frequently used diagnostic tests in clinical practice. Many studies have shown the prognostic significance of ECG findings
in many diseases, especially in cardiovascular system diseases. Information on COVID-19 infection is newly accumulating, and information on the clinical course and mortality of COVID-19 is emerging with the studies. In the early stages of Covid 19 infection, ECG findings - especially QTc value - were used to determine treatment options and side effects of treatment (3). In addition, studies related to Covid 19 mortality and ECG findings are also published. In addition, studies related to Covid 19 mortality and ECG findings have begun to be published. Our aim in this study is to reveal the relationship between in-hospital mortality and data and parameters to be obtained from 12-lead ECGs of patients who have been followed up in intensive care with COVID-19 infection.

893
Aydemir et al. ECG and mortality in COVID-19 J Health Sci Med 2021; 4(6): 892-896
MATERIAL AND METHOD259 patients admitted to the intensive care unit due to COVID-19 infection between 01.04.2020 and 01.12.2020 were included in the study. The demographic characteristics of the patients, clinical backgrounds, laboratory values at the time of admission to the intensive care unit, and 12 derivation ECG records were obtained from the patient files. Rhythm, PR distance, QRS duration and morphology, QT interval, T wave morphology, presence of atriventricular (AV) block, QRS axis, presence of ventricular premature contraction, frontal plane QRS-T (f(QRS-T)) angle degree were determined on 12 derivation ECG records. Patient groups were classified as "deceased patient" and "survivors" and the relationship of these parameters with survival was tried to be elucidated. This retrospective study was carried out with the permission of Keçiören Trainig and Research Hospital Clinical Researchs Ethics Committee (Date: 22.12.2020, Decision No: 15/2206). All procedures were carried out in accordance with the ethical rules and the principles of the Declaration of Helsinki.
12 leads ECG recordings were performed at a speed of 25mm/sec and with a height of 10 mm/mV. In 12 derivations ECG, recordings with irregular R-R distance without P waves were accepted as atrial fibrillation (AF). Recordings longer than 120 milliseconds were defined as Right Bundle Branch Block or Left Bundle Branch Block according to their morphology. Other wide QRS morphology that does not fit this classification was collected under the interventricular conduction defect (IVCD). The corrected QT (QTc) distance is calculated according to the Bazett formula. All ECG records had automatically reported QRS axis and T axis data. The angle f(QRS-T) was calculated from these angles as the distance between the QRS axis and the T axis.
Statistical AnalysisSPSS for Windows version 23.0 (SPSS Inc., IL, USA) was used for statistical analysis. Continuous variables were expressed as means± standard deviations and categorical variables were expressed as percentages. Continuous data were compared using Student’s t test. Categorical data were compared using the chi-square test. With ch square test, Pearson’s correlation coefficient was used for correlation analysis. A value of p< 0.05 was considered statistically significant.
RESULTSWhen the patient groups were compared, the mean age was higher in the "deceased patient" group (71.15±10.75 vs. 63.09±12.69; p<0.001). When co-morbidities were taken into account, heart failure and history of cerebrovascular events were statistically significantly higher in the
"deceased patient" group, while there was no statistically significant difference in terms of hypertension, coronary artery disease, diabetes mellitus, malignancy, chronic obstructive pulmonary disease and gender (Table 1).
When ECG parameters were examined, the frequency of atrial fibrillation was significantly higher in the "deceased patient" group. For patients in sinus rhythm, there was no difference between the two groups in terms of PR distance and 1st degree AV block. Severe AV block was not observed in either group. There was no difference between the two groups in terms of QRS morphology, T wave inversion, and ventricular premature contractions. QRS duration, corrected QTc duration, and frotal plane QRS-T angle values were found to be statistically significantly higher in in the "deceased patient" group (Table 2).
Tablo 1. Demographic, clinical and laboratory characteristics of the study patients
Died n=101
Survived n=158
P value
Age 71.15±10.75 63.09±12.69 <0.001Gender 0.171 Female 33 (32.7%) 65 (41.1%) Male 68 (67.3%) 93 (58.9%)Hypertension 44 (43.6%) 81 (51.3%) 0.226Diabetes mellitus 23 (22.8%) 38 (24.1%) 0.813Coronary artery disease 21 (20.8%) 28 (17.7%) 0.538
Heart failure 9 (8.9%) 5 (3.2%) 0.046Chronic obstructive pulmonary disease 16 (15.8%) 21 (13.3%) 0.567
Malignancy 6 (5.9%) 12 (7.6%) 0.610Cerebrovascular event 8 (7.9%) 4 (2.5%) 0.044
Glucose (mg/dL) 189.55±96.22 175.69±99.48 0.270Creatinine (mg/dL) 1.22±0.44 1.01±0.31 <0.001GFR (mL/min) 61.51±23.11 80.53±78.19 0.018Albumine (mg/dL) 3.05±0.46 3.36±0.61 <0.001AST (IU/L) 69.89±93.02 43.57±39.29 0.002ALT (IU/L) 51.61±77.61 37.54±42.01 0.061GGT (IU/L) 69.44±83.69 64.10±83.19 0.616LDH (IU/L) 639.64±428.56 391.51±185.71 <0.001CRP (mg/dL) 141.93±99.01 109.52±99.40 0.011Ferritin (ng/mL) 791.42±522.57 465.60±459.42 <0.001D-dimer (mg/L) 6.85±15.19 2.93±9.33 0.012Troponin (ng/L) 532.45±2459.57 33.79±177.63 0.012Lactate (mmol/L) 3.43±2.50 1.21±0.81 <0.001Sat O2 (%) 74.07±8.78 85.79±7.82 <0.001WBC (×103/µL) 12.4899±6.2614 8652.6±3866.1 <0.001Neutrophile (×103/µL) 10.8151±5.8133 7008.4±3917.7 <0.001
Lymphocyte (×103/µL) 992.2±1671.9 1139.1±616.7 0.317
Platelet 241144±113290 257284±98665 0.227Hgb (g/dL) 13.37±2.18 13.34±1.65 0.903(ALT: alanine aminotransferase, AST: aspartate transaminase, CRP: C-reactive protein, GFR: Glomerular Filtration rate, GGT: gamma-glutamyl transpeptidase, Hgb: hemoglobin, LDH: lactic acid dehydrogenase, WBC: white blood cell)

894
Aydemir et al. ECG and mortality in COVID-19J Health Sci Med 2021; 4(6): 892-896
As an acute phase reactant, albumin levels were significantly lower in the “deceased patient” group, and ferritin and C-reactive protein (CRP) levels were significantly higher in the “deceased patient” group. There was a statistically significant difference between the two groups in terms of creatinine, glomerule filtration rate (GFR), aspartate transaminase (AST), lactic acid dehydrogenase (LDH), troponin, d-dimer, lactate and Sat O2, white blood count (WBC), neutrophil count (Table 1).
DISCUSSIONCOVID-19 infection rapidly affected the whole world, reaching high mortality rates with the increase in the number of infected patients and the respiratory stress it caused. The fact that the infection is caused by a newly emerging virus limits the diagnosis and treatment options, and as the knowledge about the disease increases, knowledge about the clinical course and causes of mortality increases.
The 12 derivation ECG is one of the most frequently used tests in emergency services, outpatient clinic visits, inpatient wards and intensive care units. Until today, the relationship between the clinical course and mortality of many diseases, especially cardiovascular diseases, and ECG findings has been revealed. Some studies on COVID-19 disease and ECG have been published, and the number of studies demonstrating its relationship with mortality is small, and different parameters were used in each study (6-10). In this study, we wanted to reveal the relationship between ECG parameters and COVID -19
and emphasize the importance of rhythm character and the frontal plane QRS-t angle, which reflects especially the depolarization-repolarization state.
It is emphasized in the updated atrial fibrillation guidelines that the mortality due to all causes is 1.5-3.5 times higher in patients diagnosed with atrial fibrillation, and the presence of AF in addition to those with cardiovascular disease increases mortality and morbidity (11). Among the 259 patients included in the study, 19 patients had a diagnosis of atrial fibrillation. The clinical course of 18 of these patients ended with mortality. In studies conducted with COVID-19 infection, the relationship between AF and mortality has not been emphasized enough, and considering the results of this study, COVID-19 patients with AF may be considered to be at higher risk for mortality.
QT distance is one of the reflections of the ventricular depolarization and repolarization process on the ECG. The relationship between corrected QT (QTc) duration and ventricular arrhythmias and mortality has been demonstrated (12,13). With prolonged QTc, the frequency of ventricular arrhythmias and mortality rate increases especially in cardiovascular diseases. Prolonged QTc duration has been reported to be associated with prognosis in COVID-19 infection (14,15). In our study, the QTc duration was found to be significantly longer in the “deceased patient” group. Considering the results of the study, the prolonged QTc duration may be considered as a mortality predictor in patients diagnosed with COVID-19. In addition, the number of patients with an abnormal QRS axis other than 0-90 degrees is higher in the “deceased patient” group. There was no significant difference between the two groups in terms of the frequency of ventricular premature contraction (VPC). It was concluded that the frequency of VPC does not have a clear effect on mortality in the study population. There was no significant difference between the two groups in terms of PR duration and the frequency of first degree atrioventricular block in the study population. 2nd and 3rd degree atrioventricular block, which is associated with cardiovascular system morbidity and mortality, was not observed in the rhythm records of both groups.
The frontal plane QRS-T angle f (QRS-T), is another ECG parameter that reflects the ventricular deoplarization-repolarization process (16). In previous studies, increased f (QRS-T) angle was found to be associated with mortality in the general population and cardiovascular disease (17-19). In our study, higher f(QRS-T) angle values were observed in the “deceased patient” group compared to the surviving patients. Increased f(QRS-T) angle was thought to be associated with an increased risk of mortality in patients with a diagnosis of COVID-19.
Table 2. ECG findings and characteristics of the study patientsDied
n=101Survived
n=158 P value
Heart rate (b.p.m) 102.68±25.04 90.77±19.14 <0.001Rythm <0.001 Sinus Rythm 83 (82.2%) 157 (99.4%) Atrial Fibrillation 18 (17.8%) 1 (0.6%)PR interval (msec) 152.70±24.10 154.31±28.48 0.796First degree AV block 3 (3.6%) 8 (5.1%) 0.602QRS (msec) 95.77±16.53 92.04±13.83 0.051QRS morphology 0.489 Normal 77 (76.2%) 129 (81.6%) IVCD 15 (14.9%) 22 (13.9%) LBBB 6 (5.9%) 4 (2.5%) RBBB 3 (3.0%) 3 (1.9%)Ventricular premature contraction 14 (13.9%) 16 (10.1%) 0.360
Corrected QT (msec) 426.75±35.50 416.97±25.66 0.011T wave inversion 14 (13.9%) 11 (7.0%) 0.067Abnormal QRS axis 50 (49.5%) 50 (31.6%) 0.004Frontal Plane QRS-T angle (0) 64.96±52.69 37.90±34.43 <0.001
IVCD: interventricular conduction disease, LBBB: left bundle brunch block, RBBB: right bıundle brunch block

895
Aydemir et al. ECG and mortality in COVID-19 J Health Sci Med 2021; 4(6): 892-896
Considering the demographic characteristics and laboratory results of the study population, there was a higher mean age in the deceased patient group. In previous studies, it was stated that mortality in covid 19 patients increased with increasing age (20,21). Heart failure and history of cerebrovascular disease were statistically significantly higher in the deceased patient group. However, there was no significant difference between the two groups in terms of diseases with high mortality rates such as hypertension, diabetes mellitus, coronary artery disease, chronic obstructive pulmonary disease, malignancy and gender. In addition, as acute phase reactants, low albumin, high CRP and ferritin were statistically significant in the deceased patient group, same as results of previous studies (22,23). In our study, as in previous studies, troponin and d-dimer levels were higher in the patient group who died, and their relationship with mortality was also revealed in this study (24,25).
CONCLUSIONAtrial fibrillation, prolonged QTc duration and increased frontal plane QRS-T angle can be considered as mortality predictors in COVID-19 infection, whose mortality rate is high all over the world. We think that patients with these parameters can be evaluated as high-risk and closely monitored from the time of diagnosis, and positive effects on mortality rates can be achieved.
ETHICAL DECLARATIONSEthics Committee Approval: The study was carried out with the permission of Keçiören Trainig and Research Hospital Clinical Researchs Ethics Committee (Date: 22.12.2020, Decision No: 15/2206).Informed Consent: Because the study was designed retrospectively, no written informed consent form was obtained from patients.Referee Evaluation Process: Externally peer-reviewed. Conflict of Interest Statement: The authors have no conflicts of interest to declare. Financial Disclosure: The authors declared that this study has received no financial support. Author Contributions: All of the authors declare that they have all participated in the design, execution, and analysis of the paper, and that they have approved the final version.
REFERENCES1. Hassan M, Zalkifal M, Wahab A, et al. Novel Coronavirus: A
Review from Origin to Current Status of Therapeutic Strategies.Crit Rev Eukaryot Gene Expr 2021; 31: 21-34.
2. Alves VP, Casemiro FG, Araujo BG, et al. Factors associated with mortality among elderly people in the COVID-19 pandemic (SARS-CoV-2): a systematic review and meta-analysis. Int J Environ Res Public Health 2021; 18: 8008.
3. Ding J, Liu W, Guan H, et al. Corrected QT interval in hospitalized patients with coronavirus disease 2019: focus on drugs therapy. Medicine (Baltimore) 2021; 100: e26538.
4. Bertini M, D'Aniello E, Cereda A, et al. The Combination of chest computed tomography and standard electrocardiogram provides prognostic information and pathophysiological insights in COVID-19 pneumonia. J Clin Med 2021; 10: 3031.
5. Haji Aghajani M, Toloui A, Aghamohammadi M, et al. Electrocardiographic findings and in-hospital mortality of COVID-19 patients; a retrospective cohort study. Arch Acad Emerg Med 2021; 9: e45.
6. McCullough SA, Goyal P, Krishnan U, Choi JJ, Safford MM, Okin PM. Electrocardiographic findings in coronavirus disease-19: insights on mortality and underlying myocardial processes. J Card Fail 2020; 26: 626-632.
7. Lanza GA,De Vita A, Ravenna SE, et al. Electrocardiographic findings at presentation and clinical outcome in patients with SARS-CoV-2 infection. Europace 2021; 23: 123-9.
8. Elias P, Poterucha TJ, Jain SS, et al. The prognostic value of electrocardiogram at presentation to emergency department in patients with COVID-19. Mayo Clin Proc 2020; 95: 2099-109.
9. Wang Y, Chen L, Wang J, et al. Electrocardiogram analysis of patients with different types of COVID-19. Ann Noninvasive Electrocardiol 2020; 25: e12806.
10. Li Y, Liu T, Tse G, et al. Electrocardiograhic characteristics in patients with coronavirus infection: A single-center observational study. Ann Noninvasive Electrocardiol 2020; 25: e12805.
11. Hindricks G, Potpara T, Dagres N, et al 2020 ESC Guidelines for the diagnosis and management of atrial fibrillation developed in collaboration with the European Association of Cardio-Thoracic Surgery (EACTS). Eur Heart J 2020; 42: 373-98.
12. Moss AJ. Measurement of the QT interval and the risk associated with QTc interval prolongation: a review. Am J Cardiol 1993; 72: 23B-25B.
13. Hondeghem LM. QT prolongation is an unreliable predictor of ventricular arrhythmia. Heart Rhythm 2008; 5: 1210-2.
14. Akhtar Z, Gallagher MM, Yap YG, et al. Prolonged QT predicts prognosis in COVID-19.Pacing Clin Electrophysiol 2021; 44: 875-82.
15. Changal K, Paternite D, Mack S, et al. Coronavirus disease 2019 (COVID-19) and QTc prolongation. BMC Cardiovasc Disord 2021; 21: 158.
16. Oehler A, Feldman T, Henrikson CA, Tereshchenko LG.QRS-T angle: a review. Ann Noninvasive Electrocardiol 2014; 19: 534-42.
17. Gotsman I,Keren A, Hellman Y, Banker J, Lotan C, Zwas DR. Usefulness of electrocardiographic frontal QRS-T angle to predict increased morbidity and mortality in patients with chronic heart failure. Am J Cardiol 2013; 111: 1452-9.
18. Aro AL, Huikuri HV, Tikkanen JT, et al. QRS-T angle as a predictor of sudden cardiac death in a middle-aged general population. Europace 2012; 14: 872-6.
19. Lown MT, Munyombwe T, Harrison W, et al. Association of frontal QRS-T angle--age risk score on admission electrocardiogram with mortality in patients admitted with an acute coronary syndrome. Am J Cardiol 2012; 109: 307-13.
20. Liu Y, Mao B, Liang S, et al. Association between age and clinical characteristics and outcomes of COVID-19. Eur Respir J 2020; 55: 5.
21. Moraga P, Ketcheson DI, Ombao HC, Duarte CM. Assessing the age- and gender-dependence of the severity and case fatality rates of COVID-19 disease in Spain.Wellcome Open Res 2020; 5: 117.

896
Aydemir et al. ECG and mortality in COVID-19J Health Sci Med 2021; 4(6): 892-896
22. Jain AC, Kansal S, Sardana R, Bali RK, Kar S, Chawla R. A retrospective observational study to determine the early predictors of in-hospital mortality at admission with COVID-19. Indian J Crit Care Med 2020; 24: 1174-9.
23. Deng F, Zhang L, Lyu L, et al. Increased levels of ferritin on admission predicts intensive care unit mortality in patients with COVID-19. Med Clin (Barc) 2021; 156: 324-31.
24. Zhang L, Yan X, Fan Q, et al. D-dimer levels on admission to predict in-hospital mortality in patients with COVID-19. J Thromb Haemost 2020; 18: 1324-9.
25. Lippi G, Lavie CJ, Sanchis-Gomar F. Cardiac troponin I in patients with coronavirus disease 2019 (COVID-19): evidence from a meta-analysis. Prog Cardiovasc Dis 2020; 63: 390-1.

HEALTH SCIENCESMEDICINE
Original Article
J Health Sci Med 2021; 4(6): 897-900
This work is licensed under a Creative Commons Attribution 4.0 International License.
DOI: 10.32322/jhsm.981374
Received: 11.08.2021 Accepted: 02.09.2021Corresponding Author: Mehmet Demir, [email protected]
Evaluation of the diagnostic efficiency of systemic immune-inflammation index in prostate biopsy
Mehmet Demir, İsmail Yağmur, Eyyup Sabri Pelit, Bülent Katı, İbrahim Halil Albayrak, Halil Çiftçi
Harran University, Department of Urology, Şanlıurfa, Turkey
Cite this article as: Demir M, Yağmur İ, Pelit ES, Katı B, Albayrak İH, Çiftçi H. Evaluation of the diagnostic efficiency of systemic immune-inflammation index in prostate biopsy. J Health Sci Med 2021; 4(6): 897-900.
ABSTRACTAim: This study aimed to evaluate the diagnostic efficacy of systemic immune-inflammation index (SII) in patients with prostate cancer (PCa) who have undergone prostate biopsy and have a prostate-specific antigen (PSA) value of 4–10 ng/ml.Material and Method: In this study we included patients with a PSA value of 4–10 ng/mL, who underwent transrectal ultrasound-guided 12-core prostate biopsy between January 2010 and March 2021. The patients were divided into two groups as those with and without cancer. Those with cancer were divided into two groups as low grade (grade 1 and 2) and high grade (grade 3–5) according to the International Society of Urologic Pathologists (ISUP) grades. PSA, neutrophil-lymphocyte ratio (NLR), prostate volume, platelet-to-lymphocyte ratio (PLR) and SII were compared between the groups.Results: The mean age of the 182 patients included in the study was 63.4±8.0 years, and the mean PSA value was 6.69±2.45 ng/mL. Benign prostate disease were detected in 142 (78%) of the patients and PCa in 40 (22%) patients. PSA, PLR, NLR and SII did not differ in those with cancer. Low ISUP grade cancer was detected in 80% of the patients and high ISUP grade cancer in 20%. PSA and PLR values were significantly higher in patients with high ISUP grade PCa compared to those with low ISUP grade (p < 0.05). There was no difference in SII values between the two groups. PSA, PLR and SII values of patients with high ISUP grade PCa were significantly higher than those without cancer (p<0.05).Conclusions: SII and PLR, which can be easily calculated from peripheral blood, can be an effective predictor of pre-biopsy high-grade ISUP PCa.
Keywords: Prostate cancer, diagnosis, systemic immune-inflammation index, platelet-to-lymphocyte ratio, biopsy
Ana Metin-Alt bilgi Arası 5mm
Cite-Öz arası 5mm
Başlık-Yazarlar arası 12mm
Yazar-Kurum arası 2,5 mm
Kurum-Cite arası 5mm
Öz-Abstract arası 7,5mm
INTRODUCTIONProstate cancer (PCa) is the most common cancer in men following lung cancer. Mortality rates vary worldwide, with the highest being in the African descent and lowest in Asian (1). The use of serum prostate-specific antigen (PSA) has become widespread due to the increasing elderly population. Accordingly, prostate biopsy rates have increased significantly. Although the PSA value to predict cancer remains unknown, 4 ng/mL is used as a cut-off value for prostate biopsy (2). Since PSA can increase in benign prostate diseases, it is not an ideal biomarker for PCa (3). PCa was detected in approximately 25% of prostate biopsies performed with a cut-off value of 4.0 ng/mL; however, approximately 50% of the detected cancers were clinically insignificant (4). PSA density and free PSA/total PSA are used in the differentiation of cancer and benign diseases; however, their sensitivity
and specificity are low (5). Therefore, there is a need for effective biomarkers to detect clinically important cancer.
Inflammation is an important predictor of tumour invasion and progression (6) and plays a role in PCa development (7). Therefore, inflammation parameters, such as neutrophil-to-lymphocyte ratio (NLR) and platelet-to-lymphocyte ratio (PLR) are used as tumour markers. Systemic immune-inflammation index (SII) is a new inflammatory marker calculated from lymphocytes, neutrophils and platelets and is used in cancer diagnosis and prognosis (8). In this study, we aimed to evaluate the effectiveness of NLR, PLR and SII in distinguishing PCa and clinically important cancer in patients with a PSA value of 4–10 ng/mL and who underwent biopsy for PCa screening.

898
Demir et al. Systemic immune-inflammation index in prostate cancer diagnosis J Health Sci Med 2021; 4(6): 897-900
MATERIAL AND METHODThe study was carried out with the permission of Harran University Clinical Researchs Ethics Committee (Date: 12.04.2021, Decision No: HRU/21.08.07). All procedures were carried out in accordance with the ethical rules and the principles of the Declaration of Helsinki.
The data of patients who underwent prostate biopsy for prostate cancer screening between January 2010 and March 2021 were retrospectively reviewed. Patients with a total PSA value of 4–10 ng/mL were included in the study. Patients who had previously undergone prostate biopsy and those with suspected cancer during the rectal examination were not included in the study. Before the biopsy, urine culture and complete blood count were performed. Appropriate treatment was applied to patients with infection in the analysis results, and biopsy was performed after their cultures were negative. All patients received antibiotic prophylaxis before the biopsy. All patients underwent a 12-core prostate biopsy using an 18 gauge Tru-Cut needle accompanied by transrectal ultrasound. From the complete blood count results, NLR, PLR and SII (neutrophil count x platelet count / lymphocyte count) were calculated. Prostate volume was calculated according to the formula 0.52× transverse × anteroposterior × transverse × longitudinal diameters. The patients were divided into two groups those with and those without PCa. Those with PCa were divided into two groups low ISUP grade (grade 1 and 2) and high ISUP grade (grade 3–5) according to the International Society of Urological Pathology 2014. Age, PSA, prostate volume, lymphocyte, neutrophil, platelet, NLR, PLR and SII were compared between the groups.
Statistical AnalysisMean, lowest and highest median values, standard deviation, ratio values and frequency were used in the descriptive statistics of the data. Kolmogorov–Smirnov test was used to measure the distribution of variables. Quantitative independent data was analyzed using independent samples t-test and Mann–Whitney U test. SPSS 27.0 was used for statistical analyses.
RESULTSThe mean age of the 182 men included in the study was 63.4±8.0 years, and the mean PSA value was 6.69±2.45 ng/mL (Table 1).
Benign prostate diseases were detected in 142 (78%) patients and PCa in 40 (22%) patients. There was no significant difference (p>0.05) in age, prostate volume, PSA value, lymphocyte value, neutrophil value, NLR, PLR and SII ratio between the groups with and without PCa. Platelet value was significantly higher (p<0.05) in the group with PCa than in the group without PCa (Table 2).
Low ISUP grade cancers were detected in 80% of the patients and high ISUP grade cancers in 20% of the patients. Patients' age, lymphocyte value, neutrophil value, NLR ratio and SII ratio did not differ between the low ISUP grades and high ISUP grades groups (p> 0.05). PSA value, platelet value and PLR were significantly higher (p<0.05) in the group with high ISUP grades compared to the group with low ISUP grades (Table 3). PSA, PLR and SII were significantly higher in patients with high ISUP grade PCa compared with those without cancer (p<0.05).
Table 1. Characteristics of the patientsMin-Max Median Mean±sd/n-%
Age 44.0-78.0 63.0 63.4±8.0PSA 4.00-10.00 6.294 6.69±2.45Lymphocyte 0.40-4.40 1.90 2.05±0.79Neutrophil 1.50-45.00 5.25 5.69±3.75Platelet 111.0-446.0 267.5 267.8±66.0NLR 0.71-15.52 2.64 3.16±2.24PLR 47.1-757.5 129.6 148.6±82.9SII 160.3-4851.7 698.6 843.2±656.4
ISUP grade
I 23 57.5%II 9 22.5%III 3 7.5%IV 3 7.5%V 2 5.0%
NLR: Neutrophil lymhocyte ratio, PLR: Platelet lymphocyte ratio, SII: Systemic inflammation index
Table 2. Comparison of patients according to biopsy resultsNo cancer n:142 Cancer n:40 pMean±sd Median Mean±sd Median
Age 63.3±8.0 63.0 63.4±83.3 66.0 0.986t
PSA 6.61±2.62 6.24 6.93±1.91 6.50 0.226m
Prostate volume (mL) 50.8±29.2 48.00 47.7±16.9 46.00 0.08m
Lymphocyte 2.00±0.67 1.90 2.19±0.85 2.10 0.080m
Neutrophil 5.72±4.21 5.10 5.62±2.01 5.60 0.416m
Platelet 253.1±62.0 255.5 308.9±59.9 296.5 0.000m
NLR 3.11±1.91 2.72 3.29±3.00 2.27 0.253m
PLR 138.4±52.9 126.0 177.2±132.2 144.8 0.146m
SII 780.4±498.0 714.6 1019.3±958.9 694.3 0.376m
t: t test, m: Mann-Whitney u test, statistically significant results are in bold italics (p<0,05), NLR: Neutrophil lymhocyte ratio, PLR: Platelet lymphocyte ratio, SII: Systemic inflammation index
Table 3. Comparison of patients according to ISUP grades ISUP Grade I-II ISUP Grade III-IV-V
p Mean±sd Median Mean±sd MedianAge 62.5±8.0 64.5 66.9±8.9 67.0 0.249m
PSA 6.55±1.74 6.10 8.44±1.93 9.20 0.016m
Lymphocyte 2.23±0.77 2.20 2.04±1.17 1.75 0.278m
Neutrophil 5.71±1.92 5.60 5.26±2.43 5.40 0.735m
Platelet 293.3±52.1 286.0 371.0±49.5 368.5 0.001m
NLR 3.16±2.72 2.29 3.78±4.15 2.10 0.685m
PLR 159.5±121.6 130.0 248.0±157.6 222.7 0.046m
SII 934.1±800.6 667.3 1359.9±1455.4 823.0 0.279m
mMann-whitney u test, statistically significant results are in bold italics (p<0.05), NLR: neutrophil lymhocyte ratio, PLR: platelet lymphocyte ratio, SII: systemic inflammation index

899
Demir et al. Systemic immune-inflammation index in prostate cancer diagnosisJ Health Sci Med 2021; 4(6): 897-900
DISCUSSIONOnly half of the patients with PCa develop symptomatic disease throughout their lives (4). With the widespread use of PSA, a significant increase is observed in the diagnosis of clinically insignificant PCa (9,10). While increased diagnosis leads to overtreatment, its impact on patients' overall quality of life is still uncertain (11). In patients with ISUP grade 1–2 PCa, the mortality rate is 7% in 15 years of follow-up, which is quite low (12). In addition, studies have shown that 10% of patients with clinically insignificant cancer develop severe depression as a side effect (13). Therefore, it is important to detect clinically significant PCa by avoiding overdiagnosis in patients with PSA values of <10 ng/ml and no evidence of disease on rectal examination. In this study, cancer was detected in 22% of the patients who underwent prostate biopsy. Low ISUP grade (grade 1; 57.5%, grade 2; 22.5%) PCa was detected in 80% of these patients. These rates were similar to previous studies (4).Inflammation is an important predictor of tumour invasion, progression and metastasis; additionally, it plays a role in PCa development (7,14,15). Inflammatory markers, such as lymphocyte count, NLR, PLR and lymphocyte-to-monocyte ratio, are used in determining the diagnosis and prognosis of cancer due to their affordability and availability (16).
SII is calculated from the combination of NLR and the number of platelets, and studies emphasise that it may be a better marker than NLR (17). Recent studies have shown that high SII values in urological cancers are associated with poor prognosis (8,18). Görgel et al. (19) reported that preoperative high SII value could be an independent prognostic factor in patients with muscle-invasive bladder tumour who underwent radical cystectomy, and cancer-specific survival was low in patients with SII>843. Another study evaluating patients who underwent nephroureterectomy for upper urinary tract ureteral cancers showed that high SII value is associated with high pathological stage and poor prognosis (20).
Studies examining the role of SII in PCa have been published in the recent years. Stangl-Kremser et al. (21) reported that SII may be a predictor of overall survival in patients with castration-resistant PCa. In the study by Rajwa et al. (22), in which the preoperative SII values of patients who underwent salvage radical prostatectomy were examined, it was shown that high SII value was a predictor for lymph node involvement and non-organ-confined disease. Another study published recently has investigated the effect of SII in cancer detection in patients who have undergone prostate biopsy. This study could not show an effect of SII in the distinction between PCa and benign prostate disease (23). In their study evaluating patients who underwent fission prostate biopsy, Sönmez et al. reported
similar SII between benign prostatic diseases and low ISUP grades (grade 1 and 2) PCa. However, it was observed that SII was significantly higher in patients with high ISUP grades (grade 3–5) PCa (24). It has been reported that SII can be a predictor in detecting clinically important PCa. Although the SII value in patients with PCa in our study was higher than benign prostatic diseases, this difference was not statistically significant. Regarding the patients with PCa, there was no statistical difference between those with low ISUP grades and high ISUP grades. However, in patients with high ISUP grade PCa, the SII value was statistically significantly higher than benign prostatic diseases. Therefore, we think that SII can be a predictor in detecting clinically important PCa.
Patients with cancer usually have a hypercoagulable state. Platelets are an effective parameter in the progression of cancer and the prothrombotic state of the cancer patient. (25). Li et al. (15) reported that PLR value increases in patients with PCa and is an independent predictor of 3-year mortality. Adhyatma et al. (26) reported that PLR is a promising predictor of cancer in patients with suspected PCa. On the contrary, Murray et al. (23) found that PLR was similar between those with cancer and those with a benign prostate disease in patients who underwent prostate biopsy. In another study of metastatic PCa patients receiving hormonal therapy, NLR and PLR could not be associated with disease-specific survival, but platelet count was shown to be an independent prognostic factor (27). While the platelet value was significantly higher in patients with PCa in our study, PLR did not differ. However, in patients with high ISUP grades PCa, PLR and platelet values were significantly higher than those with both low ISUP grades PCa and benign prostate disease.
Our study includes some limitations. The first is the low number of patients. The reason for this is that patients with PSA >10 and patients with suspected cancer on rectal examination were excluded from the study. Another limitation is that the study is retrospective.
CONCLUSIONIn PCa screening, ideal biomarkers that can differentiate benign and malignant tumours and detect clinically important cancer are needed to avoid unnecessary biopsies and overtreatment, especially in men with a PSA value in the gray zone (4–10 ng/mL) and no evidence of rectal examination. In our study, we showed that SII and PLR were higher in patients with higher ISUP grades than those with benign pathology. We think that SII and PLR, which can be easily calculated from peripheral blood, can be used as predictors of high ISUP grade PCa before performing a biopsy. For this, prospective studies with high numbers are needed.

900
Demir et al. Systemic immune-inflammation index in prostate cancer diagnosis J Health Sci Med 2021; 4(6): 897-900
ETHICAL DECLARATIONSEthics Committee Approval: The study was carried out with the permission of Harran University Clinical Researchs Ethics Committee (Date: 12.04.2021, Decision No: HRU/21.08.07).Informed Consent: Because the study was designed retrospectively, no written informed consent form was obtained from patients.Referee Evaluation Process: Externally peer-reviewed. Conflict of Interest Statement: The authors have no conflicts of interest to declare. Financial Disclosure: The authors declared that this study has received no financial support. Author Contributions: All of the authors declare that they have all participated in the design, execution, and analysis of the paper, and that they have approved the final version.
REFERENCES1. Ferlay J, Soerjomataram I, Dikshit R, et al. Cancer incidence and
mortality worldwide: sources, methods and major patterns in GLOBOCAN 2012. Int J Cancer 2015; 136: E359-86.
2. Canby-Hagino E, Hernandez J, Brand TC, Thompson I. Looking back at PCPT: looking forward to new paradigms in prostate cancer screening and prevention. Eur Urol 2007; 51: 27-33.
3. Vickers AJ, Sjoberg DD, Ulmert D, et al. Empirical estimates of prostate cancer overdiagnosis by age and prostate-specific antigen. BMC Med 2014; 12: 26.
4. Finne P, Fallah M, Hakama M, et al. Lead-time in the European Randomised Study of screening for prostate cancer. EurJ Cancer 2010; 46: 3102-8.
5. Catalona WJ, Southwick PC, Slawin KM, et al. Prospective evaluation of percent free PSA, PSA density and age specific PSA cut-offs for prostate cancer detection and staging. Urology 2000; 56: 255-60.
6. Bausch D, Pausch T, Krauss T, et al. Neutrophil granulocyte derived MMP-9 is a VEGF independent functional component of the angiogenic switchin pancreatic ductal adenocarcinoma. Angiogenesis 2011; 14: 235-43.
7. Yuksel OH, Urkmez A, Akan S, Yidirim C, Verit A. Predictive value of the platelet to lymphocyte ratio in the diagnosis of prostate cancer. Asian Pac J Cancer Prev 2015; 16: 6407-12.
8. Huang Y, Gao Y, Wu Y, Lin H. Prognostic value of systemic immune-inflammation index in patients with urologic cancers: a meta-analysis. Cancer Cell Int 2020; 20: 499.
9. Ilic D, Neuberger MM, Djulbegovic M, Dahm P. Screening for prostate cancer. Cochrane Database Syst Rev 2013; 31: CD004720.
10. Hayes JH, Barry MJ. Screening for prostate cancer with the prostate-specificantigen test: a review of current evidence. JAMA 2014; 311: 1143-9.
11. Booth N, Rissanen P, Tammela TL, Määttänen L, Taari K, Auvinen A. Health-related quality of life in the Finnish trial of screening for prostate cancer. Eur Urol 2014; 65: 39-47.
12. Albertsen PC. Observational studies and the natural history of screen-detected prostate cancer. Curr Opin Urol 2015; 25: 232-7.
13. Bellardita L, Villa S, Valdagni R. Living with untreated prostate cancer: predictors of quality of life. Curr Opin Urol 2014; 24: 311-7.
14. Ostan R, Lanzarini C, Pini E, et al. Inflammaging and cancer: a challenge for the Mediterranean diet. Nutrients 2015; 7: 2589-621.
15. Li F, Hu H, Gu S, Chen X, Sun Q. Platelet to lymphocyte ratio plays an important role in prostate cancer's diagnosis and prognosis. Int J Clin Exp Med 2015; 8: 11746-51.
16. Palacka P, Mego M, Mikulova T, et al. Systemic immune-inflammation index to predict survival in Caucasian patients with metastatic urothelial carcinoma. J Clin Oncol 2017; 35: e16015.
17. Aziz MH, Sideras K, Aziz NA, et al. The systemic-immune-infammation index independently predicts survival and recurrence in resectable pancreatic cancer and its prognostic value depends on bilirubin levels: a retrospective multicenter cohort study. Ann Surg 2019; 270: 139-46.
18. Wang Q, Zhu SR, Huang XP, Liu XQ, Liu JB, Tian G. Prognostic value of systemic immune-inflammation index in patients with urinary system cancers: a meta-analysis. Eur Rev Med Pharmacol Sci 2021; 25: 1302-10.
19. Gorgel SN, Akin Y, Koc EM, Kose O, Ozcan S, Yilmaz Y. Retrospective study of systemic immune-inflammation index in muscle invasive bladder cancer: initial results of single centre. Int Urol Nephrol 2020; 52: 469-73.
20. Mori K, Resch I, Miura N, et al. Prognostic role of the systemic immune-inflammation index in upper tract urothelial carcinoma treated with radical nephroureterectomy: results from a large multicenter international collaboration. Cancer Immunol Immunother 2021; 70: 2641-50.
21. Stangl-Kremser J, Mari A, Suarez-Ibarrola R, et al. Development of a prognostic model for survival time prediction in castration-resistant prostate cancer patients. Urol Oncol 2020; 38: 600.
22. Rajwa P, Schuettfort VM, Quhal F, et al. Role of systemic immune-inflammation index in patients treated with salvage radical prostatectomy. World J Urol 2021; 17.
23. Murray NP, Fuentealba C, Salazar A, Reyes E. Platelet-to-lymphocyte ratio and systemic immune-inflammation index versus circulating prostate cells to predict significant prostate cancer at first biopsy. Turk J Urol 2020; 46: 115-22.
24. Sonmez G, Demirtas T, Tombul ST, Akgun H, Demirtas A. Diagnostic efficiency of systemic immune-inflammation index in fusion prostate biopsy. Actas Urol Esp 2021; 45: 359-65.
25. Riedl J, Kaider A, Marosi C, et al. Decreased platelet reactivity in patients with cancer is associated with high risk of venous thromboembolism and poor prognosis. Thromb Haemost 2017; 117: 90-8.
26. Adhyatma KP, Warli SM. Diagnostic value of platelet-to-lymphocyte ratio in prostate cancer. Open Access Maced J Med Sci 2019; 7: 1093-6.
27. Shimodaira K, Nakashima J, Nakagami Y, et al. Prognostic Value of Platelet Counts in Patients with Metastatic Prostate Cancer Treated with Endocrine Therapy. Urol J 2020; 17: 42-9.

HEALTH SCIENCESMEDICINE
Original Article
J Health Sci Med 2021; 4(6): 901-906
This work is licensed under a Creative Commons Attribution 4.0 International License.
DOI: 10.32322/jhsm.982130
Received: 12.08.2021 Accepted: 02.09.2021Corresponding Author: Tekin Yıldırım, [email protected]
Analysis of Helicobacter pylori positiveness and upper gastrointestinal system endoscopy results of Yozgat region in Turkey
Tekin Yıldırım, Muhammed Alperen DursunYozgat BozokUniversity, Faculty of Medicine, Department of Internal Medical Sciences, Yozgat, Turkey
Cite this article as: Yıldırım T, Dursun MA. Analysis of Helicobacter pylori positiveness and upper gastrointestinal system endoscopy results of Yozgat region in Turkey. J Health Sci Med 2021; 4(6): 901-906.
ABSTRACTAims: The aim of this study is to analyze the endoscopy and pathology results of patients who underwent endoscopy in Yozgat region, to determine the frequency of Helicobacter pylori (H. pylori) positivity and to compare the results with the data in the literature.Material and Method: Among the patients who applied to our clinic for any reason between 01/01/2019 and 31/12/2019, 772 patients who underwent upper gastrointestinal system endoscopy were included in the study and analyzed retrospectively.Results: The mean age of the patients was 50±16.78 (16–89). 61.3% (n=473) of the patients were female; 38.7% (n=299) were male. When gastroscopic diagnoses were evaluated, the rate of patients reported as "normal upper gastrointestinal endoscopy" was found to be 5.2% (n= 40). The most frequently reported diagnosis was “nonerosive gastritis” with a rate of 59.2% (n=457). Biopsy was obtained in 646 of 772 patients. The most common diagnosis was reported as “chronic active gastritis” with 90.6% (n=585). 626 of the patients had H. pylori pathological evaluation results. While 18.7% (n=117) of the patients were found to be H. pylori negative, 81.3% (n=509) were found to be H. pylori positive. Stomach cancer was found to be 1.3% (n=9) and esophageal cancer was found to be 0.1% (n=1).Conclusion: In the Yozgat region, the frequency of H. pylori positivity was found to be 81.3%, and it is often mildly (+) positive. In addition, the frequency of H. pylori positivity was similar between men and women, consistent with the literature. The most common diagnosis was reported as "chronic active gastritis". While stomach cancer was detected at a rate of 1.3%, esophageal cancer was found at a rate of 0.1%.
Keywords: Upper gastrointestinal endoscopy, Helicobacter pylori, histopathology, gastric cancer, esophageal cancer
Ana Metin-Alt bilgi Arası 5mm
Cite-Öz arası 5mm
Başlık-Yazarlar arası 12mm
Yazar-Kurum arası 2,5 mm
Kurum-Cite arası 5mm
Öz-Abstract arası 7,5mm
INTRODUCTIONUpper gastrointestinal endoscopy (Esophago-gastroduodenoscopy) is the most reliable diagnostic method widely used in the diagnosis of esophageal, stomach and proximal duodenal diseases. The advantage of endoscopy is to see the inner surface of the organ directly, to perform pathological sampling from the lesions, and to apply endoscopic treatment when necessary. For treatment purposes, interventional procedures such as excision of the polyp, control of upper and lower gastrointestinal system bleeding (esophageal varices bleeding, sclerotherapy, coagulation), and removal of foreign bodies can be performed (1).
The most common symptoms of upper gastrointestinal system diseases can be detected as dysphagia, dyspepsia,
nausea and vomiting, retrosternal burning, epigastric pain, bleeding, and weight loss. These symptoms may indicate a benign or malignant condition. Therefore, patients with these symptoms should be evaluated with endoscopy (2,3).
H. pylori is a frequently encountered gram-negative pathogenic bacterium that affects almost half of the world population (4). H. pylori is implicated as an important pathogen in some diseases; chronic gastritis, peptic ulcer, nonulcer dyspepsia, gastric carcinoma and MALT lymphoma are the main ones (5). It is estimated that 50-90% of the world population is infected with H. pylori (6,7).

902
Yıldırım et al. Upper gastrointestinal system endoscopy results & Helicobacter pylori J Health Sci Med 2021; 4(6): 901-906
H. pylori is a human pathogen that is transmitted from person to person and causes chronic active gastritis (of varying severity) in all colonized subjects. H. pylori gastritis is considered an infectious disease regardless of the symptoms of the individual and the stage-complications of the disease (8). In 1994, when the World Health Organization International Agency for Research on Cancer concluded that H. pylori is a definite carcinogen in humans, attention was focused on this bacterium (9). The need for endoscopy is increasing due to increasing gastrointestinal malignancies, increased frequency of H. pylori and widespread screening programs.
The gold standard for the diagnosis of H. pylori is the histopathological examination of the samples taken by gastroscopic biopsy and the demonstration of the bacterium by culture (10,11).
In this study, we aimed to retrospectively determine and present the frequency of esophageal, stomach and proximal duodenum diseases and the frequency of H. pylori in endoscopic biopsy samples, and its relationship with age and gender in patients admitted to a tertiary hospital and undergoing upper gastrointestinal system endoscopy.
MATERIAL AND METHODThe study was carried out with the permission of Yozgat Bozok University Clinical Research Ethics Committee (Date: 14.04.2021, Decision No: 2017-KAEK-189_2021.04.14_04). All procedures were carried out in accordance with the ethical rules and the principles of the Declaration of Helsinki.
In our study, 772 patients who underwent upper gastrointestinal endoscopy for any reason in the endoscopy unit of a tertiary hospital between 01/01/2019 and 31/12/2019 were retrospectively analyzed. The patients' endoscopy reports, tissue biopsy pathology reports and other information were obtained from hospital records.
It was observed that all endoscopic procedures were performed under pharyngeal local anesthesia and sedated anesthesia (propofol i.v.) after 8 hours of fasting. The age, gender and esophagus, stomach and proximal duodenum findings in the endoscopy reports of the patients were determined.
Biopsy preparations taken for H. pylori and histopathological diagnosis were stained with hematoxylin-eosin and modified giemsa and examined under light microscopy, and reported as (+) mild, (++) moderate, (+++) severe positive according to the bacterial density in the preparations. It was observed that PNL activation, Hp activity, chronic inflammation, intestinal metaplasia, presence of atrophy were graded according to Sydney classification (Table 1) (12). It was observed that more advanced staining and techniques were used in malignant cases. Pathological data were obtained from these reports.
Statistical AnalysisSPSS version 20.0 (Statistical Package for Social Sciences) program was used for statistical analysis of the findings. Descriptive statistics were used in the analysis of the data. While continuous variables were expressed as mean±standard deviation (SD), nominal variables were expressed as percentages. Chi-square test and Mann-Whitney U test were used to evaluate the relationship between groups. P value <0.05 was considered statistically significant.
RESULTSWhen the retrospective files were scanned, it was determined that 772 patients underwent upper gastrointestinal endoscopy between 01/01/2019 and 31/12/2019. The mean age of the patients was 50±16.78 (16–89). 61.3% (n=473) of the patients were female; 38.7% (n=299) were male.
When gastroscopic diagnoses were evaluated, the rate of patients reported as "normal upper gastrointestinal endoscopy" was found to be 5.2% (n=40). The most
Table 1. Sydney Classification (11)Feature Definition Garding guidelinesChronic inflammation
Increased lymphocytes and plasma cells in the lamina propria Mild, moderate, or severe increase in density
Activity Neutrophilic infiltrates of the laminapropria, pits, or surface epithelium
Mild: < 1/3 of pit and surface infiltratedModerate: 1/3 - 2/3 of pit and surface infiltratedSevere: > 2/3 of pit and surface infiltrated
Atrophy Loss of specialized glands from either antrum or corpus
Mild: mild lossModerate: moderate lossSevere: severe loss
Intestinal metaplasia Intestinal metaplasia of the epithelium
Mild: < 1/3 of mucosa involvedModerate: 1/3 - 2/3 of mucosa involved Severe: > 2/3 of mucosa involved
Helicobacter pylori Density of H. pylori overlying epithelium
Mild: scattered organism covering < 1/3 of surfaceModerate: intermediate numbersSevere: large cluster or a continuous layer over > 2/3 of surface

903
Yıldırım et al. Upper gastrointestinal system endoscopy results & Helicobacter pyloriJ Health Sci Med 2021; 4(6): 901-906
frequently reported diagnosis was “nonerosive gastritis” with a rate of 59.2% (n=457). Gastric ulcer rate was 6% (n=46); duodenal ulcer rate was found to be 2.3% (n=17). A mass lesion suggesting malignancy in the stomach was found to be 1.3% (n=10). Esophagitis was reported as 23.4% (n=181), varicose veins in the esophagus 0.8% (n=6) and a mass lesion suggesting malignancy in the esophagus was reported as 0.1% (n=1) (Table 2).
When the pathological diagnoses were examined, it was determined that biopsy was taken in 646 of 772 patients. The most common diagnosis was reported as “chronic active gastritis” with 90.6% (n=585). It was observed that chronic atrophic gastritis was reported with a rate of 4.8% (n=31). Gastric adenocarcinoma rate was 1.2% (n=8), neuroendocrine tumor rate was 0.1% (n=1), and esophageal squamous cell cancer rate was 0.1% (n=1) (Table 3).
626 of the patients had H. pylori pathological evaluation results. While 18.7% (n=117) of the patients were found to be H. pylori negative, 81.3% (n=509) were found to be H. pylori positive. The rates of positivity degrees according to Sydney Classification in H. pylori positive patients are given in Table 4.
When the relationship between H. pylori status and gender was examined, it was found that there was no significant relationship (p=0.595). When the relationship between H. pylori status and age was examined, it was found that there was no significant relationship (p=0.195).
When metaplasia was examined, metaplasia was found in 8.6% (n=53) of 615 patients. When atrophy was examined, it was found that 16.3% (n=100) of 613 patients had atrophy.
DISCUSSIONIn addition to the use of upper gastrointestinal endoscopy for diagnostic purposes in esophagus, stomach and proximal duodenal diseases, its therapeutic use is becoming widespread with the development of therapeutic endoscopes.
Esophageal cancer is the 8th most common cancer in the world and ranks 6th in cancer-related deaths (13). Esophageal cancers are more common in developing countries and these cancers are usually detected at an advanced stage (inoperable period). Esophageal cancer is more common in males. According to 2013 statistical data in Turkey, the incidence of esophageal cancer is 1.3 per hundred thousand in women and 2.1 per hundred thousand in men (14).
In studies conducted in our country, the incidence of esophageal cancer shows regional differences. Esophageal cancer was detected in 4.3% of the patients who underwent endoscopy in the study conducted in the Van basin in the Eastern Anatolia Region. 61% of the patients were women and 39% were men, and esophageal cancer was 1.5 times more common in women than in men. The mean age was determined as 54.7 (15). In a study conducted in the Harran Region, the incidence of esophageal cancer was found to be 0.2% in a series of 5286 patients (16). In a study evaluating 6912 upper gastrointestinal endoscopy performed in the Elazig region, esophageal cancer was reported as 0.1%.
Table 2. Diagnoses, patient numbers and rates reported in upper gastrointestinal endoscopy
Endoscopic Diagnoses Number of patients (n)
Patient ratio (%)
Normal Endoscopy 40 5.2Nonerosive Gastritis 457 59.2Pangastritis 44 5.7Erosive Gastritis 42 5.4Alkaline Reflu Gastritis 49 6.3Gastric Ulcer 46 6Gastric Malignant Mass Lesion 10 1.3Gastric Polyp 14 1.8Bulbit 33 4.3Duodenal Ulcer 17 2.2Esophagitis 181 23.4Lower Esophageal Sphincter Slackness 178 23Hiatal Hernia 11 1.4Esophageal Varicose 6 0.8Esophageal Diverticulum 1 0.1Esophageal Malignant Mass Lesion 1 0.1İnlet Patch 10 1.3
Table 3. Reported pathological diagnoses, patient numbers and rates
Endoscopic Diagnoses Number of patients (n)
Patient ratio (%)
Chronic Active Gastritis 585 90.6Chronic Atrophic Gastritis 31 4.8Stomach Adenocarcinoma 8 1.2Gastric Neuroendocrine Tumor 1 0.1Hyperplastic adenoma 8 1.2Tubular Adenoma 2 0.2Tubulovillous Adenoma 1 0.1Xanthelasma 1 0.1Esophageal Columnar Metaplasia 2 0.2Squamous Cell Carcinoma of the Esophagus 1 0.1
Celiac Disease 2 0.2
Table 4. Rates of Helicobacter pylori positivity according to Sydney classification
Degree of Positivity Number of patients (n)
Rate of patients (%)
Helicobacter pylori +1 379 74.5Helicobacter pylori +2 103 20.2Helicobacter pylori +3 27 5.3

904
Yıldırım et al. Upper gastrointestinal system endoscopy results & Helicobacter pylori J Health Sci Med 2021; 4(6): 901-906
In a study conducted in the Western Black Sea Region, the rate of esophageal cancer was reported as 0.06% in 7703 patients who underwent upper gastrointestinal endoscopy (17). In a study conducted in Aydın Region, upper gastrointestinal malignancy was detected with a rate of 2.71% in endoscopic examinations (18). In our study, the detection rate of esophageal cancer in the Yozgat Region was found to be 0.1% (n=1).
While gastric cancer is the fourth most common type of cancer in the world, it ranks third in cancer-related deaths (19). Gastric cancer is the most common type of cancer in women after breast and colorectal cancers in our country. In men, it is the most common type of cancer after lung cancer. In general, it occurs twice as often in men than in women. The average age of occurrence is between 60-70 years (20,21). The incidence of gastric cancer in our country varies between 0.5-4% (17). In a study involving 504 gastric cancers in Erzurum Region, 36.1% of gastric cancer patients were female and 63.9% male, and the mean age of the patients was 62.4 years (22). In a study conducted in the Elazig Region, gastric cancer was detected with a rate of 1.3% in upper gastrointestinal endoscopy (17). In a study conducted in the Harran Region, the frequency of gastric cancer was found to be 0.5% in a series of 5286 patients (16). Gastric cancer in the Van Region was found 1.6 times more frequently in men than in women. The mean age of the cases was 54.8, and it was most common between the ages of 51-60 (39%) (15). In our study, the incidence of gastric cancer was 1.3% (n=9) in 772 patients who underwent upper gastrointestinal endoscopy. The findings are similar to the literature. Gastric adenocarcinoma was detected in 8 patients, and gastric neuroendocrine tumor was detected in 1 patient.
There are various diagnostic methods used in the detection of H. pylori infection. These methods are divided into invasive methods that require endoscopic gastric mucosal biopsy and noninvasive methods that do not require endoscopy. Invasive tests; culture, histopathological test, rapid urease test and PCR. Noninvasive tests consist of Urea breath test, serological tests and Helicobacter pylori antigen in stool (10,11).
In studies conducted in different regions of Turkey and on different dates, it has been reported that the frequency of H. pylori is found to be between 43-88.6%, the frequency varies between regions and age groups, and tends to decrease with age in recent years (23-37). Özardalı et al. (28) in 1998, Uyanıkoğlu et al. (24) in 2012, in their study covering the Şanlıurfa region and including cases with different endoscopic diagnoses; reported H. pylori positivity as 89.8% and 71%, respectively. Konakçı et al. (23) found H. pylori positivity in 50.5% of 218 patients who underwent
endoscopic biopsy due to dyspepsia complaint in 2010. In studies conducted in Konya region, while Kesli et al. (29) found H. pylori positive in 36.6% of 168 patients who applied with dyspepsia complaints and underwent endoscopic gastric biopsy in 2010, Korkmaz et al. (30) found H. pylori positive in 45.4% of 198 dyspepsia patients who underwent endoscopy in 2012. In studies conducted between 2003 and 2008, the prevalence of H. pylori antigen was reported as 70.1% (30) in Sivas, 64% - 44.2% (32, 33) in Konya, and 58.4% (34) in Kayseri. The most comprehensive study on epidemiological studies on H. pylori in adults in our country is the TURHEP study conducted in 2003. In this study, the general prevalence of H. pylori was found to be 82.5% using the urea breath test in 5.549 adults over the age of 18, and the prevalence was found to be 84% in men and 81% in women (35). Again, in the study of Çiftel et al. (36) involving 653 patients in Erzurum region, H. pylori positivity was found to be 57.7% and it was reported as mild (+) positive in 58.7% of the patients with H. pylori. When the literature is examined in terms of positivity and clinical and laboratory results, not many studies have been found. Only Dağlı et al. (37) found a relationship between the degree of H. pylori positivity and mast cell density, which is known to be the primary trigger of inflammation. In our study, H. pylori was examined histopathologically in patients whose biopsy was taken. In addition to the presence of H. pylori, its density was also examined. In our study, H. pylori was found to be positive in 81.3% of the patients who underwent endoscopy by histopathological examination. The degree of H. pylori positivity was mildly (+) positive with a rate of 74.5% in line with the literature, and the frequency of H. pylori positivity between women and men was similar as in the literature (36).
The difference in the frequency of H. pylori positivity in studies may be due to the presence of various risk factors in the studied population, such as environmental reasons, hygiene, low education level, regional backwardness, previous gastrointestinal endoscopy, and less eradication. Megraud et al. (38) showed that with the increase in the incidence of atrophic gastritis in advanced ages, H. pylori lost its ecological home and its frequency decreased. Low education level, regional backwardness, hygiene and less eradication may be the main factors due to the high H. pylori positivity rates in our region.
Approximately one million people worldwide die from diseases associated with H. pylori every year (39). Considering that H. pylori is the main etiological factor especially in gastric cancer and its associated other diseases and its frequency in the general population, it is estimated that H. pylori infection will remain on the
905
Yıldırım et al. Upper gastrointestinal system endoscopy results & Helicobacter pyloriJ Health Sci Med 2021; 4(6): 901-906
agenda as the leading health problem in developing countries for the next 50 years (11, 39). For this reason, it becomes necessary to monitor the changes in the frequency of H. pylori and to make its eradication. Expecting a reduction in the incidence of gastric cancer with the eradication of H. pylori seems to be the most effective and cost-effective method.
Gastric polyps are detected incidentally during the endoscopy procedure. In a study involving 13 thousand patients, the prevalence of gastric polyps was found to be 1.2% (40). In a study conducted in the Kırıkkale region of our country, the frequency of gastric polyps was found to be 1.5% (41). In our study, it was found to be 1.8%.
In studies conducted in our country, while the frequency of gastric ulcer was 10% and duodenal ulcer frequency was found to be 11% in Şanlıurfa region, the frequency of gastric ulcer was 9% and duodenal ulcer frequency was found to be 15% in Aydın region (42,43). In our study, the frequency of gastric ulcer was 6% and the frequency of duodenal ulcer was 2.2% in the Yozgat region.
CONCLUSIONThe frequency of H. pylori was found to be 81.3% in Yozgat region and it was often mildly positive (+). In addition, the prevalence of H. pylori was similar between men and women, consistent with the literature. The most common diagnosis was reported as "chronic active gastritis". Gastric ulcer frequency was 6%, duodenal ulcer frequency was 2.2%, gastric poly frequency was 1.8%, gastric cancer was 1.3%, and esophageal cancer was 0.1%. As a result, with this study, we have presented the upper gastrointestinal endoscopy data of our region to the literature and it is the first study conducted in the Yozgat region.
ETHICAL DECLARATIONSEthics Committee Approval: The study was carried out with the permission of Yozgat Bozok University Clinical Researchs Ethics Committee (Date: 14.04.2021, Decision No: 2017-KAEK-189_2021.04.14_04).Informed Consent: Because the study was designed retrospectively, no written informed consent form was obtained from patients.Referee Evaluation Process: Externally peer-reviewed. Conflict of Interest Statement: The authors have no conflicts of interest to declare. Financial Disclosure: The authors declared that this study has received no financial support. Author Contributions: All of the authors declare that they have all participated in the design, execution, and analysis of the paper, and that they have approved the final version.
REFERENCES1. Loffeld R, Van der Putten A. The yield of UGIE: a study of a ten-
year period in the ‘Zaanstreek’. Neth J Med 2003; 61: 14-8.2. Tamer A, Korkut E, Korkmaz U. Upper gastrointestinal endoscopy
results in Düzce region. Med J Kocatepe 2005; 6: 31-4.3. Nur N, Yılmaz A, Yıldız G. Characteristics of patients with
gastrointestinal bleeding, evaluation of endoscopy and biopsy results. Journal of the CU Faculty of Medicine 2007; 29: 42-6.
4. Kaplan M, Tanoglu A, Düzenli T, Tozun AN. Helicobacter pylori treatment in Turkey: Current status and rational treatment options. North Clin Istanb 2020; 7: 87–94.
5. Hunt RH. The role of Helicobacter pylori in pathogenesis: the spectrum of clinical outcomes. Scand J Gastroenterol 1996; 31: 3-9.
6. Lehours P, Yılmaz O. Epidemiology of Helicobacter pylori infection. Helicobacter 2007; 12: 1-3.
7. Yücel T, Aygın D, Sen S, Yücel O. The prevalence of Helicobacter pylori and related factors among university students in Turkey. Jpn J Infect Dis 2008; 61: 179-83.
8. Malfertheiner P, Megraud F, O'Morain CA on behalf of the European Helicobacter and Microbiota Study Group and Consensus panel, et al Management of Helicobacter pylori infection—the Maastricht V/Florence Consensus Report Gut 2017; 66: 6-30.
9. [No authors listed]. Schistosomes, liver flukes and Helicobacter pylori. IARC Working Group on the Evaluation of Carcinogenic Risks to Humans. Lyon, 7-14 June 1994. IARC Monogr Eval Carcinog Risks Hum 1994; 6: 1-241.
10. McNulty C.A, Lehours P, Mégraud F. Diagnosis of Helicobacter pylori Infection. Helicobacter 2011; 16: 10-18.
11. Granstrom M, Lehours P, Bengtsson C, Mégraud, F. Diagnosis of Helicobacter pylori. Helicobacter 2008; 13: 7-12.
12. Tonkic A, Tonkic M, Lehours P, Mégraud F. Epidemiology and diagnosis of H. pylori infection. Helicobacter 2012; 17: 1-8.
13. Siegel RL, Miller KD, Jemal A. Cancer statistics, 2015. CA Cancer J Clin 2015; 65: 5-29.
14. Gültekin M, Boztaş G, Utku EŞ. Turkey cancer statistics. Eds İ. Şencan, GN İnce T.C. Ministry of Health Turkish Public Health Institution 2016; 19.
15. Tuncer İ, Uygan İ, Kösem M, et al. Demographic and histopathological features of upper gastrointestinal system cancers in Van and its surroundings. Van Med J 2001; 8: 10-3.
16. Cevheri Ağan Z, Cindoğlu Ç, Ağan V, Uyanıkoğlu A, Yenice N. Analysis of demographic data of patients who underwent esophagogastroduodenoscopy in Harran University Gastroenterology Clinic: 5-year series. Harran University Med J 2019; 16: 101-4.
17. Polat Y. Endoscopic experience of a surgeon: The evaluation of 8453 cases. Int J Basic Clin Med 2015; 3: 1-5.
18. Coşkun A, Borazan S, Yükselen V et al. Features of upper gastrointestinal tract malignancies in Aydin region. Endoscopy Gastrointestinal 2015; 23: 67-9.
19. Ferlay J, Soerjomataram I, Dikshit R, et al. Cancer incidence and mortality worldwide: sources, methods and major patterns in Globocan 2012. Int J Cancer 2015; 136: 359-86.
20. Yalçın B, Zengin N, Aydın F. The clinical and pathological features of patients with gastric cancer in Turkey: A Turkish Oncology Group Study. Turk J Cancer 2006; 36: 108-15.
21. Göçmen E, Kocaoğlu H. Gastric cancer epidemiology. T Klin J Surg 2000; 5: 161-2.
22. Kısaoğlu A, Özoğul B, Yıldırgan Mİ, et al. Surgery in stomach cancer: 504 cases. Abant Med J 2014; 3: 220-5.
23. Konakcı N, Gülten M, İbanoğlu MS, et al. The frequency of Helicobacter pylori in patients with chronic active gastritis. Journal of Uludag University Medicine Faculty 2010; 36: 7-10.
906
Yıldırım et al. Upper gastrointestinal system endoscopy results & Helicobacter pylori J Health Sci Med 2021; 4(6): 901-906
24. Uyanıkoğlu A, Coskun M, Binici DN, et al. The frequency of Helicobacter pylori in patients undergoing endoscopy. Dicle Med J 2012; 39: 197-200.
25. Karaaslan H, Bektaş M, Soykan İ, Bozkaya H, Bahar K, Özden A. Helicobacter pylori seroprevalence in volunteer blood donors in Turkey. Türk J Gastroenterol 2003; 14: SBO3/1.
26. Göral V, Özdal B, Kaplan A, Şit D, Danış R. Helicobacter pylori antibody prevalence in Diyarbakır province. The Turkish Journal of Academic Gastroenterology 2005; 5: 47-50.
27. Bulut M, Armağan E, Kıyıcı M, Balcı V, Atar N, Gürel S. The frequency of Helicobacter pylori in patients presenting to the emergency department with epigastric pain and the role of qualitative serum IgG test in diagnosis. Journal of Uludag University Medicine Faculty 2004; 30: 7-10.
28. Özardalı Hİ, Bitiren M, Nazlıgül Y, Yılmaz N. The frequency of Helicobacter pylori in nonerosive gastritis in Şanlıurfa region. Genel Tıp Derg 1998; 8: 149-52.
29. Kesli R, Göktürk HS, Erbayrak M, Karabağlı P, Terzi Y. Comparison of the diagnostic values of the 3 different stool antigen tests for the noninvasive diagnosis of Helicobacter pylori infection. J Investig Med 2010; 58: 982-6.
30. Korkmaz H, Kesli R, Karabağlı P, Terzi Y. Comparison of the diagnostic accuracy of five different stool antigen tests for the diagnosis of Helicobacter pylori infection. Helicobacter 2013; 18: 384-91.
31. Alim A, Ataş AD, Güneş T, et al. Helicobacter pylori seroprevalence in symptomatic and asymptomatic adults in Sivas province. Journal of the Faculty of Medicine Cumhuriyet University 2004; 26: 75-80.
32. Kalem F, Özdemir M, Baysal B. Investigation of the presence of Helicobacter pylori by different methods in patients with dispeptic complaints. Mikrobiyol Bult 2010; 44: 29-34.
33. Özdemir M, Baykan M. Investigation of the diagnostic value of H. pylori stool antigen in the diagnosis of H. pylori infection in dyspeptic patients. Genel Tıp Derg 2005; 15: 65-70.
34. Arslan D, Tahan F, Demir F, Taşkın İ. Seroprevalence of Helicobacter pylori infection in healthy children admitted to Erciyes University Faculty of Medicine Pediatrics Outpatient Clinic and the factors affecting it. Erciyes Med J 2006; 28: 192-6.
35. Ozaydin N, Turkyilmaz SA, Cali S. Prevalence and risk factors of Helicobacter pylori in Turkey: a nationally-representative, cross-sectional, screening with the 13C-Urea breath test. BMC Public Health 2013; 13: 1215.
36. Çiftel S, Okçu N, Dursun H, Albayrak F, Usta S. The frequency of Helicobacter pylori in our region. Güncel Gastroenteroloji, 2016; 20/2: 157-160.
37. Dağlı AF, Cihangiroğlu G, Çobanoğlu B, Özercan İH, Bahçecioğlu IH, Özercan MR. The relationship between Helicobacter pylori density and mast cell count in antral gastritis. Fırat Med J 2006; 11: 48-50.
38. Megraud F. Epidemiology of Helicobacter pylori infection: Helicobacter pylori. Gastroenterology Clin Nort America 1993; 22: 73-88.
39. Ferlay J, Soerjjomataram I, Dikshit R, et al. Cancer incidence and mortality worldwide: souces, methods and major patterns in GLOBOCAN 2012. Int J Cancer 2015; 136: E359-86.
40. Archimandritis A, Spiliadis C, Tzivras M, et al. Gastric epithelial polyps: a retrospective endoscopic study of 12974 symptomatic patients. Ital J Gastroenterol, 1996; 28: 387-90.
41. Güliter S, Keleş H, Özkurt ZN. Kırıkkale University Faculty of Medicine Internal Diseases Clinic Upper Gastrointestinal System Endoscopy Results. KU Faculty of Med J 2004; 6: 10-2.
42. Yılmaz N, Bölükbaş C, Bölükbaş F, et al. Our upper gastrointestinal endoscopy findings; Harran University. Turk J Gastroenterol 2003; 14: 198.
43. Yükselen V, Öztürk B, Karaoğlu A, et al. Diagnostic distribution of upper gastrointestinal endoscopic examinations performed in Adnan Menderes University Faculty of Medicine, Department of Gastroenterology by years. Turk J Gastroenterol 2003; 14: 489.

HEALTH SCIENCESMEDICINE
Original Article
J Health Sci Med 2021; 4(6): 907-911
This work is licensed under a Creative Commons Attribution 4.0 International License.
DOI: 10.32322/jhsm.981918
Received: 13.08.2021 Accepted: 18.09.2021Corresponding Author: Ali Korhan Sig, [email protected]
Distribution of clinical isolates obtained from sterile body fluids: a four-year retrospective data
Alev Çetin-Duran1, Tuğba Kula-Atik1,2, Nermin Özen1, Ali Korhan Sig1, Onur Irmak11Atatürk City Hospital, Department of Medical Microbiology, Balıkesir, Turkey2Balıkesir University, Faculty of Medicine, Department of Medical Microbiology, Balıkesir, Turkey
Cite this article as: Çetin-Duran A, Kula-Atik T, Özen N, Sig AK, Irmak O. Distribution of clinical isolates obtained from sterile body fluids: a four-year retrospective data. J Health Sci Med 2021; 4(6): 907-911.
ABSTRACTAim: Infections of sterile body fluids (SBFs) require rapid and accurate diagnosis and treatment, since their morbidities and mortalities are high. To achieve this goal, definite epidemiologic data is absolutely required, since empiric and preemptive treatments are mainly based on this. The aim of this study was to evaluate infectious agents isolated from SBFs, susceptibility results and molecular analysis (PCR) data, retrospectively.Material and Method: Clinical samples of SBFs (Cerebrospinal, pleural, peritoneal, pericardial and synovial fluids) obtained from January 2017 to December 2020 in Atatürk City Hospital (tertiary center) were included. Identification of bacterial and fungal agents and antibiotic susceptibility were done by conventional and automated system (BD Phoenix™, Becton Dickinson Co., Sparks, MD, USA). Löwenstein-Jensen media and BACTEC Mycobacteria Growth Indicator Tube 960 (Becton Dickinson Co., Sparks, MD, USA) were used for mycobacterial analysis. Bosphore Viral Meningitis Panel Multiplex PCR Kit (Anatolia Geneworks, İstanbul, Turkey) were applied to detect HSV-1, HSV-2, VZV, Enterovirus and/or Parechovirus.Results: A total of 221 (9.74%) organisms were detected among 2269 samples. Particularly common gram negative bacterial agents covered the top of the list (Escherichia coli, Pseudomonas spp., Klebsiella spp. and Acinetobacter baumannii-Acinetobacter calcoaceticus complex). Staphylococcus aureus was the most frequent gram positive strain, followed by enteroccocci. Most of the A. baumannii isolates were multidrug resistant, Pseudomonas spp. showed over than 20% resistance rate to ceftazidime, cefepime and piperacillin-tazobactam. All enterococci were vancomycin-susceptible, one S. aureus strain was methicillin-resistant. All Mycobacterium tuberculosis complex isolates were found to be susceptible to first-line anti-tuberculosis drugs.Conclusions: Continuous laboratory surveillance even in local phase is important to guide clinicians. Even though our data did not show significant changes, improvements on laboratory capabilities and clinical awareness must be done. Isolation rates might be underestimated due to requirement of improvements in our laboratory, especially about sampling, anaerobe transportation and usage of blood culture vials.Keywords: Meningitis, pleuritis, infection, sterile body fluids
Ana Metin-Alt bilgi Arası 5mm
Cite-Öz arası 5mm
Başlık-Yazarlar arası 12mmv
Yazar-Kurum arası 2,5 mmvcv
Kurum-Cite arası 5mm
Öz-Abstract arası 7,5mmvc
INTRODUCTION
Body fluids from sterile sites such as cerebrospinal (CSF), pleural, peritoneal, pericardial and synovial fluids are defined as sterile body fluids (SBFs). The crucial point from microbiologic view is that any growth on culture of these fluids is accepted as causative agent, except any suspicion of contamination. These samples are obtained via invasive procedures and preanalytic transportation to laboratories has great importance. Exact identification of microorganisms to at least genus level (preferably species level) directly guides clinicians to the appropriate treatment, even in the shortage of susceptibility tests.
Generally, a wide spectrum of microbiological analysis for SBFs is required, including bacterial, fungal, viral and mycobacterial agents (1-3).
Meningitis, pericarditis, pleural infection (either complicated parapneumonic effusion or empyema) and septic arthritis cover major forms of SBFs infections. The most frequent causative agents of these infections are Staphylococcus aureus, Streptococcus pneumoniae, Haemophilus influenza, Escherichia coli, Pseudomonas aeruginosa, Mycobacterium tuberculosis complex, Candida spp. and viruses (2,3). Many factors including

908
Çetin-Duran et al. Microbiological analysis of sterile body fluids J Health Sci Med 2021; 4(6): 907-911
infection site, age, immune status and underlying pathologies have major effect on species epidemiology of etiologic agent. Diagnosis depends on several methods such as culture, PCR and serology (4-8).
Infections of SBFs require rapid and accurate diagnosis and treatment, since their morbidities and mortalities are high. To achieve this goal, definite epidemiologic data is absolutely required, since empiric and preemptive treatments are mainly based on this. Furthermore, due to epidemiologic variations between geographic locations, local data of infections are crucial, since they create a base for national management guidelines. The aim of this study was to evaluate infectious agents isolated from SBFs, susceptibility results and molecular analysis (PCR) data, retrospectively.
MATERIAL AND METHODThe study was carried out with the permission of Balıkesir University Faculty of Medicine Clinical Researchs Ethics Committee (Date: 11.11.2020, Decision No: 2020/202). All procedures were carried out in accordance with the ethical rules and the principles of the Declaration of Helsinki. Clinical samples of SBFs (CSF, pleural, peritoneal, pericardial and synovial fluids) obtained from January 2017 to December 2020 in Atatürk City Hospital (tertiary center) were included in the study. Identification of bacterial and fungal agents were done by conventional and automated system (BD Phoenix™, Becton Dickinson Co., Sparks, MD, USA). Antibiotic susceptibility tests were also performed by the same system and evaluated according to “The European Committee on Antimicrobial Susceptibility Testing (EUCAST)” criteria (9). Antifungal susceptibility tests were not applied. Mycobacterial analysis were performed by Löwenstein-Jensen (LJ) media (RTA Laboratories, Kocaeli, Turkey) and BACTEC “Mycobacteria Growth Indicator Tube” (MGIT) 960 (Becton Dickinson Co., Sparks, MD, USA) automated system. Susceptibility to the first-line antituberculosis drugs (Isoniazid-INH, rifampicin-RIF, ethambutol-ETM, streptomycin-SM) were also analyzed with the same system according to manufacturer’s guidelines. In patients with suspicion of viral meningitis, Bosphore Viral Meningitis Panel Multiplex PCR Kit (Anatolia Geneworks, İstanbul, Turkey) were applied to detect Herpes simplex virus-1 (HSV-1), Herpes Simplex Virus-2 (HSV-2), Varicella-Zoster Virus (VZV), Enterovirus (Coxsackie A ve B, Echovirus, Poliovirus and Enterovirus 68 – 71) and/or Parechovirus nuclear material.
Statistical AnalysisRetrospective definitive analysis was done. n (numbers) and ratios (%) were shared. SPSS 22.0 (SPSS, IBM, Chicago, IL, USA) programme was used.
RESULTSThe majority of sterile samples were pleural fluid (n=1105), followed by peritoneal fluid (n=540), CSF (n=440), synovial (n=183) and pericardial fluid (n=1), respectively. A total of 221 (9.74%) agents were observed (157/540 in peritoneal fluid; 41/1105 in pleural fluid; 15/440 in CSF; 8/183 in synovial fluid and no isolation in pericardial fluid). Table 1 shows distribution of etiologic agents and ratios of isolated microorganisms. Bacterial strains had a dominance, particularly common gram negative bacterial agents covered the top of the list (Escherichia coli, Pseudomonas spp., Klebsiella spp. and Acinetobacter baumannii-Acinetobacter calcoaceticus complex). Staphylococcus aureus was the most frequent gram positive strain, followed by enteroccocci.
Most of the A. baumannii isolates were multidrug-resistant (MDR) showing carbapenem resistance (90%) and amikacin resistance (60%), thus, colistin seemed to be the only therapeutic option (data not shown). On the other hand, Pseudomonas spp. showed over than 20% resistance rate to ceftazidime, cefepime and piperacillin-tazobactam. All enterococci were vancomycin-susceptible, however one S. aureus strain was methicillin-resistant (MRSA). Cephalosporin, fluoroquinolone and co-trimoxazole resistance were in seriously threatening levels for E. coli (over than 30%). Table 2 shows antibiotic susceptibility results of E. coli, K. pneumoniae and Pseudomonas spp. All Mycobacterium tuberculosis complex isolates detected in SBFs were found to be susceptible to first-line anti-tuberculosis drugs.
DISCUSSIONInfections of SBFs are one of the most frequent infections in developing countries. The microorganism spectrum show extensive variation due to several factors such as antibiotic administrations, methodological differences and patient factors (underlying disease, surgeries, etc). In overall, K. pneumoniae, E. coli, P. aeruginosa, Citrobacter spp and Acinetobacter spp. are the most frequently isolated species among gram negative bacteria, while S. aureus, Streptococcus pneumoniae and enterococci are among gram positive ones. On the other hand, the question of the most common causative agent remains unanswered, since several studies indicated different results (10,11).
Many experts and stewardship programs published different guidelines to manage and treat SBF infections, especially focusing on meningitis (12,13). All these guides mainly depend on intensive antimicrobial therapies according to the causative agent. Thus, awareness of epidemiology even in local and/or national level directly affects the empiric and preemptive treatments, since epidemiological variations are severe.

909
Çetin-Duran et al. Microbiological analysis of sterile body fluidsJ Health Sci Med 2021; 4(6): 907-911
Table 1. Infectious agents isolated from SBFs and frequency (%)Types of infectious
agents n (%) Microorganism Overall n (%)
Peritoneal fluid n (%)
Pleural fluid n (%)
CSF n (%)
Synovial fluid n (%)
Bacterial Agents (n=234; 94.4%)E. coli 115 (52.03) 108 (48.87) 4 (1.81) 2 (0.90) 1 (0.45)Pseudomonas spp. 25 (11.31) 16 (7.23) 8 (3.62) None 1 (0.45)Klebsiella spp. 17 (7.69) 13 (5.88) 2 (0.90) 2 (0.90) NoneA. baumannii 10 (4.52) 3 (1.36) 3 (1.36) 4 (1.81) NoneS. aureus 9 (4.07) 2 (0.90) 4 (1.81) None 3 (1.36)Enterococcus spp. 8 (3.62) 3 (1.36) 2 (0.90) 1 (0.45) 2 (0.90)S. maltophilia 6 (2.71) 1 (0.45) 5 (2.26) None NoneS. pneumoniae 4 (1.81) None 3 (1.36) 1 (0.45) NoneGroup B Streptococci 4 (1.81) 4 (1.81) None None NoneProteus spp. 3 (1.36) 1 (0.45) 2 (0.90) None NoneCitrobacter spp. 2 (0.90) 2 (0.90) None None NoneEnterobacter spp. 2 (0.90) 2 (0.90) None None NoneSerratia spp. 2 (0.90) 1 (0.45) None 1 (0.45) None
Mycobacterium spp. (n=6; 2.4%)M. tuberculosis complex 6 (2.71) None 5 (2.26) None 1 (0.45)
Fungal Agents (n=6; 2.4%)C. albicans 3 (1.36) 1 (0.45) 1 (0.45) 1 (0.45) NoneC. parapsilosis complex 2 (0.90) None 1 (0.45) 1 (0.45) NoneC. tropicalis 1 (0.45) None 1 (0.45) None None
Viral Agents (n=2; 0.8%)HSV-1 2 (0.90) None None 2 (0.90) None
Total 221 (100.0) 157 (71.04) 41 (18.55) 15 (6.79) 8 (3.62)
Table 2. Resistance rates of particular strains (%) (Modified from references 15,18,19)
Ant
ibio
tic
This Study CAESAR 2020b (R-Rate-%)
EU/EEA Country Range (R-Rate-%)
(EARS-Net; 2015-2019)
SENTRY (R-Rate-%) (20-Year BSIs Surveillance)
E. co
li (n
=115
)
Kle
bsie
lla sp
p.
(n=1
7)
Pseu
dom
onas
sp
p. (n
=52)
E. co
li
K. p
neum
onia
e
Pseu
dom
onas
sp
p.
E. co
li
K. p
neum
onia
e
Pseu
dom
onas
sp
p.
Ente
roba
cter
ales
Pseu
dom
onas
sp
p.
AK None 17.6 7.7 2.0 27.0 14.0 ID ID ID 1.3 7.6
AGc 11.3 23.5 NA 26.0 45.0 21.0 4.7-24.4 3.5-57.3 0.3-48.9 11.0 17.4
MEM 2.6 29.4 36.53.0 39.0 38.0 0.0-1.6 0.0-58.3 0.0-55.4
1.0 16.3
IMP 1.7 29.4 36.5 1.7 20.0
ERT 11.3 35.3 51.9 9.0 51.0 ID ID ID ID ID ID
CRO 31.3 35.3 48.1 53.0 73.0 ID6.2-38.6 4.3-75.7
ID 15.7 ID
CAZ 28.7 35.3 42.3 47.0 70.0 28.0 3.5-52.2 ID 17.4
FEP 29.6 35.3 32.7 ID ID 31.0 ID ID ID 7.7 10.1
AMCa 45.2 41.2 NA 61.0 75.0 ID ID ID ID ID ID
TZP 6.1 35.3 NA 22.0 60.0 34.0 ID ID 2.3-52.8 5.6 14.9
TMP-SXT 37.4 29.4 NA ID ID ID ID ID ID 25.3 ID
FQ 24.3 35.3 NA 52.0 65.0 35.0 11.3-43.5 4.3-66.9 4.5-52.2 17.5 23.0AK: Amikacin; AG: Aminoglycoside; MEM: Meropenem; IMP: Imipenem; ERT: Ertapenem; CRO: Ceftriaxone; CAZ: Ceftazidime; FEP: Cefepime; AMC: Amoxicillin-clavulanic acid; TZP: Piperacillin-tazobactam; TMP-SXT: Trimethoprim-sulfamethoxazole; FQ: Fluoroquinolones; ID: Insufficient Data; NA: Not applicableaAminopenicillin susceptibility of Enterobacterales is for intravenous administration. bData of Turkey. cIndicates gentamicin/netilmicin/tobramycin.

910
Çetin-Duran et al. Microbiological analysis of sterile body fluids J Health Sci Med 2021; 4(6): 907-911
Some reports indicated that gram positive bacteria including S. pneumoniae and staphylococci showed a dominance, however, there are also studies stating gram negative superiority, like this study (10,11,14). According to Central Asian and European Surveillance of Antimicrobial Resistance (CAESAR) report of Turkey, which included CSF and blood culture (BC) data, even though it was followed by Acinetobacter spp., S. pneumoniae had a few times more CSF isolation counts than the other strains. On the other hand, BC data seems to be different, since gram negative ones counted with a huge superiority (15). Contrary results were observed in a ten-year BC study from Turkey, since coagulase-negative staphylococci (CoNS) took the largest counts (16). The Turkish National Antimicrobial Resistance Surveillance System (UAMDSS) focuses on antimicrobial resistance (AMR) of E. coli, K. pneumoniae, P. aeruginosa, S. aureus, S. pneumoniae, Enterococcus faecium/faecalis and A. baumannii that were isolated from CSF and BCs. These strains were particularly under surveillance, since they were the most frequently isolated ones and they showed the most problematic resistance patterns (17). Of note, it is obvious that BC and other SBF data should be separated, because their microbiologic cultivation and management procedures are also different.
International antimicrobial stewardship programs supported by global organizations like World Health Organization (WHO), The Centers for Disease Control and Prevention (CDC) and The European Centre for Disease Prevention and Control (ECDC), and national authorities (Public Health Directorate of Turkey) specifically endorse a continuous surveillance on AMR, especially for particular species and infections. In this study, despite of only a limited data of pathogens were shared (Table 2), it can be observed that AMR is a serious issue for common species. The CAESAR, The SENTRY Antimicrobial Surveillance Program (20-Year bloodstream infections-BSIs data) and The European Antimicrobial Resistance Surveillance Network (EARS-Net) data were also shared in Table 2 (15,18,19). Although our sample size is much smaller and our data was based on samples other than BCs, our rates showed a slightly lower resistance profile, which might be explained with this sample differences. On the other hand, regarding EU/EEA Country Ranges in the EARS-Net data, it is obvious that our facility is in the “high-threat” zone (19). MDR rates of Acinetobacter spp., β-lactam resistance of Pseudomonas spp., cephalosporin, fluoroquinolone and co-trimoxazole resistance of E. coli were major observations. On the other hand, it is very promising that there was not any vancomycin-resistant enterococci (VRE) and MDR-tuberculosis cases, and there was only one MRSA strain, while UAMDSS and CAESAR reports stated opposite results (15,17).
Recently, there are some reports that strongly recommended cultivation of SBFs with BC vials. Nowadays, there is a microbiological consensus that this method is very beneficial especially for reducing time to detection and increased growth ability of fastidious microorganisms (20,21). In our facility, this technique is also recommended by our laboratory; however it is rarely preferred by clinicians. Thus, this might be a limitation of this study, since our isolation rates might have been underestimated. However, internationally-suggested methods are applied in our laboratory, so we believe this should be a minor effect. Another limitation is that anaerobic microbiological analysis cannot be performed in our laboratory due to physical issues. We believe anaerobes could also be causative agents in our infection profiles, but they were not able to be detected by our laboratory. Thirdly, we could not reach to any information of empiric and preemptive treatments applied to the patients and time of sampling. These patients generally required such kind of therapy, and time of sampling (before or after treatment) directly affects the isolation of the agent, especially for bacterial and fungal infections. If so, isolation rates might have also been underestimated.
CONCLUSIONContinuous laboratory surveillance even in local phase is important to guide clinicians. Data of this study did not seem to show any significant change in epidemiology, but it revealed that clinic and laboratory communication requires extensive improvement, especially about sampling, anaerobe transportation and usage of BC vials. Our laboratory also needs to focus on anaerobic cultivation methods. On the other hand, it is promising that any potential contaminant strain (E.g.; CoNS, gram positive rods) was not observed at any stage of cultivation. More data should be collected to modify national guidelines.
ETHICAL DECLARATIONSEthics Committee Approval: The study was carried out with the permission of Balıkesir University Faculty of Medicine Clinical Researchs Ethics Committee (Date: 11.11.2020, Decision No: 2020/202).
Informed Consent: Because the study was designed retrospectively, no written informed consent form was obtained from patients.
Referee Evaluation Process: Externally peer-reviewed.
Conflict of Interest Statement: The authors have no conflicts of interest to declare.
Financial Disclosure: The authors declared that this study has received no financial support.

911
Çetin-Duran et al. Microbiological analysis of sterile body fluidsJ Health Sci Med 2021; 4(6): 907-911
Author Contributions: All of the authors declare that they have all participated in the design, execution, and analysis of the paper, and that they have approved the final version.
REFERENCES1. Özekinci T. Plevral sıvının mikrobiyolojik ve immünolojik analizi.
Güncel Göğüs Hastalıkları Serisi 2015; 3: 316-8.2. Öktem A, Çelik HT, Göçer E, Ceyhan M, Yiğit Ş, Yurdakök
M. Yenidoğan döneminde septik artrit ve osteomiyelit: deneyimlerimiz ve güncel bilgilerin gözden geçirilmesi. Çocuk Sağlığı ve Hastalıkları Dergisi 2016; 59: 1-13.
3. Kleines M, Scheithauer S, Schiefer J, Häusler M. Clinical application of viral cerebrospinal fluid PCR testing for diagnosis of central nervous system disorders: a retrospective 11-year experience. Diagn Microbiol Infect Dis 2014; 80: 207-15.
4. Sayıner AA. Viral merkezi sinir sistemi infeksiyonlarında tanı. ANKEM Derg 2005; 19: 130-6.
5. Zeytinoğlu A, Erensoy S, Sertöz R, et al. Santral sinir sistemi enfeksiyonlarında viral etiyolojinin İzmir’de bir üniversite hastanesinin yedi yıllık verileri üzerinden değerlendirilmesi. Mikrobiyol Bul 2017; 51: 127-35.
6. Varıcı-Balcı FK, Sayıner AA. Viral etkenlere bağlı santral sinir sistemi enfeksiyonlarının yedi yıllık değerlendirmesi. Mikrobiyol Bul 2019;53: 434-41.
7. Akkaya O, Güvenç Hİ, Güzelant A, et al. Menenjit etkenlerinin Real-time PCR Yöntemiyle Araştırılması. Türk Mikrobiyol Cem Derg 2017; 47: 131-7.
8. Kahraman H, Tünger A, Şenol Ş, et al. Toplum kökenli santral sinir sistemi enfeksiyonlarında bakteriyel ve viral etiyolojinin moleküler yöntemlerle değerlendirilmesi. Mikrobiyol Bul 2017; 51: 277-85.
9. European Committee on Antimicrobial Susceptibility Testing (EUCAST). Breakpoint tables for interpretation of MICs and zone diameters. Version 11.0, Basel, Switzerland. https://www.eucast.org [Date of Access: 11 August 2021].
10. Tsegay E, Hailesilassie A, Hailekiros H, Niguse S, Saravanan M, Abdulkader M. Bacterial isolates and drug susceptibility pattern of sterile body fluids from tertiary hospital, Northern Ethiopia: a four-year retrospective study. J Pathog. 2019; 2019: 5456067.
11. Rouf M, Nazir A. Aerobic bacteriological profile and antimicrobial sensitivity pattern of bacteria isolated from sterile body fluids: A study from a Tertiary Care Hospital in North India. Microbiol Res J Int 2019; 28: 1-10.
12. Young N, Thomas M. Meningitis in adults: diagnosis and management. Internal Med J 2018; 48: 1294–307.
13. Griffiths MJ, McGill F, Solomon T. Management of acute meningitis. Clin Med 2018 18: 164–9.
14. Poorabbas B, Mardaneh J, Rezaei Z, et al. Nosocomial Infections: Multicenter surveillance of antimicrobial resistance profile of Staphylococcus aureus and Gram negative rods isolated from blood and other sterile body fluids in Iran. Iran J Microbiol 2015; 7: 127-35.
15. World Health Organization (WHO). Central Asian and European Surveillance of Antimicrobial Resistance (CAESAR), Annual 2020 Report, 2020. https://www.euro.who.int/__data/assets/pdf_file/0003/469200/Central-Asian-and-European-Surveillance-of-Antimicrobial-Resistance.-Annual-report-2020-eng.pdf (Date of Access: 11 August 2021).
16. Mataj V, Guney M, Sig AK, et al. An Investigation into bacterial bloodstream infections and antibiotic resistance profiles in a tertiary hospital for a ten-year period. Clin Lab 2020; 66: 1467-77.
17. Ulusal Antimikrobiyal Direnç Sürveyans Sistemi. https://hsgm.saglik.gov.tr/tr/uamdss (Date of Access: 11 August 2021).
18. Diekema DJ, Hsueh PR, Mendes RE, et al. The microbiology of bloodstream infection: 20-year trends from the SENTRY antimicrobial surveillance program. Antimicrob Agent Chemother 2019; 63: e00355-19.
19. European Centre for Disease Prevention and Control. Antimicrobial resistance in the EU/EEA (EARS-Net) - Annual Epidemiological Report 2019. Stockholm: ECDC; 2020. https://www.ecdc.europa.eu/en/publications-data/surveillance-antimicrobial-resistance-europe-2019 (Date of Access: 17 June 2021).
20. Sesli Çetin E, Kaya S, Demirci M, Cicioglu Aridogan B. Comparison of the BACTEC blood culture system versus conventional methods for culture of normally sterile body fluids. Adv Ther 2007; 24: 1271-7.
21. Udayan U, Dias M. Evaluation of BACTECTM blood culture system for culture of normally sterile body fluids. Indian J Crit Care Med 2014; 18: 829-30.

HEALTH SCIENCESMEDICINE
Original Article
J Health Sci Med 2021; 4(6): 912-918
This work is licensed under a Creative Commons Attribution 4.0 International License.
DOI: 10.32322/jhsm.982776
Received: 14.08.2021 Accepted: 19.09.2021Corresponding Author: Vugar Ali Türksoy, [email protected]
Silicosis and methylated arginines/L-arginines: case-control adapted a cross-sectional design
Özgur Öztan1, Vugar Ali Türksoy2, Serdar Deniz3, Ayşe Coşkun Beyan4, Servet Birgin İritaş5, Müjgan Ercan Karadağ6, Engin Tutkun2
1HLC Medical Center, Department of Medical Management, Ankara, Turkey2Yozgat Bozok University Faculty of Medicine, Department of Public Health, Yozgat, Turkey3Malatya Turgut Ozal University Faculty of Medicine, Department of Public Health, Malatya, Turkey4Dokuz Eylül University Faculty of Medicine, Department of Occupational Medicine, Turkey5Ankara Institute Forensic Medicine, Ankara, Turkey6Afyon Health Sciences University, Department of Medical Biochemistry, Afyon, Turkey
Cite this article as: Öztan Ö, Türksoy VA, Deniz S, et al. Silicosis and methylated arginines/L-arginines: case-control adapted a cross-sectional design. J Health Sci Med 2021; 4(6): 912-918.
ABSTRACTAim: Silicosis has long been recognized as an important occupational lung disease that is included in the group of pneumoconiosis. As already well-known silicosis is a progressive pneumoconiosis characterized by fibrosis in the lungs. Also, chronic exposure to silica may cause chronic obstructive pulmonary disease, emphysema, lung cancer, and pulmonary fibrosis. Asymmetric dimethyl arginine (ADMA), symmetric dimethyl arginine (SDMA), and L-NMMA (NG-mono-methylated-L-arginine) are the products of protein arginine methyltransferase (PRMT) enzymes. The aim of this study is to investigate the relationship between silicosis and arginine metabolites in silica exposed and non-exposed workers.Material and Method: 180 male subjects (90 non-exposed workers (age matched-control) and 90 workers diagnosed with silicosis occupational physician based on radiological and clinical findings and exposure history-(silica-exposed) were included in this study. The serum levels arginine, ADMA, SDMA, and L-NMMA were determined using enzyme-linked immunosorbent assay. Results: ADMA, SDMA, L-NMMA values were significantly higher in the silica-exposed group compared to the control group. The positive correlations were observed between methylated arginine parameters such as ADMA and SDMA, ADMA and L-NMMA levels (r=0.43, r=0.60; p<0.01). The negative correlations were found between SDMA and arginine/ADMA, L-NMMA, and arginine/ADMA, arginine and SDMA/ADMA, arginine/ADMA and SDMA/ADMA levels, respectively (r=-0.22; r=-0.22, r=-0.34, r=- 0.29; p<0.01). The strongest positive correlation was found between arginine and arginine/ADMA ratio, and the strongest negative relationship between ADMA and arginine/ADMA ratio, respectively (r=0.87; r= -0.48; p<0.01). Conclusion: The results could provide additional insight into understanding the disease and the potential for developing biomarkers.
Keywords: Silicosis, arginine, Asymmetric dimethyl arginine, symmetric dimethyl arginine, NG-mono-methylated-L-arginine
Ana Metin-Alt bilgi Arası 5mm
Cite-Öz arası 5mm
Başlık-Yazarlar arası 12mmvv
Yazar-Kurum arası 2,5 mmvcv
Kurum-Cite arası 5mmv
Öz-Abstract arası 7,5mmvc
INTRODUCTIONSilicosis has long been recognized as an important occupational lung disease that is included in the group of pneumoconiosis. The risk increases due to the concentration of dust, the percentage of silica in the dust, and the duration of total exposure. The total burden of silica in the body is mainly directly related to the risk of pneumoconiosis. Silicon dioxide has two forms as amorphous and crystalline. The amorphous
form does not seem to cause severe pulmonary disease. Histologically, it can be defined as a diffuse interstitial fibro nodular lung disease. In the post-mortem examinations of silicotic lungs, the tissue is characterized with hilar and parenchymal lymphadenopathies and silicotic nodules, generally located in the upper lobes of the lung. Crystalline silica particles can be seen in a polarized light microscope (1).

913
Öztan et al. Silicosis and methylated arginines/L-arginines J Health Sci Med 2021; 4(6): 912-918
Asymmetric dimethyl arginine (ADMA), symmetric dimethyl arginine (SDMA) and L-NMMA (NG-mono-methylated-L-arginine) are the products of protein arginine methyltransferase (PRMT) enzymes (2). As nitric oxide (NO) has reactive oxygen species (ROS) scavenging functions and promotes the activation of endogenous anti-oxidant defense systems, ADMA can contribute ROS imbalance by reducing NO bioavailability and invoke superoxide production (3,4). The mechanism underlying between silicosis and inflammation is still unknown, but several studies provide many results supporting this link. Many cellular mechanisms can contribute to the inflammation progress in silicosis. The inflammatory cytokines (interleukin (IL)-8, IL-6), arachidonic acid metabolites (leukotrienes, prostaglandins), transcription factors ((nuclear factor kappa-light-chain-enhancer of activated B cells (NFkB) and activator protein-1), and chemokines such as macrophage inflammatory protein (MIP)-2, MIP-1α, MIP-1β and monocyte chemoattractant proteins are involved in the inflammatory process. There are also some experimental studies which have shown to decrease inflammation and production of MIP-2, preventing the subsequent pulmonary fibrosis and silicosis (1,5) ADMA, SDMA and L-NMMA are first extracted in human urine in 1970’s (6). Since then, there have been many publications on these metabolites and their relationship with various diseases. Most of them has been highlighted that ADMA contributed in endothelial dysmorphology and can be selected as a screening marker. It has been found to be elevated in the serum in cases of renal insufficiency, cardiovascular diseases and atherosclerosis, renal failure, hyperglycemia and hyperhomocysteinemia (2,4,6–8). The studies evaluating the relationship between arginine metabolites and pulmonary diseases, different hypotheses have been suggested (11,12). However, there is lack of knowledge about the relationship silicosis and arginine metabolites. We aim to identify an expanding role of serum ADMA, SDMA and L-NMMA levels in silica exposed and non-exposed workers.
MATERIAL AND METHODThis study was ethically approved by the Non-interventional Clinical Researchs Ethics Committee of the Bozok University Medical Faculty (Date: 17.10.2016, Decision No:17/04). All procedures were carried out in accordance with the ethical rules and the principles of the Declaration of Helsinki.
Study Groups180 male subjects (90 non-exposed workers (age matched-control) and 90 workers diagnosed with silicosis occupational physician based on radiological and clinical findings and exposure history-(silica-
exposed) were included in this study (13). Serum samples taken as a result of routine examinations were collected from denim bleaching workers diagnosed with silicosis and people in the control group who did not show any symptoms or radiological findings despite working in the same environment. Control group and study group consist of non-smoker or ex-smoker (more than 10 years) workers. In the study, consent forms containing questions about the socio demographic variables, medical history and workplace conditions of both control and exposed groups were filled and strictly adhered to the principles of the Declaration of Helsinki. The workers with chronic diseases (coronary heart disease, hypertension, diabetes, etc.), and acute infections were excluded in the study. The patients were selected among Category 2 patients classified according to ILO pneumoconiosis classification. Oral and written informed consent was granted by all women involved in the study. Serum samples for arginine, ADMA, SDMA, and L-NMMA levels were collected as biological material from the individuals. At the end of the shift week, first morning voiding venous blood were collected into tubes (BD Vacutainer, USA), than centrifuging the samples at 3500×g for 10 min at 4°C, serum were separated and stored at −80°C further until transfer samples. The samples were transferred in boxes in ice molds to Yozgat Bozok University Science and Technology Application and Research Center (BILTEM) for measuring arginine, ADMA, SDMA and L-NMMA levels.
Laboratory AnalysisWithin the scope of the study, the analysis and preliminary preparation processes of the samples that were thawed in accordance with the commercial kit procedure were performed. The serum arginine, ADMA, SDMA and L-NMMA levels were determined using a commercially available enzyme-linked immunosorbent assay (ELISA) kit, according to the manufacturer’s instructions. The reading of the samples placed on the microplates was done with a BMG LABTECH ClarioStar model ELISA device with a wavelength of 450 nm. Control materials used for optimization and for validity of the ELISA methods. Control samples were used for verification. The analysis was done in 5 points according to the calibration curves created against the standard measurements in the ELISA device. Each kit was read at least 10 times and regression analysis was performed by taking the averages.
Statistical AnalysisStatistical Package for the Social Sciences (IBM SPSS Statistics for Windows, Version 25.0) program was used for the analysis of all parameters. The data were evaluated in terms of compliance with normal distribution using the Kolmogorov-Smirnov test. Descriptive statistics were
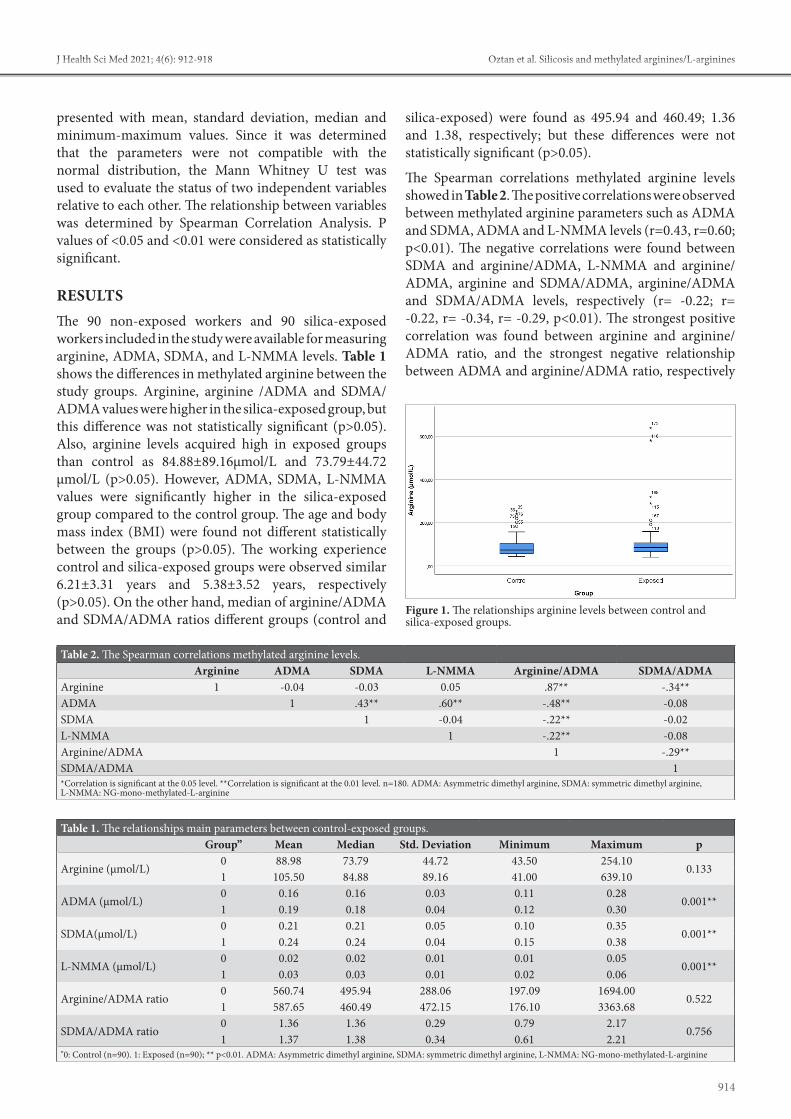
914
Öztan et al. Silicosis and methylated arginines/L-argininesJ Health Sci Med 2021; 4(6): 912-918
presented with mean, standard deviation, median and minimum-maximum values. Since it was determined that the parameters were not compatible with the normal distribution, the Mann Whitney U test was used to evaluate the status of two independent variables relative to each other. The relationship between variables was determined by Spearman Correlation Analysis. P values of <0.05 and <0.01 were considered as statistically significant.
RESULTSThe 90 non-exposed workers and 90 silica-exposed workers included in the study were available for measuring arginine, ADMA, SDMA, and L-NMMA levels. Table 1 shows the differences in methylated arginine between the study groups. Arginine, arginine /ADMA and SDMA/ADMA values were higher in the silica-exposed group, but this difference was not statistically significant (p>0.05). Also, arginine levels acquired high in exposed groups than control as 84.88±89.16µmol/L and 73.79±44.72 µmol/L (p>0.05). However, ADMA, SDMA, L-NMMA values were significantly higher in the silica-exposed group compared to the control group. The age and body mass index (BMI) were found not different statistically between the groups (p>0.05). The working experience control and silica-exposed groups were observed similar 6.21±3.31 years and 5.38±3.52 years, respectively (p>0.05). On the other hand, median of arginine/ADMA and SDMA/ADMA ratios different groups (control and
silica-exposed) were found as 495.94 and 460.49; 1.36 and 1.38, respectively; but these differences were not statistically significant (p>0.05).
The Spearman correlations methylated arginine levels showed in Table 2. The positive correlations were observed between methylated arginine parameters such as ADMA and SDMA, ADMA and L-NMMA levels (r=0.43, r=0.60; p<0.01). The negative correlations were found between SDMA and arginine/ADMA, L-NMMA and arginine/ADMA, arginine and SDMA/ADMA, arginine/ADMA and SDMA/ADMA levels, respectively (r= -0.22; r= -0.22, r= -0.34, r= -0.29, p<0.01). The strongest positive correlation was found between arginine and arginine/ADMA ratio, and the strongest negative relationship between ADMA and arginine/ADMA ratio, respectively
Figure 1. The relationships arginine levels between control and silica-exposed groups.
Table 1. The relationships main parameters between control-exposed groups. Group” Mean Median Std. Deviation Minimum Maximum p
Arginine (µmol/L)0 88.98 73.79 44.72 43.50 254.10
0.1331 105.50 84.88 89.16 41.00 639.10
ADMA (µmol/L)0 0.16 0.16 0.03 0.11 0.28
0.001**1 0.19 0.18 0.04 0.12 0.30
SDMA(µmol/L)0 0.21 0.21 0.05 0.10 0.35
0.001**1 0.24 0.24 0.04 0.15 0.38
L-NMMA (µmol/L)0 0.02 0.02 0.01 0.01 0.05
0.001**1 0.03 0.03 0.01 0.02 0.06
Arginine/ADMA ratio0 560.74 495.94 288.06 197.09 1694.00
0.5221 587.65 460.49 472.15 176.10 3363.68
SDMA/ADMA ratio0 1.36 1.36 0.29 0.79 2.17
0.7561 1.37 1.38 0.34 0.61 2.21
"0: Control (n=90). 1: Exposed (n=90); ** p<0.01. ADMA: Asymmetric dimethyl arginine, SDMA: symmetric dimethyl arginine, L-NMMA: NG-mono-methylated-L-arginine
Table 2. The Spearman correlations methylated arginine levels. Arginine ADMA SDMA L-NMMA Arginine/ADMA SDMA/ADMAArginine 1 -0.04 -0.03 0.05 .87** -.34**ADMA 1 .43** .60** -.48** -0.08SDMA 1 -0.04 -.22** -0.02L-NMMA 1 -.22** -0.08Arginine/ADMA 1 -.29**SDMA/ADMA 1*Correlation is significant at the 0.05 level. **Correlation is significant at the 0.01 level. n=180. ADMA: Asymmetric dimethyl arginine, SDMA: symmetric dimethyl arginine, L-NMMA: NG-mono-methylated-L-arginine
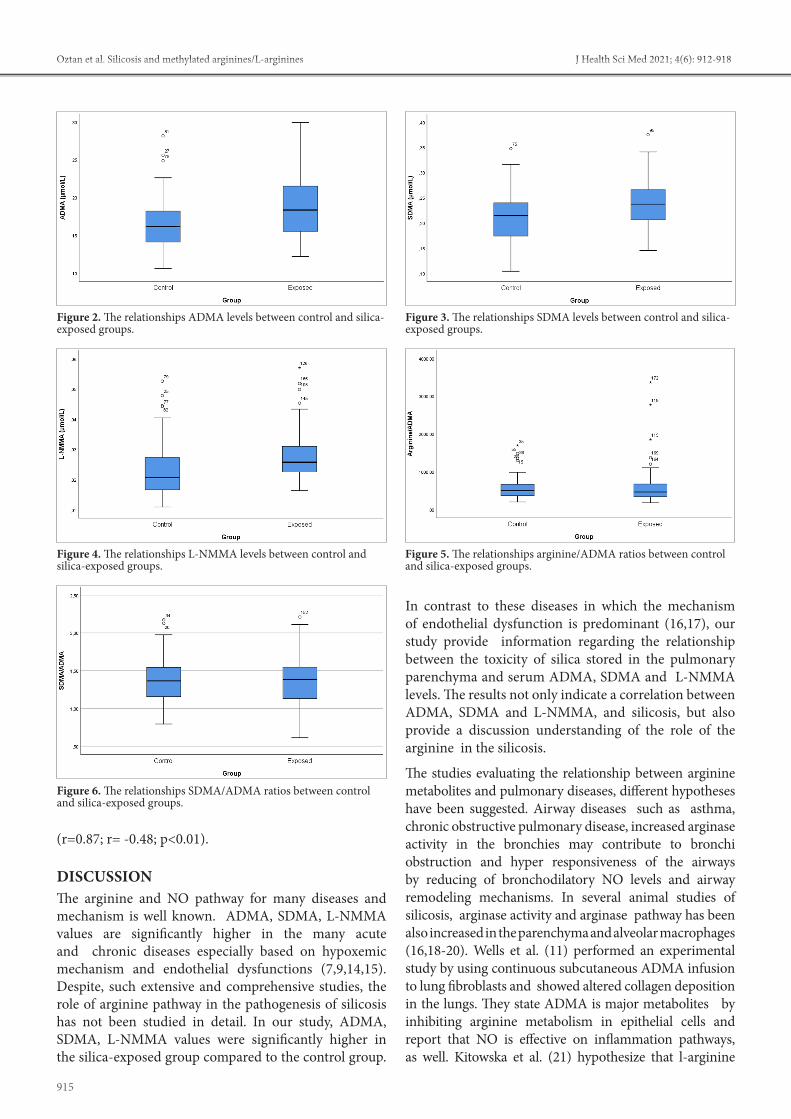
915
Öztan et al. Silicosis and methylated arginines/L-arginines J Health Sci Med 2021; 4(6): 912-918
(r=0.87; r= -0.48; p<0.01).
DISCUSSIONThe arginine and NO pathway for many diseases and mechanism is well known. ADMA, SDMA, L-NMMA values are significantly higher in the many acute and chronic diseases especially based on hypoxemic mechanism and endothelial dysfunctions (7,9,14,15). Despite, such extensive and comprehensive studies, the role of arginine pathway in the pathogenesis of silicosis has not been studied in detail. In our study, ADMA, SDMA, L-NMMA values were significantly higher in the silica-exposed group compared to the control group.
In contrast to these diseases in which the mechanism of endothelial dysfunction is predominant (16,17), our study provide information regarding the relationship between the toxicity of silica stored in the pulmonary parenchyma and serum ADMA, SDMA and L-NMMA levels. The results not only indicate a correlation between ADMA, SDMA and L-NMMA, and silicosis, but also provide a discussion understanding of the role of the arginine in the silicosis.
The studies evaluating the relationship between arginine metabolites and pulmonary diseases, different hypotheses have been suggested. Airway diseases such as asthma, chronic obstructive pulmonary disease, increased arginase activity in the bronchies may contribute to bronchi obstruction and hyper responsiveness of the airways by reducing of bronchodilatory NO levels and airway remodeling mechanisms. In several animal studies of silicosis, arginase activity and arginase pathway has been also increased in the parenchyma and alveolar macrophages (16,18-20). Wells et al. (11) performed an experimental study by using continuous subcutaneous ADMA infusion to lung fibroblasts and showed altered collagen deposition in the lungs. They state ADMA is major metabolites by inhibiting arginine metabolism in epithelial cells and report that NO is effective on inflammation pathways, as well. Kitowska et al. (21) hypothesize that l-arginine
Figure 2. The relationships ADMA levels between control and silica-exposed groups.
Figure 3. The relationships SDMA levels between control and silica-exposed groups.
Figure 5. The relationships arginine/ADMA ratios between control and silica-exposed groups.
Figure 4. The relationships L-NMMA levels between control and silica-exposed groups.
Figure 6. The relationships SDMA/ADMA ratios between control and silica-exposed groups.

916
Öztan et al. Silicosis and methylated arginines/L-argininesJ Health Sci Med 2021; 4(6): 912-918
have been reported on the use them in the early diagnosis, treatment and follow-up of diseases. Major promising improvement has been made in research on ADMA-lowering therapies in cancer, cardiovascular diseases and so on. However, further human studies are needed in order to treat human diseases related to elevated ADMA/SDMA levels (34–36). Furthermore, the studies that L-arginine may have a predictive role in monitoring silicosis and many other diseases, as well (27,37). Several studies stated that ADMA and oxidative stress biomarkers as a screening biomarker for pulmonary arterial hypertension and silicosis, COPD respectively (38–40). Pacheco et al. (41) stated macrophages polarize to M2 phenotype in response to arginase, and in this case they are involved in the inflammation resolution and tissue repairs. However, different results regarding these studies are also reported (17). Further evaluations with larger study groups are necessary.
Strengths and LimitationsSome strengths and limitations should be discussed. The case and control group matched in terms of age and working year were included in the study are the strengths of this study, as it reduces confounding factors. On the other hand, despite the absence of environmental silica measurements, the absence of an evaluation of the disease stages of silicosis patients with a relatively small number of cases are main limitations in our study. Finally, given the cross-sectional design, the study has limited power to explain the potential metabolic biomarkers for disease progression and survival, which are clinically significant.
CONCLUSIONIn conclusion, the diagnosis and screening of silicosis basically depend on a history of silica exposure and radiological findings. Recent studies on pathophysiological mechanisms and markers to understand the nature of silicosis have a great contribution to better understanding silicosis. Our small study showed the relationship between silicosis and arginine pathway. The results could provide additional insight into understanding the disease and potential for developing biomarkers. We believe that the role of ADMA, SDMA and arginine in the diagnosis, screening, treatment and follow-up of silicosis will be better understood with future studies.
ETHICAL DECLARATIONSEthics Committee Approval: This study was ethically approved by the Non-interventional Clinical Researchs Ethics Committee of Bozok University Medical Faculty (Date: 17.10.2016, Decision No:17/04). Informed Consent: All patients signed the free and informed consent form.
metabolism is changed in pulmonary fibrosis by affecting extra cellular matrix synthesis.
As already well known silicosis is a progressive pneumoconiosis characterized by fibrosis in the lungs. Also, chronic exposure to silica may cause chronic obstructive pulmonary disease, emphysema, lung cancer, and pulmonary fibrosis (22). It has complex pathophysiological mechanisms and involves many systematic, cellular and molecular arrangements. Crystalline silica entering the airways, triggers a number of inflammatory processes (23,24). The repeated process of defense circle, the macrophages induces activation of the reactive oxygen radicals and inflammatory reactions, which is linked with pulmonary interstitial fibrosis mechanism (25,26). On the other hands, the role of arginine pathway in the pathogenesis of pneumoconiosis has not been studied in detail. Xue et al. (27) studied distinct metabolic features in the silicosis. They stated sphingolipid and arginine and proline metabolism were the dominant metabolic pathway in silicosis and arginine was positively correlated with the stage of silicosis. Increased levels of some inflammatory markers IL-8 and IL-6, tumor necrosis factor, and IL-1β, -were elevated in fibrotic lung tissue of silica-induced lung damage compared with normal lung tissue. (clear form of abbreviations should be stated where they are first used.) In the early pathogenesis of silicosis, the enhancement of arginine metabolism and is closely related to the severity of the fibrosis (28,29) In the end stage, the formation of silicotic micro nodules is the pathological manifestation of the production of collagen bres and pulmonary interstitial fibrosis mediated by amino acid metabolism, which is consistent with the recent studies that arginine pathway and extracellular matrix synthesis were the dominant mechanism in silicosis (27).
ADMA is similar to arginine in terms of molecular structure and it competes with arginine for NOS binding, thus blocking the production of NO from arginine by NOS directly. Since, ADMA competes with arginine for NOS, the bioavailability of NO depends on the equation between the two, the so-named arginine/ADMA ratio (30). Keller et al. (31) stated that the arginine/ADNA ratio is a more sensitive risk marker in cardiac diseases. In our study arginine/ADMA and SDMA/ADMA ratios were not significantly different exposed versus non exposed groups. Also in correlation analysis we found positive correlation between arginine and arginine/ADMA ratio. Molnar et al. (14) assessed L-arginine, arginine/ADMA ratio in stroke patients. They stated that arginine levels may tend to both increase and decrease and different results can be found in different stages of silicosis.
Arginine, ADMA, SDMA, L-NMMA studies show improvement (32,33). An increasing number of studies

917
Öztan et al. Silicosis and methylated arginines/L-arginines J Health Sci Med 2021; 4(6): 912-918
Referee Evaluation Process: Externally peer-reviewed. Conflict of Interest Statement: The authors have no conflicts of interest to declare. Financial Disclosure: This study was supported by the Bozok University Scientific Research Foundation (grant No. 6602b-TF/18-227).Author Contributions: All of the authors declare that they have all participated in the design, execution, and analysis of the paper, and that they have approved the final version.
REFERENCES1. Chan JYW, Tsui JCC, Law PTW, et al. Regulation of TLR4 in silica-
induced inflammation: An underlying mechanism of silicosis. Int J Med Sci 2018; 15: 986–91.
2. Dowsett L, Higgins E, Alanazi S, Alshuwayer NA, Leiper FC, Leiper J. ADMA: a key player in the relationship between vascular dysfunction and ınflammation in atherosclerosis. J Clin Med 2020; 9: 3026.
3. Patel RP, Levonen AL, Crawford JH, Darley-Usmar VM. Mechanisms of the pro- and anti-oxidant actions of nitric oxide in atherosclerosis. Vol. 47, Cardiovascular Research. Oxford Academic; 2000. p. 465–74.
4. Antoniades C, Shirodaria C, Leeson P, et al. Association of plasma asymmetrical dimethylarginine (ADMA) with elevated vascular superoxide production and endothelial nitric oxide synthase uncoupling: Implications for endothelial function in human atherosclerosis. Eur Heart J 2009; 30: 1142–50.
5. Zhao Y, Hao C, Bao L, et al. Silica particles disorganize the polarization of pulmonary macrophages in mice. Ecotoxicol Environ Saf 2020; 193.
6. Oliva-Damaso E, Oliva-Damaso N, Rodriguez-Esparragon F, et al. Asymmetric (ADMA) and symmetric (SDMA) dimethylarginines in chronic kidney disease: A clinical approach. Int J Molecular Sci. MDPI AG 2019; 20: 3668.
7. Koudelka A, Ambrozova G, Klinke A, et al. Nitro-oleic acid prevents hypoxia- and asymmetric dimethylarginine-ınduced pulmonary endothelial dysfunction. Cardiovasc Drugs Ther 2016; 30: 579–86.
8. Vallance P, Leiper J. Cardiovascular biology of the asymmetric dimethylarginine: dimethylarginine dimethylaminohydrolase pathway. Arterioscler Thromb Vasc Biol 2004; 24: 1023–30.
9. Zewinger S, Kleber ME, Rohrer L, et al. Symmetric dimethylarginine, high-density lipoproteins and cardiovascular disease. Eur Heart J 2017; 38: 1597–607.
10. Szabo Z, Bartha E, Nagy L, Molnar T. Increased symmetric dimethylarginine, but not asymmetric dimethylarginine, concentrations are associated with transient myocardial ischemia and predict outcome. J Int Med Res 2020; 48: 6.
11. Wells SM, Buford MC, Migliaccio CT, Holian A. Elevated asymmetric dimethylarginine alters lung function and induces collagen deposition in mice. Am J Respir Cell Mol Biol 2009; 40: 179–88.
12. Vögeli A, Ottiger M, Meier MA, et al. Asymmetric Dimethylarginine Predicts long-term outcome in patients with acute exacerbation of chronic obstructive pulmonary disease. Lung 2017; 195: 717–27.
13. Fernández Álvarez R, Martínez González C, Quero Martínez A, Blanco Pérez JJ, Carazo Fernández L, Prieto Fernández A. Guidelines for the Diagnosis and Monitoring of Silicosis. Arch Bronconeumol 2015; 51: 86–93.
14. Molnar T, Pusch G, Papp V, et al. The L-arginine pathway in acute ischemic stroke and severe carotid stenosis: Temporal profiles and association with biomarkers and outcome. J Stroke Cerebrovasc Dis 2014; 23: 2206–14.
15. Hosinian M, Qujeq D, Ahmadi Ahangar A. The relation between GABA and L-arginine levels with some stroke risk factors in acute ischemic stroke patients. Int J Mol Cell Med Spring 2016; 5: 100-5.
16. Maarsingh H, Pera T, Meurs H. Arginase and pulmonary diseases. Vol. 378, Naunyn-Schmiedeberg’s Archives of Pharmacology 2008. p. 171–84.
17. Parmaksiz E, Inal A, Salepci B, et al. Relationship of asymmetric dimethylarginine levels with disease severity and pulmonary hypertension in chronic obstructive pulmonary disease. Lung India 2018; 35: 199–203.
18. Tadié JM, Henno P, Leroy I, et al. Role of nitric oxide synthase/arginase balance in bronchial reactivity in patients with chronic obstructive pulmonary disease. Am J Physiol - Lung Cell Mol Physiol 2008; 294: 3.
19. Fajardo I, Svensson L, Bucht A, Pejler G. Increased levels of hypoxia-sensitive proteins in allergic airway inflammation. Am J Respir Crit Care Med 2004; 170: 477–84.
20. Böger R, Hannemann J. Dual role of the L-arginine–ADMA–NO pathway in systemic hypoxic vasodilation and pulmonary hypoxic vasoconstriction. Vol. 10, Pulmonary Circulation. SAGE Publications Ltd; 2020. Apr-Jun; 10: 2.
21. Kitowska K, Zakrzewicz D, Königshoff M, et al. Functional role and species-specific contribution of arginases in pulmonary fibrosis. Am J Physiol Cell Mol Physiol 2008; 294: L34–45.
22. Ding M, Chen F, Shi X, Yucesoy B, Mossman B, Vallyathan V. Diseases caused by silica: Mechanisms of injury and disease development. Vol. 2, International Immunopharmacology. Elsevier; 2002. p. 173–82.
23. Rimal B, Greenberg AK, Rom N. Basic pathogenetic mechanisms in silicosis: Current understanding. Vol. 11, Current Opinion in Pulmonary Medicine. Lippincott Williams and Wilkins; 2005. p. 169–73.
24. Anlar HG, Bacanli M, İritaş S, et al. Effects of Occupational Silica Exposure on OXIDATIVE Stress and Immune System Parameters in Ceramic Workers in TURKEY. J Toxicol Environ Heal - Part A Curr Issues 2017; 80: 688–96.
25. Pollard KM. Silica, silicosis, and autoimmunity. Front Immunol 2016; 7: 97.
26. Liu H, Cheng Y, Yang J, et al. BBC3 in macrophages promoted pulmonary fibrosis development through inducing autophagy during silicosis. Cell Death Dis 2017; 8: 3.
27. Xue C, Chao-Yang B, Alicated H, et al. Distinct metabolic features in the plasma of patients with silicosis and dust-exposed workers in Chinaa case-control study. BMC Pulmonary Medicine 2021; 21.
28. Misson P, van den Brûle S, Barbarin V, Lison D, Huaux F. Markers of macrophage differentiation in experimental silicosis. J Leukoc Biol 2004; 76: 926–32.
29. Miao R, Ding B, Zhang Y, Xia Q, Li Y, Zhu B. Proteomic profiling change during the early development of silicosis disease. J Thorac Dis 2016; 8: 329–41.
30. Brinkmann SJH, Wörner EA, Buijs N, et al. The arginine/ADMA ratio is related to the prevention of atherosclerotic plaques in hypercholesterolemic rabbits when giving a combined therapy with atorvastatine and arginine. Int J Mol Sci 2015; 16: 12230–42.
31. Notsu Y, Yano S, Shibata H, Nagai A, Nabika T. Plasma arginine/ADMA ratio as a sensitive risk marker for atherosclerosis: Shimane CoHRE study. Atherosclerosis 2015; 239: 61–6.
32. Clemente GS, van Waarde A, Antunes IF, Dömling A, Elsinga PH. Arginase as a potential biomarker of disease progression: A molecular imaging perspective. Vol. 21, International Journal of Molecular Sciences. MDPI AG; 2020. p. 1–36.
33. Mussai F, Wheat R, Sarrou E, et al. Targeting the arginine metabolic brake enhances immunotherapy for leukaemia. Int J Cancer 2019; 145: 2201–8.
34. Tain YL, Hsu CN. Toxic dimethylarginines: Asymmetric dimethylarginine (ADMA) and symmetric dimethylarginine (SDMA). Toxins (Basel) 2017; 9: 92.

918
Öztan et al. Silicosis and methylated arginines/L-argininesJ Health Sci Med 2021; 4(6): 912-918
35. Trocha M, Szuba A, Merwid-Lad A, Sozánski T. Effect of selected drugs on plasma asymmetric dimethylarginine (ADMA) levels. Pharmazie 2010; 65: 562–71.
36. Gao L, Zhang JH, Chen XX, et al. Combination of L-Arginine and L-Norvaline protects against pulmonary fibrosis progression induced by bleomycin in mice. Biomed Pharmacother 2019; 113: 108768.
37. Böger RH, Maas R, Schulze F, Schwedhelm E. Elevated levels of asymmetric dimethylarginine (ADMA) as a marker for cardiovascular disease and mortality. Clin Chem Lab Med 2005; 43: 1124–9.
38. Thakkar V, Stevens WM, Prior D, et al. N-terminal pro-brain natriuretic peptide in a novel screening algorithm for pulmonary arterial hypertension in systemic sclerosis: A case-control study. Arthritis Res Ther 2012; 14: 3.
39. Nardi J, Nascimento S, Göethel G, et al. Inflammatory and oxidative stress parameters as potential early biomarkers for silicosis. Clinica Chimica Acta 2018; 484: 305–13.
40. Telo S, Kırkıl G, Kuluöztürk M, Balin M, Deveci F. Can ADMA play a role in determining pulmonary hypertension related to chronic obstructive pulmonary disease? Clin Respir J 2018; 12: 1433–8.
41. Lopes-Pacheco M, Bandeira E, Morales MM. Cell-based therapy for silicosis. Stem Cells International 2016; doi.org/10.1155/2016/5091838.

HEALTH SCIENCESMEDICINE
Original Article
J Health Sci Med 2021; 4(6): 919-926
This work is licensed under a Creative Commons Attribution 4.0 International License.
DOI: 10.32322/jhsm.983161
Received: 15.08.2021 Accepted: 04.09.2021Corresponding Author: Muharrem Bayrak, [email protected]
Impact of quality of life on nutritional risk and malnutrition: a cross-sectional study in elderly patients
Muharrem Bayrak1, Gökhan Özpolat21Health Sciences University, Erzurum Regional Training and Research Hospital, Department of Internal Medicine, Erzurum, Turkey2Health Sciences University, Erzurum Regional Training and Research Hospital, Department of Psychiatry, Erzurum, Turkey
Cite this article as: Bayrak M, Özpolat G. Impact of quality of life on nutritional risk and malnutrition: a cross-sectional study in elderly patients. J Health Sci Med 2021; 4(6): 919-926.
ABSTRACTObjectives: To investigate prevalence of malnutrition and nutritional risk, related factors, and the association between nutritional status and quality of life in the elderly.Material and Method: Cross-sectional study. Participants; elderly (≥65 years) patients without severe hearing and vision impairment and dependency on a bed or wheel chair who admitted internal medicine outpatient clinics. Measurements; the mini nutritional assessment questionnaire, Charlson comorbidity index, the World Health Organization quality of life (WHOQOL-OLD) questionnaire. Intervention; none.Results: The study included 532 patients with a mean age of 70.8±5.4 years. The median Mini Nutritional Assessment score was 26, and the total prevalence of nutritional risk and malnutrition was 26.7%. There were significant differences between the nutritional groups regarding the educational, living, and marital status, smoking history, presence of any systemic disease, Charlson Comorbidity Index, and polypharmacy (p<0.05). WHOQOL-OLD and its subdomain scores had a significant relationship with having nutritional risk or malnutrition (p<0.001). Total WHOQOL-OLD score and the Charlson Comorbidity Index were significant independent risk factors for developing nutritional risk and malnutrition.Conclusion: Having nutritional risk or malnutrition in the elderly were significantly associated with the Charlson Comorbidity Index and the WHOQOL-OLD total and its subdomain scores.Keywords: Elderly, nutritional status, malnutrition, health-related quality of life, comorbidity.
Ana Metin-Alt bilgi Arası 5mm
Cite-Öz arası 5mm
Başlık-Yazarlar arası 12mm
Yazar-Kurum arası 2,5 mm
Kurum-Cite arası 5mm
Öz-Abstract arası 7,5mm
INTRODUCTIONThe aging population has emerged as a new demographic trend in recent years. There is an inverse relationship between increased life expectancy and quality of life, most probably due to chronic diseases and disability (1,2). Besides, a substantial proportion of community-dwelling elderly lacks an adequate nutrient intake leading to an increased risk for malnutrition (1,3,4). Food is not only required for physiological well-being, but it also contributes to social, cultural, and psychological quality of life (4). So, aging and increased risk of malnutrition lead to a low quality of life as well as physical, mental, and social disabilities (5).
As a significant and common public health problem in older adults, the prevalence of malnutrition and associated factors show substantial variations based on the nutritional screening tools and the studied population's characteristics (4,5). In previous studies, the rate of malnutrition ranged from 20 to 30% in clinical
settings and from 2 to 8% in older adults in community-residences (2). Several physiological, socio-economic, and neuropsychological health-related factors influence the nutritional status, including depression, social isolation, and frailty status. Thus, the real-time knowledge about the prevalence of malnutrition in a specified population alerts the physicians dealing with older adults.
The assessment of nutritional risk is a strong determinant of interventions to prevent malnutrition and manage different aspects of quality of life, including its physical and mental components (1). Identifying people with malnutrition or nutritional risk includes some inherent difficulties (3). Besides the use of a diverse set of instruments for the evaluation of malnutrition and its risk, there is still a lack of a gold standard for the optimal definition of malnutrition. Nevertheless, the Mini Nutritional Assessment (MNA) has been recommended for its higher efficiency to predict malnutrition in the elderly (6,7).

920
Yıldırım et al. Quality of life and malnutrition J Health Sci Med 2021; 4(6): 919-926
In this study, we aimed to determine the prevalence of malnutrition and associated factors and analyze the association between the nutritional status of the older adults indicated by the MNA and their quality of life indicated by the World Health Organization Quality of Life (WHOQOL-OLD) questionnaire.
MATERIAL AND METHODThe study was carried out with the permission of Erzurum Regional Training and Researh Hospital Clinical Researchs Ethics Committee (Date: 06.01.2020, Decision No: 2020/01-06). All procedures were carried out in accordance with the ethical rules and the principles of the Declaration of Helsinki.
PatientsThe MNA questionnaire was applied to all consecutive patients who were 65 or older and admitted to the Internal Medicine Outpatient Clinics after obtaining their consent between 01.01.2020 and 01.07.2020. Patients who had communication problems such as severe hearing (n=235) and vision impairment (n=192) or were dependent on bed or wheelchair (n=59) were not evaluated. A total of 532 patients were included in the study.
Several sociodemographic and clinical variables, including age, sex, body mass index (BMI), educational and marital status, living status (alone, with relatives, or residential care center), history of smoking, comorbidities, and drugs used, were evaluated. The patients were classified based on BMI values as underweight (BMI < 18.5 kg/m2), normal (18.5–24.9 kg/m2), or overweight (BMI ≥ 25 kg/m2). Patients using five or more drugs were grouped as polypharmacy. The Charlson Comorbidity Index (CCI) was calculated for each patient using the website www.mdcalc.com/charlson-comorbidity-index (8).
Questionnaires and ScalesNutritional status was evaluated using the MNA questionnaire that was translated and validated in the Turkish language (9). MNA includes 18 items for the anthropometric measurements, dietary intake, global health assessment, and self-assessment of health and nutrition. The patients were categorized as satisfactory nutritional status (scores ≥24), nutritional risk (scores between 17 and 23.5), and malnutrition (scores <17) (1).
The WHOQLD-OLD questionnaire was applied to the patients to assess their quality of life. The WHOQLD-OLD contains six different subdomains: sensory abilities, autonomy, past, present, future activities, social participation, death and dying, and intimacy (1). Higher scores represent a higher self-rated quality of life. The 30-item Geriatric Depression Scale (GDS) was used to evaluate depression. A GDS score >10 was regarded as
depression (10, 11). Cognitive ability was assessed using the Mini-Mental State Examination (MMSE), commonly used to monitor dementia and cognitive states (12, 13). The MMSE score ranges from 0 (impaired) to 30 (normal). Scores below 24 were regarded as cognitive impairment (14). The Hendrich II Fall Risk Model (HIIFRM) was used to analyze the factors associated with fall risk. The HIIFRM score ranges from 0 to 16, where scores ≥5 were considered a high risk for falls (15).
Anthropometric MeasurementsThe anthropometric evaluation included body circumference (calf, arm) and triceps skinfold thickness. All measurements were carried out in the morning after an overnight fast of at least 8 hours. The BMI values were calculated as the bodyweight divided by the square of the height (kg/m2). The calf and arm circumferences were measured using a non-elastic tape measure. For calf measurements, the tape measure was placed around the calf without compressing the subcutaneous tissue and was moved along the calf 's length to obtain the maximal circumference while the patient was lying down, and the leg was angled 90° at the knee. Calf circumference values were recorded as the average of the measurements from two trials for each leg, which were averaged again to get the overall measurement (16). Forearm circumference (mid-upper arm circumference) was measured at the midpoint between the acromion and olecranon bones while the arm was angled 90° at the elbow (17). For the measurement of triceps skinfold thickness, while the patients were standing and the arms were free at both sides, the arms were angled 90°, and the midpoint between the shoulder and the acromion was marked with a pencil. The skinfold was measured at the marked point. The anthropometric measurements were performed twice by experienced nurses and averaged later.
Biochemical analyses included hemoglobin (g/dL), fasting blood glucose (mg/dL), HbA1c (%), total cholesterol (mg/dL), low density lipoprotein (LDL) cholesterol (mg/dL), triglyceride (mg/dL), albumin (mg/dL), ferritin (ng/mL), vitamins B12 (pg/mL) and D (ng/mL) and B9 (folic acid) (ng/mL). Glomerular filtration rate (mL/min) was calculated using the Modification of Diet in Renal Disease (MDRD) formula (18).
Statistical AnalysisThe primary outcome of the study was the prevalence of nutritional risk and malnutrition. The analysis of the factors associated with nutritional risk and malnutrition and the association between nutritional risk and the quality of life were the secondary outcomes.
Descriptive statistics were given as mean±standard deviation or median [interquartile range-IQR] for the continuous variables depending on their distribution.

921
Yıldırım et al. Upper gastrointestinal system endoscopy results & Helicobacter pyloriJ Health Sci Med 2021; 4(6): 919-926
Numbers and percentages were used for categorical variables. The Kolmogorov-Smirnov test was used to check normal distribution. The One-Way ANOVA test was used to compare more than two independent groups when the numerical variables had a normal distribution. For variables without normal distribution, the Kruskal-Wallis test was applied.
For the analyses in which non-parametric tests were used, the differences between the groups were evaluated with the Tukey test when data was homogeneous based on its distribution. The Games-Howell test was used in situations where data was not homogeneous. The Dwass-Steel-Critchlow-Fligner test was used to evaluate the differences between the groups. To compare the differences between categorical variables, Pearson Chi-Square and Fisher-Freeman-Halton tests were used in 2x2 tables. Spearman correlation coefficients were calculated to analyze the relationships between numerical variables. Univariate and multivariate logistic regression analyses were performed to
analyze the demographic and clinical factors that impact nutritional risk and malnutrition. Statistically significant demographic and clinical characteristics in the univariate analysis were included in the multivariate analysis. For statistical analysis and figures, Jamovi (version 1.6.3, retrieved from https://www.jamovi.org) and JASP (version 0.13.1, retrieved from https://jasp-stats.org) software were used. The significance level (p-value cutoff) was set at 0.05 in all statistical analyses.
RESULTSThere were 532 patients with a mean age of 70.8±5.4 years. The female to male ratio was 1.1. The majority of the patients lived with their relatives. Although hypertension was the most significant comorbid disease (358 patients, 67.3%), there was no comorbidity in 249 patients (46.8%). The median CCI score was 4. The demographic and clinical characteristics of the study group were given in Table 1.
Table 1. Demographic and clinical characteristics of the study groups
Overall (n=532)
Groupsp-valuesSatisfactory nutritional
status (n=390)Nutritional risk
(n=83)Malnutrition
(n=59)Age (year)† 70.8±5.4 70.7±5.4 70.9±6.0 71.4±4.4 0.514Sex‡ 0.938
Male 253 (47.6) 187 (47.9) 38 (45.8) 28 (47.5) Female 279 (52.4) 203 (52.1) 45 (54.2) 31 (52.5)
Educational status‡ <0.001Illiterate 125 (23.5) 69 (17.7)a 28 (33.7)b 28 (47.5)b
Primary 307 (57.7) 230 (59.0)a 46 (55.4)a 31 (52.5)a
Secondary-college 76 (14.3) 67 (17.2)a 9 (10.8)a 0 (0.0)b University 24 (4.5) 24 (6.2)a 0 (0.0)b 0 (0.0)a,b
Living status‡ <0.001Alone 136 (25.6) 88 (22.6)a 33 (39.8)b 15 (25.4)a,b
With relatives 344 (64.7) 291 (74.6)a 45 (54.2)b 8 (13.6)c Residential care center 52 (9.8) 11 (2.8)a 5 (6.0)a 36 (61.0)b
Marital status‡ <0.001Single 38 (7.1) 28 (7.2)a 5 (6.0)a 5 (8.5)a
Married 333 (62.6) 289 (74.1)a 40 (48.2)b 4 (6.8)c
Divorced/widowed 161 (30.3) 73 (18.7)a 38 (45.8)b 50 (84.7)c Smoking‡ 208 (39.1) 145 (37.2)a 30 (36.1)a 33 (55.9)b 0.019Comorbidity‡
Hypertension 358 (67.3) 239 (61.3)a 62 (74.7)b 57 (96.6)c <0.001Diabetes mellitus 210 (39.5) 149 (38.2) 37 (44.6) 24 (40.7) 0.548Any systemic disease 283 (53.2) 172 (44.1)a 54 (65.1)b 57 (96.6)c <0.001
Systemic disease‡ <0.001Absent 249 (46.8) 218 (55.9)a 29 (34.9)b 2 (3.4)c
Coronary artery disease 84 (15.8) 66 (16.9)a 14 (16.9)a,b 4 (6.8)b
Chronic heart failure 17 (3.2) 10 (2.6)a 5 (6.0)a 2 (3.4)a
Chronic renal failure 40 (7.5) 34 (8.7)a 4 (4.8)a 2 (3.4)a
Cerebrovascular accident 66 (12.4) 18 (4.6)a 11 (13.3)b 37 (62.7)c
Chronic liver failure 10 (1.9) 7 (1.8)a 1 (1.2)a 2 (3.4)a
Malignancy 23 (4.3) 6 (1.5)a 11 (13.3)b 6 (10.2)b
Chronic obstructive pulmonary disease 43 (8.1) 31 (7.9)a 8 (9.6)a 4 (6.8)a
Charlson comorbidity indexβ 4.0 [2.0-14.0] 4.0 [2.0-10.0]a 5.0 [3.0-13.0]b 8.0 [4.0-14.0]c <0.001Polypharmacy‡ 215 (40.4) 121 (31.0)a 42 (50.6)b 52 (88.1)c <0.001Mini Nutritional Assessmentβ 26.0 [6.0-29.0] 26.0 [19.0-29.0]a 19.0 [11.0-26.0]b 9.0 [6.0-17.0]c <0.001†mean±standard deviation,‡n (%),βmedian (IQR), Each subscript letter denotes a subset of group categories whose column proportions do not differ significantly from each other at the 0.05 level.

922
Yıldırım et al. Quality of life and malnutrition J Health Sci Med 2021; 4(6): 919-926
The median MNA score was 26 [6-29]. Based on the MNA scores, 83 patients (15.6%) had nutritional risk, and 59 patients (11.1%) had malnutrition; 390 patients (73.3%) had satisfactory nutritional status. The combined prevalence of malnutrition (nutritional risk and malnutrition) was 26.7%. The comparison of different nutritional status (satisfactory nutritional status, nutritional risk, and malnutrition) for various variables was given in Table 1. Significant differences were found between the groups regarding their education, living and marital status, smoking history, systemic diseases, CCI scores, and polypharmacy status. Malnutrition was more common in patients with low education, those living in residential care centers, and those who were divorced or widowed (p<0.001 for each). Smoking was significantly associated with malnutrition (p=0.019). Hypertension and any systemic disease were more common in patients with nutritional risk and malnutrition (p<0.001 for
both). Cerebrovascular accident was the most common systemic disease (62.7%) in the patients with malnutrition (p<0.001). The CCI score was significantly higher in malnourished patients (p<0.001). Polypharmacy was more frequent in the patients with malnutrition (88.1%) than in the patients with nutritional risk (50.6%) and satisfactory nutritional status (31.0%).
Outcomes of the questionnaires, anthropometric measurements, and laboratory analyses were summarized in Table 2. The median total WHOQOL-OLD scores were 27.0, 36.0, and 56.0 in patients with malnutrition, nutritional risk, and satisfactory nutritional status, respectively; the differences between the groups were significant (p<0.001 for all). The WHOQOL-OLD and its domain scores were significantly associated with nutritional risk and malnutrition. There were significant differences between the groups regarding all subdomain scores of the WHOQOL-OLD (p<0.001). The rates of
Table 2. Questionnaires, anthropometric measurements and laboratory values of the study groups
Overall (n=532)
Groups p valuesSatisfactory nutritional
status (n=390)Nutritional risk
(n=83)Malnutrition
(n=59)QuestionnairesWHOQOL-OLD total scoreβ 50.0 [22.0-94.0] 56.0 [29.0-94.0]a 36.0 [27.0-68.0]b 27.0 [22.0-41.0]c <0.001
Sensory abilitiesβ 9.0 [4.0-17.0] 10.0 [5.0-17.0]a 7.0 [4.0-13.0]b 5.0 [4.0-8.0]c <0.001Autonomyβ 9.0 [3.0-17.0] 10.0 [3.0-17.0]a 6.0 [4.0-12.0]b 5.0 [3.0-6.0]c <0.001Past, present, and future activitiesβ 8.0 [3.0-17.0] 9.0 [5.0-17.0]a 6.0 [4.0-12.0]b 5.0 [3.0-8.0]c <0.001Social participationβ 8.0 [3.0-17.0] 9.0 [4.0-17.0]a 6.0 [4.0-13.0]b 4.0 [3.0-7.0]c <0.001Death and dyingβ 8.0 [3.0-16.0] 9.0 [4.0-16.0]a 5.0 [3.0-11.0]b 4.0 [3.0-7.0]c <0.001Intimacyβ 8.0 [3.0-16.0] 9.0 [4.0-16.0]a 6.0 [4.0-13.0]b 4.0 [3.0-6.0]c <0.001
Geriatric depression scaleβ 8.5 [0.0-21.0] 8.0 [0.0-20.0]a 9.0 [5.0-21.0]b 17.0 [6.0-20.0]c <0.001Depression‡ 142 (26.7) 50 (12.8)a 36 (43.4)b 56 (94.9)c <0.001Mini Mental State Examinationβ 26.0 [5.0-29.0] 26.0 [6.0-29.0]a 25.0 [7.0-29.0]b 9.0 [5.0-27.0]c <0.001Dementia‡ 102 (19.2) 24 (6.2)a 27 (32.5)b 51 (86.4)c <0.001Hendrich II fall risk modelβ 3.0 [2.0- 9.0] 3.0 [2.0- 4.0]a 8.0 [3.0- 11.0]b 10.0 [8.5- 11.0]c <0.001Fall risk‡ 203 (38.2) 97 (24.9)a 50 (60.2)b 56 (94.9)c <0.001Anthropometric measurementsBody mass index (kg/m2)† 23.2±3.5 25.1±1.5a 19.7±1.6b 16.1±1.0c <0.001Body mass index (kg/m2)‡
<18.5 67 (12.6) 0 (0.0)a 67 (47.2)b 0 (0.0)c <0.00118.5–24.9 247 (46.4) 174 (44.6)a 73 (51.4)b 174 (44.6)c
≥ 25 218 (41.0) 216 (55.4)a 2 (1.4)b 216 (55.4)b
Triceps skin fold thickness (mm)β 16.0 [7.0-26.0] 17.0 [9.0-26.0]a 13.0 [9.0-18.0]b 9.0 [7.0-16.4]c <0.001Calf circumference (cm)† 35.47±5.54 38.13±3.12a 30.66±2.81b 24.66±2.23c <0.001Forearm circumference (cm)† 25.89±5.58 28.33±3.68a 22.01±2.98b 15.19±1.9c <0.001Laboratory analysesβ
Hemoglobin (g/dL) 13.1 [8.4-18.1] 13.8 [10.9-18.1]a 11.1 [8.4-17.2]b 10.2 [8.4-13.1]c <0.001Fasting blood glucose (mg/dL) 86.0 [48.0-268.0] 87.0 [71.0-268.0]a 82.0 [58.0-185.0]b 71.0 [48.0-245.0]c <0.001Creatinine (mg/dL) 0.8 [0.3-3.1] 0.8 [0.6-2.8]a,b 0.9 [0.4-2.9]a 0.7 [0.3-3.1]b 0.007Albumin (mg/dL) 4.6 [3.1-5.4] 4.7 [3.5-5.4]a 3.7 [3.4-4.6]b 3.2 [3.1-3.6]c <0.001Total cholesterol (mg/dL) 185.0 [41.0-321.0] 196.0 [88.0-321.0]a 106.0 [78.0-263.0]b 85.0 [41.0-198.0]c <0.001LDL (mg/dL) 142.0 [32.0-247.0] 149.0 [89.0-247.0]a 99.0 [56.0-174.0]b 79.0 [32.0-146.0]c <0.001Triglyceride (mg/dL) 163.0 [41.0-326.0] 174.0 [59.0-326.0]a 101.0 [67.0-236.0]b 86.0 [41.0-168.0]c <0.001Ferritin 22.0 [1.8-124.0] 28.1 [6.8-124.0]a 8.4 [1.8-56.1]b 5.6 [1.9-17.0]c <0.001Folic asit 6.5 [1.6-10.1] 6.9 [3.9-10.1]a 3.7 [1.9-7.6]b 2.4 [1.6-6.1]c <0.001Vitamin D 15.6 [2.1-41.1] 17.0 [5.8-41.1]a 6.2 [2.8-21.3]b 3.7 [2.1-16.4]c <0.001Vitamin B12 248.5 [85.0-413.0] 258.0 [169.0-413.0]a 174.0 [94.0-325.0]b 136.0 [85.0-186.0]c <0.001HbA1C (%) 5.7 [4.1-13.2] 5.7 [4.9-11.3]a 5.2 [4.4-10.9]b 4.6 [4.1-13.2]c <0.001Glomerular filtration rate (ml/min) 69.0 [16.0-89.0] 74.0 [18.0-89.0]a 51.0 [18.0-78.0]b 45.0 [16.0-88.0]b <0.001
†mean±standard deviation,‡n (%),βmedian (IQR), Each subscript letter denotes a subset of group categories whose column proportions do not differ significantly from each other at the 0.05 level.

923
Yıldırım et al. Upper gastrointestinal system endoscopy results & Helicobacter pyloriJ Health Sci Med 2021; 4(6): 919-926
significantly associated with nutritional risk according to the univariate analysis (Table 4). Multivariate logistic regression analysis showed that total WHOQOL-OLD score (OR=1.40, CI 95%:1.30-1.52, p<0.001) and CCI score (OR=1.73, CI 95%:1.34-2.23, p<0.001) were the significant independent risk factors for the development of nutritional risk and malnutrition.
DISCUSSIONSIn the present study, we showed significant associations between malnutrition risk and quality of life. Besides, meaningful relationships between the MNA score and depression, cognitive impairment, and a higher fall risk were also detected in older adults. As one of the first studies focusing on evaluating the association between quality of life and nutritional risk in Turkish elderly patients, the overall prevalence of nutritional risk and malnutrition was relatively high. Nutritional status and quality of life in elderly patients were regarded as the indicators for each other.
Depending on the study groups' characteristics and the country of the study, reported prevalence of nutritional risk and malnutrition shows significant variation. The combined rates of nutritional risk and malnutrition (based on the MNA scores) range from 14.3% to 82.6% (1,4,5,7,19–22). Several factors have been speculated to explain these variations. Living in institutions with menus for three meals that may lack essential nutrients was regarded as an underlying factor (22). Extended family support was suggested as another factor; for example, living in crowded families prevents loneliness and social isolation (4). In our study, the combined malnutrition risk was the highest among the patients living in residential care centers and the lowest in
depression, dementia, and fall risk were significantly higher in patients with nutritional risk and malnutrition (Table 2). We also detected significant differences between the groups in terms of the anthropometric measurements, including BMI, BMI category, triceps skinfold thickness, the calf and forearm circumferences, and laboratory parameters (Table 2).
There were significant correlations between the MNA score and total WHOQOL-OLD and subdomain scores (Table 3). Increased MNA scores (indicating a satisfactory nutritional status) were associated with increased scores in WHOQOL-OLD and its subdomain (indicating a higher quality of life). Besides, a positive correlation was found between the MNA and MMSE scores (r=0.545, p<0.001) while there were negative correlations between the MNA score and the GDS and HIIFRM scores (r=-0.462, r<0.001 and r=-0.380, p<0.001, respectively).
Univariate and multivariate logistic regression analyses of the variables for nutritional risk and malnutrition were given in Table 4. Most of the independent variables were
Table 3. Correlation of Mini Nutritional Risk Assessment with patient reported outcomes and WHOQOL-OLD score
Mini nutritional assessmentr p
Geriatric Depression Scale -0.462 <0.001Mini Mental State Examination 0.545 <0.001Hendrich II fall risk model -0.380 <0.001WHOQOL-OLD total score 0.693 <0.001Sensory abilities 0.673 <0.001Autonomy 0.683 <0.001Past, present, and future activities 0.654 <0.001Social participation 0.666 <0.001Death and dying 0.677 <0.001Intimacy 0.641 <0.001
Table 4. Univariate and multivariate logistic regression analyses of the variables for the development of nutritional risk and malnutritionUnivariate Multivariate
Crude OR [95%CI]
crude p value
Adjusted OR [95%CI]
crude p value
Age 1.02 [0.98-1.05] 0.397 - -Sex: Female vs. male 1.06 [0.72-1.56] 0.764 - -Educational status: Ref. literate (primary+secondary-college+university) vs. illiterate 3.03 [1.98-4.64] <0.001 0.68 [0.32-1.43] 0.308Living status: Ref. relativesAlone 2.99 [1.90-4.73] <0.001 0.58 [0.14-2.37] 0.447Residential care center 0.15 [0.07-0.31] <0.001 1.14 [0.38-3.42] 0.813Marital status: Ref. married with single+divorced/widowed 6.37 [4.18-9.72] <0.001 2.13 [0.53-8.49] 0.285Smoking: Present vs. absent 1.35 [0.91-1.99] 0.134 - -Comorbidity: Present vs. absent 0.06 [0.01-0.24] <0.001 2.15 [0.13-35.43] 0.592Hypertension: Present vs. absent 0.31 [0.19-0.50] <0.001 1.44 [0.62-3.37] 0.400Charlson comorbidity score 0.56 [0.50-0.62] <0.001 1.73 [1.34-2.23] <0.001WHOQOL-OLD total score 1.24 [1.19-1.29] <0.001 1.40 [1.30-1.52] <0.001Depression: Present vs. absent 0.08 [0.05-0.13] <0.001 1.17 [0.40-3.42] 0.770Dementia: Present vs. absent 0.05 [0.03-0.09] <0.001 0.53 [0.15-1.86] 0.322Fall risk: Present vs. absent 0.11 [0.07-0.17] <0.001 1.88 [0.76-4.61] 0.171OR: odds ratio, CI: confidence interval

924
Yıldırım et al. Quality of life and malnutrition J Health Sci Med 2021; 4(6): 919-926
patients living with relatives. Evaluation of these factors in a homogenous manner may not help reach a definitive conclusion; therefore, the complexity of the problem may necessitate prospective large-scale studies.
The general health status of elderly patients is a critical variable that predicts the nutrition risk. Coexisting diseases and their related indexes such as the CCI and the use of multiple medications (polypharmacy) might be used as the indicators for this purpose (3, 7). Polypharmacy may have a negative impact on nutritional status due to drug-food interactions or gastrointestinal complaints (3,7). Our results were consistent with these studies. The presence of multiple comorbidities has been speculated as a significant risk factor for malnourishment in elderly patients (23). Although the relationship between comorbidities and malnutrition remains obscure, it has been thought that these comorbidities may have a negative impact on the nutritional status of the patients. In association with polypharmacy, comorbidities, as reflected by the CCI in the present study, may be regarded as indicators for developing malnutrition. Therefore, those who provide care for elderly patients are recommended to pay attention to the presence or absence of such factors because of their close association with malnutrition.
The educational, marital, and living status are thought to impact the nutritional quality of older adults significantly (1,7). Living alone or widowed older men are more vulnerable to nutritional risk because of difficulty buying and preparing food (1). In this study, we found that elderly illiterate, divorced, or widowed people living alone or in residential care centers were the riskiest group for malnutrition (4). The lower level of education was significantly associated with malnutrition (23). Sex discrepancy in nutrition is regarded as a complex and poorly understood issue (3). Some researchers reported that female sex is an independent risk factor for developing poor nutritional status, but we did not find any association between sex and nutrition (3,5,6). These controversial results might be affected by multiple unidentified confounders among the patients' demographic and clinical characteristics (4). Therefore, reciprocal associations of several demographic and clinical features should be considered while evaluating these findings.
The association between the presence or severity of depression and nutritional status was also investigated. There was a significant negative correlation between the GDS and MNA scores in the present study. In the BRIGHT trial, patients with more depressive symptoms were at moderate or high risk of malnutrition (3). In previous studies, nutritional disorders and malnutrition are regarded as modifiable risk factors for preventing
and progression of age-related cognitive impairment (24-26). It was also mentioned that there was a relationship between malnutrition and the severity of cognitive impairment and that good nutritional status is associated with normal cognition. In this study, we showed a significant positive correlation between the MMSE and MNA scores. Poor nutritional status has been speculated as a significant factor for falls, especially in elderly patients, based on community-based studies (27). As opposed to our findings, Adly et al. (27) demonstrated a significant association between malnutrition and fall risk assessment scores using various scales. In light of this evidence, we may conclude that poor nutritional status in the elderly may reflect many underlying problems, such as impaired motor function, psychological abnormalities, and cognitive and functional impairment. So, efforts should be made to improve nutritional status considering these outcomes, especially in the elderly.
The strongest associations between nutritional risk and the physical health and sensory abilities subdomains of the WHOQOL-OLD scale has been reported in previous studies (1,3,5). Physical health status may be regarded as a critical factor for routine daily activities such as eating and walking; however, close associations between the other domains are also possible (1). Sensory abilities such as sight, touch, smell, and taste may also impact both malnutrition and the quality of life. Our study showed that the total WHOQOL-OLD score and all subdomain scores were significantly correlated with the risk of malnutrition, as opposed to findings in other studies (3). Some studies have also reported similar findings (1). Using several scales for quality of life, other studies have shown that mental and physical components had a critical impact on nutritional status (7,19). Therefore, we may conclude that older adults' nutritional status may be directly related to all aspects of the quality of life, and the elderly individuals with nutritional risk are more likely to score lower on all or some domains of quality of life scales.
Considering the study's limitations, there may be controversial cause-and-effect relationships between the primary outcomes of the risk of malnutrition and the quality of life. Besides, the inclusion of only the patients admitted to the outpatient clinics was regarded as another limitation. Causality of the associated variables were lacked due to the cross-sectional design of the study. It is better to assess the likelihood of adverse causality and temporal relationships between quality of life, malnutrition risk, and other relevant variables. On the other hand, the present study had several important strengths, including the use of MMSE, GDS, and HIIFRM.
925
Yıldırım et al. Upper gastrointestinal system endoscopy results & Helicobacter pyloriJ Health Sci Med 2021; 4(6): 919-926
CONCLUSIONThe prevalence of nutritional risk and malnutrition was high among elderly patients. The study also showed how various demographic and clinical factors were associated with malnutrition or nutritional risk. Nutritional risk and malnutrition were associated with the total WHOQOL-OLD score and the CCI score. Besides, there were significant correlations between all subdomains of the WHOQOL-OLD questionnaire and malnutrition. Having poor quality of life and higher comorbidities were the main determinants of malnutrition and nutritional risk in the multivariate analysis. The present findings contribute to the understanding of nutritional risk and its potential determinants. Results also underline the association between quality of life and nutritional status. These findings may help prevent nutritional risk and determine appropriate interventions, especially for the elderly population.
Clinical ImplicationsThe combined prevalence of nutritional risk and malnutrition was 26.7% in the elderly patients.
There were significant correlations between all subdomains of the WHOQOL-OLD questionnaire and malnutrition and nutritional risk assessed with MNA.
Rates of depression, dementia, and fall risk were significantly higher in patients with nutritional risk and malnutrition.
Nutritional risk and malnutrition were significantly associated with the WHOQOL-OLD and CCI scores. Having poor quality of life and higher comorbidities were the main determinants of malnutrition and nutritional risk in the multivariate analysis.
ETHICAL DECLARATIONSEthics Committee Approval: The study was carried out with the permission of Erzurum Regional Training and Researh Hospital Clinical Researchs Ethics Committee (Date: 06.01.2020, Decision No: 2020/01-06).Informed Consent: All patients signed the free and informed consent form.Referee Evaluation Process: Externally peer-reviewed. Conflict of Interest Statement: The authors have no conflicts of interest to declare. Financial Disclosure: The authors declared that this study has received no financial support. Author Contributions: All of the authors declare that they have all participated in the design, execution, and analysis of the paper, and that they have approved the final version.
REFERENCES1. Damião R, Meneguci J, da Silva Santos, Matijasevich A, Rossi
Menezes P. Nutritional Risk and Quality of Life in Community-Dwelling Elderly. A Cross-Sectional Study. J Nutr Heal Aging 2018; 22: 111–6.
2. Katsas K, Mamalaki E, Kontogianni MD, et al.Malnutrition in older adults: Correlations with social, diet-related, and neuropsychological factors, Nutrition 2020; 71: 110640.
3. Wham CA, McLean C, Teh R, Moyes S, Peri K, Kerse N. The BRIGHT Trial: What are the factors associated with nutrition risk?, J Nutr Heal Aging 2014; 18: 692–7.
4. Damayanthi HDWT, Moy FM, Abdullah KL, Dharmaratne SD. Prevalence of malnutrition and associated factors among community-dwelling older persons in Sri Lanka. A cross-sectional study. BMC Geriatr 2018; 18: 199.
5. Maseda A, Diego-Diez C, Lorenzo-López L, López-López R, Regueiro-Folgueira L, Millán-Calenti JC. Quality of life, functional impairment and social factors as determinants of nutritional status in older adults. The VERISAÚDE study. Clin Nutr 2018; 37: 993–9.
6. Estrada A, Cardona D, Segura AM, Chavarriaga LM, Ordóñez J, Osorio JJ. Calidad de vida de los adultos mayores de medellín. Biomedica 2011; 31,492–502.
7. Khatami F, Shafiee G, Kamali K, et al.Correlation between malnutrition and health-related quality of life (HRQOL) in elderly Iranian adults. J Int Med Res 2020; 48(1): 030006051986349.
8. Hiramatsu M, Momoki C, Oide Y, et al. Association between risk factors and intensive nutritional intervention outcomes in elderly individuals. J Clin Med Res 2019; 11: 472–9.
9. Akın S, Ozer FF, Ertürk Zararsız G, et al. Validity of simplified nutritional appetite questionnaire for Turkish community-dwelling elderly and determining cut-off according to mini nutritional assessment. Arch Gerontol Geriatr 2019; 83: 31–6.
10. Dafsari FS, Bewernick B, Biewer M, et al. Cognitive behavioural therapy for the treatment of late life depression: Study protocol of a multicentre, randomized, observer-blinded, controlled trial (CBTlate). BMC Psychiatry 2019; 19: 423.
11. Ertan T, Eker E. Reliability, validity, and factor structure of the geriatric depression scale in Turkish elderly: Are there different factor structures for different cultures? Int Psychogeriatrics 2000; 12: 163–72.
12. Güngen C, Ertan T, Eker E, Yaşar R, Engin F. Standardize mini mental test’in Türk toplumunda hafif demans tanısında geçerlik ve güvenilirliği. Türk Psikiyatr Derg, 2002; 13: 273–81.
13. Mollinedo Cardalda I, López A, Cancela Carral JM. The effects of different types of physical exercise on physical and cognitive function in frail institutionalized older adults with mild to moderate cognitive impairment. A randomized controlled trial. Arch Gerontol Geriatr 2019; 83: 223–30.
14. Aycicek GS, Çalıskan H, Ozsurekci C, et al. A reliable tool for assessing MCI and dementia: validation study of DemTect for Turkish population. Am J Alzheimer’s Dis Other Dementiasr 2020; 35: 153331752094980.
15. Cho EH, Woo YJ, Han A, Chung YC, Kim YH, Park H. Comparison of the predictive validity of three fall risk assessment tools and analysis of fall‐risk factors at a tertiary teaching hospital. J Clin Nurs 2020; 29: 3482–93.
16. Kawakami R, Murakami H, Sanada K, et al.Calf circumference as a surrogate marker of muscle mass for diagnosing sarcopenia in Japanese men and women. Geriatr Gerontol Int 2015; 15: 969–76.
17. Kretzer DC, Matos S, Von Diemen L, et al. Anthropometrical measurements and maternal visceral fat during first half of pregnancy: A cross-sectional survey. BMC Pregnancy Childbirth 2020; 20: 576.
18. Onyekwelu J, Nwankwo C. Significance of the difference in the estimates of glomerular filtration rate obtained using different models. Niger J Clin Pract 2019; 22: 258–64.

926
Yıldırım et al. Quality of life and malnutrition J Health Sci Med 2021; 4(6): 919-926
19. Adıgüzel E, Acar-Tek N. Nutrition-related parameters predict the health-related quality of life in home care patients. Exp Gerontol 2019; 120: 15–20.
20. Krishnamoorthy Y, Vijayageetha M, Kumar Sg, Rajaa S, Rehman T. Prevalence of malnutrition and its associated factors among elderly population in rural Puducherry using mini-nutritional assessment questionnaire. J Fam Med Prim Care 2018; 7: 1429.
21. El Osta N, El Arab H, Saad R, et al. Assessment of nutritional status of older patients attending a tertiary hospital in Middle Eastern country. Clin Nutr ESPEN 2019; 33: 105–10.
22. Salminen KS, Suominen MH, Soini H, et al.Associations between nutritional status and health-related quality of life among long-term care residents in Helsinki. J Nutr Heal Aging 2019; 23: 474–8.
23. Marinho R, Pessoa A, Lopes M, et al. High prevalence of malnutrition in Internal Medicine wards – a multicentre ANUMEDI study. Eur J Intern Med 2020; 76: 82–8.
24. Espinosa del Pozo PH, Espinosa PS, Donadi EA, et al.Cognitive Decline in Adults Aged 65 and Older in Cumbayá, Quito, Ecuador: Prevalence and Risk Factors. Cureus 2018; 10: e326910.
25. Tana C, Lauretani F, Ticinesi A, et al. Impact of nutritional status on caregiver burden of elderly outpatients. a cross-sectional Study. Nutrients 2019; 11: 281.
26. Tsutsumiuchi K, Wakabayashi H, Maeda K, Shamoto H. Impact of malnutrition on post-stroke cognitive impairment in convalescent rehabilitation ward inpatients. Eur Geriatr Med 2020; https: // doi.org/10.1007/s41999-020-00393-0
27. Adly NN, Abd-El-Gawad WM, Abou-Hashem RM. Relationship between malnutrition and different fall risk assessment tools in a geriatric in-patient unit. Aging Clin Exp Res 2020; 32: 1279–80.

HEALTH SCIENCESMEDICINE
Original Article
J Health Sci Med 2021; 4(6): 927-930
This work is licensed under a Creative Commons Attribution 4.0 International License.
DOI: 10.32322/jhsm.983541
Received: 16.08.2021 Accepted: 15.09.2021Corresponding Author: Berke Aras, [email protected]
A reliable source of information on botulinum toxin injection used in the treatment of spasticity: YouTube
Berke Aras1, Ömer Kuzu21Ankara City Hospital, Department of Physical Medicine and Rehabilitation, Ankara, Turkey2Kastamonu Rehabilitation Centre, Department of Physical Medicine and Rehabilitation, Kastamonu, Turkey
Cite this article as: Aras B, Kuzu Ö. A reliable source of information on botulinum toxin injection used in the treatment of spasticity: YouTube. J Health Sci Med 2021; 4(6): 927-930.
ABSTRACTAim: The aim of the study is to assess the quality and reliability of YouTube videos on botulinum toxin injection for the treatment of spasticity.Material and Method: In this cross-sectional study, a search of YouTube videos was made on 15 September 2020, using the keywords "botulinum toxin and spasticity", "botulinum toxin treatment for spasticity", “spasticity management with botulinum toxin" "treating spasticity with botox". Two experienced reviewers on botulinum toxin injection on spasticity reviewed the first 200 videos. The quality of the videos was evaluated according to the Global Quality Scale (GQS) and three groups were formed: high quality, intermediate quality and low quality. The DISCERN tool was used to evaluate the reliability of the videos.Results: Of the 77 videos analyzed according to GQS, 36 (46.8%) were high quality, 31 (40.2%) were intermediate quality and 10 (13.0%) were low quality. Most of the videos (44.15%, n=34) uploaded by health professionals (physiatrist, orthopedist etc.) and the majority of the health professional groups had produced high quality videos (67.64%). When the parameters of the videos were compared according to quality levels, no significant differences were found in the number of view, comment, likes, dislikes, video length, days since upload (p>0.05). Significant differences were only found between the groups in respect of the DISCERN scores (p<0.001). Conclusion: YouTube can be considered as a reliable source for botulinum toxin injection in spasticity. The importance of the video source should be explained to the patient and healthcare professional using YouTube. Keywords: YouTube, botulinum toxin, spasticity
Ana Metin-Alt bilgi Arası 5mm
Cite-Öz arası 5mm
Başlık-Yazarlar arası 12mmv
Yazar-Kurum arası 2,5 mmvcv
Kurum-Cite arası 5mm
Öz-Abstract arası 7,5mmvc
INTRODUCTIONSpasticity is a motor disorder characterized by the velocity-dependent increase in tonic stretching reflexes and increased tendon responses due to the hyperexcitability of stretching reflexes (1). It is one of the complications that occur as a result of upper motor neuron lesion. Although the pathophysiology of spasticity is complex, it occurs as a result of the hyperexcitability of spinal motor neurons in the damage of the inhibitory system, which starts from the cortex and extends to the spinal cord and ensures the control of spinal reflexes and maintains the normal tone in the muscles (2). Although the beneficial effects of spasticity such as standing upright positioning and protecting bone mass are known, it has negative effects on functional recovery in many cases. It should be treated if it restricts functional movements, affects daily life activities and hygiene care, and causes contractures (3).
Posture and positioning, stretching and strengthening exercises and orthosis are used in the non-pharmacological treatment of spasticity. In addition, superficial and deep heaters, cryotherapy and some electrotherapy agents are other non-pharmacological treatment options. Pharmacologically, oral anti-spastic agents, intrathecal applications and motor point and nerve blocks are used in the treatment (4). Botulinum toxin is a potent neurotoxin produced by clostridium botulinum. It binds to presynaptic cholinergic nerve endings at the neuromuscular junction and blocks muscle contraction by preventing acetylcholine release into the intersynaptic area. Many studies have shown that botulinum toxin administration is effective and safe in spasticity treatment (5).
YouTube is an internet platform that is frequently used to obtain health-related information. Although there is information on the diagnosis and treatment of many
928
Aras et al. YouTube on botulinum toxin injection J Health Sci Med 2021; 4(6): 927-930
diseases on this platform, the accuracy of the videos or the educational quality of the videos are questioned, as anyone can easily upload a video and there is no quality control mechanism. Therefore, there are studies in the literature questioning the reliability of YouTube videos in different disease groups (6-9).
The objective of this study is to evaluate the quality and reliability of YouTube videos on botulinum toxin injection for the treatment of spasticity to determine if it is a reliable resource for the people.
MATERIAL AND METOD
Ethics Statement
Ethics Committee approval was not required for this study because videos are publicly available on YouTube and there were no human or animal participants in the study. Similarly, Ethics Committee approval was not obtained in other studies that evaluated YouTube videos (13-15). All procedures were carried out in accordance with the ethical rules and the principles of the Declaration of Helsinki.
Study DesignA search was made of videos on YouTube (www.youtube.com) on 15 September 2020, using the keywords "botulinum toxin and spasticity", "botulinum toxin treatment for spasticity", “spasticity management with botulinum toxin" "treating spasticity with botox". It has been shown that many YouTube users watched the first 60-200 videos after searching (10). In present study, two experienced reviewers on botulinum toxin injection on spasticity reviewed the first 200 videos. The reviewers who evaluated the quality of the videos did not have any information about the video's number of likes, dislikes, views and comments in order not to affect the assessment. In cases where there was disagreement between reviewers in terms of evaluation and scoring, a consensus was achieved by conducting detailed literature research and discussion. Non-English videos, duplicate videos, videos about botulinum toxin injection in different diseases (bruxism, wrinkles, headache etc.) and off-topic videos were excluded in the study. After the exclusion, a total of 77 videos were analyzed.
Video AssessmentThe source of the video, number of likes and dislikes, number of comments, number of views, video length and upload day to YouTube of all videos were recorded. Sources of the video were divided into five categories: 1.health professionals, 2 independent users, 3. independent users with health, 4.PhD/anatomist/physiotherapist, 5.TV/magazine media. The target audiences of the videos were divided into four categories: 1.patients, 2.health professionals, 3.both patients and health professionals, 4.everybody. Videos
containing general information about the indications and complications of botulinum toxin injection were included in the first group, videos with detailed information such as the location, dosage, anatomy of the injection and which patients should be applied were included in the second group, and videos that provided both general and detailed information were included in the third group. Videos containing superficial information not teaching botulinum toxin application were included in the fourth group.
The quality of all videos was evaluated with the Global Quality Scale (GQS). The GQS is a 5-point Likert scale developed for internet research, with scores ranging from 1 to 5.A score of 1 or 2 indicates a low-quality video, 3 points indicate intermediate quality, and a score of 4 or 5, high quality (11). To evaluate the reliability of the videos DISCERN tool that consisting of 5 yes-no questions and each question is one point (maximum 5 points), was used (12). This GQS and DISCERN tool is used in studies where many YouTube videos are examined in educational terms.
Statistical Analysis Data obtained in the study were analyzed statistically using SPSS for Windows 22.0 software. Inter-observer agreement was calculated as the kappa score. The conformity of numerical variables to normal distribution was assessed with the Shapiro Wilk test. In the comparisons of 3 or more groups of variables not showing normal distribution, the Kruskal-Wallis and Dunn tests were applied. A value of p<0.05 was considered statistically significant.
RESULTSOf the 200 videos examined by the researchers, 91 duplicated videos, 28 off-topic videos, and 4 non-English languages videos were excluded from the study. Thus analysis was made of 77 videos. The mean GQS score of the videos was 3.65 ± 1.04, the mean DISCERN score was 3.50 ± 1.20. Video length, days since upload, likes, dislikes, number of views, number of comments data are shown in Table 1. In terms of target audience, more than half of the videos (53.2%, n = 41) were in the patient group, 14 (18.2%) were in the health professionals group, 10 (13.0%) were both patients and health professional group, and 12 (15.6%) were in the study population group.
When the 77 videos were analyzed according to GQS, 36 (46.8%) were high quality, 31 (40.2%) were intermediate quality and 10 (13.0%) were low quality. Most of the videos (44.15%, n=34) were uploaded by health professionals (physiatrist, orthopedist etc.), whereas 9.09% (n=7) were uploaded by independent users, 19.48% (n=15) were uploaded by independent users with an accompanying health professional, 12.98% (n=10) were uploaded by PhD/anatomist/physiotherapist and

929
Aras et al. YouTube on botulinum toxin injectionJ Health Sci Med 2021; 4(6): 927-930
14.28% (n=11) were uploaded by TV/magazine media. While the majority of the health professional groups had produced high quality videos (67.64%), the rate of high quality videos in the other groups was between 28.6% and 36.4% (Table 2). There was no statistically significant difference between the groups in terms of likes, dislikes, number of views, video length, days since upload, number of comments, comments per day, or views per day.
When the parameters of the videos were compared according to the quality levels, no significant differences were found in the likes, dislikes, number of views, video length, days since upload, number of comments, comments per day, or views per day (p>0.05). Significant differences were only found between the groups in respect of the DISCERN scores and (p<0.001). The kappa score, which shows the interreviewer agreement, was determined as 0.85.
DISCUSSIONBotulinum toxin injection is a method commonly used in the treatment of spasticity in upper motor neuron injury diseases such as stroke, spinal cord injury, traumatic brain injury, and multiple sclerosis. Although YouTube has been used for many different purposes since its creation, in recent years it has been used by both healthcare professionals and patients for medical information. The aim of the study was to evaluate the quality and reliability of botulinum toxin injection videos on spasticity on YouTube. It was observed that some of the videos evaluated were addressed to healthcare professionals, some to the patient population, and some to both groups.
When the video quality was examined, it was seen that 87% of the videos were high and intermediate quality. When evaluated as a video source, it was observed that health professionals had a higher reliability.
The videos investigated in present study had over 1 million views, with an average 13238 views per video, demonstrating that botulinum toxin videos are widely available on YouTube. Moreover, the videos garnered total 439 comments and 4381 likes from users, reflecting both the active input and support form YouTube users. That's why the videos on such a frequently used platform should have the correct information and quality. The high rate of high quality video shows that people have reached the right information on this subject. There are conflicting results in studies evaluating the quality of YouTube videos in the literature. While some studies have concluded that the quality of the videos on the related subject is high (16,17), others have concluded that the video quality is low (18). In the present study, 36 (46.9%) were high quality, 31 (40.2%) were intermediate quality and 10 (13.0%) were low quality according to the GQS.
Botulinum toxin injections are also used for aesthetic and non-aesthetic (cervical dystonia, headache, sialorrhea, temporomandibular joint disorders, bruxism) purposes other than spasticity (19). However, there are only two studies evaluating the quality of YouTube videos in the literature on this subject. First, Wong et al examined botulinum toxin injection videos used for wrinkles and stated that these videos had high-quality content and YouTube was a useful resource for patients (20). In the other study, Gaş et al. (21) evaluated botulinum toxin injection videos for bruxism and concluded that YouTube is a reliable source in this field. Similarly, in this study, it was concluded that YouTube videos on spasticity are a reliable source for both patients and healthcare professionals.
When examined as a video source in present study; although the video quality was better in the health professionals group, it was observed that there was no difference between the groups in terms of views, likes, dislikes, number of comments. This means that YouTube users are interested in videos regardless of source. Similarly, previous studies assessing the quality of videos on YouTube have demonstrated that the videos produced
Table 1. General features of the videosn Mean Std. Deviation Minimum Maximum
Video duration (second) 77 386.45 497.04 38.00 4213.00Days since upload_(date) 77 1731.61 1080.49 56.00 3812.00Likes 77 56.94 126.89 .00 903.00Dislikes 77 4.26 13.90 .00 116.00Number of comments 63 5.71 11.64 .00 72.00View 77 3238.56 32.004 2.00 229494,00
Table 2. Categorization of the videos according to sources, n (%)Low
qualityIntermediate
qualityHigh
quality Total
Health professionals 3 (8.8) 8 (23.5) 23 (67.64) 34
Independent users 1 (14.3) 4 (57.1) 2 (28.6) 7
Independent users with health 3 (20.0) 8 (53.3) 4 (26.7) 15
PhD/anatomist/physiotherapi st 1 (10,0) 6 (60,0) 3 (30,0) 10
TV/magazine media 2 (18.2) 5 (45.5) 4 (36.4) 11
n number, % percentage

930
Aras et al. YouTube on botulinum toxin injection J Health Sci Med 2021; 4(6): 927-930
by healthcare professionals were of higher quality (6). The fact that nearly half of the videos examined in present study were uploaded by qualified health professional supports that they are both reliable and valuable.
The study has several limitations. First, as in all studies YouTube videos are evaluated, the results of the study depend on the day of the research, due to the dynamic structure of YouTube. Second, the scales used in the study are subjective and therefore results depend on the person evaluating it. Third, we evaluated only English-language videos but botulinum toxin injection is also popular in non-English speaking countries.
CONCLUSIONYouTube contains reliable and educational information about botulinum toxin injection used in the treatment of spasticity. In particular, the qualities of videos uploaded by the health professional are higher than others. Therefore health professionals should be encouraged to make and upload more videos for educational purposes.
ETHICAL DECLARATIONSEthics Committee Approval: Ethics Committee approval was not required for this study because videos are publicly available on YouTube and there were no human or animal participants in the study. Similarly, Ethics Committee approval was not obtained in other studies that evaluated YouTube videos (13-15).Referee Evaluation Process: Externally peer-reviewed.
Conflict of Interest Statement: The authors have no conflicts of interest to declare.
Financial Disclosure: The authors declared that this study has received no financial support.
Author Contributions: All of the authors declare that they have all participated in the design, execution, and analysis of the paper, and that they have approved the final version.
REFERENCES1. Lance JW, Feldman RG, Young RR, Koella WP. Spasticity: disorder
of motor control. Chicago, IL: Year Book Medical; 1980, p. 485-94. 2. Sheean G. Neurophysiology of spasticity. In Barnes MP, Johnson
GR (Eds): Upper Motor Neurone Syndrome and Spasticity. Cambridge, Cambridge University Press, 2008, p. 9-68.
3. Zorowitz RD, Gillard PJ, Brainin M. Poststroke spasticity: sequelae and burden on stroke survivors and caregivers. Neurology 2013; 80: S45-52.
4. Leo A, Naro A, Molonia F, et al. Spasticity Management: The Current State of Transcranial Neuromodulation. PMR 2017; 9: 1020-9.
5. Brin MF, Aoki KR. Botulinum toxin type A: pharmacology. Spasticity, Etiology, Evaluation, Management and the Role of Botulinum Toxin 2002: 110-24.
6. Kocyiğit BF, Nacitarhan V, Koca TT, Berk E. YouTube as a source of patient information for ankylosing spondylitis exercises. Clin Rheumatol 2019; 38: 1747-51.
7. Lee TH, Kim SE, Park KS, et al. Medical Professionals' Review of YouTube Videos Pertaining to Exercises for the Constipation Relief. Korean J Gastroenterol 2018; 72: 295-303.
8. Villafane JH, Tellez RC, Valdes K, Usuelli FG, Berjano P. Educational Quality of YouTube Videos in Thumb Exercises for Carpometacarpal Osteoarthritis: A Search on Current Practice. Hand (NY) 2018; 13: 715-9.
9. Stephen K, Cumming GP. Searching for pelvic floor muscle exercises on YouTube: what individuals may find and where this might fit with health service programmes to promote continence. Menopause Int 2012; 18: 110-5.
10. Hegarty R, Campbell C, Grammatopoulos E. YouTube as an information resource for orthognathic surgery. J Orthod 2017: 44; 90.
11. Bernard A, Langille M, Hughes S, Rose C, Leddin D, Veldhuyzen van Zanten S. A systematic review of patient inflammatory bowel disease information resources on the World Wide Web. Am J Gastroenterol 2007; 102: 2070–7 .
12. Charnock D, Shepperd S, Needham G, Gann R. DISCERN: an instrument for judging the quality of written consumer health information on treatment choices. J Epidemiol Community Health 1999; 53: 105-111.
13. Tolu S, Yurdakul OV, Basaran B, Rezvani A. Englishlanguage videos on YouTube as a source of information on selfadminister subcutaneous antitumour necrosis factor agent injections. Rheumatol Int 2018; 38: 1285–92.
14. Nason GJ, Kelly P, Kelly ME, et al. YouTube as an educational tool regarding male urethral catheterization. Scand J Urol 2015; 49: 189–92.
15. Esen E, Aslan M, Sonbahar BÇ, Kerimoğlu RS. YouTube English videos as a source of information on breast self-examination. Breast Cancer Res Treat 2019; 173: 629–35.
16. Singh AG, Singh S, Singh PP. YouTube for information on rheumatoid arthritis—a wakeup call? J Rheumatol 2012; 39: 899–903.
17. Garg N, Venkatraman A, Pandey A, Kumar N. YouTube as a source of information on dialysis: a content analysis. Nephrology (Carlton) 2015; 20: 315–20.
18. Erdem H, Sisik A. The reliability of bariatric surgery videos in YouTube platform. Obes Surg 2018; 28: 712–6.
19. Persaud R, Garas G, Silva S. An evidence-based review of botulinum toxin applications in non-cosmetic head and neck conditions. JRSM Short Rep 2013: 4; 10.
20. Wong K, Doong J, Trang T, Joo S, Chien AL. YouTube videos on botulinum toxin A for wrinkles: A useful Resource for patient education. Dermatol Surg 2017: 43; 1466.
21. Gaş S, Zincir ÖÖ, Bozkurt AP. Are YouTubevideos useful fır patients interested in botulinum toxin for bruxism. J Oral Maxillofac Surg 2019: 77: 1776-83.
HEALTH SCIENCESMEDICINE
Original Article
J Health Sci Med 2021; 4(6): 931-935
This work is licensed under a Creative Commons Attribution 4.0 International License.
DOI: 10.32322/jhsm.974816
Received: 26.07.2021 Accepted: 11.08.2021Corresponding Author: Harun Düğeroğlu, [email protected]
Evaluation of 25-hydroxy vitamin D levels in COVID-19 positive patients
Harun DüğeroğluOrdu University Faculty of Medicine, Training and Research Hospital, Department of Internal Medicine, Ordu, Turkey
Cite this article as: Düğeroğlu H. Evaluation of 25-hydroxy vitamin D levels in COVID-19 positive patients. J Health Sci Med 2021; 4(6): 931-935.
ABSTRACTAim: With this study, the aim was to evaluate the serum 25-hydroxy vitamin D levels in COVID-19 positive patients. Material and Method: The study retrospectively screened the archive records for patient data from 732 patients, attending the pandemic clinic in our hospital from March 2020 to February 2021 aged over 18 years with COVID-19 positivity and serum 25-hydroxy vitamin D levels examined, with data from 360 control patients between the same dates in similar age group and without COVID-19 positivity. COVID-19 positive patients and control group patients were divided into three groups according to serum 25-hydroxy vitamin D levels (deficiency, insufficiency, and normal level). Results: Of the 732 COVID-19 positive patients included in the study, 66.4% were female (n=486) and 33.6% were male (n=246). The mean serum 25(OH)D level in the COVID-19 positive patient group was calculated as 14.2± 11.7 ng/ml. For the 360 patients included in the COVID-19 negative control group, 70% were female (n=252) and 30% were male (n=108). Mean serum 25(OH)D level in the COVID-19 negative control group was 27.6±12.1 ng/l. There was a significant difference between the groups (p=0.012). Conclusion: High rates of vitamin D deficiency and insufficiency are seen in COVID-19 positive patients. Sufficient levels of replacement for patients with low vitamin D levels will provide significant reductions in musculoskeletal system symptoms and complaints of patients. We think vitamin D is a protective vitamin for COVID-19.
Keywords: COVID-19, pandemic, 25-hydroxy vitamin D, prognosis
Ana Metin-Alt bilgi Arası 5mm
Cite-Öz arası 5mm
Başlık-Yazarlar arası 12mm
Yazar-Kurum arası 2,5 mmvv
Kurum-Cite arası 5mm
Öz-Abstract arası 7,5mm
INTRODUCTIONThe coronavirus family is a positive strand RNA virus family which is responsible for 5-10% of all acute upper respiratory tract infections in adults (1). Research after reports of viral pneumonia cases in Wuhan city in China in December 2019 identified a new coronavirus vector. Initially called ‘2019-nCoV’ the virus was later called ‘SARS-CoV-2’ due to similarity to the virus causing severe acute respiratory syndrome (SARS). The disease spread rapidly around the world and a pandemic was declared by the World Health Organization in March 2020 (2). ‘Coronavirus disease 2019 (COVID-19)’, causing a broad clinical spectrum from asymptomatic cases to cases with acute severe respiratory distress requiring intensive care, has infected many people since December 2019 to date and caused the death of many people (3).
Patients with SARS-CoV-2 infection generally have mild clinical progression, but may also develop severe complications resulting in mortality (4,5). Among the
risk factors for severe COVID-19 infection are advanced age, obesity, smoking habit, chronic renal failure, and comorbid diseases like chronic lung disease, chronic liver disease, cardiovascular diseases, hypertension, malignancy and diabetes mellitus (6,7). As most of these risk factors are preventable and controllable diseases, they are important to lessen the severity of COVID-19. A study by Dong et al. (8) assessed 731 COVID-19 positive patients with 1412 COVID-19 suspected cases. They identified that more than 90% of cases were asymptomatic, mild or moderately symptomatic cases.
Vitamin D is a steroid with hormone-like functions playing a role in bone growth and mineral metabolism (9). At the same time, vitamin D has a direct effect on calcium and phosphorus metabolism (10). Vitamin D receptors were identified in many tissues and this situation shows that vitamin D deficiency plays a role in many diseases (11).
932
Düğeroğlu H. Vitamin D levels in COVID-19 J Health Sci Med 2021; 4(6): 931-935
Currently, vitamin D deficiency and insufficiency are important problems and are thought to play a role in the etiology of many chronic diseases (12). In many studies, vitamin D insufficiency was shown to be associated with viral and bacterial infections, cardiovascular diseases, multiple sclerosis, psychiatric disorders like depression, diabetes and autoimmune diseases and even breast and colon cancer (13-16). Patients with chronic disease who do not receive sufficient amounts of vitamin D in foods or who have disrupted vitamin D metabolism due to the chronic disease process may have vitamin D deficiency. Additionally, medications used for chronic diseases may disrupt vitamin D metabolism. Some studies showed that vitamin D deficiency in patients with chronic disease may shorten the life expectancy of the patient and increase mortality and cause severe complications (17). They proposed that the reason for this in situations with vitamin D insufficiency is due to the loss of the positive effects of vitamin D in the body of anti-inflammatory, antioxidant and anti-ischemic properties (18). Serum 25-hydroxy vitamin D (25(OH)D) measurements are a test used to show vitamin D levels of individuals. Serum 25(OH)D levels below 20 ng/mL are vitamin D deficiency, 21-30 ng/mL are vitamin D insufficiency and levels above 30 ng/mL are accepted as normal vitamin D levels (19). Low 25(OH)D levels may cause widespread body pain, muscle and skeletal weakness, bone fractures and bone mineralization inadequacy in patients (20,21). There are several studies showing the protective effects of vitamin D against community-acquired pneumonia, interstitial pneumonia and influenza A infections. Again, these studies showed regulatory effects on monocyte activation and IL-6 in the cytokine storm (22,23). Several other studies showed the active form of vitamin D of 1,25(OH)2D3 increased ACE2 expression in the lungs and had positive effects on lung injury (24,25). Cytokine storm is a significant problem in COVID-19 patients. It is possible to lessen the severity of disease by keeping vitamin D at normal levels to reduce the synthesis of proinflammatory cytokines in COVID-19 patients (26). A study by Ilie et al. (27) identified a negative correlation between mean vitamin D levels of patients and COVID-19 case numbers in some European countries. With this study, the aim was to evaluate the serum 25-hydroxy vitamin D levels in COVID-19 positive patients.
MATERIAL AND METHODThis study was approved by Ordu University, Clinical Research and Ethics Committee (Date: 15/04/2021, Decision No: 93). All procedures were carried out in accordance with the ethical rules and the principles of the Declaration of Helsinki.
The study retrospectively screened archive records of 732 patients, aged over 18 years with COVID-19 positivity attending the pandemic clinic in our hospital from March 2020 to February 2021, with 360 patients without COVID-19 positivity comprising normal individuals in a similar age group between the same dates. Patient data (age, gender, serum 25(OH)D levels) were retrospectively obtained from file records. Our study did not include patients receiving vitamin D and immunosuppressive medication treatment, with bone metabolism diseases, with cancer, pregnant or breastfeeding patients, with osteoporosis and osteomalacia diagnosis, with primary hyperparathyroidism, with chronic renal failure, patients who drank alcohol or smoked and with inadequate or missing records. Our hospital studied serum 25(OH)D levels with an Abbott Architecture i2000-SR autoanalyzer. Patients with serum 25(OH)D levels below 20 ng/mL were placed in the vitamin D deficiency group, those with 21-30 ng/mL were in the vitamin D insufficiency group and patients with values above 30 ng/mL were included in the normal vitamin D group. Groups were analyzed for the presence of statistically significant differences. Additionally, data for the COVID-19 positive patient group were compared with data for the COVID-19 negative control group. Vitamin D levels of COVID-19 positive patients were examined in age groups. Serum 25(OH)D levels of patients were statistically assessed according to age group.
Statistical Analysis All data were uploaded to IBM SPSS Statistics 22.0 (SPSS Inc., Chicago, Illinois) program. For assessment of data, number, percentage, mean and standard deviation were used as descriptive statistics. Distribution of data was assessed with the Kolmogorov-Smirnov test. Comparisons of groups used the student T test. Correlation analyses used the Pearson and Spearman tests. P values smaller than 0.05 were accepted as significant.
RESULTSOf the 732 COVID-19 positive patients included in the study, 66.4% were women (n=486) and 33.6% (n=246) were men. Mean age of patients was 45.2±11.9 years (men 47.7±10.4 years, women 46.5±10.1 years). The mean serum 25(OH)S levels in the COVID-19 positive patient group were 14.2±11.7 ng/mL. For the 360 patients included in the COVID-19 negative control group, 70% were women (n=252) and 30% were men (n=108). The mean age of controls was 45.8±10.6 years (men 44.5±11.4 years, women 46.6±12.7 years). The mean serum 25(OH)D levels for the COVID-19 negative control group patients were 27.6±12.1 ng/mL. When statistical comparison was made between gender and serum 25(OH)D levels in the COVID-19 positive patient group and COVID-19

933
Düğeroğlu H. Vitamin D levels in COVID-19J Health Sci Med 2021; 4(6): 931-935
negative control group patients, there was a significant difference between the groups (p=0.012) (Table 1).
Additionally, COVID-19 positive patients were divided into age groups and serum 25(OH)D levels were assessed according to age group (Table 2). The serum 25(OH)D level was identified to be lowest in the 51-65-year age interval.
DISCUSSIONThe correlation between vitamin D levels and viral infections was reported in some studies. A study in India identified that after 6-months follow-up, patients with vitamin D deficiency had more upper respiratory tract infections compared to normal healthy individuals (28). The majority of these upper respiratory tract infections comprised viral infections. Among these, the most frequent vectors are rhinovirus, coronavirus, respiratory syncytial virus (RSV), adenovirus, influenza and parainfluenza. A study by Banajeh et al. (29) identified that vitamin D deficiency in patients with upper respiratory tract infections was associated with reduced neutrophil counts in circulation and hypoxemia. A study by Yao et al. (30) reported H7N9 pneumonia in two patients with advanced degree of vitamin D deficiency. In our study, 50.8% of COVID-19 positive patients had vitamin D deficiency, 29% had vitamin D insufficiency and 20.2% had normal vitamin D levels. Generally, vitamin D levels were identified to be lower in the COVID-19 positive patient group compared to the COVID-19 negative control group. Among the COVID-19 positive patients,
34 required respiratory support. The vitamin D levels of these patients were severely low and below 3 ng/mL. Our small-scale study results show that COVID-19 patients have vitamin D deficiency; however, there is a need for more studies including higher patient numbers.
Though there are several studies assessing the relationship between vitamin D deficiency and infections, studies in recent times researched the protective effect of vitamin D supplementation on infections. For this reason, administering sufficient amounts of vitamin D supplementation to patients with low vitamin D levels is thought to provide a protective effect against infections (31). For this reason, we think that vitamin D replacement at appropriate doses for patients with vitamin D deficiency identified will be protective against several other infections, led by COVID-19 infection. However, a study by Arihiro et al. (32) showed that in spite of the significantly low incidence of upper respiratory tract infections in the patient group with vitamin D deficiency, there was no difference in influenza incidence. Urashima et al. (33) reported that vitamin D support in the winter months may reduce influenza A incidence. Similarly, a study by Camargo et al. (34) showed vitamin D supplementation significantly reduced acute respiratory tract infection risk in patients with vitamin D deficiency. In our study, we began oral vitamin D supplementation at appropriate doses for patients who were COVID-19 positive and with vitamin D deficiency/insufficiency identified.
To date, a variety of studies were performed researching vitamin D levels in healthy children and adults in Turkey. A study by Uçar et al. (35) identified 51.8% vitamin D deficiency and 20.7% vitamin D insufficiency. Erol et al. (36) found 25(OH)D levels were 10.6±6.5 ng/mL and 92.2% of patients had vitamin D levels below 20 ng/mL. In our study, mean serum 25(OH)D levels were 14.2±11.7 ng/mL in COVID-19 positive patients, and 50.8% of patients had vitamin D levels below 20 ng/mL (vitamin D deficient), 29% had vitamin D levels from 21-30 ng/mL (vitamin D insufficient) and 20.2% had normal vitamin D levels (>30 ng/mL). In Turkey, inadequate nutrition, lifestyle variations and environmental factors play roles among reasons for the low vitamin D levels.
A review by Silva and Furlanetto (37) proposed the need to carefully assess reductions in 25(OH)D measured during the acute phase response. If vitamin D acts like a negative acute phase reactant, vitamin D supplementation will not provide any benefit. However, we think there is a need for more studies to strengthen this view. Ebadi and Montano-Loza (38) proposed the need to measure vitamin D levels in COVID-19 patients in their article, and recommended 50,000 IU vitamin D supplementation (total 100,000 IU) twice per week at time of diagnosis for patients with vitamin D below 20 ng/mL.
Table 1. Statistical comparison of gender and serum 25(OH) D levels in COVID-19 positive patient group and COVID-19 negative control group
Serum 25(OH)D levels
COVID-19 positive patient group
(n=732)
COVID-19 negative control group (n=360)
P
value Female (n=486)
Male (n=246)
Female (n=252)
Male (n=108)
n/% n/% n/% n/%Deficiency (<20 ng/ml) 234/48.2 138/56.2 69/27.3 18/16.7
0.012Insufficiency (21-30 ng/ml) 141/29.0 72/29.2 96/38.1 42/38.8
Normal (>30 ng/ml) 111/22.8 36/14.6 87/34.5 48/44.5
n: number of patients, %: percent, 25(OH)D: 25-hydroxy vitamin D
Table 2. Classification of COVID-19 positive patients according to age group and assessment of serum 25(OH) D levels in age groups.
Age interval(year)
Mean serum 25(OH)D level (ng/ml)
Patient number and percentage n (%)
18-35 17.70±13.04 138 (18.9) 36-50 16.78±17.42 213 (29.1) 51-65 12.36±11.01 240 (32.8) >66 13.45±10.21 141 (19.2)
n: number of patients, %: percent, 25(OH)D: 25-hydroxy vitamin D

934
Düğeroğlu H. Vitamin D levels in COVID-19 J Health Sci Med 2021; 4(6): 931-935
CONCLUSIONVitamin D deficiency and insufficiency are observed at high rates in COVID-19 positive patients. For this reason, sufficient levels of replacement for patients with low vitamin D levels will provide clear reductions in musculoskeletal system symptoms and complaints. Additionally, vitamin D was shown to be a significant determinant of mortality due to antiinflammatory, antioxidant and antiischemic properties. For this reason, we think vitamin D is a protective vitamin for COVID-19
ETHICAL DECLARATIONSEthics Committee Approval: This study was approved by Ordu University, Clinical Research and Ethics Committee (Date: 15/04/2021, Decision No: 93).Informed Consent: Because the study was designed retrospectively, no written informed consent form was obtained from patients.Referee Evaluation Process: Externally peer-reviewed. Conflict of Interest Statement: The authors have no conflicts of interest to declare. Financial Disclosure: The authors declared that this study has received no financial support. Author Contributions: All of the authors declare that they have all participated in the design, execution, and analysis of the paper, and that they have approved the final version.
REFERENCES1. Ozcelik F, Tanoglu A, Çıracı MZ, Ozcelik IK. Use of immune
modulator interferon-gamma to support combating COVID-19 pandemic. Int J Coronaviruses 2020; 1: 1-15.
2. World Health Organization (WHO). Coronavirus disease 2019 ( COVID-19): situation report - 61. March 20, 2020. Geneva: World Health Organization Geneva; 2020. Available from: https://www.who.int/docs/default-source/coronaviruse/situation-reports/20200321-sitrep-61-covid-19.pdf?sfvrsn=ce5ca11c_2. Accessed in 2021 (Jun 16).
3. COVID-19 Dashboard by the Center for Systems Science and Engineering (CSSE) at Johns Hopkins University(JHU). Available from: https://coronavirus.jhu.edu/map.html.
4. Jiehao C, Jin X, Daojiong L, et al. A case series of children with 2019 novel coronavirus infection: clinical and epidemiological features. Clin Infect Dis 2020; 71: 1547-51.
5. Liu W, Zhang Q, Chen J, et al. Detection of COVID-19 in Children in Early January 2020 in Wuhan, China. N Engl J Med 2020; 382: 1370-1.
6. Zhou F, Yu T, Du R, et al. Clinical course and risk factors for mortality of adult inpatients with COVID-19 in Wuhan, China: a retrospective cohort study. Lancet 2020; 395: 1054-62.
7. CDC COVID-19 Response Team. Preliminary estimates of the prevalence of selected underlying health conditions among patients with Coronavirus disease 2019-United States, February 12-March 28, 2020. MMWR Morb Mortal Wkly Rep 2020; 69: 382–6
8. Dong Y, Mo X, Hu Y, et al. Epidemiological characteristics of 2143 pediatric patients with 2019 coronavirus disease in China. Pediatrics 2020: e20200702.
9. Bhatty SA, Shaikh NA, Irfan M, Kashif SM, Vaswani AS, Sumbhai A, Gunpat. Vitamin D deficiency in fibromyalgia. J Pak Med Assoc 2010; 60: 949-51.
10. Binkley N, Ramamurthy R, Krueger D. Low vitamin D status: definition, prevalence, consequences, and correction. Endocrinol Metab Clin North Am 2010; 39: 287-contents.
11. Wolfe F, Smythe HA, Yunus MB, et al. The American College of Rheumatology 1990 criteria for the classification of fibromyalgia. Arthritis Rheum 1990; 33: 160-72.
12. Altındağ O, Öğüt E, Gür A, Gürsoy S, Günay M. Serum vitamin D level and its relation with clinical parameters in fibromyalgia as a neuropathic pain. Orthop Muscular Syst 2014; 3: 171.
13. Cannell JJ, Vieth R, Umhau JC, et al. Epidemic influenza and vitamin D. Epidemiol Infect 2006; 134: 1129-40.
14. Schöttker B, Haug U, Schomburg L, et al. Strong associations of 25-hydroxyvitamin D concentrations with all-cause, cardiovascular, cancer, and respiratory disease mortality in a large cohort study. Am J. Clin Nutr 2013; 97: 782-93.
15. Holick MF. Vitamin D: A millenium perspective. J Cell Biochem 2003; 88: 296-307.
16. Holick MF, Chen TC. Vitamin D deficiency: a worldwide problem with health consequences. Am J Clin Nutr 2008; 87: 1080-6.
17. Sağır M, Kaplan M, Tanoğlu A, Demirel F. Relationship between vitamin D levels and mortality rates of critically ill patients in intensive care unit. Anatolian Curr Med J 2021; 3: 171-5.
18. Lee IM, Shiroma EJ, Lobelo F, Puska P, Blair SN, Katzmarzyk PT. Effect of physical inactivity on major non-communicable diseases worldwide: an analysis of burden of disease and life expectancy. Lancet 2012; 380: 219-29.
19. Okyay R, Koçyiğit B, Gürsoy S. Vitamin D levels in women with fibromyalgia and relationship between pain, tender point count and disease activity. Acta Med Mediterr 2016; 32: 243-47.
20. Masuko K. The multifaceted effects of vitamin D and its potential contribution to rheumatoid arthritis. British Journal of Medicine and Medical Research 2014; 4: 1680-90.
21. Cantorna MT, Zhu Y, Froicu M, Wittke A. Vitamin D status, 1, 25-dihydroxyvitamin D3, and the immune system. Am J Clin Nutr 2004; 80: 1717-20.
22. Commission WMH Report of clustering pneumonia of unknown etiology in Wuhan City (2019-2020).
23. Hong M, Xiong T, Huang J, et al. Association of vitamin D supplementation with respiratory tract infection in infants. Matern Child Nutr 2020; 16: e12987.
24. Kuba K, Imai Y, Penninger JM. Angiotensin-converting enzyme 2 in lung diseases. Curr Opin Pharmacol 2006; 6: 271-76.
25. Ishii K, Takeuchi H, Fukunaga K, et al. Attenuation of lipopolysaccharide-induced acute lung injury after (pro)renin receptor blockade. Exp Lung Res 2015; 41: 199-207.
26. Molloy EJ, Murphy N. Vitamin D, Covid-19 and Children. Ir Med J 2020; 113: 64.
27. Ilie PC, Stefanescu S, Smith L. The role of vitamin D in the prevention of coronavirus disease 2019 infection and mortality. Aging Clin Exp Res 2020; 32: 1195-8.
28. Chowdhury R, Taneja S, Bhandari N, et al. Vitamin-D deficiency predicts infections in young north Indian children: A secondary data analysis. PLoS One 2017; 12: e0170509.
29. Banajeh SM. Nutritional rickets and vitamin D deficiency- -association with the outcomes of childhood very severe pneumonia: a prospective cohort study. Pediatr Pulmonol 2009; 44: 1207-15.

935
Düğeroğlu H. Vitamin D levels in COVID-19J Health Sci Med 2021; 4(6): 931-935
30. Yao J, Liu L, Chen G, et al. Two severe cases of H7N9 pneumonia patients with immunoneuroendocrine axis dysfunction and vitamin D insufficiency. BMC Infect Dis 2014; 28: 44.
31. Holick MF. Sunlight and vitamin D for bone health and prevention of autoimmune diseases, cancers, and cardiovascular disease. Am J Clin Nutr 2004; 80: 1678-88.
32. Arihiro S, Nakashima A, Matsuoka M, et al. Randomized trial of vitamin D supplementation to prevent seasonal influenza and upper respiratory infection in patients with inflammatory bowel disease. Inflamm Bowel Dis 2019; 25: 1088-95.
33. Urashima M, Segawa T, Okazaki M, et al. Randomized trial of vitamin D supplementation to prevent seasonal influenza A in schoolchildren. Am J Clin Nutr 2010; 91: 1255-60.
34. Camargo CA Jr, Ganmaa D, Frazier AL, et al. Randomized trial of vitamin D supplementation and risk of acute respiratory infection in Mongolia. Pediatrics 2012; 130: 561-7.
35. Uçar F, Taşlıpınar MY, Soydaş AÖ, Özcan N. 25-OH vitamin D levels in patients admitted to Ankara Etlik İhtisas Training and Research Hospital. Eur J Basic Med Sci 2012; 2: 12-5.
36. Erol AM, Çelik C, Hacıoğlu K, et al. The relationship between vitamin D level and lipid profile in patients admitted to Physical Medicine and Rehabilitation outpatient clinic. Ege Med J 2015; 54: 173-6.
37. Silva MC, Furlanetto TW. Does serum 25-hydroxyvitamin D decrease during acute-phase response? A systematic review. Nutr Res 2015; 35 : 91-6.
38. Ebadi M, Montano-Loza AJ. Perspective: improving vitamin D status in the management of COVID-19. Eur J Clin Nutr 2020; 74: 856-9.
HEALTH SCIENCESMEDICINE
Original Article
J Health Sci Med 2021; 4(6): 936-942
This work is licensed under a Creative Commons Attribution 4.0 International License.
DOI: 10.32322/jhsm.946969
Received: 03.06.2021 Accepted: 19.09.2021Corresponding Author: Ayşe Burçin Uyumlu, [email protected]
Investigation of the effect of watercress via nuclear factor-E2-related factor-2 pathway on 7,12-dimethylbenz[a]anthracene-induced oxidative damage in rat liver
Kübra Atay1, Ayşe Burçin Uyumlu1, Basri Satılmış2, Aslı Taşlıdere3, Hatice Çağlar Yılmaz41İnönü University, Faculty of Pharmacy, Department of Biochemistry, Malatya, Turkey2İnönü University, Hepatology Research Laboratory, Institute of Liver Transplantation, Malatya, Turkey3İnönü University, Faculty of Medicine, Department of Histology and Embryology, Malatya, Turkey4İnönü University, Faculty of Arts and Science, Department of Chemistry, Malatya, Turkey
Cite this article as: Atay K, Uyumlu AB, Satılmış B, Taşlıdere A, Çağlar Yılmaz H. Investigation of the effect of watercress via nuclear factor-E2-related factor-2 pathway on 7,12-dimethylbenz[a]anthracene-induced oxidative damage in rat liver. J Health Sci Med 2021; 4(6): 936-942.
ABSTRACTAim: Nuclear factor E2-related factor-2 (Nrf2) regulates many cytoprotective antioxidants, and detoxifying enzymes, has been a hopeful approach for chemoprevention of cancer. We researched the chemopreventive impact of watercress on the DMBA-induced oxidative damage in the rat liver via the Nrf2/ARE signalling pathway in the present study. Material and Method: Female Wistar albino rats have categorized into three groups. The control was the first group, rats in the second and third groups were administered 7,12-dimethylbenz[a]anthracene (DMBA) (20 mg/kg b.w., i.p.) and rats in the third group were given daily doses of watercress (250 mg/kg b.w. Nasturtium officinale R.Br. for 4 weeks by oral gavage). Antioxidant and phase II detoxification enzyme activities, Nrf2 transcription factor level in liver, and serum ALT were determined. Also, histopathological analysis of the liver was performed.Results: We observed that watercress induces DNA-binding of Nrf2. It was related to increased enzyme activities of phase II detoxifying and the antioxidant. Our results also demonstrated that watercress ameliorated liver injury.Conclusion: Our data ensured considerable evidence that the dietary watercress ameliorates DMBA induced liver toxicity via regulating the activation of the Nrf2/ARE pathway which increases the expression of cytoprotective enzymes.Keywords: Watercress, Nrf2, DMBA, xenobiotic enzymes, hepatoprotective effect
Ana Metin-Alt bilgi Arası 5mm
Cite-Öz arası 5mm
Başlık-Yazarlar arası 12mmvv
Yazar-Kurum arası 2,5 mmvcv
Kurum-Cite arası 5mmv
Öz-Abstract arası 7,5mmvc
INTRODUCTIONCancer incidence of the world and its mortality is associated with lifestyle and environmental agents like food and chemicals. Sustained exposure to chemicals directly or indirectly leads to increase cancer risk by participating in all aspects of carcinogenesis (1). Polycyclic aromatic hydrocarbons (PAHs) are xenobiotic compounds that are environmental contaminants. PAHs are lipophilic and metabolized by xenobiotic-metabolizing enzymes (XMEs) (2). Firstly, enzymes of cytochrome P 450 family 1 that includes CYP1A1, CYP1A2, and CYP1B1 oxidize lipophilic compounds and generates reactive metabolites that interact with protein and DNA. Secondly, highly reactive compounds are converted to more hydrophilic species and/or inactivated by enzymes of phase II detoxification such as glutathione-S-transferase (GST), UDP -glucuronosyltransferases, heme oxygenases-1
(HO-1), NAD(P)H: quinine oxidoreductase 1 (NQO1), and sulfotransferases (3).
DMBA is one of the PAHs that is mainly found in automobile exhaust, cigarette smoke, grilled foods (4) which leads to the generation of reactive oxygen species (ROS), causing oxidative damage and decreased antioxidant defense enzymes, and increases carcinogenicity and toxicity (5). DMBA causes liver toxicity through the released carcinogenic metabolites as a result of xenobiotic metabolism (6). Normally Nrf2, is sensitive to redox changes, exists in an inactive form with a cytosolic inhibitor called Kelch-like epichlorohydrin-associated protein 1 (Keap1). Oxidative stress generating factors including electrophiles, xenobiotics, heavy metals, UV radiation, and physiological stress lead to cleavage of Nrf2 from the Nrf2-Keap1 complex. Nrf2 translocates to

937
Atay et al. Hepatoprotective effect of watercress via Nrf2 pathway J Health Sci Med 2021; 4(6): 936-942
the nucleus and binds to the antioxidant response element (ARE). This causes the transcription of genes of phase II enzymes including NQO1 and GST (7). Excessive ROS generation due to the xenobiotic metabolism of DMBA causes oxidative stress, liver damage, and carcinogenesis. The Nrf2/ARE binding results in the induction of detoxification enzymes, antioxidative stress proteins, and other defense mechanisms (8).
Watercress belongs to the Cruciferae, also called Brassicaceae, family and is one of the perennial freshwater macrohydrophytes that has ecological and economic importance. It has been used by humans for many years both for food and medical purposes (9). This plant has some medicinal properties such as a diuretic (10), antihypertensive (11), antidiabetic (12), antihyperlipidemic (13), antiasthmatic, antituberculosis (14), and anticarcinogenic (15). Furthermore, it contains vitamins (Vitamin A and C), phenolic compounds, minerals, and glucosinolates (16). Glucosinolates are converted to isothiocyanates (ITC) non-enzymatically by physical factors or enzymatically by myrosinase during food preparation, cooking, and chewing (17). Phenethylisothiocyanate (PEITC) in watercress, is an ITC, has been extensively investigated as the most promising chemopreventive compound (18).
In this study, we hypothesized that watercress-mediated Nrf2 activation is a novel hepatoprotective pathway. The goal of this study was to evaluate the chemopreventive effect of watercress grown in the Malatya region of Turkey on oxidative liver injury induced by DMBA via the Nrf2/ARE pathway.
MATERIAL AND METHODAnimals and Experimental Design All experimental procedures of animals were approved by the Local Ethics Committee of the Animal Experiments of İnönü University (Date: 20/02/2015, Decision No: 2015/A-25). Twenty-seven female Wistar albino rats (weighing 150–250 g) accommodated in a room kept at 22°C with a 12-hr light/dark cycle and had free access to food. Rats were separated randomly into three groups (9 rats per group): Rats in group I served as control and were injected intraperitoneally with corn oil. Rats in group II (DMBA) and group III (DMBA+watercress) were injected intraperitoneally with DMBA (20 mg/kg body-weight in corn oil) (Sigma-Aldrich, USA) (19). Rats in group III were given daily doses of watercress (Nasturtium officinale R.Br) (250 mg/kg b.w) for 4 weeks by oral gavage before intraperitoneal injection of DMBA (20 mg/kg body-weight in corn oil). After 30 days, under xylazine/ketamine anesthesia blood of rats in all groups was collected and then liver tissues of the rats were resected, washed in phosphate buffer, and rapidly frozen at -80°C.
Plant Material and ExtractionNasturtium officinale R.Br were obtained from the pond in Arguvan country, city of Malatya, Turkey. A voucher specimen (No: 1001) was deposited into a herbarium at the Faculty of Pharmacy of İnönü University in Malatya, Turkey (Figure 1). Samples were freeze-dried and were powdered. The powdered sample was extracted with 70% methanol by heating at 70°C for 30 minutes and filtered. This procedure was carried out two more times and then centrifuged at 4000 rpm for 10 min. The solvent was removed with a rotary evaporator (Heidolph Laborota 4011-digital) at 90 rpm, and 45°C for 2 h and dried.
Figure 1. The aerial parts of Nasturtium officinale R.Br. were collected from the pond in Arguvan country, city of Malatya, Turkey (Fresh plant and a voucher specimen (No: 1001)).

938
Atay et al. Hepatoprotective effect of watercress via Nrf2 pathwayJ Health Sci Med 2021; 4(6): 936-942
Determination of PEITC Content of the WatercressThe PEITC content of the watercress was determined by HPLC. PEITC standards were prepared with acetonitrile at concentrations of 0.312, 0.625, 1.25, 2.5, 5, and 10 ppm. 100 μL of the cyclocondensation working reagent (10 mM 1,2 benzene dithiol isopropanol and pH 8.5 phosphate buffer) was mixed and incubated at 65°C for 2 h. For the determination of PEITC amount is needed the conversion of glucosinolates to isothiocyanates and derivatization of the isothiocyanates by a cyclocondensation reaction. 2 mg of dry watercress powder was solved in 2 mL deionized water and added 1 mL myrosinase. It was incubated at 37°C for 2 h, and centrifugated at 875 g for 15 min. It was derivatized by cyclocondensation reaction before HPLC analysis (20). For the chromatographic separation method in HPLC (Agilent 1100, Germany), a C18 column (150×4.6 mm i.d., 5 μm-ACE columns) and a mobile phase (Methanol-water (90:10, v/v) were used. It flowed at 1.1 mL/min and was measured at 365 nm. The amount of PEITC was calculated according to the calibration curve of PEITC standards. The correlation coefficient was found to be 0,999 for PEITC (Figure 2). The amount of PEITC in watercress was expressed as µg PEITC per mg of watercress.
Biochemical AnalysisDetermination of protein content of liver tissues: The protein levels in the liver tissues were measured by the method of Bradford using BSA as the standard (21). Protein levels were expressed as milligram protein.Determination of alanine aminotransferase (ALT): Rat ALT ELISA kit (Elabscience) was used to measure ALT level in the rat serum, according to the manufacturers’ instructions. ALT level was expressed as ng/mL.Determination of superoxide dismutase (SOD) activity: The SOD activity was measured using the Nitroblue tetrazolium (NBT) assay as described by Beauchamp and Fridovich (22). NBT-formazan was spectrophotometrically determined at 560 nm. SOD activity was expressed as U/mg protein.
Determination of glutathione peroxidase (GPx) activity: GPx activity was determined by the method of Lawrence and Burk (23). The absorbance at 340 nm was recorded for 1 min. GPx activity was expressed as U/mg protein. Determination of catalase (CAT) activity: CAT activity was determined by the method of Luck (24). The absorption was detected spectrophotometrically at 240 nm for 1 min. CAT activity was expressed as U/mg protein.Determination of malondialdehyde (MDA): Amount of MDA was measured using the method of Mihara and Uchiyama (25). The absorption at 532 nm was recorded using 1,1,3,3-tetramethoxypropane as the standard. MDA content was expressed as nanomoles per milligram protein.Determination of GST activity: GST activity assay kit (Cayman) was used to determine the activity of GST in the rat liver, according to the manufacturers’ instructions. The absorption was monitored at 340 nm. GST activity was expressed as nmol/min/mg protein.Determination of NQO1 activity: NQO1 activity assay kit (Abcam) was used to determine the activity of NQO1 in rat liver, according to the manufacturers’ instructions. The absorbance was detected at 440 nm. NQO1 activity was expressed as U/mg protein.Determination of Nrf2-DNA binding activity: To measure the DNA binding activity of Nrf2 in liver nuclear extracts Nrf2 Transcription Factor Assay Kit (Cayman) was used.
Histological AnalysisThe liver tissues were fixed in 10% formalin solution for 24 h. Following embedded in paraffin, sections of the liver tissue were cut at 5 μm and stained with hematoxylin-eosin (H-E) and Masson's trichrome methods. These samples were examined under light microscopy (Leica Micros Imaging Solutions Ltd., Cambridge, UK). The microscopic score of each tissue was calculated as the sum of the scores given to each criterion. Scores were given as absent (0), slight (1), moderate (2), and severe (3) for each criterion. The maximum score was 9.
Statistical AnalysisThe IBM SPSS software version 22 was used for data analysis. Whether the data showed normal distribution was analyzed according to the Kolmogorov-Smirnov Test. For the data that had normal distribution, the One-Way ANOVA test was used for statistical analyses. The Post-hoc LSD Test was used for the comparisons among the groups. For the data that didn't have a normal distribution, the Kruskal-Wallis test and the Post-hoc Mann-Whitney U test were used. Arithmetic mean ± Standard Deviation (SD) was used for the biochemical data. Differences were considered significant when p values were less than 0.05 and 0,0001 for the biochemical and histological data, respectively.
Figure 2. Calibration curve of standard solutions of PEITC.

939
Atay et al. Hepatoprotective effect of watercress via Nrf2 pathway J Health Sci Med 2021; 4(6): 936-942
RESULTS
Histological FindingsHistopathological analysis results were given in Table 1. The liver tissues of the control group did not present any histopathological alterations and significant damage was shown in the liver tissue of the DMBA-treated group (p <0.0001). Liver tissues of the DMBA+watercress (WS) group showed markedly reduced damage defined by less amount of mononuclear cell infiltration, hemorrhage, eosinophilic cells with a pyknotic nucleus (p <0.0001). Histopathological images of the control, DMBA, and DMBA+WS groups are shown in Figures 3, 4, and 5, respectively. In the control group, the normal parenchymal structure was observed in liver tissue (Figure 3 (A,B)). There is no histological alteration of the central vein and surrounding hepatocytes in the portal areas. The liver tissue of the DMBA group (Figure 4 (A-E)) showed significantly histopathological damage. Liver necrosis (Figure 4 (A,E)), hepatocytes with a pyknotic nucleus and eosinophilic cytoplasm (Figure 4 (A,B)), hemorrhage (Figure 4 (A,B)), mononuclear cell infiltration (Figure 4 (C)), vascular congestion (Figure 4 (C,E)), and sinusoidal dilatation (Figure 4 (D)) were observed. The liver tissue of the DMBA+WS group presented a decrease in histopathological damage. In liver tissue of the DMBA+WS group, a small amount of mononuclear cell infiltration (black arrows), hemorrhage (Figure 5 (A)), eosinophilic cells with a pyknotic nucleus (black arrows) were observed (Figure 5 (B)).
Biochemical FindingsAlterations in serum ALT level related to liver function are represented in Figure 6. It was observed that serum ALT level increased as a result of the application of DMBA, and then decreased in the DMBA+WS group (p <0.05). The DNA binding activity level of the Nrf2 transcription factor was decreased significantly (p <0.05) in the DMBA group, and a significant increase (p <0.05) was observed in the DMBA+WS group (Figure 7). Our results showed decreased activities of NQO1 and GST in the DMBA group . The administration of watercress significantly modulated the activities of NQO1 and GST (Figure 8). Furthermore, activities of SOD, GPx, and CAT were decreased in the DMBA group compared to the control and increased in the DMBA+WS group (Table 2). MDA levels were significantly elevated in the DMBA group and decreased by watercress administration (Table 2).
Table 1. The mean histopathological damage score of all groups. Lowercase letters a, b, c in the same column show the differences between groups. p<0.0001.Group Histopathological damage score (Mean±SE)Control 0.39±0.59aDMBA 2.11±0.88bDMBA+watercress 1.30±0.80c
Lowercase letters a, b, c in the same column show the differences between groups. p<0.0001
Figure 3. (A,B) Liver specimen from the control group showing a normal appearance. In the control group, liver tissue was normal histological and hepatocytes arranged in the form of cords around the vena centralis were observed. A: H-E; X20, B: H-E; X 40.
Figure 5. (A,B) Liver specimen from the DMBA+watercress group. In the DMBA+watercress group, mononuclear cell infiltration (black arrows) (A), haemorrhage (black arrows) (A), and hepatocytes with eosinophilic stained pyknotic nuclei (black arrows) (B) were observed. A: H-E; X 20, B: H-E; X 40.
Figure 4. (A-E) Liver specimen from the DMBA-treated group. In the DMBA-treated group, necrosis of the liver tissue (black star) (A, E), hepatocytes with eosinophilic stained pyknotic nuclei (thick black arrows) (A, B), haemorrhage (thin black arrows) (A, B), mononuclear cell infiltration (thin black arrows) ) (C), vascular congestion (white star) (C, E) and sinusoidal dilatation (thin black arrows) (D) were observed. A, B, C, E: H-E; X20, D: H-E; X 40.
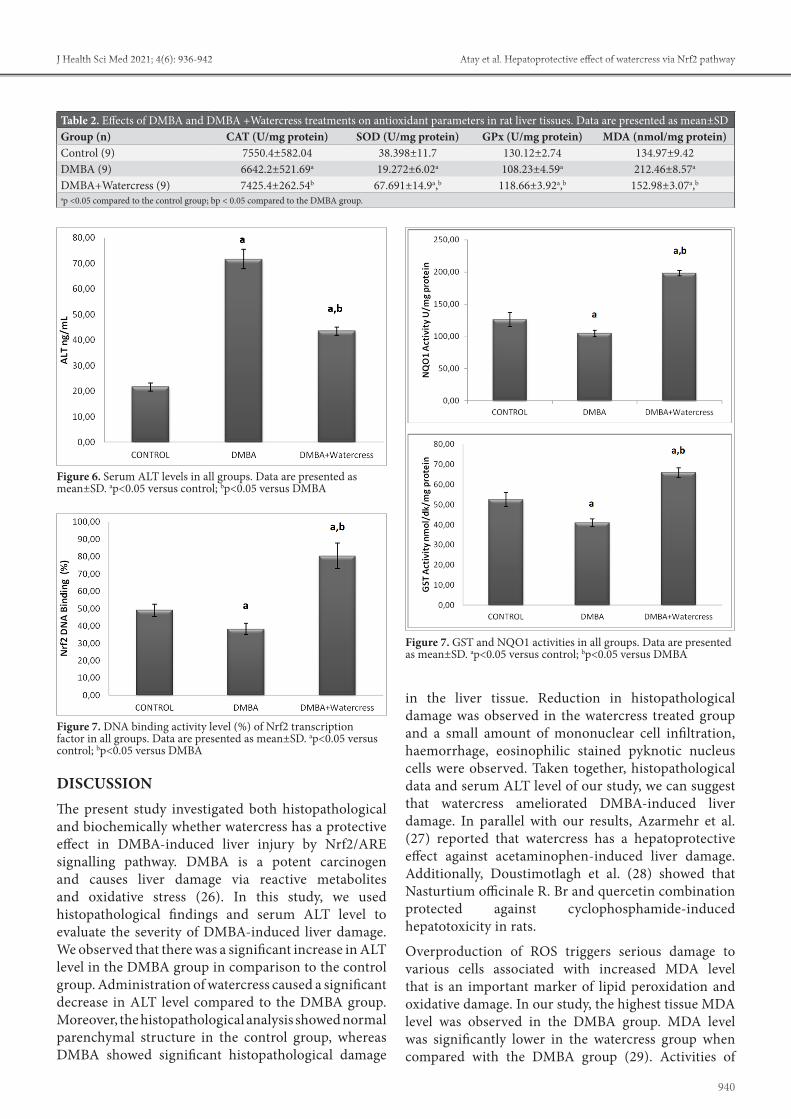
940
Atay et al. Hepatoprotective effect of watercress via Nrf2 pathwayJ Health Sci Med 2021; 4(6): 936-942
in the liver tissue. Reduction in histopathological damage was observed in the watercress treated group and a small amount of mononuclear cell infiltration, haemorrhage, eosinophilic stained pyknotic nucleus cells were observed. Taken together, histopathological data and serum ALT level of our study, we can suggest that watercress ameliorated DMBA-induced liver damage. In parallel with our results, Azarmehr et al. (27) reported that watercress has a hepatoprotective effect against acetaminophen-induced liver damage. Additionally, Doustimotlagh et al. (28) showed that Nasturtium officinale R. Br and quercetin combination protected against cyclophosphamide-induced hepatotoxicity in rats.
Overproduction of ROS triggers serious damage to various cells associated with increased MDA level that is an important marker of lipid peroxidation and oxidative damage. In our study, the highest tissue MDA level was observed in the DMBA group. MDA level was significantly lower in the watercress group when compared with the DMBA group (29). Activities of
DISCUSSIONThe present study investigated both histopathological and biochemically whether watercress has a protective effect in DMBA-induced liver injury by Nrf2/ARE signalling pathway. DMBA is a potent carcinogen and causes liver damage via reactive metabolites and oxidative stress (26). In this study, we used histopathological findings and serum ALT level to evaluate the severity of DMBA-induced liver damage. We observed that there was a significant increase in ALT level in the DMBA group in comparison to the control group. Administration of watercress caused a significant decrease in ALT level compared to the DMBA group. Moreover, the histopathological analysis showed normal parenchymal structure in the control group, whereas DMBA showed significant histopathological damage
Table 2. Effects of DMBA and DMBA +Watercress treatments on antioxidant parameters in rat liver tissues. Data are presented as mean±SDGroup (n) CAT (U/mg protein) SOD (U/mg protein) GPx (U/mg protein) MDA (nmol/mg protein)Control (9) 7550.4±582.04 38.398±11.7 130.12±2.74 134.97±9.42DMBA (9) 6642.2±521.69a 19.272±6.02a 108.23±4.59a 212.46±8.57a
DMBA+Watercress (9) 7425.4±262.54b 67.691±14.9a,b 118.66±3.92a,b 152.98±3.07a,b
ap <0.05 compared to the control group; bp < 0.05 compared to the DMBA group.
Figure 6. Serum ALT levels in all groups. Data are presented as mean±SD. ap<0.05 versus control; bp<0.05 versus DMBA
Figure 7. DNA binding activity level (%) of Nrf2 transcription factor in all groups. Data are presented as mean±SD. ap<0.05 versus control; bp<0.05 versus DMBA
Figure 7. GST and NQO1 activities in all groups. Data are presented as mean±SD. ap<0.05 versus control; bp<0.05 versus DMBA

941
Atay et al. Hepatoprotective effect of watercress via Nrf2 pathway J Health Sci Med 2021; 4(6): 936-942
SOD, CAT, GPx were significantly decreased in DMBA-treated rats when compared to control group and administration of watercress enhanced the activities of SOD, CAT, GPx. The alteration in antioxidant status increases the risk of oxidative damage to nucleic acids, proteins, lipids, and small intracellular molecules (30). Many experimental studies reported that enhancement of oxidative stress is contributed to DMBA-induced cancer (31). In this study, administration of watercress significantly reduced DMBA-induced elevation lipid peroxidation and also decreased the activities of liver enzymatic antioxidants. In line with our results, Sadeghi et al. (32) reported that hydroalcoholic extract of watercress ameliorated oxidative stress and liver injury in bile duct ligation-induced cholestatic rats by preventing the hepatic protein oxidation and enhancing the activity of the antioxidant enzymes.
It has been reported that up-regulation of Keap1 and down-regulation of Nrf2 expression increased cellular ROS (33). Nrf2-mediated antioxidant signalling pathways are critical for the prevention of oxidative stress-induced cell injury (34). It has been showed that various dietary phytochemicals target Nrf2/Keap1 signalling and induce the expression of antioxidant and phase II enzymes to inhibit the development of DMBA-induced carcinogenesis model (35). Our results revealed that the binding percentage of the Nrf2 transcription factor had a statistically significant decrease in the DMBA group comparison to the control group. In the watercress group, the percentage of Nrf2/ARE binding significantly was activated compared to the DMBA group. These results can be associated with sulfur-containing glucosinolate derivatives, such as PEITC. These natural isothiocyanates reduce Nrf2 degradation which results in the translocation to the nucleus of Nrf2 (36). Previous studies reported that dietary isothiocyanates are an important cancer chemoprevention compound for the Nrf2/ARE system, which induces the activation and expression of phase II enzymes (37). Saravan et al. (38) were reported that thymoquinone protected liver tissue from DMBA toxicity by regulating phase I and phase II detoxification enzymes. In present study, there was a statistically significant decrease in phase II enzymes (NQO1 and GST) activities in the DMBA group compared to the control group. Administration of watercress significantly increased the activities of these enzymes compared to the DMBA group. According to our study, it can be suggested that there is a good correlation between the protective effect of watercress and supporting the DMBA detoxification by the Nrf2 signalling pathway. Induction of phase II detoxifying enzymes by Nrf2 assists to eliminate toxic reactive intermediates generated via xenobiotic metabolism (39).
There are two major limitations for our study. First, we were only be able to measure ALT to evaluate the level of liver damage. Changes in ALT level were supported with histopathological analysis, but we could not measure other liver function parameters due to financial conditions. Another limitation is that we did not design and conduct a study on the molecular mechanism about which way watercress affects the Nrf2/ARE pathway. This topic has been planned for our future research.
Overall, this experimental study suggests that watercress ameliorated oxidative stress and liver injury through the regulation of antioxidant and phase II enzymes by the activation Nrf2/ARE signalling pathway in DMBA-induced liver damage in rats.
CONCLUSIONThe study revealed that the watercress plant is effective through the activation of Nrf2/ARE signalling resulting in increased antioxidant and phase II detoxification enzyme activities which are important for the chemoprevention of liver damage caused by DMBA. Our data support that activation of Nrf2 is a promising strategy for chemoprevention. In this context, we think that watercress functions as an Nrf2 activator and effect of its PEITC content on the molecular mechanism should be investigated with further studies
ETHICAL DECLARATIONSEthics Committee Approval: The study was carried out with the permission of the Local Ethics Committee of the Animal Experiments of İnönü University (Date: 20/02/2015, Decision No: 2015/A-25). Referee Evaluation Process: Externally peer-reviewed. Conflict of Interest Statement: The authors have no conflicts of interest to declare. Financial Disclosure: This study was supported by Scientific Research Projects Unit of İnönü University; Grant/Award Number: 2015/84. Author Contributions: All of the authors declare that they have all participated in the design, execution, and analysis of the paper, and that they have approved the final version.
REFERENCES1. Rengarajan T, Nandakumar N, Balasubramanian MP. D-Pinitol
prevents rat breast carcinogenesis induced by 7,12-Dimethylbenz[a]anthracene through inhibition of Bcl-2 and induction of p53, caspase-3 proteins and modulation of hepatic biotransformation enzymes and antioxidants. Biomed Prev Nutr 2013; 3: 31-41.
2. Shimada T. Xenobiotic-metabolizing enzymes involved in activation and detoxification of carcinogenic polycyclic aromatic hydrocarbons. Drug Metab Pharmacokinet 2006; 21: 257-76.
942
Atay et al. Hepatoprotective effect of watercress via Nrf2 pathwayJ Health Sci Med 2021; 4(6): 936-942
3. Xue W, Warshawsky D. Metabolic activation of polycyclic and heterocyclic aromatic hydrocarbons and DNA damage: a review. Toxicol Appl Pharmacol 2005; 206: 73-93.
4. Gelboin HV. Benzo[alpha]pyrene metabolism, activation and carcinogenesis: role and regulation of mixed-function oxidases and related enzymes. Physiol Rev 1980; 60: 1107-66.
5. Bharali R, Tabassum J, Azad MRH. Chemomodulatory effect of moringa oleifera, lam, on hepatic carcinogen metabolising enzymes, antioxidant parameters and skin papillomagenesis in mice. Asian Pac J Cancer Prev 2003; 4: 131-9.
6. Manzanares MÁ, Solanas M, Moral R, Escrich R, Vela E, Escrich E. Ontogeny of the major xenobiotic-metabolizing enzymes expression and the dietary lipids modulatory effect in the rat dimethylbenz(a)anthracene-induced breast cancer model. J Biochem Mol Toxicol 2014; 28: 539-48.
7. Li Y, Paonessa JD, Zhang, Y. Mechanism of chemical activation of Nrf2. PLoS ONE 2012; 7: e35122.
8. Baird L, Dinkova-Kostova AT. The cytoprotective role of the Keap1–Nrf2 pathway. Arch Toxicol 2011; 85: 241-72.
9. Klimek-Szczykutowicz M, Szopa A, Ekiert H. Chemical composition, traditional and professional use in medicine, application in environmental protection, position in food and cosmetics industries, and biotechnological studies of Nasturtium officinale (watercress) – a review. Fitoterapia 2018; 129: 283-92.
10. Ribeiro Rde A, de Barros F, de Melo MM, et al. Acute diuretic effects in conscious rats produced by some medicinal plants used in the state of São Paulo, Brasil. J Ethnopharmacol 1988; 24: 19-29.
11. Yaricsha CA, Rissyelly K. ACE inhibitory activity, Total phenolic and flavonoid content of watercress (Nasturtium officinale R. Br.) extract. Pharm J 2017; 9: 249-51.
12. Hoseini HF, Gohari AR, Saeidnia S, Majd NS, Hadjiakhoondi A. The effect of Nasturtium officinale on blood glucose level in diabetic rats. Pharmacol Ther 2009; 3: 866–71.
13. Bahramikia S, Yazdanparast R. Effect of hydroalcoholic extracts of Nasturtium officinale leaves on lipid profile in high-fat diet rats. J Ethnopharmacol 2008; 115: 116-21.
14. Camacho-Corona Mdel R, Ramírez-Cabrera MA, Santiago OG, Garza-González E, Palacios P, IdeLuna-Herrera J. Activity against drug resistant-tuberculosis strains of plants used in Mexican traditional medicine to treat tuberculosis and other respiratory diseases. Phytother Res 2008; 22: 82-5.
15. Boyd LA, McCann MJ, Hashim Y, Bennett RN, Gill CI, Rowland IR. Assessment of the anti-genotoxic, anti-proliferative, and anti-metastatic potential of crude watercress extract in human colon cancer cells. Nutr Cancer 2006; 55: 232-41.
16. Giallourou N, Oruna-Concha MJ, Harbourne N. Effects of domestic processing methods on the phytochemical content of watercress (Nasturtium officinale). Food Chem 2016; 212: 411-9.
17. Talalay P, Fahey JW. Phytochemicals from cruciferous plants protect against cancer by modulating carcinogen metabolism. J Nutr 2001; 131: 3027-33.
18. Keum YS, Owuor ED, Kim BR, Hu R, Kong ANT. Involvement of Nrf2 and JNK1 in the activation of antioxidant responsive element (ARE) by chemopreventive agent phenethyl isothiocyanate (PEITC). Pharm Res 2003; 20: 1351-55.
19. Saarinen NM, Warri A, Airio M, Smeds A, Makela S. Role of dietary lignans in the reduction of breast cancer risk. Mol Nutr Food Res 2007; 51: 857-66.
20. Jiao D, Yu MC, Hankin JH, Low S-H, Chung F-L. Total isothiocyanate contents in cooked vegetables frequently consumed in Singapore. J Agric Food Chem 1998; 46: 1055-58.
21. Bradford MM. A rapid and sensitive method for the quantitation of microgram quantities of protein utilizing the principle of protein-dye binding. Anal Biochem 1976; 72: 248-54.
22. Beauchamp C, Fridovich I. Superoxide dismutase: Improved assays and an assay applicable to acrylamide gels. Anal Biochem 1971; 44: 276-87.
23. Lawrence RA, Burk RF. Glutathione peroxidase activity in selenium-deficient rat liver. Biochem Biophys Res Commun 1976; 71: 952-58.
24. Luck H. Catalase. In: Methods of Enzymatic Analysis, Bergmeyer HU (ed). Academic Press/Verlag Chemie, New York; 1963: 885-94.
25. Mihara M, Uchiyama M. Determination of malonaldehyde precursor in tissues by thiobarbituric acid test. Anal Biochem 1978; 86: 271-8.
26. Girolamia F. Time-dependent acetylsalicylic acid effects on liver CYP1A and antioxidant enzymes in a rat model of 7,12-dimethylbenzanthracene (DMBA)-induced mammary carcinogenesis. Toxicol Lett 2008; 181: 87-92.
27. Azarmehr N, Afshar P, Moradi M, et al. Hepatoprotective and antioxidant activity of watercress extract on acetaminophen-induced hepatotoxicity in rats. Heliyon 2019; 5: e02072.
28. Doustimotlagh AH, Kokhdan EP, Vakilpour H, et al. Protective effect of Nasturtium officinale R. Br and quercetin against cyclophosphamide-induced hepatotoxicity in rats. Mol Biol Rep 2020; 47: 5001-12.
29. Gulbahce-Mutlu E, Baltaci SB, Menevse E, Mogulkoc R, Baltaci AK. The Effect of zinc and melatonin administration on lipid peroxidation, IL-6 levels, and element metabolism in DMBA-induced breast cancer in rats. Biol Trace Elem Res 2021; 199: 1044-51.
30. Saha SK, Lee SB, Won J, et al. Correlation between oxidative stress, nutrition, and cancer initiation. Int J Mol Sci 2017; 18: E1544.
31. Zeweil MM, Sadek KM, Taha NM, El-Sayed Y, Menshawy S. Graviola attenuates DMBA-induced breast cancer possibly through augmenting apoptosis and antioxidant pathway and downregulating estrogen receptors. Environ Sci Pollut Res Int 2019; 26: 15209–17.
32. Sadeghi H, Azarmehr N, Razmkhah F, et al. The hydroalcoholic extract of watercress attenuates protein oxidation, oxidative stress, and liver damage after bile duct ligation in rats. J Cell Biochem 2019; 120: 14875-84.
33. Sun T, Gao J, Han D, Shi H, Liu X. Fabrication and characterization of solid lipid nano-formulation of astraxanthin against DMBA-induced breast cancer via Nrf-2-Keap1 and NF-kB and mTOR/Maf-1/PTEN pathway. Drug Deliv 2019; 26: 975-88.
34. Flocryk U, Lobodam A, Stachurska A, Jozkowicz A, Dulak J. Role of Nrf2 transcription factor in the cellular response to oxidative stress. Postepy Biochem 2010; 56: 147-55.
35. Kavitha K, Thiyagarajan P, Nandhini JR, Mishra R, Nagini S. Chemopreventive effects of diverse dietary phytochemicals against DMBA-induced hamster buccal pouch carcinogenesis via the induction of Nrf2-mediated cytoprotective antioxidant, detoxification, and DNA repair enzymes. Biochimie 2013; 95: 1629-39.
36. Yamamoto M, Kensler TW, Motohashi H. The Keap1-Nrf2 system: a thiol-based sensor-effector apparatus for maintaining redox homeostasis. Physiol Rev 2018; 98: 1169-203.
37. Konsue N, Ioannides C. Tissue differences in the modulation of rat cytochromes P450 and phase II conjugation systems by dietary doses of phenethyl isothiocyanate. Food Chem Toxicol 2008; 46: 3677-83.
38. Saravanan D, Baskaran K, Sakthisekaran D. Protective effect of thymoquinone on the liver tissues of 7, 12-dimethylbenz(a) anthracene induced experimental breast cancer rats. Asian J Pharm Clin Res 2016; 9: 197–201.
39. Ezzat SM, El-Halawany AM, Hamed AR, Abdel-Sattar E. Chapter 9-Role phytochemicals play in the activation of antioxidant response elements (AREs) and phase II enzymes and their relation to cancer progression and prevention. In: Studies in Natural Products Chemistry, Atta-ur-Rahman (ed). Elsevier, Volume 60; 2019: 345-69.
HEALTH SCIENCESMEDICINE
Original Article
J Health Sci Med 2021; 4(6): 943-948
This work is licensed under a Creative Commons Attribution 4.0 International License.
DOI: 10.32322/jhsm.985592
Received: 21.08.2021 Accepted: 06.09.2021Corresponding Author: Ebru Yılmaz, [email protected]
Transplantation for ultra high-risk neuroblastoma patients: effect of tandem autologous stem cell transplantation
Ebru Yılmaz1, Muhammed Bahadır Samur1 Alper Özcan1, Ekrem Ünal1,2, Musa Karakükcü11Erciyes University, Faculty of Medicine, Department of Pediatrics, Division of Pediatric Hematology and Oncology & Pediatric HSCT Unit, Kayseri, Turkey2Erciyes University Betül Ziya EREN Genome and Stem Cell, Department of Molecular Biology and Genetics, Kayseri, Turkey
Cite this article as: Yılmaz E, Samur MB, Özcan A, Ünal E, Karakükcü M. Transplantation for ultra high-risk neuroblastoma patients: effect of tandem autologous stem cell transplantation. J Health Sci Med 2021; 4(6): 943-948.
ABSTRACT Aim: Neuroblastoma is a tumor with a high mortality rate originating from primitive sympathetic ganglion cells. In recent years, the definition of "ultra high-risk" has been used, in which the response to treatment is added in addition to the disease characteristics. In this study, the results of tandem high-dose Iodine 131 (131I) metaiodobenzylguanidine (MIBG) and tandem autologous hematopoietic stem cell transplantation (HSCT) in patients who were diagnosed as refractory after first-line treatments and considered with ultra-high risk nöroblastom (NBL) in Erciyes University Medical Faculty Pediatric Bone Marrow Transplant Center were shared.Material and Method: Eleven patients who underwent tandem MIBG and autologous HSCT with the diagnosis of refractory/ultra high-risk NBL between 2011 and 2021 were included in the study. Patient's data were obtained retrospectively using an electronic or manuscript medical record.Results: Tandem autologous HSCT and MIBG treatment were applied to 11 patients with a median age of 40.5 months who were diagnosed with refractory/ultra high-risk neuroblastoma. In our study, the overall survival rate was 54.5% and event-free survival (EFS) was 39% at a median follow-up of 20.7 (7.8-105.6) months. Of the 6 surviving patients, 4 are followed in complete remission and 2 in partial remission.Conclusion: Our study is the only study that includes a group of patients who received tandem high-dose MIBG and tandem autologous HSCT transplantation in refractory NBL patients without cytokine and immunotherapy. Tandem transplantation and MIBG therapy in ultra-high-risk NBL cases remain promising with acceptable toxicity. Adding immunotherapy to this treatment protocol and combining it with new treatment modalities such as anaplastic lymphoma kinase (ALK), which also takes into account genetic characteristics, may increase survival and event-free survival rates.Keywords: Neuroblastoma, tandem stem cell transplantation, children, tandem MIBG
Ana Metin-Alt bilgi Arası 5mm
Cite-Öz arası 5mm
Başlık-Yazarlar arası 12mmv
Yazar-Kurum arası 2,5 mmvcv
Kurum-Cite arası 5mm
Öz-Abstract arası 7,5mmvc
INTRODUCTIONThe spectrum of neuroblastic tumors (this term includes neuroblastomas, ganglioneuroblastomas, and ganglioneuromas) is one of the most common lethal malign diseases that arise from primitive sympathetic ganglion cells (1). Neuroblastoma (NBL) is the most common extracranial malignancy overall in the first year of life as the cause of 15% mortality of childhood cancers and disease is characterized by a heterogeneous group of histopathologic appearance, biologic characteristics with onset usually before age 5 years old (2-4). Neuroblastomas constitute 13% of childhood cancers in Turkey (5). Remarkably divergent courses of tumors are typically associated with patient age, tumor stage, and histology, genetic and chromosomal abnormalities (6). Global
surveys estimate the occurrence of NBL in the range of eight to ten per million children 0-14 years (2,3).
NBL remains distinct from other solid tumors. The disease has ranged from extremely aggressive metastatic disease to spontaneous regression forms, this is probably due to their unique histological and biological character (6). While the most adrenal gland involvement was observed (40%), up to 25% followed by abdominal, 15% thoracic, 10% other nervous sympathetic systems; location of the tumor determines the symptoms including abdominal mass or pain, weakness, constipation and bladder dysfunction, palpable non-tender subcutaneous nodules, anemia, and bone pain. Elevated levels of catecholamines

944
Yılmaz et al. Transplantation for ultra high-risk neuroblastoma patients J Health Sci Med 2021; 4(6): 943-948
may lead to significant morbidity and death but also "atypical" presentation such as horner syndrome, proptosis, periorbital ecchymoses, or opsoclonus myoclonus syndrome expected (1,2,6). Previous studies have shown that the most robust prognostic factors are age, stage, metastasis, histology, Stage of the tumor at the time of diagnosis, and amplification of the N-Myc oncogene (7). Markers associated with a poor prognosis include ferritin, lactate dehydrogenase (LDH), and neuron-specific enolase (NSE). However, these markers have become less important due to the discovery of N-Myc amplification, deletion of chromosome 1, and heterozygosity at 11q23 (1,7).
Standard care of high-risk NBL is defined as multi-modal treatment which includes induction chemotherapy, surgical tumor resection, immunotherapy, consolidative high-dose chemotherapy with autologous hematopoietic stem cell transplantation (HSCT), post-consolidation therapy to treat minimal residual disease including isotretinoin, post-transplant radiotherapy (8,9,10). Detection of GD2 and ALK expression in neuroblastoma cells brings up alternative treatment options (11). Survival is around less than %15 before these intense therapies but, it is still below 50% despite all these treatment regimens (9,10). The use of high-dose chemotherapy with autologous HSCT rescue and Iodine 131 (131I) metaiodobenzylguanidine (MIBG) has still insufficient in survival however, patients with the high-risk disease requires treatment with multi-modal therapy (3). Especially, refractory and ultra high-risk patients (which including treatment response) have an extremely poor prognosis; despite gradual improvements chemotherapy, surgery, radiotherapy, and HSCT with %10-15 survival (8,12).
Studies over the past few years show that survival of NBL patients undergoing tandem transplantation is significantly better, by the time tandem HSCTs are getting the standard first-line therapy in The United States of America step by step (8,13,14). There are still institutes that apply myeloablative regimens consolidated with immunotherapy and isotretinoin as standard therapy (15). Thus, improvement of treatment strategies of stem cells is warranted.
In this study, the results of tandem high-dose MIBG and tandem autologous HSCT in patients who were diagnosed as refractory after first-line treatments and considered with ultra-high risk NBL in Erciyes University Medical Faculty Pediatric Bone Marrow Transplant Center were shared. In comparison to previously published bone marrow transplantation experience, our data is the only study with both tandem high-dose MIBG and tandem autologous HSCT transplantation for pediatric ultra high-risk neuroblastoma patients.
MATERIAL AND METHODPatientsEleven patients who underwent tandem MIBG and autologous HSCT with the diagnosis of refractory/ultra high-risk neuroblastoma at Erciyes University Pediatrics Bone Marrow Transplant Center between January 2011 and January 2021 were included in the study. Patient's data were obtained retrospectively using an electronic or manuscript medical record.
The study was carried out with the permission of Erciyes University Faculty of Medicine Clinical Researchs Ethics Committee (Date: 08.07.2020, Decision No: 2020/371). All procedures were carried out in accordance with the ethical rules and the principles of the Declaration of Helsinki.
Diagnosis, Risk Classification, Genetic StudyAll patients were diagnosed with tissue biopsy. Molecular analyzes were performed on tissue samples taken at the time of diagnosis at Dokuz Eylül University Oncology Institute. Bone marrow aspiration and biopsy were used for staging the disease, MIBG, positron emission tomography/computed tomography (PET CT) and/or whole-body magnetic resonance imaging (MRI) were used as imaging modalities. In the evaluation of patients' response to treatment, biochemical parameters such as lactate dehydrogenase, ferritin, NSE; if there is bone marrow involvement at the time of diagnosis or if additional symptoms developed, bone marrow aspiration and biopsy; MIBG, PET CT and/or MRI were used as imaging modalities. The patients were staged according to the International Neuroblastoma Staging System (INSS) (16). The patients' response to treatment was evaluated using the international neuroblastoma response criteria (17).
Treatment ProtocolsAll patients received the Turkish Pediatrics Oncology Group Neuroblastoma 2009 (TPOG 2009) treatment protocol. Tumor resection was performed before and/or after the protocol according to the size, localization and invasion of the tumor. Interim evaluation was made after the 3rd or 4th cycle. Following the interim evaluation, hematopoietic stem cells were collected from the patient with the help of an apheresis device using a central venous catheter. During the stem cell collection stage, granulocyte colony-stimulating factor (GCSF) was administered at a dose of 10 mcg/kg to the patients. Enough cells for two transplants were collected and cryopreserved. 8-12 mCi/kg dose of MIBG was given to the patients who completed the induction treatment and underwent surgery.The first transplantation was performed with conditioning regimen consisting of busulfan and melphalan 3 weeks after the first MIBG.

945
Yılmaz et al. Transplantation for ultra high-risk neuroblastoma patientsJ Health Sci Med 2021; 4(6): 943-948
MIBG was repeated at a dose of 8-12 mCi/kg after first autologous HSCT in patients. In the second autologous HSCT, a conditioning regimen containing melphalan, etoposide and carboplatin was used. Nine cycles of 13-cis retinoic acid were given in the post-transplant maintenance treatment (Figure 1).
Statistical AnalysisCategorical data were expressed as the number of patients and percentage and continuous variables were expressed as the mean±standard deviation or median (minimum-maximum). Nominal variables were expressed as number of cases and percentage (%). The Kaplan-Meier method was used to estimate survival probabilities.
RESULTSThe median age of 11 patients (8 boys, 3 girls) included in the study was 40.5 (range, 22.1-72.9) months. The clinical features of the patients are summarized in Table 1.
The median value of CD34 (+) cell count in the stem cell product given in the first transplantation was 7.5 (range, 4.55-17.1) ×10⁶ cells/kg. The median day of
myeloid and platelet engraftment was detected as +12 (9-22) days and +18 (12-28) days, respectively. The mean time between two HSCT was 4.7±0.5 months. In the second HSCT, 5.7 (2.7-16.7) ×10⁶ cells/kg CD34(+) cells were given. The median day of myeloid and platelet engraftment was +11 (9-15) days and +19 (16-21) days, respectively.
Only one patient did not have bone metastases at the time of diagnosis (Patient 6). One patient died on the 45th day of the second transplantation due to venoocclusive disease and sepsis, and 4 patients died due to progressive disease. Transplant-related mortality was 4.5%. After the second HSCT, 3 patients (Patient 9, 10, and 11) with residual tumors were given radiotherapy for local control. Retinoic acid maintenance therapy was given to the surviving patients (Patient 2, 5, 8, 9, 10, and 11).
In our study, the overall survival rate (OS) was 54.5% and event-free survival (EFS) was 39% at a median follow-up of 20.7 (range, 7.8-105.6) months (Figure 2). Of the 6 surviving patients, 4 are followed in complete remission and 2 in partial remission (Table 1).
Figure 1. Treatment schemeA9: Vincristine, dacarbazine, ifosfamide, adriamycin; A11: Cyclophosphamide, etoposide, cisplatin; Bu: Busulfan; Mel: Melphalan; CEM: Carboplatin, etoposide, melphalan; HSCT: Hematopoietic stem cell transplantation; MIBG: Iodine 131 (131I) metaiodobenzylguanidine ; RT: Radiotherapy; 13 CİS RA: 13-cis retinoic acid
Table 1. Patient characteristicsPatient number Sex Diagnosis age
(month) Tumor type Histology Stage N-Myc Outcome
1 Boy 26.7 Ganglioneuroblastoma Poorly Differentiated 4 Amplified Exitus2 Boy 24.4 Neuroblastoma Intermixed 4 Amplified Remission3 Boy 24 Neuroblastoma Undiferantiated 4 Not amplified Exitus4 Girl 35.9 Neuroblastoma Undiferantiated 4 Not amplified Exitus5 Boy 45.6 Neuroblastoma Undiferantiated 4 Not amplified Remission6 Boy 13.7 Neuroblastoma Undiferantiated 4 Amplified Exitus7 Girl 88.2 Neuroblastoma Undiferantiated 4 Not amplified Exitus8 Girl 31.7 Ganglioneuroblastoma Poorly Differentiated 4 Not amplified Remission9 Boy 13.1 Neuroblastoma Undiferantiated 4 Amplified Remission
10 Boy 33.8 Neuroblastoma Poorly Differentiated 4 Amplified Partial Remission11 Boy 48.8 Ganglioneuroblastoma Poorly Differentiated 4 Not amplified Partial Remission

946
Yılmaz et al. Transplantation for ultra high-risk neuroblastoma patients J Health Sci Med 2021; 4(6): 943-948
DISCUSSIONNeuroblastoma is related to the disproportionate morbidity and mortality among the cancers of childhood and has been shown that high-dose chemotherapy with autologous stem cell rescue has improved the outcomes for children with high-risk neuroblastoma (8,18). In non-metastatic patients, chemotherapy, surgery, and/or radiotherapy are often cured. However, 40% of these patients are high-risk or ultra high-risk cases which is extremely difficult to provide cures for these patients. The current therapies including high-dose chemotherapy and HSCT are border on tolerability limits with insufficient effectiveness. Therefore, alternative protocols aiming at curative treatment are required.
The high-risk tumors include a heterogeneous group of patients with a wide range of outcome spectrum. Treatment of 5 phases with high-risk tumors includes; induction, surgery, metastatic remission, myeloablative chemotherapy with autologous HSCT, radiotherapy, and biological differentiation therapy (19). Main modalities have been standardized however, autologous HSCT
approaches vary considerably. In the literature, autologous HSCT was performed with MIBG to be applied once to patients in the high-risk group, and the overall response rate was found to be 27% with the 31% 3-year EFS (20). In 2012, Qayed et al., showed that patients who were randomized to high dose chemotherapy and HSCT had a significantly improved at 3-year EFS compared with high dose chemotherapy and HSCT (4-year EFS 59.3±6.7% vs. 26.8±9.2%, p=0.01) (21). The Children’s Oncology Group (COG) Phase 3 trial (NCT00567567) compared carboplatin-etoposide-melphalan and thiotepa based tandem HSCT. They found significantly increased 3 year EFS (3-year) scores (61.8% versus 48.8%; p=.0082) (14). Follow up results of this randomized controlled trial data in 2019 comparing tandem and single transplants show 85 of 176 tandem HSCT were in complete remission/very good partial response, and 121 of 176 were needed immunotherapy (8). Another immunologically based study compared post-transplant dinutuximab beta effects was also concluded that improved EFS (5-year) results with superior significant improvement in OS (5-year) (66.7% versus 11.4%; p=.0007) (22). Major tandem studies are summurized in Table 2 (8,23-27). The experience of allogeneic HSCT in high-risk neuroblastoma patients is increasing over time (27,28).
In our study, the overall survival rate of ultra high-risk patients was 54.5% and EFS was 39% without cytokine and immunotherapies. In our patients with minimal toxicity, this tandem treatment modality provides encouraging results. Our results appear to be better than the previously high-risk studies eventhough immunotherapies were not used at all. MIBG is an adrenal imaging analogue marker initially developed at the University of Michigan fifty years ago; however, by the time with studies as therapy has directed on palliation for patients with refractory disease. The majority of authors focusing on patients with MIBG avid, non-responsive or progressive disease with safety profile, and also potential efficacy
Figure 2. Overall survival of patients
Table 2. Tandem Hematopoietic Stem Cell Transplantation Data
Study Patient Pre-transplant remission status Conditioning regimen Additional
treatment OS EFS
Park et al. 176 PR, CR, MR Cy-TT/CEM RT, 13 Cis RA, IT 74% (3-year) 61% (3-year)Pasqualini et al. 26 PR, CR TT/ Bu-Mel RT, 13 Cis RA 69% (3-year) 37.3% (3-year)
Suh et al. 18 PR, CR, MR CEM/Bu-Mel/TT-Cy RT, 13 Cis RA, single MIBG, IT 83% (5-year) 64% (5-year)
Lee et al. 54 PR, CR, MR CEC/TT-Mel RT, 13 Cis RA, single MIBG, IT 72.4% (5-year) 58.3% (5-year)
Sung et al. 50 PR, CR, MR CEC/TT-Mel-TBI/TT-Mel RT, 13 Cis RA, IT 77% (5-year) 71.4% (5-year)
George et al. 82 - CEC/TBI-Mel RT, 13 Cis RA 64% (5-year) 54%(5-year)-PFS
Our Data 11 PR, PD Bu-Mel/CEM RT, 13 Cis RA, tandem MIBG 54.5% (3-year) 39% (3-year)
CR: Complete response, PR: Partial response, MR: Mixed response, PD: Progressive disease, TT: Thiotepa, Bu: Busulfan, Mel: Melphalan, TBI: Total body irradiation, CEM: Carboplatin, etoposide, melphalan, CEC: Carboplatin, etoposide, cyclophosphamide, Cy: Cyclophosphamide, RT: Radiotherapy, 13 Cis RA: 13 Cis retinoic acid, MIBG: Iodine 131 (131I) metaiodobenzylguanidine, IT: Immunotherapy, PFS: Progression free survival, OS: Overall survival, EFS: Event free survival
947
Yılmaz et al. Transplantation for ultra high-risk neuroblastoma patientsJ Health Sci Med 2021; 4(6): 943-948
of this regimen, the combination of chemotherapy and stem cell rescue is being considered within COG for the refractory neuroblastoma patients (29). As a result, our study suggested that tandem MIBG and tandem autologous HSCT combination might indeed improve the EFS of the ultra high-risk refractory patients.
The limitations of the study were that it is retrospective design and the sample is relatively small. In addition, the patients were not given cytokine and immunotherapy/anti-GD2 antibodies. Survivors should be evaluated for any toxicity.
CONCLUSION This study is the only case series study with both tandem high-dose MIBG and tandem autologous HSCT transplantation in refractory NBL patients without cytokine and immunotherapy. Tandem transplantation and MIBG therapy in ultra high-risk NBL cases remain promising with acceptable toxicity. Our data show that a significant contribution may be added to the survival of ultra high-risk NBL patients based on this dual protocol. Adding immunotherapy to this treatment protocol and combining it with new treatment modalities such as anaplastic lymphoma kinase (ALK), which also takes into account genetic characteristics, may increase survival and EFS rates.
ETHICAL DECLARATIONSEthics Committee Approval: The study was carried out with the permission of Erciyes University Faculty of Medicine Clinical Researchs Ethics Committee (Date: 08.07.2020, Decision No: 2020/371).Informed Consent: Because the study was designed retrospectively, no written informed consent form was obtained from patients.Referee Evaluation Process: Externally peer-reviewed. Conflict of Interest Statement: The authors have no conflicts of interest to declare. Financial Disclosure: The authors declared that this study has received no financial support. Author Contributions: All of the authors declare that they have all participated in the design, execution, and analysis of the paper, and that they have approved the final version. Acknowledgment: The authors thank Prof. Dr Mehmet Akif Özdemir, Prof. Dr. Türkan Patıroğlu for their valuable contributions to the study.
REFERENCES1. Swift CC, Eklund MJ, Kraveka JM, Alazraki AL. Updates in
Diagnosis, Management, and Treatment of Neuroblastoma. Radiographics 2018; 38: 566-80.
2. Schwab M, Shimada H, Joshi V, Brodeur GM. Neuroblastic tumours of adrenal gland and sympathetic nervous system. In: Pathology and Genetics. Tumours of the Nervous system, Kleihues P, Cavenee WK (eds). IARC Press: Lyon; 2000: 153-61.
3. Smith V, Foster J. High-risk neuroblastoma treatment review. Children (Basel) 2018; 5: 114.
4. Almandoz JP, Xie L, Schellinger JN, et al. Impact of COVID-19 stay-at-home orders on weight-related behaviours among patients with obesity. Clin Obes 2020; 10: e12386.
5. Kebudi R. Turkish Pediatric Oncology Group. Pediatric oncology in Turkey. J Pediatr Hematol Oncol 2012; 34: S12-4.
6. Louis CU, Shohet JM. Neuroblastoma: molecular pathogenesis and therapy. Annu Rev Med 2015; 66: 49-63.
7. Zhang Y, Huang D, Zhang W, et al. Clinical characteristics of infant neuroblastoma and a summary of treatment outcome. Oncol Lett 2016; 12: 5356-62.
8. Park JR, Kreissman SG, London WB, et al. Effect of tandem autologous stem cell transplant vs single transplant on event-free survival in patients with high-risk neuroblastoma: a randomized clinical trial. JAMA 2019; 322: 746-55.
9. Pinto NR, Applebaum MA, Volchenboum SL, et al. Advances in risk classification and treatment strategies for neuroblastoma. J Clin Oncol 2015; 33: 3008-17.
10. Smith V, Foster J. High-risk neuroblastoma treatment review. Children (Basel) 2018; 5.
11. Aygün Z, Batur Ş, Emre Ş, Celkan T, Özman O, Comunoglu N. Frequency of ALK and GD2 expression in neuroblastoma. Fetal Pediatr Pathol 2019; 38: 326-34.
12. Morgenstern DA, Bagatell R, Cohn SL, et al. The challenge of defining "ultra-high-risk" neuroblastoma. Pediatr Blood Cancer 2019; 66: e27556.
13. Berthold F, Spix C, Kaatsch P, Lampert F. Incidence, survival, and treatment of localized and metastatic neuroblastoma in Germany 1979-2015. Paediatr Drugs 2017; 19: 577-93.
14. Park JR, Kreissman SG, London WB, et al. A phase III randomized clinical trial (RCT) of tandem myeloablative autologous stem cell transplant (ASCT) using peripheral blood stem cell (PBSC) as consolidation therapy for high-risk neuroblastoma (HR-NB): A Children's Oncology Group (COG) study. J Clin Oncol 2016; 34.
15. Kushner BH, Ostrovnaya I, Cheung IY, et al. Lack of survival advantage with autologous stem-cell transplantation in high-risk neuroblastoma consolidated by anti-GD2 immunotherapy and isotretinoin. Oncotarget 2016; 7: 4155.
16. Kushner BH, Cheung NK, LaQuaglia MP, et al. International neuroblastoma staging system stage 1 neuroblastoma: a prospective study and literature review. J Clin Oncol 1996; 14: 2174-80.
17. Brodeur GM, Pritchard J, Berthold F, et al. Revisions of the international criteria for neuroblastoma diagnosis, staging, and response to treatment. J Clin Oncol 1993; 11: 1466-77.
18. Elborai Y, Hafez H, Moussa EA, et al. Comparison of toxicity following different conditioning regimens (busulfan/melphalan and carboplatin/etoposide/melphalan) for advanced stage neuroblastoma: Experience of two transplant centers. Pediatr Transplant 2016; 20(2): 284-9.
19. Bansal D, Totadri S, Chinnaswamy G, et al. Management of neuroblastoma: ICMR consensus document. Indian J Pediatr 2017; 84: 446-55.
20. Matthay KK, Tan JC, Villablanca JG, et al. Phase I dose escalation of iodine-131-metaiodobenzylguanidine with myeloablative chemotherapy and autologous stem-cell transplantation in refractory neuroblastoma: a new approaches to Neuroblastoma Therapy Consortium Study. J Clin Oncol 2006; 24: 500-6.
21. Qayed M, Chiang KY, Ricketts R, et al. Tandem stem cell rescue as consolidation therapy for high-risk neuroblastoma. Pediatr Blood Cancer 2012; 58: 448-52.

948
Yılmaz et al. Transplantation for ultra high-risk neuroblastoma patients J Health Sci Med 2021; 4(6): 943-948
22. Wawrzyniak-Dzierżek E, Gajek K, Rybka B, et al. Feasibility and safety of treosulfan, melphalan, and thiotepa-based megachemotherapy with autologous or allogeneic stem cell transplantation in heavily pretreated children with relapsed or refractory neuroblastoma. Biol Blood Marrow Transplant 2019; 25: 1792-7.
23. Pasqualini C, Dufour C, Goma G, Raquin MA, Lapierre V, Valteau-Couanet D. Tandem high-dose chemotherapy with thiotepa and busulfan-melphalan and autologous stem cell transplantation in very high-risk neuroblastoma patients. Bone Marrow Transplant 2016; 51: 227-31.
24. Suh JK, Koh KN, Min SY, et al. Feasibility and effectiveness of treatment strategy of tandem high-dose chemotherapy and autologous stem cell transplantation in combination with 131 I-MIBG therapy for high-risk neuroblastoma. Pediatr Transplant 2020; 24: e13658.
25. Lee JW, Lee S, Cho HW, et al. Incorporation of high-dose 131I-metaiodobenzylguanidine treatment into tandem high-dose chemotherapy and autologous stem cell transplantation for high-risk neuroblastoma: results of the SMC NB-2009 study. J Hematol Oncol 2017; 10: 108.
26. Sung KW, Son MH, Lee SH, et al. Tandem high-dose chemotherapy and autologous stem cell transplantation in patients with high-risk neuroblastoma: results of SMC NB-2004 study. Bone Marrow Transplant 2013; 48: 68-73.
27. George RE, Li S, Medeiros-Nancarrow C, et al. High-risk neuroblastoma treated with tandem autologous peripheral-blood stem cell-supported transplantation: long-term survival update. J Clin Oncol 2006; 24: 2891-6.
28. Erbey F, Atay D, Akçay A, Öztürk G. Autologous cord blood transplantation in neuroblastoma. Turk J Pediatr 2015; 57: 210-1.
29. Grupp SA, Asgharzadeh S, Yanik GA. Neuroblastoma: issues in transplantation. Biol Blood Marrow Transplant 2012; 18: S92-100.

HEALTH SCIENCESMEDICINE
Original Article
J Health Sci Med 2021; 4(6): 949-953
This work is licensed under a Creative Commons Attribution 4.0 International License.
DOI: 10.32322/jhsm.985774
Received: 22.08.2021 Accepted: 05.09.2021Corresponding Author: Ökkeş Hakan Miniksar, [email protected]
The relationship between preoperative anxiety level, ABO blood types and birth outcomes in cesarean sections
Ökkeş Hakan Miniksar1, Dilşad Yıldız Miniksar2, Erol Toy31Yozgat Bozok University, Faculty of Medicine, Department of Anesthesiology and Reanimation, Yozgat, Turkey 2Yozgat Bozok University, Faculty of Medicine, Department of Child and Adolescent Psychiatry, Yozgat, Turkey3Karabük University, Karabuk University Education Research Hospital, Department of Anesthesiology and Reanimation, Karabük, Turkey
Cite this article as: Miniksar ÖH, Miniksar DY, Toy E. The relationship between preoperative anxiety level, ABO blood types and birth outcomes in cesarean sections. J Health Sci Med 2021; 4(6): 949-953.
ABSTRACT Objective: There is a relationship between ABO blood groups, which are part of the genetic phenotype, and various psychiatric diseases. Our primer aim in this study is to examine the relationship between ABO blood groups and preoperative anxiety (POA) levels in patients undergoing elective cesarean section. The secondary aim is to determine the relationship between POA levels and birth outcomes in pregnant women.Material and Method: A total of 132 patients with different ABO blood groups who were scheduled for elective cesarean section under spinal anesthesia between August 2020 and July 2021 at the Medical Faculty Hospital were included in this prospective observational study. State Anxiety Inventory scores (SAI) were used to assess preoperative anxiety in groups A, B, AB, and O. Birth outcomes (fetal birth weight, birth sex and APGAR scores at the 1st and 5th minutes) were recorded.Results: There were 55 people (41.7%) in the A blood group, 43 people (32.6%) in the O blood group, 25 people (18.9%) in the B blood group, 9 people (6.8%) in the AB blood group. A total of 73/132 (55.3%) patients with SAI score >40 were identified. There was no significant difference in mean SAI scores in A, B, AB and O blood groups (p=0.531). Fetal birth weight was found to be lower in patients with high SAI scores (p=0.044). Conclusion: There was no relationship between ABO blood groups and preoperative anxiety and birth outcomes in elective cesarean sections under spinal anesthesia, but low fetal birth weight was found in pregnant women with high anxiety. More studies with larger sample sizes in the future are needed to confirm the results of our study.
Keywords: ABO blood types, preoperative anxiety, birth outcomes, spinal anaesthesia, caesarean section
Ana Metin-Alt bilgi Arası 5mm
Cite-Öz arası 5mm
Başlık-Yazarlar arası 12mm
Yazar-Kurum arası 2,5 mm
Kurum-Cite arası 5mm
Öz-Abstract arası 7,5mm
INTRODUCTION Antenatal preoperative anxiety (POA) is a common problem that can cause negative physiological responses in pregnant women due to pain and fear of delivery. POA is more common in cesarean section, which is the most common obstetric surgery (1-4).
High-level anxiety symptoms before cesarean section cause an increase in catecholamine levels and thus may result in increased heart rate, blood pressure, and cardiac stimulation (1,2,5). However, many studies have shown that maternal stress causes many negative clinical outcomes such as low birth weight and preterm delivery (5-7). For these reasons, predetermining the factors that trigger POA by clinicians can reduce these negative outcomes.
While POA level varies according to age, gender, type of operation and negative operation experience, genetic
factors also affect anxiety level (8). Multifactorial factors play a role in the etiology of many psychiatric diseases. These factors are generally genetic and environmental factors. Studies examining the genetics of psychiatric diseases have shown that gene-environment interaction is determinant, especially in anxiety disorders (9). Blood group types are genetically inherited from parents and ancestors (9,10). Observational studies investigating ABO blood types, preoperative anxiety and phenotypic factors are limited in the literature. To the best of our knowledge, a study examining ABO blood types and preoperative anxiety was found in the literature (11). In this study, POA levels of patients with AB blood group were found to be higher than those with other blood groups (11).

950
Miniksar et al. Anxiety, ABO blood types and birth outcomes in cesarean section J Health Sci Med 2021; 4(6): 949-953
When the literature is examined, it has been found that ABO blood groups are associated with many clinical conditions, including diabetes, various types of cancer, and cardiovascular diseases (12,13). Thus, it reveals that ABO blood group types may be associated with some diseases. For these reasons, we hypothesized in this study that there is a relationship between ABO blood types and preoperative anxiety levels in CS deliverys, which is a stressful surgical procedure.
The main aim of current study is to evaluate the relationship between POA levels according to ABO blood groups in patients undergoing elective cesarean section. The secondary aim is to determine the relationship between POA levels and birth outcomes in pregnant women.
MATERIAL AND METHOD
Study DesignThis prospective cross-sectional study was conducted at Yozgat Bozok University Faculty of Medicine Hospital (Yozgat, Turkey) between August 2020 and July 2021. The study was carried out with the permission of Yozgat Bozok University Clinical Research Ethics Committee (Date: 29.07.2020, Decision No: 2017-KAEK-189_2020.07.29_07). All procedures were carried out in accordance with the ethical rules and the principles of the Declaration of Helsinki.
ParticipantsA total of 132 pregnant women between the ages of 18-45 whose gestational age was 36-41 weeks, who gave written informed consents and who underwent elective cesarean section with medical indications under spinal anesthesia were included in the study. The numbers of the A, O, B and AB blood type groups were 55, 43, 88 and 9, respectively. Patients with a known psychiatric or neurological disease, drug users, patients who did not have the mental competence to understand the survey questions or were illiterate, patients scheduled to undergo an emergency cesarean operation, urgent patients were not included in the study.
ProceduresPreoperatif anxiety levels in patients who were referred to an anesthesia outpatient clinic due to elective cesarean section were evaluated using the State Anxiety Inventory (SAI). Maternal demographic and medical data (smoking status, educational level, employment status, anesthesia history) were recorded for prenatal evaluation by anesthetists. The gestational week was calculated based on the ultrasound imaging performed during the first trimester by the obstetrics department. Following delivery, fetal birth weight, birth sex and APGAR scores
at the 1st and 5th minutes were recorded. The health status of the newborns was evaluated using the 10-point APGAR score, which evaluates five parameters (heart rate, respiratory effort, muscle tone, reflex irritability and color) with a score from 0 to 2. A total score of 7 or higher suggests that the newborn is in good health, while a total score of 4 to 6 means the newborn needs medical attention, and scores of 3 or lower indicate a critical condition (14).
Preoperative anxiety assessmentThe SAI scale (20 items) determines how the individual feels at a certain time and under certain conditions. The SAI scale is scored between 20 and 80 points, where higher scores indicate a higher level of anxiety. The SAI is widely used to assess anxiety in pregnancy, and their validity and reliability have been demonstrated (1). In the evaluation of the scale score, 40 points was considered the threshold value, as is common in the literature (1), scores below 40 were classified as ‘low to moderate’ anxiety, and scores above 40 were classified as ‘high’ anxiety.
Statistical AnalysisData were analyzed using SPSS v.20.0 (SPSS Inc., Chicago, IL, USA) software. Data were expressed as mean±standard deviation. The normality of distribution was checked using the Kolmogorov–Smirnov test and histograms. Normally distributed continuous variables are reported as mean ± standard deviation (SD), non-normally distributed variables as median [interquartile range], and categorical variables as counts (%). Differences in non-normally distributed variables between two independent groups were assessed using the non-parametric Mann–Whitney U-test. A one-way ANOVA, chi-square test, or Kruskal-Wallis pairwise comparisons were used to identify the difference among the A, B, AB, and O blood type groups in some variables. All comparative analyzes were 2-tailed, and a P-value of less than 0.05 was considered to be statistically significant.
RESULTS Of the 132 female patients included in the study, 41.7% (n=55) A, 32.6% (n=43) O, 18.9% (n=25) B, and 6.8% (n=9) AB were patients with blood group. The mean age of blood groups A, B, AB and O was 28.8±6.0, 31.6±5.8, 31.5±7.3 and 29.3±5.9, respectively. Blood groups did not differ significantly according to sociodemographic (age, gravity, parity, gestational age, smoking status, education level, employment status, anesthesia history) and clinical characteristics. Fetal birth weight was similar between groups (p=0.456). There was no difference between ABO blood groups according to birth sex (p=0.230). The 1st min and 5th min APGAR scores were similar between the groups (0.747, 0.539, respectively) (Table 1).

951
Miniksar et al. Anxiety, ABO blood types and birth outcomes in cesarean sectionJ Health Sci Med 2021; 4(6): 949-953
SAI score was used to assess preoperative anxiety in patients with blood groups A, B, AB, and O. Then, the relationship of different blood groups with SAI scores was examined. The mean SAI score of the patients was 42.6±11.0. A total of 73/132 (55.3%) patients with SAI score >40 were identified. The number of patients with high preoperative anxiety did not differ according to ABO blood groups (p=0.921). There was no significant difference in mean SAI scores in A, B, AB and O blood groups (p=0.531) (Table 2). The lowest SAI score was found in O blood group (41.5±10.7) and the highest SAI score was found in B blood group (45.4±11.9).
Detailed information about the differences between pregnant women with and without high anxiety is presented in Table 3. There was no statistically significant difference between maternal age and gestational week and POA groups (p=0.367, p=0.436, respectively). Fetal birth weight was found to be lower in patients with high SAI scores (p=0.044) (Table 3). However, there was no significant correlation between SAI scores and APGAR scores (respectively, p=0.055, p=0.066) (Table 3).
DISCUSSIONAlthough many studies have investigated the relationship between various psychiatric diseases and blood groups, the relationship between POA and ABO blood groups has not been studied in pregnant women with high anxiety levels who will have a cesarean delivery. The
primary aim of this prospective, observational study was that preoperative anxiety scores of pregnant women in cesarean deliveries were associated with ABO blood group types; The secondary aim was to test the hypothesis that POA scores affect birth outcomes. Several important findings were identified in the current study. Firstly; POA levels of pregnant women did not differ according to ABO blood group types. Secondly; Lower fetal birth weight was found in pregnant women with high POA levels. Finally; There was no significant correlation between POA levels and APGAR scores.
Many studies have shown that genetic factors such as blood group antigens are associated with the development and severity of some diseases (diabetes, cardiovascular diseases, endocrine diseases) (12,13,15). It has been determined that genes controlling blood group antigen
Table 1. Demographic and clinical characteristics of patients according to ABO blood groupsVariables A (n= 55) B (n= 25) AB (n= 9) O (n= 43) Total (n=132) P valueAge (years) 28.8±6.0 31.6±5.8 31.5±7.3 29.3±5.9 29.7±6.0 0.198a
Gravity 2 [2 to 3] 3 [2 to 4] 3 [2 to 4] 3 [2 to 4] 3 [2 to 4] 0.296b
Parity 1 [1 to 2] 2 [1 to 2] 2 [1 to 2] 2 [1 to 3] 1 [1 to 2] 0.280b
Gestational age (weeks) 38 [38 to 39] 38 [38 to 39] 38 [38 to 39] 38 [38 to 39] 38 [38 to 39] 0.992b
APGAR score 1st min 8 [8 to 9] 8 [7 to 9] 8 [7 to 9] 9 [7 to 9] 8 [8 to 9] 0.747b
APGAR score 5th min 9 [9 to 10] 9 [8 to 10] 10 [9 to 10] 10 [9 to 10] 9 [9 to 10] 0.539b
Fetal birth weight (grams) 3175±454 3327±373 3283±432 3287±480 3248±447 0.456a
Birth sex Male 36 (65.5) 11 (44) 4 (44.5) 22 (51.2) 73 (55.4) 0.230*Female 19 (34.5) 14 (56) 5 (55.5) 21 (48.8) 59 (44.6)
Smoking status, n (%)
Yes 14 (25.5) 8 (0.32) 1 (11.2) 15 (34.9) 38 (28.7) 0.462*No 41 (74.5) 17 (0.68) 8 (88.8) 28 (65.1) 94 (71.3)
Educational level
Primary school 20 (36.3) 8 (32) 3 (33.3) 18 (39.5) 49 (36.3)0.906#Secondary school 26 (47.2) 10 (40) 4 (44.4) 17 (39.5) 57 (43.1)
University 9 (16.3) 7 (28) 2 (22.3) 8 (18.6) 26 (19.6)Employment status Employed 21 (38.1) 10 (40) 3 (33.4) 14 (32.5) 48 (36.4) 0.913*
Anesthesia history
Yes 36 (65.5) 16 (64) 5 (55.5) 30 (69.7) 87 (66.0) 0.859*No 19 (34.5) 9 (36) 4 (44.5) 13 (30.3) 45 (34.0)
Values are quoted as the mean ± SD and median [interquartile range] for continuous variables and percentage for categorical variable. aOne-way ANOVA test and bKruskal-Wallis test were used to identify the difference among the A, B, AB, and O blood type groups in some variables. *Chi-square Test; #Fisher’s exact test. SAI, State Anxiety Inventory.
Table 2. Comparison of patients' SAI scores according to ABO blood groupsVariables A (n= 55) B (n= 25) AB (n= 9) O (n= 43) Total (n=132) P valueSAI score 42.1±10.9 45.4±11.9 43.4±11.0 41.5±10.7 42.6±11.0 0.531a
Patients with SAI score >40, n (%) 31 (56.4) 15 (60.0) 5 (55.6) 22 (51.2) 73 (55.3) 0.921#
Values are quoted as the mean ± SD for continuous variable and percentage for categorical variable. aOne-way ANOVA test was used to identify the difference among the A, B, AB, and O blood type groups in SAI score. #Fisher’s exact test, SAI: State Anxiety Inventory
Table 3. Characteristics of the mother and the newborn according to preoperative anxiety groups
Variables Patients with SAI score <40
Patients with SAI score >40
P value
Maternal characteristicsAge (years) 30 ± 6 29 ± 6 0.367a
Gestational age (weeks) 38 [38 to 39] 38 [38 to 39] 0.436b
Newborn characteristicsFetal birth weight (grams) 3327 ± 468 3187 ± 421 0.044a
APGAR score 1st 9 [8 to 9] 8 [7 to 9] 0.055b
APGAR score 5th 10 [9 to 10] 9 [9 to 10] 0.066b
Values are quoted as the mean ± SD and median [interquartile range] for continuous variables. aIndependent sample t test, bMann Whitney U test, SAI: State Anxiety Inventory.

952
Miniksar et al. Anxiety, ABO blood types and birth outcomes in cesarean section J Health Sci Med 2021; 4(6): 949-953
expression are associated with genes encoding dopamine beta-hydroxylase, catechol-O-methyl-transferase and argininosuccinate synthetase activities that regulate neuropsychiatric responses. It has even been claimed that genes encoding ABO blood group antigens control dopamine beta-hydroxylase activity (15,16). For these reasons, the potential role of the ABO blood group in psychiatric diseases (schizophrenia, bipolar and unipolar depression) and personality traits, which are thought to be predominantly inherited, has been investigated in various studies, but conflicting results have been found (17-19).
When the literature was examined, in a study examining the relationship between dental anxiety and blood group in children, the highest level of dental anxiety was found in those with AB blood group (20). Similarly, Feng Xu et al. (11), preoperative anxiety levels were found to be higher in people with AB blood type. In another study examining blood groups and stress levels, it was found that pathological and general stress levels were found in people with the lowest O blood group (21). Similarly, in the current study, the mean SAI score was found in the lowest O blood group (41.5±10.7) and the highest in B blood group (45.4±11.9). However, no significant relationship was found between the POA levels of pregnant women and ABO blood groups. The reason for these results may be related to the effect of many variables on POA, including surgical factors other than blood groups.
In the literature, there are studies reporting a relationship between maternal ABO blood groups and adverse birth outcomes (most commonly preeclampsia, venous thromboembolism, chorioamnionitis, and postpartum hemorrhage) (22,23). Premature birth and low birth weight are among these negative outcomes associated with blood type. In a recent study, it was reported that pregnant women with maternal B blood group had lower fetal birth weight, but there was no relationship between preeclampsia and gestational week and blood groups (22). In the same study, the authors reported that fetal growth may be adversely affected as a result of placental insufficiency due to the etiological role of blood groups in arterial thrombosis. However, in this study, the authors did not analyze other adverse pregnancy risk factors such as gestational diabetes mellitus, smoking, chorioamnionitis and venous thromboembolism (22). According to the results of our study, no significant difference was found between ABO blood groups and fetal birth weight, APGAR scores and gestational week. This issue, which are still controversial, need to be investigated with further studies.
Another important result in our study is that pregnant women with high POA levels have lower fetal birth weights and similar APGAR scores. POA, which is more common in cesarean deliveries, has been shown to
cause many adverse birth outcomes such as premature birth, low birth weight, and low APGAR scores (5-7). It has been reported that the autonomic stress response triggered by maternal anxiety may cause negative fetal outcomes due to uterine artery vasoconstriction (7,24). On the other hand, although there are studies reporting that there is no relationship between maternal anxiety and APGAR scores (25), there are also studies reporting that maternal anxiety causes low APGAR scores (4,7). There is still no consensus on whether there is a true relationship between POA and adverse birth outcomes.
This study has some strengths and limitations. One of its strengths is that, to the best of our knowledge, it is the first original study in the literature to investigate the relationship between AB0 blood groups and preoperative anxiety in pregnant women. Other strengths are that the study is prospective and blood groups are obtained from data of the Hospital Blood Bank, not verbally. The limitations are; rare blood groups require more patients due to the small number of patients, and Rh sub blood groups are not included in the study.
CONCLUSIONWe planned this study with the hypothesis that there may be a relationship between ABO blood groups, which are known to be associated with many psychiatric disorders and various personality types, and preoperative anxiety. As a result, it was determined that there was no relationship between ABO blood groups and preoperative anxiety and birth outcomes in cesarean section, but low fetal birth weight was found in pregnant women with high anxiety. For this reason, the identification of pregnant women with high preoperative anxiety levels and removing anxiety may contribute to the prevention of negative birth results to the fetus such as low birth weight. However, we think that our results are interesting and further studies are needed in different races and geographical regions to clarify these results.
ETHICAL DECLARATIONSEthics Committee Approval: The study was carried out with the permission of Yozgat Bozok University Clinical Researchs Ethics Committee (Date: 29.07.2020, Decision No: 2017-KAEK-189_2020.07.29_07).
Informed Consent: All patients signed the free and informed consent form.
Referee Evaluation Process: Externally peer-reviewed.
Conflict of Interest Statement: The authors have no conflicts of interest to declare.
Financial Disclosure: The authors declared that this study has received no financial support.

953
Miniksar et al. Anxiety, ABO blood types and birth outcomes in cesarean sectionJ Health Sci Med 2021; 4(6): 949-953
Author Contributions: All of the authors declare that they have all participated in the design, execution, and analysis of the paper, and that they have approved the final version.
REFERENCES1. Akildiz M, Aksoy Y, Kaydu A, Kaçar CK, Şahin ÖF, Yıldırım ZB.
Effect of anaesthesia method on preoperative anxiety level in elective caesarean section surgeries. Turk J Anaesthesiol Reanim 2017; 45: 36-40.
2. Badner NH, Nielson WR, Munk S, Kwiatkowska C, Gelb AW. Preoperative anxiety: detection and contributing factors. Can J Anaesth 1990; 37: 444–7.
3. Sun Y, Huang K, Hu Y, et al. Pregnancy-specific anxiety and elective cesarean section in primiparas: A cohort study in China. PLoS One 2019; 14: 1–13.
4. Horsch A, Gilbert L, Lanzi S, Kang JS, Vial Y, Puder JJ. Prospective associations between maternal stress during pregnancy and fasting glucose with obstetric and neonatal outcomes. J Psychosom Res 2019; 125: 109795.
5. Van Den Bergh BRH, Mulder EJH, Mennes M, Glover V. Antenatal maternal anxiety and stress and the neurobehavioural development of the fetus and child: Links and possible mechanisms. A review. Neurosci Biobehav Rev 2005; 29: 237–58.
6. O Pimenta BS, Y Nomura RM, Nakamura MU, Moron AF. Maternal anxiety and fetal movement patterns in late pregnancy. J Matern Neonatal Med 2016; 29: 2008–12.
7. Ding XX, Wu Y Le, Xu SJ, et al. Maternal anxiety during pregnancy and adverse birth outcomes: A systematic review and meta-analysis of prospective cohort studies. J Affect Disord 2014; 159: 103–10.
8. Theunissen M, Peters ML, Bruce J, Gramke HF, Marcus MA. Preoperative anxiety and catastrophizing: A systematic review and meta-analysis of the association with chronic postsurgical pain. Clin J Pain 2012; 28: 819–41.
9. Fogelman N, Canli T. Early life stress, physiology, and genetics: a review. Front Psychol 2019; 10: 1668.
10. De Gregori M, Diatchenko L, Ingelmo PM, et al. Human genetic variability contributes to postoperative morphine consumption. J Pain 2016; 17: 628–36.
11. Xu F, Yin JW, Xiong EF, et al. Correlation between preoperative anxiety and ABO blood types: Evidence from a clinical cross-sectional study. Dis Markers 2019; ID: 1761693 (doi: 10.1155/2019/1761693).
12. Franchini M, Mengoli C, Lippi G. Relationship between ABO blood group and pregnancy complications: A systematic literature analysis. Blood Transfus 2016; 14: 441–8.
13. Stakišaitis D, Juknevičienė M, Ulys A, et al. ABO blood group polymorphism has an impact on prostate, kidney and bladder cancer in association with longevity. Oncol Lett 2018; 16: 1321–31.
14. Thorngren-Jerneck K, Herbst A. Low 5-minute Apgar score: A population-based register study of 1 million term births. Obstet Gynecol 2001; 98: 65–70.
15. Anstee DJ. The relationship between blood groups and disease. Blood 2010; 115: 4635–43.
16. Wilson AF, Elston RC, Siervogel RM, Tran LD. Linkage of a gene regulating dopamine-β-hydroxylase activity and the ABO blood group locus. Am J Hum Genet 1988; 42: 160–6.
17. Irvıne DG, Mıyashıta H. Blood types in relation to depressions and schizophrenia: a preliminary report. Can Med Assoc J 1965; 92: 551–4.
18. Parker JB, Theılıe A, Spielberger CD. Frequency of blood types in a homogeneous group of manic-depressıve patients. BJP 1961; 107: 936-42.
19. Tsuchimine S, Saruwatari J, Kaneda A, Yasui-Furukori N. ABO blood type and personality traits in healthy Japanese subjects. PLoS One 2015; 10: 1–10.
20. Kakathkar S, Srinivasan I, Setty J, Akhil P, Suting C, Nayana K. Correlation between A, B, and O blood group system and dental anxiety in children of age 6–12 years in East Bengaluru. J Int Clin Dent Res Organ 2020; 12: 127–31.
21. Alataş M. Kan grupları ve stres düzeyi arasindaki ilişkiler. Int J Innov Eng Appl 2018; 2: 50–2.
22. Beyazıt F, Pek E, Güngör AÇ, Gencer M, Unsal MA. Effect of maternal ABO blood type on birth weight and preeclampsia. Int J Reprod Contraception Obstet Gynecol 2017; 6: 2164.
23. Aghasadeghi F, Saadat M. Association between ABO and Rh blood groups and risk of preeclampsia: A case-control study from Iran. Open Access Maced J Med Sci 2017; 5: 173–6.
24. Sjöström K, Valentin L, Thelin T, Maršál K. Maternal anxiety in late pregnancy and fetal hemodynamics. Eur J Obstet Gynecol Reprod Biol 1997; 74: 149–55.
25. Andersson L, Sundström-Poromaa I, Wulff M, Åström M, Bixo M. Neonatal outcome following maternal antenatal depression and anxiety: A population-based study. Am J Epidemiol 2004; 159: 872–81.

HEALTH SCIENCESMEDICINE
Original Article
J Health Sci Med 2021; 4(6): 954-959
This work is licensed under a Creative Commons Attribution 4.0 International License.
DOI: 10.32322/jhsm.990487
Received: 03.09.2021 Accepted: 14.09.2021Corresponding Author: Şadiye Altun Tuzcu, [email protected]
Is there a relationship between the liver SUVmax values in FDG-PET/CT imaging and non-alcoholic fatty liver disease score?
Şadiye Altun Tuzcu1, Fatih Güzel1, Ali Uyar1, İhsan Kaplan2, Yunus Güzel2, Bekir Taşdemir1, Kendal Yalçın3
1Dicle University, Medical Faculty, Department of Nuclear Medicine, Diyarbakır, Turkey2Diyarbakır Gazi Yaşargil Research and Education Hospital, Department of Nuclear Medicine, Diyarbakır, Turkey3Dicle University, Medical Faculty, Department of Gastroenterology and Hepatology, Department of Internal Medicine, Diyarbakır, Turkey
Cite this article as: Altun Tuzcu Ş, Güzel F, Uyar A, et al. Is there a relationship between the liver SUVmax values in FDG-PET/CT imaging and non-alcoholic fatty liver disease score?. J Health Sci Med 2021; 4(6): 954-959.
ABSTRACTAim: Non-alcoholic fatty liver disease is one of the most common causes of liver disease worldwide with an estimated prevalence of 20%–30% in adult population. Following the widespread utilization of PET in the evaluation of malignant diseases, F-18 FDG have also been reported to be used in non-malignant processes. The aim of this study is to elucidate whether the FDG SUVmax values determined by PET/CT in different adipose tissue samples and the liver change according to NAFLD score. During our desktop research we did not find any published article therefore, it is the first study in this field.Materials and Method: A total of 230 patients who applied to Dicle University Faculty of Medicine, Department of Nuclear Medicine between March and April 2020 and who have been conducted FDG PET/CT for diagnosis, staging, restaging and evaluation of response to treatment were included in the study. Patients were divided into three groups according to their NAFLD score as patients with fibrosis score <-1,455 (the group in which severe fibrosis was excluded) as group-1, and those with NAFLD score between -1.455-0.676 (inter-mediate score) as group-2. and patients with a NAFLD score >0.676 (severe fibrosis group) group-3. Results: Liver SUVmax levels were found to be significantly higher in group-3 than group-1. No significant difference was observed between group-2 and group-3. SUVmax levels measured from supracalvicular region, posterior scapular region and mesentery region were not different from each other in all three groups. Glucose-corrected liver SUVglu levels were found to be significantly lower in group-1 than group-3 (p=0.001). In terms of liver SUVglu levels, group-1 and group-2 and group-2 and group-3 did not differ statistically from each other. Supracalvicular SUVglu, posterior scapular SUVglu and mesenteric SUVglu groups were not different from each other.Conclusions: The most important result of this study could be elaborated with increased FDG uptake in NAFLD. Liver FDG uptake increases as the severity of NAFLD increases as demonstrated by the NAFLD score.
Keywords: SUVmax, FDG-PET/CT, nonalcoholic steatohepatitis score
Ana Metin-Alt bilgi Arası 5mm
Cite-Öz arası 5mm
Başlık-Yazarlar arası 12mmv
Yazar-Kurum arası 2,5 mmvcv
Kurum-Cite arası 5mm
Öz-Abstract arası 7,5mmvc
INTRODUCTIONNon-alcoholic fatty liver disease (NAFLD) is one of the most common causes of liver disease worldwide. NAFLD is a broad terminology that includes simple fatty liver spectrum of chronic liver disease that progresses to non-alcoholic steatohepatitis (NASH), fibrosis, cirrhosis and end-stage liver (1-4). The excessive accumulation of triglycerides and cholesterol in the liver is classified as alcoholic fatty liver disease or non–alcohol-related fatty liver disease (NAFLD). NAFLD is the most common
chronic liver condition in the developed countries, with an estimated prevalence of 20%–30% in adult population (5,6).
PET/CT technology is a non-invasive imaging method commonly utilized as it provides important metabolic and functional data and high spatial resolution. Fluorine (F)-18, a radiopharmaceutical glucose analogue is a labeled Fluoro-2-deoxy-D-glucose (FDG) compound is mostly used in routine practice (7). The sensitivity and

955
Altun Tuzcu et al. Liver SUVmax values on FDG-PET/CT and nonalcoholic steatohepatitis J Health Sci Med 2021; 4(6): 954-959
specificity of FDG PET/CT is quite high in metastatic liver lesions and other possible metastatic foci due to the whole body scanning advantage (8). Lymphocytes involved in infectious and inflammatory events, such as neutrophils and macrophages increased intracellular hexokinase and surface glucose transporter present a similar pattern to malignant cells and show affinity for F-18 FDG (7,8) .
Adenosine triphosphate located inside the inflammatory cells phosphorylates FDG and increases concentration cytoplasmic conversion of FDG to FDG 6-phosphate. However, as FDG-6-phosphate is not the convenient substrate for glucose-6-isomerase enzyme it cannot enter into metabolic reactions and accumulates inside the cells. The accumulation of FDG due to increased glucose transport activity during inflammatory processes on glucose metabolism and the amount of FDG accumulated derives information about the pathological areas showing impaired glucose metabolism in three dimensional display (9,10).
SUV is a semiquantitative measurement which corresponds to measured activity normalized for body weight/surface area and injected dose (11, 12). The formula for calculation of SUV is region of interest (ROI) activity (mCi/mL) x body weight (g) / injected dose (mCi). SUV is a proportional value without units, rather than being an absolute value in characterization of lesions, so for the quantification of tumour FDG uptake there was always a need for a site in the body which is presumed to have normal FDG uptake (13,14). If the 18F-FDG uptake in the target lesion is greater than in the liver in terms of SUV, the hypermetabolic focus would be considered abnormal (15).
Study HypothesisThe aim of this study is to elucidate whether the FDG SUVmax values determined by PET/CT in different adipose tissue samples of the liver and body change according to NAFLD score.
Fatty liver has been elaborated with different methods in previous studies. In this research we preferred to proceed by calculating the NAFLD score, considering it as a practical method. During our desktop research we did not find any published article therefore, it is the first study in this field.
MATERIAL AND METHODThe study was carried out with the permission of Dicle University Medical Faculty Non-interventional Studies Ethics Committee (Date: 2021, Decision No: 358). All procedures were carried out in accordance with the ethical rules and the principles of the Declaration of Helsinki.
A total of 230 patients who applied to Dicle University Faculty of Medicine, Department of Nuclear Medicine between March and April 2020 and who have been conducted FDG PET/CT for diagnosis, staging, restaging and evaluation of response to treatment were included in the study. Because the study was designed retrospectively, no written Informed consent form was obtained.
NAFLD fibrosis score is a non-invasive, simple and easy-to-apply scoring system, which is obtained using 6 variable parameters (age, presence of impaired fasting glucose (IFG) or diabetes, body mass index (BMI), AST/ALT ratio, platelet count, and albumin) and allows to accurately determine the presence, absence and severity of fibrosis(16). The files of the patients were examined (blood tests in the last month were examined), and the patients with ALT, AST, albumin and platelet levels in their files were included in the study. The height and weight of the patients were measured and their BMI (body mass index) was calculated. Patients were divided into three groups according to their NAFLD (Non-alcoholic fatty liver disease) score. According to the score defined by Angulo P et al. (16), patients with fibrosis score <-1,455 (the group in which severe fibrosis was excluded) as group-1, and those with NAFLD score between -1.455-0.676 (inter-mediate score) as group-2. and patients with a NAFLD score >0.676 (severe fibrosis group) were classified as group-3.
In group-1, a total of 28 of patients had diabetes or IGT and 66 did not. In group-2, 37 had diabetes or IGT, while 50 did not. In group-3, 41 of the patients had diabetes or IGT, 8 did not.
SUVmax value was calculated by drawing 1 cm diameter ROI (region of interest) from the periphery of the right lobe of the liver. In addition, SUVmax values were measured from the fatty planes in the right supraclavicular region, from the subcutaneous tissue of the posterior part of the left scapula, and from the mesenteric area of the abdomen. All three groups were compared and was investigated whether there was a difference between the SUV values obtained from the supraclavicular region, especially the liver, and the mesentery of the infracalvicular region. In addition, patients' glucose-adjusted SUV values were SUVmax×blood glucose level/100 were calculated via SUVglu in order to compare 3 groups (17).
Method and Device InformationFor the FDG PET/CT imaging, patients were required to fast for at least 6 h and have a blood glucose level of 140 mg/dL. FDG at a dose of 0.1 mCI/kg was injected intravenously into the patients. After the injection, the patients were kept in a special lead-coated room for 1 h

956
Altun Tuzcu et al. Liver SUVmax values on FDG-PET/CT and nonalcoholic steatohepatitisJ Health Sci Med 2021; 4(6): 954-959
for the medication to spread through the whole body, and a CT scan of the whole body (from vertex to knees) was performed. Subsequently, whole-body emission scanning was performed with PET. A 2016 model Siemens Horizon brand PET/CT device with 3D-TOF was used for imaging. The slice thickness of the device was 3 mm, and the images were created according to PET iterative and by the CT bp-LOR reconstruction processing method. The low-dose CT device used for anatomical detail and attenuation correction was adjusted to 80 mA and 120 kV (Siemens Healthcare, GmbH Henkestrasse 127, 91052 Erlangen, Germany).
Anthropometric EvaluationsAccording to the height and body weight data obtained from the file records of the patients, the BMI of the patients was calculated with the formula weight(kg) /height(m)2.
Inclusion CriteriaPatients who had blood tests in the last month and whose bio-distribution of F-18 FDG in the whole body was within normal limits.
Exclusion CriteriaPatients with liver cancer or liver metastasis were not included to the study as these cancer types may affect liver SUV. Patients with alcoholic stetohepatitis, viral hepatitis, pregnancy, autoimmune hepatitis, drug-induced toxic hepatitis, cirrhosis, insulin and pioglitazone using individuals have been excluded from the study. Imaging was performed in patients who received chemotherapy after waiting at least two weeks from the last chemotherapy
Statistical Analysis IBM SPSS 21.0 for Windows statistical package program was used for the statistical evaluation of the data. Measurable variables were presented as mean ± standard deviation, and categorical variables as numbers and percentages (%). The chi-square (χ2) test was used for comparing categorical variables. Oneway Anova and Post-Hoc Bonferroni were used for comparing measurable variables. Pearson correlation test was used to show correlation between NAFLD score and liverSUVmax, liverSUVglu age and glucose levels. A P value ≤0.05 indicated a statistically significant difference.
RESULTSThe mean ages of all three groups were statistically different from each other. The mean age of group-1 was statistically significantly lower than group-2 and group-3 (p<0.001). The mean age was not different
between group-2 and group-3. There was no difference between the groups in terms of gender. Group-1 mean body weight was significantly lower than group-2 (p=0.03). There was no difference in body weight between group-2 and group-3.
There was no difference between the three groups in terms of height and BMI. Fasting blood glucose was found to be different from each other when all three groups were compared (p=0.001). Fasting blood glucose level was found to be significantly lower in group-1 than group-2 (p<0.0001).
The proportion of patients with impaired glucose tolerance and diabetes was found to be significantly higher in group-3 and group-2 than in group-1. Gender distribution, age, anthropometric parameters, glucose AST , ALT, albumin and platelet levels of the groups have been presented in Table 1.
AST levels were significantly different from each other in the three groups (p=0.004). While the AST level of group-1 was found to be significantly lower than group-3 (p=0.003), the AST level of group-2 was found to be significantly lower than group-3 (p=0.02). ALT levels did not differ between groups.All three groups were different from each other in terms of platelet levels. Group-1 had lower platelet levels than group-2, while group-2 had a significantly lower platelet level than group-3 (p=0.0001).The albumin levels in the three groups were significantly different from each other (p=0.0001). While the albumin level of group-1 was found to be significantly lower than group-3 (p=0.0001), the AST level of group-2 was found to be significantly lower than group-3 (p=0.0001).
Liver SUVmax levels were found to be significantly higher in group-3 than group-1. No significant
Tablo 1. Sex distribution, age, anthropometric parameters, glucose AST ,ALT Albumin and platelet levels of the groups
Group 1 (n=94)
Group 2 (n=87)
Group 3 (n=49)
P value
Age (years)±SD 48.01±13.92 59.5±13.3 62.7±13.4 0.0001
Gender (female/male) 55/39 40/47 29/20 >0.05
BMI (kg/m2) 25.0±4.8 26.7±4.7 25.9± 5.5 >0.05
Glucose (mg/dl) 97.94±23.44 106.6±21.16 115.78±31.09 0.001
AST (IU/L) 24.46±23,33 27.5±18.5 41.4±47.7 0.004
ALT(IU/L) 23.11±22.87 22.2 ±23.4 21.3±23.9 >0.05
Platelets (cell/ml) 331±109 239±74 170±95 0.0001
Albumin (g/dl) 3.89±0.56 3.76±0.63 2.99±0.75
0.0001

957
Altun Tuzcu et al. Liver SUVmax values on FDG-PET/CT and nonalcoholic steatohepatitis J Health Sci Med 2021; 4(6): 954-959
difference was observed between group-2 and group-3. SUVmax levels measured from supracalvicular region, posterior scapular region and mesentery region were not different from each other in all three groups. NAFLD score showed a positive correlation with the liver SUVmax (r=0.254, p=0.02) liverSUVglu(r=0.284, p=0.01), age (r=0.482, p=0.001) and (r=0.225, p=0.03) glucose levels. (Table 2, Figure 1).
Glucose-corrected liver SUVglu levels were found to be significantly lower in group-1 than group-3 (p=0.001). In terms of liver SUVglu levels, group-1 and group-2 and group-2 and group-3 did not differ statistically from each other. Supracalvicular SUVglu, posterior scapular SUVglu and mesenteric SUVglu groups were not different from each other (Table 2, Figure 2).
DISCUSSIONIn our study, patients with a high NAFLD score have increased liver FDG Uptake. We did not find a similar study in our literature review. The articles in the literature on this subject are limited to FDG uptake measurements in patients with steatohepatitis, and fibrosis has been evaluated with either an invasive method such as liver biopsy or liver MRI, which is very expensive or invasive for the patient (18,19). In our study, this easy and reproducible non-invasive model was used and its relationship with increased liver FDG uptake was emphasized.
The majority of patients with NAFLD will have fatty liver and liver inflammation resulting in altered hepatic FDG kinetics(20, 21). Fatty liver disease, which means accumulation of fat in the form of triglycerides and cholesterol in the liver cells, might induce some sort of inflammation and FDG uptake may be increased as a result of irreversible FDG accumulation in inflammatory cells, suggesting that FDG PET could be developed as a potential imaging approach to NASH (22). The reason for increased FDG uptake in fatty liver can be explained by increased Kupffer cell activity and FDG trapping (23).
In this study we found that liver SUV levels were found to be significantly higher in group-3 than group-1. No significant difference was observed between group-2 and group-3. SUV levels measured from supracalvicular region, posterior scapular region and mesentery region were not different from each other in all three groups. Glucose-corrected liver SUVglu levels were found to be significantly lower in group-1 than group-3. In terms of liver SUVglu levels, group-1 and group-2 and group-2 and group-3 did not differ statistically from each other. Supracalvicular SUVglu, posterior scapular SUVglu
Table 2. NAFLD score of the groups, SUV measurements from the liver supraclavicular supscapular and mesenteric region, and SUVglu measurements corrected for glucose level
Group 1 (n=94)
Group 2 (n=87)
Group 3 (n=49)
P value
NAFLD score -2.80±1.18 -0.447±0.643 2.223±1.279 0.0001
Liver SUVmax 3.39±0.74 3.66±0.73 3.68±0.77 0.02
Supraclavicular region SUVmax 0.57±0.12 0.53±0.12 0.52±0.10 >0.05
Posterior scapular SUVmax 0.55± 0.12 0.53±0.16 0.55±0.15 >0.05
Mesenteric SUV 0.65±0.36 0.60± 0.12 0.61± 0.15 >0.05
Liver SUVglu 3.79±1.76 4.50±1.85 5.22 ± 2.79 0.001
Supraclavicular region SUVglu 0.63±0.26 0.65±0.29 0.72±0.34 >0.05
Supscapular SUVglu 0.61±0.30 0.64±0.28 0.75 ±0.34 >0.05
Mesenteric SUVglu 0.25±0.18 0.72±0.30 0.86 ±0.45 >0.05
Figure 1. Liver SUVmax values of all three groups. The liver SUVmax value of group-1 was found to be significantly lower than group-3. Group-1 and group-2 Liver SUVmax values were not different. Liver SUVmax values of group-2 were not lower than group-3.
Figure 2. Liver SUVglu values of all three groups. The liver SUVglu value of group-1 was found to be significantly lower than group-3. Group-1 and group-2 Liver SUVglu values were not different. Liver SUVglu values of group-2 were not lower than group-3.
958
Altun Tuzcu et al. Liver SUVmax values on FDG-PET/CT and nonalcoholic steatohepatitisJ Health Sci Med 2021; 4(6): 954-959
and mesenteric SUVglu groups were not different from each other. The most important phrase that one could derive from this data could be elaborated as, FDG uptake increased in NASH and FDG SUVmax has been detected statistically significantly higher in the group with higher NAFLD scores compared to the group with lower NAFLD scores. FDG uptake may be increased as a result of irreversible FDG accumulation in inflammatory cells, suggesting that FDG PET could be developed as a potential imaging approach to NASH (24, 25).
In this study fasting blood glucose was found to be different from each other when all three groups were compared. Fasting blood glucose level was found to be significantly lower in group-1 than group-2. Blood glucose levels can affect liver FDG SUVmax and therefore FDG SUVmax may have been different in the group with high NAFLD scores. FDG SUVglu levels, in which FDG uptake is calculated according to the patient's blood glucose level, can provide a correction opportunity according to glucose levels (26). In our study, FDG SUVglu levels were found to be significantly higher in the group with high NAFLD score. Based on these findings, the reason for the increase in FDG uptake seems to be due to a different cause than the patient's blood glucose levels.
The AST level of group-1 was found to be significantly lower than group-3, the AST level of group-2 was found to be significantly lower than group-3. ALT levels did not differ between groups. All three groups were different from each other in terms of platelet levels. Group-1 had lower platelet levels than group-2, while group-2 had a significantly lower platelet level than group-3. The albumin levels of group-1 was found to be significantly lower than group-3. Ozulker et al. (27) found a statistically significant difference between the body weight, serum ALT levels, DM, and glucose levels of the patients with fatty liver and the control group. Patients with fatty liver disease have higher AST and ALT levels .
In some cases, NAFLD score may clarify the reason of increase in FDG uptake. Liver biopsy is performed to identify fibrosis and in addition to this the fibrosis score of patients can be predicted with lower FDG doses (28). In this case the calculation of the NAFLD score can reveal whether the FDG increase is due to the increase in the NAFLD score. The liver FDG SUV values are used as reference SUV values and if the NAFLD score is high in the patient, then the FDG SUVmax values will increase, thus causing false judgements because the reference SUV levels change. Currently liver biopsy is the gold standard in NASH to show inflammation, fibrosis and the severity of the disease. However, this procedure is invasive and has difficulties in routine implementation. In this study we have shown that a relationship can be established between FDG uptake and the severity of the disease (29).
Limitations of the StudyThe main limitation of this study could be elaborated by its study population as all the enrolled individuals were cancer patients. One of the limitations of our study is that it had a retrospective nature and the mean age was different between the groups.
CONCLUSIONThe most important result of this study could be elaborated with increased FDG uptake in NASH. Liver FDG uptake increases as the severity of NASH increases as demonstrated by the NAFLD score. An increase in NAFLD score causes the formation of the inflammatory pathway leading to fibrosis. Future prospective studies with larger number of patients where inflammatory markers are to be measured may enlighten this situation better.
ETHICAL DECLARATIONSEthics Committee Approval: The study was carried out with the permission of Dicle University Medical Faculty Non-interventional Studies Ethics Committee (Date: 2021, Decision No: 358).
Informed Consent: Because the study was designed retrospectively, no written informed consent form was obtained from patients.
Referee Evaluation Process: Externally peer-reviewed.
Conflict of Interest Statement: The authors have no conflicts of interest to declare.
Financial Disclosure: The authors declared that this study has received no financial support.
Author Contributions: All of the authors declare that they have all participated in the design, execution, and analysis of the paper, and that they have approved the final version.
REFERENCES1. Schaffner F, Thaler H. Nonalcoholic fatty liver disease. Prog Liver
Dis 1986: 8: 283-98.2. Sheth SG, Gordon FD, Chopra S. Nonalcoholic steatohepatitis.
Ann Intern Med 1997; 126: 137-45.3. Matteoni CA, Younossi ZM, Gramlich T, et al. Nonalcoholic fatty
liver disease: a spectrum of clinical and pathological severity. Gastroenterology 1999; 116: 1413-9.
4. Reid AE. Nonalcoholic steatohepatitis. Gastroenterology 2001; 121: 710-23.
5. Wah-Kheong C, Khean-Lee G. Epidemiology of a fast emerging disease in the Asia-Pacific region: non-alcoholic fatty liver disease. Hepatol Int 2013;7(1):65–71.
6. Papamiltiadous ES, Roberts SK, Nicoll AJ, et al. A randomised controlled trial of a Mediterranean Dietary Intervention for Adults with Non Alcoholic Fatty Liver Disease (MEDINA): study protocol. BMC Gastroenterol 2016; 16: 14.

959
Altun Tuzcu et al. Liver SUVmax values on FDG-PET/CT and nonalcoholic steatohepatitisJ Health Sci Med 2021; 4(6): 954-959
7. Parisi MT. Functional imaging of infection: conventional nuclear medicine agents and the expanding role of 18-F-FDG PET. Pediatr Radiol. 2011;41:803–10.
8. Israel O, Keidar Z. PET/CT imaging in infectious conditions. Ann N Y Acad Sci 2011; 1228: 150–66.
9. European Association for the Study of the Liver (EASL); European Association for the Study of Diabetes (EASD); European Association for the Study of Obesity (EASO) EASL-EASD-EASO Clinical Practice Guidelines for the management of non-alcoholic fatty liver disease. J Hepatol 2016; 64: 1388–402.
10. Lin CY, Ding HJ, Lin CC, et al. Impact of age on FDG uptake in the liver on PET scan Clin Imaging 2010; 34: 348-50.
11. Keramida G, Potts J, Bush J, Dizdarevic S, Peters AM. Hepatic steatosis is associated with increased hepatic FDG uptake.Eur J Radiol 2014; 83: 751-5.
12. Khandani AH, Wahl RL. Applications of PET in liver imaging .Radiol Clin North Am 2005; 43: 849–60.
13. Kumar R, Xiu Y, Yu JQ, et al. 18 F-FDG PET in evaluation of adrenal lesions inpatients with lung cancer. J Nucl Med 2004; 45: 2058–62.
14. van KouwenMC, Jansen JB, van Goor H, et al. FDG-PET is able to detect pancreatic carcinoma in chronic pancreatitis . Eur J Nucl Med Mol Imaging 2005; 32: 399–404 .
15. Barrington NG, Mikhaeel L, Kostakoglu, et al. Role of imaging in thestaging and response assessment of lymphoma: consensus of theinternational conference on malignant lymphomas imaging working group. J Clin Oncol 2014; 32: 3048–58.
16. Angulo P, Hui JM, Marchesini G, et al. TheNAFLD fibrosis score: a noninvasive system that identifies liver fibrosis inpatients with NAFLD. Hepatology 2007; 45: 846–854.
17. Lee SM, Kim TS, Lee JW, Kim SK, Park SJ, Han SS. Improved prognostic value of standardized uptake value corrected for blood glucose level in pancreatic cancer using F-18 FDG PET. Clin Nucl Med 2011; 36: 331-6.
18. Wang G, Corwin M, Olson K, et al. Dynamic FDG-PET study of liver inflammation in non-alcoholic fatty liver disease. J Hepatol 2017; 66: 543–750.
19. Imajo K, Honda Y, Yoneda M, Saito S, Nakajima A. Magnetic resonance imaging for the assessment of pathological hepatic findings in nonalcoholic fatty liver disease. J Med Ultrason (2001). 2020; 47: 535-48.
20. Hain SF, Curran KM, Beggs AD, et al. FDG-PET as a “metabolic biopsy” tool in thoracic lesions with indeterminate biopsy. Eur J Nucl Med 2001; 28: 1336–40.
21. Beggs AD, Hain SF, Curran KM, O’Doherty MJ. FDG-PET as a “metabolic biopsy” tool in non-lung lesions with indeterminate biopsy. Eur J Nucl Med Mol Imaging 2002; 29: 542–6.
22. Keramida G, Potts J, Bush J, et al. Accumulation of (18)F-FDG in the liver in hepatic steatosis.AJR Am J Roentgenol. 2014; 203: 643-8. Erratum in: AJR Am J Roentgenol 2015; 204: 1137.
23. Kim YH, Kim JY, Jang SJ, et al. F-18 FDG uptake in focal fatty infiltration of liver mimicking hepatic malignancy on PET/CT images. Clin Nucl Med 2011; 36: 1146-8.
24. Le Y, Chen Y, Huang Z,Cai L, Zhang L.Intense FDG activity in focal hepatic steatosis.Clin Nucl Med 2014; 39: 669-72.
25. Han N, Feng H, Arnous MM, Bouhari A, Lan X.Multiple liver focal fat sparing lesions with unexpectedly increased (18)F-FDG uptake mimicking metastases examined by ultrasound (18)F-FDG PET/CT and MRI. Hell J Nucl Med 2016; 19: 173-5.
26. Qazi F, Oliver D, Nguyen N, Osman M. Fatty liver: impact on metabolic activity as detected with18F FDG-PET/CT. J Nucl Med 2008; 49: 263.
27. Ozulker T, Ozulker F, Assessment of the Effect of Fatty Infiltration on Hepatic FDG Uptake, Eur Arch Med Res 2019; 35: 27-32
28. Pak K, Kim SJ, Kim IJ, Kim K, Kim H, Kim SJ. Hepatic FDG Uptake is not Associated with Hepatic Steatosis but with Visceral Fat Volume in Cancer Screening. Nucl Med Mol Imaging 2012; 46: 176-81.
29. Bural GG, Torigian DA, Burke A, et al. Quantitative assessment of the hepatic metabolic volume product in patients with diffuse hepatic steatosis and normal controls through use of FDG-PET and MR imaging: a novel concept. Mol Imaging Biol 2010; 12: 233-9.

HEALTH SCIENCESMEDICINE
Original Article
J Health Sci Med 2021; 4(6): 960-966
This work is licensed under a Creative Commons Attribution 4.0 International License.
DOI: 10.32322/jhsm.991465
Received: 05.09.2021 Accepted: 19.09.2021Corresponding Author: Esra Güzel Tanoğlu, [email protected]
Evaluation of studies on molecular biology and genetics related to COVID-19 with data mining
Esra Güzel Tanoğlu1,2, Muhammed Fevzi Esen31University of Health Sciences, Institution of Hamidiye Medical Sciences, Department of Molecular Biology and Genetics, Istanbul, Turkey2University of Health Sciences, Experimental Medicine Research and Application Center, Istanbul, Turkey3University of Health Sciences, Institution of Hamidiye Medical Sciences, Department of Health Information Systems, Istanbul, Turkey
Cite this article as: Güzel Tanoğlu E, Esen MF. Evaluation of studies on molecular biology and genetics related to COVID-19 with data mining. J Health Sci Med 2021; 4(6): 960-966.
ABSTRACT Aim: The aim of this study was to examine the most common studies about molecular biology and genetics related to COVID-19. In addition, the aim was also to determine the subject focus of studies about COVID-19 during the pandemic with data mining.Material and Method: Review and research articles, book chapters, conference abstracts, case reports and mini reviews published between March 2020 and July 2021 were included in this study. We retrieved only articles from the genetics discipline. The MeSH heading “genetics [GENET]” was used including the specific fields in the MeSH hierarchy of cytogenetics, genomics, human genetics, immunogenetics, molecular biology, pharmacogenetics, phenomics, radiation genetics, toxicogenetics, gene ontology, microbial genetics, behavioral and population genetics.Results: A total of 6234 research articles were evaluated in our study. Of the 85966 terms, 5833 met the threshold from title and abstract extraction. We showed that betacoronavirus, viral pneumonia, viral RNA, spike glycoprotein, coronavirus, middle-aged and animals were the most repetitive terms. Clinical laboratory techniques, polymerase chain reaction and reverse transcriptase polymerase techniques were the main focus for the detection of COVID-19. We found that molecular-based COVID-19 studies were most frequently published by the Journal of Medical Virology, Viruses, and PLoS One. We found that the institutes where molecular-based studies investigating COVID-19 were conducted are in the United States (USA), China and England. The USA and China were in the first rank for countries that conducted the most frequent molecular-based COVID-19 studies, and Turkey was in 19th place in terms of published molecular COVID-19 studies.Conclusion: It is important to identify the issues and mechanisms most frequently investigated in molecular-based studies related to COVID-19. Scientific approaches founded on evidence-based data may be beneficial to find the curative treatment for COVID-19 infection and to effectively prevent this infection.Keywords: COVID-19, genetics, molecular biology, data mining
Ana Metin-Alt bilgi Arası 5mm
Cite-Öz arası 5mm
Başlık-Yazarlar arası 12mmv
Yazar-Kurum arası 2,5 mmvcv
Kurum-Cite arası 5mmv
Öz-Abstract arası 7,5mmvc
INTRODUCTIONWith the worldwide COVID-19 pandemic, humanity is facing a global health threat. There are more than one hundred million infected individuals affected by COVID-19 due to the rapid spread of the virus, resulting in the death of more than four million people. (1).
According to the World Health Organization (WHO), approximately 80% of COVID-19 patients are asymptomatic, approximately 20% of them progress with respiratory tract symptoms, and 5% of these patients need respiratory support. Although the respiratory system is primarily affected including severe pneumonia, COVID-19 involvement in the heart, kidney, nervous
system, liver and gastrointestinal system was also reported. Although different races, genders and age groups have equal susceptibility to the virus, i the disease has higher prevalence in people over the age of 60 years (2,3). Individuals with comorbidities such as cardiovascular diseases, hypertension, diabetes, asthma, chronic liver and chronic kidney disease have higher mortality rate (4,5).
Molecular and genetic mechanisms underlie all these COVID-19-related clinical manifestations and conditions that affect the course of the disease (6). Unfortunately, the molecular, biological and genetic mechanisms of the SARS-CoV-2 virus, which we recently encountered, are still not clearly known. Studies and articles dealing with molecular

961
Güzel Tanoğlu et al. Molecular studies about COVID-19 J Health Sci Med 2021; 4(6): 960-966
and genetic mechanisms, as well as clinical presentations of COVID-19, are being published in increasing numbers. (7, 8). However, the areas of focus in molecular biology and genetics-based COVID-19 studies, which have a very common study subject, that are most researched and which topics involve the most frequently asked questions are unknown. Determining which subjects and areas these studies focus on and which mechanisms they focus on, and taking scientific steps by combining the findings like puzzle pieces is the most powerful and rational course of action to eliminate the COVID-19 infection.
In this current data mining study, the aim was to determine the most common research topics in molecular biology and genetics studies related to COVID-19. Moreover, the aim was also to determine the subject focus of studies about COVID-19 during the pandemic.
MATERIAL AND METHOD This current study is a computer based data-mining study. There is no need to obtain ethical committee approval. All procedures were carried out in accordance with the ethical rules and the principles of the Declaration of Helsinki.
In this research, the study sample consisted of 6234 articles published between March 2020 and July 2021. We addressed all publications regardless of their number of co-authors. Review and research articles, book chapters, conference abstracts, case reports and mini reviews were included in the sample. We retrieved only articles from molecular studies in genetics discipline. The MeSH heading “Genetics [GENET]” was used, including the specific fields in the MeSH hierarchy of cytogenetics, genomics, human genetics, immunogenetics, molecular biology, pharmacogenetics, phenomics, radiation genetics, toxicogenetics, gene ontology, microbial genetics, behavioral and population genetics.
We choose the binary counting method to indicate the number of documents in which a term occurs at least once. For bibliographic mapping, the terms were extracted from MeSH headings, title and abstract fields. For title and abstract text analysis, the minimum number of occurrences of a term was set to 5 and relevance scores were calculated. Of the 85966 terms, 5833 met the threshold from title and abstract extraction. Then, the most relevant terms were selected based on the scores. The terms with low relevance scores were filtered out manually in order to focus on more informative terms. The calculation of relevance scores was performed according to Van Eck and Waltman (9).
Co-occurrence analysis was also performed for MeSH keywords. In the analysis, the relatedness of the items was determined based on the number of documents in which the items occur together. Fractional counting was used to determine the weight of a link. The minimum number of occurrences of a keyword was set to 1, so that all of the MeSH keywords (N=5240) met the threshold for co-occurrence analysis.
RESULTSAs mentioned above, 6234 published articles were included in this data mining study. In Figure 1 (network diagram of MeSH key terms), betacoronavirus, viral pneumonia, viral RNA, spike glycoprotein, coronavirus, middle-aged and animals are the most repetitive terms and the studies about these terms have the highest link strength. It is noteworthy that almost all studies about COVID-19 are related to each other and the studies concentrate around betacoronavirus and RNA. In addition, studies in the field of COVID-19 genetics are shaped around the keywords shown in Figure 2. Clinical laboratory techniques, polymerase chain reaction (PCR) and reverse transcriptase polymerase techniques (RT-PCR) are the main focus for the detection of COVID-19.
Figure 1. Network diagram of MeSH keywords Figure 2. Occurence of MeSH data
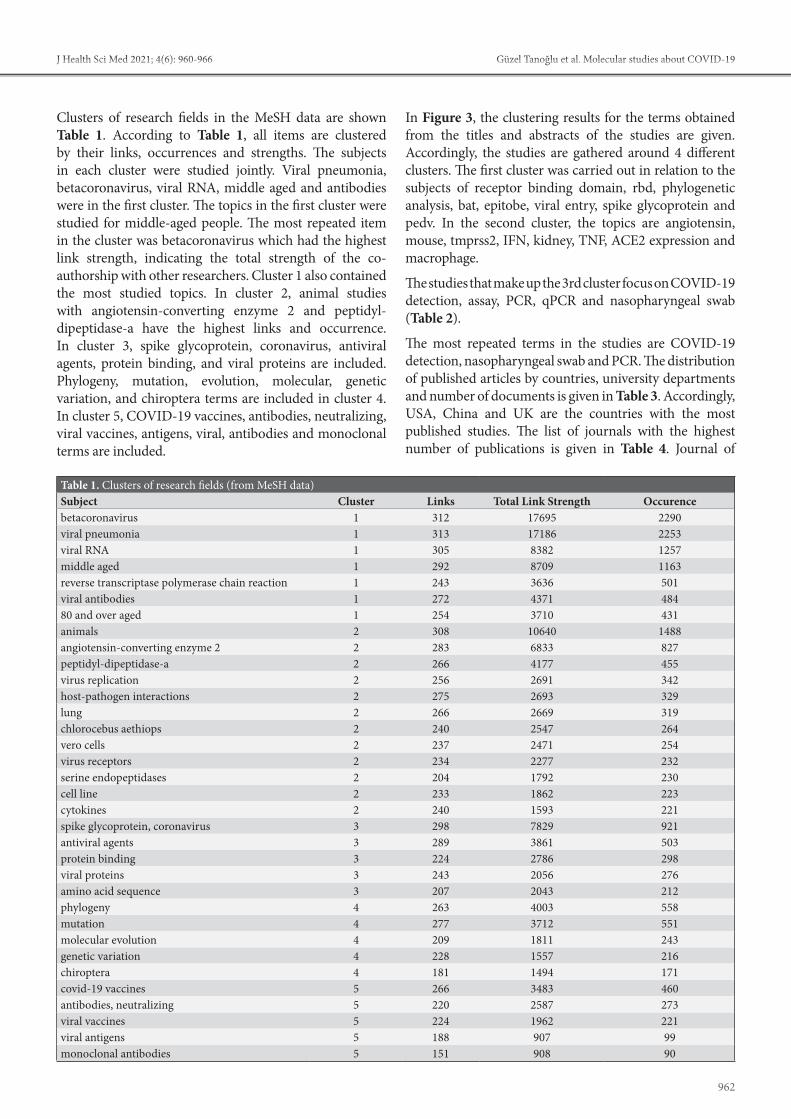
962
Güzel Tanoğlu et al. Molecular studies about COVID-19J Health Sci Med 2021; 4(6): 960-966
Clusters of research fields in the MeSH data are shown Table 1. According to Table 1, all items are clustered by their links, occurrences and strengths. The subjects in each cluster were studied jointly. Viral pneumonia, betacoronavirus, viral RNA, middle aged and antibodies were in the first cluster. The topics in the first cluster were studied for middle-aged people. The most repeated item in the cluster was betacoronavirus which had the highest link strength, indicating the total strength of the co-authorship with other researchers. Cluster 1 also contained the most studied topics. In cluster 2, animal studies with angiotensin-converting enzyme 2 and peptidyl-dipeptidase-a have the highest links and occurrence. In cluster 3, spike glycoprotein, coronavirus, antiviral agents, protein binding, and viral proteins are included. Phylogeny, mutation, evolution, molecular, genetic variation, and chiroptera terms are included in cluster 4. In cluster 5, COVID-19 vaccines, antibodies, neutralizing, viral vaccines, antigens, viral, antibodies and monoclonal terms are included.
In Figure 3, the clustering results for the terms obtained from the titles and abstracts of the studies are given. Accordingly, the studies are gathered around 4 different clusters. The first cluster was carried out in relation to the subjects of receptor binding domain, rbd, phylogenetic analysis, bat, epitobe, viral entry, spike glycoprotein and pedv. In the second cluster, the topics are angiotensin, mouse, tmprss2, IFN, kidney, TNF, ACE2 expression and macrophage.
The studies that make up the 3rd cluster focus on COVID-19 detection, assay, PCR, qPCR and nasopharyngeal swab (Table 2).
The most repeated terms in the studies are COVID-19 detection, nasopharyngeal swab and PCR. The distribution of published articles by countries, university departments and number of documents is given in Table 3. Accordingly, USA, China and UK are the countries with the most published studies. The list of journals with the highest number of publications is given in Table 4. Journal of
Table 1. Clusters of research fields (from MeSH data)Subject Cluster Links Total Link Strength Occurencebetacoronavirus 1 312 17695 2290viral pneumonia 1 313 17186 2253viral RNA 1 305 8382 1257middle aged 1 292 8709 1163reverse transcriptase polymerase chain reaction 1 243 3636 501viral antibodies 1 272 4371 48480 and over aged 1 254 3710 431animals 2 308 10640 1488angiotensin-converting enzyme 2 2 283 6833 827peptidyl-dipeptidase-a 2 266 4177 455virus replication 2 256 2691 342host-pathogen interactions 2 275 2693 329lung 2 266 2669 319chlorocebus aethiops 2 240 2547 264vero cells 2 237 2471 254virus receptors 2 234 2277 232serine endopeptidases 2 204 1792 230cell line 2 233 1862 223cytokines 2 240 1593 221spike glycoprotein, coronavirus 3 298 7829 921antiviral agents 3 289 3861 503protein binding 3 224 2786 298viral proteins 3 243 2056 276amino acid sequence 3 207 2043 212phylogeny 4 263 4003 558mutation 4 277 3712 551molecular evolution 4 209 1811 243genetic variation 4 228 1557 216chiroptera 4 181 1494 171covid-19 vaccines 5 266 3483 460antibodies, neutralizing 5 220 2587 273viral vaccines 5 224 1962 221viral antigens 5 188 907 99monoclonal antibodies 5 151 908 90

963
Güzel Tanoğlu et al. Molecular studies about COVID-19 J Health Sci Med 2021; 4(6): 960-966
Medical Virology, Viruses, PLoS One, Scientific Reports, and Nature were found to be the journals with the most publications in 2020, 2021 and in total. Lastly, the list of journals which published molecular-based COVID-19 studies by year is found in Table 5.
Table 2. Extracted Items from the titles and abstractsLabel Cluster Links Total Link Strength Occurencedetection 3 1873 9739 713assay 3 1642 6417 436RT PCR 3 1568 5769 382specimen 3 1175 3178 202nasopharyngeal swab 3 1035 2969 189binding 1 1204 2750 237receptor binding domain 1 1000 2671 231angiotensin 2 1006 2366 209rbd (receptor-binding domain) 1 921 2341 191reaction 3 925 2276 132phylogenetic analysis 1 938 2162 200mouse 2 926 2058 172tmprss2 2 889 2035 182RT qPCR 3 771 1917 126s protein 1 881 1880 157inf (interferon) 2 890 1712 122bat 1 739 1706 146woman 4 773 1639 109adult 4 799 1544 105epitope 1 642 1430 131isothermal amplification 3 427 1398 72reagent 3 537 1330 90n gene 3 588 1306 81reverse transcription polymerase chain reaction 3 675 1271 90kidney 2 660 1247 92
Table 3. Distribution of molecular based COVID-19 studies by country and institution
Institution Number of Documents Country
Department of Microbiology, Icahn School of Medicine At Mount Sinai 22 USA
University of Chinese Academy of Sciences 15 China
Departmentof Zoology, University of Oxford 11 UK
Ihu-Méditerranée Infection 11 FranceChan Zuckerberg Biohub 10 USADepartment of Immunology, School of Medicine, Tehran Universityof Medical Sciences
10 Iran
Department of Infectious Diseases and Pathobiology, Vetsuisse Faculty, University of Bern
10 Switzerland
Institute of Evolutionary Biology, University of Edinburgh 10 UK
Laboratório De Flavivírus, Instituto Oswaldo Cruz, Fundação Oswaldo Cruz
9 Brazil
University of Chinese Academy of Sciences 9 China
Africa Health Research Institute, Durban, South Africa 8 South Africa
Broad Institute of Mit and Harvard 8 USADepartment of Biochemistry and Molecular Biology, University of Texas Medical Branch
8 USA
Figure 3. Clusters from title and abstract extraction

964
Güzel Tanoğlu et al. Molecular studies about COVID-19J Health Sci Med 2021; 4(6): 960-966
In the last 1.5 years, scientific studies in almost every discipline around the world have focused on COVID-19. In this process, many studies were carried out about the molecular structure, biology and molecular mechanisms of COVID-19 (12). It is critical to elucidate the molecular structure and mechanism of action of COVID-19 to find a curative treatment and prevent the disease. To the best of our knowledge this current study is one of the most comprehensive studies in the literature.
In line with the data obtained from our study, we determined that "betacoronaviruses" are mostly investigated in molecular studies. In their study on betacoronavirus, Letko et al. (13) confirmed that lineage B betacoronaviruses can enter human cells through an unknown receptor and that human ACE2 is the receptor for SARS-CoV-2. Li et al. (14) suggested that betacoronaviruses may have a much more complex recombination mechanism than our current knowledge.
In molecular studies about COVID-19, "viral pneumonia" is the second most common topic. Tianyu et al. (15) showed that Xuebijing agent inhibits COVID-19 and reduces lung involvement by acting on the AKT1
DISCUSSIONCOVID-19 is a dangerous infectious disease caused by severe acute respiratory syndrome coronavirus 2 (SARS-CoV-2), for which we have no curative treatment (10). COVID-19 first emerged in late December 2019 in the Chinese province of Wuhan and soon spread globally around the world (11). It led to the declaration of the COVID-19 pandemic by the WHO. As of August 2021, it has caused approximately 200 million confirmed cases and approximately 4 million deaths (1). Due to the current number of cases, death rates and worldwide prevalence, it has become the pandemic of the century and is a major problem affecting humanity worldwide.
Table 4. List of journals which published molecular based COVID-19 studies by yearsJournal Name 2020 2021 TotalJournal of Medical Virology 95 104 199Viruses 83 94 177PLoS One 98 71 169Scientific Report 70 80 150Nature 61 56 117Nature Communications 50 50 100Frontiers in Immunology 52 32 84International Journal of Molecular Sciences 52 23 75
Emerging Microbes & Infection 58 17 75International Journal of Infectious Diseases 41 34 75
Infection, Genetics and Evolution 46 23 69Science 38 31 69Cell 36 26 62Proceedings of the National Academy of Sciences 29 29 58
Journal of Clinical Virology 48 8 56Journal of Virology 33 14 47Signal Transduction and Targeted Therapy 32 19 51
Journal of Clinical Microbiology 41 6 47BMC Infectious Diseases 30 17 47Medical Hypotheses 34 12 46Virus Research 29 14 43Eurosurveillance 32 10 42Emerging Infectious Diseases 30 12 42Clinical Microbiology and Infection 25 15 40Journal of Virological Methods 13 25 38Archives of Virology 24 12 36PLoS Pathogens 10 25 35The New England Journal of Medicine 19 15 34Nature Medicine 25 9 34JAMA 17 17 34The journal of Infectious Diseases 23 11 34Biochem Biophys Res Commun 8 24 32Genes (Basel) 19 11 30Cell Host Microbe 15 15 30Frontiers in Cellular and Infection Microbiology 20 9 29
British Medical Journal 4 23 27
Table 5. Distribution of molecular based COVID-19 studies by countries
# Country Study number1 USA 28162 China 22673 Italy 6374 Germany 3535 France 3426 United Kingdom 2637 India 2108 Canada 1169 Japan 113
10 Spain 10711 Korea 9812 Switzerland 9213 Netherlands 8614 Australia 8815 Saudi Arabia 7216 Israel 5717 Brazil 5318 Denmark 4319 Turkey 3720 South Africa 3721 Vietnam 3722 Poland 3123 Sweden 3024 Pakistan 3025 Russia 2226 Finland 16
Note: In studies with multiple authors, if the countries in which the institutions are located are not the same, the study is equally distributed to the countries of the authors.

965
Güzel Tanoğlu et al. Molecular studies about COVID-19 J Health Sci Med 2021; 4(6): 960-966
pathway, a serine-threonine protein kinase protein that is effective in the inflammatory response. In another study, it was shown that when the damage-associated molecular pattern (DAMPs) from the coronavirus is combined with other risk factors such as air pollution, smoking or advanced age, the disease progresses more seriously and causes fatal coronavirus pneumonia (16).
Regarding viral RNAs, which is the third most common molecular study subject, Zhang et al. (17) showed that CoV nonstructural protein 14 (nsp14) functions as (guanine-N7)-methyltransferase (N7-MTase) involved in RNA cap formation. They suggested that it would be an ideal method for designing live attenuated vaccines for coronavirus by eliminating the viral RNA N7-MTase activity. In the study by Jesus et al. (18), they suggested that antisense RNA-mediated gene editing would increase the success of treatment and provide a cost-effective approach to treat COVID-19.
Another leading research topic is the reverse transcriptase polymerase chain reaction method used in the diagnosis of COVID-19. A common mutation in the spike protein of SARS-CoV-2, called D614G (A23403G), is known to occur (19). Al-Jaf et al. (20) reported that the qRT-PCR method is a suitable diagnostic method for the detection of this mutation because it is fast, effective and cost-effective. In a meta-analysis study by Sopp et al. (21) with COVID-19 data, they reported that SARS-CoV-2 RNA tested by qRT-PCR was rarely found in conjunctival samples. In a review article describing the production and distribution of mRNA vaccines in the COVID-19 process, production scales of SARS-CoV-2 RNA vaccines and mRNA vaccine production against new agents were mentioned. In this review, the topicality of the mRNA vaccine was emphasized (22).
While the United States and China are in the top ranking for countries that conducted molecular-based COVID-19 studies, Italy, Germany and France among European countries follow this ranking. Among the reasons for this ranking are the first detection of the virus in China, the population and the budget allocated to research. Our country of Turkey, on the other hand, ranks 19th in terms of published molecular COVID-19 studies, and an increasing number of comprehensive studies were accepted for publication in reputable journals. When molecular-based studies examining COVID-19 are evaluated on an institute basis, the USA, China and England share the top three places. The reason for this may be that there are sufficient devices and equipment on an institutional basis, experienced researchers and sufficient research budgets.
CONCLUSIONIt is an obvious fact that clinical and molecular studies conducted during the COVID-19 pandemic will continue after the pandemic. However, it is important to determine in the subjects and areas where the molecular-based studies about COVID-19 are clustered and which mechanisms were investigated. Taking scientific steps according to the evidence-based data obtained will be the most beneficial and rational approach to find curative treatment for COVID-19 infection and to effectively prevent this infection.
ETHICAL DECLARATIONSEthics Committee Approval: This current study is a computer based data-mining study. There is no need to obtain ethical committee approval.
Informed Consent: Because of the study design no written informed consent form was obtained from patients.
Referee Evaluation Process: Externally peer-reviewed.
Conflict of Interest Statement: The authors have no conflicts of interest to declare.
Financial Disclosure: The authors declared that this study has received no financial support.
Author Contributions: All of the authors declare that they have all participated in the design, execution, and analysis of the paper, and that they have approved the final version.
REFERENCES1. Jamsheela O. A Study of the correlation between the dates of
the first COVID case and the first COVID death of 25 selected countries to know the virulence of the COVID-19 in different tropical conditions. Ethics Med Public Health 2021; 19: 100707.
2. Liu K, Chen Y, Lin R, Han K. Clinical features of COVID-19 in elderly patients: A comparison with young and middle-aged patients. J Infect 2020; 80: e14-e8.
3. Chen N, Zhou M, Dong X, et al. Epidemiological and clinical characteristics of 99 cases of 2019 novel coronavirus pneumonia in Wuhan, China: a descriptive study. Lancet 2020; 395(10223): 507-13.
4. Wang L, He W, Yu X, et al. Coronavirus disease 2019 in elderly patients: Characteristics and prognostic factors based on 4-week follow-up. J Infect 2020; 80: 639-45.
5. Wu Z, McGoogan JM. Characteristics of and Important Lessons From the Coronavirus Disease 2019 (COVID-19) Outbreak in China: Summary of a Report of 72 314 Cases From the Chinese Center for Disease Control and Prevention. JAMA 2020.
6. Zhu C, He G, Yin Q, et al. Molecular biology of the SARs-CoV-2 spike protein: A review of current knowledge. J Med Virol 2021; 93: 5729-41.
7. Ozcelik F, Tanoglu A, Guven BB, Keskin U, Kaplan M. Assessment of severity and mortality of COVID-19 with anti-A1 and anti-B IgM isohaemagglutinins, a reflection of the innate immune status. Int J Clin Pract 2021: e14624.

966
Güzel Tanoğlu et al. Molecular studies about COVID-19J Health Sci Med 2021; 4(6): 960-966
8. Beyazit F, Beyazit Y, Tanoglu A, Haznedaroglu IC. Ankaferd hemostat (ABS) as a potential mucosal topical agent for the management of COVID-19 syndrome based on its PAR-1 inhibitory effect and oestrogen content. Med Hypotheses 2020; 143: 110150.
9. Van Eck NJ, & Waltman, L. Text mining and visualization using VOSviewer. ISSI Newsletter 2011; 7: 50-4.
10. Viruses CSGotICoTo. The species Severe acute respiratory syndrome-related coronavirus: classifying 2019-nCoV and naming it SARS-CoV-2. Nat Microbiol 2020; 5: 536-44.
11. Alshammary AF, Al-Sulaiman AM. The journey of SARS-CoV-2 in human hosts: a review of immune responses, immunosuppression, and their consequences. Virulence 2021; 12: 1771-94.
12. James N, Menzies M. Trends in COVID-19 prevalence and mortality: A year in review. Physica D 2021; 425: 132968.
13. Letko M, Marzi A, Munster V. Functional assessment of cell entry and receptor usage for SARS-CoV-2 and other lineage B betacoronaviruses. Nat Microbiol 2020; 5: 562-9.
14. Li LL, Wang JL, Ma XH, et al. A novel SARS-CoV-2 related coronavirus with complex recombination isolated from bats in Yunnan province, China. Emerg Microbes Infect 2021; 10: 1683-90.
15. Tianyu Z, Liying G. Identifying the molecular targets and mechanisms of xuebijing injection for the treatment of COVID-19 via network parmacology and molecular docking. Bioengineered 2021; 12: 2274-87.
16. Land WG. Role of DAMPs in respiratory virus-induced acute respiratory distress syndrome-with a preliminary reference to SARS-CoV-2 pneumonia. Genes Immun 2021; 22: 141-60.
17. Zhang Z, Liu Q, Sun Y, et al. Live attenuated coronavirus vaccines deficient in N7-Methyltransferase activity induce both humoral and cellular immune responses in mice. Emerg Microbes Infect 2021; 10: 1626-37.
18. de Jesus SF, Santos LI, Rodrigues Neto JF, Vieira TM, Mendes JB, D'angelo MFSV, et al. Therapeutic perceptions in antisense RNA-mediated gene regulation for COVID-19. Gene 2021; 800: 145839.
19. Badua CLDC, Baldo KAT, Medina PMB. Genomic and proteomic mutation landscapes of SARS-CoV-2. J Med Virol 2021; 93: 1702-21.
20. Al-Jaf SMA, Niranji SS, Mahmood ZH. Rapid, inexpensive methods for exploring SARS CoV-2 D614G mutation. Meta Gene 2021; 30: 100950.
21. Sopp NM, Sharda V. An Eye on COVID-19: A Meta-analysis of Positive Conjunctival Reverse Transcriptase-Polymerase Chain Reaction and SARS-CoV-2 Conjunctivitis Prevalence. Optom Vis Sci 2021; 98: 429-36.
22. Tanoğlu EG. Production and distribution of mRNA vaccines: SARS-CoV-2 experience. J Mol Virol Immunol 2020; 1: 27-34.

HEALTH SCIENCESMEDICINE
Case Report
J Health Sci Med 2021; 4(6): 967-969
This work is licensed under a Creative Commons Attribution 4.0 International License.
DOI: 10.32322/jhsm.888191
Received: 12.04.2021 Accepted: 07.07.2020Corresponding Author: Muhammed Kızılgül, [email protected]
Interference of high dose intravenous vitamin C with blood glucose testing in a patient with COVID-19 infection
Engin Karagöz1, Muhammed Kızılgül21Private Clinic, İstanbul, Turkey2Health Sciences University, Dışkapı Training and Research Hospital, Department of Endocrinology and Metabolism, Ankara, Turkey
Cite this article as: Karagöz E, Kızılgül M. Interference of high dose intravenous vitamin C with blood glucose testing in a patient with COVID-19 infection. J Health Sci Med 2021; 4(6): 967-969.
ABSTRACTFlash glucose monitoring system (FGMs) is an option for patients to monitor their glucose however, the presence of interfering substances can result in false blood glucose readings. The COVID-19 (SARS-2-Cov) pandemic has resulted in substantial damage to the public and currently, no effective treatment is available for this deadly disease. Intravenous vitamin C (VC) has been shown to attenuate the cytokine storm in COVID-19 infection. Studies suggest that vitamin C supplementation reduces blood glucose in diabetic patients. On the other hand, VC can affect glucose readings obtained by devices in varying degrees. Here, we present a diabetic patient diagnosed with COVID-19 infection, who had false increased blood glucose readings on FGM after VC treatment. A 45-year-old woman with T2DM was diagnosed with a COVID-19 infection. Intravenous VC at a dose of 2500mg five times was added to the standard treatment protocol due to COVID-19 pneumonia. Her flash glucose levels were consistently elevated during intravenous VC infusion and returned to her normal average values after cessation of infusion. Insulin was not given at the time of fluctuations in blood glucose readings because both fingerstick and venous blood glucose measurements at the time of VC infusion were not consistent with the FGM readings. False increase in blood glucose readings due to interfering substances should be kept in mind since correction with insulin or antidiabetics may lead to a potential for dangerous life-threatening hypoglycemic events.
Keywords: Flash glucose monitoring system, COVID-19, interference, high dose vitamin C
Ana Metin-Alt bilgi Arası 5mm
Cite-Öz arası 5mm
Başlık-Yazarlar arası 12mm
Yazar-Kurum arası 2,5 mm
Kurum-Cite arası 5mm
Öz-Abstract arası 7,5mm
INTRODUCTIONContinuous glucose monitoring (CGM) is a new method that depends on interstitial glucose measurement via a subcutaneous sensor. CGM has been shown to reduce risks of hypoglycemia and hyperglycemia, glycemic variability, and improve HbA1c and patient’s quality of life (1). Flash Glucose Monitoring system (FGMs), a subset of CGM, is designed as an alternative to traditional blood glucose monitoring, which allows patients to get individual blood sugar readings on demand. However, understanding the limitations of flash glucose monitoring (Abbott Freestyle Libre) due to the presence of interfering substances and the clinical status of the patient can be significant, and need to be considered when interpreting the glucose values provided. Dehydration, using high dose vitamin C (VC) or salicylic acid may lead to false readings with the system (2). The COVID-19 (SARS-2-Cov) pandemic, first reported in Wuhan, China, spreads to many countries, has resulted in substantial damage to the public. Currently, no effective treatment is available
for this deadly disease. Coronaviruses increase oxidative stress that promotes cellular malfunction and ultimately results in organ failure. This process finally leads to serious cellular injury, organ failure, and death (3,4). The administration of anti-oxidizing agents along with proven conventional supportive therapies is believed to have an important role in controlling these medical situations. VC shows its antioxidant properties by the elimination of harmful reactive oxygen species, thus defending the cells from oxidative damage (5,6). It is known that high-dose VC provides a certain protection against viral infection. Intravenous VC may also attenuate the cytokine storm in the COVID-19 infection besides its antiviral properties (7). High-dose vitamin C is an example of a substance that has proven to alter blood glucose measurements on glucose devices. Here, we will discuss a type 2 diabetic patient diagnosed with COVID-19 infection, who had false increased blood glucose readings on FGM after VC treatment.

968
Karagöz et al. Vitamin C and interference with blood glucose testing J Health Sci Med 2021; 4(6): 967-969
CASE REPORTA 45-year-old woman with T2DM was diagnosed with a COVID-19 infection. She was on metformin/sitagliptin and empagliflozin treatment and her last HbA1c and C-peptide were 8.2% and 1 ng/mL, respectively. She was on FGMs to improve her glycemic control. After diagnosed with a COVID-19 infection, she was admitted to the hospital since she had pulmonary infiltrations. Empagliflozin treatment was discontinued as recommended by the guidelines. She has started standard hydroxychloroquine (800 mg loading dose, 400 mg/day for 4 days), azithromycin (500 mg loading dose, 250 mg/day for 4 days), and oseltamivir (75 mg/day for 5 days) treatment and later inhaler treatment and, intravenous VC at a dose of 2500 mg for five times was added to the treatment protocol due to COVID-19 pneumonia. Following this, her flash glucose levels (Freestyle Libre) were consistently elevated with intravenous VC and returned to her normal average values after cessation of infusion (Figure 1-2). Both fingerstick and venous blood glucose measurements at the time of VC infusion were not consistent with the FGM readings. Dextrose or some other dextrose-containing fluid was not administered during hospital admission. Her diabetes medication dose was not increased and insulin was not given at the time of fluctuations in blood glucose readings. Her glucose levels returned to her normal average levels after discontinuation of VC treatment. She did not need an intensive care unit for COVID-19 infection. She was discharged on the 6th day of admission after recovery of COVID-19 infection.
DISCUSSIONCurrently, no suitable vaccine or specific antivirals are available for COVID-19. Acute respiratory distress syndrome (ARDS) is considered as the virtual reason for mortality (7). Coronaviruses may lead to significant lung damage and death from ARDS via the activation of pulmonary capillary endothelium, infiltration by neutrophils, and enhanced oxidative stress as a result of “cytokine storm” (3,4). Enhanced oxidative stress is an important trigger in lung damage leading to acute lung failure with remarkably increased morbidity and mortality (8).
FGMs (Abbott Freestyle Libre) mechanically measures and constantly reads the glucose concentration in the interstitial fluid glucose collected by an inserted sensor filament just beneath the skin and record changes in an individual’s glucose levels up to 14 days; this process reduces the necessity for countless and painful finger pricks currently used for glucose monitoring. FGMs are delicate and tolerable, which efficiently improve glycemic control (2). FGM systems can be exposed to heterograde interference from various drugs and nondrug compounds, such as acetaminophen, salicylic acid, and VC (9,10). It is known that vasopressor drugs and severe acute illness may also interfere with glucose readings, however, the patient was not admitted to the intensive care unit.
VC shows its antioxidant properties by the elimination of harmful reactive oxygen species, thus defending the cells from oxidative damage. VC at high concentrations (1,000–5,000 mmol/L) is administrated by intravenous access. According to a randomized cross-over study, supplementation with vitamin C tablets two times a day (2×500 mg/d, quite higher than the daily recommended dose) decreased postprandial hyperglycemia in diabetics
Figure 1. Flash glucose levels before hospital admission and 1st and 2nd days of hospital stay
Figure 2. Flash glucose levels at the 3rd, 4th, and 5th days of hospital admission

969
Karagöz et al. Vitamin C and interference with blood glucose testingJ Health Sci Med 2021; 4(6): 967-969
(11). A meta-analysis showed vitamin C supplementation has beneficial effects on glycaemic control in diabetic patients (12). On the other hand, VC can variably affect glucose devices. The oxidization of ascorbic acid at the electrode surface, leading to more electrons and current production, which leads to a false increase in blood glucose reading (5). The antiviral activities of VC were known for decades and high-dose intravenous VC treatment was shown to be effective in patients with sepsis, ill with severe influenza, receiving mechanical ventilation (7). In addition to direct antiviral properties, intravenous VC may also attenuate the cytokine storm in the COVID-19 infection. Pneumonia caused by COVID-19 may lead to severe lung injury and prevent sufficient pulmonary oxygen enter that results in ARDS, with increased morbidity and mortality rate. Oxidative stress-induced by COVID-19 leads to cellular dysfunction and finally results in organ failure. ARDS is considered the main trigger of COVID-19’s induced lung failure. An increase in oxidative stress by the production of free radicals and cytokines eventually causes critical cellular damage, organ dysfunction, and death. Anti-oxidants use with proven supportive therapies is considered to play a significant role in disease control. Intravenous VC and other antioxidant agents can be used for ARDS. Additionally, high dose intravenous VC is well-tolerable and effective (6).
In most cases of mild COVID-19 infection, antidiabetic medications should be followed as usual, except for sodium-glucose co-transporter-2 (SGLT2) inhibitors, which can lead to an increase in the risk of dehydration and diabetic ketoacidosis, necessitating careful renal function monitoring. Since there is a risk for lactic acidosis with metformin, discontinuation is suggested during hospitalization in case of moderate or severe disease (13). Our patient had mild disease and only empagliflozin treatment was discontinued.
Because no vaccine or specific antiviral medicine is available presently for this mortal disease, high-dose VC is safe and may be an option to mitigate COVID-19 associated pulmonary involvement. Correction of false increase in blood glucose readings as a result of high-dose VC may create a potential for dangerous life-threatening hypoglycemic events. Clinicians and patients need to be aware of the susceptibility of the blood glucose monitoring system to interfering substances.
ETHICAL DECLARATIONSInformed Consent: Written informed consent was obtained from all participants who participated in this study.
Referee Evaluation Process: Externally peer-reviewed.
Conflict of Interest Statement: The authors have no conflicts of interest to declare. Financial Disclosure: The authors declared that this study has received no financial support. Author Contributions: All of the authors declare that they have all participated in the design, execution, and analysis of the paper, and that they have approved the final version.
REFERENCES1. Rodbard D. Continuous glucose monitoring: a review of recent
studies demonstrating improved glycemic outcomes. Diabetes Technol Ther 2017; 19: 25–37.
2. Blum A. Freestyle libre glucose monitoring system. Clin Diabetes 2018; 36: 203–4.
3. Wang D, Hu B, Hu C, et al. Clinical characteristics of 138 hospitalized patients with 2019 novel Coronavirus–infected pneumonia in Wuhan, China. JAMA 2020; 323: 1061.
4. Chen N, Zhou M, Dong X, et al. Epidemiological and clinical characteristics of 99 cases of 2019 novel coronavirus pneumonia in Wuhan, China: a descriptive study. Lancet 2020; 395: 507–13.
5. Tang Z, Du X, Louie RF, Kost GJ. Effects of drugs on glucose measurements with handheld glucose meters and a portable glucose analyzer. Am J Clin Pathol 2000; 113: 75–86.
6. Boretti A, Banik BK. Intravenous Vitamin C for reduction of cytokines storm in acute respiratory distress syndrome. PharmaNutrition 2020; 12: 100190.
7. Cheng RZ. Can early and a high intravenous dose of vitamin C prevent and treat coronavirus disease 2019 (COVID-19)? Med Drug Discov 2020; 5: 100028.
8. Hecker L. Mechanisms and consequences of oxidative stress in lung disease: therapeutic implications for an aging populace. Am J Physiol Cell Mol Physiol 2018; 314: 642–53.
9. Basu A, Slama MQ, Nicholson WT, et al. Continuous glucose monitor interference with commonly prescribed medications: a pilot study. J Diabetes Sci Technol 2017; 11: 936–41.
10. Calhoun P, Johnson TK, Hughes J, Price D, Balo AK. Resistance to acetaminophen interference in a novel continuous glucose monitoring system. J Diabetes Sci Technol 2018; 12: 393–6.
11. Mason SA, Rasmussen B, van Loon LJC, Salmon J, Wadley GD. Ascorbic acid supplementation improves postprandial glycaemic control and blood pressure in individuals with type 2 diabetes: Findings of a randomized cross-over trial. Diabetes Obes Metab 2019; 21: 674–82.
12. Ashor AW, Werner AD, Lara J, Willis ND, Mathers JC, Siervo M. Effects of vitamin C supplementation on glycaemic control: a systematic review and meta-analysis of randomized controlled trials. Eur J Clin Nutr 2017; 71: 1371–80.
13. Doupis J, Avramidis K. Managing diabetes during the COVID-19 pandemic. Eur Endocrinol 2020; 16: 85.

Characteristic features of acute postoperative pain after cesarean delivery.......................................................................................................... 4(1): 1-6Investigating anxiety, depression and obsessive-compulsive disorders among the pregnant women during COVID-19 pandemic. .................................................................................................................................................................................................................... 4(1): 7-12Spectrum of eyelid lesions–a histopathological study in South India. ..............................................................................................................4(1): 13-17Clinical features and laboratory values associated with disease severity in COVID-19 patients: a single center experience. ..................4(1): 18-22Evaluation of ferric carboxymaltose treatment efficacy in women with postpartum iron deficiency anemia. ...........................................4(1): 23-27Retrospective analysis of urine culture results in our clinic: determination of pathogen types and antibiotic resistance in our region. .............................................................................................................................................................................................................4(1): 28-32Investigation of the contribution of concentrated growth factor (CGF) and processed lipoaspirate (PLA) to wound healing in diabetic rats. ..........................................................................................................................................................................................................4(1): 33-37Evaluation of craniometric measurements in human skulls. .............................................................................................................................4(1): 38-44The relationship between renal resistive index and simple hematologic indices in patients with chronic kidney disease. .......................4(1): 45-48An evaluation of risk factors affecting amputation in patients with diabetic foot infection. .........................................................................4(1): 49-54Risk of malnutrition in general surgical patients. ................................................................................................................................................4(1): 55-62Awareness among patients taking oral non-steroidal anti-inflammatory drugs as analgesics: a cross-sectional study. ............................4(1): 63-70Outcomes of mTORi-Involving minimized ımmunosuppression protocols in renal transplantation. ........................................................4(1): 71-77Urinary tract stone surgery in patients with urinary diversion and vesicostomy: a single center experience. ...........................................4(1): 78-83The cultural attitudes of nurses and the analysis of the interactive relation between the nurse and the patient.........................................4(1): 84-90The view of #schizophrenia on Twitter (a splitting of the mind in 280 characters). .......................................................................................4(1): 91-95Is mean platelet volume better than other long-used non-invasive parameters in assessing severe fibrosis in patients with chronic hepatitis B?. ...............................................................................................................................................................................................4(1): 96-102Sleep quality and social support in people over 65 years old who have had a quarantine process due to COVID-19...........................4(1): 103-108Outcomes of delayed graft function in deceased donor kidney transplantation: a single center experience. .........................................4(1): 109-114Severe hypokalemia and rhabdomyolysis caused by Conn syndrome. .........................................................................................................4(1): 115-117
Stroke in long-term intensive care unit. ............................................................................................................................................................4(2): 118-122Evaluation of seasonality in the diagnosis of diffuse large B cell lymphoma in Turkey. .............................................................................4(2): 123-126Investigating the relation between upper extremity function and trunk control, balance and functional mobility in individuals with stroke.........................................................................................................................................................................................4(2): 127-131Multidimensional assessment of interoceptive awareness (MAIA 2): psychometric properties of the Turkish version........................4(2): 132-136Comparison of the efficacy of different progesterone regimens in blastocyst frozen-thawed embryo transfer cycles. ..........................4(2): 137-141The impact of laboratory features and comorbidities on the prognosis of patients with COVID-19. ......................................................4(2): 142-146The evaluation of sleep quality, anxiety disorder and depression in older adults with Parkinson disease. ..............................................4(2): 147-153The place of transvaginal ultrasonography saline infusion sonohysterography and hysteroscopy in the diagnosis of abnormal uterin bleedings. .................................................................................................................................................................................4(2): 154-159The effect of phosphorylcoline-coated cardiopulmonary bypass circuits on morbidity and mortality in patients with congenital open cardiac surgery. ........................................................................................................................................................................4(2): 160-165Comparison of hydroxyethylstarch 130/0.4 and ringer’s lactate on fibrinogen level in cesarean operations: a randomized clinical trial. ...........................................................................................................................................................................................................4(2): 166-169Factors associated with the development of screw cut-out after the fixation of intertrochanteric femoral fractures with a proximal femoral nail. ..........................................................................................................................................................................................4(2): 170-175Effect of number of uses on the cyclic fatigue resistance of single-file rotary instruments. .......................................................................4(2): 176-180The effect of normotensive arterial pressure on cerebral saturation during carotid endarterectomy. ......................................................4(2): 181-185Our results of cardiac surgery performed with a right infra-axillary mini thoracotomy. ..........................................................................4(2): 186-191Evaluation of effect of frailty on warfarin compliance among older patients. .............................................................................................4(2): 192-197Evaluation of the hematologic indices in patients with thyrotoxicosis with distinct etiologies: a case-control study. ...........................4(2): 198-202Efficacy of reduced dose melphalan conditioning for multiple myeloma patients undergoing autologous stem cell transplantation: in the era of combined induction with novel agents. ..........................................................................................................4(2): 203-208Cytotoxicity of two self-adhesive flowable composites on bovine dental pulp-derived cells. ....................................................................4(2): 209-212The effectiveness of electroneuromyography in the early diagnosis of diabetic foot development...........................................................4(2): 213-218Antibiotic resistance pattern in Shigella species isolated from children with acute diarrhea in Tabriz city, Iran. ..................................4(2): 219-222The frequency and relationship of osteoporosis and vitamin D deficiency in the female geriatric population in Central Anatolia. ..................................................................................................................................................................................................4(2): 223-227
ISSUE 2021/1
ISSUE 2021/2
HEALTH SCIENCESMEDICINE
ARTICLE INDEX

ISSUE 2021/2
ISSUE 2021/3
ISSUE 2021/4
Can mini-tracheostomy needle be safer for residency training in percutaneous dilatation tracheostomy applications in intensive care unit?. ..............................................................................................................................................................................................4(2): 228-232Does red ginseng ameliorate liver damage caused by obstructive jaundice?: an experimental study. ......................................................4(2): 233-239Can persistent hiccups be a progression marker in COVID-19? ..................................................................................................................4(2): 240-242A rare presentation of brucellosis: acute cholestatic hepatitis. .......................................................................................................................4(2): 243-245Spontaneous hemothorax under rivaroxaban treatment. .......................................................................................................................................4(2): 246
The relationship between sarcopenia and nesfatin-1 and ghrelin levels in patients with chronic obstructive pulmonary disease. .....4(4): 402-407The effect of gender differences on the use of valproic acid for migraine prophylaxis. ..............................................................................4(4): 408-411A content analysis and evaluation of outcomes of specialty theses in dentistry. .........................................................................................4(4): 412-415The impact and relationship of inflammatory markers and radiologic involvement in the COVID-19 patients. ..................................4(4): 416-421The high co-existence rate of Blastocystis and Dientamoeba fragilis in human faecal samples and the analysis of demographic and clinical findings. ....................................................................................................................................................................4(4): 422-427Investigation of sinus vein thrombosis cases detected in the emergency department. ...............................................................................4(4): 428-433The effect of restorative dentistry practices on the vital signs of healthy individuals. ................................................................................4(4): 434-440Relationship between the ABO blood group and mortality among the COVID-19 patients. ...................................................................4(4): 441-444Effects of essential oils obtained from wild and cultured forms of thyme (Origanum acutidens) on lung cancer cells membrane. ..........4(4): 445-450The evaluation of the cases with extrapulmonary tuberculosis. ....................................................................................................................4(4): 451-456Investigation of factors associated with nausea and vomiting in pregnant women. ...................................................................................4(4): 457-461
Evaluation of pediatric patients presenting with vertigo. ...............................................................................................................................4(3): 247-251First-year mortality in living donor kidney transplantation: twelve-year experience from a single center. ............................................4(3): 252-256Are thyroid functions affected in children diagnosed with COVID-19?. .....................................................................................................4(3): 257-261A key challenge in gestational diabetes screening: resistance to oral glucose tolerance test screening and implications for neonatal health. ..............................................................................................................................................................................................4(3): 262-266Ulcerative colitis may be a risk factor for sensorineural hearing loss. ..........................................................................................................4(3): 267-271Use of frozen-thawed sperm for ICSI improves fertility outcome in men with azoospermia. ..................................................................4(3): 272-276Histological changes in methotrexate hepatotoxicity after boron application and evaluation of serum thiol-disulfide balance. ........4(3): 277-282The role of colchicine treatment on reproductive outcome in women with Familial Mediterranean Fever. ...........................................4(3): 283-288Frequency of use and characteristics of complementary and alternative treatment methods by children oncology patients. .............4(3): 289-294Non-surgical follow-up success in blunt abdominal trauma. Can we protect patients with blunt abdominal trauma from surgery?. .......................................................................................................................................................................................................4(3): 295-299A relationship between musculoskeletal pain and prognosis in hospitalized COVID-19 patients. .........................................................4(3): 300-305COVID-19 outpatients and surviving inpatients exhibit comparable blood test results that are distinct from non-surviving inpatients. ....................................................................................................................................................................................4(3): 306-313Our experience of laser lithotripsy under local anesthesia in the treatment of bladder stones in obese male patients. ........................4(3): 314-321A new approach to lymphedema following breast cancer treatment with lymphatic endothelial cell markers. .....................................4(3): 322-328Determinants of intensive care prognosis in patients with “platelet indices” in chronic obstructive pulmonary disease and lung cancer. ....................................................................................................................................................................................................4(3): 329-333Immunohistochemical examination of p97/VCP expression in developing mouse pancreas and liver. ..................................................4(3): 334-339YouTube as an information source during the COVID-19 outbreak: a cross sectional study of Turkish video content. ......................4(3): 340-343Preoperative and intraoperative factors affecting mortality in patients operated on for peptic ulcer perforation: a single center retrospective study. ...................................................................................................................................................................................4(3): 344-348Investigation of the effect of tens treatment on cardiac electrical activity using proarrhythmogenic markers. ......................................4(3): 349-352Relationship between mean platelet volume and intensive care unit requirement in COVID-19 patients. ............................................4(3): 353-357Volume-based dysplasia severity index with the spheric cup method in the evaluation of adult and adolescent acetabular dysplasia. ................................................................................................................................................................................................................4(3): 358-365 Comparison of sympathectomy and cilostazol treatment results in non-revascularized critical leg ischemia. ......................................4(3): 366-371The role of YouTube® videos in heart surgery decision. ..................................................................................................................................4(3): 372-376Does the fibromyalgia affect the quality of life in the patients with inflammatory bowel disease. ...........................................................4(3): 377-382Comparison of bypass versus primary angioplasty for lower extremity chronic limb-threatening peripheral arterial diseases. .........4(3): 383-387COVID-19 and myocarditis/myocardial injury. ..............................................................................................................................................4(3): 388-390Enoxaparin-induced atraumatic acute compartment syndrome of the thigh: a case report. ....................................................................4(3): 391-393Pulmonary involvement in connective tissue disease due to Coronavirus 19: a case report. ....................................................................4(3): 394-396An unexpected complication in a hemodialysis patient: midodrine related A-V fistula dysfunction. .....................................................4(3): 397-399Autoimmune hepatitis as an overlap of secondary antiphospholipid syndrome. ........................................................................................4(3): 400-401

ISSUE 2021/4
ISSUE 2021/5
Laboratory parameters can be used to differentiate renal infarction and urolithiasis in patients who are admitted to the emergency department with flank pain.............................................................................................................................................................4(4): 462-465Adaptation of COVID-19 risk perception and COVID-19 prevention guidelines compliance scales to Turkish: a validity and reliability study. .............................................................................................................................................................................................4(4): 466-471Evaluation of non-traumatic intracranial hemorrhages as cause of cardiac arrest in emergency department. ......................................4(4): 472-476The predictors of complicated acute appendicitis: large unstained cells, gamma-glutamyl transferase, monocyte to platelet ratio, age and gender. ...........................................................................................................................................................................................4(4): 477-481The effects of anogenital condylomas on female sexuality and psychology: a case-control study. ...........................................................4(4): 482-487GLIM criteria for the evaluation of nutrition in palliative care patients, a comparison of MNA-SF and NRS-2002. ............................4(4): 488-492Prognostic value of blood gas lactate levels among COVID-19 patients who visited to emergency department. ..................................4(4): 493-497The relationship between nutritional status, anthropometric measurements and hemogram parameters in preobese and obese women before and after menopause. ......................................................................................................................................................4(4): 498-504Predictive value of C-reactive protein/albumin ratio in predicting poor outcome of hospitalized patients with COVID-19. .............4(4): 505-510The association between PTX3 and serum manganese levels of welders in comparison with controls: An application of anti-inflammatory biomarker. ............................................................................................................................................................................4(4): 511-515Brief review of parathyroid adenoma; problems caused by water clear cells. ..............................................................................................4(4): 516-519A neonatal case of pial arteriovenous fistulas and the review of literature. ..................................................................................................4(4): 520-523Flaxseed: a promising alternative for polycystic ovarian syndrome therapy. ...............................................................................................4(4): 524-525
Cardiovascular risk factors in polycystic ovary syndrome; the relationship of dyslipidemia and obesity. ..............................................4(5): 526-531Comparison of the timed limb coordination according to comorbidity level in community dwelling older adults. .............................4(5): 532-537Evaluation of serum perlecan levels in pregnancy with mild and severe preeclampsia. ............................................................................4(5): 538-542Evaluation of factors affecting 90-day mortality in patients hospitalized due to pulmonary thromboembolism. .................................4(5): 543-551The effect of myometrial invasion and histological grade on lymph node metastasis in patient with early stage endometrium cancer. ...........................................................................................................................................................................................4(5): 552-556The predictive value of systemic immune inflammation index on long-term mortality among patients with acute pulmonary embolism. ..........................................................................................................................................................................................4(5): 557-563Pre-hospital antithrombotic drug use status of died COVID-19 patients. ...................................................................................................4(5): 564-568Comparison of short-term results of open and laparoscopic surgery in gastric cancer at a new regional hospital: a single surgeon experience.................................................................................................................................................................................4(5): 569-575Clinical and epidemiological features of amyotrophic lateral sclerosis in eastern Turkey. ........................................................................4(5): 576-581Extraspinal incidental findings and reporting rates at lumbar spine magnetic resonance imaging: more than a spinal examination?..............................................................................................................................................................................................4(5): 582-588The association between urine pH and abnormal glucose tolerance in adults. ...........................................................................................4(5): 589-597Contribution of beverages to daily added sugar intake: compliance with guidelines’ recommendations. ..............................................4(5): 598-603Factors affecting occupational burnout in nurses working in a medical oncology clinic. .........................................................................4(5): 604-609Evaluation of mortality and acute kidney injury by KDIGO and RIFLE in patients treated with colistin in the intensive care unit. ........4(5): 610-614Assessment of Tp-e interval, Tp-e/QT, and Tp-e/QTc ratios, in patients with COVID-19 infected with or without pneumonia. .......4(5): 615-621Relationship of socioeconomic status and oral-dental health in the Southeastern Anatolia. ....................................................................4(5): 622-629Retrospective analysis of ovarian torsion incidence in 5186 women undergoing controlled ovarian hyperstimulation.......................4(5): 630-633Comparison of the ability of the shock index, modified shock index and age shock index to predict mortality in geriatric patients with COVID-19 pneumonia. ...............................................................................................................................................................4(5): 634-638Evaluation of the relationship between disease activity and serum bilirubin, albumin, and uric acid levels in Crohn's disease. ........4(5): 639-645Evaluation of colonoscopic findings in patients undergoing colonoscopy due to positive fecal occult blood test: a single center experience. .................................................................................................................................................................................................4(5): 646-649Comparison of trans-articular Kirschner wire fixation and TightRope System for the treatment of acromioclavicular joint injuries. .........................................................................................................................................................................................................4(5): 650-655Pediatric palliative care: data of the first 13 months of operation..................................................................................................................4(5): 656-661Sonographic evaluation of intra-abdominal organs in children with familial Mediterranean fever. .......................................................4(5): 662-665Evaluation of hematological indices in terms of COVID-19 related mortality and ICU admission. .......................................................4(5): 666-670Antibiotic resistance of Enterococcus species: 3-year data. ............................................................................................................................4(5): 670-674Head and neck lymphomas from otolaryngology perspective. ......................................................................................................................4(5): 675-679Does fine needle aspiration from a different nodule other than the dominant nodule provide additional benefit in thyroid diseases with nodules?. ..........................................................................................................................................................................4(5): 680-685CRP, WBC and monocyte/lymphocyte ratio relation as a preoperative predictive factor for adhesions observed during laparoscopic cholecystectomy. ...............................................................................................................................................................4(5): 686-691Exploring healthcare professionals’ views and approaches regarding COVID-19 vaccines. .....................................................................4(5): 692-697The effect of blood gas analysis and Charlson comorbidity index evaluation on the prediction of hospitalization period in patients with diabetic hyperglycemic crisis. ....................................................................................................................................4(5): 698-702The effect of vertebral artery characteristics on cervical discogenic pain and disability. ...........................................................................4(5): 703-709
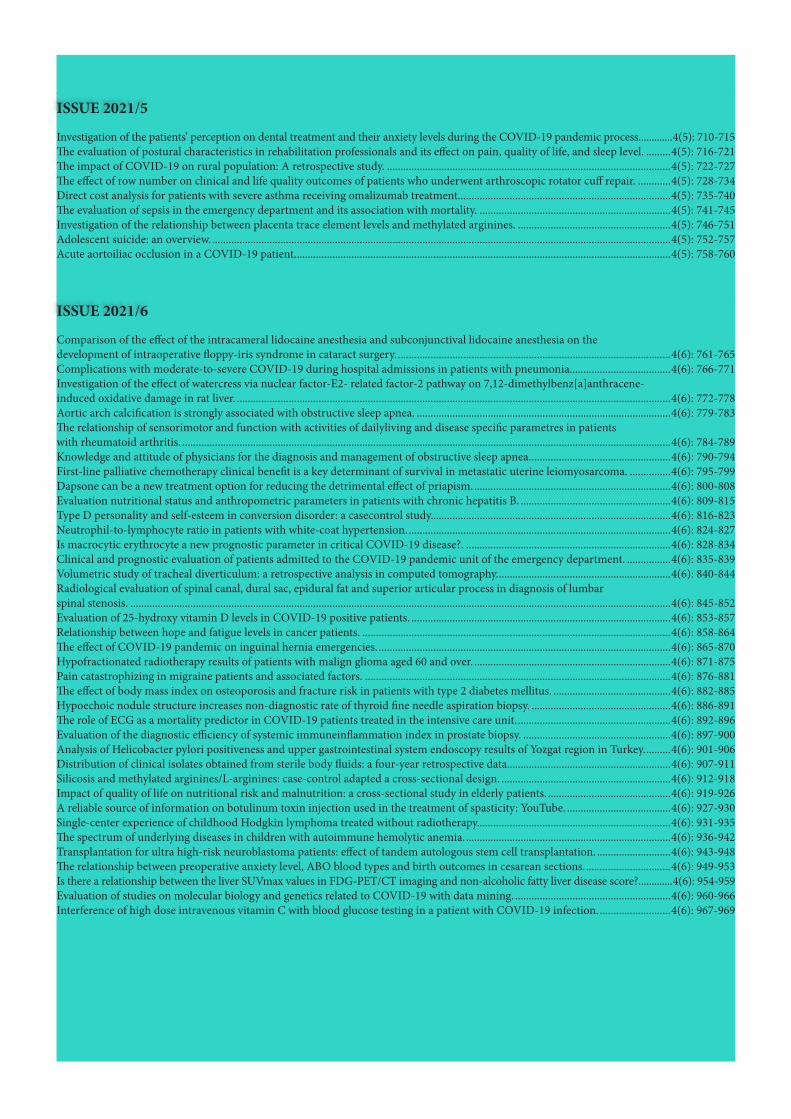
ISSUE 2021/5
ISSUE 2021/6
Investigation of the patients’ perception on dental treatment and their anxiety levels during the COVID-19 pandemic process. ............4(5): 710-715The evaluation of postural characteristics in rehabilitation professionals and its effect on pain, quality of life, and sleep level. .........4(5): 716-721The impact of COVID-19 on rural population: A retrospective study. ........................................................................................................4(5): 722-727The effect of row number on clinical and life quality outcomes of patients who underwent arthroscopic rotator cuff repair. ............4(5): 728-734Direct cost analysis for patients with severe asthma receiving omalizumab treatment. .............................................................................4(5): 735-740The evaluation of sepsis in the emergency department and its association with mortality. ......................................................................4(5): 741-745Investigation of the relationship between placenta trace element levels and methylated arginines. ........................................................4(5): 746-751Adolescent suicide: an overview. ........................................................................................................................................................................4(5): 752-757Acute aortoiliac occlusion in a COVID-19 patient. .........................................................................................................................................4(5): 758-760
Comparison of the effect of the intracameral lidocaine anesthesia and subconjunctival lidocaine anesthesia on the development of intraoperative floppy-iris syndrome in cataract surgery. ....................................................................................................4(6): 761-765Complications with moderate-to-severe COVID-19 during hospital admissions in patients with pneumonia. ....................................4(6): 766-771Investigation of the effect of watercress via nuclear factor-E2- related factor-2 pathway on 7,12-dimethylbenz[a]anthracene- induced oxidative damage in rat liver. ...............................................................................................................................................................4(6): 772-778Aortic arch calcification is strongly associated with obstructive sleep apnea. .............................................................................................4(6): 779-783The relationship of sensorimotor and function with activities of dailyliving and disease specific parametres in patients with rheumatoid arthritis. ...................................................................................................................................................................................4(6): 784-789Knowledge and attitude of physicians for the diagnosis and management of obstructive sleep apnea. ...................................................4(6): 790-794First-line palliative chemotherapy clinical benefit is a key determinant of survival in metastatic uterine leiomyosarcoma. ...............4(6): 795-799Dapsone can be a new treatment option for reducing the detrimental effect of priapism. ........................................................................4(6): 800-808Evaluation nutritional status and anthropometric parameters in patients with chronic hepatitis B. .......................................................4(6): 809-815Type D personality and self-esteem in conversion disorder: a casecontrol study........................................................................................4(6): 816-823Neutrophil-to-lymphocyte ratio in patients with white-coat hypertension. ................................................................................................4(6): 824-827Is macrocytic erythrocyte a new prognostic parameter in critical COVID-19 disease?. ...........................................................................4(6): 828-834Clinical and prognostic evaluation of patients admitted to the COVID-19 pandemic unit of the emergency department. ................4(6): 835-839Volumetric study of tracheal diverticulum: a retrospective analysis in computed tomography. ...............................................................4(6): 840-844Radiological evaluation of spinal canal, dural sac, epidural fat and superior articular process in diagnosis of lumbar spinal stenosis. ......................................................................................................................................................................................................4(6): 845-852Evaluation of 25-hydroxy vitamin D levels in COVID-19 positive patients. ...............................................................................................4(6): 853-857Relationship between hope and fatigue levels in cancer patients. .................................................................................................................4(6): 858-864The effect of COVID-19 pandemic on inguinal hernia emergencies. ...........................................................................................................4(6): 865-870Hypofractionated radiotherapy results of patients with malign glioma aged 60 and over. ........................................................................4(6): 871-875Pain catastrophizing in migraine patients and associated factors. ................................................................................................................4(6): 876-881The effect of body mass index on osteoporosis and fracture risk in patients with type 2 diabetes mellitus. ...........................................4(6): 882-885Hypoechoic nodule structure increases non-diagnostic rate of thyroid fine needle aspiration biopsy. ...................................................4(6): 886-891The role of ECG as a mortality predictor in COVID-19 patients treated in the intensive care unit. ........................................................4(6): 892-896Evaluation of the diagnostic efficiency of systemic immuneinflammation index in prostate biopsy. ......................................................4(6): 897-900Analysis of Helicobacter pylori positiveness and upper gastrointestinal system endoscopy results of Yozgat region in Turkey. .........4(6): 901-906Distribution of clinical isolates obtained from sterile body fluids: a four-year retrospective data............................................................4(6): 907-911Silicosis and methylated arginines/L-arginines: case-control adapted a cross-sectional design. ..............................................................4(6): 912-918Impact of quality of life on nutritional risk and malnutrition: a cross-sectional study in elderly patients. .............................................4(6): 919-926A reliable source of information on botulinum toxin injection used in the treatment of spasticity: YouTube. ......................................4(6): 927-930Single-center experience of childhood Hodgkin lymphoma treated without radiotherapy.......................................................................4(6): 931-935The spectrum of underlying diseases in children with autoimmune hemolytic anemia. ...........................................................................4(6): 936-942Transplantation for ultra high-risk neuroblastoma patients: effect of tandem autologous stem cell transplantation. ...........................4(6): 943-948The relationship between preoperative anxiety level, ABO blood types and birth outcomes in cesarean sections. ...............................4(6): 949-953Is there a relationship between the liver SUVmax values in FDG-PET/CT imaging and non-alcoholic fatty liver disease score?. ............4(6): 954-959Evaluation of studies on molecular biology and genetics related to COVID-19 with data mining. .........................................................4(6): 960-966Interference of high dose intravenous vitamin C with blood glucose testing in a patient with COVID-19 infection. ..........................4(6): 967-969

SYMBOLS25-hydroxy vitamin D, 4(6): 853-857
AAbnormal uterine bleeding, 4(2): 154-159ABO blood types, 4(6): 949-953Acetabular dysplasia assessment, 4(3): 358-365Acetabular dysplasia, 4(3): 358-365Acetabular volume, 4(3): 358-365Acetylsalicylic acid, 4(5): 564-568Acromioclavicular joint, 4(5): 650-655Acute appendicitis, 4(4): 477-481Acute arterial thrombosis, 4(5): 758-760Acute cholestatic hepatitis, 4(2): 243-245Acute kidney injury, 4(5): 610-614Acute limb ischemia, 4(5): 758-760Added sugar, 4(5): 598-603Adenomas, 4(4): 516-519Adolescent, 4(5): 752-757AF, 4(6): 892-896Age shock index, 4(5): 634-638Ageing, 4(5): 532-537Albumin, 4(1): 96-102, 4(5): 639-645, 4(4): 505-510Alternative medicine, 4(3): 289-294Amputation, 4(1): 49-54Amyotrophic lateral sclerosis, 4(5): 576-581Analgesics, 4(1): 63-70Anemia, 4(1): 23-27, 4(4): 428-433, 4(4): 498-504Angiogenesis, 4(5): 538-542Angioplasty., 4(3): 383-387Anthropometric measurements, 4(1): 55-62, 4(4): 498-504Anthropometry, 4(1): 38-44Antibiotic sensitivity, 4(1): 28-32Anticancer, 4(4): 445-450Anticoagulant treatment, 4(3): 391-393Anti-inflammatory properties, 4(2): 233-239Antimicrobial stewardship, 4(5): 670-674Anti-mullerian hormone, 4(5): 526-531Antioxidant properties, 4(2): 233-239Antithrombotic, 4(5): 564-568Anxiety, 4(1): 7-12, 4(1): 103-108, 4(2): 147-153, 4(5): 710-715Aorta, 4(6): 779-783Aortic occlusion, 4(5): 758-760Appendectomy, 4(4): 477-481Approach towards vaccines, 4(5): 692-697Arginine, 4(6): 912-918Arthralgia, 4(3): 300-305Arthroscopy, 4(5): 728-734Article, 4(4): 412-415Aspartate aminotransferase to platelet ratio index, 4(1): 96-102Assessment, 4(6): 790-794Associated factors, 4(2): 170-175, 4(4): 457-461Asthma management, 4(5): 735-740Asymmetric dimethyl arginine, 4(6): 912-918Atraumatic, 4(3): 391-393Attitude, 4(6): 790-794Attitudes, 4(1): 84-90Audiometry, 4(3): 267-271Autoimmune hemolytic anemia, 4(6): 936-942Autologous stem cell transplantation, 4(2): 203-208Autophagy, 4(5): 538-542AV fistula, 4(3): 397-399Azoospermia, 4(3): 272-276
BBacteriuria, 4(1): 28-32bDPCs, 4(2): 209-212Beck depression inventory, 4(5): 604-609Benign paroxysmal vertigo, 4(3): 247-251Bilirubin, 4(5): 639-645Biopsy, 4(6): 897-900Birth outcomes, 4(6): 949-953Birth rates, 4(3): 283-288Birth weight, 4(5): 746-751Bladder, 4(3): 314-321Blastocystis, 4(4): 422-427Blood gas analysis, 4(5): 698-702Blood groups, 4(4): 441-444Blood pressure, 4(4): 434-440Blood test results, 4(3): 306-313Blunt trauma, 4(3): 295-299Body awareness, 4(2): 132-136Body composition, 4(6): 809-815Body mass index, 4(5): 526-531Body temperature, 4(4): 434-440Body weights and measures, 4(6): 809-815Body-mind, 4(2): 132-136Bone mineral density, 4(2): 223-227, 4(6): 882-885Boric acid, 4(3): 277-282Botulinum toxin, 4(6): 927-930Brucellosis, 4(2): 243-245
CCaesarean section, 4(6): 949-953Calcinosis, 4(6): 779-783Caloric soda, 4(5): 598-603Cancer, 4(3): 289-294, 4(6): 858-864Carcinomas, 4(4): 516-519Cardiac arrest, 4(4): 472-476Cardiopulmonary bypass, 4(2): 160-165Care, 4(1): 84-90Carotid endarterectomy, 4(2): 181-185Cataract, 4(6): 761-765Cell culture, 4(2): 209-212Central Anatolia, 4(2): 223-227Cerebral arteriovenous malformation, 4(4): 520-523Cervical vertebrae, 4(5): 703-709Cesarean operations, 4(2): 166-169Cesarean, 4(1): 1-6CGF, 4(1): 33-37CHAID, 4(3): 353-357Chalazion, 4(1): 13-17Charlson comorbidity index, 4(2): 142-146Chemotherapy, 4(6): 871-875Child, 4(3): 247-251Children, 4(3): 289-294, 4(5): 662-665, 4(6): 931-935, 4(6): 936-942, 4(6): 943-948Cholecystectomy, 4(5): 686-691Cholesterol, 4(5): 526-531Chronic hepatitis b virus infection, 4(6): 809-815Chronic hepatitis b, 4(1): 96-102Chronic kidney disease, 4(1): 45-48Chronic obstructive pulmonary disease, 4(3): 329-333, 4(4): 402-407Cilostazol, 4(3): 366-371Clinical aspects, 4(6): 876-881Clinical benefit, 4(6): 795-799Clinical findings, 4(4): 422-427
SUBJECT INDEX

Clinical, 4(5): 576-581CLSI, 4(5): 670-674Co-existence, 4(4): 422-427Colchicine, 4(3): 283-288Colistin, 4(5): 610-614Colonoscopy, 4(5): 646-649Colorectal cancer, 4(5): 646-649Comorbidity, 4(5): 532-537, 4(6): 919-926Compartment syndrome, 4(3): 391-393Complementary medicine, 4(3): 289-294Complete blood count, 4(6): 828-834Complication, 4(3): 391-393, 4(6): 766-771Computed tomography, 4(6): 840-844Condyloma, 4(4): 482-487Congenital heart surgery, 4(2): 160-165Conn sydrome, 4(1): 115-117Connective tissue disease, 4(3): 394-396Content analysis, 4(4): 412-415Conversion disorder, 4(6): 816-823Coordination impairment, 4(5): 532-537Coronavirus, 4(5): 634-638Cost analysis, 4(5): 735-740COVID-19 pandemic, 4(6): 865-870COVID-19 infection, 4(3): 388-390COVID-19 vaccines, 4(5): 692-697COVID-19, 4(1): 103-108, 4(1): 18-22, 4(1): 7-12, 4(2): 142-146, 4(2): 240-242, 4(3): 257-261, 4(3): 300-305, 4(3): 306-313, 4(3): 340-343, 4(3): 353-357, 4(3): 394-396, 4(4): 416-421, 4(4): 441-444, 4(4): 466-471, 4(4): 493-497, 4(4): 505-510, 4(5): 564-568, 4(5): 615-621, 4(5): 634-638, 4(5): 666-670, 4(5): 710-715, 4(5): 722-727, 4(5): 752-757, 4(5): 758-760, 4(6): 766-771, 4(6): 828-834, 4(6): 835-839, 4(6): 853-857, 4(6): 892-896, 4(6): 960-966, 4(6): 967-969cQT, 4(3): 349-352Craniometry, 4(1): 38-44C-reactive protein, 4(4): 505-510, 4(5): 686-691Critical leg ischemia, 4(3): 366-371Crohn’s disease, 4(3): 267-271, 4(3): 377-382, 4(5): 639-645Culture, 4(1): 84-90Cut-out, 4(2): 170-175Cyclic fatigue, 4(2): 176-180Cytotoxicity, 4(2): 209-212
DDapsone, 4(6): 800-808Data mining, 4(6): 960-966Delayed graft function, 4(1): 109-114Delivery, 4(1): 1-6Dental treatment, 4(5): 710-715Dentistry, 4(4): 412-415Depression, 4(1): 7-12, 4(2): 147-153, 4(4): 482-487Diabetes mellitus, 4(5): 589-597Diabetes, 4(3): 262-266Diabetic foot, 4(1): 49-54Diabetic foot, 4(2): 213-218Diabetic ketoacidosis, 4(5): 698-702Diabetic rat, 4(1): 33-37Diagnosis, 4(4): 451-456Diagnosis, 4(6): 897-900Dialysis, 4(3): 252-256Diarrhea, 4(2): 219-222Dientamoeba fragilis, 4(4): 422-427Diffuse large B cell lymphoma, 4(2): 123-126Disc herniation, 4(5): 703-709Disease activity score, 4(6): 784-789Disease severity, 4(1): 18-22Disulfide, 4(3): 277-282DMBA, 4(6): 772-778
DMFT, 4(5): 622-629Double-row repair, 4(5): 728-734Drug resistance, 4(2): 219-222Dural stenosis, 4(6): 845-852Dyslipidemia, 4(5): 526-531
EEastern, 4(5): 576-581ECG, 4(3): 349-352ECG, 4(6): 892-896Elderly people, 4(1): 103-108Elderly, 4(4): 488-492, 4(6): 871-875, 4(6): 919-926Electroneuromyography, 4(2): 213-218Emergency department, 4(4): 462-465, 4(4): 472-476, 4(4): 493-497, 4(5): 698-702Emergency, 4(5): 741-745, 4(6): 865-870End of life, 4(5): 656-661Endometrial polyp, 4(2): 154-159Endometrium cancer, 4(5): 552-556Enterococci, 4(5): 670-674Epidemic diseases, 4(3): 340-343Epidemiology, 4(5): 576-581, 4(6): 835-839Epidural fat, 4(6): 845-852Escherichia coli, 4(1): 28-32Esophageal cancer, 4(6): 901-906Essential elements, 4(5): 746-751Essential oil, 4(4): 445-450EUCAST, 4(5): 670-674Euthyroid sick syndrome, 4(3): 257-261Experience, 4(5): 569-575Exposure, 4(4): 511-515Extrapulmonary tuberculosis, 4(4): 451-456Extraspinal, 4(5): 582-588Eyelid, 4(1): 13-17
FFamilial Mediterranean fever, 4(5): 662-665Family medicine, 4(1): 63-70Fatique, 4(6): 858-864FDG-PET/CT, 4(6): 954-959Fecal occult blood test, 4(5): 646-649Female geriatric population, 4(2): 223-227Female, 4(4): 428-433Femoral head volume, 4(3): 358-365Ferric carboxymaltose, 4(1): 23-27Fertility outcome, 4(3): 272-276Fever, 4(2): 243-245Fibrinogen, 4(2): 166-169Fibromyalgia, 4(3): 377-382Fibrosis, 4(1): 96-102Fine needle aspiration biopsy, 4(5): 680-685Flank pain, 4(4): 462-465Flash glucose monitoring system, 4(6): 967-969Flaxseed oil, 4(4): 524-525Flaxseed, 4(4): 524-525FMF, 4(3): 283-288Frailty, 4(2): 192-197Free sugar, 4(5): 598-603Fresh sperm, 4(3): 272-276Frozen sperm, 4(3): 272-276Frozen-thawed embryo transfer, 4(2): 137-141Fruit drinks, 4(5): 598-603fT3, 4(3): 257-261
GGastric cancer, 4(5): 569-575, 4(6): 901-906General surgery, 4(1): 55-62Genetics, 4(6): 960-966

Geriatric population, 4(2): 192-197Ghrelin, 4(4): 402-407Glucose, 4(5): 589-597Graduate thesis, 4(4): 412-415Graft survival, 4(1): 109-114Ground glass opacity, 4(3): 394-396
HHead and neck, 4(5): 675-679Headache, 4(4): 428-433Health assessment questionnaire, 4(6): 784-789Health, 4(1): 84-90Healthcare professionals, 4(5): 692-697, 4(5): 716-721Health-related quality of life, 4(6): 919-926Heart surgery, 4(3): 372-376Heart valve replacement, 4(2): 186-191Helicobacter pylori, 4(6): 901-906Hemodialysis, 4(3): 397-399Hemoglobin, 4(1): 23-27Hemogram, 4(4): 498-504Hepatoprotective effect, 4(6): 772-778Hepatoprotective effects, 4(2): 233-239High blood pressure, 4(6): 824-827High dose vitamin c, 4(6): 967-969Histopathological, 4(4): 451-456Histopathology, 4(6): 901-906Hodgkin lymphoma, 4(6): 931-935Holmium laser, 4(3): 314-321Hope, 4(6): 858-864HPV, 4(4): 482-487Hydroxyethyl starch, 4(2): 166-169Hypercoagulability, 4(5): 758-760Hyperinsulinemia, 4(4): 524-525Hyperosmolar hyperglycemic syndrome, 4(5): 698-702Hyperplasia, 4(4): 516-519Hypertension, 4(1): 115-117Hypoechogenicity, 4(6): 886-891Hypofractionated dose, 4(6): 871-875Hypokalemia, 4(1): 115-117Hysteroscopy, 4(2): 154-159
IICSI, 4(3): 272-276ICU admission, 4(5): 666-670Inflammatory marker, 4(5): 557-563Intertrochanteric femoral fractures, 4(2): 170-175Immunodeficiency, 4(6): 936-942Immunohistochemistry pancreas, 4(3): 334-339Implant failure, 4(2): 170-175Impulsiveness, 4(6): 876-881In vitro fertilization, 4(2): 137-141, 4(5): 630-633Infection, 4(1): 49-54, 4(6): 907-911Inflammation, 4(2): 160-165, 4(4): 511-515, 4(6): 824-827Inflammatory bowel disease, 4(3): 267-271, 4(3): 377-382Inflammatory markers, 4(5): 662-665Inflammatory, 4(5): 543-551Inguinal hernia, 4(6): 865-870Injury, 4(5): 650-655Intensive care, 4(3): 329-333, 4(4): 505-510Intensive care unit, 4(3): 353-357, 4(4): 416-421, 4(6): 828-834, 4(5): 610-614Interference, 4(6): 967-969Interoceptive awareness, 4(2): 132-136Inter-shift fatigue, 4(5): 604-609Intracranial hemorrhage, 4(4): 472-476Intra-operative adhesion, 4(5): 686-691Intravenous iron, 4(1): 23-27
Iris diseases, 4(6): 761-765Iron deficiency anemia, 4(1): 23-27Ischaemia reperfusion injury, 4(6): 800-808
KKidney transplantation, 4(1): 109-114Kirschner wire, 4(5): 650-655Knowledge, 4(3): 340-343, 4(6): 790-794
LLaboratory features, 4(2): 142-146Lactate, 4(4): 493-497Laparoscopic gastrectomy, 4(5): 569-575Large unstained cells, 4(4): 477-481Length of hospital stay, 4(1): 55-62Length of stay, 4(5): 698-702Liver, 4(3): 295-299, 4(3): 334-339Living donor kidney transplantation, 4(3): 252-256Local anesthesia, 4(3): 314-321, 4(6): 761-765Long-term intensive care unit, 4(2): 118-122Lumbar, 4(5): 582-588Lung cancer, 4(3): 329-333Luteal phase support, 4(2): 137-141Lymph node metastasis, 4(5): 552-556Lymphangiogenesis, 4(3): 322-328Lymphatic endothelial cell markers, 4(3): 322-328Lymphoma, 4(5): 675-679
MMacrocytic erythrocyte population, 4(6): 828-834Magnetic resonance imaging, 4(5): 582-588, 4(6): 845-852Male, 4(3): 314-321Malignancy, 4(5): 675-679Malignant glioma, 4(6): 871-875Malnutrition, 4(1): 55-62, 4(4): 488-492, 4(6): 919-926Manganese, 4(4): 511-515Mean platelet volume (MPV), 4(1): 96-102, 4(2): 198-202, 4(3): 353-357, 4(4): 428-433 Medical devices, 4(5): 656-661Melphalan, 4(2): 203-208Membrane damaging, 4(4): 445-450Meningitis, 4(6): 907-911Menopause, 4(4): 498-504Mental health, 4(5): 752-757Metastasis, 4(4): 516-519Metastatic uterine leiomyosarcoma, 4(6): 795-799Methotrexate, 4(3): 277-282Methylated arginines, 4(5): 746-751Microbiological, 4(4): 451-456Midodrine, 4(3): 397-399Migraine, 4(3): 247-251, 4(4): 408-411, 4(6): 876-881Mini-tracheostomy needle, 4(2): 228-232Mini-tracheostomy, 4(2): 228-232Miscarriage rates, 4(3): 283-288Modified shock index, 4(5): 634-638Molecular biology, 4(6): 960-966Monocyte/lymphocyte ratio, 4(5): 686-691Mortality, 4(2): 142-146, 4(3): 252-256, 4(3): 344-348, 4(4): 441-444, 4(4): 493-497, 4(5): 543-551, 4(5): 576-581, 4(5): 666-670, 4(5): 741-745, 4(6): 828-834, 4(6): 892-896MPV, 4(3): 329-333mTORi, 4(1): 71-77MTT, 4(2): 209-212Multidrug resistance, 4(1): 49-54Multiple chronic health conditions, 4(5): 656-661Multiple myeloma, 4(2): 203-208Myalgia, 4(3): 300-305

Myocardial injury, 4(3): 388-390Myocarditis, 4(3): 388-390Myometrial invasion, 4(5): 552-556
NNausea, 4(4): 457-461Near-infrared spectroscopy, 4(2): 181-185Neck pain, 4(5): 703-709Neonate, 4(4): 520-523Nesfatin-1, 4(4): 402-407Neuroblastoma, 4(6): 943-948Neutrophil-to-lymphocyte ratio, 4(2): 142-146, 4(2): 198-202, 4(6): 824-827Nevus, 4(1): 13-17Newborn, 4(3): 262-266NG-mono-methylated-L-arginine, 4(6): 912-918Nickel-titanium, 4(2): 176-180Non diagnostic, 4(6): 886-891Nonalcoholic steatohepatitis score, 4(6): 954-959Non-hodgkin lymphoma, 4(2): 123-126Non-operatif,Non-steroidal anti-inflammatory agents, 4(1): 63-70Non-surviving, 4(3): 306-313Nrf2, 4(6): 772-778Nursing, 4(1): 84-90Nutrition assessment, 4(4): 488-492Nutrition, 4(4): 498-504Nutritional Risk Screening-2002, 4(1): 55-62Nutritional status, 4(6): 809-815, 4(6): 919-926
OO. acutidens, 4(4): 445-450Obesity, 4(3): 314-321, 4(6): 882-885Obsessive-compulsive disorder, 4(1): 7-12Obstructive, 4(6): 779-783Obstructive jaundice, 4(2): 233-239Obstructive sleep apnea, 4(6): 790-794Occupational burnout, 4(5): 604-609Occupational fatigue exhaustion/recovery scale, 4(5): 604-609OGTT, 4(3): 262-266Older adults, 4(2): 147-153Omalizumab, 4(5): 735-740Oncology nurses, 4(5): 604-609One curve, 4(2): 176-180Open gastrectomy, 4(5): 569-575Open heart surgery, 4(2): 186-191Oral glucose tolerance test, 4(3): 262-266Oral-dental health, 4(5): 622-629Osteoporosis, 4(6): 882-885Outcome, 4(4): 520-523Outpatients, 4(3): 306-313Ovarian torsion, 4(5): 630-633Overall survival, 4(6): 795-799Oxidative stres, 4(3): 277-282, 4(4): 524-525, 4(5): 639-645Oxygen saturation, 4(4): 434-440
Pp97/VCP, 4(3): 334-339Pain area, 4(3): 300-305Pain catastrophizing, 4(6): 876-881Pain management, 4(1): 63-70Pain, 4(1): 1-6Palliative care, 4(4): 488-492Palliative chemotherapy, 4(6): 795-799Pandemic, 4(1): 7-12, 4(6): 853-857Paranoiac, 4(1): 91-95Parathyroid, 4(4): 516-519
Parkinson disease, 4(2): 147-153Pathophysiology, 4(5): 538-542Patient care, 4(3): 372-376PDT, 4(2): 228-232Pentraxin-3, 4(4): 511-515Peptic ulcer disease, 4(3): 344-348Peptic ulcer perforation, 4(3): 344-348Peripheral arterial diseases, 4(3): 383-387Peripheral bypass surgery, 4(3): 383-387Perlecan, 4(5): 538-542Persistent hiccups, 4(2): 240-242Phacoemulsification, 4(6): 761-765Phosphorylcholine coated oxygenator, 4(2): 160-165Physician, 4(6): 790-794Pial arteriovenous fistula, 4(4): 520-523PLA, 4(1): 33-37Placenta tissue, 4(5): 746-751Placental weight, 4(5): 746-751Platelet count, 4(1): 96-102, 4(3): 329-333, 4(3): 353-357Platelet indices, 4(3): 329-333Platelet-to-lymphocyte ratio, 4(2): 198-202, 4(6): 897-900Pleuritis, 4(6): 907-911Pneumonia, 4(3): 394-396, 4(5): 634-638, 4(6): 766-771Polycystic ovarian syndrome, 4(4): 524-525, 4(5): 526-531, 4(5): 630-633Polyneuropathy, 4(2): 213-218Polyp, 4(5): 646-649Postnatal development, 4(3): 334-339Postural balance, 4(2): 127-131Posture, 4(5): 716-721Prediabetes, 4(5): 589-597Preeclampsia, 4(5): 538-542Pregnancy, 4(1): 28-32, 4(3): 262-266, 4(4): 457-461Prehospital, 4(5): 564-568Preoperative anxiety, 4(6): 949-953Prevalence, 4(2): 219-222, 4(6): 840-844Prevention, 4(5): 752-757Prevention guidelines, 4(4): 466-471Priapism, 4(6): 800-808Professional quality of life scale, 4(5): 604-609Progesterone, 4(2): 137-141Prognosis, 4(3): 300-305, 4(4): 416-421, 4(6): 835-839, 4(6): 853-857Progression, 4(2): 240-242Prostate cancer, 4(6): 897-900Proximal femoral nail, 4(2): 170-175Public health, 4(3): 340-343Pulmonary embolism, 4(5): 543-551, 4(5): 557-563Pulse, 4(4): 434-440
QQRS-T angle, 4(6): 892-896qSOFA, 4(5): 741-745Questionnaire, 4(6): 790-794
RRadiotherapy, 4(6): 931-935Rational drug use, 4(1): 63-70Reciproc blue, 4(2): 176-180Red ginseng, 4(2): 233-239Rehabilitation, 4(5): 716-721Reliability, 4(2): 132-136Renal allograft, 4(1): 71-77Renal infarction, 4(4): 462-465Renal resistive index, 4(1): 45-48Renal transplantation, 4(1): 71-77Residency training, 4(2): 228-232Restorative dentistry, 4(4): 434-440

Rheumatoid arthritis, 4(6): 784-789Rhythm, 4(3): 349-352Right infra-axillary thoracotomy, 4(2): 186-191Risk assessment, 4(5): 557-563Risk factors, 4(1): 49-54Risk perception, 4(4): 466-471Rotator cuff rupture, 4(5): 728-734Rural area, 4(5): 722-727
SSaline infusion sonohystygraphy, 4(2): 154-159Sarcopenia, 4(4): 402-407SARS-CoV-2, 4(4): 416-421Schizophrenia, 4(1): 91-95Seasonality, 4(2): 123-126Secondary lymphedema, 4(3): 322-328Self-adhesive flowable composite, 4(2): 209-212Self-esteem, 4(6): 816-823Self-harm, 4(5): 752-757Semmes-Weinstein monofilament test, 4(6): 784-789Sensorineural hearing loss, 4(3): 267-271Sepsis, 4(5): 741-745Severe asthma, 4(5): 735-740Sexual functioning, 4(4): 482-487Shigella, 4(2): 219-222Shock index, 4(5): 634-638Silicosis, 4(6): 912-918Simple hematologic indices, 4(1): 45-48Single file, 4(2): 176-180Single-row repair , 4(5): 728-734Sinus vein thrombosis, 4(4): 428-433Sjogren’s syndrome, 4(3): 394-396Skull, 4(1): 38-44Sleep apnea, 4(6): 779-783Sleep disorders, 4(2): 147-153Sleep quality, 4(1): 103-108Social media, 4(1): 91-95Social support, 4(1): 103-108Socioeconomic status, 4(5): 622-629Spasticity, 4(6): 927-930Spinal, 4(5): 582-588Spinal anaesthesia, 4(6): 949-953Spinal stenosis, 4(6): 845-852Spleen, 4(3): 295-299Splenomegaly, 4(5): 662-665Staging, 4(5): 552-556Sterile body fluids, 4(6): 907-911Stigma, 4(1): 91-95Stigmatization, 4(1): 91-95Stone formation, 4(1): 78-83Stone surgery, 4(1): 78-83Stroke, 4(2): 118-122, 4(2): 127-131, 4(2): 181-185Subjective Global Assessment, 4(1): 55-62Sugar sweetened beverages, 4(5): 598-603Suicide, 4(5): 752-757Supraspinatus, 4(5): 728-734Surgical treatment, 4(5): 650-655Survey, 4(5): 692-697, 4(6): 790-794Survival, 4(5): 656-661Surviving, 4(3): 306-313SUVmax, 4(6): 954-959Symmetric dimethyl arginine, 4(6): 912-918Sympathectomy, 4(3): 366-371Systemic hypertension, 4(6): 824-827Systemic immune-inflammation index, 4(5): 557-563, 4(6): 897-900
TTandem MIBG, 4(6): 943-948Tandem stem cell transplantation, 4(6): 943-948TENS, 4(3): 349-352
Thigh, 4(3): 391-393Thiol, 4(3): 277-282Thoracic, 4(6): 779-783Thyroid, 4(3): 257-261Thyroid cancer, 4(5): 680-685Thyroid fine needle aspiration biopsy, 4(6): 886-891Thyroid nodule, 4(5): 680-685Thyrotoxicosis, 4(2): 198-202Tightrope, 4(5): 650-655Tp-e interval, 4(5): 615-621Tp-e/qt and tp-e/qtc, 4(5): 615-621Tp-e/qt ratio and iceb, 4(3): 349-352Tracheal diverticula, 4(6): 840-844Tracheostomy, 4(2): 118-122Treatment, 4(4): 520-523Treatment, 4(6): 800-808Turkey, 4(5): 576-581Twitter, 4(1): 91-95Type 2 diabetes mellitus, 4(6): 882-885Type d personality, 4(6): 816-823
UUlcer, 4(1): 33-37Ulcerative colitis, 4(3): 267-271, 4(3): 377-382Ultrasonography, 4(5): 662-665, 4(6): 886-891Upper extremity function, 4(2): 127-131Upper gastrointestinal endoscopy, 4(6): 901-906Uric acid, 4(5): 639-645Urinary diversion, 4(1): 78-83Urinary tract infection, 4(1): 28-32Urine cultures, 4(2): 118-122Urine pH, 4(5): 589-597Urolithiasis, 4(4): 462-465
VValidity, 4(2): 132-136Validity and reliability, 4(4): 466-471Valproic acid, 4(4): 408-411Vancomycin, 4(5): 670-674Vertebral artery, 4(5): 703-709Vertigo, 4(3): 247-251Viral pandemic, 4(5): 722-727Visual analogue scale, 4(4): 408-411Vitamin d, 4(2): 223-227Volumetry, 4(6): 840-844Vomiting, 4(4): 457-461
WWarfarin, 4(2): 192-197Water clear cells, 4(4): 516-519Watercress, 4(6): 772-778White blood cell, 4(5): 686-691White coat hypertension, 4(6): 824-827Wild and cultured form, 4(4): 445-450
XXenobiotic enzymes, 4(6): 772-778
YYouTube, 4(3): 340-343, 4(6): 927-930YouTube® videos, 4(3): 372-376

AAbdülrezzak Ü, 4(6): 931-935Abit Kocaman A, 4(5): 532-537Acar N, 4(4): 472-476Ademoğlu Dilekçi EN, 4(3): 377-382Ağar E, 4(4): 482-487Ak R, 4(3): 353-357, 4(4): 441-444, 4(5): 698-702, 4(5): 758-760Akar M, 4(1): 96-102, 4(3): 400-401Akarsu M, 4(5): 666-670Akarsu S, 4(4): 412-415Akcan G, 4(3): 277-282, 4(3): 334-339Akdoğan Kayhan M, 4(3): 377-382Akdulum İ, 4(6): 840-844Akıncı Özyürek B, 4(6): 766-771Akkurt ES, 4(6): 766-771Aksu K, 4(5): 735-740Aktaş S, 4(1): 71-77, 4(3): 252-256Aktekin L, 4(6): 784-789Akyol M, 4(2): 132-136Akyol Ş, 4(6): 931-935Alagöz A, 4(2): 228-232Alagüney ME, 4(5): 746-751Alatlı T, 4(4): 462-465Alay H, 4(1): 49-54, 4(2): 213-218, 4(2): 240-242, 4(5): 741-745Albayrak İH, 4(6): 897-900Aliefendioğlu D, 4(3): 262-266Alimoğulları E, 4(3): 334-339Alkan Kuşabbi İ, 4(2): 233-239Alkurt EG, 4(5): 686-691Alp Ç, 4(3): 397-399Altun Ö, 4(4): 402-407Altun Tuzcu Ş, 4(6): 954-959Altundağ MB, 4(6): 871-875Altuntaş F, 4(2): 123-126, 4(2): 203-208Aras A, 4(5): 741-745Aras B, 4(6): 927-930Araz Ö, 4(2): 240-242Arıcan B, 4(2): 176-180Arıcan ÇD, 4(5): 569-575Arman Y, 4(4): 402-407Arslan A, 4(3): 372-376Arslan M, 4(2): 198-202, 4(6): 931-935Arslan S, 4(4): 402-407Arslanca T, 4(5): 538-542Aslan O, 4(6): 865-870Atav Ateş A, 4(2): 176-180Atay K, 4(6): 772-778Ateş C, 4(5): 543-551Ateş H, 4(5): 735-740Ateş M, 4(5): 552-556Avşar E, 4(6): 824-827Aydemir S, 4(5): 543-551, 4(6): 892-896Aydil U, 4(5): 675-679Aydın A, 4(5): 680-685Aydın E, 4(5): 610-614Aydın Güzey N, 4(2): 166-169Aydoğan Arslan S, 4(2): 127-131Azak C, 4(6): 871-875Azamat İF, 4(5): 569-575
BBağ YM, 4(2): 233-239
Bahadırlı S, 4(4): 493-497, 4(4): 505-510Bakır EP, 4(4): 434-440, 4(5): 622-629Bakır Ş, 4(4): 434-440, 4(5): 622-629Bakırdöğen S, 4(1): 45-48Bakırtaş M, 4(2): 123-126, 4(2): 203-208Bakkal FK, 4(5): 675-679Balcı A, 4(6): 790-794Balcı PÖ, 4(3): 306-313Başa Akdoğan B, 4(5): 735-740Başar H, 4(2): 170-175Basat S, 4(2): 192-197, 4(2): 123-126, 4(2): 203-208Basılgan S, 4(2): 170-175, 4(5): 650-655Batgi H, 4(2): 123-126, 4(2): 203-208Bayrak M, 4(6): 919-926Bayram M, 4(5): 666-670Baysal NA, 4(2): 123-126, 4(2): 203-208Bedir Keser G, 4(5): 639-645Berber İ, 4(1): 18-22, 4(2): 142-146Beyazıt Y, 4(2): 198-202Biçim S, 4(2): 142-146Bilge N, 4(2): 213-218, 4(2): 240-242, 4(5): 576-581Bilgi A, 4(5): 552-556Bilici S, 4(5): 598-603Birgin İritaş S, 4(6): 912-918Bitirim MA, 4(5): 569-575Bolat A, 4(1): 33-37, 4(2): 160-165, 4(3): 366-371Bolat E, 4(2): 160-165Bostanoğlu S, 4(3): 295-299Bozkurt ÖF, 4(1): 78-83, 4(3): 314-321Bülbül S, 4(5): 752-757Bulut D, 4(4): 416-421Bulut GT, 4(3): 322-328Bulut İ, 4(3): 289-294Bulut YE, 4(3): 289-294Bursa N, 4(5): 722-727Burulday V, 4(4): 416-421Büyük SK, 4(4): 412-415Büyükkuşcu A, 4(3): 391-393Büyükkuşcu MÖ, 4(2): 170-175, 4(3): 391-393
C-ÇÇağaşar Ö, 4(1): 18-22-, 4(2): 142-146Çağlar Yılmaz H, 4(6): 772-778Çakar MK, 4(2): 123-126-, 4(2): 203-208Çam AB, 4(1): 45-48-, 4(5): 557-563Can A, 4(5): 741-745Can G, 4(3): 377-382Can S, 4(4): 451-456Çanakçı ME, 4(4): 472-476Çankal F, 4(6): 845-852Canöz Ö, 4(6): 931-935Çapraz M, 4(3): 349-352-, 4(6): 882-885Çaylı S, 4(3): 334-339Çelik Ç, 4(5): 552-556Çelik M, 4(6): 858-864Çelik S, 4(4): 416-421Çelikel E, 4(4): 428-433Çelikhisar H, 4(1): 103-108, 4(2): 147-153, 4(4): 402-407Cengiz H, 4(5): 680-685Çepni Ş, 4(3): 300-305Çetin Duran A, 4(5): 670-674Çetin M, 4(3): 306-313
AUTHOR INDEX

Çetin Ş, 4(3): 306-313Çetin Z, 4(6): 886-891Çetin-Duran A, 4(6): 907-911Çetinkaya HB, 4(4): 462-465Çiftçi H, 4(6): 897-900Çiftçi M, 4(1): 78-83Çil İ, 4(5): 569-575Çilekar Ş, 4(6): 790-794Cırık MÖ, 4(2): 228-232, 4(3): 329-333Çoban E, 4(6): 824-827Çölkesen F, 4(4): 451-456Coşğun İG, 4(6): 790-794Coşkun Beyan A, 4(6): 912-918Coşkuner İ, 4(1): 63-70
DDal MS, 4(2): 123-126, 4(2): 203-208Darçın T, 4(2): 123-126, 4(2): 203-208Daşdemir Gİ, 4(2): 147-153Daşdemir İlkhan G, 4(4): 402-407Daştan Aİ, 4(4): 498-504Demir M, 4(6): 897-900Demir ME, 4(1): 71-77, 4(1): 109-114, 4(2): 246, 4(3): 252-256, 4(3): 397-399Demir U, 4(6): 828-834Demir Y, 4(2): 132-136Demirbaş B, 4(2): 192-197Demirci T, 4(5): 680-685Demirel E, 4(3): 300-305Deniz S, 4(4): 511-515, 4(5): 746-751, 4(6): 912-918Deresoy FA, 4(6): 800-808Dilekçi E, 4(3): 377-382Dinçaslan H, 4(3): 289-294Doğan M, 4(6): 795-799Doğan N, 4(2): 240-242Doğan S, 4(5): 752-757Doğanay F, 4(3): 353-357Doğanay F, 4(4): 441-444Dokuzeylül Güngör N, 4(2): 137-141, 4(3): 272-276, 4(5): 630-633Düğeroğlu H, 4(6): 853-857Duman Y, 4(1): 91-95Dündar AS, 4(5): 666-670Dünder E, 4(2): 132-136Durak D, 4(5): 686-691Durhan A, 4(2): 233-239, 4(3): 344-348Durmuş E, 4(5): 564-568Dursun MA, 4(6): 901-906Duymuş ME, 4(2): 233-239Düzenli T, 4(5): 646-649
EEken G, 4(5): 650-655, 4(5): 728-734Ekinci İ, 4(5): 666-670Ekmen N, 4(5): 639-645Eraslan Doğanay G, 4(2): 228-232, 4(3): 329-333Eraslan E, 4(6): 795-799Eraslan P, 4(5): 604-609Eravcı FC, 4(5): 675-679Ercan Karadağ M, 4(6): 912-918Erdem AB, 4(4): 428-433Erdem H, 4(4): 516-519Erel Ö, 4(3): 277-282Eren MB, 4(3): 358-365Ergüder E, 4(2): 233-239Erkanlı K, 4(3): 383-387Erkayıran U, 4(5): 538-542
Erkekol FÖ, 4(5): 735-740Erkent M, 4(3): 295-299Erkuş Sirkeci E, 4(1): 115-117Eroğlu E, 4(2): 243-245, 4(4): 451-456Erşahin Söylemez N, 4(1): 7-12Ersoy O, 4(3): 400-401Ertabaklar H, 4(4): 422-427Ertan Ö, 4(6): 766-771Ertaş G, 4(6): 871-875Ertorul D, 4(5): 569-575Ertuğ S, 4(4): 422-427Esen MF, 4(6): 960-966Eser EP, 4(2): 233-239Evirgen O, 4(3): 277-282
GGemalmaz H, 4(2): 186-191, 4(3): 366-371Gökçe Ş, 4(5): 526-531Gökhan A, 4(4): 445-450Gökler ME, 4(6): 766-771Gökmen O, 4(1): 7-12Göksoy B, 4(5): 569-575Gözükara Bağ H, 4(1): 18-22, 4(2): 142-146Güçlü M, 4(5): 630-633Gülbahar Ö, 4(2): 160-165Güler AH, 4(5): 552-556Gülhan Yaşar N, 4(5): 675-679Gültekin Y, 4(1): 33-37, 4(2): 160-165, 4(2): 186-191, 4(3): 366-371Gülten S, 4(6): 828-834Gültepe A, 4(5): 722-727Günay E, 4(6): 790-794Günay M, 4(5): 728-734Güneysu F, 4(5): 564-568Güngörer B, 4(4): 477-481Gürbüz T, 4(1): 1-6, 4(1): 7-12, 4(2): 137-141Gürler M, 4(3): 267-271, 4(3): 377-382Gürün E, 4(6): 840-844Güzel F, 4(6): 954-959Güzel S, 4(1): 55-62Güzel Tanoğlu E, 4(6): 960-966Güzel Y, 4(6): 954-959Güzelküçük Ü, 4(5): 716-721Güzoğlu N, 4(3): 262-266
HHaque A, 4(4): 524-525Harmancı H, 4(6): 876-881Herkiloğlu D, 4(5): 526-531Hocaoğlu A, 4(5): 746-751Hökenek NM, 4(5): 634-638, 4(5): 698-702Hoşgün D, 4(5): 543-551Hücümenoğlu S, 4(2): 233-239
I-İİlhan A, 4(5): 604-609, 4(6): 795-799İlhan Alp S, 4(1): 103-108İlkhan Daşdemir G, 4(1): 103-108İnan Çatan F, 4(6): 828-834İnanç İH, 4(5): 722-727İnanç ÖF, 4(5): 569-575İnanlı E, 4(1): 7-12İpek MŞ, 4(4): 520-523İritaş SB, 4(4): 511-515Irmak O, 4(6): 907-911İşçi E, 4(4): 466-471İskender D, 4(2): 123-126, 4(2): 203-208

JJafari-Sales A, 4(2): 219-222
KKaçar F, 4(4): 451-456Kadiroğlu AK, 4(5): 610-614Kahraman S, 4(1): 84-90Kahvecioğlu F, 4(2): 209-212Kamaşak B, 4(1): 38-44Kamış F, 4(1): 45-48, 4(2): 198-202Kaplan İ, 4(6): 954-959Kaptan G, 4(1): 7-12Karadağ E, 4(6): 858-864Karadeniz SB, 4(1): 7-12Karagöz E, 4(6): 967-969Karagözoğlu İ, 4(5): 710-715Karakaya A, 4(3): 383-387Karakılıç E, 4(2): 198-202Karaküçük S, 4(5): 538-542Karakükcü M, 4(6): 931-935, 4(6): 936-942, 4(6): 943-948Karaman Ç, 4(4): 498-504Karapınar M, 4(5): 532-537Karapınarlı B, 4(4): 428-433Karatana Ö, 4(4): 466-471Kartal B, 4(3): 334-339Katar M, 4(6): 800-808Katı B, 4(6): 897-900Kaya M, 4(6): 840-844Kaya N, 4(4): 466-471Kaya UB, 4(4): 428-433Kayalar N, 4(2): 181-185Kazğan Kılıçaslan A, 4(6): 816-823Keleş H, 4(5): 703-709Keleşoğlu Ş, 4(5): 615-621Kendirci M, 4(3): 295-299Kepenekçi Bayram İ, 4(1): 55-62Keser A, 4(1): 55-62Keser Şahin HH, 4(5): 552-556Keserci Ö, 4(5): 610-614Keskin ED, 4(2): 127-131Keskin Kavak S, 4(6): 784-789Kesmez Can F, 4(1): 49-54, 4(2): 213-218, 4(2): 240-242, 4(5): 741-745Kılavuz A, 4(2): 147-153Kılınçer A, 4(3): 394-396Kipalev Neşelioğlu A, 4(3): 277-282Kırıcı Berber N, 4(1): 18-22, 4(2): 142-146Kırık S, 4(3): 247-251Kıyak M, 4(2): 192-197, 4(5): 569-575, 4(5): 646-649Kızıl Y, 4(5): 675-679Kızılgül M, 4(6): 967-969Koca Kalkan İ, 4(5): 735-740Kocagözoğlu SG, 4(5): 752-757Kocamış Sİ, 4(6): 761-765Kokoz Çitaker Ö, 4(5): 622-629Köksal AR, 4(5): 666-670Kölükçü E, 4(3): 314-321, 4(6): 800-808Kölükçü V, 4(3): 314-321Kölüş T, 4(2): 209-212Komut E, 4(5): 582-588Kontaş O, 4(6): 931-935Korkmaz S, 4(6): 816-823Korkmaz ŞA, 4(1): 91-95Koşmaz K, 4(2): 233-239, 4(3): 344-348Köycü Buhari G, 4(5): 735-740Kul B, 4(6): 876-881
Kula Atik T, 4(5): 670-674, 4(6): 907-911Kulhan M, 4(5): 552-556Kurt E, 4(4): 493-497, 4(4): 505-510Kurt N, 4(4): 416-421Kurt O, 4(6): 816-823Kutsal A, 4(2): 160-165Kuzu Ö, 4(6): 927-930Li W, 4(3): 306-313Malatyalı E, 4(4): 422-427Mansoor S, 4(4): 524-525Mercan Ü, 4(3): 344-348Merdin A, 4(2): 123-126, 4(2): 203-208Merhametsiz Ö, 4(1): 109-114, 4(1): 71-77, 4(3): 252-256Miniksar DY, 4(6): 949-953Miniksar ÖH, 4(6): 949-953Mısır A, 4(2): 170-175Mızrah Şahin B, 4(4): 457-461Mortaş H, 4(5): 598-603Muralidhar A, 4(1): 13-17
NNakkaş H, 4(3): 277-282Neşelioğlu S, 4(3): 277-282Nurlu N, 4(3): 322-328
O-ÖOkyay K, 4(3): 388-390Ösken A, 4(5): 557-563Öten E, 4(3): 349-352, 4(6): 882-885Oymak B, 4(4): 488-492Özakın E, 4(4): 472-476Özcan A, 4(6): 931-935, 4(6): 943-948Özcan Ai Cansever M, 4(6): 936-942Özcelik F, 4(4): 498-504Özçelik İK, 4(4): 498-504Özdedeoğlu Ö, 4(5): 735-740Özdemir Ş, 4(4): 451-456Özen A, 4(1): 84-90Özen N, 4(6): 907-911Özer H, 4(3): 394-396Özgör B, 4(3): 247-251Özgüner HM, 4(3): 277-282Özkan MB, 4(3): 295-299, 4(6): 865-870Özkars MY, 4(3): 247-251Özkurt Z, 4(2): 240-242Özmen RS, 4(5): 666-670Özolcay O, 4(2): 154-159Özpınar S, 4(2): 132-136Özpolat G, 4(6): 919-926Öztan Ö, 4(6): 912-918, 4(4): 511-515, 4(5): 746-751Öztek Çelebi FZ, 4(5): 656-661Öztin H, 4(4): 488-492Öztürk Durmaz Ş, 4(6): 835-839Öztürk İ, 4(4): 488-492Öztürk R, 4(5): 692-697
PParlak M, 4(1): 49-54, 4(2): 213-218Parlaktaş BS, 4(3): 314-321, 4(6): 800-808Parlar Öz Ö, 4(5): 710-715Parpucu Bağçeci K, 4(4): 472-476Patat D, 4(6): 845-852Patıroğlu T, 4(6): 936-942Pekcici MR, 4(2): 233-239Peker H, 4(4): 516-519Pelit ES, 4(6): 897-900Polat A, 4(2): 170-175

RRani A, 4(4): 524-525
S-ŞŞabanoğlu C, 4(5): 722-727Sadioğlu FE, 4(1): 78-83Sağ Güngör F, 4(2): 209-212Şahan E, 4(6): 892-896Şahin A, 4(3): 300-305Şahin Aker S, 4(4): 482-487Şahin D, 4(2): 123-126, 4(2): 203-208Şahin F, 4(6): 865-870Şahin Özdemirel T, 4(6): 766-771Şahin Ş, 4(5): 656-661Şahin T, 4(6): 761-765Şahiner İT, 4(3): 295-299Saka Baran B, 4(3): 400-401Samur MB, 4(6): 943-948Sanmak E, 4(1): 28-32Sarıçam G, 4(2): 118-122Sarıcı A, 4(1): 18-22, 4(2): 142-146Sarıkaya K, 4(1): 78-83, 4(3): 314-321Sarıkaya R, 4(4): 416-421Satılmış B, 4(6): 772-778Savaş Özolcay ŞA, 4(2): 154-159Savcun Demirci C, 4(2): 127-131Sayar MS, 4(4): 416-421Sazak H, 4(2): 228-232Seçilmiş J, 4(2): 123-126Şenes M, 4(2): 233-239Şenlikci A, 4(2): 233-239, 4(3): 344-348Şenocak Ç, 4(1): 78-83, 4(3): 314-321Sevmiş M, 4(1): 71-77, 4(3): 252-256Sevmiş Ş, 4(1): 71-77, 4(3): 252-256Seyithanoğlu M, 4(5): 538-542Sezer N, 4(6): 784-789Sezikli İ, 4(6): 865-870Shariat A, 4(2): 219-222Shauyet I, 4(2): 192-197Sig AK, 4(5): 670-674, 4(6): 907-911Şık BA, 4(2): 154-159Şimşir C, 4(5): 746-751Sirekbasan S, 4(3): 340-343Şirinoğlu T, 4(6): 845-852Sirkeci Ö, 4(1): 115-117Şıvgın H, 4(3): 306-313Şıvgın S, 4(3): 306-313Solakoğlu T, 4(3): 400-401Sönmezgöz E, 4(5): 662-665Sönmezgöz F, 4(5): 662-665Söylemez İ, 4(1): 7-12Soylu B, 4(5): 666-670Soylu VG, 4(6): 828-834Sözel H, 4(5): 589-597Süleyman M, 4(2): 233-239, 4(3): 344-348Sümer Coşkun A, 4(6): 835-839Surel AA, 4(4): 477-481Sürer S, 4(2): 160-165Süzük Yıldız S, 4(3): 340-343
TTabak Ö, 4(5): 666-670Taçyıldız N, 4(3): 289-294Tan AK, 4(5): 716-721Tanoğlu A, 4(1): 115-117, 4(2): 192-197, 4(4): 498-504Tanrıdan Okçu N, 4(1): 1-6Tarakçı A, 4(2): 243-245
Tarakçı A, 4(4): 451-456Taşdemir B, 4(6): 954-959Taşkın Ö, 4(6): 828-834Taşlıdere A, 4(6): 772-778Tazegül G, 4(6): 824-827Tekin E, 4(5): 741-745Tekin M, 4(1): 23-27, 4(1): 28-32Tekyol D, 4(5): 634-638Tepe N, 4(4): 408-411Tileklioğlu E, 4(4): 422-427Tok A, 4(5): 538-542Topaloğlu ÖF, 4(3): 394-396Topçu R, 4(3): 295-299, 4(6): 865-870Toy E, 4(6): 949-953Tükek, 4(4): 402-407Türken R, 4(4): 412-415Türksoy VA, 4(4): 511-515, 4(5): 746-751, 4(6): 912-918Türktekin N, 4(3): 283-288Tursun S, 4(3): 262-266Tutan MB, 4(5): 686-691Tutkun E, 4(4): 511-515, 4(6): 912-918Tutkun L, 4(4): 511-515, 4(5): 746-751
U-ÜÜçer AR, 4(6): 871-875Uğur Ö, 4(6): 858-864Uğurlu K, 4(2): 127-131Uğurlucan M, 4(3): 383-387Ulcay T, 4(1): 38-44Ülgen A, 4(3): 306-313Ülker HE, 4(2): 209-212Ulukan MÖ, 4(3): 383-387Uluocak N, 4(6): 800-808Ulusoy Kaymak S, 4(1): 91-95Ulutaş Ö, 4(1): 18-22, 4(2): 142-146Ünal Çetin E, 4(2): 198-202Ünal E, 4(3): 257-261, 4(3): 289-294, 4(6): 931-935, 4(6): 936-942, 4(6): 943-948Ünal EG, 4(3): 262-266Ünal S, 4(4): 434-440Uncu Ulu B, 4(2): 123-126, 4(2): 203-208Unsal V, 4(6): 800-808Uran Şan A, 4(5): 703-709, 4(5): 716-721Ustaalioğlu İ, 4(5): 758-760Utlu M, 4(3): 300-305Uyar A, 4(6): 954-959Uyar M, 4(1): 71-77, 4(3): 252-256Uyar Türkyılmaz HE, 4(2): 166-169Uysal E, 4(3): 394-396, 4(4): 434-440Uyumlu AB, 4(6): 772-778Uzun F, 4(1): 23-27, 4(1): 28-32Uzun ND, 4(1): 23-27, 4(1): 28-32
VVarım C, 4(5): 680-685Veizi E, 4(3): 300-305Venugopal SB, 4(1): 13-17Vergili MA, 4(3): 334-339
YYağmur İ, 4(6): 897-900Yakupoğulları Y, 4(2): 142-146Yalçın AN, 4(6): 835-839Yalçın K, 4(6): 954-959Yasir FÇ, 4(2): 142-146Yavuz LG, 4(3): 289-294Yavuz Veizi BG, 4(3): 300-305

Yeral Mİ, 4(3): 262-266Yevgi R, 4(5): 576-581Yiğenoğlu TN, 4(2): 123-126, 4(2): 203-208Yıldırım A, 4(1): 18-22Yıldırım MB, 4(3): 295-299, 4(6): 865-870Yıldırım Ö, 4(5): 666-670Yıldırım T, 4(2): 223-227, 4(6): 901-906Yıldız F, 4(6): 795-799Yıldız İ, 4(4): 422-427Yıldız J, 4(2): 123-126, 4(2): 203-208Yıldız S, 4(6): 816-823Yıldız V, 4(3): 262-266Yılmaz A, 4(4): 520-523, 4(6): 828-834Yılmaz Aydın F, 4(5): 610-614Yılmaz E, 4(5): 758-760, 4(6): 931-935, 4(6): 936-942, 4(6): 943-948Yılmaz F, 4(5): 589-597Yılmaz G, 4(5): 569-575Yılmaz K, 4(3): 257-261Yılmaz MS, 4(4): 428-433Yılmaz Önal H, 4(6): 809-815Yılmaz S, 4(1): 49-54Yılmaz TE, 4(1): 63-70Yılmaz Y, 4(5): 615-621Yozgat A, 4(3): 267-271Yücel C, 4(2): 181-185Yurci A, 4(2): 137-141, 4(3): 272-276, 4(3): 283-288, 4(5): 630-633
ZZararsız G, 4(6): 931-935Zorlu Ç, 4(6): 779-783

AACAR AydınAKAY NeşetAKDİ AhmetAKINCI ÖZYÜREK BernaAKMANSU MügeAKYOL AlparslanALANYA TOSUN ŞebnemALPASLAN MeteARSLAN SerdarASİRVATHAM RajuATILGAN Hasan İkbalATILGAN Kadir GökhanATİK AzizAYDIN Bahattin KeremAYDIN GülçinAYDOĞAN Tolga
BBAÇÇIOĞLU AyşeBASTURK ABAYRAK MuharremBEKTAŞ AKPINAR NilayBERBER İlhamiBERBER UfukBEYAZIT FatmaBEYAZIT YavuzBEYSEL SelvihanBOLAT EsefBOZKURT YILMAZ Hatice Eylül
C CAN GürayCANBEYLİ İbrahim DenizCESUR Salih
ÇÇETİNKAYA MehmetÇADIRCI KenanÇAPRAZ AylinÇAPRAZ MustafaÇARLIOĞLU AyşeÇELİK EtemÇITIRIK MehmetÇİFCİ AydınÇOŞKUN BuğraÇULLU Neşat
DDEMİR Mehmet EminDEMİRCİ TanerDERİCİ Mehmet KürşatDOĞAN EmrahDOĞAN RuhiDÜĞEROĞLU Harun
EERDOĞAN ElifERGÜN İhsanEROĞLU OğuzERSÖZ ALAN Burcu
GGENÇOAMANOĞLU GülenayGÖKMEN KARASU Ayşe FilizGÖKMEN SüleymanGÜL SerdarGÜLTEKİN YıldırımGÜZEY ARAS Yeşim
HHACIBEKİROĞLU Tuba
IISSIN Ahmet
KKABALCI MehmetKAÇMAZ BirgülKANDEMİR HüseyinKARADENİZ MuhammedKARAHACI OĞLU ErayKARAHAN İrfanKARALEZLİ AyşegülKARATAY EylemKARLI PervinKAYA AhmetKAYA MustafaKESER ŞAHİN Havva HandeKILIÇ Mustafa KemalKIRICI PınarKIZILARSLANOĞLU Muhammet CemalKİZİLGUL MuhammedKOCA GökhanKOÇAK ErdemKOÇAK FİDAN NurdanKORKMAZ HakanKORKMAZ SerdalKORKMAZ Şükrü AlperenKÖLÜKÇÜ EnginKÖSE HaticeKUTLUER GülşenKÜLTÜR Turgut
MMİNİKSAR Ökkeş HakanMORTAŞ Tülay
ÖÖCAL RuhsenÖĞDEN MustafaÖTEN ErolÖZÇİFTÇİ SerhatÖZDEMİR AdnanÖZDEMİR CoşkunÖZEN MehmetÖZKAN DeryaÖZKUK KağanÖZSOY Metin
PPAÇ MustafaPEHLİVANLI FarukPEKER KevserPEKER NurullahPOLAT Reyhan
REVIEWER LIST

SSARI OktaySARI TuğbaSEL GörkerSELVİ ÖzgürSema ÖZKAN ZehraSİG Ali KorhanSUNGUR Nezih
ŞŞAHAN Mehmet HamdiŞAHİN ErcanŞAHİN MustafaŞAHİN OrçunŞENCAN ZiyaŞENER EmineŞENGÜL AYÇİÇEK GözdeŞİMŞİR Coşkun
TTANOĞLU AlpaslanTARHAN GülnurTAŞDELEN YEŞİLDAL FatmaTEKELİ Arzu EsenTEMOÇİN FatihTOĞRUL CihanTOPCU RamazanToptaş MehmetTUTKUN Engin
UULUSOY M. GürhanUTKU Özlem Gül
VVERGİLİ Özge
YYALÇIN SelimYALIM ZaferYENİÇERİ MuratYERAL İlkinYILDIZ KadriYILMAZ YücelYILMAZSOY YunusYİLMAZ Kerem
ZZENGİN Mehmet

PUBLICATION RULES, PUBLICATION POLICY, GENERAL PRINCIPLES AND SUBMISSION RULES
AUTHOR GUIDELINES Journal of Health Sciences and Medicine (JHSM) is a refereed, open access and periodical publication. The articles published according to the journal’s writing rules are accepted through the DergiPark system. All numbers are available at our https://dergipark.org.tr/en/pub/jhsm/archive web address and Dergipark web page for free. Our purpose is to provide high-quality scientific articles for diseases’diagnosis and treatment having appropriate innovations internationally. It is a scientific medical journal published six times (January, March, May, July, September, November) a year. The articles coming as a refereed journal are primarily evaluated in terms of common rules conformity with the standard requirements defined by the Committee of International Medical Journal Editors (www.icmje.org) in biomedical articles. You can access all of the articles published in our journal electronically, read and download from our web site (https://dergipark.org.tr/en/pub/jhsm). Our goal is to make sure that your colleagues send the decision and publishing process of publications that we send to you in the shortest possible time. We would like to emphasize that we are always open to suggestions and constructive criticisms to raise the quality of our publication, and that we will show the necessary sensitivity to the statements in this regard. The English name of the journal will be used in the article operating system and citations.
Journal of Health Sciences and Medicine (JHSM) It is a scientific, internationally refereed journal that publishes retrospective/prospective clinical and laboratory studies, interesting case presentations, invited collections, editorial letters, original images, short reports and surgical technical articles about every branch of medicine. The language of the journal is English. Articles are accepted in English. Sent for evaluation to be published or published articles in another journal or not written in accordance with the journal’s rules are not accepted for evaluation. The editor, co-editor and publisher do not take any responsibility for the articles published in the journal.You can access all of the articles published in our journal electronically, read and download from our web site: https://dergipark.org.tr/en/pub/jhsm.
JOURNAL NAME Journal of Health Sciences and Medicine
ABBREVIATION OF JOURNAL NAME J Heatlh Sci Med/JHSM
CORRESPONDENCE ADDRESS Manuscripts should be sent by e-mail by the responsible author, after registering with DergiPark, by going to https://dergipark.org.tr/en/journal/2316/submission/step/manuscript/new.
ARTICLE GENERAL WRITING RULES All scientific responsibility of the manuscripts belongs to the author (s). The editor, co-editor and publisher do not accept any responsibility for the articles published in the journal.
EDITORIAL PRE-CONTROL EVALUATION Manuscripts sent to the Journal of Health Sciences and Medicine (JHSM) are evaluated in terms of format and plagiarism. Manuscripts that do not conform to the format are sent back to the author responsible for evaluation. Spelling rules should be reviewed to avoid such a waste of time. All manuscripts submitted for publication are evaluated by two or more domestic/foreign referees. The evaluation of the articles is made considering the scientific importance and originality. Manuscripts that are accepted for publication can be rearranged by the editorial board without informing the authors. After the article is submitted to the journal or accepted for publication, the order of names cannot be changed, author name cannot be added or removed.
SCIENTIFiC AND ETHICAL RESPONSIBILITYThe editorial and the publication processes of Journal of Health Sciences and Medicine (JHSM) are shaped in accordance with the guidelines of the World Association of Medical Editors (WAME), the Committee on Publication Ethics (COPE), the International Council of Medical Journal Editors (ICMJE), the Council of Science Editors (CSE), the European Association of Science Editors (EASE) and National Information Standards Organization (NISO). The journal conforms to the Principles of Transparency and Best Practice in Scholarly Publishing (doaj.org/bestpractice).
HEALTH SCIENCESMEDICINE

The protocol for clinical research articles must be approved by the Ethics Committee. In all studies conducted on humans, the “Material and Method” section was approved by the relevant committee or the Helsinki Declaration of Principles (https://www.wma.net/what-we-do/medical-ethics/declaration-of-helsinki/). It should be stated in the text that all persons included in the study signed the Informed Consent Form. The articles submitted to the Journal of Health Sciences and Medicine (JHSM) will be deemed to have been conducted in accordance with the Helsinki Declaration of Principles, and have received ethical and legal permissions and will not be held responsible. If “Animal” was used in the study, the authors stated in the Materials and Methods section of the article that they protect animal rights in accordance with the principles of the Guide for the Care and Use of Laboratory Animals (www.nap.edu/catalog/5140.html), and that they have received approval from the ethics committees of their institutions. it is difficult. In case reports Informed Consent an should be obtained from patients regardless of the identity of the patient. If the Ethics Committee Approval is required in the article; the received document should be sent with the article. The article should be passed by the authors for academic plagiarism prevention program. It is the authors’responsibility to ensure that the article complies with the ethical rules.
All manuscript submissions should be scanned for plagiarism research and then uploaded to the journal system. In the event of alleged or suspected research misconduct, e.g., plagiarism, citation manipulation, and data falsification/fabrication, the Editorial Board will follow and act in accordance with the COPE guidelines. See Guidance from the Committee on Publication Ethics (COPE).
Each individual listed as an author should fulfill the authorship criteria recommended by the International Committee of Medical Journal Editors (ICMJE- www.icmje.org). The ICMJE recommends that authorship should be based on the following 4 criteria: (1) Substantial contributions to the conception or design of the work; or the acquisition, analysis, or interpretation of data for the work; (2) Drafting the work or revising it critically for important intellectual content; (3) Final approval of the version to be published; (4) Agreement to be accountable of all aspects of the work in ensuring that questions related to the accuracy or the integrity of any part of the work are appropriately investigated and resolved.
In addition to being accountable for the parts of the work he/she had done, an author should be able to identify which co-authors are responsible for the specific other parts of the work. In addition, authors should have confidence in the integrity of the contributions of their co-authors.
All those designated as authors should meet all of the four criteria for authorship, and all who meet the four criteria should be identified as authors. Those who do not meet all four criteria should be acknowledged and thanked on the title page of the article. If the editorial board suspects that someone who does not meet the authorship requirements has been added as a writer, the article will be rejected without further investigation.
Journal of Health Sciences and Medicine (JHSM) requires and encourages the authors and the individuals who involved in the evaluation process of submitted manuscripts to disclose any existing or potential conflicts of interests, including financial, consultant, and institutional, that might lead to the potential bias or a conflict of interest. Any financial grants or other supports received for the submitted study from individuals or institutions should be disclosed to the Editorial Board. To disclose a potential conflict of interest, the ICMJE Potential Conflict of Interest Disclosure Form should be filled in and submitted by all of the contributing authors. Cases of the potential conflict of interest of the editors, authors, or reviewers are being resolved by the journal’s Editorial Board within the scope of COPE and ICMJE guidelines. The Editorial Board of the journal handles all of the appeal and complaint cases within the scope of COPE guidelines. In such cases, authors should get in direct contact with the editorial office to regard their appeals and complaints. When needed, an ombudsperson may be assigned to resolve cases that cannot be resolved internally. The Editor in Chief is the final authority in the decision-making process for all of the appeals and complaints. When submitting a manuscript to the Journal of Health Sciences and Medicine (JHSM), authors should accept to assign the copyright of their manuscript to the Journal of Health Sciences and Medicine (JHSM). If authors rejected for publication, the copyright of the manuscript will be assigned back to the authors. When using previously published content including figures, tables, or any other material in both of the print and electronic formats, authors must obtain permission from the copyright holder. Legal, financial and criminal liabilities in this regard belong to the author(s). Statements or opinions expressed in the manuscripts published in the Journal of Health Sciences and Medicine (JHSM) reflect the views of the author(s) and not the opinions of the editors, the editorial board, or the publisher; the editors, the editorial board, and the publisher disclaim any responsibility or liability for such materials. The final responsibility in regard to the published content rests with the authors.
ARTICLE IS NOT PUBLISHED ELSEWHEREEach author should indicate to the editor on the presentation page that part or all of the manuscript is not published elsewhere and is not in the process of being evaluated in another journal at the same time. Oral or poster presentations presented at congresses should be indicated on the title page with the name of the congress, place and date. All responsibility for the articles published in the journal (ethics, scientific, legal, etc.) belongs to the authors.

COPYRIGHT TRANSFER FORMCopyright Transfer Form (https://dergipark.org.tr/en/journal/2316/file/3808/download) can be obtained from the link. In the native language of the manuscript should be filled in must be sent on-line when loading. According to the 1976 Copyright Act, all kinds of publication rights of articles accepted for publication belong to the publisher.
WRITING LANGUAGE CONTROLThe publication language of the journal is English. English articles and Abstract should be checked by a professional linguist before being submitted. The spelling and grammatical errors in the manuscript are corrected by our English language consultant and editorial committee.
STATISTICS EVALUATIONAll prospective, experimental and retrospective research articles should be evaluated in terms of statistics (if required by the statistical expert) and indicated by appropriate planning, analysis and reporting.
ACCEPTANCE OF PUBLISHINGAfter the approval of the editors and referees, the publication date of the article is taken into consideration. A Doi number is obtained for each post.
ARTICLE WRITING RULESManuscripts are double-spaced with Microsoft Word, and titles (Abstract, Introduction, Material and Method, Results, Discussion, References, etc.) are written in 12 pt. 2.5 cm space should be written at the top and bottom. The writing style should be Times New Roman. “System International” (SI) units should be used. Figures, tables and graphs should be referenced in the text. Abbreviations should be given in parentheses where the word first appears. Review articles and research articles should not exceed 4000 words, case reports 2000 words, letters to the editor should not exceed 500 words (This limits to all article types are excluding Abstract and References section). Pages should be numbered from the abstract page.
SECTIONS OF MANUSCRIPT
1. Presentation to the EditorThis is the article that the author of the article sends to the editor of the journal. In this section, it should be noted that part or all of the article is not published elsewhere and is not in the process of being evaluated in another journal at the same time, “Material Support and Interest Relationship” status, language and statistical checks are made.
2. Title PageThe category of the article submitted at the beginning of the page should be indicated (clinical analysis, research article, experimental study, case report, review, etc.). The names and surnames of all authors should be numbered after the superscript and numbered from 1, and they should be added under the names of the institutions, clinics, cities and countries. On the title page, each author’s Orcid ID should be his/her e-mail address. This page should include the Authorized Author (s), name, full address, telephone and e-mail (address information should be indicated in English. Oral or Poster presentations presented at congresses should be indicated on the title page by giving the name, place and date of the congress.
3. Article FileThere should be no names of authors and institutions, only this information should be on the title page.
Title: There should be a short and clear title. It should not contain abbreviations.
Abstract: English abstracts should be written. In research articles; It should be divided into sections of Aim, Material and Method, Results, Conclusion and should not exceed 400 words. In the review, case reports and the like.
Keywords: A minimum of 3 and a maximum of 6 keywords should be written. Words should be separated by semicolons. Keywords should be submitted in accordance with Subject Medical Subject Headings (MESH) (www.nlm.nih.gov/mesh/MBrowser.html).
Figures, Photographs, Tables and Graphics: It should be indicated at the end of the sentence where it is mentioned in the text, should not be placed in the text, and should be added to the end of the text after the references. Abbreviations used should be indicated in the description below. If previously printed figures, pictures, tables and graphics are used, written permission must be obtained and this permission should be stated in the description of figures, pictures, tables and graphics. The article should be passed by the authors for academic plagiarism prevention program. The picture/photo should be in jpeg and at least 300 dpi resolution.

Text Sections: The text samples to be sent for publication are as follows.
Editorial Comment/Discussion: It is the evaluation of the original research articles published by the expert other than the authors. It is published before the articles in the journal.
Research Article: Prospective-retrospective and all kinds of experimental studies can be published. Introduction, Materials and Methods, Results, Discussion, Conclusion. Abstract (approximately 400 words; aim, material and method, results and conclusion sections), Introduction, Material and Method, Results, Discussion, Conclusion, Acknowledgments, References.
Review: Can be prepared by invited authors or directly. It can be prepared to include the latest medical literature for any subject that has medical characteristics. Abstract (about 300 words, unpartitioned), titles, references.
Case Report: These are rare or different articles in diagnosis and treatment. It should be supported with sufficient number of photographs and diagrams. Abstract (about 250 words; no section), Introduction, Case report, Discussion, Conclusions.
Letter to the Editor: The articles that are published in the journal within the last year include a maximum of 500 words containing various opinions, experiences and questions of the readers. There are no Title and Abstract sections. The number of references is limited to 5. It should be indicated which article (number, date) is dedicated and at the end there should be the name, institution and address of the author. The answer to the letter is given by the editor or the author (s) of the article and published in the journal.
Education: Scientific articles supported by the latest clinical and laboratory applications that send messages to readers on current issues within the scope of the journal. Abstract (about 200-250 words; no section), related titles, references.
Book Evaluations: Evaluations of national or internationally accepted books of current value within the scope of the journal.
WHAT SHOULD BE INDICATED BEFORE THE RESOURCES
ETHICAL CONSIDERATIONSEthics Committee Approval: The study was carried out with the permission of …………... Ethics Committee of ……………………. (Date: ………., Decision no: …………).
Informed Consent: All patients signed the free and informed consent form. (If retrospective study; Informed Consent: Because the study was designed retrospectively, no written informed consent form was obtained from patients.)
Referee Evaluation Process: Externally peer-reviewed.
Conflict of Interest Statement: The authors have no conflicts of interest to declare.
Financial Disclosure: The authors declared that this study has received no financial support.
Author Contributions: All of the authors declare that they have all participated in the design, execution, and analysis of the paper, and that they have approved the final version.
Acknowledgements: If any, it should be written before references.
References: References should be written according to the order of arrival. If the number of authors in the source is 6 or less, all authors (surname and first name should be the first letter, the names of the authors should be separated by commas) should be specified; (‘’et al ”), the name of the article (only the first letter of the sentence and the first letter of the special names will be capitalized), short journal name, year, volume, short page number (15-8, not 15-18) and a space between the punctuation marks. The format used for the manuscript submission should be as specified in Index Medicus (www.icmje.org). The list of references should only include studies that have been published or accepted for publication or have a Doi number. Journal abbreviations should follow the style used in Cumulated Index Medicus (http://www2.bg.am.poznan.pl/czasopisma/medicus.php?lang=eng.). The number of references should be limited to 40 in research articles, 60 in reviews, 20 in case reports and 5 (max. 10) in letter to the editor. References should be given in parentheses at the end of the sentence just before the period. For example (4,5). The author (s) is responsible for the accuracy of the references. Importance should be given to the synthesis of domestic and foreign sources.

4. Figures and Table TitlesTitles should be written after the references. Each must be submitted as a separate image file (at least 300 dpi resolution, jpg).
After the article is accepted for publication, the first copy of the string will be sent to the responsible author by e-mail. In this text, only the spelling errors will be corrected and no additions or substitutions will be made. The responsible author will notify the editorial center by e-mail of the corrections within 2 days.
SOURCE WRITING EXAMPLES
Excerpt from journals;Cesur S, Aslan T, Hoca NT, Cimen F, Tarhan G, Cifci A. Clinical importance of serum neopterin level in patients with pulmonary tuberculosis. Int J Mycobacteriol 2014; 3: 15-8 (not 15-18).
Excerpt from the book;Tos M. Cartilage tympanoplasty. 1st ed. Stuttgart-New York: Georg Thieme Verlag; 2009.
Excerpt from the book, which is the only author and editor;
Neinstein LS. The office visit, interview techniques, and recommendations to parents. In: Neinstein LS (ed). Adolescent Health Care. A practical guide. 3rd ed. Baltimore: Williams & Wilkins; 1996: 46-60.
Excerpt from the book with multiple authors and editors;Schulz JE, Parran T Jr.: Principles of identification and intervention. In: Principles of Addicton Medicine, Graem AW. Shultz TK (eds). American Society of Addiction Medicine, 3rd ed. Baltimore: Williams & Wilkins; 1998: 1-10.
If the editor is also the author of the chapter in the book;Diener HC, Wilkinson M (editors). Drug-induced headache. In: Headache. First ed., New York: Springer-Verlag; 1988: 45-67.
Excerpt from PhD/Undergraduate Thesis;Kilic C. General Health Survey: A Study of Reliability and Validity. phD Thesis, Hacettepe University Faculty of Medicine, Department of Psychiatrics, Ankara; 1992.
Excerpt from an internet site;Site name, URL address, author names, access date should be given in detail.
Giving a Doi number;Joos S, Musselmann B, Szecsenyi J. Integration of complementary and alternative medicine into the family market in Germany: Result of National Survey. Evid Based Complement Alternat Med 2011 (doi: 10.1093/ecam/nep019).
For other reference styles, see “ICMJE Uniform Requirements for Manuscripts Submitted to Biomedical Journals: Sample References”.
Eder I hereby declare that all or part of the material in this study has not previously been published in any place and is not currently being evaluated elsewhere for publication. electronic submissions and all kinds of pre-declarations.
Sponsorship StatementAuthors should declare, if any, the roles of sponsors of the study:
1. Design of the study 2. Data collection, analysis and interpretation of the results 3. Writing the report
CHECKLIST/CONTROL LISTThe checklist must be complete.

What should be in the article;-Editor to Presentation Page
-Title Page
• Ethical Status,
• “Conflict of Interest”
• Orcid numbers and author information should be on this page.
-Main Text
-Copyright Transfer Form
1. Presentation page to the Editor: It should be written by the responsible author addressed to the editor. Phone and E-mail must be added. The title, short name of the submitted article, ‘this work has not been sent to any journal and it is not under consideration and it is authors’ own work’ should be written in a Conflict of Interest statement’
2. Title page: Article titles/Short titles, Authors and Institutions, Corresponding Author’s postal address and telephone, Orcid no (mandatory since 2019) and E-mail addresses of all authors. Special names and lowercase letters should be used in the title.
3. Main pages of the article: Article Titles/Short Titles, Abstract and Keywords, Article Text, References, Table and Figure Titles, Tables. This page will not contain author names or institution information.
4. Font: Titles should be “Times New Roman 12 and 12 pt, with 11 pt, double-spaced line spacing and 2.5 cm indentation in all areas.
5. Abstract: Abstract should begin with the title ABSTRACT and include the sections “Introduction/Aim, Material and Method, Findings/Results, Conclusion”.
6. Keywords should be added under the abstract in “Keywords”, under “Abstract”. Keywords should be at least 3, at most 6 words, separated by commas, and should be MeSH-compliant.
7. Material and Method section should indicate the approval of the Ethics Committee (it is recommended to include the place, date, ethics committee number). In articles that do not require Ethics Committee Approval, it should be stated that the Approval/Permission of the Institution has been obtained (in order to avoid Conflict of Interest). Related documents should be sent on request. It should be noted that the author (s) is responsible for ethical problems.
8. Statistical terms (such as p, r, α) should not be used in the discussion.9. “Financial Support/Conflict of Interest Status”; should be stated before the bibliography and “Acknowledgment”
should be written before the bibliography.10. References Representation; should be as detailed in the spelling rules. Journal’s number number “(2)” is not in
bibliography. In articles with up to six authors, the names of all authors should be written (with the first letter of surname and first name), and for articles with seven or more authors, the first three authors should be cited as et al (et al.). The name of the manuscript should be in the form of sentence usage (except for special names and first letter). The journal should be given a short name. A space must be left between the punctuation marks after the journal name.
11. Tables, Graphs, Pictures and Figures should be placed under a separate title after the bibliography. Figures/Images (at least 300 dpi resolution, must be jpeg file) and Tables should be submitted as one or more separate files.
12. Copyright Transfer Form: Must be filled in the original language of the manuscript. It must be signed by all authors. In the absence of the signature of all authors, the Corresponding Author may take responsibility and sign on behalf of all authors.