Corporate Ownership & Control / Volume 4, Issue 2, Winter ...
85
Corporate Ownership & Control / Volume 4, Issue 2, Winter 2006-2007 (continued) 159 CORPORATE OWNERSHIP & CONTROL Editorial Address: Assistant Professor Alexander N. Kostyuk Department of International Economics Ukrainian Academy of Banking of National Bank of Ukraine Petropavlovskaya Str. 57 Sumy 40030 Ukraine Tel: +0038-0542-611025 Fax: +0038-0542-611025 e-mail: [email protected] [email protected] www.virtusinterpress.org Journal Corporate Ownership & Control is published four times a year, in September-November, December-February, March-May and June-August, by Publishing House “Virtus Interpress”, Kirova Str. 146/1, office 20, Sumy, 40021, Ukraine. Information for subscribers: New orders requests should be addressed to the Editor by e-mail. See the section "Subscription details". Back issues: Single issues are available from the Editor. Details, including prices, are available upon request. Advertising: For details, please, contact the Editor of the journal. Copyright: All rights reserved. No part of this publication may be reproduced, stored or transmitted in any form or by any means without the prior permission in writing of the Publisher. Corporate Ownership & Control ISSN 1727-9232 (printed version) 1810-0368 (CD version) 1810-3057 (online version) Certificate № 7881 Virtus Interpress. All rights reserved. КОРПОРАТИВНАЯ СОБСТВЕННОСТЬ И КОНТРОЛЬ Адрес редакции: Александр Николаевич Костюк доцент кафедры международной экономики Украинская академия банковского дела Национального банка Украины ул. Петропавловская 57 г. Сумы 40030 Украина Тел.: 0038-0542-611025 Факс: 0038-0542-611025 эл. почта: [email protected] [email protected] www.virtusinterpress.org Журнал "Корпоративная собственность и контроль" издается четыре раза в год в сентябре- ноябре, декабре-феврале, марте-мае, июне- августе издательским домом Виртус Интерпресс, ул. Кирова 146/1, г. Сумы, 40021, Украина. Информация для подписчиков: заказ на подписку следует адресовать Редактору журнала по электронной почте. Отдельные номера: заказ на приобретение отдельных номеров следует направлять Редактору журнала. Размещение рекламы: за информацией обращайтесь к Редактору. Права на копирование и распространение: копирование, хранение и распространение материалов журнала в любой форме возможно лишь с письменного разрешения Издательства. Корпоративная собственность и контроль ISSN 1727-9232 (печатная версия) 1810-0368 (версия на компакт-диске) 1810-3057 (электронная версия) Свидетельство КВ 7881 от 11.09.2003 г. Виртус Интерпресс. Права защищены.
-
Upload
khangminh22 -
Category
Documents
-
view
0 -
download
0
Transcript of Corporate Ownership & Control / Volume 4, Issue 2, Winter ...

Corporate Ownership & Control / Volume 4, Issue 2, Winter 2006-2007 (continued)
159
CORPORATE
OWNERSHIP & CONTROL
Editorial Address: Assistant Professor Alexander N. Kostyuk Department of International Economics Ukrainian Academy of Banking of National Bank of Ukraine Petropavlovskaya Str. 57 Sumy 40030 Ukraine Tel: +0038-0542-611025 Fax: +0038-0542-611025 e-mail: [email protected] [email protected] www.virtusinterpress.org Journal Corporate Ownership & Control is published four times a year, in September-November, December-February, March-May and June-August, by Publishing House “Virtus Interpress”, Kirova Str. 146/1, office 20, Sumy, 40021, Ukraine. Information for subscribers: New orders requests should be addressed to the Editor by e-mail. See the section "Subscription details". Back issues: Single issues are available from the Editor. Details, including prices, are available upon request. Advertising: For details, please, contact the Editor of the journal. Copyright: All rights reserved. No part of this publication may be reproduced, stored or transmitted in any form or by any means without the prior permission in writing of the Publisher.
Corporate Ownership & Control
ISSN 1727-9232 (printed version)
1810-0368 (CD version)
1810-3057 (online version)
Certificate № 7881 Virtus Interpress. All rights reserved.
КОРПОРАТИВНАЯ
СОБСТВЕННОСТЬ И КОНТРОЛЬ
Адрес редакции: Александр Николаевич Костюк доцент кафедры международной экономики Украинская академия банковского дела Национального банка Украины ул. Петропавловская 57 г. Сумы 40030 Украина Тел.: 0038-0542-611025 Факс: 0038-0542-611025 эл. почта: [email protected] [email protected] www.virtusinterpress.org Журнал "Корпоративная собственность и контроль" издается четыре раза в год в сентябре-ноябре, декабре-феврале, марте-мае, июне-августе издательским домом Виртус Интерпресс, ул. Кирова 146/1, г. Сумы, 40021, Украина. Информация для подписчиков: заказ на подписку следует адресовать Редактору журнала по электронной почте. Отдельные номера: заказ на приобретение отдельных номеров следует направлять Редактору журнала. Размещение рекламы: за информацией обращайтесь к Редактору. Права на копирование и распространение:
копирование, хранение и распространение материалов журнала в любой форме возможно лишь с письменного разрешения Издательства. Корпоративная собственность и контроль
ISSN 1727-9232 (печатная версия)
1810-0368 (версия на компакт-диске)
1810-3057 (электронная версия)
Свидетельство КВ 7881 от 11.09.2003 г. Виртус Интерпресс. Права защищены.

Corporate Ownership & Control / Volume 4, Issue 2, Winter 2006-2007 (continued)
160
EDITORIAL BOARD
Alex Kostyuk, Editor, Ukrainian Academy of Banking (Ukraine); Sir George Bain, President and Vice-Chancellor, Queen's University (UK) –
honorary member; Sir Geoffrey Owen, London School of Economics (UK) - honorary member; Michael C. Jensen, Harvard Business School (USA) - honorary member;
Stephen Davis, President, Davis Global Advisors, Inc. (USA); Brian Cheffins, Cambridge University (UK); Bernard S. Black, Stanford Law School (USA); Simon Deakin, Judge Institute, Cambridge Business School (UK); David Yermack, New York University (USA); Joongi Kim, Graduate School of International Studies (GSIS), Yonsei University (Korea); Geoffrey Netter, Terry College of Business, Department of Banking and Finance, University of Georgia (USA); Ian Ramsay, University of Melbourne (Australia); Jonathan Bates, Director, Institutional Design (UK); Liu Junhai, Institute of Law, Chinese Academy of Social Sciences (China); Jonathan R. Macey, Cornell University, School of Law (USA); Fianna Jesover, OECD Corporate Governance Division; Yoser Gadhoum, University of Quebec (Canada); Alexander Lock, National University of Singapore (Singapore); Anil Shivdasani, Kenan-Flagler Business School, University of North Carolina at Chapel Hill (USA); Rado Bohinc, University of Ljubliana (Slovenia); Harry G. Broadman, Europe & Central Asia Regional Operations, The World Bank (USA); Rodolfo Apreda, University of Cema (Argentina); Hagen Lindstaedt, University of Karlsruhe (Germany); Andrea Melis, University of Cagliari (Italy); Julio Pindado, University of Salamanca (Spain); Robert W. McGee, Barry University (USA); Piotr Tamowicz, Gdansk Institute of Market Research (Poland); Victor Mendes, University of Porto (Portugal); Azhdar Karami, University of Wales (UK); Alexander Krakovsky, Ukraine Investment Advisors, Inc. (USA); Peter Mihalyi, Central European University (Hungary); Wolfgang Drobetz, University of Basle (Switzerland); Jean Chen, University of Surrey (UK); Klaus Gugler, University of Vienna (Austria); Carsten Sprenger, University of Pompeu Fabra (Spain); Tor Eriksson, Aarhus School of Business (Denmark); Norvald Instefjord, Birkbeck College (UK); John S. Earle, Upjohn Institute for Employment Research (USA); Tom Kirchmaier, London School of Economics (UK); Theodore Baums, University of Frankfurt (Germany); Julie Ann Elston, Central Florida University (USA); Demir Yener, USAID (Bosnia and Herzegovina); Martin Conyon, The Wharton School (USA); Geoffrey Stapledon, University of Melbourne (Australia); Eugene Rastorguev, Secretary of the Board (Ukraine).

Corporate Ownership & Control / Volume 4, Issue 2, Winter 2006-2007 (continued)
161
CORPORATE OWNERSHIP & CONTROL
Volume 4, Issue 2, Winter 2006-2007 (continued)
CONTENTS
IPO BOARDS OF DIRECTORS AND FIRM PERFORMANCE: THRESHOLD FIRMS AND GOVERNANCE THEORY BOUNDARIES 162
Suzanne M. Carter, James H. Davis, Charles R. Young CORPORATE GOVERNANCE AND FIRM PERFORMANCE OF HIGHLY LEVERAGED TRANSACTIONS: EVIDENCE FROM LEVERAGED RECAPITALIZATIONS AND MANAGEMENT BUYOUTS 170
Sung C. Bae, Hoje Jo THE EFFECTS OF INVESTOR PROTECTION ON THE VENTURE CAPITAL INDUSTRY 181
Luis J. Sanz CIRCUMSTANCES RELATING TO INTERLOCKING DIRECTORATES IN ITALY: AN EXPLORATORY STUDY 192
Garen Markarian, Antonio Parbonetti, Gary John Previts CORPORATE GOVERNANCE IN INDONESIAN STATE-OWNED
ENTERPRISES: FEEDING WITH WESTERN INGREDIENTS 205
Frederik G. Worang, David A. Holloway CORPORATE GOVERNANCE AND FIRM PERFORMANCE IN AN EMERGING MARKET - AN EXPLORATORY ANALYSIS OF PAKISTAN 216
Mohammed Nishat, Rozina Shaheen ECONOMIC GROWTH IN AFRICA: THE ROLE OF CORPORATE GOVERNANCE AND STOCK MARKET DEVELOPMENTS 226 Anthony Kyereboah-Coleman MANAGEMENT CONTROL IN ENTERPRISE SYSTEM ENABLED ORGANIZATIONS: A LITERATURE REVIEW 233 Pall Rikhardsson, Carsten Rohde, Anders Rom

Corporate Ownership & Control / Volume 4, Issue 2, Winter 2006-2007 (continued)
162
IPO BOARDS OF DIRECTORS AND FIRM PERFORMANCE:
THRESHOLD FIRMS AND GOVERNANCE THEORY BOUNDARIES
Suzanne M. Carter*, James H. Davis**, Charles R. Young***
Abstract
Past research examining the influence of boards of directors on firm performance has acknowledged, but typically failed to account for, the early life cycle stage of the firm. This study analyzes the effectiveness of board structure and behavior on firm performance in the early stages of the life-cycle for start-up IPO firms. Results suggest that the life-cycle of the firm is an important contextual variable to include when determining board effectiveness. Keywords: Corporate governance, firm life-cycle, IPO
*University of Notre Dame, 18993 Stonewater Blvd, Northville, MI 48167, (248) 924-2295; fax: (248) 924-2295, [email protected] **University of Notre Dame, Notre Dame, IN 46556, 574-631-8614; fax: 219-631-5255; [email protected] ***Success Academy, Milwaukee, Wisconsin 55127, 651-917-8185; fax: 651-917-8075, [email protected]
Introduction For decades, researchers have studied the effects of boards of directors (BOD) on various firm outcomes, such as strategy, strategic change, social performance and financial performance (Baysinger & Hoskisson, 1990; Dalton, Daily, Ellstrand & Johnson, 1998; Zahra & Pearce, 1989). The purpose of past work has been in part to determine how much value is created for the firm by the structure, process and control of the BOD. While this work has produced mixed results (Donaldson & Davis, 1994), the vast majority of governance research studies have focused primarily on large, well-established Fortune 500 companies. Many scholars acknowledge that examining other arenas, where managerial and board discretion is likely to be higher, may yield a different set of results (Dalton et al, 1998; Johnson, Daily & Ellstrand, 1996). Some speculate that the BODs in small or entrepreneurial firms at the beginning of their life-cycle are likely to differentially impact their firm’s financial performance compared to those in larger well-established firms (Daily & Dalton, 1993; Zahra & Pearce, 1989). Zahra and Pearce (1989), noting a dearth of studies outside of the Fortune 500 samples, call the life-cycle of the firm a critical contingency that should be accounted for when studying the influence of BOD on financial performance.
Recently, to fill this gap in our knowledge, scholars have begun to explore board composition and its relationship to performance at the early stage of a firm’s life cycle (Certo, Daily & Dalton, 2001; Finkle, 1998). Our study continues that effort by
exploring company financial and stock performance subsequent to the Initial Public Offering (IPO) stage to clarify boundaries where previously theorized effects of BOD-performance associations are most likely to occur. We examine exclusively those entrepreneurial-type firms that are at the stage of entering IPOs that raised less than $20 million. These threshold firms are defined as firms that are at (or near) the point of transition from entrepreneurial to professional management (Clifford, 1973; Daily & Dalton, 1992). Our research question is whether the composition and process of threshold firms’ boards of directors impact the future financial performance of their firms.
This study has several theoretical and practical implications. We add to the governance literature by enhancing our understanding of how board composition and processes may be differentially effective for early threshold stages of a firm’s life-cycle. Setting boundary conditions for previously theorized effects of corporate governance roles is an important aspect of theory refinement. From a practical standpoint, we challenge those scholars who have suggested various “best approaches” for board selection and board decision-making processes without taking into consideration the key contextual variable of life-cycle stage.
We begin with a brief review of prior research on BOD and financial performance of both large and small firms. Next, we present and test a set of hypotheses using a sample of 150 small-cap threshold firms. We discuss results of the empirical study, and set forth theoretical, empirical, and practical implications.

Corporate Ownership & Control / Volume 4, Issue 2, Winter 2006-2007 (continued)
163
Governance Theory Previous researchers have used a number of theoretical lenses to examine the BOD-financial performance relationship, including legalistic, resource dependence, class hegemony and agency theory perspectives, among others (see Johnson, Daily & Ellstrand, 1996 and Zahra & Pearce, 1989 for reviews). The empirical results of these studies have been equivocal. Dalton et al (1998) performed a meta-analysis of the effects of corporate governance on financial performance using 54 previous studies of board composition and 31 studies of board leadership structure and found little evidence of systematic governance/financial performance relationships. Importantly, however, Dalton et al reported that approximately 80% of their sample consisted of large, Fortune 500 firms. They concluded that generalizability of their results beyond large U.S. corporations may be misleading. But the question remains, are existing theories better able to explain the BOD-performance relationships in other settings where discretion may be higher, such as the early life-cycle stage of the firm? Examining the contingent aspect of governance issues may be an important next step towards understanding under what circumstances boards may be most influential.
The Life-Cycle Contingency and Board Influence on Performance
The needs of firms change as they age suggesting firm life-cycle to be a critical contingency (Jawahar & McLaughlin, 2001). For example, as a firm is getting established in a marketplace, it is important that it develop a favorable reputation that may provide an intangible source of resources to the firm over its lifetime (Zahra & Pearce, 1989). The development of this reputation likely requires a substantially different set of resources and capabilities than would the maintenance of a well-established reputation. Furthermore, threshold firms often require significant capital investment, as well as community support as they build their legitimacy and reputation among their various stakeholders (Suchman, 1995). It is likely that CEOs of threshold firms are less constrained by organizational structures and control than those in well-established firms (Daily & Dalton, 1993; Norburn & Birley, 1988). An important result is that the CEO may be at greater discretion to build a board according to his/her own set of criteria. Indeed, in new start-ups, founder/CEOs have significant influence on who sits on the board (Timmons, 1999). The ability for BODs to influence future financial performance effectively may be a key motivation behind the CEO’s nomination of directors. Indeed, some outsiders may bring a critical element to early board operations that CEOs are likely to not only need, but
also to desire. Thus, the types of directors that are selected at the IPO stage of a firm may ultimately influence the firm’s future financial performance.
Some effort has been made to understand the differential impact of BODs on small firms. For example, Daily and Dalton (1993) found that boards of small cap firms are likely to have significantly different board composition than might be evident at larger Fortune 500 firms and that BOD composition/ financial performance relationships were found to be more effective for those firms that followed typical board reform adoptions such as separating CEO and BOD roles, and adopting a greater number of outsiders to the board. The mean age of the firms in the Daily and Dalton sample was over 17 years and thus it is unclear whether similar effects might be found for firms at the threshold of going public.
Closer to the empirical examinations made in the present study, several scholars have examined the impact of board composition on IPO pricing (Certo et al, 2001; Finkle, 1998). These scholars found differential impact of board composition on IPO pricing using resource dependence and signaling theories. For example, Certo et al found a negative relationship between board size and IPO underpricing but a positive relationship between board independence and IPO underpricing, suggesting that underwriters may value those inside directors that have familiarity with the firm rather than more independent directors. Finkle (1998) explored biotechnology firms at the IPO stage and found that CEO expertise increased the size of the firm’s IPO, but had no impact on subsequent stock market valuation. Our study extends these efforts by examining additional board roles as well as the board’s association with subsequent financial and stock performance of the firm – key to understanding board effectiveness at this stage. We now turn to that issue. Governance scholars have agreed that several roles and responsibilities of the BOD are particularly important to their effectiveness. These roles can generally be divided into three key responsibilities - service, strategy and control (Zahra & Pearce, 1989). Each of the roles is expected to ultimately influence the company’s performance. The effects of the BOD may be more pronounced at the IPO life-cycle stage of the firm for a number of reasons. First, strong boards at the threshold stage are particularly critical as capital markets and investors assess the firm. Additionally, the management needs of the firm begin to shift from an entrepreneurial style to professional management, and thus board responsibilities play a greater role in managing this change. Finally, at this stage the effects of the board on a new venture are most salient in that firm performance can be assessed in market terms as well as in accounting terms. Hence, it is an ideal time to assess the impact of the board on firm performance.

Corporate Ownership & Control / Volume 4, Issue 2, Winter 2006-2007 (continued)
164
We will discuss these three main responsibilities and develop hypotheses specific to these roles below.
Service. The service component involves being a boundary spanner with the external environment, finding and obtaining necessary resources, and establishing networks to legitimize the organization and improve its reputation (Zahra & Pearce, 1989). The main theoretical stance taken in regard to this role is resource dependence (Pfeffer & Salancik, 1978). Scholars taking this perspective argue that directors are responsible for providing the firm with critical resources that may not otherwise be obtained. Selecting board members with the power to obtain these resources may be crucial to the firm's survival. Previous research generally supports the central argument of resource dependence for well-established firms (Pfeffer & Salancik, 1978; Zahra & Pearce, 1989). The need for reduced environmental uncertainty may be even greater for threshold firms. These firms are not likely to have established strong reputations in their community or in the broader community that will help them ensure long-term survival. Nor have these threshold firms had the opportunity to develop crucial contacts that will provide access to key scarce resources. Thus, to improve performance, having boundary spanners on the BOD will likely be critical in the IPO life-cycle stage.
Hypothesis 1: The greater the number of service
directors on the board of the threshold firm at its
IPO stage, the greater the increase in subsequent
firm performance.
Strategy. The second responsibility of the board is to help management with strategic decisions. The strategy role of directors includes giving counsel and advice to the CEO, initiating analyses, suggesting alternatives, guiding the articulation of the firm's mission and setting guidelines for implementation of the firm's strategy (Zahra & Pearce, 1989). Scholars emphasizing this role promote the importance of expertise and understanding of firm activities to ensure board effectiveness and improve firm performance. Evidence of the contribution that boards have given well-established companies for the strategy role has been limited (Henke, 1986). However, it is likely that management of threshold firms has a greater need for the expertise and advice of board members than would be necessary for well-established firms. Indeed, Finkle (1998) found that CEO expertise was associated with larger IPO offerings. Directors experienced with the firm’s services/products and customer markets may have a similar impact upon the firm’s future financial performance. Expertise in the industry is likely to be a key characteristic that the CEO is searching for in the IPO stage. Those firms that capitalize on this element of a board’s role are likely to have better performance than other firms.
Hypothesis 2: The greater the number of
strategy specialists on the board of the threshold
firm at its IPO stage, the greater the increase in
subsequent firm performance. The process by which the board operates can be
an important element to the effectiveness of the board of threshold firms. One measure of board activity is the number of meetings held by the board over the course of each fiscal year (Vafeas, 1999; Zahra & Pearce, 1989). There are opposing views on the likely benefit of board meetings. One view suggests that board meetings are indeed beneficial to shareholders (Conger, Finegold & Lawler; 1998). Alternatively, Vafeas (1999) found that shareholders place a lower value on firms whose boards meet more frequently. However, he also finds that years with abnormally high meeting frequencies are followed by improvements in operating performance, suggesting that these meetings were effective nonetheless. Companies that have recently been established are much more likely to need significant help from the board in establishing a credible place in the community, developing a favorable reputation, providing and sustaining funding needs, determining growth opportunities, etc. (Reingold, 1999). As such, numerous meetings by the BODs will likely be more effective for the firm's future performance. Moreover, as noted by Judge and Zeithaml (1992), recent institutional pressures have increased the expectation by stakeholders that BODs become more active in day-to-day activities of the firm. Thus, boards formed under this increased pressure are likely to attend to this issue to a greater extent than older more established boards.
Hypothesis 3: The greater the board activity of
the threshold firm at its IPO stage, the greater the
increase in subsequent firm performance.
Control. The final responsibility for the BOD is control. Agency theorists contend that the control role of the board is the most critical (Zahra & Pearce, 1989). However, the degree to which this control is influential or important at the IPO stage is still in question. While most empirical studies examining control issues have examined large firms exclusively, some research has examined firms in IPO situations. Beatty and Zajac (1996) argued that agency problems arise in all situations in which there is no single 100-percent owner/entrepreneur who incurs the full cost of his or her actions. Thus, they argue that this life-cycle stage may also be relevant for the control role of the BODs.
From this perspective, directors selected to the board are in a position to control upper management. A board whose membership is independent of management is best suited to control the decisions and activity of upper management. Independence is best gained by appointing outside directors who are neither employees of the firm, nor members of the top management team or past top management

Corporate Ownership & Control / Volume 4, Issue 2, Winter 2006-2007 (continued)
165
groups (Jones & Goldberg, 1982). Yet outside directors are not necessarily placed on threshold boards by CEO/founders for control, but rather for collaboration, advice, expertise and boundary spanning capabilities. And indeed, venture capitalists are frequently considered to be “insiders” because of their lack of independence with management (Reingold, 1999). In many cases, the firm would likely be unable to reach the threshold stage without the venture capitalist’s financial backing, increasing the power of the venture capitalist to influence executive decision-making. Bertsch of TIAA-CREF indicates, “We would consider a founding venture capitalist to be an insider,” and feels that a “substantial majority” of directors should be outsiders [non-venture capitalists or employees] to avoid conflicts of interests.” (Reingold, 1999: 132). Independence seems to be the critical element that separates insiders from outsiders (Daily et al, 1999; Lorsch, Zelleke & Pick, 2001). While agency theory argues that outside directors in general improve firm performance through their control role, given the life-cycle context of threshold boards, we contend that simply having a larger contingency of outside directors is unlikely to provide the controls that agency theorists expect. Instead, the control function may be best attended to by directors that are
independent of management, thus excluding venture capitalists from the “outsider” category.
Hypothesis 4: The greater the ratio of independent directors to total directors of the BOD of the threshold firm at its IPO stage, the greater the increase in subsequent firm performance.
Methodology
Firms selected to test the hypotheses of our study were transitioning from start-up stages to their initial public offering in 1993. We specifically examine those entrepreneurial-type firms that are at the stage of entering IPOs that raised less than $20 million (deemed threshold firms, Clifford, 1973; Daily & Dalton, 1992). A sample of 150 firms was randomly selected from Standard and Poor’s Smallcap 600 guide for statistical analysis. Marketing, accounting, industry, and director composition data was collected from proxy reports and Standard and Poor’s Smallcap 600 guide and directory as well as through Primark financial services. Additionally a series of structured interviews with the top executive (founder) of each firm was conducted which provided key data on board of director background and experience.
Dependent Variables - Firm Performance
In order to test both market returns as well as accounting returns (Cochran & Wood, 1984; Daily & Dalton, 1993), we used both Market Value and Net Income as suggested by Zahra and Pearce (1989).
We study the influence of board characteristics on the change in both marketing and accounting measures of performance using a two-year lag, considered adequate to capture the impact of the independent variables on the dependent variables. This change measure is based on the suggestions of Zahra and Pearce (1989), who note that static performance measures have been overemphasized in BOD studies, and suggest that the dimension of change should be considered to a greater extent.
Market Value Change. The percentage change in market value over a two-year period was calculated by subtracting each firm’s year ending 1995 market value from its initial year ending 1993 market value and dividing by the 1993 value. This performance variable reflects the firm’s market performance over a two-year period.
Net Income Change. Most executives interviewed stated that net income is a measure of performance that was meaningful to their firm and was tracked by the board. A performance change score was calculated by dividing the difference between 1995-93 Net Income by 1993 Net Income. Thus the accounting measure was percentage change in net income using a two-year lag.
Independent Variables
Service. Directors that perform a service role are expected to enhance the company reputation and span boundaries between the firm and its external environment. These directors typically have alliances and networks that can be utilized by the firm. We contend that threshold firms gain this type of service in part by having venture capitalists on their boards. Venture capitalists typically have competencies that ensure that necessary resources become available to the company as needed (Jain, 2001). Most new ventures require networks of venture groups to obtain sufficient funding to grow to the point where an IPO is possible (Berlin, 1998). A venture capitalist often brings a strong understanding of the community resources available and the best means of obtaining these resources to the board (Reingold, 1999). Venture capitalists serving in the role of service directors can be strong assets towards securing critical resources and reducing environmental uncertainty. The measure used was the number of venture capitalists on the board and is labeled Venture Capital Directors.
Strategy. Directors who can help the firm strategically are those that have expertise with the firm’s product/service and/or industry. These directors have skills, knowledge and experience that the CEO/founder can tap to improve the competitive position of the firm in its markets. In the structured interviews, top executives were asked how many of their board’s directors had related firm and industry experience. The measure for strategy directors was the ratio of number of executives with related

Corporate Ownership & Control / Volume 4, Issue 2, Winter 2006-2007 (continued)
166
expertise to the total number of board directors, and is labeled Percentage Related Directors.
Additionally, we examined the strategy responsibilities by testing the degree to which the intensity of board activity influenced firm performance measures. Thus, as measured in other studies of board activity, we used a proxy for board activity intensity by the total number of annual, ‘in person’ board meetings as reported in proxy reports (Vafeas, 1999), labeled Number of Board Meetings.
Control. One common way of assessing board control over the firm is with the ratio of outside directors to the total number of board directors (Daily, Johnson & Dalton, 1999; Pearce & Zahra, 1992). Independent outside directors are herein defined as those directors who are not employees of the firm and are considered to be independent of management, thus reducing conflicts of interest (Daily et al, 1999). Outside directors are thought to bring objectivity to critical organizational decisions and ensure that shareholder wealth and vision for the firm are protected. Thus, we measure control with the variable labeled Percentage Independent Outside
Directors, including only outsiders considered to be independent of management (thus excluding venture capitalists and insider employees).
Control Variables
Controls were selected to ensure that the variance accounted for in hypothesis testing could be attributed to the board and not other firm and industry factors. The Log of Sales was used as a control for firm size. Because multiple industries were examined, industry was controlled using a measure of Average Industry Net Income. Similar control measures have been used in other studies examining board variables (Judge & Zeithaml, 1992).
Data Analysis
A final sample of 134 (89% of the sample of 150 start-ups contacted) provided the information needed for statistical testing. The average board in our sample had 6 directors, 58.39% outside directors and met 5.79 times during the year. Threshold firms within our sample came from 80 different four-digit SIC codes. See Table 1 for a summary of means, standard deviations and correlations. [See appendices, Table 1].
Ordinary Least Squares (OLS) multiple regression was used for hypothesis testing. The two dependent variables of interest for performance were the percent change in Market Value from 1993 to 1995 as well as the percentage increase in Net Income from 1993-1995 (Table 2). We entered each set of hypothesized variables into the model according to their theorized impact on the level of firm performance (service, strategy and control). In each regression model, we include two control
variables, firm size and industry profitability. We report standardized coefficients and one-tailed tests. We then present a full model including all variables. Below we will describe the results of our tests on the service, strategy, and control hypotheses as well as those of the full model. [ See appendices, Table 2].
Results
The first hypothesis examined the effect of venture capital directors on firm performance. It was hypothesized that the networking and boundary spanning function of service directors would significantly increase the performance of the firm. There was a range of zero to four venture capital directors on the boards in our sample with an average of .81. This suggests that most boards in our sample had at least one service director. Venture capital directors were significantly positively related to both performance measures (β = .357, p< .001, for market value, and β = .198, p< .05 for net income). This result supports the first hypothesis, that service directors are associated with an increase in firm performance both from a market as well as an accounting perspective.
Hypothesis 2 examined whether directors with related experience with the products or services of the firm explained the variance in firm performance. As predicted, we found that these strategy directors had a positive relationship to both market value change β = .266, p<.05 and net income change (β = .277, p< .05), thus supporting hypothesis 2. Hypothesis 3 argued that the activity level of the board affects firm performance. Board activity showed no support of Hypothesis 3 with market value change and modest support with the change in net income (β = .165, p< .10). Thus, there is some limited, but mixed support for Hypothesis 3.
Hypothesis 4 posits a positive relationship between the percentage of independent outsider directors to firm performance. In this case, this ratio was not found to be significant when used to explain changes in market value, and was found to be negative and significant, in the opposite of the predicted direction, for net income (β = -.184, p<.05), giving no support to Hypothesis 4. That is, independent outside directors did not have the positive influence on firm performance as expected by agency theory predictions. In order to determine whether our results were due to the unique nature of the venture capitalists on the board (i.e., considered to be non-independent), we ran a post hoc regression analysis to compare total outsiders (including venture capitalists) with total directors. Our results showed that this measure of total outsiders failed to explain a significant amount of the variance in net income change. It did, however, explain a significant amount of the variance in market value change (β = .186, p < .05). If venture capitalists are considered outside directors their influence was

Corporate Ownership & Control / Volume 4, Issue 2, Winter 2006-2007 (continued)
167
enough to change the relationship from significantly negative to significantly positive. Thus the venture capitalists significantly influenced financial performance (as found in hypothesis 1) above and beyond that of the other outside board members.
The full models are reported for both market value change and net income change as well. These full models had R-squared values of .154 and .118 respectively. The variables in the full model had similar results to those in the separate regression equations with only two exceptions. Specifically, in the full model for net income, the number of venture capitalists as well as the independent outsiders is each no longer significantly associated with net income change. Instead, it appears that the strategy variables exhibit the greatest influence over net income. The implications of these exceptions are discussed below.
Discussion and Implications
In this research we have tried to determine how the IPO stage of the firm contributes to our understanding of boundary conditions for corporate governance research. Our research examined whether the match between board attributes within the context of threshold firms affected firm performance. We found that service directors who span resource market boundaries as well as strategy directors who have related firm specific expertise influence both the market value and the net income of the threshold firm. However, we had mixed evidence as to whether threshold firms whose executives have more meetings with their boards (strategy process) have significantly higher performance than those that do not. Specifically, the number of meetings was modestly significant using an accounting performance measure but failed to explain a significant amount of market performance change suggesting perhaps that shareholders view threshold BOD meetings as being similarly ineffective as those of larger firm BOD meetings (Vafeas, 1999).
Control through the use of independent outside directors as prescribed by agency theory failed to improve either the market value or net income of the threshold firm. Indeed, independent board members had a negative and significant association with firm performance from an accounting perspective while they had no effect on market performance. Certo et al (2001) found that greater proportions of outside directors were positively associated with IPO underpricing suggesting that oversight of firm management may be considered by underwriters to be less critical in the IPO context. Consistent with Certo et al’s findings, our study adds further evidence that this consideration may be valid.
In addition, our complete model demonstrates the effect different types of directors have on different aspects of firm performance. Venture
capitalist directors explain the variance in market performance to the greatest extent and directors with related business experience explain the variance in net income to the greatest extent. Venture capitalists appear to bring market understanding and boundary spanning competencies to the firm translating into improved market performance at the IPO stage. Directors with related business experience bring tacit operational knowledge and mentoring experience that help the firm’s efficiency, effectiveness and ultimately, accounting performance at the IPO stage. Thus, based on our analysis of these threshold firms, there is some evidence confirming the proposition that the match between board form, function and context, and in particular, life-cycle, has merit (Zahra & Pearce, 1989). While we found evidence that independent outsiders actually may have harmed the effectiveness of firms at this stage of the life-cycle, other studies of outsiders of large companies have found similar negative effects (Rechner & Dalton, 1988; Chaganti, Mahajan & Sharma, 1985). These studies suggest that outsiders play only a minimalist role, refraining from active initiative-taking, reacting to managerial proposals and not exercising incisive questioning of management. In contrast, Daily and Dalton (1993) found a positive relationship between outsider ratio and firm performance for small firms (Their measure of outsiders included everyone not employed by the firm and thus may have included individuals who were not truly independent). Even so, as Daily and Dalton speculate, it is likely that the service and resource functions of those independent board members may be more critical to the small firm than the control functions. Indeed, why independent outsiders at the threshold stage are similarly ineffective to those outsiders in larger firms may be partially explained not by their lack of initiative- taking or incisive questioning, but instead by the differential boundary spanning and resource acquisition needs of the firm at this stage. Perhaps, as Certo et al (2001) suggest, the threshold stage of the firm is an arena in which the control function of the board is unnecessary. Indeed, at this stage of a firm’s life cycle, ownership may not yet be dispersed enough to require the need for management oversight prescribed to older, more established firms (Jensen & Meckling, 1976). This standard application of agency theory does not seem to apply to the threshold context. Thus, the IPO stage may demonstrate an important boundary condition to agency theory. From a practical standpoint, one must begin to question the value of independent outside board members if empirical evidence continues to mount that outsiders do not offer the improvements in firm performance that agency theorists would expect. Agency prescriptions have found a strong following within the business world. Institutional investors are successfully encouraging under-performing companies to improve their boards by

Corporate Ownership & Control / Volume 4, Issue 2, Winter 2006-2007 (continued)
168
making them more independent of management through an increase in the representation of outside directors (Pearce & Zahra, 1992). And yet this control reform seems to have no bounds. Is control a necessary role for BODs in the IPO stage? Our results suggest that it may not be – at least not in our traditional understanding. However, we did find evidence that some outside directors who are not truly independent of the firm - venture capitalists, seem to add boundary spanning capabilities and knowledge that can be used by firm executives – specifically, it appears that venture capitalists are critical to the success of these threshold organizations. Our results suggest that it is not just outsiders in general, but the specific type of outsider, that matters when predicting performance. Collaboration efforts, not control, per se, seem to affect firm performance at the IPO stage of the life-cycle. Both theoretical and empirical studies in the future should attend to finer grained measures of outsiders versus insiders to understand the true implications of certain board members on firm performance. There are limitations to this study design that should be addressed. Causality is always a problem in governance research. We attempted to overcome this problem by using a change measure with a two-year performance lag. Shorter performance lags may not reflect the firm’s long-term performance but simply reflect the speculation and hype of the market. Additionally, our study only examined a limited number of roles that BODs serve. Future research should examine how important other characteristics of board members are to firm performance. For example, the prestige of board members may substantially influence not only market measures of performance but operating performance as well in the form of increased business while threshold firms are trying to establish their place in the market. These, as well as other characteristics, may prove to be differentially effective for firms at the early life-cycle stage and should be examined in future studies.
Conclusion
This research supports the notion that the life-cycle of the firm is an important contingency supporting Zahra and Pearce’s (1989) argument that context matters in governance research. This research is one of very few empirical investigations of threshold firms at the IPO stage of the life-cycle. Our study reveals several things about organizational governance that should influence future research. First, we find support for the proposal that successful board structure and process is context dependent. The performance of threshold firms is explained to some degree by the service and strategy attributes of skilled directors. Board control of executives through the use of independent directors does not seem to explain the performance of threshold firms. Firms in
the IPO stage of their life-cycle appear to need a more collaborative board that provides expert advice and bridges organizational boundaries than more mature organizations. We add our results to others that have concluded that a ‘one-best-way’ theory to organizational governance is incorrect (Donaldson & Davis, 1991). The correct governance structure and process is contingent upon the conditions of the firm. The mixed results that currently abound may be due to the homogenization of very different governance needs regardless of the context studied (Daily et al, 1999). Future research should further develop contingency frameworks to advance the governance literature in constructive ways.
References
1. Baysinger, B. & Hoskisson, R. E. 1990. The composition of boards of directors and strategic control: Effects on corporate strategy. Academy of
Management Review. 15 (1): 72-87. 2. Certo, S., Daily, C., & Dalton, D. 2001. Signaling
firm value through board structure: An investigation of Initial Public Offerings. Entrepreneurship Theory
and Practice.Winter.33-50. 3. Chaganti, R.S., Mahajan, V., & Sharma, S. 1985.
Corporate board size, composition and corporate failures in retailing industry. Journal of Management
Studies, 2: 400-416. 4. Clifford, D. K. 1973. Growth pains of the threshold
company. Harvard Business Review, 61 (3): 143-154. 5. Conger, J., Finegold, D. & Lawler, E.III. 1998.
Appraising boardroom performance. Harvard
Business Review, 76: 136-148. 6. Daily, C. & Dalton, D. 1992. Financial performance
of founder-managed vs. professionally managed small corporations. Journal of Small Business Management, April: 25-34.
7. Daily, C. M & Dalton, D. R. 1993. Board of director’s leadership and structure: Control and performance implications. Entrepreneurship Theory and Practice, Spring: 65-81.
8. Daily, C. M., Johnson, J. L. & Dalton, D. R. 1999. On the measurements of board composition: Poor consistency and a serious mismatch of theory and operationalization. Decision Sciences, 30 (1): 83-106.
9. Dalton, D. R., Daily, C. M., Ellstrand, A. E & Johnson, J. L. 1998. Meta-Analytic reviews of board composition, leadership structure, and financial performance. Strategic Management Journal, 19.
10. Donaldson, L., & Davis, J.H. 1991. Stewardship theory or agency theory: CEO governance and shareholder returns. Australian Journal of
Management, 16(1): 49-64. 11. Donaldson, L., & Davis, J.H. 1994. Boards and
company performance: Research challenges the conventional wisdom. Corporate Governance: An
International Review, 2 (3):151-160. 12. Finkle, S. 1998. The relationship between boards of
directors and Initial Public Offerings in the Biotechnology industry. Entrepreneurship: Theory
and Practice, Spring 22 (3): 5-30. 13. Henke, J. W., Jr. 1986. Involving the board of
directors in strategic planning. Journal of Business
Strategy, 7 (2): 87-95.

Corporate Ownership & Control / Volume 4, Issue 2, Winter 2006-2007 (continued)
169
14. Jain, B. A. 2001. Predictors of performance of venture capitalist-backed organizations. Journal of Business
Research. 52: 223-233. 15. Jawahar, I., & McLaughlin, G. 2001. Toward a
descriptive stakeholder theory: An organizational life cycle approach. Academy of Management Review, 26.
16. Jensen, M.C., & Meckling, W.H. 1976. Theory of the firm: Managerial behavior, agency costs and ownership structure. Journal of Financial Economics, 3: 305-360.
17. Johnson, J. L., Daily, C. M. & Ellstrand, A. E. 1996. Boards of directors: A review and research agenda. Journal of Management, 22 (3): 409-438.
18. Jones, T. M. & Goldberg, L. D. 1982. Governing the large corporation: More arguments for public directors. Academy of Management Review. 7.
19. Judge, W. & Zeithaml, C. 1992. Institutional and strategic choice perspectives on board involvement in the strategic decision process. Academy of
Management Journal, 35 (4): 766-794. 20. Lorsch, J.W., Zelleke, A. S. & Pick, K. 2001.
Unbalanced boards. Harvard Business Review, February, 79 (2): 28-30.
21. Norburn, D. & Birley, S. 1988. The top management team and corporate performance. Strategic
Management Journal, 7: 110-117.
22. Pearce, J. A. & Zahra, S. A. 1992. Board composition from a strategic contingency perspective. Journal of
Management Studies, 29 (4): 411-437. 23. Pfeffer. J & Salancik, G. R. 1978. The external
control of organizations: A resource-dependence
perspective. New York: Harper and Row. 24. Rechner, P.L., & Dalton, D.R. 1988. Board
composition and organizational performance: A longitudinal assessment. Paper presented at the annual meeting of the Academy of Management, Anaheim.
25. Reingold, J. 1999. Dot.Com boards are flouting the rules. Business Week, New York, December 20.
26. Shivdasani, A. & Yermack, D.1999. CEO involvement in the selection of new board members: An empirical analysis. The Journal of Finance, LIV (5): 1829-1853.
27. Suchman, M. C. 1995. Managing legitimacy: Strategic and institutional approaches. Academy of
Management Review, 20 (3): 571-610. 28. Timmons, J.A. 1999. New Venture Creation. Boston:
McGraw-Hill. 29. Vafeas, N. 1999. Board meeting frequency and firm
performance. Journal of Financial Economics. 30. Zahra, S. A. & Pearce, J. A. 1989. Boards of directors
and corporate financial performance: A review and integrative model. Journal of Management, 15 (2).
Appendices
Table1. Means, Standard Deviations & Correlations a
Means 1 2 3 4 5
1 Percent increase market value 93-95
1.123 2.373
2 Percent net income change 93 to 95
-.0973 3.351 .220
3 Venture Capitalist Directors
.8060 1.037 .339 .177
4 Percentage Independent Outside Directors
.450 .206 -.118 -.169 -.493
5 Percentage Related Director
.123 .179 .280 .264 .374 -.102
6 Number of Meetings
5.795 3.180 .070 .227 .285 -.114 .291
a p<.05 for all r>.14; p<.01 for all r>.18.
Table 2. OLS Regressions: Percentage Change in Market Value 1993-1995;
Percentage Change in Net Income 1993-1995 a
Variables
Service
MktVal
Strategy
MktVal
Control
MktVal
Full
MktVal
Service
NI
Strategy
NI
Control
NI
Full NI
Constant 0.00 (2.53)
0.00 (2.24)
0.00 (2.56)
0.00 (2.65)
0.00 (1.81)
0.00 (2.25)
0.00 (2.22)
0.00 (2.51)
Log of Sales
.063 (.564)
.116 (.464)
.044 (.550)
.124 (.482)
.003 (.394)
-.041 (.453)
.010 (.414)
.030 (.455)
Industry Net Income
-.046 (.002)
-.073 (.002)
-.042 (.002)
-.075 (.002)
-.055 (.002)
-.097 (.002)
-.065 (.002)
-.062 (.002)
Venture Capital Directors
.198* (.332)
.057 (.333)
.357*** (.242)
.361** (.331)
Percentage Related Director
.277* (.277)
.263* (.017)
.266* (.015)
.164+ (.016)
Number of Board Meetings
.165+ (.106)
.159+ (.109)
-.016 (.101)
-.069 (.100)
Percentage Independent Outside Directors
-.184* (1.73)
.018 (1.68)
-.078 (1.23)
.122 (1.51)
R-Squared
.038 .116 .035 .118 .131 .080 .023 .154
Standardized coefficients reported. Standard errors are in parentheses.
a + p < .10 ;* p < .05; ** p < .01; *** p < .001

Corporate Ownership & Control / Volume 4, Issue 2, Winter 2006-2007 (continued)
170
CORPORATE GOVERNANCE AND FIRM PERFORMANCE OF HIGHLY
LEVERAGED TRANSACTIONS: EVIDENCE FROM LEVERAGED
RECAPITALIZATIONS AND MANAGEMENT BUYOUTS
Sung C. Bae*, Hoje Jo**
Abstract
We examine the effects of several corporate governance mechanisms on firm performance of two highly leveraged transactions (HLTs). Employing forty-one firms that implemented leveraged recapitalizations (LRs) and eighty-eight firms that undertook leveraged management buyouts (MBOs) during the period 1985-1990, we find that prior to their HLT, MBO firms tend to be smaller, be less profitable, have higher managerial ownership, have lower block ownership, and have a smaller fraction of independent outside directors on their board than LR firms. On the other hand, we observe no significant difference in board size or equity-based compensation between MBO and LR firms. Our regression results show that higher managerial ownership and greater equity-based compensation, which presumably help align managers’ incentives with shareholders, are strongly associated with operating performance of MBO firms, but only marginally with operating performance of LR firms. In contrast, greater outside representation on corporate boards, which presumably improves shareholder monitoring, is strongly associated with operating performance of LR firms, but only marginally with operating performance of MBO firms. Blockholders’ ownership, another effective mechanism of internal monitoring, is found to play a relatively insignificant role in enhancing operating performance of firms that go through a HLT. Our results are not attributed either to the difference in firm size or to an industry effect. Keywords: corporate governance, firm performance, management buyouts, leveraged recapitalizations
* Corresponding author: Department of Finance, 201 BA Bldg., College of Business Administration, Bowling Green State University, Bowling Green, OH 43402, USA; Tel) 419-372-8714; Fax) 419-372-2527; E-mail) [email protected]. ** Santa Clara University We thank Yaron Brook, Saeyoung Chang, Patric Hendershott, Michael Jensen, Jonathan Karpoff, Tim Opler, Young Seok Park, Atulya Sarin, Dennis Sheehan, Meir Statman, René Stulz and session participants at the Annual Korean Securities Research Institute Symposium for many valuable comments on earlier versions of our paper. Bae acknowledges financial support from the CBA summer research grant program at Bowling Green State University, and Jo acknowledges a Leavey Research Grant at the Leavey School of Business and the Dean Witter Foundation for financial support.
1. Introduction In modern corporations, stockholders rely on internal and external governance mechanisms to help resolve agency problems that arise from the separation of ownership and management. Boards of directors and blockholders are important internal control mechanisms whereas the takeover market is a major source of external control. In this context, a growing body of research has dealt with the effectiveness of alternative corporate governance systems such as the Anglo-Saxon market based system and the Continental-European bank based system.1 An active market for corporate control would make corporate governance ultimately market-based. Widespread
1Dennis and McConnell (2003) and Holmstrom and Kaplan (2003) review recent development of corporate governance issues.
corporate misconduct in the U.S. during the early 2000s, however, raises questions about its effectivenes.
In this study, we examine how various corporate governance mechanisms affect firm performance of highly leveraged transactions (HLTs). We take two HLTs that were widely used in the market for corporate control during the 1980s: leveraged management buyouts (MBOs), in which a company is purchased by a group of its managers with debt financing, and leveraged recapitalizations (LRs), in which a large debt-financed cash payout, generally either a special dividend or tender offer repurchase, is distributed to stockholders. These two HLTs share many similarities in that both often occur in response to a takeover threat and tend to substantially increase firm value, debt levels, and insider ownership. MBOs and LRs, however, lead to a very different post-HLT governance system. MBOs take a company private

Corporate Ownership & Control / Volume 4, Issue 2, Winter 2006-2007 (continued)
171
with little or no publicly traded equity whereas LRs retain relatively diffuse outside ownership of publicly traded equity. Contrasting MBOs and LRs provides an excellent experiment for exploring the effectivenss of vastly different corporate governance systems and their effects on firm performance while controlling for increased leverage.
Previous research documents the characteristics of HLTs and their effects on securityholders' wealth and firm performance.2 These studies, however, pay little attention to the relation of various governance mechanisms of MBO and LR firms on firm performance. Although it would be interesting to examine the impact of pre-HLT corporate governance on post-HLT operating and stock performance, post-MBO performance data are difficult to obtain due to MBO firms’ private company status. Accordingly, we investigate the potential differences in corporate governance mechanisms of ownership structure (managerial ownership and blokcholder ownership), corporate boards, and executive compensation for the pre-HLT period and the empirical relations between pre-HLT corporate governance characteristics and pre-HLT firm performance of firms conducting MBOs and LRs. The four pre-HLT governance mechanisms of MBO and LR firms would all be closely related to the firm’s operating performance. Jensen and Meckling (1976) argue that increased equity ownership by managers provides them with incentives to make value-maximizing decisions. Morck, Shleifer, and Vishny (1988) and McConnell and Servaes (1990) document a curvelinear relation between management ownership and firm value. Jensen and Murphy (1990a, 1990b) argue that equity-based compensation provides managers with an incentive to maximize value. Additionally, large outside blockholders, recognizing that managers have a tendency to skew decisions in directions that would benefit themselves, have an incentive to monitor managers (Demsetz and Lehn (1985), Jensen (1989), and Shleifer and Vishny (1986)). Denis and Serano (1996) find that monitoring by active outside blockholders with substantial ownership stakes often promotes valuable internal control efforts. It has been suggested that the Anglo-Saxon regime shareholders may control management decision making through both the board and the market for corporate control. In the Continental-European system, alternately, shareholder control can only take place through corporate boards in the absence of the market for corporate control and the effective mechanisms for legal investor protection.3 Hence,
2See Palepu (1990) and Halpern, Kieschnick, and Rotenberg (1999) for a review of LBO research and Palepu and Wruck (1992) for a review of LR research. Bae, Hendershott, and Jo (2001) investigate factors determining a firm’s choice of an organizational form between a LBO and a LR. 3The Economist (January 29, 1994) argues that American corporate governance is improved by merger and takeover activity, while questioning the effectiveness of the German and
shareholders in both regimes will be seriously interested in board characteristics when it comes to the accountability of managements for corporate performance. As noted in the seminal study of Fama and Jensen (1983), boards can be effective mechanisms to monitor top management on behalf of dispersed shareholders by effectuating management appointment, dismissal, suspension, and reward. Several studies suggest that top managers are more vigorously monitored when the board of directors is controlled by independent outside directors (see, e.g., Berger, Ofek, and Yermack (1997), Brickley, Coles, and Terry (1994), Byrd and Hickman (1992), and Weisbach (1988)). Yermak (1996) also argues that board size has an impact on the quality of internal monitoring. In contrast, examining a two-tier board system of Netherlands, Ees, Postma, and Sterken (2003) find no evidence of a strong relation between firm performance and board size. They also report that the number of outside board members is negatively associated with firm performance, whose evidence is contrary to those from Bhagat and Black (1998), Dalton et al. (1998), and Hermalin and Weisbach (1991).4 Combined together, well-designed corporate governance systems would either align managers' incentives with shareholders through substantial managerial ownership and equity-linked compensation plans or promote active monitoring on managers’ decision making through outside block ownership and boards of directors. Hence, firms with good corporate governance should put greater emphasis on value maximization.5
Based upon a sample of 41 LRs and 88 MBOs during the 1985-1990 period, our empirical results indicate the following. Prior to their HLT, MBO firms tend to be smaller, be less profitable, have higher insider ownership, have lower block ownership, and have a smaller fraction of independent outside directors on their board. A further analysis shows that these findings can not be attributed either to the difference in firm size or to an industry effect.
We perform regression analysis of two industry-adjusted measures of firm’s operating performance against four corporate governance mechanisms along with firm size as a control variable. The results show that CEO equity ownerhsip and the fraction of indenpendent outside directors on the board are significantly positively related to operating
Japanese corproate governance model. 4In a similar line of reasoning, Hartzell and Starks (2003) suggest that institutional investors also serve a monitoring role in mitigating the agency problem between shareholders and managers. 5Several studies examine the relation between foreced CEO turnover and firm performance (see, e.g., Allgood and Farrell (2000), Parrino (1997), Warner, Watts, and Wruck (1988)). Interestingly, Huson, Parrino, and Starks (2001) report that although there were significant changes in internal monitoring mechanisms from early 1970s to mid-1990s, the relation between the likelihood of forced CEO turnover and firm performance has not changed significantly over the time.

Corporate Ownership & Control / Volume 4, Issue 2, Winter 2006-2007 (continued)
172
performance for MBO firms, but marginally to operating performance for LR firms. On the contrary, board dependence, measured by the ratio of outside independent directors on the board, is strongly related to operating performance of LR firms, but only marginally to operating performance of MBO firms.
Our results suggest that higher managerial ownership and greater equity-based compenstion relative to total compensation, which presumably help align managers’ incentives with shareholders, are strongly associated with operating performance of MBO firms. In contrast, greater board independence measured by the number of outside directors on corporate boards, which presumably improves shareholder monitoring, is strongly associated with operating performance of LR firms. Blockholders’ ownership, another effective mechanism of internal monitoring, plays little, or relatively insignificant, role in enhancing operating performance of firms that go through a HLT.
Our paper proceeds as follows. Section II compares governance and ownership structures between LR and MBO firms, and Section III discusses our sample data and measurement of variables. Section IV presents empirical results with conclusions in Section V. 2. Governance and Ownership Structures Between LR Firms and MBO Firms Previous studies document a different ownership structure between LR and MBO (or LBO more generally) firms and provide evidence consistent with greater management incentive rationale for MBO firms. For a sample of 76 MBOs in 1980-1986, Kaplan (1989) reports that while the median pre-buyout ownership of all managers is 5.88 percent, the median post-buyout ownership increased by about three times the pre-buyout value to 22.63 percent. Smith (1990) provides similar evidence on the concentration of ownership that the median post-buyout ownership share of all officers, outsider directors and other major holders for MBO firms is 95.26 percent, compared to the corresponding pre-buyout ownership share of 75.45 percent. Kaplan and Stein (1993) find that for 124 large MBOs during the 1980s the managerial ownership increased from 5 percent prior to the buyout to 22.3 percent after the buyout.
Following a typical LR transaction, managerial ownership also increases, but in a much smaller magnitude. According to Gupta and Rosenthal (1991), the pre- and post-LR managerial ownership is 3.8 percent and 8.4 percent, respectively. Denis and Denis (1993) find that equity ownership of officers and directors increases from a median of 1.7 percent to a median of 3.6 percent. Similarly, Palepu and Wruck (1992) report that managerial ownership of defensive recapitalization firms increases from 2.9
percent to 5.9 percent. Denis (1994) provides similar evidence on the changes in managerial ownership for LBO and LR firms.6
The difference in ownership structure following MBOs and LRs appears to result in different compensation arrangements for top management. Conceivably, management ownership stake is more enhanced by MBO firms so that their incentives are stronger for improved performance than LR firms. Going-private MBOs facilitate compensation arrangements that induce management to undertake some investment proposals that would require disproportionate effort of managers, and hence disproportionate share of the proposal's income (DeAngelo, DeAngelo, and Rice (1984) and Travlos and Cornett (1990)). Muscarella and Vetsuypens (1990) provide evidence on management incentives following LBO transactions. They show that almost all firms in their sample (69 out of 72) implement at least one type of incentive plan under private ownership and that the two most popular types of incentive plans are stock option plans and stock appreciation rights. Their study also reports an elasticity of compensation (defined as salary plus bonus) to sales of 0.46 for the most highly paid officer in their sample. This finding is in contrast to the typical elasticity of about 0.3 found for public companies in Murphy (1985). By comparing the Kroger Co.'s LR with the Safeway Stores' LBO, Denis (1994) shows similar evidence that while Safeway relates managerial compensation more closely to firm performance, there was no such compensation scheme at Kroger.
Finance literature has also documented that MBOs (and LBOs in general) replace prior management and provide new management with large equity stakes, whereas LRs involve little change in governance of the firm. In an LBO, managers are frequently replaced and they are responsible to a small but powerful group of shareholders (e.g., LBO specialist or institutional investors). Jensen (1993) shows that following an LBO, boards of directors shrink to about seven or eight people and the sensitivity of managerial pay to performance rises. In a study of 42 firms that announced LRs during the 1985-1989 period, Handa and Radhakrishnan (1991) report that only five firms result in a change of CEOs following the firms' financial problems. Denis (1994) also shows a dramatic difference in the composition of the board of directors following Kroger's LR versus Safeway's LBO. While there were no changes in Kroger's board at a result of their LR, Safeway's board size was reduced from eighteen to five members; only two members of the old board remained following
6 Unlike these studies, Kleiman (1988) reports that average insider ownership increases to 29.5 percent after LRs from a pre-LR average of 8.1 percent.
Corporate Ownership & Control / Volume 4, Issue 2, Winter 2006-2007 (continued)
173
the buyout. It was also noted that Kroger's board held just 1.8 percent of the firm's equity after LR, whereas Safeway's board represented 92.6 percent of the firm's equity after the buyout.
The evidence suggests that the incentives for closer board monitoring of managerial behavior should be much stronger in MBOs than in LRs. Denis (1994) offers similar evidence on executive compensation for LR and LBO firms. There was no formal change in the structure of Kroger's executive cash compensation following LR. In contrast, there were major changes in executive compensation policy following Safeways' buyout which included bonuses as high as 110 percent (vs. 40 percent prior to buyout) of the executive's salary and also tied bonus payments to performance measures.
To put in perspective, there appear to be significant changes in ownership structure, board composition, and executive compensation policy following MBOs in a way that not only gives MBO firms' management more incentive, but also increases monitoring of top management. Hence, MBOs (especially induced by LBO specialists) would result in large changes in corporate governance and involve closer monitoring of management by the newly-formed board of directors. This suggests, as Denis (1994) points out, that given the small financial incentives of LR firms' officers and directors, these firms may choose the LR transaction as a means of avoiding these changes in governance system and monitoring. On the contrary, the increased ownership following LRs may improve managerial incentives and monitoring, but its effect is expected to be much smaller than for the case of MBOs. Hence, going private through MBOs enables the firm to institute more incentive compensation plans, which may not be possible for public firms due to the outside restrictions such as political process (Jensen and Murphy (1990b)).
In sum, leverage coupled with changes in governance structure appears to effectively eliminate the agency problem of free cash flow. While managers in recaps may waste resources to defend their position to potential takeover threat, going private MBOs may eliminate these costs. In many MBOs, the LBO specialists (e.g., KKR) retain a large equity stake and serve on the board. The equity stake and their desire to protect their reputation as efficient sponsors give them the incentive to closely monitor post MBO management. The concentrated ownership resulting from a MBO represents reunification of ownership and control. As documented in Denis (1994), the improved incentive structure and increased monitoring provided by the LBO specialists appear to lead managers to generate cash in a more productive manner than did the organizational structure of LR firms.
3. Data and Measurement of Variables
A. Data
We collect data from a sample of MBO and LR firms during the period 1985 to 1990, the period of greatest LBO and LR activities during the 1980’s. The recession of 1990-1991, combined with a collapse of the high-yield junk bond market in 1989, brought a substantial drop of LBO activity to $6.8 billion in 1991, less than 9 percent of the $76 billion in 1989. With the more favorable economic environment and the resurgence of the high-yield bond market since 1992, however, the LBO market has moved to an age of renewal, expanding its scope increasingly beyond mature slow-growing industries to high growth technology-driven industries (Allen (1996)). However, we use the 1985-1990 period because LRs first appeared in 1985, and LR activity dropped sharply after 1990 and there is almost no LRs after 1990.
Our sample of LRs comes from a search of the annual industrial Compustat tapes for large special dividends and stock repurchases. Each LR transaction indicating that there was an abrupt recapitalization is then confirmed from the news media. This process results in 41 sample LR firms that distribute at least 20 percent of their market value of equity in a debt-financed special dividend or nontargeted tender offer repurchase (but not a LBO).
We construct our sample of MBOs using a newspaper search of the Wall Street Journal abstracts over the same period for the keywords "LBO," "MBO," and "buyout," and selecting the resulting LBOs that meet criteria similar to those in Kaplan (1989). Specifically, (i) the firm must go private in a whole company LBO7; (ii) there cannot be a pre-MBO majority owner; and (iii) the firm must maintain its independence following the LBO. In addition, we categorize a LBO as a MBO when at least one top incumbent manager (CEO, Chairman, or President) is reported as taking an equity position in the buyout. If no top incumbent manager is reported as taking an equity position in the buyout, the firm is classified as a non-MBO LBO. We also require that sufficient Compustat data are available for our tests. This produces a sample of 88 MBO firms out of 106 LBO firms. Table 1 provides the sample distribution by year. The sample LR firms are most heavily concentrated in 1988-1989 and are very thin in 1990. The sample MBO firms are most heavily concentrated in 1987-1989 and are very thin in 1990. We use the Wall Street Journal Index to learn whether an active takeover threat exists prior to the initial MBO or LR proposal.
7We do not include divisional LBO firms in our sample because divisional LBO firms are believed to be more comparable with other corporate divestiture tactics, such as equity carve-outs, spin-offs, sell-offs, and asset sales.

Corporate Ownership & Control / Volume 4, Issue 2, Winter 2006-2007 (continued)
174
We define an active takeover threat as either an actual takeover offer or a large (>5 percent) toehold disclosure by a potential bidder along with published speculation about a possible takeover in the Wall
Street Journal.
B. Measurement of Variables
In our tests, all financial variables are taken from the Compustat tapes for the last full fiscal year before each firm's HLT. We measure pre-HLT performance using firms’ profitability. Since potential operating improvements can be the result of restructuring either capital or labor, we measure pre-HLT performance as both the ratio of operating income to total assets and the ratio of operating income to the number of employees. These are common performance measures in the HLT and governance literature (see, e.g., Allgood and Farrell (2000), Kaplan (1989), and Smith (1990)). We use four variables measuring the quality of corporate governance systems—managerial equity ownership, outside block ownership, board independence, and CEO equity-based compensation—and collect the governance data from published proxy statements for the last full fiscal year before the HLT.
We measure managerial equity ownership in two ways: CEO's beneficial ownership and the beneficial ownership of all officers and directors. Outside block ownership represents equity ownership of outside blockholders and is measured as the sum of greater-than-five percent owners that are unaffiliated with the firm. We measure board independence as the number of independent outside directors divided by the total number of directors on the board. We define independent outside directors following Hermalin and Weisbach (1988) as directors who have no past, present, or likely future financial ties to the firms other than compensation for being a director (investment bankers are assumed to have likely future financial ties). For the variable, we exclude gray directors who are relatives of former or current officers or have personal business relationship with the firm. Finally, following Mehran (1995), we measure CEO’s equity-based compensation as the sum of the value of CEO stock, pseudo-stock, and option grants expressed as a percentage of total compensation.
4. Empirical Results
A. Preliminary Comparison of MBO Firms and LR Firms
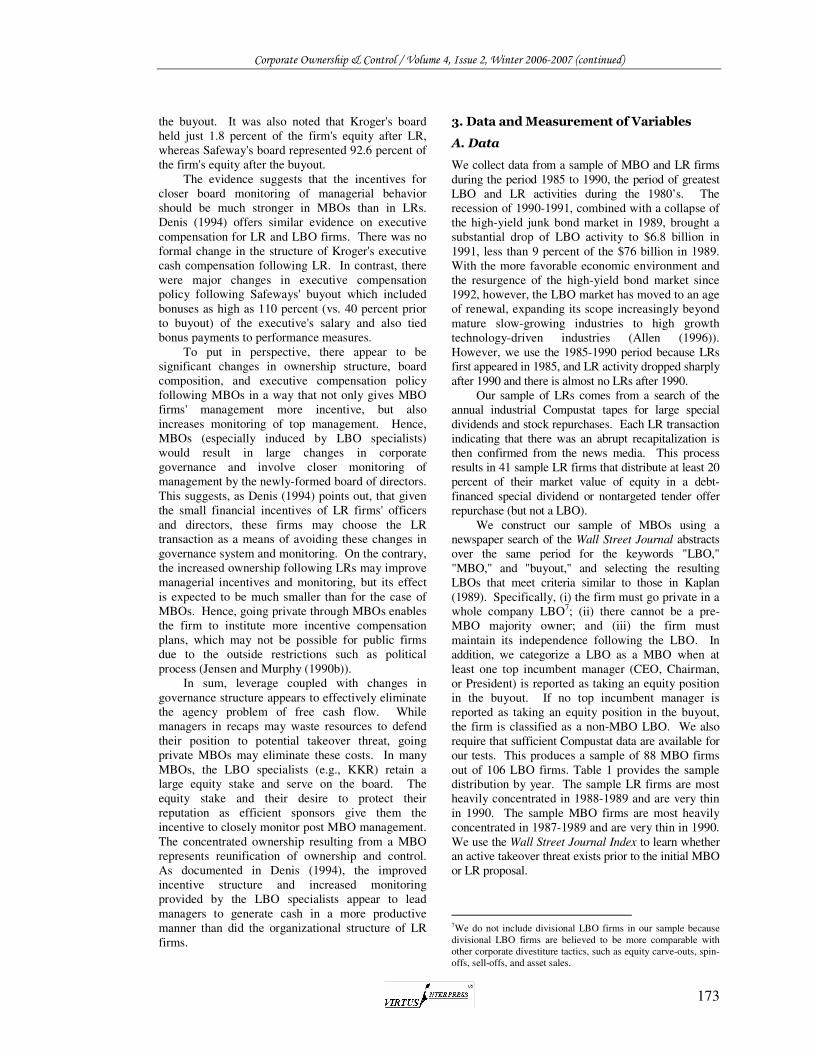
Before we examine the effects of various corporate governance mechanisms on firm performance of HLT firms, it will be beneficial to have some preliminary comparison of how the HLT transactions affect leverage and ownership in our sample firms. While changes following LRs are observed directly, changes following MBOs are based on the financing and equity investment information provided in the buyout proxy statement filed with the SEC.
Table 2 presents a preliminary summary of how HLTs change leverage and equity ownership. In both MBOs and LRs, debt levels roughly quadruple from relatively low levels (around 20 percent of total assets) to very high levels (around 80 percent of total assets). These findings demonstrate that both transactions are associated with dramatic (and similar) leverage increases. LRs have, however, a much more modest impact on firms’ organizational form. While remaining publicly traded corporations, LR firms are associated with only a modest increase in director and officer ownership and outside blockholdings. For LR firms, the median level of managerial ownership rises from 3.3 percent to 4.1 percent while the largest blockholder’s stake rises from a median level of 5.7 percent to 6.7 percent. On the other hand, MBO firms experience more dramatic organizational changes after going private. The median director and officer ownership rises from 12.0 percent to 24.6 percent, and the largest blockholder’s median stake rises from 8.6 percent to 77.1 percent. Our results clearly indicate that although MBOs and LRs result in similar capital structure changes, they produce very different organizational structures at least in terms of equity ownership structures.
B. Univariate Tests
Table 3 provides summary statistics from tests for univariate differences in firm characteristics between MBO and LR firms. As a group, LR firms are larger (based upon both total assets and market value of equity) and more profitable, particularly when profitability is measured by the ratio of operating income to number of employees. Both managerial and outside block equity ownership are higher in MBO firms, but LR firms have more outside directors relative to total board size. There is no significant difference in board size or CEO’s equity-based compensation relative to total compensation between MBO and LR firms. The significant difference in size between the MBO and LR groups measured by both total assets and market value of equity, however, makes these results difficult to interpret. For example, because large firms tend to have lower managerial ownership, the ownership difference between MBO and LR firms could be entirely a reflection of MBOs being, on average, smaller firms.
C. Analysis of Covariance Test
As a way to better control for the size difference between MBO and LR firms, we undertake an analysis of covariance (ANCOVA). An ANCOVA is functionally identical to regressing the variable of interest (for example, managerial ownership) on a covariate (in our case, firm size) and a dummy variable that classifies the two groups (in our case, MBOs and LRs). The impact of the dummy variable on the regression's sum of squared errors is represented by an

Corporate Ownership & Control / Volume 4, Issue 2, Winter 2006-2007 (continued)
175
F-statistic that measures the dependent variable's difference between the two groups, controlling for the covariate. The regression coefficients can also be used to compute the least square mean for each group, representing the group means adjusted for differences in the covariate.
In addition to controlling for size, it may also be important to control for industry difference between our sample firms. Although MBO and LR firms tend to come from similar industries, a subtle difference in industry could explain some of the univariate differences in Table 3. For example, the lower average ratio of operating income to number of employees could be the result of our MBO sample consisting of more firms from high employment service industries. To better proxy for potential improvements using pre-HLT performance, we industry-adjust our profitability ratios by subtracting the median ratios for all Compustat firms with the same four-digit SIC code, excluding firms in our sample of HLTs. Because these industry-adjusted ratios are benchmarked against clearly attainable norms, they should provide better measures of pre-HLT capital and organizational structures of our sample firms. Table 4 reports results from the ANCOVA tests for group differences between MBO and LR firms, controlling for firms' market value of equity using industry-adjusted profitability measures. Even after controlling for size, significant differences exist in industry-adjusted profitability, managerial ownership, block ownership, and board composition between MBO and LR firms. There continues to be no significant difference in CEO’s equity-based compensation or board size between the two groups.
Our results on lower profitability, both per dollar of book assets and per employee, for MBO firms than LR firms are consistent with MBOs being more common in firms that have the potential to most benefit from additional monitoring by MBO equity investors (see Denis (1994)). These results are not sensitive to various methods for industry adjustment (e.g., using three-digit SIC code matches or industry means). On the contrary, lower managerial equity ownership, higher block ownership, and greater board independence for LR firms are consistent with the notion that managers in weak positions will prefer LRs. Measuring size using total assets in place of market value of equity makes virtually no difference in our results.
D. Size Matched-Sample Tests
The ANCOVAs assume a specific relation between firm size and the other variables; for example, the ANCOVAs assume a linear relation between size and managerial ownership. In order to check the robustness of our results on the comparisons of variables between MBOs and LRs, we also examine thirty-five size-matched pairs of MBOs and LRs. To construct the size-matched sample, each LR is matched
to a MBO with the closest market value of equity. Whenever possible, a LR is matched to a MBO that has full governance data available. However, in cases where no MBO with full governance data available has a market value of equity within 10 percent of the LR’s market value of equity, a match is made to the closest MBO without regard for governance data availability (one case using the MBOs). If no MBO with a market value of equity within 20 percent of the LR is available, the LR is not used in the analysis (four cases using the MBOs). Each MBO firm is used as a match only once. Table 5 presents summary statistics from difference tests using the size-matched samples. The results using size-matched pairs provide evidence supporting that LR firms are more profitable and have lower managerial ownership and more independent boards. These results confirm our earlier empirical results. 8 The size-matched pairs, however, do not indicate a difference in outside block ownership between MBO and LR firms.
E. Regression Analysis of Firm Performance
We use two multivariate regression models to investigate the potential differences in the effects of governance mechanisms on firm preformance between MBO and LR firms. We regress two measures of operating performance seperately on four different mechanisms of a firm’s corporate governance, along with a size control variable. The dependent variable in regressions 1 and 2 is operating income divided by total assets and operating income divided by number of employees, respectivley. Both measures of operating performance are industry adjusted.
The regression results are summarized in Table 6. Overall, the five-variable regression models explain more than 25 percent of total variations in operating performance of sample firms. Regardless of the organizational form, the two measures of firm’s operating performance exhibit similar relations to the four variables proxying corporate governance mechanisms. The estimated coefficient of CEO equity ownership is positive and significant at the 0.01 level for both measures of firm perofrmance of MBO firms, whereas it is positive and significant at the 0.10 level for only one measure of firm performance of LR firms. These findings indicate that higher managerial owernship is strongly associated with greater operating performance for MBO firms and marginally for LR firms. Board independence, measured as the fraction of independent outside directors on the board, is significantly positively related to both measures of firm
8To further explore the effect of industry differences, we also constructed 31 industry-matched MBO-LR pairs. Tests using
these industry-matched pairs produced results consistent with those reported in our study.

Corporate Ownership & Control / Volume 4, Issue 2, Winter 2006-2007 (continued)
176
performance for MBO firms at least at the 0.05 level, but to only one measure of firm performance for LR firms at the 0.10 level. Hence, greater board independence is strongly associated with greater operating performance of LR firms and marginally with greater operating performance of MBO firms. The findings on the positive relation of independent outside directors on a corporate board to firm performance are consistent with those from prior studies in Bhagat and Black (1998), and Dalton et al. (1998), and Hermalin and Weisbach (1988).
The regression results for block ownership are weaker, though the sign of the estimated coefficient is consistently positive. Hence, block ownership has little, if any, effect on the operating performance of HLT firms. Unlike the first three variables of corporate governance mechanisms, the regression results on the ratio of CEO’s equity-based compensation to total compensation are strikingly different between MBO and LR firms. To be more specific, the regression coefficient of equity-based compensation is positive and significant at least at the 0.10 level only for MBO firms. Hence, equity-based compensation is highly effective in enhancing operating performance for MBO firms, but plays a little role in generating greater operating performance for LR firms.
5. Summary and Conclusions
We examine the effects of several corporate governance mechanisms on firm performance for two similar highly leveraged transactions of LRs and MBOs. Both transactions result in heavy debt loads, but different organizational forms and governance structures. Employing a sample of 41 LRs and 88 MBOs during the 1985-1990 period, we find that prior to their HLT, MBO firms tend to be smaller, be less profitable, have higher insider ownership, have lower block ownership, and have a smaller fraction of independent outside directors on their board than LR firms. On the contrary, there is no significant difference in board size or the ratio of equity-based compensation to total compensation between MBO and LR firms. We find that these findings can not be attributed either to the difference in firm size or to an industry effect.
We perform regression analysis of two measures of firm’s operating performance against four corporate governance mechanisms along with firm size as a control variable. The regression results show that CEO equity ownerhsip and the fraction of indendent outside directors on the board are significantly positively related to operating performance for MBO firms, but marginally to operating performance for LR firms. On the contrary, board dependence, measured by the ratio of outside independent directors on the board, is more strongly related to operating performance of LR firms, but only marginally to operating performance of MBO firms. As a whole, our regression results suggest that higher managerial ownership and greater equity-based
compenstion relative to total compensation, which presumably help align managers’ incentives with shareholders, are strongly associated with operating performance of MBO firms. In contrast, greater outside representation on corporate boards, which presumably improves shareholder monitoring, is strongly associated with operating performance of LR firms. Blockholders’ ownership, another effective mechanism of internal monitoring, plays a little or relatively insignificant role in enhancing operating performance of firms that go through a HLT.
References
1. Allen, J. R., 1996, LBOsThe evolution of financial structures and strategies, Journal of Applied
Corporate Finance 8, Winter, 18-29. 2. Allgood, S. and K. A. Farrell, 2000, The effect of
CEO tenure on the relation between firm performance and turnover, Journal of Financial Research 24.
3. Bae, S. C., R. J. Hendershott, and H. Jo, 2001, Consolidating corporate control: LBOs versus LRs, Corporate Finance Review 2, 5-20.
4. Bhagat, S. and B. Black, 1998, The uncertain relationship between board composition and firm performance, Columbia Law School Project, New York, NY, 291-316.
5. Berger, P., E. Ofek, and D. Yermack, 1997, Managerial entrenchment and capital structure decisions, Journal of
Finance 51, 1411-1438. 6. Brickley, J., J. Coles, and R. Terry, 1994, Outside
directors and the adoption of poison pills, Journal of
Financial Economics 35, 371-390. 7. Byrd, J. and K. Hickman, 1992, Do outside directors
monitor managers? Evidence from tender offer bids, Journal of Financial Economics 32, 195-222.
8. Dalton, D. R., C. M. Daily, A. E. Ellstrand, and J. L. Johnson, 1998, Meta-analytic reviews of board composition, leadership structure, and financial performance, Strategic Management Journal, 269-290.
9. DeAngelo, H., L. DeAngelo, and E. Rice, 1984, Going private: Minority freezeouts and stockholder wealth, Journal of Law and Economics 27, 367-401.
10. Demsetz, H. and K. Lehn, 1985, The structure of corporate ownership: causes and consequences, Journal
of Political Economy 93, 1155-1177. 11. Denis, D., 1994, Organizational form and the
consequences of highly leveraged transactions: Kroger's recapitalization and Safeway's LBO, Journal
of Financial Economics 36, 193-224. 12. Denis, D. and D. Denis, 1993, Leveraged recaps and
the curbing of corporate overinvestment, Journal of
Applied Corporate Finance 6, 60-71. 13. Denis, D. and J. Serrano, 1996, Active investors and
management turnover following unsuccessful control contests, Journal of Financial Economics 40.
14. Denis, D. and J. McConnell, 2003, International corporate governance, Journal of Financial and
Quantitative Analysis 38, 1-36. 15. Ees, H. V., T. J. B. M. Postma, and E. Sterken, 2003,
Board characteristics and corporate performance in the Netherlands, Eastern Economic Journal 29.
16. Fama, E. F. and M. C. Jensen, 1983, Separation of ownership and control, Journal of Law and
Economics 26, 301-325.

Corporate Ownership & Control / Volume 4, Issue 2, Winter 2006-2007 (continued)
177
17. Gupta, A. and L. Rosenthal, 1991, Ownership structure, leverage and firm value: The case of leveraged recapitalizations. Financial Management 20, 69-83.
18. Halpern, P., R. Kieschnick, and W. Rotenberg, 1999, On the heterogeneity of leveraged going private transactions, Review of Financial Studies 12.
19. Handa P. and A.R. Radhakrishnan, 1991, An empirical investigation of leveraged recapitalizations with cash payout as takeover defense. Financial
Management 20, 58-68. 20. Hermalin, B. and M. Weisbach, 1988, The
determinants of board composition, Rand Journal of
Economics 19, 589-606. 21. Holmstrom, B. and S. N. Kaplan, 2003, The state of
U.S. corporate governance: What’s right and what’s wrong? Journal of Applied Corporate Finance 15.
22. Huson, M. R., R. Parrino, and L. T. Starks, 2001, International monitoring mechanisms and CEO turnover: A long-term perspective, Journal of
Finance 56, 2265-2297. 23. Jensen, M. C. and W. Meckling, 1976, Theory of
firm: Managerial behavior, agency costs, and capital structure, Journal of Financial Economics 3, 305-360.
24. Jensen, M. C., 1989, The eclipse of the public corporation, Harvard Business Review 5, 61-74.
25. Jensen, M. C., 1993, The modern industrial revolution, exit, and the failure of internal control systems, Journal of Finance 48, 831- 880.
26. Jensen, M. C. and K. Murphy, 1990a, CEO incentives–It’s not how much you pay, but how? Harvard Business Review 90, 138-153.
27. Jensen, M. and K. Murphy, 1990b, Performance pay and top-management incentives, Journal of Political
Economy 98, 225-264. 28. Kaplan, S. N., 1989, The effects of management
buyouts on operations and value, Journal of Financial
Economics 24, 217-254. 29. Kaplan, S. N. and J. C. Stein, 1993, The evolution of
buyout pricing and financial structure in the 1980s, The Quarterly Journal of Economics 108, 313-357.
30. Kleiman, R. T., 1988, The shareholder gains from leveraged cash-outs: Some preliminary evidence, Journal of Applied Corporate Finance 1, 46-53.
31. McConnell, J. and H. Servaes, 1990, Additional evidence on equity ownership and corporate value, Journal of Financial Economics 27, 595-612.
32. Mehran, H., 1995, Executive compensation structure, ownership, and firm performance, Journal of
Financial Economics 38, 163-184. 33. Morck, R., A. Shleifer, and R. Vishny, 1988,
Management ownership and market valuation: An empirical analysis, Journal of Financial Economics 20, 293-316.
34. Muscarella, C. J. and M. R. Vetsuypens, 1990, Efficiency and organizational structure: A study of reverse LBOs, Journal of Finance 45, 1389-1414.
35. Murphy, K. J., 1985, An empirical analysis, Journal
of Accounting and Economics 7, 3. 36. Palepu, K., 1990, Consequences of leveraged
buyouts, Journal of Financial Economics 27. 37. Palepu, K. and K. Wruck, 1992, Consequences of
leveraged shareholder payouts: Defensive versus voluntary recapitalizations, Harvard University working paper.
38. Parrino, R., 1997, CEO turnover and outside succession: A cross-sectional analysis, Journal of
Financial Economics 46, 165-197. 39. Shleifer, A. and R. Vishny, 1986, Large shareholders
and corporate control, Journal of Political Economy 94, 461-488.
40. Smith, A., 1990, Corporate ownership structure and performance: The case of management buyouts, Journal of Financial Economics 27, 143-164.
41. Travlos, N. G. and M. M. Cornett, 1993, Going private buyouts and determinants of shareholders' returns. Journal of Accounting, Auditing, and Finance 8, 1-25.
42. Warner, J. B., R. L. Watts, and K. Wruck, 1988, Stock prices and top management changes, Journal of
Financial Economics 20, 461-492. 43. Weisbach, M., 1988, Outside directors and CEO
turnover, Journal of Financial Economics 20. 44. Yermack, D., 1996, Higher market valuation of
companies with a small board of directors, Journal of
Financial Economics 40, 185-211.
Appendices
Table 1. Distribution of Sample Firms by Year
This table presents the distribution of sample firms. The leveraged recapitalization sample consists of 41 firms that distribute at least 20 percent of their market value of equity in a debt-financed special dividend or nontargeted tender offer repurchase (but not a leveraged buyout) between 1985 and 1990, the period of greatest HLT activity. The management buyout sample consists of 88 firms that use debt financing to go private with at least one top incumbent manager (CEO, chairman, or president) taking an equity position in the buyout between 1985 and 1990.
Leveraged Leveraged Buyouts Recapitalizations All Buyouts MBOs Non-MBOs Year number (%) number (%) number (%) number (%)
1985 6 14.6 13 12.3 11 12.5 2 11.1 1986 6 14.6 17 16.0 14 15.9 3 16.7 1987 7 17.1 20 18.9 16 18.2 4 22.2 1988 11 26.8 35 33.0 30 34.1 5 27.8 1989 9 22.0 18 17.0 16 18.2 2 11.1 1990 2 4.9 3 2.8 1 1.1 2 11.1 Total: 41 106 88 18
Corporate Ownership & Control / Volume 4, Issue 2, Winter 2006-2007 (continued)
178
Table 2. Comparison of Variables Before and After Transactions Between Leveraged Recapitalizations and Management Buyouts
This table provides estimated changes in leverage and ownership after each type of highly leveraged transaction (HLT) from 1985 to 1990. The leveraged recapitalization sample consists of 41 firms that distribute at least 20 percent of their market value of equity in a debt-financed special dividend or non-targeted tender offer repurchase (but not a leveraged buyout). The management buyout sample consists of 88 firms that use debt financing to go private with at least one top incumbent manager (CEO, chairman, or president) taking an equity position in the buyout. The pre-HLT leverage variable is taken from the Compustat tapes for the last full fiscal year before each firm’s HLT. The pre-HLT managerial and outside blockholders’ ownership variables are from published proxy statements for the last full fiscal year before the HLT. The post-MBO variables are taken from the financing and equity investment information provided in the buyout proxy statement filed with the SEC. The post-LR variables are from the Compustat tapes at the closest time to the date suggested by the SEC filed information. Changes following the recapitalizations are observed directly. Changes following the buyouts are based on the information provided in the buyout proxy statement filed with the SEC.
Leveraged Management Recapitalizations Buyouts
before after ratio before after ratio mean mean mean mean mean mean (median) (median) (median) (median) (median) (median)
Long term debt/ 0.177 0.723 4.08 0.221 0.873 3.95 total assets (0.154) (0.681) (4.42) (0.201) (0.896) (4.46) Equity ownership 6.6% 10.1% 1.53 16.3% 32.8% 2.01 of all officers and (3.3%) (4.1%) (1.25) (12.0%) (24.6%) (2.05) directors Largest outside 6.5% 8.3% 1.28 10.3% 62.3% 6.02 blockholder (5.7%) (6.7%) (1.18) (8.6%) (77.1%) (9.30)
Table 3. Univariate Mean Test and Rank Sum Median Test This table reports results from univariate mean test and rank sum median test. The leveraged recapitalization (LR) sample consists of 41 firms that distribute at least 20 percent of their market value of equity in a debt-financed special dividend or nontargeted tender offer repurchase (but not a leveraged buyout) between 1985 and 1990. The management buyout (MBO) sample consists of 88 firms that use debt financing to go private with at least one top incumbent manager (CEO, chairman, or president) taking an equity position in the buyout between 1985 and 1990. Tests for differences use a t-test on the means and a rank sum test on the medians. Total assets and market value of equity are reported in million dollars. Operating income/employees is in thousand dollars. Equity ownership is reported as a percentage of shares outstanding. The size and profitability variables are taken from the Compustat tapes and the corporate governance variables from published proxy statements for the last full fiscal year before each firm’s HLT. ***, **, and * denote that the MBO sample differs significantly from the LR sample at the 0.01, 0.05, and 0.10 levels, respectively. Tests on size variables use natural logs.
Leveraged Management Recapitalizations Buyouts mean mean (median) (median)
Size Total Assets 2,629 1,047*** (1,599) (351)*** Market value of equity 1,596 830*** (1,094) (217)***
Profitability Operating income/total assets 0.176 0.151* (0.148) (0.152) Operating income/employees 28.84 13.28** (13.02) (9.80)**
Corporate Governance CEO equity ownership 2.37 8.98*** (0.50) (2.20)*** Equity ownership of all 6.60 16.27*** officers and directors (3.30) (12.04)*** Equity ownership of 12.14 13.99 outside blockholders (8.58) (11.90)* Board size 10.6 9.9 (11) (10) Outside directors/board size 0.49 0.36*** (0.50) (0.38)*** Equity-based compensation/ 0.10 0.13 total compensation (0.03) (0.04)

Corporate Ownership & Control / Volume 4, Issue 2, Winter 2006-2007 (continued)
179
Table 4. Comparisons of Sample Firms, Controlling for Size in an Analysis of Covariance (ANCOVA)
This table presents results from ANCOVA tests for group differences between leveraged recapitalization (LR) and management buyout (MBO) firms, controlling for firms' market value of equity. The LR sample consists of 41 firms that distribute at least 20 percent of their market value of equity in a debt-financed special dividend or non-targeted tender offer repurchase (but not a leveraged buyout) between 1985 and 1990. The MBO sample consists of 88 firms that use debt financing to go private with at least one top incumbent manager (CEO, chairman, or president) taking an equity position in the buyout between 1985 and 1990. The analysis of covariance controls for the natural log of market value of equity. Operating income over total assets and employees are industry-adjusted by subtracting the median value for all Compustat firms with the same four-digit SIC code. Equity ownership is reported as a percentage of shares outstanding. The size and profitability variables are taken from the Compustat tapes and the corporate governance variables from published proxy statements for the last full fiscal year before HLT. An ANCOVA is functionally identical to regressing the variable of interest (for example, CEO ownership) on a covariate (in our case, firm size) and a dummy variable that classifies the two groups (in our case, LRs and MBOs). The dummy variable's impact on the regression's sum of squared errors provides an F-statistic that measures the dependent variable's difference between the two groups, controlling for the covariate. The regression coefficients can also be used to calculate the least square (LS) mean for each group, representing the group means adjusted for differences in the covariate. ***, **, and * denote that the MBO sample differs significantly from the LR sample at the 0.01, 0.05, and 0.10 levels, respectively.
Leveraged Management Recapitalizations Buyouts LS mean LS mean
Profitability Operating income/total assets 0.042 0.010** Operating income/employees 6.51 0.79* Corporate Governance CEO equity ownership 3.69 7.18* Equity ownership 9.22 13.62 of all officers and directors Equity ownership 18.01 9.21* of outside blockholders Outside directors/board size 0.48 0.38** Board size 9.90 11.40 Equity-based compensation/ 0.11 0.12 total compensation
Table 5. Comparisons of Sample Firms Using Size-Matched Pairs
This table provides summary statistics and difference tests for the size-matched samples. The leveraged recapitalization (LR) sample consists of 41 firms that distribute at least 20 percent of their market value of equity in a debt-financed special dividend or non-targeted tender offer repurchase (but not a leveraged buyout) between 1985 and 1990. The management buyout (MBO) sample consists of 88 firms that use debt financing to go private with at least one top incumbent manager (CEO, chairman, or president) taking an equity position in the buyout between 1985 and 1990. Each LR is matched to an MBO with a similar market value of equity. Whenever possible, a LR is matched to an MBO with full governance data available. If no MBO with a market value of equity within 20 percent of the LR's is available, the LR is not used in this analysis. Each MBO is used as a match only once. Operating income over total assets and over employees are industry-adjusted by subtracting the median value for all Compustat firms with the same four-digit SIC code. Tests for differences use a t-test on the mean difference and a sign rank test on the median difference. ***, **, and * denote significance at the 0.01, 0.05, and 0.10 levels, respectively. Leveraged Management Recapitalizations Buyouts Tests for differences mean mean t-stat number (median) (median) (z-stat) of pairs
Profitability Operating income/total assets 0.040 0.011 2.72** 34 (0.027) (0.013) (3.16)** Operating income/employees 5.81 1.54 1.81* 34 (2.80) (0.56) (2.39)** Governance
CEO equity ownership 2.68 6.96 2.14** 31 (0.60) (1.85) (1.94)* Equity ownership of all 7.42 12.87 1.94* 31 officers and directors (3.80) (6.40) (2.69)** Equity ownership of 12.56 14.29 1.42 31 outside blockholders (8.73) (11.48) (1.50) Board size 10.5 10.8 0.31 31 (10.0) (11.0) (0.78) Outside directors/board size 0.47 0.39 1.64 31 (0.50) (0.40) (1.90)*

Corporate Ownership & Control / Volume 4, Issue 2, Winter 2006-2007 (continued)
180
Table 6. Regression Analysis of Firm Performance on Corporate Governance Mechanisms
This table provides regression results of firm’s operating performance against four corporate governance mechanisms for firms that went through leveraged recapitalizations (LRs) or management buyouts (MBOs). The LR sample consists of 41 firms that distribute at least 20 percent of their market value of equity in a debt-financed special dividend or non-targeted tender offer repurchase (but not a leveraged buyout) between 1985 and 1990. The MBO sample consists of 88 firms that use debt financing to go private with at least one top incumbent manager (CEO, chairman, or president) taking an equity position in the buyout between 1985 and 1990. The dependent variable for regressions (1) and (2) is operating income divided by total assets and operating income divided by number of employees, respectively Both measures of firm performance are industry-adjusted by subtracting the median value for all COMPUSTAT firms with the same four-digit SIC code. T-statistics are in parentheses. ***, **, and * denote significance at the 0.01, 0.05, and 0.10 levels, respectively.
Leveraged Recapitalizations Management Buyouts
Explanatory variable Regression 1 Regression 2 Regression 1 Regression 2
Constant 0.972 (0.625)
1.222 (1.210)
0.643 (0.596)
0.889 (1.046)
Log(Market value of equity) -0.006 (-0.182)
-0.010 (-0.383)
-0.013 (-0.224)
-0.009 (-0.140)
CEO equity ownership 0.051 (1.396)
0.064 (1.802)*
0.109 (3.210)***
0.120 (3.418)***
Equity ownership of outside blockholders
0.032 (0.304)
0.029 (0.288)
0.068 (0.609)
0.063 (0.512)
Outside directors/board size 0.121 (2.204)**
0.150 (2.925)***
0.061 (1.536)
0.075 (1.690)*
Equity-based compensation / total compensation
0.020 (1.382)
0.026 (1.560)
0.035 (1.720)*
0.041 (1.804)*
Number of firms 41 41 88 88
Adjusted R2 0.283 0.266 0.375 0.362

Corporate Ownership & Control / Volume 4, Issue 2, Winter 2006-2007 (continued)
181
THE EFFECTS OF INVESTOR PROTECTION ON THE VENTURE
CAPITAL INDUSTRY*
Luis J. Sanz**
Abstract
In this model the level of investor protection shapes both the investment and exit policies of the venture capitalist. It therefore might help to explain the correlation between the development of both the venture capital industry and the stock market across countries, as well as some of the differences between the venture capital industry in Europe and in the U.S. Keywords: corporate governance, investor, tock market
*I am Grateful to Bilge Yilmaz and Makoto Nakajima for helpful comments. **INCAE, Apartado 2485, Managua, Nicaragua, Tel.: 505-265-8141, Fax 505-265-8617, E-mail: [email protected]
1. Introduction
Entrepreneurial firms that are characterized by significant intangible assets, expect years of negative earnings, and have uncertain prospects, are unlikely to receive bank loans or other debt financing. Similarly, troubled firms that need to undergo restructuring may find external financing difficult to raise. Venture capital organizations finance these high-risk, potentially high-reward projects. They protect the value of their equity stakes by undertaking careful due diligence before making the investments and retaining powerful oversight rights afterwards.
Typically, venture capitalists do not primarily invest their own capital, but rather raise the bulk of their funds from institutions and individuals. Large institutional investors, such as pension funds and university endowments, are likely to want illiquid long run investments such as venture capital in their portfolio. Often, these groups have neither the staff nor the expertise to make such investments themselves.
In this paper, I consider the venture capitalist as a financial intermediary, subject to the venture capital cycle (Gompers and Lerner, 1999). Venture capital funds are usually organized as limited partnerships with predetermined, finite life spans. The venture capitalist raises money from investors, which expect a return in exchange. Given the finite life span of the partnership, eventually the venture capitalist must exit the investments, and give back the proceeds, less his own compensation, to the investors.
A variety of factors may limit access to capital for some of the most potentially profitable and exciting firms. Financial intermediaries like the venture capitalists are usually considered able to address asymmetric information problems by intensively scrutinizing firms before providing capital and then monitoring them afterwards. Here I focus on the latter role, monitoring the behavior of the entrepreneur.
Finally, venture capital investing is primarily equity investing. Thus, most of the venture capitalist’s return arises in the form of capital gains. For this reason, understanding the means by which venture capitalists exit their investments is vital to an understanding of the venture capital process. Potential exit vehicles are Initial Public Offerings (or IPOs), acquisitions, secondary sales, company buybacks, and write-offs. According to Cumming and MacIntosh (2000) the most common in the U.S. and Canada are IPOs and acquisitions.
But the feasibility of these exit vehicles, particularly IPOs, depends on the development of the capital markets. Recent research on corporate governance round the world has established a number of empirical regularities. Such diverse elements of countries’ financial systems as breadth and depth of their capital markets, the pace of new security issues, corporate ownership structures, dividend policies, and the efficiency of investment allocation appear to be explained both conceptually and empirically by how well the laws in these countries protect outside investors. According to this research, the protection of shareholders and creditors by the legal system is central to understanding the

Corporate Ownership & Control / Volume 4, Issue 2, Winter 2006-2007 (continued)
182
patterns of corporate finance in different countries (for a survey, see La Porta, Lopez-de-Silanes, Shleifer, and Vishny, or LLSV, 2000).
In this paper I study how the level of investor protection can affect the venture capital industry. Investor protection can shape the exit policy of the venture capitalists by influencing the profitability of IPOs, relative to other exit vehicles, in particular acquisitions. But it also affects the relationship between the venture capitalists and their investors. Eventually, it can even help to determine the kind of investments that the venture capitalists will undertake.
It is usually assumed that the venture capitalist always prefers to exit his investments through an IPO. Cumming and MacIntosh (2000) suggest that IPOs appear to be the most desirable form of exit for high quality, rapid-growth firms in the U.S. and Canada. However, according to LLSV (1999) firms in countries with lower levels of investor protection are less valued than their counterparts in countries with higher levels of investor protection. Therefore, as long as other exit vehicles are not as affected by the level of investor protection as IPOs, their initial advantage can be eventually overcome by the loss due to the diversion of the firm’s cash flow by the entrepreneur.
In my model startups can either be funded directly by an angel investor, or by giving the money to a venture capitalist, who in turn invests in the startup on behalf of the angel investor. If the firm is successful, it yields a small return. Given the level of investor protection, the entrepreneur can costlessly divert up to a certain fraction of the firm’s return at the end of the period. Both the angel and the venture capitalist can (costly) monitor the entrepreneur if they have invested in the firm, and in this way recover at least part of the firm’s cash flow diverted by the latter.
The venture capitalist has an advantage in that his monitoring cost is lower than that of the angel. However, this might not be enough, because the venture capitalist typically has a lower participation in the proceeds of the investment than the investor. Therefore, the cost advantage has to be high enough to induce the venture capitalist to monitor more than the investor.
But, even this can be short of what is required when we take into account that the venture capitalist can in turn divert part of the funds recovered through the monitoring activity. Because the angel is also able to monitor, the venture capitalist can not divert the proceeds from the investment, except for a part of what he recovers from the entrepreneur. This means that, if the investor protection is low enough, the diversion problem between the angel and the venture capitalist actually outweighs the monitoring advantage of the venture capitalist, inducing the angel to invest by himself. In consequence, the level
of investor protection can affect the ability of the venture capital industry to perform its intermediation function.
When the venture capitalist is not able to raise the funds from the angel investor, I assume that he can not invest in startups. However, by raising funds from different kinds of investors, he may be able to fund the growing opportunities of successful firms. Again, his initial advantage, if any, is eventually overcome when investor protection is bad enough. Therefore, for the lowest levels of investor protection, the venture capital industry may collapse together with the capital markets. However, it is not the latter what is causing the former, but rather both are the consequence of the low level of investor protection.
I assume here that the venture capitalist is not allowed to invest in both startups and growing firms, but instead is forced to specialize in one of them. I also assume that even for the highest feasible level of investor protection, the entrepreneur can always obtain some private benefits from diversion. As long as the venture capitalist prefers to invest in startups, we have that for the highest levels of investor protection; he invests in the firm on behalf of the angel, and exits the investment through an IPO.
However, for intermediate levels of investor protection, it is possible that the angel invests directly in the startup, and the venture capitalist in turn funds the expansion phase. I think this result can shed some light on the differences between the venture capital industries in Europe and in the U.S.
This paper contributes to the study of the venture capital industry by considering the venture capitalist as a financial intermediary subject to an agency problem similar to the one he faces when investing in entrepreneurial firms. This is similar to some of the work in Gompers and Lerner (1999). However, to my knowledge this paper is the first attempt to link the development and organization of the venture capital industry with the level of investor protection.
Black and Gilson (1999) suggest that the development of the venture capital industry is correlated with the dynamics of the stock market. And they try to explain this correlation with the idea that IPOs are an important resource for the venture capitalist because the private benefits of control the entrepreneur can enjoy afterwards induce him to work harder if the exit policy of the venture capitalists is to take public the successful firms. For the private benefits of control to play such a key role is required that the cost of both the capital provided by the venture capitalists and the cost of effort by the entrepreneur are together higher than the public returns yielded by the firm.
Only in this case private benefits of control can make a difference by allowing the venture capitalist to use them as part of the entrepreneur’s

Corporate Ownership & Control / Volume 4, Issue 2, Winter 2006-2007 (continued)
183
compensation. In other words, the net present value of these entrepreneurial projects is negative unless private benefits of control (which, in contrast with my model, are independent of the value of the firm) are used as a part of the compensation offered to the entrepreneur for his effort.
In the model here the correlation between the dynamics of the venture capital industry and the stock market is rather explained by the influence of investor protection in both the profitability of IPOs and the funds raised by the venture capitalist. Indeed, investor protection affects the profitability of the stock market for all kinds on investors, including venture capitalists. Then, it is possible that venture capitalists in countries different than the U.S. might prefer other exit vehicles, just like any other investors in those countries. Therefore, the results in Cumming and MacIntosh (2000) about the preference of the venture capitalist to exit rapidly-growing successful firms through IPOs can not just be simply translated to other countries. IPOs need not be the most profitable exit vehicle in all countries.
Obviously, investor protection is only one of many factors that indeed affect the venture capital industry. Moreover, the effects considered here might inter-act with some others, producing different results. However, the main message of this paper is that we can not compare the venture capital industry across different countries without taking into consideration the differences in the level of investor protection. And that policy makers interested in stimulating the development of the venture capital industry should also take a look at the level of investor protection in their respective countries.
The paper is organized as follows. The next section introduces the basic model. Section 3 starts by establishing in this context the (already known) principle of delegated monitoring: if the monitoring cost advantage of the financial intermediary is high enough, the investors delegate the monitoring activity, and the investment, on the venture capitalist. Section 4 analyzes the case when the venture capitalist can divert. It begins by assuming that he is restricted to invest in startups, and then explores what happens if we relax this assumption in a specific way: the venture capitalist can invest in later stage firms when he is not the preferred choice for the startup phase. In light of these results, section 5 reexamines some of the empirical evidence available and discusses the model. Section 6 concludes.
2. The model
There are three risk neutral agents. The first is an entrepreneur (e) with an investment project but not enough wealth to fund it. The second is an angel investor (a). The third is a venture capitalist (v). An angel is a wealthy individual who invests in
entrepreneurial firms and performs many of the same functions as the venture capitalist. However, while the latter raises capital from institutional as well as other individual investors, the former invests only his own capital. Therefore, the venture capitalist is the only one that can be considered a financial intermediary.
The project of the entrepreneur has two different stages, both requiring outside financing. The first stage is the startup or development phase. At this time is not clear whether the project can be successful or not. The project is successful with probability p, and unsuccessful otherwise. When successful, the project produces a return of V1, of which the outside investor owns a fraction α. It also yields a growth opportunity. If the project is unsuccessful the return is zero. In the second (or expansion) stage successful firms invest in expanding their operations. There is no discounting.
I assume that the first stage is too risky to support funding through capital markets or other traditional intermediaries. Hence, the only two possible sources of funding are the venture capitalist and the angel investor. I assume that the angel is interested to invest only in the startup stage. In turn, the venture capitalist is constrained to invest only in one phase, he either invests on the startup stage or in the expansion phase. Furthermore, I assume that the venture capitalists have a preference for the development phase.
Therefore, he will invest in the second stage only when he can not do it in the first one. However, once the project has been shown to be successful, it is possible to raise funds from the capital markets (V1 is not enough to fund this part). This will provide both types of investor with an exit vehicle for their investments. Under this alternative, the entrepreneur will regain unsupervised control of the
firm, yielding a return of e
V2 . There is also the
possibility of selling the outside investor’s participation in the project to an established firm, or buyer, who will fire the entrepreneur, take control of the firm, and finance its expansion. However, given that the project has already proven to be successful under the management of the entrepreneur, I assume that the second stage return under the buyer is only
ebVV 22 ≤ . 1
In each stage the entrepreneur can divert, at no cost, a fraction φ [0, 1] of the firm’s cash flow, which produces the same amount of private
1 This seems consistent with the actual returns pf the venture capital industry in the U.S. According to Gompers and Lerner (1999), by far the most profitable exit is an IPO, yielding $1.95 in excess of an initial investment of $1, with an average holding period of 4.2 years. The next bes6t alternative is an acquisition, with an average holding period of 4.2 years. The next best alternative is an acquisition, which yields a return of only 0.4 cents over a 3.7 years average holding period.

Corporate Ownership & Control / Volume 4, Issue 2, Winter 2006-2007 (continued)
184
consumption for him. But expropriation of shareholders is limited by the legal system. To model legal shareholder protection I follow Burkart, Panunzi, and Shleifer (2002) and assume that the law sets and upper bound φ [0, 1] to the fraction of the firm’s cash flow that can be diverted. Stronger legal protection corresponds to lower values of φ.
The law is not the only determinant of the fraction of resources diverted for private benefits. The other is monitoring. Both the venture capitalist and the angel investor can monitor the entrepreneur
at a cost j
j
j km
k ,2
2
> 0 for all j, j {v, a}, and
recover a fraction mj [0, 1] of the firm’s cash flow. The monitoring technology of the venture capitalist is superior, due to a higher expertise, to that of the angel investor, and this is reflected on a lower monitoring cost, ka > kv. Therefore, the angel must decide whether to invest by himself or give his funds to the venture capitalist, who in turn will invest on his behalf.
Investments funded through the capital markets are not subject to monitoring, probably because individual investors will have a participation too small to justify the monitoring cost.
Also, to simplify the calculations I assume that the expected value of the buyer in the second stage is independent from the level of investor protection.
Actually, for the results is enough that IPOs are more affected by the (low) level of investor protection than other exit vehicles. This might be the case if, for instance, the acquirer is a private firm with a big controlling shareholder.
3. Only the entrepreneur can divert
Here I restrict the venture capitalist to invest only in startups, and then consider whether the angel investor should give his money to the venture capitalist, or rather invest it by himself. Since the angel investor is also assumed to invest only during the development phase, both investors are required to exit their investment at the end of the first period. Hence, the only two exit vehicles. This seems consistent with the actual returns of the venture capital industry in the U.S. According to Gompers and Lerner (1999), by far the most profitable exit is an IPO, yielding $1.95 in excess of an initial investment of $1, with an average holding period of 4.2 years. The next best alternative is an acquisition, which yields a return of only 0.4 cents over a 3.7 years average holding period. Available at this time are an IPO or selling the firm (acquisition)2. I analyze the
2 These are indeed the two most common exit vehicles in the U.S.
problem backwards, starting by the exit decision at the end of the startup stage, and then exploring whether the firm is funded by either the angel investor or the venture capitalist.
3.1. Exit policy First notice that in this simple framework the exit decision is the same for the venture capitalist and the angel investor. They both want to maximize their profits by choosing the most profitable exit vehicle. Hence, this decision is independent of the type of investor.
Although an IPO will produce a higher return for the investor in the Absence of expropriation, this advantage is reduced by diversion. As the next lemma shows, once we take into account the effect of investor protection, an IPO needs not be the preferred exit vehicle all the time.
Lemma 1 For φ ≤ 1− ,2
2
e
b
V
V, an IPO is preferred to
an acquisition. For φ > 1−V ,2
2
e
b
V
V the opposite is
true.
Proof. First, notice only that since expropriation is costless, there is no Reason for the entrepreneur to divert less than φ. Now, because of diversion, what the investor can obtain from selling the firm through
an IPO is only (1 − φ)eV2 , rather than
eV2 . And
from an acquisition the investor can get b
V2 .
Comparing these two results we have that the IPO is
preferred as long as (1 − φ)eV2 ≥
bV2 .After some
algebra, this is equal to φ ≤ 1− e
b
V
V
2
2
Lemma 1 tells us that for high levels of investor protection, the stock market is the preferred alternative to exit their investment for both investors. But for low levels they both favor an acquisition. Let
2V= max
( ){ }eb VV 22 1, φ−. Realize that the level
of investor protection can affect the profitability of the original investment, by reducing the expected profit in the second stage.3
and Canada, according to Cumming and MacIntosh (2000). 3 LLSV (1999) found evidence of higher valuation of firms in
countries with better protection of minority shareholders. But clearly this affects all firms and not only those founded by venture capitalist. Therefore, in general the level of investor protection can effect the funding of new firms, as long as they depend on outside financing. Notice also that the results here are consistent with other works in that the number of listed firms is lower in countries with low levels of investor’s protection( LLSV,2000).

Corporate Ownership & Control / Volume 4, Issue 2, Winter 2006-2007 (continued)
185
3.2. Financial intermediation versus direct investment
We know that the participation of the outside investor in the firm is equal to α. Additionally, let δ be the participation of the venture capitalist in the venture capital fund. And let β be his participation in the firm. Hence,
β = δα (1)
Since 2V V2 comes from a public transaction, I
assume that the entrepreneur can not divert any fraction of it. However, consider the diversion problem in the first stage. If successful, the firm
yields a return of 2V . The entrepreneur can divert up
to a fraction φ of it. However, given the monitoring technology, he only controls
{ }je m−= φφ ,0max (2)
for j ∈ {a, v}. In turn, the monitoring decision of the angel investor is determined by
( ){ }21
2
1max aM
aaMa
kVm −+− φα (3)
However, the angel investor does not monitor more than φ. Therefore, we have that
=
a
vk
Vm 1* ,min βφ (4)
Notice that in order to guarantee that
[ ]1,0* ∈am for all α, we require that 1Vka ≥
. In a similar fashion we can determine that
=
v
vk
Vm 1* ,min βφ (5)
Again, we require that vk > 1V . Now, when
[ ]{ }va k
V
k
V 11 ,min βαφ ≤ , neither the venture
capitalist nor the angel investor have a monitoring advantage over the other, because both
.** φ== aivc mm . Moreover, the entrepreneur does
not enjoy any private benefits at all. In order to make the model more interesting, I will consider only situations in which the entrepreneur always enjoys private benefits of control. To that effect the following assumption is made.
Assumption 1: { }va k
V
k
V 11 ,max βαφ ≥
Now, this assumption implies that ,1*
vk
V
vm β= , and
.1* V
ka am α= If
**
av mm ≥ the venture capitalist has a
monitoring advantage, while if **
av mm ≤ is the
angel who has the edge. This is established in the next lemma.
Lemma 2 Suppose assumption 1 is satisfied. Then,
for δ > a
v
k
kthe angel investor gives his money to the
venture capitalist, who in turn invests on his behalf.
For δ a
v
k
k≤δ the angel investor finances the project
directly. Proof. Since V2 is the same for both types of investor, we only have to compare their utility in the first stage. The angel investor will give his money to the venture capitalist when his share of the funds recovered by the venture capitalist through monitoring equals or exceeds the amount he will recover by himself, i.e., when
**
av mm ≥ (6)
Given assumption 1 this is equivalent to
av k
V
k
V 11 αβ ≥
a
v
k
k≥δ (7)
Lemma 2 tells us that when the difference in
monitoring costs is enough to compensate for the lower participation of the venture capitalist in the firm, then the angel prefers to invest his money in the venture capital fund. In other words, for the venture capitalist to emerge as a financial intermediary a lower monitoring cost is not enough in this case. Because the venture capitalist has a lower participation in the proceeds recovered through the monitoring activity, his cost has to be low enough in order for him to be willing to monitor more than the angel investor. This is the usual result on delegated monitoring, adapted to the model considered here. Proposition 3. Suppose assumption 1 is satisfied and
that a
v
k
k≥δ . Then, the venture capitalist exits the
investment through an IPO if e
b
V
V
2
21 −≤φ , and
through an acquisition otherwise. Proof. It follows from lemmas 1 and 2. Proposition 3 tell us that when the venture capitalist invest on behalf of the angel investor, an IPO is not always his preferred exit vehicle. Obviously, the case here is extreme because I assumed that the value of the successful firm for the buyer is independent of the level of investor protection. However, as long as the buyer’s
Corporate Ownership & Control / Volume 4, Issue 2, Winter 2006-2007 (continued)
186
valuations is less affected by the level of investor protection than the stock market’s valuation of the firm, the initial advantage of taking the firm public tends to disappear. Although IPOs might indeed have advantages not considered in this paper, clearly the level of investor protection has an impact on their profitability (and even on their feasibility).
But, Allen (2001) suggests that there is an inconsistency in assuming that when you give your money to a financial institution there is no agency problem but when you give it to a firm there is. The next section deals with an extended model that allows for this possibility.
4. Allowing the venture capitalist to divert
In this section we go back to the question in Diamond (1984): who monitors the monitor? Rather than to assume the optimal contract between the intermediary and the investor, as Diamond does, I just consider the effect of the level of investor protection in the relationship between the investor and the venture capitalist, when their contract is equity-like.
I assume that the venture capitalist can divert in
turn a fraction φ
of the fraction vm recovered
through monitoring, subject to the same upper bound as the entrepreneur. This means that the venture capitalist can appropriate for himself at no cost up to
a fraction vmφ of the firm’s cash flow. The reason
why the venture capitalist can divert only from the amount he recovers is that this is precisely the less visible return, presumably because it was already hidden by the entrepreneur.
In contrast, whatever the latter does not divert by himself remains open to the public and it should be easier to verify by the investors of the venture fund (given that the angel can monitor too). The question now is whether the monitoring advantage of the venture capitalist, with respect to the investment in the firm, is enough to compensate for the diversion problem between him and his own investors?
4.1. Does the venture capitalist have an initial advantage?
In this extended model the monitoring decision of the venture capitalist is given by the following problem
( )( )
−++−2
~~~11max
2
11~
v
vvm
mkVmVm
v
φφβ (8)
Hence, as before, we have that
( )[ ]
−+=v
vk
Vm 1* 1,min~ βφβφ (9)
Comparing conditions (5) and (9) is clear that the possibility of divert for his private use part of the proceedings from monitoring the entrepreneur increases the incentives of the venture capitalist to do so. Notice that now assumption 1 is not enough to guarantee the existence of private benefits of control for the entrepreneur. In fact, they are zero for
( )[ ]1
11
1,
Vk
V
Ka
V
v β
ββφ−−
∈ . Hence, the next assumption is
made to provide conditions similar to those in the previous section.
Assumption 2: { }1
11
)1(,max
Vk
V
k
V
va β
βαφ−−
≥
But now diversion also affects the amount recovered that is available to be distributed to the investors in the venture fund. For this reason, it is not clear when the venture capitalist really yields higher revenues for the investor, compared with what the angel can do by himself. In this case, the angel have to compare the value of the investment in the firm under the venture capitalist,
( )( ) 21
*~11 VVmv ++− φ,with the value of the
investment in the firm if he invest directly,
( ) 21
*1 VVma ++. As before, we can reduce this
problem to the comparison of ( ) *~1 vmφ−
and *
am.
In the previous section a
v
k
k≥δ
together with assumption 1 implied that the venture capitalist had a monitoring advantage over the angel investor
( )**
aivc mm ≥, and therefore the latter preferred to
give the funds to the former. However, this needs not
be the case anymore. Even if**~av mm ≥
, still it is
possible that ( ) **1 av mm ≤− φ
under assumption 2. In words, the distortion introduced by diversion in the relationship between the venture capitalist and the investor might be high enough to overcome the venture capitalist’s monitoring advantage. Then, when will the angel investor give his money to the venture capitalist? The next proposition starts to answer this question by considering if the venture capitalist is indeed the preferred choice of the investor when the level of diversion allowed is
minimum, i.e., when ( ){ }1
11
1,max
Vk
V
k
V
va β
βαφ−−
=
Proposition 4. Suppose that assumption 2 holds with
equality. Then, when ( )( ) ( )( )a
a
v
v
v
v
k
k
Vk
k
Vk
Vk≥
−−−−
−δ
ββ 111 1
1 ,
the angel prefers to give his funds to the venture
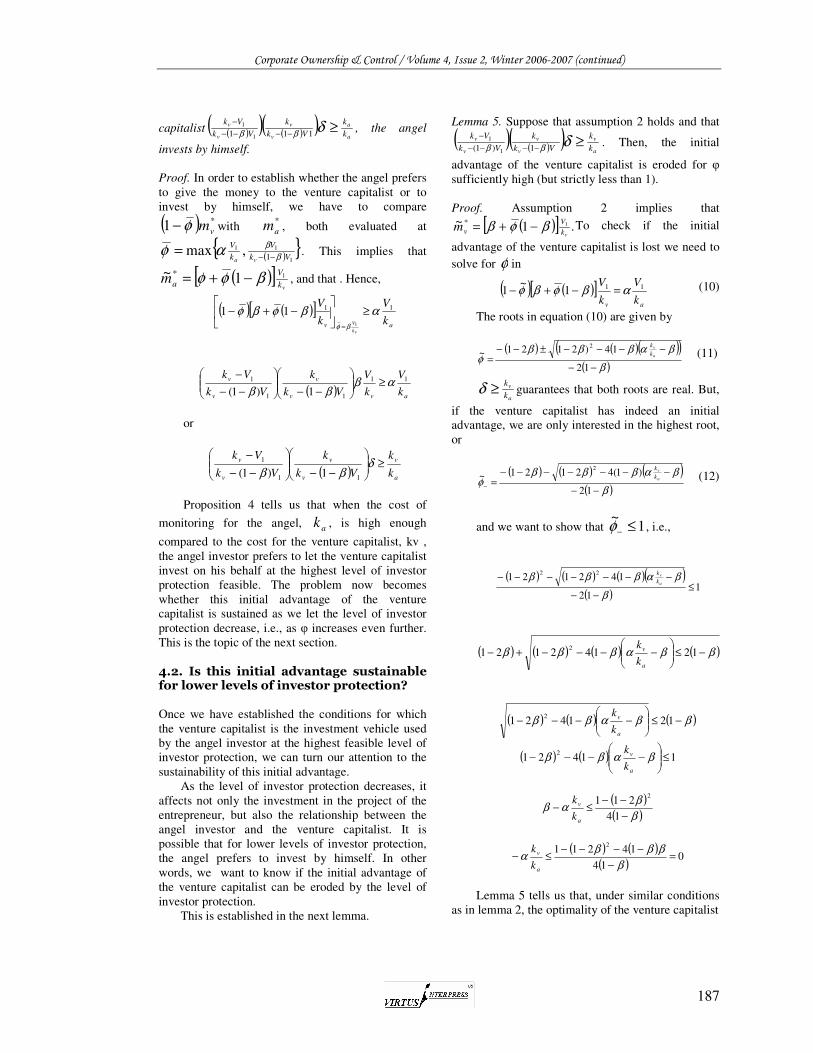
Corporate Ownership & Control / Volume 4, Issue 2, Winter 2006-2007 (continued)
187
capitalist ( )( ) ( )( )a
a
v
v
v
v
k
k
Vk
k
Vk
Vk≥
−−−−
− δββ 111 1
1 , the angel
invests by himself.
Proof. In order to establish whether the angel prefers to give the money to the venture capitalist or to invest by himself, we have to compare
( ) *1 vmφ− with *
am , both evaluated at
( ){ }1
11
1,max
Vk
V
k
V
va β
βαφ−−
= . This implies that
( )[ ]vk
V
am 11~ * βφφ −+= , and that . Hence,
( ) ( )[ ]av k
V
k
V
vk
V
11
1
11 αβφβφβφ
≥
−+−
=
( ) avv
v
v
v
k
V
k
V
Vk
k
Vk
Vk 11
11
1
1)1(αβ
ββ≥
−−
−−
−
or
( )a
v
v
v
v
v
k
k
Vk
k
Vk
Vk≥
−−
−−
−δ
ββ 11
1
1)1(
Proposition 4 tells us that when the cost of
monitoring for the angel, ak , is high enough
compared to the cost for the venture capitalist, kv , the angel investor prefers to let the venture capitalist invest on his behalf at the highest level of investor protection feasible. The problem now becomes whether this initial advantage of the venture capitalist is sustained as we let the level of investor protection decrease, i.e., as φ increases even further. This is the topic of the next section.
4.2. Is this initial advantage sustainable for lower levels of investor protection?
Once we have established the conditions for which the venture capitalist is the investment vehicle used by the angel investor at the highest feasible level of investor protection, we can turn our attention to the sustainability of this initial advantage. As the level of investor protection decreases, it affects not only the investment in the project of the entrepreneur, but also the relationship between the angel investor and the venture capitalist. It is possible that for lower levels of investor protection, the angel prefers to invest by himself. In other words, we want to know if the initial advantage of the venture capitalist can be eroded by the level of investor protection. This is established in the next lemma.
Lemma 5. Suppose that assumption 2 holds and that
( ) ( )( )a
v
v
v
v
v
k
k
Vk
k
Vk
Vk≥
−−−−
− δββ 1)1( 1
1 . Then, the initial
advantage of the venture capitalist is eroded for φ sufficiently high (but strictly less than 1).
Proof. Assumption 2 implies that
( )[ ] .1~ 1*
vk
V
vm βφβ −+= To check if the initial
advantage of the venture capitalist is lost we need to
solve for φ in
( ) ( )[ ]av k
V
k
V 111~
1 αβφβφ =−+− (10)
The roots in equation (10) are given by
( ) ( )( )( )( )β
βαβββφ
−−
−−−−±−−=
12
14)2121~2
a
v
k
k
(11)
a
v
k
k≥δ guarantees that both roots are real. But,
if the venture capitalist has indeed an initial advantage, we are only interested in the highest root, or
( ) ( ) ( )( )β
βαβββφ
−−
−−−−−−−=−
12
)1(42121~2
a
v
k
k
(12)
and we want to show that 1~
≤−φ , i.e.,
( ) ( ) ( )( )( )
112
14212122
≤−−
−−−−−−−
β
βαβββa
v
k
k
( ) ( ) ( ) ( )ββαβββ −≤
−−−−+− 12142121
2
a
v
k
k
( ) ( ) ( )ββαββ −≤
−−−− 121421
2
a
v
k
k
( ) ( ) 114212
≤
−−−− βαββ
a
v
k
k
( )( )β
βαβ
−
−−≤−
14
2112
a
v
k
k
( ) ( )( )
014
142112
=−
−−−−≤−
β
βββα
a
v
k
k
Lemma 5 tells us that, under similar conditions
as in lemma 2, the optimality of the venture capitalist

Corporate Ownership & Control / Volume 4, Issue 2, Winter 2006-2007 (continued)
188
is not absolute: for lower levels of investor protection the angel prefers to invest by himself. This is one of the effects of the level of investor protection in the venture capital industry. The other, stated in lemma 1, is on the exit policy. Also, realize
that if v
e
b
k
V
V
V 1
2
21 α≤− , then IPOs never happen. The
exit policy is therefore restricted to acquisitions, and lemma 5 applies directly. The next proposition puts both effects together. Proposition 6. Suppose that assumption 2 holds, that
ve
b
k
V
V
V 1
2
21 α≥− , and that
( )( ) ( )( )a
v
v
v
v
v
k
k
Vk
k
Vk
Vk≥
−−−−
− δββ 11
1
11. Then, when
_12
21 φα ≤−≤ e
b
v V
V
K
V we have that: (i) for
e
b
v V
V
k
V
2
21 1 −≤≤ φα the venture capitalist invests on
behalf of the angel, and exits through an IPO; (ii) for
_~
12
2 φφ ≤≤− e
b
V
V the venture capitalist invests on
behalf of the angel but exits through an acquisition;
(iii) for φφ ≤_ the angel invests directly and exits
through an acquisition. And, when
e
b
v V
V
k
V
2
21 1_~
−≤≤ φα we have that: (i) for
_~
1 φφα ≤≤vK
Vthe venture capitalist invests on
behalf of the angel and exits through an IPO; (ii) for
e
b
V
V
2
21_~
−≤φ the angel invests by himself and exits
through an IPO; (iii) φ≤− e
b
V
V
2
21 the angel invests
directly but exits through and acquisition. Proof. It follows from lemmas 1 and 5, and proposition 4. The results in proposition 6 are clear cut for both high and low levels of investor protection: for the former the venture capitalist is the outside investor and IPOs are the preferred exit mechanism, while for the latter the angel finances the startups directly and sells the successful ones to the buyer.
However, the results for intermediate levels of investor protection depend on the value of some of the parameters. In one case the investor finances the firm directly, while in the other he gives his money to the venture capitalist. What it is interesting is that when the latter happens, the venture capitalist prefers to exit by selling the successful firms to the buyer, even though he could have taken them public. This result is again at odds with the common supposition that the venture capitalist always prefers IPOs.
Hitherto I restricted the venture capitalist to invest only in startups. The next section explores what happens if he is allowed to invest in later stages
when the angel invests by himself during the development phase.
5. Allowing the venture capitalist to invest in the growing phase
Assume now that the venture capitalist can invest in the expansion phase as long as the angel investor invests by himself in the startup stage. Since the angel investor is funding the firm at its start, it must be that the venture capitalist raises his funds from other investors. Also, I assume that the value of the firm, absent any diversion, remains the same when
taken public, i.e., e
V2 .
Given the monitoring technology of the venture capitalist, the exit choice at the end of the startup stage is restricted again to two alternatives: the venture capitalist or an acquisition.4 Denote the venture capitalist participation in the firm in the second stage as γ. Then, his monitoring choice is given by
( )[ ]
−+=v
e
vk
Vm 21,max~ γφγφ (13)
Notice that the entrepreneur might or might not enjoy private benefits in the second period, since I will no assume here anything about φ. The next lemma shows what the optimal exit policy is in this case. Lemma 7. When the exit choice at the end of the startup phase is between a venture capitalist and a
buyer, we have that: (i) for ( )
2
2
11 e
v
b
Vm
V
+−≤φ the
venture capitalist is preferred; (ii) while for
( ) ev
b
Vm
V
2
2
11
+−≥φ the buyer is preferred.
Proof. The proof is trivial and follows from the fact that the venture capitalist is preferred to the buyer if
.)~1)(1( 22
be
v VVm ≥+− φ
Now, from proposition 6 we know that there are two different cases in which the venture capitalist is not the preferred investor at the startup stage. The next proposition analyzes when, if any, the venture capitalist would be the chosen mechanism to fund the expansion stage.
Proposition 8. Suppose proposition 6 holds and
._~
φφ ≤ When ev
b
Vm
V
2)
2
)~1(1_
+−≥φ
4 In fact, this will remain true even of the value of the firm in the
second period under the venture capitalist were ev VV 22 ≤ . All
that is requires is ( )( ) ( ) ( ).1,.,111 2
22 −≥−≥+−eV
v
ev
v meiVVm φφ

Corporate Ownership & Control / Volume 4, Issue 2, Winter 2006-2007 (continued)
189
the venture capitalist is never preferred. When
ev
b
Vm
V
2)
2
)~1(1_
+−≤φ the venture capitalist is
preferred only if ev
b
Vm
V
2)
2
)~1(1_
+−≤≤ φφ .
Proof. From proposition 6 we know that when
φφ ≤_~
the angel investor finances the startup
stage directly. Hence, the venture capitalist is then allowed to invest in the expansion stage. When
ev
b
Vm
V
2)
2
)~1(1_
+−≥φ , lemma 7 implies that the
venture capitalist is not chosen to fund the expansion phase either.
Now, when e
v
b
Vm
V
2)
2
)~1(1_
+−≤φ
it follows directly from lemma 7 that the venture capitalist is preferred
as long ase
v
b
Vm
V
2)
2
)~1(1_
+−≤≤ φφ
. If we put together the results in propositions 6
and 8 we get again that for high levels of investor protection the venture capitalist funds the startup phase and exits through an IPO. This case follows directly from proposition 6.
While for low levels of investor protection the venture capital industry collapses, and the venture capitalist is not able to invest neither at the startup phase nor at the expansion one (propositions 6 and 8).
Again, the results for the intermediate levels of investor protection are not clear cut and depend on the value of some of the parameters.
However, now it is possible to have the startup phase funded by the angel investor, and the expansion phase funded by the venture capitalist. In this way, the venture capitalist is able to extend the scope of his participation in the process of financial intermediation.
Finally, notice that I did not specify how the venture capitalist exits his investment in the expansion phase.
However, we can still apply lemma 1 with the corresponding modifications. Moreover, at the end of the expansion phase the entrepreneur might be able to buyback all outside participation in the firm. Clearly, in such a case the diversion problem disappears.
The model in here has so far yielded some testable implications. Although an empirical test of these might be interesting, I decided to postpone it for a later work. Instead, the next section gives discusses the model and some of the empirical evidence available.
6. Discussion The venture capital industry varies greatly
across nations, not only in size but also in the type of investors, institutional agreements, and firms funded. The following table shows the size of the venture capital industry in 20 countries in 1995, as reported by Gompers and Lerner (1999, p. 16).
Table 1.Venture capital investments Million of
Dollars5
Country Total Total venture capital invested
Australia 54
Austria 0.4
Belgium 8
Canada 182
Denmark 4
Finland 1
France 35
Germany 116
Ireland 1
Italy 60
Japan 11
Netherlands 100
New Zealand 1
Norway 7
Portugal 9
Spain 24
Sweden 9
Switzerland 1
United Kingdom 36
United States 3,374
It is clear from table 1 that the dynamism of the
venture capitalist industry in the U.S. is much greater than in any other country. In fact, the size of the funds invested in the U.S. is more than 18 times that in Canada, the country with he second largest industry.
However, these figures are obviously affected by the size of the economies. In fact, Black and Gilson (1999) reported that, after adjusting using the GDP for each country, by 1994 Canada has a similar figure to the U.S. Also, United Kingdom and Ireland have figures close to the U.S. in new capital committed to venture capital funds in 1993-1994 as a percentage of GDP, while other European countries fall far behind.
The latter is shown in the next table, taken from Black and Gilson (1999, p. 20). Notice that while Canada has a relative open market for domestic IPOs as well as for IPOs into the nearby U.S. market, Ireland has easy access to the London stock market.
5 All figures in 1997 U.S. dollars. Gompers and Lerner used
figures for early stage funds in each country outside the U.S. I decided to exclude the information for Israel, which was an
estimate.
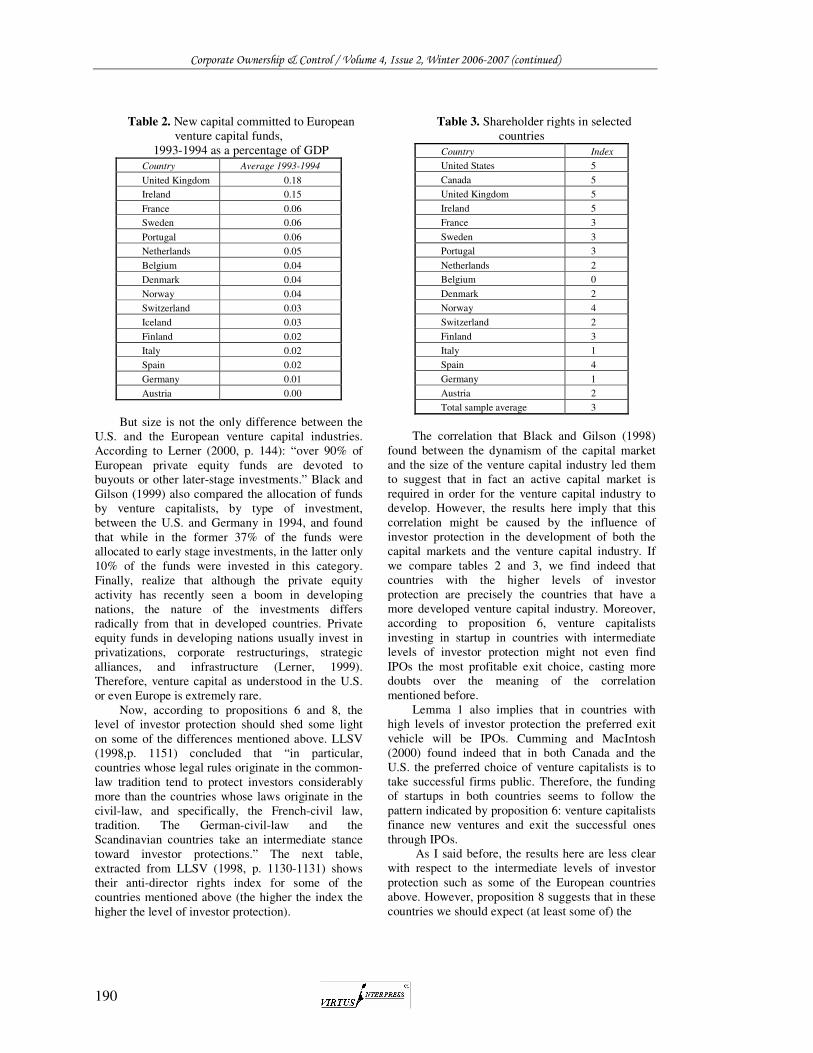
Corporate Ownership & Control / Volume 4, Issue 2, Winter 2006-2007 (continued)
190
Table 2. New capital committed to European venture capital funds,
1993-1994 as a percentage of GDP
Country Average 1993-1994
United Kingdom 0.18
Ireland 0.15
France 0.06
Sweden 0.06
Portugal 0.06
Netherlands 0.05
Belgium 0.04
Denmark 0.04
Norway 0.04
Switzerland 0.03
Iceland 0.03
Finland 0.02
Italy 0.02
Spain 0.02
Germany 0.01
Austria 0.00
But size is not the only difference between the
U.S. and the European venture capital industries. According to Lerner (2000, p. 144): “over 90% of European private equity funds are devoted to buyouts or other later-stage investments.” Black and Gilson (1999) also compared the allocation of funds by venture capitalists, by type of investment, between the U.S. and Germany in 1994, and found that while in the former 37% of the funds were allocated to early stage investments, in the latter only 10% of the funds were invested in this category. Finally, realize that although the private equity activity has recently seen a boom in developing nations, the nature of the investments differs radically from that in developed countries. Private equity funds in developing nations usually invest in privatizations, corporate restructurings, strategic alliances, and infrastructure (Lerner, 1999). Therefore, venture capital as understood in the U.S. or even Europe is extremely rare.
Now, according to propositions 6 and 8, the level of investor protection should shed some light on some of the differences mentioned above. LLSV (1998,p. 1151) concluded that “in particular, countries whose legal rules originate in the common-law tradition tend to protect investors considerably more than the countries whose laws originate in the civil-law, and specifically, the French-civil law, tradition. The German-civil-law and the Scandinavian countries take an intermediate stance toward investor protections.” The next table, extracted from LLSV (1998, p. 1130-1131) shows their anti-director rights index for some of the countries mentioned above (the higher the index the higher the level of investor protection).
Table 3. Shareholder rights in selected countries
Country Index
United States 5
Canada 5
United Kingdom 5
Ireland 5
France 3
Sweden 3
Portugal 3
Netherlands 2
Belgium 0
Denmark 2
Norway 4
Switzerland 2
Finland 3
Italy 1
Spain 4
Germany 1
Austria 2
Total sample average 3
The correlation that Black and Gilson (1998)
found between the dynamism of the capital market and the size of the venture capital industry led them to suggest that in fact an active capital market is required in order for the venture capital industry to develop. However, the results here imply that this correlation might be caused by the influence of investor protection in the development of both the capital markets and the venture capital industry. If we compare tables 2 and 3, we find indeed that countries with the higher levels of investor protection are precisely the countries that have a more developed venture capital industry. Moreover, according to proposition 6, venture capitalists investing in startup in countries with intermediate levels of investor protection might not even find IPOs the most profitable exit choice, casting more doubts over the meaning of the correlation mentioned before.
Lemma 1 also implies that in countries with high levels of investor protection the preferred exit vehicle will be IPOs. Cumming and MacIntosh (2000) found indeed that in both Canada and the U.S. the preferred choice of venture capitalists is to take successful firms public. Therefore, the funding of startups in both countries seems to follow the pattern indicated by proposition 6: venture capitalists finance new ventures and exit the successful ones through IPOs.
As I said before, the results here are less clear with respect to the intermediate levels of investor protection such as some of the European countries above. However, proposition 8 suggests that in these countries we should expect (at least some of) the

Corporate Ownership & Control / Volume 4, Issue 2, Winter 2006-2007 (continued)
191
venture capitalists to invest more in firms on the expansion stage. And this is indeed what seems to happen in the European venture capital industry.
However, there are some countries that do not quite follow the suggested path. In particular, England and Ireland, with their higher level of investor protection should behave more like the North American industry, while in fact they are more similar to their European counterparts. This might be due at least in part to the fact that most private equity funds in England are offshoots from financial institutions. Also, it is worth noting that the United Kingdom was the cradle of European private equity, and most of the top-tier players are of British origin (Lerner, 1999).
Obviously, there are other factors affecting the development and organization of the venture capital industry than just the degree of investor protection (see, for instance, Gompers and Lerner, 1999, for an excellent account of some of the main forces behind the venture capital cycle). It is also evident that venture capitalists are capable of adapting to different business environments, as their incursion in developing countries shows. In those countries they do not finance startups or later-stage firms, but rather other kinds of investments in which their financial expertise allows them to be competitive.
However, I think that the empirical evidence presented in this section points at least to some influence of the level on investor protection in the venture capital industry. Therefore, policy makers trying to develop the venture capital industry should take into account how the level of investor protection in their country will affect its development and organization.
As well, venture capitalists usually perform other functions beyond monitoring, some of which can help the development of capital markets. For instance, Megginson and Weiss (1991) argue that the venture capitalist can certify to investors that the firms they bring to market are not overvalued. This should improve the growth of the stock market by eliminating the under pricing of IPOs due to asymmetries of information. Hence, the level of investor protection not only affects the valuation of publicly traded firms directly, but also indirectly because the absence of a venture capital industry accentuates the inefficiencies caused by asymmetric information. This is an example of the symbiotic relationship between markets and financial intermediaries, as stated in Allen and Gale (2000).
7. Conclusion
In this paper I showed how the level of investor protection can influence not only the exit policy of the venture capitalist, but his investment policy as
well. The venture capital industry collapses for the lowest levels of investor protection. Although this is correlated with the stock market, the reason behind both is the poor protection granted to minority investors. For the highest levels of investor protection, the venture capitalist invests in startups and takes public the successful ones. This resembles the U.S.-Canada industry. For the intermediate levels of investor protection it is possible that the venture capitalist invests rather in expansion firms (later-stage firms). Moreover, his preferred exit vehicle might not be an IPO. I think this might explain some of the differences between the venture capital industries in Europe and the U.S. But, the cases of the venture capitalists in England and Ireland, who according to this model should behave more like their counterparts in the U.S., and instead follow the same strategies as their European cousins, suggest that there may be still some other forces shaping the venture capital industry. The latter, as well as a more formal empirical test of the results in this paper, are suitable topics for future research. References
1. Allen, F., 2001. Do financial institutions matter?
Financial Institutions Center, University of Pennsylvania, working paper 01-04.
2. Allen, F., and Gale, D., 2000. Comparing financial systems. The MIT Press.
3. Black, B., and Gilson, R., 1999. Does venture capital require an active stock market? Journal of Applied Corporate Finance, winter, 36-48.
4. Burkart, M., Panunzi, F., and Shleifer, A., 2002. Family firms. NBER, working paper 8776.
5. Cumming, D. J., and MacIntosh, J. G., 2000. Venture capital exits in Canada and the United States. Working paper.
6. Diamond, D. W., 1984. Financial intermediation and delegated monitoring. Review of Economic Studies, 51, 393-414.
7. Gompers, P., and Lerner, J., 1999. The venture capital cycle. The MIT Press.
8. La Porta, R., Lopez de Silanes, F., Shleifer, A., and Vishny, R., 1998. Law and finance. Journal of Political Economy, 106.
9. La Porta, R., Lopes de Silanes, F., Shleifer, A., and Vishny, R., 1999. Investor protection and corporate valuation. Harvard University, working paper.
10. La Porta, R., Lopez de Silanes F., Shleifer, A., and Vishny, R., 2000. Investor protection and corporate governance. Harvard University, working paper.
11. Lerner, J., 1999. Venture capital and private equity. A casebook. John Wiley and sons, Inc.
12. Megginson, W., and Weiss, K., 1991. Venture capital certification in initial public offerings. Journal of Finance, 46, 879-893.

Corporate Ownership & Control / Volume 4, Issue 2, Winter 2006-2007 (continued)
192
CIRCUMSTANCES RELATING TO INTERLOCKING
DIRECTORATES IN ITALY: AN EXPLORATORY STUDY
Garen Markarian*, Antonio Parbonetti**, Gary John Previts***
Abstract
Despite a large body of research in the management, accounting, economics, and finance literatures, the relationship between board composition and firm performance is still controversial and ripe for debate (for a recent study, see Boone et al., 2004). Utilizing the theoretical approach of Zahra and Pearce (1989) that identifies the three key roles of the board as oversight, strategy, and service, we examine the effects of having board interlocks between an industrial firm and of financial services firm, and firm characteristics. Using publicly available data on all listed Italian firms for the year 2001, we find that for industrial firms, there is a positive relationship between the number of board interlocks with a bank and current year return on assets, however, the opposite is true for financial services firms. Finally, we find no relationship between interlocking directorates with banks and firm capital structure. Keywords: board of directors, corporate governance, Italy
*Bocconi University. On leave from Concordia University, Montreal, Canada
**University of Padova. Corresponding Author. Please address all communication to Antonio Parbonetti, Dipartimento di Scienze Economiche, via Del Santo 33, 35121 Padova, Italia. ***Weatherhead School of Management, Case Western Reserve University
1. Introduction Optimal board composition has been a matter of debate for the past thirty years. Despite a large body of research in the management, accounting, economics, and finance literatures, the relationship between board composition and firm performance is still controversial and ripe for debate (for a recent study, see Boone et al., 2004). Since corporate governance is central to the efficient functioning of capital markets, the need to understand the structure and composition of the board of directors creates a fruitful avenue for research. According to agency theory (Jensen and Meckling, 1976; Fama and Jensen, 1983) the board performs two main functions: oversight and setting CEO pay. Other theories such as stewardship theory (Davis et al., 1997; Muth and Donaldson, 1998) emphasize the strategic function of boards, and resource dependence theory (Pfeffer, 1972; Pfeffer and Salancik, 1978) views boards as boundary spanners. To this date, none of those theoretical perspectives has received definitive empirical validation. The relationship between board characteristics and firm performance remains a controversial topic in financial markets, regulatory bodies, and academic
research: Studies have found either no results or contradictory findings when examining the relationship between board composition and firm performance (Baysinger and Butler, 1985; Bhagat and Black, 2002; Chaganti et al., 1985; Daily and Dalton, 1992, 1993, 1994; Dalton et al., 1998; Ezzamel and Watson, 1993; Kesner et al., 1986; Pearce and Zahra, 1992; Peng, 2004; Rosenstein and Wyatt, 1990; Schellenger et al., 1989). Hence, at least in academic circles, the superiority of any theoretical approach as well as its empirical validity is unclear (Raheja, 2004; Boone et al., 2004; Linck et al., 2005).
Utilizing the theoretical approach of Zahra and Pearce (1989) that identifies the three key roles of the board as oversight, strategy, and service, we examine the relationship between interlocking directorates (when board of director members of one firm are also board members on another firm) and firm performance. Our study is motivated partly by the desire to contribute to the governance-performance debate and partly to understand how corporate governance facilitates relationships between banks and industrial firms. We specifically examine the effects of having board interlocks between an industrial firm and a bank (financial services firm), and we hypothesize the following:

Corporate Ownership & Control / Volume 4, Issue 2, Winter 2006-2007 (continued)
193
Industrial firms having board interlocks with banks have higher levels of debt financing due to the resource-picking effect provided by interlocking with a bank. Additionally, we also hypothesize that interlocks between industrial firms and financial institutions provide synergistic benefits for both entities: Firms are able to obtain cheaper financing, improving their financial position, and banks are better able to monitor firms and reduce information asymmetries. Therefore, we expect interlocks between banks and industrial firms to have a positive performance effect for both entities. Using publicly available data on more than 200 Italian firms, we use a multivariate OLS regression model to test these relationships. Results indicate that for industrial firms, there is a positive relationship between the number of board interlocks with a bank and current year return on assets, indicating that both the monitoring effect of banks and a facilitated access to capital have a positive effect on firm performance. However, for banks, there is a marginally negative relationship between the number of board interlocks with an industrial firm and return on equity. This surprising result indicates that industrial firms use their connections to banks to extract rents to the detriment of the financial institutions. Finally, we find no relationship between the number of interlocks between industrial firms and banks and industrial firms’ capital structure.
This paper contributes to the existing debate regarding corporate governance and firm performance. We find that board interlocks have differential effects on performance predicated upon the specific nature of the interlocking relationship. This study also adds to the literature examining relationships between industrial firms and financial institutions in general, and specifically, board interlock as a means to such relationships. Finally, we also provide an analysis of the role of banks in the underdeveloped Italian capital markets for which we collect data on all publicly available firms in CONSOB (the Italian SEC). This paper is organized as follows: Section 2 discusses the theoretical framework and presents the hypotheses; Section 3 discusses the specific institutional background of Italy. Section 4 discusses the sample selection and variables used, and Section 5 presents the results followed by the discussion and conclusion.
2. Theoretical Framework 2.1. The Board of Directors: Roles and Composition Modern governance theories have three primary assumptions regarding the board of directors. First, each director within the board has an individual function of providing skills, knowledge, expertise, and connections to the external environment.
Second, the board of directors performs different tasks simultaneously. Third, the board of directors performs tasks according to the strategic alternatives facing the company (Rindova, 1999). Consequently, there is a large variability as to what each individual member can contribute to the firm (Sullivan, 1990). This board diversity combined with what the executive team contributes in terms of decision-making abilities produces a “mosaic” of management approaches to strategic choices (Markarian and Parbonetti, 2005).
In order to further understand the board of director and its composition as well as its effect on firm decision making, we have to re-examine the underlying theories regarding board functions. Extant systems have adopted the agency theory influence view that boards have a binary composition of being independent or entrenched because most policy research has looked at boards in terms size, power structure, and independence. Such a view of the firm is useful if we are analyzing the board in terms of its monitoring activity, but since the board concurrently performs control, strategic, and service functions (Zahra and Pearce, 1989), modern views of governance need to examine boards in an organic, rather than a binary, perspective. In this study, we examine the relationship between board composition and firm characteristics, such as performance and capital structure, from the perspective that each board member brings different capabilities to the firm. While previous research has examined the relationship between board structure and firm characteristics, we argue that each director within the board contributes to the firm in terms of the specific capabilities and resources that he or she can contribute. Therefore, the firm’s performance and strategic choices with respect to the firm’s internal and external environments are affected by the contribution of each board member (see Branson, 2003; Gillan et al., 2003; Hillman et al., 2000; Lehn et al., 2004; Zahra and Pearce, 1989).
In the theoretical development advanced by Zahra and Pearce (1989), which assimilates the agency, resource-based, and legalistic perspectives of corporate governance, the structure and composition of the board of directors represent a function of the firm’s external (industry, competitive environment, legal) and internal (life cycle, CEO style, size, resources) contingencies whereby boards perform three basic functions: service, strategy, and oversight (control). Strategic decision making has been identified as a primary role of board members (Bavly, 1985; Estes, 1980; Kreiken, 1985; Harrison, 1987; Rosenstein, l987; Schmidt and Bauer, 2006; Tashakori and Boulton, 1985; Waldo, 1985; Zahra and Pearce, 1989). The oversight function relates to monitoring managers and protecting shareholders (Carpenter, 1988; Chapin, 1986; Ewing, 1979; Linck et al., 2005; Louden, 1982; Mattar and Ball, 1985;

Corporate Ownership & Control / Volume 4, Issue 2, Winter 2006-2007 (continued)
194
Mueller, 1979; Vance, 1983; Zahra and Pearce, 1989). Finally, the service role relates to strengthening the ties with the external environment, enhancing strategic bonds with key entities (Carpenter, 1988; Leibowitz, 1978; Louden, 1982; Swaminathan and Moorman, 2003; Zahra and Pearce, 1989; Vance, 1983). Based on the three roles performed by board members, the next sections examine the role played by directors who are board members of a firm and a bank at the same time: the service and oversight functions of board members in monitoring of lending relationships (Booth and Deli, 1999). 2.2. Bank-Firm Relationships and the Strategic/Service Function As discussed in Section 2.1, board functions are affected by the contributions of individual board members. Therefore, the skills, expertise, and resources contributed by each board member affect the firm’s strategic decision making. One such characteristic is whether a board member in an industrial firm is also a board member in a firm in the banking industry. A board member from the banking industry would provide different resources to the firm as compared to those of a politician, a scientist, or an executive from a competing firm. For example, if the host firm is a relatively small technologically intensive firm, board members who are university scientists can provide resources regarding the latest advances in the technology domain; board members who are politicians can provide the necessary connections to reduce the cost of business in the firm’s geographic location. Finally, a board member from the banking industry provides resources regarding the firm’s capital structure and could provide cheaper access to financing.
Academic and anecdotal evidence suggests the strategic and service functions are among the most important roles of board members (see Johnson et al., 1996; Jennings and Lumpkin, 1992).
It is well recognized that outside directors play an important advisory role (Baysinger and Hoskisson, 1990; Fama and Jensen, 1983; Rosenstein and Wyatt, 1990; Hillman et al., 2000; Hillman, 2003; Rindova, 1999; Terry, 1992; Vance, 1978). The service function involves environmental scanning to provide the necessary information regarding the external environment (Smircich and Stubbart, 1985) and helps firms assess characteristics of strategic issues (Jackson and Dutton, 1988). The service role enhances company reputation and facilitates important strategic connections, reducing the costs of doing business. As for the strategic function, Andrews (1980) argues that board members participate in the strategic decision-making process because they possess the necessary requisite
judgment and because it improves their oversight function. The strategic management literature has identified two processes for acquiring competitive advantages: resource picking and capability building (Makadok, 2001). The resource-picking process enhances a firm’s ability to obtain resources and information from the environment. A competitive advantage will exist if the resource is obtained at a price lower than that available in an independent arm’s-length transaction. One way to enhance resource picking is to have interlocking directorates (Burt, 1983; Pennings, 1980), providing valuable links and sources of expertise in building a competitive advantage.
Interlocking directorates is one means of establishing closer ties between a bank and a firm (Byrd and Mizruchi, 2005; Booth and Deli, 1999; Dooley, 1969; Fligstein and Brantley, 1992; Kroszner and Strahan, 2001; Pfeffer, 1972; Stearns and Mizruchi, 1993). When it comes to bank-firm relationships, the presence of bank representatives on the board of directors enhances the resource-picking process. Pfeffer (1972) and Pfeffer and Salancik (1978) argue that boards of directors act as boundary spanners. Boards of directors are vehicles through which firms absorb important external resources (Pfeffer, 1972). Kesner (1988: 68) argues that “outsiders often help an organization secure scarce resources through external associations.” Pfeffer (1972) finds a positive correlation between the proportion of directors that represents financial institutions and leverage and interprets such a relation to be coherent with the idea that banks would provide capital when they have representation on the board of directors. A different interpretation of Pfeffer’s (1972) finding is that the connections between banks and firms can reduce the cost of borrowing thanks to a better information flow between the banks and the firms (James, 1987). As reported by Mace (1971: 132), bankers believe that board membership formalizes the relationship between their banks and industrial companies. Booth and Deli (1999) provide empirical evidence that support the notion that outside directors from the banking industry provide debt market expertise, while Hoshi et al. (1991) document the potential benefits that arise form the connections between banks and firms. They analyze Japanese firms that are members of keiretsus and compare them with Japanese firms that are not. They find that keiretsu firms have higher debt levels than nonkeiretsu firms and that investment is less sensitive to liquidity in keiretsu firms than for independent firms. These findings suggest that firms that are inherently bound in business relationships with banking entities have an easier access to capital and that a larger part of their financing is done through their close ties with debt providers. In this study, we examine the expertise related to debt markets and its effect on

Corporate Ownership & Control / Volume 4, Issue 2, Winter 2006-2007 (continued)
195
firm capital structure by investigating the potential benefits of interlocking directorships in providing debt market expertise. This strategic/service role consists of (1) the provision of necessary connections as well as information and the ability to access capital through connection with the banking industry and (2) the ability to evaluate alternative debt contracts and pricing arrangement. If board members belonging to the banking sector sit on industrial firms’ boards and provide the firms with the necessary financial resources, then we expect the following:
H1: The number of interlocking directorates that a
firm has with banks positively affects the amount of
debt financing.
2.3. Bank-Firm Relationships and the Monitoring Function In Section 2.2, we argued that the presence of interlocking directorates with banks affects the firm’s capital structure and financing decisions. In this section, we examine whether such a relationship affects the performance of both the firm and the lending institution. As advanced by agency theory and assumed in current governance trends, boards that have a majority of independent directors adequately monitor top management (Dedman, 2002; Hopt and Leyens, 2004; Johnson et al., 1996; Klein, 2002). Board independence has been associated with a reduced likelihood of financial misstatement (Dechow et al., 1996), a more comprehensive audit (Carcello et al., 2002), and lower levels of earnings management (Klein, 2002). In general, independent directors preserve shareholder interests by using their expertise to enhance the comprehension, creativity, and soundness of a firm’s decisions (Ginsberg, 1994; Rindova 1999). These relationships pertain to board independence per se; however, they do not address the type of board members occupying seats on the board.
In a bank-firm relationship setting, Rosenstein and Wyatt (1990) find results that are consistent with the notion that outside directors contribute in a monitoring function. They examine the market response to the appointment of a board member with a financial background and find that there is a positive abnormal return associated with such an appointment, indicating that the market perceives that such appointments are in shareholder interests. Pfeffer (1972) finds that the connections between banks and firms can reduce the cost of borrowing thanks to a better information flow between the banks and the firms (James, 1987). Hoski et al. (1991) suggest that the close ties occurring within the keiretsu benefit the firms because banks have the incentive to monitor the firms, thus reducing information problems (Myers and Majluf, 1984) and
incentive problems (Myers, 1977). Hoski et al. (1991) also find that close bank ties reduce the cost of financial distress, and Gilson et al. (1990) find that financially distressed firms with higher leverage are more likely to reorganize outside of bankruptcy courts. These findings combined suggest that closer ties to banks provide easier and cheaper access to capital, increase monitoring, and reduce the likelihood of distress, thereby positively affecting the firm’s performance.
An interlocking directorate facilitates the relationships between a bank and a firm when representatives from the banking industry are independent members of the board of directors of industrial firms, have access to inside information, and simultaneously provide executives the necessary resources to access capital. Additionally, interlocking directorates may also have indirect consequences because they may serve as a certification form signalling the creditworthiness of the firm, thus helping firms secure cheap capital from other banks or investors (Fama, 1985; Kracaw and Zenner, 1998). In sum, so long as firms need capital for growth and survival, there is a positive expectation from having lenders on the board of directors (Booth and Deli, 1999), which leads to our second hypothesis:
H2: The number of interlocking directorates with
banks positively affects firms’ performance.
Sharing one (or more) directors with a firm permits the financial institution to access proprietary information. Links between firms and lending institutions could reduce contracting costs as do the links within a keiretsu (Booth and Deli, 1999). Interlocking directorates that occur between firms and banks permit firms to economize on the cost of monitoring as a result of greater access to information (Kroszner and Strahan, 2001; Williamson, 1988). This easy flow of information improves a bank’s evaluation of the creditworthiness of the firm, facilitating the lending process (Kracaw and Zenner, 1998; Kroszner and Strahan, 2001). As a consequence, we argue that close ties between banks and firms provide benefits not only to the firm but also to the bank, leading to our third hypothesis: H3: The number of interlocking directorates with
firms positively affects banks’ performance.
3. Institutional Background: Corporate Governance in Italy
The Italian system of corporate governance is characterized by an underdeveloped capital market and weak legal protection of small shareholders (La Porta et. al., 1999). Companies, even though public, typically belong to a pyramidal group structure where the “top” group generally controls a number

Corporate Ownership & Control / Volume 4, Issue 2, Winter 2006-2007 (continued)
196
of subsidiaries (Brioschi et. al., 1990). Such hierarchical groups control over 56 percent of firms in the manufacturing industry in excess of 200 employees (Bianco et al., 1996). In general, such ownership structures offer ample opportunities for expropriating small shareholders (Bebchuk et al., 1999) when there is a marked separation of control rights from cash flow rights by means of a pyramidal group and cross-ownership ties. Furthermore, Zingales (1994) documents that the benefits associated with control are larger in Italy than elsewhere. Another well recognized characteristic of the Italian corporate governance system is a strong ownership concentration; Brunello et al. (2003: 1029) document that “in more than half of listed firms one shareholder owns the absolute majority of common shares.” During the 1990–2000 period, the average share ownership of the largest shareholder remained almost unchanged at slightly less than 50 percent (CONSOB, 2001) and of the second largest shareholder at between 8 to 10 percent (La Porta et al., 1999; Brunello et al., 2003).
These characteristics make the Italian corporate governance system more similar to the German and Japanese system than to the U.K./U.S. (so called Anglo-Saxon) governance model (Shleifer and Vishny, 1997). Italy differs from the German and Japanese systems, however, because banks’ monitoring activities seem to be ineffective. Brunello et al. (2003) raise concern about the ability of banks to monitor insiders. Thus, coupled with a weak external market for corporate control, there seems to be inadequate monitoring of insiders on behalf of minority shareholders. The Italian financial system relies on multiple loans from the same lending institution, but unlike German banks, Italian banks are legally prohibited from voting the shares that are in their custody (Franks and Mayer, 1998). Thus, Italian banks are at a relative disadvantage when it comes to monitoring firms.
In sum, because of weak legal shareholder protection and ownership concentrated at the top of a pyramidal ownership structure, the Italian capital markets provide for a fruitful setting to examine relationships between banks and industrial firms through board interlocks. This study of a “locked” capitalism dominated by a few families and shareholders renders interlocking directorates between banks and firms as the only way through which banks exert their oversight role over insiders. 4. Data and Variables Used 4.1. Data Our sample consists of all companies listed at the Milan Stock Exchange in the year 2002. We use data available through CONSOB that disclose the composition of the board of directors. We classify
each firm as an industrial firm or a financial services firm based on the SIC classification, and we classify as an interlock each board member concurrently holding board membership in an industrial firm and in a financial firm. As such, each firm might have multiple interlocks depending on the number of ties held by each board member. Financial data are computed using data from the annual report. The final sample consists of 204 industrial firms and 50 financial services firms. 4.2. Variable Used For the purposes of our study, we utilize as our main research variable INTERLOCK, which is a measure of the extent of interlocking relationships between an industrial firm and a financial services firm. Furthermore, in order to examine the relations between interlocking directorates and debt policy and between interlocking directorates and performance, we also calculate the debt ratio (DEBTRATIO) as long-term debt as a percentage of total capital [LTD / (LTD + Equity)] (Byrd and Mizruchi, 2005). Booth and Deli (1999) document that although the association between bankers on the board and bank debt may be strong, the association with nonbank debt may be insignificant. Thus, our measure of aggregate debt maybe be conservatively biased (see Byrd and Mizruchi, 2005). Firm performance is measured using return on asset (ROA), and bank performance is measured using return on equity (ROE). This distinction is due to the difficulties in defining the operating profit of a financial institution. To isolate the relationships between our variables of interest, we also utilize a number of firm-specific variables. First, we control for firm size using the number of employees (EMPLOYEE).1 Second, consistent with previous studies, we control for the firm’s growth opportunities using the market to book value of equity ratio, MBV (see Booth and Deli, 1999; Smith and Watts, 1992). Third, we consider two governance variables that may represent the monitoring of insiders: the incidence of CEO with the chairmanship role (CHCEO) and the size of the board of directors (NBOD) (see Fama and Jensen, 1983; Hermalin and Weisbach, 1988). For a list of variables used in the study, please see Table 1. [See appendices, Table 1].
5. Results 5.1. Descriptives and Univariate Analysis Table 2 provides the descriptive statistics. Upon examining them, we can make the following key
1 Using total assets instead of the number of employees qualitatively doesn’t alter the results
Corporate Ownership & Control / Volume 4, Issue 2, Winter 2006-2007 (continued)
197
observations regarding industrial firms: On average firms have 0.88 links with banks, and the maximum number of interlocks that a firm has with a bank is 11. 39.7 percent of firms with at least one interlock with a bank, and 18 percent of firms with more than a single interlock. Analyzing the 500 largest U.S. manufacturing firms, Byrd and Mizruchi (2005) find that the board of 37 percent of all firms has at least one banker, although Booth and Deli (1999) find that 43 percent of S&P 500 firms have at least one member representing the financial services industry. Hence, in our data, Italian firms appear to have stronger ties to the financial services industry than do U.S. firms. Looking at firms in the financial service industry, we see that on average banks have 4.82 interlocks with industrial firms, and the maximum number of interlocks that a bank has with an industrial firms is 25. 77.1 percent of banks with at least one interlock, while 60 percent of banks have more than one interlock with an industrial entity. Banks on average have boards made up of 15.44 members, while the board of industrials has on average 9.0 members. Similar to our results, Byrd and Mizruchi (2005) and Booth and Deli (1999) document an average board size of 12.0 members. Finally, banks on average are larger than the industrial firms as evidenced by the fact that they have twice as many employees, consistent with the fact that Italy has underdeveloped capital markets that are dominated by financial institutions. [See appendices, Table 2]. Table 3 presents the Pearson correlation coefficients. Panel A, which examines industrial companies, indicates that the number of interlocks that a firm has with banks depends on both the size of the firm and the board but is negatively correlated with CEO duality and positively related to performance. Contrary to expectations, the debt ratio and the number of interlocks are not correlated. As robustness check, we also calculate the correlation coefficient between the debt ratio and a dummy variable that takes the value of 1 in the case a firm has at least one or more interlocks with a bank (0 otherwise). Our results do not change in this alternate specification; hence, for parsimony, we do not report them in this and following tables. If the ties between firms and banks serve in supplying debt-market expertise and monitoring lending relationships, then we expect that the number of interlocks between firms and banks to be positively related to a firm’s use of debt. However, these results are at the univariate level, and tests in the following section will examine these relationships at the multivariate level, taking into consideration firm specific effects. Panel B of Table 3 reports correlation coefficients regarding banks. Its results show that the number of interlocks that a bank has with firms is not correlated with the research and control variables. [See appendices, Table 3].
5.2. Multivariate Analysis
The univariate analysis provides useful insight on the relationship between interlocking directorates and firm debt policy as well as firm performance. However, these univariate tests could be misleading because they fail to account for potential correlations among the independent variables. Therefore, in this section, we utilize an OLS regression model to examine our hypothesized relationships. Table 4 shows results examining our first hypothesis: The number of board interlocks between an industrial firm and a bank positively affects the total debt held by the firm. Results on INTERLOCK are insignificant, indicating that in our sample firms there is no relationship between board interlock with financial services firms and capital structure. The size of the firm is significantly and positively related to leverage because EMPLOYEE is positive (t-value = 2.165), signifying that larger firms have more debt, which is consistent with larger and more stable firms being able to attract debt financing. We see that the size of the board is not related to the firm’s capital structure. In general, larger firms have both larger boards and more debt financing; hence, the inclusion of firm size in our regressions renders the relationship between board size and leverage insignificant. Finally, the coefficient on MBV is positive and significant, indicating that when we control for size, firms with higher growth opportunities are able to secure debt financing. [See appendices, Table 4]. Table 5 presents results examining our second hypothesis regarding the relationship between interlocking directorates and firm performance. We see that INTERLOCK is positively and significantly related to ROA; this result is significant, controlling for the size of the firm, the size of the board of directors, the power of the CEO, and the firm’s growth opportunities. We see from the four control variables that only MBV is significant and that the negative relationship signifies that for firms with larger growth opportunities, profitability is lower, perhaps because such firms hold the promise of future profitability. We see that the adjusted R-squared of 22.6 percent provides the reasonable explanatory power of our regression model. [See appendices, Table 5]. Table 6 reports the results of our third hypothesis. We see that INTERLOCK is negatively related to ROE, indicating that for banks that have a large amount of interlock, there is a negative relationship with respect to profitability. However, this relationship is only marginally significant (p < 0.10). We also see that CHCEO is negatively related to ROE, indicating that for firms whose power is concentrated in the hands of the CEO, inadequate monitoring results in lower profitability. MBV is significantly positive, indicating that for Italian

Corporate Ownership & Control / Volume 4, Issue 2, Winter 2006-2007 (continued)
198
banks with growth prospects, profitability is relatively higher. The R-squared of 13.4 percent again indicates that the regression is of reasonable explanatory power. [See appendices, Table 6]. 6. Discussion and Conclusion
Our empirical tests examine three hypotheses in
which we find that the number of interlocks between an industrial firm and a financial service firm benefits the former to the detriment of the latter. We also find that such directorates are not related to the amount of debt carried by the industrial firm. The following discussion attempts to explain and reconcile our results with those of other studies in the literature that examine relationships between firms and banks. Kaplan and Minton (1994) argue that there are differential relationships between firms and banks depending on the institutional structure of the firm; in their analysis of poorly performing Japanese firms, they find that bankers are added for monitoring purposes, but this is not the case for U.S. firms. Gilson (1990) argues that during financial distress, bankers are added to the board in a monitoring capacity although Booth and Deli (1999) argue that bankers on boards do not monitor debt owned by firms. In sum, the studies just cited have contradictory findings regarding the role of bankers in monitoring firm debt. This could explain our results on H1 and H3: Positions on firm boards do not facilitate the lending process, and information asymmetries do not appear to be reduced. Also, such positions do not seem to be increasing the amount of total debt held by the firm. If anything, these results indicate that close relationships between banks and firms are detrimental to the firm. A similar argument can be found in La Porta et al. (2001) and Laeven (2001), who examine Russian and Mexican banks before their financial collapse and find that poor lending practices involving closely affiliated firms represented one of the factors leading to poor performance. These papers that examine the unique institutional environment of Russia and Mexico are relevant to understand the relationships between Italian firms and lending institutions. A possible explanation of our results is that firms interlock with banks in order to extract rents, not to obtain debt-market expertise. For firms based in a country characterized by weak legal protection of investors and a small capital market, interlocks with banks may represent a way to permit firms to acquire capital.
Taking into consideration the history of the Italian banking system and the governance model could provide some insights to our findings. At the beginning of the 1990s, all major Italian banks were owned by the government. During the privatization wave of the 1990s, all major industrial groups tried to establish close ties with banks in order to have an
easy access to capital. Specifically, having a link to a bank allowed a firm to obtain its capital needs without constraints. Since Italian equity markets are insignificant, establishing ties with banks could represent an important benefit for firms. Since banks possibly decide on their investments by considering the needs of the industrial group instead of their portfolio of strategic opportunities, this could potentially explain banks’ negative performance with respect to interlocking directorates. It is a widely accepted anecdote that pyramidal groups are able to obtain cheap financing from affiliated lending institutions. This is evidenced by the recent scandals at Parmalat and Cirio, which involved Italian banks as co-conspirators. These scandals highlighted the negative effect of the links between banks and firms on the banks. Although bank involvement led to the eventual revival of Parmalat, this action was not without huge financial costs borne by the affiliated lending institutions. Finally, the more recent scandal involving the past governor of the Bank of Italy, Antonio Fazio, highlighted the presence of a little known network of insurance companies and financial institutions. Alternatively, our differential results regarding interlocks on firms and banks could be interpreted as follows: Directors of successful firms are invited to sit on other boards; consequently, a large number of directors of successful industrial firms sit on the boards of poorly performing banks. Another remote possibility is the fact that board members of banks having multiple directorates are busy directors who are not able to monitor the banks properly. Also, contrary to previous empirical studies (Booth and Dely, 1999; Byrd and Mizruchi, 2005; Pfeffer, 1972; Pfeffer and Salancik, 1978), our analysis does not confirm the hypothesis that interlocks between banks and firms serve to supply firms with debt-market expertise and debt financing. These differences with previous studies could be due to the fact that previous studies consider interlocks that occur by means of a bank’s executive (CEO, CFO, etc.), while we consider all possible interlocks, therefore diluting the power of our proxy, which is a limitation of our study. Another limitation of our study is that we analyze only a single year of data because the hand collection and classification of data was a tedious process. To strengthen our tests, we must examine a longer time series of data as a way to validate our current findings.
This is the first study that examines interlocking directorates in Italy in a unique setting of weak capital markets where the relationships between banks and firms are paramount to the survival and growth needs of firms. Our results as a whole have a number of interesting implications, including the fact that strong ties between industrial and financial firms in Italy have positive effects on the firms because of the monitoring effect of bankers and their provision of business expertise. However, this relationship is

Corporate Ownership & Control / Volume 4, Issue 2, Winter 2006-2007 (continued)
199
apparently at the detriment of banks, possibly due to the extraction of cheaper, or riskier, financing. Our findings have important implications to regulators and academics not only in Italy but also to regulators, academics, governance consultants, and politicians interested in understanding the role of banks and corporate governance in underdeveloped capital markets.
References 1. Adams, R.B. and Ferreira, D. (2003) A Theory of
Friendly Boards, Working paper: Stockholm School of Economics.
2. Amit, R.P. and Schoemaker, J.H. (1993) Strategic Asset and Organizational Rent, Strategic
Management Journal, 14: 33–46. 3. Andrews, K. (1980) Responsibility for Corporate
Strategy, Harvard Business Review, 104-108. 4. Barney, J.B. (1986) Strategic Factor Markets:
Expectations, Luck, and Business Strategy, Management Science, 32: 795-801.
5. Bavly, D. (1985) What Is the Board Good For? Long
Range Planning, 19: 20-26. 6. Baysinger, B.D. and Butler, H. (1985) Corporate
Governance and the Board of Directors: Performance Effects of Changes in Board Composition, Journal of
Law, Economics and Organization, 1: 101-124. 7. Baysinger, B.D. and Hoskisson, R.E. (1990) The
Composition of Boards of Directors and Strategic Control: Effects on Corporate Strategy, Academy of
Management Review, 15: 72-87. 8. Baysinger, B.D. and Zardkoohi, A. (1986)
Technology, Residual Claimants and Corporate Control, Journal of Law, Economics, and
Organization, 2: 339-344. 9. Bebchuk. L., Kraakman, R. and Triantis, G. (1999)
Stock Pyramids. Cross-Ownership. and Dual Class Equity: The Creation and agency Costs of Separating Control from Cash Flow Rights. NBER working paper 6951.
10. Becht, M. and Röell, A. (1999) Blockholdings in Europe: An international Comparison, European
Economic Review, 43: 1049-1056. 11. Becker-Blease, J.R., Goldberg, L.G. and Kaen, F.R.
(2004) Mergers and Acquisitions as a Response to the Deregulation of the Electric Power Industry: Value Creation or Value Destruction? Working paper, University of New Hampshire.
12. Bhagat, S. and Black, B. (2002), The Non-Correlation Between Board Independence and Long Term Firm Performance, Journal of Corporation Law, 27.
13. Bianco, M., Gola, C. and Signorini. L.F. (1996) Dealing with Separation between Ownership and Control: State, Family, Coalitions and Pyramidal Groups in Italian Corporate Governance. Fondazione Mattei working paper 5-96.
14. Blau, J.R. and McKinley, W. (1979) Idea, Complexity, and Innovation, Administrative Science
Quarterly, 24: 200-219. 15. Bobker, M.F. (2001) Leveraging Knowledge:
Transferring Energy Services to New Markets, Strategic Planning for Energy and the Environment, 20: 62-77.
16. Boone, A.L., Field, L.C., Karpoff, J.M. and Raheja, C.G. (2004) The Determinants of Corporate Board Size and Composition: An Empirical Analysis, Working paper: Penn State University.
17. Booth, J. R. and Deli, D.N. (1999) On Executives of Financial Institutions as Outside Directors, Journal of
Corporate Finance, 5: 227-250. 18. Boyd, B.K. and Fulk, J. (1996) Executive Scanning
and Perceived Uncertainty: A Multidimensional Model, Journal of Management, 22: 1-21.
19. Branson, D.M. (2001) The Very Uncertain Prospect of “Global” Convergence in Corporate Governance, Cornell International Law Journal, 34: 321.
20. Brioschi, F. et al. (1990) Gruppi di Imprese e Mercato Finanziario, Nuova Italia Scientifica, Rome.
21. Brunello, G., Graziano, C. and Parigi, B.M (2003) CEO Turnover in Insider-Dominated Boards: The Italian Case, Journal of Banking & Finance, 27.
22. Buchholtz, A.K., Amason, A.C. and Rutherford, M. A. (2005) The Impact of Board Monitoring and Involvement on Top Management Team Affective Conflict, Journal of Managerial Issues, 17: 405-422.
23. Burt, R.S. (1983) Corporate Profits and Cooptation, Academic Press: New York.
24. Bushman, R., Chen, Q., Engel, E. and Smith, A. (2004) Financial Accounting Information, Organizational Complexity and Corporate Governance Systems, Journal of Accounting and
Economics, 37: 167-201. 25. Byrd, D.T. and Mizruchi, M.S. (2005) Bankers on the
Board and the Debt Ratio of Firms, Journal of
Corporate Finance, 11: 129-173. 26. Carcello, J.V., Hermanson, D.R., Neal, T.L. and Riley
R.A. (2002) Board Characteristics and Audit Fees, Contemporary Accounting Research, 19: 365-384.
27. Carpenter, R.N. (1988) Cooperative Governance, Part II: Directors Responsabilities, Directors & Boards, 29: 3-6.
28. Chaganti, R.S., Mahajan, V. and Sharma, S. (1985) Corporate Board Size, Composition and Corporate Failures in Retailing Industry, Journal of
Management Studies, 22: 400-417. 29. Chapin, D.H. (1986) Internal Controls and the
“Prudent Man,” Directors & Boards, 10: 25-27. 30. Coles, J., Daniel, N. and Naveen, L. (2005) Boards:
Does One-Size Fit All? Working paper: Arizona State University.
31. CONSOB (2001) Annual Report, Rome. 32. Daft, R.L. and Lengel, R.H. (1986) Organizational
Information Requirement, Media Richness and Structural Design, Management Science, 32: 554-571.
33. Daft, R.L. and Weick, K.E. (1984) Toward a Model of Organizations as Interpretation Systems, Academy
of Management Review, 9: 284-295. 34. Daily, C.M. and Dalton, D.R. (1992) The
Relationship between Governance Structure and Corporate Performance in Entrepreneurial Firms, Journal of Business Venturing, 7: 375-386.
35. Daily C.M. and Dalton, D.R. (1993) Boards of Directors, Leadership, and Structure: Control and Performance Implications, Entrepreneurship Theory
and Practice, 17: 65-81. 36. Daily, C.M. and Dalton, D.R. (1994) Outsider
Directors Revisited: Prescriptions for CEOs and Directors, Journal of Small Business Strategy, 5.

Corporate Ownership & Control / Volume 4, Issue 2, Winter 2006-2007 (continued)
200
37. Dalton, D.R., Daily, C.M., Ellstrand, A.E. and Johnson, J.L. (1998) Meta-Analytic Reviews of Board Composition, Leadership Structure and Financial Performance, Strategic Management Journal, 19.
38. Davis J.H., Schoorman, F.D. and Donaldson, L. (1997) Toward a Stewardship Theory of Management, Academy of Management Review, 22.
39. Dechow, P.M., Sloan, R.G. and Sweeney, A.P. (1996) Causes and Consequences of Earnings Manipulation: An Analysis of Firms Subject to Enforcement Actions by the SEC, Contemporary Accounting Research, 13.
40. Dedman E. B. (2002) The Cadbury Committee Recommendations on Corporate Governance—A Review of Compliance and Performance Impacts, International Journal of Management Review, 4.
41. Dick, A.A. (2003), Nationwide Branching and Its Impact on Market Structure, Quality and Bank Performance, FEDS Working paper 2003-35.
42. Dooley, P.C. (1969) The Interlocking Directorate, The
American Economic Review, 59: 314-323. 43. Elliott, G. (2002) Organizational Complexity: A New
Perspective, Industrial Management, 44: 8-12. 44. Estes, R.M. (1980) Corporate Governance in the
Courts, Harvard Business Review, 51: 107-114. 45. Ezzamel, M.A. and Watson, R. (1993) Organizational
Form, Ownership Structure and Corporate Performance: a Contextual Empirical Analysis of UK Companies, British Journal of Management, 4.
46. Ewing, H.G. (1979) The Corporate Board of Directors—Duties and Responsibilities, Public
Relations Quarterly, 24: 7-9 47. Fama, E.F. (1985) What’s Different about Banks,
Journal of Monetary Economics, 15: 355-387. 48. Fama, E.F. and Jensen, M.C. (1983) Separation of
Ownership and Control, Journal of Law and
Economics, 26: 301-325. 49. Fligstein, N. and Brantley, P. (1992) Bank Control,
Owner Control, or Organizational Dynamics: Who Controls the Large Modern Corporation? The
American Journal of Sociology, 98: 280-307. 50. Franks, J. and Mayer, C. (1998) Bank Control,
Takeovers and Corporate Governance in Germany, Journal of Banking and Finance, 22: 1385-1403.
51. Fredrickson, J.W. (1986) The Strategic Decision Process and Organizational Structure: A Critical Replication, Academy of Management Journal, 23.
52. Gillan, S., Hartzel, J. and Starks, L. (2003) Industries, Investment Opportunities, and Corporate Governance Structures, Working paper: Centre for Corporate Governance University of Delaware.
53. Gilson, S. (1990) Bankruptcy, Boards, Banks, and Blockholders: Evidence on Changes in Corporate Ownership and Control When Firms Default, Journal
of Financial Economics, 27: 241-262. 54. Gilson, S., Kose, J. and Lang, L. (1990) Troubled
Debt Restructurings: An Empirical Study of Private Reorganization of Firms in Default, Journal of
Financial Economics, 27: 315-354. 55. Ginsberg, A. (1994) Minding the Competition: From
Mapping to Mastery, Strategic Management Journal, 15: 153-175.
56. Gulati, R. and Westphal, J. D. (1999) Cooperative or Controlling? The Effects of CEO-Board Relations and the Content of Interlocks on the Formation of Joint Ventures, Administrative Science Quarterly, 44.
57. Hamel, G. and Prahalad, C.K. (1990) The Core Competence of Corporation, Harvard Business
Review, 75: 56-73. 58. Harrison, J.R. (1987) The Strategic Use of Corporate
Board Committees, California Management Review, 30: 109-125.
59. Henderson, A.D. and Fredrickson, J.W. (1996) Information-Processing Demands as a Determinant of CEO Compensation, The Academy of Management
Journal, 39: 575-606. 60. Hermalin, B. and Weisbach, M. 1988. The
Determinants of Board Composition, Rand Journal of
Economics, 19: 589-606. 61. Hermalin, B. and Weisbach, M. (2003) Board of
Directors as an Endogenously Determined Institution: A Survey of the Economic Literature, Economic
Policy Review, 9: 7-28. 62. Hermalin, B. and Weisbach, M. (1998) Endogenously
Chosen Boards of Directors and Their Monitoring of the CEO, American Economic Review, 88: 96-118
63. Hillman, A.J. (2005) Politicians on the Board of Directors: Do Connections Affect the Bottom Line? Journal of Management, 31: 464-481.
64. Hillman A.J., Cannella, A.A. and Paetzold, R.L. (2000) The Resource Dependence Role of Corporate Directors: Strategic Adaptation of Board Composition in Response to Environmental Change, Journal of
Management Studies, 37: 136-152. 65. Hillman, A.J. and Dalziel, T. (2003) Boards of
Directors and Firm Performance: Integrating Agency and Resource Dependence Perspectives, Academy of
Management Review, 28: 383-396. 66. Hillman, A.J., Zardkoohi, A. and Bierman, L. (1999)
Corporate Political Strategies and Firm Performance: Indications of Firm-Specific Benefits from Personal Service in the US Government, Strategic
Management Journal, 20: 67-81. 67. Hopt, K. J. and Leyens, P. C. (2004), Board Models
in Europe. Recent Development of Internal Corporate Governance Structures in Germany, The United Kingdom, France and Italy, European Corporate Governance Institute, Law Working paper 18/2004.
68. Hoshi, T., Kashyap, A. and Scharfstein, D. (1991) Corporate Structure, Liquidity, and Investment: Evidence from Japanese Industrial Groups, Quarterly
Journal of Economics, 106: 33-60. 69. Jackson, S.E. and Dutton, J.E. (1988) Discerning
Threats and Opportunities, Administrative Science
Quarterly, 33: 370-387. 70. James, C. (1987) Some Evidence on the Uniqueness
of Bank Loans, Journal of Financial Economics, 19. 71. Jennings, D.F. and Lumpkin, J.R. (1992) Insights
between Environmental Scanning Activities and Porter’s Generic Strategies: An Empirical Analysis, Journal of Management, 18: 791-803.
72. Jensen, M.C. and Meckling, W.H. (1976) Agency Cost and the Theory of the Firm, Journal of Financial
Economics, 3: 305-360. 73. Johnson, J.L., Daily, C.M. and Ellestrand, A.E.
(1996) Boards of Directors: A Review and Research Agenda, Journal of Management, 22: 409-438.
74. Kaplan, S.N. and Minton, B.A. (1994). Appointments of Outsiders to Japanese Boards: Determinants and Implications for Managers, Journal of Financial
Economics, 36: 225-258.

Corporate Ownership & Control / Volume 4, Issue 2, Winter 2006-2007 (continued)
201
75. Karpoff, J.M., Malatesta, P.H. and Walkling, R.A. (1996) Corporate Governance and Shareholders Initiatives: Empirical Evidence, Journal of Financial
Economics, 42, 365-395. 76. Kesner, I. (1988) Directors' Characteristics and
Committee Membership: An Investigation of Type, Occupation, Tenure, and Gender, Academy of
Management Journal, 31: 66-84. 77. Kesner, I.F., Victor, B. and Lamont, B. (1986) Board
Composition and the Commission of Illegal Acts: An Investigation of Fortune 500 Companies, Academy of
Management Review, 29: 879-899. 78. Khanna. T. and Palepu, K. (2000) Is Group Affiliation
Profitable in Emerging Markets? An Analysis of Diversified Indian Business Groups, Journal of
Finance; 55(2): 867-891. 79. Klein, A. (1998) Firm Performance and Board
Committee Structure, Journal of Law and Economics, 41: 137-165.
80. Klein A. (2002) Audit Committee, Board of Director Characteristics and Earnings Management, Journal of
Accounting and Economics, 33, 375-400. 81. Kogut, B. (2000) The Network as Knowledge:
Generative Rules and the Emergence of Structure, Strategic Management Journal, 21: 405-425.
82. Korn/Ferry International (1996) Board of Directors, 23rd Annual Study: Board Meeting in Session, Korn/Ferry International: New York.
83. Kracaw, W. and Zenner, M. (1998) Bankers in the Boardroom: Good News or Bad News? Working paper: Kenan-Flagler Business School, University of North Carolina.
84. Kreiken, J. (1985) The Board’s Role in Strategic Planning and Resource Allocation, in E.P. Mattor and M. Ball (Eds.), Handbook for Corporate Directors, McGraw-Hill: New York.
85. Kroszner, R.S. and Strahan, P.E. (1998) Bankers on Boards: Monitoring, Financing, and Lender Liability. Working paper: University of Chicago.
86. Kroszner, R.S. and Strahan, P.E. (2001) Throwing Good Money after Bad? Board Connections and Conflicts in Bank Lending, NBER Working Paper 8694.
87. Kurke, L.B. and Aldrich, H.E. (1983) Mintzberg Was Right. A Replication and Extension of the Nature of Managerial Work, Management Science, 29: 975-984.
88. Laeven, L. (2001) Insider Lending and Bank Ownership: The Case of Russia. Working paper: World Bank Group.
89. Lang, M.H. and Lundholm, R.J. (1996) Corporate Disclosure Policy and Analyst Behavior, The
Accounting Review, 71: 467-492. 90. La Porta, R., Lopez-de-Silanes, F. and Zamarripa
(2001) Insider Lending in Mexico, Working paper: Harvard University.
91. La Porta, R., Lopez-de-Silanes, F. and Shleifer, A. (1999) Corporate Ownership around the World, Journal of Finance, 54: 471-517.
92. Lehn, K., Patro, S. and Zhao, M. (2004) Determinants of the Size and Structure of Corporate Boards: 1935-2000, Working paper: University of Pittsburgh.
93. Leibowitz, A. (1978) Does the Corporation Discourage Individual Responsibility, in M.B. Johnson (Ed.), The Attack on Corporate America: The Corporate Issues Sourcebook, McGraw-Hill:
New York. 94. Linck, J.S., Netter, J.M. and Yang, T. (2005) The
Determinants of Board Structure, Working paper, Department of Banking and Finance, University of Georgia.
95. Louden, J.K. (1982) The Director: A Professional Guide to Effective Board Work, Amacom: New York.
96. Lowendahl ,B. and Revang, O. (1998) Challenges to Existing Strategy Theory in a Post-Industrial Society, Strategic Management Journal, 19: 752-773.
97. Mace, M.L. (1971) Directors, Myth and Reality. Harvard Business School Press: Boston.
98. Mahon, J. and Murray, E. (1981) Strategic Planning for Regulated Companies, Strategic Management
Journal, 2: 251-262. 99. Makadok, R. (2001) Toward a Synthesis of the
Resource-Based and Dynamic-Capability of Rent Creation, Strategic Management Journal, 22.
100. Markarian G. and Parbonetti, A. (20050 Firm Complexity and Board of Director Composition, Working paper, University of Padova.
101. Markarian, G., Parbonetti, A. and Previts, G.J. (2005) The Convergence of Disclosure and Governance Practices in the World’s Largest Firms, Working paper, Weatherhead School of Management, Case Western Reserve University.
102. Marsh, S. (1998) Creating Barriers for Foreign Competitors: A Study of the Impact of Anti-Dumping Actions on the Performance of US Firms, Strategic
Management Journal, 19: 25-37. 103. Mattar, E. and Ball, M. (1985) Handbook for
Corporate Directors, McGraw-Hill: New York. 104. Maug, E (1997) Boards of Directors and Capital
Structure: Alternative Forms of Corporate Restructuring, Journal of Corporate Finance, 3.
105. Mayers, D. and Smith, C.W. Jr. (1982) On the Corporate Demand for Insurance, Journal of
Business, 55: 281-296.
106. Mayers, D., Shivdasani, A. and Smith, C.W. Jr. (1997) Board Composition and Corporate Control: Evidence from the Insurance Industry, Journal of
Business, 70: 33-62. 107. Milliken, F. (1987) Three Types of Perceived
Uncertainty about the Environment: State, Effect, and Response Uncertainty, Academy of Management
Review, 12: 133-143. 108. Milliken, F. and Vollrath, D. (1991) Strategic
Decision Making Tasks and Group Effectiveness: Insights from Theory and Research on Small Group Performance, Human Relations, 44: 1229-1253.
109. Moldoveanu, M. and Bauer, R.M. (2004) Organizational Complexity and Organizational Structuration, Institute of Management Sciences, 15.
110. Mueller, R.K. (1979), Board Compass, D.C. Heath: Lexington, MA.
111. Muth, M.M. and Donaldson, L. (1998) Stewardship Theory and Board Structure: A Contingency Approach, Corporate Governance: An International
Review, 6: 5-28. 112. Myers, S. (1977) Determinants of Corporate
Borrowing, Journal of Financial Economics, 5. 113. Myers, S. and Majluf, N. (1984) Corporate Financing
and Investment Decisions When Firms Have Information That Investors Do Not Have, Journal of
Financial Economics, 13: 187-221.

Corporate Ownership & Control / Volume 4, Issue 2, Winter 2006-2007 (continued)
202
114. Nadler, D. and Tushman, M.L. (1992) Designing Organizations That Have Good Fit: A Framework for Understanding New Architectures, in D, Nadler, M.S.Gestrain, and R.B. Shaw (Eds.) Organizational Architecture, Jossey-Bass: San Francisco, CA.
115. Nolle, D.E. (1994) Banking Industry Consolidation: Past Changes and Implications for the Future, Working paper, The Jerome Levy Economics Institute.
116. Oliver, A.L. (2001) Strategic Alliances and the Learning Life-Cycle of Biotechnology Firms, Organization Studies, 22: 467–489.
117. Pearce, J. and Zahra, S. (1992) Board Composition from a Strategic Contingency Perspective, Journal of
Management Studies, 29: 411-438. 118. Peng, M.W. (2004) Outside Directors and Firm
Performance during Institutional Transitions, Strategic Management Journal, 25: 453-471.
119. Pennings, J. (1980) Interlocking Directorates, Jossey- Bass: San Francisco.
120. Pfeffer, J. (1972) Size and Composition of Corporate Boards of Directors: the Organization and Its Environment, Administrative Science Quarterly, 17.
121. Pfeffer J. and Salancik, G. R. (1978) The External Control of Organizations: A Resource Dependence Perspective, Harper & Row: New York.
122. Prevost, A.K., Rao, R.P. and Hossain, M. (2002) Board Composition in New Zealand: An Agency Perspective, Journal of Business Finance &
Accounting, 29: 731-760. 123. Raheja, C. (2004) Determinants of Board Size and
Composition: A theory of Corporate Boards, Journal
of Financial and Quantitative Analysis, 40: 283-306. 124. Rindova, V.P. (1999) What Corporate Boards Have to
do with Strategy: A Cognitive Perspective, Journal of
Management Studies, 36: 953-975. 125. Rosenstein, J. (l987) Why Don’t US Boards Get More
Involved in Strategy? Long Range Planning, 20. 126. Rosenstein, S. and Wyatt, J.G. (1990) Outside
Directors, Board Independence, and Shareholder Wealth, Journal of Financial Economics, 26.
127. Sanyal, P. and Cohen, L.R. (2004) Deregulation, Restructuring and Changing R&D Paradigms in the US Electric Utility Industry, Working paper, Department of Economics, Brandeis University.
128. Schmidt, S.L. and Bauer, M. (2006) Strategic Governance: How to Assess Board Effectiveness in Guiding Strategy Execution, Corporate Governance:
An International Review, 14: 13-22. 129. Schellenger, M.H., Wood, D.D. and Tashakori, A.
(1989) Board of Director Composition, Shareholder Wealth, and Dividend Policy, Journal of
Management, 15: 457-467. 130. Shaffer, B. (1995) Firm-Level Responses to
Government Regulation: Theoretical and Research Approaches, Journal of Management, 21: 495-514.
131. Sharara, N. and Hoke-Witherspoon, A. (1993) The Evolution of the 1992 Shareholder Communication Proxy Rules and Their Impact on Corporate Governance, The Business Lawyer, 49, 327-358.
132. Shleifer, A. and Vishny. R. (1997) A Survey of Corporate Governance, Journal of Finance, 52.
133. Simon, H.A. (1996) The Sciences of the Artificial, MIT Press: Cambridge, MA.
134. Smircich, L. and Stubbart, C. (1985) Strategic Management in an Enacted World, Academy of
Management Review, 10: 724-736. 135. Smith, M.P. (1996) Shareholder Activism by
Institutional Investors: Evidence from CalPERS, Journal of Finance, 51, 227-252.
136. Smith, C.W. and Watts, R.L. (1992) The Investment Opportunity Set and Corporate Financing, Dividend, and Compensation Policies, Journal of
Financial Economics, 32: 263-292. 137. Spencer Stuart (2005) Spencer Stuart US Board Index
2005, Spencer Stuart, accessed at www.spenecerstuart.com//global.
138. Sullivan, J. (1990) Experts, Experts Systems, and Organizations, in M. Masuch (Ed.), Organization, Management and Expert Systems, Walter de Gruyter: New York.
139. Swaminathan, V. and Moorman, C. (2003) Value Creation in Hi-Tech Alliances: the Role of Resource Strength, Resource Fit, and Resource Fit, Working paper, Fuqua School of Business, Duke University.
140. Tashakori, A. and Boulton, W. (1985) A Look at the Board’s Role in Planning, The Journal of Business
Strategy, 3: 64-70. 141. Teece D. J., Pisano, G. and Shuen, A. (1997)
Dynamic Capabilities and Strategic Management, Strategic Management Journal, 18: 509–533.
142. Terry, R. (1992) An Examination of the Role of Boards of Directors in the Enactment of Poison Pill Securities, Doctoral dissertation: University of Utah, Salt Lake City.
143. Thompson, A.A. and Strickland, A.J. (1990) Strategic Management: Concepts and Cases, Irwin: Homewood, IL.
144. Vafeas, N. (1999) Board Meeting Frequency and Firm Performance, Journal of Financial Economics, 53: 113-142.
145. Vance, S.C. (1978) Corporate Governance: Assessing Corporate Performance by Boardroom Attributes, Journal of Business Research, 6: 203-220.
146. Vance, S.C. (1983) Corporate Leadership: Boards, Directors, and Strategy, McGraw-Hill: New York.
147. Zahra, S.A. and Pearce, J.A. (1989) Boards of Directors and Financial Performance: A Review and Integrative Model, Journal of Management, 15.
148. Zingales, L. (1994) The Value of the Voting Right: A Study of the Milan Stock Exchange Experience, Review of Financial Studies, 7: 125-148.
149. Zucker, L. G., Darby, M.R. and Armstrong, J.S. (1999) Intellectual Capital and the Firm: The Technology of Geographically Localized Knowledge Spillovers, NBER Working paper W4946.
150. Waldo, C. N. (1985) Boards of Directors: Their Changing Roles, Structure, and Information Needs, Quorum Books: Westport, CT.
151. Waxman, M. (1998) A Legal Framework for Systemic Bank Restructuring, Working paper, World Bank.
152. Williamson, O.E. (1988) Corporate Finance and Corporate Governance, Journal of Finance, 63.
153. Yasai-Ardekani, M. and Nystrom, P.C. (1996) Designs for Environmental Scanning Systems: Tests of a Contingency Theory, Management Science, 42: 187-204.

Corporate Ownership & Control / Volume 4, Issue 2, Winter 2006-2007 (continued)
203
Appendices
Table 1. Variables
Variable Description
INTERLOCK Number of interlocking directorates between firms and banks
ROE Ratio of earnings over equity
ROA Ratio of operating income over total asset
DEBTRATIORatio of long-term debt over long-term debt plus equity [LTD / (LTD +
Equity)]
EMPLOYEE Number of employees
MBV Ratio of market value over book value of equity
CHCEOTakes a value of 1 if the CEO is the chairman of the board, 0 otherwise
NBOD Number of directors
Table 2. Descriptives Statistics on Select Variables
INTERLOCK: Number of interlocking directorates between firms and banks; CHCEO: Takes a value of 1 if the CEO is not the chairman of the board, 0 otherwise; Debt ratio: Ratio of long-term debt over long-term debt plus equity [LTD / (LTD + Equity)]; MBV: Ratio of market value over book value of equity; NBOD: Number of directors; NE: Number of employees; ROA:
Ratio of operating income over total asset; ROE: Ratio of earnings over equity
Table 3. Pearson Correlation Coefficients
* Correlation is significant at the 0,05 level. **Correlation is significant at the 0,01 level. INTERLOCK: Number of interlocking directorates between firms and banks; ROA: Ratio of operating income over total asset; NE: Number of employees; NBOD: Number of directors; CHCEO: Takes a value of 1 if the CEO is not the chairman of the board, 0 otherwise; MBV:
Ratio of market value over book value of equity; Debt ratio: Ratio of long-term debt over long-term debt plus equity [LTD / (LTD + Equity)]; ROE: Ratio of earnings over equity.
Panel A: Firms
N Mean
Standard
Deviation
INTERLOCK 204 0.88 1.600
CHCEO 193 0.56 0.496
Debt ratio 200 0.60 0.223
First 202 52.02 19.05
MBV 193 1.84 3.104
NBOD 193 9 3.077
NE 194 5052.15 16722.459
ROA 199 0.02 0.094
Panel B: Banks
N Mean
Standard
Deviation
INTERLOCK 50 4.82 5.833
CHCEO 48 0.81 0.394
First 45 40.45 28.504
MBV 35 1.72 1.365
NBOD 48 15.44 4.505
NE 42 10698.83 17466.726ROE 45 0.07 0.083

Corporate Ownership & Control / Volume 4, Issue 2, Winter 2006-2007 (continued)
204
Table 4. OLS Regression Examining the Relationship between Board Interlocks with Banks and the Debt Ratio of Industrial Firms
* Correlation is significant at the 0.1 level.. ** Correlation is significant at the 0.05 level. *** Correlation is significant at the 0.01 level.. INTERLOCK: Number of interlocking directorates between firms and banks; NE:
Number of employees; NBOD: Number of directors; CHCEO: Takes a value of 1 if the CEO is not the chairman of the board, 0 otherwise; MBV: Ratio of market value over book value of equity; ROA: Ratio of operating income over total asset; ROE: Ratio of earnings over equity; Debt ratio: Ratio of long-term debt over long-term debt plus equity [LTD / (LTD + Equity)].
Table 5. OLS Regression Examining the Relationship between Board Interlocks
with Banks and Industrial Firm Performance
* Correlation is significant at the 0.1 level.. ** Correlation is significant at the 0.05 level.. *** Correlation is significant at the 0.01 level.. INTERLOCK: Number of interlocking directorates between firms and banks; NE:
Number of employees; NBOD: Number of directors; CHCEO: Takes a value of 1 if the CEO is not the chairman of the board, 0 otherwise; MBV: Ratio of market value over book value of equity; ROA: Ratio of operating income over total asset; ROE: Ratio of earnings over equity; Debt ratio: Ratio of long-term debt over long-term debt plus equity [LTD / (LTD + Equity)].
Table 6. OLS Regression Examining the Relationship between Board Interlocks
with Industrial Firms and Bank Performance
* Correlation is significant at the 0.1 level. ** Correlation is significant at the 0.05 level. *** Correlation is significant at the 0.01 level. INTERLOCK: Number of interlocking directorates between firms and banks; NE:
Number of employees; NBOD: Number of directors; CHCEO: Takes a value of 1 if the CEO is not the chairman of the board, 0 otherwise; MBV: Ratio of market value over book value of equity; ROA: Ratio of operating income over total asset; ROE:
Ratio of earnings over equity; Debt ratio: Ratio of long-term debt over long-term debt plus equity [LTD / (LTD + Equity)].

Corporate Ownership & Control / Volume 4, Issue 2, Winter 2006-2007 (continued)
205
CORPORATE GOVERNANCE IN INDONESIAN STATE-OWNED
ENTERPRISES: FEEDING WITH WESTERN INGREDIENTS
Frederik G. Worang*, David A. Holloway*
Abstract
Corporate frauds and failures in Indonesian have continued despite the corporate governance principles of Indonesia’s State-Owned Enterprises (SOEs) which have been strengthened following the Asian financial crisis of 1997/1998. This appears to indicate that corporate governance principles primarily adopted from developed Western nations are not adequate to address problems faced by SOEs in Indonesia. This primarily analytical paper evaluates the current corporate governance practices in Indonesian SOEs in light of the prevailing political and corporate culture. Given the complexity of Indonesia’s political and corporate culture the adoption of corporate governance principles from Western nations as promulgated by the OECD and/or the Cadbury report are inadequate to reduce corporate mismanagement and failure among SOEs. The study also utilizes some qualitative interview data from thirty respondents at managerial level within three SOEs to aid the assessment of corporate governance practices and principles in the Indonesian context.
Keywords: corporate governance principles, shareholders, Indonesia *Murdoch Business School, Murdoch University,South Street, Murdoch WA 6150, Western Australia, [email protected], [email protected]
Introduction There has been a history of corporate governance failures in Indonesian State Owned Enterprises (SOEs) both before and after the Asian crisis as has also occurred in other nation-states. There have been many instances of management problems as well as corporate failures that can be traced back to ineffective or poor corporate governance practices. At the beginning of 1990’s theses included the cases of Bank Bali; Indover Bank; BULOG (The National Logistics Body); PERTAMINA (state oil company); Bank Negara Indonesia—one of the listed state banks in the late 2003 which lost Rp.1.7 trillion (A$ 283.3 million); and, management remuneration packages in PLN (State power company) (Goodpaster, 2002, p. 12-13; Cahyono, 2003, 7; Polce, 2005; Zainal, 2005; Oliver, 2005).1 Indications of corporate governance malpractice amongst Indonesian SOEs include the alleged misuse
1 All theses cases have been prosecuted in the courts. However,
this paper will not be analyzing these individual cases because the focus in instead on Indonesian SOEs.
of power by government regulators through their representatives within SOEs. These nominees serve as directors and commissioners on the SOE governing bodies. Similar abuses of power and privilege are promulgated by Indonesia’s diversified power elite: those social categories that are powerful politically, economically, militarily, or traditionally within Indonesian society (Patrick, 2001, p. 5).
This paper focuses on the actual behaviour of Indonesian SOEs shareholders—which in this instance is government of Indonesia—and its stakeholders who include board directors/commissio- ners; senior managers; employees; and, related parties such as parliament members and other parties who have the power to influence policy making process. The study examines the interaction and practices of these parties in implementing corporate governance systems within SOEs. Issues such as the board’s role in making strategic decisions; its role in supervising corporate finances; and, in supervising daily management tasks will be analyzed in line with the board’s behaviour (Holloway, 2004).
Herwidayatmo argued that one of the main factors that exacerbated and prolonged the East Asian financial crisis was the inadequate

Corporate Ownership & Control / Volume 4, Issue 2, Winter 2006-2007 (continued)
206
implementation and practice of ‘good’ corporate governance (2002, p. 6). Indonesia, in which the research for this paper took place, was impacted the hardest when compared with other countries in the region (Herwidayatmo, 2002). Shiroyama posited that ‘bad’ corporate governance, which is colloquially known within Indonesia as KKN (corruption, collusion, and nepotism) is a primary cause of the ongoing Indonesian economic crisis (2003, p. 28). Tabalujan also argued that ‘weak’ corporate governance practices are a major factor in the prolonged financial crisis in Indonesia (2002, p. 2). The cost of this economic and financial crisis to Indonesia has been extensive. The Indonesian currency—the rupiah—has been depreciated approximately 575%, and wealthy local business people have transferred large tranches of funds out of Indonesia in a quest for safer places for investment.
This paper is organised as follows. The first part provides a brief background and justification for the study of these SOEs. The second part locates the paper within the broader—Western and European based—literature on corporate governance and its many contested definitions. It then proceeds to analyse and critique the main elements of the Western-developed corporate governance model which is being advocated as the preferred ‘global convergence’ model (Solomon and Solomon, 2004). The development of corporate culture within Indonesian SOEs is also analysed within the larger context of Indonesian political and historical developments. It concludes with an assessment of the current state of corporate governance practices within the latest political and business developments. The latter half of the paper also incorporates insights from the qualitative interview data from ten of thirty Indonesian respondents—obtained in 2005—within SOEs and other Indonesian institutions. In addition to these interviews, this study utilizes current news releases published in mass media to update and confirm the information supplied by participants in these interviews. Background The existence of ‘good corporate governance’ (GCG) is important for two main reasons. At a corporate level it is importance to ensure business entities are managed in such a way that “…business behaves honestly, equitably, and transparently towards all their stakeholders” (Patrick, 2001, p. 22). At the nation-state level, the existence of GCG will ensure a continued confidence in the interaction among economic agents within the business domain. This degree of confidence is paramount for a country such as Indonesia in its quest for achieving sustained improvements in economic wellbeing and the future prosperity of its citizens. Any sustained loss of confidence, among economic agents within a system
that is supposed to guarantee GCG, will negatively impact the entire economy as evidenced by what happened during the Indonesian economic and financial crisis in 1997/98.
One unique characteristic of Indonesia corporate structure to date which differentiates if from other nation-states—especially the ‘developed’ Western countries—is the existence of many large and small corporations owned and/or controlled by the State. These State Owned Enterprises (SOEs) have existed side by side with other public corporations—in private shareholders hands—for the past half century. There are about 158 SOEs with total assets of US$150 billion (Ministry of State Owned Enterprises, 2005). Following the financial crisis in 1997/1998 SOEs were and are expected to increase their contribution to the national income and budget outcomes. For example the target for 2005 budget is US$1,100 million and will be doubled in 20062(Asian Development Bank, 2005, p. 1-2; Supriyanto, 2005).
These SOEs can be broadly categorized into two main types. The first is those SOEs which have been publicly listed on Jakarta Stock Exchange including PTTelkom (Indonesian telecommunication company); PT Bank BNI (State bank); and, PT Timah (Mining company). This has occurred as part of a privatization ‘push’ by the Indonesian government. The shareholders within these privatized corporations are other companies, institutional investors as well as the general public. The second category consists of SOEs which are still fully owned by the State such as PT PLN (State power company); PT Pertamina (State oil company); and PT Garuda Indonesia (National airline company). Whilst SOEs belonging to the first category are now subject to the rules, regulations and corporate governance practices of publicly listed companies, the second category of SOEs are subject to different set of rules, regulation and governance. A special government ministry, the Ministry of State-Owned Enterprises exists to regulate, govern and monitor the management and business activities of SOEs which fall within this latter category.
In essence, SOEs were and are established in order to provide an economic boost to the nation and provides specific goods and services not supplied by the private sector and to: contribute to the development of national economic, especially to the national revenue; be a profit oriented; perform its public functions of fulfilling the needs of the masses in the form of the provision of high quality goods and services; be a pioneer in business ventures where the presence of private sector and cooperation is yet to be realized; and actively provide guidance and assistance to small
2 1 US$ equal Indonesian Rupiah (IDR) 10,000

Corporate Ownership & Control / Volume 4, Issue 2, Winter 2006-2007 (continued)
207
and weak enterprises, cooperation, and people (Kementerian Badan Usaha Milik Negara, Undang-Undang (or Parliamentary law) number 19, 2003).3
However, as the result of weak corporate governance practices in SOEs, there is a growing perception that most SOEs have become personal ‘gold mines’ for corrupt individuals. Consequently, the operation and management of SOEs has become the centre of public attention. SOEs are being publicly scrutinized because of the belief that KKN is entrenched in this sector. There exists a public perception that GCG practices may provide a useful development to help eliminate KKN because this foregrounds the critical elements of transparency and accountability. If these elements of transparency and accountability are present in the operation and management of an enterprise the risk of KKN practices is reduced.
This paper poses the following question: What are the main problems faced in efforts to adopt the internationally-developed GCG characteristics and system for Indonesian SOEs? It is clear from the earlier analysis that SOEs are vital to the Indonesian economy.
There is a ‘wealth’ of literature on issues associated with the corporate governance of publicly listed companies but there is, however, a gap in the literature on corporate governance issues and practices specifically associated with SOEs in Indonesia and other nation-state domains. This paper will help to redress that imbalance and provides insights into the specific issues and difficulties facing the Indonesian regulators and corporate governance reformers.
International Corporate Governance Definitions and Developments and the Indonesian Context The objective of corporate governance according to Patrick (2002) is that “business4 behaves honestly, equitably, and transparently toward all their stakeholders”. An earlier distinction by Berle and Means in the early 1930s (cited in Sato, 2003, p. 89) posited that corporate governance is about the separation between the shareholders and those who run the business—the notion of the emergence of a professional management class in organizations. This raises a critical issue of how to ‘control’ management behaviour and the associated problem of the alignment of owners’ versus senior managers’ expectations of firm performance.
3 The purpose and goals of the establishment of SOEs has been changed. In the first place the establishment of certain SOEs were as: a) pilot project, b) price stabilizer, c) the role of a strategic industry, and d.) agent of economic development. 4 The term business in this case is defined as directors, commissioners, owner/government and other stakeholders.
More recently the Organisation for Economic Co-operation and Development (OECD, 1999) has developed a set of corporate governance principles that can be adopted by the OECD member and non-member countries which would help to ameliorate this particular problem if implemented effectively.5 There are, however, many different definitions of corporate governance that have been developed internationally through a series of reports and recommendations following a series of high profile corporate failures and scandals throughout the 1980s and 1990s. For example the Cadbury Committee defined corporate governance as the system by which companies are directed and controlled (Baxt, Ramsay & Stapledon, 2002, p. 160). A definition developed by Claessens (2003) divides corporate governance into two categories. First, governance is linked with the actual behaviour within corporations such as management efficiency and the treatment of shareholders and stakeholders. Second it is seen within a normative framework consisting of the rules, legal and the judicial system. According to Claessens, the first category is more appropriate for studies of single firms in one country such as would be the case in this paper on State-Owned Enterprises (SOEs) in Indonesia.6 Prentice (1993) on the other hand defined corporate governance as being concerned with the relationship between the stakeholders and the board of directors.7 Given the aim of this paper the corporate governance definition given by Prentice which is concerned with the relationships between the stakeholders in a company and the board of directors/commissioners is deemed to be the most appropriate for this study. Corporate Governance and the Indonesian Context The significant numbers of recent corporate failures has meant that corporate governance issues have received more attention by the regulators not only in developed countries but also in countries such as Indonesia. One way of recovering from a lengthy financial crisis as happened in Indonesia from 1997 onwards is to bring capital investment into the country (Shiroyama,2003). Utilising the International Monetary Fund’s economic reform package recommendations, direct
5 The principles include for example: the rights of shareholders;
the equitable treatment of shareholders; the role of stakeholders; disclosure and transparency; and, the responsibilities of the board of directors (OECD, 1999, p. 13). 6 The second category of definitions is more logical for
comparative studies (Claessens, 2003, p. 4). 7 Indonesia adopts two tier system or two-boards system
(European Continental System) for the limited liability companies which are Board of Commissioners (BOC) and Board of Directors (BOD) (Kurniawan and Indirantonoro 2000; Husnan 2001).
Corporate Ownership & Control / Volume 4, Issue 2, Winter 2006-2007 (continued)
208
foreign investment can be achieved through the privatization of SOEs and the overseas purchases of listed Indonesian companies’ shares.
These types of financing activities can facilitate Indonesia’s economic growth and assist Indonesia out of its ongoing financial crisis. However, this can not be realized unless investors’ confidence—both oversea and domestic—is strong, hence these foreign institutional and personal investors demand good corporate governance regimes and practices (Patrick, 2001, p. 7).
Consistent with the International Monetary Fund’s requirements, SOE shareholders and senior management are pinning their organizational future hope and faith that GCG within the SOEs can and will be established.
Without the implementation of effective and internationally acceptable corporate governance practices, ongoing privatization will not be viable for the remaining Indonesian SOEs. If such privatization initiatives or other forms of foreign investments can not be achieved then the Indonesian recovery from economic and financial will be further retarded.
The National Committee on Corporate Governance (NCCG) has issued what is called “code of corporate governance practices for Indonesian entities” to enhance the effective implementation of GCG. The plan is that this code will help improve the attractiveness of the investment climate in Indonesia (National Committee on Corporate Governance, 2000, p. i).
The NCCG, a non-governmental body, was established in 1999 by the Coordinating Minister for Economy, Finance and Industry (NCCG, 2000). The committee has received ongoing funding from the Asian Development Bank and assistance from World Bank experts in helping to develop and promulgate the ‘Code for Good Corporate Governance’. This code for good corporate governance is intended for use by corporate business executives as a direction and guide for the future conduct of business in Indonesia (Herwidayatmo, 2002, p. 7; Rosser, 2004, p. 133).
The code is very similar to the ‘best-practice’ codes of corporate governance that have been applied by several developed countries. It is also similar to the British, OECD and American corporate governance approaches including the USA Sarbannes Oxley Act Corporate Governance principles and recommendations (Bank BNI, 2003, 3; Sato, 2003, p. 88).
The code is, therefore, closely based on the international developments towards a ‘global convergence’ model of corporate governance. The result is a ‘one size fits all’ approach.
Contradiction within Western Corporate Governance Models in the Indonesian Context: One Size Does Not Fit All Some of the principles and practices that are highlighted in the Indonesian code are equitable treatment of shareholders; the appointment of independent directors and commissioners; timely and accurate disclosure; the appointment of a corporate secretary; and, the establishment of an independent audit committee (Rosser, 2004, p. 133). This section evaluates three of the above practices, namely, the appointment of independent commissioners; establishment of an independent audit committee; and, timely and accurate disclosure. Independence of Commissioners The Indonesian government and the Indonesia Capital Market Supervisory Agent (Badan Pengawas Pasar Modal/BAPEPAM) has responded positively to the development of corporate governance practices and regimes in Western nations. Indonesian company Law no. 1 (1995) resulted in Indonesia adopting a two-tier system (cited in Tumbuan, 2005, p. 1). Companies must have both a Board of Directors/Board of Management charged with the management of the company and a Board of Commissioners or Supervisory Board who ‘supervise’ the way the board of directors manage the company (Tumbuan, 2005, p. 2).8 From the above statement it is clear that the board of commissioners has to perform and act independently. For example the Bank BNI website—which is consistent with law number 13, year 2003 chapter 28 verse 2—states that “…commissioners must be independent” (Bank BNI, 2003, 6; Kementerian Badan Usaha Milik Negara, 2003a, p. 15). This provision is confirmed by Benny, one of the interview participants, who as one of the commissioners stated during the interview that: “…commissioners basically must be independent” (personal communication, 2005). Unlike a two-tier corporate governance regime, a one tier system—which is the popular model in most Western countries—requires the appointment of independent director(s) on the board of directors. Their role then becomes the equivalent of the independent commissioners in a two-tier system. This function of ‘independence’ is a key element of the corporate governance reforms recommended by the Cadbury committee and the OECD (Holloway and van Rhyn, 2003, p. 2; OECD, 2004). Independent director(s) on boards—in regimes where these constitute the only governing body—is a necessity because a one tier system does not have an
8 The task of management board is to manage the company under
the supervision and the direction of the board of commissioners.

Corporate Ownership & Control / Volume 4, Issue 2, Winter 2006-2007 (continued)
209
additional governing body that that supervises the board of directors. A two-tier system, as is the case in Indonesia, does have a separate body (in the form of a board of commissioners) that provides and additional layer of supervision over the (behaviour of?) directors. The principles and practices of an ‘outsider’ corporate governance model10 (Solomon and Solomon, 2004) which requires the inclusion of independent directors on boards (or board of commissioners in a two-tier system) is redundant. It is not applicable in Indonesian corporate settings because a controlling governing body is in place in the form of this very same board of commissioners. Audit Committee Indonesian company law does not currently have regulations requiring the establishment of a separate audit committee (AC). However, because of the adoption of a Western model of corporate governance, the establishment of ACs was required under BAPEPAM Rule number IX.I.5 and the decree of the Chairman of BAPEPAM number Kep-29/PM/2004, and law number 19, 2003 (Kementerian Badan Usaha Milik Negara, 2003b, p. 30; Tumbuan, 2005). Once the audit committee is implemented it is then accountable to the board of commissioners which consists primarily of a majority government shareholders representation compared to the minority shareholders representation. Unlike American companies, where ownership is dispersed, Indonesian SOEs ownership is concentrated primarily through the government of Indonesia as the majority shareholder. As the majority shareholder the government appoints the members of board of commissioners during the shareholders annual (or special) general meetings. The members of the board of commissioners are independent of the board of directors. The appointments of AC members are the responsibility of the board of commissioners. This ensures that the AC members are independent of the board of directors. Theoretically this is a stronger provision then currently prevails in a one-tier system of corporate governance.
However, problems arise in practice when directors and commissioners are effectively colluding to protect corrupt individual government interest in SOEs. If there is an internal investigation, the report must be approved by the Main Director, and if there is a problem highlighted in that report it
10
The ‘outsider’ model refers to the broad category of corporate
governance regimes where the business entity is controlled by the senior managers but owned by outside shareholders (Solomon and Solomon, 2004, p. 150).
must be solved by a cultural approach which is top-down oriented. As explained by Zainal: …the investigation must be done internally (between internal auditor and directors) and/or must be changed of result. Commonly, directors are being back up by big guys, Commissioners (shareholders/government’s representation) including the audit committee who are very close persons with government officers, collude with internal auditors, checking by board of directors, and report has been sterilized (personal communication, 2005).
Elvy also referred to this issue in the following way: “…the directors will eliminate the corporate frauds if it is involved the shareholders and/or influence stakeholders such as members of house of representative” (personal communication, 2005). As a consequence similar corporate frauds do occur (often?) due to this protection and intervention not only by management but also by members of the two boards.
This phenomenon is not consistent with the code of GCG practices developed to ensure the effective administration and governance of SOEs. Most of the time, the appointed directors and commissioners represent the interests of the ruling political party, which itself is strongly influenced by powerful individuals with key roles in government. The problem arises when the interest of these individuals are not aligned with the public interest. There does, however, exist a mechanism where the candidates for board directors and board commissioners have to be approved by the Indonesian House of Representative. Baswir (2005) argued that there is an institutional chaos in managing the relationship between parliament, government, and SOEs which makes it more difficult for specific individuals to exert their power. Therefore, this mechanism may help to minimize if not to eliminate the abuse of power in SOEs. Disclosure A recent court case was referred to by one of the interview participants: Ellen is a union leader in one of the SOEs in this study. The union took the case to court because it disputed and challenged the payment of significant bonuses to members on both the board of directors and board of commissioners. The information had first emerged in the media. The union membership and leadership concluded that management and directors did not deserve to receive such bonuses when the company was facing large financial losses. The union also felt that management was not being transparent because the amounts in the bonuses were omitted from the financial statements. Ellen argued that: “We knew management giving out of bonus through the reporters…if it’s meant transparent, it must be

Corporate Ownership & Control / Volume 4, Issue 2, Winter 2006-2007 (continued)
210
appear on financial report…”. She interpreted this action as one of the leaking of information. She continued “…leaking information means that there is something is hiding and detected” (personal communication, 2005). There is a discrepancy between the ‘outsider’ model—with its one-tier system focus—and the current two-tier corporate governance system in Indonesia SOEs. In addition, the recommendations to have a corporate secretary, independent commissioners and an audit committee overlap existing jobs already established within the SOEs. Therefore, the adoption of the narrower ‘outsider’ model of good corporate governance practices is “…just like changing the clothes but same person” as argued by Connie one of the managers within these SOEs (personal communication, 2005). Historical Development of Corporate Culture in SOE11 The first and second Indonesian presidents significantly influenced and contributed to the development of present-day SOE corporate culture. When the Indonesian republic was first established in 1945, the first two longest-serving presidents were both born in Java (Tugiman, 1998, p. 3). Soekarno, the first president, reigned for twenty one years and his successor, Soeharto, a four-star army general, ruled for thirty two years. Therefore, the Javanese leadership styles and military business style have penetrated deep into the social, political and corporate lives of the Indonesian people and the State. This leadership approach has understandably also been practiced within state offices including the state ministry of SOEs which has the supervisory role over the day to day operation and future direction of the SOEs. Soekarno Era: The Foundation of SOE Corporate Culture The establishment of Indonesian SOE’s started during the revolutionary era of Soekarno, the first president of Republic of Indonesia (Usman, 2005, 2). During this period, the government nationalized companies owned by Dutch firms. At the time there were not many large private firms, hence, the economy was dominated by SOEs and (the national economy) was effectively governed by the State (Pangestu, 1999, p. 67).
Highly educated manpower is required to effectively manage SOEs. However, during this era the only educated manpower available was from the pool of public servants and members of the Republic
11
Corporate culture refers to a company's values, beliefs, business
principles, traditions, ways of operating, and internal work environment.
Indonesia Armed Forces (ABRI) (Usman, 2005). As a result of this historic influence it is currently still common to have directors and commissioners with bureaucratic and army backgrounds ‘serving’ within SOEs.
The combined recruitment of senior personnel from these two sources has helped to initially shape the SOEs’ corporate culture. Consequently, there were many internationally acceptable business practices and principles which were either overlooked or ignored in the business process of the SOEs. The day to day business working relationship between the ‘highest authority’ and the ‘subordinate’ was very similar to the processes used within a military hierarchy. It is clear that the army leadership style has been adopted in many SOEs and continues to this day. The various management layers—who were often merely the extended ‘hands’ of the State Ministers of SOEs—exhibited traits of totals obedience to their senior ‘leader’ (the higher authority). The way management and employees operated within the SOE was similar to the ‘public servant mentality’—understandable given that many were previously government employees—with many inefficient and non-competitive business practices (Priambodo, 2004, p. 117). Koentjaraningrat (1985, p. 459) also argued that this critical element of ‘total obedience’ is embedded throughout the civil-service approach in Indonesia.
Currently, there are still bureaucrats and non-active army personnel who hold key positions and are members of the board of directors and commissioners inside SOEs. Samuel argued that the Army’s style is still needed within SOEs: “…if the task is about supervision and then the person must can able to say “yes” or “no”, but not “or”, means that not in the grey area. And frankly I know only a person who has military trained able to do that” (personal communication, 2005).
Similarly, the rationale behind the placements of bureaucrats in SOEs is that they (the bureaucrats) have the experience in their field (e.g. state finance budget) and it is assumed that they are more capable of managing SOEs (Samuel, personal communication, 2005).
The fact that there may be more appropriate professional business background persons from external sources (non-bureaucratic or non-army) for these positions is disregarded. There are still a number of bureaucrats and ‘retired’ armed forces members within management circles and acting as board directors and commissioners in SOEs. These people will need to accept and participate in the changes and reforms to business practices and corporate governance approaches that are occurring within the SOEs.

Corporate Ownership & Control / Volume 4, Issue 2, Winter 2006-2007 (continued)
211
Soeharto Era: Further Influences on SOEs’ Corporate Culture The role of military in the economy continued during Soeharto’s era (Robison, 1986, p. 251). SOEs such as Pertamina (oil company) and Berdikari (trading company), who played major roles in Indonesian economy, were chaired by ex-military generals. Later, more positions at the director and commissioner level in SOEs were occupied by ex-members of the armed forces. A further reason for why so many military officers held positions in SOEs was because a number of the assets of SOEs used to belong to ABRI12 (Samuel, personal interview, 2005).
It was easier for members of ABRI to hold positions in ministry offices and then SOEs because of the existence of a program referred to as “dwi fungsi” (dual function) ABRI. Management positions in SOEs were also held by ex-government employees. These types of practices has led to the current situation where many members of the board of directors and board of commissioners of SOEs are people who previously held positions within the State Ministry of SOEs and the Ministry of Finance.
In Soeharto’s era all government employees were members of KORPRI (Korps Pegawai Republik Indonesia or Corps of Indonesian Government Employee).13 This applied to positions in all public and statutory offices. The ‘head’ of the respective departmental KORPRI was effectively the ‘head’ of those offices. For example, the Minster of Finance was the head of KORPRI for the Department of Finance or the General Director of PLN (State Power Company) was the head of KORPRI of PLN. Soeharto himself was the leader of the national KORPRI.
During this and the earlier Soekarno era government bureaucrats were effectively acculturated into an organizational setting where it was deemed appropriate to always obey (excessively?) higher authority. Orders from these ‘higher authority’ figures were and are executed without question. This business culture and practice has been prevalent during the past thirty years. Connie illustrated this point cogently: “what has been done is a culture process…because one regime that has been such a long time [in the] lead, this regime that has “culturized” this nation, because his [is] the one dominant [that] cultivate the values. We know that this regime is reign by Soeharto, new era ...” (personal communication, 2005). According to Connie, the key for the development of a modern approach to ‘good’ corporate governance in SOEs is
12
The ABRI used to own more business groups at that time – this
is no longer the case. 13
KORPRI is identical to the ruling political party GOLKAR in
the Soeharto era.
to change the culture that has existed for more than thirty years (personal communication, 2005).
The existing corporate culture in Indonesia, especially in SOEs, is not conducive for the implementation of Good Corporate Governance (GCG) practices that have been adopted from the West. The current employees in SOEs, as expressed by the participants in the interviews, felt that GCG practices cannot be implemented because of the existence of a current corporate culture that is different from the one that exists in Western nations.
Indonesian is immersed in what Sultan Hamengku Buwono X calls a ‘mud of conformism culture’ through the exploitation of symbols and manipulation of idioms of Javanese culture to reassemble the political and social culture of the nation (2003). Sometimes the wrong behaviour becomes the ‘right thing’ to do. This has become the values, beliefs and practices of Javanese culture that has moved stealthily into mainstream Indonesian life. Siahaan (2002), supporting this viewpoint, argued that Soeharto had misinterpreted the Javanese culture during his reign (cited in Ano, 2002). This has helped to contribute significantly to the prevalence of endemic corruption in the Indonesian bureaucracy.
Ellen argued that leaders in this country have misused some elements of Javanese culture in order to secure their individual or group’s self-interest. This behaviour is termed “ewuh pakewuh” (in the Javanese language) which means being fully obedient and loyal to one’s superior. The subordinates or employees are reluctant to question the instruction(s) given by their superior. Ellen explains the misuse of these Javanese practices as: “…from my point of view it (ewuh pakewuh practices) is good if it used positively…means for the employee’s loyalty…but the leader is don’t be an … like Soeharto,…when he effectively succeed [to] lead those who obey to him, he make a crony and giving the project to only to certain Chinese - Indonesian born Chinese…” (personal communication, 2005).
The abuse of this particular weakness has led to non-transparency in SOEs. This kind of abuse, malappropriation and distortion of Javanese culture and practice thrived during Soeharto’s reign in power.
Another element of Javanese culture that has been found within SOEs is the high tolerance among employees to the perceived superiority of certain individuals. As Polce pointed out: “…in Soeharto era before this company went listed many employees giving the wrong tolerance to his or her superior” (Polce, personal interview, 2005). The high level of tolerance of others practiced in daily living has been taught and spread within wider Javanese social culture from the early school years. The characteristics of obedience, respect for seniors and

Corporate Ownership & Control / Volume 4, Issue 2, Winter 2006-2007 (continued)
212
superiors are the principles of human relation among the various certain social classes of Javanese (Koentjoroningrat, 1985, p.459). It is difficult socially, therefore, for current internal stakeholders to criticize their colleagues and management. Further, there is no such word as “no” that is commonly used within the Javanese society especially within government settings (Tugiman, 1998, p. 95). Similarly, Priambodo (2004, p.59) posited that paternalism and “the leader is always right” culture prevails within SOEs. This paper finds also that “asal bapak senang” (ABS)14 still exists. Hadi, one of the branch managers stated: “if there is a meeting (discussing the report) between superior and subordinate, the report is just ABS…” (Hadi, personal communication, 2005). This overall situation has been abused resulting in a number of frauds and corporate misconduct referred to earlier in this paper.
To some extent, some of the Javanese style of leadership and cultural practices could be beneficial for the running of business entities. Management can more easily motivate(?) their staff to achieve corporate goals when they so readily comply with the company policy and show no resistance to senior managers’ requests and directions. However, in most cases, these employees are unaware of the ‘bigger picture’ and are simply driven to be part of management misconduct inside the company. In conclusion, the Javanese style that is currently embedded in SOE corporate culture has been abused and twisted such that ‘poor’ corporate practices and management misconduct is publicly perceived to occur regularly within SOEs.
Corporate Governance in an Emerging Democracy The Western corporate governance system which is being adopted by the Indonesian government and is the primary guidance for the management and operation of Indonesian companies has a ‘liberal democracy’ cultural favour and substance. In fact the normal life of political ‘democracy’ is new in Indonesia. Liberal democracy practices are still far behind the developed Western nations. The practice of democracy in Indonesia is still limited to the election of political positions such as the President, Prime Minster and members of parliament. In the meantime the appointment of boards of directors and commissioners are still in the hand of government with various political parties, powerful individuals and other powers interests interacting and influencing the outcomes. Little has apparently
14
ABS is the acronym which means in Indonesian that “..as long
as Sir happy”.
changed from past self-interested and ultimately abusive business practices. Changes within the Political System There have been, however, significant changes to the political system. This political transformation started when Soeharto resigned. During the Soeharto era the government was dominant in making decisions that impact the nation, society and business in general. However, successive Presidents including Abdurahman Wahid; Megawati; and, Susilo B. Yudhoyono have come from different political factions. There are now several political parties and factions that are involved in the decision-making processes as the result of major democratic reform in Indonesia. Patrick (2001, p. 5) depicted this new period as the end of authoritarian regimes and the birth of true democracy with no one person or political party having the majority of power and authority. However, KKN (collusion, corruption and nepotism) practices still take place. KKN does not belong to one particular political, social or business group instead it appears to have been diversified across several powerful groups within Indonesia.
Consequently, the policies and practices within SOEs are now being influenced not only by one all-powerful authority, but by several different factions that have placed their representatives within SOEs. Didi a member of the parliament pointed out that although the appointment of an executive in SOEs is supposed to be based on his/her professional experience and background and no longer to be based solely on which political party s/he comes from (personal communication, 2005). On the other hand, another member of parliament, Suzetta (cited by MT in Kompas, 20 April, 2005) stated that in reality (and this perception has wide public acceptance) the appointment of directors and commissioners of SOEs is still a ‘battlefield’ for politicians and political interests in this emerging democratic nation.
State Owned Enterprises are still targets for the active interplay of political and other vested interests. The politicians have seemingly ignored the main objective for the continued existence of SOEs which is to create economic stability and enhance economic prosperity for the nation as a whole. They are instead still using SOEs to achieve their own political objectives. As a reflection of this President Wahid’s Finance Minister stated openly: “Politics is a means to accommodate various interests” (Putranto, 2000). It appears that every change in the membership of the board of directors and board of commissioners of an SOE will turn into a battle of interests for the political factions in Indonesia.
Another example of this ongoing tension and interplay between vested interests occurred during the Wahid presidency. There was a major conflict

Corporate Ownership & Control / Volume 4, Issue 2, Winter 2006-2007 (continued)
213
between two major political factions, namely, the Indonesian Democratic Party for Struggle (PDIP) and the Islamic based Central Axis Forces. Sudibjo, the Minister of Finance was backed by the Central Axis Forces while Sukardi the Minister of SOEs by the PDIP. Wahid first stated that the Minister of SOEs had full power for the oversight and control of all the SOEs but six days later he issued another decree stating that the Minister of Finance still had full authority to control the state-owned banks (Putranto, 2000). It should be noted that Wahid became the president due to the support by the Central Axis faction although the PDIP had the majority of votes in the 2000 election.
Another example of what could be classified as ‘bad’ corporate governance practices took place during President Megawati’s regime. The SOE Minister at the time, Laksamana Sukardi who was also the treasurers of PDIP, was criticized by the public during the privatization process of one of the Indonesian satellite companies (PT Indosat). The privatization process was attacked because there was a strong public perception that it lacked transparency in the determination of the ultimate buyer and the appropriate share price. This particular act of privatization was claimed to only benefit the ruling party PDIP. Sukardi was criticized by Limbong and was requested to step down from his position as the President of the Board of Commissioners of Pertamina (cited in Ant/Edj, 2004). This type of incident is consistent with the claim by Baswir (2005) that the current elected president and dominant political party in government will always wants to place his/her nominated or preferred personnel within the senior positions in SOEs.
Current Corporate Governance inside SOEs: Form over Substance? Can the importation and implementation of GCG from the West replace the current SOEs practices which have existed to date in the Indonesian Republic? As indicated by Elvy, one of auditors that was interviewed: “…the external consultant who involved in forming GCG don’t know the culture of this company…because this GCG is make by those on the top who owned this republic” (personal communication, 2005). Oliver also argued that this culture hinder GCG practices. He gives as an example: “…the subordinate who make a mistake essentially must be punish due to his wrong doing, he (the superior) is not punish” (personal communication, 2005). The new corporate governance model is not being effectively embedded within the corporate culture of the SOEs. It is an ‘outsider’ model that has been implemented within SOEs by the government without studying thoroughly the existence of the real problem which is more closely related to management misbehaviour
and the need to eradicate KKN. However, the current directors and commissioners are supporters of the implementation of this new corporate governance system as was clearly evidenced in their responses during the interviews that were conducted in this study. It can also be understood that they are being appointed by the government representative in General Shareholder(s) meetings15 and are by no means just the extended hands of government (shareholder).
Indonesian SOEs have effectively adopted corporate governance system similar to the one used in developed Western countries. We would argue however that the implementation process has been ineffective. Are corporate governance reforms in Indonesia a mere “knee-jerk” political reaction as argued out by Holloway and van Rhyn16 in the case of the Sarbannes-Oxley Act in the USA in 2002 (2003, p. 2)? In this way politicians can at least be publicly seen as ‘doing something substantial’ in the corporate reform process. Corporate governance reforms in Indonesia have occurred partly due to public demands for a higher level of transparency and accountability in the running of public companies. Evidence shows that, although corporate governance frameworks have been strengthened, SOE management misbehaviour, frauds and even failures still continue. As pointed out by Rosser (2004, p. 122) Indonesian companies may well have converged towards the international GCG practices but only in form not in substance.
Conclusion and Recommendations
This paper has analysed three main factors that
continue to hinder the effective implementation of GCG practices in Indonesian SOEs. They include the ‘naïve’ adoption of the Western model of corporate governance practices ignoring the prevalence and historicity of the Indonesian version of corporate governance inside SOEs. The current corporate culture—developed out of the past, dominant influences on Indonesian culture and business practice during the Soekarno and Soeharto eras—is also a significant barrier to reform. The misuse and malappropriation of Javanese cultural practices by management as well as the changing political system which still embeds inappropriate influences over SOEs are additional negative factors.
15
Two of the sample of SOEs are 100% owned by government.
Another one of the sample is already publicly listed on the Jakarta Stock Exchange but the majority are still owned by the government. 16
Holloway and van Rhyn argued that the corporate governance
reforms in USA were just a mere political reaction that needed to be seen as such by the public (Holloway and van Rhyn, 2003, p. 2).
Corporate Ownership & Control / Volume 4, Issue 2, Winter 2006-2007 (continued)
214
In order to have effective GCG practices implemented successfully in Indonesian SOEs, we would recommend the following actions:
1) The new corporate governance system has to be consistent with the existing social, legal and corporate cultures. So far, Indonesian SOEs have adopted the corporate governance system used in a one-tier system. It should be noted that: “There is no single model of good corporate governance” (OECD, 1999, p. 12). Therefore, the government of Indonesia, in this case the Minister of SOEs must not merely adopt the outsider model of corporate governance without effective implementation strategies and support that can truly tackle the degree and depth of reform required.
2) The corporate culture in Indonesian SOEs has been influenced by the misuse of many elements of Javanese culture for more than thirty years. As a consequence this has created and embedded the notion of managerial hegemony—senior management decides ‘all things organizational’ without any active questioning of their actions. Two steps need to be taken in order to eradicate this exclusively top-down approach. According to Connie—one of these manager: “In my view, people (internal stakeholders) has been culturized (been forming) to misbehave for certain years, therefore, de-culturized process is needed” (personal communication, 2005). Secondly, A similar view is
given by Hamengku Buwono X who stated that a “counter culture” is needed to eliminate the long established corrupt culture (Hamengku Buwono X, 2003). Oliver explained his notion of this improvement of internal culture approach: “…if we want to truly implement that GCG, we have to corrected the insider people, those who operates this company have truly correct…” (personal communication, 2005). Secondly, after eliminating this inappropriate business culture, a sound form governance culture needs to be promoted. This can only be achieved through the development of a “healthy relationship” between, government, the SOEs management, and employees. Superiors and senior managers should have “a sincere heart” in accepting the different argument and viewpoints from subordinates who then become active and engaged as well as respected followers in modern organizations. This will create a more conducive and effective internal governance and corporate culture (Holloway and van Rhyn, 2005).
3) Finally, reduce the intervention of politicians in the appointment process and the operation of SOEs. The Minister of SOEs and the management of SOEs must not come from any one political party or any one powerful group in Indonesian society.
If all three sets of recommended actions occur then there is a greater chance of effective corporate and internal governance reform in SOEs.
References
1. Ano (2002), Budaya Jawa Lahirkan Birokrasi
Yang Korup (7 November), retrieved on 10 November 2004. Available fromhttp://www.
kompas.com/kompascetak/0211/07/dikbud/ buda09.htm. 2. Ant/Edj (2004), Laksamana Harus Mundur
Sebagai Komut Pertamina, retrieved on 5 January 2005. Available from - 27/06/2004, 15:05 WIB - KOMPAS Cyber Media - NASIONALhttp://www.kompas.com/utama/news/0406/27/150537.htm.
3. Asian Development Bank (2005), Progress
Report on the State-Owned Enterprise
Governance and Privatization Program (Loan
1866-Ino) in Indonesia, Manila: Asian Development Bank.
4. Bank BNI (2003) Memperkuat Tata Kelola
Perusahaan Bank BNI, 2003, retrieved on 30 January 2005. Available from E:\BNI Hubungan Investor.htm.
5. Baswir, R, (2005), Ada kekacauan Institutional
Dalam Mengelola BUMN, Sinar Harapan, 26 April, 2005. p. 4
6. Baxt, R., Ramsay, I. Stapledon, G. (Eds) (2002), Corporate Governance in Australia: The Evolving Legal Framework and Empirical
Evidence. In Low, C. K. (Ed.) Corporate
Governance: An Asia-Pacific Critique, Hong Kong: Sweet & Maxwell Asia, 2002.
7. Benny (2005), Participant interview, Jakarta: State-Owned Enterprise, 5 May.
8. Cahyono, R. (2003), Tipis Ingatan, Tipis
Solidaritas Sosial, retrieved on 20 September 2004. Available from http://www.suarapem
baruan.com/news/2003/11/14/editor/edi02.htm. 9. Claessens, S. (2003), Corporate Governance and
Development. Netherlands: Hague. 10. Connie (2005), Participant interview, Jakarta:
State-Owned Enterprise, 4 May. 11. Didi (2005), Participant interview, Jakarta:
State-Owned Enterprise, 27 April. 12. Ellen (2005), Participant interview, Jakarta:
State-Owned Enterprise, 3 May. 13. Elvy (2005), Participant interview, Jakarta:
State-Owned Enterprise, 3 May. 14. Goodpaster, G. (2002), Renungan Tentang
Korupsi Di Indonesia. In Basyaib, H., Holloway, R., Makarim, N. (Eds.) Mencuri Uang Rakyat:
16 Kajian Korupsi Di Indonesia, Jakarta: Yayasan Aksara.
15. Hadi (2005), Participant interview, Manado: State-Owned Enterprise, 11 April.
16. Hamengku Buwono X (2003), Priyayi Agung
Yang Demokrat, retrieved on 25 June 2005. Availablefrom http://www.tokohindonesia.com/

Corporate Ownership & Control / Volume 4, Issue 2, Winter 2006-2007 (continued)
215
ensiklopedi/s/sri-sultan-hb-x/index.shtml. 17. Herwidayatmo (2002) Fourth Round Table on
Capital Market Reform in Asia Tokyo: Organisation for Economic Co-Operation and Development and Asian Development Bank.
18. Holloway, D. A., (2004), “Corporate Governance Disasters and Developments: Implications for University Governing Bodies”, Australian Universities Review, Vol 46, No 2, April, pp. 23-30.
19. Holloway, D. A., van Rhyn, D. (2003), Corporate Governance Reforms: The Emperor's
New Clothes, Multinational Alliance for the Advancement of Organisational Excellence, MAAOE 03, pp. 1-6.
20. Holloway, D. A. and van Rhyn, D. (2005), Effective Corporate Governance Reform and Organisational Pluralism: Reframing Culture, Leadership and Followership. In Lehman, C. R. (Ed.), Corporate Governance: Does Any Size
Fit?, Advances in Public Interest Accounting Volume 11, Elsevier: Oxford, pp. 303-328.
21. Husnan, S. (2001), Indonesia. In Zhuang, J., Edwards, D., & Capulong, M. (Eds). Corporate
Governance and Finance in East Asia: A Study
of Indonesia, Republic of Korea, Malaysia,
Philippines, and Thailand, Vol.2, Manila: Asian Development Bank, 2001.
22. Kementerian Badan Usaha Milik Negara (2003a), Undang-Undang Republik Indonesia
No. 19 Tahun 2003 Tentang Badan Usaha Milik
Negara, P. 15, Ps 28, Ayat 2, Jakarta: Kementerian Badan Usaha Milik Negara.
23. Kementerian Badan Usaha Milik Negara (2003b), Undang-Undang Republik Indonesia
No. 19 Tahun 2003 Tentang Badan Usaha Milik
Negara, P. 30, Ps 70, Ayat 1, Jakarta: Kementerian Badan Usaha Milik Negara.
24. Koentjaraningrat (1985), Javanese Culture, Oxford: Oxford University Press.
25. Kurniawan, D. and Indriantoro, N. (2000) In the Second Asian Roundtable on Corporate
Governance Hongkong: The Role of Disclosure in Strengthening Corporate Governance and Accountability.
26. Ministry of SOEs (2005), Bumn Summit 2005:
Value Enhancement through the Improvement of
Productivity and Efficiency of Natural Resource-
Based Companies, Jakarta: Ministry of SOEs. 27. MT (2005), Bumn Dikhawatirkan Menjadi
Lembaga Politik, Kompas, 20 April, p. 15. 28. National Committee on Corporate Governance
(2000), Code for Good Corporate Governance, Jakarta: National Committee on Corporate Governance.
29. Oliver (2005), Participant interview, Jakarta: State-Owned Enterprise, 29 April.
30. Organisation for Economic Co-Operation and Development (1999), OECD Principles of
Corporate Governance, Paris: Organisation for Economic Co-Operation and Development.
31. Organisation for Economic Co-Operation and Development (2004), OECD Principles of
Corporate Governance, Paris: Organisation for Economic Co-Operation and Development.
32. Pangestu, M. (1996), Economic Reform,
Deregulation and Privatization: The Indonesian
Experience, Jakarta: Center for Strategic and International Studies (CSIS).
33. Patrick, H. (2001), Corporate Governance and
the Indonesian Financial System: A Comparative
Perspective. Paper presented at the Discussion Paper Series, APEC Study Center, Columbia Business School.
34. Polce (2005), Participant interview, Manado: State-Owned Enterprise, 7 April.
35. Priambodo (2004) Perjalanan Panjang Dan
Berliku: Refleksi Bumn 1993-2003, Yogyakarta: Media Pressindo.
36. Prentice, D. D. (1993), An Overview of the Corporate Governance Debate. In Prentice, D. D & Holland, P.R.J. (Eds), Contemporary issues in
corporate governance, Oxford: Clarendon Press. 37. Putranto (2000), Freedom to Achieve Their Best,
retrieved on 24 January 2005. Available from file://A:\IBonWeb_com - Freeddom To Achive Their Best.htm.
38. Robison, R. (1986), Indonesia: The Rise of
Capital, Sydney: Asian Studies Association of Australia.
39. Rosser, A. (2004), Coalitions, Convergence and Corporate Governance Reform in Indonesia. In Jayasuriya, K. (Ed.), Governing the Asia Pacific:
Beyond the "New Regionalism, New York: Palgrave Macmillan.
40. Samuel (2005), Participant interview, Jakarta: The Ministry of State-Owned Enterprise, 10 May.
41. Sato, Y. (2003), Corporate Governance in Indonesia: A Study on Governance of Business Groups. In Shimomura, Y. (Ed.), The Role of
Governance in Asia,. Singapore: Institute of Southeast Asian Studies.
42. Shiroyama, H. (2003), Regional Governance in Asia: Comparatvie Analysis of Experimentsof Decentralisation and Deconcentration in Indonesia, Thailand and Korea. In Shimomura, Y. (Ed.), The Role of Governance in Asia,. Singapore: Institute of Southeast Asian Studies.
43. Solomon, J. and Solomon, A. (2004) Corporate
Governance and Accountability, Wiley: Chichester, West Sussex.
44. Supriyanto, A. (2005), Dividen Bumn
Ditargetkan Naik 100 Persen Tempointeraktif, 18 October, retrieved on 11 February 2006. Availablefrom http://www.tempointeraktif.com/
hg/ekbis/2005/10/18/brk,20051018-68176,id.html.
45. Tabalujan, B S. (2002), Why Indonesian
Corporate Governance Failed - Conjectures
Concerning Legal Culture, revised working paper. 46. Tugiman, H. (1998), Budaya Jawa &
Mundurnya Presiden Soeharto, Bandung. 47. Tumbuan, F. (2005), The Two-Tier Board and
Corporate Governance OECD, retrieved on 22 November 2005. Available from http://www.
oecd.org/dataoecd/47/10/35550189.pdf. 48. Usman, M. (2005), Bumn, Apa Memang
Diperlukan? , [cited 13 July 2005], Available from http://www. sinarharapan.co.id
/ekonomi/keuangan/2005/0328/keu2.html. 49. Zainal (2005), Participant interview, Jakarta:
State-Owned Enterprise, 26 April.

Corporate Ownership & Control / Volume 4, Issue 2, Winter 2006-2007 (continued)
216
CORPORATE GOVERNANCE AND FIRM PERFORMANCE IN AN
EMERGING MARKET - AN EXPLORATORY ANALYSIS OF PAKISTAN
Mohammed Nishat*, Rozina Shaheen**
Abstract
This preliminary study aims to develop a corporate governance index based on governance practices followed by the listed firms at Karachi Stock Exchange (KSE). Since the corporate governance concept is at very initial level of its implementation and practices, this study also analyses the structure of good corporate governance practices and level of awareness about new regulations of corporate governance implemented by Security Exchange Commission of Pakistan. The data is collected through a structured questionnaire covering seven corporate governance categories: audit committee, board of directors, charter/bylaws, director education, executive and director compensation, ownership, and the progressive practices during the year 2004. The results indicate that all of the firm performance measures; return on equity, net profit margin, sales growth and dividend yield (except Tobin’s Q) have their expected positive relation with corporate governance index score (Gov-Score) and are significant in correlation and decile analysis. This suggests that firms with relatively poor governance are relatively less profitable, less valuable, and pay less cash to their shareholders. The role of audit and board of director are highly associated with good performance while the governance categories related to director’s education and charter/bylaws are least associated with good performance.
Keywords: corporate governance, firm performance, governance categories
*PhD, Professor and Chairman, Department of Finance and Economics, Institute of Business Administration (IBA), University Road, Karachi, Phones: 111-422-422 Ext. 222, Fax: 9243421, Email: [email protected] **Assistant Professor, NUST Institute of Management Sciences–NIMS, Tamizuddin Road-Rawalpindi, Phones: 051-9270373-74, Ext: 220, Fax: 051-9271610, Email: [email protected]
1. Introduction
Pakistan stock market is one of the leading emerging markets in the world. It has gone through series of reforms and structural changes since 1991. Financial reforms during 1990s have influenced the pattern of capital structure, dividend policy, risk premia, and compliances to corporate governance (Nishat, 1999). Very recently in 2002 Securities Exchange Commission of Pakistan (SECP) has directed for the purpose of establishing a framework of good corporate governance whereby a listed company is managed in compliance with best practices and in exercise of the powers conferred by sub-section (4) of the section 34 of the Securities and Exchange Ordinance, 1969 (XVII of 1969). The underline motives for planned corporate governance was to improve the overall governance practices firstly, through quality and independent board of directors and secondly improved management policies on investor communications. It is the first time that corporate sector is required to implement the corporate governance rules and provide the
undertaken of its compliance. We expect that with the openness and compliance the performance of corporate sector will improve at both individual firm level and at aggregate level.
Better corporate governance is supposed to lead to better corporate performance by preventing the expropriation of controlling shareholders and ensuring better decision-making. Corporate governance is the process and structure through which a firm’s business and affairs are managed by enhancing business prosperity and corporate accountability with the ultimate objective of enhancing shareholder’s wealth. Most of the research in the area of corporate governance is done for developed economies, as rich data is only available for these economies where active market for corporate control exists and the ownership concentration is low (Bohren and Odegaard, 2001). Pakistan like many developing countries is characterized by relatively weak investor’s protection and corporate law enforcement. Pakistani market is also characterized by the ownership concentration; cross-shareholdings and pyramid

Corporate Ownership & Control / Volume 4, Issue 2, Winter 2006-2007 (continued)
217
structure and the dominance of family business (Ghani and Ashraf, 2004).
Earlier Mir and Nishat (2004) empirically tested the link between corporate governance structure and the firm performance in Pakistan. This study differs from Mir and Nishat (2004) since it includes a different set of performance parameters which include, return on equity, net profit margin, sales growth, Tobin’s Q and dividend yield. Moreover, to determine parameters of corporate governance, Mir and Nishat (2004) used secondary data from the annual statements.
This paper is based on the secondary as well as on primary survey of different companies listed with Karachi Stock Exchange. We create a summary index of firm-specific governance, “Gov-Score,” and relate it to operating performance, valuation, and cash payouts for 226 firms listed with Karachi stock Exchange. We show that poorly governed firms (i.e., those with low Gov-Scores) have lower operating performance, lower valuations, and pay out less cash to their shareholders, while better-governed firms have higher operating performance, higher valuations, and pay out more cash to their shareholders.
This paper identifies several factors representing good governance that (as expected) are related to good performance that have seldom been studied before, providing new focal points for those seeking to link good governance to good performance.
The rest of the paper is organized as section 2 identifies the hypotheses. Section 3 describes the data and research methodology followed by discussion of results in section 4. The summary and concluding remarks are presented in section 5.
2. Hypotheses
H1: Better-governed firms have better operating
performance
Effective corporate governance reduces “control rights” stockholders and creditors confer on managers, increasing the probability that managers invest in positive net present value projects, (Shleifer and Vishny, 1997), suggesting that better-governed firms have better operating performance, our first proxy for firm performance.
H2:Better-governed firms are more valuable
Gompers et al. (2003), Bebchuk and Cohen (2004) and Bebchuk, Cohen and Ferrell (2004) show that firms with stronger stockholder rights have higher Tobin Q’s, their proxy for firm value, suggesting that better-governed firms are more valuable, our second measure of firm performance.
H3: Better-governed firms pay out more cash to
shareholders
Consistent with the notion that earnings are retained for empire building rather than for engaging in positive net value projects, Arnott and Asness (2003) find that firms with relatively smaller dividend payouts have relatively lower earnings growth, suggesting that better-governed firms pay out more cash to shareholders, our third proxy for firm performance.
3. Data and Research Methodology
We create a summary metric, Gov-Score, to measure the strength of a firm’s governance. We compute Gov Scores for 226 individual firms as of December 1, 2004 using data obtained from the annual reports. The data is collected through a questionnaire containing 37 factors as either 1 or 0 depending on whether the firm’s governance standards are minimally acceptable. We then sum each firm’s 37 binary variables to derive Gov-Score. We consider five performance measures spread across three categories: operating performance, valuation and shareholder payout. We select the three operating performance measures, return on equity, profit margin and sales growth, Tobin’s Q, the single valuation measure and single measures of shareholder payout, dividend yield.
Table 1 shows the percent of sample firms with minimally acceptable governance standards for our 37 corporate governance factors. Average score for 37 variables is 65.546%.
The research methodology involves two types of cross-sectional analyses. Firstly, we determine correlation between Gov-Score with each industry-adjusted fundamental variable using Pearson and Spearman correlations. We then order Gov-Scores from highest to lowest (i.e. from best to worst governance), and analyse if firm performance differs in the extreme governance deciles. For example, when we examine return on equity, we compare industry-adjusted return on equity for firms in the top Gov-Score decile with those in the bottom decile, and we use a t-test to determine if the mean values of return on equity in the top and bottom deciles of Gov-Scores differ significantly. To assess which categories and factors are associated with expected/unexpected (good/bad) performance, we correlate the five performance measures with seven governance categories and 37 governance factors. We consider a category or a factor to be associated with good/bad (expected/unexpected) performance if it is positive/negative and significant at the 10% level or better using a one-tailed test.

Corporate Ownership & Control / Volume 4, Issue 2, Winter 2006-2007 (continued)
218
4. Results Discussion and Interpretation 4.1.Gov-score and Firm Performance Table 2 presents Pearson and Spearman correlations between Gov-Score and firm performance. Excepting Tobin’s Q, all of the performance measures are significant with their expected positive signs for at least one of the correlations. The positive Pearson correlations range from a low of 0.0611 (returns on equity) to a high of 0.126 (dividend yield), while the positive Spearman correlations range from a low of 0.067 (net profit margin) to a high of 0.102 (dividend yield).
This study shows that better governed firms have higher dividend yields. However, we do not find that better governed firms to have higher sales growth and better valuation. The magnitude of correlation between Gov-Score and Tobin’s Q is of 0.061which is significant at 10%.
We also find negative correlation between Gov-Score and sales growth but its magnitude is very low. Table 3 shows the mean performance of each measure by docile sorted in decreasing order of Gov-Score. By construction, the mean Gov-Score in a docile is about the midpoint of the decile’s Gov-Score.
For example, in the analysis of return on equity, mean Gov-Scores for the top three Gov-Score deciles are 32.318, 30.578 and 29.601, while those for the bottom three deciles are 25.039, 25.853 and 26.492.
The results presented in table 3 reveal significant differences in performance between the top and bottom deciles of Gov-Score of the expected direction for five performance measures. Firms in the top and bottom deciles of Gov-Score have:
• Return on equity that is 8.262 % above the industry average, for a spread of 0.468%.
• Net profit margin, that is 0.297 % above the industry average, for a spread of 0.244%.
• Sales growth that is 0.206 % above the industry average, for a spread of -1.1758 %.
• Tobin’s Q that is0.767% above the industry average, for a spread of -0.614.
• Dividend yield that is 3.903 % above the industry average, for a spread of1.845 %
In summary, results presented in table 2 and table 3 reveal that firms with better governance, as measured via larger Gov-Scores, have higher returns on equity, higher profit margins and pay out more cash dividends.
In contrast, firms with poorer governance, as measured via lower Gov-Scores, have lower returns on equity, lower profit margins and pay out less cash dividends.
4.2. Categories and Factors Associated with Firm Performance 4.2.1. Categories Associated with Firm Performance Table 4 shows the association of the seven governance categories with our five performance measures. Return on equity is negatively associated with four governance categories and three of them are significant. Return on equity has a positive and significant relation with the other three categories, audit, ownership and charter/bylaws. Net profit margin also is positively associated with six categories and all of them are statistically insignificant. Net profit margin has a negative but insignificant relation with the charter/bylaws. Sales growth is positively associated with four categories but none of the relations are statistically significant. Tobin’s Q is negatively associated with five categories and all of them are significant. Dividend yield is positively associated with three categories and all the correlations are significant. Regarding the other four categories, they all have negative and statistically significant relation with dividend yield. The results presented in table 4 confirm with those in table 3 that governance is related to firm performance. Based on 35 comparisons (seven categories times five performance measures), the correlations are positive 51.43 % of the time (18 times). Net profit margin and dividend yield are positively related to most of the governance categories and the relationship is statistically significant. Our results for specific governance categories can be summarized as follows (presented in decreasing order of their conformance with expected performance):
• Executive and director compensation is positively correlated with net profit margin and sales growth but the relationship is statistically insignificant.
• Progressive practices are positively correlated with four out of five performance measures and the relation is statistically significant. Progressive practices are not significant when they have the ‘wrong’ sig.
• Ownership is positively correlated with three out of five categories. Ownership has a statistically significant “wrong” sign.
• Executive and director Compensation has three positive correlation and statistically significant wrong sign with return on equity.
• Director education is significant with two negative significant signs.
• Charter/Bylaws have only a positive correlation with sales growth but it is statistically insignificant.

Corporate Ownership & Control / Volume 4, Issue 2, Winter 2006-2007 (continued)
219
• Audit has four positive signs out of five performance measures and only three are statistically significant.
4.2.2. Factors Associated with Firm Performance
Table 5 shows the association of the 37
governance factors with performance. The three factors with positive signs possessing the largest correlations with return on equity are audit committee meets at least once every quarter of the year, audit committee consists solely of independent outside directors and directors are subject to stock ownership guidelines.
The three factors with unexpected (negative) signs that have the largest correlations with return on equity are: Board has outside advisors; board members are elected every three years and stock incentive plans were adopted with shareholder approval. Fifteen factors are significantly negatively associated with return on equity (see table 4). Twenty-four factors are negatively associated with net profit margin but all are statistically insignificant. The three factors with positive signs that have the largest correlations with net profit margin are: the size of board of directors is at least six but not more than 15 members, shareholders approval is required to change board and a board approved plan is in succession. The factors with negative signs have small correlation values. Fourteen factors are negatively associated with sales growth but they all are statistically insignificant. Twenty three factors are positively associated with sales growth and they all are statistically significant. The three factors with positive signs that have the largest correlations with sales growth are: mandatory retirement age for directors exists, audit committee consists solely of independent outside directors and shareholders approval is required to change board size. The three factors with negative signs and the largest correlations are: the size of the board of directors is at least six but not more than 15 members; company encourages board members to attend professional training programs and board members are elected after every three years.
Eighteen of the 37 governance factors are positively associated with Tobin’s Q and they all are significant, while seven of the 19 factors that are negatively associated with Tobin’s Q are statistically significant. The three most highly associated factors with a positive sign are: Mandatory retirement age for directors exists, directors are subject to stock ownership guidelines and no former CEO serves on board. The three significant factors with a negative sign are: stock incentive plans were adopted with shareholders approval, the CEO and chairman duties are separated or a lead director is specified and the
board of directors includes at least one independent outside director.
As shown eighteen of the 37 factors are positively associated with dividend yield and they are significant, while nineteen of the 37 factors are negatively associated with dividend yield and are significant. The three most highly associated factors with a positive sign are: Mandatory retirement age for directors exists, audit committee meets at least once every quarter of the year and stock incentive plans were adopted with shareholder approval. The three most highly associated factors with a negative sign are: board has outside advisors, shareholders approval is required to change board size and shareholders are allowed to call special meetings.
The results presented in table 5 confirm our findings discussed in table 3 and table 4, that governance is related to performance. There are 185 factor-performance combinations (37 governance factors multiplied by five performance measures). Ninety-four of the factors have their expected signs so we obtain the expected result 51% of the time. Similarly, of the 115 cases of significance, 70 have their expected signs, so when the results are significant, they are as expected 60.86 % of the time. Thus, our results indicate that good governance (based on factors) is related to good performance majority of the time. The following factors have a positive and significant correlation with at least three of the five performance measures, making them the governance factors that are most closely linked to expected performance:
• Audit committee consists solely of independent outside directors (3 out of 5).
• Audit committee meets at least once every quarter of the year (4 out of 5).
• Company has a formal policy on auditor rotation( 5 out of 5).
• All directors attended at least 75% of board meetings or had a valid excuse for non-attendance. (3 out of 5).
• Size of board of directors is at least six but not more than 15 members (3 out of 5).
• The CEO and chairman duties are separated or a lead director is specified (3out of 5).
• Shareholder approval is required to change board size (4 out of 5).
• Board cannot amend bylaws without shareholder approval or can only do so under limited circumstances (3 out of 5).
• Non-employees do not participate in company pension plans (3 out of 5).
• Stock incentive plans were adopted with shareholder approval. (4 out of 5).
• Directors receive all or a portion of their fees in stock. (4 out of 5).
• Directors are subject to stock ownership guidelines (4 out of 5).

Corporate Ownership & Control / Volume 4, Issue 2, Winter 2006-2007 (continued)
220
• Mandatory retirement age for directors exist. (5 out of 5).
• Performance of the board is reviewed regularly. (4 out of 5).
• A board-approved CEO succession plan is in place. (3 out of 5).
• Director term limits exist. (3 out of 5).
Following factors have a negative and significant correlation with three of the five performance measures. The linkage between performance and these factors can be interpreted as either the factors represent poor, rather than good governance, or they represent good governance but our results are peculiar to our particular sample, time period, and/or performance measures. Regardless of their interpretation, we consider these factors to be most closely linked to unexpected performance:
• Managers respond to shareholder proposals within 12 months of shareholder meeting. (4 out of 5).
• Executive directors are not more than 75% of the elected directors including the Chief Executive. (4 out of 5).
• No former CEO serves on board (3 out of 5)
• The Board of Directors includes at least one independent outside director (3 out of 5).
• Shareholders vote on directors selected to fill vacancies. (4 out of 5).
• Board members are elected after every three years. (5out of 5).
• Policy exists requiring outside directors to serve on not more than ten additional boards (3 out of 5).
• Shareholders have cumulative voting rights to elect directors. (3 out of 5).
• A simple majority vote is required to approve a merger (not a supermajority). (4 out of 5).
• Shareholders may act by written consent and the consent is non-unanimous (3 out of 5).
• Company is not authorized to issue blank check preferred stock. (3 out of 5).
• All the members of the board have post graduate qualification (3 out of 5).
• No interlocks exist among directors on the compensation committee. (3 out of 5).
• All directors with more than one year of service own stock (3 out of 5).
• Officers’ and directors’ stock ownership is at least 1% of total shares outstanding (3 out of 5).
• Board has outside advisors (4 out of 5).
• Directors are required to submit their resignation upon a change in job status (4 out of 5).
Much of the literature that relates corporate governance to firm performance has focused on Tobin’s Q. Yermack (1996); Bebchuk et al. (2004) identify six governance factors as being most highly associated with Tobin’s Q. We confirm their results using 37 factors, showing that the structure of the board of directors is the most important factor for Tobin’s Q. However, we also show that the board structure is significantly negatively related to most of our other performance measures. Firms with staggered boards have higher net profit margins, higher dividend.
4. 3. Multivariate Analyses
The evidence presented to this point is based on univariate analyses. We now provide multivariate evidence on the association between Gov-Score a Gov-Score and performance. We use Gov-Score, the log of the book-to-market ratio and the log of assets as control variables. Table 6 provides the results. Return on equity is positively related to the log of the book-to market ratio and the relationship is statistically significant. The relationship between return on equity and Gov-Score is positive but statistically insignificant. Net profit margin is positively related to Gov-Score but it is insignificant. The relationship between dividend yield and Gov-Score is positive and statically significant. Hence our results confirm a positive relationship between Gov-Score and performance measures. Firms with higher Gov-Scores have higher returns on equity, higher profit margins, are more valuable and pay out more cash dividends.
5. Summary and Concluding Remarks
We relate corporate governance to firm performance using 226 firms based on 37 corporate governance factors. We consider five performance measures from three categories: operating performance (return on equity, profit margin, and sales growth), valuation (Tobin’s Q), and shareholder payout (dividend yield). The data related to governance factor is collected through a questionnaire based survey of the companies listed with Karachi Stock Exchange.
We create a broad summary measure of corporate governance, Gov-Score, which sums 37 corporate governance factors where each factor is coded 1 (0). The 37 factors cover seven governance categories: audit, board of directors, charter/bylaws, director education, executive and director compensation, ownership and progressive practices.
With the exception of Tobin’s Q, all of our firm performance measures have their expected positive relation with Gov-Score and are significant in our correlation analysis (table 2), decile analysis (table 3), or both, suggesting that firms with relatively poor governance are relatively less profitable (lower

Corporate Ownership & Control / Volume 4, Issue 2, Winter 2006-2007 (continued)
221
return on equity and profit margin), less valuable (smaller Tobin’s Q), and pay out less cash to their shareholders (lower dividend yield. We correlate each of our five firm performance measures with each of the seven governance categories. We find that the governance categories related to Audit and Board of Directors are highly associated with good performance while the governance categories related to director’s education and charter/bylaws, least associated with good performance
We correlate each of the five firm performance measures with the 37 corporate governance factors. We find that the factors associated most often with good performance are: Audit committee consists solely of independent outside directors, Audit committee meets at least once every quarter of the year, Company has a formal policy on auditor rotation, all directors attended at least 75% of board meetings or had a valid excuse for non-attendance, size of board of directors is at least six but not more than 15 members, The CEO and chairman duties are separated or a lead director is specified, Shareholder approval is required to change board size , Stock incentive plans were adopted with shareholder approval, Directors receive all or a portion of their fees in stock. Directors are subject to stock ownership guidelines, Mandatory retirement age for directors exists, Performance of the board is reviewed regularly and Director Term limits exist.
We identify seven factors that are associated most often with bad performance, namely, Managers respond to shareholder proposals within 12 months of shareholder meeting, Executive directors are not more than 75% of the elected directors including the Chief Executive, No former CEO serves on board, The Board of Directors includes at least one independent outside director, Shareholders vote on directors selected to fill vacancies, Board members are elected after every three years, policy exists requiring outside directors to serve on not more than ten additional boards, A simple majority vote is required to approve a merger (not a supermajority), Board has outside advisors and Directors are required to submit their resignation upon a change in job status.
Anderson et al. (2004) show that the cost of debt is lower for larger boards, presumably because creditors view these firms as having more effective monitors of their financial accounting processes. We add to this literature by showing that firms with board sizes of between six and 15 have higher returns on equity and higher net profit margins than do firms with other board sizes
This paper provides insights on the association between audit-related governance factors and firm performance by showing that: (1) solely independent audit committees are positively related to dividend yield, return on equity and sales growth but not with net profit margin or firm valuation (2) company has
a formal policy on auditor rotation is positively related to operating performance, firm valuation and dividend yield.
We close with some limitations. First, we construct Gov-Score by summing 37 governance classified in a binary manner, a procedure that is ad-hoc and that does not maximize the linkage between performance and governance. Nevertheless, our method is similar to that of GIM, who summed up 24 governance factors to derive their widely used G-Index. Second, we relate corporate governance to firm performance on a single calendar day so our results may not pertain to other points in time. Unfortunately, we have response only from 226 companies out of 700 companies listed with Karachi stock exchange. Third, we examined only five performance measures, If we selected other performance measures, we likely would find some changes in the factors we found to be most highly related to expected/unexpected performance. Fourth, governance is advocated for reasons aside from firm performance, such as fairness, equity, and appearance of propriety. Some factors we do not find to be related to firm performance may be important for other purposes. Finally, we associate corporate governance with firm performance, but our results do not necessarily imply causality. References
1. Anderson, R., S. Mansi, and D. Reeb (2004),
“Board characteristics, accounting report integrity, and the cost of debt”, Journal of
Accounting and Economics 37 (September): 315-342.
2. Arnott, R., and C. Asness (2003), “Surprise! Higher dividends = Higher earnings growth”, Financial Analysts Journal 59 (January/February): 70-87.
3. Ashbaugh, H., D. Collins, and R. LaFond (2004), “The effects of corporate governance on firms’ credit ratings”, Working Paper, University of Iowa.
4. Barber, B., and J. Lyon (1996), “Detecting long-run abnormal operating performance: The empirical power and specification of test statistics”, Journal of Financial Economics 4 (July): 359-399.
5. Baysinger, B., and H. Butler (1985), “Corporate governance and board of directors: Performance effects of changes in board composition”, Journal of Law, Economics and Organization 1 (Spring): 101-124.
6. Bebchuk, L., A. Cohen, and A. Ferrell (2004), “What matters in corporate governance?”, Working Paper, Harvard Law School.
7. Bhagat, S., and B. Black (2002), “The non-correlation between board independence and long-term firm performance”, Journal of
Corporation Law 27 (Winter): 231-274. 8. Bhattacharya, U., and A. Dittmar (2002),
“Costless versus costly signaling in capital

Corporate Ownership & Control / Volume 4, Issue 2, Winter 2006-2007 (continued)
222
markets: Theory and evidence from share repurchases”, Working Paper, Indiana University.
9. Botosan, C., and M. Plumlee (2001), “Stock option expense: The sword of Damocles revealed”, Accounting Horizons 15 (December): 311-327.
10. Bowen, R., S. Rajgopal, and M. Venkatachalam (2004), “Accounting discretion, corporate governance and firm performance”, Working Paper, University of Washington.
11. Brown Lawrence D. and Marcus L. Caylor (2004), “Corporate governance and firm performance”, Presented at15th Conference on Financial Economics and Accounting, University of Missouri.
12. Cheema, Ali (2003), “Corporate governance in Pakistan: issues and concerns”, The Journal.
13. Copeland,T., T. Koller, and J. Murrin (2000), “Valuation: Measuring and managing the value
of companies”, (John Wiley and Sons, Inc.). 14. Core, J., R. Holthausen, and D. Larcker (1999),
“Corporate governance, chief executive compensation, and firm performance”, Journal
of Financial Economics 51 (March): 371-406. 15. Cremers, K. J. M., and V. B. Nair (2003),
“Governance mechanisms and equity prices”, Working Paper, Yale University.
16. DeFond, M., R. Hann, and X. Hu (2004), “Does the market value financial expertise on audit committees of boards of directors?”, Working Paper, University of Southern California.
17. Demsetz, H., and K. Lehn (1985), “The structure of corporate ownership: Causes and consequences”, Journal of Political Economy 93 (December): 1155-1177.
18. Dittmar, A (2000), “Why do firms repurchase stock?”, Journal of Business 73 (July): 331- 355.
19. Donaldson, W. (2003), “Congressional testimony concerning the implementation of the Sarbanes-Oxley Act of 2002”.
20. Easterbrook, F. (1984), “Two agency-cost explanations of dividends”, American Economic
Review 74 (September): 650-659. 21. Fama, E., and M. Jensen (1983), “Separation of
ownership and control”, Journal of Law and
Economics 26 (June): 301-325. 22. Fenn, G., and N. Liang (2001), “Corporate
payout policy and managerial stock incentives”, Journal of Financial Economics 60 (April): 45-72.
23. Fich, E., and A. Shivdasani (2004), “The impact of stock-option compensation for outside directors on firm value”, Journal of Business
(Forthcoming). 24. Fosberg, R. (1989), “Outside directors and
managerial monitoring”, Akron Business and
Economic Review 20 (Summer): 24-32. 25. Frankel, R., M. Johnson, and K. Johnson (2002),
“The relation between auditors’ fees for non-audit services and earnings management”, Accounting Review 77 (Supplement): 71 – 105.
26. Ghani, Waqar I. and Junaid Ashraf (2004), “Corporate Governance, Business Group Affiliation, and Firm Performance: Descriptive Evidence from Pakistan, presented ad the 2nd
Annual conference on Corporate Governance. Lahore University of Management Sciences
27. Gompers, P., J. Ishii, and A. Metrick (2003), “Corporate governance and equity prices”, Quarterly Journal of Economics 118 (February): 107-155.
28. Hermalin, B., and M. Weisbach (1991), “The effects of board composition and direct incentives on firm performance”, Financial
Management 20 (Winter): 101-112. 29. Hermalin, B., and M. Weisbach (2003), “Board
of directors as an endogenously determined institution: A survey of the economic literature”, Economic Policy Review 9 (April): 7-26.
30. Jensen, M. (1986), “Agency costs of free cash flow, corporate finance, and takeovers”, American Economic Review 76 (May): 323-329.
31. Jensen, M. (1993), “The modern industrial revolution, exit, and the failure of internal control systems”, Journal of Finance 48 (July): 831-880.
32. Jensen, M., and W. Meckling (1976), “Theory of the firm: Managerial behavior, agency costs, and ownership structure”, Journal of Financial
Economics 3 (October): 305-360. 33. John, K., and L. W. Senbet (1998), “Corporate
governance and board effectiveness”, Journal of
Banking & Finance 22 (May): 371-403. 34. Klein, A. (2002), “Audit committee, board of
director characteristics, and earnings management”, Journal of Accounting and
Economics 33 (August): 375-400. 35. Larcker, D., and S. Richardson (2004), “Fees
paid to audit firms, accrual choices, and corporate governance”, Journal of Accounting
Research 42 (June): 625-658. 36. Larcker, D., S. Richardson, and I. Tuna (2004),
“How important is corporate governance?”, Working Paper, University of Pennsylvania.
37. Mir, Shahid and M. Nishat (2004) “corporate governance structure and firm performance in Pakistan– an empirical study” presented ad the 2nd Annual conference on Corporate Governance. Lahore University of Management Sciences
38. Nishat, M. (1999), “The Impact of Institutional Development on Stock Prices in Pakistan”, Unpublished Dissertation, Auckland Business School, University of Auckland.
39. Morck, R., A. Shleifer, and R. Vishny (1988), “Management ownership and market valuation: An empirical analysis”, Journal of Financial
Economics 20 (March): 293-315. 40. Rosenstein, S., and J. Wyatt (1990), “Outside
directors: Board independence and shareholder wealth”, Journal of Financial Economics 26 (August): 175-191.
41. Shleifer, A., and R. Vishny (1997), “A survey of corporate governance”, Journal of Finance 52 (June): 737-783.
42. Yermack, D. (1996), “Higher market valuation for firms with a small board of directors”, Journal of Financial Economics 40 (February): 185-211.

Corporate Ownership & Control / Volume 4, Issue 2, Winter 2006-2007 (continued)
223
Appendices
Table 1. Descriptive Statistics of 37Corporate Governance Provisions (226firms)
Audit
1 Audit committee consists solely of independent outside directors 42.477 2 Audit committee meets at least once every quarter of the year 90.708 3 Company has a formal policy on auditor rotation 71.238
Board of Directors
4 Managers respond to shareholder proposals within 12 months of shareholder meeting. 84.071 5 All directors attended at least 75% of board meetings or had a valid excuse for non-attendance. 88.053 6 Executive directors i.e. working or whole time directors are not more than 75% of the elected directors
including the Chief Executive. 81.416 7 Size of board of directors is at least six but not more than 15 members. 85.841 8 No former CEO serves on board 61.504 9 The Board of Directors includes at least one independent outside director. 83.186 10 The CEO and chairman duties are separated or a lead director is specified. 73.894 11 Shareholders vote on directors selected to fill vacancies.
61.504 12 Board members are elected annually.
42.035 13 Shareholder approval is required to change board size. 75.221 14 Policy exists requiring outside directors to serve on not more than ten additional boards 77.876 15 Shareholders have cumulative voting rights to elect directors. 68.584
Charter / Bylaws
16 A simple majority vote is required to approve a merger (not a supermajority).
39.823 17 Shareholders are allowed to call special meetings.
67.256 18 A majority vote is required to amend charter/bylaws (not a supermajority). 73.893
19 Shareholders may act by written consent and the consent is non-unanimous.
61.947
20 Company is not authorized to issue blank check preferred stock.
74.778
21 Board cannot amend bylaws without shareholder approval or can only do so under limited circumstances. 83.186
Director Education
22 All the members of the board have post graduate qualification 66.814
23 Company encourages board members to attend professional training programs 81.858
Executive and Director Compensation
24 No interlocks exist among directors on the compensation committee.
73.451 25 Non-employees do not participate in company pension plans 70.354 26 Stock incentive plans were adopted with shareholder approval.
59.734 27 Directors receive all or a portion of their fees in stock. 36.730
Ownership
28 All directors with more than one year of service own stock.
61.947 29 Officers’ and directors’ stock ownership amounts to what % of total shares outstanding.
59.734 30 Executives are subject to stock ownership guidelines.
59.292 31 Directors are subject to stock ownership guidelines 65.487
Progressive Practices
32 Mandatory retirement age for directors exist. 41.593 33 Performance of the board is reviewed regularly. 83.186
34 A board-approved CEO succession plan is in place. 58.849
35 Board has outside advisors. 57.522
36 Directors are required to submit their resignation upon a change in job status.
60.177 37 Director term limits exist. 80.531
Table 2. Correlations of Gov- Score with Five Industry- adjusted Performance Measures
** Bold Values are statically significant
Pearson Spearman
ROE 0.061 0.042
NPM 0.0702 0.088
SG -0.024 0.011
Q -0.061 -0.202
DY 0.102 0.232

Corporate Ownership & Control / Volume 4, Issue 2, Winter 2006-2007 (continued)
224
Table 3. Decile Means of Six Industry- adjusted Performance Measures
Table 4. Seven Categories Associated with the Five Industry- adjusted Performance Measures
Table 5. Corporate Governance Measures Associated with the Six Industry- adjusted Performance Measures

Corporate Ownership & Control / Volume 4, Issue 2, Winter 2006-2007 (continued)
225
Table 6. OLS Regressions of Five Industry- adjusted Performance Measures on Gov- Score and Controls

Corporate Ownership & Control / Volume 4, Issue 2, Winter 2006-2007 (continued)
226
ECONOMIC GROWTH IN AFRICA: THE ROLE OF CORPORATE
GOVERNANCE AND STOCK MARKET DEVELOPMENTS
Anthony Kyereboah-Coleman*
Abstract
The study explored the link between corporate governance, stock market developments and economic growth by using data on selected African countries. Analysis was done within the Arellano-Bond Dynamic Panel data modelling. Results show that corporate governance and particularly the independence of corporate boards is important for firm performance and economic growth and that stock markets also play an important role in economic development. However, while market size is conclusive, our findings points to the fact that an increase in stock market activities must be focussed and carefully supported with appropriate mix of policies and programs in order to achieve the desired impact on economic growth because too many policies could erode the effect of critical indicators. Keywords: Economic Growth, Corporate Governance, Stock Market Developments, Africa
* Lecturer, University of Ghana Business School, Ghana and a PhD Student at University of Stellenbosch, Graduate School of
Business, Cape Town, South Africa. Email: [email protected], [email protected], Box LG 78, Legon, Accra, Ghana;
Tel: +233 21 501594; Cell: +233 244 234886; Fax: +233 21 500024 1. Introduction The fundamental role of stock markets in the economic growth and development of countries has never been in dispute. Thus, one main merit for the development of a stock market is its ability to promote long-term investment and economic growth through issuing shares and sharing risks between issuing firms and shareholders. Again, liquid stock markets allow shareholders to dispose of shares quickly and cheaply and in the process enable them to finance otherwise illiquid projects (Levine, 2000). An investment by a firm or the accumulation of physical capital formation has been identified to be closely associated with economic growth (McKinnon, 1973 & Shaw, 1973). Hence, stock or equity markets promote economic growth essentially through investment. Though, it is believed that one important role of the stock market is to promote efficient corporate governance, recent scandals involving firms such as the Enron Corp and WorldCom has raised more questions than answers. For instance, what should be the composition of a board of directors? The story of Enron and WorldCom shows clearly that corporate governance would fail to work if the board of directors lack the needed independence and capacity to monitor management due to information asymmetry. The development and growth of stock markets in emerging economies has been rampant in recent times especially in Africa. From thirteen stock
markets at the end of 1992, bourses in Sub-Saharan Africa (SSA) had increased to eighteen in 2002; these markets, with the exception of South Africa, doubled and in some cases more than doubled their capitalisation during the 1992-2002 period (S&P Emerging Markets Handbook). Total market capitalisation for Africa also more than doubled from US $113,423 million to US$ 244,672 million in the same period. For instance, the Ghana Stock Exchange was adjudged the world’s best performing market at the end of the first quarter of 2004 with an annual return of 144% in US dollar terms compared to a 30% return by Morgan Stanley Capital International Global Index, 26% Standard & Poor in US and 32% in Europe, amongst others (The Databank Group, 2004). On the continent itself, five other bourses namely Uganda, Kenya, Egypt, Mauritius and Nigeria, besides Ghana, were amongst the best performers in the year. Zimbabwe, however, was the worst performer with an abysmal return of -84%. This is illustrated in Figure 1.
The concept of corporate governance has traditionally been associated with the principal-agent paradigm. The principal-agent relationship arises when there is a separation between ownership and control of firms according to Berle and Means (1932). In this instance, principals (owners) hire agents (managers) to manage a firm on their behalf for a fee. This arrangement often leads to conflict of objectives as managers may pursue a set of objectives very different from that of owners.

Corporate Ownership & Control / Volume 4, Issue 2, Winter 2006-2007 (continued)
227
144
30 26 32
-84
GSE Morgan Stanley Standard &
Poor
Europe Zimbabwe
PerformersAnnual Return (% US $)
Figure 1. Performance of Some Stock Markets Compared to Other World Indicators (2004)
In order to reduce such agency costs associated with separation of ownership and control, several mechanisms have been proposed, among them is corporate governance. The term corporate governance has been used in many different ways and the boundaries of the subject vary widely. However, corporate governance could be defined as the set of rules, principles, structures, processes and mechanisms that a firm puts in place to ensure effective accountability of management to several corporate constituencies. The ongoing discussions on corporate governance have highlighted two basic models, namely the shareholder and the stakeholder models. The shareholder model posits that the fundamental objective of the firm is to maximise shareholder wealth through allocative, productive and dynamic efficiency. Thus, a firm’s performance is judged by the market value or shareholder’s value of the firm. In this case, managers aim constantly to ensure that firms are run in the interests of the shareholders. This has often been regarded as a narrow view of corporate governance warranting the advancement of the second model called the stakeholder model. This takes a broader view of the firm and its constituents. The main argument in this model is that a firm is responsible to a wider constituency of stakeholders other than shareholders. This wider constituency may include contractual partners such as employees, suppliers, customers, creditors, and social constituents such as members of the community within which a firm operates, environmental interests, local and national governments and indeed the society at large.
Corporate governance in Africa is relatively undeveloped. While much could be said of South Africa as having governance structures comparable to the developed market economies, corporate governance in most of the countries on the continent is in a developmental stage. One major characteristic of governance on the continent is the issue of institutional weaknesses and apparent lack of structures to swiftly address corporate disputes. For instance, Ayogu (2001) points out that the quality of
corporate governance in Africa may not be independent of the quality of state governance. This is because, he argues that the quality of the state provides the backbone upon which a board of directors can govern and upon which shareholders can “re-direct” the directors or monitor the monitors. Notwithstanding the above, there is overwhelming interest in corporate governance on the continent and this has become the focus of policy discussion and agenda because it is believed that good corporate governance leads to sustainable growth. Like corporate governance, stock markets in Africa are also at various levels of development and efficiency. As mentioned, however, the last three decades has seen an upsurge of stock markets on the continent.
The question concerns whether there is any link between corporate governance, stock market developments and economic growth. This is the fundamental question this paper seeks to explore. The theoretical link between stock market development and growth hinges on the advantage of stock markets spreading and pooling risk. In this light, stock markets influence growth through a number of channels: liquidity, risk diversification, acquisition of information about firms, corporate governance and savings mobilisation (Levine & Zervos, 1996). Levine (1991) used endogenous growth to show that stock markets help protect investors against idiosyncratic risk (firm-specific productivity risks) by providing firms with the opportunity to hold diversified portfolios. The rapid development of African bourses is also quite clear. Plausible reasons for these developments lie in the importance of stock markets in economic development. Pardy (1992) has noted that, even in less-developed countries, capital markets are able to mobilise domestic savings and are able to allocate funds more efficiently. Empirical studies on the link between stock markets and growth have varied in methods and results. Atje and Javanovic (1993), using cross-sectional regressions, conclude that stock markets have long run impacts on economic growth. Harris (1997) has also shown, within a cross-

Corporate Ownership & Control / Volume 4, Issue 2, Winter 2006-2007 (continued)
228
sectional framework, that stock markets promote growth, though this occurs only for developed countries. Rousseau and Wachtel (2000) also find that stock markets influence growth via value traded of shares whilst Arestis, Demetriades and Luintel (2001), using time-series on five industrialised countries, indicate that stock markets play a role in growth. Indeed, one other critical role of stock markets is their ability to provide an alternative tool for corporate governance through the use of shareholders’ monitoring devices as well as a market for corporate control where raiders can buy up the shares of poorly managed firms, replace the management and make capital gains as seen in the United States and the United Kingdom (Allen & Gale, 2000). The link between the equity market and corporate governance is through the gamut of listing requirements, satisfaction of objective criteria such as equity size, profitability, years of operation and future prospects. Hence, listed firms are supposed to be relatively profitable and large. While the positive relationship between stock market development and economic growth is not at all in dispute, the impact of corporate governance on economic growth is yet to be thoroughly explored, more so on the African continent where such studies are currently non-
existent. Some have argued that one important element of improving macroeconomic efficiency is through corporate governance (Maher & Anderson, 1999). Thus, well governed firms are expected to perform better and this could lead to higher economic growth. By this, therefore, the transmission mechanism through which corporate governance affects economic growth is firm performance.
The rest of the paper is organised as follows: Section two is devoted to data and methodology; Section three discusses empirical findings and section four concludes.
2. Data and Methodological Issues
In carrying out this study we use unique data from 103 companies listed on the Ghanaian, Nairobi, Nigerian, Kenyan and South African stock exchanges. Apart from the stock exchange factbooks, some data was also obtained electronically from INET-Bridge. Firms sampled were on the basis of data availability. Sampled firms cover the Industrial, Manufacturing, Mining, Agricultural and Services sectors.
Table 1. Firm Distribution by Sector and Country
Country Sector
Industrial Manufacturing Mining Agricultural Services Total
South Africa 15 5 15 3 4 42
Ghana 4 10 1 2 5 22
Nigeria 4 3 5 2 2 16
Kenya 8 7 3 3 2 23
Total 31 25 24 10 13 103
In defining what constitutes these sectors, we
largely depended on the classifications given by the various stock exchanges. We acknowledge the possibility of non-uniform classification which could pose a problem with regard to the analysis and results, but we are of the opinion that such differences are marginal and thus have little impact on compromising the validity of our results. The banking and finance sector was omitted in conjunction with studies on corporate governance (Faccio & Lasfer, 2000). 2.1. Empirical Model Specification We carry out our analysis in a dynamic panel data framework with the following model specifications:
titititi uZyy ,,1,, +′++= − ψλδ , (1)
where ,5................1;103.............1 == ti and
tiy , is the annual GDP growth rates for country i at
time t; tiZ ,′ is a vector of explanatory variables of
stock market development and firms’ governance indicators, and control variables; and
tiitiu ,, νµ += (2)
Our main stock market development variables
are the ratio of market capitalisation to GDP measuring size, and the ratio of value traded to GDP as a measure of liquidity, size and transaction cost. We use the size of the board (measured by the number of directors) and the independence of the board (measured by the ratio of non-executive directors to total board size) as the main governance variables. The duality of the CEO (a dummy variable equal to 1 when the same person occupies CEO and Board chair positions, and to 0, otherwise), CEO tenure, and the size of the economy measured by the standardised GDP in dollar terms are used as control variables. The specified model has two main characteristics. An autocorrelation problem due to

Corporate Ownership & Control / Volume 4, Issue 2, Winter 2006-2007 (continued)
229
the presence of the lagged dependent variable among the regressors and individual effects characterising heterogeneity among the interactive variables. Thus, in carrying out our estimation we employ the Arellano and Bond estimator which uses additional instruments and utilises the othogonality conditions
that exist between lagged values of tiy , and the
disturbances ti ,ν (Arellano & Bond, 1991). In this
regard the study adopts the Arellano and Bond (1991) Generalized Method of Moments (GMM) dynamic instrumental variable modelling approach where the lagged values of the dependent variable (growth) and differences of the independent variables are suitably used as a valid instrument to control for this bias. The use of instruments is important because, in a dynamic panel, the lagged
dependent variable [ 1−− itit yy ] will be correlated
with the lagged error terms [ 1−− itit ee ] by construct
and induce the possibility of endogeneity of some explanatory variables. Based on the assumption of no
serial correlation in the error terms and weak exogeneity of explanatory variables, the following moments condition applies:
( )[ ] 011 =− −− ititit eeyE 2≥y (3)
( )[ ] 011 =− −− ititit eezE 2≥y , (4)
where itz is a set of explanatory variables. Arellano
and Bond’s (1991) GMM estimation is based on these moment conditions and is consistent if lagged values of explanatory variables are valid instruments. The validity of the use of instruments is checked via the utilisation of a Sargan test of over-identifying restrictions which tests for correlation between the instruments and the model residuals. 3. Empirical Findings 3.1. Descriptive Statistics
Table 2. Summary Statistics
Variable Obs Mean Std. Dev. Minimum Maximum
Board size 388 9.224227 3.409779 3 23
Board independence 388 0.4190222 0.259989 0.05 0.846
CEO duality 388 0.193299 0.3953953 0 1
CEO tenure 388 3.510309 1.585593 2 8
Board meetings 388 10.53093 2.149833 5 14
Size of audit 388 4.146907 1.188474 2 9
Audit committee meetings 388 4.71134 1.49907 2 12
Profitability (ROA) 388 0.1268295 0.1458879 -0.426 0.68
GDP Growth 388 0.0258657 0.147148 -0.0023688 0.0470028
Mkt. Capitalisation 388 311224.69 74642.71 209.7413 231289
Mkt. Cap to GDP 388 0.2943687 0.4461504 0.0564919 1.503618
Value Traded to GDP 388 0.0807902 0.190179 0.0020291 0.6349773
The firms that were investigated operate with a
mean board size of about nine members, with a minimum and maximum board size of three and twenty-three members respectively. Most of these boards are deemed to be relatively less independent because about 42% of them are composed of non-executive directors, which imply that about 58% of such boards are composed of executive directors or insiders (John & Senbet, 1998). With a mean percentage point of 19, most of the firms have two personalities occupying the positions of CEO and board chairperson. The situation suggests the presence of less conflict of interest and fewer agency problems. These CEOs have been operating with a mean tenure of about four years, with a range between two and eight years, and these boards have a mean of about eleven meetings annually with the minimum and maximum being five and fourteen meetings respectively. Having audit committees in place, these committees average four meetings per
year, though some meet twelve times a year. The mean of four meetings could be due to the fact that the audit committees review financial and operational issues on a quarterly basis. Though most of the firms show steady performance with regard to profitability, some of them also did not appear to perform well during the period under study. Stock markets in these economies have also experienced some degree of growth with regard to size, liquidity and cost of transaction.
The results also show that stock market indicators could influence each other towards growth and development.
For instance, the liquidity and the size of the market are positively correlated shown by the high correlation coefficient of 0.9758 at 1% level of significance. It is clear from the table that all the corporate governance indicators showed the expected signs both with stock market variables and economic growth.

Corporate Ownership & Control / Volume 4, Issue 2, Winter 2006-2007 (continued)
230
Table 3. Pair-wise Correlation Matrix
Boar
d
Siz
e
Boar
d
Indep
end
ence
CE
O
dual
ity
CE
O
ten
ure
Rat
io o
f M
ark
et
Cap
ital
izat
ion
to G
DP
Rat
io o
f V
alu
e tr
aded
to
GD
P
RO
A
GD
P G
row
th
Rat
e
Board size 1.0000
Board Independence
0.1277
1.0000
CEO duality -0.1108 -0.2426* 1.0000
CEO tenure 0.3607* -0.0130 0.2132* 1.0000
Ratio of Mkt. Cap. To GDP
0.6124*
0.2655*
-0.2000*
0.5144*
1.0000
Ratio of Value Traded to GDP
0.5998*
0.2624*
-0.1961*
0.4941*
0.9758*
1.0000
ROA 0.2527* 0.2433* -0.1324 0.0089 0.1363 0.1412 1.0000
GDP Growth Rate
0.0653
0.2620*
0.1349
0.1551
-0.0044
0.0090
0.2152*
1.0000
Note: * indicates significance at 1% level.
For instance, the size of the board has a positive relationship with both market size, liquidity and transaction cost likewise the independence of the board. A combination of board chair and CEO positions by the same person negatively affects stock market activities ostensibly through a rise in agency costs. The CEO tenure also has positive impact on both stock market development variables and firm profitability. The implication being that longer tenure enables CEO to enhance firm value and this eventually translates into market developments through size and liquidity.
3.2. Discussion of Regression Results Arellano-Bond test that average autocovariance in residuals of order 1 is 0: H0: no autocorrelation z = -7.80 Pr > z = 0.0000. Arellano-Bond test that average autocovariance in residuals of order 2 is 0: H0: no autocorrelation z = -0.21 Pr > z = 0.8314. A regression analysis and the interaction between the dependent and the independent variables is also carried out and the results are shown in Table 4.
The results clearly reaffirm the notion that countries that grow have the potential to grow, in that previous growth rate reinforces current capacity to grow as lagged GDP growth rate is significantly and positively related to GDP growth. The capitalisation ratio (ratio of market capitalisation to GDP) and total value of share traded to the GDP ratio (measuring size, transaction cost and, more importantly, liquidity) are the main stock market development indicators. The results show that the ratio of market capitalisation to GDP has a positive relationship with GDP and economic growth, augmenting growth. In model 1, the surprise is the
negative relationship between market liquidity and economic growth. The results presuppose that an increase in stock market activities through higher liquidity has negative implications for economic growth. However, the correlation matrix in Table 3 suggest that there is a high correlation between the ratios of market capitalization and market liquidity (with coefficient of 0.9758) and thus using the two variables in the same regression could be problematic. This could partly explain the sign of market liquidity to GDP growth in model 1. In Model 2 however, higher liquidity is seen to augment GDP growth. The implication of the results of the two models is that an increase in stock market activities should be well-directed and focussed and that too many policies could erode the effect of critical indicators. The results also show that the independence of a corporate board enhances firm performance and therefore promotes economic growth. The pair-wise correlation matrix in Table 3 shows that both the size of the board and its independence have positive relationship with firm performance. Again, the independence of the board has a positive impact on economic growth through firm performance. This is consistent with other studies such as Fama (1980) who suggested that outside directors may act as “professional referees” to ensure that competition among insiders stimulates actions consistent with shareholder value maximisation and thus firm performance.
Again, a number of empirical studies on outside directors support the beneficial monitoring and advisory functions to firm shareholders (see Brickley & James, 1987; Weisbach, 1988; Byrd & Hickman, 1992; Brickley et al., 1994).

Corporate Ownership & Control / Volume 4, Issue 2, Winter 2006-2007 (continued)
231
Table 4. Regression Results (Dynamic Panel Estimation) All models passed the diagnostic testing of validity of instruments via Sargan Test and second order serially correlated errors via AR tests. Results are not shown for brevity
Dependent Variable: GDP Growth Rate
Regressors Model 1 Model 2
Lagged GDP
0.3395796 (14.38)**
0.8453405 (35.71)**
Board size
-0.0000493 (-1.40)
-6.08e-06 (-0.10)
Board independence
0.002097 (3.17)**
CEO duality
0.0005314 (1.99)**
Capitalisation ratio
0.1493188 (15.66)**
Value traded to GDP
-0.2568253 (-13.24)**
0.01026 (5.38)**
Size of the economy
-0.0027471 (-21.49)**
Constant -0.000097 (-10.14)**
-0.0000196 (-1.41)
Obs 347 347
Wald Chi2(7)=8492.93 Chi2(3)=2104.73
Baysinger and Butler (1985) and Rosenstein and
Wyatt (1990) showed that the market rewards firms for appointing outside directors. Brickley et al. (1994) found a positive relation between the proportion of outside directors and stock-market reactions to poison pill adoptions. In addition, the size of a corporate board is seen to have a negative correlation with performance and therefore with economic growth, though it is not significant. While all the control variables relatively showed the
expected signs, the size of the economy showed a surprise result, pointing to a negative relationship between the size of an economy and growth. While this at first sight sounds surprising, it could be true, empirically re-iterating the fact that growth may not necessarily be dependent on size if resources are not effectively harnessed and channelled, and combined with appropriate policies within a conductive environment.
Table 5. Country Specific Effect on Growth (Random Effect Estimation)
Dependent Variable: GDP Growth Rate
Regressors
Board Independence 0.0021712 (0.97)
Ratio of Value Traded to GDP 0.0450028 (6.23)**
Ghana 0.0417801 (10.41)**
Nigeria 0.0297743 (7.57)**
Kenya 0.0070739 (1.76)**
Constant -0.0000965 (-0.02)
R-squared 0.9377
Number of Observations 388
Test of Probability Wald Chi2(5)=1769.55
[ ]0000.0
Note: The regression includes a constant. ** indicates 5% significance level. T-statistics are in parenthesis and probability values in square brackets.
The regression results for country specific
effects shown in Table 5 indicate that the performance in the growth variable is largely driven by Ghana, followed by Nigeria and Kenya in that order. The implication is that the economic growth pattern of these countries within the period under
study was influenced by the nature and direction of economic growth in Ghana. Surprisingly, all the countries in the sample namely Ghana, Nigeria and Kenya appear to have performed better than South Africa within the period.

Corporate Ownership & Control / Volume 4, Issue 2, Winter 2006-2007 (continued)
232
4. Conclusion The study examined how corporate governance and stock market developments impact on economic growth. While most boards were seen to be less independent, the regression results point to a positive relationship between independent boards and economic growth. This performance appears to be largely driven by Ghana in particular followed by Nigeria, and Kenya in that order. Again, while stock market development has positive implications for economic growth, the study shows that policies should be well-focussed and well-directed in order to enjoy the benefits thereof. Our recommendation is that corporate boards should be made as independent as possible through the inclusion of more non-executive directors, and that stock market activities should be studied carefully in order to design an appropriate policy mix for the desired effect of achieving economic growth and development to be realised.
References 1. Allen, F. & Gale, D. (2000). Comparing financial
systems. Cambridge, MA: MIT Press. 2. Arellano, M. & Bond, S. (1991). “Some Tests of
Specification for Panel Data: Monte 3. Carlo Evidence and an Application to Employment
Equations” Review of Economic Studies, 58: 277-297. 4. Arestis, P., Demetriades, P. & Luintel, K. (2001).
“Financial Development and Economic Growth: The Role of Stock Markets”, Journal of Money, Credit
and Banking, 33: 16-41. 5. Atje, R. & Javanovic, B. (1992). Stock markets and
developments. N.Y: New York University Press. 6. Ayogu, M. (2001). “Corporate Governance in Africa:
The Record and Policies for good 7. Governance”, African Development Bank, Economic
Research Paper No.66. 8. Baysinger, B.D. & Butler, H.N. (1985). “Corporate
governance and the board of directors: Performance effects of changes in board composition”, Journal of
Law, Economics and Organization, 1: 101-124. 9. Berle, A.A. & Means, G.C. (1932). The Modern
Corporation and Private Property. New York: Macmillan.
10. Brickley, J.A. & James, C.M. (1987). “The takeover market, corporate board composition, and Ownership structure: The case of banking”, Journal of Law and
Economics, 30: 161-181. 11. Brickley, J.A., Coles, J.L. & Terry, R.L. (1994).
“Outside directors and the adoption of Poison Pills”, Journal of Financial Economics, 35: 371-390.
12. Byrd, J.W. & Hickman, K.A. (1992). “Do outside Directors Monitor Managers: Evidence form Tender Offer Birds”, Journal of Financial Economics, 32(2).
13. Demirguc-Kunt, A.. & Levine, R. (1993). “Stock market development and financial intermediary growth: a research agenda”. World Bank Working
Paper No. 1159, Washington DC, The World Bank.
14. Fama, E.F. (1980). Agency problems and the theory of the firm. Journal of Political Economy, 88.
15. Harris, R.D.F. (1997). “Stock markets and Development: A Reassessment” European Economic
Review, 41(1): 139-46. 16. Jensen, M. (2001). “Value maximization,
Stakeholders Theory and the Corporate Objective Function”. Working paper No. 01-01, Harvard Business School.
17. Jensen, M.C. & Meckling, W.H. (1976). Theory of the Firm: Managerial Behaviour, Agency Costs, and Ownership Structure. Journal of Financial
Economics, 3: 305-350. 18. John, K. & Senbet, L.W. (1998). “Corporate
governance and board effectiveness”, Journal of
Banking and Finance, 22: 371-403. 19. Levine, R. & Zervos, S. 1996. “Stock market
development and long run growth” World Bank
Economic Review, 10(2): 323-340. 20. Levine, R. (1997). “Financial Development and
Economic Growth: Views and Agenda”, Journal of
Economic Literature xxxv: 688-726. 21. Maehara, Y. 1995. “Japan’s Stock Market: Lesson
from the recent Boom and Slump”. Journal of Asian
Economics, 6(1): 119-131. 22. Maher, M. & Anderson, T. (1999). “Corporate
governance: Effects on firm performance and economic growth”, OECD Working Paper.
23. Mayer, C. (2002). “Financing the New Economy: financial institutions and corporate Governance”, Information Economics and Policy, 14.
24. McKinnon, R. (1973). “Money and Capital in Economic Development” The Brookings Institution. Washington D C.
25. Pardy, R. (1992). “Institutional Reform in Emerging Securities Markets.” Policy Research Working
Papers, (Financial Policy and Systems). The World
Bank, Working Paper Series, 907. 26. Rosenstein, S. & Wyatt, J.C. (1990). “Outside
Directors, Board Effectiveness and Shareholders Wealth”, Journal of Financial Economics, 26.
27. Rousseau, P.L. & Wachtel, P. (2000). “Equity markets and Growth: Cross-Country Evidence on Timing and Outcomes 1980-1995”, Journal of
Banking and Finance, 24: 1933-1957. 28. Scharfstein, D. (1988) “The Disciplinary Role of
Takeovers” Review of Economic Studies, 55: 185-199. 29. Schumpeter, J.A. (1932). The Theory of Economic
Development. Translated by Redvers Opie. Cambridge, Mass.: Harvard University Press.
30. Shaw, E. (1973). Financial deepening in economic
development. New York: Oxford University Press. 31. Shirai, S. (2004). Testing the three roles of equity
markets in developing countries: The case of China. World Development Report, 32(9): 1467-1486
32. Shleifer, A. & Vishny, R.W. (1986). “Large Shareholders and Corporate Control” Journal of
Political Economy, 94: 461-88. 33. Stiglitz, J.E. (1985) “Credit Markets and the Control
of Capital” Journal of Money, Credit and Banking, 17(2): 133-52.
34. Weisbach, M.S. 1988. Outside Directors and CEO Turnover. Journal of Financial Economics, 20.

Corporate Ownership & Control / Volume 4, Issue 2, Winter 2006-2007 (continued)
233
MANAGEMENT CONTROL IN ENTERPRISE SYSTEM ENABLED
ORGANIZATIONS: A LITERATURE REVIEW
Pall Rikhardsson*, Carsten Rohde**, Anders Rom***
Abstract
The objective of this paper is to add to the limited body of knowledge on the relationship between enterprise systems (ES) and management control. Based on a literature review, we describe and classify studies that empirically address this relationship. Apart from not being extensive, the research done so far primarily addresses the relationship between management control and ES based on a limited number of methodologies and approaches. We argue that there seems to be a need for more research done from functionalistic and critical perspectives, as well which employs a greater variety of methodologies. Subsequently, we propose some avenues for future research.
Keywords: ERP, management control, management accounting
* PhD, Associate professor, The Aarhus School of Business, [email protected] ** PhD, Associate professor, Copenhagen Business School, [email protected] *** MSc, PhD student, Copenhagen Business School, [email protected] Contact details of corresponding author: Pall Rikhardsson, Department of Accounting, Finance and Logistics, The Aarhus School of Business Fuglesangs Allé 4, 8210 Aarhus V, Denmark Telephone: (+45) 89486688, Telephone (direct): (+45) 89486376, Fax: (+45) 89486660 Mobile: (+45) 22285598, E-mail: [email protected]
Introduction
Few IT innovations have had as much impact on business organizations in recent years as enterprise resource planning (ERP) systems. Today, virtually every major business has implemented one or more ERP systems. It is estimated that organizations worldwide spend approximately USD18.3 billion every year on ERP systems (Shanks et al., 2003). Therefore, the management and organization of ERP technology and the innovative use of ERP systems are considered in almost any business context (Møller et al., 2003).
It has been argued that relatively few studies have looked at the relationship between enterprise systems (ES), enterprise systems enabled organizations and management control (Granlund and Mouritsen, 2003; Sutton, 2005). This seems paradoxical given the apparent importance of ES. It also seems that research is very much needed given developments within management control in the advent of, for example, the Sarbanes Oxley Act in the US, changes in international accounting standards and the increased responsibility of external auditors to validate internal control systems.
The main objective of this paper is to add to the limited body of knowledge of the relationship between ES and management control. To do this, we describe the empirical studies which have looked at
the effect of enterprise systems on management. We then tentatively make conclusions concerning the current state of knowledge regarding the effect of enterprise systems on management control and propose avenues for future research.
Defining management control and enterprise systems Enterprise systems and enterprise system enabled organizations
ERP systems are modular systems based on a client/server technology and offer comprehensive functionalities that support and integrate most business processes, such as accounting, sales, purchasing and production. Apart from internal integration, these systems offer the possibility of integration with external business partners such as customers and vendors (Klaus et al., 2000). Data are stored in a single database, which eliminates redundancy and the need to update data in several different subsystems (Davenport, 1998).
While the focus of ERP systems is mainly on the operational and tactical level, Fahy (2000) argues that they lack comprehensive reporting and analysis functionalities at the strategic level. Rom and Rohde (forthcoming) argue that ERP systems are in effect giant “calculation machines” and are mainly

Corporate Ownership & Control / Volume 4, Issue 2, Winter 2006-2007 (continued)
234
developed to process transaction information. As such, these systems have, in the past, been somewhat less successful in processing and reporting this information for the support of the various decision making processes in the organization. This is changing, however, with the advent of what are called business analytics and reporting (BAR) applications, which include various analytical applications such as balanced scorecard, budgeting and consolidation applications. BAR applications are linked (often through a data warehouse) to the transaction processing “engines” of the ERP system (Brignall and Ballantine, 2004). It should be noted that our definition is somewhat similar to Brignall and Ballantine’s (2004), who talk of strategic enterprise management (SEM) systems. However, in order to avoid any confusion with SAP’s product suite, which has the same name (SAP, 2004), we prefer the term business analytics and reporting systems or BAR systems.
Only five years ago, BAR systems were often found as add-on applications to ERP systems sold by third party vendors (i.e. non-ERP system vendors), including for example, Siebel, Cognos, QPR, SAS institute and Hyperion. Established ERP vendors did not allocate much attention to this area and focused more on the transaction functionalities of their systems. This is changing, however, as vendors release suites of BAR functionalities in their systems, such as SAP’s Strategic Enterprise Management suite and Intentia’s Enterprise Performance Manager. SAP SEM, for example, is a suite containing modules of Business Planning and Simulation, Business Consolidation, Strategy Management, Performance Measurement and Stakeholder Relationship Management (SAP, 2004).
ERP systems today are thus a combination of transaction registration and processing technologies and information extraction and reporting technologies – either from an ERP vendor or from an ERP vendor combined with software from a third party vendor. The term “enterprise system” (ES) will hereafter be used to refer to this combination. It does not include, for example, spreadsheets as these are not standard systems and are not an integrated part of the system. However, applications like Cognos and Hyperion (Clark, 1997; Classe, 1998; Dragoon, 2003) are included when they conform to the demands of being a standard system and of being integrated with an ERP system. Stand alone BAR systems not connected to an ERP system are not referred to as ES, though.
It could be argued that the development of ERP and ES in organizations has gone through at least two evolutionary cycles (Shanks et al., 2003). The first cycle included the acquisition, configuration and implementation of the ERP system, along with changes inflicted on organizations after going live with the system for the first time. The second
evolutionary cycle follows when managers who have gone through the first cycle begin asking questions such as: How can we gain greater benefits from our ERP investments? How can ERP systems be managed and enhanced to continuously align the system with the strategy and structures of the organization? How will the ERP system impact the business and create new ways of working? How will ERP systems impact management practices in the short and long run? (Kræmmergaard and Koch, 2002). This means that implementation issues are no longer of primary concern, but that issues of utilization and development of the system are, as well as business value enhancement and ensuring the strategic alignment of these systems. Adding BAR systems or functionality are examples of projects spurred by this second evolutionary cycle (Rikhardsson and Kræmmergaard, 2005).
ES implementations from the first development cycle have been explored mainly through case studies focusing on, for example, strategic options, how to avoid implementation failures and how to identify issues of strategic alignment, as well as business process reengineering issues (Esteves and Pastor, 2001; Dong et al., 2002; Al-Mashari, 2003). Only recently has research appeared aimed at ERP and ES issues in the second development cycle (Rikhardsson and Kræmmergaard, 2005).
Research into the application and impacts of enterprise systems has a clear message: These systems have the ability to enable the transformation of a business as well as the generation of real business benefits. But, the emphasis is on the word “enable”. Enterprise systems, which do not automatically lead to business benefits, can do so only if the company can utilize the system strategically and tactically – in other words, the ES, like any other company asset, has to be managed (Markus et al., 2003; Ross et al., 2003; Davenport et al., 2004). Thus, this research introduces and uses the term “enterprise system-enabled organization” (Elmes et al., 2005) instead of only using the term ERP or ES. This shift is important as the true impact of ERP systems does not emerge through simply “turning the system on”, but in the management and utilization of the system over time. Management control Control means different things to different people. Some sources have even identified over 50 different meanings of the term “control” (Rathe, 1960). The accounting and organization literature uses terms such as management control, organizational control, internal controls, strategic control, operational control and financial controls, which all seem to revolve around the same concept.
Management control has been defined both from a process and a system perspective. Otley and Berry

Corporate Ownership & Control / Volume 4, Issue 2, Winter 2006-2007 (continued)
235
(1980, p. 235) define control as, “the process of ensuring that the organization is adapted to its environment and is pursuing courses of action that enable it to achieve its purposes” (1980, p. 233). Flamholtz and Das define organizational control as, “attempts by the organization to increase the probability that individuals will behave in ways that will lead to the attainment of organizational objectives” (1985, p. 35). Emmanuel et al. define management control as, the “processes by which organizations govern their activities so that they continue to achieve the objectives they set for themselves” (1995, p. 11). Anthony and Govindarajan define management control as, “the process by which managers influence other members of the organization to implement the organization’s strategies” (2003, p. 10). The common characteristics of the definitions mentioned above are that they focus on management control as a process by which the organization tries to achieve its objectives. Other definitions of management control are based on a system perspective. Lowe defines management control as, “a system of organizational information seeking and gathering, accountability and feedback designed to ensure that the enterprise adapts to changes in the substantive environment and that the work behavior of its employees is measured by reference to a set of operational sub-goals (which conform with overall objectives) so that the discrepancy between the two can be reconciled and corrected for” (1971, p. 5). Simons defines management control systems as, “the formal, information based routines and procedures managers use to maintain or alter patterns in organizational activities” (1995, p. 5). Describing the characteristics of a management control system, Anthony and Govindarajan (2003, p. 4) identify a number of elements that are present in control systems. The authors draw analogies to systems such as automobiles, thermostats and the human body. Management control is seen as a simple cybernetic system, much like a thermostat, where there is a single feedback loop. Recent writings on management control takes a broader view of management control, as is apparent in the definitions cited above, where it is recognized that there are not always preset quantifiable standards with which to measure performance against, but that management control still takes place through supervision, codes of conduct, guidelines, etc. (Merchant and Van der Stede, 2003). Controls are also designed to prevent deviations instead of only reacting to control problems, which is the view inherent in much of the earlier writings on management control. Anthony and Govindarajan (2003, p. 6) point toward some of the characteristics of management control that actually make it more complex than a simple cybernetic system. Fundamentally, implementing and running a management control system means
ensuring that the organization does the right things in the right way, both regarding internal operations and how things fit with the external operating environment (Lowe, 1971). Earlier frameworks, like that of Flamholz et al. (1985), focused on this from the perspective of controlling work behavior and outcomes so that the organization reaches its goals. However, as mentioned above, later writings stress that management control is not about ensuring achieving goals in isolation, but also about implementing corporate strategy. As pointed out by Simons (1995), this entails controlling two dimensions of human behavior that seem incompatible at first glance. One is the creative innovation process which should ensure that the company renews itself and its offerings to the market. The other is ensuring that organizational actors fulfill the goals set out by management, as well as management fulfilling the goals set out by owners and external stakeholders. Simons calls this “organizational tensions” i.e. where managers use control systems to balance these “tensions” (2000, p. 7). Looking at what actually comprises a management control system, current research indicates that actual control activities can be classified into two main categories. Chenhall (2003) has, for example, classified the findings of numerous authors into whether management control activities are mechanistic – i.e. relying on formal rules, standardized operating procedures and routines - or organic – i.e. is flexible, responsive and has few rules and standards. Although not wrong in it self, classifying them into two broad categories seems like a bit of an over-simplification when looking at the plethora of control activities in use in organizations. The following lists some of the attributes of management control activities that could be added to the division between mechanic and organic:
1. Control level: Is the control activity performed at the level of employees, business unit (such as a sales organization), business process (e.g. a production process or a purchasing process), organization (such as a company) or a supply chain (i.e. from resource extraction to the finished product)?
2. System integrativeness: Is the control based on one person influencing the behavior of other people or is it integrated into a system (such as the enterprise system) or a process that influences the behavior?
3. Accounting relation: Is the control activity primarily a financial control based on accounting processes such as budgeting or cost control, or is it primarily related to controlling, e.g. production flows or logistic flows in, e.g. production management?
4. Decision relevance: Is the aim of the control to enhance decision making or is the aim to secure

Corporate Ownership & Control / Volume 4, Issue 2, Winter 2006-2007 (continued)
236
the correct and efficient conduct of business transactions?
Finally, management control and management accounting are often seen as closely related (Emmanuel et al 1990). Management accounting practices, such as cost analysis and performance monitoring, are seen as control activities, which they certainly are. This form for accounting thus includes control activities and supplies managers with information for use in management control. One could argue however, that although management accounting is a part of the control system of a company, it is not the only element of such a system. Examining Simons’ framework, described earlier, it becomes apparent that management accounting is but a part (albeit an important one) of the overall management control system. In the following literature review, we thus treat management accounting as a subset of management control, and therefore also include studies of how ERP systems have affected management accounting practices.
Summing up the above, current understanding of management control would thus seem to define management control as an organizational system consisting of specific processes aimed at ensuring the implementation of organizational strategy, at enabling the achievement of organizational goals, as well as at enabling reactions to changes in the operating environment. This is done by limiting and/or enabling the behavior of organizational members through the application of various control activities which take place in an organizational control environment. The characteristics of a management control system seem to be dependent on contextual variables, such as size, organizational structure, technology, strategy and operating environment. Control activities in the organization can be classified into several categories, such as mechanistic or organic (Chenhall, 2003). However, other categories also seem relevant. Although management accounting and management control are seen as deeply integrated, management control as an organizational process is a broader concept than just the management accounting tasks that are a part of the management control system in a company. Management control and enterprise systems One could ask the question as to why ERP systems, BAR systems or the integration of the two, Enterprise Systems (ES), are interesting in a management control context. On a general level, one can say that society is moving towards what can be called the post-industrial society, the networked society, the new economy, the digital economy, the information society or the knowledge society (Bhimani, 2003). These changes have often been largely due to advances in information technology
and the impact it has on the way people, for example, trade, travel, communicate and entertain them. This in itself has an impact on how companies carry out production, logistics, accounting, marketing, etc., as well as on strategic planning and goal setting (Hartmann and Vaassen, 2003). Thus, exploring the impact of changes inherent in the information society on organizational behavior and on processes becomes interesting in it self as a part of the academic study of social processes and changes.
More specifically, enterprise systems are a part of the advances in information technology that drive some of the social changes mentioned above. As described previously, ES imply a radical change in how information systems are used to manage data and information and in their role in supporting decision making, business process coordination and interaction, both inside the company and with regard to external business partners. The implied integration of business processes, an increase in information transparency and the organizational changes that often take place during an ERP implementation (Rikhardsson and Kræmmergaard, 2005) also have implications for accounting and controlling processes (Hartmann and Vaassen, 2003). Thus, understanding the links between management control and ES is interesting as a part of a broader process focusing on the effects of information technology in society in general, but also more specifically regarding the effects on a specific information technology on organizational development, decision processes and management practices. Looking at the latter in the context of management control, it is notable that research into the relationship between management control and ES seems to fall into two broad categories. The first category of research is the impact of enterprise systems on accounting, including financial accounting, management accounting and auditing. Accounting has long been seen as the “nexus of control” in the registering, processing and reporting of the information in an organization needed to assess whether the company is achieving its objectives, what new opportunities should be exploited and how to judge the performance of organizational members. Thus, it would seem natural to focus on this function in assessing the overall impact of ES on management control. The second category of research addresses the impact of ES on management control at a more general level, where management control is seen as an organizational process on its own subject to changes regarding the advent of enterprise systems. Furthermore, management control is seen as something every manager in the organization does regardless of their link to the accounting department (e.g. Dechow and Mouritsen, 2005). These empirical studies will be reviewed below; starting with the accounting focused studies and ending with the more generally focused studies.

Corporate Ownership & Control / Volume 4, Issue 2, Winter 2006-2007 (continued)
237
Research on enterprise systems and management control from a design perspective Research into how ES affects accounting has looked at several distinct issues – which sometimes are bundled together in the same paper or analysis - including: (i) performance of core accounting tasks such as data registration and reporting; (ii) adoption of management accounting innovations (Bjørnenak and Olson, 1999) such as activity-based costing and the balanced scorecard in the wake of the ES implementation; and (iii) the impact of ES implementation and use on the controlling tasks of the accounting department.
In a survey of Australian firms, Booth et al. (2000) found that ERP systems improve transaction processing by making it more automated and integrated between various business functions, thus improving the “information platform” of the company. But, the survey did not find that ES automatically delivered better reporting or decision support. These higher order effects require, according to the respondents interviewed, additional investment and effort. However, the companies were satisfied with the facilities provided in the systems that had been implemented, at least regarding financial accounting, but slightly less so for management accounting. Regarding the effects on accounting practices as such, the Australian survey did not find any evidence that the companies surveyed implemented management accounting innovations in the wake of the ES implementation. One explanation is that this requires more organizational changes and system capabilities than just reporting transaction information. Also, changes can be required concerning what transaction information is registered and how it is treated in the system. The authors reach the conclusion that ES themselves are not sufficient enough to lead to the adoption of management accounting innovations even though they offer supporting facilities.
Granlund and Malmi (2002) focused on the impact of ERP, specifically on management accounting and whether it had in any way changed management accounting practices. Based on case studies done on ten international companies, the researchers also focused on whether ERP had any impact on the accounting function in these companies and whether it was the case that these changes could be explained in terms of, for example, innovation diffusion or in terms of more sociological explanations, such as power struggles or organizational isomorphism. Granlund and Malmi (2002) did not find any evidence of significant changes regarding issues such as cost accounting, performance measurement, strategic management accounting or budgeting and forecasting practices. They found, however, that routine work, as well as
manual tasks regarding, for example, data registration and consolidation was minimized due to system integration and new technological options.
Hyvönen (2003) surveyed a sample of 300 small and medium Finnish companies regarding the effects of the use of IT either as an integrated “wall-to-wall” ERP application or as a collection of integrated “Best-of-Breed” applications. Instead of asking about benefits, the author asked about the level of problem reduction in the accounting function following the implementation of the ERP system. The top five categories in which companies reported fewer problems were:
1. Speed of reporting systems 2. Accuracy of reporting systems 3. General cost consciousness 4. Detail of information 5. Reliability of reporting system Hyvönen also points out that although some of
the companies in the survey adopted management accounting innovations, it was not a question of either or. Most of the companies adopting management accounting innovations continued using more conventional management accounting techniques alongside the more innovative techniques.
In a similar manner, Spathis and Constantinides (2004) surveyed the impact of ERP systems on accounting practices in 26 Greek companies. The most significant changes following the implementation of the ERP systems were increased use of an internal audit function, increased use of non-financial indicators and increased use of profitability analysis by segment and product. The authors attribute these changes to the integration of different applications and the possibility of real time information production. The top five impacts on the accounting processes are:
1. Increased flexibility of information generation, 2. Increased integration of accounting applications, 3. Improved quality of reports, 4. Improved decisions based on timely and reliable accounting information, 5. Reduced time for closing accounts. Rom and Rohde (forthcoming) investigate the
relationship between ERP vs. BAR systems and management accounting practices. On the basis of a survey of 349 companies in Denmark, they find that ERP systems are better at supporting some aspects of management accounting, while BAR systems are better at supporting other aspects of management accounting. ERP systems seem to be better at supporting data collection and giving an organizational breadth to management accounting. These findings seem to fit well with the characteristics of ERP systems which are transaction-oriented systems with a broad functional focus. With regard to BAR systems, Rom and Rohde

Corporate Ownership & Control / Volume 4, Issue 2, Winter 2006-2007 (continued)
238
find them to be better than ERP systems at supporting non-financial, external and ad hoc management accounting, the allocation of costs and reporting and analysis. Characteristic of these aspects of management accounting is that they emphasize aggregations, calculations and analyses rather than transactions, which fits in well with the definition of BAR systems as analytics and reporting systems. On the basis of their findings, they conclude that different systems support different aspects of management accounting. Research on enterprise systems and management control from a process perspective Cowton and Dopson (2002) studied management control changes in an UK automotive distributor. These changes were caused by both organizational changes, changes in performance measurement as well as the implementation of a new accounting information system as part of a broader ERP solution. The authors analyze this from a Foucauldian perspective, applying the concepts of visibility, disciplinary power and surveillance to the data. The results showed that the changes experienced by the managers interviewed included shifts in both freedom and constraints. But the common view was that these were personally negotiated and not the result of the new structure. Managers thought that the system implementation had entailed changes in both coercive and enabling controls (constraints and freedoms), while the actual changes were not uniform across the entire organization, but dependent on management interpretation. This is also reflected in a study done by Ahrens and Chapman (2004) which – although it does not focus on ERP systems as such – shows the importance of management interpretation.
Scapens and Jazayeri (2003), who conducted a study focusing on ERP and accounting change from an institutional perspective, found it difficult to establish that ERP is the sole cause of some of the changes cited in the literature. They argue that ERP can be an enabler of change, or accompany change, but might not be sufficient as the sole cause of change. Other factors that might also be important are:
1. The number and scope of modules implemented, 2. The implementation process and current status of the system utilization, 3. The length of time since going live, 4. The organizational structure of the accounting department, 5. The perceived roles of the accounting department by the organization, 6. The changes taking place in the environment of the accounting department,
alongside the implementation that might affect the accounting department. Scapens and Jazayeri (2003) also criticize some
earlier studies for only providing a static picture of the impacts of enterprise systems and emphasize the need for longitudinal studies focusing on the process of change, rather than the outcome of change. In their own study, they follow a company that decides to re-implement a newer version of SAP several years after its initial implementation. The main findings are that the ERP brought integration, standardization, “reutilization” and centralization of both data and business processes into the company, which played a key role in the changes observed in the accounting department, including:
1. The elimination of routine jobs, 2. More line managers with accounting knowledge, 3. More forward looking information, 4. A wider role for management accountants. These results indicate that the accounting
department is loosing its monopoly on access to accounting data and has to find other ways of legitimizing its existence by, for example, adding value to information through analysis, assurance services regarding information quality and by providing managers with forward looking perspectives and scenarios instead of backward looking reports. In a study of an ERP implementation in a large international company, Caglio (2003) also notes that accounting information retrieval, processing and reporting are no longer necessarily the sole domain of accountants. On-line data retrieval tools (i.e. BAR systems) and more user-friendly user interfaces enable non-accountants to get the information they need without involving the accounting department. Caglio (2003) proposes that the traditional view of the accounting department as the centre of the organizational information system is challenged (p. 124). Accounting professionals need to cast themselves in new roles within the organization, thus becoming what Caglio (2003) call “hybrids” between accountants and other professional groups. Caglio (2003) uses Giddens’ structuration theory (Giddens, 1986, 1994) to argue that accountants as a professional group are restructured in the organization as a result of ES implementation, resulting in new legitimacy, new status and an extended knowledge base. Furthermore, the accounting department is no longer the “nexus of control” in the organization, as the practice of control becomes more centralized.
Dechow and Mouritsen (2005), who examine the implementation of enterprise systems in two corporations, reach the conclusion that ERP systems enable the separation of management control from the management accounting function – even if this was not the intention. Control becomes an activity

Corporate Ownership & Control / Volume 4, Issue 2, Winter 2006-2007 (continued)
239
that is integrated with commercial management, rather than being functionally separated from it. Thus, control no longer seems to be the sole domain of the accounting department, but rather a collective affair where enterprise systems define the logic through which control is performed. In the company studied, it was SAP R/3 that defined the distinction between control regarding financial and non-financial data and the distinction between the accounting and logistics structure. They find that the logistics structure is more flexible than the accounting structure and that it takes a lot of effort to change the accounting structure after the system has gone live. The authors conclude that management control is not reinvented with the implementation of ERP. A panoptic visibility is not created as control becomes a collective affair with people telling the ERP what to do and the ERP telling people what to do.
In one study, Elmes et al. (2005) look at the implementation and effects of an ES in a large organization over three years. Their main research question is the apparent paradox concerning how an ES can increase control, while employee empowerment increases simultaneously. Applying grounded theory methodology and a Focauldian perspective, the authors develop two theoretical constructs regarding the effects of ES on management control. One is “panoptic empowerment” and the other is “reflective conformity”. The first addresses the simultaneous increase in control and empowerment which occurs through increased information visibility. That is to say, employees have more/better information and thus can affect the way they do their jobs. At the same time, managers and employees have greater visibility through one another’s ES, which increases disciplined behavior and control. When not only hierarchical managers could exercise control, but also peers and other managers, control changed as transparency increased from being hierarchical to being multi-directional. The second construct, reflective conformity, is where the “regime of truth” shifted away from valuing “heroic”, single actions in the name of expediency and effectiveness to more disciplined action within the constraints of the system. This conformity is not, as expected, followed by a decrease in reflection, but by an increase, mainly related to problem solving in relation to the use of the ES and in relation to getting the system “wrapped around” the realities of operations. As Elmes et al. state, “no finite set of embedded procedures can accommodate all possible operational needs” (2005, p. 27), so there will always be a need for understanding how to undo errors, force deviations from the model in the system, undo ripple effects, etc. The better employees understand the system, the better they are able to do so.
Discussion Based on the above review, some tentative conclusions can be drawn regarding current research on the relationship between ERP systems and management control.
First of all, most of the studies reviewed do not distinguished between the two system types we argue make up enterprise systems, i.e. the transaction registration and processing part (typically ERP systems) or the analytical, decision support and reporting part (typically BAR systems). Most of the studies seem to focus more on the effects of the transaction registration and processing part of the system regarding efficiency and effectiveness changes. However, BAR systems used in making decisions and measuring their effects would include addressing changes in the quality of decisions made. Following the arguments of Rom & Rohde (forthcoming), this focus on ERP systems is limiting as BAR systems serve other purposes and have other effects than just the ERP part. Tentative evidence, however, seems to suggest that there is a difference between the control effects of these two system types. Focusing on ERP systems, they seem to increase the efficiency and visibility of the accounting department in the organization by replacing many manual and routine tasks with automation. There is, however, no guarantee that implementation of ERP will lead to lower administrative costs, which seems to be dependent on contextual factors. Furthermore, the ERP does not automatically imply the implementation of management accounting innovations and innovative control techniques. This might change, however, as companies learn to use the system and to utilize any potential for more innovative control practices.
In general, it seems that the implementation and utilization of an enterprise system in an organization affects the control environment and the practice of management control activities as well as the characteristics of the management control system itself. Although the effects of ES utilization on management control can be expected to vary between different organizations, ES seem to separate management control from the accounting department, forcing it to redefine its role as its monopoly on control given the generation, processing and reporting of accounting information used in management control practices. This implies that control activities are, to some extent, integrated into the processes built into the ES architecture, as well as the various functions of the enterprise, thus delegating control. Furthermore, ES do not seem to create pure panoptic visibility in the organization, implying some sort of unidirectional Big Brother watchtower control. These systems seem to create different types of visibilities or types of multidirectional control depending on the actors and

Corporate Ownership & Control / Volume 4, Issue 2, Winter 2006-2007 (continued)
240
structures and logics applied. It seems, though, that the type of control differs as well with managers affected by the visibility of their actions in the system, while employees are affected more directly by the system itself. That is to say, managers change their behavior to improve the performance within their area of responsibility given that others now more easily can monitor their performance. Employees working directly with the system are, on the other hand, affected by more direct types of controls such as application controls and checks.
Finally, the studies presented above could be classified into the social science framework developed by Burrell & Morgan (1979), who classify research into four different paradigms based on the fundamental assumptions adopted by the researchers. The first assumption ranges from an extreme objectivist view to an extreme subjectivist view of social phenomena. The second assumption about the nature of society ranges from whether the research stresses the status quo (or stability) in society or the aspect of change (often resulting from conflict). This results in four main domains of social science research which Burrell & Morgan call functionalism, interpretivism, critical humanism and critical structuralism. Using these assumptions and the framework developed by Burrell & Morgan (1979), we tentatively classify the studies presented above as shown in Figure 1 below.
Stability
Change
Subjective Objective
Interpretivism Functionalism
Critical
humanism
Critical
structuralim
Booth et al. 2000
Spathis and Constantinides (2004)
Hyvönnen (2003)
Granlund & Malmi (2002)
Scapens & Jazayeri (2003).
Cowton & Dopson (2002)
Dechow & Mouritsen (2006)
Elmes et al. (2005)
Caglio (2003)
Rom & Rohde (forthcoming)
Figure 1. Classifying research on enterprise
systems and management control It is notable that a significant part of the research
reviewed has been sociological in nature and has applied interpretative frameworks such as those developed by, for example, Foucault and Giddens, regarding the interpretation of empirical material. The studies that are more functionalistic in nature usually focus on what overall effects (mostly) ERP systems have caused in organizations, but not necessarily on more detailed differences between systems, modules, practices and approaches.
The methodologies applied in the interpretive
studies have mostly consisted of case studies, while the methodologies applied in more functionalistic studies have consisted both of written questionnaire surveys as well as interview studies
Apparently, no studies have studied the impact of enterprise systems on management control by framing it in a comprehensive management control framework such as the one developed by Simons (1995). This would include examining the changes brought about by the ES in all four areas of say, Simons’ framework of value systems, boundary systems, diagnostic control systems and interactive control systems.
Finally, the upper part of Figure 1 is notably empty. No empirical studies to date have applied a critical theoretical approach to ES, although some more conceptual work is starting to appear (Dillard et al., 2005).
Conclusion and directions for future research
Our literature review on the relationship between ES and management control seems to support the arguments of Granlund and Mouritsen (2003) and Sutton (2005), who claim that research on these issues is relatively scarce.
We would like to argue that there is a need for research based on a comprehensive management control framework that addresses different aspects of management control as well as looks at enterprise systems – i.e. both ERP systems and BAR systems. Based on Simons’ framework (1995), we have identified a couple of research questions that have not yet been addressed, including:
1. Do ES have an impact on management and employee behavior by applying controls to limiting or enabling behavior and by the registration, processing and reporting of quality information to improve decisions and enable control? 2. When facing more traditional controlling tasks regarding budgeting, cost control and variance control, do managers rely more on the ERP system than on the BAR system aspect of the ES for supplying them with transaction based data and information? 3. Do managers rely more on BAR systems to generate information, build scenarios and support decisions when facing strategic uncertainties? 4. Are the values of the organization reflected in the design choices in the ES? That is to say, does the system support and enable search behavior that conforms to the values and priorities of the company? 5. Do the ES structure, set up, process models and design choices affect and support the limits for which behavior is deemed appropriate and

Corporate Ownership & Control / Volume 4, Issue 2, Winter 2006-2007 (continued)
241
possible for carrying out the activities of the company? Likewise, addressing a research issue from
different angles increases our understanding of the issue. Thus, examining ES from a more critical angle, with emphasis on the conflicts and unintended consequences of these systems, should also be pursued. We would like to propose several research questions from a more critical point of view, such as:
1. Do ES empower certain groups in the organization at the expense of other groups? 2. Do ES promote a certain type of business logic, effectively creating a “false consciousness”, making managers unable to contemplate other alternatives than those that can be integrated into the system? 3. In the future, will ES lead to panoptic Big Brother control systems where every transaction, action and reaction is logged and accessible for scrutiny by certain groups within the organization? 4. Are ES embedding certain structures in organizations (i.e. business process models, types of relationships, ways of doing business, etc.) that lead to some sort of “business practice monoculture”? Regarding methodological approaches, we have,
to date, seen approaches based on field studies (based on e.g. Yin, 1989; Kasanen et al., 1993; Lukka, 2003), and surveys. It is certainly relevant in these first phases of ES research to use qualitative methods to explore and to gain a deeper understanding of the issues involved and of the relationship between management control and ES. In later phases, however, it would be beneficial to support and extend these types of research with studies applying other types of methods, such as large-scale questionnaire surveys and experiments. Large-scale surveys would provide a general understanding of the impacts of ES in a variety of organizations and settings. Experiments could show the effects of ES in, for example, different decision-making situations, making this methodology a good way of studying the effects of BAR systems.
Using different theoretical paradigms and a variety of research methods would strengthen our understanding of ES and management control, both now and with regard to potential future developments. References
1. Ahrens, T. and C. S. Chapman (2004): 'Accounting
for flexibility and efficiency: A field study of management control systems in a restaurant chain', Contemporary Accounting Research, volume 21, issue 2, pp. 271-301
2. Al-Mashari, M. (2003): ‘Enterprise resource planning (erp systems): A research agenda’, Industrial
Management and Data Systems, volume 103, issue 1, pp. 22-27
3. Anthony, R. and V. Govindarajan (2003): ‘Management Control Systems’, New York: MacGraw Hill
4. Bhimani, A. (ed.) (2003): ‘Management Accounting in the Digital Economy’, Oxford: Oxford University Press
5. Bjørnenak, T. and O. Olson (1999): ‘Unbundling management accounting
6. innovations’, Management Accounting Research, volume 10, Issue 4, pp. 325-338
7. Booth, P., Z. Matolcsy and B. Wieder (2000): ‘The impact of enterprise resource planning systems on accounting practice – the australian experience’, Australian Accounting Review, volume 10, issue 2.
8. Brignall, T. J. S. and J. Ballantine (2004): ‘Strategic enterprise management systems: New directions for research’, Management Accounting Research, volume 15, issue 2, pp. 225-240
9. Burrell, G. and G. Morgan (1979): ‘Sociological Paradigms in Organisational Analysis’, London: Heinemann Books
10. Caglio, A. (2003): ‘Enterprise resource planning systems and accountants: towards hybridization?’, European Accounting Review, volume 12, issue 1.
11. Caglio, A. (2003): ‘Enterprise resource planning systems and accountants: towards hybridization?’, European Accounting Review, volume 12, issue 1.
12. Chenhall, R. (2003): ‘Management control systems design within its organisational context: Findings from contingency-based research and directions for the future’, Accounting, Organizations and Society, volume 28, issue 2-3, pp. 127-168
13. Clark, W. (1997): ‘The new breed of analytic applications’, Management Accounting, volume 79, issue 6, pp. 57-59
14. Classe, A. (1998): ‘Support for the strategists’, Accountancy, volume 121, issue 1258, pp. 50-53
15. Cowton, C. and S. Dopson (2002): ‘Foucault's prison? management control in an automotive distributor’, Management Accounting Research, volume 13, issue 2, pp. 191-214
16. Davenport, T. H. (1998): ‘Putting the enterprise into the enterprise system’, Harvard Business Review, volume 76, issue 4, pp. 121-131
17. Davenport, T. H., J. G. Harris and S. Cantrell (2004): ‘Enterprise systems and ongoing process change’, Business Process Management Journal, volume 10, issue 1, pp. 16-26
18. Dechow, N. and J. Mouritsen (2005): ‘Enterprise resource planning systems, management control and the quest for integration’, Accounting, Organizations
and Society, volume 30, issue 7-8, pp. 691-733 19. Dillard, J., L. Ruchala and K. Yuth (2005):
‘Enterprise resource planning systems: A physical manifestation of administrative evil’, International
Journal of Accounting Information Systems, volume 6 issue 2, pp. 107– 127
20. Dong, L., D. Neufeld and C. Higgins (2002): ‘The iceberg on the sea: What do you see?’, Proceedings of
the Eighth Americas Conference on Information
Systems, pp. 857-864 21. Dragoon, A. (2003): ‘Business intelligence gets
smart(er), CIO, volume 16, issue 23

Corporate Ownership & Control / Volume 4, Issue 2, Winter 2006-2007 (continued)
242
22. Elmes, M., D. Strong and O. Volkoff (2005): ‘Panoptic empowerment and reflective conformity in enterprise systems-enabled organizations’, Information and Organization, volume 15, issue 1.
23. Emmanuel, C., D. Otley and K. Merchant (1995): ‘Accounting for Management Control’ , London: Chapman & Hall
24. Esteves, J. and J. Pastor (2001): ‘Enterprise resource planning systems research: An annotated bibliography’, Communications of the AIS, volume 7, issue 8, pp. 1-52
25. Fahy, M. J. (2000): ‘Strategic enterprise management: the implications for management accounting and control’, paper presented at the 23rd annual congress of the European Accounting Association, Munich, March 29-31, 2000
26. Flamholtz, F. and T. K. Das (1985): ‘Toward an integrative framework of organizational control’, Accounting Organizations and Society, volume 10, issue 1, pp. 35-50
27. Giddens, A. (1986): ‘The Constitution of Society’, Cambridge: Polity Press
28. Giddens, A. (1994): ‘Structuration Theory: Past, Present and Future’, in Bryant, C. and D. Jary (eds.): ‘Giddens’ Theory of Structuration: A Critical Appreciation’, London: Routledge
29. Granlund, M. and T. Malmi (2002): ’Moderate impact of erps on management accounting: A lag or permanent outcome?’, Management Accounting
Research, volume 13, issue 3, pp. 299-321 30. Granlund, M. and J. Mouritsen (2003): ‘Introduction:
Problematizing the relationship between management control and information technology’. European
Accounting Review, volume 12, issue 1, pp. 77-83 31. Hartmann, F. and E. Vaassen (2003): ‘The Changing
Role of Management Accounting and Control Systems: Accounting for Knowledge Across Control Domains’, in Bhimani, A. (ed.) (2003): ‘Management Accounting in the Digital Economy’, Oxford: Oxford University Press
32. Hyvönen, T. (2003): ‘Management accounting and information systems: Erp vs. bob’, European
Accounting Review, volume 12, issue 1, pp. 155-173 33. Kasanen, E., K. Lukka and A. Siitonen (1993): ‘The
constructive approach in management accounting research’, Journal of Management Accounting
Research, volume 5, pp. 243-264 34. Klaus, H., M. Rosemann and G. G. Gable (2000):
‘What is erp?’, Information Systems Frontiers, volume 2, issue 2, pp. 141-162
35. Kræmmergaard, P. and C. Koch (2002): ‘Managing erp after going-live’, Proceedings of the 9th International Conference European Operations Management Association, Copenhagen
36. Lowe, E. A. (1971): ‘On the idea of a management control system: integrating accounting and management control’, The Journal of Management
Studies, volume 8, issue 1, pp. 1-12 37. Lukka, K. (2003): ‘The constructive research
approach’, in Ojala, L. and O.-P. Hilmola (eds.), ‘Case Study Research in Logistics’, Publications of the Turku School of Economics and Business Administration, Series B 1:2003, pp. 83-101
38. Markus, M. L., D. Petrie and S. Axline (2003): ‘Continuity ersus discontinuity: Weighing the future
for ERP packages’, in Shanks, G., P. Seddon and L. Willcocks (eds.): ‘Second-wave Enterprise Resource Planning Systems - Implementing for Effectiveness’, Cambridge: Cambridge University Press
39. Merchant, K. A. and Van der Stede, W. A. (2003): ‘Management Control Systems: Performance Measurement, Evaluation and Incentives’, London: Pearson/Prentice Hall
40. Møller, C., P. Kræmmergaard, and M. Rotbøl (2003): ‘Virksomhedssystemer i Danmark 2003 - en analyse af de 500 største danske virksomheders ERP systemer’, (Enterprise Systems in Denmark 2003: An analysis of the 500 largest companies in Denmark) IFI working paper series no. 126 ISSN no. 1398-067X, Aarhus: Department of Information Science
41. Nah, F. F.-H. (ed.) (2002): ‘Enterprise Resource Planning Solutions and Management’, Hershey, PA: IRM Press
42. Otley, D. and A. Berry (1980): ‘Control, organization, and accounting’, Accounting, Organizations and
Society, volume 5, issue 2, pp. 231-246 43. Rathe, A. W. (1960): 'Management control in
business', in Malcolm, D.G. and A. J. Rowe (eds.): ‘Management Control Systems’, New York: Wiley
44. Rikhardsson, P. and P. Kræmmergaard (2005): ‘Identifying the effects of enterprise system implementation and use: Examples from Denmark’, presented at the 2nd International Conference on Enterprise Systems and Accounting, Thessaloniki, July 11-12, 2005
45. Rom, A. and C. Rohde (forthcoming): ‘Enterprise resource planning (erp) systems, strategic enterprise management (sem) systems and management accounting: A danish study’, Journal of Enterprise
Information Management
46. Ross, J., M. R. Vitale and L. P. Willcocks (2003): ‘The continuing erp revolution: Sustainable lessons, new modes of delivery’, in Shanks, G., P. Seddon and L. Willcocks (eds.): ‘Second-wave Enterprise Resource Planning Systems - Implementing for Effectiveness’, Cambridge: Cambridge University Press
47. SAP (2004), ‘SEM010: SEM Overview. Participant Handbook.’, Germany
48. Scapens, R. and M. Jazayeri (2003): ‘ERP systems and management accounting change: Opportunities or impacts? A research note.’, European Accounting
Review, volume 12, issue 1, pp.201-233 49. Shanks, G., P. B. Seddon and L. P. Willcocks (eds.)
(2003): ‘Second-wave Enterprise Resource Planning Systems: Implementing for Effectiveness’, Cambridge: Cambridge University Press
50. Simons, R. (1995): ‘Levers of Control‘, Boston, MA: Harvard Business School Press
51. Simons, R. (2000): ‘Performance Measurement and Control Systems for Implementing Strategy: Text & Cases’, Upper Saddle River, NJ: Prentice Hall
52. Spathis, C. and S. Constantinides (2004): ‘Enterprise resource planning systems’ impact on accounting processes’, Business Process Management Journal, volume 10, issue 2, pp. 234-247
53. Sutton, S. (2005): ‘The role of ais research in guiding practice’, International Journal of Accounting
Information Systems, volume 6, issue 1, pp. 1-4 54. Yin, R. (1989): ‘Case Study Research‘, London: Sage

Corporate Ownership & Control / Volume 4, Issue 2, Winter 2006-2007 (continued)
243