
Print Version, Volume 7, Issue 4 - International Journal of ...
448
www.ijsrp.org April 2017 Print Version International Journal of Scientific and Research Publications Print Version, Volume 7, Issue 4 April 2017 Edition ISSN 2250-3153 IJSRP www.ijsrp.org
-
Upload
khangminh22 -
Category
Documents
-
view
0 -
download
0
Transcript of Print Version, Volume 7, Issue 4 - International Journal of ...

www.ijsrp.org
April 2017 Print Version
International Journal of Scientific and Research Publications Print Version, Volume 7, Issue 4 April 2017 Edition
ISSN 2250-3153
IJSRP www.ijsrp.org
www.ijsrp.org
International Journal of Scientific and Research Publications GENERAL INFORMAION: IJSRP, International Journal of Scientific and Research Publications publish monthly journal under ISSN 2250-3153. ONLINE VERSION http://www.ijsrp.org/e-journal.html PRINT VERSION (E-book) http://www.ijsrp.org/print-journal.html All the respective authors are the sole owner and responsible of published research and research papers are published after full consent of respective author or co-author(s). For any discussion on research subject or research matter, the reader should directly contact to undersigned authors. COPYRIGHT Copyright©2016 IJSRP.ORG All Rights Reserved. No part of this publication may be reproduced, stored in a retrieval system, or transmitted, in any form or by any means, electronic, mechanical, photocopying, recording, scanning or otherwise, except as described below, without the permission in writing of the Publisher. Copying of articles is not permitted except for personal and internal use, to the extent permitted by national copyright law, or under the terms of a license issued by the national Reproduction Rights Organization. All the published research can be referenced by readers/scholars/researchers in their further research with proper citation given to original authors. DISCLAIMER Statements and opinions expressed in the published papers are those of the individual contributors and not the statements and opinion of IJSRP. We assumes no responsibility or liability for any damage or injury to persons or property arising out of the use of any materials, instructions, methods or ideas contained herein. We expressly disclaim any implied warranties of merchantability or fitness for a particular purpose. If expert assistance is required, the services of a competent professional person should be sought. Contact Information: Editor: [email protected] Website: http://www.ijsrp.org
www.ijsrp.org
Table of Contents Evaluation and Optimization of Hot Liming Process in Kenana Sugar Factory, White Nile State, Sudan……....1
Waleed Nour Eldien, Elham H . M. Ali, Ahmed. Sohily, Mortada Hamad E.A……………………..1 Development Strategies For Electricity Business Portfolio At PT Cogindo Daya Bersama……….……………..6
Mulyadi, Musa Hubeis, Setiadi Djohar……………………………………….………………………..6 Radius, Diameter and Center of a Directed Fuzzy Graph Using Algorithm………………………………….....14
Dr.K.UMA……………………………………….………………………………………….…………..14 Research Proposal: The Veddas’, the Indigenous people of Sri Lanka, attitude on cultural heritage identification after relocation from their forest homeland……………………………………...………………..17
Sasni Amarasekara……………………………………….………………………………...…………..17 Evaluation of antioxidative and biological activity of Houttuyniacordata extracts………………….…………..22
NagungCamder Tok, Kamal Kant Jain, Narottam Prasad Sahu,Tincy Varghese, and Daniel N...22 An Assessment of Human Resource Management in the Academic Libraries - in the case of Amhara Region, Ethiopia……………………………………….……………….………………………………………..32
Dr. V. Ramadevi……………………………………….………………………………………………..32 A review on Causes and Consequences of Rural- Urban Migration in Ethiopia……………………….………..37
Birhanu Melesse, Dr.Kavitha Nachimuthu………………………………….………………………..37 Constraints and Challenges in Implementing Agricultural Extension Practices. The Case of North Gondar in Amhara Region, Ethiopia……………………………………….………………………………………………..43
Mrs.Tigist Petros, Dr. Kavitha Nachimuthu, Mr. Haimanot Atinikut, Mr. Mohammed Gedefaw……………………………………….…………………………………………………….…..43
Assessing Stakeholders Integration in Practicing Agricultural Extension System in Selected Districts of North Gondar Zone……………………………………….…………………………………….……………..52
Beyene Derso, Kibrom Adino, Haimanot Atinkut, and Mohamed Gedefaw…………………….....52 Development of a questionnaire onPrevention and Risk of Metabolic Syndrome among a rural population in Kelantan……………………………………….…………………………………………………..60
Norhafizah Ab Manan, Nor Azwany Yaacob, Al-Safi Ismail………...…….………………………..60 Determination Of Resistance To Low Temperatures Of Winter Buds According To Position In Karaerik (V. vinifera L.) Grape Cultivar……………………………………….……………………………..64
Cafer KÖSE, Özkan KAYA……………………………………….……………………………….…..64 The Structural Weaknesses for Quality of Education in Private Universities of Bangladesh…………….……..69
Md.Ashadujjaman, Asma Akter……………………………………….……………………………...69 A Layered Approach to Inferring Similarity Measurement of Ontologies Using Concept Mapping…………...75
Farah Shahid, Maruf Pasha……………………………………….…………………………………..75

www.ijsrp.org
Self-employment Intention and the Impact of Entrepreneurship Education on School Leavers…………….…..83 S.DamayanthiEdiriisnghe……………………………………….……………………………………..83
Changing Pattern of the Downstream of Ganges River Course: A Comparison with Rennell’s Map of 1760s……………………………………….……………………………………………………...……………..90
Nusrat Jahan Ety, Dr. Md. Shahedur Rashid……………………………………….………………..90 Family perspectives on end-of-life care in a tertiary care medical facility of Sri Lanka…………………...…..106
DRRHB Dissanayake, HKMMB Kavisekara, KSCK Dissanayake, WKS Kularatne………..…..106 The influence of grazed grassland in productivity on Indian grassland (Bilaspur, Chhattisgarh)………….…..110
Baldau Prasad Dadsena, Dr.M.L.Jaiswal……………………….………….………………………..110 Evaluation of Biosecurity Status in Commercial Broiler Farms in Sri Lanka…………………………...……..114
W.M.J.B. Wijesinghe, P.G.J.C. De Silva, S.P. Gunaratne…………………………...……………..114 Combined Effect of Different Micronutrients and Spacing on the Growth and Yield of Garlic (Allium sativum L.)……………………………………….……………………………………..……………..120
Sumaiya Afrin Jhuma, Dr. Tahmina Mostarin, Dr. Khaleda khatun, Israt Jahan, Prince Biswas, Mohammad Abu Bakar Siddik……………………………………….……………………..120
Investigation of in vitroSunscreen Activity and Phytochemical Profile of Flueggealeucopyrus (Willd)……...127
L.S. Perera, W.D. Ratnasooriya, R.N. Pathirana……………………………………….…………..127 Financial management function in the relevant Lybian institutions……………………………………..……..133
Khalid Mohamed Durar……………………………………….………………………….…………..133 Women empowerment: Boaster of Economic Development (A study of working women in higher education)……………………………………….………………………………………………………..……..136
Jyoti Khare……………………………………….………………………………………………..…..136 Plastic Roads - Use of Waste Plastic in Road Construction……………………………………….…….……..137
Ahmed Trimbakwala……………………………………….……………………..…………………..137 A Scalable Sketch Based Image Retrieval System……………………………………………………………..140
Kathy Khaing, SaiMaungMaungZaw, Nyein Aye…………………………………………………..140 Usability Recommendations for an Academic Website: A Case Study………………………………………..145
D.P.Jayathunga, J.M.D.R. Jayawardana, S.T.C.I. Wimaladharma, H.M.U.M. Herath………....145 Analysis Relationship Regional Representative Council and Local Government in Regulation Making of Alleviation Poverty in West Sulawesi Province………………………………………………………………..153
Juanda Nawawi………………………………………………………...…….………………………..153 Cloud computing – a necessary reality in modern education………………………....………………………..158
Gabriela Kiryakova……………………………………….…………………………………………..158 Real and character self in a virtual environment: personality traits of World of Warcraft players………….....165
Gabriella PÁTKAI, Tamás BERECZKEI……………...………………….………………………..165

www.ijsrp.org
VLSI Using CMOS Fabrication……………………………………….………………………………………..169 Prakhar Dixit, Pratik Suhasaria,Atul Singh, Prof. Atul Patil………………………….…………..169
Working Capital Improvement fo A Competitive Securities Company………………………………………..173
Muhammad Rifqi Syauqi, Dedi Budiman Hakim, Hendro Sasongko……………………………..173 The modern marketing methods of improving healthcare facilities…………………..………………………..179
Emil Zhalmukhamedov…………………………………………………..….………………………..179 Performance Improvement of Photovoltaic Module Using Plane Mirror……………………………….……..182
Aliyu Abubakar, M.H Ali……………………………………….……………………..……………..182 Setting, Moderating And Marking University Examinations: A Comparative Review of Policies from Universities in East Africa and United Kingdom……………………………………….………………….…..192
Edwin Andama Ombasa……………………………………….……………………………………..192 MULTIPLE INTELLIGENCE ASSESSMENT - BASED ON HOWARD GARDNER’S RESEARCH……..203
MR. SREENIDHI S K, MS. TAY CHINYI HELENA………………………….…………………..203 Improved LEACH algorithm for enhancing lifetime of WSN – A Survey…………………...………………..214
Deepa & Dr. Nipin Gupta……………………………………….………………..…………………..214 4Cs -INNER MOTIVATION STYLES - BASED ON DR. WILLIAM MARSTON’S RESEARCH………...219
MR. SREENIDHI S K,MS. TAY CHINYI HELENA, MS. SHOBA ABY JOHN………………..219 MINIMUM UNORTHODOX MEASURE OF ENTROPY FOR RESCRIBED ARITHMETIC MEAN AND SECOND ORDER MOMENT……………………………………….………...………………..230
Shalu Garg……………………………………….…………………………………………...………..230 Automatic alert and switching control of secondary distribution system……………………………..………..240
Sanjosibimoolamkunnam……………………………………….………………………...…………..240 Ethnic distribution of patients presenting with lower urinary tract symptoms (LUTS)…………………... …..243
AUB Pethiyagoda, K Pethiyagoda……………………………………….………………….………..243 Concept of Peace in World’s Major Religions:an Analysis……………………………..……………………..248
Dr. Muhammad RafiqueAnjum……………………………………….……………………………..248 Impact of Participation in Microfinance on Women Empowerment: Evidence from the Women Enterprise Fund Beneficiaries in Nairobi County, Kenya……………………………………….……………..263
Margaret Wawira Ndwiga, Dr. Florence Ondieki-Mwaura, Dr. Winifred Karugu……………...263 Analysis of Factors Affecting Profitability in XYZ Bank (One of Commercial Bank in Indonesia)……….....276
AndhinaDyahSulityowati, NoerAzamAchsani, Tanti Novianti…………………...………………..276 Buckling and bonding behaviour of glass fiber reinforced epoxy resin composite column under compressive loading mechanism……………………………………….………………………………..283
Srinath T, Shyam Kumar E……………………………………….……………………………..…..283

www.ijsrp.org
COMPETITIVE INTELLIGENCE AND PRODUCT DEVELOPMENT IN SELECTED PHARMACEUTICAL FIRMS IN ANAMBRA STATE OF NIGERIA………………………..……………..288
Moneme, Chigozie Patrick, Nzewi, Hope Ngozi , Mgbemena, Ijeamaka Charity………………...288 Single Server Bulk Queueing System with Three Stage Heterogeneous Service, Compulsory Vacation and Balking……………………………………….………………………………………………………….....300
S. Uma, P. Manikandan……………………………………….…………………………………..…..300 Study on the Spatial Pattern of Commercial Area, Based on the Energy Electrical Distribution…….………..307
Singgih Hartanto, Soegiono Soetomo, Broto Sunaryo, Wisnu Pradoto…………..………………..307 Analogy Based Software Project Effort Estimation Using Projects Clustering………………………………..320
M.Kowsalya, H.OormilaDevi, N.ShivaKumar…………………………………..…………………..320 SERVICE MANAGEMENT AND HUMAN RESOURCES MANAGEMENT OF EDUCATIONAL INSTITUTIONS IN JAKARTA, INDONESIA………………………………………………………………..326
Dr. Mustainah, M.Si……………………………………….……………………….......……………..326 Water Quality Assessment Of Wyitt and Environs, Part Of Jos-Bukuru Metropolis, North Central Nigeria.....333
Joyce Ayuba Ramadan……………………………………….…………………………………….....333 Research Challenges in Professional Communication……………………………………….………….……..344
Dr. Neeta Pandey……………………………………….……………………………………………..344 The Mediating effect of Employee engagement on Employee participation and Employee voice in selected manufacturing industries of Gwalior……………………………………….……………..…………..347
Dr. Garima Mathur, Abhijeet Singh Chauhan……………………………………….……………..347 The Determinants of Commercialization of Households Farmers Rice Tidal Land in Tanjung Jabung Timur District, Jambi Provincy……………………………………….…………………………………….…..357
Ira Wahyuni, Amruzi Minha, Andy Mulyana, Zulkifli Alamsyah………………………….……..357 Physico-Chemical Analysis of Drinking Water (in case of Mettu town, Southwest Ethiopia)…………… …..364
Bizualem Wakuma, Tolesa Fita……………………………………….……………………………...364 Increasing the Quality and Yield Attributes of Late Sown Forage Sorghum through Seed Priming of Different Growth Substances……………………………………….………………………………………..371
Muhammad ZeeshanMazher, Asif Iqbal, Wajid Saeed, Naveed Arsalan, Muhammad Usman Asghar, Qaiser, Babar Usman, Nadia Manzoor……………………………………..……..371
Evaluation of Saline Tolerant Wheat(Triticumaestivuml.) In F2segregating Populations……………………..378
Adeel Feroz, Zulfiqar Ali, Babar Usman,Wajid Saeed, Mohsin Niaz, Mudassir Abbas, Umair Khalid, Nadia Manzoor and Waseem Hassan……………………………….……………..378
Enhancement the Output Power from Solar Cell Using Lens……………………………………...…………..389
Khalid S.Shibib, Haneen D. Jabbar, Mohammed S. Hamza………………………...……………..389 The elements of popular culture in “The Great Gatsby”…………………………. ….………………………..401
Rima Subhi Taher………………………………………………...………….………………………..401

www.ijsrp.org
Factors Affecting Timely Completion of Public Construction Projects in Trans-Nzoia County…………..…..404 Silas Harun Murithi………………………………………………………….………………………..404
Ratio Estimators in two Stage Sampling Using Auxiliary Information………………………………………..459
A.K.P.C. Swain , S. S. Mishra……………………………………….………………………………..459 Medical Doctors’ Knowledge about Patients’ Ionizing Radiation Exposure Dose and Its Associated Risks at Jimma University Specialized Hospital, South West Ethiopia………………………………………..466
MesfinZewdu, Elias Kadir, MelkamuBerhane…………………………….………………………..466
International Journal of Scientific and Research Publications, Volume 7, Issue 4, April 2017 1 ISSN 2250-3153
www.ijsrp.org
Evaluation and Optimization of Hot Liming Process in
Kenana Sugar Factory, White Nile State, Sudan
Waleed Nour Eldien *, Elham H . M. Ali **
Ahmed. Sohily
**, Mortada Hamad E.A
**
* Chemical Engineering Department, Elimam Elmahdi University, Sudan, [email protected]
**Chemical Engineering Department, Elimam Elmahdi University, [email protected] **
Chemical Engineering Department, Elimam Elmahdi University, Sudan, [email protected] **
Chemical Engineering Department, Elimam Elmahdi University, Sudan, [email protected] **
Food Processing Engineering Department, Elimam Elmahdi University, Sudan, [email protected]
Abstract-The purification process is very important stage in sugar industries. The juice extracted from cane sugar is normally treated
by addition of milk of lime and heating. This treatment helps settling of the coagulate, fulgent, salt, gums, and fiber impurities. This
impurity affects to quality of juice and there chemical properties. After purification process the clear juice concentrated in evaporators
then to the crystallizers to produce sugar crystals. Then sugar crystals were separated from molasses and to color improvement unit.
.In this study the samples of lime juice were taken and heated to different temperature (75, 80, 85, 90, 95, 100) oC were analyzed
and determined the chemical properties which affected to quality of sugar production like: pH, polarization sugar , reducing sugar,
color, phosphate contains, turbidity and purity. Then the sedimentation rat at this different temperature by measuring the volumes of
settling material and the clear juice were calculated.
In output result, find that temperature which affected for this properties - turbidity change (37. 3 , 20 ,7), reducing sugar
(0.77, 0.72, 0.77) it is found that from the result the optimum temperatures for good quality is (90, 85oC). Then The study
recommended that used optimum concentration of milk of lime should be considered in liming and pre-liming processes.
Keywords: evaluation, optimization of hot liming process in sugar factory
I. INTRODUCTION
he liming station is one of the most important stations in the raw cane sugar factory. The importance of proper treatment of raw
cane juice with milk of lime must be kept in mind when a sugar factory is designed or modified. Addition milk of lime to the raw
cane juice is a chemical treatment for a small chemical treatment the correct procedure must be an accuracy followed.
Hydrated lime is essential to the production of sugar from both sugar cane and sugar beets .It is used to purify sugar from other
sources such as maple or sorghum although these are produced in much smaller quantities.
Sugar cane and sugar beets are harvested and processed with water to form raw juice which has low pH and contains emil
dissolved impurities.Hydrated lime is added to the juice to raise the pH and react with impurities to form insoluble calcium organic
compounds that can be removed Excess lime is removed by carbonation or addition of phosphoric acid . This process may be repeated
several times depending on the final product required.
Raw sugar cane juice is compassed of great number of organic and inorganic compounds, acids, salt, in vary amount. When it
comes from the mill tandem. the juice is an opaque liquid varying in color from greenish-gray to dark green, and it carries suspended
matter such as fine bagasses (bagacillo), gums, wax, albumin, coloring matter, particles of soil , clay and muck the normal raw cane
juice has pH 5.2-5.4 The wax and albumin make the raw juice rather viscous and it cannot be readily filtered but when cold liming
and heating cause many impurities to become coagulated and precipitated out.
At the same time the Acids are neutralized and any phosphates present are flocculated adsorbing a large amount of coloring
matter and other impurities. Usually the lime is added to the raw sugarcane juice in the form of milk preparing of lime for better
dispersion and quicker reaction. Preparing the milk of lime more advantageous to use already prepared hydrated lime rather than to
burn lime stone and slake.
The lime must be carefully selected it contain over 95% Ca (OH)2 and not more than 1% Mgo and almost free of iron,
aluminums oxides and sand. The lime should be finely ground and pass through a400 mesh.
Lime which meets these specification will actually be more economical to use than a cheaper grade of lime about 50 Bome' all
the lime will be in suspension and when dispersed in the raw can juice it will react much faster with acids and compounds in the sugar
juice [1].
There are three Objectives of this study, to treat the limed juice by heating for different temperature at constant pressure , to
carry out the properties of the clear juice after heating, (e.g.) polarization (pol%) , Brix (Bx%) , Reducing sugar(Rs), color , turbidity,
pH, and phosphate contents, and determine the sedimentation rate.
T

International Journal of Scientific and Research Publications, Volume 7, Issue 4, April 2017 2
ISSN 2250-3153
www.ijsrp.org
II. MATERIALS AND METHODS
The cane juice comes from the mills contains many soluble and insoluble impurities it is turbid and viscous in nature, and is not
fit to be worked for white sugar manufactory without suitable chemical treatment of it, it is necessary to remove the maximum
quantity of impurities from the expressed juice at the earlier stags to be obtained pure crystallize sugar.
The clarification of juice is done for two purposes that are: removal of impurities and bleaching effects
Removal of impurities
To precipitate dissolved inorganic non-sugar present in the juice in colloidal state there by to increase the percentage of
available or crystailizable sugar. To separate insoluble solid matters suspended in the juice in colloidal state rendering the juice opaque
viscous and dark in co lour. These impurities cannot be separated by simple filtration of the raw juice but are separated along with
non-sugar precipitated by the action of lime and heat. [2]
Bleaching effects After the impurities are removed by the chemical treatment of juice, bleaching is done to render the juice brilliant and light in
color this process is necessary for the manufacture of white sugar but is not of much importance for the raw sugar Sulphur dioxide is
the chief bleaching agent used in sugar house practice [3].
Methods of clarification process The nature of the chemical treatment of the juice is determined by two considerations:
- The quality of juice to be treated
- The quality of sugar to be produced (raw sugar , white consumption sugar , refined sugar)
Defecation process Three methods for the manufacture of raw sugar from cane these are classified as Simple defecation, compound defecation,
neutral defecation Action of lime on cane juice in the defecation process
- It eliminates free organic acids (oxalic, tartaric, etc)
- The following non sugars are insoluble albumen both soluble and insoluble forms acid phosphates as tribasic phosphates Colorings
substance anthocyanin (a small percentage) Nitrogenous compounds about 50-60% of the total Pectin a small percentage Gum (xylan)
none of the cane juice gums the purification is physical in nature and the precipitate formed readily entraps the suspended impurities
and brings them down. There is a small purity rise of 0.7 to 1.0 units due to removal of the non sugar and colloids in lesser proportion.
Simple defecation Lime and heat are only used in this process, methods commonly followed are classified according to manner lime and heat is
used. These are Liming in cold juice, liming hot juice, fractional liming with double heating, java method
Liming in cold juice (lime –heat method)
Milk of lime is added to the cold raw juice, as expressed from the mills in sufficient quantity so as to make the juice distinctly
alkaline. The pH of treated juice may go up to 8.0-8.4 the criterion to judge the optimum quantity of lime required should be form the
pH of clarified juice which should be about 7.2.The juice is then heated to101.1oC or higher and allowed to settle, the clear juice is
decanted of and muddy juice filtered The clear filtered juice is mixed with the clarified juice and concentrated in the multiple effect
evaporator. In the case of vacuum filter the cloudy juice is mixed with the raw juice.
With the growth of technical knowledge liming in hot juice and fractional liming with double heating has come into practice.
Liming in hot juice (heat-lime method)
This is modification of original system of liming in cold juice .The precipitate is more flocculent when lime is added in hot
juice and its settling qualities also improve.
Raw juice is first heated to (75-80oC) and milk of lime is added to it in sufficient quantity to raise its pH between 7.8 and 8.0, so
as to give to the clarified juice final pH between 6.8 and 7.2 .The lime juice again heated to its boiling point as before 101.1oC
(minimum) and allowed to settle. The drop in pH between the hot limed juice and the clarified juice in this case is less when comp red
with drop in case of original cold liming method this is due to the fact that by heating raw juice alone, certain colloids coagulate
without the addition of lime [4]. made experiments in java and showed that heating juices alone to 80oC caused the precipitate of 1.4
grams of organic matter per liter of juice.
Fractional liming with double heating This process is intended to treat refractory juices when ordinary liming becomes in efficient. In this system lime is added in
two fractions and the juice is heated twice:
- Lime is added first in raw juice at ordinary temperature and a pH between 6.2 and 6.6 is maintained.
- Heat the partially limed juice to 71.1-79.4oC
- Add second dose of lime and pH between 7.6 and 8.2 (maximum) is maintained.
- Heat again to a temperature between 101.7oC and 104.4
oC.
- Allow the juice to settle.
Advantages:
This procedure has the superiority over cold liming system in the following way.
- Settling is rapid.
- Scum formation is less.
- The clarified juice is much more brilliant.
International Journal of Scientific and Research Publications, Volume 7, Issue 4, April 2017 3
ISSN 2250-3153
www.ijsrp.org
- The mud filters better, giving dry and porous cakes.
- The nitrogenous colloid are separated to a much greater extent, about 80% instead of 50%
- Waxes are eliminated in much greater proportion, about 90% instead of 70% in the case of cold –liming method.
The following materials which were used in this study were collected from Kenana Sugar Factory (K.S.F) used Sugar cane lime
juice. And determined the properties which affected to the quality of produce sugar according to (ICUMSA ) [5]. International
commission uniform methods of sugar analysis and South African Sugar Technologist’s Association methods were used [6].to
determined the properties which affected to the quality of sugar like : polarization sugar (poll), Reducing sugar (RS). Turbidity, color
phosphate contents, Brix, pH and determined the sedimentation rate. Then output results of optimum properties at various
temperatures.
III. RESULT AND DISCUSSION
The following tables shows the result of clear juice samples after added 2ml separn at different temperatures:
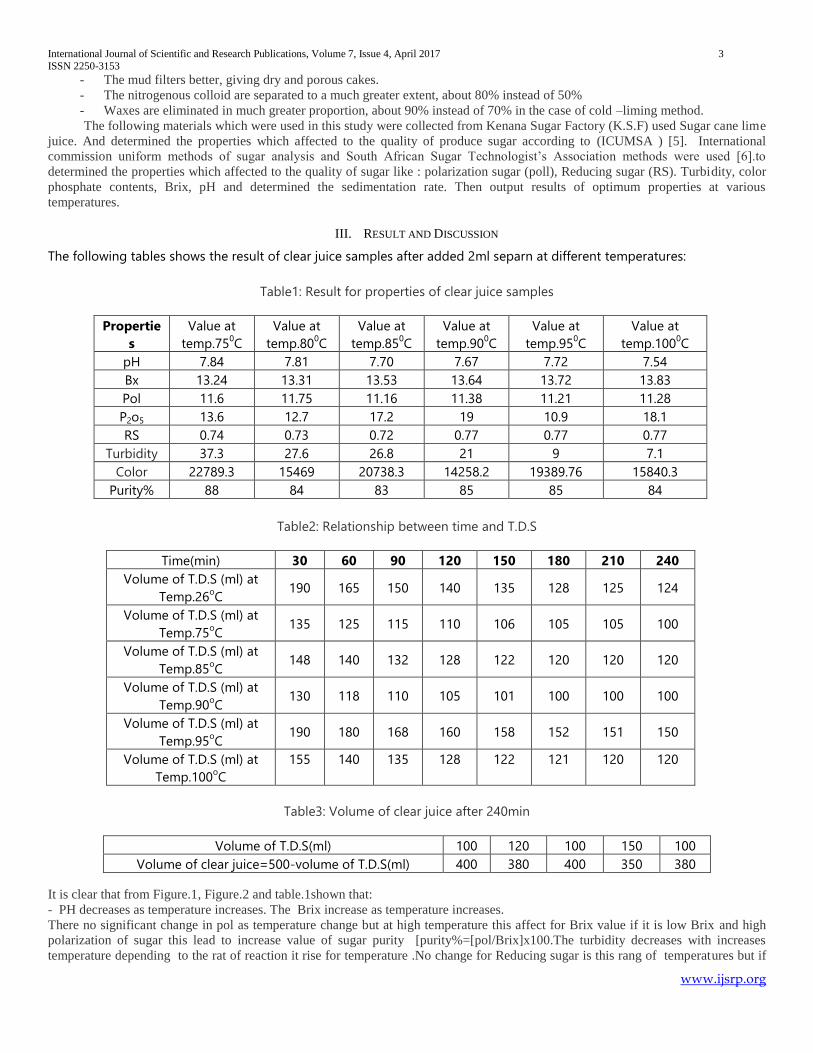
Table1: Result for properties of clear juice samples
Propertie
s
Value at
temp.750C
Value at
temp.800C
Value at
temp.850C
Value at
temp.900C
Value at
temp.950C
Value at
temp.1000C
pH 7.84 7.81 7.70 7.67 7.72 7.54
Bx 13.24 13.31 13.53 13.64 13.72 13.83
Pol 11.6 11.75 11.16 11.38 11.21 11.28
P2o5 13.6 12.7 17.2 19 10.9 18.1
RS 0.74 0.73 0.72 0.77 0.77 0.77
Turbidity 37.3 27.6 26.8 21 9 7.1
Color 22789.3 15469 20738.3 14258.2 19389.76 15840.3
Purity% 88 84 83 85 85 84
Table2: Relationship between time and T.D.S
Time(min) 30 60 90 120 150 180 210 240
Volume of T.D.S (ml) at
Temp.26oC
190 165 150 140 135 128 125 124
Volume of T.D.S (ml) at
Temp.75oC
135 125 115 110 106 105 105 100
Volume of T.D.S (ml) at
Temp.85oC
148 140 132 128 122 120 120 120
Volume of T.D.S (ml) at
Temp.90oC
130 118 110 105 101 100 100 100
Volume of T.D.S (ml) at
Temp.95oC
190 180 168 160 158 152 151 150
Volume of T.D.S (ml) at
Temp.100oC
155 140 135 128 122 121 120 120
Table3: Volume of clear juice after 240min
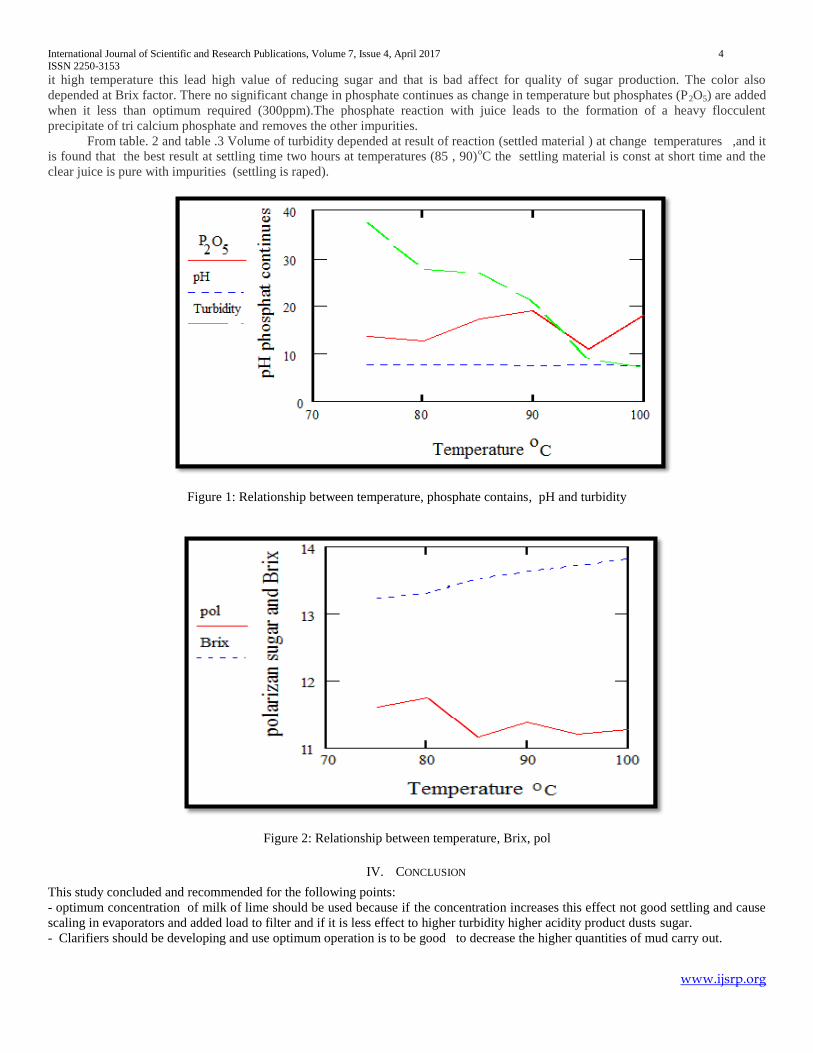
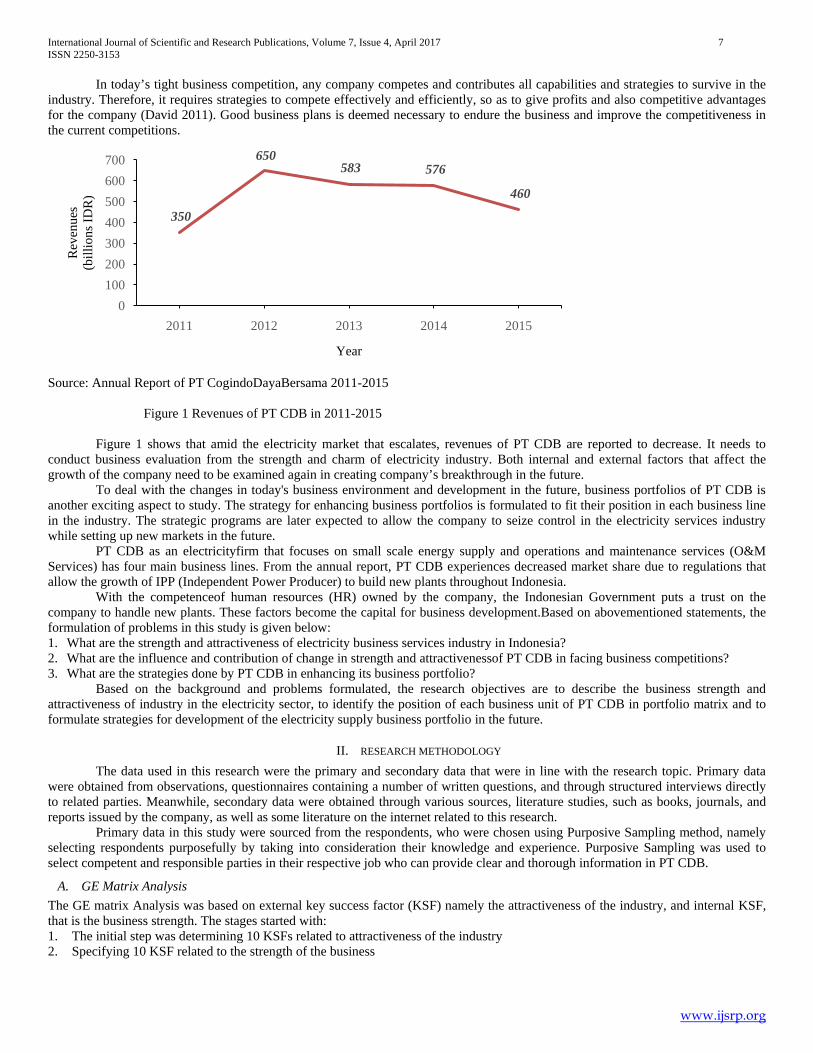
It is clear that from Figure.1, Figure.2 and table.1shown that:
- PH decreases as temperature increases. The Brix increase as temperature increases.
There no significant change in pol as temperature change but at high temperature this affect for Brix value if it is low Brix and high
polarization of sugar this lead to increase value of sugar purity [purity%=[pol/Brix]x100.The turbidity decreases with increases
temperature depending to the rat of reaction it rise for temperature .No change for Reducing sugar is this rang of temperatures but if
Volume of T.D.S(ml) 100 120 100 150 100
Volume of clear juice=500-volume of T.D.S(ml) 400 380 400 350 380
International Journal of Scientific and Research Publications, Volume 7, Issue 4, April 2017 4
ISSN 2250-3153
www.ijsrp.org
it high temperature this lead high value of reducing sugar and that is bad affect for quality of sugar production. The color also
depended at Brix factor. There no significant change in phosphate continues as change in temperature but phosphates (P2O5) are added
when it less than optimum required (300ppm).The phosphate reaction with juice leads to the formation of a heavy flocculent
precipitate of tri calcium phosphate and removes the other impurities.
From table. 2 and table .3 Volume of turbidity depended at result of reaction (settled material ) at change temperatures ,and it
is found that the best result at settling time two hours at temperatures (85 , 90)oC the settling material is const at short time and the
clear juice is pure with impurities (settling is raped).
Figure 1: Relationship between temperature, phosphate contains, pH and turbidity
Figure 2: Relationship between temperature, Brix, pol
IV. CONCLUSION
This study concluded and recommended for the following points:
- optimum concentration of milk of lime should be used because if the concentration increases this effect not good settling and cause
scaling in evaporators and added load to filter and if it is less effect to higher turbidity higher acidity product dusts sugar.
- Clarifiers should be developing and use optimum operation is to be good to decrease the higher quantities of mud carry out.

International Journal of Scientific and Research Publications, Volume 7, Issue 4, April 2017 5
ISSN 2250-3153
www.ijsrp.org
- More refined sugar will give more income so purification should be considered before recycle the filtrate to pre lime instead of lime
juice tank these decrease the quantities of lime added and acidity
ACKNOWLEDGMENT
The authors wish to thank Chemical Engineering Department Elimam Elmahdi University, for their help and support during the period
for the work from which the paper is generated. and Thanks are also due to the staff, technicians, and labors of KenanaSugar Factory,
for their co-operation, for their help and support during the period for the work from which the paper is generated.
REFERENCES
[1] BaCkow,V.E. ''Manufacture and Refining of raw cane sugar'', Second edition, Elsevier publishing Co, Amsterdam,(1982)
[2] E.Hugot (ibid), ''cane sugar Technology" Elsevier publishing Co, Amsterdam ,(1972) ,p.402 [3] Noel Deerr,''can sugar", Elsevier publishing Co, Amsterdam: p. (267). [4] p.Honig. ''Technology of sugar'', (1953) part 1, p.(598). [5] International commission uniform methods of sugar analysis to, (2005). [6] Horne
’s dry lead method (South African Sugar Technologist
’s Association (1985).

International Journal of Scientific and Research Publications, Volume 7, Issue 4, April 2017 6 ISSN 2250-3153
www.ijsrp.org
Development Strategies For Electricity Business Portfolio At PT Cogindo Daya Bersama
Mulyadi*, Musa Hubeis**, Setiadi Djohar**
* Post Graduate, School of Business, Bogor Agricultural University (IPB), Indonesia ** Lecturer, School of Business, Bogor Agricultural University (IPB), Indonesia
Abstract- PT Cogindo Daya Bersama (CDB) was established with the aim of holding a commercial business in power supply generation and other related fields. The company has a market share up to 24.5%, making it the second largest company in operation and maintenance (O&M) services of power plants in Indonesia. The electricity market is currently growing, yet the revenues of PT CDB tend to decrease in the last 4 years. The purpose of this research is to determine the development future strategies of portfolio of business lines at PT CDB.
Based on the mapping results of the GE matrix, the current portfolio of business lines of PT CDB are mostly on cell “selective” or “average business”. On the future conditions, four business lines will be on the cell“investment and growth”or considered as “winner”. In such condition, the company seeks dominance, increase growth, perform penetration, market/product developmentand maximize investment.
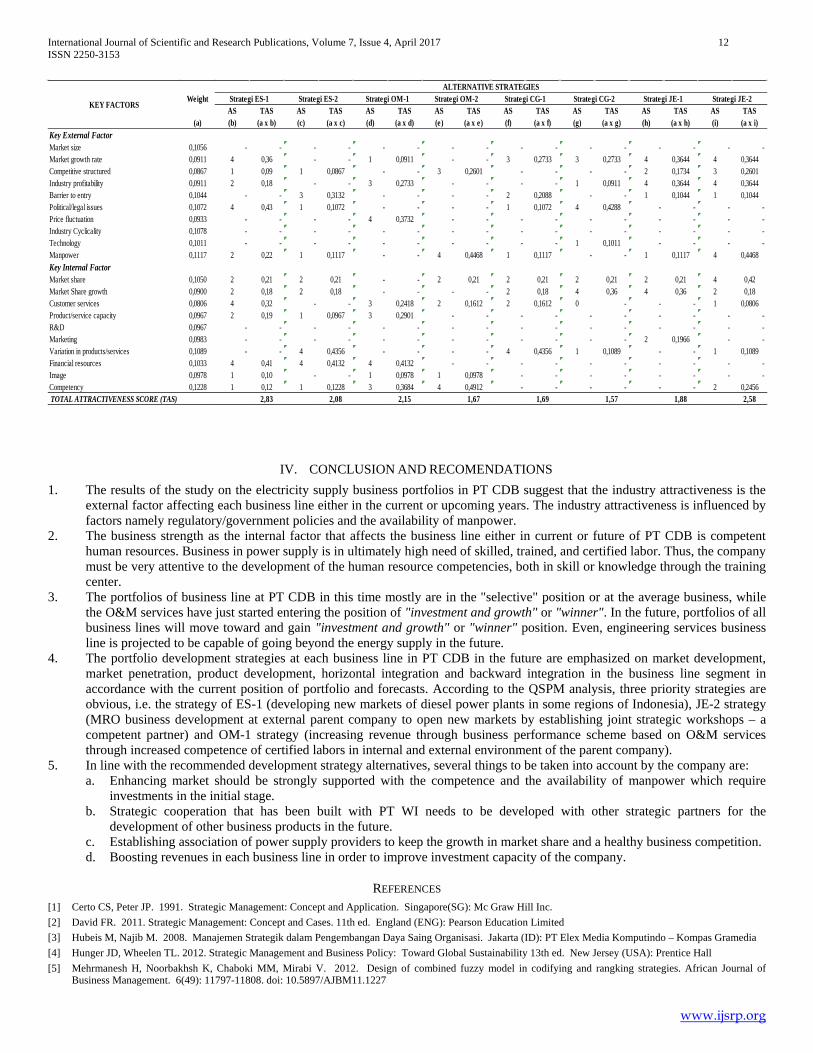
The study found there were three priority development strategies of business portfolio which take precedence based on the analysis of Quantitative Strategic Planning Matrix (QSPM) and the calculation of the Total Attractiveness Score (TAS), namely ES-1 strategy with TAS score = 2,83, JE-2 strategy with TAS score = 2,58 and OM-1 strategy with TAS score = 2,15. Index Terms- portfolio business, General Electric Matrix, Analysis Quantitative Strategic Planning Matrix (QSPM)
I. INTRODUCTION he growth of national electricity demand based on Electricity Supply Business Plan (RUPTL) 2015 – 2024 is estimated at 8.7%. The increasing demands of electricity have triggered to the birth of new electricity providers, along with the enactment of Act No.
30 in 2009 on Electricity. The Act stipulates that the State-owned Electricity Company (PLN) is not the onlypower supply company and monopolizes the electricity industry. PT CDB which has been set up since 15 April 1998 is a subsidiary of PT Indonesia Power (IP) that was established to run a commercial business in the electric power generation and other related fields. The company has a core competency in the operation and maintenance (O&M) services of power plants that supports the provision of power assets to generating operators of PT IP and manages power plants with a capacity of under 50 megawatts (MW) across Indonesia. Table 1 Market Share of Operation and Maintenance (O&M) Services of Power Plants in Indonesia No. Company Name Capacity of Managed
Power Plants (MW)
Market Share
(%) 1 PT. PJB Services (PJBS) 5.632 28,5% 2 PT. Cogindo Daya Bersama (CDB) 4.853 24,5% 3 PT. Tanjung Jati B Power Services 1.320 6,7% 4 PT. Sumberdaya Sewatama 1.300 6,6% 5 PT. Jawa Power (JP) 1.300 6,6% 6 PT. Sumber Segara Primadaya (S2P) 1.260 6,4% 7 PT. Paiton Energy Company (PEC) 1.230 6,2% 8 Others )a 2.875 14,5%
aOther private electricity companies with capacity below 200 megawatt Sources : Report of Ministry of Energy and Mineral Resources (ESDM) Dirjen LPE
Table 1 shows that the market share of PT CDB reaches 24.5%. The closest competitor is PT PJB Services with 28.5% market share of total plants. The more intense construction of new plants by the Government in the fast track program of 10,000 MW and 35,000 MW by the private sector has yielded an increase in the need for assets operators.
T
International Journal of Scientific and Research Publications, Volume 7, Issue 4, April 2017 7 ISSN 2250-3153
www.ijsrp.org
In today’s tight business competition, any company competes and contributes all capabilities and strategies to survive in the industry. Therefore, it requires strategies to compete effectively and efficiently, so as to give profits and also competitive advantages for the company (David 2011). Good business plans is deemed necessary to endure the business and improve the competitiveness in the current competitions.
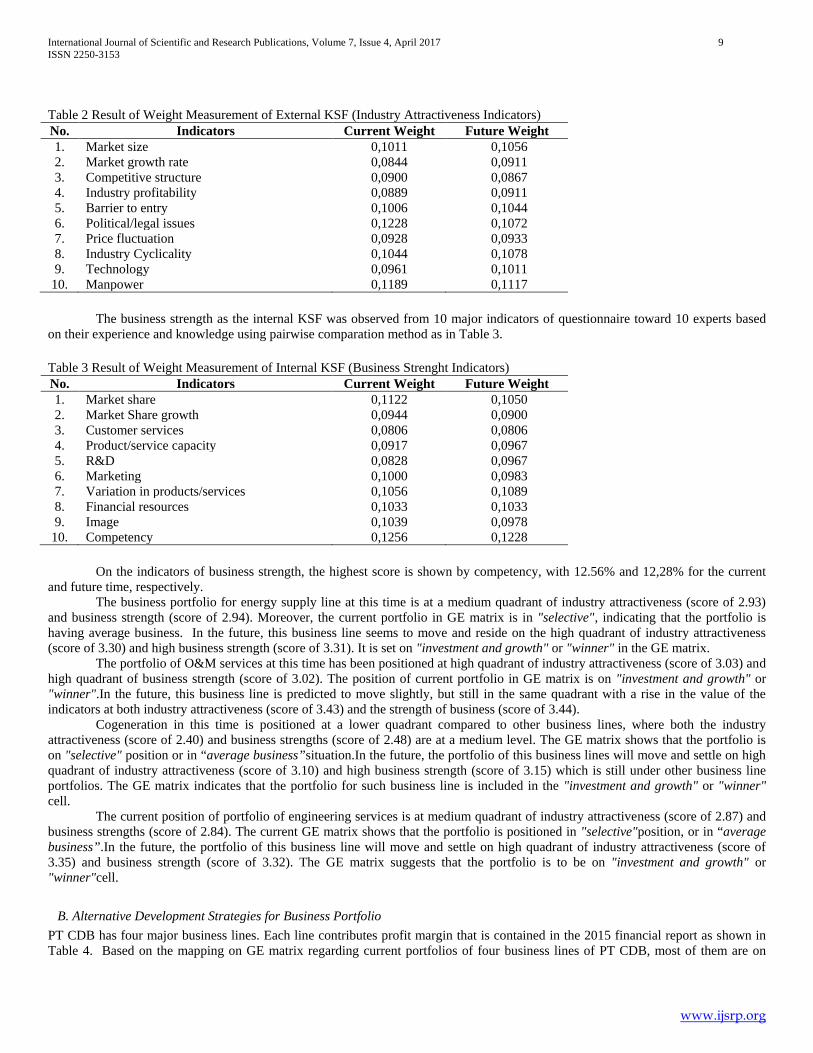
Source: Annual Report of PT CogindoDayaBersama 2011-2015 Figure 1 Revenues of PT CDB in 2011-2015
Figure 1 shows that amid the electricity market that escalates, revenues of PT CDB are reported to decrease. It needs to
conduct business evaluation from the strength and charm of electricity industry. Both internal and external factors that affect the growth of the company need to be examined again in creating company’s breakthrough in the future.
To deal with the changes in today's business environment and development in the future, business portfolios of PT CDB is another exciting aspect to study. The strategy for enhancing business portfolios is formulated to fit their position in each business line in the industry. The strategic programs are later expected to allow the company to seize control in the electricity services industry while setting up new markets in the future.
PT CDB as an electricityfirm that focuses on small scale energy supply and operations and maintenance services (O&M Services) has four main business lines. From the annual report, PT CDB experiences decreased market share due to regulations that allow the growth of IPP (Independent Power Producer) to build new plants throughout Indonesia.
With the competenceof human resources (HR) owned by the company, the Indonesian Government puts a trust on the company to handle new plants. These factors become the capital for business development.Based on abovementioned statements, the formulation of problems in this study is given below: 1. What are the strength and attractiveness of electricity business services industry in Indonesia? 2. What are the influence and contribution of change in strength and attractivenessof PT CDB in facing business competitions? 3. What are the strategies done by PT CDB in enhancing its business portfolio?
Based on the background and problems formulated, the research objectives are to describe the business strength and attractiveness of industry in the electricity sector, to identify the position of each business unit of PT CDB in portfolio matrix and to formulate strategies for development of the electricity supply business portfolio in the future.
II. RESEARCH METHODOLOGY The data used in this research were the primary and secondary data that were in line with the research topic. Primary data
were obtained from observations, questionnaires containing a number of written questions, and through structured interviews directly to related parties. Meanwhile, secondary data were obtained through various sources, literature studies, such as books, journals, and reports issued by the company, as well as some literature on the internet related to this research.
Primary data in this study were sourced from the respondents, who were chosen using Purposive Sampling method, namely selecting respondents purposefully by taking into consideration their knowledge and experience. Purposive Sampling was used to select competent and responsible parties in their respective job who can provide clear and thorough information in PT CDB.
A. GE Matrix Analysis The GE matrix Analysis was based on external key success factor (KSF) namely the attractiveness of the industry, and internal KSF, that is the business strength. The stages started with: 1. The initial step was determining 10 KSFs related to attractiveness of the industry 2. Specifying 10 KSF related to the strength of the business
350
650 583 576
460
0100200300400500600700
2011 2012 2013 2014 2015
Rev
enue
s (b
illio
ns ID
R)
Year

International Journal of Scientific and Research Publications, Volume 7, Issue 4, April 2017 8 ISSN 2250-3153
www.ijsrp.org
3. Scoring was done based on questionnaire on each factor of attractiveness and strength through pairwise comparison, and the scales were ranging from 1, 2 to 3 with the following provisions: a. Score 1= If the horizontal indicator is less important than the vertical indicator b. Score 2 = If the horizontal indicator is equally important that the vertical indicator c. Score 3 = If the horizontal indicator is more important than the vertical indicator
4. Each score of the variables from the questionnaires was calculated with the following formula:
𝑎𝑎𝑖𝑖 = ∑ 𝑋𝑋𝑖𝑖𝑛𝑛𝑖𝑖n
Where : 𝑎𝑎𝑖𝑖 = score of indicator to-i ∑ 𝑋𝑋𝑖𝑖𝑛𝑛
𝑖𝑖 = number of value of Xi up to Xn N = number of responden
5. Determination of ranking/rating was based on questionnaires on each of the major business lines with indicators mentioned in the
previous stage according to the current and the future conditions. The scores used were: a. Score 1 = Very small/very low/very slow/very unsupportive/very bad/very little b. Score 2 = Small/medium/low/no support/bad/enough c. Score 3 = High/big/fast/supportive/good/much d. Score 4 = Very large/very high/very fast/very supportive/very good/very much
6. The average ranking/rating obtained from the questionnaire was measured to determine the scores of the indicators. The formula is given below:
𝑏𝑏𝑖𝑖 = ∑ 𝑋𝑋𝑖𝑖𝑛𝑛𝑖𝑖n
Where : 𝑏𝑏𝑖𝑖 = value ranking/rating of the indicator to-i ∑ 𝑋𝑋𝑖𝑖𝑛𝑛
𝑖𝑖 = number of value of Xi up to Xn n = number of responden
B. Analysis of Quantitative Strategic Planning Matrix Determination of ranking/rating has been carried out to evaluate various alternative strategies objectively, based on critical external and internal success factors that have been previously identified in the GE matrix. The main factors were taken from industry attractiveness and business strength that were weighted on the analysis in Phase 1, along with deciding alternatives strategies to improve business portfolios in the future including rationale alternative strategies based on Phase 2. Stages of QSPM analysis which have been done are:
1. Compiling a list of critical success factors from both external and internal sides which include industry attractiveness (external) and business strength (internal)
2. Giving score to each external and internal factors appropriately according to the future 3. Identifying a range of alternative strategies to consider the priority strategies applied by the company 4. Specifying Attractiveness Score (AS) through questionnaire given to some experts. The scores of AS are described below:
a. Score 1 = No attractiveness b. Score 2 = Low attractiveness c. Score 3 = Moderate attractiveness d. Score 4 = High attractiveness e. Score "-"= No influence on the chosen strategies
5. Calculating the total attractiveness score (TAS) which is defined as the time between the scores and attractiveness score in each line.
III. RESULTS AND DISCUSSIONS
A. Business Portfolio Analysis In the analysis of industry attractiveness as an external KSF, there were10 major indicators of questionnaire given to 10 expert respondents based on experience and knowledge with the pairwise comparation method. The scores of the indicatorsare shown in Table 2.
On the indicators of industry attractiveness, the highest score for current time is regulatory/government policy by 12,28%. For the near future, the highest score is on the availability of manpower, which is 11.17%.
International Journal of Scientific and Research Publications, Volume 7, Issue 4, April 2017 9 ISSN 2250-3153
www.ijsrp.org
Table 2 Result of Weight Measurement of External KSF (Industry Attractiveness Indicators) No. Indicators Current Weight Future Weight 1. Market size 0,1011 0,1056 2. Market growth rate 0,0844 0,0911 3. Competitive structure 0,0900 0,0867 4. Industry profitability 0,0889 0,0911 5. Barrier to entry 0,1006 0,1044 6. Political/legal issues 0,1228 0,1072 7. Price fluctuation 0,0928 0,0933 8. Industry Cyclicality 0,1044 0,1078 9. Technology 0,0961 0,1011
10. Manpower 0,1189 0,1117
The business strength as the internal KSF was observed from 10 major indicators of questionnaire toward 10 experts based on their experience and knowledge using pairwise comparation method as in Table 3. Table 3 Result of Weight Measurement of Internal KSF (Business Strenght Indicators) No. Indicators Current Weight Future Weight 1. Market share 0,1122 0,1050 2. Market Share growth 0,0944 0,0900 3. Customer services 0,0806 0,0806 4. Product/service capacity 0,0917 0,0967 5. R&D 0,0828 0,0967 6. Marketing 0,1000 0,0983 7. Variation in products/services 0,1056 0,1089 8. Financial resources 0,1033 0,1033 9. Image 0,1039 0,0978
10. Competency 0,1256 0,1228
On the indicators of business strength, the highest score is shown by competency, with 12.56% and 12,28% for the current and future time, respectively.
The business portfolio for energy supply line at this time is at a medium quadrant of industry attractiveness (score of 2.93) and business strength (score of 2.94). Moreover, the current portfolio in GE matrix is in "selective", indicating that the portfolio is having average business. In the future, this business line seems to move and reside on the high quadrant of industry attractiveness (score of 3.30) and high business strength (score of 3.31). It is set on "investment and growth" or "winner" in the GE matrix.
The portfolio of O&M services at this time has been positioned at high quadrant of industry attractiveness (score of 3.03) and high quadrant of business strength (score of 3.02). The position of current portfolio in GE matrix is on "investment and growth" or "winner".In the future, this business line is predicted to move slightly, but still in the same quadrant with a rise in the value of the indicators at both industry attractiveness (score of 3.43) and the strength of business (score of 3.44).
Cogeneration in this time is positioned at a lower quadrant compared to other business lines, where both the industry attractiveness (score of 2.40) and business strengths (score of 2.48) are at a medium level. The GE matrix shows that the portfolio is on "selective" position or in “average business”situation.In the future, the portfolio of this business lines will move and settle on high quadrant of industry attractiveness (score of 3.10) and high business strength (score of 3.15) which is still under other business line portfolios. The GE matrix indicates that the portfolio for such business line is included in the "investment and growth" or "winner" cell.
The current position of portfolio of engineering services is at medium quadrant of industry attractiveness (score of 2.87) and business strengths (score of 2.84). The current GE matrix shows that the portfolio is positioned in "selective"position, or in “average business”.In the future, the portfolio of this business line will move and settle on high quadrant of industry attractiveness (score of 3.35) and business strength (score of 3.32). The GE matrix suggests that the portfolio is to be on "investment and growth" or "winner"cell.
B. Alternative Development Strategies for Business Portfolio PT CDB has four major business lines. Each line contributes profit margin that is contained in the 2015 financial report as shown in Table 4. Based on the mapping on GE matrix regarding current portfolios of four business lines of PT CDB, most of them are on

International Journal of Scientific and Research Publications, Volume 7, Issue 4, April 2017 10 ISSN 2250-3153
www.ijsrp.org
"selective" or average business position. Such position could not clearly give clue to the growth of the lines, whether they would be improved or not.
Table 4 Profit Marginof Four Business Lines of PT Cogindo Daya Bersama
No. Description of Business Lines
Revenues (Million IDR)
Cost (Million IDR)
Profit Margin (Million IDR)
Percentage (%)
1. Energy Supply 97.259 74.205 23.054 26,87 2. O&M Services 272.545 218.299 54.247 63,22 3. Cogeneration 62.824 61.142 1.682 1,96 4. Engineering services 27.041 20.222 6.819 7,95
Source: Financial Report 2015 of PT CDB
Figure 2ThePosition of the Business Line Portfolios in the Current
Meanwhile, the future prediction from the GE matrix denotes that those lines are on the “investment and growth” cell or
winner. The four business lines tend to move forward from the current position, even engineering services can go beyond the energy supply. On "investment and growth" cell or the “winner”, the company will seek dominance, growth as well as perform penetration and market/product development to maximize investment.
Daya Tarik Industri
Keku
atan
Bis
nis
1234
3
2
1
Lini Bisnis Energy Supply
Lini Bisnis Jasa O&M
Lini Bisnis Coogeneration
Lini Bisnis Jasa Engineering
International Journal of Scientific and Research Publications, Volume 7, Issue 4, April 2017 11 ISSN 2250-3153
www.ijsrp.org
Figure 3 The Position of the Business Line Portfolios in the Future
After studying the position of the business lines for the current and the future, and also considering factors such as industry attractiveness and business strength, the researcher suggests alternative development strategies in PT CDB as listed in Table 5.
Table 5 Alternative Development Strategies for Portfolio ofBusiness Lines at PT CDB
Business Line Alternative Strategies First Second
Energy Supply Market development to Gas Diesel Power Plants (PLTDG) in some parts of Indonesia (ES-1 strategy).
Cooperating with strategic partners through horizontal integration in developing Engineering, Procurement and Construction (EPC) for plants having capacity of 30-50 MW (ES-2 strategy).
O&M Services Enhancing revenues through product development with performance base business scheme in O&M services by increasing competency of certified manpower in both internal and external environment of the parent company (OM-1 strategy)
Strengthening employee engagement through the three factors of leadership, better and conducive career and renumeration to improve the availability of manpower and market share of O&M services (market penetration) in the future (OM-2 strategy).
Cogeneration Performing market development of coogeneration business on segments limited to airport, hospitality, and mountaintourism areas in cooperation with strategic partners (CG-1 strategy)
Carrying out product development of coogeneration business in the environmentally friendly renewable energy such as solar cell, geothermal, biomass and mini hydro (CG-2 strategy).
Engineering Services
Building strategic partnership in the stockiest with backward integration for meeting the needs of PLTDG as well as steam power generation (PLTU) (JE-1 strategy)
Conducting business development of MRO (maintenance, repair and overhaul) on the external aspects of parent company to market development by building joint workshop with competent and strategic partners (JE-2 strategy).
C. Determining Alternative Priority Strategies Using QSPM Analysis From theaforementioned alternative strategies to four business lines of PT CDB, some priority alternative strategies are determined. The QSPM analysis have yielded the most interesting and priority strategies to apply with regard to the limited allocation of resources. Based on external and internal critical success factors including industry attractiveness (external) and business strength (internal) Attactiveness Score (AS) is calculated through questionnaire given to a number of experts. The results of the Total Attractiveness Score (TAS), which is the time between the scores and score of AS, is given in Table 6.
Table 6Result of the Total Attractiveness Score (TAS) for Prioritizing Strategies With QSPM
Daya Tarik Industri
Keku
atan
Bis
nis
1234
3
2
1
Lini Bisnis Energy Supply
Lini Bisnis Jasa O&M
Lini Bisnis Coogeneration
Lini Bisnis Jasa Engineering
International Journal of Scientific and Research Publications, Volume 7, Issue 4, April 2017 12 ISSN 2250-3153
www.ijsrp.org
IV. CONCLUSION AND RECOMENDATIONS 1. The results of the study on the electricity supply business portfolios in PT CDB suggest that the industry attractiveness is the
external factor affecting each business line either in the current or upcoming years. The industry attractiveness is influenced by factors namely regulatory/government policies and the availability of manpower.
2. The business strength as the internal factor that affects the business line either in current or future of PT CDB is competent human resources. Business in power supply is in ultimately high need of skilled, trained, and certified labor. Thus, the company must be very attentive to the development of the human resource competencies, both in skill or knowledge through the training center.
3. The portfolios of business line at PT CDB in this time mostly are in the "selective" position or at the average business, while the O&M services have just started entering the position of "investment and growth" or "winner". In the future, portfolios of all business lines will move toward and gain "investment and growth" or "winner" position. Even, engineering services business line is projected to be capable of going beyond the energy supply in the future.
4. The portfolio development strategies at each business line in PT CDB in the future are emphasized on market development, market penetration, product development, horizontal integration and backward integration in the business line segment in accordance with the current position of portfolio and forecasts. According to the QSPM analysis, three priority strategies are obvious, i.e. the strategy of ES-1 (developing new markets of diesel power plants in some regions of Indonesia), JE-2 strategy (MRO business development at external parent company to open new markets by establishing joint strategic workshops – a competent partner) and OM-1 strategy (increasing revenue through business performance scheme based on O&M services through increased competence of certified labors in internal and external environment of the parent company).
5. In line with the recommended development strategy alternatives, several things to be taken into account by the company are: a. Enhancing market should be strongly supported with the competence and the availability of manpower which require
investments in the initial stage. b. Strategic cooperation that has been built with PT WI needs to be developed with other strategic partners for the
development of other business products in the future. c. Establishing association of power supply providers to keep the growth in market share and a healthy business competition. d. Boosting revenues in each business line in order to improve investment capacity of the company.
REFERENCES [1] Certo CS, Peter JP. 1991. Strategic Management: Concept and Application. Singapore(SG): Mc Graw Hill Inc. [2] David FR. 2011. Strategic Management: Concept and Cases. 11th ed. England (ENG): Pearson Education Limited [3] Hubeis M, Najib M. 2008. Manajemen Strategik dalam Pengembangan Daya Saing Organisasi. Jakarta (ID): PT Elex Media Komputindo – Kompas Gramedia [4] Hunger JD, Wheelen TL. 2012. Strategic Management and Business Policy: Toward Global Sustainability 13th ed. New Jersey (USA): Prentice Hall [5] Mehrmanesh H, Noorbakhsh K, Chaboki MM, Mirabi V. 2012. Design of combined fuzzy model in codifying and rangking strategies. African Journal of
Business Management. 6(49): 11797-11808. doi: 10.5897/AJBM11.1227
AS TAS AS TAS AS TAS AS TAS AS TAS AS TAS AS TAS AS TAS(a) (b) (a x b) (c) (a x c) (d) (a x d) (e) (a x e) (f) (a x f) (g) (a x g) (h) (a x h) (i) (a x i)
Key External FactorMarket size 0,1056 - - - - - - - - - - - - - - - - Market growth rate 0,0911 4 0,36 - - 1 0,0911 - - 3 0,2733 3 0,2733 4 0,3644 4 0,3644Competitive structured 0,0867 1 0,09 1 0,0867 - - 3 0,2601 - - - - 2 0,1734 3 0,2601Industry profitability 0,0911 2 0,18 - - 3 0,2733 - - - - 1 0,0911 4 0,3644 4 0,3644Barrier to entry 0,1044 - - 3 0,3132 - - - - 2 0,2088 - - 1 0,1044 1 0,1044Political/legal issues 0,1072 4 0,43 1 0,1072 - - - - 1 0,1072 4 0,4288 - - - - Price fluctuation 0,0933 - - - - 4 0,3732 - - - - - - - - - - Industry Cyclicality 0,1078 - - - - - - - - - - - - - - - - Technology 0,1011 - - - - - - - - - - 1 0,1011 - - - - Manpower 0,1117 2 0,22 1 0,1117 - - 4 0,4468 1 0,1117 - - 1 0,1117 4 0,4468Key Internal FactorMarket share 0,1050 2 0,21 2 0,21 - - 2 0,21 2 0,21 2 0,21 2 0,21 4 0,42Market Share growth 0,0900 2 0,18 2 0,18 - - - - 2 0,18 4 0,36 4 0,36 2 0,18Customer services 0,0806 4 0,32 - - 3 0,2418 2 0,1612 2 0,1612 0 - - - 1 0,0806Product/service capacity 0,0967 2 0,19 1 0,0967 3 0,2901 - - - - - - - - - - R&D 0,0967 - - - - - - - - - - - - - - - - Marketing 0,0983 - - - - - - - - - - - - 2 0,1966 - - Variation in products/services 0,1089 - - 4 0,4356 - - - - 4 0,4356 1 0,1089 - - 1 0,1089Financial resources 0,1033 4 0,41 4 0,4132 4 0,4132 - - - - - - - - - - Image 0,0978 1 0,10 - - 1 0,0978 1 0,0978 - - - - - - - - Competency 0,1228 1 0,12 1 0,1228 3 0,3684 4 0,4912 - - - - - - 2 0,2456TOTAL ATTRACTIVENESS SCORE (TAS) 2,83 2,08 2,15 1,67 1,69 1,57 1,88 2,58
Strategi JE-2KEY FACTORS
WeightALTERNATIVE STRATEGIES
Strategi ES-1 Strategi ES-2 Strategi OM-1 Strategi OM-2 Strategi CG-1 Strategi CG-2 Strategi JE-1

International Journal of Scientific and Research Publications, Volume 7, Issue 4, April 2017 13 ISSN 2250-3153
www.ijsrp.org
[6] Mintzberg H, Lampel J, Quinn JB, Ghosal S. 2003. The Strategy Process – Concepts, Contexts, Cases. New Jersey (USA): Prentice Hall. [7] Mirzakhani M, Parsaamal E, Golzar A. 2014. Strategy Formulation with SWOT Matrix: A Case Study of an Iranian Company. Global Business and
Management Research: An International Journal. 6(2): 150-168. [8] Ommani AR. 2011. Strenght , weaknesses, opportunities and threats (SWOT) analysis for farming system businesses management: Case of wheat farmers of
Shadervan Distrik, Shoushtar Township, Iran. African Journal of Business Management. 5(22): 9448-9454. [9] Rea P, Kerxner H. 1997. Strategic Planning: A Practical Guide. New York (USA): Van Nostrand Reinhold. [10] Robins JA, Wiersema MF. 2003. The Measurement of Corporate Portofolio Strategy: Analysis of Content Validity of Related Diversification Indexes. Strategic
Management Journal. 24(1): 39-59. doi: 10.1002/smj.282 [11] Setyowati R. 2004. Analisis Portofolio Bisnis PT (Persero) Pelabuhan Indonesia II [Tesis]. Bogor (ID): Manajemen Bisnis Institut Pertanian Bogor. [12] Silitonga P. 2006. Analisis Strategik Portofolio Komoditi PT Perkebunan Nusantara III [Tesis]. Bogor (ID): Manajemen Bisnis Institut Pertanian Bogor. [13] Srivastava R, Prakash A. (2011). Growth-Share Matrix as a Tool for Portfolio Planning: Evidence From the Indian Telecommunication Services Industry. The
IUP Journal of Business Strategy. 8(2): 22-23. [14] Sumarwan U, Daryanto A, Achsani NA, Fahmi I, Nuryartono N, Suhendi, Samputra LS, Sijabat FDV, Tobing A, Kristiadi A et al. 2014. Metode Riset Bisnis
dan Konsumen. Bogor (ID): PT Penerbit IPB Press. [15] Yumartono. 2003. Strategi Portofolio Bisnis PT (Persero) Indosat [Tesis]. Bogor (ID): Manajemen Bisnis Institut Pertanian Bogor.
AUTHORS First Author – Mulyadi, Post Graduate, School of Business, Bogor Agricultural University (IPB), Email: [email protected] Second Author – Prof. Dr. Ir. Musa Hubeis, MS, Dipl. Ing, DEA, School of Business, Bogor Agricultural University (IPB) Third Author – Ir. Setiadi Djohar, MSM, DBA, School of Business, Bogor Agricultural University (IPB) Correspondence Author – Mulyadi,[email protected], +6281511300051

International Journal of Scientific and Research Publications, Volume 7, Issue 4, April 2017 14 ISSN 2250-3153
www.ijsrp.org
Radius, Diameter and Center of a Directed Fuzzy Graph Using Algorithm
Dr.K.UMA
Assistant Professor of Mathematics, Poompuhar College, Melaiyur, Nagapattinam District Abstract- In this paper, the length of an edge sequence is said to be the number of edges contained in the edge sequence. The length of a fuzzy chain is the number of edges that makes up the fuzzy chain. The distance between vertex i and vertex j is sij, which is defined as the length of the smallest fuzzy chain between vi and vj. The concept of radius and diameter are associated with connected fuzzy graph. The radius of a fuzzy graph is defined as the set of maximum values selected from each row of the distance matrix is in a sense a measure of the closeness of a fuzzy graph. The diameter of a graph is the greatest distance that can be found in the fuzzy graph. To determine the diameter, select the maximum value from each row in the distance matrix. The largest of these numbers is the diameter. Index Terms- Connected Directed fuzzy graph, Vertex strings, Radius, Diameter.
I. INTRODUCTION uzzy set is one of the branches of modern mathematics having experienced a most impressive development in recent
years. The notion of fuzzy sets was introduced by L.A. Zadeh in 1965. It involves the concept of a membership function defined on a universal set. The value of the membership function lies in [0,1].Using the concept of fuzzy subsets, the concept of fuzzy graph was introduced by A. Rosenfeld in 1975. We present a taxonomy of fuzzy graphs that treats fuzziness in vertex existence, edge existence, edge connectivity, and edge weight. Within that framework, we formulate some standard graph-theoretic problems (Radius, Diameter and centre) for fuzzy graphs using a unified approach distinguished by its uniform application of guiding principles such as the construction of membership grades via the ranking of fuzzy numbers, the preservation of membership grade normalization, and the “collapsing” of fuzzy sets of graphs into fuzzy graphs. In the case of directed fuzzy graphs, the terms radius , center and diameter are defined in an analogous manner but apply only to strongly connected fuzzy graphs. To find radius , diameter and center of a problem from a specified source node to the other nodes appears in several applications. The works developed to find radius , diameter and center of a problem have been initiated in the contribution of my paper. Finally, we provide algorithmic solutions to these problems, with examples.
II. DEFINITION Definition 2.1: A fuzzy graph G=(X,F) is a pair of functions F :V →[0,1] and X:V X V→[0,1], where for all u,v єV, such that X(u,v) ≤ min{F (u), F(v)}. Definition 2.2: A directed fuzzy graph is said to be strongly connected fuzzy graph if there is at least one directed fuzzy path from every vertex to every other vertex. Definition 2.3: The radius of a fuzzy graph is defined as the minimum of the row distances, (i.e) the minimax distance of the fuzzy graph. Definition: 2.4: The center is defined as the point in a connected fuzzy graph which has the minimal separation. It need not always be a single point.
III. ALGORITHM TO FIND RADIUS OF DIRECTED FUZZY GRAPH
Let A be the adjacency matrix of a directed fuzzy graph, Sd be the shortest distance of directed fuzzy graph and S the distance matrix with elements sij . Initially let all sij be undefined. Step 1 For all i and j, if aij > 0, then for i≠j, s ij=1 and sij=0 for all i. If any element of S is not defined go to step 2. Otherwise go to step 7. Step 2 Define a nxn matrix [M]1 from the fuzzy graph using the following
a) If there is an arc from vertex vi to vertex vj (i.e) aij > 0, i≠j, put vij in the (i , j) location in the matrix.
b) Put 0 elsewhere. c) The non-zero entries are called strings.
Step 3 Define a nxn matrix {N}1 .{N}k is obtained from {M}k by deleting the first vertex in each non zero entry of {M}k . Step 4 {M}k●{N}m ={M}k+m
a) zero multiplied by anything equals zero. b) strong multiplication concatenates the vertex strings. Example : v1v2 ● v5v6 = v1v2 v5v6 and v1v2 ● v1v6 = 0. c) Any string that has a vertex more than once equals zero. Step 5 Find [M]1 .Define k =1. Step 6
F
International Journal of Scientific and Research Publications, Volume 7, Issue 4, April 2017 15 ISSN 2250-3153
www.ijsrp.org
a) Using step 2 and step 3 , find [M]k+1 from [M]k. b) For every sij that is not defined and the (i,j) element of
[M]k+1 is non zero , define sij =k+1 c) If, for all i and j, sij is defined , then go to step 7.
Otherwise, increase k by 1 return to step 6a. Step 7 Radius = min𝑖𝑖 max𝑗𝑗 𝑠𝑠𝑖𝑖𝑗𝑗 , Diameter= max𝑖𝑖 max𝑗𝑗 𝑠𝑠𝑖𝑖𝑗𝑗 . Vertex vk is center with k such that radius = max𝑗𝑗 𝑠𝑠𝑘𝑘𝑗𝑗 .
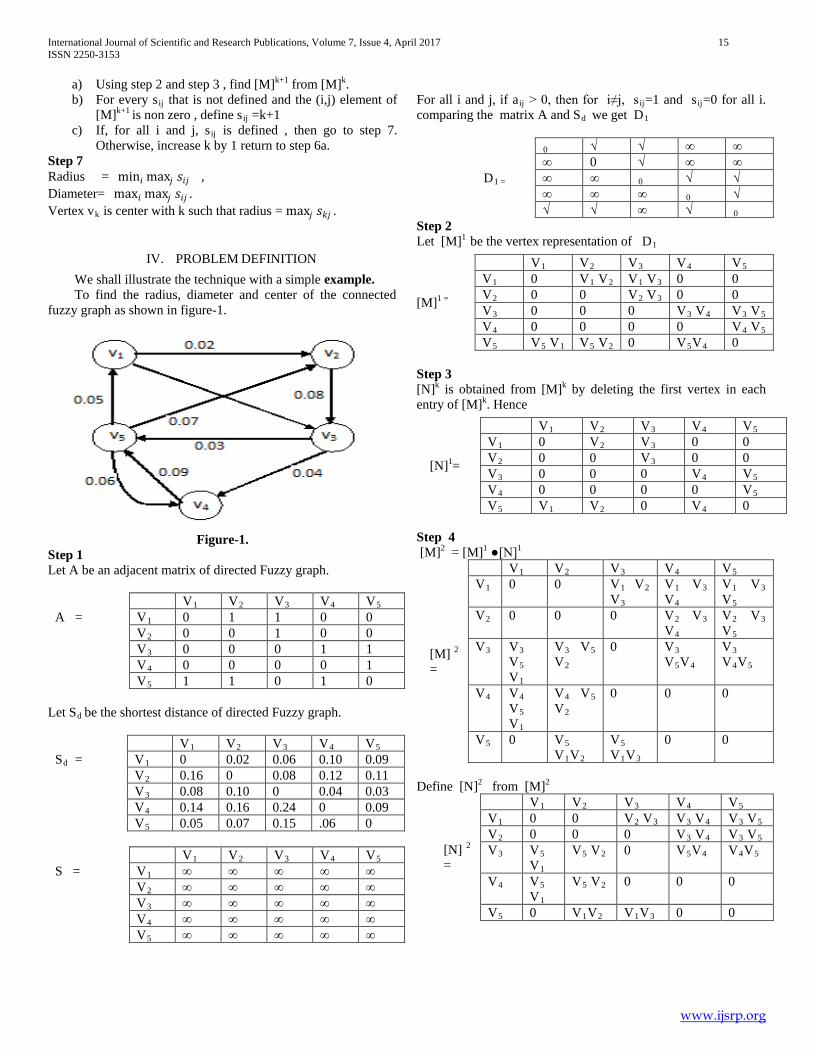
IV. PROBLEM DEFINITION We shall illustrate the technique with a simple example. To find the radius, diameter and center of the connected fuzzy graph as shown in figure-1.
Figure-1.
Step 1 Let A be an adjacent matrix of directed Fuzzy graph.
V1 V2 V3 V4 V5 A = V1 0 1 1 0 0 V2 0 0 1 0 0 V3 0 0 0 1 1 V4 0 0 0 0 1 V5 1 1 0 1 0
Let Sd be the shortest distance of directed Fuzzy graph.
V1 V2 V3 V4 V5 Sd = V1 0 0.02 0.06 0.10 0.09 V2 0.16 0 0.08 0.12 0.11 V3 0.08 0.10 0 0.04 0.03 V4 0.14 0.16 0.24 0 0.09 V5 0.05 0.07 0.15 .06 0
V1 V2 V3 V4 V5 S = V1 ∞ ∞ ∞ ∞ ∞ V2 ∞ ∞ ∞ ∞ ∞ V3 ∞ ∞ ∞ ∞ ∞ V4 ∞ ∞ ∞ ∞ ∞ V5 ∞ ∞ ∞ ∞ ∞
For all i and j, if aij > 0, then for i≠j, s ij=1 and sij=0 for all i. comparing the matrix A and Sd we get D1
D1 =
0 √ √ ∞ ∞ ∞ 0 √ ∞ ∞ ∞ ∞ 0 √ √ ∞ ∞ ∞ 0 √ √ √ ∞ √ 0
Step 2 Let [M]1 be the vertex representation of D1
Step 3 [N]k is obtained from [M]k by deleting the first vertex in each entry of [M]k. Hence
Step 4 [M]2 = [M]1 ●[N]1
[M] 2 =
V1 V2 V3 V4 V5 V1 0 0 V1 V2
V3 V1 V3 V4
V1 V3 V5
V2 0 0 0 V2 V3 V4
V2 V3 V5
V3 V3 V5 V1
V3 V5 V2
0 V3 V5V4
V3 V4V5
V4 V4 V5 V1
V4 V5 V2
0 0 0
V5 0 V5 V1V2
V5 V1V3
0 0
Define [N]2 from [M]2
[N] 2 =
V1 V2 V3 V4 V5 V1 0 0 V2 V3 V3 V4 V3 V5 V2 0 0 0 V3 V4 V3 V5 V3 V5
V1 V5 V2 0 V5V4 V4V5
V4 V5 V1
V5 V2 0 0 0
V5 0 V1V2 V1V3 0 0
[M]1 =
V1 V2 V3 V4 V5 V1 0 V1 V2 V1 V3 0 0 V2 0 0 V2 V3 0 0 V3 0 0 0 V3 V4 V3 V5 V4 0 0 0 0 V4 V5 V5 V5 V1 V5 V2 0 V5V4 0
[N]1=
V1 V2 V3 V4 V5 V1 0 V2 V3 0 0 V2 0 0 V3 0 0 V3 0 0 0 V4 V5 V4 0 0 0 0 V5 V5 V1 V2 0 V4 0

International Journal of Scientific and Research Publications, Volume 7, Issue 4, April 2017 16 ISSN 2250-3153
www.ijsrp.org
Similarly proceeding we get the value of [M]3 and [M]4 .
[M] 4 =
V1 V2 V3 V4 V5 V1 0 V1 V3 V4 V5 V2 0 V1 V2 V3 V5 V4 V1 V2 V3 V4 V5 V2 V2 V3 V4 V5 V1 0 0 0 0 V3 0 V3 V4 V5 V1 V2 0 0 0 V4 0 0 V4 V5V1 V2 V3 0 0 V5 0 0 0 V5V1V2 V3 V4 0
Step 5 Find [M]1 for k=1 (using step 2).
Step 5a Repeat step 2,3,and 4 as in algorithm procedure , we get s14, s15, s24, s25, s31, s32, s41, s42, s43 all equal to √√ . k=2 the results of these steps are shown in D2.
Similarly proceeding we get s21 and s43 equal to √√√. It is shown in D3
Go to step 7.Observing the values in the column marked maximum of sij in D3, we find that Radius = 𝑚𝑚𝑖𝑖𝑚𝑚𝑖𝑖
𝑚𝑚𝑚𝑚𝑚𝑚 𝑗𝑗 sij =2
Diameter =3 Center =v1, v3 and v5.
V. CONCLUSION The radius of fuzzy directed graph is 2 and diameter is 3. The recursive procedure described here was carried out for different directed fuzzy graphs. This same procedure is often utilized for undirected fuzzy graphs which leads to a solution. It is useful for solving several different types of network problems.
REFERENCES [1] L.S. Bershtein,Т.А. Dziouba(2000). Allocation of maximal bipartite part
from fuzzy graph. In Proceedings of European Symposium on Intelligent Techniques ESIT’2000, pages 45-47, full version on CD, Aachen,Germany,2000.
[2] G. Frank, I. Frish (1978). Networks, connection and flows. Moscow, translation from English.
[3] G.Nirmala & K.Uma- Flows in Fuzzy Graphs with Gains - For Exchanging Commodities, Aryabhatta Journal of Mathematics and Informatics Vol.4, No., July-Dec,2012.
[4] G.Nirmala & K.Uma - Fuzzy Spanning Tree flow Equivalent Algorithm, International Journal of Scientific and Research publication, Volume.2, Issue-6, June-2012.
[5] G.Nirmala & K.Uma - Fuzzy Shortest Algorithm for Telephone Line Connection, International Journal of Scientific and Research publication, Volume.2, Issue-8, August-2012.
[6] G.Nirmala & K.Uma -Fuzzy P-Median Tree Search Algorithm, Proceedings of International Conference on Algebra and its Applications, Pages 299-311, 2011
[7] G.Nirmala & K.Uma - Fuzzy Graph – Estimations of Strongest Weight, The Periyar Maniammai university Journal of Humanities and sciences, Vol-3, No.1, Jan-June-2012.
[8] G.Nirmala & K.Uma - Maximal Bipartite Fuzzy Graph Algorithm, Narosa publication, 2010.
[9] H.J.Zimmermann (1991).Fuzzy Set Theory and Its Applications (2nd edition). Boston/Dordrecht/London, Kluwer Academic Publishers.
[10] Berge C., 1989, Hypergraphs, Amsterdam, North-Holland. [11] Bershtein L.S.,Dziouba T.A.,1998,Construction of the optimal bipartite
part in the fuzzy graph, Proceedings of IT&SE.98,Yalta, Ukraine. [12] Dubois, D., Prade H., 1980, Fuzzy Sets and Systems: Theory and
Applications, Academic Press, London.
AUTHORS First Author – Dr.K.UMA, M.Sc., M.Phil., Ph.D, Assistant Professor of Mathematics, Poompuhar College, Melaiyur, Nagapattinam District-609107 – [email protected]
[M]1 =
0 √ √ 0 0 0 0 √ 0 0 0 0 0 √ √ 0 0 0 0 √ √ √ 0 √ 0
D2 =
0 √ √ √√ √√ ∞ 0 √ √√ √√ √√ √√ 0 √ √ √√ √√ ∞ 0 √ √ √ √√ √ 0
D3 =
0 √ √ √√ √√ √√√ 0 √ √√ √√ √√ √√ 0 √ √ √√ √√ √√√ 0 √ √ √ √√ √ 0
International Journal of Scientific and Research Publications, Volume 7, Issue 4, April 2017 17 ISSN 2250-3153
www.ijsrp.org
Research Proposal: The Veddas’, the Indigenous people of Sri Lanka, attitude on cultural heritage identification
after relocation from their forest homeland Abstract- Sri Lanka's indigenous people, the Veddas (forest-dwellers), have inhabited Sri Lanka's monsoon dry forest for at least 16,000 years and probably much longer. Hunting and gathering was their main means of living. Accordingly their foods were meat, birds, eggs, honey, fish, fruit, and vegetables. After independent from British government, many development projects were implemented by the Sri Lankan government. The accelerated Mahaweli river development project which was the largest development program ever in Sri Lankan history, was commenced in 1977. As the Accelerated Mahaweli Development Project evolved, the old “Veddas’ Country" was segmented into “systems” labelled with alphabetic designations: so called system A,B and C, and colonized with indigenous Vedda population and ordinary people who wish to settle down from rest of the country. The plan called for the last portion of tropical forest inhabited by the indigenous people of Sri Lanka to become colonies and Wildlife Reserve catchments area. Approximately five thousand three hundred men, women, and children were forced to resettle into three different systems. For the past 30 years these displaced group of Veddas have struggled to live in these colonies. Their cultural heritage was influenced by the neighbouring cultures. The original occupants of the country are suffering a cultural decline. Many traditions are rapidly vanishing. The rituals to the gods and spirits, the great and important annual ceremonies, have become rare. The rock arts, bow and arrow, traditional costumes are no longer visible The proposed research is to study their thoughts and understandings about their present cultural heritage identification, and then to understand any differences about their thoughts due to forced colonization. The research result is helpful for anybody to refer before considering any diversion of the natural flow of indigenous people’s life in the world, in case. Index Terms- Vedda, Indigenous people, Indigenous culture, forest-dwelling, Relocation of Indigenous people
I. INTRODUCTION ri Lanka's indigenous people, the Veddas (forest-dwellers), have inhabited Sri Lanka's semi-evergreen monsoon dry
forest for at least 16,000 years and probably much longer. Even though the Veddas were the first people in Sri Lanka, they have never controlled the country since the Indian immigrants were settled in Sri Lanka about 2500 years ago. In fact, the early immigrants were of the opinion that the forest-dwelling Veddas were not human beings but wild jungle spirits who were human in outward guise only. Such negative attitudes towards the island’s indigenous people persist up to the present day; make them to be categorized as backward, deceivable, illiterate and
uncivilized people whose point of view may be conveniently ignored. These categorizations lead to ignore the recognition of these native people’s self-respect, dignity, human rights and cultural heritage. The Veddas are proud of their distinct heritage and call themselves “Vannialettho” which means “those of the forest”. The term “Vedda” was donated by the Sinhalese neighbors. The word “Vedda” comes from the Sanskrit language “Vyadda” which means the hunter with bow and arrow. The pure Veddas, unlike the Sinhalese who speak Indo-Aryan language and claim Aryan decent, are related to the Austro – Asiatic people found scattered today in many part of southern Asia. These include the aboriginal tribes of Chota Nagpur in eastern India such as the Hos and Birhos, the Sakai of Malaysia, the Kubu of Indonesia and the Australian Aborigines. (Deraniyagala 1992:392). The Veddas live in Eastern province located east of the central mountain massif in Sri Lanka. The towns closest to the Vedda settlements are Maha Oya to the east and Mahiyangana to the west. Along the Maha Oya road twenty kilometers from Mahiyangana, is the village of Dambana. The landscape of Vedda country is green, crossed by ever flowing rivers and streams and through reservoirs and water tanks. Out of the 20 million people of Sri Lanka, there are approximately 5000 indigenous people remains. Hunting and gathering was their main means of living. Accordingly their foods were meat, birds, eggs, honey, fish, fruit, and vegetables. Role of gathering practices by Vedda women contributed more to the family's daily food supply than men’s’ hunting practices. Many hunting and gathering peoples practice some form of agriculture called chena cultivation to supplement the foods collected in the wild. In chena cultivation, they clear small plots of land from the forest, cultivate them by hand for one or two years. After this period they keep abandoned those lands for longer period. This system of agriculture is well suited to the coexistence of man and the forest. Abandoned After independent from British government, many development projects were implemented by the Sri Lankan government. Between 1951 and 1955, Sri Lanka instituted the Gal Oya project which drastically affected the Vedda in the eastern region. Gal Oya is a river which flows from hilly area in the middle of the country to the eastern sea through Veddas’ habitat. The project built the country's largest reservoir at Inginiyagala and inundated some of the Veddas’ best hunting and food gathering areas along with several of their favorite cave dwellings. The government wanted to resettle those Veddas into colonies, but, the Veddas chose to survive by retreating further into the forest. (Dharmadasa 1990:36). The accelerated Mahaweli development project which was the largest development program ever in Sri Lankan history, was commenced in 1977. This plan provided that the longest
S

International Journal of Scientific and Research Publications, Volume 7, Issue 4, April 2017 18 ISSN 2250-3153
www.ijsrp.org
river in the country, the 335 km. long Mahaweli River, would be developed, channeled, and diverted into tunnels to produce electricity, then guided to reservoirs and canals for artificial irrigation. About 640,000 acres of formerly "undeveloped" land would be opened for cultivation. The project would provide new agricultural lands and homesteads for 140,000 families (Keuneman 1983: 64). The plan called for the last portion of tropical forest inhabited by the indigenous people of Sri Lanka to become colonies and Wildlife Reserve catchments area. As the Accelerated Mahaweli Development Project evolved, the old “Veddas’ Country" was segmented into “systems” labeled with alphabetic designations. The northern half of the forest belonged to System B (north of the river Maduru Oya) and the south-western half to System C. The trees were logged, and the hunting grounds and traditional honey bee sites were leveled by bulldozers. The Veddas Country underwent dramatic change into vast areas of rice-paddy cultivation, towns, villages, highways, and infrastructure. Thousands of people were resettled into the area. Eleven thousand hectares of hunting ground were inundated. The government plan was also to establish a system of national parks stretching from borders of these new colonies towards the eastern beaches. This would form a chain of islets of natural sanctuaries. On November 9, 1983, the home-land of the Veddas measuring approximately 51468 hectares was designated as the Maduru Oya National Park administered by the Mahaweli Environmental Authority. (Dharmadasa 1990:50 ). Barriers, guards, and outposts were stationed along the borders. No one could enter the park without a written permission from the Wildlife Department located in the capital, Colombo, on the other side of the country. Most Veddas cannot read and write. From one day to the next their ancient livelihood became criminal in the eyes of the law. Yesterday's hunters and gatherers are today's poachers. Since they were not allowed to carry out the only subsistence they knew they finally went to the government for help. They learned that they could no longer collect food as in the past. The forest-dwellers must abide by the government's plan to cut the trees, blast through the mountains, and dig ditches in their hunting grounds. They were told they could never again return to their traditional life in the forest. The waters of the rivers were diverted for rice paddies, and their hunting grounds now were reserved for wildlife. Thus it was that the majority of the last nine hundred Veddas families who still remained in the forest have finally been evicted. Approximately five thousand three hundred men, women, and children were forced to resettle into three different districts, splitting up their community and destroying the highly-integrated social structure on which the Veddas traditionally depend. These resettlement areas are situated outside the forest, in rice-growing areas totally unfamiliar to the Veddas and unsuitable for their traditional small scale agriculture. The forest beings are now considered trespassers in their own forest. (Obeysekara 1990:26). A smaller number of Vedda families, which the government authorities missed to identify or uncounted due to practical reasons were living in virtual forests. The original occupants of the country are suffering a cultural decline. Many traditions are rapidly vanishing. The rituals to the gods and spirits, the great and important annual ceremonies, have become rare. The rock arts, bow and arrow, traditional costumes
are no longer visible. Indeed, these are precisely the elements of their cultural heritage that the Veddas are most anxious to preserve for future generations. For the past 25 years these displaced group of Veddas have struggled to live in these colonies. Their cultural heritage was influenced by the neighboring cultures. Today only a few remaining Veddas still manage to preserve their cultural identity despite relentless pressure from the surrounding dominant communities. The proposed research is to study their thoughts and understandings about their present cultural heritage identification, and then to understand any differences about their thoughts due to forced colonization. The research result is helpful for any body to refer before considering diverting the natural flow of indigenous people’s life in the world, in case.
II. LITERATURE REVIEW Many scholars have done studies on original Vedda people who still live in jungles and follow hunter – gather life style. But there is only a few studies conducted on this colonized group of Veddas. Most of these published and unpublished research articles and reports are required to be studied to examine others views on this subject. Furthermore, there are government official policies of Sri Lanka introduced on indigenous people so far since the country’s independence. These policies need to be studied and reassessed to see whether these were correctly implemented in working with indigenous people. Further it will be discussed how these policies influence on cultural heritage identification of these people. Wiveca Stegeborn, an indigenous anthropologist at the Department of the social Anthropology at the University of Tromsoe in Norway, has done a series of researches on original Veddas and the colonized Veddas. She has lived with the Veddas since 1977, is the only outsider who speaks Vedda’s language. She has devoted her life to their cause. In a paper published by her on the topic “Indigenous People, Nature Conservation and Human Rights – A Case study of Veddas of Sri Lanka”, she made a lengthy discussion on all sociological aspects of the colonized Veddas ( Stegeborn Wiveca 1997:18). But she has mentioned little about what these people think of their cultural heritage after colonization. A review on this article will help to have a good understanding on the social background of the colonized Veddas There is another paper written by Lund Ragnhild on the topic. "Geographies of Eviction, Expulsion and Marginalization: Stories and Coping Capacities of the Veddas, Sri Lanka" to the Norwegian Journal of Geography. This paper identifies why the Veddas have been exposed to forced relocation and marginalization at various historical junctures. Their history is a dramatic story of eviction and marginalization. The key concepts of marginalization and eviction are discussed in relation to an analytical model illustrating how external and internal factors, collective capabilities and individual characteristics interact on people's coping capacity. Veddas in two villages have given accounts of their understanding of the situation. He conclude that the dicline of the Vedda’s thoughts on their cultural heritage is due to ignorance and the unwillingness of the Sri Lankan government

International Journal of Scientific and Research Publications, Volume 7, Issue 4, April 2017 19 ISSN 2250-3153
www.ijsrp.org
to secure an enabling environment that would improve the handling capacity of its indigenous population .This paper will help to review the history of Vedda colonization in Sri Lanka . Professor K.N.O. Dharmadasa, has done a major research on forest dwelling Veddas in Sri Lanka. In his book “The Vanishing Aborigines” (1990), there are many details on the cultural heritage for forest dwelling Veddas. The following researches, articles and papers are also worth referring during a research.
- Colonial Histories and Vedda Primitivism by Professor Gananath Obeysekara (1990)
- Pre history of Sri Lanka by Deraniyagala S.U (1985) - Memories of the Archaeological Survey of Ceylon by
Hocart A.M (1924) - Insight Guides, Sri Lanka & Hong Kong by Keuneman
Herbert and Anderson.G(1983). In addition to the research reports, the following documentations made by this Vedda group, will be examined to find any reference to the cultural heritage aspects.
- Any complains to the Government - Any complains to the NGOs - Any complains to the media and other sources.
III. AIM AND OBJECTIVES With the start of accelerated Mahaweli development project, about 900 Vedda families were relocated in two colonies closer to the forest. Each family was issued two hector yards of land and a house: a piece of land was for rise and vegetable cultivation. The former hunter and gathers have now become rise cultivators and vegetarians. The old forest dwelling Veddas talk about their cultural heritage proudly and respectfully. Their traditional ritual practices, folk songs, stories, dances, cults and beliefs, clothing, rock arts, weapons, are some of the identifications which are considered as their cultural heritage. From generation to generation, elders transfer the knowledge on cultural heritage to their youngsters. When discussing the cultural heritage identification of these colonized Veddas, three major age groups in this society can be focused on. First age group is who were born in these colonies: that is the group of age bellow 30 years. The second group is the people from 30 to 60 years old, who spend approximately half of their lives in the forest and rest in the colony. The final group contains the people above 60 years old who spent larger part of their life in the forest. As mentioned above, living enviorenment influences their cultural heritage, it can be expected some differences of thoughts and identifications on cultural heritage in these colonized Vedda groups. The aim of this research is to identify these deviations and differences in cultural heritage identification of this society due to this colonization. The results can be compared with the cultural heritage identity of forest dwelling Veddas. Many researches have already been done on cultural heritage identification of forest Veddas.
IV. METHODOLOGY The proposed research method is “Focus Group” concept. Due to following reasons it is accepted that this research method will be the most effective methodology in the research.
- The previous researches on this colonized vedda society have proved that focus group method was generating qualitative data on the basis of group interaction and discussion
- As they speak different language it is required to have a service of an interpreter. It is not practicable to have this service for a long period of time: so the research needs to be completed within a short period of time.
- The problems and difficulties in their new life style are always subjected to discussions in group environment whenever they get together. So having group discussions instead of individual interviews will create more realistic results.
It is expected to select three groups for this focus group research. Each group will include the volunteers and may contain 5-10 people. Volunteers will be selected to minimize the risk of fault and fabricated answering. The first group will be between the ages 20-30, so that the entire participants who were born in this colony will be allocated to a group. They have no experience in forest life. The majority is expected to be modernized and mixed with neighboring cultures. At least some of them must have exposed to the modern civil society, and can speak Sinhalese language other than their traditional Vedda language. So researcher can directly talk to them with a minimum service of an interpreter. The second age group is from 30 to 60 years. The majority of the participant in this group must have lived half of their lives in forest and the rest in this colony. Unlike the first group, this second group should have good understanding on the forest Vedda’s cultural heritage. It is expected that an enough number of participants can be found as volunteers. The government records and previous researches by scholars have shown that the majority of the population in these colonies belongs to this age group. For the better response during this focus group discussion it is required to have a service of an interpreter. The aged people above 60 years will be included in the third focus group. This group has lived more than a half of their life as forest Veddas. Most of them would be the leaders who have led their protest against forced colonization. It can be believed that their feelings on the Vedda’s cultural heritage are more likely as forest Veddas . In this Vedda community, they have formed an action committee who organize their protest to the government against their forced relocation. This committee talks to the government agent of this province, and other non-government organizations. Once a month, there is a meeting between this committee and the government officials. It is required to inform the government agents of these areas regarding the research details, by which researcher can be introduced to the Veddas’ action committee. During the focus group discussions, it is required to audio record the discussion and take short notes of their answers and there body language and behaviors, ensuring all the participants are given the opportunity to voice their comments. At the end of the

International Journal of Scientific and Research Publications, Volume 7, Issue 4, April 2017 20 ISSN 2250-3153
www.ijsrp.org
focus group discussion a summary of the discussion can be noted down on the spot.
V. DATA ANALYSIS Tape – based analysis will be more suitable to this research data analysis, as the participants speak different language. In addition to the translations done by the interpreter during the discussions, a second translation of the audio tapes will be done with the help of another translator to minimize the errors during translation. This translation will be noted down for data analysis. Finally all these audio tapes, translations, field notes and summaries are required to be examined to prepare the results of the research The major topics identified by each group as their cultural heritage will be separated and listed down. The reasons forwarded for their identifications are also noted by the side of the list. All the information will be categorised and sorted into following topics for each group.
- Major ideas forwarded by a group as their cultural heritage
- Reasons for these identifications - Minor ideas on their cultural heritage - What they heard as their elders cultural heritage - What are the things a group does and does not like to
hear as cultural heritage - What are topics a group does and does not want to
continue as cultural heritage to the next generation
VI. ETHICAL ISSUES Before starting of the focus group research it is needed to obtain the written approval from the Ministry of Environment and cultural affairs, Sri Lanka.. Any local law enforcing authorities and village headmen are also be informed to avoid any unforeseen situations. When selecting participants, It is required to ensure that full information about the purpose of the research, role of participants, and use of collected data, are given to the participants and their action committee.
REFERENCES [1] Deraniyagala S, U (1992) Pre history of Sri Lanka , An Ecological
Perspective. Department of Archaeological Survey, Government of Sri Lanka.
[2] Dharmadasa, K. N.O and S. Samarasinghe (eds.) (1990). The Vanishing Aborigines. International Center for Ethnic Studies (ICES). Sri Lanka Studies Series: 2. New Delhi: ICES in association with NORAD and Vikas Publishing House PVT Ltd. India
[3] Gananath Obeysekara (1990) Colonial Histories and Vedda Primitivism: An Unorthodox Reading of Kandy Period Texts Kandy, Sri Lanka
[4] Geiger, W (1960) Mahavamsa the Great Cronical of Ceylon , Department of Cultural Affairs ,Colombo,Sri Lanka.
[5] Hocart, A.M (1924) Memories of the Archaeological Survey of Ceylon , Department of Archaeology ,Colombo, Sri Lanka.
[6] Keuneman, Herbert and G. Anderson (eds.): (1983) Insight Guides, Sri Lanka & Hong Kong. Apa Productions Ltd, Colombo, Sri Lanka.
[7] Malalaskara, G.P (1928) Pali Literature of Ceylon ,Pali Text Books Publishers, Colombo, Sri Lanka.
[8] Paranavithana , S (1970) Inscription of Ceylon Vol 1 , Archaeological Survey of Ceylon, Colombo, Sri Lanka.
[9] Ragnhild Lund (1990) Geographies of eviction, Expulsion and Marginalization: stories and coping capacities of the Veddas, Sri Lanka. www.svt.ntnu.no/Geo/ragnhild.lund
[10] Stegeborn Wiveca (1997) Indigenous People, Nature Conservation and Human Rights – A Case study of Veddas of Sri Lanka. Plan to protect Biodiversity and Indigenous Culture in Sri Lanka. Department of Environment and Cultural Affairs, Colombo, Sri Lanka.
PHOTOS . INDEGINIOUS PEOPLE OF SRI LANKA – VEDDAS

International Journal of Scientific and Research Publications, Volume 7, Issue 4, April 2017 21 ISSN 2250-3153
www.ijsrp.org
International Journal of Scientific and Research Publications, Volume 7, Issue 4, April 2017 22 ISSN 2250-3153
www.ijsrp.org
Evaluation of antioxidative and biological activity of
Houttuynia cordata extracts
Nagung Camder Tok1 Kamal Kant Jain
1*, Narottam Prasad Sahu
1,Tincy Varghese
1, and Daniel N.
1
1ICAR-Central Institute of Fisheries Education (CIFE), Versova, Mumbai - 400 061, India
Abstract- The present study evaluated the antioxidative and
biological activity of the aqueous, ethanolic and methanolic
extract from leaf and root of aromatic herb, Houttuyniacordata
(HC). The yield were found to be 7.67±0.33 to 9.33±0.58 %,
9.00±0.58 to 10.67±0.33 % and 11.33±0.33 to 13.67±0.58 % of
root to leaf in different solvent of aqueous, ethanolic and
methanolic solvent extraction. The parameters such as 2, 2-
Diphenyl-1-picrylhydrazyl (DPPH) scavenging assay, total
phenol contents (TPC), ferric reducing antioxidant power assay
(FRAP), superoxide anion radical scavenging activity (NTZ),
haemolytic assay (HA) and genoprotective assay were analysed.
The results showed the highest radical scavenging (DPPH) effect
in the methanolicleaf extract (75.30±2.16 %) and the lowest in
the aqueous root extract (28.69±1.03 %). TPC and FRAP values
followed similar trend with highest response found in
methanolicleaf extract (305.68±0.58 mg g-1
), (20.49±0.01mg g-1
)
and lowest in aqueous root extract (66.68±0.43), (5.17±0.13)
respectively. The highest activity for NTZ was estimated in
aqueous root extract (92.92±0.90 %) and lowest in methanolic
leaf extract (80.96±0.80 %). The haemolytic activity showed the
highest effect in aqueous leaf extract (65.62±0.58 %) and lowest
in methanolicleaf extracts (27.77±0.18 %). In genoprotective
assay, the percentage protection against oxidative damage to
DNA found highest in aqueous root extract (55.37±1.53%) and
lowest in methanolic leaf extract (30.34±0.89 %). Overall results
from present study demonstrated leaf and root extracts of HC
extracted with methanolic, ethanolic and aqueous solvents
possess excellent antioxidant properties; however, the highest
extraction yield and antioxidant responses for the most of the
parameters were exhibited in the methanolic extracts of HC than
those of ethanolic and aqueous HC extracts.
Index Terms- Houttuyniacordata; aqueous, ethanolic and
methanolic extracts; free radical; antioxidant; DNA damage.
I. INTRODUCTION
ree radicals are highly reactive, unstable molecules carries an
unpaired number of electrons. It formed constantly in the
cells which are potentially dangerous to cells because it regularly
steals the electrons from the stable molecules of the cells
including DNA, proteins, etc. and make them unstable through
the process called oxidation [75]. Therefore, free radicals are
toxic to the cells and must be converted into non-toxic form [19].
To neutralize the toxic effects of free radicals or to make free
radicals become stable, antioxidants play a main role via
inhibiting the oxidation process by donating their own electron
[16]. Free radicals are no more dangerous to cells once it gained
the electrons from the antioxidants [17]. As a natural defense
mechanism, all living organisms contain antioxidant molecules to
hunt the free radicals produced in the body. Nevertheless, they
are not enough to scavenge those [3] as over-production of free
radicals often damages several essential biomolecules such as
cellular proteins, membrane lipids, lipoproteins; DNA strands,
and thereby disrupts the cellular functions of the cells [3]. Earlier
reports proved that antioxidants minimize the risk of chronic
diseases including cancer and heart diseases [69]. For these
reasons, pharmaceuticals industry serves the antioxidants from
natural and synthetic sources for human beings, terrestrial
animals and aquatic animals. But an experimental study confirms
that synthetic antioxidants cause lipid alteration and carcinogenic
effects to the cells [26]. Therefore, the focus of most research has
been directed on the development of natural antioxidants from
the natural sources of herbal and plant material [75, 62, 15].
For the last several years there has been a growing interest
in the exploration /or extraction of antioxidants from many plants
and herbs. For more than 8000 years, herbal and plant extracts
have been identified as a potential medicine to treat variety of
human diseases [20]. It is worth mentioning to note that about
80% of the world’s human population during 1980’s was solely
relied on herbal and plants medicine as a primary source of
medicine [21]. Previous studies with secondary metabolites of
plants and herbs has provided ample support for the assertion that
they contain the active compounds such as peptides, unsaturated
long chain fatty acids, aldehydes, flavonoid, alkaloids, essential
oils, phenols and water or ethanol soluble, which are used in the
therapeutic application against the various human and animal
pathogens[52,33,46]. Report says that taking certain taking
certain plant/herbal phenolic in the daily diet protect the cells
against cardiovascular diseases [66] and cancer [20]. It is also
supported that plant/herbal extracts carries antioxidants such as
phenolic compounds, flavonoids and tannins that can play an
important role in the scavenging free radicals [55, 21, 11].
The flowering and perennial herbal plant,
Houttuyniacordata(HC) belongs to the family of Saururaceae,
which is found in different countries including China, Japan,
Korea, Thailand, Vietnam and India. H. cordata commonly
grows in the hilly areas of moist and shady places with an
altitude of 300-2600m[7].
The vernacular name of H. cordata for the different
countries is as follows: Yu-Xing-Cao, and Chou-Xing-Cao
(QuanzhouBencao) in China; dokudami in Japan; E-Sung-Cho in
Korea; Khao-tong or Plu-khao in Thailand; giấpcá or diếpcá in
Vietnam and Hangya, Amuli in Arunachal Pradesh, Indiawhere
the sample was collected. H. cordata has a long history of usage
among the tribal people of India in the treatment of various
F

International Journal of Scientific and Research Publications, Volume 7, Issue 4, April 2017 23
ISSN 2250-3153
www.ijsrp.org
illness and diseases. In the literature, several authors have been
reportedaboutthe antioxidant activity [1], digestive stimulation
action [11],anti-toxin[73], anti-platelet aggregation [30], anti-
inflammatory[27], anti-allergic35, virucidal31, anti-
leukemic[12], anti-Severe Acute Respiratory Syndrome (SARS)
and anti-cancer [36] properties of H. cordata. It has also been
reported that H. cordata carries a range of antibacterial, anti-
microbial, and immunomodulatory effects [30,13,27].
Previous studies revealed that H. cordata contain the
biologically active compounds such as flavones, phenolic
components (quercetin and chlorogenic acid), essential oil and
alkaloids [5, 45, 50]. Prior reports on biochemical and
epidemiologic results recommended that H. cordata contain
phenolic and antioxidativecomponents[13] which responsible for
free radical-scavenging activity that would be beneficial to the
health of humans and animals [72, 42]. However, no information
is available on the antioxidant activities of different parts of H.
cordata to support practical application in the medicinal industry.
Therefore, the present study was conducted to evaluate the
antioxidant and genoprotective activities of three different
(aqueous, ethanolic and methanolic) extracts from leaf and root
of aromatic herb, H.cordata.
II. MATERIAL AND METHODS
2.1. Collection, identification and extraction process of plant
sample
The whole plant,Houttuyniacordata(HC) were collected
from Palove village,Pakke-Kessang (at elevation of 1100msl and
the latitude of (27º14’ N) and longitude (93º61’ E) District East
Kameng, Arunachal Pradesh, India; in the month of July-August,
2016 and it wasindividually washed with tap water. Further, leaf
and root were carefully separated and spread under shade in the
bamboo carpet. Once shadow dried, it was packed for
transportation and brought to the Laboratory of Fish Nutrition
and Feed Technology, ICAR-Central Institute of Fisheries
Education (CIFE), Mumbai, India, for separation of crude
extracts of leaf and root. The sample was deposited and voucher
specimen number TT-33 and identified in Blatter Herbarium, St.
Xavier’s College, Mumbai, India.
2.2. Chemicals used for the extraction process
Agarose, bromocresol purple, D-glucose, Folin–Ciocalteu
reagent, and methanol were purchased from Sigma Chemical Co.
(St. Louis, MO,USA); Davis–Mingioli salt, deionised water,
hydrochloric acid, hydrogen peroxide, phosphate buffer saline
(PBS) and Triton-X 100 were procured from Sigma-Aldrich Co.
(Steinheim, Germany); gallic acid and Tris-Acetate EDTA buffer
were obtained from Merck (Darmstadt, Germany); while DNA
plasmid (pJET1.2) from Fermantas and Na2CO3 purchased from
Merck company. All chemicals were of HPLC grades.
2.3. Extraction from leaf and root of H. cordata
The extraction method was followedperstandard protocol
[79] with slightly modificationfor both ethanolic and methanolic
extraction.After complete drying, the leaf and root were ground
to powder using mixer grinder. Either leaf or root of each
Houttuyniacordata (10g) powder was taken into a 250ml flask
and added with 100ml 90% ethanol (ethanol: water 90:10 v/v)or
90% methanol (methanol: water 90:10 v/v). The ethanol/
methanol powdered leaf or root were kept on orbital shaker at
160 rpm for 24hrs. After 24hrs, the extracts of leaf or root were
filtered using muslin cloth to exclude the leaf and root powder
residue. The extraction was done twotimes and the filtrates
pulled together were centrifuged at 10,000rpm at 4ºC for 5min
and the supernatant was collected. The volume of supernatant
was reduced by rotatory evaporator at temperature of 40-65ºC,
rotor speed of 40rpm. A greasy material (crude
ethanolic/methanolic extract) obtained was transferred to
screwed-cap bottles, labelled and stored under refrigerated (4ºC)
condition until use. Aliquots of known weight fromeach extract
were freeze-dried and lyophilized (-95⁰C±4⁰C and 0.100 to
0.200±111 mbars) for estimation of yield on dry weight basis.
2.4. Aqueous extraction
The aqueous extraction method was carried out per the
standard procedure [79] with some modifications.A known
quantity of 10g of air dried powdered of leaf or root powder was
taken in 250ml flask and added with 100ml of distilled
waterfollowed by heating at temperature of 60ºC on magnetic
stirrer cum hotplate (SPINOT, Tarson, India) for 2 hrs. It was
filtered using muslin cloth to exclude the leaf and root powder
residue. The extraction was done two times and the filtrates
pulled together were centrifuged at 10,000rpm for 5min and the
supernatants were collected. Then the supernatant was
concentrated using lyophilisation at temperature of -95⁰C ±4⁰C
and pressure of 0.100 to 0.200±111 mbars. A greasy material
(crude water extract) obtained was transferred to screwed-cap
bottles, labelled and stored under refrigerated (4ºC) condition
until use.
2.5. Determination of the Extraction Yield The extraction yield is a measure of the solvent efficiency to
extract specific components from the original material. In the
case of HC, it will give an idea about the extractability of
phenolics under different solvents. It could be calculated per the
standard method of Liu et al. (2008) [41] as follow formula:
Weight of the freeze-dried extract
Extraction yield (%) = ×100
Weight of the original sample
2.5.2 Determination of Antioxidant Activity
2.5.2. 2, 2-Diphenyl-1-picrylhydrazyl (DPPH) Assay
The radical scavenging activity of the extracts of leaf or root
was tested against 2,2-Diphenyl-1-picrylhydrazyl (Sigma-
Aldrich) radical following the method described by previous
authors [10]with slight modification. Each extract sample’s stock
solution (0.5 g ml-1
) was diluted to final concentrations of (0.001,
0.0025, 0.005, 0.025, and 0.05mg ml-1
) in water, ethanol and
methanol. Ten microliter (10µl) of crude herb extracts was
placed in 3 test tubes and 2ml of 0.01M DPPH solution in
methanol was added. The test tubes were incubated in dark for
30min, and the UV absorbance was read at 517nm. A blank
solution containing the same amounted of methanol and DPPH
was prepared and measured. Lower absorbance of the reaction
mixture indicates higher free radical scavenging activity. All the
measurements were taken in triplicates and the mean value was
calculated using the following formula:
International Journal of Scientific and Research Publications, Volume 7, Issue 4, April 2017 24
ISSN 2250-3153
www.ijsrp.org
DPPH Scavenging Effect (%) = [(AB - AA) ×100/AB]; where
AB is the absorption of blank sample and AA is absorption of
tested crude herbal extract solution.
2.5.3. Estimation of total phenolic contents (TPC)
Total phenolic contents in the root or leaf extracts were
determined per the method described by previous workers [43]
with slight modification. Concentrations of 0.001, 0.0025, 0.005,
0.025, and 0.05mg ml-1
of herbal extracts were prepared from the
stock solution. Thirty microlitre of each part herbal extract was
taken in a test tube and made up to 3ml with distilled water.After
3min, 2ml of 20% sodium carbonate (Na2CO3) was added and
mixed well. A blue coloured reaction was developed in each
tube. The tubes were then placed in boiling water for 1min,
cooled and absorbance was measured in spectrophotometer at
650nm against a reagent blank. The standard curve was prepared
using gallic acid in methanol and linear dose-response regression
curve was generated at absorbance of 650nm. The total
phenoliccontents in the samples were calculated from the
standard curve and the results were expressed as gallic acid
equivalent per 100g dry weight of the mgGAE/100 g extract. All
the measurements were taken in triplicates to calculate the mean
value.
2.5.4. Ferric reducing antioxidant power (FRAP) assay
The FRAP assay was carried out per the standard procedure
[6]with some modifications. Diluted sample of 0.001, 0.025,
0.0125, 0.0025, and 0.05mg ml-1
of herb extracts were prepared
using the two solvents. The FRAP reagent was prepared fresh
daily and warmed to 37ºC in the water-bath prior to use. To 20µl
of sample extracts, 1.8ml of the FRAP reagent, containing 25ml
of 300mM acetate buffer pH 3.6 2.5ml of 10mM 2,4,6-
tripyridyls-triazine (TPTZ) in 40mMHCl and 2.5ml of 20ml
ferric chloride (FeCl3•6H2O) solution was added, and the
absorbance of the reaction mixture was read at 593nm after
4min. The standard curve was constructed using iron (II) sulfate
solution (100-2000 µM), and the results were expressed as µM
Fe (II)/g dry weight of herb material. All the measurements were
taken in triplicate to calculate the mean value using the following
formula:
FRAP value of sample (µM) = [(Δabs of sample from 0 to 4
min) / (Δabs of standard from 0 to 4 min) × FRAP value of
standard (×2) (103 µM)].
2.5.5. Superoxide Anion Scavenging Activity (NTZ)
Measurement of superoxide anion scavenging activity of
Houttuyniacordataroot or leaf extract was based on the method
described by previous workers [40]. Superoxide radicals were
generated in PMS-NADH systems by oxidation of NADH and
assayed by the reduction of nitrobluetetrazolium (NBT). In this
experiment, the superoxide radicals were generated in 3ml of
Tris-HCl buffer (16mM, pH 8.0) containing 1ml of NBT 50µM)
solution, 1ml NADH (78µM) solution and sample solution of
Houttuyniacordata ethanol extract 100 µg ml-1
) in water. The
reaction started by adding 1ml of phenazinemethosulphate
(PMS) solution (10µM) to the mixture. The reaction mixture was
incubated at 25ºC for 5 min, and the absorbance was measured at
560nm in spectrophotometer against blank samples. L-ascorbic
acid was used as a control. Decreased absorbance of the reaction
mixture indicated increased superoxide anion scavenging
activity. The percentage inhibition of superoxide anion
generation was calculated using the following formula:
Inhibition (%) = {[(A0-A1) ×100)]/A0}; where, A0 was the
absorbance of the control, and A1 was the absorbance of
Houttuyniacordataethanolicextract sample and standard (L-
ascorbic acid).
2.5.6. Haemolytic assay
Haemolytic activity was evaluated by using the standard
method [53]. Fresh heparinised human blood (3ml) was gently
mixed and dispensed into a sterile falcon tube (15 ml) and
centrifuged for 5 min at 900 g. The sticky pellet was separated
from the supernatant and washed with sterile isotonic phosphate
buffer saline (PBS 2% v/v) solution thrice, to maintain the pH to
~7.4. The well shaken/pounded cells were added to chilled,
sterile PBS buffer, as to get 7.068 × 10⁸ cells ml−1
. With
measured/optimised of different solvent and parts (namely leaf
and root) extracts (20 µl) were mixed separately with diluted
blood cell suspension (180µl) in separate microfuge tubes; each
tube was incubated at 37°C for 35 min with continuous agitation
(180 rpm). After incubation, supernatant (100µl) from each tube
was mixed with 900 µl cooled, sterile PBS in separate microfuge
tubes and retained on ice (5 min). Absorbance was then
measured at 576 nm, using Triton-X 100 (0.1%) as the positive
control. From the absorbance of the sample and the positive
control, haemolytic activity was quantified using the following
formula:
Haemolysis (%) = [absorbance of sample / absorbance of
standard] ×100; where, standard indicates positive control, which
show 100 % haemolysis.
2.5.7. Genoprotective assay
Genoprotective potential of samples was assessed on DNA
plasmid (pJET1.2)66
with sight modification. In this assay, the
protection capability of the extracts against oxidative damage to
DNA instigated by H2O2 and UV radiations was measured. The
trials were conducted in microcentrifuge tubes containing
pJET1.2 DNA plasmid (3L, 172 ngL−1
), herbal extract (5µL, in
varying concentrations of 25 mg ml−1
) and H2O2(2% µl of 30%).
A negative control (devoid of sample) and a positive control
(without H2O2) were also run along with the samples. All
eppendorf tubes except the positive controls were also exposed to
UV radiations for 15 min to break down the supercoiled DNA
plasmid. After completion of reaction, the reaction mixtures were
loaded on 1% agarose gel along with loading dye (6×) using Tris
Acetate–EDTA buffer (1×). The gel was photographed using gel
documentation system (Gene Genius, SYNGENE) applying
software Syngene (version 4.01.00) after staining with ethidium
bromide (0.5µg ml−1
).
2.7. Statistical analysis
The data were statistically analysed by statistical package
SPSS version 16. Comparisons of different assays of the extracts
were done byone way ANOVA and the comparison among
different mean values were made using Duncan's Multiple Range
Test (Duncan, 1955). All the comparisons were made at the 5%
(P<0.05) probability levels.
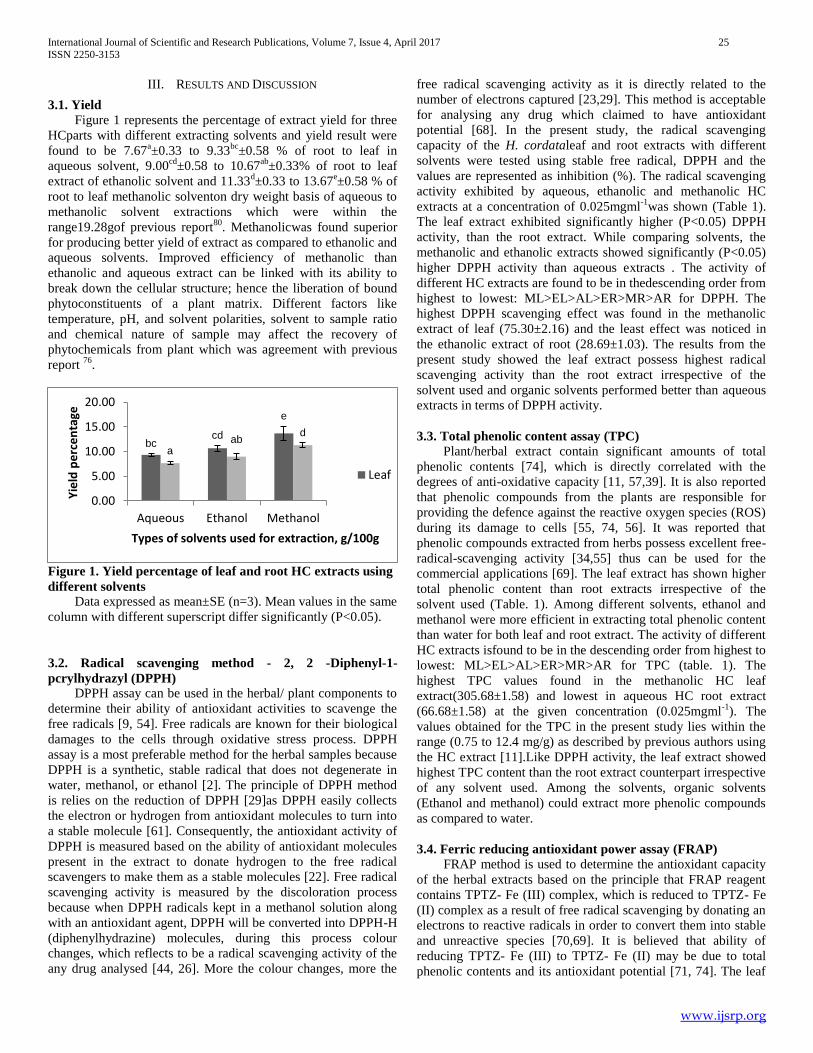
International Journal of Scientific and Research Publications, Volume 7, Issue 4, April 2017 25
ISSN 2250-3153
www.ijsrp.org
III. RESULTS AND DISCUSSION
3.1. Yield
Figure 1 represents the percentage of extract yield for three
HCparts with different extracting solvents and yield result were
found to be 7.67a±0.33 to 9.33
bc±0.58 % of root to leaf in
aqueous solvent, 9.00cd
±0.58 to 10.67ab
±0.33% of root to leaf
extract of ethanolic solvent and 11.33d±0.33 to 13.67
e±0.58 % of
root to leaf methanolic solventon dry weight basis of aqueous to
methanolic solvent extractions which were within the
range19.28gof previous report80
. Methanolicwas found superior
for producing better yield of extract as compared to ethanolic and
aqueous solvents. Improved efficiency of methanolic than
ethanolic and aqueous extract can be linked with its ability to
break down the cellular structure; hence the liberation of bound
phytoconstituents of a plant matrix. Different factors like
temperature, pH, and solvent polarities, solvent to sample ratio
and chemical nature of sample may affect the recovery of
phytochemicals from plant which was agreement with previous
report 76
.
Figure 1. Yield percentage of leaf and root HC extracts using
different solvents
Data expressed as mean±SE (n=3). Mean values in the same
column with different superscript differ significantly (P<0.05).
3.2. Radical scavenging method - 2, 2 -Diphenyl-1-
pcrylhydrazyl (DPPH)
DPPH assay can be used in the herbal/ plant components to
determine their ability of antioxidant activities to scavenge the
free radicals [9, 54]. Free radicals are known for their biological
damages to the cells through oxidative stress process. DPPH
assay is a most preferable method for the herbal samples because
DPPH is a synthetic, stable radical that does not degenerate in
water, methanol, or ethanol [2]. The principle of DPPH method
is relies on the reduction of DPPH [29]as DPPH easily collects
the electron or hydrogen from antioxidant molecules to turn into
a stable molecule [61]. Consequently, the antioxidant activity of
DPPH is measured based on the ability of antioxidant molecules
present in the extract to donate hydrogen to the free radical
scavengers to make them as a stable molecules [22]. Free radical
scavenging activity is measured by the discoloration process
because when DPPH radicals kept in a methanol solution along
with an antioxidant agent, DPPH will be converted into DPPH-H
(diphenylhydrazine) molecules, during this process colour
changes, which reflects to be a radical scavenging activity of the
any drug analysed [44, 26]. More the colour changes, more the
free radical scavenging activity as it is directly related to the
number of electrons captured [23,29]. This method is acceptable
for analysing any drug which claimed to have antioxidant
potential [68]. In the present study, the radical scavenging
capacity of the H. cordataleaf and root extracts with different
solvents were tested using stable free radical, DPPH and the
values are represented as inhibition (%). The radical scavenging
activity exhibited by aqueous, ethanolic and methanolic HC
extracts at a concentration of 0.025mgml-1
was shown (Table 1).
The leaf extract exhibited significantly higher (P<0.05) DPPH
activity, than the root extract. While comparing solvents, the
methanolic and ethanolic extracts showed significantly (P<0.05)
higher DPPH activity than aqueous extracts . The activity of
different HC extracts are found to be in thedescending order from
highest to lowest: ML>EL>AL>ER>MR>AR for DPPH. The
highest DPPH scavenging effect was found in the methanolic
extract of leaf (75.30±2.16) and the least effect was noticed in
the ethanolic extract of root (28.69±1.03). The results from the
present study showed the leaf extract possess highest radical
scavenging activity than the root extract irrespective of the
solvent used and organic solvents performed better than aqueous
extracts in terms of DPPH activity.
3.3. Total phenolic content assay (TPC)
Plant/herbal extract contain significant amounts of total
phenolic contents [74], which is directly correlated with the
degrees of anti-oxidative capacity [11, 57,39]. It is also reported
that phenolic compounds from the plants are responsible for
providing the defence against the reactive oxygen species (ROS)
during its damage to cells [55, 74, 56]. It was reported that
phenolic compounds extracted from herbs possess excellent free-
radical-scavenging activity [34,55] thus can be used for the
commercial applications [69]. The leaf extract has shown higher
total phenolic content than root extracts irrespective of the
solvent used (Table. 1). Among different solvents, ethanol and
methanol were more efficient in extracting total phenolic content
than water for both leaf and root extract. The activity of different
HC extracts isfound to be in the descending order from highest to
lowest: ML>EL>AL>ER>MR>AR for TPC (table. 1). The
highest TPC values found in the methanolic HC leaf
extract(305.68±1.58) and lowest in aqueous HC root extract
(66.68±1.58) at the given concentration (0.025mgml-1
). The
values obtained for the TPC in the present study lies within the
range (0.75 to 12.4 mg/g) as described by previous authors using
the HC extract [11].Like DPPH activity, the leaf extract showed
highest TPC content than the root extract counterpart irrespective
of any solvent used. Among the solvents, organic solvents
(Ethanol and methanol) could extract more phenolic compounds
as compared to water.
3.4. Ferric reducing antioxidant power assay (FRAP)
FRAP method is used to determine the antioxidant capacity
of the herbal extracts based on the principle that FRAP reagent
contains TPTZ- Fe (III) complex, which is reduced to TPTZ- Fe
(II) complex as a result of free radical scavenging by donating an
electrons to reactive radicals in order to convert them into stable
and unreactive species [70,69]. It is believed that ability of
reducing TPTZ- Fe (III) to TPTZ- Fe (II) may be due to total
phenolic contents and its antioxidant potential [71, 74]. The leaf
bc cd
e
a ab
d
0.00
5.00
10.00
15.00
20.00
Aqueous Ethanol Methanol
Yie
ld p
erc
en
tage
Types of solvents used for extraction, g/100g
Leaf
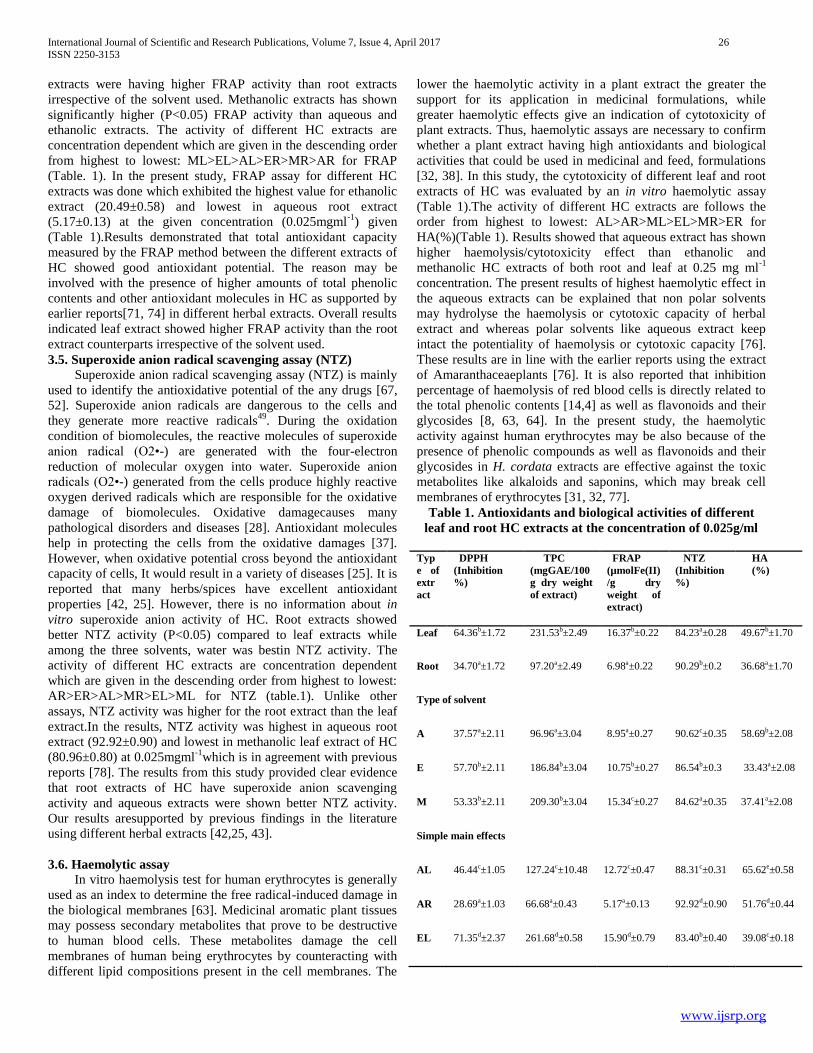
International Journal of Scientific and Research Publications, Volume 7, Issue 4, April 2017 26
ISSN 2250-3153
www.ijsrp.org
extracts were having higher FRAP activity than root extracts
irrespective of the solvent used. Methanolic extracts has shown
significantly higher (P<0.05) FRAP activity than aqueous and
ethanolic extracts. The activity of different HC extracts are
concentration dependent which are given in the descending order
from highest to lowest: ML>EL>AL>ER>MR>AR for FRAP
(Table. 1). In the present study, FRAP assay for different HC
extracts was done which exhibited the highest value for ethanolic
extract (20.49±0.58) and lowest in aqueous root extract
(5.17±0.13) at the given concentration (0.025mgml-1
) given
(Table 1).Results demonstrated that total antioxidant capacity
measured by the FRAP method between the different extracts of
HC showed good antioxidant potential. The reason may be
involved with the presence of higher amounts of total phenolic
contents and other antioxidant molecules in HC as supported by
earlier reports[71, 74] in different herbal extracts. Overall results
indicated leaf extract showed higher FRAP activity than the root
extract counterparts irrespective of the solvent used.
3.5. Superoxide anion radical scavenging assay (NTZ)
Superoxide anion radical scavenging assay (NTZ) is mainly
used to identify the antioxidative potential of the any drugs [67,
52]. Superoxide anion radicals are dangerous to the cells and
they generate more reactive radicals49
. During the oxidation
condition of biomolecules, the reactive molecules of superoxide
anion radical (O2•-) are generated with the four-electron
reduction of molecular oxygen into water. Superoxide anion
radicals (O2•-) generated from the cells produce highly reactive
oxygen derived radicals which are responsible for the oxidative
damage of biomolecules. Oxidative damagecauses many
pathological disorders and diseases [28]. Antioxidant molecules
help in protecting the cells from the oxidative damages [37].
However, when oxidative potential cross beyond the antioxidant
capacity of cells, It would result in a variety of diseases [25]. It is
reported that many herbs/spices have excellent antioxidant
properties [42, 25]. However, there is no information about in
vitro superoxide anion activity of HC. Root extracts showed
better NTZ activity (P<0.05) compared to leaf extracts while
among the three solvents, water was bestin NTZ activity. The
activity of different HC extracts are concentration dependent
which are given in the descending order from highest to lowest:
AR>ER>AL>MR>EL>ML for NTZ (table.1). Unlike other
assays, NTZ activity was higher for the root extract than the leaf
extract.In the results, NTZ activity was highest in aqueous root
extract (92.92±0.90) and lowest in methanolic leaf extract of HC
(80.96±0.80) at 0.025mgml-1
which is in agreement with previous
reports [78]. The results from this study provided clear evidence
that root extracts of HC have superoxide anion scavenging
activity and aqueous extracts were shown better NTZ activity.
Our results aresupported by previous findings in the literature
using different herbal extracts [42,25, 43].
3.6. Haemolytic assay
In vitro haemolysis test for human erythrocytes is generally
used as an index to determine the free radical-induced damage in
the biological membranes [63]. Medicinal aromatic plant tissues
may possess secondary metabolites that prove to be destructive
to human blood cells. These metabolites damage the cell
membranes of human being erythrocytes by counteracting with
different lipid compositions present in the cell membranes. The
lower the haemolytic activity in a plant extract the greater the
support for its application in medicinal formulations, while
greater haemolytic effects give an indication of cytotoxicity of
plant extracts. Thus, haemolytic assays are necessary to confirm
whether a plant extract having high antioxidants and biological
activities that could be used in medicinal and feed, formulations
[32, 38]. In this study, the cytotoxicity of different leaf and root
extracts of HC was evaluated by an in vitro haemolytic assay
(Table 1).The activity of different HC extracts are follows the
order from highest to lowest: AL>AR>ML>EL>MR>ER for
HA(%)(Table 1). Results showed that aqueous extract has shown
higher haemolysis/cytotoxicity effect than ethanolic and
methanolic HC extracts of both root and leaf at 0.25 mg ml-1
concentration. The present results of highest haemolytic effect in
the aqueous extracts can be explained that non polar solvents
may hydrolyse the haemolysis or cytotoxic capacity of herbal
extract and whereas polar solvents like aqueous extract keep
intact the potentiality of haemolysis or cytotoxic capacity [76].
These results are in line with the earlier reports using the extract
of Amaranthaceaeplants [76]. It is also reported that inhibition
percentage of haemolysis of red blood cells is directly related to
the total phenolic contents [14,4] as well as flavonoids and their
glycosides [8, 63, 64]. In the present study, the haemolytic
activity against human erythrocytes may be also because of the
presence of phenolic compounds as well as flavonoids and their
glycosides in H. cordata extracts are effective against the toxic
metabolites like alkaloids and saponins, which may break cell
membranes of erythrocytes [31, 32, 77].
Table 1. Antioxidants and biological activities of different
leaf and root HC extracts at the concentration of 0.025g/ml
Typ
e of
extr
act
DPPH
(Inhibition
%)
TPC
(mgGAE/100
g dry weight
of extract)
FRAP
(µmolFe(II)
/g dry
weight of
extract)
NTZ
(Inhibition
%)
HA
(%)
Leaf 64.36b±1.72 231.53b±2.49
16.37b±0.22 84.23a±0.28 49.67b±1.70
Root 34.70a±1.72 97.20a±2.49 6.98a±0.22 90.29b±0.2 36.68a±1.70
Type of solvent
A 37.57a±2.11 96.96a±3.04
8.95a±0.27 90.62c±0.35 58.69b±2.08
E 57.70b±2.11 186.84b±3.04
10.75b±0.27
86.54b±0.3 33.43a±2.08
M 53.33b±2.11 209.30b±3.04
15.34c±0.27
84.62a±0.35 37.41a±2.08
Simple main effects
AL 46.44c±1.05 127.24c±10.48 12.72c±0.47 88.31c±0.31 65.62e±0.58
AR 28.69a±1.03 66.68a±0.43 5.17a±0.13 92.92d±0.90 51.76d±0.44
EL 71.35d±2.37 261.68d±0.58 15.90d±0.79 83.40b±0.40 39.08c±0.18
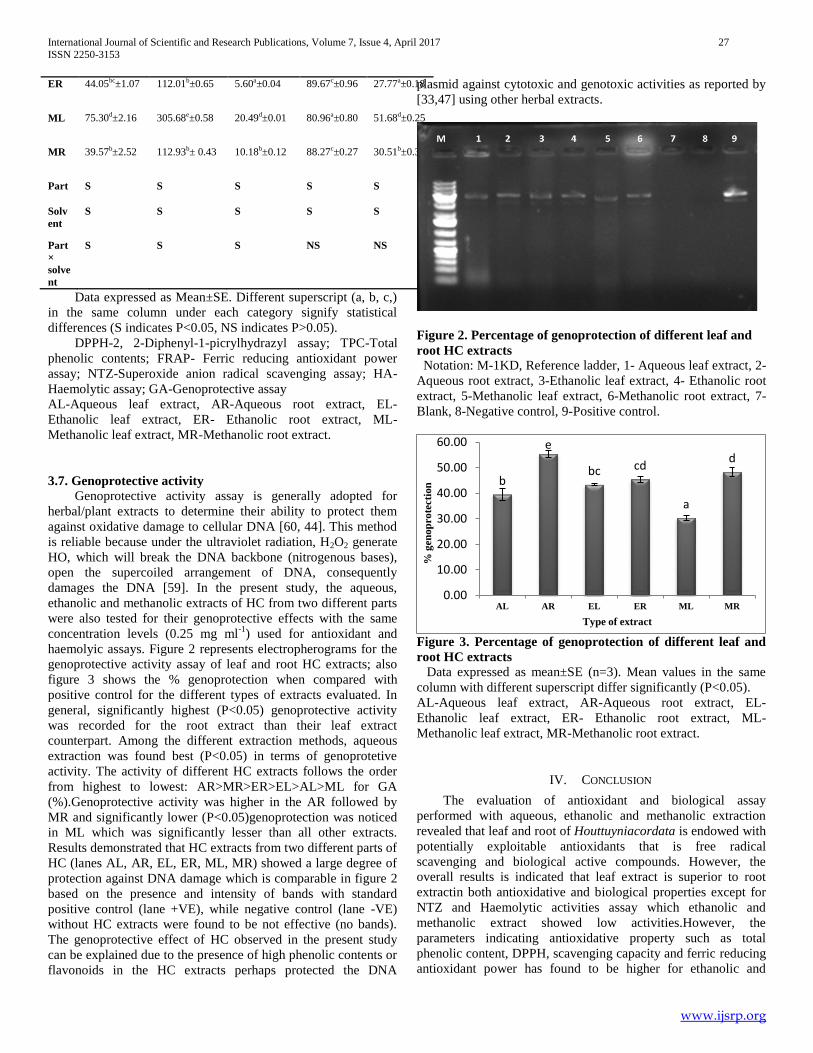
International Journal of Scientific and Research Publications, Volume 7, Issue 4, April 2017 27
ISSN 2250-3153
www.ijsrp.org
ER 44.05bc±1.07 112.01b±0.65 5.60a±0.04 89.67c±0.96 27.77a±0.18
ML 75.30d±2.16 305.68e±0.58 20.49d±0.01 80.96a±0.80 51.68d±0.25
MR 39.57b±2.52 112.93b± 0.43 10.18b±0.12 88.27c±0.27 30.51b±0.30
Part S S S S S
Solv
ent
S S S S S
Part
×
solve
nt
S S S NS NS
Data expressed as Mean±SE. Different superscript (a, b, c,)
in the same column under each category signify statistical
differences (S indicates P<0.05, NS indicates P>0.05).
DPPH-2, 2-Diphenyl-1-picrylhydrazyl assay; TPC-Total
phenolic contents; FRAP- Ferric reducing antioxidant power
assay; NTZ-Superoxide anion radical scavenging assay; HA-
Haemolytic assay; GA-Genoprotective assay
AL-Aqueous leaf extract, AR-Aqueous root extract, EL-
Ethanolic leaf extract, ER- Ethanolic root extract, ML-
Methanolic leaf extract, MR-Methanolic root extract.
3.7. Genoprotective activity
Genoprotective activity assay is generally adopted for
herbal/plant extracts to determine their ability to protect them
against oxidative damage to cellular DNA [60, 44]. This method
is reliable because under the ultraviolet radiation, H2O2 generate
HO, which will break the DNA backbone (nitrogenous bases),
open the supercoiled arrangement of DNA, consequently
damages the DNA [59]. In the present study, the aqueous,
ethanolic and methanolic extracts of HC from two different parts
were also tested for their genoprotective effects with the same
concentration levels (0.25 mg ml-1
) used for antioxidant and
haemolyic assays. Figure 2 represents electropherograms for the
genoprotective activity assay of leaf and root HC extracts; also
figure 3 shows the % genoprotection when compared with
positive control for the different types of extracts evaluated. In
general, significantly highest (P<0.05) genoprotective activity
was recorded for the root extract than their leaf extract
counterpart. Among the different extraction methods, aqueous
extraction was found best (P<0.05) in terms of genoprotetive
activity. The activity of different HC extracts follows the order
from highest to lowest: AR>MR>ER>EL>AL>ML for GA
(%).Genoprotective activity was higher in the AR followed by
MR and significantly lower (P<0.05)genoprotection was noticed
in ML which was significantly lesser than all other extracts.
Results demonstrated that HC extracts from two different parts of
HC (lanes AL, AR, EL, ER, ML, MR) showed a large degree of
protection against DNA damage which is comparable in figure 2
based on the presence and intensity of bands with standard
positive control (lane +VE), while negative control (lane -VE)
without HC extracts were found to be not effective (no bands).
The genoprotective effect of HC observed in the present study
can be explained due to the presence of high phenolic contents or
flavonoids in the HC extracts perhaps protected the DNA
plasmid against cytotoxic and genotoxic activities as reported by
[33,47] using other herbal extracts.
Figure 2. Percentage of genoprotection of different leaf and
root HC extracts
Notation: M-1KD, Reference ladder, 1- Aqueous leaf extract, 2-
Aqueous root extract, 3-Ethanolic leaf extract, 4- Ethanolic root
extract, 5-Methanolic leaf extract, 6-Methanolic root extract, 7-
Blank, 8-Negative control, 9-Positive control.
Figure 3. Percentage of genoprotection of different leaf and
root HC extracts
Data expressed as mean±SE (n=3). Mean values in the same
column with different superscript differ significantly (P<0.05).
AL-Aqueous leaf extract, AR-Aqueous root extract, EL-
Ethanolic leaf extract, ER- Ethanolic root extract, ML-
Methanolic leaf extract, MR-Methanolic root extract.
IV. CONCLUSION
The evaluation of antioxidant and biological assay
performed with aqueous, ethanolic and methanolic extraction
revealed that leaf and root of Houttuyniacordata is endowed with
potentially exploitable antioxidants that is free radical
scavenging and biological active compounds. However, the
overall results is indicated that leaf extract is superior to root
extractin both antioxidative and biological properties except for
NTZ and Haemolytic activities assay which ethanolic and
methanolic extract showed low activities.However, the
parameters indicating antioxidative property such as total
phenolic content, DPPH, scavenging capacity and ferric reducing
antioxidant power has found to be higher for ethanolic and
b
e
bc cd
a
d
0.00
10.00
20.00
30.00
40.00
50.00
60.00
AL AR EL ER ML MR
% g
eno
pro
tecti
on
Type of extract

International Journal of Scientific and Research Publications, Volume 7, Issue 4, April 2017 28
ISSN 2250-3153
www.ijsrp.org
methanolic extract compared to aqueous extracts.Maenwhile, the
biological activities such as haemolytic and genoprotective
activities were higher in aqueous extracts than that of methanolic
and ethanolic extracts. Results from the present study
demonstrated that HC possess significantly good amounts of total
phenolic content that can be used as natural antioxidants for the
commercial applications in the terrestrial and aquatic animal
feeds to replace the synthetic antioxidants such as butylated
hydroxyl toluene (BHT) and butylatedhydroxyl anisole (BHA)
which are criticised in the feeds as supported by earlier
reports69
.Three different types of extracts aqueous ethanolic and
methanolic were established to possess highest superoxide anion
assay, haemolytic and genoprotection activities assays. Different
solvents have different capacity to extract antioxidative
compounds and biologically active compounds.Despite these
differences, all the HC extracts using aqueous, ethanolic and
methanolicsolvents showed considerably higher antioxidant and
biological effects; therefore, HC extracts could be utilized as a
natural source of antioxidants for human, terrestrial and aquatic
animals. Nevertheless, it is suggested that further works may be
done with in vivo test in terrestrial and aquatic animals to support
HC extracts as an excellent antioxidants source for the
application in the pharmaceutical industries.
ACKNOWLEDGEMENTS
This paper is a part of PhD thesis of the first author. The
authors are thankful to Director, ICAR-Central Institute of
Fisheries Education (CIFE), Mumbai for providing necessary
facilities for carrying out the study.
REFERENCES
[1] Aaby,K., Hvattum, E. and Skrede, G., Analysis of flavonoids and other phenolic compounds using high-performance liquid chromatography with coulometric array detection: relationship to antioxidant activity. Journal of agricultural and food chemistry : 2004: 52(15), pp4595-4603.
[2] Aksoy, L., Kolay, E., Ağılönü, Y., Aslan, Z. and Kargıoğlu, M., Free radical scavenging activity, total phenolic content, total antioxidant status, and total oxidant status of endemic Thermopsisturcica. Saudi journal of biological sciences, 20(3), 235-239 (2013).
[3] Amaeze, O.U., Ayoola, G.A., Sofidiya, M.O., Adepoju-Bello, A.A., Adegoke, A.O. and Coker, H.A.B., Evaluation of antioxidant activity of Tetracarpidiumconophorum (Müll. Arg) Hutch &Dalziel leaves. Oxidative medicine and cellular longevity. 2011: 7, pp701-976.
[4] Barros, L., Ferreira, M.J., Queiros, B., Ferreira, I.C. and Baptista, P., Total phenols, ascorbic acid, β-carotene and lycopene in Portuguese wild edible mushrooms and their antioxidant activities. Food chemistry. 2007:103(2), pp413-419.
[5] Bauer, R., Proebstle, A., Lotter, H., Wagner-Redecker, W. and Matthiesen, U., Cyclooxygenase inhibitory constituents from Houttuyniacordata. Phytomedicine, 1996: 2(4), pp305-308.
[6] Benzie, I.F. and Strain, J.J., The ferric reducing ability of plasma (FRAP) as a measure of “antioxidant power”: the FRAP assay. Analytical biochemistry, 1996: 239(1), pp70-76.
[7] Bhattacharyya, N. and Sarma, S., Assessment of availability, ecological feature, and habitat preference of the medicinal herb HouttuyniacordataThunb in the Brahmaputra Valley of Assam, India. Environmental monitoring and assessment, 2010: 160(1-4), pp277.
[8] Blasa, M., Candiracci, M., Accorsi, A., Piacentini, M.P. and Piatti, E., Honey flavonoids as protection agents against oxidative damage to human red blood cells. Food Chemistry, 2007: 104(4), pp.1635-1640.
[9] Bozin, B., Mimica-Dukic, N., Bogavac, M., Suvajdzic, L., Simin, N., Samojlik, I. and Couladis, M., Chemical composition, antioxidant and antibacterial properties of Achilleacollina Becker ex HeimerlSl and A. pannonica Scheele essential oils. Molecules, 2008: 13(9), pp. 2058-2068.
[10] Brand-Williams, W., Cuvelier, M.E. and Berset, C.L.W.T., Use of a free radical method to evaluate antioxidant activity. LWT-Food science and Technology, 1995: 28(1), pp. 25-30.
[11] Cai, Y., Luo, Q., Sun, M. and Corke, H., Antioxidant activity and phenolic compounds of 112 traditional Chinese medicinal plants associated with anticancer. Life sciences, 2004: 74(17), pp. 2157-2184.
[12] Chang, J.S., Chiang, L.C., Chen, C.C., Liu, L.T., Wang, K.C. and Lin, C.C., Antileukemic activity of Bidenspilosa L. var. minor (Blume) Sherff and HouttuyniacordataThunb. The American journal of Chinese medicine, 2001: 29(02), pp. 303-312.
[13] Chen, Y.Y., Liu, J.F., Chen, C.M., Chao, P.Y. and Chang, T.J., A Study of the Antioxidative and Antimutagenic Effects of HouttuyniacordataThunb. Using an Oxidized Frying Oil-Fed Model, Journal of Nutritional Science and Vitaminology, 2003: 49(5);pp. 327-333.
[14] Cheung, L.M., Cheung, P.C. and Ooi, V.E., Antioxidant activity and total phenolics of edible mushroom extracts. Food Chemistry, 2003: 81(2), pp. 249-255.
[15] Dekkers, J.C., van Doornen, L.J. and Kemper, H.C., The role of antioxidant vitamins and enzymes in the prevention of exercise-induced muscle damage. Sports Medicine, 1996: 21(3), pp. 213-238.
[16] Deshpande, S.S., Madhavi, D.L. and Salunkhe, D.K. eds., Food Antioxidants: Technological, Toxicological, and Health Perspectives, (1996).
[17] Dinis, T.C., Almeida, L.M. and Madeira, V.M.C., Lipid peroxidation in sarcoplasmic reticulum membranes: effect on functional and biophysical properties. Archives of biochemistry and biophysics, 1993: 301(2), pp. 256-264.
[18] Djeridane, A., Yousfi, M., Nadjemi, B., Boutassouna, D., Stocker, P. and Vidal, N., Antioxidant activity of some Algerian medicinal plants extracts containing phenolic compounds. Food chemistry, 2006: 97(4), pp. 654-660.
[19] Dragland, S., Senoo, H., Wake, K., Holte, K. and Blomhoff, R., Several culinary and medicinal herbs are important sources of dietary antioxidants. The Journal of nutrition, 2003: 133(5) pp. 1286-1290.
[20] Drašar, P. and Moravcova, J., Recent advances in analysis of Chinese medical plants and traditional medicines. Journal of Chromatography B, 2004: 812(1) pp. 3-21.
[21] Farnsworth, N.R., Akerele, O., Bingel, A.S., Soejarto, D.D. and Guo, Z., Medicinal Plants in Therapy. Bulletin of the World Health Organization, 1985: 63(6), pp. 965-981.
[22] Fukumoto, L.R. and Mazza, G., Assessing antioxidant and prooxidant activities of phenolic compounds. Journal of agricultural and food chemistry, 2000: 48(8), pp. 3597-3604.
[23] Ghosh, M.N, Fundamentals of Experimental Pharmacology, 2nd Edn., Scientific Book Agency, Calcutta, 1998: pp. 174-179.
[24] Grillo, C.A. and Dulout, F.N., Cytogenetic evaluation of butylatedhydroxytoluene. Mutation Research/Genetic Toxicology, 1995: 345(1-2), pp.73-78.
[25] Gülçin, İ., Oktay, M., Küfrevioğlu, Ö.İ. and Aslan, A., Determination of antioxidant activity of lichen Cetrariaislandica (L) Ach. Journal of ethnopharmacology, 2002: 79(3), pp. 325-329.
[26] Guo, Y.H. and Xu, J.Y., Extraction and purification of Houttuyniacordata flavonoids and identification of flavonoids type. Food Science, 2007: 9,pp.070.
[27] Lu, H., Wu, X., Liang, Y. and Zhang, J., “Variation in Chemical Composition and Antibacterial Activities of Essential Oils from Two Species of HouttuyniacordataThunb,” Chemical & Pharmaceutical Bulletin, 2006: 54(7), pp. 936-940.
[28] Halliwell, B., Gutteridge, J.M.C., Free radicals in biology and medicine. Oxford, UK: Oxford University Press: (1985).
[29] Harborne, A.J., Phytochemical methods a guide to modern techniques of plant analysis. springer science & business media (1998).
[30] Hayashi, K., Kamiya, M. and Hayashi, T., Virucidal effects of the steam distillate from Houttuyniacordataand its components on HSV-1, influenza virus, and HIV. Plantamedica, 1995: 61(3), pp. 237-241.
International Journal of Scientific and Research Publications, Volume 7, Issue 4, April 2017 29
ISSN 2250-3153
www.ijsrp.org
[31] Hayashi, K., Kamiya, M. and Hayashi, T., Virucidal Effects of the Steam Distillate from Houttuyniacordata and Its Components on HSV-1, Influenza Virus, and HIV. PlantaMedica, 2005: 61(3), pp. 237-241.
[32] Inalegwu, B. and Sodipo, O., Phytochemical screening and haemolytic activities of crude and purified saponins of aqueous and methanolic extracts of leaves of Tephrosiavogelii Hook. F. Asian J Plant Sci. Res, 2013: 3(5), pp. 7-11.
[33] Jaiswal, S., Mansa, N., Prasad, M.P., Jena, B.S. and Negi, P.S., Antibacterial and antimutagenic activities of Dilleniaindica extracts. Food Bioscience, 2014: 5, pp. 47-51.
[34] Khan, A.W., Jan, S., Parveen, S., Khan, R.A., Saeed, A., Tanveer, A.J. and Shad, A.A., Phytochemical analysis and enzyme inhibition assay of Aervajavanica for ulcer. Chemistry Central Journal, 2012: 6(1), pp. 76.
[35] Kim, D.O. and Lee, C.Y., Comprehensive study on vitamin C equivalent antioxidant capacity (VCEAC) of various polyphenolic in scavenging a free radical and its structural relationship. Critical reviews in food science and nutrition, 2004: 44(4), pp. 253-273.
[36] Kim, G.S., Kim, D.H., Lim, J.J., Lee, J.J., Han, D.Y., Lee, W.M., Jung, W.C., Min, W.G., Won, C.G., Rhee, M.H. and Lee, H.J., Biological and antibacterial activities of the natural herb Houttuyniacordata water extract against the intracellular bacterial pathogen salmonella within the RAW 264.7 macrophage. Biological and Pharmaceutical Bulletin, 2008: 31(11), pp.2012-2017.
[37] Kim, S.K., Ryu, S.Y., No, J., Choi, S.U. and Kim, Y.S., Cytotoxic alkaloids from Houttuyniacordata. Archives of pharmacal research, 2001: 24(6) 518-521.
[38] Kourounakis, A.P., Galanakis, D., Tsiakitzis, K., Rekka, E.A. and Kourounakis, P.N., Synthesis and pharmacological evaluation of novel derivatives of anti‐inflammatory drugs with increased antioxidant and anti‐inflammatory activities. Drug Development Research, 1999: 47(1), pp. 9-16.
[39] Lamien-Meda, A., Kiendrebeogo, M., Compaoré, M., Meda, R.N., Bacher, M., Koenig, K., Pacher, T., Fuehrer, H.P., Noedl, H., Willcox, M. and Novak, J., Quality assessment and antiplasmodial activity of West African Cochlospermum species. Phytochemistry, 2015: 119,pp. 51-61.
[40] Liu, F., Ooi, V.E.C. and Chang, S.T., Free radical scavenging activities of mushroom polysaccharide extracts. Life sciences, 1997: 60(10), pp. 763-771.
[41] Liu, H., Qiu, N., Ding, H. and Yao, R., Polyphenols contents and antioxidant capacity of 68 Chinese herbals suitable for medical or food uses. Food Research International, 2008: 41(4), pp. 363-370.
[42] Lu, H.M., Liang, Y.Z., Wu, X.J. and Qiu, P., Tentative fingerprint-efficacy study of Houttuyniacordata injection in quality control of traditional Chinese medicine. Chemical and pharmaceutical bulletin, 2006: 54(5), pp. 725-730.
[43] Madsen, H.L. and Bertelsen, G., Spices as antioxidants. Trends in Food Science & Technology, 1995: 6(8), pp.271-277.
[44] Malik, C.P. and Singh, M.B., Plant enzymology and histo-enzymology, (1st Edn.).Kalyani Publishers, New Delhi, 1980: pp. 286-288.
[45] Mayne, S.T., Antioxidant nutrients and chronic disease: use of biomarkers of exposure and oxidative stress status in epidemiologic research. The Journal of nutrition, 2003: 133(3) pp. 933S-940S.
[46] Meng, J., Leung, K.S.Y., Jiang, Z., Dong, X., Zhao, Z. and Xu, L.J., Establishment of HPLC-DAD-MS fingerprint of fresh Houttuyniacordata. Chemical and pharmaceutical bulletin, 2005: 53(12), pp. 1604-1609.
[47] Molyneux, P., The use of the stable free radical diphenylpicrylhydrazyl (DPPH) for estimating antioxidant activity. Songklanakarin J. Sci. Technol, 2004: 26(2), pp. 211-219.
[48] Mufti, F.U.D., Ullah, H., Bangash, A., Khan, N., Hussain, S., Ullah, F., Jamil, M. and Jabeen, M., Antimicrobial activities of Aervajavanica and Paeoniaemodi plants. Pak. J. Pharm. Sci, 2012: 25(3), pp. 565-569.
[49] Ng, L.T., Yen, F.L., Liao, C.W. and Lin, C.C., Protective effect of Houttuyniacordata extract on bleomycin-induced pulmonary fibrosis in rats. The American journal of Chinese medicine, 2007: 35(3), pp. 465-475.
[50] Nishikimi, M., Rao, N.A. and Yagi, K., The occurrence of superoxide anion in the reaction of reduced phenazinemethosulfate and molecular oxygen. Biochemical and biophysical research communications, 2012: 46(2), pp. 849-854.
[51] Patra, J.K., Rath, S.K., Jena, K., Rathod, V.K. and Thatoi, H., 2008. Evaluation of antioxidant and antimicrobial activity of seaweed (Sargassum sp.) extract: A study on inhibition of Glutathione-S-Transferase activity. Turkish Journal of Biology, 2008: 32(2), pp. 119-125.
[52] Pavrez, M., Mahboob, H.K., Zahuul, I., Shek, M.H., Antimicrobial activities of the petroleum ether, methanol and acetone extracts of kaempferia galangal. rhizome.J. Life Earth Sci., 2005: 1, pp. 25–29.
[53] Peschel, W., Sánchez-Rabaneda, F., Diekmann, W., Plescher, A., Gartzía, I., Jiménez, D., Lamuela-Raventos, R., Buxaderas, S. and Codina, C., An industrial approach in the search of natural antioxidants from vegetable and fruit wastes. Food Chemistry, 2006: 97(1), pp. 137-150.
[54] Powell, W.A., Catranis, C.M. and Maynard, C.A., Design of self‐processing antimicrobial peptides for plant protection. Letters in applied microbiology, 2000: 31(2),pp. 163-168.
[55] Pyrzynska, K. and Pękal, A., Application of free radical diphenylpicrylhydrazyl (DPPH) to estimate the antioxidant capacity of food samples. Analytical Methods, 2013: 5(17), pp.4288-4295.
[56] Rice-Evans, C.A., Miller, N.J. and Paganga, G., 1996. Structure-antioxidant activity relationships of flavonoids and phenolic acids. Free radical biology and medicine, 1996: 20(7), pp.933-956.
[57] Sengul, M., Yildiz, H., Gungor, N., Cetin, B., Eser, Z. and Ercisli, S., Total phenolic content, antioxidant and antimicrobial activities of some medicinal plants. Pak J Pharm Sci, 2009: 22(1),pp. 102-106.
[58] Shan, B., Cai, Y.Z., Sun, M. and Corke, H., Antioxidant capacity of 26 spice extracts and characterization of their phenolic constituents. Journal of agricultural and food chemistry, 2005: 53(20), pp. 7749-7759.
[59] Sharma, N., Bhardwaj, R., Kumar, S. and Kaur, S., Evaluation of Bauhinia variegata L. bark fractions for in vitro antioxidant potential and protective effect against H2O2-induced oxidative damage to pBR322 DNA. African Journal of Pharmacy and Pharmacology, 2011: 5(12), pp. 1494-1500.
[60] Shanab, S.M., Antioxidant and antibiotic activities of some seaweeds (Egyptian isolates). Int J AgricBiol, 2007: 9(2), pp.220-225.
[61] Shi, Y.L., James, A.E., Benzie, I.F. and Buswell, J.A., Mushroom‐derived preparations in the prevention of H2O2‐induced oxidative damage to cellular DNA. Teratogenesis, carcinogenesis, and mutagenesis, 2002: 22(2), pp.103-111.
[62] Soare, J.R., Dinis, T.C., Cunha, A.P. and Almeida, L., Antioxidant activities of some extracts of Thymus zygis. Free radical research, 1997: 26(5), pp.469-478.
[63] Stephens, N.G., Parsons, A., Brown, M.J., Schofield, P.M., Kelly, F., Cheeseman, K. and Mitchinson, M., Randomised controlled trial of vitamin E in patients with coronary disease: Cambridge Heart Antioxidant Study (CHAOS). The Lancet, 1996: 347(9004), pp.781-786.
[64] Tabart, J., Kevers, C., Pincemail, J., Defraigne, J.O. and Dommes, J., Comparative antioxidant capacities of phenolic compounds measured by various tests. Food Chemistry, 2009: 113(4), pp.1226-1233.
[65] Tepe, B., Degerli, S., Arslan, S., Malatyali, E. and Sarikurkcu, C., Determination of chemical profile, antioxidant, DNA damage protection and antiamoebic activities of Teucriumpolium and Stachysiberica. Fitoterapia, 2011: 82(2),pp. 237-246.
[66] Tailor, C.S. and Goyal, A., Antioxidant Activity by DPPH Radical Scavenging Method of Ageratum conyzoides Linn. Leaves, American Journal of Ethnomedicine, 2014: 1(4) pp. 244-249.
[67] Tsai, C.H., Chang, R.C., Chiou, J.F. and Liu, T.Z., Improved superoxide-generating system suitable for the assessment of the superoxide-scavenging ability of aqueous extracts of food constituents using ultraweakchemiluminescence. Journal of agricultural and food chemistry, 2003: 51(1) pp.58-62.
[68] Wagner, H. and Bladet, S., Plant Drug Analysis-A TLC Atlas, 1st Edn, Springer verlag Berlin, Heidel berg, New York, 1996: pp. 195-214.
[69] Wojdyło, A., Oszmiański, J. and Czemerys, R., Antioxidant activity and phenolic compounds in 32 selected herbs. Food chemistry, 2007: 105(3) pp.940-949.
[70] Wong, C.C., Li, H.B., Cheng, K.W. and Chen, F., A systematic survey of antioxidant activity of 30 Chinese medicinal plants using the ferric reducing antioxidant power assay. Food chemistry, 2006: 97(4), pp.705-711.
[71] Yıldırım, A., Mavi, A., Oktay, M., Kara, A.A., Algur, Ö.F. and Bilaloǧlu, V., Comparison of antioxidant and antimicrobial activities of Tilia (TiliaargenteaDesf ex DC), sage (Salvia triloba L.), and Black tea

International Journal of Scientific and Research Publications, Volume 7, Issue 4, April 2017 30
ISSN 2250-3153
www.ijsrp.org
(Camellia sinensis) extracts. Journal of Agricultural and Food Chemistry, 2000: 48(10) pp. 5030-5034.
[72] Chen, Y.Y. Chen, C.M., Chao, P.Y., Chang, T.J. and Liu,J.F., “Effects of Frying Oil and HouttuyniacordataThunb on Xenobiotic-Metabolizing Enzyme System of Rodents,” World Journal of Gastroenterology, 2005: 11(3) pp.389-392.
[73] Zheng, H.Z., Dong, Z.H. and She, J., Modern study of traditional Chinese medicine. Xue Yuan Press Beijing China, 1998: 3,pp. 2057.
[74] Zheng, W. and Wang, S.Y., Antioxidant activity and phenolic compounds in selected herbs. Journal of Agricultural and Food chemistry, 2001: 49(11) pp.5165-5170.
[75] Yasir, M., Sultana, B. and Amicucci, M., Biological activities of phenolic compounds extracted from Amaranthaceae plants and their LC/ESI-MS/MS profiling. Journal of Functional Foods, 2016: 26, pp. 645-656.
[76] de Oliveira, V. M. A., Carneiro, A. L. B., Cauper, G. S. D. B. andPohlit, A. M., In vitro screening of Amazonian plants for hemolytic activity and inhibition of platelet aggregation in human blood. ActaAmazonica, 2009: 39(4), pp. 973–980.
[77] Tian, L., Zhao, Y., Guo, C. and Yang, X.,A comparative study on the antioxidant activities of an acidic polysaccharide and various solvent extracts derived from herbal Houttuyniacordata. Carbohydrate Polymers,2011: 83, pp. 537–544.
[78] Tekle, E.W., Sahu, N.P. and Makesh, M., Antioxidative and antimicrobial activities of different solvent extracts of Moringaoleifera: an in vitro evaluation. International Journal for Scientific and Research Publications, 2015: 5(5), pp. 255-266.
[79] Chiow, K.H., Phoon, M.C. Putti, T., Tan, B.K.H., Chow, V.T., Evaluation of antiviral activities of HouttuyniacordataThunb. extract, quercetin, quercetrin and cinanserin on murine coronavirus and dengue virus infection. Asian Pacific Journal of Tropical Medicine,2016: 9(1), pp. 1–7.
AUTHORS
First Author–Mr.NagungCamderTok, Fish Nutrition,
Biochemistry and Physiology Division, Central Institute of
Fisheries Education, Mumbai, Maharashtra, India.
Second Author - Dr. K. K. Jain, Principal Scientist,
Fish Nutrition, Biochemistry and Physiology Division, Central
Institute of Fisheries Education, Mumbai, Maharashtra, India.
Email- [email protected]
Third author -Dr. N. P. Sahu, Principal Scientist and
HoD, Fish Nutrition, Biochemistry and Physiology Division,
Central Institute of Fisheries Education, Mumbai, Maharashtra,
India. Email- [email protected]
Fourth Author – Ms Tincy Varghese, Scientist,
Fish Nutrition, Biochemistry and Physiology Division, Central
Institute of Fisheries Education, Mumbai, Maharashtra, India.
Email- [email protected]
Fifth Author – Mr.Daniel, N., Fish Genetics and Biotechnology
Division, Central Institute of Fisheries Education, Mumbai,
Maharashtra, India. Email- [email protected]
Correspondence author - Dr. K. K. Jain, Principal Scientist,
Fish Nutrition, Biochemistry and Physiology Division, Central
Institute of Fisheries Education, Mumbai, Maharashtra, India.
Email- [email protected]
International Journal of Scientific and Research Publications, Volume 7, Issue 4, April 2017 32 ISSN 2250-3153
www.ijsrp.org
An Assessment of Human Resource Management in the Academic Libraries - in the case of Amhara Region,
Ethiopia Dr. V. Ramadevi
Assistant Professor, Department of Information Science, Faculty of Informatics, University of Gondar, Ethiopia
Abstract- Human Resource Management plays very important role in any organization which facilitates the most effective use of employees to achieve the objectives of any organization. In this study, an attempt has been made to find out the issues relating to Human resource management in the academic libraries, professional engagement and views and comments to improve the library services in Amhara region, Ethiopia. Methodology followed for this study is survey method. For this, both primary and secondary data related to the study has been collected. Samples of 100 librarians and library staffs were selected from the academic libraries by using simple random sampling. The results pointed out that, the satisfaction and dissatisfaction of the respondents with their work, working culture, working condition and their salary and etc. This study assesses human resource function at the university level and then evaluates the specific structures of the academic library within the institution. The purpose of the study is to help both library and its parent organization in understanding each other’s views on HR issues and to evaluate the importance of an internal HR expert to deal the situations in the day to- day administration of the library. Index Terms- Management, Organization, Libraries and Information Centres (LICs) and Academic libraries, Library Administration and Organization
I. INTRODUCTION uman manpower is effectively utilized in the libraries for optimum utilization of available resources and for providing
better library services to the organization. Shifting workforce and labor market demographics, technology, globalization, economic uncertainty, and increased competition are factors requiring restore the human resources function to meet out the need and requirement in the organization. In any organization, human resources department is responsible for administrative and operational roles such as benefits and payroll processing, manpower handling, recruitment and selection and employee position changes. These are the main activities of the Human resource department. Maximizing the efforts of human beings and their contribution in the libraries and information centres (LICs) are not an easy task. It is a big challenge. In this present scenario, Information technology and outsourcing have allowed Human resource departments to achieve maximum efficiencies in managing the activities of human resources.
Now a day, optimum utilization of human resources and human relation is big challenge to achieve the goals and objectives of the organization. Libraries and information centres are facing the problem of managing the human resources and their contribution to maximizing the efforts towards library services. The priority should be given for the human resource management for successful of any organization. There is a new approach to improve the performance of human resource such as acquire new and innovative skills, satisfying the employees, reward them based on their performance, motivating the employees towards objectives of the organization, career development and training and development. The paper reviewed the HRM approach about awareness on the levels of participation by librarian and library staffs and how their working relations among employees and employers which may create an friendly environment that enhances overall performance of library management. Duties and responsibilities of Human resource in the areas of Academic libraries: Recruitment and Selection: Responsible to coordinate the activities include recruitment and selection of professionals’s in academic libraries such as recruitment of staff, professionals, semi-professionals, Administrative staff including non-professionals and technical assistants etc. Employment/Compensation: Responsible for monitoring library’s budgets, purchasing books and non-book material, salaries and other expenses recurring and non-recurring with the library administrative manager. Apart from that, manage the periodicals/journals and back volumes of journals, furniture etc. Position Administrator: Responsible for the technical processes like classification, cataloging, circulation, journals processing and job analysis process and coordinate the performance of the personnel management process which includes evaluation of librarians and staff. They are responsible for coordinating the faculty librarian’s position, maintenance, promotion process and etc. Organizational Development (OD): It is the process of enhancing the effectiveness of an organization and the well-being of its members through planned interventions.” The primary purpose of an OD intervention is to manage change; these can be “changes that improve the effectiveness of the organization or that enhance the relationships of groups or individuals.” Career Development: Career development is the “process by which individual’s progress through a series of stages in their careers, each of which is characterized by a relatively unique set of issues, themes, tasks”
H

International Journal of Scientific and Research Publications, Volume 7, Issue 4, April 2017 33 ISSN 2250-3153
www.ijsrp.org
Training and Development: Responsible to conduct comprehensive library employee orientation and employee training programs including needs assessment, curriculum design and development, and evaluation. Training will be given for the personnel such as on-the job and off-the job training to train the employees to perform well in their job to achieve the organizational objective.
II. STATEMENT OF THE PROBLEM The present study attempts to assess the human resource management related issues related to academic libraries in the universities. The different types of manpower handling are followed in Academic libraries, Amhara region, Ethiopia. Many qualitative differences in human resource administration are followed at University level. Therefore, it is important to study the issues relating to human resource management in the academic libraries in Amhara Region, Ethiopia.
III. LITERATURE REVIEW According to the Society for Human Resource Management (SHRM, 2002a), human resources management is “the design of formal systems in an organization to ensure the effective and efficient use of human talent to accomplish the organizational goals”. Bundy (2002) has put it, "the ultimate form of co-operation." Wikipedia (2014) defines HRM as “the strategic and
coherent approach to the management of an organization's most valued assets – the people working there, who individually and collectively contribute to the achievement of the objectives of the business”.
IV. OBJECTIVES OF THE STUDY To identify the issues of human resource in the
academic libraries To assess the Job satisfaction of the library
professionals To provide suitable suggestion to overcome the
problems
V. METHODOLOGY The present study is based on survey method. The study is based on both primary and secondary data related to the study. Samples of 100 librarians and library staffs were selected from the academic libraries in University of Gondar and Tebre Dabir University in Ethiopia by using simple random sampling. The percentage analyses were used to find out the assessment of human resource management in the academic libraries. Two sets of questionnaires were prepared and distributed for the librarians as well as library staff for collection of data.
VI. RESULTS AND DISCUSSION Table No.1 Percentage analysis of Manpower handling and Human resource management towards academic libraries
Range No of Respondents Percentage 1-25 - - 26-50 20 20% 51-75 51 51% 76-100 29 29% Total 100 100%
Source : Own Survey 2016
0
20
40
60
80
100
120
26-50 51-75 76-100 Total
Percentage -
No of Respondents -
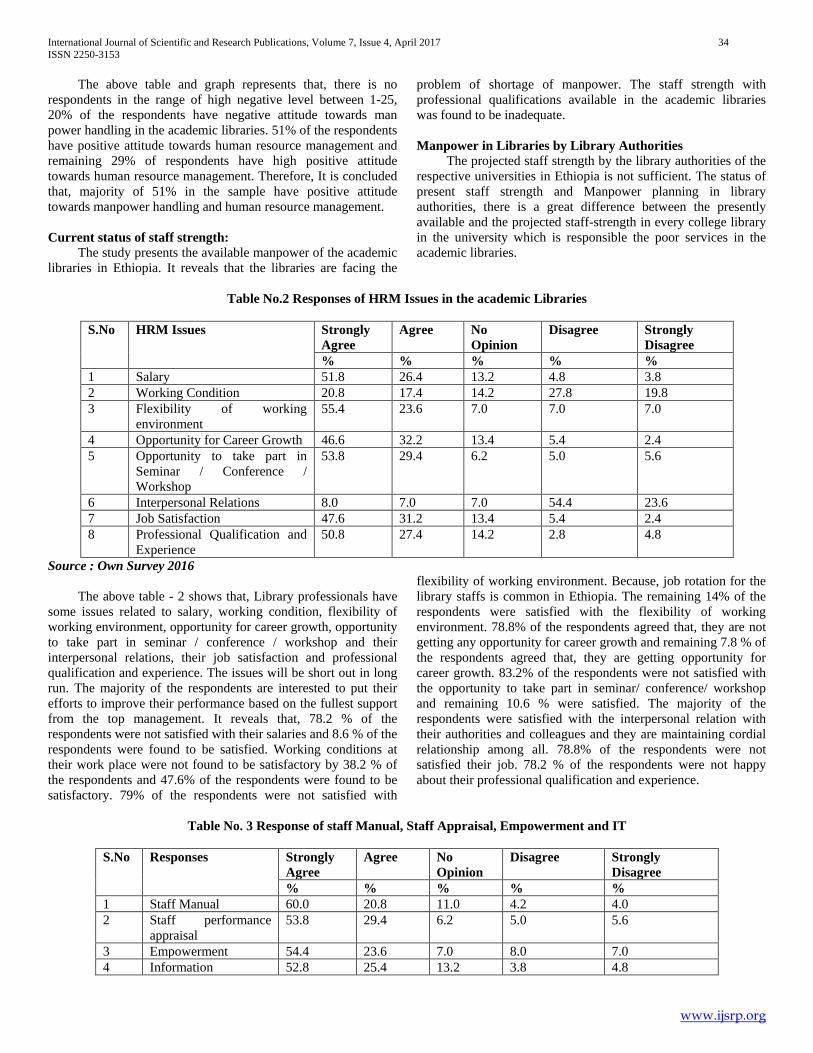
International Journal of Scientific and Research Publications, Volume 7, Issue 4, April 2017 34 ISSN 2250-3153
www.ijsrp.org
The above table and graph represents that, there is no respondents in the range of high negative level between 1-25, 20% of the respondents have negative attitude towards man power handling in the academic libraries. 51% of the respondents have positive attitude towards human resource management and remaining 29% of respondents have high positive attitude towards human resource management. Therefore, It is concluded that, majority of 51% in the sample have positive attitude towards manpower handling and human resource management. Current status of staff strength: The study presents the available manpower of the academic libraries in Ethiopia. It reveals that the libraries are facing the
problem of shortage of manpower. The staff strength with professional qualifications available in the academic libraries was found to be inadequate. Manpower in Libraries by Library Authorities The projected staff strength by the library authorities of the respective universities in Ethiopia is not sufficient. The status of present staff strength and Manpower planning in library authorities, there is a great difference between the presently available and the projected staff-strength in every college library in the university which is responsible the poor services in the academic libraries.
Table No.2 Responses of HRM Issues in the academic Libraries
S.No HRM Issues Strongly
Agree Agree No
Opinion Disagree Strongly
Disagree % % % % %
1 Salary 51.8 26.4 13.2 4.8 3.8 2 Working Condition 20.8 17.4 14.2 27.8 19.8 3 Flexibility of working
environment 55.4 23.6 7.0 7.0 7.0
4 Opportunity for Career Growth 46.6 32.2 13.4 5.4 2.4 5 Opportunity to take part in
Seminar / Conference / Workshop
53.8 29.4 6.2 5.0 5.6
6 Interpersonal Relations 8.0 7.0 7.0 54.4 23.6 7 Job Satisfaction 47.6 31.2 13.4 5.4 2.4 8 Professional Qualification and
Experience 50.8 27.4 14.2 2.8 4.8
Source : Own Survey 2016 The above table - 2 shows that, Library professionals have some issues related to salary, working condition, flexibility of working environment, opportunity for career growth, opportunity to take part in seminar / conference / workshop and their interpersonal relations, their job satisfaction and professional qualification and experience. The issues will be short out in long run. The majority of the respondents are interested to put their efforts to improve their performance based on the fullest support from the top management. It reveals that, 78.2 % of the respondents were not satisfied with their salaries and 8.6 % of the respondents were found to be satisfied. Working conditions at their work place were not found to be satisfactory by 38.2 % of the respondents and 47.6% of the respondents were found to be satisfactory. 79% of the respondents were not satisfied with
flexibility of working environment. Because, job rotation for the library staffs is common in Ethiopia. The remaining 14% of the respondents were satisfied with the flexibility of working environment. 78.8% of the respondents agreed that, they are not getting any opportunity for career growth and remaining 7.8 % of the respondents agreed that, they are getting opportunity for career growth. 83.2% of the respondents were not satisfied with the opportunity to take part in seminar/ conference/ workshop and remaining 10.6 % were satisfied. The majority of the respondents were satisfied with the interpersonal relation with their authorities and colleagues and they are maintaining cordial relationship among all. 78.8% of the respondents were not satisfied their job. 78.2 % of the respondents were not happy about their professional qualification and experience.
Table No. 3 Response of staff Manual, Staff Appraisal, Empowerment and IT
S.No Responses Strongly
Agree Agree No
Opinion Disagree Strongly
Disagree % % % % %
1 Staff Manual 60.0 20.8 11.0 4.2 4.0 2 Staff performance
appraisal 53.8 29.4 6.2 5.0 5.6
3 Empowerment 54.4 23.6 7.0 8.0 7.0 4 Information 52.8 25.4 13.2 3.8 4.8

International Journal of Scientific and Research Publications, Volume 7, Issue 4, April 2017 35 ISSN 2250-3153
www.ijsrp.org
Technology Source : Own Survey 2016 The above Table-3 reveals that, library staff manual available in any library for specific duties were assigned to the library professionals from time to time. It shows that, staff appraisals were not found in anywhere in the library. It is necessary to implement the 360◦ performance appraisal to improve the individual performance. It also shows that, lack of awareness about the concept of empowerment in the libraries. It also reveals that the libraries surveyed were having computer facility, but they have lack of knowledge to operate it.
VII. FINDINGS OF THE STUDY - The present staff strength was inadequate in most of the libraries. Some library staffs were found that, they are working with inadequate qualification and without any library. The recruitment and selection were concerned without any library background. No fresh recruitment have been made within last 5 years in most of the libraries based on the same library background .- Facilities available to the library professional for their career growth and development were not found to be satisfactory when compared to teaching staffs whereas teaching staffs are getting opportunities to enhance their qualification to go abroad. - There is no library staff manual found in the libraries. - Staff performance appraisal was not found in the libraries. - The lack awareness about the concept of empowerment in the academic libraries. - Mostly, the relationship of the library professionals with authorities and colleagues were cooperative and cordial. - The libraries have fullest computer facility where CDS/ISIS package was also available. Library professionals were found reluctant to adopt information Technology as they were not trained to handle it. Library should be digitalized.
VIII. CONCLUSION Library administrators must frequently constantly assess how effectively functioning human resource activities in the academic library. They need to assess their present needs, culture and the climate in their day to day operation of the institute. Top management should concern about the morale of the employees. Good management skills are required for managing the human resource. Apart from that, leadership styles used to handle the manpower, concern about the employees, issues related to work life balance, salary, reward the employees, developing the interpersonal skills, opportunity to participate in the workshop, conference / seminar and helps to develop their decision making skills will lead to successful of the organization.
IX. RECOMMENDATIONS A library staff manual should be prepared and designed
including job description, job specification, role and responsibilities, role relations, tools and techniques related to each job, etc. It will help them to relieve the
librarian from involved in routine tasks. The staff will get sufficient information and clarity regarding their tasks.
Empowerment is important area which needs attention. It allows the concerned staff member to work out suitable solution for some problematic cases. It will be possible when the climate of faith exists.
Staff development is another important area to which more attention required. Librarian should identify the training need requirements of the academic library staff. When proper training will be given to the employees, they are possible to take decision independently regarding the day to day operation of the library. It saves their time and helps to satisfy their stakeholders.
Need to motivate them towards to acquire qualifications, allow them to learn the new skills like basic computer skills, participating in the workshop, seminar and allow them to attend the in-bound and out-bound training relating to library system and management.
All the library staffs should be motivated towards apply for promotion which enables them to go greater height based on their qualification and experience and publication in the referred journals. Once they get promotion from one level to another level, it will motivate them to show interest in their job. They should be recognized both in the monetary and non-monitory way to achieve the excellence in their work and for their future prospects based on the university legislation.
All the librarians and library professionals should have the knowledge about computer application and how to operate. In the globalised era, information technology plays important role which provides latest information. It saves time of the librarian when compare to manual works. Everyone in the academic library professional should update with latest technology. So that, libraries can reach store house of the knowledge to modern technology i.e. digitalized era.
Total quality management concept should applied for the library such as six sigma concept (zero defects), 5s model, ISO 9001-2000, Just in Time to improve the efficiency, ability and skills of the library professionals. It will improve their overall performance of the academic libraries. It provides better and improved library services and information products and services of quality which ensures customer satisfaction of library science.
University authorities should give priority to the development of academic libraries that are the Knowledge Centers, where information can be generated, transformed and retrieved back and play an important role in the higher education. They should provide sufficient library budget so that those libraries can develop their collection and fulfill their parent organization objectives.
In the competitive world, talented manpower should be identified and selected to meet the challenges in the

International Journal of Scientific and Research Publications, Volume 7, Issue 4, April 2017 36 ISSN 2250-3153
www.ijsrp.org
Libraries / Information Centres. Human relation plays the centre of the heart in LICs. Every success and failure depends upon the proper manpower planning in the academic library.
REFERENCES [1] Aaron, Shirley L. (1992). The role of combined libraries in Florida phase I:
Surveying the literature. Tallahassee: Florida State University. [2] Bach, S. (2005), Managing human resources: personnel management in
transition. USA: Blackwell publishing Inc. [3] Butteriss, M. (Ed.). (1998). Re-inventing HR: changing roles to create the
high-performance organization. New York: Wiley. [4] Byars (LL). (1987). Human Resource Management. Illinois: lrwin. [5] Bundy, Alan. (1998).Widening client horizons: joint use public libraries in
the 1990s.APLIS, 11(1), pp 4-16.. [6] Dickens, P. (1994). Quality and excellence in human services. Chichester:
John wiley.. [7] Drinan, H. G. (2002). HR outsourcing: Opportunity or threat? HR
Magazine, 47(2), 8. [8] Jorden, P. (1995). Staff management in library and information work.
Hampshire: Gower. [9] Lynch, B. P. and Robles-Smith, K. (2001). The changing nature of work in
academic libraries. College & Research Libraries, 62(5), 407–420.
[10] Malden, MA. and Durey, P. 1976). Staff management in university and college libraries. Oxford: Pergamon Press.
[11] Sherman (AW). (1988). Managing human resources. Cincinnati : South Westerns Publishing.
[12] Simmons-Welburn, J. and McNeil, B. (2004). Human resource management in today’s academic libraries – meeting challenges and opportunities. Libraries unlimited, Westport, CT.
[13] Society for Human Resource Management (SHRM). (2002a). SHRM learning system. Module 1: Strategic management. Alexandria, VA: SHRM.
[14] Society for Human Resource Management (SHRM).(2002b). SHRM learning system. Module 3: Human resource development. Alexandria, VA: SHRM.
[15] Wayne (F C). Human resources management: an information system approach . Virginia: Reston, 1981.
[16] Wikipedia (2014). Wikipedia, available at: www.12manage.com/i_hr.html (accessed 20 March 2014), retrieved at June 2014.
AUTHORS First Author – Dr. V. Ramadevi, Assistant Professor, Department of Information Science, Faculty of Informatics , University of Gondar, Ethiopia.
International Journal of Scientific and Research Publications, Volume 7, Issue 4, April 2017 37 ISSN 2250-3153
www.ijsrp.org
A review on Causes and Consequences of Rural- Urban Migration in Ethiopia
Birhanu Melesse *, Dr.Kavitha Nachimuthu **
* Lecturer, Department of Rural Development and Agricultural Extension, College of Agriculture and Rural Transformation, University of Gondar, Ethiopia.
** Associate Professor, Department of Rural Development and Agricultural Extension, College of Agriculture and Rural Transformation, University of Gondar, Ethiopia.
Abstract- The study specifically aims to review cause and consequences of rural- urban migration in Ethiopia. Environmental degradation, lower agricultural productivity, inadequate social services, demographic pressure, land shortages in rural areas were identified as the major push factors of migration. Although “push” factors predominate, there are some significant “pull” factors that attract rural people to urban areas such as education, health services, security, better job, advancement opportunities and other urban amenities. Depending on reviewed document, the most significant consequences of migration in the urban areas are overcrowding and congestion, strain on urban social services rising food costs, worsening air and water quality and increasing violence, prostitution and diseases are important. Index Terms- Causes, Consequences, Migration, Rural and Urban.
I. INTRODUCTION igration and mobility continue to attract much interest, but also growing concern. The 2013 World Policies report
states that, ”among 185 countries with available data in 2013, 80 per cent of governments had policies to lower rural to urban migration, an increase from 38 per cent in 1996” (UN DESA, 2013). This proportion is highest in low- and middle-income nations in Africa and Asia – the regions that are currently undergoing urban transitions. Rural-urban migration has been historically connected with industrialization, urbanization and economic growth (Bhattacharya, 1993). Rural-urban migration eases inter-sectoral factor mobility and plays a vital role for structural changes. Moreover, migration has also been a key livelihood and survival strategy for many poor groups across the developing world, particularly in Africa. In Africa, migration has been considered as a way of life where the people migrate from place to place due to political, socio-economic and demographic reasons. Rural-urban migration has contributed for half of the urban population growth in Africa in 1960s and 1970s and about 25% of urban growth in 1980s and 1990s (Waddington & Sabates-Wheeler, 2003; Adepoju, 1977; Lall et al, 2006). Concentration of investment in industries, commerce, and social services in towns has been the causes for regional inequalities and differences in economic opportunities. In addition, the productivity of the rural and agricultural sector has remained low
and leading to rural out-migration to urban and industrial sectors (Adepoju, 1977). Similarly, Ethiopia has been common mainly in the form of rural-urban migration flows (Fransen and Kuschminder, 2009). As a result, rural-urban migration trend in Ethiopia can be explained by a number of so-called push and pull factors (Kunt, 1973 cited in Fransen and Kuschminder, 2009). Markos and Gebre-Egziabher (2001) summarize the main push factors in Ethiopia as being over population, famine, poverty, land scarcity and lack of agricultural resources. In addition to these push factors; many rural people are being pulled to Ethiopian urban areas as a result of the development of these areas into more important business centers (Betemariam and White, 1999). Migration in Ethiopia was not only an individual and/or family response to adverse socio economic, physical and political environment, but also as a result of the official government policy. Therefore, the paper reviews the causes and consequences of rural-urban migration to provide significant suitable planning and response strategies to the emerging challenges and problems.
II. LITERATURE REVIEW Concepts and Definitions Migration can be defined in terms of spatial boundaries as internal and international. Internal migration is the movement of individuals within a country whereas international migration involves the flow of individuals between countries where national boundaries are crossed. The UN (1970:2) defines migration as: “ a move from one migration defining area to another (or a move of some specified minimum distance) that was made during a given migration interval and that involves change of residence.” A migrant is also defined as: “a person who has changed his usual place of residence from one migration-defining area to another (or who moved some specified minimum distance) at least once during the migration interval” (UN, 1970:2). Migration is considered as the movement of people from one geographic region to another, which may be on temporary or permanent basis. It usually takes place at a variety of scale; intercontinental (between continents), intracontinental (between countries of a given continent), and interregional (with in countries) (National Geographic Society, 2005). However, the nature of migration and the cause for it are complex, and there is no general agreement among researchers on the cause of migration. Arguments about the difference on
M
International Journal of Scientific and Research Publications, Volume 7, Issue 4, April 2017 38 ISSN 2250-3153
www.ijsrp.org
migration causing factors exist not only among researchers from different discipline, but also among researchers within one discipline (Timalsina, 2007). Thus, concepts and approaches of classifying migration are other important aspects of migration study. Any classification of migration is difficult to formulate and understand because it takes into consideration numerous criteria or stimulating factors of varying nature (Trewartha, 1969 and Vyanga, 1981 cited in Sinha, 2005).
III. TYPES OF RURAL-URBAN MIGRATION Migration is usually categorized depending up on the type of political boundaries crossed (for internal and external/international) (Weeks, 1989). Depending upon length of time, it is said to be short-term and long-term migration as well as temporary and permanent migration (McDowell and De Haan, 1997). On the basis of distance, it may be classified as short distance and long distance migration, members involved (individual and mass migration), decision making (voluntary and forced migration) movement of people based on interest; Involuntary migration: the movement of people from place of origin to new areas because of war (armed conflict), environmental degradation or natural disaster such as drought and famine, social organization (family, class and individual migration), causes (economic and non-economic) and aims (conservative and innovative) (Sinha,12 2005). Depending up on rural-urban nature of the area, migration becomes, rural-rural, rural to urban, urban to rural and urban to urban (Clarke, 1987 cited in Sinha, 2005). One of the most significant migration patterns has been rural to urban migration, i.e. the movement of people from the country side to cities in search of opportunities (National Geographic Society, 2005; Rwelamira, 2008). It is also possible to classify migration into five major types based on the situation of migrants: Primitive Migration: migration in response to environmental conditions undertaken by people at low levels of development; Focused Migration: compulsory transfer of a group of people, usually by a government. Impelled Migration: similar to forced migration but it is differs as the migrants retain some ability to decide whether to move or not; Free migration: individual movements for economic betterment; Mass Migration: large numbers or entire communities, moving in mass without being fully informed on an individual basis of what to expect. Moreover, the common types of rural-urban migration are circulating in the following forms including step migration (village-town-city), circulatory (village-city-village), seasonal (migration associated with periodic labor demand) and chain migration (where migrants follow their predecessors, and assisted by them in establishing an urban area) (Lynch, 2005; National Geographic Society, 2005). Urban-ward migration in Ethiopia is both direct and step-wise. About 75 percent of in-migrants to Shashemene (Bejeren, 1985:54) and 62.5 percent of rural urban migrants to Awassa (Berhane, 1993:86) were step-migrants. On the other hand 57.6 and 74 percent of the migrants to Nazareth (Kebede, 1991:80) and 35 Arbaminch (Birru, 1997:53), respectively, were direct migrants. The same studies indicated that step-wise migration is more common among urban-urban migrants than rural-urban migrants. The majority of urban in-migrants in Ethiopia are short distance migrants. But compared to rural-rural migrants, urban-
ward migrants (ruralurban and urban-urban) are less common and are relatively long distance migrations (CSA, 1992:145; Markos and Seyoum (eds), 1998:164). Urbanward migration studies on Shashemene (Bejeren, 1985:53), Nazareth (Kebede, 1991:70), Awassa (Berhane, 1993:72) and Abraminch (Birru, 1997:50) indicate the predominance of rural-born migrants in the stream. This is not only an indication of the high propensity of rural population to migrate but also the low level of urbanization in the country. The other concept related to migration is the push-pull which concerned with reasons for migration. It explains that, for any individual the decision to migrate results from the interplay of 'push' and 'pull' factors. The 'push' factors are pressures which encourage individuals or families to leave one place (the rural home land). Most of the literatures reveal that people are forced to leave their living environment (original places) because of different unfavorable socio-economic, cultural, natural and political conditions, which are referred as ‘push factors’. Some of the push factors are negative home conditions that impel the decision to migrate, eg. lack of job opportunities, lack of resources, unfavorable climatic condition, low crop yield, land shortage, poor employment prospects etc. The 'pull' factors are attractions of the destination (attractions of the city). For example high wages, employment opportunities, wide range of amenities etc. (Gmelch and Zenner, 1996:190; Broadly and Cunningham, 1994:22). In some cases only 'push' factors will be of major importance and in other situations, 'pull' factors will be of overwhelming importance which include those positive attributes perceived to exist at the new location, such as job opportunity, better climate, educational opportunity. (Witherick , 1994:79 and Hornby and Jones, 1993:102).
IV. FACTORS OF RURAL-URBAN MIGRATION IN ETHIOPIA Migration is a strategy for moving out of poverty that is accessible to the poor in rural Ethiopia. It is often a risky investment, it has low short term returns, has the potential to end in disaster, exposes migrants to exploitation, hard work and abuse. However, in many cases it is the only investment opportunity available, and the only opportunity some of the rural poor have to change their lives. Many of the participants in this research linked migration to education, and the comparison illustrates the nature of migration as an investment in human capital. The poverty and lack of opportunity that accessing and completing education is extremely difficult and has high opportunity costs for rural households. It is a major investment for a poor household to send all their children to school, which requires considerable sacrifice. It is also an investment that often does not pay off. Despite levels of decisions, studies conducted on migration agree that there are important factors that would lead to migration decisions. The type of people migrating and levels of decisions made, the reviewed literatures so far showed that rural-urban migration has push and pull factors although the extent could differ contextually. The Ethiopian rural areas have been experiencing a lot of problems pushing their residents towards migration. Although population pressure and food insecurity have been increasingly becoming obvious push factors, lack of access to farm land is the major problem, which force most
International Journal of Scientific and Research Publications, Volume 7, Issue 4, April 2017 39 ISSN 2250-3153
www.ijsrp.org
people to leave their areas (Abate, 1989, cited in Ezra and Kirso, 2001:750). Environmental degradation, lower agricultural productivity, inadequate social services, demographic pressure, land shortages in rural areas were identified as the major push factors of migration (Kebede, 1991; Sileshi, 1978; Befekadu, 1978). Similarly Markos and Gebre-Egziabher (2001) state that, population pressure, famine, poverty, land scarcity and lack of agricultural resources push the rural people to the urban areas of Ethiopia. Empirical Studies on Causes and Consequences of Rural-Urban Migration in Ethiopia Causes of Rural-Urban Migration in Ethiopia Available studies indicated that rural-urban migration in Ethiopia is a suitable mechanism to improve own and families’ living standards and to relax land constraints in the rural areas (Brauw and Mueller, 2011:3). Most of the studies agree that the Ethiopian rural areas are characterized by weak socio-economic conditions, unreliable weather for agricultural activities, poor infrastructure and environmental degradation (Demeke and Regassa, 1996, cited in Ezra and Kiros, 2001:752 and Brauw and Mueller, 2011:6). According to Feleke (2005), in the four Kolfe (one of Addis Ababa's sub-cities) migrants in theses urban neighborhoods have revealed rural poverty as their initial and main reasons for the migration of male migrants notably from the Southern Nations, Nationalities and Peoples Region (SNNPR), Amhara, Oromiya, and, to some extent, from Tigray. Like the case of Shashemene, the main push factors are rural vulnerability and lack of assets expressed in the form of diminishing farmland sizes in all their rural localities and shortage of landholdings, lack of rain, recurrent drought, absence of an effective extension system, limited investment in irrigation based agriculture, high population pressure, lack of off-farm employment opportunities, and imposition of heavy taxes. In addition to this, pull factors for their step migration mentioned by urban male migrants included increasing construction activities, demand for urban domestic workers, better pay for service work and the presence of social support from the long term migrants in Kolfe ( Feleke, 2005). Among these predictors four of them (namely, household size, educational status, sex, and ethnicity) are found to have significant relationship with the response variable. Households with 4-6 members are 35.1 percent less likely to migrate because of economic reason compared to the reference category. Similarly, households with 10+ members are 87.6 percent less likely to migrate because of economic reasons compared to the reference category. It is also evident from the table that the odds of migration because of economic reason increase steadily as educational status of household heads increases. The same table indicates that female migrants are 1.6 times more likely to migrate because of economic reasons compared to their counterpart male. The relationship between ethnicity and reasons for migration was found to be significant only for Amhara migrants (Alemante et al., 2006). Zewdu and Malek (2010) indicated that rural urban migration in Ethiopia could be triggered by low income generated in the agriculture sector and need to diversify activities
in other sectors. However, the majority of cases in Ethiopia show that the poor have more inclination for migration than the rich. Unlike experiences in other countries, with diminishing income opportunities, the poor tend to migrate than the rural rich in Ethiopia (De Haan et al, 2000, cited in Zewdu and Malek, 2010:15). Hence, the nature of the factors would happen to be more of problem driven. A study conducted on seasonal migration in the Amhara Region of Ethiopia (Gete et al., 2008b) showed that the young and single men tend to migrate seasonally because they do not have land to work on and means of subsistence to establish their own livelihood. Land policy and other related political decisions may force subsistent farmers to tie themselves with a piece of land and avoid being away. Nevertheless, with the new generation remaining landless and land fragmentation reaching to an unaffordable level, migration to urban areas is something that every desperate rural residents would like to embark on. In the mentioned study, in the Amhara Region, 55 percent of the respondents who are young and single migrate seasonally (ibid). Similarly, Mesfine (1986) and Betemariam and White (1999) also witnessed that landlessness, agricultural policy, population pressure, recurrent drought and famine, war and political crisis were the major factors responsible for mobility and they also stated that the difficulty of locating all the various factors causing rural exodus. There is evidence that small plot of farmlands, which are inadequate to support a family, are a driver of migration (World Bank, 2010). Gibson and Gumru (2012) report that a development initiative providing water taps in villages in Ethiopia led to lower mortality rates and higher fertility. The resulting competition between male siblings for land led to higher rates of migration in the villages that had taps than those that did not. For women and girls, there is evidence that early marriage and sexual abuse are drivers of migration (World Bank, 2010). Nevertheless, migration rates in Ethiopia are relatively low. Migration is mainly to nearby towns, and for the purpose of employment (de Brauw et al. 2013a; World Bank, 2010). Low rates of migration may be linked to land ownership policies in Ethiopia. All land is owned and allocated by the government and households maintain the right to farm it through continuous residence and use of the land, this mitigates against migration (de Brauw and Mueller, 2012). The review document revealed that the significant cause of migration is lack of land ownership in rural areas. Therefore, it is an indicator that to develop policies and strategies which include engaging rural youth in non-farm activities and establish different income generating activities by providing loan and extension service for the rural people. Tesfaye (2009) also state that in rural Ethiopia, migration of labor is a common practice by the rural people during the slack farming season so as to supplement their income. This type of migration is undertaken even in normal times so as to diversify household livelihood portfolio and as a copping strategy in poor farming periods. Zewdu and Malek (2010) argue that improved agricultural productivity could facilitate rural-urban migration with growing non-farm activities. This assumption seems to show increasing capacity and opportunity with growing agricultural output per person. Those who are able to hold adequate farming land could

International Journal of Scientific and Research Publications, Volume 7, Issue 4, April 2017 40 ISSN 2250-3153
www.ijsrp.org
strive towards improved productivity by using their available labor and investing on agricultural inputs. Again investing on non-farm activities depends on available opportunities in rural areas. This idea seems to contradict with a theory revealing that rural-urban migration improves productivity per person because of increasing or not diminishing holding sizes. Abdurahaman (1987) in his study indicated that the main reasons for internal migration in Ethiopia are regional inequality of development and income; existence of population pressure; low agricultural productivity; attraction of towns; ethnic violence and other similar reasons. Although “push” factors predominate, there are some significant “pull” factors that attract rural people to urban areas such as education, health services, security, better job, advancement opportunities and other urban amenities (Birru, 1997; Befekadu, 1978).The presence of relatives and friends as well as the flow of information between origin and destination has been also identified as among the most important factors and key influences on the pattern of migration (Beyene, 1985; Bjeren 1985; Worku, 1995). Worku (1995) in the case of Gurage migration states that migrants from some areas migrate not necessarily because they are among the poorest but groups can develop a tradition of migration, once certain patterns of migration exist. He argues that Gurage’s engagement in self-employed occupation such as petty trade, and settlement on the permanent basis in urban areas provided a strong source of attraction for further Gurage urban migration. A study conducted in Ethiopia, in selected kebeles of Shashemene (Juron, 1985) indicated that the major reasons for in-migration are of two types: Economic reasons:- individuals are migrating to get a job, transferred by the government and trading; Social reasons:- migrants were brought to town by relatives, divorced, or married someone in town and the like. Apart from economic reasons, social and cultural factors play an important role in rural-urban migration. People with better-off in their income could migrate to urban centers to get a better social infrastructure (education, health) driven by urban amenities, urban culture and lifestyle. In urban areas, there is a better access to information, modern technologies and modern way of thinking. The significant outflow of workers and inflow of remittances, as well as the continuous exchange of goods, ideas and cultural values, have changed the rural landscape economically, socially and demographically (IFAD, 2007; Mendola, 2006). According to (Alemante et al., 2006) indicated that women are increasingly migrating to urban areas in search of job opportunities and better life. Some of the women are taking migrations as the only way out from the marriage arrangement as a result of harmful traditional practices such as early marriage, abduction and unhealthy relationship in the family. In most cases the intended pull factor might not actually be reachable due to the poor skills and the overall negative attitudes of the community towards women. As a result, women who migrated from rural areas are forced to be engaged in activities such as housemaid, domestic works and other low paying and risky activities which ultimately expose them to various abuses such as sexual harassment, labor exploitation, rape, unwanted pregnancy, physical abuse and the like. On the other hand, how the prospective migrants perceive living conditions in destination
areas may have a decisive influence on migration. Migrants are attracted to towns by the favorable attitudes they have regarding city living.
V. CONSEQUENCES OF RURAL-URBAN MIGRATION IN ETHIOPIA
The effects of migration are viewed from two directions. On one hand migration causes excessive urbanization, unemployment, income inequalities, ecological stress and population mal-distribution whereas on the other hand migration is a necessary part of economic growth, equilibrating tendencies, facilitating industrialization, improving income distribution and introducing technological change in agriculture, and generalize that migration is the human right ensuring choosing one's destination to improve welfare and economic benefit. The effects of the movements from an area of origin to areas of final or temporal destination have been well documented in literature such as Anarfi et al (2003),Nabila (1974), Mahama et al. (2012) to mention a few. The consequences of migration are numerous in the urban areas among which overcrowding and congestion, strain on urban social services rising food costs, worsening air and water quality and increasing violence, prostitution and diseases are important. Alemante et al., (2006) found in their study, (42.8 percent) male migrants than female migrants (31.5 percent) have reported to be suffering from serious food insecurity or insufficiency. The Chi-square result has also shows significant association between the sex of the migrant and vulnerability to food insecurity at the place of destination (P-value of 0.002). Migration puts pressure on schools, health services, and food items prices to rise. As economic conditions of urban centers worsen, a growing number of people shift from employment in the formal sector to work in the informal labor market. Employment in the informal sector is less secure, and incomes are lower than formal sector. Within the informal sectors, the urban poor work in variety of jobs, such as, as street venders, petty traders, taxi drivers and in other small transport, in personal services such as shoe shiners, in security services such as night watchmen, car parking attendants, janitorial services, and also begging and commercial sex workers. These diverse activities share the common thread of low status, low wages, long hours, and often dangerous and insecure working conditions. Homelessness among migrants was reported to be one of the most serious reported problems. It is observed that 57.4 percent of males and 53.1 percent of females have reported to face homelessness. Further, 40.9 percent of males and 45.8 percent of females are reported to feel that they have experienced unequal opportunities in every aspect of life. It is also apparent to note that some respondents (5.2% of males and 12.1 percent females) have reported to encounter repeated social crises such as steetism and prostitution at the place of destination (Alemante et al., 2006). The economic activities of the rural area are mainly agricultural in nature, which are performed manually with application of traditional technology and labour intensive in nature. Since rural-urban migration is selective of certain characteristics, it affects the composition of the population in

International Journal of Scientific and Research Publications, Volume 7, Issue 4, April 2017 41 ISSN 2250-3153
www.ijsrp.org
sending areas. Thus, out migration areas loss a disproportionate percentage of younger and better educated population. As a result, the proportion of the total population economically dependent increases as the relative share of economically active working labour force is reduced which consequently lead to decrease in rural productivity (Aliyev, 2008; Caldwell, 1969 cited in IDRC, 1977; Mendola, 2006) even though the consequence of out-migration on rural productivity and social progress is clearly not known. Alemante et al., (2006) indicated that the gender differential of reported sexual harassment is more for female migrant (18.0%) than males (4.7%). Overall, about 10.5 percent of migrants have reported to face sexual harassment of one kind or the other. The association between the sex of migrant and risk of harassment found to be significant at 0.001 (P-value of 0.000). Small proportion of both males and females reported to be vulnerable to crimes of some kind during the course of their stay at the place of destination. Such vulnerability, however, has not yield gender relationship. The temporary and circulatory nature of migration creates conducive environment for the transmission of STDs such as HIV/AIDS. Migration has been linked to STDs in many countries. For example, villagers in Thailand, Uganda, Nigeria and Ghana mentioned that migrants often return with HIV/AIDS (Deshingkar and Grimm 2005). Thus, migratory movements cannot be blamed for the spread of STDs. Certain migratory movements may increase STDs infection rates, as can be argued in the case of male only migration in South Africa mining industry and its social consequence (example the creation of second families) (Deshingkar and Grimm 2005). Similarly, Alemante et al., (2006) reported that 21.4 percent of males and 27.2 female migrants faced the risk of contracting diseases once or more times during the course of their life as migrants in the current destination. The overall proportion shows that, about 23.4 percent of all migrants have encountered sickness at least once. The Chi-square analysis also revealed that there is some association between sex of the migrant and sickness encountered. The migration of rural youth in to urban area means, they are introducing themselves with new environment in terms of physical setup of the area, and the culture as well. Their interaction with the people in the urban area would lead to lose of their traditional culture where they grew (Andersen, 2002; Jamilah, 1981). The UN (1991) reported that the migration which is caused by population pressure becomes age and sex selective. The result will be a rejuvenation of the population structure of the urban area at destination because the migrants are younger than the resident population. Moreover, some studies demonstrated that the age selectivity nature of rural-urban migration supplies cities with more young adults which in turn increase crude birth rates in cites and urban areas.
VI. CONCLUSION Migration has environmental, economic, social and cultural factors that play an important role in rural-urban migration. Rural People with highly drought prone and environmental degraded area low income, poor access to social services could migrate to
urban centers to get a better social infrastructure (education, health) driven by urban amenities, urban culture and lifestyle. In urban areas, there is a better access to information, modern technologies and modern way of thinking. The significant outflow of workers and inflow of remittances, as well as the continuous exchanges of goods, ideas and cultural values, have changed the rural landscape economically, socially and demographically.
REFERENCES [1] Adewale, A. O. (2005). Socio-Economic Factors Associated with Urban-
Rural Migration in Nigeria: A Case study of Oyo State. Journal of Human Ecology, Vol.17 No.1, pp.13- 16.
[2] Adepoju, A.(1977). Migration and Development in tropical Africa: Some Research Priorities; Department of Demography and Social Statistics at the University of Ife, Nigeria; pp.210-225.
[3] Alemante Amera, Ansha Yesufe and Waktole Tike,(2006). “Causes, Patterns and Effects of Migration in SNNPR”.Hawassa University, Hawassa.
[4] Anarfi JK, Kwankye SO. (2009). Independent North-South Child Migration in Ghana: The Decision-Making Process Migration DRC Working Paper No T29.
[5] Berhane Keleta, (1993). Migrant's Attributes and Some of the Causative Factors of Migration: The Case of Awassa Town, M.A. Thesis, Addis Ababa University.
[6] Betemariam Berhanu and White, M. (1999). War, Famine and Female Migration in Ethiopia: 1960–1989. Brown University, Population Studies and Training Center, Working Paper No. 28.
[7] Beyene Doilicho (1985). The Pattern of Labour Migration to Metehara Estate and Neighboring State Farms. M.A. Thesis in Geography, Addis Ababa University.
[8] Bhattacharya, P.C. (1993). Rural-Urban Migration in Economic Development. Heriot-Watt University. Journal of Economic Surveys Vol. 7(3): 243-281; Basil Blackwell Ltd.
[9] Birru Busha (1997). Causes and Consequences of Rural-Urban Labor Migration in Ethiopia: The Case of Arba Minch town. MA. Thesis in Geography, Addis Ababa University
[10] Brauw, A. and Mueller, V. (2011). Do Limitations in Land Rights transferability Influence Mobility Rates in Ethiopia?. Working Paper No. 018. Development Strategy and Governance Division, International Food Policy Research Institute-Ethiopia Strategy Support Program II, Ethiopia.
[11] de Brauw, A., Mueller, V. and Woldehanna, T. (2013a) ‘Motives to remit: Evidence from tracked internal migrants in Ethiopia’, World Development, 50: 13-23.
[12] Ezra, M. and Kiros, G. (2001). Rural Out-Migration in the Drought Prone Areas of Ethiopia: A Multilevel Analysis. International Migration Review, Vol. 35, No. 3. The Center for Migration Studies of New York, Inc. http://www.jstor.org/stable/2675842
[13] Feleke, T.2005. Migration, Livelihoods and Wellbeing across four Communities in Ethiopia, ESRC Research Group on Wellbeing in Developing Countries,University of Bath.
[14] Franson, S., and Kuschminder, K. (2009). Migration in Ethiopia: History, Current Trends and Future Prospects. Paper Series; Mgraton and Development Country Profile
[15] Gibson, M. A. and Gurmu, E. (2012) ‘Rural to urban migration is an unforeseen impact of development intervention in Ethiopia’, Plos One, 7(11).
[16] Gmelch, G. and Zenner, W.P. (1996). Urban Life: Readings in Urban Anthropology, Third Edition. USA: Waveland Press, Inc.
[17] Hossain, M. Z. (2001). Rural-Urban Miration in Bangladesh: a Micro Level Study, paper presented at the Brazil IUSSP Conference, August 20-24.
[18] IFAD (2007). Migration and Rural Employment. Policy Division, Thirtieth Session of the Governing Council of IFAD, 14 February.
[19] Lynch, K. (2005). Rural-Urban Interactions in the Developing World. London and New York:Florence Production Ltd.

International Journal of Scientific and Research Publications, Volume 7, Issue 4, April 2017 42 ISSN 2250-3153
www.ijsrp.org
[20] Markos Ezra (2001). Ecological Degradation, Rural Poverty, and Migration in Ethiopia: A Contextual Analysis. Policy Research Division Working Paper, No. 149. New York: Population Council.
[21] Markos Ezra and Gebre-Egziabher Kiros (2001). Rural Out-Migration in the Drought-Prone Areas of Ethiopia: A Multi-Level Analysis. International Migration Research, Vol.35 No.3, pp. 749-771.
[22] McDowell, C., and De Haan, A. (1997). Migration and Sustainable Livelihoods: A Critical Review of the Literature. IDS Working Paper 65.
[23] Morrissey, J. (2011). Rural Urban Migration in Ethiopia. Case Study. Climate Change and Displacement. University of Oxford. www.fmreview.org
[24] National Geographic Society (2005). Human Migration Guide. Available from: http://www.nationalgeographic.com/xpeditions / lessons/09/g68/migrationguidestudent.pdf
[25] Sinha, B. R. (2005). Human Migration: Concepts and Approaches. Földraji Éretesitö 2005. LIV.évf. 3-4.füzet, pp. 403-414.
[26] Tesfaye Tafesse (2009).The Predicaments of Amhara Migrant-Settlers in East Wollega Zone, Ethiopia. Proceedings of the 16th International Conference of Ethiopian Studies, Trondheim.
[27] Timalsina, K. P. (2007). Rural Urban Migration and Livelihood in the Informal Sector: A Study of Street Vendors of Kathmandu Metropolitan City, Nepal. PhD Dissertation, Norwegian Science and Technology. Available from http://ntnu.diva portal.org/smash/get/diva2:122401/FULLTEXT01.
[28] United Nations-UN (1970). Manuals on methods of estimating population, Manual VI: methods of measuring internal migration. Department of Economic and social Affairs, Population studies, No.47, New York.
[29] United Nations Department of Economic and Social Affairs (UN DESA) (2013) World Population Policies 2013. Population Division, United Nations Department of Economic and Social Affairs, New York. www.un.org/en/development/desa/population/publications/ pdf/policy/WPP2013/wpp2013.pdf
[30] USAID (2013). USAID Country Profile. Property Rights and Resource Governance. Vietnam. http://usaidlandtenure.net/vietnam.
[31] Waddington, H. & Sabates-Wheeler,R., (2003). How Does Poverty Affect Migration Choice? A Review of Literature. Development Research Centre on Migration, Globalisation and Poverty: pp1-22
[32] Weeks, J. R. (1989). Population: An Introduction to Concepts and Issues. Words Worth Publishing Company, Belmont, California
[33] Witherick, M.E. (1994). Population Geography: Second Edition. London: Longman Modular Geography Series.
[34] World Bank (2010). The Ethiopian Urban Migration Study 2008: The Characteristics, Motives and Outcomes of Migrants to Addis Ababa. Report No. 55731-ET. Poverty Reduction and Economic Management: Africa Region.
[35] Zewdu, G. and Malek, M. (2010). Implications of Land Policies for Rural-
urban Linkages and Rural Transformation in Ethiopia. International Food
Policy Research Institute – Ethiopia Strategy Support Program (ESSP).
ESSP II Working Paper No. 15
AUTHORS First Author – Birhanu Melesse, Lecturer, Department of Rural Development and Agricultural Extension, College of Agriculture and Rural Transformation, University of Gondar, Ethiopia. Second Author – Dr.Kavitha Nachimuthu , Associate Professor, Department of Rural Development and Agricultural Extension, College of Agriculture and Rural Transformation, University of Gondar, Ethiopia.
International Journal of Scientific and Research Publications, Volume 7, Issue 4, April 2017 43 ISSN 2250-3153
www.ijsrp.org
Constraints and Challenges in Implementing Agricultural Extension Practices. The Case of North
Gondar in Amhara Region, Ethiopia Mrs.Tigist Petros*, Dr. Kavitha Nachimuthu**, Mr. Haimanot Atinikut***, Mr. Mohammed Gedefaw****
* Lecturer, Department of Rural Development and Agricultural Extension, College of Agriculture and Rural Transformation, University of Gondar,
Ethiopia ** Associate Professor, Department of Rural Development and Agricultural Extension, College of Agriculture and Rural Transformation, University
of Gondar, Ethiopia *** Lecturer, Department of Rural Development and Agricultural Extension, College of Agriculture and Rural Transformation, University of Gondar,
Ethiopia. **** Lecturer, Department of Natural resources Management, College of Agriculture and Rural Transformation, University of Gondar, Ethiopia.
Abstract- Ethiopia is one of the countries on the African continent with highest agricultural potential. Its natural resources base is the foundation of any economic development, food security and other basic necessities of its people. Predominantly smallholder agriculture is the dominant sector of the national economy. The objective of the study is to examine constraints in addressing women farmers and rural youth and to assess constraints of extension system in promoting agricultural technologies to farmers in the study area. Primary and Secondary data was collected for the study purpose. In addition to respondents’ interview, focus group discussion, key informants interview and case studies were used for qualitative data analysis. Descriptive statistics of mean, standard devotions and percent was applied. For statistical tests, chi-square, T-test, Pearson and spearman’s correlation coefficient were employed. As a conclusion, the challenges of existing public agricultural extension service provision institutional, technological and technical and in terms of addressing cross-cutting issues such as environment and gender as theses have wider contexts to look into existing endogenous and exogenous constraints. Index Terms- Agricultural extension, women farmers, rural youth, information and rural development
I. INTRODUCTION thiopian agriculture still plays the pivotal role to the overall GDP as well as employment opportunity to the
majority of the population. It supported 84 percent of the country’s population engaged in various agricultural activities and generates its income for household consumption to sustain livelihood (CSA, 2015c). On the top of that the sector contributes hugely for foreign currency earnings that estimated to be 42% of countries GDP through export of agricultural commodities (Ibid). Thus, agricultural extension service delivery situation in North Gondar has been assessed. Agricultural extension is part of a system of actors who influence farmers’ decisions. It includes, among others, agricultural researchers, political authorities,
farmer organizations, non-governmental organizations (NGOs), farmer training centers and the media. In North Gondar zone, an integration of relevant stakeholders for combined effort in agricultural development activities need further strengthening. Changing this weak agricultural information and knowledge system among actors to holistic approach and strong integration of stakeholders is a very essential action to be done. Then, in order to apply this holistic approach, identification of the main stakeholders and their roles and responsibilities, assessing their linkage and analyzing the factors affecting stockholders integration in implementing Agricultural Extension in the study areas need to be studied, but systematical and empirical study was not attempted so far. Therefore, the proposed study addresses this research gap and tries to make empirical inferences to provide valuable research outputs, that could be used by farmers, government and NGO’s who are participating in agricultural development process as well as policy makers in planning appropriate mechanisms that would improve actors integrations, knowledge and information sharing in order to achieve agricultural development. To realize agricultural development, it is agricultural extension agents, particularly in developing countries, which are the main actors in delivering extension services to farmers.
II. OBJECTIVE OF THE STUDY • To examine constraints in addressing women farmers
and rural youth • To assess constraints of extension system in promoting
agricultural technologies to farmers • To offer suitable suggestion to implement the
agricultural extension practices
III. METHODS AND MATERIALS Sampling and Data Collection Methods Cross-sectional survey involving quantitative and qualitative aspects was the design of research and the data were
ET

International Journal of Scientific and Research Publications, Volume 7, Issue 4, April 2017 44 ISSN 2250-3153
www.ijsrp.org
dependent on primary and secondary sources. Among 23 districts in North Gondar Zone (Woredas), three districts namely, Wogera form highland (Dega), Demibia from midland (Woina Dega) and Metma from lowland (Kolla) areas were selected using purposive sampling techniques. From each district, 3-4 kebeles were selected using different representations in term of access to agricultural extension services. The distance from district center and availability of road and facilities were also considered as criteria of selection for kebeles. Then household respondents were selected from each Kebele using simple random sampling technique and 120 household respondents were taken from the three districts. Data were collected using different techniques and tools. Household survey using structured and semi-structured questionnaire; focus group discussion with farmers, agricultural extension stakeholders and extension experts and observation of farming systems, settlement pattern, available infrastructure including communication technologies and farmers training centers were important data collection techniques of the study. Methods of Data Analysis Data gathered from different sources, were organized and analyzed using quantitative and qualitative techniques. The quantitative data were analyzed mainly using different descriptive statistics. To see relationship between different categorical variables, Chi-square test was also used. Correlation and simple linear regression analysis were also used to see the relations between and association among different socio-economic variables and access to agricultural extension service. The data obtained using focus group discussion, key informant interview and case studies were analyzed using qualitative techniques.
IV. RESULTS AND DISCUSSIONS • Rural development and attaining household security in
development countries are responses of public agricultural extension (Rivera and Qamar, 2003). However, in many developing countries including Ethiopia, the strong association between the rural development and reduction of poverty has not attracted the attention of policy makers, planners and implementer of the agricultural extension system. Anticipated outcomes of agricultural extension system deliver have not met and the improvements in the lives of agrarian society have yet been in its immovable position and remained unanswered question of the rural development. This is mainly due to the fact that public agricultural extension service, which is the only way in Ethiopia (Spielman et al, 2011), has been challenged by different factors including institutional, technical, technological and geographical in many cases.
• Public agricultural extension in the country at large and the study areas particularly, has been challenged by different exogenous and indigenous factors. These factors are in one or another ways associated with the system in which the process of the agricultural knowledge and technology transfer is undertaken. Agricultural knowledge and technology transfer of the system in the country commands unidirectional, top-
down approach, in which the role of the indigenous knowledge and participatory planning based specific felt needs of the poor, are seldom taken into account. The technical aspects of extension experts, who are major planners, facilitators, promoters, demonstrators and managers of agricultural knowledge and technology transfer is in many cases is observed to be the challenging issues for agricultural extension in Amhara Region. The problems with expert technical aspects are emanated from lack of adequate and /or sufficient theoretical and technical knowledge and mismatch between theory and practices. General recommendation and attempts to promote any technologies considering as they are fitting to all, regardless of the need of famers, compatibility of the areas, faming systems, soil types and agricultural commodities is also observed to be the bottleneck of the public agricultural extension service. The following sections presents the specific challenges that public agricultural services facing in the region generally, and North Gondar Zone specifically based on the data generated from household survey, group discussions and observations.
Institutional Aspects of the Agricultural Extension
• There are different options through which agricultural extension is facilitated and managed (Rivera and Kamar, 2003). In terms of service delivery and funding, the only responsible body in Ethiopia is government by channeling through ministry of agriculture. Structural decentralization of agricultural extension from regional level to lowest administrative structure known as Kebele, in most cases with required personnel in the fields of crop production, animal production and natural resource management and in some potential areas with expert in irrigation is found to be important step–forward observed in institutional organizations. Although, such structural arrangements exist, the knowledge and agricultural technologies transfer have been attempted through top-down command and recommendations, where as demand driven and participatory planning and implementation is neglected, technologies are misused and not in line with diverse production systems.
• Top-down recommendation of agricultural technologies and knowledge transfer systems has resulted in poor feedback-as extension agents and farmers don not have strong and regular connection with the sources of technologies and clients. The data obtained from household survey show that 73.3 % of farm households are willing to provide feedback about the agricultural technologies they are using, but constrained by the distance of the service provision centers and weak interaction with extension experts. The functionality and roles of Farmers Training Centers (FTCs), as a center of agricultural extension service provision, are expected to mediate knowledge and technology transfer system.
Famers Training Centers (FTCs)

International Journal of Scientific and Research Publications, Volume 7, Issue 4, April 2017 45 ISSN 2250-3153
www.ijsrp.org
• Streamlining public extension service has been identified as one of the critical interventions that will drive technology adoption and use by smallholder farmers (UNDP, 2013). To this effect, decentralized institutional arrangements and facilities play pivotal roles and serve a bridge to transfer knowledge and technologies to the farmers. Public agricultural extension services have implemented through institutionalized systems. In this regard, Farmers Training Centers (FTCs), which have established with aim to transform the extension service delivery from sole technology transfers models to human resource and social capital development approach (MoARD, 2009) have indispensible role in agricultural knowledge and information system for better production and productivity and also expected to contribute for rural development and tackling the problems of household food security. According to (Berhanu et al, 2006), FTCs are also expected to serve as hubs for the transfer of improved technologies and knowledge, skill development, and the provision of other institutional support services.
• There are about 327 constructed FTCs in North Gondar Zone. However, they have managed to contribute with their manifold problems, which are mainly emanated from improper planning, resource allocation and organization. In connection with the problems of the FTCs, the study conducted by (Tesfaye et al, 2010), show that making FTCs functional, responsive and dynamic remains the challenge. Moreover, data generated from observation and focus group discussion with concerned stakeholder and clients, this study supports the facts, indicating that FTCs in the areas studied have suffered from human resources shortage, absence of demonstration sites, absences of the materials and improper positioning to reach the needy smallholder farmers, who have starved of right and timely information and demand derived and affordable agricultural technologies. The study has questioned whether farm households are satisfied with services provided by nearby FTCs? Data generated from household survey revealed that 32.5% of households reported that they are dissatisfied with the existences and service provided in FTCs. The Chi-square (X2 ) test at 95% of confidence interval indicated that there is no statistically significant difference observed between male and female headed households in terms of satisfaction from farmers training center. The study has also revealed that from randomly selected households in North Gondar Zone, 26.7% do not have access to nearby farmers training center.
• Most of FTCs in North Gondar of Amhara Regions in highland and midlands, some in lowlands do not have demonstration sites both for crops and livestock production (for instance, 10% in Quara, 62.5% in Dembia distorts and 15% in Metema). From the study, it could leaned that Western lowlands of regions, where is there is abandon land, more FTCs tends to have demonstration sites, where as the highland and midland
areas most of FTCs do not have demonstration site. The training centers in the study areas lack required material including training materials, guidelines, radio, television, chairs and the like. The FTCs are not also fulfilled with required personnel, budget and are not owned by responsible body. Very little budget support for some centers (up to 20,000.00 birr per FTC) is also tagged to be used only for purchase of fertilizer other than knowledge and technology transfer activities.
• In terms of infrastructure and facilities, most of FTCs in the study areas are found to be mainly focusing on crop production than livestock keeping aside the multiple functions of agricultural extension. Land allocation and constructions in many cases did not consider the livestock management and animal health extension services.
V. TECHNOLOGICAL ASPECTS • Demanded, appropriate, affordable and technical
feasible technologies have significant role in increasing agricultural production and productivity and lead to improvement of the livelihoods of vast majority. Agricultural technologies requirements are responses of to the demand of the farmers and felt problems in crop and livestock production. It is apparently important to look the crops and livestock production constraints before the evaluating the existing technologies.
• Crop production, which is the main sources of income for about 68.3% of rural households in the study area is also the primarily the source of food for farm households. As far as the production is concerned there is slight incremental trend in gross product. However, evidences from different sources including the qualitative data of this study indicated that much of the increase in agricultural output in the last decade was achieved by expanding land under crop cultivation, which clearly show the contribution of the agricultural technologies not significant. The limited supply of inputs such as improved seed, fertilizer and high price of inputs particularly highly inflated prices of fertilizer is the major pressing issues of the highland farm households. The problems of the weed, labor shortage especially during the peak times of weeding and harvesting in the lowlands of the study areas, pest and insects infestation, declining trend of the land and soil fertility with its impact on productivity are also observed to be the major constraining factors of the crops production.
•
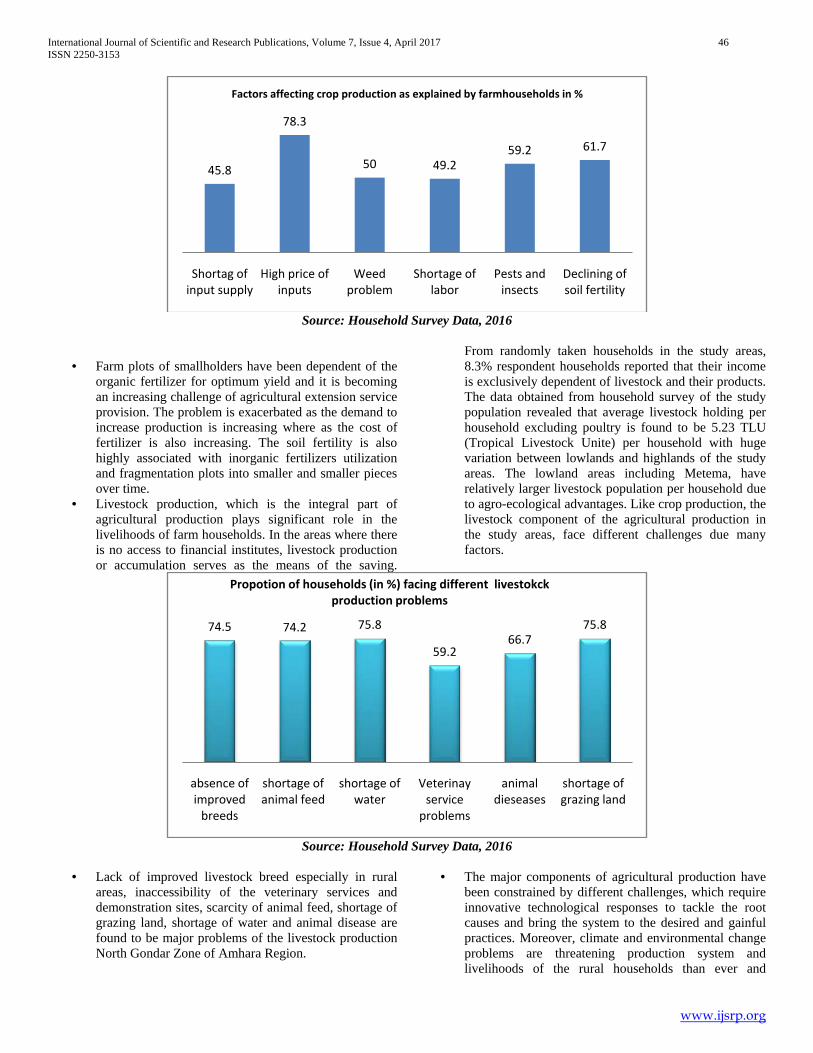
International Journal of Scientific and Research Publications, Volume 7, Issue 4, April 2017 46 ISSN 2250-3153
www.ijsrp.org
Source: Household Survey Data, 2016
• Farm plots of smallholders have been dependent of the organic fertilizer for optimum yield and it is becoming an increasing challenge of agricultural extension service provision. The problem is exacerbated as the demand to increase production is increasing where as the cost of fertilizer is also increasing. The soil fertility is also highly associated with inorganic fertilizers utilization and fragmentation plots into smaller and smaller pieces over time.
• Livestock production, which is the integral part of agricultural production plays significant role in the livelihoods of farm households. In the areas where there is no access to financial institutes, livestock production or accumulation serves as the means of the saving.
From randomly taken households in the study areas, 8.3% respondent households reported that their income is exclusively dependent of livestock and their products. The data obtained from household survey of the study population revealed that average livestock holding per household excluding poultry is found to be 5.23 TLU (Tropical Livestock Unite) per household with huge variation between lowlands and highlands of the study areas. The lowland areas including Metema, have relatively larger livestock population per household due to agro-ecological advantages. Like crop production, the livestock component of the agricultural production in the study areas, face different challenges due many factors.
Source: Household Survey Data, 2016
• Lack of improved livestock breed especially in rural
areas, inaccessibility of the veterinary services and demonstration sites, scarcity of animal feed, shortage of grazing land, shortage of water and animal disease are found to be major problems of the livestock production North Gondar Zone of Amhara Region.
• The major components of agricultural production have been constrained by different challenges, which require innovative technological responses to tackle the root causes and bring the system to the desired and gainful practices. Moreover, climate and environmental change problems are threatening production system and livelihoods of the rural households than ever and
45.8
78.3
50 49.259.2 61.7
Shortag of input supply
High price of inputs
Weed problem
Shortage of labor
Pests and insects
Declining of soil fertility
Factors affecting crop production as explained by farmhouseholds in %
74.5 74.2 75.8
59.266.7
75.8
absence of improved
breeds
shortage of animal feed
shortage of water
Veterinay service
problems
animal dieseases
shortage of grazing land
Propotion of households (in %) facing different livestokck production problems

International Journal of Scientific and Research Publications, Volume 7, Issue 4, April 2017 47 ISSN 2250-3153
www.ijsrp.org
expected to continue along with declining trends of natural resources including forest, waters and degradation of soil. In this regard, it is apparently important to question existing agricultural technologies, whether they are demanded or commanded, the short comings and their ability to address the pressing problems of the farm households.
VI. AGRICULTURAL TECHNOLOGIES IN PLACE • To increase agricultural production and productivity
through extension advisory and dissemination of technologies to farmers is more of theoretical and political than practice in the context of the Amhara Region. In connection with this, Rural Development Agricultural Extension Series report of World Bank in 2010, revealed that public agricultural extension service in Ethiopian and other developing countries is characterized by the tendency of politicians providing extension services to clients in exchange of political gains. Since the inception of the agricultural extension in the country, there are long lasting attempts in this regards in all parts of the country. The same is true in the study area with limited access to agricultural information and technologies. In principle and structurally, almost in all parts of the study area, there
are concerns that extension services is focusing on pressing issues of agriculture including crop production, animal production, natural resources management and recently irrigation in some potential areas.
• Crop production enhancement technologies are dominantly focused on fertilizer, improved crop variety and seeds, row planting, pesticide and herbicide application with limited access and geographical disparities. The study has revealed that despite the long lasting efforts in the agricultural extension, yet significant proportion of farm households never advised or get any technical support for different agricultural technologies for crop production by concerned extension service providers.
• The available data from household survey show that agricultural extension advisory service for crop production component, has given less attention to pest management and storage techniques, which are the major causes of pre and post-harvest losses respectively. Considering technological practices as they fit to all areas has been also observed challenges of crop production as political leaders attempt to convince farmers taking the good report of other areas without any adaptation trail and testing to the context.
Source: Household Survey Data, 2016
• Relative to crop production, livestock production and
management has attracted less attention in the agricultural extension services in North Gondar Zone, where the demand for improved breads, animal feeds, veterinary services and livestock product processing and marketing is high. Information and access to improved breeds is concerned, 66.7%, 65.8% and 35 % of farm households do not have neither access to information nor for improved breed of milk caw, sheep and poultry respectively. Famers from highland and midland areas relatively have better information about improved poultry and cattle breads. In this regard, the pre-urban and urban areas have good practices for hybrid cattle (in
most cases with Holstein Frisians breeds) for milk production compared to rural farm household. As the case in post-harvest handling, the agricultural extension services and technologies in promoting the livestock products such as milk processing and hide and skin is by far blew the expectation where the need and contribution of such product gross domestic production (GDP) is significant. Thought they have their own technical and managerial problems, dairy cooperative in urban areas have relatively better experience in processing and marketing in Cities such as Gondar, but as important stakeholders for agricultural extension, they have limited practice in disseminating the diary
72.2 75 72.554.2
72.5 63.3
27.8 25 22.545.8
22.536.7
Proportion of households, who got extension advisory service in %
got advised never advised

International Journal of Scientific and Research Publications, Volume 7, Issue 4, April 2017 48 ISSN 2250-3153
www.ijsrp.org
processing technologies to the nearby rural areas. The data obtained from household survey of randomly taken respondents tell us 77.5% of farm households do have any information and practice about handling and management of skin and hides, whereas the rest 22.5% of respondents have information about good handling and management, but don’t have any practices. The effect of these is hid and skins supplied by the vast majority of the rural community have poor quality and farmer loss expected benefits from byproduct livestock.
• Public agricultural extension service is responsible to promote natural resources sensitive agriculture both in crop and livestock production. The ever increasing climate change and its impact on global warming has become pressing issue of the contemporary world. Moreover, according to the United Nations Framework Convention for Climate Change 2007, the effect of the climate change on developing counties including Ethiopia is comparatively higher. The study questions in what ways public agricultural extension services in the areas is supporting environmental friendly production system. Based on data obtained from survey, 75.8% of households do have information and practice about soil and water conservation. However, the natural resources conservation activities have been undertaken in mass mobilization of community based on top-down plan of the government in the name of green economy. The natural resources conservation activities in the form of campaign is the clear indication that agricultural activities with full participation of the community has got less attention and it not institutionalized as there is decentralized structural arrangements of agricultural extension under each lowest administrative levels. On the other hand, there is geographical variation in natural resource conservation campaigns and it is mainly undertaken in highlands and midlands, where the natural resources are degraded due frequent cultivation over a centuries. In the lowland areas, where there is relatively diverse natural forest, the attention given for conservation agriculture and protection of natural resources very less. This can jeopardize the loss of natural resources and expansion of desertification along with devastating impacts of climate change.
• The soil and water conservation activities at farm level are very important extension intervention and there had been different attempts in the study area and other part of countries especially where vertisol dominantly found. Broad Bed Maker (BBM) technology is believed to be helpful to avoid water logging problems. Despite anticipate positive impact of the BBM technology, smallholder farmers did not adopt even in the areas, where the existing situation is demanding it because of different reasons. Incompatibility of the technology to existing farming tools and absence of technical support from extension agents are found to be the reasons behind failure of the specified technology. An interesting finding with regard to BBM technology is there is blind recommendation to the area where there is no need for it through agricultural offices.
• Availability, compatibility to the environment and farming system and affordability of agricultural technologies are the main factors for sustainable application and use by smallholders. As it was witnessed by 45% of sample respondents, the existing technologies of agriculture did not consider environmental issues. In all parts of the study area, using pesticide is found to common practice regardless of the knowledge and practices on application and safety precautions. There is observable impact of pesticides application in beekeeping, which is the ideal climate smart agriculture, as there is loss of grasses and residual effects for the death of bees in lowland areas include Metema.
• Availability and affordability of technologies significantly affects the utilization of agricultural technologies as it is observed in north Gondar of Amhara Region. The high cost of the technologies such as improved seeds, machineries and fertilizers is the challenged for farm households. Applying inorganic fertilizer for most of the highland and midland famers is mandatory as their plots have already developed dependency on it, but the high cost has forced the famers to use below the recommended rates of application. On the other way, there is forced recommendation of organic fertilizer to the areas, where there is no demand for it and there are also farm machineries, which their applications and operation are not known by farmers and even by extension agents.
• The practical observation of all agricultural technologies in different areas revealed that there are huge gaps in demand and supply of technologies. The demanded technologies of agriculture in most cases improved seeds and verities such as Malt Barely as the case in Wogera district are introduced without recommended full pack of production. The high cost, poor quality and limited variety of agricultural technologies are the major bottlenecks to promote the needed technologies to the needy smallholder farmers. The weak agricultural extension system in the study areas and absence of other alternative technologies have resulted in unnecessary or higher cost for smallholder farmers and waste to public institutes due technical and managerial pitfalls.
• In general, there is mismatch between existing crop and livestock production and natural resource problems and available agricultural technologies. The agricultural technologies in place are neither based on the problems smallholder agriculture nor sufficient to the needs of smallholder farmers in North Gondar of Amhara Region. This finding has more to share with the study conducted by (Belay, 2003). As he has vividly noted, different extension approaches in Ethiopia have been planned and implemented without the participation of the very people for whom they have been designed. The finding of the this study consolidate the case as planning and transfer of technologies follows top-down approach and is commanded than demanded by the needy people along with the lost linkage between

International Journal of Scientific and Research Publications, Volume 7, Issue 4, April 2017 49 ISSN 2250-3153
www.ijsrp.org
farmers, extension workers and the sources of technologies.
VII. TECHNICAL AND COMMUNICATION SKILLS OF AGRICULTURAL EXTENSION AGENTS
• Effectiveness, efficiency and quality of agricultural extension service provision are mainly a function of the competency of professionals in terms of the required knowledge, skills and attitudes. Technical and communication skills are paramount important for promotion and dissemination of the technologies. Famers require practical demonstration to adopt agricultural technologies than mere information about certain technology. The data obtained from focus group discussions with farmers indicated that technologies, which have been demonstrated practically, are trusted and practiced. However, the current technology introduction and dissemination strategies are simply based on theoretical judgments than their practical impacts. Thought, there are institutional and resources related problems, low adoption of agricultural technologies in north Gondar is partly due the technical inefficiency of development agents. The data obtained from qualitative source indicated that development agents are not technically equipped to demonstrate the new technologies and also unable to create sustained interaction with clients. Based on the services given to famers, the performance of development agents (extension workers) was evaluated. According to 39.2% of the sample respondent famers in study areas, development agents are reported to be qualified in term of giving the needed services to their clients and 12.5% of farm households claimed that they have poorly qualified to provide agricultural extension and advisory and technical services.
• Weak interaction of farmers and service providers could be explained from technological, infrastructural and cultural points of views as they significantly affect communication. Imbalanced extension worker to farmers’ ratio (0.0058); absence of continuous technical updates for newly introduced agricultural technologies, frequent turnover of extension workers, which emanated from absences of rewarding incentives and as they seek to promote the local political leaders. In addition to these, geographical barriers have contributed more to inefficiency of extension workers.
VIII. AGRICULTURAL EXTENSION IN ADDRESSING WOMEN AND RURAL YOUTH
• Public agricultural extension services are for those who have involved in agriculture and to let them better in increasing their capacity through providing applicable information, knowledge and skills. The women and rural youth represent the vast majority of the productive segment in agrarian society including North Gondar Zone of Amhara Region in Ethiopia. It is imperative
agricultural or rural extension to address women and youth as important drivers of economy. Owing the fact, the study has attempted to look in what way they have been supported by public agricultural extension services.
• Concerning women, Berhanu et al (2006), has importantly noted that although the role of women in agricultural production and marketing has been well recognized, there is gender bias in the service, whereby the majority of the beneficiaries are male. The study questions whether the exiting public agricultural extension services in the study has given due attention in terms of creating gainful opportunities to women. Compared to men, proportion of women getting agricultural extension services are significantly less in terms of getting advisory services from extension works, but the politics of extension in addressing woman is high. This is partly due to proportion of women extension agents are less than the number of men and men agents tend to contact male headed households than female headed households. Agricultural extension agent contact frequency of female is also less than men as women have multiple roles in addition to their involvement in agricultural production. Moreover, qualitative evidence from focus groups discussions with different representations in all districts of the study areas and field observations revealed that women farmers or women headed households are mostly neglected from agricultural extension duet to the fact that most of extension workers are male and they preferably contact mainly diplomatic male headed farm households. Interestingly, proportionally few female extension agents are better in contacting female headed households and managing all service provision activities than male extension workers in most cases. However, they are few in number and placed in the easily accessible areas and geographically challenging areas are not addressed through female extension workers.
• The fate of future development depends on new generation. Agricultural transformation requires genuine investment on education and empowerment of the most energetic segment of existing productive forces. Apart from formal education, public agricultural education, which is important part of non-formal education, is expected to play significant role. According to different government reports, Ethiopian youth represent about 30% of the total population and majority of productive forces. Unlike urban youth, who have attracted the transformation plan of the country as major players, rural youth did not receive due consideration and if any intensive agricultural production through small scale irrigation schemes and animal fattening are possible ways among many alternatives.
• According to data generated from both primary and secondary sources, rural youth in North Gondar zone are not benefited from public agricultural extension services even on small scale irrigation based production and animal fattening. They have been trained and capacitated by Technical and Vocation Enterprise

International Journal of Scientific and Research Publications, Volume 7, Issue 4, April 2017 50 ISSN 2250-3153
www.ijsrp.org
Development Office of districts (woredas) on agricultural and non-agricultural enterprises by creating access to credit for initial capital in collaboration with Amhara Saving and Credit Institute (ACSI). In some areas, Nongovernmental Organizations (NGOs) on entrepreneurship skills development rarely provide trainings upon the recommendations of local administrative bodies such as Kebele officials. The challenging issue with these endeavors is the selection process of youth, in which most of times nomination of beneficiaries are based on the political affiliation. Another challenging issue of public agricultural extension in addressing youth is the land tenure issue, in which most of members of people under the category do not have land to cultivate and if any they are dependent on their family plots.
• In general, despite many opportunities to assist youth, public agricultural extension service provision did not pay due attention and the exiting capacity building activities for youth are mainly done by Technical and Vocational Enterprise Development Offices and rarely by NGOs without creating synergy among these stakeholders.
IX. CONCLUSION • Persisting challenges of public agricultural extension
services provision and its prospects could be seen from different perspectives. Based on imperial evidences of the study from primary and secondary sources, the following are some of conclusion drawn. Apparently, it is important to look the challenges of existing public agricultural extension service provision institutional, technological and technical and in terms of addressing cross-cutting issues such as environment and gender as theses have wider contexts to look into existing endogenous and exogenous constraints.
• Agricultural extension services as institutionalized public activity in North Gondar Zone of Amhara Region has good base to start up for effective and publically demanded technology dissemination and diffusion. Structurally, it has been decentralized to the levels of the lowest attainable public administration stricture know as Kebeles. Identification of public agricultural extension services provision focus areas including the most dominant components of agricultural production (crop and livestock); natural resources conservation and irrigation technologies have been well stipulated. These pressing issues have important role in uplifting the production and productivity and sustainability of agriculture, which can help to o meet the increasing demand its products.
• Structural skeleton of public agricultural extension service provision alone has nothing to do with in the process of assisting smallholder farmers through technical advisory services and practical demonstrations, which lead to positive impact on productivity and livelihoods of needy people (Smallholder farmers), unless they have been fulfilled
with required personnel and extension agents having required qualification. The services center, such as FTCs are expected to be in representative areas to the majority of beneficiaries and in way to fill the pressing problems of agriculture and environmental issues, but they lack to be so. The existing FTCs, which are meant to serve as center of innovation in the study areas, have different pitfalls affecting their proper functioning in the process of the technology dissemination, generation and transfer of the applicable information, knowledge and skills to famers.
• Major agricultural production components production in North Gondar Zone have suffered from different problems which ranging from input supply to processing and marketing, demanding immediate technical support, technological response and timely information. Existing public agricultural advisory and extension system is not designed and implemented based on felt need of producers and lacks full participation concerned stakeholders. As far as existing agricultural production and available technologies are concerned, there is mismatch between the demand and advisory services and technologies in place.
• Environmental and natural resources issues have threatening agricultural production severely than ever and expected to threaten more with devastating impacts on the lives of the people across glob, especially in developing countries including Ethiopia. However, neither available agricultural technologies nor the long lasting experiences of smallholder farmers have been environmentally friendly and sensitive to climate change. The situation has been exacerbated due to inefficient technical knowledge, commitment, and higher turnover of extension workers, who are believed to be major planners, facilitators and promoter of the public agricultural extension.
• Women and youth are believed to be contributed more for agricultural production and they constitute significantly larger proportion of the population. Despite, their contribution in overall economy of the nation, attention given to them from public agricultural extension services in the study is not in way to support the vast majority and this partly due to cultural, economic, geographical and absence of rewarding incentives.
X. RECOMMENDATIONS The study has revealed many challenging factors of public agricultural extension in North Gondar Zone of Amhara Region. Based on the major findings of the study, the following are some recommendations forwarded for practical intervention and policy implications.
• Despite decentralized skeleton of public agricultural extension services provision, there are different pitfalls of the system including shortage of skilled personal, absence of fully equipped Farmers Training Centers and technologies. Therefore, the local government and extension service provision stakeholders should pay due
International Journal of Scientific and Research Publications, Volume 7, Issue 4, April 2017 51 ISSN 2250-3153
www.ijsrp.org
attention for the institutions such FTC to be functional with the required personnel, expertise and materials.
• It is found that public agricultural extension service is geared towards the crop production, paying less attention for livestock and natural resources management and extension work has been considered as seasonal campaign based interventions by the political leaders. For sustainable agricultural development and impactful agricultural extension, diversifying its services based on existing problems of the farming households is paramount important. Instead of campaign, it should be based on participatory planning and implementation. To this effect, the agricultural extension experts, practitioners, promoters and GOs, and NGOs could play significant roles. The agricultural extension works activities should be led by technical experts aiming to benefit the needy smallholder farmers than for political consumption.
• There is mismatch between the problems of agricultural production and available but ‘limited” technologies and services to the farmers. Therefore, it is highly recommended that dissemination and promotion of agricultural technologies should be preceded by proper assessment of the needs and suitability to environment, cultural and economic situation with full participation of clients along with recommended packages.
• Agricultural extension workers, who are major promoter of the knowledge and technology transfer, lack communication and demonstration skills to transfer technologies in most districts of study area. In addition, poor incentive and rewarding mechanisms and the challenges they face due geographical disparities in highlands and harsh climate environment in lowlands resulted in high turnover. To make them important assets of agricultural development, providing technical updates specially skill training, devising incentive and rewarding mechanisms such as resident housing by the local government bodies and stakeholders could fill gaps.
• Empowering rural women and youth, who constitute the majority of productive forces, through agricultural extension and advisory system based on the needs of and using existing opportunities is wise investment for overall transformation of the sector. Therefore, it is highly recommended that agricultural extension program planning and implementation take into account proactive involvement of rural women and youth.
REFERENCES [1] Asiedu-Darko Emmanuel (2013). Agricultural extension delivery in Ghana:
A case study of factors affecting it in Ashanti, Eastern and Northern regions of Ghana. Journal of Agricultural Extension and Rural Development Vol. 5(2), pp. 37 –41, February, 2013
[2] Belay K. 2003. Agricultural Extension in Ethiopia: the case of Participatory
Demonstration and Training Extension System. Journal of Social Development in Africa, Vol. 18, No. 1, pp 49-83.
[3] Berhanu G., Hoesktra D. & Azage T. 2006. Commercialization of Ethiopian Agriculture: Extension Service from Input Supplier to Knowledge Broker and Facilitator. IPMS Ethiopia, Working Paper 1.
[4] Elias, A., Nohmi, M., Yasunobu, K. and Ishida A., (2015). Farmers’ Satisfaction with Agricultural Extension Service and Its Influencing Factors: A Case Study in North West Ethiopia. J. Agr. Sci. Tech. (2015) Vol. 18: 39-53
[5] Gezahegn Ayele, Mekonnen Bekele and Samia Zekeria .2006. Productivity and Efficiency of Agricultural Extension Package in Ethiopia. The Ethiopian Development Research Institute, Addis Abeba, Ethiopia.
[6] Habtemariam Kassa, 2004. Agricultural Extension with Particular Emphasis on Ethiopia. Ethiopian Economic Policy Research Institute, Addis Ababa, pp 80.
[7] Khalil AHO, Ismai,l M. Suandi, T. and Silong, AD. (2008). Extension worker as a leader to farmers: Influence of extension leadership competencies and organizational commitment on extension workers‟ performance in Yemen. J. Int. Soc.l Res, 1(4): 358-387.
[8] Kuhnen, F., 1977. The Concept of Integrated Rural Development, World Food and Agriculture. Food and Agriculture Organization of the United Nations. 2000. The World Bank, Rome.
[9] Rivera W. Mc. and Qamar K. M. 2003. Agricultural Extension, Rural Development and Food Security Challenges. Foods and Agricultural Organization of United Nations.
[10] Spielman D.J., Dawit K., and Dawit A. 2011.Seed, Fertilizer, and Agricultural Extension in Ethiopia. Development Strategy and Governance Division, International Food Policy Research Institute – Ethiopia Strategy Support Program II, Working Paper 20.
[11] TewodajMogues,Cohen, M.J.,Birner, R., Mamusha Lemma, Randriamamonjy,J.,FanayeTadesse and Zelekawork Paulos (2009). Agricultural Extension in Ethiopia through a Gender and Governance Lens Ethiopia Strategy Support Program 2 (ESSP2) Discussion Paper No. ESSP2 007 October 2009.
AUTHORS First Author – Mrs.Tigist Petros, Lecturer, Department of Rural Development and Agricultural Extension, College of Agriculture and Rural Transformation, University of Gondar, Ethiopia. E-mail: [email protected]. Second Author – Dr. Kavitha Nachimuthu, Associate Professor, Department of Rural Development and Agricultural Extension, College of Agriculture and Rural Transformation, University of Gondar, Ethiopia. Third Author – Mr. Haimanot Atinikut, Lecturer, Department of Rural Development and Agricultural Extension, College of Agriculture and Rural Transformation, University of Gondar, Ethiopia. Fourth Author – Mr. Mohammed Gedefaw, Lecturer, Department of Natural resources Management, College of Agriculture and Rural Transformation, University of Gondar, Ethiopia.

International Journal of Scientific and Research Publications, Volume 7, Issue 4, April 2017 52 ISSN 2250-3153
www.ijsrp.org
Assessing Stakeholders Integration in Practicing Agricultural Extension System in Selected Districts of
North Gondar Zone Beyene Derso, Kibrom Adino, Haimanot Atinkut, and Mohamed Gedefaw
Lecturer, College of Agriculture and Rural Transformation, University of Gondar
Abstract- There is a need for an integration of stakeholders that are dealing with agricultural development in problem identification, planning, implementation and evaluation. This integration and regular share of knowledge and information among them could bring sustainable agricultural development. However, these holistic approach performances were not assessed and documented for future improvement in Amhara Region, North Gondar. In light of this, the study look into the stakeholders’ integration existed in agricultural extension practices in north Gondar zone, located at North of Amhara region. The objective of the study is to assess the existing stakeholders’ integration in Agricultural extension practice in the study area. The sampling procedure followed multi-stage sampling to draw three woredas out of 23 woredas, (one from Dega, one from woyna Dega, and one from kola were selected purposively). With regard to data type and source, both primary and secondary data as well as qualitative and quantitative data were collected. In addition to respondents’ interview, focus group discussion, key informants interview and case studies were used for qualitative data analysis. Descriptive statistics of mean, standard devotions and percent was applied. For statistical tests, chi-square and T-test were employed. As a conclusion, though the main stakeholders that has to be involved in agricultural extension practices supposed to be ample; their integration is very weak and the majority of the organization was not participated regularly in all activities. At the same time, the level of Inter-organizational linkage and coordination is very weak, stakeholders didn’t work together to practice agricultural extension because of not giving due attention , The mandate of Coordination was give to woreda and zonal administrators Based on our conclusion we adhered for the relevance of integration in agricultural extension practices and therefore there should be strong integration and any responsible bodies must do to strengthen the linkage of them, should be regular participation and strong inter-organizational linkage of stakeholders to practice the activities of agricultural extension, every stakeholder must give due attention and work together to practice Agricultural extension, for effective integration stakeholders must have prepared and approved modality in to practice, for effective integration, stakeholders should be empowered and different mechanisms must be used for sharing information and other new practices, the coordination of stakeholders must be given to the responsible bodies independently and stakeholders must be participated whenever necessary in the fiscal year.
Index Terms- Stakeholders integration, Agricultural Extension practices
I. INTRODUCTION n Ethiopian, Agriculture contributes 50% of gross domestic production (GDP), employs 85% of the population and the
main income-generating sector for the majority of the rural population. It also serves as the main source of food and generates 90% of the foreign exchange earnings. It provides raw materials for more than 70% of the country’s industry (Getahun, 2004). Even though different extension approaches have been implementing, Ethiopian agriculture is characterized by low productivity, and the experiences over the past four decades did not bring major impacts on the productivity of smallholders and it has been unable to produce sufficient quantities to feed the country's rapidly growing population (Dercon, 2000). One of the reasons is low level of technology transfer and adoption. Moreover, much of the agricultural research and extension over recent decades has failed in noticeable improvement of poor people's livelihoods. But even without the support of research and extension services, farmers can and do adapt to changes in their environment. Many farmers are natural innovators, some more than others. The key is to recognize these innovations and to integrate them into agricultural research and development (Amanuel, 2007). It is important to bring the various stakeholders together, to bring the policy makers, the politicians, the legislators, the administrators, researchers, Extensionists, farmers, etc. on board they must understand the concept, the theories, methods involved within research and development. If we bring them together to the same table, they can understand, they can appreciate, the merits of this holistic approach. To be institutionalized in the research and development approach. It must be planted and nurtured and then agriculture can be sustainable (Alex, 2007). In north Gondar, crop production, animal production and water and soil conservation activities have been practicing. For the improvement of those practices, agricultural extension services have been providing trainings and inputs as well as supervision up to the local level. Research and some NGOs, also have been trying to support farmers by demonstrating new technologies and providing training (NGZAD, 2015). Research-Extension-Farmer Advisory Council (REFAC) meeting held once per 6 months at zonal level and exchanging ideas on field days at some localities. Even though, these
I

International Journal of Scientific and Research Publications, Volume 7, Issue 4, April 2017 53 ISSN 2250-3153
www.ijsrp.org
activities have been done, government sectors, private organizations, NGOs, farmers, universities, etc. integration such as information exchange, knowledge and experience sharing in planning, implementing and evaluation in agricultural development process was not as such seen strong (NGZAD, 2015). In light of this, the study will assess the current stakeholder’s Integration and their linkage / how they interact and what linkages exist among them/. Assessing the existing stakeholders’ linkage in implementing Agricultural Extension in the study areas need to be studied, but systematical and empirical study was not attempted so far. Therefore, the proposed study addresses this research gap and tries to make empirical inferences to provide valuable research outputs, that could be used by stakeholders who are participating in agricultural development process as well as policy makers in planning appropriate mechanisms that would improve actors integrations, knowledge and information sharing in order to achieve agricultural development.
II. METHOD AND APPROACHES USED 1.1. Description of the study area
Location: The study was conducted in North Gondar Zone, Amhara National Regional State (ANRS) and representative sample woredas were three of which Wogera from Dega, Chilga from Woyna Dega and Metema from Kola Districts.
1.2. Sample and sampling technique To select the sample from each organization at local,
woreda and zonal level, multistage sampling technique was applied. North Gondar zone contains 23 woredas. In the first stage of sampling, woredas was stratified according to their agro-ecology such as Dega, Woyna Dega and Kola.
In the second stage, 3 representative woredas that is 1 from Dega, 1 from woyna Dega and 1 from kola and 6 sample kebeles (2 Kebele in each woreda) was selected purposively. In the third stage of sampling, stakeholders were listed at all levels and taken 120 sample respondents from each stakeholder by using simple random sampling method.
1.3. Data Types, Sources and method of collection In this study, qualitative and quantitative as well as
primary and secondary data was collected. The primary quantitative data was collected from the respondents using a pre- tested, structured interview schedule, discussions and personal observations. This interview schedule for primary data includes open-ended and closed-ended questions. Secondary quantitative data were collected through reviewing documents from documents, studies, records and reports of Kebele, Woreda and zonal representative farmer’s organizations, NGOs and GOs offices.
Qualitative data was collected through discussions with focus groups and key-informants, observations and case studies. In order to investigate detailed information, group discussion was carried out in each Kebele, woreda and at zonal level based on the check list that
was prepared. In addition, discussion with Kebele, Woreda and zonal officials, DAs and concerned woreda Agricultural office experts were also conducted.
1.4. Methods of Data Analysis Following the completion of the data collection, the data
was coded and entered in to statistical Package for Social Science (SPSS version 20) computer program for analysis. Qualitative data was analyzed using different qualitative statistical procedures and methods. Descriptive tools were supplemented by qualitative analytical methods like interpretation and explanation of various opinions, views and concepts; and summarizing, categorizing, and presentation of these in convenient forms and descriptive statistical tools were used to analyze the quantitative data. The important statistical measures that are used to summarize and categorize the research data was means, percentages, frequencies, standard deviations, chi-square and T-Test.
III. RESULTS AND DISCUSSIONS: In this part, the results of focused group discussion, key informant interview and survey were presented and discussed. The descriptive analyses were done to describe the existing stake holders’ integration for Agricultural extension practices in north Gondar Administrative zone. The significance of the result was tested by using Chi-square and T -test.
1.5. Personal Characteristics of respondents Under personal characteristics of the respondents, Age, Sex, Educational level, Religion, occupation, marital status and family size were seen. When we see the age of the respondents, it is the number of completed years of the respondents from the time of birth till the time of the survey conducted. Table 1 below shows that 47.5% of the respondents were within the age group of 15-30 years, 33.3% in between 31-45 years, 18.3% in between of 46-60 years and the rest 0.8% were above 60 years old. It implies the majority of the respondents were between 15-45 years old. When we see the sex of the respondents, 63.3 % were male and 36.7% were female. So, the majority of the respondents were male. Educational level is refers to the grades completed through formal schooling. As to table 1 below shows, it was found that from the total respondents about 3.3% were able to read and write, 6.7% belonged to grade 1-8, 4.2% were between grade 9-12, 18.3% were diploma holder, 55.8% were degree holder and the rest 11.7% were masters holder. This implies the majority of the respondents were degree holder. With regarding to Religion, 94.2% of the respondents were follower of Orthodox, while 4.2% of the respondents were followers of Muslim and the rest 1.7% were other religion followers. This implies that the vast majority of the respondents were followers of Orthodox religion. Concerning occupation, as the table 1 below shows, from the total respondents about 40% was engaged in agriculture, where as the rest 60% were non agriculture. The result shows, the majority of the respondents were engaged in the field of non agriculture.
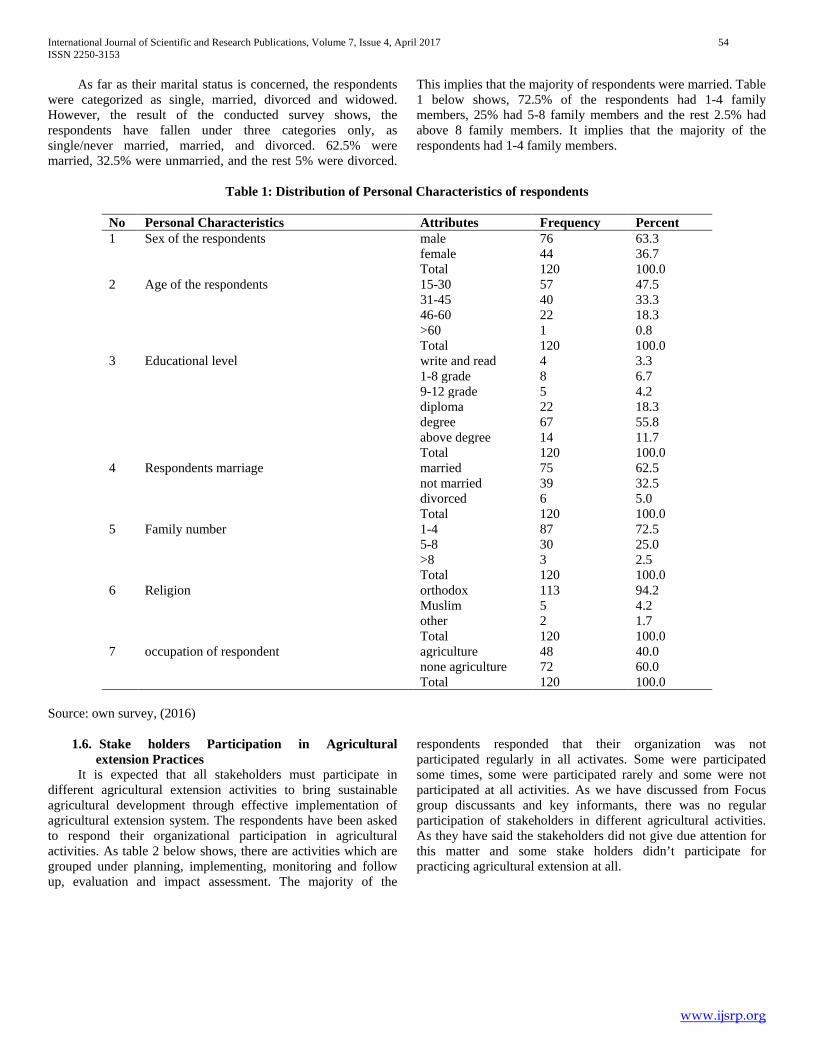
International Journal of Scientific and Research Publications, Volume 7, Issue 4, April 2017 54 ISSN 2250-3153
www.ijsrp.org
As far as their marital status is concerned, the respondents were categorized as single, married, divorced and widowed. However, the result of the conducted survey shows, the respondents have fallen under three categories only, as single/never married, married, and divorced. 62.5% were married, 32.5% were unmarried, and the rest 5% were divorced.
This implies that the majority of respondents were married. Table 1 below shows, 72.5% of the respondents had 1-4 family members, 25% had 5-8 family members and the rest 2.5% had above 8 family members. It implies that the majority of the respondents had 1-4 family members.
Table 1: Distribution of Personal Characteristics of respondents
No Personal Characteristics Attributes Frequency Percent 1 Sex of the respondents male 76 63.3
female 44 36.7 Total 120 100.0
2 Age of the respondents 15-30 57 47.5 31-45 40 33.3 46-60 22 18.3 >60 1 0.8 Total 120 100.0
3 Educational level write and read 4 3.3 1-8 grade 8 6.7 9-12 grade 5 4.2 diploma 22 18.3 degree 67 55.8 above degree 14 11.7 Total 120 100.0
4 Respondents marriage married 75 62.5 not married 39 32.5 divorced 6 5.0 Total 120 100.0
5 Family number 1-4 87 72.5 5-8 30 25.0 >8 3 2.5 Total 120 100.0
6 Religion orthodox 113 94.2 Muslim 5 4.2 other 2 1.7 Total 120 100.0
7 occupation of respondent agriculture 48 40.0 none agriculture 72 60.0 Total 120 100.0
Source: own survey, (2016)
1.6. Stake holders Participation in Agricultural extension Practices
It is expected that all stakeholders must participate in different agricultural extension activities to bring sustainable agricultural development through effective implementation of agricultural extension system. The respondents have been asked to respond their organizational participation in agricultural activities. As table 2 below shows, there are activities which are grouped under planning, implementing, monitoring and follow up, evaluation and impact assessment. The majority of the
respondents responded that their organization was not participated regularly in all activates. Some were participated some times, some were participated rarely and some were not participated at all activities. As we have discussed from Focus group discussants and key informants, there was no regular participation of stakeholders in different agricultural activities. As they have said the stakeholders did not give due attention for this matter and some stake holders didn’t participate for practicing agricultural extension at all.
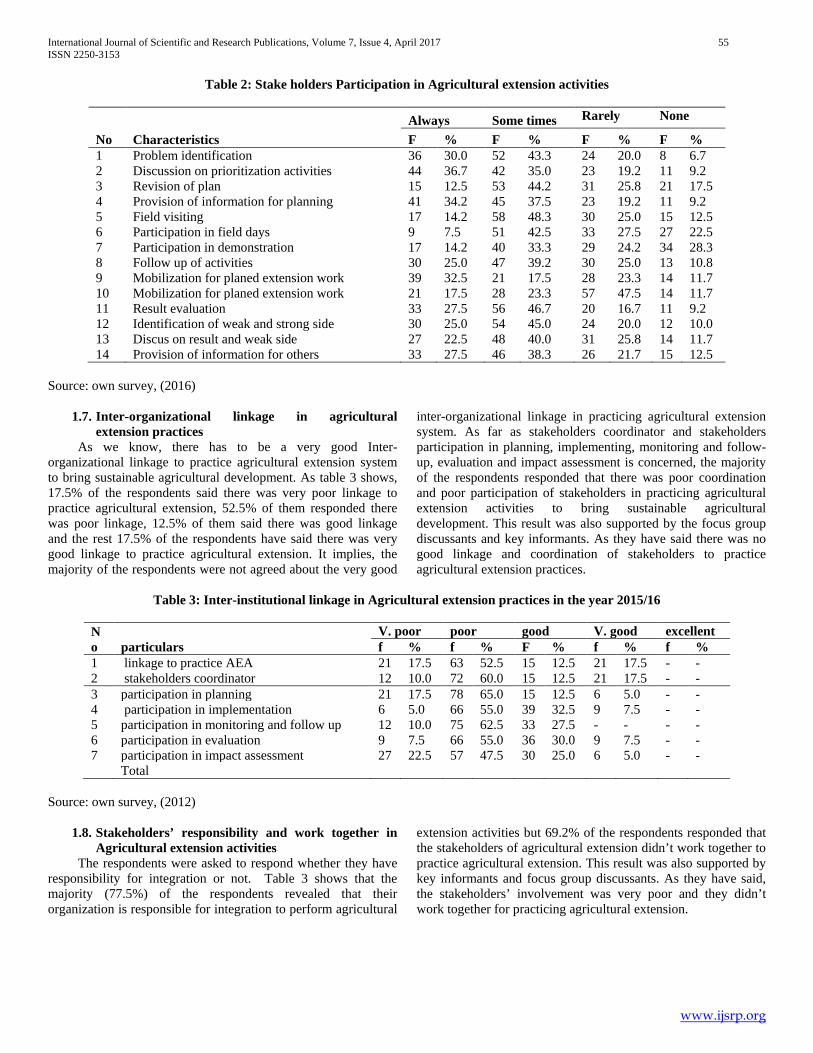
International Journal of Scientific and Research Publications, Volume 7, Issue 4, April 2017 55 ISSN 2250-3153
www.ijsrp.org
Table 2: Stake holders Participation in Agricultural extension activities
No Characteristics Always Some times Rarely None
F % F % F % F % 1 Problem identification 36 30.0 52 43.3 24 20.0 8 6.7 2 Discussion on prioritization activities 44 36.7 42 35.0 23 19.2 11 9.2 3 Revision of plan 15 12.5 53 44.2 31 25.8 21 17.5 4 Provision of information for planning 41 34.2 45 37.5 23 19.2 11 9.2 5 Field visiting 17 14.2 58 48.3 30 25.0 15 12.5 6 Participation in field days 9 7.5 51 42.5 33 27.5 27 22.5 7 Participation in demonstration 17 14.2 40 33.3 29 24.2 34 28.3 8 Follow up of activities 30 25.0 47 39.2 30 25.0 13 10.8 9 Mobilization for planed extension work 39 32.5 21 17.5 28 23.3 14 11.7 10 Mobilization for planed extension work 21 17.5 28 23.3 57 47.5 14 11.7 11 Result evaluation 33 27.5 56 46.7 20 16.7 11 9.2 12 Identification of weak and strong side 30 25.0 54 45.0 24 20.0 12 10.0 13 Discus on result and weak side 27 22.5 48 40.0 31 25.8 14 11.7 14 Provision of information for others 33 27.5 46 38.3 26 21.7 15 12.5
Source: own survey, (2016)
1.7. Inter-organizational linkage in agricultural extension practices
As we know, there has to be a very good Inter-organizational linkage to practice agricultural extension system to bring sustainable agricultural development. As table 3 shows, 17.5% of the respondents said there was very poor linkage to practice agricultural extension, 52.5% of them responded there was poor linkage, 12.5% of them said there was good linkage and the rest 17.5% of the respondents have said there was very good linkage to practice agricultural extension. It implies, the majority of the respondents were not agreed about the very good
inter-organizational linkage in practicing agricultural extension system. As far as stakeholders coordinator and stakeholders participation in planning, implementing, monitoring and follow-up, evaluation and impact assessment is concerned, the majority of the respondents responded that there was poor coordination and poor participation of stakeholders in practicing agricultural extension activities to bring sustainable agricultural development. This result was also supported by the focus group discussants and key informants. As they have said there was no good linkage and coordination of stakeholders to practice agricultural extension practices.
Table 3: Inter-institutional linkage in Agricultural extension practices in the year 2015/16
No particulars
V. poor poor good V. good excellent f % f % F % f % f %
1 linkage to practice AEA 21 17.5 63 52.5 15 12.5 21 17.5 - - 2 stakeholders coordinator 12 10.0 72 60.0 15 12.5 21 17.5 - - 3 participation in planning 21 17.5 78 65.0 15 12.5 6 5.0 - - 4 participation in implementation 6 5.0 66 55.0 39 32.5 9 7.5 - - 5 participation in monitoring and follow up 12 10.0 75 62.5 33 27.5 - - - - 6 participation in evaluation 9 7.5 66 55.0 36 30.0 9 7.5 - - 7 participation in impact assessment 27 22.5 57 47.5 30 25.0 6 5.0 - - Total
Source: own survey, (2012)
1.8. Stakeholders’ responsibility and work together in Agricultural extension activities
The respondents were asked to respond whether they have responsibility for integration or not. Table 3 shows that the majority (77.5%) of the respondents revealed that their organization is responsible for integration to perform agricultural
extension activities but 69.2% of the respondents responded that the stakeholders of agricultural extension didn’t work together to practice agricultural extension. This result was also supported by key informants and focus group discussants. As they have said, the stakeholders’ involvement was very poor and they didn’t work together for practicing agricultural extension.
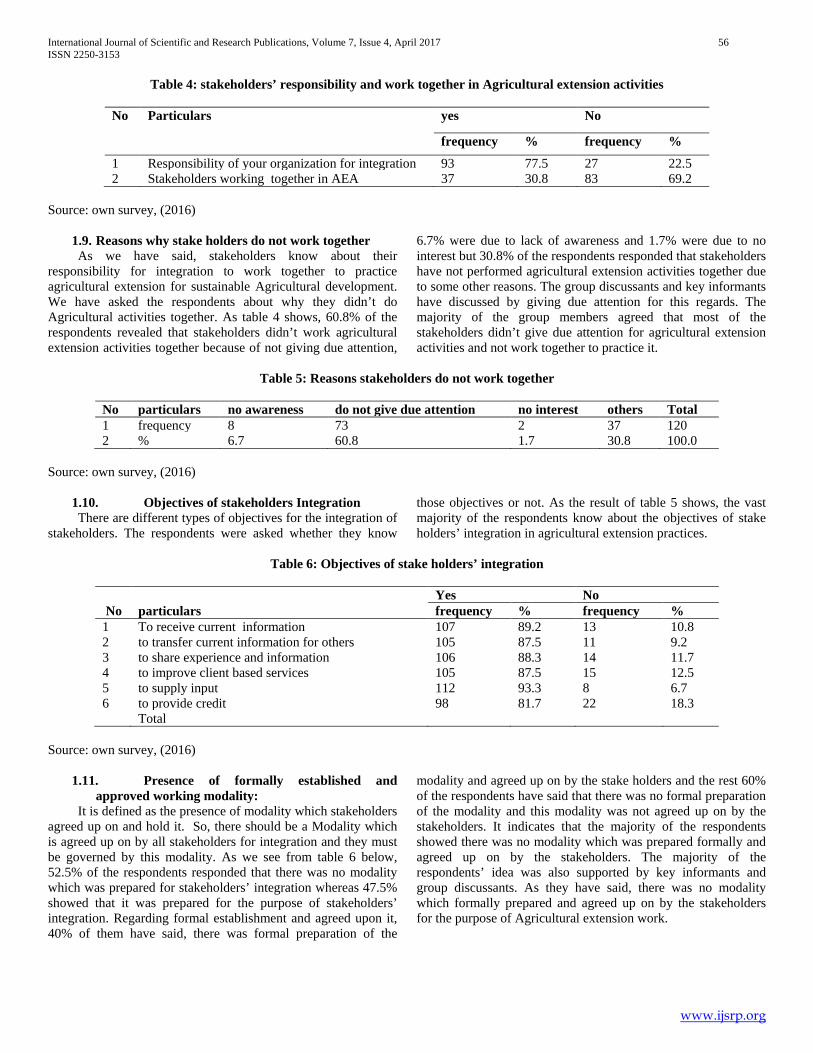
International Journal of Scientific and Research Publications, Volume 7, Issue 4, April 2017 56 ISSN 2250-3153
www.ijsrp.org
Table 4: stakeholders’ responsibility and work together in Agricultural extension activities
No Particulars yes No
frequency % frequency % 1 Responsibility of your organization for integration 93 77.5 27 22.5 2 Stakeholders working together in AEA 37 30.8 83 69.2
Source: own survey, (2016)
1.9. Reasons why stake holders do not work together As we have said, stakeholders know about their responsibility for integration to work together to practice agricultural extension for sustainable Agricultural development. We have asked the respondents about why they didn’t do Agricultural activities together. As table 4 shows, 60.8% of the respondents revealed that stakeholders didn’t work agricultural extension activities together because of not giving due attention,
6.7% were due to lack of awareness and 1.7% were due to no interest but 30.8% of the respondents responded that stakeholders have not performed agricultural extension activities together due to some other reasons. The group discussants and key informants have discussed by giving due attention for this regards. The majority of the group members agreed that most of the stakeholders didn’t give due attention for agricultural extension activities and not work together to practice it.
Table 5: Reasons stakeholders do not work together
No particulars no awareness do not give due attention no interest others Total 1 frequency 8 73 2 37 120 2 % 6.7 60.8 1.7 30.8 100.0
Source: own survey, (2016)
1.10. Objectives of stakeholders Integration There are different types of objectives for the integration of stakeholders. The respondents were asked whether they know
those objectives or not. As the result of table 5 shows, the vast majority of the respondents know about the objectives of stake holders’ integration in agricultural extension practices.
Table 6: Objectives of stake holders’ integration
No particulars Yes No frequency % frequency %
1 To receive current information 107 89.2 13 10.8 2 to transfer current information for others 105 87.5 11 9.2 3 to share experience and information 106 88.3 14 11.7 4 to improve client based services 105 87.5 15 12.5 5 to supply input 112 93.3 8 6.7 6 to provide credit 98 81.7 22 18.3 Total
Source: own survey, (2016)
1.11. Presence of formally established and approved working modality:
It is defined as the presence of modality which stakeholders agreed up on and hold it. So, there should be a Modality which is agreed up on by all stakeholders for integration and they must be governed by this modality. As we see from table 6 below, 52.5% of the respondents responded that there was no modality which was prepared for stakeholders’ integration whereas 47.5% showed that it was prepared for the purpose of stakeholders’ integration. Regarding formal establishment and agreed upon it, 40% of them have said, there was formal preparation of the
modality and agreed up on by the stake holders and the rest 60% of the respondents have said that there was no formal preparation of the modality and this modality was not agreed up on by the stakeholders. It indicates that the majority of the respondents showed there was no modality which was prepared formally and agreed up on by the stakeholders. The majority of the respondents’ idea was also supported by key informants and group discussants. As they have said, there was no modality which formally prepared and agreed up on by the stakeholders for the purpose of Agricultural extension work.

International Journal of Scientific and Research Publications, Volume 7, Issue 4, April 2017 57 ISSN 2250-3153
www.ijsrp.org
Table 7: Formally established and approved working modality for integration
No Particulars Yes No frequency % frequency %
1 presence of modality for integration 57 47.5 63 52.5 2 Formally established and agreed up on 48 40.0 72 60.0 Total
Source: own survey, (2016)
1.12. Mechanisms of information sharing between stake holders in Agricultural activities
There are different mechanisms which stakeholders can use to share the new ideas, practices, knowledge, and systems and so on. So, the respondents were asked to tell which methods/mechanisms they use to share new knowledge/information between them. So table 7 below shows that, 70.8% of the respondents revealed that stakeholders conducted meeting to share new information/knowledge, 10% of them said, stakeholders used telephone to share new information, 15.8% said letter was used by them and the rest 3.3% of the
respondents have said that meeting, letter and telephone were used by the stakeholders to share new information. This implies that the majority of the respondents have indicated meeting was the means to share new information between stakeholders. The question was also raised for group discussants to know the mechanisms which stakeholders used to share new information, practices, knowledge and working culture for agricultural extension practices. So the discussants revealed that the majority of the stakeholders used irregular meetings for this purpose. As they have said it was also conducted when it is necessary.
Table 8: Mechanisms of sharing information between stakeholders
no Particulars meet if necessary Telephone Letter All Total 1 frequency 85 12 19 4 120 2 % 70.8 10.0 15.8 3.3 100.0
Source: own survey, (2016)
1.13. Level of Stakeholders’ integration for information exchange
Table 8 below shows the level of stakeholders’ integration for information exchange in agricultural extension practices. The result shows that 26.7% of the respondents revealed that 18.3% of the respondents have said there was high level of integration
for information exchange, 47.5% responded there was medium level and the rest 34.2% of the respondents revealed there was low level of integration for information exchange. There focus group discussant and key informants showed there was low level of integration and their organization has not highly empowered and influential for information exchange.
Table 9: Level of Stakeholders’ integration for information exchange
No particulars High medium low F % F % F %
1. Level of integration 22 18.3 57 47.5 41 34.2 Source: own survey, (2016)
1.14. Stakeholders’ participation in agricultural extension activities in the year 2015/16
Stakeholders must participate in the activities of agricultural extension so many times in a fiscal year, because the
activities will be performed different times in a year. But as we see from table 9 below, the majority of the stakeholders were not participated more than once a year in planning, farmers’ field days, coordinating and visiting tasks and in result evaluation.
Table 10: stakeholders’ participation in the year 2015/16
No particulars
Numbers of participation in a year 0 1 2 ≥3 F % F % F % F %
1 participation in annual planning 32 26.7 54 45.0 23 19.2 11 9.1 2 participation in farmer field day 39 32.5 37 30.8 21 17.5 23 19.2 3 participation in coordinating tasks 35 29.2 35 29.2 18 15.0 32 26.7 4 participation in task visiting 39 32.5 36 30.0 24 20.0 21 17.6

International Journal of Scientific and Research Publications, Volume 7, Issue 4, April 2017 58 ISSN 2250-3153
www.ijsrp.org
5 participation in result evaluation 38 31.7 42 35.0 24 20.0 16 13.3 Total
Source: own survey, (2016)
1.15. Responsibility for stakeholders’ coordination
The respondents were asked to respond who was the responsible body for coordination of stakeholders in agricultural extension practices. As table 10 shows, 40% of the respondents revealed Agricultural office was the coordinator for stakeholders integration, 4.2% responded farmer cooperatives was the coordinator, 55.8% revealed woreda/zonal administrator were the
coordinator of stakeholders in agricultural extension practices. It implies that the majority of the respondents showed woreda/zonal administrators were the coordinators of stakeholders’ integration in agricultural extension practices. Group discussants and key informants also said that this task was not run independently but it was run together with other tasks by the administrators and to this effect, it was not that much effective.
Table 11: Responsibility for stakeholders’ coordination
No agriculture office Farmers’ cooperatives administrator Total 1 frequency 48 5 67 120 2 % 40.0 4.2 55.8 100.0
Source: own survey, (2016)
IV. CONCLUSIONS AND RECOMMENDATIONS 1.16. Conclusion:
Stakeholders’ integration/Actors linkage is very important for practicing agricultural extension to bring sustainable agricultural development. In agricultural extension system there are diversified activities which are performed to satisfy farmers’ needs and aspirations. So it needs strong linkage of agricultural extension stakeholders to do these diversified activities. As the survey result indicated, the age of majority of the respondents were found under the age of 15-45 years and the majority of the respondents were male. When we see the educational level, religion, marital status and family size of the respondents, the majority of them were degree holder, followers of Orthodox religion, married, and 1-4 family members respectively. Stakeholders Participated in Agricultural extension Practices in many dimensions, such as planning, implementing, monitoring and follow up and evaluation. So, as the result indicated, the majority of the organization was not participated regularly in all activates. Some were participated some times, some were participated rarely and some were not participated at all activities. As we have seen the result of the level of Inter-organizational linkage and its coordination, the majority of the respondents were not agreed about the very good inter-organizational linkage to practice agricultural extension and they said there was poor inter-organizational linkage. As far as stakeholders coordination and their participation in planning, implementing, monitoring and follow-up, evaluation and impact assessment is concerned, the majority of the respondents responded that there was poor coordination and poor participation in practicing agricultural extension activities to bring sustainable agricultural development.
As the existing Actors’ linkage in Agricultural extension practices have been seen, Stakeholders’ responsibility for Agricultural extension activities and the way they work together was assessed. Every stakeholder must know that they are responsible for integration and work together in agricultural extension activities and the results indicated that the majority of the organizations were responsible for integration to perform agricultural extension activities but they didn’t work together. The reason why stakeholders do not work together was also asked and the result showed that the majority didn’t work together because of not giving due attention and for some were due to lack of awareness. It was also asked whether they have prepared and approved working modality or not by them for their integration. But as the study result indicated, the majority of the respondents showed that there was no modality which was prepared formally and agreed up on by the stakeholders. Concerning Mechanisms of information sharing between stakeholders, there are different mechanisms which stakeholders can use to share the new ideas, practices, knowledge, and systems and so on. So, the respondents were asked to tell which mechanisms they used. So the result showed that the majority of the respondents have used conduct meeting to share new information, practices, knowledge and ideas. We have seen the level stakeholders’ integration for information exchange. The result showed that there was no high integration and their organization has not highly empowered for information exchange. In addition to this the study indicated that the majority of the stakeholders’ participation was less than once in a year in planning, farmers’ field days, coordinating and visiting tasks and in result evaluation and the responsibility for stakeholders’ coordination was given to woreda/zonal administrators and it was supported by focus group discussants and key informants.
1.17. Recommendations

International Journal of Scientific and Research Publications, Volume 7, Issue 4, April 2017 59 ISSN 2250-3153
www.ijsrp.org
As we have said stakeholders’ integration is very important for practicing agricultural extension to bring sustainable agricultural development and as the study result indicated, the main stakeholders that might be involved in agricultural extension practices were too much. But their integration and participation was very weak. So, there should be strong integration and any responsible bodies must strengthen their linkage and participation.
In agricultural extension system, there are main activities which must be performed by the stakeholders in a regular base. But as the result indicated, the majority of the organization was not participated regularly in all activates and the level of Inter-organizational linkage and coordination is very weak. So, there should be regular participation and strong inter-organizational linkage of stakeholders to practice the activities of agricultural extension and all stakeholders must give due attention for these critical issues.
Every stakeholder must know that they are responsible for integration and work together in agricultural extension activities and the results indicated that the majority of the organizations were responsible for integration. But they didn’t work together because of not giving due attention and lack of awareness. So, every stakeholder must give due attention and create awareness for whom they have the gap.
The presence of modality which stakeholders agreed up on and hold it is a mandatory for effective integration. But there is no modality which stakeholders prepared formally and agreed up on it. So, for effective integration stakeholders should prepare, approve and change it in to practice.
Most of the time stakeholders use conducting of
irregular meeting for sharing of information, new ideas, practices and knowledge and there was no high integration, information exchange and their organization was not highly empowered for information exchange. So, for effective integration stakeholders should be
empowered and other mechanisms must be used for sharing of information and new practices.
Stakeholders’ participation in planning, implementing, monitoring and evaluation is less than once in a fiscal year and the responsibility for stakeholders’ coordination was given to woreda and zonal administrators. But the coordination of stakeholders must be given to the responsible bodies including Agricultural offices independently and stakeholders must be participated whenever necessary.
REFERENCES [1] Alex, L., 2007. Ministry of Agriculture, Animal Industries and Fisheries,
Uganda. [2] Amanuel, A., 2007. Agri Service Ethiopia. [Online accessed in September,
2010] On line at http://www.wrenmedia.co... [3] Amanuel, A., 2007. Agricultural innovation system. Agri service Ethiopia.
[On line accessed in September, 2010] http://www.wrenmedia.co... [4] Dercon, S., 2000. Growth and Poverty in Ethiopia in the 1990s: An
Economic Perspective, Centre for the Study of African Economies, Oxford University.
[5] Getahun, D., 2004. Assessment of Factors Affecting Adoption of Wheat Technologies and Its Impact: The Case of Hula Woreda Ethiopia. A MSc. Thesis (Unpublished) Presented to School of Graduate Studies of Alemaya University.
[6] North Gondar Zone Agricultural department (2015). Annual report.
AUTHORS First Author – Beyene Derso, Lecturer, College of Agriculture and Rural Transformation, University of Gondar Second Author – Kibrom Adino, Lecturer, College of Agriculture and Rural Transformation, University of Gondar Third Author – Haimanot Atinkut, Lecturer, College of Agriculture and Rural Transformation, University of Gondar Fourth Author – Mohamed Gedefaw, Lecturer, College of Agriculture and Rural Transformation, University of Gondar

International Journal of Scientific and Research Publications, Volume 7, Issue 4, April 2017 60 ISSN 2250-3153
www.ijsrp.org
Development of a questionnaire onPrevention and Risk of Metabolic Syndrome among a rural population in
Kelantan. Norhafizah Ab Manan*, Nor Azwany Yaacob**, Al-Safi Ismail**
* Public Health and Community Medicine department, CUCMS
**Community Medicine department, USM Abstract-The number of metabolic syndrome is increasing, necessity an assessment of knowledge to avoid this population growing. The aims of this study were to develop and validate Malay questionnaire on knowledge of prevention and risk on metabolic syndrome. Methodology: Cross sectional study was done among 200 samples from three villages in Bachok, Kelantan by face-to-face interview. Twenty-eight items were developed by a group of public health experts. To assess test retest reliability, 62 from all respondents were re-interviewed for the second time after two weeks interval. Result: Respondents were aged between 18 to 84 years old. Majority of the subjects were Malay (98%) and female (89%). Two items from the original questionnaire were deleted due to low correlations and after being judge unduly influence item. The factor loading using principal component analysis with varimax rotation was ranged from 0.41 to 0.84. Internal consistency of the components using cronbach’s alpha was ranged from 0.403 to 0.809. Intra Class Correlation (ICC) test was performed for test-retest reliability with the coefficient at 0.95. Conclusion:An acceptable questionnaire was developed for measuringthe knowledge on prevention and risk of metabolic syndrome. The feasibility was present and the internal consistency and ICC were excellent. It can be used to explore the baseline of knowledge of metabolic syndrome before tailoring anyhealth educationor promotion for preventing metabolic syndrome in Malaysia. Index TermsMetabolic syndrome, validation, questionnaire, knowledge, factor analysis.
I. INTRODUCTION efinition of metabolic syndrome was initially introduced in 1998 by WHO. After that, several agencies such as
International Definition Federation(IDF) and National Cholesterol Education Program Adult Treatment Panel III (NCEP/ATP III) have proposed their own definition.Generally, metabolic syndrome is characterized by constellation of insulin resistance, hyperlipidaemia, central obesity and high blood pressure [1]. Prevalence of metabolic syndrome is accelerating not only in western country, but also in asian countries. Using NCEP/ATP III definition, 28.4% are reported of having metabolic syndrome in Jakarta, Indonesia [2]. Meanwhile, in India and China, based
to IDF definition, prevalence of metabolic syndrome is 43.2% [3] and 33.9% [4] respectively. Using the same definition, the prevalence of metabolic syndrome in Malaysia is 37% [5]. It is high in urban as well as in rural community [5, 6, 7]. Prevention by primary intervention such as exercise regularly and eating healthy diet are very important to benefit for this disease not accelerating in the future. Thus, assessing their knowledge on this syndrome is very useful for planning intervention especially for health education and promotion, so that the intervention is more specific. Questionnaire is one of the common tools has been used to assess knowledge and it can measure knowledge effectively. To ensure a questionnaire is valid, it must go through a validation process for assessingtheir ease of comprehension, relevance to their intended topics, effectiveness in providing useful information, and the degree to which the questions are interpreted and understood by different individual [8]. There were several studies in measuring knowledge on diseases that are related to metabolic syndrome in Malaysia [9, 10], but, there are no available questionnaires that measure knowledge on prevention and risk of metabolic syndrome using Malaysian local language. This study is aim to develop and validate a Malay language questionnaire to measure the knowledge on prevention and risk of metabolic syndrome.
II. METHODOLOGY This cross-sectional study was done among rural community in Bachok, Kelantan. Houses were chosen randomly using simple random sampling and only one respondent from each house was selected to be the respondents. Malaysian who at least 18 years and understand Malay language could participate in this study. Criteria considered in calculating sample size were subjects-to-variable ratio, internal consistency, and confident interval width for test retest reliability. After consider 20% of non-response, sample size was determined at 214.
A. Design of the Questionnaire
The questionnaire began with socio-demographic characteristics including gender, age, race and education level. Then followed
D

International Journal of Scientific and Research Publications, Volume 7, Issue 4, April 2017 61 ISSN 2250-3153
www.ijsrp.org
by 28 items about the risk and prevention of disease that related to metabolic syndrome. The questionnaire was structured in Malay language for face-to-face interview. It was developed based on reviews of International recommendation and guidelines for treatment or prevention of metabolic syndrome [11 ,12]. A group of experts from University Science of Malaysia (USM) which consist of four endocrinologists, one epidemiologist, one dietician, one family medicine specialist and one diabetic epidemiologist were involve to create the items. The questions need to be answered as “True”, “False” or “Do not know”. Score were given as zero for incorrect answer, one for “don’t know” answer, and two for correct answer.
Pre-test (n=6) and pilot studies (n=35) were done prior to the study. After that, minor revisions were made in response to respondents’ suggestion and the initial version of the questionnaire was finalized.There were two interviewers in collecting the data, therefore discussion was made between the interviewers to standardized the way to interview.Besides that, 36 from the total respondents were selected by simple random sampling to be interviewed two times by different interviewer. Finally, to test the reliability of the questionnaire test-retest was done among 62 respondents who were re-interviewed again after two weeks’ interval by the same interviewer.
B. Statistical Analysis
All statistical analyses in this study were conducted by using SPSS 20. Descriptive statistics were used to describe demographic characteristics and for each item by calculating the mean (SD) and frequency (%). Principle Component Analysis (PCA) extraction method with direct varimax rotation was conducted on the items to determine the factor structure of the scale. To verify that the data set is suitable for factor analysis, the Kaiser–Meyer–Olkin Measure of Sampling Adequacy (KMO) [13] and the Bartlett’s test of sphericity [14] were applied. The criteria used to select the number of factors and the number of items within a factor, exploratory factor analysis included: eigenvalue greater than 1; item-factor loading of at least 0.4 [15]. Test-retest data was used to assess the stability of the questionnaire by using intra class correlation (ICC) analysis.Cronbach’s alpha for internal consistency and Kappa statistics is for inter-viewer reliability.
C. Ethical approval
The study was approved by Medical Research and Ethics Committee Ministry of Health, Malaysia. This study also approved by Research Ethics Committee (Human), USM.
III. RESULT A total of 200 respondents age ranged between 19 to 70 years old (mean (SD):46 (17) agreed to participate consequential the response rate of 93%. Majority of the respondents were female (80%) and Malays (98%). Meanwhile, with regards of education, 41% had secondary education meanwhile 20% had tertiary education.
A. Item level descriptive statistics The mean values of 28 items ranged from 0.41 to 1.9 (Table 1). Table 1: Descriptive analysis of each item.
Items Mean score (SD) Correct answer
no (%)
1 1.6 (0.67) 132 (66.0) 2 1.5 (0.76) 135 (67.5) 3 1.7 (0.55) 145 (72.5) 4 1.5 (0.80) 133 (65.5) 5 1.4 (0.84) 125 (62.5) 6 1.6 (0.55) 131 (65.5) 7* 1.8 (0.42) 132 (66.0) 8 1.8 (0.51) 160 (80.0) 9 1.8 (0.46) 166 (83.0) 10 1.7 (0.56) 155 (77.5) 11 1.6 (0.55) 132 (66.0) 12 1.7 (0.54) 140 (70.0) 13* 1.8 (0.45) 164 (82.0) 14 2.0 (0.24) 191 (95.5)
15 1.8 (0.46) 162 (81.0) 16 1.2 (0.90) 106 (53.0) 17 1.5 (0.70) 122 (61.0) 8* 1.8 (0.50) 169 (84.5) 19 1.7 (0.61) 158 (79.0) 20 1.8 (0.42) 169 (84.5) 21 1.6 (0.73) 149 (74.5) 22 1.5 (0.75) 120 (60.0) 23* 1.7 (0.63) 157 (78.5) 24* 0.4 (0.77) 35 (17.5) 25 1.9 (0.27) 191 (95.5) 26 1.4 (0.85) 131 (65.5) 27 0.7 (0.66) 39 (19.5) 28* 1.7 (0.62) 153 (76.5)
* The items were excluded in the final analysis
B. Factor Analysis
Six items were removed due to low correlation with the other items resulting only 22 items left to be continued for further analysis. Factor loading is shown in Table 2 and Fig. 1. Scree plot indicated that a five solution was appropriate. The five factors accounted for 50.73% of the total variance. All items loaded at greater than or equal to 0.407. The KMO value was 0.73 and Bartlett's Test of Sphericity was significant (p value=<0.001). All the factors had 0% of floor and ceiling effect
C. Analysis for Consistency
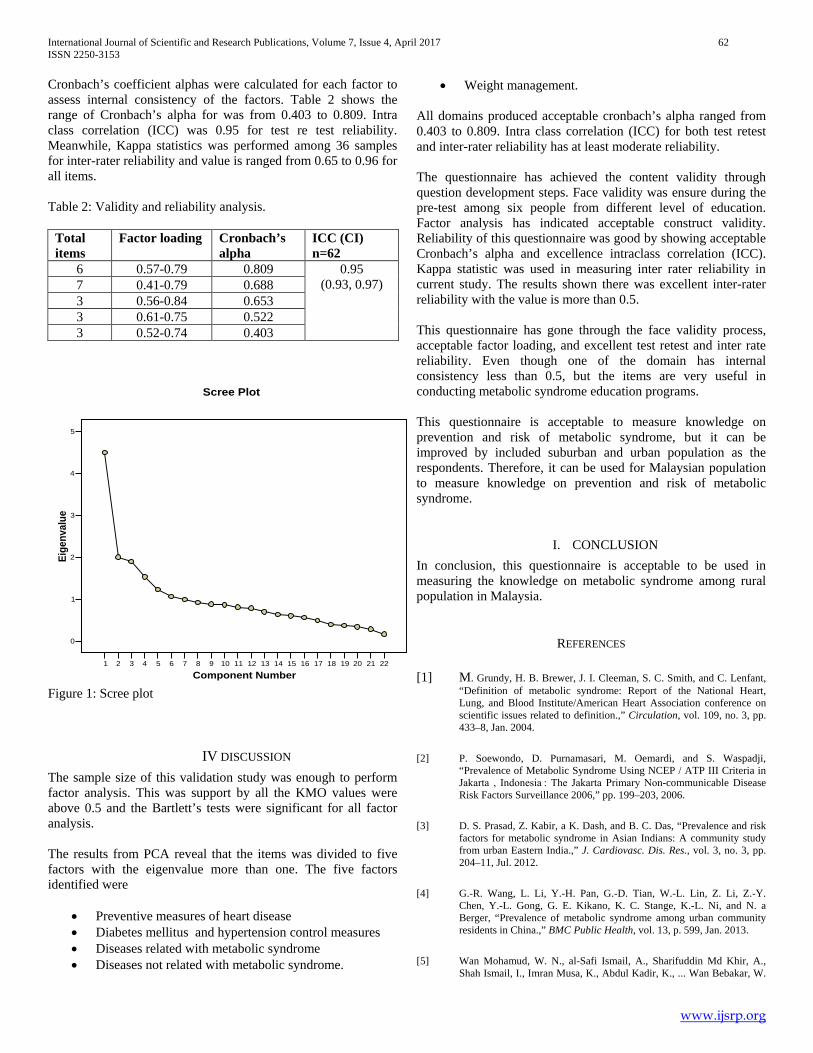
International Journal of Scientific and Research Publications, Volume 7, Issue 4, April 2017 62 ISSN 2250-3153
www.ijsrp.org
Cronbach’s coefficient alphas were calculated for each factor to assess internal consistency of the factors. Table 2 shows the range of Cronbach’s alpha for was from 0.403 to 0.809. Intra class correlation (ICC) was 0.95 for test re test reliability. Meanwhile, Kappa statistics was performed among 36 samples for inter-rater reliability and value is ranged from 0.65 to 0.96 for all items. Table 2: Validity and reliability analysis.
Total items
Factor loading Cronbach’s alpha
ICC (CI) n=62
6 0.57-0.79 0.809 0.95 (0.93, 0.97) 7 0.41-0.79 0.688
3 0.56-0.84 0.653 3 0.61-0.75 0.522 3 0.52-0.74 0.403
Figure 1: Scree plot
IV DISCUSSION The sample size of this validation study was enough to perform factor analysis. This was support by all the KMO values were above 0.5 and the Bartlett’s tests were significant for all factor analysis. The results from PCA reveal that the items was divided to five factors with the eigenvalue more than one. The five factors identified were
• Preventive measures of heart disease • Diabetes mellitus and hypertension control measures • Diseases related with metabolic syndrome • Diseases not related with metabolic syndrome.
• Weight management.
All domains produced acceptable cronbach’s alpha ranged from 0.403 to 0.809. Intra class correlation (ICC) for both test retest and inter-rater reliability has at least moderate reliability. The questionnaire has achieved the content validity through question development steps. Face validity was ensure during the pre-test among six people from different level of education. Factor analysis has indicated acceptable construct validity. Reliability of this questionnaire was good by showing acceptable Cronbach’s alpha and excellence intraclass correlation (ICC). Kappa statistic was used in measuring inter rater reliability in current study. The results shown there was excellent inter-rater reliability with the value is more than 0.5. This questionnaire has gone through the face validity process, acceptable factor loading, and excellent test retest and inter rate reliability. Even though one of the domain has internal consistency less than 0.5, but the items are very useful in conducting metabolic syndrome education programs. This questionnaire is acceptable to measure knowledge on prevention and risk of metabolic syndrome, but it can be improved by included suburban and urban population as the respondents. Therefore, it can be used for Malaysian population to measure knowledge on prevention and risk of metabolic syndrome.
I. CONCLUSION In conclusion, this questionnaire is acceptable to be used in measuring the knowledge on metabolic syndrome among rural population in Malaysia.
REFERENCES
[1] M. Grundy, H. B. Brewer, J. I. Cleeman, S. C. Smith, and C. Lenfant, “Definition of metabolic syndrome: Report of the National Heart, Lung, and Blood Institute/American Heart Association conference on scientific issues related to definition.,” Circulation, vol. 109, no. 3, pp. 433–8, Jan. 2004.
[2] P. Soewondo, D. Purnamasari, M. Oemardi, and S. Waspadji, “Prevalence of Metabolic Syndrome Using NCEP / ATP III Criteria in Jakarta , Indonesia : The Jakarta Primary Non-communicable Disease Risk Factors Surveillance 2006,” pp. 199–203, 2006.
[3] D. S. Prasad, Z. Kabir, a K. Dash, and B. C. Das, “Prevalence and risk factors for metabolic syndrome in Asian Indians: A community study from urban Eastern India.,” J. Cardiovasc. Dis. Res., vol. 3, no. 3, pp. 204–11, Jul. 2012.
[4] G.-R. Wang, L. Li, Y.-H. Pan, G.-D. Tian, W.-L. Lin, Z. Li, Z.-Y. Chen, Y.-L. Gong, G. E. Kikano, K. C. Stange, K.-L. Ni, and N. a Berger, “Prevalence of metabolic syndrome among urban community residents in China.,” BMC Public Health, vol. 13, p. 599, Jan. 2013.
[5] Wan Mohamud, W. N., al-Safi Ismail, A., Sharifuddin Md Khir, A., Shah Ismail, I., Imran Musa, K., Abdul Kadir, K., ... Wan Bebakar, W.
1 2 3 4 5 6 7 8 9 10 11 12 13 14 15 16 17 18 19 20 21 22
Component Number
0
1
2
3
4
5
Eige
nval
ue
Scree Plot

International Journal of Scientific and Research Publications, Volume 7, Issue 4, April 2017 63 ISSN 2250-3153
www.ijsrp.org
M. (2012). Corrigendum to " Prevalence of metabolic syndrome and its risk factors in adult Malaysians: Results of a nationwide survey". Diabetes Res. Clin. Pract.Vol 91 p 239-245. 2011.
[6] L. R. M. Zainuddin, N. Isa, W. M. W. Muda, and H. J. Mohamed, “The Prevalence of Metabolic Syndrome According to Various Definitions and Hypertriglyceridemic-Waist in Malaysian Adults,” Int. J. Prev. Med., vol. 2, no. 4, pp. 229–237, Feb. 2011.
[7] Ramli AS1, Daher AM, Nor-Ashikin MN, Mat-Nasir N, Ng KK, Miskan M, et al. JIS definition identified more Malaysian adults with metabolic syndrome compared to the NCEP-ATP III and IDF criteria. Biomed Res Int.2013.
[8] K. Kaliyaperumal, “Guideline for Conducting a Knowledge, Attitude and Practice (KAP) Study,” Diabet. Retin., vol. 4, no. 1, 2004.
[9] Baig M. A. I, Sulaiman S A S, Gillani S W and Hariadha E. “A preliminary study on knowledge about obesity in Pulau Pinang, Malaysia” Int. J. of Pharm. & Life Sci. (IJPLS), Vol. 4 (6) 2013
[10] Yun L.S., Hassan Y. Aziz N A., Awaisu A., Ghazali R. “A comparison of knowledge of diabetes mellitus between patients with diabetes and healthy adults: A survey from north Malaysia”,Patient Education and Counseling , Vol 69 (1) ,p. 47 – 54. 2007.
[11] WHO, “Obesity: Preventing and managing the Global Epidemic-Report of a WHO Consultation on Obesity. Geneva. Switzerland,” 1997.
[12] J. I. Cleeman, “Executive Summary of the Third Report of the National Cholesterol Education Program (NCEP) Expert Panel on Detection,
Evaluation, and Treatment of High Blood Cholesterol in Adults (Adult Treatment Panel III),” JAMA, p. 285, 2001.
[13] Kaiser H. An index of factorial simplicity. Psychometrika 1974;39(1):31–6.
[14] Bartlett MS. A note on the multiplying factors for various v2
approximations. J Royal Stat Soc 16(Series B). p. 296–298. 1954. [15] Pallant J. SPSS survival manual: a step by step guide to data analysis
using SPSS. 4th ed. Australia: Allen & Unwin; 2011
AUTHORS First Author – Norhafizah Ab Manan, MSc. Cyberjaya University College of Medical Sciences. [email protected] Second Author – Nor Azwany Yaacob. MD. Master of Community Medicine. University of Science Malaysia. [email protected]. Third Author – Dr Ab. Aziz Al-Safi Ismail .MD. University of Science [email protected] Correspondence Author – Norhafizah Ab Manan, MSc. Cyberjaya University College of Medical Sciences. [email protected]. +60163598277
International Journal of Scientific and Research Publications, Volume 7, Issue 4, April 2017 64 ISSN 2250-3153
www.ijsrp.org
Determination Of Resistance To Low Temperatures Of Winter Buds According To Position In Karaerik (V.
vinifera L.) Grape Cultivar Cafer KÖSE1, Özkan KAYA1,2*
1Department of Horticulture Faculty of Agriculture Ataturk University, 25240 Erzurum, Turkey
2Erzincan Horticultural Research Institute, 24060 Erzincan, Turkey Abstract- This experiment was carried out to determine the tolerance level of winter buds according to positions in Karaerik cv. grape cultivar grown in Erzincan province during the winter colds that occurred in 2013/14 and 2014/15 years. For this purpose, frost tolerance levels of the first 4 buds of one-year old shoot and their damaged varability rates by exposure to low winter temperatures have been detected with binocular microscope and lipid peroxidation (MDA) analysis. The winter buds at the 2nd and 3rd shoot were found to be most sensitive to low temperatures with average damage rates of 26.5% and 33.5%, respectively during the years of the research. Additionally, the winter buds at the 1st and 4th nodes according to positions were found to be the most tolerant buds with average damage rates of 18.5% and 19.5%, respectively. On the other hand, the winter buds found on the 2nd and 3rd nodes according to positions were found to be the most sensitive buds with average MDA content of 3.72 and 3.74 nmol/ml respectively. For all that the winter buds in the 1st and 4th nodes according to positions were identified as the least injured buds with average MDA content of 2.92 and 3.12 nmol/ml respectively. Therefore, in pruning this is recommended to reduce yield losses by making it from node position 4th after the severe winter cold. In this way, with standardization of pruning levels for Karaerik grape cultivar can be improved yield and quality. Index Terms- Erzincan, Karaerik, low temperature tolerance, lipid peroxidation
I. INTRODUCTION rapes, due to their wide spreading area on the earth, are one of the temperate fruit crops most frequently damaged by
low temperatures (Fennell, 2004). Low temperatures occurring especially in winter limiting the grape cultivation is among the most common environmental stress (Ma et al., 2010). Along with that, regions where vegetation duration is short and which have continental climate are affected more by this stress, which is caused by the low winter temperatures. In these areas with the increase in the intensity of winter temperatures, permanent damage to the tissues and organs of the grapevine occurs without compensation. Such a situation can result in reduced yield and substantial economic losses to grape growers, subsequently impacting fruit wholesalers, distributors, vineries and related industries (Fennell, 2004; Zabadal et al., 2007; Li, 2014).
Tolerance to low winter temperatures in grapevines include a complex set of traits that are influenced by the inherent genetic characteristics and their interaction with the environment. However, the tolerance to low temperatures of the grapevine affects factors such as the degree of low temperature, the rate of fall, the speed of fall, rootstock is grafted onto the vine, altitude and the location of the vineyard, dormant period temperatures, pruning time and method, training shape, crop load and support system, irrigation, fertilization disease and pest control level (Khanizadeh et al., 2005; Çelik et al., 2008; Köse and Güleryüz, 2009). In addition, tolerance to low winter temperatures in grapes varies between species, cultivars and tissues depending on environmental factors and cultural practices. In addition to this, it is not possible to give a definite value for the lowest temperature value of species, cultivars or tissues due to the dynamic nature of the resistance to low winter temperatures. However, varieties of V. vinifera L. which provide more than 90% of world grape production are limited to areas where low winter temperatures are above a minimum of -25oC (Fennell, 2004; Mills et al., 2006; Davenport et al., 2008; Ferguson et al., 2011; Ferguson et al., 2014; Keller, 2015). After the low winter temperatures variety of tissues of V. vinifera L. and organs to determine the degree of damage caused in the right way, is extremely important in terms of the adjustment crop load in winter pruning (Ershadi et al., 2016). For this purpose, determination of the degree of damage by looking at the color change (browning of bud tissues) of living and dead tissues in winter buds is one of the most widely used methods (Wolf and Cook, 1992; Rekika et al., 2004; Köse and Güleryüz, 2009; Ershadi et al., 2016). On the other hand, tolerance to low temperatures in grapes usually involves a combination of morphological, physiological and biochemical features which develop by natural selection over very long periods of time. Therefore these features are often associated so that cold hardiness can be determined by testing for change in the relative amounts of particular biochemicals (Zhang et al., 2012). The increase and decrease in the amount of malondialdehyde (MDA) from these biochemicals is a good indicator that the structural integrity of the cellular membranes has deteriorated (Lin et al., 2006; Kaya and Köse, 2016). For this reason, the increase in the proportion of MDA in the grape buds after low winter temperatures can be used as an alternative method for assessing frost tolerance. This study was carried out to determine the tolerance level of winter buds (1st, 2nd, 3rd and 4th buds) of Karaerik cv. grape cultivar which have a significant share in Erzincan viticulture
G

International Journal of Scientific and Research Publications, Volume 7, Issue 4, April 2017 65 ISSN 2250-3153
www.ijsrp.org
during winter colds that occurred in 2013-2014 and 2014-2015 years.
II. MATERIAL AND METHODS II.1. Plant material This study focused on a homogeneous plant material consists of a single vine variety of Vitis vinifera L. cv. Karaerik. In study, cultivar from 25 years old own-rooted vines grown in Erzincan, were evaluated in the early spring after low winter temperatures in 2013/14-2014/15. All vines were spaced 2.5 m apart in north-south oriented rows that were 2.0 m wide. The vines were spur pruned and Baran system-trained. The height of head was 0.2 m bove ground. Cultural practices such as fertilization, irrigation, and pest control were uniform across the vineyards. Vines had been pruned to 2nd to 4th node spurs each dormant season before the study but were not pruned before the collection of buds for this experiment. Healthy canes of 4 buds with uniform periderm formation were randomly sampled from the vine canopy for all the cultivar at each evaluation year. From each of the plots occupied by the cultivar, 400 samples of cane were taken of during March 13, 2014 and March 17, 2015. One-year-old shoots, free from structural damage, were taken from vines. Upon collection, samples were placed in plastic bags, immediately brought to the laboratory, and for the enzymatic browning of bud tissues kept at 25°C for 48 hours until testing. The frost damage and amount of lipid peroxidation of the winter buds of the vines were assessed following the weather conditions described in Table 1 and Table 2. Extremely low temperatures, below –15°C, occurred in January 6, 2014 and January 10, 2015. II.2. Determination of enzymatic browning in winter buds tissues Determining low temperature damage in winter buds was estimated according to the method of Odneal (2004). The buds under assessment were cut cross-sections. Winter buds on the first 4 nodes of one-year-old cane were examined by binocular microscopy. The winter buds were considered to be dead if both the main bud (primary bud) and the replacement buds underneath were dark brown. The primary buds that appeared bright and green were considered alive, and those appearing dull, strawcolored or black/brown were calculated as dead (Wolf and
Cook 1992, Linden 2002; Karami et al., 2016). The proportion of injured buds was determined as the number of buds injured/total buds. II.3. Determination of lipid peroxidation in winter buds tissues Malondialdehyde (MDA), an indicator of lipid peroxidation, was determined by the thiobarbituric acid (TBA) reaction according to the method of Heath and Packer (1968). The bud sample, a 0.2 g sample was mixed with 2 mL trichloroacetic acid and a small quantity of quartz sand in a mortar. The homogenate was centrifuged at 12000 xg for 15min at 4oC. The supernatant was mixed with the equal volume of 5% TCA containing 0.5% TBA. The mixture was heated at 90oC for 30 min and quickly cooled to room temperature and then centrifuged at 12000 xg for 10 min at 4oC. Absorbance was recorded at 532, and 600 nm. MDA content was calculated using the following formula: MDA (nmol/ml ) = [(A532- A600)/155000] X 106 (Heath and Packer 1968; Jaleel et al., 2008). II.4. Statistical analysis The study was carried out in four replications according to randomized block trial design. The difference between the averages of the variance analysis was compared in the Jamp Packet program according to the LSD multiple comparison test.
III. RESULTS AND DISCUSSION The air temperature values for the 2013-2014 and 2014-2015 winter period in which the study was conducted are given in Figure 1 and Figure 2. (Anonymous., 2017). Generally, the lowest winter temperatures in our region occur in December, January and February (Kaya, 2011). For this reason, the climate data of these months have been taken into account in the study. The minimum air temperatures were determined as -15.1°C on January 6, 2014 and -16.3°C on January 10, 2015 for the second year. As a matter of fact, the tolerance for low winter temperatures of the V. vinifera L. range varies by varieties and this value is from -15°C to -25°C in December, January and February (Andrews et al., 1984; Fennell, 2004). It has been determined that the temperature decreases among these values, which are considered as critical temperatures for the grape winter buds in both years of the study (Figure 1, 2).
Figure 1. Daily temperature values for December 2013 - January - February 2014 period (Anonymous., 2017).

International Journal of Scientific and Research Publications, Volume 7, Issue 4, April 2017 66 ISSN 2250-3153
www.ijsrp.org
Figure 2. Daily temperature values for December 2014 - January - February 2015 period (Anonymous., 2017). Frost damage, expressed as the percentage of dying buds exposed to low temperatures during winter, in Karaerik (V. vinifera L.) grapevine cultivar (Table 1). After the winters of 2013/2014 and 2014/2015, when the minimum temperature dropped to -15.1oC and -16.3oC respectively, ‘Karaerik’ primary buds suffered with average damage rates of 22.25% and 26.75% respectively. The damage was more severe than after the much colder winter of 2014/2015. However, this damage rate in the primary buds varied considerably depending on the position on the shoots of the buds. Indeed, the 3rd winter buds on the shoots have been the buds most affected by low winter temperatures with a 35% damage rate during the 2013-2014 working year. On the other hand, the 1st and 4th winter buds were the least damaged buds with 17% damage rate in the same year and they were found more tolerant to low temperatures. Similarly, winter buds on the 2nd and 3rd nodes on the shoot were the most susceptible to frost with 32-33% damage rates respectively, winter buds on the 1st and 4th nodes on the shoot were found to be more tolerant with 20-22% respectively damage rates in 2014/2015 years (Table 1). Differences in the tolerances of the winter buds to low temperatures according to their positions are confirmed by many researchers (Howell and Shaulis, 1980; Köse and Güleryüz, 2009; Buztepe, 2016). The winter buds on the 1st, 2nd and 4th nodes on the shoot of 15 different grape varieties were evaluated for tolerance to low temperatures and 1st winter buds were determined to have the highest tolerance (Çelik et al., 2008).Wolpert and Howell, (1986b) conducted a study on Concord grape variety, they found that basal buds (node positions 3 to 7), were able to withstand freezing stress at lower temperatures than middle buds (node positions 8 to 12), then apical buds (node positions 13 to17). Similarly basal buds(node positions 2 to 4 ), were able to withstand freezing stress at lower
temperatures than middle buds (node positions 6 to 8), then apical buds (node positions 10 to12). While basal buds were generally more freezing tolerant compared to the other node positions, ‘Couderc 3309’ basal buds were the most ‘Cabernet Franc’ followed by ‘Concord’ and ‘Cabernet Franc’ basal buds were the least freezing tolerance (Grant, 2012). In grape, the tolerance of winter buds to low temperatures is directly related with maturation cane (Wolpert and Howell, 1986b; Fennell, 2004). Bud dormancy is initiated at the base of the cane and continues towards the apical buds (Fennell and Hoover, 1991). According to our results the reason to be more tolerant of winter buds at the 1st node may be related to earlier maturation and decreased water content. In addition, the amount of carbohydrate stored in the basal buds may affect this situation. Carbohydrate concentrations in bud tissues were not always uniform throughout the cane, and basal buds often had higher concentrations of raffinose compared to middle or apical buds, indicating differences in hardiness progression (Fennell, 2004; Grant and Dami, 2015). On the other hand, it was determined that the winter buds at the 4th node on the shoot showed tolerance to low temperatures as much as the winter buds in the 1st node. Indeed vines trained with baran training system occurs a bending in the 4th node on the shoot during the vegetation period. In these buds 4th node may have caused the accumulation of carbohydrate substance for this bending at the 4th node on the shoot and therefore it is thought to be enhanced the tolerance of the winter buds at 4th node. In fact, this view supports to be more sensitive to low temperatures of the winter buds at 3rd node on the shoot in both working years.
Table 1.The damage rate of primary buds of winter buds according to node positions in the Karaerik (V. vinifera L.) grapevine
cultivar.
Node position The damage rate of primary buds of winter buds according to node positions (%) 2013/2014 years 2014/2015 years Mean
Buds in the 1 node 17 c 20 b 26.5 Buds in the 2 node 25 b 33 a 33.5 Buds in the 3 node 35 a 32 a 18.5
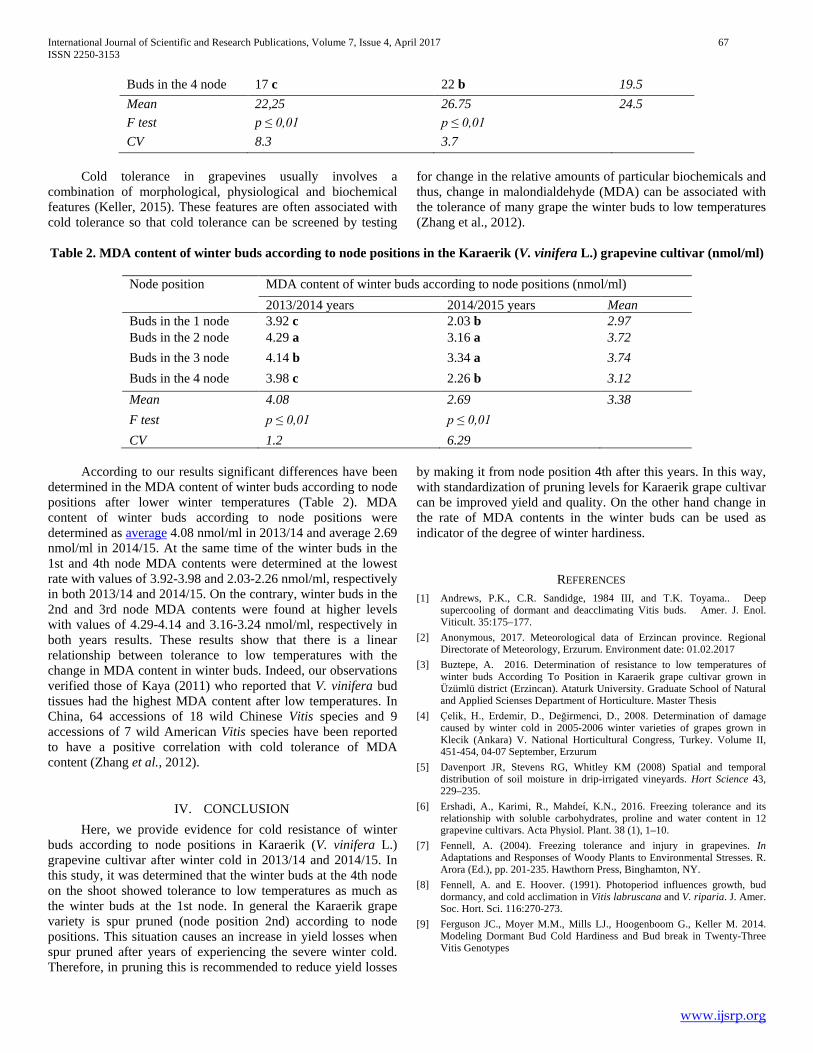
International Journal of Scientific and Research Publications, Volume 7, Issue 4, April 2017 67 ISSN 2250-3153
www.ijsrp.org
Buds in the 4 node 17 c 22 b 19.5 Mean 22,25 26.75 24.5 F test p ≤ 0,01 p ≤ 0,01 CV 8.3 3.7
Cold tolerance in grapevines usually involves a combination of morphological, physiological and biochemical features (Keller, 2015). These features are often associated with cold tolerance so that cold tolerance can be screened by testing
for change in the relative amounts of particular biochemicals and thus, change in malondialdehyde (MDA) can be associated with the tolerance of many grape the winter buds to low temperatures (Zhang et al., 2012).
Table 2. MDA content of winter buds according to node positions in the Karaerik (V. vinifera L.) grapevine cultivar (nmol/ml)
Node position MDA content of winter buds according to node positions (nmol/ml) 2013/2014 years 2014/2015 years Mean
Buds in the 1 node 3.92 c 2.03 b 2.97 Buds in the 2 node 4.29 a 3.16 a 3.72 Buds in the 3 node 4.14 b 3.34 a 3.74 Buds in the 4 node 3.98 c 2.26 b 3.12 Mean 4.08 2.69 3.38 F test p ≤ 0,01 p ≤ 0,01 CV 1.2 6.29
According to our results significant differences have been determined in the MDA content of winter buds according to node positions after lower winter temperatures (Table 2). MDA content of winter buds according to node positions were determined as average 4.08 nmol/ml in 2013/14 and average 2.69 nmol/ml in 2014/15. At the same time of the winter buds in the 1st and 4th node MDA contents were determined at the lowest rate with values of 3.92-3.98 and 2.03-2.26 nmol/ml, respectively in both 2013/14 and 2014/15. On the contrary, winter buds in the 2nd and 3rd node MDA contents were found at higher levels with values of 4.29-4.14 and 3.16-3.24 nmol/ml, respectively in both years results. These results show that there is a linear relationship between tolerance to low temperatures with the change in MDA content in winter buds. Indeed, our observations verified those of Kaya (2011) who reported that V. vinifera bud tissues had the highest MDA content after low temperatures. In China, 64 accessions of 18 wild Chinese Vitis species and 9 accessions of 7 wild American Vitis species have been reported to have a positive correlation with cold tolerance of MDA content (Zhang et al., 2012).
IV. CONCLUSION Here, we provide evidence for cold resistance of winter buds according to node positions in Karaerik (V. vinifera L.) grapevine cultivar after winter cold in 2013/14 and 2014/15. In this study, it was determined that the winter buds at the 4th node on the shoot showed tolerance to low temperatures as much as the winter buds at the 1st node. In general the Karaerik grape variety is spur pruned (node position 2nd) according to node positions. This situation causes an increase in yield losses when spur pruned after years of experiencing the severe winter cold. Therefore, in pruning this is recommended to reduce yield losses
by making it from node position 4th after this years. In this way, with standardization of pruning levels for Karaerik grape cultivar can be improved yield and quality. On the other hand change in the rate of MDA contents in the winter buds can be used as indicator of the degree of winter hardiness.
REFERENCES [1] Andrews, P.K., C.R. Sandidge, 1984 III, and T.K. Toyama.. Deep
supercooling of dormant and deacclimating Vitis buds. Amer. J. Enol. Viticult. 35:175–177.
[2] Anonymous, 2017. Meteorological data of Erzincan province. Regional Directorate of Meteorology, Erzurum. Environment date: 01.02.2017
[3] Buztepe, A. 2016. Determination of resistance to low temperatures of winter buds According To Position in Karaerik grape cultivar grown in Üzümlü district (Erzincan). Ataturk University. Graduate School of Natural and Applied Scienses Department of Horticulture. Master Thesis
[4] Çelik, H., Erdemir, D., Değirmenci, D., 2008. Determination of damage caused by winter cold in 2005-2006 winter varieties of grapes grown in Klecik (Ankara) V. National Horticultural Congress, Turkey. Volume II, 451-454, 04-07 September, Erzurum
[5] Davenport JR, Stevens RG, Whitley KM (2008) Spatial and temporal distribution of soil moisture in drip-irrigated vineyards. Hort Science 43, 229–235.
[6] Ershadi, A., Karimi, R., Mahdeí, K.N., 2016. Freezing tolerance and its relationship with soluble carbohydrates, proline and water content in 12 grapevine cultivars. Acta Physiol. Plant. 38 (1), 1–10.
[7] Fennell, A. (2004). Freezing tolerance and injury in grapevines. In Adaptations and Responses of Woody Plants to Environmental Stresses. R. Arora (Ed.), pp. 201-235. Hawthorn Press, Binghamton, NY.
[8] Fennell, A. and E. Hoover. (1991). Photoperiod influences growth, bud dormancy, and cold acclimation in Vitis labruscana and V. riparia. J. Amer. Soc. Hort. Sci. 116:270-273.
[9] Ferguson JC., Moyer M.M., Mills LJ., Hoogenboom G., Keller M. 2014. Modeling Dormant Bud Cold Hardiness and Bud break in Twenty-Three Vitis Genotypes
International Journal of Scientific and Research Publications, Volume 7, Issue 4, April 2017 68 ISSN 2250-3153
www.ijsrp.org
[10] Ferguson, J.C., Tarara, J.M., Mills, L.J., Grove, G.G., Keller, M., 2011. Dynamic thermal time model of cold hardiness for dormant grapevine buds. Ann. Bot. 107,389–396.
[11] Grant, T. N., & Dami, I. E. (2015). Physiological and Biochemical Seasonal Changes in Vitis Genotypes with Contrasting Freezing Tolerance. American Journal of Enology and Viticulture.
[12] Heath, R. L. and Packer, L., 1968. Photoperoxidation in isolated chloroplasts. I. Kinetics and stoichiometry of fatty acid peroxidation. Arch Biochem Biophys 125 189-198.
[13] Howell, G.S. and N. Shaulis. (1980). Factors influencing within-vine variation in the cold resistance of cane and primary bud tissues. Amer. J. Enol. Vitic. 131:158-161
[14] Jaleel, C.A., Riadh, K., Gopi, R., Manivannan, P., Inès, J., Al-Juburi, H.J., Chang-Xing, Z., Hong-Bo, S., Panneerselvam, R., 2009, Antioxidant defense responses: physiological plasticity in higher plants under abiotic constraints, Acta Physiol. Planta., 31, 427-436.
[15] Kaya, Ö. 2011. Determination of resistance to low temperatures of winter buds depending on lateral shoot presence in Karaerik grape cultivar grown in Üzümlü district (Erzincan). Ataturk University. Graduate School of Natural and Applied Scienses Department of Horticulture. Master Thesis
[16] Kaya, Ö. and Köse, C. 2016. The effect of the present of lateral shoot on lipid peroksidasyon activity in the winter dormant buds of Karaerik grape cultivar. International Erzincan Symposium. Turkey. September 28 - October 1, 2016. Keller, M. 2015. The science of grapevines-anatomy and physiology. Burlington, MA: Academic Press.Khanizandeh, S., Rekika, D., Levasseur, A., Groleav, Y., Richer, C., Fisher, H., 2005. The effects of different cultural and environmental factors on grapevine growth, winter hardiness and performance in three locations in Canada. Small Fruit Rev., 4(3):3-28.
[17] Köse C, Güleryüz, M., 2009. Frost Damage in Dormant Buds of Karaerik Grapevine Grown at Üzümlü Province of Erzincan During The Winter of 2007-2008. Ataturk University. Journal of the Faculty of Agriculture. Turkey. 40 (1), 55-60,
[18] Li XN, Cai J, Liu FL, Dai TB, Cao WX, Dong J. 2014. Physiological, proteomic and transcriptional responses of wheat to combination of drought or waterlogging with late spring low temperature. Funct Plant Biol.; 41(7):690–703.
[19] Lin SZ, Zhang ZY, Liu WF, Lin YZ, Zhang Q, Zhu BQ (2005) Role of glucose-6-phosphate dehydrogenase in freezing—induced freezing resistance of Populus suaveolens. J Plant Physiol Mol Biol 35:34–40
[20] Ma, Y. Y., Zhang, Y. L., Shao, H., & Lu, J. (2010). Differential physiobiochemical responses to cold stress of coldtolerant and nontolerant
grapes (Vitis L.) from China. Journal of Agronomy and Crop Science, 196(3), 212-219.
[21] Mills LJ, Ferguson JC, Keller M. 2006. Cold-hardiness evaluation of grape- vine buds and cane tissues. American Journal of Enology and Viticulture 57: 194 – 200.
[22] Odneal, M.B., 1984. Cold Hardiness of Grapes. State Fruit Experiment Station, College of Health and Applied Sciences, Missouri State University, Bulletin No:41.
[23] Rekika D, Cousineau J, Levasseur A, Richer C, Khanizadeh S, Fisher H (2004) The use of a freezing technique to determine the bud hardiness of twenty grape genotypes (Vitis sp.). Acta Hort 640:207–212
[24] Wolf, T.K. and M. Cook. 1992. Seasonal deacclimation patterns of 3 grape cultivars at constant warm temperature. Am. J. Enol. Vitic. 43:171-179
[25] Wolpert, J.A. and G.S. Howell. (1986b). Effect of night interruption on cold acclimation of potted ‘Concord’ grapevines. J. Amer. Soc. Hort. Sci. 111:16-20.
[26] Zabadal, T. J., Dami, I. E., Goffinet, M. C., Martinson, T. E., & Chien, M. L., 2007. Winter injury to grapevines and methods of protection, Michigan State University Publications on Grape Production, Michigan, USA, p. 36-37
[27] Zhang J, Wu X, Niu R, Liu Y, Liu N, Xu W, Wang Y (2012) Coldresistance evaluation in 25 wild grape species. Vitis 51:153–160
AUTHORS First Author– Cafer KÖSE, Asst. Professor-PhD, Ataturk University, Agriculture Faculty. Department of Horticulture. Erzurum, Turkey. [email protected] Second Author– Özkan KAYA, Dr-PhD, Ataturk University, Agriculture Faculty. Department of Horticulture, Erzurum and Horticultural Research Institute, Erzincan, Turkey. [email protected] Correspondence Author– Özkan KAYA, Dr-PhD, Ataturk University, Agriculture Faculty. Department of Horticulture, Erzurum and Horticultural Research Institute, Erzincan, Turkey. [Tel: +90-553-4701308, Fax: +90-446 2311639

International Journal of Scientific and Research Publications, Volume 7, Issue 4, April 2017 69 ISSN 2250-3153
www.ijsrp.org
The Structural Weaknesses for Quality of Education in Private Universities of Bangladesh
Md.Ashadujjaman*, Asma Akter**
*Md. Ashadujjaman, Lecturer of Sociology & Anthropology, Asian University of Bangladesh, Uttara Model Town, Dhaka-1230. **Asma Akter, Lecturer of Economics, Asian University of Bangladesh, Uttara Model Town, Dhaka-1230.
Abstract- Recently, quality of education is an important issue in all over the world. Private sector universities established in Bangladesh on 1992 to enhance higher education. At present there are 38 public and 90 above private universities are running their academic activities in Bangladesh. A large number of students are studying at the undergraduate and graduate levels in private universities of Bangladesh. These students are getting education in the fields of business, science and engineering, arts and social sciences respectively. Nowadays this is a burning issue that most of the private university of Bangladesh does not provide quality of education and produce quality graduates. There are some structural weaknesses or factors which influence quality of education of private universities. To identify the major influencing structural weaknesses or factors of private universities that are the main objectives of the study. The findings of the research may helps to the concern line ministry and agencies to develop such policy to enhance quality higher education in the country. Survey and interview research method were used in the study. Factor analysis was used to identify the factors that are highly affecting the quality of education of private sector universities. Multiple regression analysis were used to show that the relationship between identified factors and quality of education. Results show that there are four significant structural weaknesses or factors are immensely affecting quality of education of private universities in Bangladesh. The identified factors or structural weaknesses are answers script do not examine by second examiner, students class irregularities, incompleteness of credit hour and syllabus and questionnaire do not moderation by moderation committee. Multiple Regression Analysis shows that the identified factors are significantly related to the quality of education of private universities of Bangladesh. This study suggests that If there is a initiate in identified factors, there will be considerably improved quality of education of private universities of Bangladesh. Index Terms- Bangladesh, Private University, Quality of Education, Structural Weaknesses.
I. INTRODUCTION his study show that the quality of education is affecting due to some structural weaknesses in private universities of
Bangladesh. At present there are 90 above private universities running their academic activities in Bangladesh. These universities are providing education in the fields of business, science and engineering, arts and social sciences respectively. At this time a large number of students are studying at the
undergraduate and graduate levels in private universities of Bangladesh. But nowadays a question has been raised about their quality of education. Most of the private universities of Bangladesh did not provide quality of education and produce quality graduates because of they have some institutional structural weaknesses. This study tries to identify the major structural weaknesses that affect the quality of education of private universities of Bangladesh. If these structural weaknesses are removed, the quality of education of private universities will be enhanced. Literature review shows that quality of education means a combination of the learner's outside experiences, learning environment, content of education, learning processes, and education outcomes. The learning environment should be safe, healthy and stimulating. Appropriate education content is relevant to the learner and presented in a well-managed classroom. Learning outcomes should meet promote participation in society (UNICEF,2014). Quality of education depends on both administrative and faculty characteristics and it also depends on student’s current status and socioeconomic background. (Husain Salilul Akareem et al,2012). If Private universities try to improve their current standing through maintaining and retaining reliability and viability, they should maintain the highest student quality, designing a broad based liberal arts curriculum and emphasizing on research and scholarly activities. Overall they should have strategic plan to ensure the quality of education (SSM Sadrul Huda et al, 2010). Quality students intake, quality in teaching, transparency in grading system, library and laboratory facilities, constitute regulations for private universities, proper financing, formation of accreditation council may ensure quality of education in private sector universities of Bangladesh.( Mobasser Monem et al. 2010). There are some indicators of quality of education like methods of teaching and learning, assessment methods, renewing the curriculum continually, updating and upgrading professional knowledge and skills, and improving the broader educational, administrative and resources(UGC,2006). The Poor infrastructure facilities, inefficient and inexperienced low quality teaching staff, dissatisfaction of teachers and students and the profit motive of founders are the major obstacles for ensuring quality of education in private sectors University in Bangladesh (Abu Naser, 2008). Nine factors were related to explain the satisfaction of alumni with their education such as, comprise teacher quality, method and content, peer quality, facilities and resources, the effectiveness of the administration, campus politics, gender and year of graduation (Syed Saad Andaleeb, 2003). Faculty qualifications, intake (students) selection system, assessment system, campus facilities, research environment, leadership of
T

International Journal of Scientific and Research Publications, Volume 7, Issue 4, April 2017 70 ISSN 2250-3153
www.ijsrp.org
university, market orientation, and corporate attachment are associated with quality of business education. (Nazamul Hoque et al, 2013). Considering factors for ensuring quality of higher education in Bangladesh are tuition fees, choice of the students and guardians, session jam, popularity, teaching aids, library facilities, availability of books and journals, research facilities, and laboratory facilities.(Malaya Tashbeen Barnamala,2015). Quality of teaching, quality intake, financial resources and related issues may ensure quality of education of private universities in Bangladesh.(Touhida Tasnima,2008). Most of the private unversities are depending on part time teachers, poor infrastructures, without service rules, Poor library facilities, and they have no computer lab saminer library.(Addur Rouf et al, 2015) The above mention research discussed about some index or indicators of quality of education but did not discuss about the factors which are affecting quality of education in private universities of Bangladesh. Few researchers identified some affecting factors of quality of education but they did not show that how much percentage of a individual factor is significantly affecting quality of education of private universities. They also did not prove that their identified factors and the quality of education were significantly related or not. This study tries to identify some important structural weaknesses or factors which are significantly affecting quality of education in private universities of Bangladesh. The rest of the article is structured as follows: First, the objectives of the study will be stated, this is followed by a description of the research methods and procedures used in the study. The findings of our study are then discussed. Finally, implications, limitations, and directions for future research are offered.
II. OBJECTIVES OF THE STUDY The objective of this study is to identify the impact factors which are playing negative role for providing quality of education in the private universities of Bangladesh. The specific objectives are profiled below.
i. To find out the major structural weaknesses of private universities in Bangladesh.
ii. To identify the impact factors which are affecting quality of education in private universities of Bangladesh.
iii. To identify the significant factors are related to the quality of education.
iv. To provide some recommendation to reduce structural weaknesses and assure quality of education in private sector universities of Bangladesh.
III. METHODOLOGY This study attempts to identify the impact factors concerned with the quality of education in the private universities of Bangladesh. To conduct the study both primary and secondary sources of data were used. Primary data were collected from the private university student’s, stuffs and concern line authorities.
Secondary data were collected from the previous research monographs and the journals. 3.1 Determination of Sample Size This study only includes private universities of Bangladesh. The universities were selected for this study by random sampling techniques. According to statistics 2016, there are 90 above government approved private universities in Bangladesh but at present about 80 private universities are runing their academic activities. (University Grant Commission’s Report, 2016). We selected 80 private universities as a population and sample has been selected from 80 universities. The sample can be determined by using the following formula suggested by Yamane (1967)1. The formula used in this study is shown below.
2)(1 eNNn
+=
( 1) Where, n = Sample Size N= Population e = Percentage of sampling error In calculating sample size2 the following assumptions were made to determine, n = 45
(i) Population3 size is > 80 universities (ii) Percentage of sampling error4 is 10%
However, this study collected data from 45 private universities of Bangladesh. 3.2 Questionnaire Design and Test of Reliability The questionnaire of the study was considered with dichotomous5 and Likert scale6 method. Dichotomous questionnaire designed with possible two answers of YES/NO. Likert scale questionnaire was designed with 5 point scales which range from 1 to 5 where 1 is indicating strongly disagree and 5 is indicating strongly agree. Table 1 shows the reliability coefficient7 of the questionnaire. It shows that the Cronbach’s alpha8 of the questionnaire is 0.917 which is excellently acceptable as per Nunnally (1978)9.
1 Yamane, Taro. (1967). Statistics: An Introductory Analysis, 2nd Edition, New York: Harper and Row. 2 Sample size is a part of the population which is systematically determined and that represent the characteristics of population. 3 Population is a complete set of items that information is desired. 4 Sampling error is the level of precision, is the range in which the true value of the population is estimated to be. This is range is expressed in percentage points. 5 The dichotomous question is a question which can have two possible answers. Dichotomous questions are usually used in a survey that asks for a Yes/No, True/False or Agree/Disagree answers. 6 Likert scale is a five or seven point scale which is used to allow the individual to express how much they agree or disagree with a particular statement. 7 A measure of the accuracy of a test or measuring instrument obtained by measuring the same individuals twice and computing the correlation of the two sets of measures. 8 Cronbach’s alpha is a measure of internal consistency that is how closely related a set of items are as a group. It is considered to be a measure of scale reliability. 9 Nunnally (1978) offered a rule of thumb of 0.7. More recently, one tends to see 0.8 cited as a minimum alpha. One thing to keep in mind is that alpha is heavily
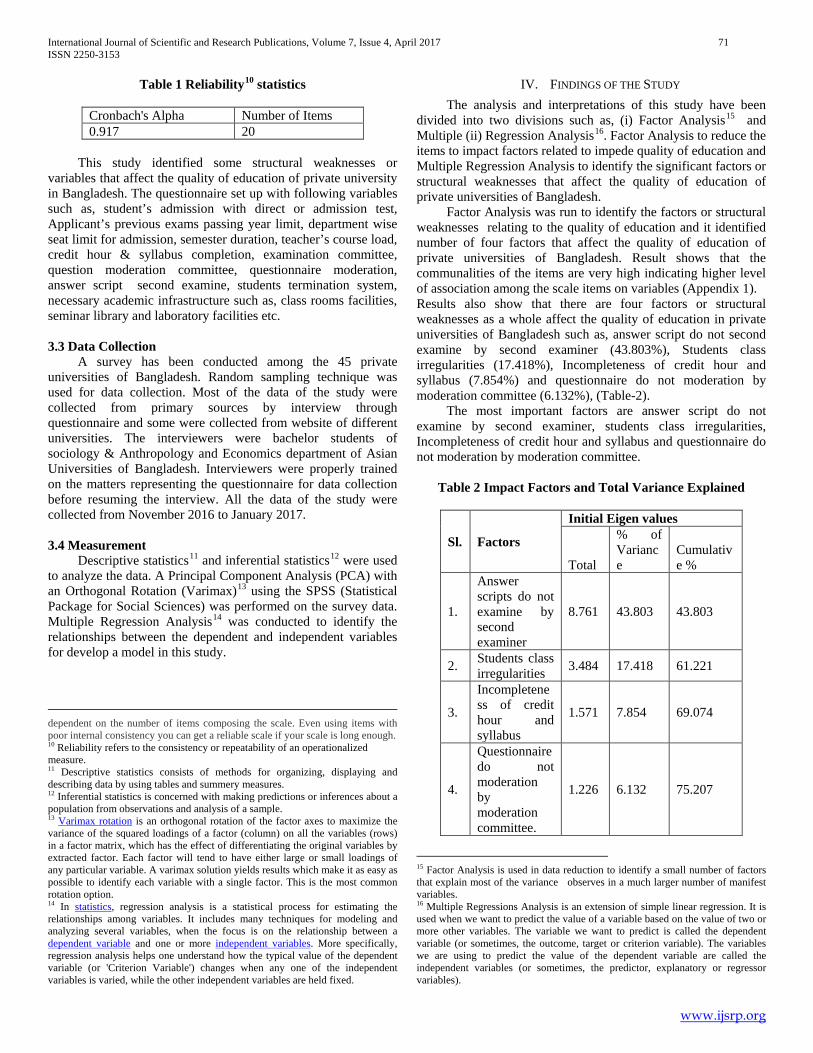
International Journal of Scientific and Research Publications, Volume 7, Issue 4, April 2017 71 ISSN 2250-3153
www.ijsrp.org
Table 1 Reliability10 statistics
Cronbach's Alpha Number of Items 0.917 20
This study identified some structural weaknesses or variables that affect the quality of education of private university in Bangladesh. The questionnaire set up with following variables such as, student’s admission with direct or admission test, Applicant’s previous exams passing year limit, department wise seat limit for admission, semester duration, teacher’s course load, credit hour & syllabus completion, examination committee, question moderation committee, questionnaire moderation, answer script second examine, students termination system, necessary academic infrastructure such as, class rooms facilities, seminar library and laboratory facilities etc. 3.3 Data Collection A survey has been conducted among the 45 private universities of Bangladesh. Random sampling technique was used for data collection. Most of the data of the study were collected from primary sources by interview through questionnaire and some were collected from website of different universities. The interviewers were bachelor students of sociology & Anthropology and Economics department of Asian Universities of Bangladesh. Interviewers were properly trained on the matters representing the questionnaire for data collection before resuming the interview. All the data of the study were collected from November 2016 to January 2017. 3.4 Measurement Descriptive statistics11 and inferential statistics12 were used to analyze the data. A Principal Component Analysis (PCA) with an Orthogonal Rotation (Varimax)13 using the SPSS (Statistical Package for Social Sciences) was performed on the survey data. Multiple Regression Analysis14 was conducted to identify the relationships between the dependent and independent variables for develop a model in this study.
dependent on the number of items composing the scale. Even using items with poor internal consistency you can get a reliable scale if your scale is long enough. 10 Reliability refers to the consistency or repeatability of an operationalized measure. 11 Descriptive statistics consists of methods for organizing, displaying and describing data by using tables and summery measures. 12 Inferential statistics is concerned with making predictions or inferences about a population from observations and analysis of a sample. 13 Varimax rotation is an orthogonal rotation of the factor axes to maximize the variance of the squared loadings of a factor (column) on all the variables (rows) in a factor matrix, which has the effect of differentiating the original variables by extracted factor. Each factor will tend to have either large or small loadings of any particular variable. A varimax solution yields results which make it as easy as possible to identify each variable with a single factor. This is the most common rotation option. 14 In statistics, regression analysis is a statistical process for estimating the relationships among variables. It includes many techniques for modeling and analyzing several variables, when the focus is on the relationship between a dependent variable and one or more independent variables. More specifically, regression analysis helps one understand how the typical value of the dependent variable (or 'Criterion Variable') changes when any one of the independent variables is varied, while the other independent variables are held fixed.
IV. FINDINGS OF THE STUDY The analysis and interpretations of this study have been divided into two divisions such as, (i) Factor Analysis15 and Multiple (ii) Regression Analysis16. Factor Analysis to reduce the items to impact factors related to impede quality of education and Multiple Regression Analysis to identify the significant factors or structural weaknesses that affect the quality of education of private universities of Bangladesh. Factor Analysis was run to identify the factors or structural weaknesses relating to the quality of education and it identified number of four factors that affect the quality of education of private universities of Bangladesh. Result shows that the communalities of the items are very high indicating higher level of association among the scale items on variables (Appendix 1). Results also show that there are four factors or structural weaknesses as a whole affect the quality of education in private universities of Bangladesh such as, answer script do not second examine by second examiner (43.803%), Students class irregularities (17.418%), Incompleteness of credit hour and syllabus (7.854%) and questionnaire do not moderation by moderation committee (6.132%), (Table-2). The most important factors are answer script do not examine by second examiner, students class irregularities, Incompleteness of credit hour and syllabus and questionnaire do not moderation by moderation committee.
Table 2 Impact Factors and Total Variance Explained
Sl. Factors
Initial Eigen values
Total
% of Variance
Cumulative %
1.
Answer scripts do not examine by second examiner
8.761 43.803 43.803
2. Students class irregularities 3.484 17.418 61.221
3.
Incompleteness of credit hour and syllabus
1.571 7.854 69.074
4.
Questionnaire do not moderation by moderation committee.
1.226 6.132 75.207
15 Factor Analysis is used in data reduction to identify a small number of factors that explain most of the variance observes in a much larger number of manifest variables. 16 Multiple Regressions Analysis is an extension of simple linear regression. It is used when we want to predict the value of a variable based on the value of two or more other variables. The variable we want to predict is called the dependent variable (or sometimes, the outcome, target or criterion variable). The variables we are using to predict the value of the dependent variable are called the independent variables (or sometimes, the predictor, explanatory or regressor variables).

International Journal of Scientific and Research Publications, Volume 7, Issue 4, April 2017 72 ISSN 2250-3153
www.ijsrp.org
Extraction Method: Principal Component Analysis. Multiple Regression Analysis shows that the factors identified by the Factors Analysis can explain about 81% of dependent variable. This means that the identified factors or structural weaknesses through this analysis are highly important and have significant influence on the quality of education in private universities of Bangladesh. (Table-3)
Table 3 Model Summery
Model R R Square
Adjusted R Square17
Std. Error of the Estimate
1 .897 .805 .785 .40266
a. Predictors: (Constant), REGR factor score 4 for analysis 1, REGR factor score 3 for analysis 1, REGR factor score 2 for analysis 1, REGR factor score 1 for analysis 1 b. Dependent Variable: Overall Analysis of Variance (ANOVA)18 shows that the factors identified by this analysis together significantly related to the dependent variable. This means that the factors identified in this analysis significantly related to the quality of education in private universities of Bangladesh. (Table- 4). If there is a change in the factors, this will be enhance the education quality in the private sector universities of Bangladesh.
Table 4 Analysis of Variance (ANOVA)b
Model Sum of Squares
df Mean Square
F Sig.
1. Regression
26.759 4 6.690 41.259 .000a
Residual 6.486 4
0 .162
Total 33.244 44
a. Predictors: (Constant), REGR factor score 4 for analysis 1, REGR factor score 3 for analysis 1, REGR factor score 2 for analysis 1, REGR factor score 1 for analysis 1 b. Dependent Variable: Overall
17 The adjusted R-squared is a modified version of R-squared that has been adjusted for the number of predictors in the model. 18 Analysis of variance (ANOVA) is used to determine whether there are any significant differences between the means of two or more independent (unrelated) groups.
Table 5 shows that the individual factor relationship with the dependent variable of the regression model. It shows that the factors such as, answer script do not examine by second examiner (8.456), students class irregularities (7.679), incompleteness of credit hour and syllabus (4.238), and questionnaire do not moderation by moderation committee (4.075) are significantly related to the quality of education in private universities of Bangladesh.
Table 5 Coefficientsa
Model
Unstandar dized Coefficients
Standardized Coefficients
t Sig.
B
Std. Error Beta
(Constant) 2.489 .060 41.46
4 .000
Answer scripts do not examine by second examiner
.513 .061 .591 8.456 .000
Students class irregularities
.466 .061 .536 7.679 .000
Incompleteness of credit hour and syllabus
.257 .061 .296 4.238 .000
Questionnaire do not moderation by moderation committee
.247 .061 .285 4.075 .000
a. Dependent Variable: Overall
V. DISCUSSION The purpose of this study was to identify the structural weaknesses of private universities of Bangladesh which are affecting the quality of education. To our knowledge, it is the first study that demonstrates the affect of structural weaknesses on quality of education in private universities of Bangladesh. 5.1 Summary of the findings After analyzing the data our study got some findings. Factor Analysis has identified four factors that highly affect the quality of education of private sector universities. The identified most important factors are answers script do not examine by second examiner, Students class irregularities, incompleteness of

International Journal of Scientific and Research Publications, Volume 7, Issue 4, April 2017 73 ISSN 2250-3153
www.ijsrp.org
credit hour and syllabus and do not construct question moderation committee for final questionnaire moderation. The factor answers script do not examine by second examiner individually influence quality of education(43.803%), Students class irregularities (17.418%), do not completion of credit hour and course syllabus (7.854%) and questionnaire do not moderation by moderation committee (6.132%). The four factors as a whole (75.207%) significantly influence the quality of education in private universities of Bangladesh. Multiple Regression Analysis shows that all the identified factors that are significantly related to the quality of education of private universities of Bangladesh. Moreover, our study empirically validated and our results indicate that there has significant relationship between structural weaknesses and quality of education. This means that the factors identified in this analysis are significantly related to the overall quality of education. 5.2 Managerial implications Our study suggests that if there is a change in identified factors, there will be change in the quality of education of private universities of Bangladesh. If private university will initiate second examine system, questionnaire moderation, class regularities and complete of credit hour and syllabus, it will be significantly enhanced quality of of education of private sector universities of Bangladesh. 5.3 Limitations of the study There are some limitations might be related to data collection. The first limitation of the study is that we determined our sample size with 10% sampling error and we collected our data from Dhaka city base private universities. Second limitation might be the omission of some important variables, such as, number of teachers, class room facilities, research facilities for students and others infrastructural facilities etc. Another shortcomings of the study is that it did not include public sector universities of Bangladesh. Another potential limitation of the study is related to the measurement of quality of education. 5.4 Recommendations for future research This study has identified the impact factors for quality of education of private universities of Bangladesh. But it did not include some influencing variables, such as, number of teachers, class room facilities, library facilities, research facilities for students and it also did not include government universities of Bangladesh. These recognized shortcomings could inspire future researchers for further study in this regard.
APPENDICES Appendix 1 Communalities
Sl. No. Name of the Variable
Extraction
VAR 01 University campus type ( Own or rented ).
.614
VAR 02 Student admission type .843
( Direct or admission test). VAR 03 Admission without test. .682
VAR 04
Applicant passing year of S.S.C and H.S.C examination not determined for admission.
.673
VAR 05 Department wise seat limit not fixed.
.926
VAR 06 Incompleteness of Credit hour.
.940
VAR 07 Incompleteness of Syllabus. .940
VAR 08 Teacher’s course load high. .804 VAR 09 Students class irregularity. .827
VAR 10
Do not declare non collegiate on the basis of student’s attendance.
.827
VAR 11
Termination system do not maintain on the basis of frequent fail.
.771
VAR 12
Do not constructs examination committee for each department to conduct final examination.
.667
VAR 13
Questionnaire do not moderation by moderation committee.
.834
VAR 14
Do not provide remuneration for invigilation.
.256
VAR 15
Do not provide remuneration for examine answer script.
.721
VAR 16
Answer script do not second examine by second examiner.
.926
VAR 17 Time and fund not allocated for research.
.554
VAR 18 No seminar library facilities. .670
VAR 19 No computer lab facilities. .854
VAR 20 No common room facilities. .713
Extraction Method: Principal Component Analysis

International Journal of Scientific and Research Publications, Volume 7, Issue 4, April 2017 74 ISSN 2250-3153
www.ijsrp.org
REFERENCES [1] Unicef. (2014). Meaning of Quality Education. https://www.reference.com
› Education › K-12 › K-12 Curriculum. [2] Akareem, H.S., Hossain, S.S. (2012). Perception of Education Quality in
Private Universities of Bangladesh: A Study from Students Perspective. Journal of Marketing for Higher education, Vol. 22, No. 1, pp. 11-33.
[3] Huda, S.S., Mujaffar, A.T., Akhtar, A., Ahmed J.U. (2010). The State of Private Universities in Bangladesh: An Evaluation of Students Perception. Journal of Information Management and Business Review, Vol. 1, No. 1, pp. 16-27.
[4] Monem, M., Baniamin, H. M. (2010). Higher Education in Bangladesh: Status, Issues and Prospects. Pakistan Journal of Social Sciences, Vol. 30, No. 2, pp. 293-305.
[5] Bangladesh University Grant Commission. (2006). Strategic Planning for Higher Education in Bangladesh. (2006-2026). Dhaka.
[6] Naser, M.A. (2008). Education Quality of Private Universities in Bangladesh: Faculty Resources and Infrastructure Perspective. Thesis. North South University, Dhaka.
[7] Andaleeb, S. S. (2003). Revitalizing Higher Education in Bangladesh: Insights from Alumni and Policy Prescriptions. Higher Education Policy, Vol.16, Issue 4, pp. 487–504.
[8] Hoque, N., Mola, M. M., Hamid, A.C.,Uddin, M.S. (2013). Quality of Education in Bangladesh: A Survey on Private Business Schools. Journal of Information and Knowledge Management, ISSN 2224-5758 (Paper) ISSN 2224-896X (Online) Vol. 3, No. 5.
[9] Barnamala, M. T. (2015). Status, Issues and Prospects of Quality of Education in Bangladesh: In the Contest of Global World. Bangladesh Research Publication Journal, ISSN: 1998-2003, Vol.11, pp. 79-86.
[10] Tasnima, T. (2008). Determinants of Quality Higher Education: Bangladesh Perspectives Through Private Universities. Institute of Social Studies, P.O. Box 297762502 LT, The Hague, Netherlands.
[11] Rouf, M. A., Habibulah, M., Islam, M. A. (2015). Opinion on the Higher Education of Private Universities in Bangladesh. International Journal of Education and Information Technology, Vol. 3, No. 3, pp. 80-86.
AUTHORS First Author – Md. Ashadujjaman, Lecturer of Sociology & Anthropology, Asian University of Bangladesh, Uttara Model Town, Dhaka-1230. Second Author – Asma Akter, Lecturer of Economics, Asian University of Bangladesh, Uttara Model Town, Dhaka-1230.

International Journal of Scientific and Research Publications, Volume 7, Issue 4, April 2017 75 ISSN 2250-3153
www.ijsrp.org
A Layered Approach to Inferring Similarity Measurement of Ontologies Using Concept
Mapping
Farah Shahid1, Maruf Pasha2
1 Department of Information Technology, Bahauddin Zakariya University Multan, Pakistan. [email protected] 2 Department of Information Technology, Faculty of Science, Bahauddin Zakariya University, Multan, Pakistan. [email protected] Abstract. The similarity measurement of mapping between ontologies has been evaluated through prior terms like instance, properties and association. Concept similarity measurement (CSM) technique is most applicable for mapping among ontologies which calculates similarity matching of data given by user (i.e. data mention in search query, mostly various keywords are typed). The basic purpose of this research is to suggest a SM technique which uses similar super concepts for mapping and increase the matching similarity with some additional datasets. We have analyzed the various limitations in previous techniques and have effort to modify the limitations of these techniques in our proposed architecture. The paper presents a layered approach for similarity matching using super concepts and measures the synonym of concepts by using domain vocabulary. It also uses the (ESR) explicit semantic relation to measure the responsibility of concepts which create conflict in mapping process. A sample case study has employed to test the SM technique of proposed architecture .Two matrices for evaluation which is efficiency and definitiveness parameters has used to improve performance of mapping by adding concept explicit semantic relation. The proposed architecture provides the enhancement of mapping results by classify super concepts which are based on the semantic responsibility of concepts. This improvement plays a vital role in the domain of ontologies for mapping, alignment and merging and will also give a clear, obvious outcome of search. Keywords: Ontologies, Ontology Mapping, SM (Similarity Measurement), Concept information, ESR (explicit semantic relation).
1. Introduction
With the formation of semantic web, the need of ontologies has significantly increased. Ontologies are well known necessary factor of semantic web, which are defined specification of shared conceptualization. Ontology consists of number of concepts, attributes and associations. Attributes represent the concept as well as association represents relation among concepts. So, Ontologies may refer to reuse, share the knowledge. In order to make the better use of ontologies, similarity matching process between various ontologies is used. Another new advancement in SM is ontology mapping. Ontology mapping is a methodology in which similar pairs among various ontologies are matched through semantic associations. The mapping of ontology has become entirely applicable for testing the semantics among ontologies. However, users can give query data from various data sources transparently and applications can serve every data source despites of their varying representations. It is considered that various ontologies have alike components, so that there can be certainly used concepts, attributes and relations of components among two or more ontologies. The “Fig. 1,”depicts the overall implementation of mapping tools besides their features.
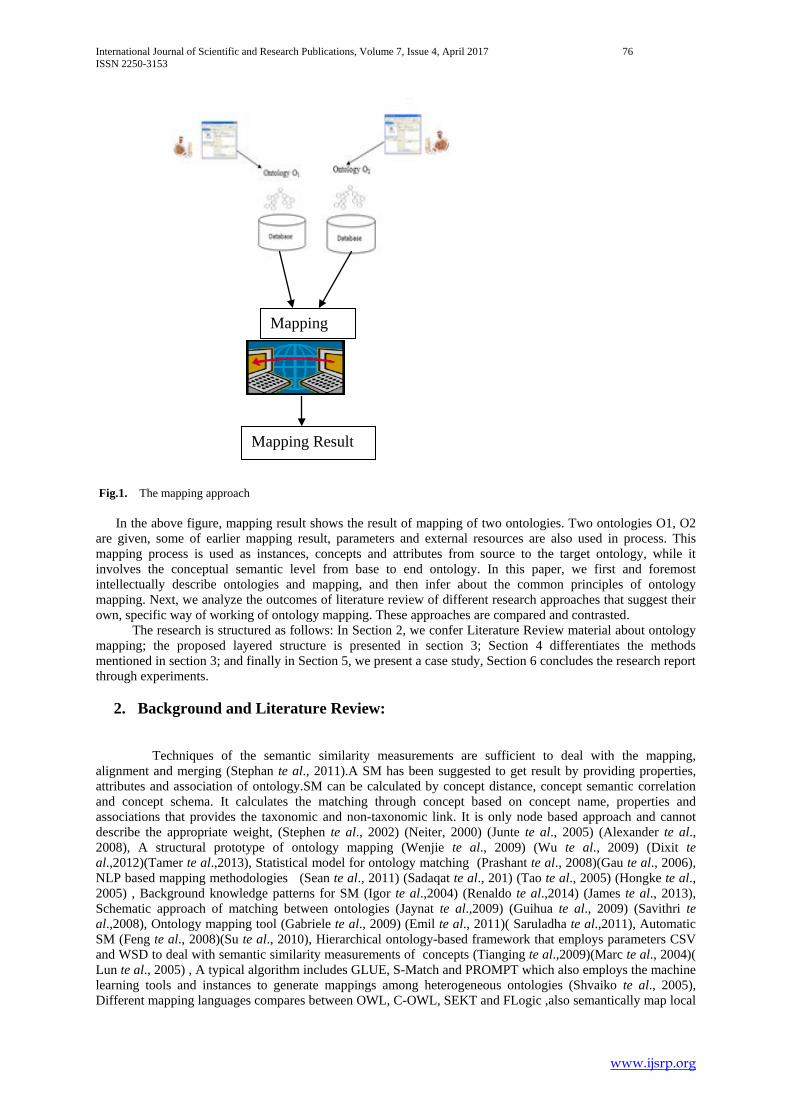
International Journal of Scientific and Research Publications, Volume 7, Issue 4, April 2017 76 ISSN 2250-3153
www.ijsrp.org
Fig.1. The mapping approach In the above figure, mapping result shows the result of mapping of two ontologies. Two ontologies O1, O2 are given, some of earlier mapping result, parameters and external resources are also used in process. This mapping process is used as instances, concepts and attributes from source to the target ontology, while it involves the conceptual semantic level from base to end ontology. In this paper, we first and foremost intellectually describe ontologies and mapping, and then infer about the common principles of ontology mapping. Next, we analyze the outcomes of literature review of different research approaches that suggest their own, specific way of working of ontology mapping. These approaches are compared and contrasted. The research is structured as follows: In Section 2, we confer Literature Review material about ontology mapping; the proposed layered structure is presented in section 3; Section 4 differentiates the methods mentioned in section 3; and finally in Section 5, we present a case study, Section 6 concludes the research report through experiments.
2. Background and Literature Review: Techniques of the semantic similarity measurements are sufficient to deal with the mapping, alignment and merging (Stephan te al., 2011).A SM has been suggested to get result by providing properties, attributes and association of ontology.SM can be calculated by concept distance, concept semantic correlation and concept schema. It calculates the matching through concept based on concept name, properties and associations that provides the taxonomic and non-taxonomic link. It is only node based approach and cannot describe the appropriate weight, (Stephen te al., 2002) (Neiter, 2000) (Junte te al., 2005) (Alexander te al., 2008), A structural prototype of ontology mapping (Wenjie te al., 2009) (Wu te al., 2009) (Dixit te al.,2012)(Tamer te al.,2013), Statistical model for ontology matching (Prashant te al., 2008)(Gau te al., 2006), NLP based mapping methodologies (Sean te al., 2011) (Sadaqat te al., 201) (Tao te al., 2005) (Hongke te al., 2005) , Background knowledge patterns for SM (Igor te al.,2004) (Renaldo te al.,2014) (James te al., 2013), Schematic approach of matching between ontologies (Jaynat te al.,2009) (Guihua te al., 2009) (Savithri te al.,2008), Ontology mapping tool (Gabriele te al., 2009) (Emil te al., 2011)( Saruladha te al.,2011), Automatic SM (Feng te al., 2008)(Su te al., 2010), Hierarchical ontology-based framework that employs parameters CSV and WSD to deal with semantic similarity measurements of concepts (Tianging te al.,2009)(Marc te al., 2004)( Lun te al., 2005) , A typical algorithm includes GLUE, S-Match and PROMPT which also employs the machine learning tools and instances to generate mappings among heterogeneous ontologies (Shvaiko te al., 2005), Different mapping languages compares between OWL, C-OWL, SEKT and FLogic ,also semantically map local
Mapping
Mapping Result
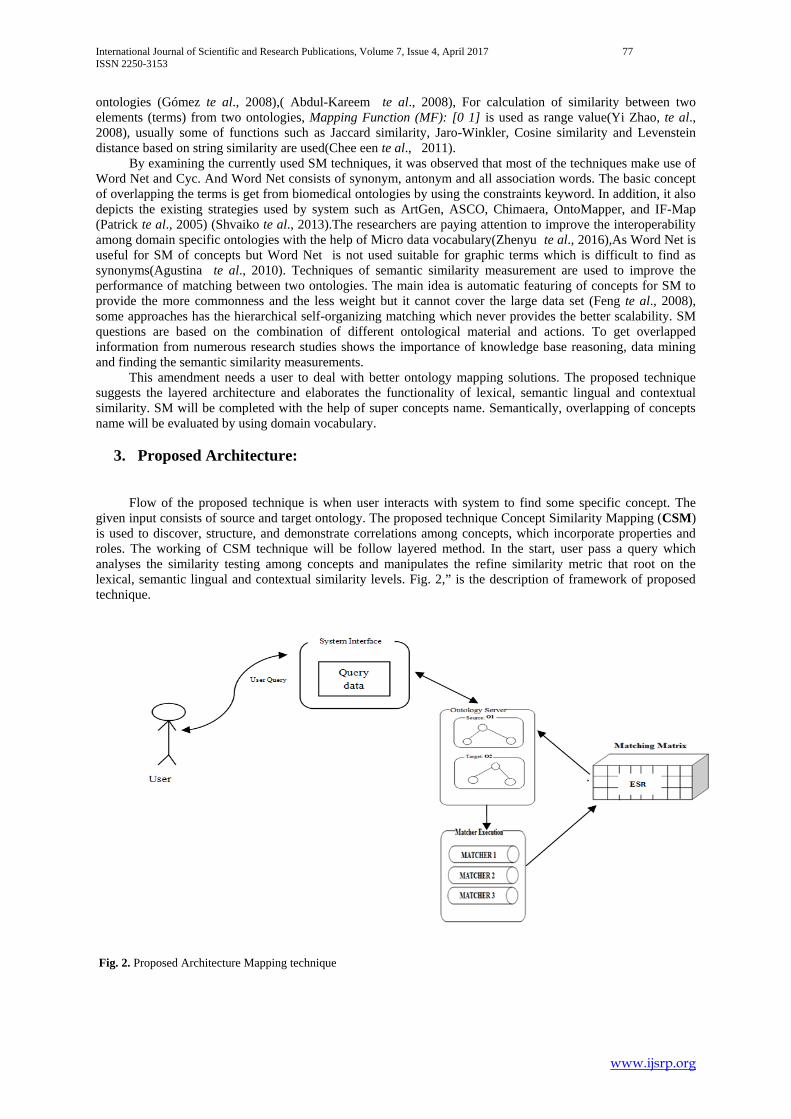
International Journal of Scientific and Research Publications, Volume 7, Issue 4, April 2017 77 ISSN 2250-3153
www.ijsrp.org
ontologies (Gómez te al., 2008),( Abdul-Kareem te al., 2008), For calculation of similarity between two elements (terms) from two ontologies, Mapping Function (MF): [0 1] is used as range value(Yi Zhao, te al., 2008), usually some of functions such as Jaccard similarity, Jaro-Winkler, Cosine similarity and Levenstein distance based on string similarity are used(Chee een te al., 2011). By examining the currently used SM techniques, it was observed that most of the techniques make use of Word Net and Cyc. And Word Net consists of synonym, antonym and all association words. The basic concept of overlapping the terms is get from biomedical ontologies by using the constraints keyword. In addition, it also depicts the existing strategies used by system such as ArtGen, ASCO, Chimaera, OntoMapper, and IF-Map (Patrick te al., 2005) (Shvaiko te al., 2013).The researchers are paying attention to improve the interoperability among domain specific ontologies with the help of Micro data vocabulary(Zhenyu te al., 2016),As Word Net is useful for SM of concepts but Word Net is not used suitable for graphic terms which is difficult to find as synonyms(Agustina te al., 2010). Techniques of semantic similarity measurement are used to improve the performance of matching between two ontologies. The main idea is automatic featuring of concepts for SM to provide the more commonness and the less weight but it cannot cover the large data set (Feng te al., 2008), some approaches has the hierarchical self-organizing matching which never provides the better scalability. SM questions are based on the combination of different ontological material and actions. To get overlapped information from numerous research studies shows the importance of knowledge base reasoning, data mining and finding the semantic similarity measurements. This amendment needs a user to deal with better ontology mapping solutions. The proposed technique suggests the layered architecture and elaborates the functionality of lexical, semantic lingual and contextual similarity. SM will be completed with the help of super concepts name. Semantically, overlapping of concepts name will be evaluated by using domain vocabulary.
3. Proposed Architecture: Flow of the proposed technique is when user interacts with system to find some specific concept. The given input consists of source and target ontology. The proposed technique Concept Similarity Mapping (CSM) is used to discover, structure, and demonstrate correlations among concepts, which incorporate properties and roles. The working of CSM technique will be follow layered method. In the start, user pass a query which analyses the similarity testing among concepts and manipulates the refine similarity metric that root on the lexical, semantic lingual and contextual similarity levels. Fig. 2,” is the description of framework of proposed technique.
Fig. 2. Proposed Architecture Mapping technique
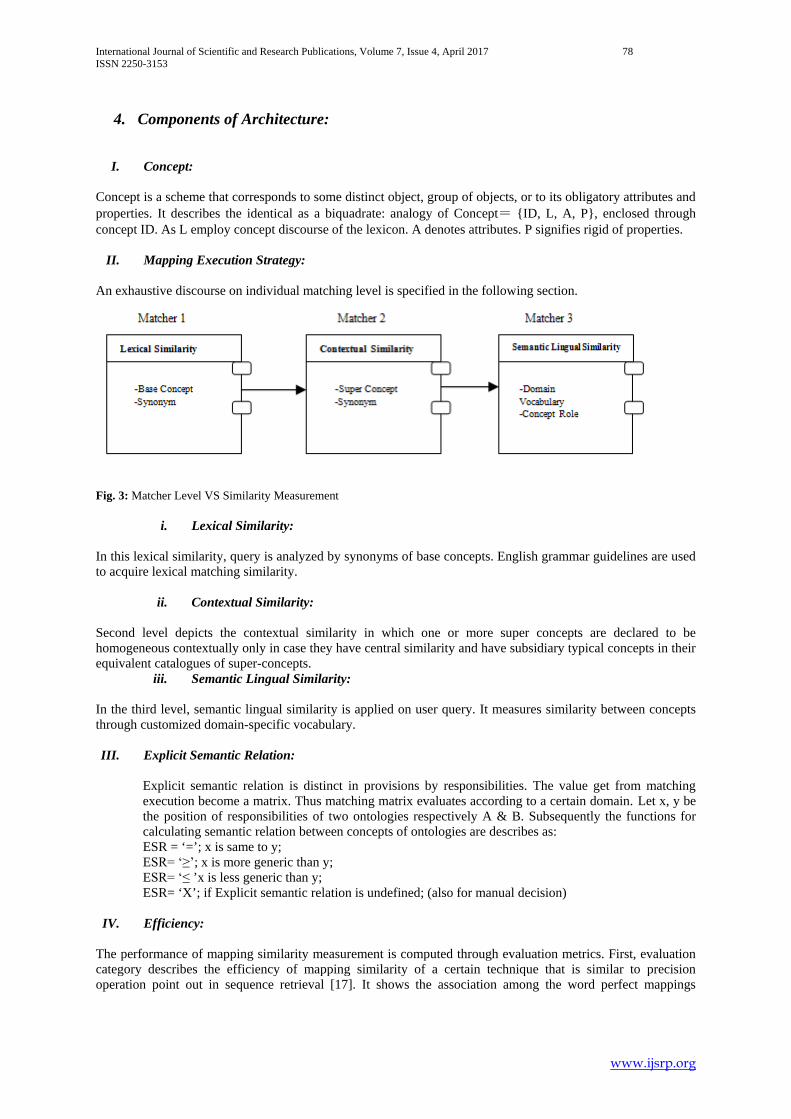
International Journal of Scientific and Research Publications, Volume 7, Issue 4, April 2017 78 ISSN 2250-3153
www.ijsrp.org
4. Components of Architecture:
I. Concept: Concept is a scheme that corresponds to some distinct object, group of objects, or to its obligatory attributes and properties. It describes the identical as a biquadrate: analogy of Concept= {ID, L, A, P}, enclosed through concept ID. As L employ concept discourse of the lexicon. A denotes attributes. P signifies rigid of properties.
II. Mapping Execution Strategy:
An exhaustive discourse on individual matching level is specified in the following section.
Fig. 3: Matcher Level VS Similarity Measurement
i. Lexical Similarity:
In this lexical similarity, query is analyzed by synonyms of base concepts. English grammar guidelines are used to acquire lexical matching similarity.
ii. Contextual Similarity:
Second level depicts the contextual similarity in which one or more super concepts are declared to be homogeneous contextually only in case they have central similarity and have subsidiary typical concepts in their equivalent catalogues of super-concepts.
iii. Semantic Lingual Similarity:
In the third level, semantic lingual similarity is applied on user query. It measures similarity between concepts through customized domain-specific vocabulary. III. Explicit Semantic Relation:
Explicit semantic relation is distinct in provisions by responsibilities. The value get from matching execution become a matrix. Thus matching matrix evaluates according to a certain domain. Let x, y be the position of responsibilities of two ontologies respectively A & B. Subsequently the functions for calculating semantic relation between concepts of ontologies are describes as: ESR = ‘=’; x is same to y; ESR= ‘≥’; x is more generic than y; ESR= ‘≤ ’x is less generic than y; ESR= ‘X’; if Explicit semantic relation is undefined; (also for manual decision)
IV. Efficiency:
The performance of mapping similarity measurement is computed through evaluation metrics. First, evaluation category describes the efficiency of mapping similarity of a certain technique that is similar to precision operation point out in sequence retrieval [17]. It shows the association among the word perfect mappings
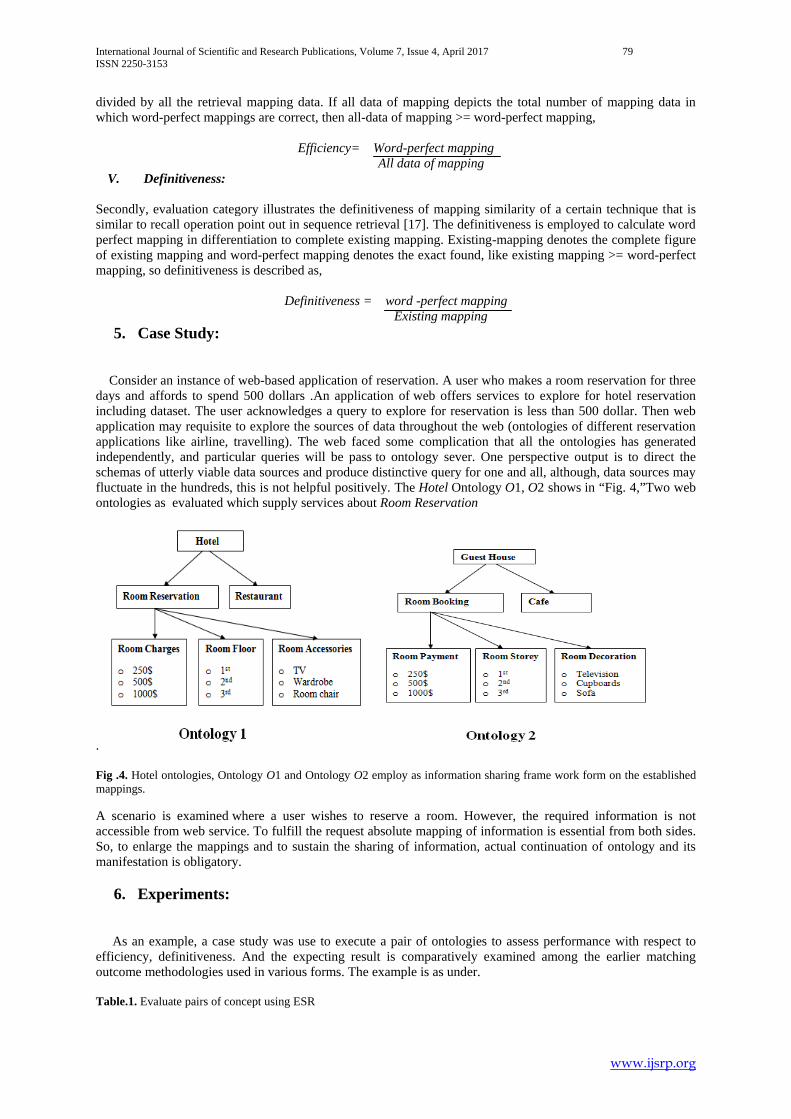
International Journal of Scientific and Research Publications, Volume 7, Issue 4, April 2017 79 ISSN 2250-3153
www.ijsrp.org
divided by all the retrieval mapping data. If all data of mapping depicts the total number of mapping data in which word-perfect mappings are correct, then all-data of mapping >= word-perfect mapping,
Efficiency= Word-perfect mapping All data of mapping
V. Definitiveness: Secondly, evaluation category illustrates the definitiveness of mapping similarity of a certain technique that is similar to recall operation point out in sequence retrieval [17]. The definitiveness is employed to calculate word perfect mapping in differentiation to complete existing mapping. Existing-mapping denotes the complete figure of existing mapping and word-perfect mapping denotes the exact found, like existing mapping >= word-perfect mapping, so definitiveness is described as,
Definitiveness = word -perfect mapping Existing mapping
5. Case Study: Consider an instance of web-based application of reservation. A user who makes a room reservation for three days and affords to spend 500 dollars .An application of web offers services to explore for hotel reservation including dataset. The user acknowledges a query to explore for reservation is less than 500 dollar. Then web application may requisite to explore the sources of data throughout the web (ontologies of different reservation applications like airline, travelling). The web faced some complication that all the ontologies has generated independently, and particular queries will be pass to ontology sever. One perspective output is to direct the schemas of utterly viable data sources and produce distinctive query for one and all, although, data sources may fluctuate in the hundreds, this is not helpful positively. The Hotel Ontology O1, O2 shows in “Fig. 4,”Two web ontologies as evaluated which supply services about Room Reservation
. Fig .4. Hotel ontologies, Ontology O1 and Ontology O2 employ as information sharing frame work form on the established mappings. A scenario is examined where a user wishes to reserve a room. However, the required information is not accessible from web service. To fulfill the request absolute mapping of information is essential from both sides. So, to enlarge the mappings and to sustain the sharing of information, actual continuation of ontology and its manifestation is obligatory.
6. Experiments: As an example, a case study was use to execute a pair of ontologies to assess performance with respect to efficiency, definitiveness. And the expecting result is comparatively examined among the earlier matching outcome methodologies used in various forms. The example is as under. Table.1. Evaluate pairs of concept using ESR
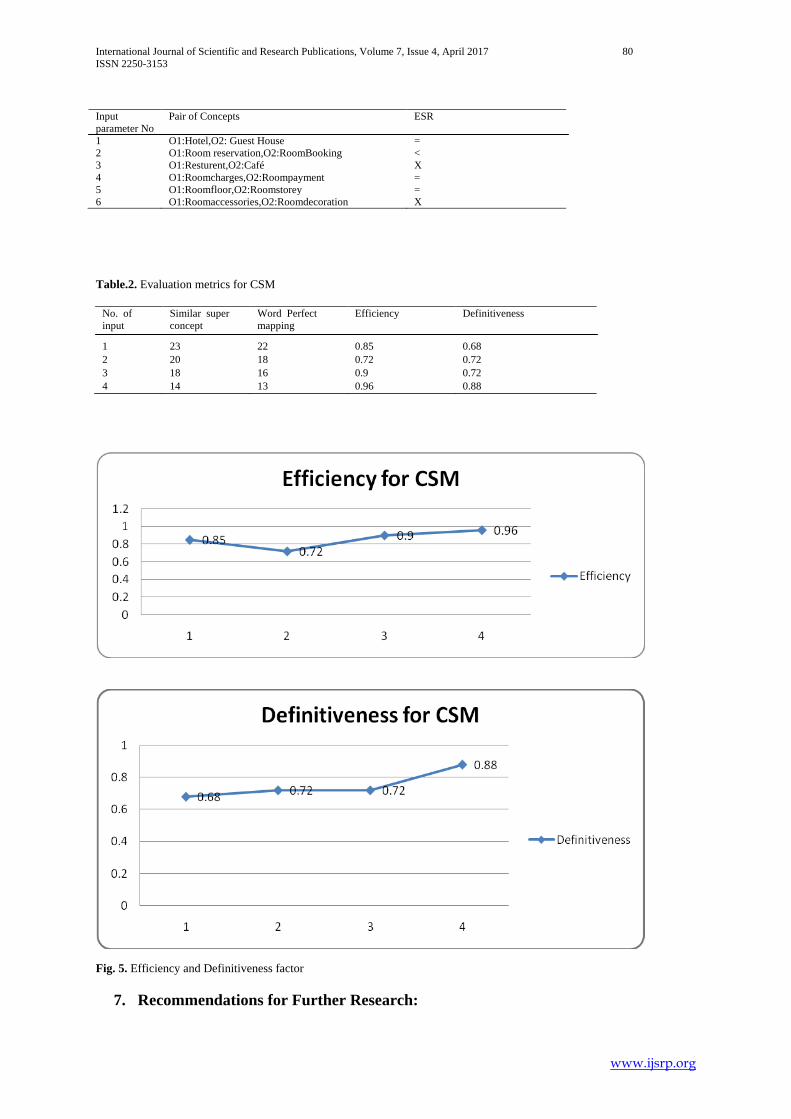
International Journal of Scientific and Research Publications, Volume 7, Issue 4, April 2017 80 ISSN 2250-3153
www.ijsrp.org
Input parameter No
Pair of Concepts ESR
1 O1:Hotel,O2: Guest House = 2 O1:Room reservation,O2:RoomBooking < 3 O1:Resturent,O2:Café X 4 O1:Roomcharges,O2:Roompayment = 5 O1:Roomfloor,O2:Roomstorey = 6 O1:Roomaccessories,O2:Roomdecoration X
Table.2. Evaluation metrics for CSM
No. of input
Similar super concept
Word Perfect mapping
Efficiency Definitiveness
1 23 22 0.85 0.68 2 20 18 0.72 0.72 3 18 16 0.9 0.72 4 14 13 0.96 0.88
Fig. 5. Efficiency and Definitiveness factor
7. Recommendations for Further Research:

International Journal of Scientific and Research Publications, Volume 7, Issue 4, April 2017 81 ISSN 2250-3153
www.ijsrp.org
The proposed system classify into a layered approach where each matching level is performed an individual task and produce highly cohesive .Our focal point is to describe the technique of mapping among two ontologies, previous one declared to work with data from ontology to ontology, alike terms of these ontologies is confirm. The suggested method has used to direct the mapping similarity among super concepts along with its role. In which ontology server receives query from user and regain information related to equivalence ontology class. Results show that the matching metrics have exact similarity and increase performance of mapping. Therefore in future this method will enlarge to assemble the requisites of similarity of extraneous concepts. So, there would be necessary to do work on its interpretation while merging two concepts into a rare concept. Furthermore, we will emphasis on how to upgrade the functionality of system, and also realize the many-to-many relations among concepts or properties to improve the solution of heterogeneity.
References:
1. Abdolreza H., S. Abdul-Kareem, 2008. An Approach for Mapping of Domain-based Local Ontology, International Conference on Complex, Intelligent and Software Intensive Systems.
2. Albert, D and C, M Steiner, 2005. Empirical Validation of Concept Maps: Preliminary Methodological Considerations, in Proceedings of the Fifth IEEE International Conference on Advanced Learning Technologies 0-7695-2338-2.
3. Agustina, B C., Alejandra. 2008. The Geographic information integration through enriched ontology matching.
4. A., Farooq. 2010. The Similarity measurement and identification between ontologies, in proceeding of ACM international conference of development in information retrieval.
5. Chee, Y and K, Myung, 2013. Instance-based ontology matching with rough set features selection. 6. Dieter, F., 2000.Ontology: Silver bullet for knowledge management and electronic commerce, in
Proceedings of the ECAI-98 Workshop on Applications of Ontology. 7. Diego, D and S Alan., 2015.Applications of ontologies in requirements engineering: a systematic
review of the literature, in proceedings of ACM international conference of development in information retrieval.
8. Dietrich, A. and S, Christina, 2005.Empirical validation of concept maps: preliminary methodological considerations. In Proceedings of, Fifth IEEE international conference on advanced learning technologies.
9. E, Şt. Chifu, I. A. Leţia, 2011. A Neural Model for Ontology Matching, Proceedings of the Federated Conference on Computer Science and Information Systems ISBN 978-83-60810-39-2.
10. Enhong, C and W, Gaofeng, 2005.An ontology learning methodology enhanced by frame Semantics IEEE international symposium on multimedia.
11. Fausto, G and S, Pavel, 2004.An algorithm and implementation of semantic matching .in proceedings of European semantic web symposium, LNCS 3053.
12. Gabriele, M and M Tania., 2011.MDSS: A framework for the integration of ontology mapping tools. 13. Godugula S., 2008.Survey of Ontology Mapping Techniques, Proceedings of Software Quality and
Assurance. 14. Guo, W. and W, Ya-Dong, 2006.An ontology –based method for similarity calculation of concept in
the semantic web, Fifth international conference on machine learning and cybernetics. 15. Hongke, X. Z., Xuefeng, 2009.Multi-strategy ontology mapping based on stacking method, Sixth
international conference of fuzzy systems and knowledge discovery, 978-1-4577-0966-1. 16. Jayant, M. B., Philip, 2002. Representing and reasoning about mappings between domain models of
AAAI-02. 17. Jerome, E. and S, Pavel. 2010. Ontology matching solutions to problem. 18. Jurisica, I., Y, Eric. 2004. Ontologies for Knowledge Management: An Information Systems
Perspective, Proceedings of the Knowledge and Information Systems. 19. K. Saruladha, G.Aghila, A., Bhuvaneswary, 2011. COSS: Cross Ontology Semantic Similarity
Measure-Information Content Based Approach, IEEE-International Conference on Recent Trends in Information Technology.

International Journal of Scientific and Research Publications, Volume 7, Issue 4, April 2017 82 ISSN 2250-3153
www.ijsrp.org
20. K.J. Lee, Taeg Keun Whangbo, 2007. Semantic Mapping between RDBMS and Domain Ontology PROCEEDINGS OF IEEE Institute 1-4244-1521.
21. Li H., G. Hu., X. Yang, 2012. Review of Ontology Mapping, in proceedings of international IEEE Conference 978-1-4577-1415-3.
22. Marc, E. and S, York. 2004. Ontology mapping-An integrated approach. 23. Marta, S and A., Mathieu, 2006.Using the semantic web as background knowledge for ontology
mapping. 24. Maedche, A., and S., Stab, 2009.Ontology Learning for the Semantic Web, PROCEEDINGS OF IEEE
Institute AIFB, D-76128. 25. Nie G., Meng F., Huan Xia. A Semantic Mapping System based on E-Commerce Logistics Ontology,
Proceedings of World Congress on Software Engineering Wuhan. 26. Patrick, L and He, Tan. 2011. The Ontology Alignment and Merging, in proceedings of Sixth
Framework Program. 27. P. Dixit, S. Seethe, A. K. Sharma, A., Dixit. 2012. The Design of an Automatic Ontology Construction
Mechanism using Semantic Analysis of the Documents, Fourth International Conference on Computational Intelligence and Communication Networks.
28. Pan C.P., L.Soldatova, S. Džeroski, 2014.Ontology of core data mining entities, in proceedings of ACM international conference about development in information retrieval.
29. Pavel, S, E., Jerome, 2004. A survey of schema-based matching approaches, in proceedings of journal on data semantics.
30. R. Lima, H, Oliveira, and Fred Freitas, 2014. Ontology Population from the Web: an Inductive Logic Programming-Based Approach, 11th International Conference on Information Technology.
31. R. Khaled, S., Hooria, 2013. The Mapping Ontology used for Geographic Information Retrieval. IEEE International Conference 978-1-4799-3392-1.
32. Ryutaro, I., 2011. Machine learning approaches for ontology mapping using multiple concept similarity measures.
33. Rashmi, C. and G. Rayan., 2012.Ontology based automatic query expansion for semantic information retrieval in sports domain, In: International Conference on Methods and Models in Computer Science.
34. Stephen, R, L. Douglas, 2002.Mapping ontologies into cyc AAAI Technical Report WS-02-11. 35. EL.T. U., S. Rajaranganathan, S.Karthik, 2013.A Survey of ontology in semantic web. International
Journal of Science, Engineering and Technology Research (IJSETR) ISSN: 2278 – 7798. 36. S M Falconer, M A, Storey. 2002. A cognitive support framework for ontology mapping:
ISWC/ASWC 2007, LNCS 4825, pp. 114–127. 37. Su H. and K. Mar Saw Hla, 2011.An Efficient Ontology Approach for Organizing and Mapping Deep
Web Resources, in IEEE-International Conference 978-1-4244-5586-7. 38. T.A Farrag., A.I Saleh., H.A Ali., 2013. Toward SWSs Discovery: Mapping from WSDL to OWL-S
Based on Ontology Search and Standardization Engine, Proceedings of IEEE transactions on knowledge and data engineering.
39. Tao, J. and F, Yuchen, 2010.A method of ontology mapping based on instance CNSF NO.60673092. 40. Thomas, L. and S. Heiner., 2012.Tightly integrated probabilistic description logic programs for
representing ontology mapping. 41. Vipul, K and S, Amit. 1995. Semantic and schematic similarities between database objects: A context-
based approach in proceedings of VLBB journal. 42. Wenjie, L. and Z, Yan, 2009.The Concept similarity calculation in ontology mapping, sixth
international conference on fuzzy system and knowledge discovery. 43. Wu, Y and J, Lang., 2009.A similarity-based approach for ontology mapping, forth international
conference on computer science & education. 44. Ying, W and L, Weiru. 2012. A structure-base similarity spreading approach for ontology matching. 45. Y. Chai H., Weiping He., Wang X., Song G., 2013. Semantic similarity calculation method for
ontology mapping of CCIS IEEE 2nd international conference no: 13898189. 46. Zhang, J and P, Olango, 2005. The Populating Ontologies in proceedings of ACM international
conference.

International Journal of Scientific and Research Publications, Volume 7, Issue 4, April 2017 83 ISSN 2250-3153
www.ijsrp.org
Self-employment Intention and the Impact of Entrepreneurship Education on School Leavers
S.DamayanthiEdiriisnghe
Faculty of Commerce &Managemnet Studies, University of Kelaniya, Sri Lanka Abstract- The purpose of this study is to identify the school leavers’ entrepreneurial characteristics and the relationship between those characteristics and entrepreneurial intension to solve existing problems of unemployment. And find out to what extent the respondents have become an entrepreneur.Both primary and secondary data were used to conduct the study. To collect the primary data self-administered questionnaire was applied.Multi-stage stratified random sampling technique usedto select the study respondents. Collected data were analyzed using descriptive and inferential statistics tools. Findings revealed that the education system has highly facilitated to develop the entrepreneurial skills through TVET to the school leavers. But considerable amount of school leavers have no high level of idea to become an entrepreneur. And they had a moderate tolerance for ambiguity and moderate willing to take the risk. Finally the study investigated effectiveness of entrepreneurship education was depend on the entrepreneurial traits.Further it was revealed that need for achievement, locus of control, risk taking propensity, self-confidence, and innovativeness positively affected to the entrepreneurial intention. For the development as well as for a solution for the unemployment, entrepreneurship education is giving more job opportunities. Hencethis study was provided awareness into entrepreneurship education, as to which entrepreneurial characteristics can be developed to raise good entrepreneurs. Further educational systems need to be re-oriented to emphasize and value entrepreneurship in order to popular an enterprise culture among the unemployed people.Moreoverto be effective of the TVET training, several other factors also should explored such as management commitment and support, students’ characters and enthusiasm, availability of physical resources for teaching and training. However, as a remedy for thelowintention, direction and links for the employment opportunities is a must parallel to the training. Index Terms- Unemployment, Entrepreneurial Traits, Entrepreneurial, Entrepreneurship Education. TVET ,School Leavers
I. INTRODUCTION ntrepreneurship education is always aiming with to provide a solutions for unemployment problems by providing new job
opportunities. Through this research paper it is investigated how the self-employment intention popular among the school-leavers in Sri Lanka. Because the Country like Sri Lanka, the role of entrepreneurship education is essential for the development process. It is helping to create self-employment opportunities and reduction of unemployment. Education that compromises the
skills to set-up new business or ventures, can be identified as entrepreneurship education. Equip individuals with entrepreneurial skills which are applicable directly to work, and also the best way to deliver the education and prepare individuals act as entrepreneurs. Because entrepreneurship training and education leads business creation and expansion. And it gives multitude benefits for the society. The economic growth of Sri Lanka has not benefited all people alike. Inequality of opportunities, deprivation and marginalization are the consequences of prevailing economic structure of the country. Unemployment is a major one among these. The objectives of entrepreneurship education is aimed at changing the students behaviors and intention that makes them to understand entrepreneurship, to become an entrepreneur that finally resulted in the formation of new businesses as well as new job opportunities (Fayolle & Gailly, 2005; Hannon, 2005). But still very few students have an intention to start a new venture. Hence there is a gap between education system and intention of students to start a business. It can be assume that, lack of entrepreneurial characteristics is a reason for that gap. Therefore, in this research it is expected that the identification of students’ entrepreneurial\characteristics and the relationship between those characteristics and entrepreneurial inclination contribute significantly to solve existing problems of unemployment. Further the successful entrepreneur has also been reported to be largely depend on individual or situational variables. Therefore many factors could be responsible for success of a business success of an entrepreneur.Further a reasonable understanding of the traits of the entrepreneur is needed for a sound entrepreneurial judgment to carry out the business plan successfully.
II. PROBLEM IDENTIFICATION Unemployment is a burning problem of the world in most of the countries. Especially among the region inAsian is recorded the highest unemployment in the world. Countries like Indonesia, Philippine, Sri Lanka are highly facing the problem of unemployment. One of the survey in national level in Sri Lanka revealed that 23% of dropped outs, didn’t find the school useful. This mentality among the youth of Sri Lanka is a clear obstacle for the development. In every year some group of youth get unemployed. One method of solving the problem unemployment is promoting the people to start a business. To start business or to be an entrepreneur, someone must have some idea about entrepreneurship. It is needed more education. Actually he or she
E

International Journal of Scientific and Research Publications, Volume 7, Issue 4, April 2017 84 ISSN 2250-3153
www.ijsrp.org
must have good knowledge about entrepreneurship to be an entrepreneur.
III. OBJECTIVES OF THE STUDY As a solution for the unemployment among youth, entrepreneurship education has been introduced to the national curricular. Because the youth need to exposure in practical entrepreneurial work experience in order to be proficient in their chosen carrier and to be useful them which is a planned effort undertaken by an individuals, institutions or agencies to develop the required competencies in people which can easily be addressed. One of the ways of attaining this is use the Vocational Training Though the objectives of entrepreneurship education are aimed in changing students’ state of behaviors and even intention that makes them to understand entrepreneurship, to become entrepreneurial and to become an entrepreneur that finally resulted in the formation of new businesses as well as new job opportunities (Fayolle & Gailly, 2005; Hannon, 2005). But still very few students have an intention to start a new venture. Therefore, focus of this research is to identify the school leavers’ entrepreneurial characteristics and the relationship between those characteristics and entrepreneurial intension to solve existing problems of unemployment. And find out what extent the students have become an entrepreneur.
IV. SIGNIFICANCE OF THE STUDY Technical Vocational Education and Training (TVET) are designed to lead the beneficiaries to self –employment, economic self-sufficiency, and employment generation through short or long-term training. TVET can be introduced as any form of education whose primary purpose is to prepare beneficiaries for gainful employment in an occupation or group of occupations or to create entrepreneurs via training. Therefore conducting research is very useful to improve and change their strategies in order to answer the emerging needs of the society. In this rapid change in the world it is necessary to conduct programs of vocational skills training which provides the opportunities for the personal wellbeing of the youth for the sustainability of the development of the country.
V. LITERATURE REVIEW According to past literature, entrepreneurship can be divided into the following stages;in 1960s,after the publication of “The Achieving Society” by McClelland in 1961 , researchers mainly focused on the effect of personality traits of entrepreneurs on their entrepreneurial behaviors. Next in 1980s and 1990s, researchers turned their attention on impact of individual intentions of entrepreneurship on their entrepreneurial behavior. Meantime, the empirical study about entrepreneurial intentions and their influencing factors emerged rapidly. As (Zhengxia , et al., 2012) some researchers argued that compared with individual personality variable; individual intentions of entrepreneurship were more effective and had stronger explanatory ability in prediction of their entrepreneurial
behaviors. According to the literature, during that period, six major entrepreneurial intention models were introduced. The Entrepreneurial Event Model by Shapero (1982) and, the Theory of Planned Behavior by Ajzen (1991) and so on But some authors expressed that understanding the concept entreprenurship as a difficult task. Accordingly some authors metioned that it is very difficult to understand notable interest and research in entrepreneurship and entrepreneurs. And it is difficult and challenging that defining and understanding entrepreneurship. From a survey of the entrepreneurship literature, has identified six main schools of thought. The existence of these schools of thought demonstrates that there is very little consensuson what entrepreneurship is and what an entrepreneur does. The ‘great person’ school of entrepreneurship views an entrepreneur as a person who is born or made. And succcessful entrepreneurs are characterized as individuals who have an intuitive ability and traits such as high level of vigor, energy, persistence and self-esteem. And they have strong drives for independence and success. The ‘classical’ school of entrepreneurship describes that innovation is the central characteristic of entrepreneurial bahavior and identifies that the key aspects of entrepreneurship are creativity,discovery and innovation. Moreover they have described the terms between entrepreneurship and management also. The ‘management’ school of entrepreneurship views entrepreneurs as person who is organizing and managing, and assuming risk for the sake of profit of an economic venture. This school of thought is based on the belief that entrepreneurship can be developed and can taught in a classroom and they deal with the technical aspects of management by focusing on the central functions required in managing a firm. The ‘leadership’ school of entrepreneurship describes the entrepreneur as a people manager or a leader of people or a mentor. They have the ability to adapt their style to the needs of people and their key functions are to motivate,direct and lead people(Alberti et al(2004), Fayolle et al(2005),Gurol et al(2006). The ‘intrapreneurship’ school says that entrepreneurial skills can be useful in complex organizations through the development of independent units to create, market and expand services. And it evolved in response to lack innovativeness and competitiveness. An intrapreneur is not an owner of the organization but he focuses product dvelopment, operational efficiency, strategic redirection and organizational duplication. And the accent is working as a team to solve problems and create opportunities(McStay(2008),Hannon(2005). Finally, thae ‘psychological characteristics’ school of entrepreneurship views entrepreneurs as individuals who have unique needs, drives, attitudes, beliefs and values which determine their bahaviour. This shool of thought focuses on personality factors/ psychological factors and characteristics associated with entrepreneurship(Yusof et al(2007). The ‘great person’ school of entrepreneurship views an entrepreneur as a person who is born or made. And succcessful entrepreneurs are characterized as individuals who are have an intuitive ability and traits such as high level of vigor, energy, persistence and self-esteem. The ‘classical’ school of entrepreneurship describes that innovation is the central characteristic of entrepreneurial bahavior and identifies that the key aspects of entrepreneurship are creativity,discovery and
International Journal of Scientific and Research Publications, Volume 7, Issue 4, April 2017 85 ISSN 2250-3153
www.ijsrp.org
innovation. Moreover ‘management’ school of entrepreneurship views entrepreneurs as person who is organizing and managing, and assuming risk for the sake of profit of an economic venture. The ‘leadership’ school of entrepreneurship describes the entrepreneur as a people manager or a leader of people or a mentor. They have the ability to adapt their style to the needs of people and their key functions are to motivate,direct and lead people. The ‘intrapreneurship’ school says that entrepreneurial skills can be useful in conplex organizations through the development of independent units to create, market and expand services. And it evolved in response to lack innovativeness and competitiveness. An intrapreneur is not an owner of the organization but he focuses product dvelopment, operational efficiency, strategic redirection and organizational duplication. And the accent is working as a team to solve problems and create opportunities. Finally, thae ‘psychological characteristics’ school of entrepreneurship views entrepreneurs as individuals who have unique needs, drives, attitudes, beliefs and values which determine their bahaviour. This shool of thought focuses on personality factors/ psychological factors and characteristics associated with entrepreneurship. This study is focuss entrepreneurial characteristics, which emphases on personality/psychological factors and characteristics associated with entrepreneurship such as need for achievement, locus of control, risk taking propensity, tolerance of ambiguity, self confidence (Brockhaus & Horwitz, 1986) and innovativeness (Schumpeter, 1934). 2.3. Entrepreneurial Approaches According to the McStay (2008), previous studies about entrepreneurship can be divided in to three distinct approaches such as trait approaches, behavioral approaches and cognitive approaches. According to trait approach, entrepreneurs are assumed to have certain personality traits which made them unique such as need for achievement, need for power, need for affiliation, internal locus of control etc.The trait approach to entrepreneurship has been pursued by many researchers in an attempt to separate entrepreneurs from non-entrepreneurs and to identify a list of character traits specific to the entrepreneur(Siverajah & Achchuthan,2013). There is no agreement however on the number of traits, specific to the entrepreneur, or their validity (McStay, 2008). Some authors pointed out the personal characteristics of the entrepreneurs that have often been related to entrepreneurial intentions and entrepreneurial success. According to the previous litreature combination of entrepreneurial characteristics was significantly greater for students engaged in entrepreneurial training and a classroom-based enterprise. Students receiving entrepreneurial training will attain a greater overall entrepreneurial characteristics score than a comparable cohort and students engaged in classroom enterprise will attain a higher overall entrepreneurial characteristics score than a comparable cohort. In general, these results support the theory that entrepreneurial characteristics can be affected by instructional and experiential intervention.Furthermore this research study suggested that entrepreneurial characteristics are universal, by extending this theory to students at the intermediate
level. Furthermore, entrepreneurial performance is the result of a combination of personal and context-based items. It cannot be solely explained by a single set of entrepreneurial personal characteristics neither a set of more or less institutional relationships Pinho & de Sa,2014). In this study, six traits were identified according to the past literature. Namely innovativeness, need for achievement, locus of control, risk taking propensity, tolerance of ambiguity and self-confidence. These characteristics are included in the study since they are the most frequently cited as entrepreneurial characteristics in different studies in the entrepreneurship literature and evidences indicating association between them and entrepreneurship have been widely documented (Koh, 1996; Gurol & Atsan, 2006). Furthermore, the authors do consider these characteristics as capable of representing the entrepreneurial behavior of individuals in natural and instinctive way (Gurol & Atsan, 2006). And also when reviewing the theories of entrepreneurship, entrepreneurial is influenced by so many factors such as education, family background, social networks, characteristics, personality and etc. Various scholars have developed varies models to describe the entrepreneurial inclination. Those models are based on two major theories, namely the Theory of Planned behaviour(Ajzen,1991) and Entrepreneurial Event Model (Shapero& Sokol,1982) Using the existing theories on Entrepreneurial intension and Entrepreneurial Traits, a comprehensive conceptual model was developed. Intention of Entrepreneurship Entrepreneurial inclination can be explained as the intention to start a new venture. Entrepreneurial inclination is the first and most important step of creating a new venture. Therefore to become an entrepreneur individuals must have entrepreneurial inclination. Intentionality is a key concept when it comes to understanding the reasons for individuals’ careers (Franco , et al., 2010). This is particularly true for explaining the decision to start up a new venture, where the entrepreneurial intention has been considered a chief element (Bird, 1988). And he defined entrepreneurial inclination as the expressed behavior of individuals to become an entrepreneur (Bird, 1988). The intention is linked with attitudes, more precisely with perceived desirability and feasibility (Gatewood , et al., 1995). In general, several prior studies have found that entrepreneurial intentionality is determined by many, sometimes different factors (Franco , et al., 2010). In this disposition, scientific literature has dealt with two major lines of research: (1) cognitive, regarding personal factors; and (2) contextual or environmental factors (Franco , et al., 2010). They can exert a positive or negative influence on the entrepreneurial intention, and often their specific combination and interaction moulds the individual’s decision towards self-employment. Within the cognitive factors, scholars have analyzed specific characteristics, personality traits and motives that seem to be typical in entrepreneurs, distinguishing them from the rest of the population.In the majority of previous studies focused on the influence of explicit demographic characteristics such as gender, marital status, age, ethnicity, family antecedents, education, previous job and other related aspects. Entrepreneurship education

International Journal of Scientific and Research Publications, Volume 7, Issue 4, April 2017 86 ISSN 2250-3153
www.ijsrp.org
Scholars defined an entrepreneur as a person who destroys the existing economic order to create and benefit from the new structure by introducing new products and services, or by creating new forms of organization, or by exploiting new raw materials. Another view point is a person who bears certain risks in order to take advantage of an invention while to be an entrepreneur is someone who is able to identify and exploit a new business opportunity. Though the definitions that constitute an entrepreneur differ in description, there is a consensus that an entrepreneur is someone who has a unique instinct, mind-set, inspiration or vision, and has the strengths, willingness, and ability to conceptualize ideas and implement a business plan and who sees change as an opportunity to create value. Based on the discussion presented above, it seems that personality dimensions, or in other words, personal traits, are essential factors in determining whether a person could become an entrepreneur. This line of thinking leads to a commonly held view that there is little logic in teaching or training someone in entrepreneurship as entrepreneurs are born to be entrepreneurs. This view argues that an entrepreneur has an innate quality, which depends on factors such as personal background and characteristics, life-path experiences and environmental influences and this quality is not transferable from one person to another. Hence, it is not possible to teach someone to become an entrepreneur. Conversely, recent studies show that entrepreneurship education does play a significant role in cultivating the entrepreneurship spirit among graduates (Solomon et al., 2002; Robinson and Hayes, 1991; Sexton and Upton, 1984). Some scholars argue that the students who have taken a course or major in entrepreneurship have shown greater interest in becoming entrepreneurs and these students act more entrepreneurially than other students in taking up the challenge to start a new business. The study implies that although it may not be possible to develop entrepreneurship from education exclusively, to a certain extent, education does have an effect in contributing to the formation of entrepreneurship. In another study, shows that students who participated in an entrepreneurship programme were more likely to start their own business than other students. Upton et al. (1995) found that 40 per cent of those who attended courses in entrepreneurship had started their own businesses. According to Ibrahim and Soufani (2002), the school and education system plays a critical role in identifying and shaping entrepreneurial traits. Other studies have pointed out that entrepreneurship education, especially education that provides technological training, is crucial to enhance entrepreneurs’ innovation skills in an increasingly challenging environment (Clarke,1990; Menzies and Paradi, 2003). The above studies have indicated that despite the belief that entrepreneurship is inborn. They may create programs which help job seekers match their skills to employers, search for vacancies in different areas, and provide workshops to help train people more in-depth in a particular skills. Research design and Methodology The youth need practical exposure in practical entrepreneurial work experience in order to be proficient in their chosen career and be useful to themselves and the society.
Entrepreneurshipeducation is a planned effort undertaken by an individual or individuals, institutions or agencies to develop the required competencies in people which can easily be addressed through vocational training centers. Sri Lanka has realized the importance of training in vocational education and training to acquire to skills for discover the individual’s potentials for work. Especially through TVET it try to develop school dropout’s potential for work. Research design and Methodology This study was employed quantitative approach. Andsample of school leavers who are engage in TVET activities in various places in Sri Lanka is used for the analysis. Sampling method chosen here is multi stage stratified sampling method. AndSelf-administered questionnaire was used as the primary data collecting method in this study. Data and Data Analysis Both primary and secondary data were used to conduct this study. Toanalyze the data descriptive statistical technique tools and regression analysis method was engaged. And subsequently reliability and validity of the tests were applied. And also tested the prior assumptions of regression analysis of Hair et al..2006 parametric tests such as mean, comparison was used in the data analysis part. By using descriptive statistics the researcher is reporting in a form of frequencies, percentages means and standard deviations. Once more, according to Leonard J. Kazmier (2004), inferential statistics include techniques by which decisions about a statistical population or process are made based on only on a sample having been observed. Inferential techniques were used to determine relationships between variables and whether differences amongst the variables exist. Data Analysis and Interpretation Unemployment Rate in Sri Lanka increased up to 5 percent in the third quarter of 2015 from 4.50 percent in the second quarter of 2015. Unemployment Rate in Sri Lanka averaged 5.60 percent from 1996 until 2015, reaching an all-time high of 11.30 percent in the fourth quarter of 1996 and a record low of 3.90 percent in the third quarter of 2011. Sampling distribution of the study Figure 1 Figure 1 revealed that from the sectors auto mobile mechanics, lath and milling operator, welding and electrical 20 students were in each strata in the sample. Among the passed out students 50 students were each represents the sample from each strata. Further the information received from the sample survey revealed that 7% of current respondents have attended school below grade 9, 38% up to grade 9, 28% up to grade 10 and 25% up to grade 11. Only 2% of the current students have attended school above grade 11. However only 5% of the students from the passed out rate were below grade 9. Twelve percent of the passed out students has attended school up to grade 9. And 21% of them has gone up to grade 10, 35% of them completed up to grade 11 and 27% of the passed out students have attend school above grade 11. And also 37% of the current students are
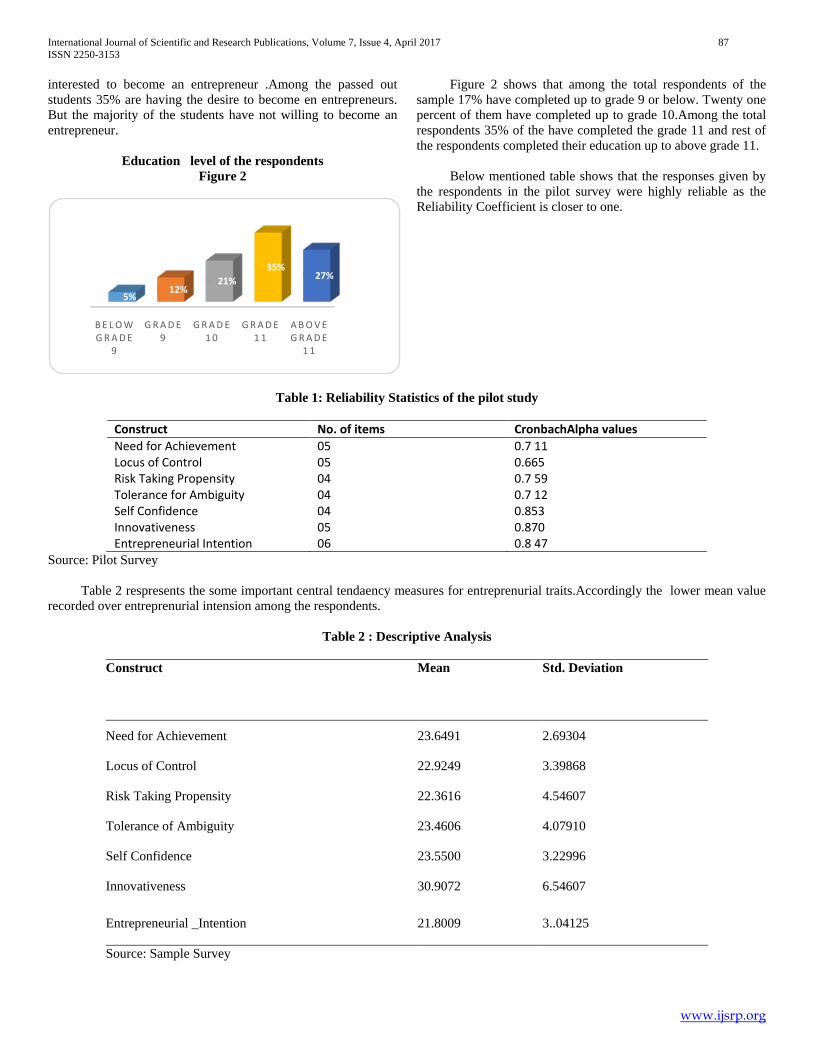
International Journal of Scientific and Research Publications, Volume 7, Issue 4, April 2017 87 ISSN 2250-3153
www.ijsrp.org
interested to become an entrepreneur .Among the passed out students 35% are having the desire to become en entrepreneurs. But the majority of the students have not willing to become an entrepreneur.
Education level of the respondents Figure 2
Figure 2 shows that among the total respondents of the sample 17% have completed up to grade 9 or below. Twenty one percent of them have completed up to grade 10.Among the total respondents 35% of the have completed the grade 11 and rest of the respondents completed their education up to above grade 11. Below mentioned table shows that the responses given by the respondents in the pilot survey were highly reliable as the Reliability Coefficient is closer to one.
Table 1: Reliability Statistics of the pilot study
Construct No. of items CronbachAlpha values Need for Achievement 05 0.7 11 Locus of Control 05 0.665 Risk Taking Propensity 04 0.7 59 Tolerance for Ambiguity 04 0.7 12 Self Confidence 04 0.853 Innovativeness 05 0.870 Entrepreneurial Intention 06 0.8 47
Source: Pilot Survey Table 2 respresents the some important central tendaency measures for entreprenurial traits.Accordingly the lower mean value recorded over entreprenurial intension among the respondents.
Table 2 : Descriptive Analysis
Construct Mean Std. Deviation
Need for Achievement 23.6491 2.69304
Locus of Control 22.9249 3.39868
Risk Taking Propensity 22.3616 4.54607
Tolerance of Ambiguity 23.4606 4.07910
Self Confidence 23.5500 3.22996
Innovativeness 30.9072 6.54607
Entrepreneurial _Intention 21.8009 3..04125
Source: Sample Survey
B E L O W G R A D E
9
G R A D E 9
G R A D E 1 0
G R A D E 1 1
A B O V E G R A D E
1 1
5%12%
21%35%
27%

International Journal of Scientific and Research Publications, Volume 7, Issue 4, April 2017 88 ISSN 2250-3153
www.ijsrp.org
And recorded correlation value shows that the relationship is significant at 5% level of significant with other independent variables.
ANOVA table in the regression analysis
Sum of Squares df Mean Square F Sig.
Regression 40007.444 6 6667.907 15.408 .000 Residual 100834.532 274 432.766
Total 140841.976 280
Further regressions model was significant at 5% level of significant.
VI. FINDINGS AND DISCUSSIONS This study was conducted to test the theoretical inferences established and to suggest some theoretical extensions for the existing literature. The entrepreneurial inclination and entrepreneurial traits relationship was tested as the theoretical testing part from the exploring the data . Confirming the theory, this study concluded that entrepreneurial traits as a predictor of entrepreneurial inclination. Therefore the study identified relationship as a possitive with need for achievement and entrepreneurial inclination. Further the study revealed that though the education system highly facilitate entrepreneurship education for the students through TVET , respondents do not have high level of an idea to become entrepreneurs. All the variables in this study were tapped on a seven point lickert scale. Accordingly,it was observed that, all the mean values are above the average of the scale. It can be concluded that, students had a high need for achievement, had a high locus of control, had a high self-confidence and was willing to highly innovate. Because mean values of those variables are close to its’ maximum value. And, they had a moderate tolerance for ambiguity and moderately willing to take risk. From the results, mean value of 21.8009 indicates that intention of the selected respondents towards entrepreneurship intension is low. Furthermore, according to the observations, students do not have very high level of intention of becoming an entrepreneur. Moreover five variables are statistically significant, at 5% level of significant namely, Need for Achievement (0.020), Locus of Control (0.000), Risk Taking Propensity (0.000), Self Confidence (0.001) and Innovativeness (0.000). at 5% level of significant. Finally it is investigated that effectiveness of the entrepreneurial education based on the number of students became an entrepreneurs as well as the entrepreneurial intention of that particular team. To be effective of the TVET training an education several other factors also explored. Among themmanagement commitment and support, students’ characters and enthusiasm, availability of physical resources for teaching and training were also identified as important factors when determining the effectiveness of training among the school leavers.
REFERENCES
[1] Alberti, F. & Sciascia, S., (2004). Entrepreneurship education: Note on an ongoing debate . 14th Annual IntEnt Conference. Italy, University of Napoli Federico.
[2] Bird, B., (1988). Implementing entrepreneurial ideas: The case for intention. Academy of Management Review, 13(3).
[3] Brockhaus , R., (1982). The psychology of the entrepreneur. In: Kent CA, Sexton DL, Vesper KH (eds). Encyclopedia of entrepreneurship, Volume 39.
[4] Brockhaus, R. H. & Horwitz, P. S., (1986). The psychology of the entrepreneur. The Art and Science of Entrepreneurship.
[5] Fayolle, A. G. & Gailly, B., (2005). Using the Theory of Planned Behaviour to assess entrepreneurship teaching programmes. Centre for Research in Change. Innovation and Strategy, pp. 1-18.
[6] Franco , M., Haase , H. & Lautenschlager , A.,( 2010). Students' entrepreneurial intentions: an inter- regional comparison. Education + Training, 52(4), pp. 260 - 275.
[7] Gatewood , E. J., Shaver, K. G. & Gartner, W. B., (1995). A longitudinal study of cognitive factors influencing start-up behaviors and success at venture creation. Journal of Business Venturing, 10(5), pp. 371-391.
[8] Gurol, Y. & Atsan, N., (2006). Entrepreneurial characteristics amongst university students: Some insights for entrepreneurship education and training in Turkey. Education + Training, 48(1).
[9] Koh & Chye, H., (1996). Testing hypotheses of entrepreneurial characteristics A study of Hong Kong MBA students. Journal of Managerial Psychology, 11(3).
[10] McClelland, D. C., (1961). The Achieving Society. New York: Van Nostrand.
[11] McClelland, D. C., (1965). Achievement and entrepreneurship: a longitudinal study. Journal of Personality and Social Psychology, 1(4), pp. 389-392.
[12] McStay, D., (2008). An investigation of undergraduate student self-employment intention and the impact of entrepreneurship education and previous entrepreneurial experience. School Of Business,Bond University,Australia.
[13] Pinho , J. C. & de Sá, E. S.,( 2014). Personal characteristics, business relationships and entrepreneurial performance. Journal of Small Business and Enterprise Development, 21(2), pp. 284 - 300.
[14] Schumpeter, J. A., (1934). The Theory of Economic Development. [15] Shapero, A. & Sokol, L., (1982). The Social Dimensions of
Entrepreneurship”, in Kent, C., Sexton, D. and Vesper, K.H. (Eds). The Encyclopedia of Entrepreneurship, pp. 72-90.
[16] Sivarajah, K. & Achchuthan, S., (2013). Entrepreneurial Intention among Undergraduates: Review of Literature. European Journal of Business and Management, 5(5).
[17] Yousaf, U., Shamim, A., Siddiqui, H. & Raina, M., (2015). Studying the influence of entrepreneurial attributes, subjective norms and perceived desirability on entrepreneurial intentions. Journal of Entrepreneurship in Emerging Economies, 7(1), pp. 23 - 34
[18] Yusof, M., Singh, S. & Kishor, P. K., (2007),Relationship between psychological characteristics and entreprenurial inclinations:A case study of

International Journal of Scientific and Research Publications, Volume 7, Issue 4, April 2017 89 ISSN 2250-3153
www.ijsrp.org
students at university TUN ABDUL RAZAK(UNITAR),Journal of Asia Enterprenurship and Substainability,3(2).
[19] Zhengxia , P., Genshu Lu & Hui , K., (2012). Entrepreneurial Intentions and Its Influencing Factors: A Survey of the University Students in Xi’an China. Volume 3.
[20] Bettina ,G. and Jennifer,H (2013),Active entrepreneurs and blue-colorworkers. Cultural understandings mirrored in European youth unemployment policies,International Journal of Sociology and Social Policy,Vol.34,No.7/8,2014,Emeral Group Publishers Limited
AUTHORS First Author – S.DamayanthiEdiriisnghe, Faculty of Commerce &Managemnet Studies, University of Kelaniya, Sri Lanka , [email protected]
International Journal of Scientific and Research Publications, Volume 7, Issue 4, April 2017
ISSN 2250-3153 90
www.ijsrp.org
Changing Pattern of the Downstream of Ganges River
Course: A Comparison with Rennell’s Map of 1760s
Nusrat Jahan Ety*, Dr. Md. Shahedur Rashid**
* Postgraduate Research Student, Department of Geography and Environment, Jahangirnagar University; e-mail:
** Professor, Department of Geography and Environment, Jahangirnagar University; e-mail: [email protected]
Abstract- Bangladesh is a land of rivers. Flood and bank
erosion since pre historic period had become one of the major
aspects of discussion for its direct interaction with physical
and socio-cultural environment. As we know regular variation
is exposed by this river from upstream to downstream at
different reaches in the Ganges River. Ganges River is
considered as a frequent bankline migrant and unstable river
of the country. This research intends to identify the shifting
pattern of the Ganges River courses accordingly using Rennell
map in 1760s and Landsat Imageries (MSS-1975; TM-1995,
and ETM+ 2015). As Landsat TM band 4 (0.76 - 0.90 µm) is
suitable for land-water interfaces separation the Ganges river
basin and have been delineated the land and water
classification using this band. The size, shape and direction of
Ganges River gradually changed over more than 250 years.
For that required processing of images like Layer stack, Image
Enhancement, Mosaic, Subset Re-Sample and Re-projection
changes were done by image processing software ERDAS
imagine 2014. To analysis the historical river course shifting
of Ganges river on the basis of Rennell’s map in 1760s and
Landsat imageries have been used various tools of ArcGIS
10.1 and Microsoft Excel 2010 likes georeferencing,
digitizing, projection transformation, calculate geometry,
layout, pivot table etc. The maximum channel width was 8.2
km in 2015 and minimum channel width was 0.9 km in 1975
in study area. Maximum channel shifted from 1760s to 1975
at the cross section 6 that was shifted in right bank 11014 m
and left bank was 14772 m. Minimum channel shifted from
1975 to 1995 at the cross section 5 that was shifted in right
bank 610 m and left bank was 61 m. The overall bankline
shifted from south to north-eastward. Maximum channel
width increased in 2015. Channel width increase day by day.
In 1760s Rennell's map, there was no River called as Jamuna
which is produced due to Earthquake in 1787 at confluence
point of Ganges River that caused dramatically shifting of the
channel of old Brahmaputra and as a result, Jamuna spreaded
across the wide area that affected comprehensive changes in
physical and human aspects.
Key words: Rennell’s Atlas, Landsat Imageries, ETM+,
Ganges River, Bankline, Channel Shifting, Confluence Point,
Physical and Human Aspects, Bangladesh.
1 Introduction
Bangladesh is a land of rivers. More than 700 rivers, with
their tributaries and distributaries have criss-crossed the
country forming a network of river system (Islam and Rashid,
2011). The Ganges river (Bangladesh part) carries the major
flow south-eastward along Indo-Bangladesh border. It
continues to flow for about 132 km eastward through
Bangladesh and ultimately joins the Brahmaputra or Jamuna.
Then it flows for 115 km south-eastward to receive the
Meghna further downstream and ultimately discharges into
the Bay of Bengal (Rudra, 2014). Its maximum depth is 1,571
feet (479 m) and average depth is 968 feet (295 m)
(Wikipedia, 2016). Evaluation of riverbeds increases because
of continuous channel fill deposition and responsible for
anabranching channel. Main causes are the low water flow.
However, comparison of the maps indicates that during the
intervening period the river had been consistently migrating
northward. Analysis of historical evidence and lithological
information (CEGIS, 2004 and Nippon, 2005) shows that
materials forming the left bank of the Padma River consist of
relatively cohesive and consolidated sediment. Hence,
northward migration of the river involves erosion of these
sediments at many locations. This is partly due to restraining
effects of outcrops of erosion resistant bank materials along
the left bank (IRIN, 2008). Regular variation is exposed by
this river from upstream to downstream at different reaches in
International Journal of Scientific and Research Publications, Volume 7, Issue 4, April 2017
ISSN 2250-3153 91
www.ijsrp.org
the Padma River. Padma River is considered as a frequent
bankline migrant and unstable river of the country. The rivers
also cause of massive suffering to people of Bangladesh.
River bank erosion is a serious hazard that directly or
indirectly causes the suffering of about one million people
annually (Elahi, 1991). A large number of people living in
both rural and urban areas become the victims of flooding
annually. These two hazards – flooding and river erosion: are
major contributors to the process of impoverisation of people
in this country. The Padma (The Ganges), the Jamuna and the
Meghna, major rivers of Bangladesh, erode several thousand
hectares of floodplain, making thousands of people landless
and homeless every year (Islam and Rashid, 2011).
2 Aim and objectives of the Research
The aim of the research is to demonstrate the applicability of
GIS and Remote Sensing over the historical maps mainly
prepared by Major James Rennell in the 1760s (Published
1779) in order to measure of the changing pattern of Ganges
River courses (Bangladesh part) in order to assess the causes
and impacts of the surrounding conditions on the current
environmental features.
In order to fulfill the above aim of the study, the following
very specific objectives are important to accomplish the
research goals.
i. To measure the changing pattern of Ganges River
courses (Bangladesh part) in comparison with a long
period of time (1760s-2015) ;and
ii. To analyze the bankline shifting pattern of the
Ganges river in different years.
3 Data and Methods
To interpret Rennell’s map, historical Landsat imagery (MSS,
TM, ETM+) and analysis the features of the old courses of
Ganges River in comparison with a long period of time
(1760s-2015) for detecting the changes.
3.1 Data
For research work Rennell’s map (1760s) has been collected
from SoB (Survey of Bangladesh). There is no ground station
to collect LANDSAT data, in Bangladesh. Multi-temporal
satellite imagery especially Landsat MSS (1975), Landsat TM
(1995), and Landsat ETM+ (2015) have downloaded from the
website http://glovis.usgs.gov during the dry period.
Resolutions of Landsat MSS, TM, and ETM+ are 60m, 30m
and 30m respectively. All the imagery are geo-referenced in
UTM projection system.
Table 1: The Landsat Imagery MSS, TM and ETM+ Frame Numbers and Meta Data of Study Data
Satellite
Sensor Year Date Frame No. of Band Data Type Map Projection
MSS 1975 Mar 17, 1975
137 / 43
137 / 44
138 / 43
148 / 44
4 MSS LIT WGS_1984_UTM_
Zone_46N
TM 1995 Jan 28, 1995
137 / 43
137 / 44
138 / 43
7 TMLIT WGS_1984_UTM_
Zone_46N
ETM+ 2015 Mar 08, 2015 137 / 44
138 / 43 11 ETM+LIT
WGS_1984_UTM_
Zone_46N
(Source: USGS- Earth Explorer, 2016)
3.2 Methodology
Ganges river basin (Rennell’s Map, Plate no-18) is my study
area for its changing behavior due to geographical
background. After selecting the study area it is essential to
collect data from different sources in order to carry on my
research work frontward. Remote Sensing data Landsat
imageries have been used for detecting changes of Ganges
river basin integrated with GIS. The verified data then
processed and analyzed based on the method of examination
or analysis. In GIS the analyzed data are presented in the map
form (ESRI, 2009). This research intends to identify the
shifting pattern of the Ganges River courses accordingly using
Rennell map and Landsat Imageries (MSS-1975; TM-1995,
and ETM+ 2015). This study also aims to contextualize

International Journal of Scientific and Research Publications, Volume 7, Issue 4, April 2017
ISSN 2250-3153 92
www.ijsrp.org
spatial-temporal reasons those are working behind the changes
and their consequences. Required processing of images like
Layer stack, Image Enhancement, Mosaic, Subset Re-Sample
and Re-projection changes were done by image processing
software ERDAS imagine 2014. To analysis the historical
river course shifting of Ganges river on the basis of Rennell’s
map in 1760s and Landsat imageries have been used various
tools of ArcGIS 10.1 and Microsoft Excel 2010 likes
georeferencing, digitizing, projection transformation, calculate
geometry, layout, pivot table etc. By the applications of the
above methods it can be possible to find out the outcome of
the research.
4 Delineation of Bankline of Ganges River: Land-Water
Classification from 1760s to 2015
To identify the bankline of Ganges River for this research
have been used two types of raw data. Those are Rennell’s
map (Plate No.-18) and Landsat satellite imageries. As
Landsat TM Band 4 (0.76 - 0.90 µm) is suitable for land-
water interfaces separation, the Ganges river have been
delineated using this band. From Landsat MSS, TM and
ETM+ single band 4, Land and water are classified and then
the interface is marked as the land and water.
Figure 1: Delineation of Bankline of Ganges River: Land-Water from 1760s to 2015
(Source: Based on Rennell’s map in 1760s and Landsat imageries, Compiled by Author, 2016)
5 River Course Shifting
The dynamic physical processes of rivers, including the
movement of water, sediment and wood, cause the river
channel in some areas to move, or "migrate," over time. This
is a natural process in response to gravity and topography and
allows the river to release energy and distribute its sediment
load. Migration processes include bank erosion and
deposition. The area within which a river channel is likely to
move over a period of time is referred to as the channel
migration zone (CMZ) (Department of Ecology, 2015). The
river Ganges is characterized by changes in its course over
historical time scales, particularly in its seaward reaches
before it enters the Bay of Bengal (Gupta, 2012). River course
line shifting mainly depends on hydrological and
morphological characteristics. Such as water level, water
discharge, soil condition, erosion and deposition. Padma River

International Journal of Scientific and Research Publications, Volume 7, Issue 4, April 2017
ISSN 2250-3153 93
www.ijsrp.org
is a meander river. In meander river lateral erosion occurs. It
is the causes of river bank shifting.
The three major Himalayan Rivers, the Ganga, Brahmaputra
and Indus, are the most sediment laden in the world (Milliman
and Meade, 1983); they carry 1.8 Gtonnes yr-1 of suspended
sediment which about 9% of the total annual load carried from
the continents to the oceans worldwide (Meybeck, 1976;
Hasnain and Thayyen, 1999). The River Ganga itself carries a
sediment load of 300-500 million tonnes yr-1 measured in
downstream at Hardinge Bridge (Sarker, 2004). The river
system is about 1.4 km to 2 km wide at its narrowest points in
the study area and varies from 10 km to 13 km wide at its
widest sections. The channel bars are also about 0.7 km to 1.5
km wide and sometimes even larger. The channel pattern of
the river is mainly meandering with anabranching pattern
(multiple channels) within some reaches (Gupta, 2012).
River bank erosion and lateral migration are chronic problems
both upstream and downstream of the Hardinge Bridge
(Sarker, 2004) along most of the 195 km length of the river
being studied. The upstream length of the river in the study
area is about 62 km north of the Hardinge Bridge and the
downstream length of the river in the study area is around 133
km from Hardinge Bridge in Bangladesh. Lateral migration
results in loss of villages and towns and loss of agricultural
land as the river flows through one of the most densely
populated regions of the world. The lateral migration of the
river has been observed to be from west to east upstream of
the barrage and from east to west downstream of the barrage
(Gupta, 2012). In the recent past, bank erosion and the rate of
change has increased resulting in a loss of agricultural land of
about 3 km2 to 3.5 km2 annually upstream in the study area
(Chattopadhyay, 2003). The total loss of land between 1980
and 1999, in downstream of the Hardinge Bridge (in
Bangladesh) was 126.5 km2 (Sarker, 2004).
6 Spatial and Temporal Dynamics of Bankline
Padma River is one of the most river bank eroded river in
Bangladesh. Continuous shifting of the thalweg from one
position to another has been occurred within bankline.
Observation of satellite images for 1760s, 1975, 1995, 2015
years are usually used compare the channel shifting from
Surdah to Calligonga at the different reaches. To easy the
measurement of bankline shifting the study area are divided
into six cross sections. Those are XS-1, XS-2, XS-3, XS-4,
XS-5, and XS-6.
7 Shifting Pattern of Ganges River from 1760s to 2015
Rennell’s map (1760s), Landsat MSS (60 m) data of 1975,
Landsat TM (30 m) data of 1995 and Landsat ETM+ (30 m)
2015 were used to generate digital database of different time
period, analysis of shifting nature of Padma river of
Bangladesh.
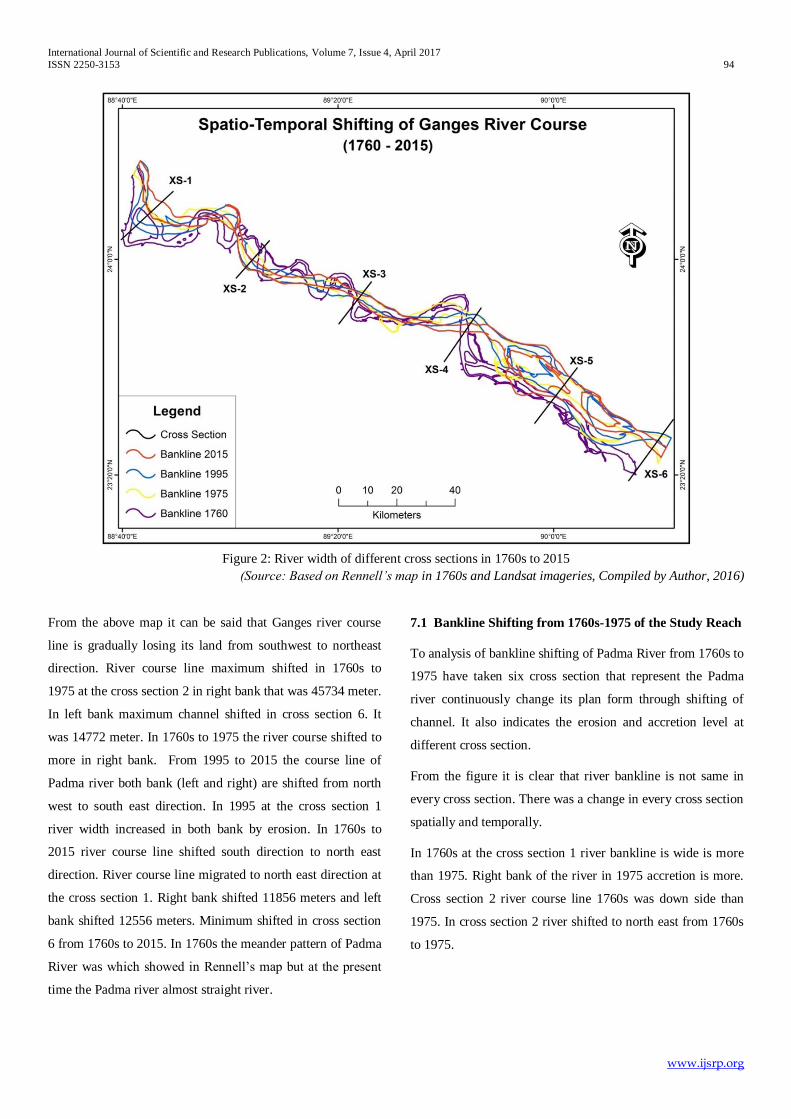
International Journal of Scientific and Research Publications, Volume 7, Issue 4, April 2017
ISSN 2250-3153 94
www.ijsrp.org
Figure 2: River width of different cross sections in 1760s to 2015
(Source: Based on Rennell’s map in 1760s and Landsat imageries, Compiled by Author, 2016)
From the above map it can be said that Ganges river course
line is gradually losing its land from southwest to northeast
direction. River course line maximum shifted in 1760s to
1975 at the cross section 2 in right bank that was 45734 meter.
In left bank maximum channel shifted in cross section 6. It
was 14772 meter. In 1760s to 1975 the river course shifted to
more in right bank. From 1995 to 2015 the course line of
Padma river both bank (left and right) are shifted from north
west to south east direction. In 1995 at the cross section 1
river width increased in both bank by erosion. In 1760s to
2015 river course line shifted south direction to north east
direction. River course line migrated to north east direction at
the cross section 1. Right bank shifted 11856 meters and left
bank shifted 12556 meters. Minimum shifted in cross section
6 from 1760s to 2015. In 1760s the meander pattern of Padma
River was which showed in Rennell’s map but at the present
time the Padma river almost straight river.
7.1 Bankline Shifting from 1760s-1975 of the Study Reach
To analysis of bankline shifting of Padma River from 1760s to
1975 have taken six cross section that represent the Padma
river continuously change its plan form through shifting of
channel. It also indicates the erosion and accretion level at
different cross section.
From the figure it is clear that river bankline is not same in
every cross section. There was a change in every cross section
spatially and temporally.
In 1760s at the cross section 1 river bankline is wide is more
than 1975. Right bank of the river in 1975 accretion is more.
Cross section 2 river course line 1760s was down side than
1975. In cross section 2 river shifted to north east from 1760s
to 1975.
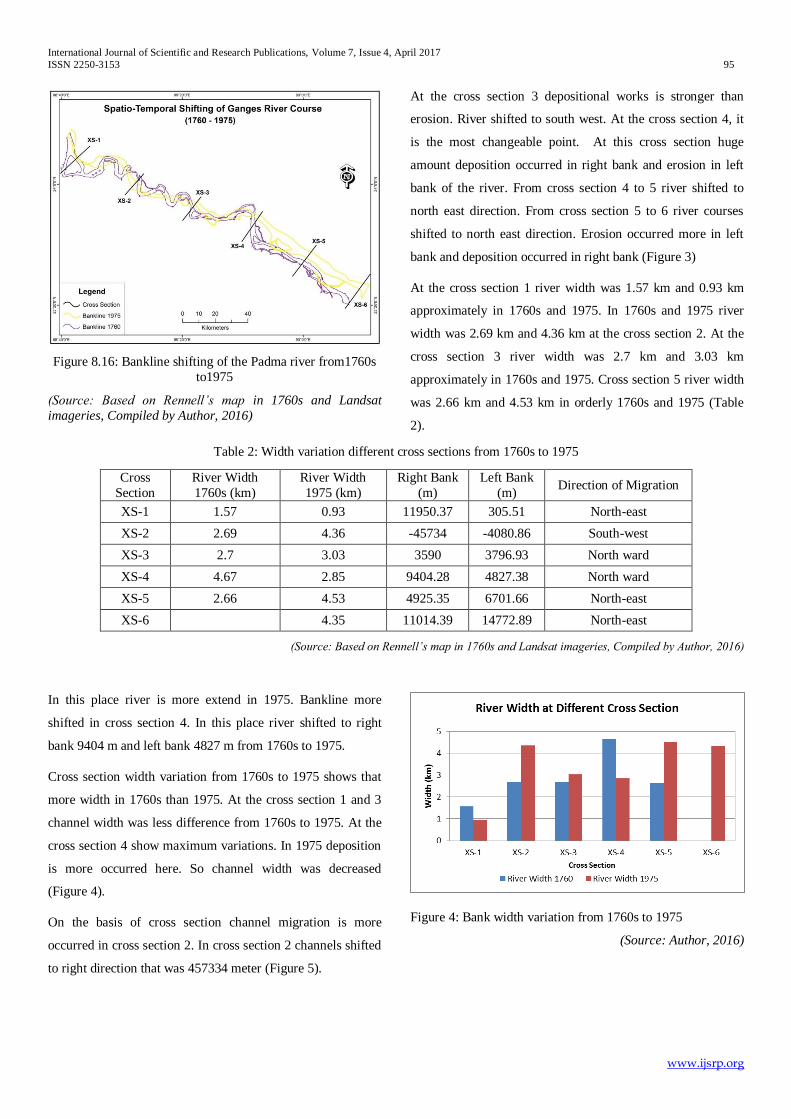
International Journal of Scientific and Research Publications, Volume 7, Issue 4, April 2017
ISSN 2250-3153 95
www.ijsrp.org
Figure 8.16: Bankline shifting of the Padma river from1760s
to1975
(Source: Based on Rennell’s map in 1760s and Landsat
imageries, Compiled by Author, 2016)
At the cross section 3 depositional works is stronger than
erosion. River shifted to south west. At the cross section 4, it
is the most changeable point. At this cross section huge
amount deposition occurred in right bank and erosion in left
bank of the river. From cross section 4 to 5 river shifted to
north east direction. From cross section 5 to 6 river courses
shifted to north east direction. Erosion occurred more in left
bank and deposition occurred in right bank (Figure 3)
At the cross section 1 river width was 1.57 km and 0.93 km
approximately in 1760s and 1975. In 1760s and 1975 river
width was 2.69 km and 4.36 km at the cross section 2. At the
cross section 3 river width was 2.7 km and 3.03 km
approximately in 1760s and 1975. Cross section 5 river width
was 2.66 km and 4.53 km in orderly 1760s and 1975 (Table
2).
Table 2: Width variation different cross sections from 1760s to 1975
Cross
Section
River Width
1760s (km)
River Width
1975 (km)
Right Bank
(m)
Left Bank
(m) Direction of Migration
XS-1 1.57 0.93 11950.37 305.51 North-east
XS-2 2.69 4.36 -45734 -4080.86 South-west
XS-3 2.7 3.03 3590 3796.93 North ward
XS-4 4.67 2.85 9404.28 4827.38 North ward
XS-5 2.66 4.53 4925.35 6701.66 North-east
XS-6
4.35 11014.39 14772.89 North-east
(Source: Based on Rennell’s map in 1760s and Landsat imageries, Compiled by Author, 2016)
In this place river is more extend in 1975. Bankline more
shifted in cross section 4. In this place river shifted to right
bank 9404 m and left bank 4827 m from 1760s to 1975.
Cross section width variation from 1760s to 1975 shows that
more width in 1760s than 1975. At the cross section 1 and 3
channel width was less difference from 1760s to 1975. At the
cross section 4 show maximum variations. In 1975 deposition
is more occurred here. So channel width was decreased
(Figure 4).
On the basis of cross section channel migration is more
occurred in cross section 2. In cross section 2 channels shifted
to right direction that was 457334 meter (Figure 5).
Figure 4: Bank width variation from 1760s to 1975
(Source: Author, 2016)
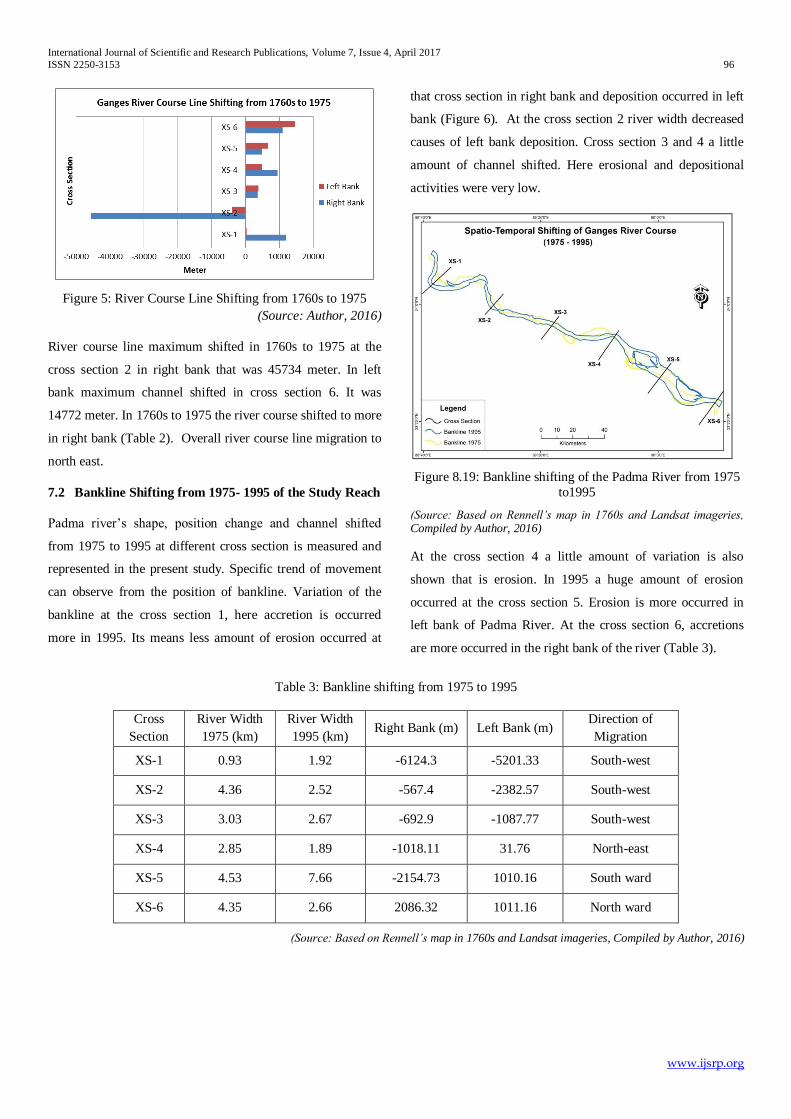
International Journal of Scientific and Research Publications, Volume 7, Issue 4, April 2017
ISSN 2250-3153 96
www.ijsrp.org
Figure 5: River Course Line Shifting from 1760s to 1975
(Source: Author, 2016)
River course line maximum shifted in 1760s to 1975 at the
cross section 2 in right bank that was 45734 meter. In left
bank maximum channel shifted in cross section 6. It was
14772 meter. In 1760s to 1975 the river course shifted to more
in right bank (Table 2). Overall river course line migration to
north east.
7.2 Bankline Shifting from 1975- 1995 of the Study Reach
Padma river’s shape, position change and channel shifted
from 1975 to 1995 at different cross section is measured and
represented in the present study. Specific trend of movement
can observe from the position of bankline. Variation of the
bankline at the cross section 1, here accretion is occurred
more in 1995. Its means less amount of erosion occurred at
that cross section in right bank and deposition occurred in left
bank (Figure 6). At the cross section 2 river width decreased
causes of left bank deposition. Cross section 3 and 4 a little
amount of channel shifted. Here erosional and depositional
activities were very low.
Figure 8.19: Bankline shifting of the Padma River from 1975
to1995
(Source: Based on Rennell’s map in 1760s and Landsat imageries, Compiled by Author, 2016)
At the cross section 4 a little amount of variation is also
shown that is erosion. In 1995 a huge amount of erosion
occurred at the cross section 5. Erosion is more occurred in
left bank of Padma River. At the cross section 6, accretions
are more occurred in the right bank of the river (Table 3).
Table 3: Bankline shifting from 1975 to 1995
Cross
Section
River Width
1975 (km)
River Width
1995 (km) Right Bank (m) Left Bank (m)
Direction of
Migration
XS-1 0.93 1.92 -6124.3 -5201.33 South-west
XS-2 4.36 2.52 -567.4 -2382.57 South-west
XS-3 3.03 2.67 -692.9 -1087.77 South-west
XS-4 2.85 1.89 -1018.11 31.76 North-east
XS-5 4.53 7.66 -2154.73 1010.16 South ward
XS-6 4.35 2.66 2086.32 1011.16 North ward
(Source: Based on Rennell’s map in 1760s and Landsat imageries, Compiled by Author, 2016)
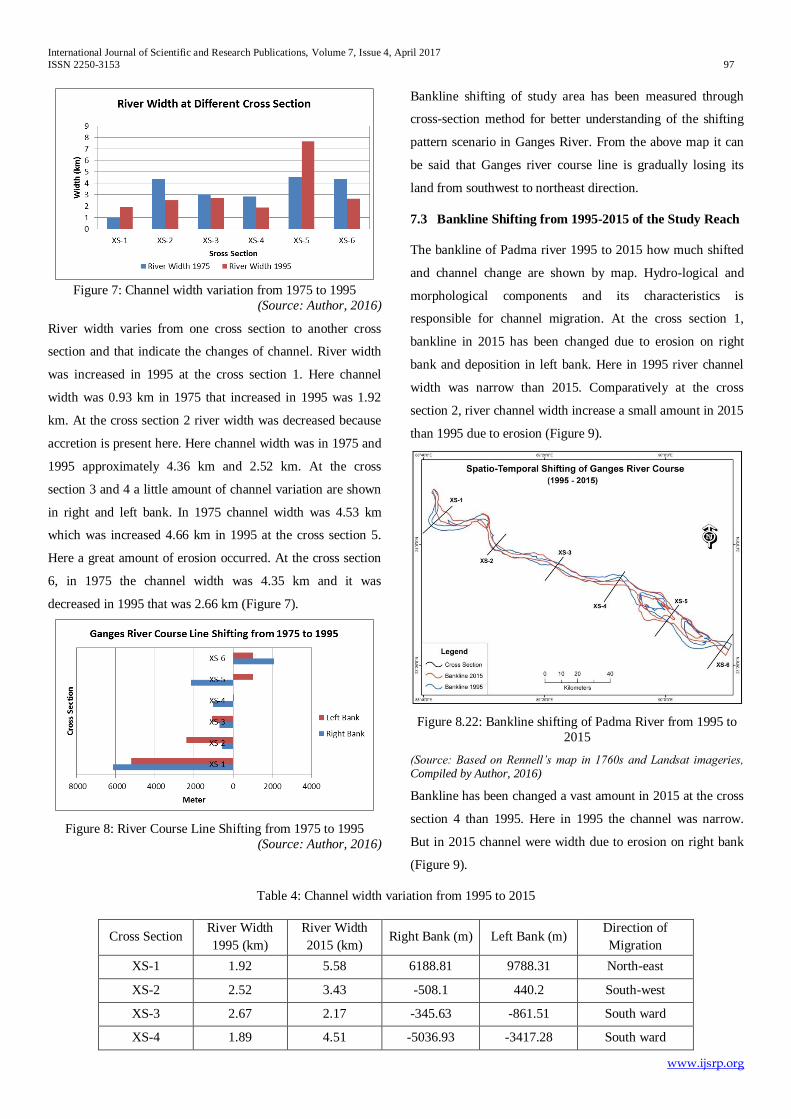
International Journal of Scientific and Research Publications, Volume 7, Issue 4, April 2017
ISSN 2250-3153 97
www.ijsrp.org
Figure 7: Channel width variation from 1975 to 1995
(Source: Author, 2016)
River width varies from one cross section to another cross
section and that indicate the changes of channel. River width
was increased in 1995 at the cross section 1. Here channel
width was 0.93 km in 1975 that increased in 1995 was 1.92
km. At the cross section 2 river width was decreased because
accretion is present here. Here channel width was in 1975 and
1995 approximately 4.36 km and 2.52 km. At the cross
section 3 and 4 a little amount of channel variation are shown
in right and left bank. In 1975 channel width was 4.53 km
which was increased 4.66 km in 1995 at the cross section 5.
Here a great amount of erosion occurred. At the cross section
6, in 1975 the channel width was 4.35 km and it was
decreased in 1995 that was 2.66 km (Figure 7).
Figure 8: River Course Line Shifting from 1975 to 1995
(Source: Author, 2016)
Bankline shifting of study area has been measured through
cross-section method for better understanding of the shifting
pattern scenario in Ganges River. From the above map it can
be said that Ganges river course line is gradually losing its
land from southwest to northeast direction.
7.3 Bankline Shifting from 1995-2015 of the Study Reach
The bankline of Padma river 1995 to 2015 how much shifted
and channel change are shown by map. Hydro-logical and
morphological components and its characteristics is
responsible for channel migration. At the cross section 1,
bankline in 2015 has been changed due to erosion on right
bank and deposition in left bank. Here in 1995 river channel
width was narrow than 2015. Comparatively at the cross
section 2, river channel width increase a small amount in 2015
than 1995 due to erosion (Figure 9).
Figure 8.22: Bankline shifting of Padma River from 1995 to
2015
(Source: Based on Rennell’s map in 1760s and Landsat imageries, Compiled by Author, 2016)
Bankline has been changed a vast amount in 2015 at the cross
section 4 than 1995. Here in 1995 the channel was narrow.
But in 2015 channel were width due to erosion on right bank
(Figure 9).
Table 4: Channel width variation from 1995 to 2015
Cross Section River Width
1995 (km)
River Width
2015 (km) Right Bank (m) Left Bank (m)
Direction of
Migration
XS-1 1.92 5.58 6188.81 9788.31 North-east
XS-2 2.52 3.43 -508.1 440.2 South-west
XS-3 2.67 2.17 -345.63 -861.51 South ward
XS-4 1.89 4.51 -5036.93 -3417.28 South ward

International Journal of Scientific and Research Publications, Volume 7, Issue 4, April 2017
ISSN 2250-3153 98
www.ijsrp.org
XS-5 7.66 8.21 -609.56 -61.38 South-west
XS-6 2.66 2.98 -3467.93 -3139.14 South-west
(Source: Based on Rennell’s map in 1760s and Landsat imageries, Compiled by Author, 2016)
The bankline width in 1995 was 7.66 km that increased was
8.21 km in 2015 at the cross section 5. At the cross section 6,
channel width increased a little amount in 2015 that was 2.98
km and 2.66 km was in 1995 (Table 4).
Figure 10: Channel width variation from 1995 to 2015
(Source: Author, 2016)
At the cross section 1, channel width in 1995 was 1.92 km and
5.58 km was in 2015. At the cross section 2, channel width
increased a little amount on left bank. Here channel width
was 2.52 km in 1995 and in 2015 was 3.43 km (Figure 10).
Figure 11: River Course Line shifting from 1995 to 2015
(Source: Author, 2016)
From the above map it can be said that Ganges river course
line is gradually losing its land from northeast to southwest
direction. From 1995 to 2015 the course line of Padma river
both bank (left and right) are shifted from north west to south
east direction. At the cross section 1 river width increased in
both bank by erosion.
7.4 Bankline Shifting from 1760s-2015 of the Study Reach
The channel of the Padma River undergoes changes in
response to morphological variation. The river exhibits
temporal changes in bankline setting as well as channel
configuration. Unique channel characteristics can observe
through the spatial-temporal dynamics of the study reach.
The bankline of Padma River more than 250 years from 1760s
to 2015 have shown (Figure 12).
Figure 8.25: Bankline variation from 1760s to 2015
(Source: Based on Rennell’s map in 1760s and Landsat imageries, Compiled by Author, 2016)
The migration of the Padma River shows that the mitting
point of the rivers has been changed into different direction
into different cross section. The main channel shifted one
place to another place day by day.
Bankline of 1760s has been changed in 2015 due to vast
erosion on the left bank and deposited in right bank at cross
section 1 (Figure 12). At the cross section 2 right bank were
eroded in 2015 and accorded in left bank. Bankline of 1760s
at the cross section 3 both side of the bank were eroded a vast
area in 2015. Bankline 1760s has been change in 2015 due to
erosion on left bank at the cross section 4. From the figure
changing nature of river pattern, its direction and bankline
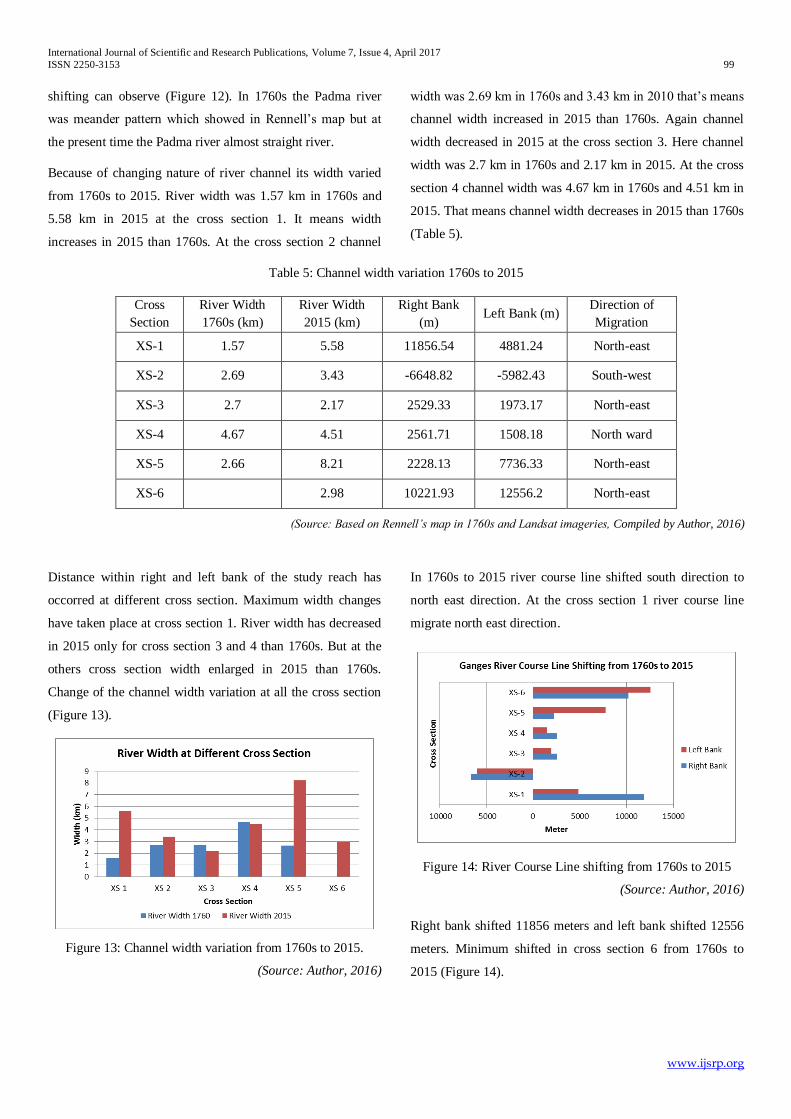
International Journal of Scientific and Research Publications, Volume 7, Issue 4, April 2017
ISSN 2250-3153 99
www.ijsrp.org
shifting can observe (Figure 12). In 1760s the Padma river
was meander pattern which showed in Rennell’s map but at
the present time the Padma river almost straight river.
Because of changing nature of river channel its width varied
from 1760s to 2015. River width was 1.57 km in 1760s and
5.58 km in 2015 at the cross section 1. It means width
increases in 2015 than 1760s. At the cross section 2 channel
width was 2.69 km in 1760s and 3.43 km in 2010 that’s means
channel width increased in 2015 than 1760s. Again channel
width decreased in 2015 at the cross section 3. Here channel
width was 2.7 km in 1760s and 2.17 km in 2015. At the cross
section 4 channel width was 4.67 km in 1760s and 4.51 km in
2015. That means channel width decreases in 2015 than 1760s
(Table 5).
Table 5: Channel width variation 1760s to 2015
Cross
Section
River Width
1760s (km)
River Width
2015 (km)
Right Bank
(m) Left Bank (m)
Direction of
Migration
XS-1 1.57 5.58 11856.54 4881.24 North-east
XS-2 2.69 3.43 -6648.82 -5982.43 South-west
XS-3 2.7 2.17 2529.33 1973.17 North-east
XS-4 4.67 4.51 2561.71 1508.18 North ward
XS-5 2.66 8.21 2228.13 7736.33 North-east
XS-6
2.98 10221.93 12556.2 North-east
(Source: Based on Rennell’s map in 1760s and Landsat imageries, Compiled by Author, 2016)
Distance within right and left bank of the study reach has
occorred at different cross section. Maximum width changes
have taken place at cross section 1. River width has decreased
in 2015 only for cross section 3 and 4 than 1760s. But at the
others cross section width enlarged in 2015 than 1760s.
Change of the channel width variation at all the cross section
(Figure 13).
Figure 13: Channel width variation from 1760s to 2015.
(Source: Author, 2016)
In 1760s to 2015 river course line shifted south direction to
north east direction. At the cross section 1 river course line
migrate north east direction.
Figure 14: River Course Line shifting from 1760s to 2015
(Source: Author, 2016)
Right bank shifted 11856 meters and left bank shifted 12556
meters. Minimum shifted in cross section 6 from 1760s to
2015 (Figure 14).
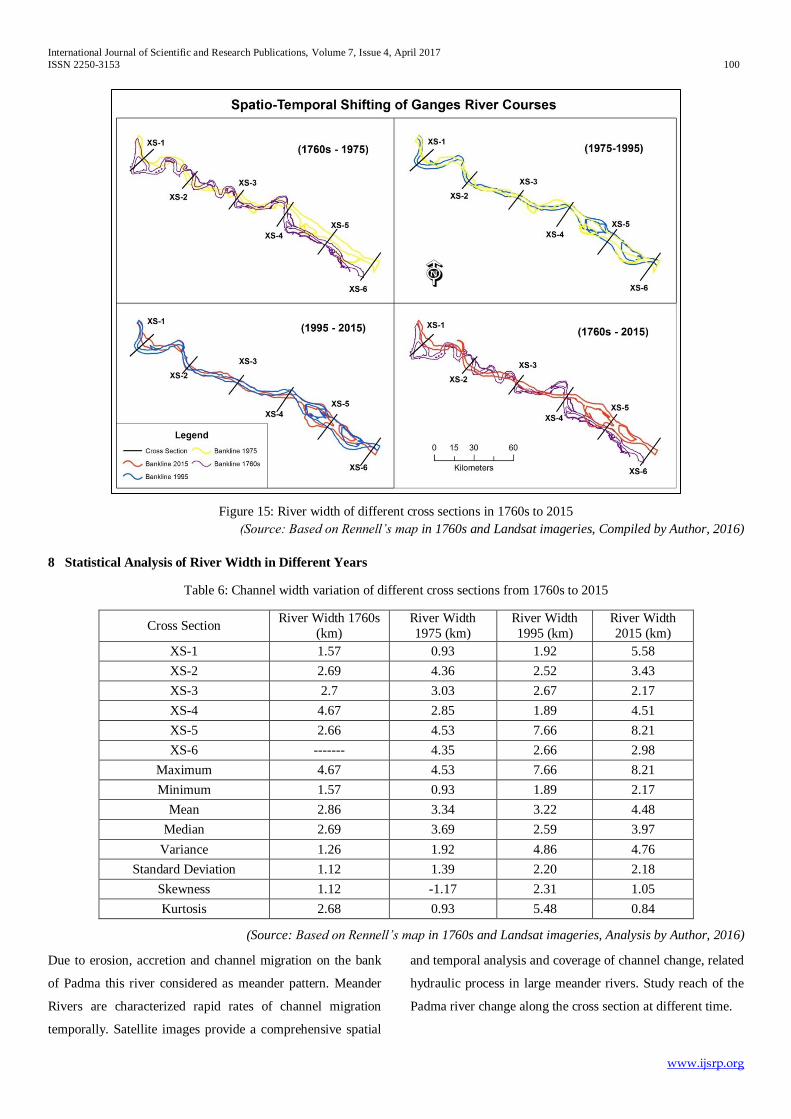
International Journal of Scientific and Research Publications, Volume 7, Issue 4, April 2017
ISSN 2250-3153 100
www.ijsrp.org
Figure 15: River width of different cross sections in 1760s to 2015
(Source: Based on Rennell’s map in 1760s and Landsat imageries, Compiled by Author, 2016)
8 Statistical Analysis of River Width in Different Years
Table 6: Channel width variation of different cross sections from 1760s to 2015
Cross Section River Width 1760s
(km)
River Width
1975 (km)
River Width
1995 (km)
River Width
2015 (km)
XS-1 1.57 0.93 1.92 5.58
XS-2 2.69 4.36 2.52 3.43
XS-3 2.7 3.03 2.67 2.17
XS-4 4.67 2.85 1.89 4.51
XS-5 2.66 4.53 7.66 8.21
XS-6 ------- 4.35 2.66 2.98
Maximum 4.67 4.53 7.66 8.21
Minimum 1.57 0.93 1.89 2.17
Mean 2.86 3.34 3.22 4.48
Median 2.69 3.69 2.59 3.97
Variance 1.26 1.92 4.86 4.76
Standard Deviation 1.12 1.39 2.20 2.18
Skewness 1.12 -1.17 2.31 1.05
Kurtosis 2.68 0.93 5.48 0.84
(Source: Based on Rennell’s map in 1760s and Landsat imageries, Analysis by Author, 2016)
Due to erosion, accretion and channel migration on the bank
of Padma this river considered as meander pattern. Meander
Rivers are characterized rapid rates of channel migration
temporally. Satellite images provide a comprehensive spatial
and temporal analysis and coverage of channel change, related
hydraulic process in large meander rivers. Study reach of the
Padma river change along the cross section at different time.
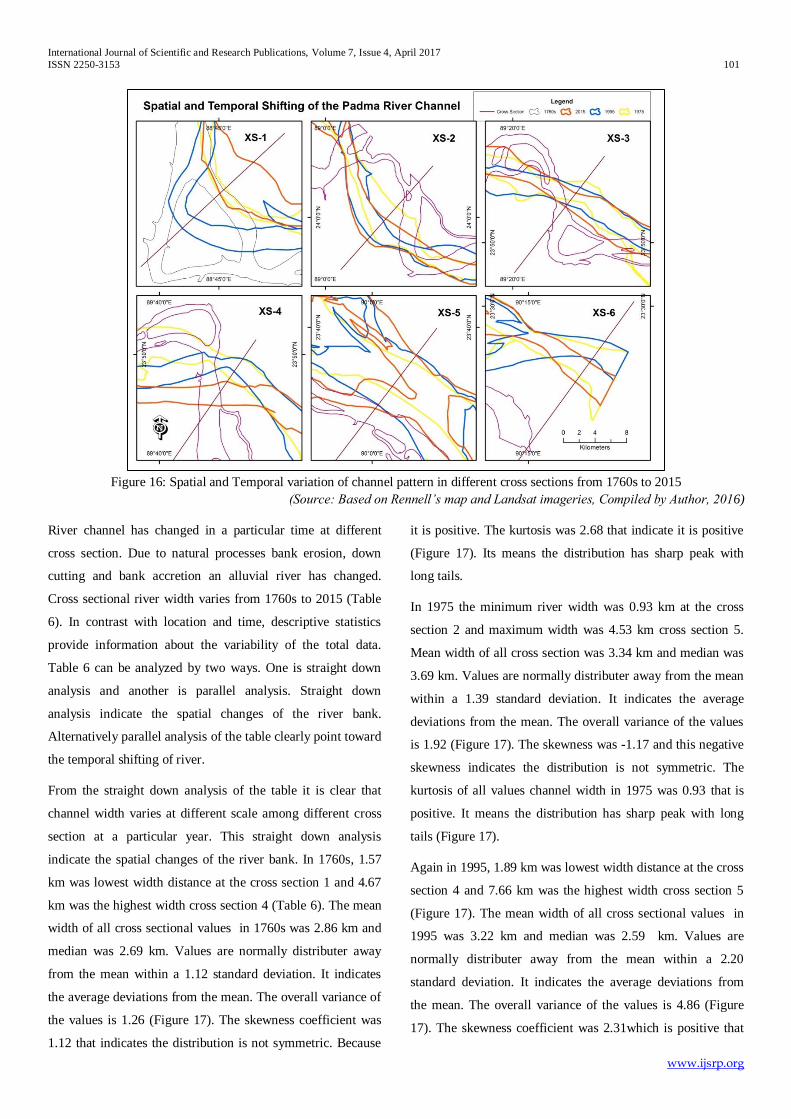
International Journal of Scientific and Research Publications, Volume 7, Issue 4, April 2017
ISSN 2250-3153 101
www.ijsrp.org
Figure 16: Spatial and Temporal variation of channel pattern in different cross sections from 1760s to 2015
(Source: Based on Rennell’s map and Landsat imageries, Compiled by Author, 2016)
River channel has changed in a particular time at different
cross section. Due to natural processes bank erosion, down
cutting and bank accretion an alluvial river has changed.
Cross sectional river width varies from 1760s to 2015 (Table
6). In contrast with location and time, descriptive statistics
provide information about the variability of the total data.
Table 6 can be analyzed by two ways. One is straight down
analysis and another is parallel analysis. Straight down
analysis indicate the spatial changes of the river bank.
Alternatively parallel analysis of the table clearly point toward
the temporal shifting of river.
From the straight down analysis of the table it is clear that
channel width varies at different scale among different cross
section at a particular year. This straight down analysis
indicate the spatial changes of the river bank. In 1760s, 1.57
km was lowest width distance at the cross section 1 and 4.67
km was the highest width cross section 4 (Table 6). The mean
width of all cross sectional values in 1760s was 2.86 km and
median was 2.69 km. Values are normally distributer away
from the mean within a 1.12 standard deviation. It indicates
the average deviations from the mean. The overall variance of
the values is 1.26 (Figure 17). The skewness coefficient was
1.12 that indicates the distribution is not symmetric. Because
it is positive. The kurtosis was 2.68 that indicate it is positive
(Figure 17). Its means the distribution has sharp peak with
long tails.
In 1975 the minimum river width was 0.93 km at the cross
section 2 and maximum width was 4.53 km cross section 5.
Mean width of all cross section was 3.34 km and median was
3.69 km. Values are normally distributer away from the mean
within a 1.39 standard deviation. It indicates the average
deviations from the mean. The overall variance of the values
is 1.92 (Figure 17). The skewness was -1.17 and this negative
skewness indicates the distribution is not symmetric. The
kurtosis of all values channel width in 1975 was 0.93 that is
positive. It means the distribution has sharp peak with long
tails (Figure 17).
Again in 1995, 1.89 km was lowest width distance at the cross
section 4 and 7.66 km was the highest width cross section 5
(Figure 17). The mean width of all cross sectional values in
1995 was 3.22 km and median was 2.59 km. Values are
normally distributer away from the mean within a 2.20
standard deviation. It indicates the average deviations from
the mean. The overall variance of the values is 4.86 (Figure
17). The skewness coefficient was 2.31which is positive that
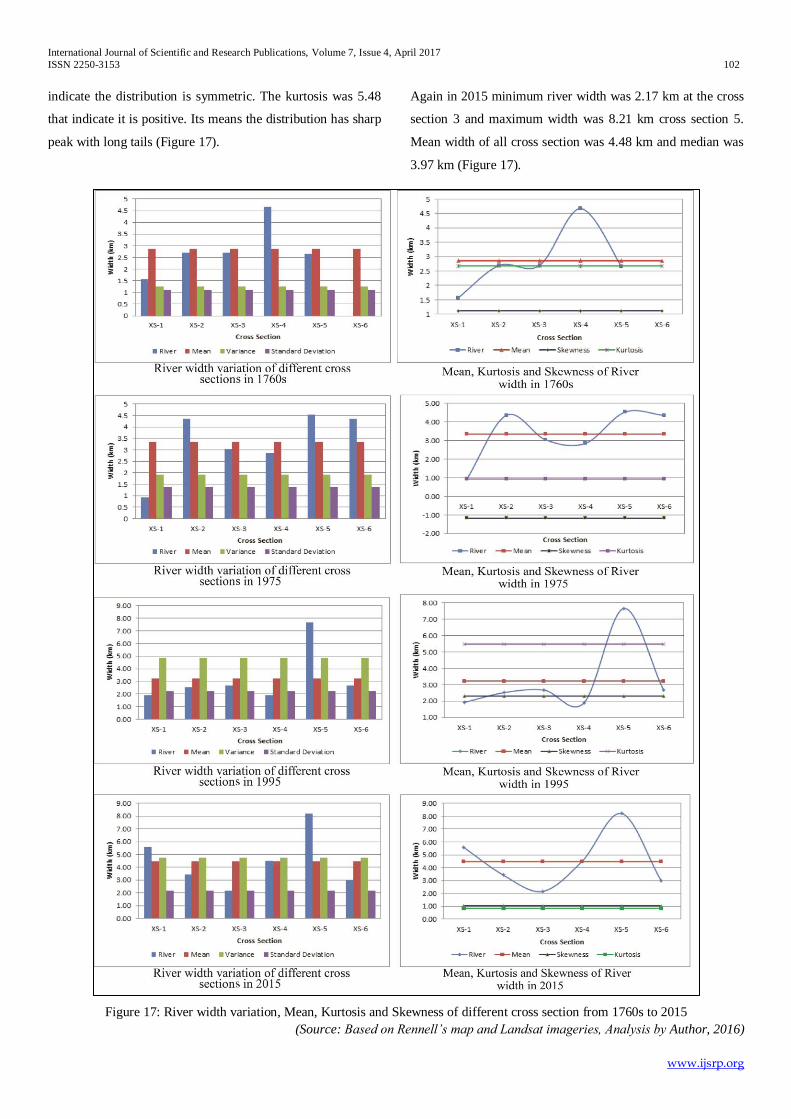
International Journal of Scientific and Research Publications, Volume 7, Issue 4, April 2017
ISSN 2250-3153 102
www.ijsrp.org
indicate the distribution is symmetric. The kurtosis was 5.48
that indicate it is positive. Its means the distribution has sharp
peak with long tails (Figure 17).
Again in 2015 minimum river width was 2.17 km at the cross
section 3 and maximum width was 8.21 km cross section 5.
Mean width of all cross section was 4.48 km and median was
3.97 km (Figure 17).
Figure 17: River width variation, Mean, Kurtosis and Skewness of different cross section from 1760s to 2015
(Source: Based on Rennell’s map and Landsat imageries, Analysis by Author, 2016)
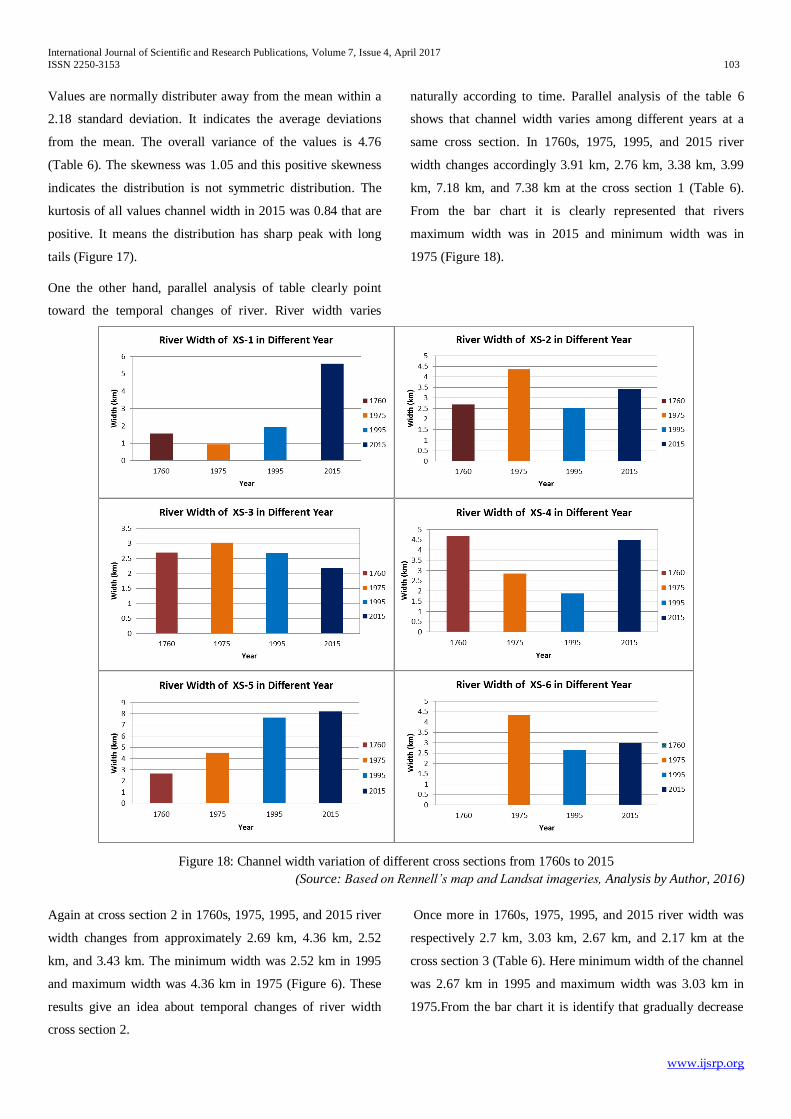
International Journal of Scientific and Research Publications, Volume 7, Issue 4, April 2017
ISSN 2250-3153 103
www.ijsrp.org
Values are normally distributer away from the mean within a
2.18 standard deviation. It indicates the average deviations
from the mean. The overall variance of the values is 4.76
(Table 6). The skewness was 1.05 and this positive skewness
indicates the distribution is not symmetric distribution. The
kurtosis of all values channel width in 2015 was 0.84 that are
positive. It means the distribution has sharp peak with long
tails (Figure 17).
One the other hand, parallel analysis of table clearly point
toward the temporal changes of river. River width varies
naturally according to time. Parallel analysis of the table 6
shows that channel width varies among different years at a
same cross section. In 1760s, 1975, 1995, and 2015 river
width changes accordingly 3.91 km, 2.76 km, 3.38 km, 3.99
km, 7.18 km, and 7.38 km at the cross section 1 (Table 6).
From the bar chart it is clearly represented that rivers
maximum width was in 2015 and minimum width was in
1975 (Figure 18).
Figure 18: Channel width variation of different cross sections from 1760s to 2015
(Source: Based on Rennell’s map and Landsat imageries, Analysis by Author, 2016)
Again at cross section 2 in 1760s, 1975, 1995, and 2015 river
width changes from approximately 2.69 km, 4.36 km, 2.52
km, and 3.43 km. The minimum width was 2.52 km in 1995
and maximum width was 4.36 km in 1975 (Figure 6). These
results give an idea about temporal changes of river width
cross section 2.
Once more in 1760s, 1975, 1995, and 2015 river width was
respectively 2.7 km, 3.03 km, 2.67 km, and 2.17 km at the
cross section 3 (Table 6). Here minimum width of the channel
was 2.67 km in 1995 and maximum width was 3.03 km in
1975.From the bar chart it is identify that gradually decrease
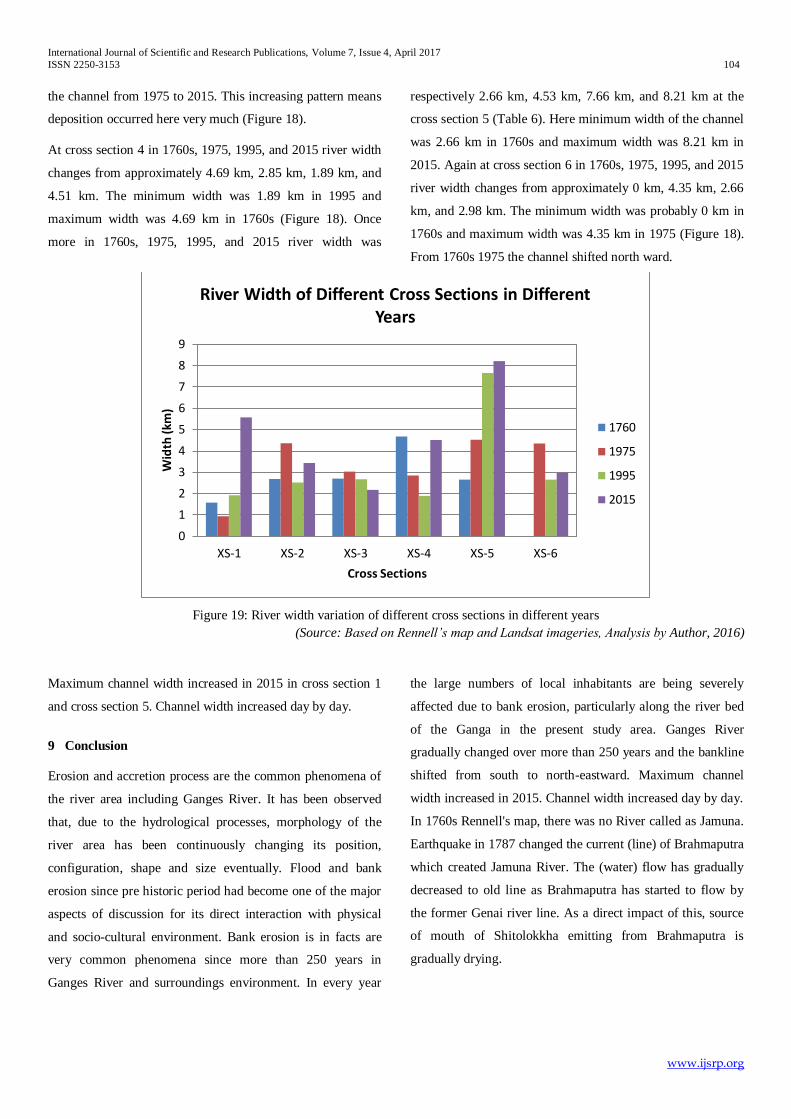
International Journal of Scientific and Research Publications, Volume 7, Issue 4, April 2017
ISSN 2250-3153 104
www.ijsrp.org
the channel from 1975 to 2015. This increasing pattern means
deposition occurred here very much (Figure 18).
At cross section 4 in 1760s, 1975, 1995, and 2015 river width
changes from approximately 4.69 km, 2.85 km, 1.89 km, and
4.51 km. The minimum width was 1.89 km in 1995 and
maximum width was 4.69 km in 1760s (Figure 18). Once
more in 1760s, 1975, 1995, and 2015 river width was
respectively 2.66 km, 4.53 km, 7.66 km, and 8.21 km at the
cross section 5 (Table 6). Here minimum width of the channel
was 2.66 km in 1760s and maximum width was 8.21 km in
2015. Again at cross section 6 in 1760s, 1975, 1995, and 2015
river width changes from approximately 0 km, 4.35 km, 2.66
km, and 2.98 km. The minimum width was probably 0 km in
1760s and maximum width was 4.35 km in 1975 (Figure 18).
From 1760s 1975 the channel shifted north ward.
Figure 19: River width variation of different cross sections in different years
(Source: Based on Rennell’s map and Landsat imageries, Analysis by Author, 2016)
Maximum channel width increased in 2015 in cross section 1
and cross section 5. Channel width increased day by day.
9 Conclusion
Erosion and accretion process are the common phenomena of
the river area including Ganges River. It has been observed
that, due to the hydrological processes, morphology of the
river area has been continuously changing its position,
configuration, shape and size eventually. Flood and bank
erosion since pre historic period had become one of the major
aspects of discussion for its direct interaction with physical
and socio-cultural environment. Bank erosion is in facts are
very common phenomena since more than 250 years in
Ganges River and surroundings environment. In every year
the large numbers of local inhabitants are being severely
affected due to bank erosion, particularly along the river bed
of the Ganga in the present study area. Ganges River
gradually changed over more than 250 years and the bankline
shifted from south to north-eastward. Maximum channel
width increased in 2015. Channel width increased day by day.
In 1760s Rennell's map, there was no River called as Jamuna.
Earthquake in 1787 changed the current (line) of Brahmaputra
which created Jamuna River. The (water) flow has gradually
decreased to old line as Brahmaputra has started to flow by
the former Genai river line. As a direct impact of this, source
of mouth of Shitolokkha emitting from Brahmaputra is
gradually drying.
0
1
2
3
4
5
6
7
8
9
XS-1 XS-2 XS-3 XS-4 XS-5 XS-6
Wid
th (
km)
Cross Sections
River Width of Different Cross Sections in Different Years
1760
1975
1995
2015

International Journal of Scientific and Research Publications, Volume 7, Issue 4, April 2017
ISSN 2250-3153 105
www.ijsrp.org
References
CEGIS (2004), Identification of the Different Types of Bank Materials Along
the Padma River, prepared within the framework of the Padma
Bridge feasibility study GIS, prepared for EMIN project of WARPO
and JMREM project of BWDB
Chattopadhyay S.S., (2003). Ravaged by a river.Frontline, 20: September 27 -
October 10, 2003, Chennai, India.
Department of Ecology, 2015:
http://www.ecy.wa.gov/programs/sea/sma/cma/page17_appendix.html
(access on 10.08. 2015)
Elahi, K.M. Ahmed, K.S. and Mafizuddin, M. (eds.) (1991). Riverbank
Erosion, Flood and Population Displacement in Bangladesh. Dhaka:
River Bank Erosion Impact Study, Jahangirnagar University.
Esri, (2009). Esri official website: http://www.esri.com
Gupta, N. (2012), Channel Plan form Dynamics of the Ganga-Padma System,
India, Faculty of Social and Human Sciences, University of
Southampton.
Hasnain, S.I., Thayyen R.J., (1999). Discharge and suspended-sediment
concentration of meltwaters, draining from the Dokriani glacier,
Garhwal Himalaya, India. Journal of Hydrology 218: 191 -198. DOI:
10.1016/s0022-1694(99)00033-5.
IRIN, (2008). Water Development Board. Bangladesh: River bank erosion
affects economy. IRIN 30th April, 2008. River bank erosion related
information is available on:
http://www.irinnews.org/report.aspx?ReportId=74443
Islam, F. and Rashid, B., (2011), riverbank erosion displaces in Bangladesh:
need for institutional response and policy intervention, Bangladesh
Journal of Bioethics, 2011; 2(2): 4-19.
Meybeck M. (1976). Total mineral dissolved transport by world major rivers.
Hydrol. Sci. Bull. 21: 265–284. DOI: 10.1080/02626667609491631.
Milliman,J.D. and Meade,R.H.(1983): World-wide delivery of river sediment
to the oceans. Journal of Geology, 91(1), 1-21.
Milliman, J.D., Syvitski, P.M., (1992). Geomorphic/tectonic control of
sediment discharge to the ocean: the importance of small
mountainous rivers. J. Geol. 100.
Nippon Koei UK; BMT Conrdah Ltd.. (2005). Environmental impact
assessment. United Kingdom; Nippon Koei / BMT Cordah Ltd.
Nippon Koei UK; BMT Conrdah Ltd.. (2005). Environmental impact
assessment. United Kingdom; Nippon Koei / BMT Cordah Ltd.
Rennell, J. (1779), Atlas of Bengal and Bahar in VIII Parts. London: act of
Parliament.
Rennell, J., (1788). Memoir of a map of Hindoostan. London
Rudra, K., (2014), Changing river courses in the western part of the Ganga
Brahmaputra delta, Geomorphology, 227 (2014) 87–100
Sarker M. H., (2004). Impact of upstream human interventions on the
morphology of the Ganges-Gorai system. In The Ganges Water
Diversion: Environmental Effects and Implications, Mirza MMQ
(ed). Kluwer Academic Publishers: The Netherlands; 49-80.
USGS, 2015 official website: http://www.usgs.gov/
Wikipedia, (2016), https://en.wikipedia.org/wiki/List_of_lakes_by_depth
Authors
Nusrat Jahan Ety
Postgraduate Research Student,
Department of Geography and Environment,
Jahangirnagar University,
Savar, Dhaka, Bangladesh.
E-mail: [email protected]
Dr. Md. Shahedur Rashid
Professor,
Department of Geography and Environment,
Jahangirnagar University;
Savar, Dhaka, Bangladesh
E-mail: [email protected]
International Journal of Scientific and Research Publications, Volume 7, Issue 4, April 2017 106 ISSN 2250-3153
www.ijsrp.org
Family perspectives on end-of-life care in a tertiary care medical facility of Sri Lanka
DRRHB Dissanayake*, HKMMB Kavisekara**, KSCK Dissanayake***, WKS Kularatne*
*Department of Medicine, General Hospital Kandy, Sri Lanka. ** Ministry of Health – Sri Lanka/ London Metropolitan University ***Department of Cardiology, General Hospital Kandy, Sri Lanka.
Abstract- Majority of deaths occur in hospital in modern era and most of them are due to chronic non-communicable diseases. End-of-life care has significant impact on overall image of care and the impression of health care services among family members. The study looked at theFamily perspectives on end-of-life care in a tertiary care medical facility of Sri Lanka. Questionnaire used was adapted from previously published and validated instrument called Quality of Dying and Death (QODD) is used. Five aspects of end-of-life care was assessed. Results of the family survey showed that significant shortcomings on the care at the end of life with regards to all 5 aspects of care assessed.It was recommended to introduce training on end of life care for everyone in the health care team. Index Terms- Family Perspective, End of Life Care, Terminal Care, Quality of Care
I. INTRODUCTION ncreasingly deaths occurring at hospital setting has shown marked rise against the deaths occurring at home. With the
improvement of health care in Sri Lanka, the life expectancy is increasing. With the ageing population, there is a significant increase in chronic diseases such as cardiovascular disease, diabetes mellitus, chronic pulmonary diseases and cancers. Health care system of the island is faced with the challenge of caring older, dying patients with those co-morbid conditionswhen compared to the past where communicable diseases contributed to significant mortality. Good end of life care depends on the effective delivery following five aspects of care, namely (1) provision of desired physical comfort and emotional support to dying person, (2) supported shared decision making, (3) treating the dying with respect, (4) provision of emotional needs of the family/next of kin,(5) provision of coordinated care. Although there are number of studies done on care at birth, there are no studies done on end-of –life care in Sri Lanka. Perception of the family members or next of kin of the deceased is used worldwide as one way of assessing the end of life care.This study is designed to consider some aspects of quality of care delivered at hospital setting for those dying with chronic illness.
II. LITERATURE REVIEW Most of the currently available data on end of life care come from studies done in Europe and America. A study in United States in 2000by Joan M et al;revealed that many people dying in institutions have unmet needs for symptom amelioration, physician communication, emotional support and being treated with respect [1].In addition, they observed that family members of the decedents who received care at home with hospice services were more likely to report a favorable dying experience [1]. A more recent study in Netherlands by Rik T. et al; involving the Intensive Care Unit (ICU) patients revealed a generally good perception of quality of dying at Dutch ICUs [2]. But in the Dutch study the majority of family members believed final decision were made by physician alone after giving information. However, there was an issue with the questionnaire used in the study being considered difficult by the family members [2]. Study byFrench RESSENTI Group described discrepancies in perceptions between physicians and nursing staff of ICU end of life decisions [3]. Recommendations from Royal College of Physicians’ palliative and National end-of-life care program indicated need for specialized system for end-of-life care in the UK [4].
III. OBJECTIVES AND METHODOLOGY Objectives Evaluate the experience at end–of–life care of those who die at hospital, from the experiences of the relatives. Methodology Study design Mortality follow back survey of family members and other knowledgeable informants was designed to assess their experiences of deaths from chronic illness of those patients dying at Medical Units, Teaching Hospital Kandy for a period of one year starting from May 2013. Study setting Medical Units, Teaching Hospital, Kandy for a period of one year starting from 3rdMay 2013. Criteria for Eligibility
I

International Journal of Scientific and Research Publications, Volume 7, Issue 4, April 2017 107 ISSN 2250-3153
www.ijsrp.org
Family members or next of kin of all the patients dying of chronic illnesses at medical units (including patients dying at Intensive care under the care of general medical teams) of Teaching Hospital Kandy were recruited for the study starting from 3rd May 2013 for period of one year.Patients with their last stay at hospital of over 48 hours were enrolled in the study. Sampling method All those who fulfilled the eligibility criteria were enrolled into the study subjected to their consent for interviewing. Exclusion criteria The following were excluded from study. If • Patients dying were under 18 years of age, • Family member/s interviewed were under 18 years of age, • Family member/s of the patients who died as a result of
trauma/suicide. • Family member/s next of kin who did notconsent or who
were not contactable through telephone. Study Instrument Questionnaire used was adapted from previously published and validated instrument called Quality of Dying and Death (QODD) is used [5, 6]. (Annexure 1). Questionnaire translated to Sinhala and Tamil and back translated to English by native English and Tamil speakers. Main out-come measures Patient and family-centered end-of-life care outcomes including whether healthcare workers
1. Provided the desired physical comfort and emotional support to the dying person.
2. Supported the shared decision making 3. Treated the dying person with respect 4. Attended to the emotional needs of the family 5. Provided the coordinated care
Method of data collection Interviewers trained in telephone conversations for the data collection were used and interview was timed at 4 to 8 weeks after the death of the patient. Contact details of family member/ next of kin and the consent for the interview wasobtained at the time of issuing of declaration of Death Certificate from the medical units of the hospital. Interviews carried out in Sinhala or Tamil languages as per the interviewee preference by a native speaker. Two medical graduates other than the principle investigator were trained in the data collection by telephone interviews. A translated version of the attached validated questionnaire was used as per the language used. Ethical clearance Ethical approval for the study was obtained from Ethical Review Committee of Teaching Hospital Kandy on 2nd May 2013.
IV. RESULTS Total number of 107 telephone interviews with family members performed during the study period. Among the family members 17.8 % felt that the doctors could have done more during the last month to relieve symptoms of their deceased relative.
21.5% of the interviewees felt that the nurse attending could have done more to help to control symptoms.
Frequency Percent No 84 78.5
Yes 23 21.5 Total 107 100.0
14 of them (13.1%) felt their deceased had to wait too long to get treated for the symptoms.
Frequency Percent No 93 86.9
Yes 14 13.1 Total 107 100.0
Analysis of questions on advanced directives revealed only 2 (1.9%) of the deceased had signed living will and there were no one with power of attorney for health care of their loved one. Only 2(1.9%) had reported that they had discussed issues of death prior the death with the deceased.
Frequency Percent No 105 98.1
Yes 2 1.9 Total 107 100.0
11.2% of families felt none of their loved one’s preferences for medical care were met and 47.7% of them felt some of the care preferences were met. 36.4% felt good amount of the care preferences were met. Only 5 (4.7% of total) interviewees felt it was very good.
Frequency Percent None 12 11.2
Some 51 47.7 Good 39 36.4 Very Good 5 4.7 Total 107 100.0
Frequency Percent No 88 82.2
Yes 19 17.8 Total 107 100.0

International Journal of Scientific and Research Publications, Volume 7, Issue 4, April 2017 108 ISSN 2250-3153
www.ijsrp.org
Involvement of family in decision making
39.3% of the families felt they were not involved by the health care team in taking treatment decisions. Some involvement was reported by 42.1% and 18.7% felt their involvement is good in treatment decisions.
Frequency Percent None 42 39.3
Some 45 42.1 Good 20 18.7 Total 107 100.0
In the survey 39.3% responders said that healthcare team fared worse in listening to family and only 11.2 % said they were best listened.
Frequency Percent Worse 42 39.3
Average 37 34.6 Good 16 15.0 Best 12 11.2 Total 107 100.0
Explaining the condition to family by the health care team was considered good by 17.8 % and best by 9.3% respectively
Frequency Percent Worse 42 39.3
Average 36 33.6 Good 19 17.8 Best 10 9.3 Total 107 100.0
Prior communication about what would happen in the final hour of deceased’s life by the health care team was mentioned
positively by 43% of the responders, with 57% responding negatively.
Frequency Percent No 61 57.0
Yes 46 43.0 Total 107 100.0
For the query about awareness of a doctor who is primarily responsible of the care of the deceased 53.3% has said no, indicating majority was unaware about the primarily responsible clinician.
Frequency Percent No 57 53.3
Yes 50 46.7 Total 107 100.0
Frequency Percent No 96 89.7
Yes 11 10.3 Total 107 100.0
82% of the families said a member of healthcare team familiar with the deceased was available during the weekend and during night in case of any problem arises.
Frequency Percent No 25 23.4
Yes 82 76.6 Total 107 100.0
V. DISCUSSION Among the 107 cases of deaths analyzed for the study majority reported reasonable control of symptoms at during the last days of life however 13.4%of familiesreported a significant delay in receiving treatment for symptom control. This seems to be similar to the results of the American study by the Joan M and others [1]where they had reported 19.3% and 18.9% of responses of lack of help in pain and dyspnea control respectively. However,for questions whether the doctor and nurse attending could have done more to relieve symptoms, therewas a discrepancy in response with more responders saying that nurses could have done more than number who said the doctors could have done more. On the communication and shared decision making in the American study 27% had concerns about communication and our analysis showed more poorer performance with 39% saying health care team did worse on explaining the condition to them. Approximately one quarter (27.1%) of the responders said they were well explained about the condition of the deceased [1]. Comparing with the Dutch ICU study by Rik T et alwhere a similar questionnaire was used, most families (62%) reported that they were well included in the decision making whereas our

International Journal of Scientific and Research Publications, Volume 7, Issue 4, April 2017 109 ISSN 2250-3153
www.ijsrp.org
results showed only 18.7% of them feeling good about their involvement in treatment decisions.[2] However the study populations in the two instances was quite different with Dutch study only recruited those who were treated in ICU where as our sample included a mixed group of ICU and ward patients, of them majority were cared only in the ward. Information about what to expect in the last hour of dying 57% of families in the study reported not having any information and comparatively American study 50% had concerns about the information about what to expect while patient was dying [1]. Awareness of the family members about a responsible clinician was low with less than half reported they knew who the responsible doctor for the care of their deceased patient. Questions on coordinated care the responses were poorer than the American study in which 15.4% Americans reported issues with carer not knowing the medical history of the patient while in this study 23.4% said that there were no one familiar with the patient available during nights and weekend [1].
VI. CONCLUSION AND RECOMMENDATION Results of the family survey showed that significant shortcomings on the care at the end of life with regards to all 5 aspects of care assessed namely (1) provision of desired physical comfort and emotional support to dying person, (2) supported shared decision making, (3) treating the dying with respect, (4) provision of emotional needs of the family/next of kin, (5) provision of coordinated care. The observations were worse than the studies done in the United States and Europe particularly in shared decision making, attending to needs of the family and in provision coordinated care. There is a need for training on end of life care for everyone in the health care team. More studies needed to assess the knowledge and attitude of health care workers about the end of care, in order plan for future programs to improve the standards of care of those dying in our hospitals.Also, further studies involving more centersrepresenting all regions of the island is needed to assess the perception of care at End of life nationally.
ABBREVIATIONS ICU – Intensive care unit
QODD – Questionnaire on quality of Dying and Death UK – United Kingdom
REFERENCES [1] Joan MT,Brian RC, Virginia C,et al.Family Perspectives on End-of-Life
Care at the Last Place of Care. JAMA. 2004; 291:88-93. [2] Rik TG, José GMH, Koopmansn M, et al. Perception by Family Members
and ICU Staff of the Quality of Dying and Death in the ICU. CHEST. 2013;143:357-363.
[3] Ferrand E, Lemaire F, Regnier B, et al; French RESSENTI Group. Discrepancies between perceptions by physicians and nursing staff of intensive care unit end-of-life decisions. American Journal of Respiratory and Critical Care Medicine.2003 ; 167: 1310 - 1315
[4] Report of a working party of the Royal College of Physicians, the Association for Palliative Medicine and National End of Life Care Programme. Improving end-of-life care: recommendations on professional development for physicians.Clinical Medicine.2012; Vol 12, No 2: 108–10
[5] Mularski R, Curtis JR, Osborne M, Engelberg RA, Ganzini L.Agreement among family members in their assessment of the Quality of Dying and Death . Journal of Pain and Symptom Management. 2004 ; 28: 306 - 315
[6] Curtis JR, Patrick DL, Engelberg RA, Norris K, Asp C, Byock I. A measure of the quality of dying and death. Initial validation using after-death interviews with family members. Journal of Painand Symptom Management. 2002 ; 24 : 17 – 31
AUTHORS First Author – Dr. H. K. M. M. B. Kavisekara – Corresponding Author, MBBS (Peradeniya), MSc – Medical Administration (Colombo), MBA (Cardiff - UK), Medical Director /Doctoral Trainee, Ministry of Health - Sri Lanka/ London Metropolitan University – United Kingdom, [email protected], [email protected] Second Author – Dr D R R H B Dissanyake – Primary Author MBBS (Peradeniya), MD – Medicine (Colombo), Consultant Physician, Ministry of Health - Sri Lanka, [email protected] Third Author – Dr W K S Kularatne – Primary Author MBBS (Peradeniya), MD – Medicine (Colombo), Consultant Physician, Ministry of Health - Sri Lanka Fourth Author – Dr KSCK Dissanayake, MBBS (Peradeniya) Medical Officer, Ministry of Health - Sri Lanka
International Journal of Scientific and Research Publications, Volume 7, Issue 4, April 2017 110 ISSN 2250-3153
www.ijsrp.org
The influence of grazed grassland in productivity on Indian grassland (Bilaspur, Chhattisgarh)
Baldau Prasad Dadsena1, Dr.M.L.Jaiswal2
1_(Lecturer(P)G.H.S.S.Katgi,Baloda Bazar (Chhattisgarh)) E-Mail: [email protected]
2_(Assistant Professor,D.P.V.P.G. College Bilaspur (Chhattisgarh)) Abstract- The grazed grasslands of the India are an important resource as it contributes environmentally, economically but also in social development of the country. In the current growing industrialization the effective use land and continuous degradation in the grassland productivity has become one of the prime concerns for the country. In this study the primary productivity of a Grazed grassland commune located at Kota of Bilaspur district, Chhattisgarh lies between 21047’ to 2308’ North latitude and 81014’ to 83015’ East longitude have been considered. A quadrate of 0.25 gm-2 is used for sampling the above ground plant parts and size of quadrate is determined by Species Area Curve Method. The grassland community comprised of 13 species (7 were grasses and 6 were non-grasses). Bothriochloa Pertusa, Cynodon dactylon, dactyloctenium aegyptium, and eragrastris mutan among the grasses and Alternanthera sessilis, Alycicarpus Monilifer, Desmodium Trifloriun, and Sida cordifolia among the non-grasses were found dominant during the study period. Results show that, the annual grass production was found to be 1305.95 gm-2/year. The non-grass production showed maximum in the month of October (53.49 gm-2) and minimum in the month of June (2.80 gm-2). The annual non-grass production was found to be 430.84 gm-2 /year. This study informed about the natural ecosystem and the primary productivity helps to the earlier balanced state. Our study provides a interesting future direction that how, human and climate changes affect the net productivity and biodiversity of grazed grassland community. Index Terms- Grazed grassland, Below ground, Live green, Biomass, litter
I. INTRODUCTION n the current global developing market and climatic issues, conservation of grasslands has become one of the major
concern for ecological as well as the environmental point of view. As the grassland is ecologically fragile and sensitive to the climate changes (Qi et al. 2012). Anderson et al. (2006) concluded that the role of grazing in regulating the function and structure of the grassland ecosystem. The influence of grazing on plant and soil mainly effected from the animals trample (Yates, 2000), that do not allow grassland to attain their fullest development. Grazing also associated with the organic content like Nitrogen (N), Phosphorous (P), Potassium (K), and pH values in soil (Yates, 2010). Almost 50% of the worlds terrestrial land base is grazed by domestic livestock (Havstad 2008).
This has insightful effect on the composition structure physiognomy and minerals status of the grasslands. The impact of grassing on the productivity, mineral status has been explained by studying the biomass structure and minerals status of the grazed grassland of district Bilaspur during 2012-2013. Our study is an attempt to evaluate the impact of grazing on biomass, by answering some of the important questions such as; how does the climatic change throughout the year affects the productivity of grazed grassland, its structure and functioning with respect to climatic variations? As the Indian grassland commune are entirely depending upon the climatologically factors and various biotic interferences. Grassland were most vital part in the worlds productivity long before. Human activities have mainly affects the grassland all over the world and much of the area has been converted in to agricultural land. As a result of excessive human interference it is difficult to locate virgin grassland in our country. The grassland plants mostly consist of a number of animal and perennial grasses mixed with legumes and fob’s with the advent of the mansoon. In June fairly good number of special starts their growth either through seeds or sporting rhizomes. Organic matter accumulation rate in plant tissue with surplus of respiratory utilization refers to net primary production. The total weight of the living component present at any given time in the ecosystem accounts for the biomass. The customary approach in ecologically works is to evaluate production as a parameter of productivity as a functional aspect of the ecosystem has attracted much attention during recent year’s and much information is available now on primary production & turnover parameters for grassland of tropical & temperate regions. Tiwary and Sing (1981) highlighted the important contributions of grassland communities’ production in India. Litter decomposition plays an vital role in terrestrial ecosystem for maintaining productivity and to regulates the availability of nutrients needed for plant growth. Basic processes of decomposition in their study namely as biological action withering and leaching are the key factor affecting decomposition (Kar 2013).
II. MATERIALS AND METHOD Climate condition: The study was carried out on Bilaspur, which is located at central part of India. The climatic climax was sub tropical with an moderate temperature variation for most of the year a part from the summer from March to June which can be externally
I
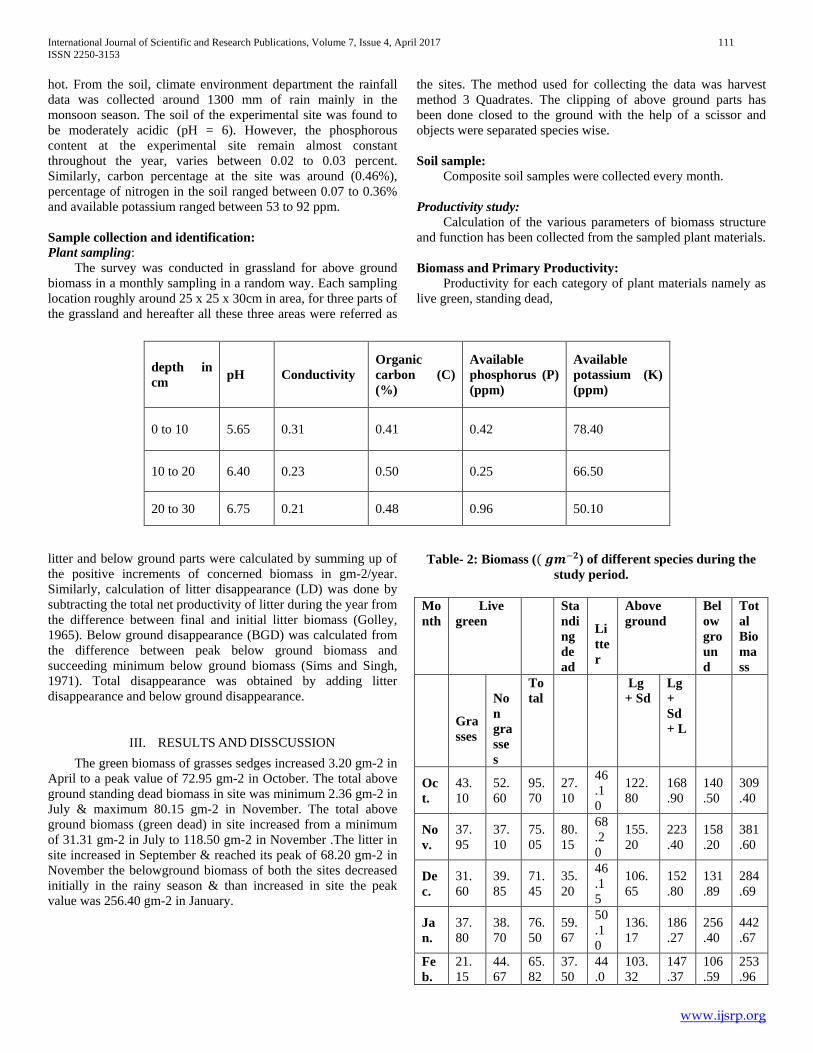
International Journal of Scientific and Research Publications, Volume 7, Issue 4, April 2017 111 ISSN 2250-3153
www.ijsrp.org
hot. From the soil, climate environment department the rainfall data was collected around 1300 mm of rain mainly in the monsoon season. The soil of the experimental site was found to be moderately acidic (pH = 6). However, the phosphorous content at the experimental site remain almost constant throughout the year, varies between 0.02 to 0.03 percent. Similarly, carbon percentage at the site was around (0.46%), percentage of nitrogen in the soil ranged between 0.07 to 0.36% and available potassium ranged between 53 to 92 ppm. Sample collection and identification: Plant sampling: The survey was conducted in grassland for above ground biomass in a monthly sampling in a random way. Each sampling location roughly around 25 x 25 x 30cm in area, for three parts of the grassland and hereafter all these three areas were referred as
the sites. The method used for collecting the data was harvest method 3 Quadrates. The clipping of above ground parts has been done closed to the ground with the help of a scissor and objects were separated species wise. Soil sample: Composite soil samples were collected every month. Productivity study: Calculation of the various parameters of biomass structure and function has been collected from the sampled plant materials. Biomass and Primary Productivity: Productivity for each category of plant materials namely as live green, standing dead,
litter and below ground parts were calculated by summing up of the positive increments of concerned biomass in gm-2/year. Similarly, calculation of litter disappearance (LD) was done by subtracting the total net productivity of litter during the year from the difference between final and initial litter biomass (Golley, 1965). Below ground disappearance (BGD) was calculated from the difference between peak below ground biomass and succeeding minimum below ground biomass (Sims and Singh, 1971). Total disappearance was obtained by adding litter disappearance and below ground disappearance.
III. RESULTS AND DISSCUSSION The green biomass of grasses sedges increased 3.20 gm-2 in April to a peak value of 72.95 gm-2 in October. The total above ground standing dead biomass in site was minimum 2.36 gm-2 in July & maximum 80.15 gm-2 in November. The total above ground biomass (green dead) in site increased from a minimum of 31.31 gm-2 in July to 118.50 gm-2 in November .The litter in site increased in September & reached its peak of 68.20 gm-2 in November the belowground biomass of both the sites decreased initially in the rainy season & than increased in site the peak value was 256.40 gm-2 in January.
Table- 2: Biomass (( 𝒈𝒈𝒈𝒈−𝟐𝟐) of different species during the study period.
Month
Live green
Standing dead
Litter
Above ground
Below ground
Total Biomass
Grasses
Non grasses
Total
Lg + Sd
Lg + Sd + L
Oct.
43.10
52.60
95.70
27.10
46.10
122.80
168.90
140.50
309.40
Nov.
37.95
37.10
75.05
80.15
68.20
155.20
223.40
158.20
381.60
Dec.
31.60
39.85
71.45
35.20
46.15
106.65
152.80
131.89
284.69
Jan.
37.80
38.70
76.50
59.67
50.10
136.17
186.27
256.40
442.67
Feb.
21.15
44.67
65.82
37.50
44.0
103.32
147.37
106.59
253.96
depth in cm pH Conductivity
Organic carbon (C) (%)
Available phosphorus (P) (ppm)
Available potassium (K) (ppm)
0 to 10 5.65 0.31 0.41 0.42 78.40
10 to 20 6.40 0.23 0.50 0.25 66.50
20 to 30 6.75 0.21 0.48 0.96 50.10

International Journal of Scientific and Research Publications, Volume 7, Issue 4, April 2017 112 ISSN 2250-3153
www.ijsrp.org
5
Mar.
5.59
39.10
47.69
44.69
60.85
92.38
153.23
99.67
252.90
Apl.
3.20
7.54
10.74
33.39
50.10
44.09
94.19
48.20
142.39
May.
2.15
4.30
6.45
40.50
19.33
46.95
66.28
97.69
163.97
Jun.
8.30
2.70
11.00
47.90 -- 58.9
0 58.90
143.59
202.49
Jul.
30.10
27.80
57.90
2.36 -- 60.2
6 60.26
152.20
212.46
Aug.
67.40
33.20
100.60
2.97 -- 103.
57 103.57
78.40
181.97
Sep.
70.50
49.26
119.76
5.10
21.94
124.86
146.80
200.45
347.25
Oct.
72.95
45.35
118.30
23.20
36.76
141.50
178.26
254.96
433.22
Total
434.79
422.17
856.96
439.69
433.58
1296.65
1740.23
1868.74
3608.97
The total biomass of site increased 44.09 gm-2 in April to 141.05 gm-2 in October where as it fluctuated throughout the year. The below ground/ above ground ratio in site ranged Results of the study for the live green biomass (grasses, non grasses and total live green) of the Grazed site and the green biomass did not follow any trend. It attained a peak during January and minimum in month of July. The standing dead biomass increased from July (2.36 gm-2) to October (23.20 gm-2 and the peak in the month of November (80.15 gm-2). Minimum standing dead biomass was recorded in the month of July (2.36 gm-2). Total above ground biomass is the sum total of live green biomass and standing dead biomass. It was found to be minimum in the month of April (44.09 gm-2) and maximum during November (155.20 gm-2). The litter biomass of the community did not showed any trend. Thereafter the value showed a declined trend minimum in September (21.94 gm-2) and the maximum value (68.20 gm-2) in November. The litter was totally absent in the month of June, July and August. The sequence of monthly above ground biomass values showed similar trend to that observed in case of live green biomass values. The below ground biomass values decreased from January (256.40 gm-2) to April (48.20 gm-2) and the minimum biomass of grazed grassland is 48.20 The sequence of monthly above ground biomass values showed similar trend to that observed in case of live green biomass values. The below ground biomass values decreased from January (256.40 gm-2) to April (48.20 gm-2) and the minimum biomass of grazed grassland is 48.20 gm-2 and the maximum biomass reached in 254.96 gm-2 in October. The total biomass of the community
ranges from 142.69 gm-2 to 446.69 gm-2. The maximum biomass was observed in January and minimum in the month of April. The non-grass production showed maximum in the month of October (52.44 gm-2) and minimum in the month of June (2.70 gm-2). The annual non-grass production was found to be 422.17 gm-2/year. The total live green production showed their minimum and maximum value during May (6.45 gm-2 and October (118.30 gm-2). Out of the annual net live green production (856.96 gm-2/year) 50.72% was contributed by grasses and 49.28% by non-grasses. The standing dead production was found to be 439.69 gm-2/year.
IV. DISCUSSION In view of the present findings, the grassed sites is under heavy grassing pressure and will lead to a further degradation of these elements in future but looking to the huge nutrient reservoir in the soil, it appears that these nutrients will not affect the productivity of these grassing land, at least for a few year in future. The annual net above ground production of this Grazed grassland, it was observed that the present value showed 434.79 gm-2/year. The litter production of the community was evident from January to May and from September to December. No litter production was observed during June, July and August. This may perhaps be due to rapid decomposition of litter. The rain fall, atmospheric temperature and soil condition were found to be suitable for the growth and development of all species so that September exhibited peak value. Onwards the amount of rain fall, atmospheric temperature along with the soil condition might not be favourable for the growth of vegetation as a result of which a gradual declined in green biomass was observed till to the end of the sampling period.
REFERENCES [1] Anderson R. H., Fuhlendorf, S. D., Engl D. M. (2006). Soil nitrogen
availability in tall grass prairie under the fire-grazing interaction. Rangeland Ecology and Management, 59: 625-631.
[2] Dadsena B.P. and Jaiswal M.L. (2014). A study of primary productivity on grassland of Bilaspur District (Chhattisgarh) India. IJSRP Vol. 4 Issue - 6. June 2014 : 1-4.
[3] Choudhary N. and Narayan R. (2013). Exotic invasive Ageratum conyzoides L. in Indian dry tropic's: A preliminary investigation of it's biomass allocation pattern and plant traits Journals of plant development and science 5(3) : 249-254.
[4] Havstad, K M. 2008. Mongolias rangelands: s livestock production the key to the future? Frontiers in Ecology 71:1040-1049.
[5] Kar P.K. (2013)- Life form and primary production of an Indian grassland community, 1(2), 8-16.
[6] Qi, J., J. Chen, S. Wan, and L. Ai. 2012. Understanding the coupled natural and human systes in Dryland East Asia. Environmental Research Letters 7:015202.
[7] Tyagi & sing P (1988) - Pasture & forage crops research a state of knowledge report pub mnmt soc, Jhansi India.
[8] Tiwari, S.C Tewary, C.K. and J.S. Singh (1981). Progress of Ecology in India. P-3-28. In: A. Singh and P. Wahi (eds.) Souvenir. Ecology and resource management in the tropics. ISTE Bhopal University, Bhopal.
[9] Van Dyna, G.M., F.M., Smith, R.L.Casplewid and R.G.Woodmansea (1978), Analysis and synthesis of grassland ecosystem dynamics. In J.S.

International Journal of Scientific and Research Publications, Volume 7, Issue 4, April 2017 113 ISSN 2250-3153
www.ijsrp.org
Singhand B.Gopal (ed.): climpses of ecology, International scientific publication Jaipur, India.
[10] Yates, C. J., Norton, D.A., Hobbs, R. J., (2000). Grazing effects on plant cover, soil and microclimate in fragmented woodlands in south-western Australia: Implication restoration. Austral Ecology, 25: 36-47.
AUTHORS First Author – Baldau Prasad Dadsena, Lecturer(P)G.H.S.S.Katgi,Baloda Bazar (Chhattisgarh)) E-Mail: [email protected] Second Author – Dr.M.L.Jaiswal, Assistant Professor,D.P.V.P.G. College Bilaspur (Chhattisgarh)
International Journal of Scientific and Research Publications, Volume 7, Issue 4, April 2017 114 ISSN 2250-3153
www.ijsrp.org
Evaluation of Biosecurity Status in Commercial Broiler Farms in Sri Lanka
W.M.J.B. Wijesinghe *, P.G.J.C. De Silva *, S.P. Gunaratne **
* Postgraduate Institute of Agriculture, University of Peradeniya, Peradeniya, Sri Lanka. ** Faculty of Veterinary Medicine and Animal Science, University of Peradeniya, Peradeniya, Sri Lanka.
Abstract- Biosecurity is the practice designed to prevent the spread of diseases onto farm, with in farm and out from the farm. It has three major components, isolation, traffic control and sanitation. Good biosecurity should be practiced at all the time and it is the cheapest and the most effective means of disease control. Therefore, objectives of this study were to evaluate and grade the commercial broiler farms according to the present biosecurity status and to correlate the performances with biosecurity status of those farms. A questionnaire covering all basic conceptual, structural and operational aspects of biosecurity was used to collect data from 80 commercial broiler farms in Central Province of Sri Lanka. Minitab software was used to analyze the data. There is a significant negative correlation (p<0.05) between average catching age with overall biosecurity status. The average body weight has shown positive correlation while average mortality% and FCR having negative correlation though not statistically significant (p< 0.05). The biosecurity status of most farms falls to category of “Average” representing about 56%, while “Good” and “Poor” had about 15% and 27% of farms, respectively. There were very few broiler farms found in categories of “Excellent” and “Very poor” in terms of overall biosecurity status. Index Terms- Biosecurity, commercial broiler farms
I. INTRODUCTION ith the development of modern poultry rearing methods, backyard poultry farming is less prominent in the modern world. Most of the technologies and developments direct the industry toward the intensive management system where huge numbers of
birds are confined to limited space with improved environmental facilities. Main disadvantage of this system observed in recent past is that when an outbreak crop up infection spreading rate is more rapid causing significant economic losses. Recent outbreaks of highly pathogenic Avian Influenza (HPAI) is a good example for such a huge loss (Rushton et al., 2005; FAO, 2014). Once birds get infected, control measures and treatments to prevent further spreading the infection and mortality is more often failed. Therefore, prevention of infectious diseases has become a priority. Thus, strict sanitation, quarantine and biosecurity within the farms, country and between the borders become an important issue today. Biosecurity is the practice designed to prevent the spread of diseases onto farm, with in farm and out from the farm (Jeffrey, 1997). It is achieved via maintaining minimum entry of organisms such as bacteria, viruses, rodents etc. cross the farms. It has three major components, isolation, traffic control and sanitation (Jeffrey, 1997). In order to have an effective disease prevention programme, good biosecurity should be a priority and should be practiced at all times. Taking the right measures will help to protect not only birds, but also poultry industry, business as well as community. In Sri Lanka, poultry industry is the fastest growing and the most developed livestock sub sector (Central bank 2014). There are three grandparent farms and nearly 33 registered breeder farms operating in Sri Lanka. Moreover, there are more than 15 chicken meat processors in the country. Most of these large scale companies maintain environmental controlled broiler houses for the purpose of efficient broiler meat production and thereby to meet high chicken meat demand. Management practices in these controlled houses are highly advanced and high importance has been given on effective health management through strong biosecurity programme. However, the majority of the commercial broiler farms in Sri Lanka are side walls open houses and small scale in nature. Often farmers have poor knowledge on diseases and their spreading, biosecurity and overall farm management. It has been estimated that disease cost for commercial broiler industry is about 10% of the total cost of production (Waller, 2007). These losses can be attributing to direct mortality and indirectly from downgrading, poor performances, cost for medicine and condemnation. Moreover, there is an overuse of antibiotic and other supplements since most of the poultry medicines available in the country can be purchase over the counter. As a consequence, development of antimicrobial resistance and deterioration of the quality of the end product has been observed. For example, antibiotic residue is becoming a critical factor in meat quality certification system. It is a question very often asked, whether commercial broiler farms in our country having basic and practicable biosecurity measures to overcome important health problems. Therefore, the objectives of this study were to evaluate the basic biosecurity status of commercial broiler farms in the country and to rank them according to the available biosecurity measures. Therefore, a survey was conducted to evaluate the biosecurity status in commercial broiler farms in Sri Lanka.
W
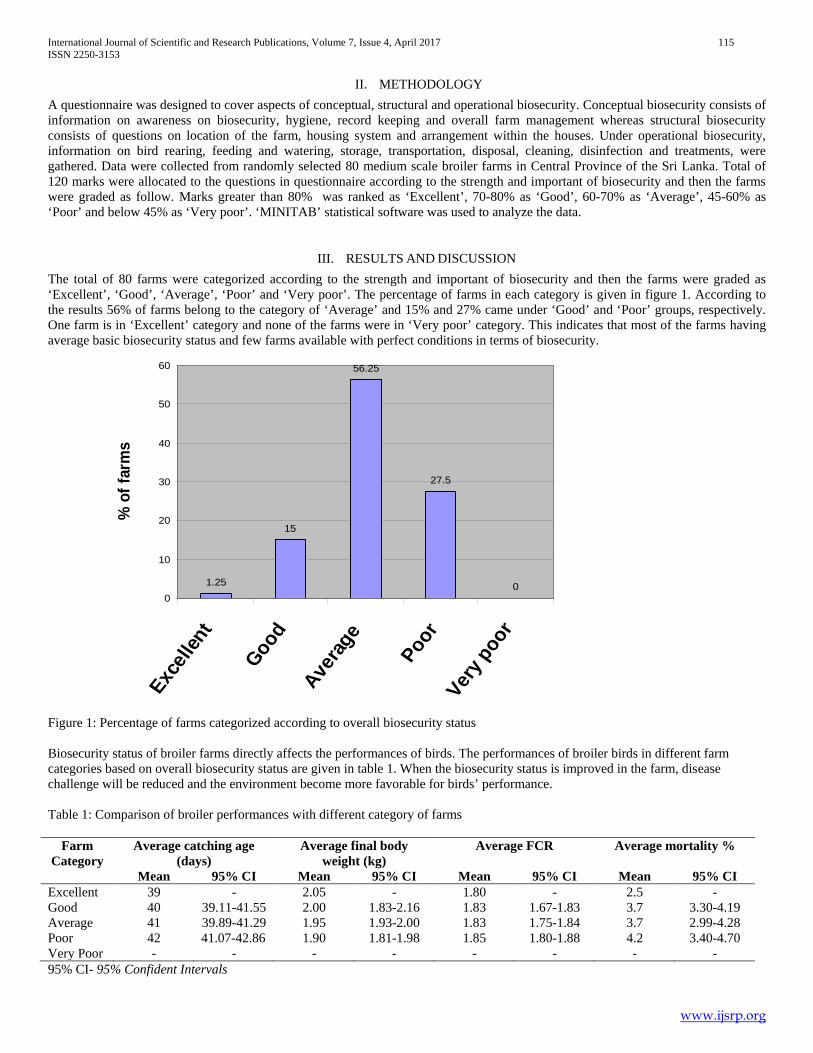
International Journal of Scientific and Research Publications, Volume 7, Issue 4, April 2017 115 ISSN 2250-3153
www.ijsrp.org
II. METHODOLOGY A questionnaire was designed to cover aspects of conceptual, structural and operational biosecurity. Conceptual biosecurity consists of information on awareness on biosecurity, hygiene, record keeping and overall farm management whereas structural biosecurity consists of questions on location of the farm, housing system and arrangement within the houses. Under operational biosecurity, information on bird rearing, feeding and watering, storage, transportation, disposal, cleaning, disinfection and treatments, were gathered. Data were collected from randomly selected 80 medium scale broiler farms in Central Province of the Sri Lanka. Total of 120 marks were allocated to the questions in questionnaire according to the strength and important of biosecurity and then the farms were graded as follow. Marks greater than 80% was ranked as ‘Excellent’, 70-80% as ‘Good’, 60-70% as ‘Average’, 45-60% as ‘Poor’ and below 45% as ‘Very poor’. ‘MINITAB’ statistical software was used to analyze the data.
III. RESULTS AND DISCUSSION The total of 80 farms were categorized according to the strength and important of biosecurity and then the farms were graded as ‘Excellent’, ‘Good’, ‘Average’, ‘Poor’ and ‘Very poor’. The percentage of farms in each category is given in figure 1. According to the results 56% of farms belong to the category of ‘Average’ and 15% and 27% came under ‘Good’ and ‘Poor’ groups, respectively. One farm is in ‘Excellent’ category and none of the farms were in ‘Very poor’ category. This indicates that most of the farms having average basic biosecurity status and few farms available with perfect conditions in terms of biosecurity.
Figure 1: Percentage of farms categorized according to overall biosecurity status Biosecurity status of broiler farms directly affects the performances of birds. The performances of broiler birds in different farm categories based on overall biosecurity status are given in table 1. When the biosecurity status is improved in the farm, disease challenge will be reduced and the environment become more favorable for birds’ performance. Table 1: Comparison of broiler performances with different category of farms
Farm Category
Average catching age (days)
Average final body weight (kg)
Average FCR Average mortality %
Mean 95% CI Mean 95% CI Mean 95% CI Mean 95% CI Excellent 39 - 2.05 - 1.80 - 2.5 - Good 40 39.11-41.55 2.00 1.83-2.16 1.83 1.67-1.83 3.7 3.30-4.19 Average 41 39.89-41.29 1.95 1.93-2.00 1.83 1.75-1.84 3.7 2.99-4.28 Poor 42 41.07-42.86 1.90 1.81-1.98 1.85 1.80-1.88 4.2 3.40-4.70 Very Poor - - - - - - - - 95% CI- 95% Confident Intervals
1.25
15
56.25
27.5
00
10
20
30
40
50
60
Excell
ent
Good
Averag
e
Poor
Very p
oor
% o
f far
ms
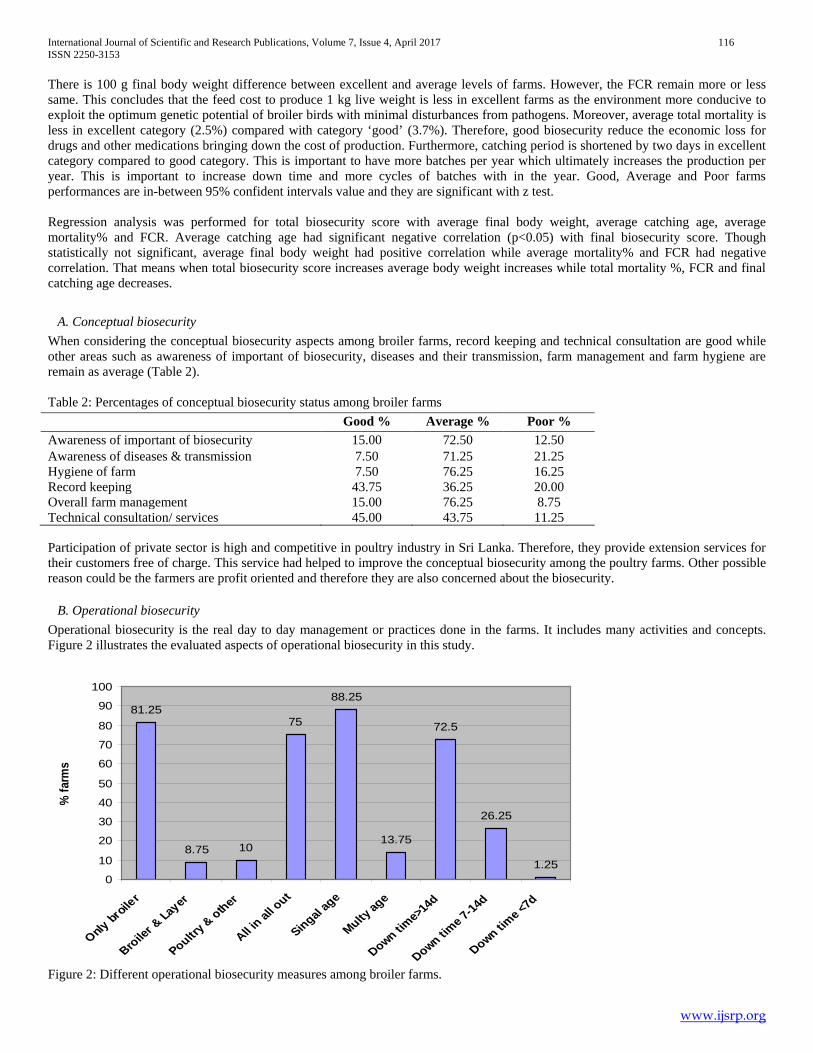
International Journal of Scientific and Research Publications, Volume 7, Issue 4, April 2017 116 ISSN 2250-3153
www.ijsrp.org
There is 100 g final body weight difference between excellent and average levels of farms. However, the FCR remain more or less same. This concludes that the feed cost to produce 1 kg live weight is less in excellent farms as the environment more conducive to exploit the optimum genetic potential of broiler birds with minimal disturbances from pathogens. Moreover, average total mortality is less in excellent category (2.5%) compared with category ‘good’ (3.7%). Therefore, good biosecurity reduce the economic loss for drugs and other medications bringing down the cost of production. Furthermore, catching period is shortened by two days in excellent category compared to good category. This is important to have more batches per year which ultimately increases the production per year. This is important to increase down time and more cycles of batches with in the year. Good, Average and Poor farms performances are in-between 95% confident intervals value and they are significant with z test. Regression analysis was performed for total biosecurity score with average final body weight, average catching age, average mortality% and FCR. Average catching age had significant negative correlation (p<0.05) with final biosecurity score. Though statistically not significant, average final body weight had positive correlation while average mortality% and FCR had negative correlation. That means when total biosecurity score increases average body weight increases while total mortality %, FCR and final catching age decreases.
A. Conceptual biosecurity When considering the conceptual biosecurity aspects among broiler farms, record keeping and technical consultation are good while other areas such as awareness of important of biosecurity, diseases and their transmission, farm management and farm hygiene are remain as average (Table 2). Table 2: Percentages of conceptual biosecurity status among broiler farms
Participation of private sector is high and competitive in poultry industry in Sri Lanka. Therefore, they provide extension services for their customers free of charge. This service had helped to improve the conceptual biosecurity among the poultry farms. Other possible reason could be the farmers are profit oriented and therefore they are also concerned about the biosecurity.
B. Operational biosecurity Operational biosecurity is the real day to day management or practices done in the farms. It includes many activities and concepts. Figure 2 illustrates the evaluated aspects of operational biosecurity in this study.
81.25
8.75 10
75
88.25
13.75
72.5
26.25
1.250
10
20
30
40
50
60
70
80
90
100
Only br
oiler
Broiler &
Layer
Poultry & other
All in al
l out
Singal ag
e
Multy ag
e
Down time>
14d
Down time 7
-14d
Down time <
7d
% fa
rms
Figure 2: Different operational biosecurity measures among broiler farms.
Good % Average % Poor % Awareness of important of biosecurity 15.00 72.50 12.50 Awareness of diseases & transmission 7.50 71.25 21.25 Hygiene of farm 7.50 76.25 16.25 Record keeping 43.75 36.25 20.00 Overall farm management 15.00 76.25 8.75 Technical consultation/ services 45.00 43.75 11.25
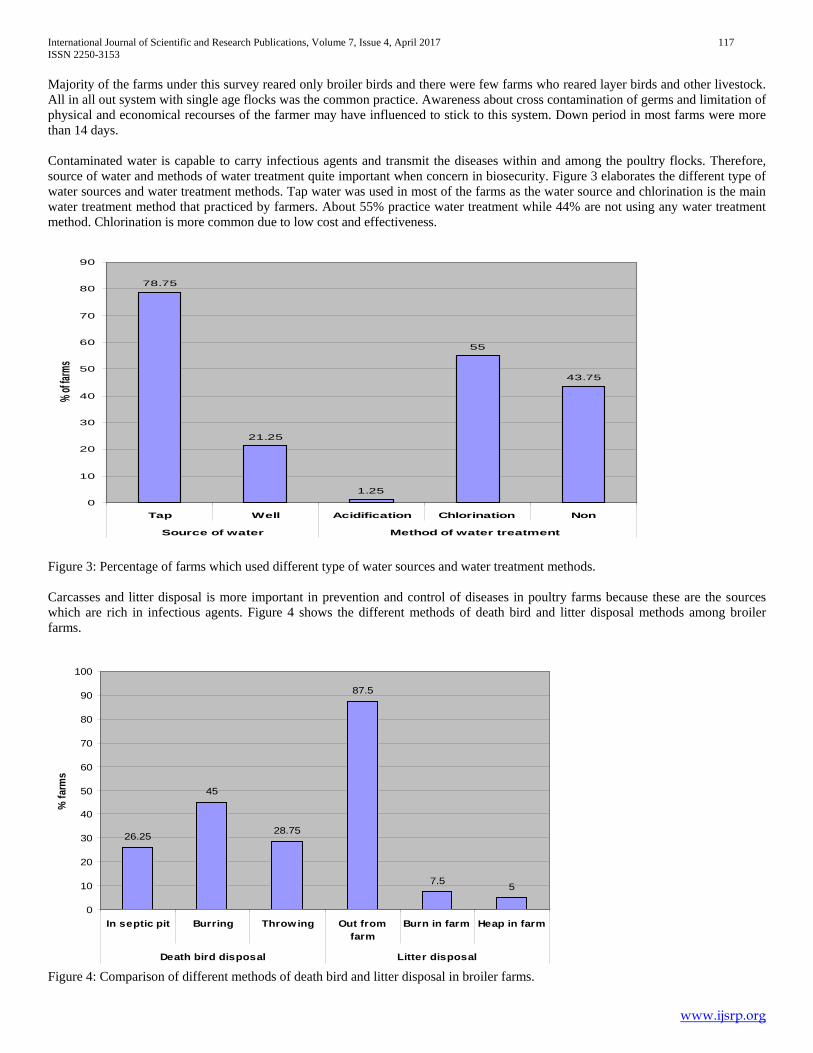
International Journal of Scientific and Research Publications, Volume 7, Issue 4, April 2017 117 ISSN 2250-3153
www.ijsrp.org
Majority of the farms under this survey reared only broiler birds and there were few farms who reared layer birds and other livestock. All in all out system with single age flocks was the common practice. Awareness about cross contamination of germs and limitation of physical and economical recourses of the farmer may have influenced to stick to this system. Down period in most farms were more than 14 days. Contaminated water is capable to carry infectious agents and transmit the diseases within and among the poultry flocks. Therefore, source of water and methods of water treatment quite important when concern in biosecurity. Figure 3 elaborates the different type of water sources and water treatment methods. Tap water was used in most of the farms as the water source and chlorination is the main water treatment method that practiced by farmers. About 55% practice water treatment while 44% are not using any water treatment method. Chlorination is more common due to low cost and effectiveness.
78.75
21.25
1.25
55
43.75
0
10
20
30
40
50
60
70
80
90
Tap Well Acidification Chlorination Non
Source of water Method of water treatment
% of fa
rms
Figure 3: Percentage of farms which used different type of water sources and water treatment methods. Carcasses and litter disposal is more important in prevention and control of diseases in poultry farms because these are the sources which are rich in infectious agents. Figure 4 shows the different methods of death bird and litter disposal methods among broiler farms.
26.25
45
28.75
87.5
7.5 5
0
10
20
30
40
50
60
70
80
90
100
In septic pit Burring Throwing Out fromfarm
Burn in farm Heap in farm
Death bird disposal Litter disposal
% fa
rms
Figure 4: Comparison of different methods of death bird and litter disposal in broiler farms.
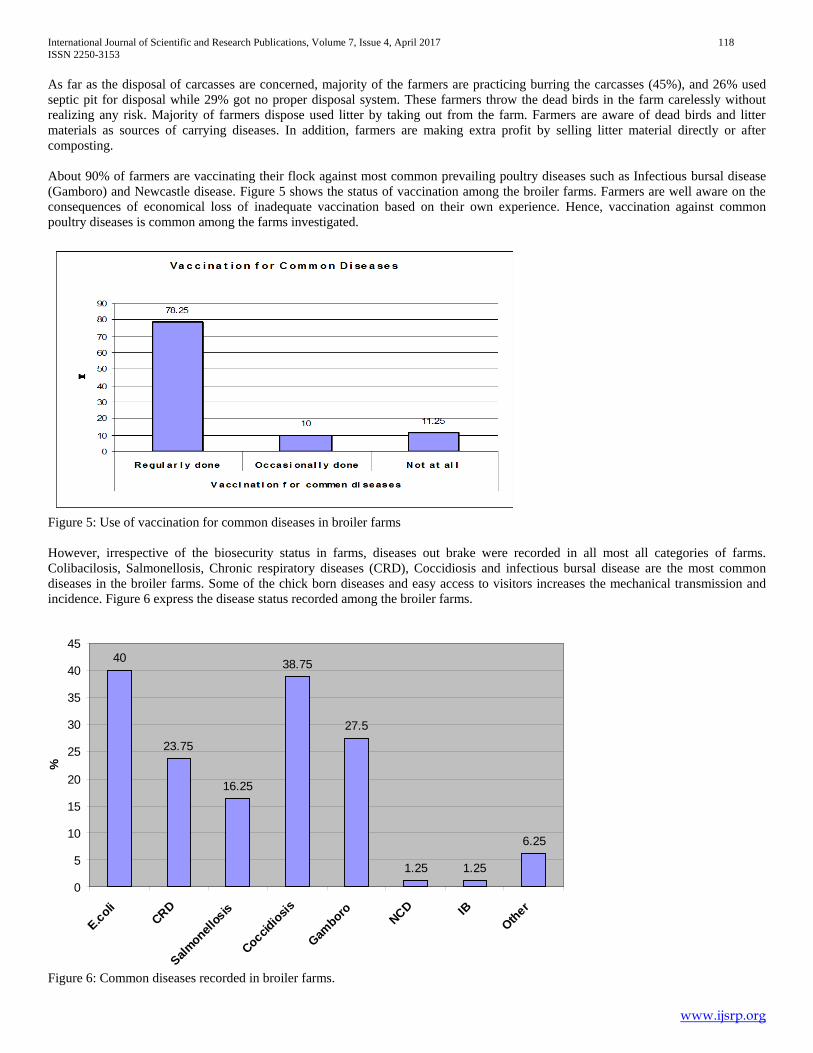
International Journal of Scientific and Research Publications, Volume 7, Issue 4, April 2017 118 ISSN 2250-3153
www.ijsrp.org
As far as the disposal of carcasses are concerned, majority of the farmers are practicing burring the carcasses (45%), and 26% used septic pit for disposal while 29% got no proper disposal system. These farmers throw the dead birds in the farm carelessly without realizing any risk. Majority of farmers dispose used litter by taking out from the farm. Farmers are aware of dead birds and litter materials as sources of carrying diseases. In addition, farmers are making extra profit by selling litter material directly or after composting. About 90% of farmers are vaccinating their flock against most common prevailing poultry diseases such as Infectious bursal disease (Gamboro) and Newcastle disease. Figure 5 shows the status of vaccination among the broiler farms. Farmers are well aware on the consequences of economical loss of inadequate vaccination based on their own experience. Hence, vaccination against common poultry diseases is common among the farms investigated.
Figure 5: Use of vaccination for common diseases in broiler farms However, irrespective of the biosecurity status in farms, diseases out brake were recorded in all most all categories of farms. Colibacilosis, Salmonellosis, Chronic respiratory diseases (CRD), Coccidiosis and infectious bursal disease are the most common diseases in the broiler farms. Some of the chick born diseases and easy access to visitors increases the mechanical transmission and incidence. Figure 6 express the disease status recorded among the broiler farms.
40
23.75
16.25
38.75
27.5
1.25 1.25
6.25
0
5
10
15
20
25
30
35
40
45
E.coliCRD
Salmonell
osis
Coccidiosis
Gamboro NCD IB
Other
%
Figure 6: Common diseases recorded in broiler farms.

International Journal of Scientific and Research Publications, Volume 7, Issue 4, April 2017 119 ISSN 2250-3153
www.ijsrp.org
E.coli infections show highest distribution among selected poultry farmers while coccidosis, Gumboro, CRD also shows moderately higher distribution. New castle disease, Infectious bronchitis and other diseases such metabolic disorders are less common in these selected farmers.
IV. CONCLUSION In conclusion this survey shows that majority of commercial broiler farms belong to the category of ‘Average’ in biosecurity status.
The body weight, mortality%, FCR and final catching age differs with different category of biosecurity status. Biosecurity status significantly influenced catching age of the birds. Whatever the biosecurity status, incidences of diseases are high among all the farms. Disease incidences are high irrespective of the status of biosecurity of the farm.
ACKNOWLEDGMENT Authors would like to thank all farmers who supported during the data collection.
REFERENCES [1] Central Bank of Sri Lanka, Annual Report 2014. Central Bank, Colombo, Sri Lanka, 2014. [2] Food and Agriculture Organization of the United Nations, Food and Nutrition in Numbers 2014, Rome. 2014. [3] J. S. Jeffrey, Biosecurity for poultry flocks. Extension Poultry Veterinarian, University of California-Davis, 1997. [4] J. Rushton, R. Viscarra, E. G. Bleich and A. McLeod. Impact of avian influenza outbreaks in the poultry sectors of five South East Asian countries (Cambodia,
Indonesia, Lao PDR, Thailand, Viet Nam) outbreak costs, responses and potential long term control. World's Poultry Science Journal. 2005, 61(03), 491-514. [5] A. Waller. Take a fresh look at broiler nutrition. Poultry International, September, 2007, 12-13.
AUTHORS W.M.J.B. Wijesinghe – Postgraduate Institute of Agriculture, University of Peradeniya, Peradeniya, Sri Lanka, [email protected]. P.G.J.C. De Silva – Postgraduate Institute of Agriculture, University of Peradeniya, Peradeniya, Sri Lanka, [email protected]. S.P. Gunaratne – Faculty of Veterinary Medicine and Animal Science, University of Peradeniya, Peradeniya, Sri Lanka, [email protected]. Correspondence Author – W.M.J.B. Wijesinghe – Postgraduate Institute of Agriculture, University of Peradeniya, Peradeniya, Sri Lanka, [email protected].

International Journal of Scientific and Research Publications, Volume 7, Issue 4, April 2017 120 ISSN 2250-3153
www.ijsrp.org
Combined Effect of Different Micronutrients and Spacing on the Growth and Yield of Garlic (Allium
sativum L.) Sumaiya Afrin Jhuma1, Dr. Tahmina Mostarin1, Dr. Khaleda khatun1, Israt Jahan1, Prince Biswas2, Mohammad
Abu Bakar Siddik3
1 Department of Horticulture, Sher-e-Bangla Agricultural University, Sher-e-Bangla Nagar, Dhaka-1207, Bangladesh 2 Department of Bichemistry, Sher-e-Bangla Agricultural University, Sher-e-Bangla Nagar, Dhaka-1207, Bangladesh
3 Depertment of Agroecology and Farming System, Institute of Crop Science, CAAS, China Abstract- The experiment was conducted at Horticultural Farm, Sher-e-Bangla Agricultural University, during the period from November 2013 to April 2014 to find out the response of different micronutrients and spacing on the growth and yield of garlic. The experiment consists of two factors. Factor A: four levels of plant nutrients T0: S0B0Zn0 (control), T1: S15B2Zn5, T2: S20B4Zn10 and T3: S25B6Zn15 (kg/ha) respectively. Factor B: three levels of spacing S1 = 10 cm × 10 cm, S2 = 15 cm × 10 cm and S3 = 15 cm × 15 cm were used for the present study. The experiment was laid out in RCBD with three replications. Results showed that T3S1 treatment combination was found highest yield (6.57 t) and lowest yield (3.36 t) was found fromT0S3 treatment combination. Calculating the benefit cost ratio T3S1 gave the highest economic return (2.52) compared with rest of the treatment combinations. So S25B6Zn15 with 10 cm × 10 cm spacing gave highest yield of garlic. Index Terms- Garlic; Micronutrients; Spacing; Growth; Yield
I. INTRODUCTION arlic (Allium sativum L.) is well known as a spice crop in Bangladesh as well as in the world. It is an aromatic
herbaceous annual spice and one of the most important bulb crops belonging to the family Alliaceae (Kurian, 1995). It is the second most widely used Alliums after onion (Bose and Som, 1990) with the characteristics of pungent smell. The major garlic producing countries of the world are China, South Korea, Spain, India, USA, Egypt, Thailand and Turkey (FAO, 2000). Garlic has been considered as a rich source of carbohydrates, proteins and phosphorus. It is popular all over the world as a valuable spice for different dishes. It is also used as a popular remedy for various diseases. According to the Unani and Ayurvedic medicines in treatments of diseases like chronic infection of stomach and intestine, dysentery, typhoid, cholera and diseases of lungs garlic is successfully used (Chopra et al, 1958). In recent, oil, powder are prepared from it for adding flavor to the curries (Pruthi, 1976). The average yield of garlic in Bangladesh is only 4.40 t/ha (BBS, 2010), which is very low as compared to that of other countries. In Bangladesh about 164,000 metric tons of garlic was produced from approximately 92000 hectares of land in 2009-2010 (BBS, 2010). The requirement of garlic in Bangladesh is about 85,000 metric tons (Rahim, 1992).
The crop is extensively cultivated during the winter season of Bangladesh. Garlic ranks second in world production among the Alliums after onion (Purseglove, 1975). Judicious application of fertilizer may enhance bulb yield significantly. Nitrogen is required for cell division and vital for plant growth. It directly involved in photosynthesis. Potassium helps in the root development and increase the efficiency of leaf in the manufacture of sugar and starch. Phosphorus promotes early root formation and growth. It also involved cell division, cell enlargement and increase water use efficiency. The sulphur compounds in garlic have received a lot of attention because of it potential antibiotics and flavor properties. Boron is essential for promotes maturity. Zinc is necessary for chlorophyll production and necessary for starch formation. So different plant nutrients are physiologically important element and it has a miscellaneous effect on vegetative and reproductive stages in plant body. Plant spacing influences the growth and yield of garlic. Yield of garlic is dependent on the number of plants accommodated per unit area of land. Planting of garlic at proper spacing also increases the yield and improves the grade of bulbs. Wider spacing increased number of leaves and greater plant height of garlic has been reported by several authors (Om and Srivastava, 1977). Increased bulb size in garlic with wider spacing has been noted by a number of authors (Menezes et al. 1974). Accommodation of reduced number of plants per unit area involves wider spacing is directly reduces the yield (Rahim et al., 1984). Thus the increased number of plant per unit area in closer spacing compensates the loss of reduced bulb sizes and ultimately increases the yield. Reports generally agree that higher plant spacing gave higher yield, but lower bulb weight of garlic (Duranti and Cuocolo, 1984).
II. MATERIALS AND METHODS The present study was carried out to study the response of different micronutrients and spacing on the growth and yield of garlic (Allium sativum L.) during the period from November 2013 to April 2014. The experiment was conducted at Horticultural Farm in Sher-e-Bangla Agricultural University, Dhaka-1207. The climate of the experimental field was sub-tropical and was characterized by high temperature, heavy rainfall during Kharif-1 season (March-June) and scanty rainfall during Rabi
G

International Journal of Scientific and Research Publications, Volume 7, Issue 4, April 2017 121 ISSN 2250-3153
www.ijsrp.org
season (October-March) associated with moderately low temperature. The physical and chemical properties of soil of the experimental site sandy loam in texture and having soil pH varied from 5.45-5.61. Organic matter content ware very low (0.83). The physical composition such as sand, silt, clay content were 40%, 40% and 20% respectively. Urea, Triple Super Phosphate (TSP) and Murate of Potash (MP) were used as the fertilizer source of the nutrient elements N, P and K respectively. A standard dose of NPK @ 100, 55,160 kg /ha was used in all treatments. The following doses of manure and fertilizer were used for the present study.
The two factors experiments having 12 different treatment combinations were laid out in a Randomized Complete Block Design (RCBD) with three replications. The whole experimental area was divided into three blocks and each of which was then divided into 12 unit plots. The twelve treatment combinations were then distributed randomly among the unit plots of each block so as to all of treatments were placed once in each block. The size of each unit plot was 0.6 m × 0.9 m. The space between the blocks and plots were 50cm and 30cm respectively. Two factors were used in the experiment viz. four levels of nutrients (T) and three levels of spacing (S). Factor- A: Four levels of micronutrients T0 = S0B0Zn0 (Kg/ha) (Control) , T1 = S15B2Zn5 (Kg/ha), T2 = S20B4Zn10 (Kg/ha) T3 = S25B6Zn15 (Kg/ha). Factor –B: Three levels of spacing S1 = 10 cm × 10 cm, S2 =15 cm × 10 cm, S3 = 15 cm × 15 cm. Treatment combinations (Micronutrients × spacing) T0S1, T0S2, T0S3, T1S1, T1S2, T1S3, T2S1, T2S2, T2S3, T3S1, T3S2, T3S3 The collected data from the experiment on yield and yield components were statistically analyzed following experiment in RCBD wherever necessary. The mean for all treatments were calculated and analyses of variance of the parameters under study were performed by F variance test. The significance of the difference among the means of treatment combinations was estimated by Dunean’s Multiple Range Test (DMRT) at 5% level of probability (Gomez and Gomez,1984).The means of the parameters were separated by least significant difference (LSD).
III. RESULTS AND DISCUSSION Combined effect of different nutrient and spacing on plant height of garlic was statistically significant at different days after sowing (DAS) (Table 1). At 75DAS, the highest plant height (47.93cm) was found in T3S1 (S25B6Zn15 with 10cm×10cm) treatment combination. On the contrary the lowest plant height (36.37cm) at 75 DAS was recorded from T0S3 (S0B0Zn0 with 15cm×15cm) treatment combination. Similar result was also found by Sing et al. (2004) and they observed that different plant nutrients with different spacing and planting dates had significant influence on plant height. Combined effect of different micronutrient and spacing was statistically significant in respect of number of leaves per plant at different days after sowing (DAS) (Table 2). Gradually increased number of leaves per plant was observed till 75 DAS. At 75 DAS, the maximum (6.77) number of leaves per plant was found in T3S3 (S25B6Zn15 with 15cm×15cm) treatment combination which was statistically identical with T2S3 treatment combination and the minimum (5.87) number of leaves per plant
was found in T0S1 (S0B0Zn0 with 10cm×0cm) treatment combination which was statistically similar to T1S1, T2S1 and T3S1 treatment combinations. Such results obtained from the present study might be due to cause of nutritional factors in soil and different spacing. Generally more nutrients and higher spacing plant get more food and space for vigorous growth and produce more leaves compared to lower nutrients and spacing. Combined effect of different plant nutrients and spacing on neck diameter per plant of garlic at different days after sowing (DAS) had considerable variation among the treatments (Table 3). At 75 DAS, the maximum neck diameter per plant (0.65cm) was found in T3S3 (S25B6Zn15 with 15cm ×15cm) treatment combination and the minimum neck diameter per plant (0.46cm) was found in T0S1 (S0B0Zn0 with 10cm×10cm) treatment combination which was statistically similar T0S2 (S0B0Zn0 with 15 cm × 10 cm) treatment combination. Bulb length of garlic varied significantly by combined effect of different levels of micronutrient and spacing (Table 4). The highest bulb length (3.62 cm) was obtained from T3S3 (S25B6Zn15 with 15cm×15cm) Treatment combination, which was statistically similar with T2S3 treatment combination. The lowest bulb height (2.81 cm) was recorded from T0S1 (S0B0Zn0 with 10cm×10cm) treatment combination, which was statistically similar with T0S2 treatment combination. Intermediate results were found from the rest of the treatment combinations. Combined effect of different levels of micronutrient and spacing proved significant differences on bulb weight per plant of garlic (Table 5). Results revealed that the highest bulb weight per plant (18.20 g) was obtained from T3S3 (S25B6Zn15 with 15cm×15cm) treatment combination, which was statistically similar with T2S3 treatment combination. The lowest bulb weight per plant (10.50 g) was recorded from T0S1 (S0B0Zn0 with 10cm×10cm) treatment combination. Rest of the treatment combination performed intermediate results in terms of fresh bulb weight per plant compared to all other treatments. Combined effect of different micronutrient and spacing had significant effect on number of cloves per bulb of garlic (Table 5). Results demonstrated that the highest number of cloves per bulb (23.99) was obtained from T3S3 treatment combination. The lowest number of cloves per bulb of garlic (16.80) was from
Fertilizer Doses/ha Nutrients Sources Cow dung- 15 t - Nature Mustard oil cake 2 t - Nature Urea 218 kg 100 kg N CO(NH2)2 TSP 275 kg 55 kg P Ca(H2PO4)2 MP 320 kg 160 kg k KCl Gypsum T1 84 kg 15 kg S CaSO4.H2O
T2 112 kg 20 kg S T3 139 kg 25 kg S
Boric acid
T1 12 kg 2 kg B H3BO3 T2 24 kg 4 kg B T3 36 kg 6 kg B
Zinc Sulphate
T1 15 kg 5 kg Zn ZnSO4.H2O T2 29 kg 10 kg Zn T3 43 kg 15 kg Zn

International Journal of Scientific and Research Publications, Volume 7, Issue 4, April 2017 122 ISSN 2250-3153
www.ijsrp.org
T0S1 treatment combination which was statistically similar to T0S2 treatment combination. The results obtained from all other combined effect gave intermediate results. Yield per plot of garlic was significantly affected by combined effect of different levels of micronutrient and spacing (Table 5). It was observed that the highest yield per plot (354.78 g) was obtained from T3S1 (S25B6Zn15 with10cm×1ocm) treatment combination. Results also revealed that the lowest yield per plot of garlic (181.44 g) was recorded from T0S3 (S0B0Zn0 with 15cm×15cm) treatment combination ,which was statistically similar to T0S2 treatment combination. The results obtained from all other treatment combination gave intermediate results compared to highest and lowest results. Higher number of plant population need higher amount of nutrients. Under the present study, closer spacing with higher nutrient doses gave the higher yield and this type of achievement might be due to higher plant population. Yield of garlic was significantly affected by combined effect of different micronutrient and spacing (Table 5). Results identified that the highest yield of garlic (6.57 t ha-1) was obtained from T3S1 (S25B6Zn15 with 10cm×10cm) treatment combination. The lowest yield of garlic (3.36 t ha-1) was recorded from T0S3 (S0B0Zn0 with 15cm×15cm) treatment combination. This result might be due to presence of favorable nutrient present in soil and higher population also contributed in the formation of the height yield of garlic. Similar results were observed by Sing et al. (2004). In the combination of different micronutrients spacing showed various gross return under different treatment combination (Table 6). The height gross return (TK. 262800/ha) was obtained from the T3S1 (S25B6Zn15 with 10cm×10cm) treatment combination and the second height gross return (TK.221200/ha) was obtained in T2S1 treatment combination. The lowest gross return (TK.134400/ha) was obtained from the T0S3 (S0B0Zn0 with 15cm×15cm) treatment combination. In case of net return, different treatment combination showed different type of net return. The height net return (TK.158392/ha) was obtained from the T3S1(S25B6Zn15 with 10cmx10cm) treatment combination and the second height net return (TK.1209211/ha) was obtained in T3S2 treatment combination. The lowest net return (TK.40551/ha) was obtained from the T0S1(S0B0Zn0 with 10cm×10cm) treatment combination.(Table 6). The combination of different nutrient and spacing for benefit cost ratio was different in all treatment combination (Table 6). The height benefit cost ratio (2.52) was obtained from the T3S1(S25B6Zn15 with 10cm×10cm) treatment combination and the second height benefit cost ratio (2.27) was obtained from T2S2 and T3S2 treatment combination. The lowest benefit cost ratio (1.41) was obtained from the T0S1 (S0B0Zn0 with 10cm×10cm) treatment combination. From the economic point of view, it was apparent form the above results that the treatment combination of T3S1 was more profitable than rest of treatment combinations. Market price of garlic @ TK.40000 /ton ; Gross return = Total yield (t/ha) × TK.40000 Net return = Gross return- Total cost of production
Benefit Cost Ratio (BCR) = Gross return/ Total cost of production
IV. CONCLUSION
ACKNOWLEDGEMENTS Sincere thanks to Bangladesh Agricultural Research Institute (BARI) for providing seeds and Sher-e-Bangla Agricultural University for providing facilities for conducting research. In the experiment higher dose of nutrient T3(S25B6Zn15) was more effective than lower dose of nutrient T0(S0B0ZnO). The spacing S3 (15cm× 15cm) gave higher cloves per bulb but the spacing S1(10cm ×10cm) gave maximum yield per hectare. During the investigation, the best treatment combination was obtained from T3S1 (S25B6Zn15 with 10 cm × 10 cm ) having yield potentiality of 6.57 t/ha-1 and BCR 2.52 .
REFERENCES [1] BBS (Bangladesh Bureau of Statistics). 2010. Monthly Statistical Bulletin
in Bangladesh. June. Statistics Division. Ministry' of Planning, Government of People’s Republic of Bangladesh.
[2] Bose, T. K., and Som, M. G. 1990. Vegetable Crops in India (1st edn.), Naya Prakash, Calcutta, India, pp. 583-601.
[3] Chopra, K. N., Chopra, I. C., Handa, K.L.and Kapur, L.D. 1958. Chopra’s indigenous drugs of India (2nd edn.), Un Dhua Sons Private Ltd. Calcutta, 271-274.
[4] Duranti, A. and Cuocolo, L. 1984. The effect of clove weight and distance between the rows on the yield of Allium sativum L. cv. Messidrome. Rivista della ortoflorofrutticaltura, Itaiana, 68 (1):25-36. [Cited from Hort. Abst., 54 (9): 6141 (1984)].
[5] FAO (Food and Agricultural Organization). 2000. Reports of Food and Agricultural Organization of the United Nations, Italy, Rome. 51: 155.
[6] Gomez, K. A. and Gomez, A. A. 1984. Statistical procedures for agricultural research, 2nd edition. John Willy and Sons, New York. pp.28-102.
[7] Kurian, J.C. 1995. Plant that Heal (1st edn), Oriental Watchman Publishing House, Pune., India, p. 31.
[8] Menezes, S. M. J. A. D. E., Novais, R. E. D. E., Santos, H. L.and Dos, L. M. A. 1974. The effect of nitrogen fertilization, plant spacing and mulching on the yield of garlic cultivar Amarante. Tevista Res., 21 (115): 203- 212 [Cited from Hort. Abstr., 45 (9): 568, 1975].
[9] Om, H.and Srivastava,R. P. 1977. Performance of different locally selected garlic clove. Prog. Hort. 8(4): 69-76.
[10] Pruthi, J.S. 1976. Spices and condiments. National Book Trust of India, New Delhi, pp. 125-132.
[11] Purseglove, J.W. 1975. Tropical Crops. Mono Cotylendons. Longman Group Ltd. London, pp.52-56.
[12] Rahim, M. A., Siddique, M. A. and Hossain, M. M. 1984. Effect of time of planting, mother bulb size and plant density on the yield of garlic. Bangladesh J. Agril. Res. 9 (2): 112-118.
[13] Rahim, M.A. 1992. Spices and plantation crops in national economy. In: Horticulture in National Development. Proceedings of the sixth National Horticulture Convention and Symposium. Bangladesh Soc. Hort. Sci., pp. 24-29.
[14] Sing, S. K. and Singh, R. K. 2004. Interaction effect of nitrogen, planting time and spacing on the performance of garlic, (Allium sativum L.) cv. Yamuna safed(G-l). 4 (2) : 123-128. [cited from CAB Abstr. 2000/08-2002/07]
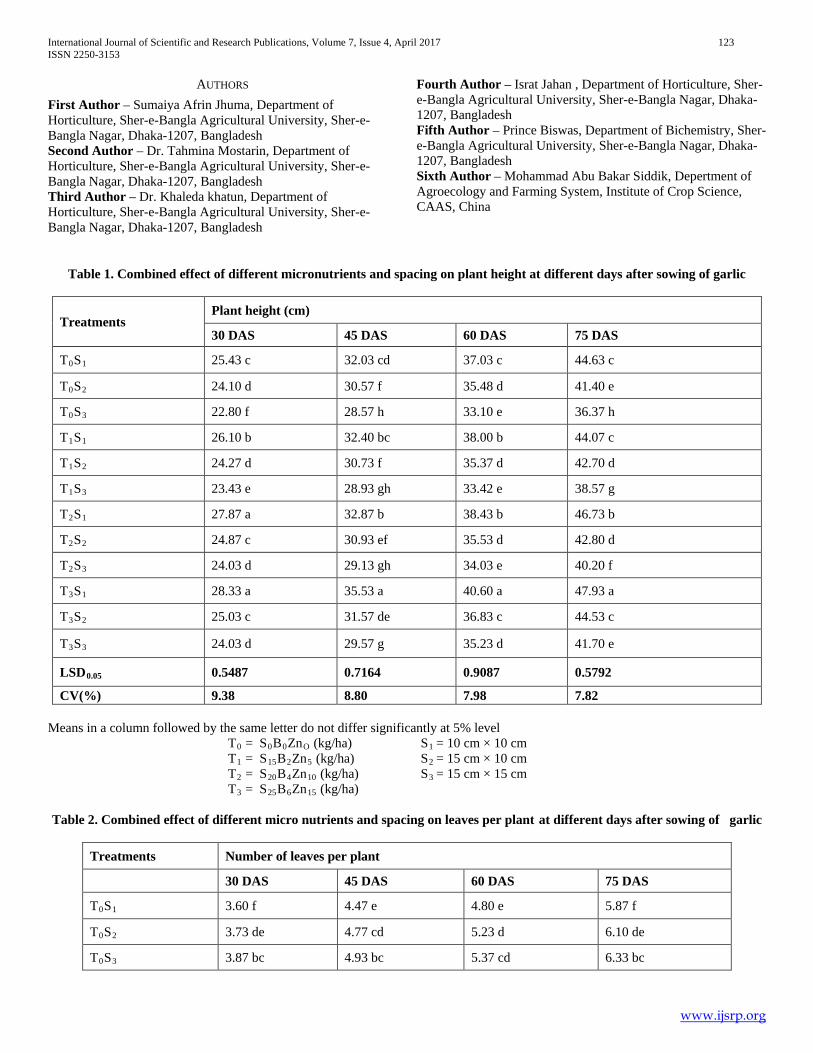
International Journal of Scientific and Research Publications, Volume 7, Issue 4, April 2017 123 ISSN 2250-3153
www.ijsrp.org
AUTHORS First Author – Sumaiya Afrin Jhuma, Department of Horticulture, Sher-e-Bangla Agricultural University, Sher-e-Bangla Nagar, Dhaka-1207, Bangladesh Second Author – Dr. Tahmina Mostarin, Department of Horticulture, Sher-e-Bangla Agricultural University, Sher-e-Bangla Nagar, Dhaka-1207, Bangladesh Third Author – Dr. Khaleda khatun, Department of Horticulture, Sher-e-Bangla Agricultural University, Sher-e-Bangla Nagar, Dhaka-1207, Bangladesh
Fourth Author – Israt Jahan , Department of Horticulture, Sher-e-Bangla Agricultural University, Sher-e-Bangla Nagar, Dhaka-1207, Bangladesh Fifth Author – Prince Biswas, Department of Bichemistry, Sher-e-Bangla Agricultural University, Sher-e-Bangla Nagar, Dhaka-1207, Bangladesh Sixth Author – Mohammad Abu Bakar Siddik, Depertment of Agroecology and Farming System, Institute of Crop Science, CAAS, China
Table 1. Combined effect of different micronutrients and spacing on plant height at different days after sowing of garlic
Treatments Plant height (cm)
30 DAS 45 DAS 60 DAS 75 DAS
T0S1 25.43 c 32.03 cd 37.03 c 44.63 c
T0S2 24.10 d 30.57 f 35.48 d 41.40 e
T0S3 22.80 f 28.57 h 33.10 e 36.37 h
T1S1 26.10 b 32.40 bc 38.00 b 44.07 c
T1S2 24.27 d 30.73 f 35.37 d 42.70 d
T1S3 23.43 e 28.93 gh 33.42 e 38.57 g
T2S1 27.87 a 32.87 b 38.43 b 46.73 b
T2S2 24.87 c 30.93 ef 35.53 d 42.80 d
T2S3 24.03 d 29.13 gh 34.03 e 40.20 f
T3S1 28.33 a 35.53 a 40.60 a 47.93 a
T3S2 25.03 c 31.57 de 36.83 c 44.53 c
T3S3 24.03 d 29.57 g 35.23 d 41.70 e
LSD0.05 0.5487 0.7164 0.9087 0.5792
CV(%) 9.38 8.80 7.98 7.82 Means in a column followed by the same letter do not differ significantly at 5% level
T0 = S0B0ZnO (kg/ha) T1 = S15B2Zn5 (kg/ha) T2 = S20B4Zn10 (kg/ha) T3 = S25B6Zn15 (kg/ha)
S1 = 10 cm × 10 cm S2 = 15 cm × 10 cm S3 = 15 cm × 15 cm
Table 2. Combined effect of different micro nutrients and spacing on leaves per plant at different days after sowing of garlic
Treatments Number of leaves per plant
30 DAS 45 DAS 60 DAS 75 DAS
T0S1 3.60 f 4.47 e 4.80 e 5.87 f
T0S2 3.73 de 4.77 cd 5.23 d 6.10 de
T0S3 3.87 bc 4.93 bc 5.37 cd 6.33 bc
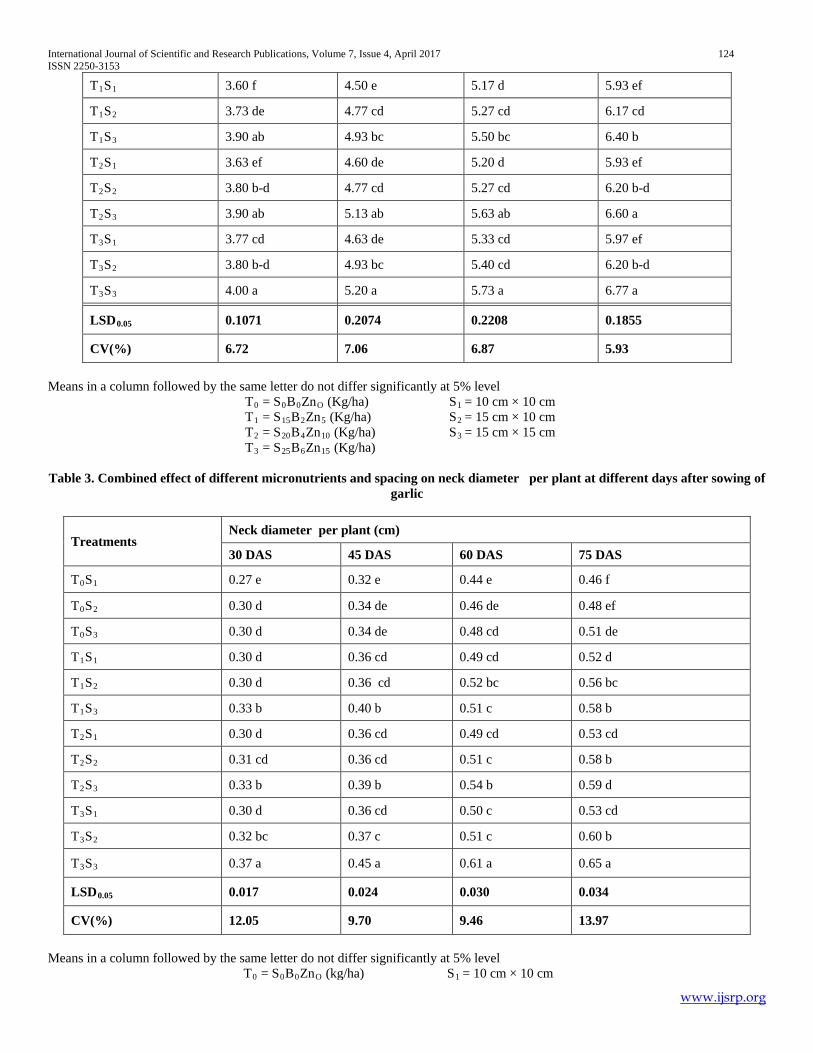
International Journal of Scientific and Research Publications, Volume 7, Issue 4, April 2017 124 ISSN 2250-3153
www.ijsrp.org
T1S1 3.60 f 4.50 e 5.17 d 5.93 ef
T1S2 3.73 de 4.77 cd 5.27 cd 6.17 cd
T1S3 3.90 ab 4.93 bc 5.50 bc 6.40 b
T2S1 3.63 ef 4.60 de 5.20 d 5.93 ef
T2S2 3.80 b-d 4.77 cd 5.27 cd 6.20 b-d
T2S3 3.90 ab 5.13 ab 5.63 ab 6.60 a
T3S1 3.77 cd 4.63 de 5.33 cd 5.97 ef
T3S2 3.80 b-d 4.93 bc 5.40 cd 6.20 b-d
T3S3 4.00 a 5.20 a 5.73 a 6.77 a LSD0.05 0.1071 0.2074 0.2208 0.1855
CV(%) 6.72 7.06 6.87 5.93
Means in a column followed by the same letter do not differ significantly at 5% level
T0 = S0B0ZnO (Kg/ha) T1 = S15B2Zn5 (Kg/ha) T2 = S20B4Zn10 (Kg/ha) T3 = S25B6Zn15 (Kg/ha)
S1 = 10 cm × 10 cm S2 = 15 cm × 10 cm S3 = 15 cm × 15 cm
Table 3. Combined effect of different micronutrients and spacing on neck diameter per plant at different days after sowing of
garlic
Treatments Neck diameter per plant (cm)
30 DAS 45 DAS 60 DAS 75 DAS
T0S1 0.27 e 0.32 e 0.44 e 0.46 f
T0S2 0.30 d 0.34 de 0.46 de 0.48 ef
T0S3 0.30 d 0.34 de 0.48 cd 0.51 de
T1S1 0.30 d 0.36 cd 0.49 cd 0.52 d
T1S2 0.30 d 0.36 cd 0.52 bc 0.56 bc
T1S3 0.33 b 0.40 b 0.51 c 0.58 b
T2S1 0.30 d 0.36 cd 0.49 cd 0.53 cd
T2S2 0.31 cd 0.36 cd 0.51 c 0.58 b
T2S3 0.33 b 0.39 b 0.54 b 0.59 d
T3S1 0.30 d 0.36 cd 0.50 c 0.53 cd
T3S2 0.32 bc 0.37 c 0.51 c 0.60 b
T3S3 0.37 a 0.45 a 0.61 a 0.65 a
LSD0.05 0.017 0.024 0.030 0.034
CV(%) 12.05 9.70 9.46 13.97
Means in a column followed by the same letter do not differ significantly at 5% level
T0 = S0B0ZnO (kg/ha) S1 = 10 cm × 10 cm
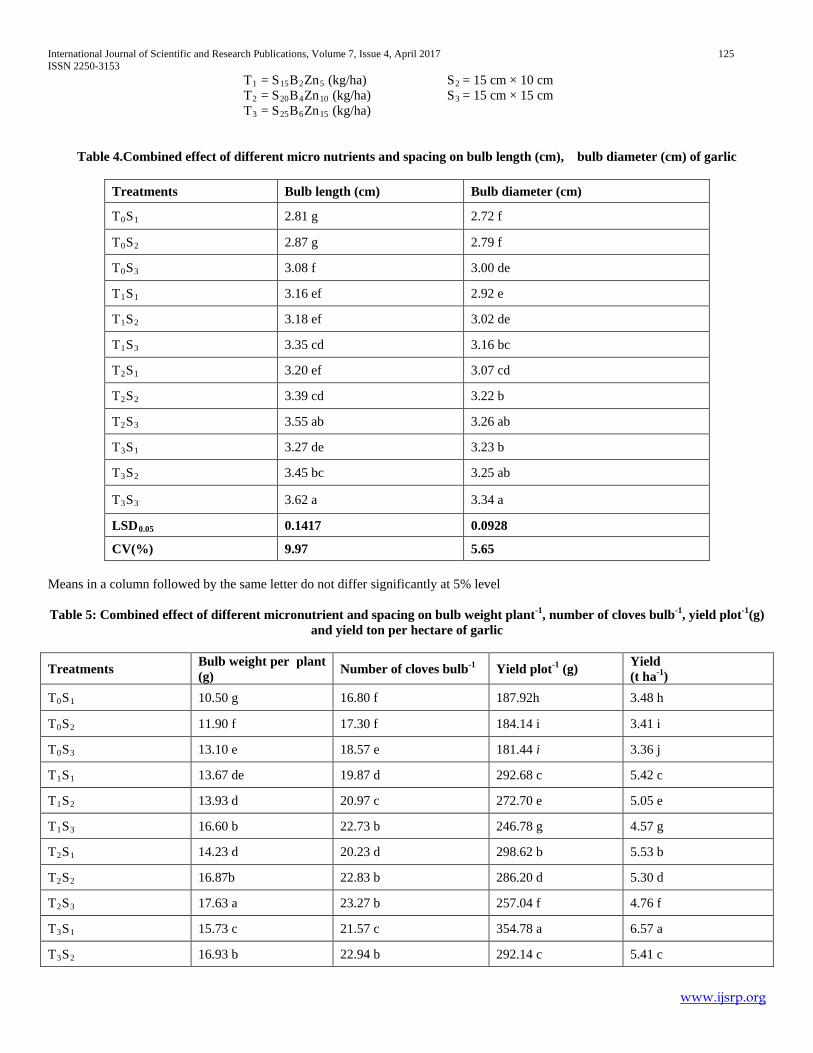
International Journal of Scientific and Research Publications, Volume 7, Issue 4, April 2017 125 ISSN 2250-3153
www.ijsrp.org
T1 = S15B2Zn5 (kg/ha) T2 = S20B4Zn10 (kg/ha) T3 = S25B6Zn15 (kg/ha)
S2 = 15 cm × 10 cm S3 = 15 cm × 15 cm
Table 4.Combined effect of different micro nutrients and spacing on bulb length (cm), bulb diameter (cm) of garlic
Treatments Bulb length (cm) Bulb diameter (cm)
T0S1 2.81 g 2.72 f
T0S2 2.87 g 2.79 f
T0S3 3.08 f 3.00 de
T1S1 3.16 ef 2.92 e
T1S2 3.18 ef 3.02 de
T1S3 3.35 cd 3.16 bc
T2S1 3.20 ef 3.07 cd
T2S2 3.39 cd 3.22 b
T2S3 3.55 ab 3.26 ab
T3S1 3.27 de 3.23 b
T3S2 3.45 bc 3.25 ab
T3S3 3.62 a 3.34 a
LSD0.05 0.1417 0.0928
CV(%) 9.97 5.65 Means in a column followed by the same letter do not differ significantly at 5% level Table 5: Combined effect of different micronutrient and spacing on bulb weight plant-1, number of cloves bulb-1, yield plot-1(g)
and yield ton per hectare of garlic
Treatments Bulb weight per plant (g) Number of cloves bulb-1 Yield plot-1 (g) Yield
(t ha-1) T0S1 10.50 g 16.80 f 187.92h 3.48 h
T0S2 11.90 f 17.30 f 184.14 i 3.41 i
T0S3 13.10 e 18.57 e 181.44 i 3.36 j
T1S1 13.67 de 19.87 d 292.68 c 5.42 c
T1S2 13.93 d 20.97 c 272.70 e 5.05 e
T1S3 16.60 b 22.73 b 246.78 g 4.57 g
T2S1 14.23 d 20.23 d 298.62 b 5.53 b
T2S2 16.87b 22.83 b 286.20 d 5.30 d
T2S3 17.63 a 23.27 b 257.04 f 4.76 f
T3S1 15.73 c 21.57 c 354.78 a 6.57 a
T3S2 16.93 b 22.94 b 292.14 c 5.41 c

International Journal of Scientific and Research Publications, Volume 7, Issue 4, April 2017 126 ISSN 2250-3153
www.ijsrp.org
T3S3 18.20 a 23.99 a 270.54 e 5.01 e
LSD0.05 0.5987 0.6731 2.033 0.041
CV (%) 14.91 12.61 8.36 7.59
Means in a column followed by the same letter do not differ significantly at 5% level T0 = S0B0ZnO (kg/ha) T1 = S15B2Zn5 (kg/ha) T2 = S20B4Zn10 (kg/ha) T3 = S25B6Zn15 (kg/ha)
S1 = 10 cm × 10 cm S2 = 15 cm × 10 cm S3 = 15 cm × 15 cm
Table 6. Economic performances regarding gross return, net return and benefit cost ratio (BCR) of garlic
Treatment Cost of production (Tk. ha-1)
Yield (t ha-1)
Gross return (Tk. ha-1)*
Net return (Tk. ha-1) BCR
T0S1 98649 3.48 139200 40551 1.41 T0S2 89719 3.41 136400 46681 1.52 T0S3 83022 3.36 134400 51378 1.62 T1S1 100569 5.42 216800 116231 2.16 T1S2 91639 5.05 202000 110361 2.20 T1S3 84942 4.57 182800 97858 2.15 T2S1 102488 5.53 221200 118712 2.16 T2S2 93559 5.30 212000 118441 2.27 T2S3 86862 4.76 190400 103538 2.19 T3S1 104408 6.57 262800 158392 2.52 T3S2 95479 5.41 216400 120921 2.27 T3S3 88781 5.01 200400 111619 2.26
* Selling cost = 40.00 Tk.kg-1
T0 = S0B0ZnO (kg/ha) T1 = S15B2Zn5 (kg/ha) T2 = S20B4Zn10 (kg/ha) T3 = S25B6Zn15 (kg/ha)
S1 = 10 cm × 10 cm S2 = 15 cm × 10 cm S3 = 15 cm × 15 cm
International Journal of Scientific and Research Publications, Volume 7, Issue 4, April 2017 127 ISSN 2250-3153
www.ijsrp.org
Investigation of in vitroSunscreen Activity and Phytochemical Profile of Flueggealeucopyrus (Willd)
L.S. Perera*, W.D. Ratnasooriya**, R.N. Pathirana**
* School of Biomedical Science and Physiology, University of Wolverhampton, Wulfruna Street, Wolverhampton, WV1 1LY, UK. **Department of Basic Sciences, General Sir John Kotelawala Defence University, Werahera, Sri Lanka.
Abstract- This study was directed to evaluate the in vitro sunscreen potential of Sri Lankan medicinal plant - Flueggealeucopyrus (In Sinhala – Katupila, In Tamil – Mulluppulatti) (Family: Phyllanthaceae)using in vitro UV spectroscopic techniques and Mansur equation with 0.2 and 0.4 mg mL-1 methanolic extracts of the plant leaves. A methanol soluble fraction of Dermatone® (0.2 and 0.4 mg mL-1) was used as the reference agent. The results revealed high absorbance levels of methanolic extract of the plant leaves at 290-320 nm (UVB) range and SPF (Sun Protection Factor) was determined as 14.63/ 27.04 respectively for the 0.2mg mL-1 and 0.4 mg mL-1 concentrations, which is a novel finding, while Dermatone® exhibited a SPF value of 14.03/ 25.32. It can be concluded that F.leucopyrus leaves have a high sun protection activity which is possibly mediated via antioxidant activity of existing phytochemicals; phenols, flavonoids, alkaloids and tannins which was revealed by the phytochemical screening. Index Terms-antioxidants, flueggealeucopyrus, photo-protection, sun protection factor (SPF), sun protection, sunscreen, UV B rays
I. INTRODUCTION Sunlight is the foundation of our existence. Since the beginning of the earth, it played a crucial part for the formation and evolution of life [1]. Sunlight is a part of the electromagnetic radiation which produced by sun. The fraction which reaches the earth can be divided into three categories, including ultraviolet radiation (UVR), visible (Vis) and infrared (IR) which occupies 6%, 52% and 42% respectively [2]. The stratospheric ozone layer absorbs the most energetic form of UVR before reaching the earth surface. This form is known as UVC (100 – 290 nm) [1], [3]. UVR which normally impact on the surface of earth include 5% of UVB (290 – 320 nm) and 95% UVA (320 – 400 nm) [1]. Human skin interacts with UVR in several ways. Initiation of cosmetic tanning is one of them [4]. Tanning by UVA does not involve with melanin production or photo-protection. Tanning by UVB provides photo-protection ability to the skin as it increases the melanin concentration [5]. This way, skin act as a natural sunscreen which protects the body from harmful UVR. Further, as a major advantage of UV radiation, UVB induced of vitamin D production can be indicated. Over 90% of the vitamin D required for the human body is produced by a complex
mechanism which involves bowel epithelium, liver, kidney and the skin [4]. Also, sunlight can be used as a treatment for some diseases and conditions (Heliotherapy) [6]. Some human skin diseases, such as atopic dermatitis and localized scleroderma, can be treated with Heliotherapy or artificial UV radiation (Phototherapy) [5]. Phototherapy has the ability to suppress multiple sclerosis independently of vitamin D synthesis [7]. Also it can be used to treat numerous diseases, including rickets [8], psoriasis [9], eczema [10] and neonatal jaundice [11]. UVB and UVA both have the ability to produce various free radicals in human skin cells. Nitric oxide (NO۰), a gaseous free radical generate in skin by UVA exposure suppress the apoptosis in low concentrations [12]. It is also a good high blood pressure reliever and it indirectly influence on the transmittance of nerve signals [5]. NO۰ gas can be used as an antibacterial in burn injuries and chronic ulcers which indicate rapid wound healing properties [13], [14]. Excessive exposure to UVR can result acute and chronic conditions. In past few decades rate of skin cancer has been massively increased [15]. Free radicals which generates through UVB radiation reduces a considerable amount of the antioxidants present in skin. This decreases the ability of skin to protect itself from free radical generation [16] and it loses the fibrous tissue which can lead to wrinkling and photo-aging after a long term UVR exposure. This can lead to photodermatitis, actinic keratosis and skin cancer. According to the WHO Ultraviolet Radiation and the INTERSUN program, 2-3 million non-melanoma cancers and about 130,000 malignant melanomas are diagnosed annually. 66,000 deaths are recorded every year due to various types of skin cancer. [17]. UVA initiate the mass production of ROS (reactive oxygen species) and RNS (reactive nitrogen species). Hydroxyl ions which generate through a procedure called “Fenton reaction” can damage DNA massively. Various types of oxidative DNA lesions including altered DNA bases, single and double stranded breaks and DNA + protein crosslinks can be provoked by ROS and RNS due to the high diffusibility of DNA [3]. Cells that bear the DNA which cannot be recovered by base excision repair (BER) and nuclear excision repair (NER) go through apoptosis to prevent the spreading of the mutation. But some cells can escapes the mechanism and this can lead to malignancies [18]. To minimize these adverse effects caused by UVR, dermatologists recommend using a broadspectrum sunscreen which has a higher SPF.The term Sun Protection Factor (SPF)
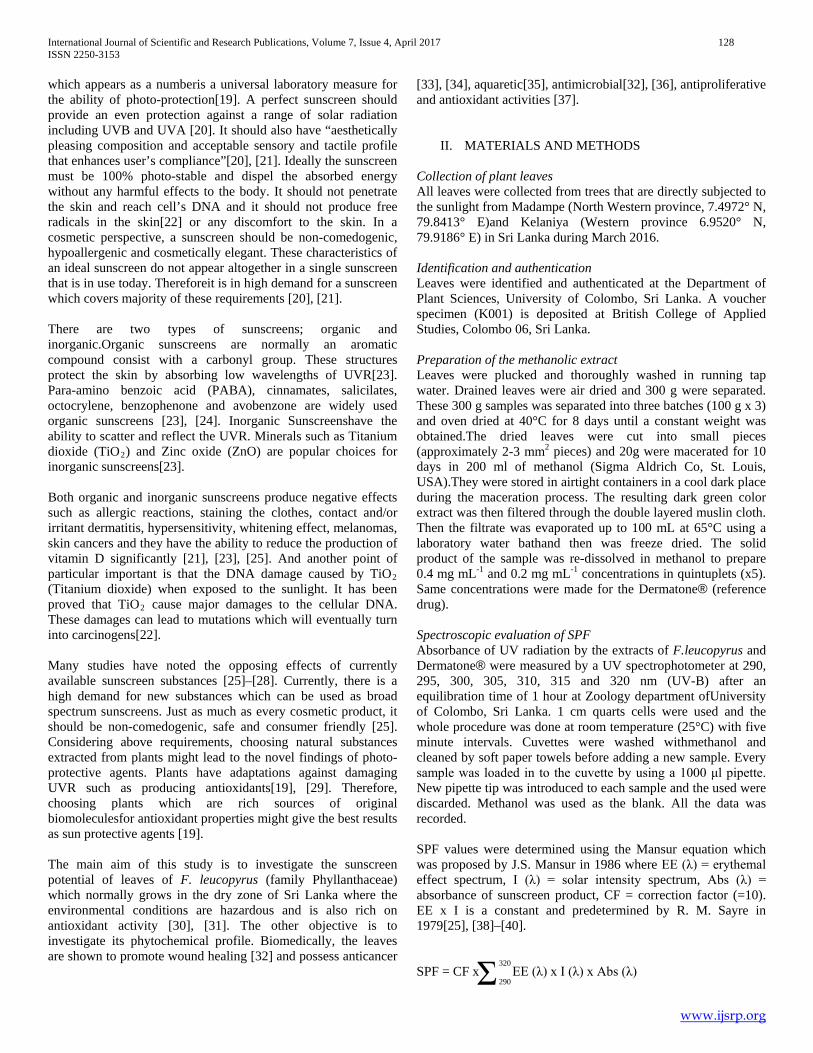
International Journal of Scientific and Research Publications, Volume 7, Issue 4, April 2017 128 ISSN 2250-3153
www.ijsrp.org
which appears as a numberis a universal laboratory measure for the ability of photo-protection[19]. A perfect sunscreen should provide an even protection against a range of solar radiation including UVB and UVA [20]. It should also have “aesthetically pleasing composition and acceptable sensory and tactile profile that enhances user’s compliance”[20], [21]. Ideally the sunscreen must be 100% photo-stable and dispel the absorbed energy without any harmful effects to the body. It should not penetrate the skin and reach cell’s DNA and it should not produce free radicals in the skin[22] or any discomfort to the skin. In a cosmetic perspective, a sunscreen should be non-comedogenic, hypoallergenic and cosmetically elegant. These characteristics of an ideal sunscreen do not appear altogether in a single sunscreen that is in use today. Thereforeit is in high demand for a sunscreen which covers majority of these requirements [20], [21]. There are two types of sunscreens; organic and inorganic.Organic sunscreens are normally an aromatic compound consist with a carbonyl group. These structures protect the skin by absorbing low wavelengths of UVR[23]. Para-amino benzoic acid (PABA), cinnamates, salicilates, octocrylene, benzophenone and avobenzone are widely used organic sunscreens [23], [24]. Inorganic Sunscreenshave the ability to scatter and reflect the UVR. Minerals such as Titanium dioxide (TiO2) and Zinc oxide (ZnO) are popular choices for inorganic sunscreens[23]. Both organic and inorganic sunscreens produce negative effects such as allergic reactions, staining the clothes, contact and/or irritant dermatitis, hypersensitivity, whitening effect, melanomas, skin cancers and they have the ability to reduce the production of vitamin D significantly [21], [23], [25]. And another point of particular important is that the DNA damage caused by TiO2 (Titanium dioxide) when exposed to the sunlight. It has been proved that TiO2 cause major damages to the cellular DNA. These damages can lead to mutations which will eventually turn into carcinogens[22]. Many studies have noted the opposing effects of currently available sunscreen substances [25]–[28]. Currently, there is a high demand for new substances which can be used as broad spectrum sunscreens. Just as much as every cosmetic product, it should be non-comedogenic, safe and consumer friendly [25]. Considering above requirements, choosing natural substances extracted from plants might lead to the novel findings of photo-protective agents. Plants have adaptations against damaging UVR such as producing antioxidants[19], [29]. Therefore, choosing plants which are rich sources of original biomoleculesfor antioxidant properties might give the best results as sun protective agents [19]. The main aim of this study is to investigate the sunscreen potential of leaves of F. leucopyrus (family Phyllanthaceae) which normally grows in the dry zone of Sri Lanka where the environmental conditions are hazardous and is also rich on antioxidant activity [30], [31]. The other objective is to investigate its phytochemical profile. Biomedically, the leaves are shown to promote wound healing [32] and possess anticancer
[33], [34], aquaretic[35], antimicrobial[32], [36], antiproliferative and antioxidant activities [37].
II. MATERIALS AND METHODS Collection of plant leaves All leaves were collected from trees that are directly subjected to the sunlight from Madampe (North Western province, 7.4972° N, 79.8413° E)and Kelaniya (Western province 6.9520° N, 79.9186° E) in Sri Lanka during March 2016. Identification and authentication Leaves were identified and authenticated at the Department of Plant Sciences, University of Colombo, Sri Lanka. A voucher specimen (K001) is deposited at British College of Applied Studies, Colombo 06, Sri Lanka. Preparation of the methanolic extract Leaves were plucked and thoroughly washed in running tap water. Drained leaves were air dried and 300 g were separated. These 300 g samples was separated into three batches (100 g x 3) and oven dried at 40°C for 8 days until a constant weight was obtained.The dried leaves were cut into small pieces (approximately 2-3 mm2 pieces) and 20g were macerated for 10 days in 200 ml of methanol (Sigma Aldrich Co, St. Louis, USA).They were stored in airtight containers in a cool dark place during the maceration process. The resulting dark green color extract was then filtered through the double layered muslin cloth. Then the filtrate was evaporated up to 100 mL at 65°C using a laboratory water bathand then was freeze dried. The solid product of the sample was re-dissolved in methanol to prepare 0.4 mg mL-1 and 0.2 mg mL-1 concentrations in quintuplets (x5). Same concentrations were made for the Dermatone® (reference drug). Spectroscopic evaluation of SPF Absorbance of UV radiation by the extracts of F.leucopyrus and Dermatone® were measured by a UV spectrophotometer at 290, 295, 300, 305, 310, 315 and 320 nm (UV-B) after an equilibration time of 1 hour at Zoology department ofUniversity of Colombo, Sri Lanka. 1 cm quarts cells were used and the whole procedure was done at room temperature (25°C) with five minute intervals. Cuvettes were washed withmethanol and cleaned by soft paper towels before adding a new sample. Every sample was loaded in to the cuvette by using a 1000 μl pipette. New pipette tip was introduced to each sample and the used were discarded. Methanol was used as the blank. All the data was recorded. SPF values were determined using the Mansur equation which was proposed by J.S. Mansur in 1986 where EE (λ) = erythemal effect spectrum, I (λ) = solar intensity spectrum, Abs (λ) = absorbance of sunscreen product, CF = correction factor (=10). EE x I is a constant and predetermined by R. M. Sayre in 1979[25], [38]–[40]. SPF = CF x EE (λ) x I (λ) x Abs (λ) Σ 320
290
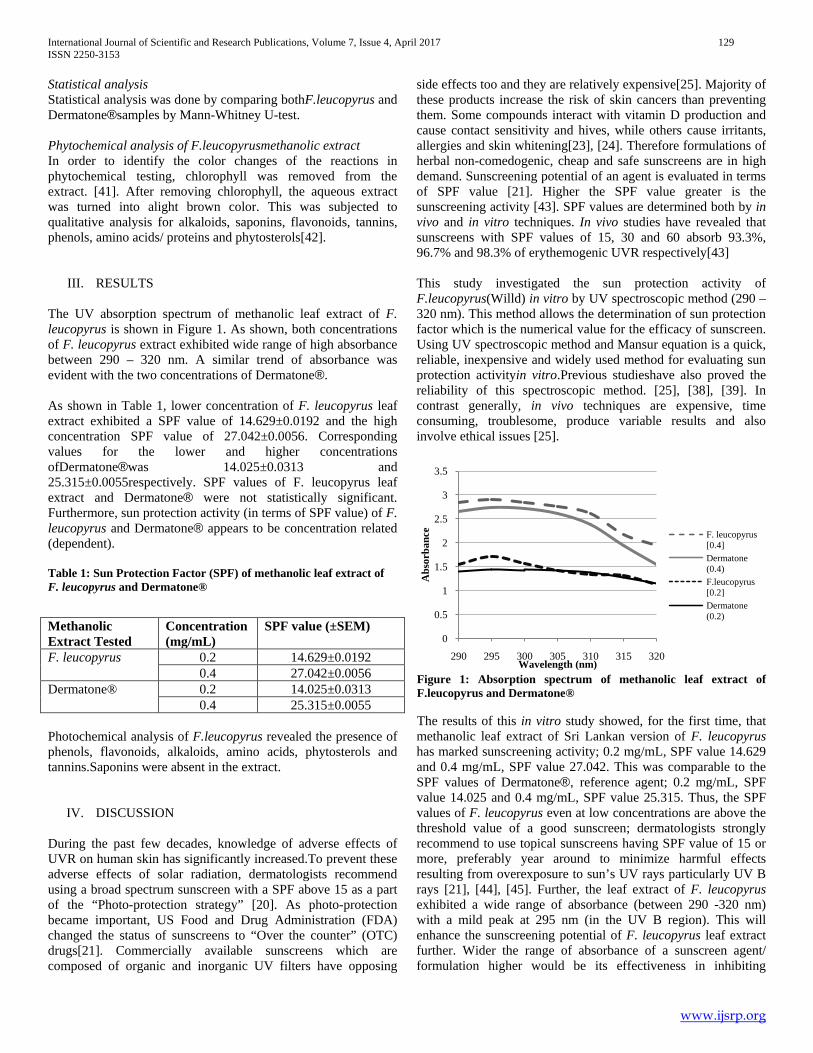
International Journal of Scientific and Research Publications, Volume 7, Issue 4, April 2017 129 ISSN 2250-3153
www.ijsrp.org
Statistical analysis Statistical analysis was done by comparing bothF.leucopyrus and Dermatone®samples by Mann-Whitney U-test. Phytochemical analysis of F.leucopyrusmethanolic extract In order to identify the color changes of the reactions in phytochemical testing, chlorophyll was removed from the extract. [41]. After removing chlorophyll, the aqueous extract was turned into alight brown color. This was subjected to qualitative analysis for alkaloids, saponins, flavonoids, tannins, phenols, amino acids/ proteins and phytosterols[42].
III. RESULTS The UV absorption spectrum of methanolic leaf extract of F. leucopyrus is shown in Figure 1. As shown, both concentrations of F. leucopyrus extract exhibited wide range of high absorbance between 290 – 320 nm. A similar trend of absorbance was evident with the two concentrations of Dermatone®. As shown in Table 1, lower concentration of F. leucopyrus leaf extract exhibited a SPF value of 14.629±0.0192 and the high concentration SPF value of 27.042±0.0056. Corresponding values for the lower and higher concentrations ofDermatone®was 14.025±0.0313 and 25.315±0.0055respectively. SPF values of F. leucopyrus leaf extract and Dermatone® were not statistically significant. Furthermore, sun protection activity (in terms of SPF value) of F. leucopyrus and Dermatone® appears to be concentration related (dependent). Table 1: Sun Protection Factor (SPF) of methanolic leaf extract of F. leucopyrus and Dermatone®
Photochemical analysis of F.leucopyrus revealed the presence of phenols, flavonoids, alkaloids, amino acids, phytosterols and tannins.Saponins were absent in the extract.
IV. DISCUSSION During the past few decades, knowledge of adverse effects of UVR on human skin has significantly increased.To prevent these adverse effects of solar radiation, dermatologists recommend using a broad spectrum sunscreen with a SPF above 15 as a part of the “Photo-protection strategy” [20]. As photo-protection became important, US Food and Drug Administration (FDA) changed the status of sunscreens to “Over the counter” (OTC) drugs[21]. Commercially available sunscreens which are composed of organic and inorganic UV filters have opposing
side effects too and they are relatively expensive[25]. Majority of these products increase the risk of skin cancers than preventing them. Some compounds interact with vitamin D production and cause contact sensitivity and hives, while others cause irritants, allergies and skin whitening[23], [24]. Therefore formulations of herbal non-comedogenic, cheap and safe sunscreens are in high demand. Sunscreening potential of an agent is evaluated in terms of SPF value [21]. Higher the SPF value greater is the sunscreening activity [43]. SPF values are determined both by in vivo and in vitro techniques. In vivo studies have revealed that sunscreens with SPF values of 15, 30 and 60 absorb 93.3%, 96.7% and 98.3% of erythemogenic UVR respectively[43] This study investigated the sun protection activity of F.leucopyrus(Willd) in vitro by UV spectroscopic method (290 – 320 nm). This method allows the determination of sun protection factor which is the numerical value for the efficacy of sunscreen. Using UV spectroscopic method and Mansur equation is a quick, reliable, inexpensive and widely used method for evaluating sun protection activityin vitro.Previous studieshave also proved the reliability of this spectroscopic method. [25], [38], [39]. In contrast generally, in vivo techniques are expensive, time consuming, troublesome, produce variable results and also involve ethical issues [25].
Figure 1: Absorption spectrum of methanolic leaf extract of F.leucopyrus and Dermatone®
The results of this in vitro study showed, for the first time, that methanolic leaf extract of Sri Lankan version of F. leucopyrus has marked sunscreening activity; 0.2 mg/mL, SPF value 14.629 and 0.4 mg/mL, SPF value 27.042. This was comparable to the SPF values of Dermatone®, reference agent; 0.2 mg/mL, SPF value 14.025 and 0.4 mg/mL, SPF value 25.315. Thus, the SPF values of F. leucopyrus even at low concentrations are above the threshold value of a good sunscreen; dermatologists strongly recommend to use topical sunscreens having SPF value of 15 or more, preferably year around to minimize harmful effects resulting from overexposure to sun’s UV rays particularly UV B rays [21], [44], [45]. Further, the leaf extract of F. leucopyrus exhibited a wide range of absorbance (between 290 -320 nm) with a mild peak at 295 nm (in the UV B region). This will enhance the sunscreening potential of F. leucopyrus leaf extract further. Wider the range of absorbance of a sunscreen agent/ formulation higher would be its effectiveness in inhibiting
0
0.5
1
1.5
2
2.5
3
3.5
290 295 300 305 310 315 320
Abs
orba
nce
Wavelength (nm)
F. leucopyrus [0.4]Dermatone (0.4)F.leucopyrus [0.2]Dermatone (0.2)
Methanolic Extract Tested
Concentration (mg/mL)
SPF value (±SEM)
F. leucopyrus 0.2 14.629±0.0192 0.4 27.042±0.0056
Dermatone® 0.2 14.025±0.0313 0.4 25.315±0.0055

International Journal of Scientific and Research Publications, Volume 7, Issue 4, April 2017 130 ISSN 2250-3153
www.ijsrp.org
sunburns (erythema) [43], [46]. Experimentally,F. leucopyrus leaves have been shown to possess strong anticancer properties [34], [47] and it is used in Sri Lankan traditional medicine to treat cancer [47]. This property should undoubtedly increase the potential of F. leucopyrus leaves as a sunscreen since some sunprotectives are known to induce skin cancers/ melanomas [22]. As UVB facilitate the production of free radicals such as OH·, O2·and HOO·[48], [49], it can reduces a considerable amount of the antioxidants present in skin[1], [16], [49]. Producing high levels of antioxidants is an adaptation of plants to the damaging UVR[19]. In order to find herbal photo-protective agents, research has been focused on their antioxidant activity[50]. Antioxidants are claimed to confer sun protection [51] and some sunscreen are formulated with antioxidants like Vitamin E [44]. High antioxidant properties of F.leucopyruswas revealed using inhibition of DPPH radical scavenging and 2-deoxy-D-ribose degradation assay[37]which could explain the photo-protective abilities of this plant.Antioxidant activities of plants are mediated via phyto-constituents such as phenolics; flavonoids/ tannins/ alkaloids and vitamin C[52]–[55]. This study revealed the presence of phenols, flavonoids and tannins in the methanolic extraction of F.leucopyrus along with phytosterols, amino acids and alkaloids. Thus the sunscreening activity of F. leucopyrus is likely to be mediated via synergistic antioxidant activities of phenolics, flavonoids and tannins. Presence of these phyto-constituents and the antioxidant properties of F.leucopyrus,shown by previous studies [37], might contribute to the high sun protective properties found on this study.
V. CONCLUSION In conclusion this study shows for the first time, considerable in vitro sunscreen activity of the methanolic leaf extract of Sri Lankan variety of F. leucopyrus. This activity together with its capacity to absorb wide range of UV rays, anticancer, antioxidant properties, makes it an ideal candidate to develop a novel, cheap, efficacious and cosmetically elegant sunscreen formulation. ACKNOWLEDGEMENT
The author acknowledges the contribution of everyone who guided and encouraged throughout this study; in particularly, Prof. W.D. Ratnasooriya and Prof. R.N. Pathirana and Ms. Surangi Fernando who provided their insight and expertise. Special thanks go to Dr.Inoka Perera,Dr.SujeewaHettihewa, Dr.CharithaGoonasekara and Mr. Chamara De Zoysafor sharing their pearls of wisdom that greatly assisted this research. REFERENCES [1] R. J. B. T.G. Polefka, T.A. Meyer, P.P. Agin, “Effects of
solar radiation on the skin.,” J. Cosmet. dermatologu, vol. 11, no. 2, pp. 134–143, 2011.
[2] M. Ichihashi, H. Ando, M. Yoshida, Y. Niki, and M. Matsui, “Photoaging of the skin,” anti aging Med., vol. 6, no. 6, pp. 46–59, 2009.
[3] A. Svobodová and J. Vostálová, “Solar radiation induced skin damage: review of protective and preventive options.,” Int. J. Radiat. Biol., vol. 86, no. 12, pp. 999–1030, 2010.
[4] M. K. B. Bogh, “Vitamin D production after UVB: aspects of UV-related and personal factors.,” Scand. J. Clin. Lab. Invest. Suppl., vol. 243, no. Suppl 243, pp. 24–31, 2012.
[5] A. Juzeniene and J. Moan, “Beneficial effects of UV radiation other than via vitamin D production,” Dermatoendocrinol., vol. 4, no. 2, pp. 109–117, 2012.
[6] R. Roelandts, “The history of phototherapy: Something new under the sun?,” J. Am. Acad. Dermatol., vol. 46, no. 6, pp. 926–930, 2002.
[7] P. Sundström and J. Salzer, “Vitamin D and multiple sclerosis-from epidemiology to prevention,” Acta Neurol. Scand., vol. 132, no. S199, pp. 56–61, 2015.
[8] M. F. Holick, “Resurrection of vitamin D and rickets,” J. Clin. Invest., vol. 116, no. 8, pp. 2062–2072, 2006.
[9] F. Almutawa, N. Alnomair, Y. Wang, I. Hamzavi, and H. W. Lim, “Systematic review of UV-based therapy for psoriasis,” Am. J. Clin. Dermatol., vol. 14, no. 2, pp. 87–109, 2013.
[10] T. Gambichler, N. Othlinghaus, N. S. Tomi, T. Holland-Letz, S. Boms, M. Skrygan, P. Altmeyer, and A. Kreuter, “Medium-dose ultraviolet (UV) A1 vs. narrowband UVB phototherapy in atopic eczema: A randomized crossover study,” Br. J. Dermatol., vol. 160, no. 3, pp. 652–658, 2009.
[11] M. J. Maisels, B. Ch, A. F. Mcdonagh, and D. Ph, “Phototherapy for Neonatal Jaundice,” Lancet, vol. 295, no. 7651, pp. 825–826, 1970.
[12] R. Weller, “Nitric oxide: A key mediator in cutaneous physiology,” Clin. Exp. Dermatol., vol. 28, no. 5, pp. 511–514, 2003.
[13] A. B. Shekhter, V. A. Serezhenkov, T. G. Rudenko, A. V. Pekshev, and A. F. Vanin, “Beneficial effect of gaseous nitric oxide on the healing of skin wounds,” Nitric Oxide - Biol. Chem., vol. 12, no. 4, pp. 210–219, 2005.
[14] A. Ghaffari, C. C. Miller, B. McMullin, and A. Ghahary, “Potential application of gaseous nitric oxide as a topical antimicrobial agent,” Nitric Oxide - Biol. Chem., vol. 14, no. 1, pp. 21–29, 2006.
[15] Y. Matsumura and H. N. Ananthaswamy, “Toxic effects of ultraviolet radiation on the skin,” Toxicol. Appl. Pharmacol., vol. 195, no. 3, pp. 298–308, 2004.
[16] A. Svobodova, D. Walterova, and J. Vostalova, “Ultraviolet light induced alteration to the skin.,” Biomed. Pap. Med. Fac. Univ. Palack??, Olomouc, Czechoslov., vol. 150, no. 1, pp. 25–38, 2006.
[17] WHO, “WHO | World Health Organization,” WHO, 2016.
[18] G.-Y. Liou and P. Storz, “Reactive oxygen species in cancer.,” Free Radic. Res., vol. 44, no. 5, pp. 479–96, 2010.
International Journal of Scientific and Research Publications, Volume 7, Issue 4, April 2017 131 ISSN 2250-3153
www.ijsrp.org
[19] M. Hupel, N. Poupart, and E. Ar Gall, “Development of a new in vitro method to evaluate the photoprotective sunscreen activity of plant extracts against high UV-B radiation,” Talanta, vol. 86, no. 1, pp. 362–371, 2011.
[20] A. Shehzad, S. Khan, and I. Hussain, “Sunscreens : some practical issues,” J. Pakistan Assoc. Dermatologists, vol. 24, no. 1, pp. 1–3, 2014.
[21] A. Abraham and S. Kaimal, “Sunscreens,” Indian J. Dermatology, Venereol. Leprol., vol. 77, no. 2, p. 238, 2011.
[22] N. Serpone, D. Dondi, and A. Albini, “Inorganic and organic UV filters: Their role and efficacy in sunscreens and suncare products,” Inorganica Chim. Acta, vol. 360, no. 3, pp. 794–802, 2007.
[23] R. Rai and C. R. Srinivas, “Photoprotection.,” Indian J. Dermatol. Venereol. Leprol., vol. 73, no. 2, pp. 73–9, 2007.
[24] K. L. Granger and P. R. Brown, “the Chemistry and Hplc Analysis of Chemical Sunscreen Filters in Sunscreens and Cosmetics,” vol. 24, no. 19, pp. 2895–2924, 2001.
[25] W. D. Ratnasooriya, R. N. Pathirana, A. S. Dissanayake, B. L. C. Samanmali, and P. K. Desman, “Evaluation of invitro sun screen activities of salt marshy plants Suaeda monoica , Suaeda maritima and Halosarcia indica,” vol. 5, no. 2, pp. 15–20, 2016.
[26] M. S. Díaz-Cruz and D. Barceló, “Chemical analysis and ecotoxicological effects of organic UV-absorbing compounds in aquatic ecosystems,” TrAC - Trends Anal. Chem., vol. 28, no. 6, pp. 708–717, 2009.
[27] M. Silvia Díaz-Cruz, M. Llorca, D. Barceló, and D. Barceló, “Organic UV filters and their photodegradates, metabolites and disinfection by-products in the aquatic environment,” TrAC - Trends Anal. Chem., vol. 27, no. 10, pp. 873–887, 2008.
[28] D. L. Giokas, A. Salvador, and A. Chisvert, “UV filters: From sunscreens to human body and the environment,” TrAC - Trends Anal. Chem., vol. 26, no. 5, pp. 360–374, 2007.
[29] M. Ali, R. Enayatifard, M. Khalili, and M. Ghaffarloo, “Correlation between Sun Protection Factor and Antioxidant Activity , Phenol and Flavonoid Contents of some Medicinal Plants,” vol. 13, no. May 2013, pp. 1041–1047, 2014.
[30] G. H. Krause, C. Schmude, H. Garden, O. Y. Koroleva, and K. Winter, “Effects of Solar Ultraviolet Radiation on the Potential Efficiency of Photosystem II in Leaves of Tropical Plants1,” Plant Physiol., vol. 121, no. December, pp. 1349–1358, 1999.
[31] G. H. Krause, A. Gallé, R. Gademann, and K. Winter, “Capacity of protection against ultraviolet radiation in sun and shade leaves of tropical forest plants,” Funct. Plant Biol., vol. 30, no. 5, pp. 533–542, 2003.
[32] T. Dudhamal, S. Gupta, V. Mahanta, and A. Ajmeer, “Katupila Securinega leucopyrus as a potential option for diabetic wound management,” J. Ayurveda Integr. Med., vol. 5, no. 1, p. 60, 2014.
[33] A. S. Mendis, I. Thabrew, S. R. Samarakoon, and K. H. Tennekoon, “Modulation of expression of heat shock proteins and apoptosis by Flueggea leucopyrus (Willd)
decoction in three breast cancer phenotypes,” BMC Complement. Altern. Med., vol. 15, no. 1, p. 404, 2015.
[34] S. D. E. Fernando, W. S. Karunaratne, D. B. M. Wickramarathne, W. A. R. T. Wickramarachchi, E. W. M. A. Ekanayake, and V. Thevanesam, “Flueggea Leucopyrus ( Katupila ) Showing Anti-Tumor Activity Against Plant Tumors Using Agrobacterium,” vol. 18, p. 2014, 2014.
[35] N. U. Ellepola, S. A. Deraniyagala, W. D. Ratnasooriya, and K. Perera, “Aqueous extract of flueggea leucopyrus increases urine output in rats,” Trop. J. Pharm. Res., vol. 14, no. 1, pp. 95–101, 2015.
[36] L. M. Bakshu, A. J. Ram, and R. R. V. Raju, “Antimicrobial activity of Securinega leucopyrus,” Fitoterapia, vol. 72, no. 8, pp. 930–933, 2001.
[37] P. Soysa, I. S. De Silva, and J. Wijayabandara, “Evaluation of antioxidant and antiproliferative activity of Flueggea leucopyrus Willd (katupila).,” BMC Complement. Altern. Med., vol. 14, no. 1, p. 274, 2014.
[38] E. A. Dutra, D. Almança, E. R. M. Kedor-, M. Inês, and R. Miritello, “Determination of sun protection factor ( SPF ) of sunscreens by ultraviolet spectrophotometry,” Brazilian J. Pharm. Sci., vol. 40, no. 3, pp. 381–385, 2004.
[39] C. Malsawmtluangi, D. K. Nath, I. Jamatia, E. Z. Lianhimgthangi, and L. Pachuau, “Determination of Sun Protection Factor (SPF) number of some aqueous herbal extracts,” J. Appl. Pharm. Sci., vol. 3, no. 9, pp. 150–151, 2013.
[40] R. M. Sayre, P. P. Agin, G. J. LeVee, and E. Marlowe, “A COMPARISON OF IN VIVO AND IN VITRO TESTING OF SUNSCREENING FORMULAS,” Photochem. Photobiol., vol. 29, no. 3, pp. 559–566, Mar. 1979.
[41] P. J. Houghton and A. Raman, Laboratory handbook for the fractionation of natural extracts. Chapman & Hall, 1998.
[42] N. R. Farnsworth, “Biological and Phytochemical Screening of Plants,” J. Pharm. Sci., vol. 55, no. 3, pp. 225–276, Mar. 1966.
[43] D. Reinau, U. Osterwalder, E. Stockfleth, and C. Surber, “The meaning and implication of sun protection factor,” Br. J. Dermatol., vol. 173, no. 5, p. 1345, 2015.
[44] J. Kockler, M. Oelgemöller, S. Robertson, and B. D. Glass, “Photostability of sunscreens,” J. Photochem. Photobiol. C Photochem. Rev., vol. 13, no. 1, pp. 91–110, 2012.
[45] L. Araújo, S. Curty, A. Moreira, A. Rossi, N. Raposo, U. Vaz, and H. Polonini, “Development of Broad-Spectrum Natural Sunscreens using Combinations of five Plant Species,” vol. 8, no. 2, pp. 144–148, 2016.
[46] L. Mbanga, M. Mulenga, P. T. Mpiana, K. Bokolo, M. Mumbwa, and K. Mvingu, “Determination of Sun Protection Factor ( SPF ) of Some Body Creams and Lotions Marketed in Kinshasa by Ultraviolet Spectrophotometry,” Int. J. Adv. Res. Chem. Sci., vol. 1, no. 8, pp. 7–13, 2014.
[47] S. R. Samarakoon, S. B. Kotigala, I. Gammana-Liyanage, I. Thabrew, K. H. Tennekoon, A. Siriwardana,

International Journal of Scientific and Research Publications, Volume 7, Issue 4, April 2017 132 ISSN 2250-3153
www.ijsrp.org
and P. B. Galhena, “Cytotoxic and apoptotic effect of the decoction of the aerial parts of Flueggea leucopyrus on human endometrial carcinoma (AN3CA) cells,” Trop. J. Pharm. Res., vol. 13, no. 6, pp. 873–880, 2014.
[48] V. T. Natarajan, P. Ganju, A. Ramkumar, R. Grover, and R. S. Gokhale, “Multifaceted pathways protect human skin from UV radiation.,” Nat. Chem. Biol., vol. 10, no. 7, pp. 542–51, 2014.
[49] K. Jung, M. Seifert, T. Herrling, and J. Fuchs, “UV-generated free radicals (FR) in skin: Their prevention by sunscreens and their induction by self-tanning agents,” Spectrochim. Acta - Part A Mol. Biomol. Spectrosc., vol. 69, no. 5, pp. 1423–1428, 2008.
[50] R. Korać and K. Khambholja, “Potential of herbs in skin protection from ultraviolet radiation,” Pharmacogn. Rev., vol. 5, no. 10, p. 164, 2011.
[51] Y. Wu, M. S. Matsui, J. Z. S. Chen, X. Jin, C. M. Shu, G. Y. Jin, G. H. Dong, Y. K. Wang, X. H. Gao, H. D. Chen, and Y. H. Li, “Antioxidants add protection to a broad-spectrum sunscreen,” Clin. Exp. Dermatol., vol. 36, no. 2, pp. 178–187, 2011.
[52] M. Kopjar, M. Orsolic, and V. Pilizota, “Anthocyanins, phenols, and antioxidant activity of sour cherry puree extracts and their stability during storage,” Int. J. Food Prop., vol. 17, no. 6, pp. 1393–1405, 2014.
[53] A. Czyzowska, E. Klewicka, E. Pogorzelski, and A. Nowak, “Polyphenols, vitamin C and antioxidant activity
in wines from Rosa canina L. and Rosa rugosa Thunb.,” J. Food Compos. Anal., vol. 39, pp. 62–68, 2015.
[54] H. S. Chung and J. C. Shin, “Characterization of antioxidant alkaloids and phenolic acids from anthocyanin-pigmented rice (Oryza sativa cv. Heugjinjubyeo),” Food Chem., vol. 104, no. 4, pp. 1670–1677, 2007.
[55] W. H. Wong, W. X. Lee, R. N. Ramanan, L. H. Tee, K. W. Kong, C. M. Galanakis, J. Sun, and K. N. Prasad, “Two level half factorial design for the extraction of phenolics, flavonoids and antioxidants recovery from palm kernel by-product,” Ind. Crops Prod., vol. 63, pp. 238–248, 2015.
AUTHORS First Author – L.S. Perera, University of Wolverhampton, UK ([email protected]) Second Author – Prof. W.D. Ratnasooriya, Kotelawala Defence University, Sri Lanka. ([email protected]) Third Author – Prof. R.N. Pathirana,Kotelawala Defence University, Sri Lanka. ([email protected]). Correspondence Author – L.S. Perera, University of Wolverhampton, UK ([email protected]) +94715674953

International Journal of Scientific and Research Publications, Volume 7, Issue 4, April 2017 133 ISSN 2250-3153
www.ijsrp.org
Financial management function in the relevant Lybian institutions
Khalid Mohamed Durar
PhD, candidate Abstract- The necessity of the cooperation of all Libyan institutions with the different educational and training institutions by holding training courses for the financial jobs workers focusing on making financial decisions and financial planning and analyzing . Index Terms- Financial, Libyan institutions, management, jobs
I. INTRODUCTION inancial administration, like other administrative specialties, experienced important changes over years because of the
change and difference in economic and financial conditions in particular. Accordingly, the specialist`s views have changed in the financial field concerning the determining of the financial administration content as an academic approach, a specializing scientific field and as a post in application.The difficulty and complexity appear on trying to determine the content and scope the financial administration as a professional specialty in the field of administrative thought in general. The reason for this difficulty and complexity is due to the form of financial post itself which is practiced by the institution administration, the type of decisions demonstrating its approach, form and type of its inputs and outputs, and the aim or aims which it tries to achieve.
II. AIMS OF THE STUDY This study aims mainly to evaluate the functional role of the financial administration in Libyan institutions considering then as the most significant component of making administrative decisions, and the study and analyze the function of financial administration as practiced in these institutions (the practical reality) then to compare in with the theoretical frame of financial administration function which is recognized in financial literature. Method of data collecting: Direct (Primary) data: This side covered by the data collected. By the researcher for the first time from the study sample represented by preparing questionnaire or surrey sheets and interviewing some administration leaderships. Methods of data analysis: Data will be analyzed by using statistical methods and the statistical programmeSpss and other statistical methods. The problem and hypotheses of the study
The responsibilities taken by a financial manager differ in various institutions where we find that the financial manager always does financial jobs of some kind. But, it is clear that some important aspects of financial manager and his staff, for example the responsibility of making basic financial resolutions in one institutions may be taken by the members of the administrative board whereas this responsibility may be taken in another institution to the head of the administrative board or to a higher level than the institution level or out of its administration scope. Accordingly, if we take in consideration these matters and differences, we find that financial post performed by financial managers include only routine responsibilities and it is better to be classified as executive posts relating to financing not to financial administration in its real meaning.
III. THE RESULTS OF THE STUDY The personal motive of the study was the clear difference noticed by the researcher about the concept and nature of financial and administrative literature within the academic frame, since this practical observation of the works perforated by the financial administrationis restricted to the procedural aspects of financial job concerning registering and writing down the finished financial operators . The researcher aimed by this study to shed light on the financial job reality as the main component of making administrative decisions in Libyan institutions and show the extort of similarity and difference between the theoretical concepts ( academic frame ) of financial administration and the practical application reality of these concepts . The results of studying the reality of the financial administration in the Libyan institutions un tams of making decisions The following are the more important results concluded from analyzing data by the different statistical methods data had in chapter five of this study. The characteristics of the financial director in the relevant Libyan institutions The results indicate that the financial directors in the relevant Libyan institutions often have high educational levels . The results show the inclination of the scientific special lies of the financial directors in the relevant Libyan institution to the accountancy field at a percentage of 70% and the administration specialty decreasing to 3.3% while the percentage of economics financing and banking specialty is 26.7%
F
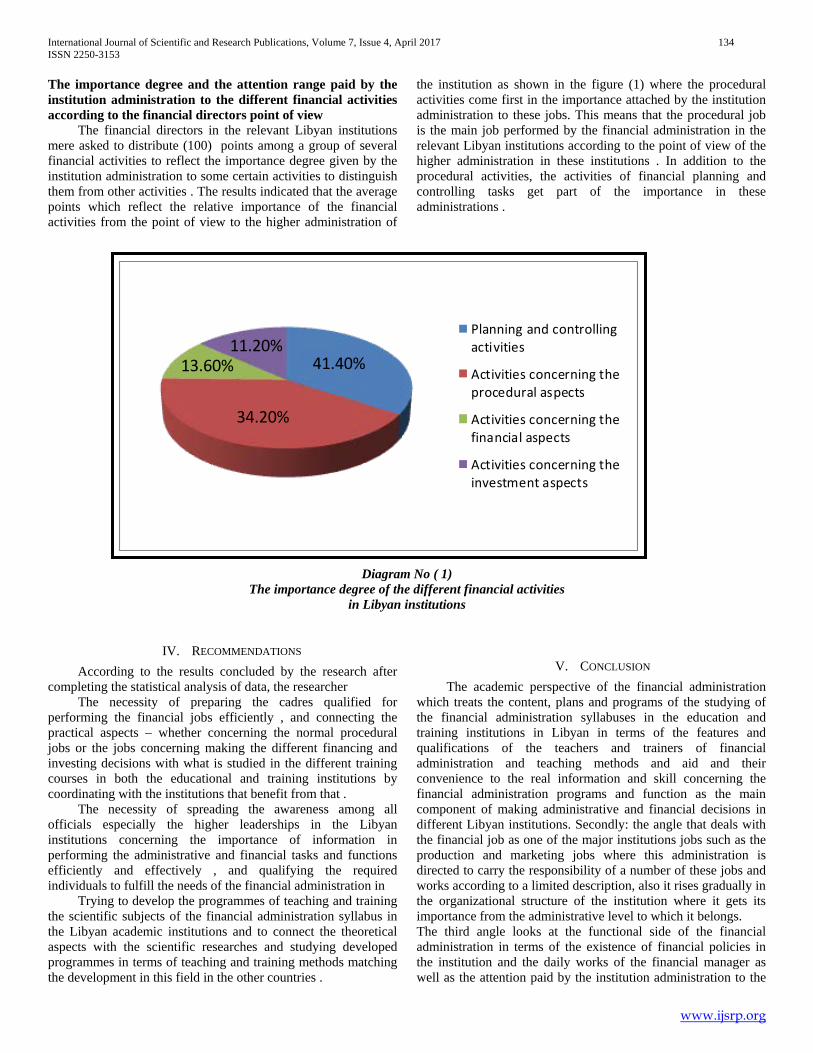
International Journal of Scientific and Research Publications, Volume 7, Issue 4, April 2017 134 ISSN 2250-3153
www.ijsrp.org
41.40%
34.20%
13.60%11.20%
Planning and controllingactivities
Activities concerning theprocedural aspects
Activities concerning thefinancial aspects
Activities concerning theinvestment aspects
The importance degree and the attention range paid by the institution administration to the different financial activities according to the financial directors point of view The financial directors in the relevant Libyan institutions mere asked to distribute (100) points among a group of several financial activities to reflect the importance degree given by the institution administration to some certain activities to distinguish them from other activities . The results indicated that the average points which reflect the relative importance of the financial activities from the point of view to the higher administration of
the institution as shown in the figure (1) where the procedural activities come first in the importance attached by the institution administration to these jobs. This means that the procedural job is the main job performed by the financial administration in the relevant Libyan institutions according to the point of view of the higher administration in these institutions . In addition to the procedural activities, the activities of financial planning and controlling tasks get part of the importance in these administrations .
Diagram No ( 1) The importance degree of the different financial activities
in Libyan institutions
IV. RECOMMENDATIONS According to the results concluded by the research after completing the statistical analysis of data, the researcher The necessity of preparing the cadres qualified for performing the financial jobs efficiently , and connecting the practical aspects – whether concerning the normal procedural jobs or the jobs concerning making the different financing and investing decisions with what is studied in the different training courses in both the educational and training institutions by coordinating with the institutions that benefit from that . The necessity of spreading the awareness among all officials especially the higher leaderships in the Libyan institutions concerning the importance of information in performing the administrative and financial tasks and functions efficiently and effectively , and qualifying the required individuals to fulfill the needs of the financial administration in Trying to develop the programmes of teaching and training the scientific subjects of the financial administration syllabus in the Libyan academic institutions and to connect the theoretical aspects with the scientific researches and studying developed programmes in terms of teaching and training methods matching the development in this field in the other countries .
V. CONCLUSION The academic perspective of the financial administration which treats the content, plans and programs of the studying of the financial administration syllabuses in the education and training institutions in Libyan in terms of the features and qualifications of the teachers and trainers of financial administration and teaching methods and aid and their convenience to the real information and skill concerning the financial administration programs and function as the main component of making administrative and financial decisions in different Libyan institutions. Secondly: the angle that deals with the financial job as one of the major institutions jobs such as the production and marketing jobs where this administration is directed to carry the responsibility of a number of these jobs and works according to a limited description, also it rises gradually in the organizational structure of the institution where it gets its importance from the administrative level to which it belongs. The third angle looks at the functional side of the financial administration in terms of the existence of financial policies in the institution and the daily works of the financial manager as well as the attention paid by the institution administration to the

International Journal of Scientific and Research Publications, Volume 7, Issue 4, April 2017 135 ISSN 2250-3153
www.ijsrp.org
different financial activities and the tools and methods upon which the finanial manager depends to perform his job, the aims of financial administration in the institution together with the jobs and tasks of financial administration and the problem it encounters during performing its work.
REFERENCES [1] Adel Abdul Hameed Al Jraidy (2000), “Reality of financial management
profession” unpublished Master Thesis, Faculty of Economy. GarYounisUniverity. pp 79-80.
[2] Hanna Razouqi As-Sayegh (1984), “General Financial Management and its Role in Managerial Development”, Arabic Magazine of Management
(Arabic Organization for Management Sciences, 8th volume, Number3) p 197.
[3] Mahmoud Husain Matar (1992), “Reality of Financial Management in Hospitals”, Magazine of General Management (31st January, Number73) p p 47-105.
[4] Jack Diamond and PokarKhemani OECD 2006 [5] CemDener, Joanna Alexandra Watkins, William Leslie Dorotinsky 2011 [6] Jack Diamond and PokarKhemani 2005International Monetary Fund
AUTHORS First Author – Khalid Mohamed Durar PhD, candidate
International Journal of Scientific and Research Publications, Volume 7, Issue 4, April 2017 136 ISSN 2250-3153
www.ijsrp.org
“Women empowerment: Boaster of Economic
Development”
(A study of working women in higher education)
Dr. Jyoti Khare Asst. Professor in Commerce, Govt. Degree .College, Raipur,
Dehradun, (Uttarakhand)
Email: [email protected]
Abstract- Although teaching is most preferable area for women
to be empowered, but women are grossly under-represented in
higher education till yet. Women are not able to give over their
time equally as men for improving their skill and knowledge
according to latest development in higher education due to dual
responsibilities. Through a study it is proved that participation of
female teachers is lesser (39%) than male teachers (61%). This
study highlights those factors that make the women immobilize
to complete their education of higher level and making the
advancement in career. By using primary and secondary data by
the researcher, the range of factors is divided into three
categories as barriers: Social, Psychological and Institutional
which mould the behavior of women and which make irrelevant
workplace values So, further, it has been tried to examine how
women can be empowered in higher education? What are the
special initiatives that should be taken by the organization and
the government? Govt. policies and plans of different authorities
& commission regarding higher education can be implemented in
such a way that women can contribute their immense
participation in the development of Indian
economy.
Index Terms- women empowerment, barriers, economic
development.
I. INTRODUCTION
After globalization, in India, the status of women socially, economically, politically, and generally— is much higher than in
early periods i.e. ancient and medieval. Now women experience greater freedom and voice, and participate more freely in public
affairs. It has changed the scenario of working women’s status. In spite of becoming easy to get the equal chance to work as men,
until women have economic liberty. Merely it is also true that they are still discriminated, harassed, humiliated, dominated and even
exploited. The Indian youth population is the largest in the macrocosm. Women comprise 48.5% of the working population. A study
focused, despite the fact that India has almost 250 million women in the working age group, but very few reach at the higher position
in Indian organizations. This shows a kind of Glass ceiling. To get the fabulous economic development it is important to infringe the
glass ceiling. It is needed to hold the intelligent and talented human beings for competing successfully in this globalized environment,
irrespective of race, gender or customs.
II. REVIEW OF LITERATURE Women empowerment is one of the most concerning area because the women are not parallel to men yet. They are empowered
in the terms of salary, position, recruitment and many more, in spite of that women are not able or not free to take their own decisions
regarding job, expenditure and so on. Many researches have been done earlier on the empowerment of women regarding different
aspects. In this paper researcher tried to understand and focused on those reasons which makes the empowerment of those women who
are working in colleges and universities poor. Women participation as professors is just 50% than male, while Government provides
equal opportunities to all at every step. Question arises why has gender pay gap seen? Why is lesser no. of females seen at higher
posts? National data collection agencies also accept the understate women's contribution as workers. A Commonwealth survey (1998)
reveals that the ratio of women is decreased drastically at the top level of academic and professional steps. This survey showed only
16.7% female professors in Uganda and 12.2% and 11.8% women professors are in Sri Lanka and Canada respectively. Some country
differences are discernible. According to Meyerson & Fletcher (2000), women at the highest levels of business are still rare. In India,
88% of women attract towards the science arts & commerce but as they go up in their career like engineering, only 1% women are
seen in this field (world conference on higher education, UNESCO, 2002). World conference on higher education, UNESCO (2002)
also reported that women are being appointed at the lecturer level but either they get stuck at this level or drop out from academic life
due to unable to combine family and academic commitments. Women today comprise only 2 per cent of the total managerial strength
in the Indian corporate sector (ILPC, 2010).Women rights are secured under the Constitution of India — mainly equality, dignity, and
freedom from discrimination; and also, India have various statutes governing the rights of women (Lalita Dhar Parihar.2011 ed
& Mamta Rao. 3rd 2012, ed). Women take up only 1 percent of boardroom seats in this country, compared to 13 percent in Australia,

International Journal of Scientific and Research Publications, Volume 7, Issue 4, April 2017 137
ISSN 2250-3153
www.ijsrp.org
8 percent in China and 5 percent in India (Bombuw ela P. M., De Alwis A. Chamaru, 2013). Even though women represent more than
half of the population in Sri Lanka, their labour force participation rate is less than men. Men’s participation in labour force is twice as
women’s participation (Bombuwela P. M., De Alwis A. Chamaru, 2013). Vinnicombe & O’Neil et al. (2014) stated that women
are unable to have advancement on the highest ranks of leadership due to lack of confidence, ignorance and further they
reported that the prevailing structures and systems make worse their work/life balance, life/career stage issues and put women
at a disadvantageous stage continuously (O’Neil et al., 2015). E. Mariana Setiadarma focused that Intrinsic and extrinsic factors
affect the participation of women in higher education management. In order to pave the way for women’s career advancement into the
senior ranks of organizations, attention must be directed at the systemic norms and structures that drive the gendered nature of the
workplace. The gender pay gap is the difference between male’s and female’s earnings. In 2008 the OECD found that the median
earnings of the full-time female workers were 17% lower than the earnings of their male counterparts. A focus on individual level
issues, i.e., women lacking confidence and women opting out, detracts from the work that must be done at the organizational level in
order to dismantle the system of pervasive, structural disadvantage facing women seeking to advance to senior positions (Deborah A.
O’Neil & Margaret M. Hopkins, 2015). India's higher education system is the third largest in the world, next to the United States and
China. There (in India) are 723 Universities, 36634 colleges and 11664 Stand Alone Institutions (AISHE, 2015). All India survey
on higher education mentioned in its report that the main governing body at the tertiary level is the University Grants Commission
(UGC), which enforces its standards, advises the government, and helps coordinate between the centre and the state. Development
policies and programs tend not to view women as integral to the economic development process. As of April 2016, the wage gap in
the United States was "79 cents for every dollar paid to men, amounting to an annual gender wage gap $10,762". Women engage in
productive work and earn incomes throughout in the developing world. Suma Chitnis also reported although the University Grants’
Commission and the Association of Indian Universities snuff out the different aspects of education in India, but there is no clear figure
of gender composition of different sectors. This is serious issue especially in the case of national commitment to increase the
participation of female folk in development and enhancement. This is the problem of not getting the absolute result of women
empowerment programs. From the review of literature it was identified that there is a need to be examine the discernible causes and
effect of dropping out the career from the advancement and to leave the wish of achieving key positions.
III. OBJECTIVES
1- To determine the status of working women regarding enrollment and participation at different level in Higher Education of
India.
2- To analyze those factors that become barriers for the working women in the advancement of the career or in reaching at higher
positions in the higher education.
3- To analyze the women empowerment program in decelerating the barriers and to focus on suggestions which improve the
participation of women in academic higher level.
IV. RESEARCH METHODOLOGY
Researcher tried to understand the barriers which are stopping stone in the advancement of career of working women in higher
education by using descriptive and exploratory research design. Data were collected through questionnaire. Before applying research,
pilot study was done and found feedback with new inputs. It helps the researcher to refine the questionnaire. Then questionnaire is
given to (convenience sample) women. Apart from the demographic information, the attitude of females regarding
barriers/discriminatory attitudes were measured. So researcher used questionnaire that is based on Likert scale This scale was made
using the five point Likert Method and carried twenty five statements; the responses could vary from ‘strongly agree’ to ‘strongly
disagree’. Both negative and positive statements were a part of the scale, and the scoring was given accordingly. Strongly agreeing to
feeling of effecting with social, institutional and psychological barriers had a score of five and who had no feeling/ no effect at all,
having the score of one. Apart from primary data, secondary data was also studied to examine the first and third objectives. Many
research papers, reports and debate on the status of working women in higher education & management were reviewed & discussed
with selected population and effect of women empowerment were also analyzed by the researcher
Sample Design:
To administer the questionnaire, population is taken from local area, Dehradun, Uttarakhand. Dehradun is an education hub.
Many private/ management/ government colleges and universities are here. The survey was carried out on 50 females working in co-
ed colleges including one private university situated in Dehradun. Sample of female teachers were randomly selected. The age groups
of correspondents whose are selected as sample, ranging from 25 years to 60 years. They were research scholar or holding the post of
assistant professor or associate professor or visiting/ contract faculty. Some of them (assistant professor) completed PhD, some
qualified NET, and some having both the degrees.
Results and findings of the study:
The researcher’s study depicts that it is not only happening in India but in abroad as well that Women get fewer
chances to upgrade their career who are working in universities and colleges. This table shows the post-wise participation of
female in universities & colleges in India.
TABLE: 1
All India Post Wise No. of teachers in Universities & colleges
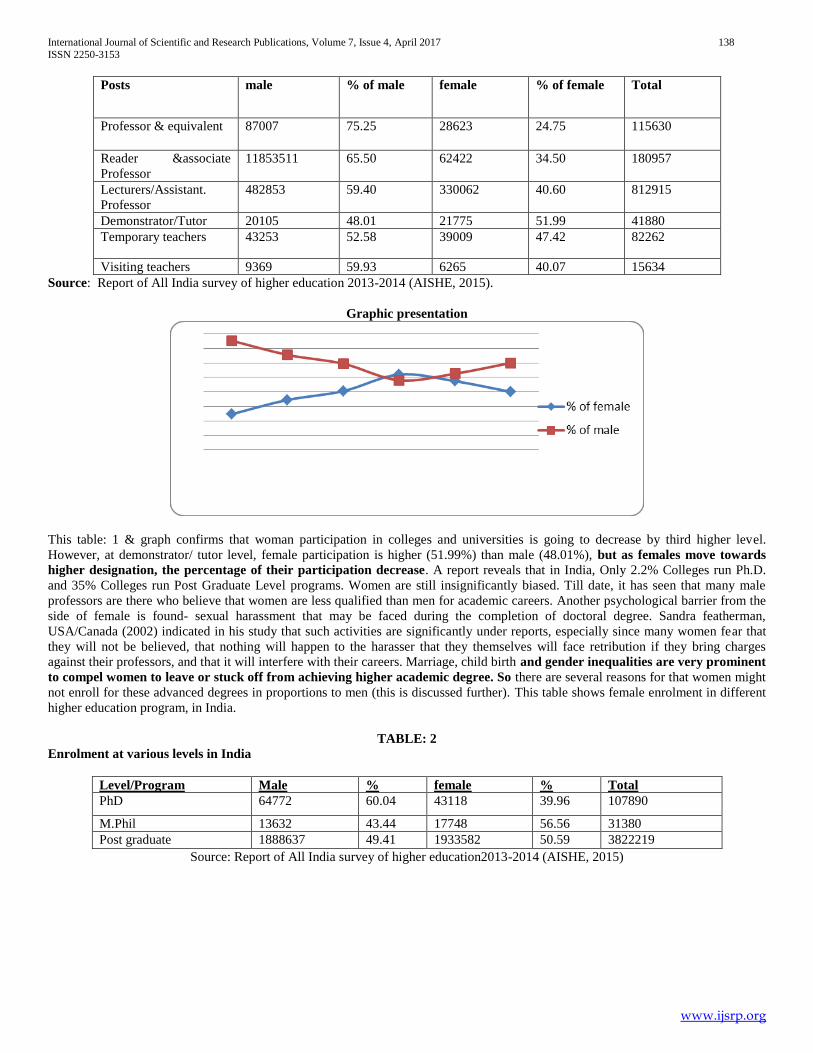
International Journal of Scientific and Research Publications, Volume 7, Issue 4, April 2017 138
ISSN 2250-3153
www.ijsrp.org
Posts male % of male female % of female Total
Professor & equivalent 87007 75.25 28623 24.75 115630
Reader &associate
Professor
11853511 65.50 62422 34.50 180957
Lecturers/Assistant.
Professor
482853 59.40 330062 40.60 812915
Demonstrator/Tutor 20105 48.01 21775 51.99 41880
Temporary teachers 43253 52.58 39009 47.42 82262
Visiting teachers 9369 59.93 6265 40.07 15634
Source: Report of All India survey of higher education 2013-2014 (AISHE, 2015).
Graphic presentation
This table: 1 & graph confirms that woman participation in colleges and universities is going to decrease by third higher level.
However, at demonstrator/ tutor level, female participation is higher (51.99%) than male (48.01%), but as females move towards
higher designation, the percentage of their participation decrease. A report reveals that in India, Only 2.2% Colleges run Ph.D.
and 35% Colleges run Post Graduate Level programs. Women are still insignificantly biased. Till date, it has seen that many male
professors are there who believe that women are less qualified than men for academic careers. Another psychological barrier from the
side of female is found- sexual harassment that may be faced during the completion of doctoral degree. Sandra featherman,
USA/Canada (2002) indicated in his study that such activities are significantly under reports, especially since many women fear that
they will not be believed, that nothing will happen to the harasser that they themselves will face retribution if they bring charges
against their professors, and that it will interfere with their careers. Marriage, child birth and gender inequalities are very prominent
to compel women to leave or stuck off from achieving higher academic degree. So there are several reasons for that women might
not enroll for these advanced degrees in proportions to men (this is discussed further). This table shows female enrolment in different
higher education program, in India.
TABLE: 2
Enrolment at various levels in India
Level/Program Male % female % Total
PhD 64772 60.04 43118 39.96 107890
M.Phil 13632 43.44 17748 56.56 31380
Post graduate 1888637 49.41 1933582 50.59 3822219
Source: Report of All India survey of higher education2013-2014 (AISHE, 2015)

International Journal of Scientific and Research Publications, Volume 7, Issue 4, April 2017 139
ISSN 2250-3153
www.ijsrp.org
Above table & graph explains that in the PG, and M.Phil. Programs, there are 50.59% and 56.56% female enrolled
respectively. This shows greater percentage of females’ enrolment than male (49.41and 43.44% respectively).But as we observe
higher ladder, in Ph.D. program, the percentage of female’s enrolment (39.96%) goes lesser as compared to male candidates(60.04%).
This might be due to special difficulties faced by female Ph.D. students like: lack of support, finance, grants and a high share of
domestic chores. And another most prominent is the social and family values- that bothers that a woman has to keep her husband’s
career at the first place, it forces women to leave academic programs, if a partner took a promotion, or was transferred to a job, in a
distant location.
Factors/barriers affecting the women to reach higher position
Teaching is the most preferable area of job for women, in spite of which women are facing many problems to reach higher
levels even in completing CAS (Career Advancement Scheme) activities, who are selected at higher post in colleges and universities.
So, there is a need to empower the women. In simple words, women empowerment is basically the concern of an environment where
women can make independent decision on their personal development as well as shine as equal society. According to Naila Kabeer,
empowerment is “the expansion in people’s ability to make strategic life choices in a context where this ability was previously denied
to them.” To understand the clear concept of empowerment it is important to demark certain overlapping concept. After above
discussion, the conclusion was drawn that there are three factors that explain the continuing absence of women in senior positions.
And which are the reasons of giving the poor result of women’s empowerment programmes. These factors are considered as the
barriers by the researcher. As under:
Reasons related to social barriers Reasons related to psychological,
personal and attitudinal barriers
Reasons related to Institutional and
structured barriers
Patriarchal effects
Parental values
Mindset of less preferable area
of job for women
Sole responsibility is of women
only to look after the children
and other family members
Less support from the side of
spouse as wife
Having the attitude of persons
centered
Lack of confidence due to less
exposure
Lack of self esteem due to less
networking
Phobia of occurring mistakes
due to adjustment of two-fold
responsibilities
Sacrificing & adjusting nature
Least networking
Under estimation of women’s
competence
Lack of proper attention
towards the women’s problem
Absence of proper legislation
Less participation of women in
promotional activities
‘Round the table’- excessive
male interference
To measure the real existence of these three factors of women’s attitude, twenty-five statements were prepared;
seven questions related to social discrimination, seven pertaining to psychological barrier, eleven to whether females found equal
opportunities to excel at their workplace i.e. institutional discrimination. Questionnaire was conducted (as explained in research
methodology). Table 3 clearly indicates the presence of barriers through mean value as shown below:

International Journal of Scientific and Research Publications, Volume 7, Issue 4, April 2017 140
ISSN 2250-3153
www.ijsrp.org
Table: 3
Analysis of barriers
Factors/barriers N Mean Std. Deviation CV
Social 50 4.128 0.6334 15.34
Psychological 50 3.577 0.6852 19.15
Institutional 50 3.284 0.6615 20.14
Source: Primary data
Table: 3 show the existence of all these barriers in the development and career advancement of females. The mean value
of these factors shows that the social factors are most prominent among them and the lowest influence factor being the institutional
factor. The Standard Deviation of social, psychological and institutional barriers are 0.6334, 0.6852 and 0.6615 respectively. The
coefficient of variation is of that barriers are also low. This indicates that the data is quite consistent and there is very little variation
around the mean. If we analyze the whole perception of working women about the situation, we get that 80% respondents disagree for
being a victim of sexual harassment but they accept the gender discrimination. About 85% respondents gave their consent for that due
to male- table authorities, remarkable/significant work are not allotted to females. Most of the respondents accept that they are
benefitted with government’s women empowerment facilities like CCL/FIP etc. They agree that it has improved their working but still
to attend FDP programs like OP/RC they have to manage a lot due other responsibilities. It shows the social barrier compelling the
women to give priority to the family (as proved with the highest mean value of social factor). After scrutinizing all responses, we can
say many changes are seen in the society. Parents are educating their female child up to higher level. But parents still feel that there
are only limited sectors that are safe for a female to work. And for them family comes first on responsibility for the women. That was
cleared by 80% respondents. Asking many questions regarding psychological barrier, the result depicts that 70%respondents feels
unsafe to stay at new places and mobility of women is less than man. They feel that lack of confidence is due to inability of mobility.
So in brief, results declare from the study that round table dominance in institutions, limitations of thinking about area of job for
female, family responsibility and lack of confidence are the most prominent reasons.
V. DISCUSSION AND CONCLUSION
In spite of women’s hard work, women have been given second importance in their field of work. Question arises now, are
the women empowered in true sense? This is the important area to be investigated. Not only Women’s monetary independence leads
them to the way to empowerment but empowered by socially and psychologically also. It leads to greater openness, generosity and
tolerance. This paper is also an attempt to prove the gender pay gap ( which is the concerning component of economic development
for every country), due to different barriers that compel to working women to leave their career in the mid way of academic life or
making disable the women in the advancement of career while it is accepted teaching is the most compatible profession for women.
Despite the empowerment given by the government to working women in higher education like CCL,ML, free education and many
research grant are provided, for updating themselves, the Gross Enrollment Ratio of male is greater e.i.23.9 % in the comparison of
female Gross enrollment Ratio(22.0%). Most competitive stream (science) does not attract the females as a students as well as being
research scholar. Generally it is seen that female attracts towards the social sciences stream. It may be due to lack of their confidence,
basic education, or due to less exposure or they want to scare themselves from the mess of two-fold tasks. One more thing is also
found that publish work of women is very less as men. Through study it reveals due to social ill, they couldn’t devote much of their
time as the demand of research work.
So, not only to empower the women by the government is sufficient, it should also be thought at the level of the institutions
and women themselves. Institutions should frame the policies and provide such environment so that women can accommodate
themselves easily at their workplace. Recruitment policies should not be gender biased. To boast their confidence and have their self
esteem, workshop, training programme and other promotional activities must be organised with keeping the point of women’s
mobility and feasibility. For exclusion of women’s activities and participation, strong network of seniors, experience academicians
must be provided to the women. So that they can update themselves and can promote their career by publishing more research work,
can enhance more their personality.
In nut shell, if we really want to empower the women or to mitigate and remove the gender pay gap, institutions, society as
well as women themselves must change their attitude and their work culture. Being equal part of the country, equal support and
lenience must be given to women to contribute in the economic development. Therefore, the corrective measure is to be taken in
improving the participation of women in academic front, is to make systematic exposure of females and by increasing their level and
positions in the area of higher education first.

International Journal of Scientific and Research Publications, Volume 7, Issue 4, April 2017 141
ISSN 2250-3153
www.ijsrp.org
REFERENCES
‘All India Survey In Higher Education’,2013-14, report of AISHE-2013-14 Government Of India, Ministry Of Human
Resource Development, Department Of Higher Education, New Delhi, 2015.
Channa Karuna, (2004) “Gender and Disciplinary Choices: Women in Higher Education in India”, Paper prepared for the
UNESCO Colloquium on Research and Higher Education Policy, Knowledge, Access and Governance: Strategies for
Change, 2004, Paris.
‘Gender Equity in Education, Employment and Entrepreneurship’: Final Report to the MCM (2012), meeting of the OECD,
Council at ministerial level, 2012.
European Commission. The situation in the EU. Retrieved on July 12, 2011.
Leigh ADVANCE: Building Community Beyond Academic Department, proposed to National Science, Foundation (2010).
Lal Shiv Kumar; ‘A Study of Issue and Challenges in empowerment of Women Through their Participation in the Panchayat
raj Institution: A Case Study of Allahabad District of Uttar Pradesh’.
Parihar, Lalita Dhar (2011) ‘Women & Law From Impoverishment to Empowerment - A Critique’, Eastern Book Company,
Lucknow.
Rao. Mamta. 3rd, 2012,ed. ‘Law Relating to Women & Children’ (Paperback). ISBN 9350286610 women and the protection
provided under various criminal, personal and labour laws in India
https://Bookshopofindia.com.search or https://googleweblight.com
Neville, Ginny, Alice Pennicott, Joanna Williams, and Ann Worrall. Women in the Workforce: The Effect of Demographic
Changes in the 1990s. London: The Industrial Society, 1990,
O’Neil Deborah A. and Hopkins Margaret M.;(2015) ‘The impact of gendered organizational systems on women’s career
advancement; Pdf, http:journalfrontiersin.org/article/fpsyg.2015.00905.
National Partnership for Women and Families, comp. (April 2016). "America's Women and the Wage Gap"(PDF). Trade,
Jobs and Wages. Retrieved 2 May 2016.www.nationalpartnership.org>fair-pay
OECD Employment Outlook. Chapter 3: The Price of Prejudice: Labour Market Discrimination on the Grounds of Gender
and Ethnicity. OECD, Paris, 2008.
OECD. OECD Employment Outlook - 2016 Edition Summary in English.ISSN: 1999-1266(online), DOI:
12.1787/19991266. www.oecd-ilibrary.org
Singh, S., & Hoge, G. (2010). ‘Debating Outcomes for ‘Working’ Women – Illustration from India’, The Journal of Poverty,
volume 14, www.tandfonline.com>loi.wpov20
Sethuraman Kavita; ‘The Role of Women’s Empowerment and Domestic Violence in Child Growth and under nutrition in a
tribal and Rural community in South India, United Nation University, UNO- WIDER,(2008). Pdf.
Turrentile; Ari, Well Venture,(2015) ‘career Advancement through Academic Commercialization’: Project OverView,122nd
ASEE Annual Conference & Explosion; journal of Seatle , WA.
https://www.researchgate.net
The Federal Glass Ceiling Commission, Executive summary (1995), pdf. http://www.dol.gov>dol>reich>report
“women in Higher Education Management” The Standing Conference of Rectors, Presidents and Vice-Chancellors of the
European Universities ,published by the United Nations Educational, Scientific and Cultural Organization (UNESCO,1993).
www.unesco.org>education>pdf
‘Women and Management in Higher Education’, A good practice handbook, Follow-up to the World Conference on Higher
Education(2002); Published by the United Nations Educational, Scientific and Cultural Organization 7, place de Fontenoy,
Paris 07 SP (ED-2002/WS/14),© UNESCO 2002.
Kiran; (2015), ‘Women in India: role and status of women in India’. www.importantindia.com
‘Empowerment of India’, (2013); world summit, African development bank, development. (Studymore.com)
US Department of Labor. "Good for Business: Making Full Use of the Nation's Human Capital", (2011); US Department of
Labor, Office of the Secretary. www.doi.gov.

International Journal of Scientific and Research Publications, Volume 7, Issue 4, April 2017 137 ISSN 2250-3153
www.ijsrp.org
Plastic Roads
Use of Waste Plastic in Road Construction Ahmed Trimbakwala
Department of Civil Engineering, K. K. Wagh Polytechnic, Nashik
Abstract- India has a road network of over 5,472,144 kilo-metres (3,400,233 mi) as on 31 March 2015, the second largest road network in the world. The plastic wastes can be used in road construction and the field tests withstood the stress and proved that plastic wastes used after proper processing as an additive would enhance the life of the roads and also solve environmental problems. Plastic use in road construction is not new. It is already in use as PVC or HDPE pipe mat crossings built by cabling together PVC (polyvinyl chloride) or HDPE (high-density poly-ethylene) pipes to form plastic mats. Waste plastic is ground and made into powder; 3 to 4 % plastic is mixed with the bitumen. The durability of the roads laid out with shredded plastic waste is much more compared with roads with asphalt with the ordinary mix. The use of the innovative technology not only strengthened the road construction but also increased the road life as well as will help to improve the environment and also creating a source of income.
I. INTRODUCTION lastic waste is a huge threat to the environment. In 2005, after monsoon rains flooded Mumbai, plastic bags were
blamed for clogging the underground drainage system and intensifying the effect of the floods. In areas frequented by tourists, like Goa, heavy consumption of bottled water has resulted in trash on beaches, creating eyesores and endangering marine life. Even India’s cows, considered sacred, have not been spared. After 3,000 cows died in Lucknow in 2000, the city investigated and found plastic bags in their stomachs. Apparently the bags had been ingested as the animals grazed at dump sites.With more than 35 tons of plastic waste generated by every Indian state, each day India is confronted with the big question of how to get rid of this non-biodegradable menace.
II. PLASTIC AS AN ADDITIVE FOR BITUMINOUS MATERIALS
Plastic used in road construction is not new. It is already in use as PVC or HDPE pipe mat crossings built by cabling together PVC (polyvinyl chloride) or HDPE (high-density poly-ethylene) pipes to form plastic mats. The plastic roads include transition mats to ease the passage of tyres up to and down from the crossing. Both options help protect wetland haul roads from rutting by distributing the load across the surface. But the use of plastic-waste has been a concern for scientists and
engineers for a quite long time. Recent studies in this direction have shown some hope in terms of using plastic-waste in road construction i.e., Plastic roads. Plastic is mixed with the bitumen. Plastic increases the melting point of the bitumen and makes the road retain its flexibility during winters resulting in its long life. Use of shredded plastic waste acts as a strong “binding agent” for tar making the asphalt last long. By mixing plastic with bitumen the ability of the bitumen to withstand high temperature increases. The plastic waste is melted and mixed with bitumen in a particular ratio. Normally, blending takes place when temperature reaches 45.5°C but when plastic is mixed, it remains stable even at 55°C. The vigorous tests at the laboratory level proved that the bituminous concrete mixes prepared using the treated bitumen binder fulfilled all the specified Marshall mix design criteria for surface course of road pavement. There was a substantial increase in Marshall Stability value of the BC mix, of the order of two to three times higher value in comparison with the untreated or ordinary bitumen. Another important observation was that the bituminous mixes prepared using the treated binder could withstand adverse soaking conditions under water for longer duration.
III. SALIENT FEATURES OF THE POLYMER-WASTE-BITUMEN MIX ROAD
• Road strength is twice stronger than normal roads; • Resistance towards water stagnation i.e. no potholes are
formed; • Less bleeding during summer; • Burning of plastics waste could be avoided • It doesn’t involve any extra machinery; • It doesn’t increase cost of road construction; and • It helps to reduce the consumption of bituminous mix
vis-à-vis reduce cost
IV. CONCEPT OF UTILISATION OF WASTE PLASTIC INBITUMINOUS MIXES FOR ROAD
CONSTRUCTION MATERIALS USED:- AGGREGATE:- Aggregates used in surface course can be divided into two types according to their size: coarse aggregates and fine aggregates. Coarse aggregates are generally defined as those retained on the 2.36 mm sieve. Fine aggregates are those that
P

International Journal of Scientific and Research Publications, Volume 7, Issue 4, April 2017 138 ISSN 2250-3153
www.ijsrp.org
pass through the 2.36 mm sieve and are retained on the 0.075 mm sieve. Aggregates required for the research work will be procured from the local market. BITUMEN:- Bitumen acts as binding agent for aggregates in bituminous mixes. Generally in India bitumen used in road construction of flexible pavement is of grades 60/70 or 80/100 penetration grade. Both the grade of bitumen confirming to BIS standards will be used for the present studies WASTE PLASTIC MODIFIERS Modifiers are generally used to enhance the properties of bituminous concrete mixes by reducing the air void present between the aggregates and also to bind them together so that no bleeding of bitumen will occur. For the present study plastic waste such as carry bags, water bottles, milk packets, glasses, cups, etc will be used as a modifier. PROCESSING DETAILS:- i. collection of waste plastic ii. cleaning and shredding of waste plastic. iii. mixing of shredded waste plastic, aggregate and bitumen in central mixing plant. COLLECTION OF WASTE PLASTIC:- Waste plastic is collected from roads, garbage trucks, dumpsites or compost plants, or from school collection programs, or by purchase from rag-pickers or waste-buyers at Rs 5-6 per kg Rag-pickers CLEANING AND SHREDDING OF WASTE PLASTIC:- Waste plastic litter in the form of thin-film carry-bags, use-and-throw cups, PET bottles, etc. these are sorted, de-dusted, washed if necessary. Fig. cleaning process Plastic waste which is cleaned is cut into a size between 1.18mm. MIXING OF SHREDDED WASTE PLASTIC, AGGREGATE AND BITUMIN IN CENTRAL MIXING PLANT:- The aggregate mix is heated to 1650c (as per the HRS specification) in central mixing plant. Similarly the bitumen is to be heated up to a maximum of 160ºc. The 8% of waste plastic to the weight of bitumen are added in the conveyor belt or special mechanical device is developed which will spray the plastics inside the chamber to coat the plastics effectively. Central mixing plant helps to have better control of temperature and better mixing of this material thus helping to have a uniform coating and heated bitumen is also sprayed. Fig. central mixing plant. LAYING OF BITUMENOUS MIX: I. MIX DESIGN BY MARSHALL METHOD: a) Optimum Waste Plastic Content b) Comparison of Two Mixes c) Volumetric properties of BC Mixes. I. MIX DESIGN BY MARSHALL METHOD :-MARSHALL TEST:-
Laboratory studies were carried out at the Centre for Transportation Engineering of Bangalore University on the possible use of the processed plastic bags as an additive in bituminous concrete mixes. The material used in this study was supplied by M/s KK Poly Flex (P) Ltd., Bangalore. The processed plastic was used as an additive with heated bitumen in different proportions (ranging from zero to 12 % by weight of bitumen) and mixed well by hand, to obtain the modified bitumen .The properties of the modified bitumen were compared with ordinary bitumen. It was observed that the penetration and ductility values of the modified bitumen decreased with the increase in proportion of the plastic additive, up to 12 % by weight. The softening point of the modified bitumen increased with the addition of plastic additive, up to 8.0 %by weight. Auto Marshall Compactor Auto Marshall tester 11 OPTIMUM WASTE PLASTIC CONTENT: Varying percentages of waste plastic by weight of bitumen was added into the heated aggregates Marshall specimen with varying waste plastic content was tested for bulk density and stability Maximum value of stability was considered as criteria for optimum waste plastic content Studies were carried out on Bituminous mixes using 60/70 grade bitumen having average Marshall Stability Value (MSV) of 1300 kg at optimum bitumen content of 5.0 % by weight of the mix. Further studies on mixes were carried out using the modified binder obtained by the addition of varying proportions of processed plastic bags (percentage by weight of bitumen) with the conventional 80 /100 grade bitumen. The optimum modified binder content fulfilling the Marshall Mix design criteria was found to be 5.0 % by weight of the mix, consisting of 8.0 % by weight of processed plastic added to the bitumen. The average MSV of the mix using the modified binder was found to be as high as 1750 kg at this optimum binder content, resulting in about three fold increase in stability of the BC mix, which contains 4.6 % bitumen plus 8 % processed plastic by weight of bitumen, i.e.,0.4 % processed plastic by weight of the mix. In order to evaluate the ability of the mix prepared with the above-modified bitumen to withstand adverse soaking condition under water, Marshall Stability tests were conducted after soaking in water at 60 Co for 24 hours. The average MSV of the BC mix with modified binder (using 8 % processed plastic by weight of bitumen, as above) was found to increase by about 2.6 times of the mix with ordinary bitumen. Further laboratory studies carried out on the BC mixes using this modified binder also indicated note worthy increase in fatigue life under repeated application of loads. Dry process is recommended for isolated works. It is recommended that the percentage of shredded waste plastic will be 8% by CRRI, while the same is specified as 10% by Dr. Vasudevan. However we can adopt 8% as the optimum plastic content for blending the bitumen in the construction of plastic roads. The details of the process are given below. Bitumen of grades 60/70 or 80/100 can be used as binder as in case of conventional method. With Mini Hot Mix Plant

International Journal of Scientific and Research Publications, Volume 7, Issue 4, April 2017 139 ISSN 2250-3153
www.ijsrp.org
The stone aggregate mix (as per specification) is transferred to the mix cylinder where it is heated to 1650c (as per the IRC specification) and then it is transferred to the mixing puddler(Temperature can be monitored using IR thermometer), while transferring the hot aggregate into the puddler, calculated quantity of shredded plastics is sprayed over the hot aggregate within 30seconds. The sprayed plastic films melts and gets coated over the aggregate, thus forming an oily coating. Similarly, the bitumen is to be heated to a maximum of 1600c in a separate chamber and kept ready (The temperature should be monitored to have good binding and to prevent weak bonding).At the mixing puddler, the hot bitumen is added over the plastic coated aggregate and the resulted mix is used for road construction. The road laying temperature is between 1100c to 1200c. The roller used is normal 8-ton capacity. Economics of Road Construction : Cost Analysis Assuming Cost of plastics waste (collection, segregation and processing) = Rs. 5 per Kg. Cost of Bitumen per drum (200 Kg) =10000 Cost of Bitumen per Kg= 50 Cost of bitumen per ton =50000 Generally roads in India are constructed in basic width of 3.75 m Consider 1 Km length road To lay 1km of road 10 tons of bitumen is required, Cost of bitumen required per Km= Rs. 5,00,000 Assuming Optimum percentage of plastic as per the test results of literature reviewed is around 10% (by % wt. of bitumen) Total quantity of bitumen required = 9 tons Total quantity of plastic waste required = 1 ton Cost of bitumen for 9 tons = Rs. 4,50,000 Cost of plastic waste = Rs. 5000 Total cost of bitumen and plastic = Rs. 4,55,000 Total savings = 5,00,000 - 4,55,000 = Rs.45,000 per Km Comparison Between normal roads and plastic roads The durability of the roads laid out with shredded plastic waste is much more compared with roads with asphalt with the ordinary mix. Roads laid with plastic waste mix are found to be better than the conventional ones. The binding property of plastic makes the road last longer besides giving added strength to withstand more loads. While a normal 'highway quality' road lasts four to five years it is claimed that plastic-bitumen roads can last up to 10 years. Rainwater will not seep through because of the plastic in the tar. So, this technology will result in lesser road repairs. And as each km of road with an average width requires over two tones of polyblend, using plastic will help reduce non-biodegradable waste. The cost of plastic road
construction may be slightly higher compared to the conventional method. However, this should not deter the adoption of the technology as the benefits are much higher than the cost. Plastic roads would be a boon for India’s hot and extremely humid climate, where temperatures frequently cross 50°C and torrential rains create havoc, leaving most of the roads with big potholes. Already, a kilometer long test-track has been tested in Karnataka using this technology. The government is keen on encouraging the setting up of small plants for mixing waste plastic and bitumen for road construction. It is hoped that in near future we will have strong, durable and eco-friendly roads which will relieve the earth from all type of plastic-waste.
V. BENEFITS OF MODIFIED BINDER • Improved resistance to surface-initiated cracking due to
high binder content. • Improved ageing and oxidation resistance. • Improved resistance to fatigue and reflection cracking
due to higher binder contents. • Improved resistance to rutting due to higher viscosity
and softening points. • Increased night time visibility due to contrast between
pavement and stripping. • Reduced tyre noise dur to increased binder film
thickness and opening textue. • Reduced construction time on site. • Lower pavement maintenance costs due to improved
quality pavement. • Help in managing hazardous waste. • Eco-friendly method of construction,and helps
maintaining balance of environment.
AUTHORS First Author – Ahmed trimbakwala, D.C.E., K. K. Wagh Polytechnic, [email protected] Second Author – Ashish Kale, M.E. Structures, K. K. wagh Polytechnic Third Author – PrakashKadave, M.E. Structures, K. K. Wagh Polytechnic, [email protected]

International Journal of Scientific and Research Publications, Volume 7, Issue 4, April 2017 140 ISSN 2250-3153
www.ijsrp.org
A Scalable Sketch Based Image Retrieval System Kathy Khaing, SaiMaungMaungZaw, Nyein Aye
[email protected], [email protected], [email protected]
University of Computer Studies, Mandalay, Myanmar
Abstract- Due to the progress in digital imaging technology, image retrieval (IR) has become a very active research area in computer science. Although many researches are increased in Sketch Based Image Retrieval (SBIR) field, it is still difficult to bridge the gap between image and sketch matching problem. Therefore, this paper presents a scalable SBIR system and contributes to get more efficient retrieval result. The features of both the query sketch and database images are extracted by Scale Invariant Feature Transform (SIFT) algorithm. Then the cropped keypoint images are processed by Canny edge detection. After blocking the edge image, the matched feature values are get by pixel count ratio. The retrieved images similar with query sketch are displayed by rank. Mean Average Precision (MAP) and Recall rates is measured as evaluation criteria. To evaluate the performance of this system, the benchmark sketch dataset of Eitz et al. is used. Index Terms- Canny, IR, keypoint, MAP, SBIR, SIFT,
I. INTRODUCTION . With the development of the technology and availability of the image capturing devices such as scanners, digital cameras, the size of the digital image collection increases rapidly. It is important to efficiently store and retrieve images for different applications, for this purpose many Image Retrieval (IR) system have been developed. The image retrieval system returns a set of images which are ranked in a certain order under a similarity function in response to a query given by a user. Early IR researches focused on the content of image such as color, texture and shape and called Content based Image Retrieval (CBIR) system. In CBIR system, example image is required as a query input. If the user has no image to show as an example, it becomes a problem. An easy way to express a user query is a line-based hand drawing, a sketch. Therefore, the recent researches are focused on Sketch based Image Retrieval (SBIR) system but those researches still keep low performance. The most important task is to bridge the gap between database image and query sketch. The major properties of an image are color, shape, texture and saliency. Among them, shape is the key feature for SBIR system due to the lack of other properties in binary drawings. In sketch based image retrieval system user provided a drawing sketch as input. The feature vector of input sketch compares with feature vector of database images and retrieves the matched image from the database and display on screen as output of the system. The SBIR system is essential and effective in real life such as medical diagnosis, digital library, search engines, crime prevention,
geographical information, art gallery and remote sensing systems. In some cases, we can recall our minds with the help of figures or drawings. This paper is organized in 5 sections.Section 2 gives the literature survey, which gives the information about previously used systems for image retrieval. The background theory of image retrieval is described in section 3. In section 4, the proposed system architecture is explained and discusses the evaluation criteria of the system. Finally, section 5 provides the conclusion of the system.
II. RELATED WORKS This section reviews the suitable background literature and describes the concept of an image retrieval system. Scientific publications included in the literature survey have been chosen in order to build a sufficient background that would help out in solving the research sub-difficulties. Since Sketch Based Image Retrieval is a young research area, there are a few works on SBIR. J. D. Fendarkar and K. A. Gulve [2] presented the problems and challenges concerned with the design and the creation of CBIR systems, which is based on a free hand sketch (i.e. SBIR). The use of the existing methods, described a possible result, how to design and implement a task specific descriptor, which can handle the informational gap between a sketch and a colored image to make an opportunity for the efficient search. Another edge-based approach is Edge Histogram Descriptor (EHD) that was proposed in the visual part of MPEG-7. The idea is to get a local distribution of five types of edges from the local regions of the image. Eitz, et al. [4] introduced a benchmark for evaluating the performance of large-scale sketch-based image retrieval systems. The necessary data are acquired in a controlled user study where subjects rate how well given sketch/image pairs match. They suggest how to use the data for evaluating performance of sketch based image retrieval systems the benchmark data as well as the large image database are made publicly available for further studies of this type. The dataset of Eitz, et al. consisting of 31 sketches, each with 40 photos ranked by similarity. Furthermore, they develop new descriptors based on the bag-of-features approach and use the benchmark to demonstrate that they significantly outperform other descriptors in the literature. The majority of SBIR methods are based on histograms of orientations either to compute a global representation or a local one. RuiHua and John Collomossea [7] described HOG seems to be the favorite descriptor in the community. However, because of the sparseness of sketches, HOG descriptors may be also sparse

International Journal of Scientific and Research Publications, Volume 7, Issue 4, April 2017 141 ISSN 2250-3153
www.ijsrp.org
which may impact negatively in the final effectiveness. To address this problem, Saavedra and Bustos [3] proposed the HELO (histogram of edge local orientations) descriptor where the orientation histogram is formed by local orientations that are estimated by grouping pixels in cells and determining just one representative orientation for each cell. The representative gradient is computed using the square gradient approach. The proposed SBIR system in this paper is used the SIFT algorithm for feature extraction. Most of SBIR systems used K-means clustering algorithm. Thus, the fuzzy C-means clustering algorithm is developed in this work.
III. IMAGE RETRIEVAL SYSTEM The efficiency of searching in information set is a very important point of view. In case of texts user can search flexibly using keywords, but if use images, user cannot apply dynamic methods. Two questions can come up. The first is who yields the keywords. And the second is an image can be well represented by keywords. In many cases if user wants to search efficiently some data have to be recalled. Since the human is visual type, looking for images using other images, and follow this approach also at the categorizing. In this case, users search using some features of images, and these features are the keywords. At this moment unfortunately there are not frequently used retrieval systems, which retrieve images using the non-textual information of a sample image. What can be the reason? One reason may be that the text is a human abstraction of the image. To give some unique and identifiable information to a text is not too difficult. At the images the huge number of data and the management of those cause the problem.
A. Content Based Image Retrieval System (CBIR)
Nowadays the application of internet and www is increasing exponentially and the collection of image accessible by the users is also growing in numbers. During the last decade there has been a rapid increase in volume of image and video collections. A huge amount of information is available, and daily gigabytes of new visual information is generated, stored, and transmitted. However, it is difficult to access this visual information unless it is organized in a way that allows efficient browsing, searching, and retrieval. Traditional methods of indexing images in databases rely on anumber ofdescriptive keywords, associated with each image. However, this manual annotation approach is subjective and recently, due to the rapidly growing database sizes, it is becoming outdated. To overcome these difficulties in the early 1990s, Content-Based Image Retrieval (CBIR) emerged as a promising means for describing and retrieving images. According to its objective, instead of being manually annotated by text-based keywords, images are indexed by their visual contents such as color, shape, texture, and spatial layout. Content Based Image Retrieval is an automatic process based on user input to search relevant images. In the digital image processing, CBIR is most popular and rising research area. The CBIR system first computes the similarity between the query and the images
stored in the database. The development of content based image retrieval, for indexing libraries have usually used manual image annotation and then later their image collections are retrieved. However, manual image annotation procedure is an expensive and labor intensive and hence there has been great interest in coming up with retrieving images based on content in an automatic way. To extract the visual content of an image like texture, color, shape or sketch is the goal of CBIR. A typical CBIR process first the image features extracts and efficiently store them. Then it compares with the database images and returns the results [2].The information extracted from the content of query is used for the content based image retrieval information systems. In these systems the keywords are annotated with images and then using text based search method retrieve images. Query by Image Retrieval (QBIR) is also known as content based image retrieval.
The aim of this paper is to develop a content based image retrieval system, which can retrieves images using sketches in frequently used databases.
B. Sketch Based Image Retrieval System (SBIR)
A sketch is s free hand-drawing consisting of a set of strokes. A sketch lacks texture and color. SBIR is part of the image retrieval field. In SBIR system, the input is a simple sketch representing one or more objects. Although a vast number of researchers on multimedia image retrieval are mainly focused on content based image retrieval systems using a regular image as query, in the last few years the interest in the SBIR problem has been increased. This interest may be owed to the emerging touch screen technology that allow users to draw a query directly on a screen, turning the process of making a query easy and accessible.
The Sketch-based image retrieval (SBIR) was introduced in QBIC and Visual SEEK systems. In these systems the user draws color sketches and blobs on the drawing area. The user has a drawing area where he can draw those sketches, which are the base of the retrieval method. The retrieval system using sketches can be essential and effective in our daily life such as Medical diagnosis, digital library, search engines, crime prevention, geographical information, art gallery and remote sensing systems [4].Feature extraction and similarity measure are very dependent on the used features. There would be more than one representation in every feature. Among these representations, to describe features histogram is the most commonly used technique.Describing the edge–based features of shape and texture is important for image retrieval using graphical rough sketches. Although edge-based feature extraction methods that used a Fourier Descriptor can be applied in order to realize image retrieval systems, these methods can be only applicable of features from limited images consisting of close-curve boundaries. Sufficient edge-based feature extractions of shape information have not yet been developed, because effectively extracting the edge-based features of shape information is difficult.
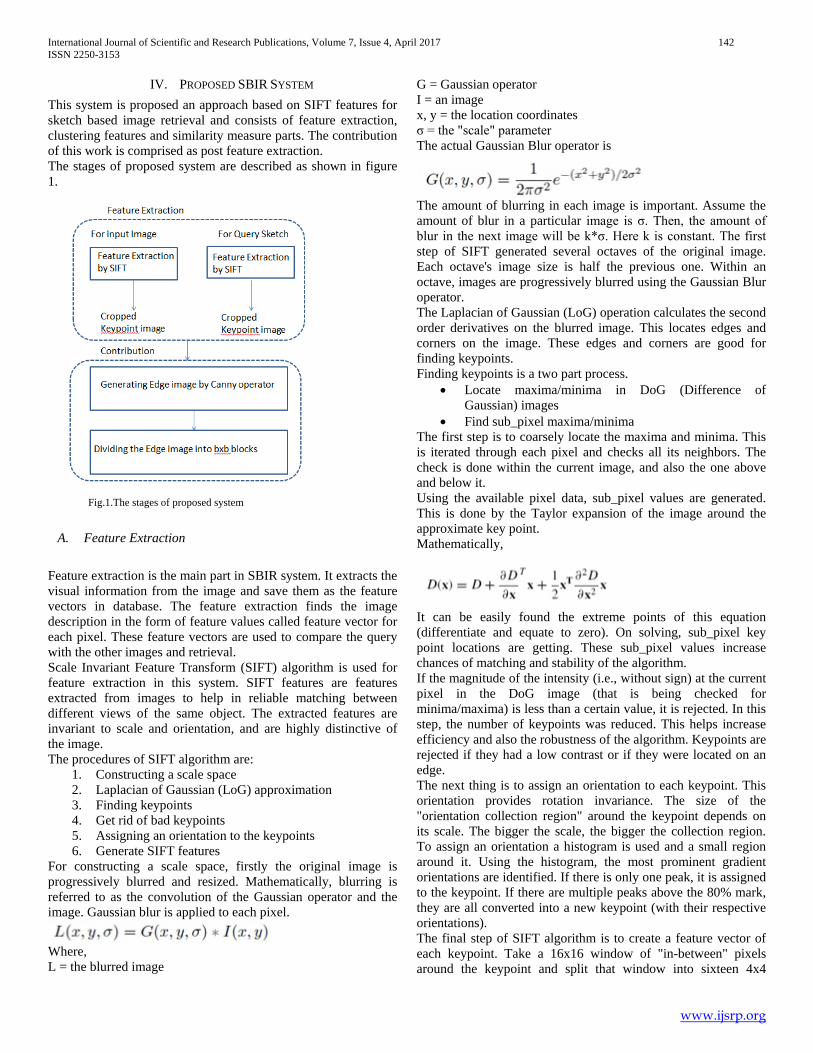
International Journal of Scientific and Research Publications, Volume 7, Issue 4, April 2017 142 ISSN 2250-3153
www.ijsrp.org
IV. PROPOSED SBIR SYSTEM This system is proposed an approach based on SIFT features for sketch based image retrieval and consists of feature extraction, clustering features and similarity measure parts. The contribution of this work is comprised as post feature extraction. The stages of proposed system are described as shown in figure 1.
Fig.1.The stages of proposed system
A. Feature Extraction Feature extraction is the main part in SBIR system. It extracts the visual information from the image and save them as the feature vectors in database. The feature extraction finds the image description in the form of feature values called feature vector for each pixel. These feature vectors are used to compare the query with the other images and retrieval. Scale Invariant Feature Transform (SIFT) algorithm is used for feature extraction in this system. SIFT features are features extracted from images to help in reliable matching between different views of the same object. The extracted features are invariant to scale and orientation, and are highly distinctive of the image. The procedures of SIFT algorithm are:
1. Constructing a scale space 2. Laplacian of Gaussian (LoG) approximation 3. Finding keypoints 4. Get rid of bad keypoints 5. Assigning an orientation to the keypoints 6. Generate SIFT features
For constructing a scale space, firstly the original image is progressively blurred and resized. Mathematically, blurring is referred to as the convolution of the Gaussian operator and the image. Gaussian blur is applied to each pixel.
Where, L = the blurred image
G = Gaussian operator I = an image x, y = the location coordinates σ = the "scale" parameter The actual Gaussian Blur operator is
The amount of blurring in each image is important. Assume the amount of blur in a particular image is σ. Then, the amount of blur in the next image will be k*σ. Here k is constant. The first step of SIFT generated several octaves of the original image. Each octave's image size is half the previous one. Within an octave, images are progressively blurred using the Gaussian Blur operator. The Laplacian of Gaussian (LoG) operation calculates the second order derivatives on the blurred image. This locates edges and corners on the image. These edges and corners are good for finding keypoints. Finding keypoints is a two part process.
• Locate maxima/minima in DoG (Difference of Gaussian) images
• Find sub_pixel maxima/minima The first step is to coarsely locate the maxima and minima. This is iterated through each pixel and checks all its neighbors. The check is done within the current image, and also the one above and below it. Using the available pixel data, sub_pixel values are generated. This is done by the Taylor expansion of the image around the approximate key point. Mathematically,
It can be easily found the extreme points of this equation (differentiate and equate to zero). On solving, sub_pixel key point locations are getting. These sub_pixel values increase chances of matching and stability of the algorithm. If the magnitude of the intensity (i.e., without sign) at the current pixel in the DoG image (that is being checked for minima/maxima) is less than a certain value, it is rejected. In this step, the number of keypoints was reduced. This helps increase efficiency and also the robustness of the algorithm. Keypoints are rejected if they had a low contrast or if they were located on an edge. The next thing is to assign an orientation to each keypoint. This orientation provides rotation invariance. The size of the "orientation collection region" around the keypoint depends on its scale. The bigger the scale, the bigger the collection region. To assign an orientation a histogram is used and a small region around it. Using the histogram, the most prominent gradient orientations are identified. If there is only one peak, it is assigned to the keypoint. If there are multiple peaks above the 80% mark, they are all converted into a new keypoint (with their respective orientations). The final step of SIFT algorithm is to create a feature vector of each keypoint. Take a 16x16 window of "in-between" pixels around the keypoint and split that window into sixteen 4x4
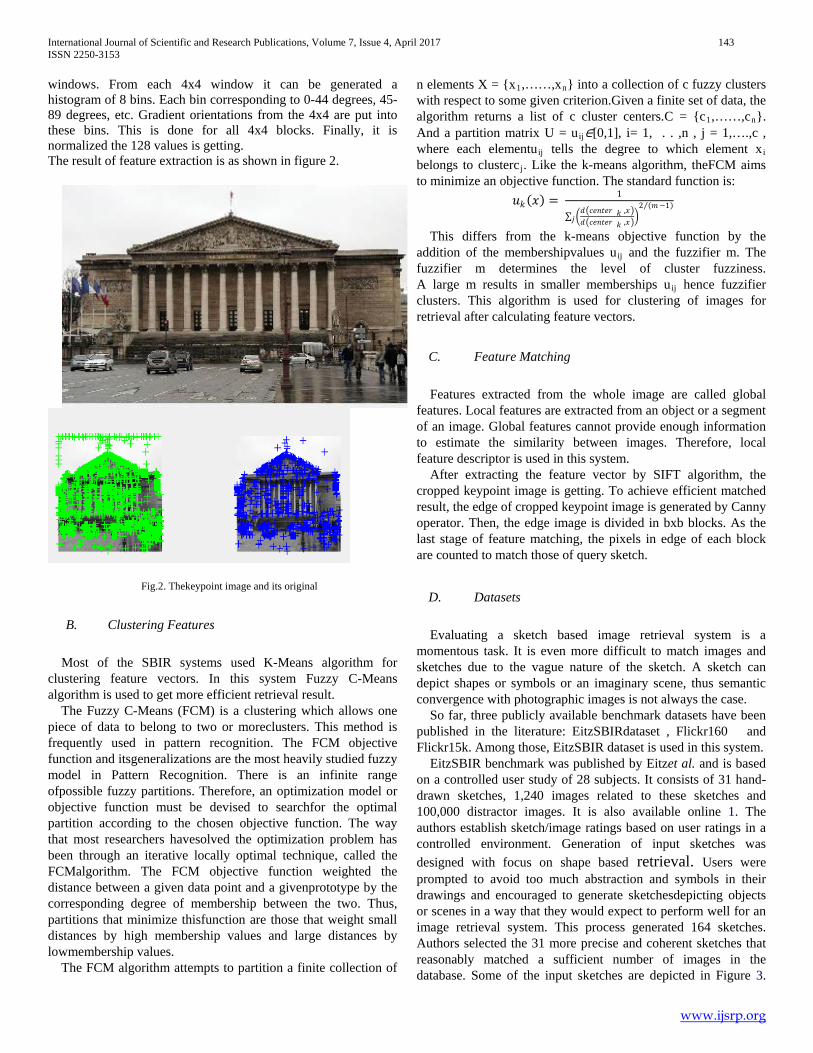
International Journal of Scientific and Research Publications, Volume 7, Issue 4, April 2017 143 ISSN 2250-3153
www.ijsrp.org
windows. From each 4x4 window it can be generated a histogram of 8 bins. Each bin corresponding to 0-44 degrees, 45-89 degrees, etc. Gradient orientations from the 4x4 are put into these bins. This is done for all 4x4 blocks. Finally, it is normalized the 128 values is getting. The result of feature extraction is as shown in figure 2.
Fig.2. Thekeypoint image and its original
B. Clustering Features
Most of the SBIR systems used K-Means algorithm for clustering feature vectors. In this system Fuzzy C-Means algorithm is used to get more efficient retrieval result.
The Fuzzy C-Means (FCM) is a clustering which allows one piece of data to belong to two or moreclusters. This method is frequently used in pattern recognition. The FCM objective function and itsgeneralizations are the most heavily studied fuzzy model in Pattern Recognition. There is an infinite range ofpossible fuzzy partitions. Therefore, an optimization model or objective function must be devised to searchfor the optimal partition according to the chosen objective function. The way that most researchers havesolved the optimization problem has been through an iterative locally optimal technique, called the FCMalgorithm. The FCM objective function weighted the distance between a given data point and a givenprototype by the corresponding degree of membership between the two. Thus, partitions that minimize thisfunction are those that weight small distances by high membership values and large distances by lowmembership values.
The FCM algorithm attempts to partition a finite collection of
n elements X = {x1,……,xn} into a collection of c fuzzy clusters with respect to some given criterion.Given a finite set of data, the algorithm returns a list of c cluster centers.C = {c1,……,cn}. And a partition matrix U = uij∈[0,1], i= 1, . . ,n , j = 1,….,c , where each elementuij tells the degree to which element xi belongs to clustercj. Like the k-means algorithm, theFCM aims to minimize an objective function. The standard function is:
𝑢𝑢𝑘𝑘(𝑥𝑥) = 1
∑ �𝑑𝑑�𝑐𝑐𝑐𝑐𝑐𝑐𝑐𝑐𝑐𝑐𝑐𝑐 𝑘𝑘 ,𝑥𝑥�𝑑𝑑�𝑐𝑐𝑐𝑐𝑐𝑐𝑐𝑐𝑐𝑐𝑐𝑐 𝑘𝑘 ,𝑥𝑥��
2 (𝑚𝑚−1)⁄
𝑗𝑗
This differs from the k-means objective function by the addition of the membershipvalues uij and the fuzzifier m. The fuzzifier m determines the level of cluster fuzziness. A large m results in smaller memberships uij hence fuzzifier clusters. This algorithm is used for clustering of images for retrieval after calculating feature vectors.
C. Feature Matching
Features extracted from the whole image are called global features. Local features are extracted from an object or a segment of an image. Global features cannot provide enough information to estimate the similarity between images. Therefore, local feature descriptor is used in this system.
After extracting the feature vector by SIFT algorithm, the cropped keypoint image is getting. To achieve efficient matched result, the edge of cropped keypoint image is generated by Canny operator. Then, the edge image is divided in bxb blocks. As the last stage of feature matching, the pixels in edge of each block are counted to match those of query sketch.
D. Datasets
Evaluating a sketch based image retrieval system is a momentous task. It is even more difficult to match images and sketches due to the vague nature of the sketch. A sketch can depict shapes or symbols or an imaginary scene, thus semantic convergence with photographic images is not always the case.
So far, three publicly available benchmark datasets have been published in the literature: EitzSBIRdataset , Flickr160 and Flickr15k. Among those, EitzSBIR dataset is used in this system.
EitzSBIR benchmark was published by Eitzet al. and is based on a controlled user study of 28 subjects. It consists of 31 hand-drawn sketches, 1,240 images related to these sketches and 100,000 distractor images. It is also available online 1. The authors establish sketch/image ratings based on user ratings in a controlled environment. Generation of input sketches was designed with focus on shape based retrieval. Users were prompted to avoid too much abstraction and symbols in their drawings and encouraged to generate sketchesdepicting objects or scenes in a way that they would expect to perform well for an image retrieval system. This process generated 164 sketches. Authors selected the 31 more precise and coherent sketches that reasonably matched a sufficient number of images in the database. Some of the input sketches are depicted in Figure 3.

International Journal of Scientific and Research Publications, Volume 7, Issue 4, April 2017 144 ISSN 2250-3153
www.ijsrp.org
Each sketch was associated with 40 visually similar images according to the user rating, for a total of 1,240 images. 100,000 distractor images were also provided as noise and mixed with the 1,240 images. The author’s aim was to create a benchmark to quantitatively compare a machine’s result with respect to the human performance. That is, how correlated is the ranking produced by a human, in this case the mean score of all the participants, to that of a computer.
Fig.3. Some sketch queries from EitzSBIR Dataset
V. PERFORMANCE EVALUATION To evaluate the performance of the Sketch Based Image
Retrieval System, the Mean Average Precision (MAP) and Recall rate are calculated.
The Precision provides information related to effectiveness of the system.
Mean Average Precision (MAP) = ∑Avg P (q)/Q Where, Q= no: of queries images displayed with similar shape
Recall = Q / Z Where, Q = No. of images displayed with similar shape. Z = No. of images with similar shape in whole database.
VI. CONCLUSION
This paper is presented the scalable sketch based image retrieval system using SIFT algorithm and fuzzy clustering. It is still difficult to bridge the gap between image and sketch matching problem. Thus, the main contribution of this work is to improve the effectiveness of image retrieval by querying as the hand drawn sketch. This system is an ongoing research work. Therefore, the overall experimental result cannot be described. Similarity score will be calculated by pixel count ratio as the contribution of this work. Mean Average Precision (MAP) and Recall rates will be measured as evaluation criteria.
REFERENCES [1] B. Szanto. P. Pozsegovics, Z. samossySz. Sergyan, “Sketch4Match
Content-based Image Retrieval System Using Sketches” SAMI 2011 _9th IEEE International Symposium on Applied Machine Intelligence and Informatics January 27-29, 2011 Smolenice, Slovakia.
[2] Fendarkar J. D., Gulve K. A. “Utilizing Effective Way of Sketches for Content-based Image Retrieval System” International Journal of Computer Applications Volume: 116 – No.: 15, pages: 23-28,April 2015.
[3] Jose M. Saavedra. “Sketch based image retrieval using a soft computation of the histogram of edge local orientations (s-helo)”. In International Conference on Image Processing, ICIP’2014.
[4] Mathias Eitz, Kristian Hildebrand, TamyBoubekeur, and Marc Alexa. “Sketch-based image retrieval: Benchmark and bag-of-features descriptors” IEEE Transactions on Visualization and Computer Graphics, 17(11):1624–1636, 2011.
[5] N. Prajapati, G.S.Prajapti, “Sketch base Image Retrieval System for the Web - Survey", International Journal of Computer Science and Information Technologies, Volume 6, Issue 4, April 2015 ISSN: 0975-9646.
[6] Prof. BalramPuruswani, Jyoti Jain, “A Preliminary Study on Sketch Based Image Retrieval System", International Journal of Modern Engineering & Management Research, Volume 1, Issue 1, April 2013 ISSN: 2320-9984
[7] RuiHua and John Collomossea, “A Performance Evaluation of Gradient Field HOG Descriptor for Sketch Based Image Retrieval", Centre for Vision, Speech and Signal Processing, University of Surrey, UK.
[8] http://www.aishack.in/2010/05/sift-scale-invariant-feature-transform/2/ [9] R. Datta, D. Joshi, J. Li and J. Z. Wang, “Image retrieval: Ideas, influences,
and trends of the new age”, ACM computing Survey, vol.40, no.2, pp.1-60, 2008.

International Journal of Scientific and Research Publications, Volume 7, Issue 4, April 2017 145 ISSN 2250-3153
www.ijsrp.org
Usability Recommendations for an Academic Website: A Case Study
D.P.Jayathunga*, J.M.D.R. Jayawardana**,S.T.C.I. Wimaladharma*,H.M.U.M. Herath*
* Department of Computer Science and Technology, Uva Wellassa University of Sri Lanka ** Department of Animal Science, Uva Wellassa University of Sri Lanka
Abstract- With the advent of the Internet, most of the academic institutions in the world are providing up-to-date information over their official websites. Nowadays it has been more concerned that the importance of the presence of information through websites to the public. Since web-based information sharing has become more popular and effective, it is required to focus on the usability of a website from the user’s viewpoint. The main objective of the study was to evaluate the usability of the official website of Uva Wellassa University of Sri Lanka under four main dimensions which are website content and organization , website navigation and links, user interface design and website performance. The questionnaire was designed and developed based on twenty usability criteria that are belong to the above four categories. A descriptive survey conducted and simple random sampling strategy employed to collect data from 194 undergraduates who have the domain knowledge about the usability of a website. The each category has a selected predictor that used to find the correlation between other four factors by using ordinal logistic regression model. The results exhibited a strong correlation between the content and organization of the website. The analysis of the results further justified that there is no significant relationship between the navigation and the composition of the links/menus of the website. But result shows it is important to consider ease of move forward/backward, usefulness of links and prevention of pop-ups and new browser windows. The negative correlation between the interface design and the attractiveness of the website implied the less importance of its design while highlighting the importance of the learnability and use of comfortable colors in interfaces. It is vital to consider the loading time of the web pages and the availability of the website to ensure the reliability of the information. As a conclusion, the overall design and the navigation of the current website is in an acceptable level while the content and the organization of the website needs to improve in order to make users more comfortable in accessing the university website. Therefore, it can be recommended that improving the factors such as content, organization, and readability of a website will significantly affect to the usability of it. Index Terms- usability evaluation, educational websites, usability factors, website usability, HCI
I. INTRODUCTION herapid development of Information and Communication Technology (ICT) has changed the way people look at the world. Moreover, the globalization of workflows of most of the organizations is benefitted from the advancement of communication
technology. Therefore, different areas such as Business, Governance, Healthcare, Engineering, Agriculture and Education have a significant influence of ICT. Computers, the Internet, and electronic delivery systems such as radios, televisions, and projectors are widely used in ICT [1]. Further, the use of different devices such as smartphones and tablet computers is increasing rapidly with respect to the technology. On top of every other ICT tools and techniques, the Internet plays a premier role by providing a solid infrastructure to connect billions of people and devices all over the world in a second. One of the most popular services of the Web of Documents (WDOC) is World Wide Web (WWW). With the invention of WWW, and the advancement of information sharing, the dominance of internet usage has rapidly grown in the academia as well [2]. Thus, the usage of website has become the most popular method of sharing information over the Internet. Since the number of websites and the users are increasing day-by-day, the necessity of improving the usability of websites has become more important in order to fulfill the users’ expectation. On the web, usability is a necessary component of survival [3], which can be used to assess the utility of a website. The common factors that are affecting to the usability of a website include its design, organization of the contents, website navigation and links, etc. It is important to balance these usability factors in order to provide an effective web experience to the user. Generally, user satisfaction is vary among the users [4]. Identifying the most significant factors that are affecting to the usability of a website is essential in order to avoid unnecessary circumstances while developing and maintaining a website. Especially, the objectives of an academic website differ from other websites in various ways. Educational institutions are the places where the new knowledge is being generated. Knowledge sharing is one of the primary objectives of those institutions. Therefore, the user domain is also unique for their websites. The usability factors that are expected from the academic websites are informativeness, ease of access (navigation), well-structured, up-to-date information, etc.
T

International Journal of Scientific and Research Publications, Volume 7, Issue 4, April 2017 146 ISSN 2250-3153
www.ijsrp.org
Thus, the necessity of examining and evaluating the usability of university websites became more important. The aim of this study is to evaluate the factors influencing the usability of Uva Wellassa university website using user-based method in which the users are having the domain knowledge in technical and theoretical. The objectives of the study are to:
1. Evaluation the Uva Wellassa University website (http://www.uwu.ac.lk) for usability factors using the users who are having the technical and theoretical knowledge about the Human-Computer Interaction. 2. Identify the main areas that are affecting for the usability of a university website from students point of view and identify the usability issues of the existing website of Uva Wellassa University of Sri Lanka.
II. RELATED WORK This section includes some found literature which covers website usability of academic institutions. “Usability is a quality attribute that assesses how easy user interfaces are to use”. The word "usability" also refers to methods for improving ease-of-use during the design process”. Website usability is identified with five quality components named as Learnability, Efficiency, Memorability, Errors and Satisfaction [3]. Several evaluation methods have been identified to assess the usability of websites under the categories of user testing methods, tool based testing methods and evaluator based testing methods [5]. In 2015, a usability evaluation research conducted by a group [6] has implied the user based testing method to assess the usability of educational websites. They have given a questionnaire which was arranged based on their developed heuristic guidelines document, to undergraduates in King Abdul Aziz university of Saudi Arabia. The purpose of this research was to figure out the usability issues in an educational website using King Abdul Aziz university website as their case study. From the evaluation results, they have identified some issues such in navigation, design, and content of the websites. Similarly, in 2012 another research conducted by Layla Hasan [5] developed evaluation criteria and conducted a rating survey to obtain the ratings for nine Jordanian University websites based on various categories of the developed usability criteria such as navigation, organization, ease of use, design, and content of the websites. The aim of this research was to investigate the usability of educational websites in Jordanian using user based method. Two hundred thirty-seven students were requested to give ratings for each nine selected university websites of Jordan. The results showed that the majority of the students was satisfied with the usability of each given university websites specifically with the content and navigation, but they were dissatisfied with the design of the websites. Samsur Rahman and Zabed Ahmed have done a study in 2013 [4] to assess the usability of the Dhaka University website of Bangladesh based on university student preferences. They have gathered information from Dhaka University students by giving a specific questionnaire which they have developed. After the analyzing of these data, Rahman and Ahmed have found that the most students were not satisfied with the Dhaka university website. Moreover, they have determined the factors which caused the usability issues of the website such as lack of content and updates of the information. Mustafa and Al-Zoua'bi have applied two methods [7] namely user based method and tool-based methods for their research in 2008, to identify the usability problems in Jordan's university websites. They have used two online automated tools called html toolbox and web page analyze along with a questionnaire which was given to websites' users. In this research, they have used the above-mentioned tools to measure the internal attribute of the websites such as html code errors while questionnaire was used to measure the user satisfaction. Though user based method and tool based method are the most widely used methods to evaluate the usability of websites, some research studies have been conducted using evaluator methods as well. For example, in 2013 Alotaibi has used an evaluator method named Heuristic Evaluation (HE) to assess twelve Saudi Arabian university websites [8]. Results of this research revealed that even though the selected universities maintain an acceptable level of quality usability practices, private university websites has 5% of lower level usability compared to government universities. Even there are many methods to evaluate the usability of websites, there were some few research studies were conducted to assess the usability of academic websites. This literature summarized that there is a lack of researches concerning to the evaluation of the usability of academic websites of Sri Lanka. Hence the assessing the usability of academic websites have become more important aspect today, this research was conducted to determine the factors which can use to enhance the usability of academic websites of Sri Lanka, using Uva Wellassa University of Sri Lanka website as a case study:
.

International Journal of Scientific and Research Publications, Volume 7, Issue 4, April 2017 147 ISSN 2250-3153
www.ijsrp.org
III. METHODOLOGY In order to collect the data, a survey questionnaire was designed and developed based on twenty usability factors under four different identified usability categories [9] [7] as shown in Table 1.
Table 1: Usability Category and factors
No Category Usability Factors 1 Content and Organization I. Up-to-date information
II. Easy of information search III. Readable content IV. No need of scroll left and right V. Well organized content
2 Website Navigation and Links
I. Ease of move forward/backward II. Usefulness of links
III. Prevention of pop-ups and new browser windows IV. Composition of the links/menus V. Easy to move around using links and back button
3 User interface design I. Attractiveness of the website II. Use of comfortable color
III. Learnability IV. Distracting or irritating elements V. Consistence look and feel
4 Website Performance I. Loading time of the web pages II. Distinguish between visited and non-visited pages
III. The availability of the website IV. Respond according to user expectation V. Efficiency in use
The survey questionnaire consists of 25 categorical questions which enables a better understanding and an insightful interpretation of the results from the study. The survey was conducted within six weeks of time period and the population of the research survey was the undergraduates who have the knowledge in website usability and currently in second and third level of study years attached to the Department of Computer Science and Technology of Uva Wellassa University. The simple random sampling technique was adapted to collect the data from the responses and the sample size was 194 students. In order to analyze the collected data, the basic descriptive statistical analysis and confirmatory statistical analysis were performed using Minitab software. There is a selected predictor in each category as used to find correlation with other four each category questions and measure the usability of the category. The ordinal logistic regression model was fitted for each usability category since the outcome results of the survey were ordered categorical scale data. Thus, interpreted result can use to determine the respondents’ interested main area of the website which needs to be more concern in improving and suggesting the further development of the website. The Chi-squared test and Goodness of fit tests were used to identify the statistical significance of the fitted model and model is either well fitted to the data or not. Further using the Chi-squared test the null hypothesis (H0) was tested as all the coefficients associated with the predictor variables are equal to zero and alternative hypothesis(H1) that at least one coefficient is not equal to zero. The Goodness-of-fit test was used to identify whether the model is well fitted to the data or not with the null hypothesis and alternative hypothesis respectively. Research Hypothesis
1. Chi squared Test H0: All the coefficients associated with predictors (i.e. the slopes) equal zero
H1: At least one of coefficients not being equal to zero
2. Goodness of fit test
H0: The model is adequate fitted for the data H1: The model is not adequate fit to the data

International Journal of Scientific and Research Publications, Volume 7, Issue 4, April 2017 148 ISSN 2250-3153
www.ijsrp.org
The log model of the ordinal logistic regression model is mentioned below in where the ordinal response is y and the expected value of the y is given as E(y) = π. Through the algebraic manipulation:
kko xBxBxBB ++++=
−
....1
ln 2211ππ
Where, 1. B0, B1 ,….Bk are the parameter of the ordinary logistic regression model 2. X1, X2, ….Xkare the predictor variables In above regression model even though the right side of the formula is linear, the left side is a non-linear function of the response variable π (ordinal responses) known as the logit link function. Since it is non-linear, the usual least square methods cannot be used to estimate the parameters. Therefore the method known as maximum likelihood is used in order to obtain above estimates. The log-likelihood ratio is used to identify the significance of the fitted model. Ordinal logistic regression was applied to multi-level responses with five-point likert scale (Strongly Disagree – 1, Disagree – 2, Fair- 3, Agree – 4, Strongly Agree - 5) with the multiple explanatory variables.
IV. RESULT AND DISCUSSION As shown in Table 2, among the total number of participants 101 (52.1%) was male and 93(47.9%) was female participants. Furthermore, Table 2 indicates that out of these participants 103(53.09%) of participants were second year undergraduate students and 91 (46.90%) were the third year students who had responded to the survey.
Table 2: Student participation by gender and level of study year
Gender Second Year Third Year Grand Total Percentage
Female 47 46 93 47.9%
Male 56 45 101 52.1%
Grand Total 103 (53.09%) 91(46.90%) 194 100%
According to the descriptive statistical analysis of the students’ internet experience the results emphasized that the majority of the students (65.46%) has more than five year of the internet experience and 20.61% has 3-5 year of internet experience. Additionally it presents that the approximately equal percentage of students from two degree programs named Computer Science and Technology (CST) and Industrial Information Technology (IIT) have been participated for the survey.
Table 3: Student participation by Internet Experience and degree program Table 4 mentioned below is consisted of the results of the best fitted ordinal logistic regression model under the first usability category (Content and Organization) as well as the results of the log-likelihood value and goodness of fit test.
Internet Experience CST IIT Grand Total
Percentage
less than one year 0 1 1 0.51% 1-2 years 12 14 26 13.40% 3-5 years 14 26 40 20.61% more than 5 years 72 55 127 65.46% Grand Total 98 (50.51%) 96 (49.48%) 194 100%

International Journal of Scientific and Research Publications, Volume 7, Issue 4, April 2017 149 ISSN 2250-3153
www.ijsrp.org
Table 4: result summary of Content and Organization category
Ordinal logistic regression model for the first usability category (Content and Organization) is shown in below formula. Where, 𝑥𝑥1 = Up-to-date information 𝑥𝑥2 = Easy of information search 𝑥𝑥3 = Readable content
𝑥𝑥4 = No need of scroll left and right From the logistic regression result table of first usability category, the p-values are used to test the statistical evidence that the respective predictors have an effect on the response. Hence the the table shows that the p-value are less in 95% of significance level (alpha=0.05), it is verified that the usability factors of the first usability category has significance effect to the overall content and organization of the website. The values labeled as B0, B1, B2, B3 are estimated intercepts for the logits of the cumulative probabilities. Since the coefficients for the predictors represent the increments of log odds for four usability factors indicated under the first category, these factors are significantly effect to the content and organization of the website. The statistic G tests value (114.001) of the Chi-squatted test and p-value (0.000) are shown that there is sufficient evidence to accept the coefficient for model is different from zero. The goodness-of-fit tests, with p-values of 1.000 denote that there is sufficient evidence to claim that the model is well filled with the data adequately. The fitted ordinal regression model for second (Website Navigation and Links), third (User interface design) and fourth (Website Performance) usability categories of the website are shown in Table 5, Table 6 and Table 7 respectively.
Table 5: result summary of Navigation and Links
Predictors Estimate Std. Error Z-value P-value
B0 4.34790 1.2812 3.39 0.001 B1 6.87310 1.2710 5.41 0.000 B2 10.2222 1.4109 7.24 0.000 Ease of move forward/backward -0.817490 0.2039 -4.01 0.000 Usefulness of links -0.758755 0.1902 -3.99 0.000 Prevention of pop-ups and new browser windows
-0.404531 0.1994 -2.03 0.042
Composition of the links/menus -0.281550 0.2331 -1.21 0.227
Test that all slopes are zero: G = 59.031 0.000 Goodness-of-Fit Tests Pearson Deviance
0.663 0.997
Predictors Estimate Std. Error Z-value P-value B0 6.98555 1.62000 4.31 0.000 B1 10.0209 1.42328 7.04 0.000 B2 12.6739 1.55342 8.16 0.000 B3 16.6663 1.76496 9.44 0.000 Up-to-date information -0.872650 0.252254 -3.46 0.001 Easy of information search -1.48370 0.254650 -5.83 0.000 Readable content -0.912825 0.228386 -4.00 0.000 No need of scroll left and right -0.374317 0.181639 -2.06 0.039 Test that all slopes are zero: G = 114.011 0.000 Goodness-of-Fit Tests Pearson Deviance
1.000 1.000

International Journal of Scientific and Research Publications, Volume 7, Issue 4, April 2017 150 ISSN 2250-3153
www.ijsrp.org
Ordinal Logistic Regression Model for the Navigation and Links:
Where 𝑥𝑥1 = Ease of move forward/backward 𝑥𝑥2 = Usefulness of links 𝑥𝑥3 = Prevention of pop-ups and new browser windows
From the above Table 5, it can be concluded that the fitted model is significance at 95% of significance level and the goodness of fit test shows that the model is adequately fitted to the data since the p-values are 0.663 and 0.997. According to the fitted model results, the second usability category is mainly affected from three factors named as ease of move forward/backward, usefulness of links and prevention of pop-ups and new browser windows. Hence the p-value of the factor ‘composition of the links/menus’ is more than 0.05, the relevant factors has no significance effect to the navigation and links.
Table 6: result summary of User interface design
Predictors Estimate Std. Error Z-value P-value
B0 3.33495 1.39278 2.39 0.017 B1 5.30422 1.09849 4.83 0.000 B2 8.17523 1.14743 7.12 0.000 B3 11.8186 1.33283 8.87 0.000 Attractiveness of the website 0.019784 0.22726 0.09 0.931 Use of comfortable color -0.613017 0.236648 -2.59 0.010 Easy learn of how to use -1.50351 0.258825 -5.81 0.000
Distracting or irritating elements -0.524226 0.198498 -2.64 0.008
Test that all slopes are zero: G = 91.163 0.000 Goodness-of-Fit Tests Pearson Deviance
0.925 1.000
Table 6 presents the result of fitted model under the category of user interface design which used to identify the user satisfaction regarding the interface design of the website. Ordinal Logistic Regression Model for the User interface design:
Where, 𝑥𝑥1 = Use of comfortable color 𝑥𝑥2 = Easy learn of how to use 𝑥𝑥3 = Distracting or irritating elements
According to the test statistic value of the chi-square test and p-value of the fitted model, it is significance at 95% significance level and goodness of fit test suggested that the model is well fitted to the data. The significance factors in the model are the uses of comfortable colors, easy learn of how to use and distracting or irritating elements. Moreover, the results show that the attractive design factor has no significance to the overall user interface design category.

International Journal of Scientific and Research Publications, Volume 7, Issue 4, April 2017 151 ISSN 2250-3153
www.ijsrp.org
Table 7: result summary of Website Performance
Predictors Estimate Std. Error Z-value P-value
B0 1.40722 1.3594 1.04 0.301 B1 3.8364 1.0085 3.80 0.000 B2 6.06722 1.0327 5.88 0.000 B3 9.32593 1.1765 7.93 0.000 Loading time of the web pages -0.35580 0.1665 -2.14 0.033 Distinguish between visited and non-visited pages
-0.35648 0.1788 -1.99 0.046
The Availability of the website -0.67695 0.1826 -3.71 0.000
Respond according to user expectation -0.608129 0.1918 -3.17 0.008
Test that all slopes are zero: G = 54.119 0.000 Goodness-of-Fit Tests Pearson Deviance
0.965 1.000
Ordinal Logistic Regression Model for the Performance and Effectiveness:
Where, 𝑥𝑥1 = Loading time of the web pages 𝑥𝑥2 = Distinguish between visited and non-visited pages 𝑥𝑥3 = The availability of the website
𝑥𝑥4 = Respond according to user expectation Based on the results mentioned in Table 7, it can be concluded that all the factors under the performance and effectiveness category is effected to the relevant category. Furthermore, the results emphasize that the model is significance at 95% significance level and it is well fitted to the data.
V. CONCLUSIONS A University website needs to be more charming websites with respond to today’s advanced technological era in order to improve user satisfaction while strengthens the university brand and its webometrics among other universities. By evaluating the usability of Uva Wellassa University website, the above aimed aspects of the university can be acquired and enhanced. In this study, a descriptive survey was conducted to collect the opinions from the undergraduate users regarding the usability of the university website and collected data has been used to investigate whether the identified usability factors have an impact on Uva Wellassa University website. The results obtained from the survey statistically proved that there is a strong associations between the usability and the content and organization as well as performance of the websites. It further revealed that the navigation and user interface design of the websites is in acceptable level according to the user perspective. Therefore, it is recommended that the usability factors under the two dimensions namely content and organization as well as website performance should be taken into consideration when improving the university website. Thus, it will significantly affect to the quality design of the university website which make the users more comfortable in accessing the websites.
REFERENCES [1] M. M. Yunus and A. Suliman, “Information & Communication Technology (ICT) tools in teaching and learning literature component in Malaysian secondary
schools,” Asian Soc. Sci., vol. 10, no. 7, pp. 136–152, 2014. [2] R. R. Ahmed, J. Vveinhardt, and N. Ahmad, “Empirical Analysis of Internet Usage and Academic Performance of Students: Evidence From Pakistan,” no.
July, pp. 3883–3892, 2016. [3] J. Nielson, “Usability 101: Introduction to Usability,” Nielsen Norman Group, 2012. [Online]. Available: https://www.nngroup.com/articles/usability-101-
introduction-to-usability/. [Accessed: 01-Aug-2016]. [4] M. S. Rahman and S. Z. Ahmed, “Exploring the factors influencing the usability of academic websites: A case study in a university setting,” Bus. Inf. Rev.,
vol. 30, no. 1, pp. 40–47, 2013. [5] L. Hasan, “Evaluating the usability of nine Jordanian university websites,” Int. Conf. Commun. Inf. Technol. - Proc., pp. 91–96, 2012. [6] H. Gull, I. S. Zafar, and Saqib MAdeeha, “Usability Evaluation of an Educational Website in Saudi Arbia,” VAWKUM Trans. Comput. Sci., vol. 1, no. 2, pp.
1–9, 2015.

International Journal of Scientific and Research Publications, Volume 7, Issue 4, April 2017 152 ISSN 2250-3153
www.ijsrp.org
[7] S. H. Mustafa and L. F. Al-Zoua’bi, “Usability of the academic websites of Jordans’ Universities An evaluation study,” Fac. Inf. Technol. Yarmouk Univ., pp. 1–9, 2008.
[8] M. B. Alotaibi, “Assessing the usability of university websites in Saudi Arabia: A heuristic evaluation approach,” in Proceedings of the 2013 10th International Conference on Information Technology: New Generations, ITNG 2013, 2013.
[9] T. K. Chiew and S. S. Salim, “Webuse: Website usability evaluation tool,” Malaysian J. Comput. Sci., vol. 16, no. 1, pp. 47–57, 2003.
AUTHORS First Author – D.P. Jayathunga, Bachelor of Science in Computer Science and Technology, Uva Wellassa University of Sri Lanka, [email protected] Second Author – J.M.D.R. Jayawardana, Bachelor of Science, Uva Wellassa University of Sri Lanka,[email protected] Third Author – S.T.C.I. Wimaladharma, Bachelor of Science, MSc.GIS, Uva Wellassa University of Sri Lanka, [email protected]. Fourth Author – H.M.U.M. Herath, Bachelor of Science, MSc, Pasbridge Inc, UK, [email protected] Correspondence Author – H.M.U.M. Herath, Bachelor of Science, MSc, Pasbridge Inc, UK, [email protected] , 0094 771843038
International Journal of Scientific and Research Publications, Volume 7, Issue 4, April 2017 153 ISSN 2250-3153
www.ijsrp.org
Analysis Relationship Regional Representative Council and Local Government in Regulation Making of Alleviation Poverty in West Sulawesi Province
Juanda Nawawi
Department of Politics and Government , Faculty of Social Sciences Hasanuddin University, Makassar, Indonesia Abstract- This research purpose was to describe and analyze the relationship between Regional Representative Council and Local Government in the making of local legislation of the alleviation of poverty. The result of this research showed that the relationship between, Regional Representative Council and Local Government in the making of local legislation is the diametric relationship. The relationship can be seen from the aspiration of society, public policy delivery budgets priorities and basis of the temporary budget by the local government to the parliament to be discussed and agreed upon. Then the local government to submit a draft regulation on the budget along with an explanation of the supporting documents to Regional Representative Council to be discussed and approved regulations. Index Terms- Local Government, Poverty, Regulation, Relationship, Representative Council.
I. INTRODUCTION he Republic of Indonesia Country as a unitary state that follows decentralization principle in the implementation of
administration, with extending opportunity and authority to the district to implement regional autonomy. Because of that, article 18 of the 1945 basic law that the unitary state of the republic of Indonesia divided into province districts and those province districts divided into regency and city, which are every province, regency, and city, has district government that has been ruled by the legislation. Thereby, the 1945 basic law is the stronger basic to implement autonomy with giving extensive authority, obvious and responsible to the district. The Legislation Number 32 Years 2004 about Local Government has been revised become The Legislation Number 23 Years 2014 to its principle regulate the implementation of local government that more give priority of decentralization principle implementation. The grounded matters in The Legislation Number 23 Years 2014 about Local Government is to encourage for empowering society, make initiative and creativity grow, increasing the society role, evolving the role and function of Regional Representative Council. The Legislation of Number 32 Years 2004 about Local Government has been revised become The Legislation of Number 23 Years 2014 gave confirmation that Local Government function as the executive body and Regional Representative Council as the local legislative body. The explicitness related to the function of this both institutes gives benefit to the democratization process in the implementation of
government in the region. The explicitness function is also become possibility "check and balances" to attain the good government order (good governance), such as the participative government, justice, transparent and accountable. In the Local Government system, the relation of Local Government and Regional Representative Council is work relationship that its position is equal and the character as a partner. This is means that both of them – Local Government and Regional Representative Council – has the same position and equal. That is the way in the implementation both of function together make Local Regulation include a regulation making of Local Budget. This means that both of them has the relation which supports each other, not become an enemy or rival each other. The Local Budget according to the Government Regulation Republic of Indonesia Number 58 Years 2005 named that The Local Budget has been planned orderly, obedient to the laws and regulations, efficiency, economical, effective, transparent, and responsible with pay attention to justice principle, properly, and benefit to the society. But in the reality there is strong impression that blossom out in the society that regulation-making process of The Local Budget, until has been considered into Local Regulation does not use the belief principles in the execute of good government order (good governance), but it's more made as interest base of the regulation making actors – agency of Local Government and Regional Representative Council Members include of individual interest, group, and party. The result of Local Budget regulation-making process, that caused the society interest as guaranteed in the laws and regulations become ignored that especially related to alleviated poverty efforts in that local government area. Besides that, Local Budget has been estimated does not have synchronization with Local Budget of City Regency. From that phenomenon that has been expressed above, the focus of this article is how is the relationship between local government and Regional Representative Council in a regulation making of Local Budget. Whether the local government apparatus and Regional Representative Council members in the Local Budget regulation making pay attention to Good Governance principle, and whether the outcome of Local Budget can ward off poverty significantly. The purpose of this research are to describe and analysis the relationship of Regional Representative Council and local government in the local regulation making of, the application of good governance principle by the local government and Regional Representative Council members in the Local Budget regulation
T

International Journal of Scientific and Research Publications, Volume 7, Issue 4, April 2017 154 ISSN 2250-3153
www.ijsrp.org
making, and the Local Budget that has been made and resulted by Regional Representative Council and Local Government can ward off poverty problem in West Sulawesi province.
II. RESEARCH METHOD The research method that used is a qualitative method with case study strategy research. The data aggregation technique is interview, observation, and document study. The respondent consists of local government apparatus and Regional Representative Council members, society personage, and NGO which their take has been doing by purposive sampling. The data has been analyzed with descriptively. The Result Research and Discussion the Relationship of Local Government and Regional Representative Council in Regulation Making of Local Budget One of the basic assumption that autonomy regulation had been applied is reinforcement of society by local government institutional, they are local government and Regional Representative Council. This reinforcement is purposed to open the opportunity of public regulation in the local area that had been becomen of local authority. From the result of research showed that relationship of local government and Regional Representative Council as government institute in the regulation making of Local Budget can be seen from a few aspects, those are: (1) the absorption of society aspiration, mechanism or medium that used in absorb society aspiration in local regulation making of Local Budget, the local province government party of West Sulawesi use mechanism of society meetings include looking for the poverty problem. Besides direct meetings between the local apparatus government with society, also the looking for input by the convenstional ways such as Local Conference or Musbangdes/Rakorbang and field observation in the process arranging of local regulation of Local Budget. The Regional Representative Council party as local legislative institute and as executor element of local government has order to absorb society aspiration as tugas menyerap aspirasi masyarakat as material in discussion of local regulation making of Local Budget, mechanism and and medium that used to absorb society aspiration with doing direct meetings with society and also field observation with constituent visit although direct aspiration acceptance from society who come from Regional Representative Council office, (2) discussion of local regulation program of Local Budget, the local government of West Sulawesi Province followed by governor decision Number 540 Years 2015 about team formation of local government estimate of West Sulawesi Province with order to make local government order program; doing discussion and decision of local government order program; and arrange program of The General Policy of The Budget, and the program of The Priority of the Provisional Budget Ceiling. The local government extend the program of The General Policy of The Budget and the program of The Priority of The Provisional Budget Ceiling to Regional Representative Council for discussing. The General Policy of The Budget and The Priority of The Provisional Budget Ceiling persistent refers to the general policy and local development
program of The Draft Medium-Term Regional Development of West Sulawesi Province in 2012-2016. The Regional Representative Council party of West Sulawesi Province as institute of The Regional Representatives and as element of local government executor, that can be seen by dicussion mechanism of local regulation program of Local Budget in 2014-2015 that has been submitted by the local government to The Regional Representative Council, has been accepted by Regional Representative Council’s secretariat, and Regional Representative Council’s secretariat extend the general policy program of budget and and the priority of the provisional budget ceiling to the Agency Budget that formed based on decision of West Sulawesi Province Regional Representative Council Number: 10 years 2012. The Agency Budget is the completeness medium of Regional Representative Council that has order to give suggestion and opinion as principal mind’s of Regional Representative Council to the local government to draw up the draft of The Local Budget. At least 5 months before established, doing discussion with budget local government team to the draft of The General Policy of The Budget and the Priority of The Provisional Budget Ceiling that extended by the local government, (3) the decision of local regulation program of Local Budget. The local regulation draft that inisiative came from the local government that suggested by the local government budget team of West Sulawesi Province to Regional Representative Council. Before it is legitimated become local regulation of Local Budget in 2015 by the local government and the Regional Representative Council in the plenary assembly, although from the local government party or the Regional Representative Council extend the principal minds, those are: (a) the regional budget confine equal maximum with the budget of last year, (b) the regional budget has been prioritized to fund budget that bonding and budget must assure the acquirement directness of society basic service of West Sulawesi Province. The relation of local government and Regional Representative Council in regulation making of Local Budget is the institutional relation. The practice that happended in the relation between local government and West Sulawesi Province Regional Representative Council inclined opposite diametrically. As the element of the local government, the local regulation are made togheter by with Regional Representative Council, it means that initiative of regulation making of West Sulawesi Province Local Budget are from the Local Government and not from Regional Representative Council. The Local Regulation Making of Local Budget and The Application of Good Governance Principle The general principles and The Local Budget in the government regulation Number 58 years 2005 about management of local finances, consider that local finances have been planned orderly, effectively, transparency and responsible with observe the principle of justice, properly, and benefit for society. The planning of local finances is held by one system that integrated and creates in The Local Budget. The Local Budget is one unit that consists of: the local income, local budget, and local defrayal. The arranging of West Sulawesi Province Local Budget by the local government apparatus and The Regional Representative Council be guided by The Work Plan of Local Government. The Work Plan of Local
International Journal of Scientific and Research Publications, Volume 7, Issue 4, April 2017 155 ISSN 2250-3153
www.ijsrp.org
Government is the analyze of West Sulawesi The Draft Medium-Term Regional Development 2012-2016 in period of time one year that make local economy draft, development priority and local obligation, the measurable work draft and its fund, such as held by province local government directly although the way in which encourage society participation. The Work Plan of Local Government of West Sulawesi Province in order to assure the relevance and consistency between planning, budgeting, implementation, and monitoring. Based on the result research showed that in arranging of The Work Plan of Local Government of West Sulawesi Province years 2015, principles also arranging mechanism has been seeking to be directed by the local government apparatus that gather with Local Budget Government Team consist of: (1) optimize engaging the society participation in absurd society aspiration, by the seminar open discussion, workshop, or forum discussion, (2) oriented to the problem solving and sensitive to the society condition development, (3) oriented to the performance development, (4) oriented to five regulation to West Sulawesi Province development, such as: (a) increase human resources quality, apparatus, (b) increase the medium infrastructure quantity and quality and also economic growth, (c) increase Natural Resources quality in the education sector, (d) strengthen Natural Resources in health sector, (e) utilization of natural resources ongoing. The arranging of the work plan of local government as many as 32 unit of The Local Government Unit and 234 work programs that be guided by The Draft Medium-Term Regional Development of West Sulawesi Province comprehensively based on the government concerned is the obligation duty and alternative duty which needs budget that could be allocated in The Local Budget years 2013-2014. The arranging of every The Local Government Unit as work plan of local government constant to pay attention of the arranging principle of The Local Budget. Based on facts that showed the arranging budget in every local government unit refers to the regulation of The Minister of Internal Affairs Number 37 years 2014 about orientation the arranging of local budget and cost years 2015 consist of: (1) appropriate with the government executor needs based on The Local Government Unit authority, (2) transparency of The Local Government Unit budget to facilitate the society to know and can access more information about the budget of every The Local Government Unit and its application, (3) engaging the society participation in order to get inputs from the society from various forums to arranging The Local Government Unit. This condition describes that the arranging of Local Budget that has been done by the local government apparatus of West Sulawesi Province has not applied Good Governance principle completely include the budget spending efficiency and effectively and accountability of the budget spending. Based on the facts that obtained by interview result with the actor of local government apparatus and Regional Representative Council members. The arranging of The Local Budget years of 2015 whereas the local government constant to pay attention to The Minister of Internal Affairs Number 32 years. The arranging principle of The Local Budget refers to: (1) the needs of local province government executor based on the government’s business and authority from government to the local province government, (2) following phases and time schedule of The
Local Budget arranging years 2015 as same as like in the laws and regulation, (3) the openness information of The Local Government Unit budget by web to make easier the society to access information about The Local Budget, (4) encourage the participation level of society, (5) pay attention of justice principle and properly in the budget spending, (6) to seek of The Local Budget arranging that not be in contradiction with public interest and the high level of regulation. The Arranging and Decision of The Local Budget. The local province government of West Sulawesi Province extend the public policy of The Local Budget that collateral with the work plan of local province government of West Sulawesi Province, as a base of the arranging of The Draft of The Local Budget to Regional Representative Council to discuss in the first talk of The Draft of The Local Budget. Based on the Local Budget public policy that has been agreed with Regional Representative Council, the local government with Regional Representative Council discuss priority and The Provisional Budget Ceiling to make into the reference for every The Local Government Unit. The discussion of public policy of Policy General Local Budget Revenue and Expenditure and priority of The Provisional Budget Ceiling both of actors, they are the local government apparatus and Regional Representative Council members that involve into the discussion of The Local Budget must pay attention of society participation by society input of development budget allocation to increase society welfare, estimate transparency that could be accessed by the society. Then The Head of The Local Government Unit arranging the work plan and budget of The Local Government Unit that in ordered based on the achievement. Work plan and budget followed with expenditure estimate for the next year. The work plan and The Budget of The Local Government Unit extend to Regional Representative Council to discuss in the first talk of The Draft of The Local Budget. The result of the discussion between The Regional Representative Council and the local government is communicated to the officials of the regional finance manager as matters to arranging local regulation draft of The Local Budget. The next process is the local government of West Sulawesi Province proposes the local regulation’s draft about The Local Government follow with the explain from documents to The Regional Representative Council to discuss and agreed. The Local Budget that has been agreed by The Regional Representative Council has details until unit organization, function, program, activity, and expenditure kind of The Local Government Unit. The Local Budget of West Sulawesi Province that made and agreed together between the local government and The Regional Representative Council showed a condition about arranging and a decision of The Local Budget by the actors, such as the government apparatus party although The Regional Representative Council’s members. On the other hand showed the application of a few good governance principle, and the other is less accurate in the calculate and budget allocation that caused The Local Budget’s deficit in 2015. From the efficiency level and effectiveness less get attention from the actors. The other words are the efficiency and effectiveness principle in the good governance has not applicated yet by the local government apparatus and The Regional Representative Council’s members
International Journal of Scientific and Research Publications, Volume 7, Issue 4, April 2017 156 ISSN 2250-3153
www.ijsrp.org
who involved in the arranging, discussing, determining of The Local Budget. Contribution of The Local Budget and The Alleviation of Poverty The Local Budget of West Sulawesi Province is one of the unity that consists of: local income, local expenditure, and local cost. The Local Income includes all of the accpeted money from The Account of The Regional Treasury that increase equity fast cost, that from the local right in one year of the budget that does not need to be paid back by the regional. The local income consist of: The Original Local Income, fund balance, and the legal of local income others; the fund balance consist of: fund output divided, the general allocation fund and the special allocation fund; and the legal local income others that include all of the local income except The Original Local Income and fund balance include grant, emergency fund, and other income that has been applied by the government. The local expenditure consists of all the expenditure from The Account of The Regional Treasury that diminished equity fast cost that becomes the local duty in one year’s budget that never gets back the payment by the region. The local expenditure uses in the implementation of government business that becomes the local province government authority, the regency in West Sulawesi that consist of the duty business and the selection business that decided with laws and regulation certainty. The expenditure of the duty business executor must be the priority to protect and increase the quality life of society in order to fulfill the local duty created in the upgrading of local services, education, health, social facilities, and public facilities that proper and also evolving social guarantee system. The duty business besides increases the quality of the society, in the other hand priority to alleviate poverty. The Poverty is a complex problem that influenced by related factors, they are income level, health, education, the access to goods and services, geographic location and area condition. From the result research showed that the regulation of local expenditure of West Sulawesi Province that describes in the Local Government has made efforts with the rule of financing system that proportional, efficient, and effective based on principle: (1) pro-growth, (2) pro-poverty alleviated, (3) pro predatory of employment to through unemployment level, (4) pro-human development, (5) pro area conservation. These are doing with the budget-based work phenomenological, The Framework of Budgeting Medium-Term and the unified budget. In the relevance with poverty problem in West Sulawesi Province, the total presentation of poor inhabitant on March 2007 until March 2010 straight showed the decrease from year to year, that is from 189,9 thousand inhabitant (19,03%) on March 2007 become 141,3 thousand inhabitant (13,58) on March 2010. But on period of March 2010 until March 2011 increase experienced as big as 23,5 thousand inhabitants (0,31%), on March 2012 the total poor inhabitant in West Sulawesi Province are 160,5 thousand inhabitant (13,89%) and on the 2013 years until 2015, data about the total poor inhabitant be guided by 2012 years (The Central Bureau of Statistic of West Sulawesi Province). In the era of 2012-2016 years, the local expenditure regulation in The Local Budget of West Sulawesi Province has
been allocated to the public expenditure that touch directly the small society include of the society who be in the poor line. The direct expenditure is an obligation of the local government and the expenditure allocation policy has not been directed to (1) upgrading of services to the society with effectively and efficiently by the raising of motivation, discipline, work ethos and local government apparatur mobility, (2) encouraging society organization in the urged the government’s duties, (3) facilitating the regency government in the acquirementand increase of the local finance capability, (4) handling of poverty problem. For the West Sulawesi Province the allocated of regional expenditure that consist of indirect expenditure consists of employee expenditure 45,18% as compare to social effort expenditure for tackling poverty 0,33%, social effort expenditure tho the society group 21,9%. This condition describes the local expenditure such as direct expenditure or indirect expenditure that in being Local Budget to tackling poverty still small relatively, in the means of the contribution of The Local Budget has not significant could through poverty problem in West Sulawesi Province. But on the other hand, there are many local government’s efforts of province and regency in West Sulawesi to overcame poverty problem include of empowering the village society which known as “The Rise of Mandar Program” it is the autonomous village development based on society. The Rise of Mandar Program is the program of West Sulawesi Province local government in the tackling poverty. The organization structure of The Rise of Mandar Program begins from province level until to village level from the government (province government/ The Local Government Unit, the regency government, subdistrict, village claim ability to play the role as development catalyst to encourage social transformation to give contribution to tackling poverty in West Sulawesi Province. The type of The Rise of Mandar Program that the fund comes from The Local Budget that submitted to The Local Government Unit of province and regency as like as training economy activity of society and development of superiority commodity in every village in region The Rise of Mandar with training to the village society that are in the six regencies: Mamuju Regency, Middle Mamuju, Mamasa, Polewali Mandar, Majene, and North Mamuju. The paradigm displacement of the government implementation from centralization system to decentralization system with the born of The Laws Number 22 Years 1999 then revised become The Laws Number 32 Years 2004 about The Local Government where both of governments can implement their function each other, the local government as the local executive and Regional Representative Council as the local legislative. In The Laws Number 32 Years 2004 and was revised become The Laws Number 23 Years 2014 explained that the local government is the executor of government’s duty by the local government and Regional Representative Council according autonomy principle and co-administration with the broadest autonomy principle on the principles system of the unity republic state.
III. CONCLUSION The Laws Number 32 Years 2004 was revised become The Laws Number 23 Years 2014 about the local government
International Journal of Scientific and Research Publications, Volume 7, Issue 4, April 2017 157 ISSN 2250-3153
www.ijsrp.org
mentioned that the local government executor is the local government and Regional Representative Council. Both of the local government are the elements of the local government executor. The relation of the local government and Regional Representative Council of West Sulawesi Province in the local regulation making of The Local Budget years 2015, in practice happened that relation both of government institute disposed be faced with diametrical appropriate with positiion, assingment, and authority. The local government and Regional Representative Council together disscuss and agree the local regulation’s draft. The local regulation’s draft of The Local Budget initiative came from the local government, and the draft of the local regulation toghether with Regional Representative Council disscuss and approve the local regulation’s draft become the local regulation Number 5 years 2015 about local regulations of The Local Budget. The Local Budget of West Sulawesi Province year 2015 is a unit that consist of local income, local expenditure, and local defrayal. The Local Budget could be seen from principles and The Local Budget structure, orientation of The Local Budget arranging, arranging and decision The Local Budget in the The Local Budget structure, planning of the local finance is doing with orderly, economical and obedient to The Laws and local government apparatus and Regional Representative Council member that involve in the arranging and disscussing of The Local Budget be guided by regulation of The Minister of Internal Affairs Number: 37 Years 2012 about the orientation of The Local Budget arranging and pay attention a few principles of good governance those are society participation, transparency and accountability. The Local Budget of West Sulawesi years 2015 that established with The Local Regulations Number 5 Years 2015 about local regulation that consist of local income, local expenditure, and local defrayal. The local government and Regional Representative Council in arranging, disscussing and establish of The Local Budget less sensitive in the allevation of poverty in means of not pro-active (poor society). This is can be seen from posture budget especially local expenditure that small relatively and less significant in alleviate of poverty. On the other hand there are the government efforts to tackling poverty problem with the budget that came from The Local Budget that definite relatively in every The Local Government Unit that is “The Rise of Mandar Program” that based on the village society.
REFERENCES [1] Anderson, J. E. (1979). Public Policy Making. New York: Holt, Rinehard
and Winsta [2] Cress well,John W.1994. Research desain Qualitative and quantitative
Approaches, London-New Delhi; International educational and profesional publiser
[3] Astawa,P,I.G .2002. Problematika peraturan daerahTantangan dan Peluang Berinvestasi di Era Otonomi Daerah. Makalah disajikan dalam seminar Nasional “Expose Potensi dan Peluang Bisnis di Provinsi Riau” di selengarakan perhimpunan Mahasiswa pasca sarjana Riau Bandung 19 Oktober 2002.
[4] Dye, T. R. (1972). Understanding Public Policy. NJ: Prentice hall Inc. [5] Easton, D. (1965). Framework for Political Analysis. NJ: Prentice Hall, Inc. [6] Hofferbert, R. L. (2000). The Study of Public Policy. New York: The Boobs
- Merrill Inc. [7] Saad, M. (2011). Analisis Pembuatan Kebijakan Anggaran Pendapatan dan
Belanja Daerah (APBD) Kota Makassar. Disertasi Universitas Hasanuddin Makassar
[8] Warstiono, S. (2009). Manajemen Pelayanan Publik Suatu Analisis. Bandung: Remaja Rosdakarya.
[9] Undang-Undang RI Nomor 32 Tahun 2004 tentang Pemerintahan Daerah. [10] Undang-Undang RI Nomor 17 Tahun 2003 Tentang Keuangan Negara. [11] Peraturan Pemerintah RI Nomor 58 Tahun 2005 Tentang Pengelolaan
Keuangan Daerah. [12] Peraturan Pemerintah RI Nomor 54 Tahun 2005 tentang Pinjaman Daerah. [13] Peraturan pemerintah RI Nomor 55 Tahun 2005 Tentang Dana
Perimbangan. [14] Peraturan Pemerintah Nomor 56 Tahun 2005 Tentang Sistem Informasi
Keuangan Daerah. [15] Peraturan Pemerintah Nomor 57 Tahun 2005 Tentang Hibah Kepada
Daerah. [16] Peraturan Pemerintah Nomor 58 tahun 2005 Tentang Pengelolaaan
Keuangan Daerah. [17] Peraturan Daerah Nomor 05 Tahun 2013 Tentang Anggaran Pendapat
Belanja Daerah Provinsi Sulawesi Barat. [18] Peraturaan Daerah Nomor.1 Tahun 2013 Tentang Rencana pembangunan
jangka Menengah Daerah RPJMD Provinsi Sulawesi Barat [19] Keputusan Gubernur Provinsi Sulawesi Barat Nomor.12 Tahun. 2013
Tentang Pembentukan Tim Anggaran Pemerintah Daerah [20] Keputusan Dewan Perwakilan Rakyat Daerah Provinsi Sulawesi Barat
Nomor 1 Tahun .2012 Tentang Pembentukan Badan Anggaran DPRD.
AUTHORS First Author – Juanda Nawawi ,Email: [email protected], Department of Politics and Government , Faculty of Social Sciences Hasanuddin University Makassar, Indonesia

International Journal of Scientific and Research Publications, Volume 7, Issue 4, April 2017 158 ISSN 2250-3153
www.ijsrp.org
Cloud computing – a necessary reality in modern education
Gabriela Kiryakova*
* Trakia University, Bulgaria Abstract- Education in the Information Society is always connected and follows the development of information and communication technologies. The deployment of modern information technologies in educational institutions requires appropriate infrastructure and its effective management. Many schools and universities cannot afford the large investment costs of new technologies, which complicates their application in education. Cloud computing is a contemporary effective solution that allows educational institutions to respond quickly and adequately to new challenges and implement innovative approaches in training. The main objective of the current work is to analyze and summarize the advantages of the cloud computing model for educational institutions, and to reveal its potential for providing infrastructure, platform and applications, which can create innovative learning environment. Index Terms- Deployment models, Cloud computing model, Infrastructure as a Service, Platform as a Service,Service models, Software as a Service
I. INTRODUCTION odern education is invariably linked to the widespread use of information and communication technologies (ICT).
ICT enable the implementation of contemporary forms of education based on new pedagogical paradigms where the learner is a central figure, and actively participates in the learning process, interacting and collaborating with all participants. Implementing ICT in education leads to training consistent with the needs and characteristics of the new generation of learners, called "digital natives". They have new requirements for the educational process and the learning environment. In order to meet the changing requirements and expectations, educational institutions need to offer modern forms and methods of training and educational services that are available through a variety of devices. More and more activities (learning and administrative) are affected by ICT because the new technological inventions are more flexible and can expand and open the educational space to a wider audience. A serious problem for most educational institutions is how to follow and apply the latest innovations in ICT. The deployment of modern ICT requires appropriate infrastructure and its effective management. Many schools and universities cannot afford the large investment costs in new technologies and do not have enough qualified IT staff – factors that complicate the application of modern ICT in education.
Similar to business companies that are quickly embracing cloud services as an approach for effective implementation of their activities, educational institutions are also looking for different ways for effective and profitable use of modern ICT, without increasing their costs. Cloud services are a contemporary and effective solution that allows educational institutions to respond quickly and adequately to the new challenges and implement innovative approaches in training. For many schools and universities the Cloud computing model offers economically efficient solution to the problem of how to provide resources and services (computing power, storage and applications) to the rapidly growing number of learners without making significant capital investments in hardware and software and their maintenance [1]. On the other hand, the continuous access to information and the possibility of sharing resources are among the most important advantages of cloud computing which make it very important and necessary for modern education.
II. CLOUD COMPUTING Cloud computing is not just a new technological phenomenon. It is the result of the evolution of different existing technologies: Internet, virtualization, grid computing, and web services [2]. Cloud computing corresponds with the new stage in community development, the emphasis is on the communication and interaction between people and the new way the content and knowledge are generated [3]. There are many definitions of cloud computing, but the most popular is the definition of the National Institute of Standards and Technology (NIST) as it reflects all essential aspects of cloud computing. Cloud computing is a model for enabling ubiquitous, convenient, on-demand network access to a shared pool of configurable computing resources (e.g., networks, servers, storage, applications, and services) that can be rapidly provisioned and released with minimal management effort or service provider interaction [4]. The essential characteristics of cloud computing are [4-6]: • On-demand self-service. Users can unilaterally request and receive computing resources when they need them without human interaction with service providers. Cloud computing creates the illusion of infinite computing resources available on demand and thus eliminates the need to make preliminary plans for their long-term delivery. • Permanent and broad network access. Computing resources and services are available anytime from anywhere in the world over the network through standard mechanisms.
M

International Journal of Scientific and Research Publications, Volume 7, Issue 4, April 2017 159 ISSN 2250-3153
www.ijsrp.org
Access mechanisms allow the use of heterogeneous platforms and devices, which facilitates users’ access to services. • Resources pooling and sharing. The provider’s computing resources are pooled to serve multiple users. They are not set aside and fixed between users in advance. They are dynamically assigned according to their needs. • Rapid elasticity. Depending on their current needs, users can dynamically change (increase or decrease) the leased resources. The possibility of scaling the rented infrastructure allows users to react promptly to dynamically changing needs. Users can start with a small amount of resources and increase them only when their needs grow. • Varying according to consumption price (pay-per-use). Payment for cloud services is determined by actual resources consumption: the price depends on the level of users’ activity. Users are charged only for the actual consumption of computing resources for the period of time they are used. Users use and pay for resources when they need them and can quickly and easily release them when they are no longer needed.
III. CLOUD COMPUTING IN EDUCATION Changes in education inevitably follow transformations in society. Traditional forms of education are inadequate and difficult to apply in training of digital generation learners. Ideas for active learning and social interaction suggest new forms of education that are implemented through new technologies. Traditional forms of e-learning require significant investments, as well as on-going costs of maintenance and upgrade of hardware and software. There could be problems at times of peak consumption due to limitations of the hardware computing power. The application of traditional IT techniques for solving existing problems is not appropriate and has a high cost for educational organizations. There is a need for a new way of implementing e-learning software solutions, new alternative technologies and tools that allow achieving a high level of efficiency and compliance with modern trends in education and science and at the same time lower costs for acquiring and maintaining of IT tools. Following the global trends in ICT development, one of which is cloud computing, is an effective way to solve existing problems and achieve objectives at a minimum cost. Cloud computing is mainly associated with business, but recently it has become a factor in education. More and more cloud service providers adapt or add new functionalities to their applications to serve the needs of participants in the learning process and meet their expectations. There are various reasons for the growing penetration of cloud computing in education: • A large number of learners (globally) who need access to education at any time and from anywhere. The idea of lifelong learning involves continuous access to a huge amount of electronic educational resources. Different educational paradigms, requiring interaction and collaboration as an essential element of the learning process, require new tools for their effective realization. • The attitudes and expectations of society, teachers and learners from the educational institutions are related to the
availability of modern learning environment where the learning process can take place. Users possess a variety of devices and they want to use them to access information (including learning materials) at any time and place and to be connected with the rest of the world. The traditional IT infrastructure cannot serve the ever growing number of personal devices (tablets, smartphones, PCs and laptops) and provide tools for effective interaction of all participants in the training process [7]. • There is a need for implementing tools and applications and delivering web-based services to learners and teachers at an accelerated pace, which is often without a proportional increase in the budget for IT resources and staff [7]. The training in certain subjects includes the use of simulations or modeling as basic tools and forms for acquiring knowledge and skills. Powerful computers and software packages are needed for their successful implementation, frequently with no free alternative, which requires considerable investment costs. Cloud services are the basis for new strategies that educational institutions should be developing in order to offer new business models that will allow them to deal with insufficient funds for building and managing IT infrastructure necessary for the development of modern forms of education (such as distance and e-learning) [8]. Cloud computing supports the creation of a suitable environment for socially oriented education based on collaboration and interaction between all participants in the learning process.
A. Advantages of cloud computing for education The benefits of the cloud computing model in education are both for teachers and learners as well as educational institutions. The study of Forrester Research [9] shows that the main reason for moving to the cloud is cost savings. Working in the cloud, organizations realize the true potential of cloud computing to transform their activities. As a result, reducing costs is no longer one of the primary reasons organizations continue to use cloud services. The advantages of cloud services for education can be viewed from different aspects [3, 6-7, 10-12]. The main advantages are: economic benefits, efficiency and flexibility, accessibility, and innovation. • Economic benefits. The use of applications and services from an external provider is a cost-effective and efficient solution for educational institutions, which allows a high degree of financial flexibility. The advantages of the cloud computing model compared to the traditional approach are: Reducing and reallocating expenses. A key element of cloud computing is its potential to reduce costs and investments for building and maintaining IT infrastructure and administrative costs for IT staff. Cost savings result from the sharing of hardware and software among many users. Cloud computing provides flexibility and eliminates the need for significant capital investment to purchase hardware and software. Educational organizations do not need to buy expensive hardware which may not be fully utilized. They can hire the necessary resources from the provider that owns them, and pay only for actual resources consumption for the period of their usage. The cost of rented resources is lower, because IT equipment is shared among multiple users. Software products are

International Journal of Scientific and Research Publications, Volume 7, Issue 4, April 2017 160 ISSN 2250-3153
www.ijsrp.org
offered in the form of services, and special software installed on client devices is not required, users need a web browser to access services. The applications are not installed and configured on the client devices, there is no need to support and update software, which leads to reduced costs for licenses and maintenance. Capital expenditures are replaced with operating expenditures, which for organizations means not only a change in their budgets, but also in their overall attitude and perception of IT infrastructure: awareness of the advantage of using IT resources instead of their possession [13]. On the other hand, there is a minimal administration of the IT infrastructure: reducing the cost of technical support of the equipment and software applications. The maintenance of the rented resources is the responsibility of the service provider, which frees the educational institutions from the need to hire IT experts or train their own staff how to maintain and manage the equipment and applications, which also reduces costs. Payment for actual consumption and free services. Many of the cloud services for education are free. At the same time, even if payment for applications or services is required, it is based on actual consumption. This approach can help avoid unnecessary expenses and the insufficient use of licensed software. Payment only for the period of actual use allows teachers to experiment with different software products and systems in order to select those that are appropriate to achieve specific educational goals. Learners can also use various software applications without the need to purchase and install them on their local computers. Utilization of old equipment. It is well known that hardware ages rapidly, forcing organizations to purchase new servers and equipment in order to meet the increasing system requirements of software products. Cloud computing provides opportunities for extending the life of old computers. The use of cloud services does not require powerful computers, a web browser is sufficient to use most of the services. The old computers can be turned to workstations and can be used for a long period of time. For educational institutions the ability to extend the life of obsolete equipment and ensure its effective use in the learning process is a way of saving money and providing the necessary technical tools. Finally, cloud computing offers a faster return of investment and the ability to deal with rapidly changing software and hardware needs at a lower cost. • Efficiency and flexibility. Cloud computing creates a virtual world where resources seem limitless, which provides each organization the flexibility and freedom to choose a development policy. Educational organizations can effectively implement their strategy, without the need to consider physical provision (hardware and software), since they have the ability to rent IT resources while securing their maintenance and management. Fast acquisition, provison and introduction of new IT solutions. Cloud computing ensures the use of modern ICT and the ability to follow the rapid development of technologies, which cannot be achieved if the organizations use locally developed IT infrastructure. The cloud computing model allows immediate use of services and applications in the real learning process [14]. Cloud computing offers fast acquisition, provision and introduction of new IT platforms, services and applications [7]. In traditional model contract and delivery of new hardware,
installing and configuring software takes considerable time, which extends the time for implementation of new IT solutions. Cloud service providers have the necessary equipment, software, staff and experience in implementing various cloud solutions in client organizations, which allows for rapid implementation and it also reflects the economic side of the issue: faster return of investment costs. The result is a more efficient response to changing conditions and requirements. A complete and effective use of IT equipment.Cloud computing allows a high degree of efficiency in training in certain subjects which require significant computing power to carry out practical exercises. There are opportunities to work with specialized complex software applications that require intensive computing resources (such as mathematical, statistical tools, CAD systems, etc.). Educational organizations can improve their IT infrastructure by renting powerful cloud computing resources as well as ensure better use of available tools. Focusing on specific activities. Cloud services are provided by specializing in particular area vendors, which guarantees the quality of both the services and their maintenance and management. Clients can implement the best available practices. Using cloud services, educational institutions can focus on activities and processes related to learning and research. They do not need to spend resources (money, time, and people) for maintenance and management of the tools that support their main mission. Such an approach results in higher productivity and efficiency. Stimulating and supporting research activities. Cloud computing supports research activities in educational institutions by providing necessary resources for data processing and analysis. A specific feature of research projects is that computing power is needed for a certain period of time (duration of the projects) and after their completion, computing resources become unusable. Using cloud computing institutions can build multiple virtual parallel computing environments, based on virtualization, that provide the necessary resources for data processing [15]. Opportunities for elastic scaling of rented facilities allow hiring of computing resources and storage without additional investment costs, paying only for actual consumption. The release of rented resources when there is no demand for them is quick and easy. Cloud services not only support research activities but also encourage them by providing the necessary environment and tools. Sharing learning resources and activities and collaboration between all participants in the learning process.Cloud computing supports sharing of learning resources and collaboration and interaction between learners and teachers, which is a prerequisite for achieving higher efficiency in the educational process. Learning content, created by cloud based tools and services, is the product of the collaboration and can be easily shared and disseminated to multiple users. Sharing learning resources allows their improvement and enrichment, avoiding duplication of content and the need for each teacher to develop his own. Cloud computing creates conditions for an environment where the idea of social constructivism can be achieved. • Accessibility.

International Journal of Scientific and Research Publications, Volume 7, Issue 4, April 2017 161 ISSN 2250-3153
www.ijsrp.org
Cloud computing allows easy and unrestricted access for teachers and learners to services and resources at any time and place through a variety of devices. A comprehensive accessibility by different devices enables implementation of mobile learning which is characterized not only by the use of mobile devices, but above all by ensuring mobility of participants in the learning process. Access to applications at any time and place is an important factor for the implementation of the idea of continuing education and lifelong learning. Learners can use their own devices for training, without requiringprior configuration or installation of specific software. Since most students, especially those in higher education, rely on mobile technologies for their daily activities, the use of mobile devices for educational purposes is completely natural. The capability to use applications offline and synchronize data between local devices and the cloud allow effective work at any time and place. • Innovation. In education, technologies should provide opportunities to create innovative learning environment where various pedagogical paradigms, methods and approaches can be realized. Higher education is a field where technologies should support the implementation of innovative ideas and approaches in learning and research activities. Through cloud services educational institutions have the privilege to experiment with new applications, services and tools with minimal financial and time commitment and engagement with vendors, paying only for actual consumption [7]. This approach enables them to choose the most appropriate solutions for learning and research activities in order to be effective and efficient. In conclusion, cloud services enable the creation of a flexible learning environment with a variety of opportunities, resources and tools that match learners’ needs, learning goals and expected results. It allows the implementation of different teaching approaches and scenarios consistent with the leading paradigms of Social constructivism and collaborative learning.
B. Risks of cloud computing model in education Risks and concerns associated with the use of cloud services by educational organizations are: security and data protection, loss of control over data and applications, unwanted ads, and inability to migrate to other providers [6, 10, 16]. • Security and data protection. Outsourcing data in remote locations is a serious risk and challenge for any organization. One possible solution to the problem of data security is the deployment in a private cloud which is more secure compared to the public clouds. The private cloud is a more expensive alternative (from a financial point of view), which makes this solution less preferred by many educational institutions with limited budgets. In order to improve security, some cloud vendors warrant data storage only in certain countries with strict laws on data protection. Data separation and deployment in several clouds, supported by different vendors, may provide a higher level of security and avoid vendor and data lock-in. The main drawback of this solution is that the transfer of data between clouds is not always possible and can put data at risk. Another possible decision is critical data and applications do not deploy in the cloud and
continue to be stored on local servers which are under the control of the organization. Unauthorized data access is another major problem of cloud computing. One of the most common solutions for data protection is data encryption before deployment in the cloud. Direct contacts and collaboration with the service provider, without the use of intermediaries, is another approach that guarantees data protection, since the presence of multiple intermediaries increases the risks to data security and protection. • Loss of control over data and applications. The cloud computing model suggests data and applications are physically stored on the service providers’ servers. The result is the transfer of the liability for maintenance and management of infrastructure, applications and data to the vendors. At the same time, data storage on remote servers automatically transfers control of the data in the hands of the providers. The consequence is a significantly reduced degree of users control over their data. Users will have no knowledge of when, where and why their data is processed and there is a substantial risk of data extraction and analysis for unclear purposes [17]. • Unwanted ads. A possible risk of cloud computing solutions is the accumulation of personal information of users which vendors can misuse for their own benefits. A common shortcoming is the "overloading" of users with unwanted advertisements (spam). This problem is predictable and can be prevented as part of the contract for cloud computing services: the majority of providers eliminate unwanted ads as part of their services for educational institutions. • Inability to migrate to other providers. Although most providers claim they ensure and facilitate migration to other vendors (due to compatibility of products and services), the transfer of content from one system to another is associated with expenses and it is not always possible. The main risk of cloud computing is the commitment and dependence on a specific provider and the inability to migrate to others. The dependence on a particular provider is directly related to the availability of the offered services. If the provider stops providing services for various reasons, users will have no access to data and applications, and therefore will not be able to carry out their activities [17]. It is particularly important for education institutions to have opportunities for experimenting and working with a variety of tools and services in order to select those that are most appropriate to the learners’ needs and for achieving specific educational objectives. Often teachers have to replace existing tools with new ones in response to changes in participants’ needs and learning environment. One possible solution to the problem of dependence is the institution of open standards and adherence to them by vendors. Absolute security and data protection does not exist. Organizations have to overcome their fears, because they exist in any decision that includes the use of ICT and the Internet. A careful selection of cloud providers and selective data deployment in the cloud, especially in public clouds, is needed in order to minimize the risks [18]. It is very important to determine the interaction between the cloud service providers and the consumers, which is usually achieved by a Service Level Agreement (SLA). The Service Level Agreement is a contract between the service provider and the user, which defines the requirements of consumers and the responsibilities of the vendor.
International Journal of Scientific and Research Publications, Volume 7, Issue 4, April 2017 162 ISSN 2250-3153
www.ijsrp.org
SLA regulates the conditions of provision and use of cloud services, which reduces the risks for users and defines their relationship with the providers. A step-by-step transition to cloud computing helps educational organizations overcome some risks. Initially they can outsource only data and applications that are not crucial to their activities. This is a way to check the reliability of the provider and how offered services meet the needs of the educational organization and participants in the learning process. The opportunity for flexible hiring and expanding rented resources allows gradual transition from traditional to cloud solutions. On the other hand, cloud computing already has a relatively long history: there are established service providers, and good practices and models for transition to the cloud, which helps minimize the risks and creates conditions for efficient and safe activities in the cloud. Some of the risks of data migration in the cloud can be viewed from a different perspective and become benefits for users [12, 19-20]: • Preventing data loss. Data and applications storage in the cloud, instead of on personal devices, makes them safer in cases of hardware problems with local user devices. Users do not need to backup data or transfer it from one device to another, since the cloud is a centralized data repository which is accessible from various locations through a variety of devices. • Higher level of data security. In comparison to the traditional approach of using hardware and software, where users (individuals or organizations) have to find their own ways and tools to protect data, cloud service providers possess advanced hardware and software means for ensuring a high level of protection of users’ data and applications. The location of stored data is not evident to the end-users and therefore theft or unauthorized access is difficult. Despite concerns and contrary to expectations, the cloud infrastructure is characterized by high level of protection and security. The data in the cloud is often better protected than if it is stored on companies` local servers and maintained by their internal IT department. Providers of cloud services ensure the confidentiality of data by encryption, strict control to prevent unauthorized access, scheduling backup, etc. [21]. • Increased reliability of services. Providers of cloud services specialize in providing certain services or applications and this specialization allows them to manage effectively the process of maintenance, backup and restoration of data in case of any failures or disasters.
IV. CLOUD COMPUTING SERVICE MODELS IN EDUCATION
Educational institutions can benefit from both different deployment models (public, private, hybrid or community cloud) as well as different service models (Infrastructure as a Service, Platform as a Service and Software as a Service). The public cloud is a cost-effective solution for educational institutions to use quality services with guaranteed support. The private cloud offers utilization of available technical resources and developed network infrastructure, higher level of data
security and provides only specific services needed by the organization. The community cloud, used by several educational institutions, offers qualitatively and quantitatively comparable information services to consumers [22]. Cloud computing offers an infrastructure, platform and educational services and applications to educational institutions [23]. Infrastructure as a Service (IaaS) is a model of providing computer infrastructure. IaaS allows users to rent computing resources according to their needs, avoiding the necessity to buy hardware components. Payment is based on consumption and there is an opportunityfor elastic scaling of rented resources. Users are able to run different software packages (including operating systems). The provider manages and controls the cloud infrastructure, while the user has control over the applications [4]. The opportunity to rent computing resources that can be elastically scaled in case of changing needs is essential for educational organizations. They can benefit from rented computing resources to provide the educational process in IT disciplines that require the availability of appropriate infrastructure. Data processing in various research projects also requires powerful computing resources. Cloud computing can facilitate the process of creating IT laboratories for data processing and analysis. After the completion of the project work or semester, the rented facilities can be released quickly and easily. IaaS model is particularly suitable for educational institutions that have limited budgets for building and maintaining IT infrastructure and insufficient qualified staff for its management. By Infrastructure as a service, even small schools and universities can be competitive in terms of quality of educational services. Platform as a Service (PaaS) is a model to provide a platform and environment for the development and implementation of web and mobile applications. The main advantage of the model is that the components of the environment are pre-configured and maintained by the service provider. The developers can focus on the process of creating of services and applications without obligations to manage the environment. PaaS model is particularly suitable for educational institutions that offer training in IT disciplines. PaaS provides opportunities for creating and providing a development environment where learners can develop, test and deliver various applications and services.Platform as a Service allows teachers to focus on the learning process instead of on maintenance and management of the environment. Software as a Service (SaaS) is a model where software applications, provided by vendors, are used as services. This model significantly changes the way applications are used: users do not have to purchase a license to use the software; they do not need to install it on local computers and maintain it which saves time, effort and money. SaaS model is extremely beneficial for educational institutions, since it enables them to work with a variety of software products, experiment with new applications without additional purchase costs, paying only for actual use. The applications are available and accessible from different user devices via web browser at any time and place. Teachers and learners always have the latest
International Journal of Scientific and Research Publications, Volume 7, Issue 4, April 2017 163 ISSN 2250-3153
www.ijsrp.org
version of the software, there is no need to maintain, control and manage the applications, since it is the responsibility of the service provider. This allows educational institutions to save money for hiring qualified IT staff to manage and maintain applications. Educational institutions are initially attracted to the SaaS model, since it offers opportunities to use a variety of applications and tools for collaboration, communication and data storage. In most cases, SaaS services are free for schools and universities or are offered at a lower price. Many educational institutions start with cloud office suites and cloud based data storages. Some of the applications offer integration between both types of services.
Other educational organizations build their e-learning environment (Learning Management System, Learning Content Management System or Virtual Learning Environment) based on cloud computing, achieving a high quality of services and reducing the cost of management and maintenance of the systems. More cloud service providers offer applications specifically designed for educational purposes and in accordance with modern trends and paradigms in education, taking into account the active role of students and cooperation in the learning process.
V. CONCLUSION Cloud computing supports the implementation of various
forms of electronic, distance and blended learning. It is extremely popular due to the penetration of ICT in education and has significant advantages over traditional forms of education.
One of the main reasons for the transition to a cloud computing model is that the traditional forms of e-learning require significant investments for establishing an adequate IT infrastructure, maintenance and upgrade costs, and funds for highly qualified IT staff to operate and manage it. The increased costs combined with reduced financial resources urge educational institutions to seek solutions to overcome existing constraints and to provide conditions for effective learning process, consistent with the new educational trends and paradigms.
Cloud computing has essential economic advantages but it also ensures comprehensive access to modern ICT for a wide audience at any time and place, from different devices, which is a prerequisite for the realization of lifelong learning. Available IT equipment can be fully and effectively used and at the same time there are opportunities for renting and using powerful computing resources as needed. Using cloud services, educational institutions can focus on their primary activities: teaching and research, and perform them in the most efficient manner.
Cloud computing is extremely important and necessary for modern education. It offers an infrastructure, platform and educational services and applications, which create affordable and innovative learning environment. Participants in the learning process have continuous access to diverse, high-quality educational resources and activities, they can interact and work together, which improves the quality of education.
REFERENCES [1] Al-Zoube, M. (2009). E-Learning on the Cloud. International Arab Journal
of e-Technology, 1 (2), 58-64. [2] Adeoye, B. (2015). Utilization of Cloud Computing in Education. Journal
of Global Research in Computer Sciences, 6(4), 10-11. [3] IBM Global Technology Services. (2012). Applying the cloud in education
An innovative approach to IT. Retrieved July 16, 2016, from http://www-935.ibm.com/services/be/en/cloud-computing/cloud_edu_en.pdf
[4] National Institute of Standards and Technology. (2013). NIST Cloud Computing Standards Roadmap. Retrieved July 16, 2016, from http://www.nist.gov/itl/cloud/upload/NIST_SP-500-291_Version-2_2013_June18_FINAL.pdf
[5] Armbrust, M., Fox, A., Griffith, R., Joseph, A., Katz, R., Konwinski, A., Lee, G., Patterson, D., Rabkin, A., Stoica, I., & Zaharia, M. (2009). Above the clouds: a Berkeley view of cloud computing. Technical Report No. UCB/EECS-2009-28. Retrieved July 16, 2016, http://www.eecs.berkeley.edu/Pubs/TechRpts/2009/EECS-2009-28.html
[6] Sclater, N. (2010). Cloud computing in education. Retrieved July 16, 2016, from http://iite.unesco.org/pics/publications/en/files/3214674.pdf
[7] Cisco Systems. (2012). Cloud 101: Developing a Cloud-Computing Strategy for Higher Education. Retrieved July 16, 2016, from http://www.cisco.com/c/dam/en/us/services/ collateral/services/services-education/cloud_101_higher_education_wp.pdf
[8] Okai, S., Uddin, M., Arshad, A., Alsaqour, R., & Shah, A. (2014). Cloud computing adoption model for universities to increase ICT proficiency. SAGE Open, 4(3), 1-10.
[9] KPMG. (2014). Cloud Survey Report: Elevating Business in the Cloud. Retrieved July 16, 2016, from http://www.kpmg.com/US/en/about/alliances/Documents/2014-kpmg-cloud-survey-report.pdf
[10] Sultan, N. (2010). Cloud computing for education: A new dawn?. International Journal of Information Management, 30(2), 109-116.
[11] Bonuccelli, G. (2014). Cloud Computing: Application Virtualization And Desktop Delivery For Education. Retrieved July 16, 2016, from http://www.2x.com/cloud-computing-application-virtualisation-education/
[12] Manongga D., W. Utomo, & Hendry. (2014). E-Learning development as public infrastructure of cloud computing. Journal of Theoretical and Applied Information Technology, 62 (1), 54-59.
[13] Mihaylov, Il. (2015). Oblachnite uslugi – da imash ili da badesh, Journal CIO, 9, 35.
[14] SkillSpark. (2008). The Software as as Service Delivery Model for E-Learning. Retrieved July 16, 2016, from http://skillspark.ca/papers/SaaS_Delivery_Model.pdf
[15] Mokhtar, S. A., Ali, S. H. S., Al-Sharafi, A., & Aborujilah, A. (2013, January). Cloud computing in academic institutions. In Proceedings of the 7th international Conference on Ubiquitous information Management and Communication, (p. 2). ACM.
[16] Mircea, M., & Andreescu, A. I. (2011). Using cloud computing in higher education: A strategy to improve agility in the current financial crisis. Communications of the IBIMA, 2011 (2011), 1-15.
[17] Council of European Professional Informatics Societies (CEPIS). (2011).Cloud Computing Security and Privacy Issues. Retrieved July 16, 2016, from http://www.cepis.org/index.jsp?p=641&n=825&a=4758
[18] Zomeren B., & Haan, W. (2014). Cloud adoption in Higher Education: meeting the challenges. Retrieved July 16, 2016, from https://www.surf.nl/binaries/content/assets/surf/nl/2014/ eunis_2014_bert-van-zomeren.pdf
[19] Fernandez, A., Peralta, D., Herrera, F., & Benitez, J. M. (2012). An overview of e-learning in cloud computing. In Workshop on Learning Technology for Education in Cloud (LTEC'12) (pp. 35-46). Springer Berlin Heidelberg.
[20] Zaharescu, E., & Zaharescu, G. A. (2012). Enhanced virtual e-learning environments using cloud computing architectures. International Journal of Computer Science Research and Application, 2(1), 31-41.
[21] Kaufman, L. (2009). Data Security in the World of Cloud Computing. IEEE Security and Privacy, 7 (4), 61-64.

International Journal of Scientific and Research Publications, Volume 7, Issue 4, April 2017 164 ISSN 2250-3153
www.ijsrp.org
[22] Kasakliev, N., Somova, E., & Hadzhikoleva, S. Izpolzvane na oblachni uslugi za podpomagane na mobilnoto obuchenie vav visshite uchilishta. Journal Natural & Mathematical science, IV (3), 94-98.
[23] Vitkar, S. (2012). Cloud Based Model for E-Learning in Higher Education. International Journal of Advanced Engineering Technology, 3(4), 38-42.
AUTHORS First Author –Gabriela Kiryakova, Assistant Professor, Trakia University – Bulgaria, [email protected]. Correspondence Author – Gabriela Kiryakova, Assistant Professor, Trakia University – Bulgaria, [email protected].
International Journal of Scientific and Research Publications, Volume 7, Issue 4, April 2017 165 ISSN 2250-3153
www.ijsrp.org
Real and character self in a virtual environment: personality traits of World of Warcraft players
Gabriella PÁTKAI, Tamás BERECZKEI
Institute of Psychology, University of Pécs, Hungary Abstract- This paper investigates the differences between personality traits of an individual and its character in a particular virtual environment (World of Warcraft, a massively multiplayer online role-playing game).Furthermore, we suggest differences between real and character personality traits emerge to gain more social success. Our findings confirm divergences between personality traits of players and their characters, especially in Neuroticism. Results also show that the individuals' real Extraversion and their characters' Openness are the variables that predict social success. Index Terms- Big Five, personality, virtual environment, World of Warcraft, social success
I. INTRODUCTION ith the rise of virtual communities, individuals can create and explore many other identities (they can be called
avatars, characters, alter egos etc.) in social places, and these identities may differ from their real selves (Joinson & Dietz-Uhler, 2002). This self-discrepancy may influence individuals' psychological state (Suh and Shin, 2010), but the theoretical background is still weak. Researches have investigated the influence of the avatars' appearance on the player's behaviour (Yee & Bailenson, 2007), also the players' judgements of the avatars they encounter (Nowak, 2004; Nowak & Rauh, 2005). Studies found that individuals usually try to create rather realistic avatars of themselves, or an ideal version of themselves (Schroeder, 2002; Taylor, 2002). If they do not succeed and feel that the created avatar is not similar enough, they are unsatisfied. But even those, who enjoy changing the appearance of their avatar or avatars, do not alter its personality (see Ducheneaut, Wen, & Wadley, 2009). There are only a very few studies focusing on behavioural differences between 'virtual self' and 'real self'. For example Suh and Shin (2010) found that where the discrepancy between real and virtual selves is bigger, the person has lower psychological well-being. While Sung et al. (2011) found differences between the perceived personality traits of individuals and their avatars. Although the research included various types of virtual environments, the methodology lacked a sort of bonding between individual and avatar. Meanwhile in MMORPG (massively multiplayer online role-playing games) games like World of Warcraft, the user creates his or her character that serves as an alterego, and plays with the very same character for hours, days and even years. In this paper we focus on personality traits of MMORPG players. World of Warcraft is probably the mostly used and
known MMORPG of all times, with millions of daily players around the world, therefore we use this particular virtual environment in our research. We suggest that the created character will have different personality traits than the player. We also suggest, that this discrepancy will help the player (or its character) to feel more sociable, popular, respected so in general more socially successfull.
II. METHOD A. Participants Participants were 188 World of Warcraft players (84% male, but 41% playing with female character) recruited from international gaming forums. Their ages ranged from 18 to 55 years (M = 23.03, SD = 5.5), they have been daily players for an average of 6 years (SD =102 2.7) at level 94 (0-100, SD = 12), playing around 23 hours per week (0-80, SD = 17.6) and participated in the study in exchange for a chance to win a game card. Subjects all gave their informed consent prior to their inclusion in the study. B. Materials and Procedure Demographic information and basic gaming data (level, gaming style, etc.) were gathered using an online survey tool. Short Big Five Inventory To measure individual differences in personality traits, we used a type of Big Five Questionnaire that was designed to assess the constellation of traits defined by the Five Factor Model of personality (John and Srivastava, 1999). The Big Five taxonomy or the Five Factor Model represents the diverse systems of personality description in a common framework. It is a hierarchical model of personality traits with five broad dimensions that are the following: Openness to experience (O), Conscientiousness (C), Extraversion (E), Agreeableness (A) and Neuroticism (N)(Goldberg, 1993). The Short 15-item Big Five Inventory (BFI-S, Lang et al., 2011) consist of 15 statements, each of which starts with 'I see myself as someone who'. The individual must indicate their level of agreement for each statement on a 7-points Likert scale where 1 means 'strongly disagree' and 7 means 'strongly agree'. Participants self-reported their personality traits based on the Big Five Inventory (BFI), twice: once normally, answering questions about themselves. Then again, filling the questionnaire as if they were their main character from the game. Social success
W

International Journal of Scientific and Research Publications, Volume 7, Issue 4, April 2017 166 ISSN 2250-3153
www.ijsrp.org
Participants were than asked to estimate the level of their perceived reputation / popularity / number of friends on 7-point Liker scales where 1 meant they are not respected at all / not popular at all / do not have friends at all, and 7 meant that they are well respected / very popular / have many friends in their own community. A single index was formed by averaging across perceived reputation, popularity and number of friends. This variable was called 'Social Success' and the higher its score was, the more socially successfull the participant felt.
III. RESULTS Vast majority of our sample population was male, hence calculating gender differences would not have given valid result or reliable result.
Correlation analyses In order to investigate whether participants' self-reported personality ratings (Real variables) correlate with their characters' personality ratings (Character variables), we calculated correlation coefficients between the Real and the Character variables across the Big Five personality dimensions. When controlling for age and gender, partial correlation showed overall Real Big Five and Character Big Five are significantly related (r=.31, p<.01). Also, each Big Five trait's Real and Character variable seemed to be positively related: Real and Character Openness (r=.66, p<.01), Conscientiousness (r=.28, p<.01), Extraversion (r=.27, p<.01), Agreeableness (r=.56, p<.01), and Neuroticism (r=.21, p<.01). Naturally, all the subscales showed correlations with the whole Big Five Inventory. For all the other correlations, see Table 1 below.
Table 1: Correlations between Real and Character Big Five variables (N = 188).
1 2 3 4 5 6 7 8 9 10
1. Real O ---
2. Real C -.26 ----
3. Real E .73 .15* ----
4. Real A -.51** .24** .06 ----
5. Real N .121 -.80 -.19** -.22** ----
6. Character O .66** -.01 -.01 -.44** .19** ----
7. Character C -.39** .28** .14 .49** -.28** -.32** ----
8. Character E -.83 .02 .27** .27** -.02 .01 .12 ----
9. Character A -.36** .23** .07 .07 -.20** -.27** .38** .25** ----
10. Character N .28** -.06 .02 .02 .27** .36** -.41** -.60 -.13 ---- Note: * p<.05, ** p<.01 The Social Success variable showed significant correlations with Real Openness (r=.34, p<.01), Real Extraversion (r=.29, p<.01), Real Agreeableness (r=-.24, p<.01) and with Character Openness (r=.36, p<.01), and Character Neuroticitism (r=.15, p<.05). Cronbach Alpha for Social Success variable was 0.7. Paired samples T-test
Each participant was given two index scores (for the Real and Character personality traits, that served as selves) for each of the five Big Five dimensions. Mean scores were computed and are shown in Table 2. Next, we performed a Paired samples T-test to better investigate the relationship between Real and Character Big Five variables.
Table 2: Descriptive statistics, means, standard deviations, T scores, Cronbach’s alphas of variables and effect sizes
Real Character
M (SD) Cohens’s d (effect size)
T score M (SD)
O 12.64 (4.0) 1.71 2.00* 12.14 (4.1)
C 10.27 (2.4) 32.7 -5.39** 11.6 (3.1)
E 8.31 (2.8) 2.4 -2.75** 9.08 (3.5)
A 10.29 (2.8) 2.7 3.82** 9.46 (3.3)
N 9.19 (3.0) 29.7 13.19** 5.7 (2.8) Note: * p<.05, ** p<.01

International Journal of Scientific and Research Publications, Volume 7, Issue 4, April 2017 167 ISSN 2250-3153
www.ijsrp.org
There are measurable, significant differences between a person's rating of his/her own personality and his/her rating of his/her character's personality. As Table 2 shows, all the results were significant. Participants' Real Openness scores were usually higher than their Characters', and they also scored higher both in Agreeableness and Neuroticitism. Meanwhile the Characters' had higher Extraversion and Conscientiousness scores. Participants also showed greater variation between the Real and Character personality on Neuroticism than on the other four dimensions.
Regression Analyses To answer our proposed research question, we performed an Enter-method Linear Regression Analyses with two Models to determine wheter any of the Big Five traits could be a predictor for Social Success. For results, see Table 3.
Table 3: Regression coefficients between Social Success and Real and Character BFI factors
β Block of predictors
Social Success
1 Real O .08 Real C .09 Real E .23**
Real A -.14
Real N -.13 2 Character O .27** Character C .00 Character E .10 Character A -.02 Character N .01 R2 (for each block) .215**
.27** Note: R2 is for R-squared effect size for regression analysis. * p < .05 ** p < .01 Both models were significant as Model 1 F(5,182)=6.8 p<.01 and Model 2 F(10,177)=6.5 p<.01. The only significant predictors of Social Success were Real Extraversion and Character Openness. This suggest the higher the individual's Real Extraversion was, the higher his/her Character's Openness was and hence the individual could feel more Social Success.
IV. SUMMARY AND DISCUSSION The importance of this study is to reconsider the findings of previous researches suggesting no difference between Real and Character variables. These studies focus mostly on the appearance of the Character (avatar), not the personality traits. In this current study we examined the relationship between a person's own self-rating and the rating of his/her character. Results show significant differences between Real and Character variables, the most conspicuous difference is the decrease of Neuroticitism in the Characters' values. Low Neuroticism scores referres to emotional stability. People scoring low on Neuroticism usually experience less anxiety, insecurity and vulnerability, do not tend to get angry or depressed as often as people with higher Neuroticism scores. Contrary to many findings that suggest playing online games or video games makes people violent, our results show it may actually strenghten and calm the individuals. Our findings suggest only predictors of Social Success are Real Extraversion and Character's Openness. This is logical,
hence to play a massively multiplayer game, a certain level of Extraversion is already important, and when someone is already in the gameplay, they better be open to experiences, to form alliances with other players, join guilds, go to fights together with the help of each other. Overall, we can conclude that participants do differ from their characters in the game. It is not yet known whether or not it is a conscious decision to alter one's personality traits when playing, is it part of a strategy needed to achieve in the game, or is it the effect of the alternative virtual environment. But this discrepancy could help individuals to be more socially successfull, with lowered level of Neuroticism and higher level of Openness to experiences. There are, of course, some limitations to this study. First, we only focused on one specific virtual environment, that is a massively multiplayer online role-playing game, the World of Warcraft. Remaking the research on other virtual environments, for example on social network sites, might result in different outcomes. Furthermore, we did use a questionnaire to measure personality traits, but perhaps applying more specific or better fitted tests would enable us to give more detailed answer to the research question. At last, the utilization of not only self-report questionnaires but reports from participants' friends or absolute zero-acquitances could differ the results too. Further investigations are needed to support current results, and broaden the study on other types of virtual environments.

International Journal of Scientific and Research Publications, Volume 7, Issue 4, April 2017 168 ISSN 2250-3153
www.ijsrp.org
ACKNOWLEDGMENT The present scientific contribution is dedicated to the 650th anniversary of the foundation of the University of Pécs, Hungary. The project has been supported by the European Union, co-financed by the European Social Fund. Comprehensive Development for Implementing Smart Specialization Strategies at the University of Pécs.
REFERENCES [1] Ducheneaut, N., Wen, M., Yee, N., & Wadley, G. (2009). Body and mind:
A study of avatar personalization in three virtual worlds. Conference paper: Proceedings of the 27th International Conference on Human Factors in Computing Systems, CHI 2009, Boston, MA, USA, April 4-9, 2009
[2] Goldberg, L.R., "The structure of phenotypic personality traits," American Psychologist, 48, 26-34, 1993.
[3] John, O. P., & Srivastava, S. (1999). The Big-Five trait taxonomy: History, measurement, and theoretical perspectives. In L. A. Pervin & O. P. John (Eds.), Handbook of personality: Theory and research (Vol. 2, pp. 102–138). New York: Guilford Press.
[4] Joinson, A. N., & Diet-Uhler, B. (2002). Explanations for the perception of and reactions to deception in a virtual community. Social Science Computer Review, 20(3), 275-289.
[5] Lang, F. R., John, D., Ludtke, O., Schupp, J., & Wagner, G. G. (2011). Short assessment of the Big Five: robust accros survey methods except telephone interviewing. Behavior Research Methods, 43, 548-567.
[6] Nowak, K. L. (2004). The influence of anthropomorphism and agency on social judgment in virtual environments. Journal of Computer Mediated Communication, 9(2).
[7] Nowak, K. L., & Rauh, C. (2005). The influence of the avatar on online perceptions of anthropomorphism, androgyny, credibility, homophily, and attraction. Journal of Computer-Mediated Communication, 11(1).
[8] Schroeder, R. (2002). Social interaction in virtual environments: Key issues, common themes, and a framework for research. In R. Schroeder (Ed.), The
social life of avatars: Presence and interaction in shared virtual environments (pp. 1-18). London: Springer.
[9] Suh A., Shin K. (2010) Discrepancy Between Actual Self And Virtual Self: Theoretical Extensions, Measurement And Relation To Contribution In Virtual Communities. Conference Paper. Conference: Pacific Asia Conference on Information Systems, PACIS 2010, Taipei, Taiwan, 9-12 July 2010.
[10] Sung Y., Moon J-H., Kang M., Lin J-S. (2011). Actual Self vs. Avatar Self: The Effect of Online Social Situation on Self-Expression. The Journal of Virtual Worlds Research, Volume 4, Number 1. DOI: http://dx.doi.org/10.4101/jvwr.v4i1.1927
[11] Taylor, T. L. (2002). Living digitally: Embodiment in virtual worlds. In R. Schroeder (Ed.), The social life of avatars: Presence and interaction in shared virtual environments (pp. 40- 62). London: Springer.
[12] Yee, N., & Bailenson, J. (2007). The proteus effect: The effect of transformed self-representation on behavior. Human Communication Research, 33(3), 271–290.
AUTHORS First author - Ms. Gabriella Pátkai – PhD candidate, University of Pécs, Institute of Psychology / psychologist, Department of Musculoskeletal and Neurological Rehabilitation, Hospital of Szigetvár, Hungary Second author - Prof. Tamás Bereczkei, Dsc – Dean / Head of the Department / Head of the Institute, Professor of Psychology, University of Pécs, Institute of Psychology Correspondence Author – Gabriella Pátkai, [email protected]

International Journal of Scientific and Research Publications, Volume 7, Issue 4, April 2017 169 ISSN 2250-3153
www.ijsrp.org
VLSI Using CMOS Fabrication Prakhar Dixit, Pratik Suhasaria,Atul Singh, Prof. Atul Patil
Electronics and Telecommunication Department
Abstract- “VLSI stands for “Very Large Scale Integration, which is the capability of semiconductor to fabricate many MOS family transistor into single silicon chip. CMOS is referred as “Complementary Metal Oxide Semiconductor” which is the technology of fabricating the n-type and p-type MOSFETs side by side on the same silicon substrate to construct a VLSI circuit. It has capability of developing both digital as well as analogue based applications. There are three types of materials used to design CMOS VLSI circuits. They are insulator, conductors and semiconductors. The paper also enlightens the fabrication process sequence which involves following steps silicon manufacture, wafer processing, lithography, oxidation, diffusion, ion implantation,deposition, metallization, testing and packing. The main advantages of this technology are CMOS possess very high input impedance and the outputs are significantly high. The VLSI Technology is currently a booming technology which has changed the electronic world.”
I. INTRODUCTION LSI stands for “Very Large Scale Integration” which reflects the capability of semiconductor to fabricate more
than 1000 MOS family transistor into a single silicon chip. The growth of VLSI technology is best described by “Moore’s Law”. As per the Moore’s law the number of transistor doubles every 18 months. The technology has decrease the device size with increasein number of gates or MOSFET in single IC. Fabrication is the process of creating integrated circuits (ICs) which realize electronic circuits. It involves multiple steps of photolithographic along with chemical process to gradually create circuits on a wafer made of pure semiconductor. The MOS fabrication processes are
• N-type MOS (nMOS) In this process IC is built with n-type source and drain and a p-type substrate in which electrons are carrier. On a high voltage at gate, IC will conduct and on a low voltage at gate, IC does not conduct. The IC built by N-type MOS fabrication are faster than P-type fabrication, since the carriers are electrons that travels twice as fast as holes.
• P-type MOS (pMOS) In this process IC is built with p-type source and drain and a n-type substrate in which holes are carrier. On a high voltage at gate, IC does not conduct and on a low voltage at gate, IC will conduct. The IC built by P-type MOS fabrication are more immune than N-type fabrication.
• Complementary MOS (CMOS) CMOS uses complementary and symmetrical pairs of p-type and n-type MOSFETs.
The paper is organised as follows: Section I deals with CMOS Technology. Section II deals with Fabrication Materials, Section III illustrates CMOS fabrication technique and Section IV deals with Fabrication sequence. The Section V describes the advantage of VLSI and Section VI draws a brief summary of the paper.
II. CMOS TECHNOLOGY CMOS is referred as “Complementary Metal Oxide Semiconductor”which is the technology of fabricating the n-type and p-type MOSFETs side by side on the same silicon substrate. CMOS ICs composed up to billions of transistor of both n-type and p-type on a piece of rectangular silicon substrate of 10 to 40 mm2. The characteristics of CMOS are high noise immunity, low propagation delay and low static power consumption. Firstly, propagation delay is short as delay is in order of 20 to 50 ns depending upon the supply voltage. Secondly, CMOS devices are low power consumption devices, since one transistor pair is always off and its draws significant amount of power during switching between on and off states. It also allows high density of functions in a chip. CMOS technology develops both digital as well as analog based applications. In digital world this technology is used in microprocessor, microcontroller, static RAM, etc. While in analog field CMOS is used to design image sensor, data converters, transceiver, etc.
III. FABRICATION MATERIALS There are three types of materials used to design CMOS VLSI circuits. They are as follows:
• Insulator: They are used to isolate semiconducting or conducting materials from each other that are present in VLSI circuits. Insulator requirements depends upon the functionality of material used in designing of ICs.E.g.: Silicon Nitride, Silicon Dioxide
• Conductors: They are used in VLSI for electrical connectivity. Conductors are used as a local as well as global interconnects. E.g.: Silver, Gold
• Semiconductors: They are the base of VLSI structure and used for formation of device. The conductivity of semiconductors are varied through selective doping depending upon the application of voltage. E.g.: Silicon
V

International Journal of Scientific and Research Publications, Volume 7, Issue 4, April 2017 170 ISSN 2250-3153
www.ijsrp.org
IV. CMOS FABRICATION TECHNOLOGY In CMOS fabrication both the p-type and n-type MOSFETs are arranged in such a manner that the p-type acts as a pull-up network and n-type acts as pull down network. This fabrication technology has become dominant due to its high performance and cost effective VLSI. There are various approach for fabrication of VLSI.
• p-well Process In p-well structure an n-type is used as substrate in which p-devices are formed bysuitable masking and diffusion. In order to accommodate the n-type devices, a deep p- well is diffused into the substrate. Since p-well concertation affects the threshold and breakdown voltages of n-transistor a deep diffusion is required. Here the p-well acts substrate to n-type devices within the main n-type substrate.
Deep p-well Diffusion process Accommodation of n-type and p-type transistors on thinox layer Pattern of Polysilicon layer is deposited p-diffusion n-diffusion Contacts are defined Metal layer is defined Passivation layer is applied for accessing the bonding pads
• n-well Process The n-well regions are created for p-type MOSFET transistors, by impurity implantation into the substrate. This technology is also popular due to its lower substrate bias effect on threshold voltage of transistors.the disadvantage of n-well is that it degrades the performance of p-type transistor.
Formation of n-well region Define nMOS and pMOS active areas with polysilicon pattern Field and gate oxidations p diffusion n-diffusion Contacts are defined
Metal layer is defined Passivation layer is applied for accessing the bonding pads
• Twin tub process
It is basically a logical extension of p-well and n-well processes. In this process a high restive n-type transistor is used in which both the p-well and n-well are created. This process has preserved the performance of n-type transistor without compromising the p-type transistor.
• Silicon on Insulator As the name suggests it is technology in which transistors are fabricated on insulator directly. The insulators used is silicon oxide or sapphire. The advantages of SOI are that it possesslow parasitic delay and consumes low dynamic power. In above all the processes that we have seen, the p-well process is widely used in practice.
V. FABRICATION PROCESS SEQUENCE Silicon Manufacture Wafer Processing Lithography Oxidation Diffusion Ion Implantation Annealing Deposition Metallization Testing Packing Fabrication Sequence Silicon Manufacturing In basic process the silica and coke is heated in submerged arc furnace to high temperature. This high temperature removes oxygen leaving behind the silicon. As it is forms it displaces the carbon, this process is called as reduction process. Wafer Processing The produced silicon is melted at 1500 0C in crucible where seed crystal is bought in contact which is withdrawn slowly from

International Journal of Scientific and Research Publications, Volume 7, Issue 4, April 2017 171 ISSN 2250-3153
www.ijsrp.org
molten silicon. As it is withdrawn the silicon atoms get attach with cool seed forming crystalline structure. With control doping the concentration of n-type and p-type impurity is maintained. This silicon are then manufactured in shape of cylinder of diameter 8-12 inch which is sawed into thin disks of thickness 0.5-0.75mm. This disks are called silicon wafer. Lithography The silicon wafer is cleaned and is covered with barrier layer of silicon dioxide with photoresist layer. The photoresist is a photosensitive layer which becomes soluble when exposed to light. The prepared silicon wafer is the substrate on which VLSI circuits are built by soft baking the wafer to set layers. The mask is a plate with design of desired layers of VLSI circuits and this several masks are used to create different feature of VLSI. The layout from mask to wafer is transferred through a wavelength limited light. The lens resolves the layout image created by light into smaller images and this images are reflected on the photoresist layer. The parts of the photoresistexposed to light are washed away, leaving unexposed regions on the wafer. The wafer is then hard baked to set theremaining photoresist. The SiO2 layer is removed by etching from the exposed regions and along with it the remaining photoresist is removed. This entire process is termed as Lithography. Oxidation The process of growth of oxide layer on wafer in a high temperature furnace is termed as oxidation. This process are of two types
• Dry Oxidation is an oxidation process in which oxygen is mixed with small amount of hydrochloric acid to give thin oxide layer known as gate oxide layer as these layers are used to form gate structure.
• Wet Oxidation is an another process in which oxygen along with water vapour is mixed with silicon to give a thicker oxide layer called as field oxide layer
Diffusion The movement of atoms from a high concentration region to low concentration region is termed as diffusion process. In VLSI this process is used to dope impurities in silicon at very high temperature (1000 to 1200 0C) in order to increase conductivity. The dopants used are boron, phosphorous and arsenic. The penetration of this dopants depends on temperature and processing time. Ion Implantation It is another method to dope impurities in semiconductor. In the following process the dopants are ionized at room temperature and this ionized atoms are accelerated between two electrodes at potential difference of 150kV. The atoms then hits the silicon substrate with high velocity and penetrate into the wafer. Here the penetration of ionized atoms depends on accelerating voltage and quantity is controlled by flow of ions. This method is used for control doping of impurities in VLSI. Annealing A process in which the wafer is heated and cool down slowly in order to remove the internal stress and remove damage
caused due collision of ion during ion implantation process. The process in which the lattice is re-crystallize and becomes stable is termed as annealing. Deposition Deposition process is a process of formation of solids on wafer by chemical reaction of gases and vapors. In VLSI fabrication the conducting layer, insulation layer and protective layer are created on wafer by use of chemical deposition technique which is carried out in a high temperature chamber. The conducting layer such as polysilicon is deposited when silane is heated at 1000 0C and the insulation layer i.e. silicon dioxide and silicon nitride are deposited by heating it with oxygen and ammonia at 400-700 0C. Metallization Metallization is basically a process in which metals are deposited on entire silicon wafer. The main idea of metallization is to interconnect various electronic component such as transistor, diodes etc. together to form desired VLSI circuit. Sputtering process through which metal layer are deposited. Testing Testing is a manufacturing step through which the correctness of fabricated VLSI circuits are verified. The testing also helps in diagnosing the faulty site (if present any). This is carried out in two process
• Test Generation: Software testing • Test Application: Hardware testing
Thus, it is an important step as it is a quality check of fabricated VLSI circuit before the final packing. Packing After being tested the VLSI fabrication process moves to its final stage where the verified circuits are mounted on packages. This verified circuits are termed as dies and the pins of package are interconnected to the die through fine gold wire. Finally, in an inert atmosphere the packages are sealed using plastic or epoxy.
VI. ADVANTAGES • CMOS possess very high input impedance • The output of CMOS actively drive in both the
direction. • The outputs are pretty much rail-to-rail. • CMOS logic circuit consumes very less power when
operated in a fixed state. • CMOS gates are simple. The basicgate in CMOS is an
inverter, which consist only of two transistors.
VII. CONCLUSION The VLSI Technology is currently a booming technology which had created a new era of electronic miniaturization and this evolution in electronic world is enhancing day by day. CMOStechnology has claimed the predominant position in

International Journal of Scientific and Research Publications, Volume 7, Issue 4, April 2017 172 ISSN 2250-3153
www.ijsrp.org
modern electronic system. It has enabled the active use of microprocessors, communication system and many others electronic devices with smaller size and higher efficiency rate. This growth is clearly seen through rapid fabrication of millions and billions transistor on single silicon chip. The paper introduces the steps through which a VLSI circuits are developed using the CMOS Fabrication technology which relatively provides high performance VLSI circuit with a low power consumption and small size. The fabrication technique used in following paper is very efficient due to its characteristics and design simplicity. The future of VLSI circuits is bright and will only flourish in coming years.
REFERENCES [1] Ashwini Dhawane and PratikshaNichhal“VLSI and
Fabrication”presentedinWorld Research Journal of Telecommunications Systems in 2012
[2] Appendix A “VLSI Fabrication Technology” reprinted in Oxford University Press 2015
[3] Jin Fu Li “Chapter 6 VLSI Testing” in National Central University, Taiwan [4] Roger T. Howe“Lect.4 IC Fabrication Process” in EE 105 Springer 1997,
University of California, Berkeley [5] Jagjot Singh &Jeeyun Kim “Lithography” in Feb 2004
[6] Neil H. E. Weste and David Money Harris “CMOS VLSI Design A Circuits and Systems Perspective”copyright © 2011, 2005, 1993, 1985 Pearson Education, Inc., publishing as Addison-Wesley
[7] Amar Mukerjee“Introduction to NMOS and CMOS VLSI System Design” copyright © 1986 Prentice Hall Eglewood Cliffs, New Jersey
[8] Ajit Pal “Chap 2 MOS Fabrication Technology” in Low Power VLSI Circuit and System” copyright © 2015 by Springer India
[9] Carver A. Mead and Lynn A. Conway “Introduction to VLSI System” copyright © 1978 by C. Mead and L. Conway
AUTHORS First Author – Prakhar Dixit pursing B. Tech. (3rd Year) inElectronics and Telecommunication.Email: [email protected] Second Author – Pratik Suhasaria pursing B. Tech. (3rd Year) in Electronics and Telecommunication. Email: [email protected] Third Author – Atul Singh pursing B. Tech. (3rd Year) in Electronics and Telecommunication. Email: [email protected] Fourth Author – Atul Patil, B.E. (Electronics & Power) and M.E (Electronics), Head of Department of Electronics and Telecommunication. Email: [email protected]

International Journal of Scientific and Research Publications, Volume 7, Issue 4, April 2017 173 ISSN 2250-3153
www.ijsrp.org
Working Capital Improvement fo A Competitive Securities Company
Muhammad Rifqi Syauqi*, Dedi Budiman Hakim*, Hendro Sasongko*
* Faculty of Management and Business, Bogor Agricultural University Abstract- Competition of brokerageindustry in Indonesia is getting harderwith advancesin information technology, such as online trading. It is goodfor investors because the stock transactions can be done anywhere and anytime with a low cost. On the other hand, securities company (broker) requires a large capital to provide an online trading systemand offer a competitivetransaction fee. This study estimates the amount of working capital that must be met by a broker in Indonesia in order to compete with the other. The result is the low working capital led to low competitiveness. Broker with a large-scale company has a higher competitiveness compared to a small one. Therefore, the minimum requirements Net Adjusted Working Capital (NAWC) should be increased from Rp 25 billion to Rp 100 billion. Increasing in working capital is expected to encourage brokers more competitive and able to outperform the regional capital market players. Index Terms- Working capital, competitiveness, brokerage
I. INTRODUCTION ndonesia's economic potential must be optimized for the development of the capital market becausethe value of raising
funds through an Initial Public Offering (IPO) and rights issue is still below the growth ofThird Party Funds (TPF) in banking. Although there is an increasing trend since 2010, the value of fund raisedfrom capital markets still have not been able exceeds or equals to the deposit growth even when the value of deposits slowed in 2015. This information can be seen in Figure 1as shown as below.
Figure1Growth in deposits and funds IPO + right issue
The potential of the Indonesian capital market can be seen from the number of qualified listed companies. Most of the listed companies on the Indonesian Stock Exchange (IDX) has good fundamentals so that the performance of the stock price index in Indonesia could be the best in the ASEAN. Jakarta Composite Index (JCI) performance is better than regional stock indexes in the last 5 years, similartothe Stock Exchange of Thailandindex. This potential should be a privilege that can improve the competitiveness of IDX. JCI and the other marketindexes during 2010 - 2015 are presented in Figure 2 below.
Figure2Performance of stock indices in the regional markets In fact, stock transactionvalue on IDXis still lower than other exchanges, such as the Stock Exchange of Thailand (SET), Singapore Exchange (SGX) and Bursa Malaysia (BM). It is supposed by a broker functions in running business less powerful in Indonesia. The number of firms in an industry will determine the level of competition(Diana, 2010). The quality of transaction services and a competitive industry could be achieved on a number of specific brokers at an exchange. The proportion between the number of listed companies with the broker on the Stock Exchange is relatively small compared to other markets. Three exchanges (SET, SGX, and BM) has great value stock transactions and the proportion of listed companies to broker reached more than 15, while the proportion in the IDX is only around 4.7 (see Table 1). As a result, trading activity on IDX dominated by most of the brokers who have a big capital while the small brokers compete for a limited market segment. For that, IDXshould have a policy for boosting the number of listed companies or restricting broker with more stringent capital requirements.
388,11
446,20 440,17 438,77 450,45
298,64
85,27 86,32 87,51 98,57 88,40 105,52
2010 2011 2012 2013 2014 2015
TPF Growth
Fund raise
in Trillion Rp
0
50
100
150
200
250
Jan-10 Jul-10 Jan-11 Jul-11 Jan-12 Jul-12 Jan-13 Jul-13 Jan-14 Jul-14 Jan-15 Jul-15 Jan-16
ThailandIndonesiaMalaysiaSingapura
I

International Journal of Scientific and Research Publications, Volume 7, Issue 4, April 2017 174 ISSN 2250-3153
www.ijsrp.org
Table1Comparison of exchanges in the regional market in 2015
Exchanges Brokerage (A)
Listed Company (B)
Transaction value (inmillion USD)
Proportion A : B
Indonesia Stock Exchange 110 521 105 467 4.7 Bursa Malaysia 30 902 129 823 30.1 Singapore Exchange 26 769 203 413 29.6 Stock Exchange of Thailand 37 639 296 711 17.3
source: WFE and annual reports related exchanges The Indonesian capital market competitiveness occupies the fourthposition after Singapore, Malaysia, and Thailand(Setiawan, 2012). Brokers who do not utilize and develop the potential of the Indonesian capital market optimally becomes a weak point. It is known from the number of brokers who have a limited capital so that not optimal in handling stock transactions. Asufficient capital will help the company to expand the business and reducethe operating expenses(Agus, 2011).Net Adjusted Working Capital (NAWC) data which is a requirement for a broker before trading on IDX shows that the majority are spread between Rp25 billion to Rp100 billionand comes from a local brokerage more than a joint venture one (see Table 2). This would affect the capability of brokers to handle stock transactions.
Table2NAWCdistributionby the types of brokers in 2015
Range ofNAWC Ownership type Total Local Joint venture Rp25 M s.d Rp50 M 47 1 48 Rp50 M s.d Rp100 M 20 1 21 Rp100 M s.d Rp150 M 7 5 12 Rp150 M s.d Rp200 M 2 5 7 Rp200 M s.d Rp250 M 1 3 4 >Rp250 M 6 12 18 Total 83 27 110
source: financial statements of brokers Most of the stock transactions value on IDX turned out to be dominated by some brokers or so-called Pareto effect. Top 20 broker on IDXcontributeRp925,67 trillion or 70% of total stock trading value in 2015 (Rp1.406,36 trillion). In other words, 30% of the stock transactions value on IDX gained from 90 (82%) brokeractivities. This information indicates that there might be less healthy competition among small brokers due to lack of market share. The number of brokers whose contribution is too small in the exchange could make capital markets less developed. Inability in serving customer transactions and doing business expansion will reduce the competitiveness of Indonesia against the broader market. The purpose of this study was to determine the relationship of working capital to business competitiveness and to estimate new capital limits for a broker. The results are expected to be useful for any stakeholders, especially regulator as consideration for making policy. In addition, the community helped in determining broker. Academically, this research still needs some enhancements to add extensive scientific insights.
II. RESEARCH METHODOLOGY A broker mayhave three operating licenses in accordance with Law No. 8 of 1995 concerning Capital Markets, i.e.: 1) Broker-dealer, a partywho buy and sell securities for its own
account or others. 2) Underwriter, a party who makes a contract with a listed
company candidate in the public bidding process with/without any obligation to purchase unsold securities.
3) Fund Manager, those who manage a portfolio of securities or collective investment for customers.
The object of this study is limited to brokers who execute permissions as broker-dealerand a Membership of IDX. This study uses secondary data obtained from IDX, such asfinancial statements, NAWC, and the stock transaction value of each broker. The financial statements contain the accounts of the company's performance based on the balance sheet, profit/loss, changes in equity and cash flow. Financial statement of broker submitted to IDX periodically (quarterly) while NAWC and stock transaction value always recorded and published every day. The data used in this study was taken by the end of 2015 because of differences period in the availability of data and the quality of financial statements data (audited). The number of brokers who submit financial statements each period sometimes differ. This is possible because there are brokers who are suspended or revoked a business license when the submission period of financial statements. The number of active brokers who consistently submit periodic financial statements to IDXare 97 companies. The collected data will be analyzed to achieve the objectives of this study in accordance with the following steps. 1) Know the working capital of brokers. 2) Make a model of competitiveness with working capital and
some supporting variables. 3) Test a conformance of regression model. 4) Estimates a competitive working capital for brokers. Besides capital, business conditions are also believed to affect the competitiveness of companies, which is reflected in the operationalrevenue and expenditure (expense). Both of them measure the company's ability to generate profits and run an efficient business. Pancurova and Lyocsa(2013)stated that the low capital ratios will lead to a low-efficiency.

International Journal of Scientific and Research Publications, Volume 7, Issue 4, April 2017 175 ISSN 2250-3153
www.ijsrp.org
Surifah (2011)reveals that large company hasbetter resources, lower transaction costs, and survive to win the competition and economic shocks. Online brokerages can be evaluated through financial ratios, market share, commission and service changes, industry consolidation, technological innovation, and constraints related to online transactions(Michal, 1999). The efficiency level depends on some factors including the characteristics of the industry. For example, Widiarti, et al.(2015)mentions that the determinant of efficiency in the banking industry is affected by the ratio of Non Performing Loans (NPL), Loan to Deposit Ratio (LDR), the size of the bank, Cost Efficiency Ratio (CER), and the Capital Adequacy Ratio (CAR). They argued that the policy of limiting interest on deposits is appropriate to support and achieve profitability and efficiency of the banking system. In addition, economic growth, interest rates, market capitalization, market share, capital, LDR, Net Interest Margin (NIM), and credit significantly affect the operational efficiency of the bank(Muljawan, et al., 2014). The factors that determine the efficiency of banking is not necessarily appropriate to be applied in the capital market. The revenue of a broker can be derived from services as broker-dealer, underwriter, fund manager, dividends and interest, and other businesses. Revenue composition of a broker does not rely on interest-based incomebut from fee-based income. The difference brokerage and bank based on its business characteristics causing some measure of banking efficiency is less relevant. Nonetheless, the measurement of bank efficiency which is a general still be used to determine the efficiency of a broker because both of institutions is in the same sector. Based on the previous explanation, a broker competitiveness in this study built according to the following model formulation.
εββββ ++++= DXXY 322110 The variables used in this study are described as follows. Y : The transaction value can be used as a measure of a broker's
competitiveness in maintaining its market share. X1 : NAWC/equity shows capital adequacy and becomes a
broker requirements before trading on IDX every day. X2 : Operational efficiency ratio is the ratio of operating
expenses to operating income. - Operating income is the sum of income from abroker-
dealer, underwriter, fund manager and other revenues, such as dividends or interest.
- Operating expenses cover company liability which paid for staff salaries, the cost of telecommunications, and public administration, system maintenance, and other expenses related to the main business.
D : Dummy variable which is 0 for regular broker and 1 for an online trading broker.
All variable can be obtained on IDX website (www.idx.co.id) on page Membership and Participant in the left menu.
III. RESULT AND FINDINGS The economic growth is inseparable from the existence of financial institutions as a driver of the real sector. A financial institution acting as the intermediary between the excess fund’s parties to those who need funds. Their activities include the collection, management, and distribution of funds. The excess fund’s parties store their moneyin the form of savings or deposits in banks. In addition, its could be allocated to investment instruments, such as stocks or bonds. Hopefully, saving or investing the funds will earn specific interest or yield. Parties who need funds especially for expansion has a variety of financing options. Business financing can apply for loansthrough the bank or issuance of equity and debt instruments (bonds). Each financing option has several advantages and risks, such as the amount of interest that must be paid or a reduction in ownership of the company (dilution). This consideration depends on the scale of business and management policies related to the company's budget. In general, the financing can be done through the money market or capital market. Money market products are usually intended to short-term financing(less than one year), while the stock market tends to be long-term financing (more than one year). Money market has long been known to the public through banks. Bank penetration which is far-reaching to remote area causes people prefer saving than investing. As the consequences, the people is less familiar with capital market products, such as stocks. In addition, businessmen tend to finance from bank loans for expansion. Ideally, financing should be funded from a capital market which the period is longer than the money market. The high-interest rates will make businessmen see the stock market as an alternative low-cost source of financing. Indonesian capital market has a special attraction for investors. The financial performance of listed companies on IDX better than other markets on average so that the rate of return stock is still high. Investment grade ratings also attract foreign investment to Indonesia. This condition should be an opportunity for brokers to advance the capital market. However, this opportunity has not been optimally utilized by a broker, given the slow increase the number of listed companies and investors in IDX. According to Hendarwin(2015),the success of the capital market is influenced by several factors, including the strength of demand and supply in the market, economic growth, political risk, and the role of supporting institutions such as a broker. Capital markets can not function optimally if not supported by a qualified broker and efficiently manage its assets.
A. Working Capital Quality of Securities Company Business continuity of brokerages depends on the ability of brokers in maintaining its competitiveness. This is reflected in the response of each broker facingemerging challenges, both internal and external. Inability to respond to this competition led to a local broker excluded from its own market. Each broker has the same opportunity, rights, and obligations in competing with other brokers at IDX with the same product, namely stocks.

International Journal of Scientific and Research Publications, Volume 7, Issue 4, April 2017 176 ISSN 2250-3153
www.ijsrp.org
Efficiency is a competitive strategy in the form of a common market with similar products. There are three types of secondary market at IDX, namely the regular market, the cash market, and the negotiationsmarket. This market is provided with a different designation, i.e. 1) Regular market.
Stock transaction arranged according to certain mechanisms, such as the queue of orders based on price and time priority, the minimum number of shares in one order follow trading unit (lot size), the price change which is allowed (tick size), reject the sell/buy orders when out ofdaily price range (auto-rejection), cycle of settlement on the third trading day (T+3).
2) Cash market. The basic difference betweena cash market and a regular market lies on the length of trading session and settlement period. Cash market occurs for one session and settlementcycle at T+0. This market is usually used by investors to fulfill settlement obligations in the regular market.
3) Negosiasi market. Transaction based on agreement (the price and quantity of stock) between buyers and sellers. Transactions that occurred in this market just a report to IDX about the agreement of both parties.
Most of stock transaction activity occurs in the regular market and the prices established are used for index calculation. Activity in the market negotiations are rare but can be very large value in one transaction. In addition, investors can also take advantage of this market as a promotion (advertising). Brokerageindustry can be categorized under perfect competitionbecause every broker is a price taker because theyare difficult to determine the market price. They are also easy to in/out from the industry because no barrier to entry in this business, anyone could become a broker when obtaining a license and meet the requirements. NAWC is a requirement for the broker to have a business license that set in Rule No. V.D.5 regarding the Maintenance and Reporting of Net Adjusted Working Capital.NAWC must be met the broker at minimum Rp25 billion or 6.25% of total liabilities without subordinated debt and debt of a public offering/limited offering plus ranking liabilities. The determination of ranking liabilities is based on the contingent liabilities and off-balance sheet liabilities that will be added to the risk factors in NAWC, whose value is determined based on certain calculations. NAWC calculated in accordance with the existing form with a sequence of the steps are as follows: 1) determining working capital by total current assets minus
total liabilities and ranking liabilities, 2) determining net working capital by working capital plus
subordinated debt, and 3) determining NAWCby net working capital minus total
liquidity risk adjustment, market riskadjustment, credit risk adjustment, and the business riskadjustment, plus haircut returnon securities covered by hedging.
All brokersare obligedto submit daily reports of NAWCelectronicallyevery day before 08.30 am. Brokers who
fail to comply or not to submit a report be liable to suspension or prohibited exchangetransaction. Financial Services Authority (FSA) will revoke the operating license if the broker fails to meet the minimal NAWC more than 30 consecutive working days or more than 60 working days within a period of 12 months. Competition in this business is getting harder when there is a war on transaction fee in online trading services. The low transaction fee is not enough to offset a brokerage costs so that they couldn’t make a profit. Brokers who want to preserve their business with a thin operating margin will seek income outside the main business. This is what makes the capital market industry getting poor when the broker is not able to compete with the demands of information and technology. Naturally, fee-based income dominant in the structure of broker’s revenues. Based onFinancial Statementsper December 31, 2015, it is known that there are 57 brokers postedan operating loss for a total loss of Rp521 billion. This loss value is smaller than the total operating profit of 40 brokers, which is Rp1.22 trillion. Meanwhile, the number who posted the current comprehensive profit increased by 19 brokers from postedoperating profit. This is due tothere are 22 brokers postedoperating loss but posted a current comprehensive profit and 3 brokers postedoperating profitbut posted a current comprehensive loss. It is explained that some brokers failed to preserve their business and rely on outside the main business activities. A substantial capital of broker allegedly insufficient and relatively limited so less optimal in running main businesses. The capital requirement to get a license as a broker on IDX is relatively small compared to other markets such as Table 3.
Table3Capital requirements at regional exchanges
Exchange Minimum capital
Local currency USD IDX Rp30 billion USD 2 million BM RM20 million USD 5 million SGX SGD 200 million USD 150 million SET 500 million Baht USD 15 million
source: website of each exchange
B. Initiatives for A Better Securities Industry Competition posed by online trading must be dealt with wisely. Online trading gives a benefit for investors because the stock transactions can be done anywhere and anytime with a low cost. On the other hand, a broker requires alarge capital to provide online trading systems and offers a transaction fee as low as possible. Brokers who do not have online trading also need a lot amount of sales force to compete. Operating revenues from brokerage services less likely to be able to cover sales force expenses, brokers even have to take income from outsidethe main business in order to maintain business continuity. Customers tend to choose a broker that offers a various of trading services with a competitive fee. This demandrequiresa broker in order to change and do efficient business processes. Kalakota and Konsynski(2000)stated that abrokerage’s industry follows the

International Journal of Scientific and Research Publications, Volume 7, Issue 4, April 2017 177 ISSN 2250-3153
www.ijsrp.org
four patterns of change, i.e. the separation of traditional services, reallocation authority customers, the establishment of strategic partners, and repackaging both the products and the services. For example, increased sales force capacity through education and training in order to get the new skills that needed the company. The skillsare expected to provide added value for employees and support a brokerage business. In the end, customers remain loyal and active in trading. As a business entity, the broker should be able to respond to changes in market demand. Brokers are encouraged to adapt to market needs and prepare a highly competitive business. Change in business towards a more efficient process would require substantial capital. A capital adequacy becomes a major factor in increasing market power and achieving economies of scale. This is essential if they want to survive and growin the brokerage industry. Capital adequacy requirements should be a limitation economies of scale for brokers in order to compete and respond to the demands of the market. A company that is able to achieve economies of scale will affect the level of its efficiency and competitiveness. The implementation of Good Corporate Governance (GCG) also affects the public confidence in favor of increasing the competitiveness of enterprises(Devita, 2011). A regression model to explain the relationship of competitiveness with working capital is presented as follows.
ε++−+−= DXXY 0116.00002.00095.00040.0 21 Competitiveness (Y) has a relationship with working capital (X1) and a broker efficiency. An efficient broker has operational efficiency ratio(X2) relatively small so that the coefficient of X2 showed a negative. Increasing in a capital will enhance the competitiveness of brokers in expanding market share while the efficiency indicates a way of capital management in order to achieve optimal results. The greater of capital, competitiveness of brokeris also getting bigger. An online trading broker (D=1) are more competitive than a regular broker (D=0) becausethe coefficient of Dummy variable is positive. The regression model can be used to estimate the amount of broker capital to enhance their competitiveness because it has met the criteria of the significance of the parameters, the size of the goodness of fit, the assumption of residual (identical, independent, and normal). Estimated working capital is done by setting a target of competitiveness broker at least equal to the Stock Exchange of Thailand (assume atcertain efficiency level). The results that the broker working capital needs to be increased from Rp 25 billion to Rp 100 billion. The increase in capital is expected to encourage brokers to be great and competitive. Opportunities and challenges facing the capital markets industry require all entities to improve itself. FSA makes the package of market deepening which contains four initiative, which addsthe investors, adds the listed companies, strengthen infrastructure and supporting trading system, and strengthen supervision and investor protection. To realize that, FSA and IDX up several strategies. One of the strategies to the advance capital market is strengtheningbroker by merging a broker who has a low NAWC, besides adding a capitaloption (Dwijayanto & Cicilia, 2015).
Aris(2016)also found there are at least two options to strengthen broker, namely improving NAWC or encourage brokers who have limited capital for a merger. Benarda(2016)stressed that the merger or acquisition in order to achieveresource efficiency. Skills and capital adequacy is a prerequisite for a broker becauseof a capital market including a highly technical and capital intensive(Moechidie & Ramelan, 2012). Strengthening broker be one focus to be achieved FSA and IDX since the amount is too much and capital is still limited. A strong broker is expected to compete with other securities companies in the ASEAN countries, dare to attract foreign companies to be listed in Indonesia, and grab broader market segment. One of the initiatives taken into regulator’s consideration is strengthening the broker especially in terms of capital (in this case NAWC). The initiatives to strengthen broker based on NAWCthresholds expected to boost the competitiveness of the capital market. Brokers with substantial capital would be more efficient to run a business, improve service, and create some innovation. A similar policy has been applied to banking in Indonesia by business activities adjusted core capital known as Bank Umum Kegiatan Usaha (BUKU). Based on core capital owned, banks are divided into four BUKU, ie. 1) BUKU 1 is a bank with a core capital less than Rp 1 T. 2) BUKU 2 is a bank with a core capital between Rp 1 - 5 T. 3) BUKU 3 is a bank with a core capital between Rp 5 - 30 T. 4) BUKU 4 is a bank with a core capital more than Rp30 T. The healthy, strong, and efficient banking system in order to create a stable financial system envisioned by the Indonesian Banking Architecture (API). Six pillars that make up the API implemented through several programs, including the strengthening of the national banking structure. The program is implemented by banks in the API should be a reference and learning materials for Indonesian capital market. Substantial capital is expected to boost the competitiveness of the business so that the social demand for investment products and brokerage services can be met optimally.
IV. CONCLUSION Indonesia’sresources and economic potential has not been optimally utilized by the capital markets. The relationship between working capital broker and competitiveness is directly proportional. In addition, the efficiency was also significantto business competitiveness. A brokers who has a great NAWC tend to be more competitive than the broker with limitedNAWC. The amount of NAWC that support the brokerage in Indonesia proposed change from Rp25 billion to Rp100 billion. This increase would encourage brokers to raise capital and boost the competitiveness in order to equivalent with other exchanges. Regulatory and policy which related to a broker needs to be directed to strengthen the brokers so that be able to serve a wider market. People are encouraged more carefully to choosea broker as a brokerage partner by avoiding companies that have limited capital and do not provide online trading. Fund managers suggested involves a broker with good credibility and strong capital in order to avoid market risks.

International Journal of Scientific and Research Publications, Volume 7, Issue 4, April 2017 178 ISSN 2250-3153
www.ijsrp.org
REFERENCES [1] Agus, S. S., 2011. Pengaruh Pertumbuhan Modal dan Aset terhadap Rasio
Risk Based Capital (RBC), Pertumbuhan Premi Neto dan Profitabilitas Perusahaan Asuransi Umum di Indonesia. Pekbis Jurnal, Vol. 3, No. 1.
[2] Aris, A., 2016. Spektrum Bisnis: Obat Kuat Untuk Anggota Bursa. [Online] Available at: http://koran.bisnis.com/read/20160218/270/520215/spektrum-bisnis-obat-kuat-untuk-anggota-bursa [Diakses 27 April 2016].
[3] Benarda, Sumarwan, U. & Hosen, M., 2016. Tingkat Efisiensi Industri Asuransi Jiwa Syariah Menggunakan Pendekatan Two Stage Data Envelopment Analysis. Jurnal Aplikasi Bisnis dan Manajemen, Vol. 2, No. 1, pp. 64-72.
[4] Devita, L., 2011. Pengaruh Penerapan Good Corporate Governance (GCG) terhadap Kinerja Keuangan Perusahaan. Jurnal Hukum Bisnis dan Investasi, Vol. 3, No. 1.
[5] Diana, Y., 2010. Efisiensi dan Pelaksanaan Hukum Persaiangan Usaha. Jurnal Persaingan Usaha, Edisi 3. Komisi Pengawas Persaingan Usaha.
[6] Dwijayanto, A. & Cicilia, S., 2015. Masih Ada Waktu Memperkuat Pasar Lokal. [Online] Available at: http://lipsus.kontan.co.id/v2/mea/read/287/Masih-ada-waktu-memperkuat-pasar-lokal [Diakses 26 April 2016].
[7] Hendarwin, R., 2015. Hubungan Efisiensi Pasar Modal di Indonesia Menghadapi Masyarakat Ekonomi ASEAN (MEA) 2015, Sukabumi: s.n.
[8] Kalakota, R. & Konsynski, B., 2000. The Rise of Neo-Intermediation: The Transformation of the Brokerage Industry. Information Systems Frontiers, 2(1), pp. 115-128.
[9] Michal, K., 1999. Analyzing The Brokerage Firms: A Look at On-Line Discounters. AAII Journal, pp. 23-28.
[10] Moechidie, A. & Ramelan, H., 2012. Gerbang Pintar Pasar Modal: Bukunya Investor dan Profesional Pasar Modal. Jakarta: PT. Capital Bridge Advisory.
[11] Muljawan, D., Hafidz, J., Astuti, R. & Oktapiani, R., 2014. Faktor-Faktor Penentu Efisiensi Perbankan Indonesia serta Dampaknya terhadap Perhitungan Suku Bunga Kredit, Jakarta, Indonesia: Bank Indonesia.
[12] Pancurova, D. & Lyocsa, S., 2013. Determinans of Commercial Bank's Efficiency: Evidence from 11 CEE Countries. Czech Journal of Economics and Finance, 63(2), pp. 152-179.
[13] Setiawan, S., 2012. Analisis Sektor Pasar Modal Indonesia Menghadapi Liberalisasi dan Integrasi ASEAN. Policy Paper Kebijakan Fiskal, Volume No. 2.
[14] Surifah, 2011. Kepemilikan Ultimat, Tingkat Risiko, Efisiensi, dan Kinerja Industri Perbankan di Indonesia. Jurnal Siasat Bisnis, Volume 15, pp. 37-53.
[15] Widiarti, A., Siregar, H. & Andati, T., 2015. The Determinants of Bank’s Efficiency In Indonesia. Buletin Ekonomi Moneter dan Perbankan, Volume 18(Nomor 2), pp. 129-156.
AUTHORS First Author – Muhammad Rifqi Syauqi, S.Si, [email protected]. Second Author – Dr. Ir. Dedi Budiman Hakim, M.Ec, [email protected]. Third Author – Dr. Hendro Sasongko, Ak, MM, [email protected]. Correspondence Author – Muhammad Rifqi Syauqi,[email protected], +62 856 4623 0887.

International Journal of Scientific and Research Publications, Volume 7, Issue 4, April 2017 179 ISSN 2250-3153
www.ijsrp.org
The modern marketing methods of improving healthcare facilities
Emil Zhalmukhamedov
Marketing board member at NYSS, NYS EMT-B Volunteer at RVAC. Abstract- As US Department of Health (DOH) continues to evaluate the ranking of hospitals throughout the country, it’s becoming imperative for the hospitals to keep their brand image on a positive side, as well as keep improving their services of patient outcome. This paper focuses on the important aspects of modern methods of healthcare marketing, as well as emergency marketing, such as how to deal with bad PR. The methods introduced in this research paper, can dramatically improve the business side of the hospital and increase the patient loyalty. Index Terms- Healthcare management;NYC Healthcare Grading and Improvements; Healthcare Marketing; Healthcare Business; Modern Healthcare Marketing; Hospital Marketing and Promotion; Improving Patient Outcomes.
I. INTRODUCTION n October 2016, the leapfrog group – a nonprofit nation’s premier advocate of hospital transparency,released a report on
hospital grading in the United States. Overall there were 38 city hospitals on the list, and NY State particularly has performed poorly according to the provided data. This reliable data proves that avoidable death still remains high, especially in the hospitals of underserved communities. As public and non-profit hospitals are chasing the budget for the research and improvement of the facilities, it’s becoming more and more challenging for them with the given statistics of poor performance. The hospitals are in need of adopting new ways of conducting management and marketing, in order to regain the trust of communities and be able to secure more funds from the government. There are numerous ways to improve the healthcare facility, but one of the most challenging is marketing and promotion. This study is prepared by expertly assessing the latest technology and its effectiveness available for the B2C (Business-To-Consumers) organizations and healthcare facilities.
II. TRADITIONAL VS. NON-TRADITIONAL MARKETING
Hospital marketing is a complex process, where HIPPA compliance has to be in place and patients have to be engaged with the message. From the hospital’s point of view it has to be effective and yet precise for the specific target market at accumulated budget. From the patients view it has to be educative enough to understand the information clearly at the most engaging medium. There are different types of business marketing that play a major role in success of the healthcare
facility. Those types are traditional marketing and non-traditional marketing. Traditional marketing could be defined as a method of promotion and advertising, which has been used for years by professionals around the world. Such marketing methods include print, TV, billboards, flyers etc. Non-traditional marketing is everything that falls outside of the traditional marketing category, the most successful ones are: search, mobile, inbound, outbound, word-of-mouth and guerilla marketing. Most hospitals nowadays still rely on traditional marketing, where we see outside banners and TV ads. The problem that poses traditional marketing is that it’s hard to scale the actual return on investment (ROI) from the budget spent. Where in non-traditional marketing, specifically Internet marketing - hospitals could tell exactly where the patient or interested party took place, and they can accommodate specific budget for the most performing channel. Additionally, mobile marketing puts hospital’s promotional message right in the hands of patients, where it’s hard to ignore it. While most people in the world are shifting towards computer and mobile era, it’s important for the hospitals to adopt the change and be on the edge with the patients who are seeking quality care.
III. EMERGENCY MARKETING Going back to the 2016thleapfrog group hospital grading, it’s important to understand that hospitals, which were graded poorly, need to have an emergency marketing PR in place. The communication between hospital and public in this critical moment is very important, and by not having a strategy in place, could ruin reputation of the hospital and patient’s trust, which can lead to the numerous negative outcomes. One of the most effective ways to implement the emergency marketing is planning ahead. There are certain steps need to be taken such as, what medium to utilize, who is responsible for writing the press release, how the release is communicated, the person in charge etc. Back in old days press release could take weeks to become available to general public, nowadays it could simply be distributed through PR service providers at cost of no more than $500 or even less with the appropriate company’s relationship.
IV. METHODS An overview of various marketing methods has been observed in B2C organizations, where non-traditional marketing drove the highest ROI through digital marketing mix
I

International Journal of Scientific and Research Publications, Volume 7, Issue 4, April 2017 180 ISSN 2250-3153
www.ijsrp.org
implemented by me. The digital marketing mix includes: website, blog/content, social media and mobile marketing. The most important part of effective modern marketing for healthcare facilities is to have optimized and consumer friendly virtual properties, and proper utilization of each one of them. Virtual properties could be identified as website, blog and social media. These properties are proven to be the most effective ones for the interaction with patients and general public. Some hospitals are still struggling to improve their online image, and these hospitals tend to be from the underserved communities or public hospitals.
V. STEP-BY-STEP GUIDELINES FOR HOSPITALS The first step in improving successful marketing, is to start with the website. Website represents an image of the hospital, communication with general public and announcement, which could be distributed directly to public for educational or promotional purposes. The website has to be optimized, meaning that it has to be searchable by search engines. If it’s not searchable then patients who are looking for services or doctors looking for work simply can’t find it. Search Engine Optimization (SEO) is the abbreviation commonly used by modern marketers, it’s a set of methods of improving the ranking of the website on the search engines such as Google, Yahoo, Bing etc. A research done by Chitka - search targeted advertising company in 2013, shows a significant drop in traffic of the websites found on the 2nd page of Google in compare to the 1st page. The websites found on first page of Google, drive around 95% of traffic, where second page drove only 4.8%. The second step is to write a relevant and highly customized content on the website. Patients who are looking for answers for the particular disease can easily find the content such as a blog post. This way not only hospital positions itself as an expert in the treating this disease, but also enhances its brand identity. It’s a modern way of engaging virtually. The third step is to make sure the website is mobile friendly. As more and more people accessing the websites from their mobile devices, it’s imperative to have your website properly scaled to the size of the multiple devices. A better optimized and scaled website brings more people to the facility. Baby boomers (born between 1946 and 1964) and millennials(born between 1981 and 2000) are looking for health information on their phones or tablets, therefore it is very important to have a website that can scale to the screen of mobile devices. The fourth step in implementing successful marketing plan, is to develop a set strategy for utilizing social media. It’s important to notice that full HIPAA compliance guideline has to be in place in order to implement marketing and promotion strategies on social media. Many hospitals make a mistake by advertising their services on every single social media. This is where the scarce budget is wasted, as some social media channels are simply not suitable for the given audience. Facebook tends to be a universal social media for brand awareness &brand recognition, and also for educational materials to general public such as awareness week - could be easily implemented. Since acquisition of Instagram by Facebook, hospitals can now increase their reach by promoting the content
not only on Facebook but on Instagram as well, for the budget of one. Another social media channel that proved to be an excellent in delivering urgent messages is Twitter. A short 140-character PR message could be easily distributed right from the mobile device or the desktop. Not to mention, many influencers in the healthcare and political government figures are there, who might be able to support your press release by re-tweeting or mentioning you in press. For gender specific messages - Pinterest could be an ideal tool for the hospitals. As 80% of the audiences on Pinterest are females, a message such as breast cancer awareness week could be beneficial. If a hospital is looking for authority in the online space, it will be good to utilize LinkedIn as a network. LinkedIn is a professional social media network, where professionals of all specialties are present. If press release is targeted towards physicians or businesses, LinkedIn is a great place to start utilizing it. Alsoan emergency press release could be successfully utilized on given social media for urgent announcements. The last but not least is G+. Google plus network allows facilities to create and claim their businesses on Google verified business finders.People who are registered with Gmail account can leave the review of the hospital, and it’s visible to everyone. Hospital managers can manage this account by replying/updating the information relevant to the healthcare clinic. As Google has become a dominant search engine of the Internet, it must be clear for the hospital to be there when somebody is searching for the particular healthcarefacility. The social media right now represents a global community, if hospital would like to connect more with the community and increase it’s brand image, it must be good at utilizing social media channels. Another very important part of medical marketing is collecting emails. By collecting emails, hospitals can stay in touch with their patients 24/7. If, for example patient requires ongoing follow-ups, it would be advisable to supplement communication through the email with this patient. It’s important to stay connected with the patients at the convenience of this technology, as patient outcome has the potential to be improved with the relevant communication between physician and patient. If casualty such as Zika virus occurs in the particular region, a mass email could be sent out to the affected community. This way doctors can have a clear action of pre and post care outcomes. Some private clinics send out awareness email marketing, however, there is a certain detachment between relevance and many patients tend to ignore these emails. To improve the relevance and engagement of the email with patients, healthcare facilities must include personalization features such as name, location or disease associated with the particular patients. This technique is accomplished by detailed email segmentation of groups by categories.
VI. PREFERENCE OF THE CONSUMERS FOR DIGITAL EXPERIENCE
I surveyed 20 people who are between ages 20 – 55 on their experience with the clinic they attend. Both males and females of

International Journal of Scientific and Research Publications, Volume 7, Issue 4, April 2017 181 ISSN 2250-3153
www.ijsrp.org
this category are owners of ios (IPhone, IPad) and android (Samsung, Motorola etc.). During survey on preference of the clinic, they pointed out to the ads found on Google (40%) and social media ads (60%) influenced their decision on choice of clinic. They said it’s important for them to find the clinic at the click of a button and when they are able to find relevant information or reviews from people online.
VII. CONCLUSION AND SUGGESTIONS When promoting or advertising hospital services, it’s important to focus on benefits for the patients, and include physician’s specialty for the last part. While it’s important to note the professionalism of the hospital’s staff, most patients are just oblivious to certain doctor’s specifications and focused more on the information of disease cured. A study done by Microsoft confirms that people generally lose their attention after 8 seconds, and it’s important to get the promotional message across first within these precious seconds. So, it’s very important to repeat and incorporate promotional message on relevant online and social media networks that work for the hospital. By marketing and advertising the healthcare facility, the facility is not only generates awareness about hospital, but it also earns the trust from the present and future patients. Patients that
are treated at particular hospital with good outcome, later on become a free brand voice for the facility they’ve been treated, which can reduce general marketing spend, as this becomes a referral marketing tool. Practicing marketing implementations online saves more money and generates better ROI for healthcare facilities in the modern day and age.
REFERENCES [1] Leapfrog hospital safety grade – New hospital safety grades. (31 October
2016). http://www.hospitalsafetygrade.org/about-us/newsroom/display/489537
[2] Chitka - The value of google result positioning. (7 June 2013). Retrieved from https://chitika.com/google-positioning-value
[3] Microsoft – Attention span research. (Spring 2015) Google – Google my business benefits. (Landing page). https://www.google.com/business/benefits/
AUTHORS First Author – Emil Zhalmukhamedov is an executive marketing board member at NYSS and volunteer NYS EMT-B at RVAC, [email protected]
International Journal of Scientific and Research Publications, Volume 7, Issue 4, April 2017 182 ISSN 2250-3153
www.ijsrp.org
Performance Improvement of Photovoltaic Module Using Plane Mirror
Aliyu Abubakar, M.H Ali
Department of physics ,Bayero University Kano, Nigeria Abstract- This work presents the quantitative advantage of using a plane mirror as reflector for photovoltaic application. Shade, intermittent nature of solar radiation and dust reduce the total amount of the incident radiation on PV panel and thus reduce its efficiency. Plane mirror is used to increase the incident radiation and thus minimized the effect of the above problems. Experimental measurements are conducted on the performance of a 15 W silicon polycrystalline PV module with mirror reflector and compared with its performance without the mirror. The results obtained show that the plane mirror increased the output power of the PV panel to 20.4W.Thus the use of plane mirror as reflector is recommended to overcome the problem of poor performance due to these problems. Index Terms- intermittent solar radiation, plane mirror,PV module, quantitative advantage
I. INTRODUCTION olar energy is the most abundance form of energy available with the permanent source whose magnitude is a function of earth surface topography. Sun is the main source of all solar energies on the earth’s surface [1]. This energy
resource is free from contamination because it does not emit toxic substances to pollute the environment as some resources possess [2]. The scenario of solar energy will address global warming issues when serious attention is focused to its use [3]. There is a fervent need for private and public to revamp the sector considering its huge potential for improving social and economic development in both rural and urban areas through the different range of applications [1]. The depletion of non-renewable resources have shown good evidences that even with conservative assumption of future increase rates, solar energy will be the mainstream electricity providing industries within the coming decade where large percentage of energy need will be covered by renewable energy resources from ecological and economical point of view. It has been recognised that sunlight striking the surface of earth is more than adequate to supply all the energy that human activities require [4]. The great challenge is the way to harvest this dilute and intermittent solar energy to a form that will be convenient for use by the inhabitant [5]. Solar energy can be harvested in four different ways: (i) direct photo-induced and endothermic reaction (photosynthesis). (ii) Direct production of electrical power (photoelectric effect). (iii) Direct conversion of sunlight to thermal energy such as solar heater and solar cookers. (iv)Conversion of thermal energy into electricity(thermoelectric effect) [6]. Photovoltaic (PV) cells are specialised semiconductor diodes that convert visible light into direct current based on photoelectric effect (the generation of potential difference at the junction of two different materials in response to visible light or other radiation). PV cells are an integral part of solar electrical energy system which is becoming increasingly important as alternative source of utility power [6]. There are many problems associated with the use of photovoltaic technologies. Shadow exercises a tremendous effect on the performance of the solar cell by casting on the whole or some portion of the module, e.g. blockage from a nearby building, trees and cloud. Therefore, casting shadow on a portion of a single cell reduce the performance of the cell, and subsequently reduce the entire performance of the module because of the number of cells in the module connected in series [7]. The low absorption of solar radiation by the solar cell is a function of overall efficiency of the panel. As a result, the module build up from the manufacturer is inherently of low efficiency; maximum ranging from 10-20% and this lowers the absorption capacity of the cell (Abd-Elhady, Fouad & Khalil, 2016). Dirt accumulation like dust, water and sand on the surface of the panel obstruct or distract light energy from reaching the solar cells. These light obstructing materials build external resistances in the cell which reduce the performance of solar module. Overheating rises the temperature and warmed up cells and Consequently, lower the overall efficiency of the panel [9]. Intermittency of solar radiation is an hourly fluctuation of solar insolation which reduces the overall efficiency of the module [10]. The highest efficiency of solar cell at commercial rate still remains around 20%. Abd-Elhady, Fouad and Khalil (2016) reported increase of 20% in the cell efficiency by smearing oil on the surface of the panel to increase the amount of light transmitted to the panel. Decrease in cell efficiency due to overheating was tackled in Popovici, Hudişteanu, Mateescu and Cherecheş( 2016) work by the use of air cooled heat sink method. While the use of the water cooling was recommended for the improvement of efficiency by Odeh and Behnia (2009). The effect of dust particles staining on the panel adversely affect cell efficiency as revealed in the work of Rao, Pillai, Mani and Ramamurthy (2014) and suggested the use of daily routine maintenance operation as the best approach to clean up dust particles on the panel and mitigate the effect of dust. Narasimman and Selvarasan (2016) worked on the effect of intermittent solar radiation on cell efficiency and recommended the use of glass reflector to boost the efficiency. The investigation of cell efficiency was performed by Hossain, Muhida and Ali (2008) and suggested the use of compound parabolic concentrator and sun tracking system to
S

International Journal of Scientific and Research Publications, Volume 7, Issue 4, April 2017 183 ISSN 2250-3153
www.ijsrp.org
improve the low efficiency. Rizk andNagrial (2009) reported in the work the effect of intermittent solar insolation on the efficiency of the panel and recommend the use of Aluminium foil as concentrator and sun tracking system to boost the reflection of light on the panel and improve cell efficiency. In this research work, we quantitatively determined the effect of plane mirror on the overall performance of photovoltaic module .The results obtained from these characteristics curves of the experimental work conducted depicted the increase in the output power and efficiency.
II. BACKGROUND THEORY Introduction Atmosphere compose of substances that intercept, scattered, absorb and reflect some solar radiation coming to the earth as a consequence reduce the total radiation reaching the earth surface. These compositions of the atmosphere are vapour molecule, dust particles, cloud and air pollution. Besides, the solar radiations striking the surface of the panel or collector are grouped into three components namely direct beam, diffuse and reflected component. The components diffuse and reflected solar radiationarecumbersome because their values cannot beeasily estimated by virtues of their nature. Therefore, in computing the solar irradiance in this research work only direct beam value is considered because of certainties attached its nature. Clear sky direct beam solar radiation The clear sky direct beam solar radiation describes the transmission of solar radiation from the sun down to the earth surface without interception of the cloud cover. The expression of clear sky solar radiation reaching the earth’s surface (normal to the collector surface) is given by [17]
𝐼𝐼𝐵𝐵 = 𝐴𝐴𝑒𝑒−𝑘𝑘𝑘𝑘 (1) where 𝐼𝐼𝐵𝐵= solar beam insolation at the earth’s surface, A=Apparent extra- terrestrial solar insolation. m=air mass ratio. A=1160+75 sin [360
365(𝑛𝑛 − 100)] (2)
where n=number of days k= 0.174 + 0.035 𝑠𝑠𝑠𝑠𝑛𝑛[360
365(n-100)] (3)
where k=atmospheric optical depth m= 1
𝑠𝑠𝑠𝑠𝑛𝑛𝑠𝑠 (4)
where m=mass air ratio, 𝑠𝑠 = 𝑠𝑠𝑠𝑠𝑠𝑠𝑠𝑠𝑠𝑠 𝑠𝑠𝑠𝑠𝑙𝑙𝑠𝑠𝑙𝑙𝑙𝑙𝑙𝑙𝑒𝑒 Total clear sky solar radiation on the collector surface The clear sky solar radiation on the collecting surface can be reasonably estimated on the surface as accurate, direct solar radiation are easy to work out and the geometry involved to determine how much energy striking a collector surface is clear and explicit but it not easy to account for the diffuse and reflected solar radiation. Direct beam solar radiation The direct beam solar radiation is a definite pattern of solar radiation that describes how the rays of light travelled on a straight line from the sun down to the surface of the earth. In these modes of transitions, the rays are travelling in the same direction and object can block them at the same time [17].
𝐼𝐼𝐵𝐵𝐵𝐵 = 𝐼𝐼𝐵𝐵𝑐𝑐𝑠𝑠𝑠𝑠𝑐𝑐 (5) Where 𝑐𝑐 = 𝑠𝑠𝑛𝑛𝑐𝑐𝑠𝑠𝑙𝑙𝑒𝑒𝑛𝑛𝑐𝑐𝑒𝑒 𝑠𝑠𝑛𝑛𝑎𝑎𝑠𝑠𝑒𝑒, 𝐼𝐼𝐵𝐵𝐵𝐵 = 𝑠𝑠𝑠𝑠𝑠𝑠𝑠𝑠𝑠𝑠 𝑠𝑠𝑛𝑛𝑠𝑠𝑠𝑠𝑠𝑠𝑠𝑠𝑙𝑙𝑠𝑠𝑠𝑠𝑛𝑛 𝑠𝑠𝑙𝑙𝑠𝑠𝑠𝑠𝑘𝑘𝑠𝑠𝑛𝑛𝑎𝑎 𝑙𝑙ℎ𝑒𝑒 𝑐𝑐𝑠𝑠𝑠𝑠𝑠𝑠𝑒𝑒𝑐𝑐𝑙𝑙𝑠𝑠𝑠𝑠 The expression of incidence angle 𝑐𝑐 𝑠𝑠𝑠𝑠 given by [17]. 𝑐𝑐𝑠𝑠𝑠𝑠𝑐𝑐 = 𝑐𝑐𝑠𝑠𝑠𝑠𝑠𝑠𝑐𝑐𝑠𝑠𝑠𝑠(∅𝑠𝑠 − ∅𝑐𝑐)𝑠𝑠𝑠𝑠𝑛𝑛𝑠𝑠 + 𝑠𝑠𝑠𝑠𝑛𝑛𝑠𝑠𝑐𝑐𝑠𝑠𝑠𝑠𝑠𝑠 ( 6) where∅𝑠𝑠 = 𝑠𝑠𝑠𝑠𝑠𝑠𝑠𝑠𝑠𝑠 𝑠𝑠𝑎𝑎𝑠𝑠𝑘𝑘𝑙𝑙𝑙𝑙ℎ 𝑠𝑠𝑛𝑛𝑎𝑎𝑠𝑠𝑒𝑒,∅𝑐𝑐 = 𝑐𝑐𝑠𝑠𝑠𝑠𝑠𝑠𝑒𝑒𝑐𝑐𝑙𝑙𝑠𝑠𝑠𝑠 𝑠𝑠𝑎𝑎𝑠𝑠𝑘𝑘𝑙𝑙𝑙𝑙ℎ 𝑠𝑠𝑛𝑛𝑎𝑎𝑠𝑠𝑒𝑒,𝑠𝑠𝑐𝑐𝑠𝑠𝑠𝑠𝑠𝑠𝑒𝑒𝑐𝑐𝑙𝑙𝑠𝑠𝑠𝑠 𝑙𝑙𝑠𝑠𝑠𝑠𝑙𝑙 𝑠𝑠𝑛𝑛𝑎𝑎𝑠𝑠𝑒𝑒,𝑠𝑠 = 𝑠𝑠𝑠𝑠𝑠𝑠𝑠𝑠𝑠𝑠 𝑠𝑠𝑠𝑠𝑙𝑙𝑠𝑠𝑙𝑙𝑙𝑙𝑙𝑙𝑒𝑒, 𝑠𝑠 =

International Journal of Scientific and Research Publications, Volume 7, Issue 4, April 2017 184 ISSN 2250-3153
www.ijsrp.org
𝑠𝑠𝑠𝑠𝑠𝑠𝑠𝑠𝑒𝑒 𝑠𝑠𝑜𝑜 𝑠𝑠𝑠𝑠𝑛𝑛𝑒𝑒𝑠𝑠
Figure.1 Solar angles
Solar declination angle The angle formed between the plane of the equator and a line drawn from the centre of the Sun to the centre of the earth is the declination angle. It varies between the extremes of ±23.45°; and is a simple sinusoidal relationship that assumes a 365-day year which puts the spring equinox on a day n=284 provides good approximation [17]
𝛿𝛿 = 23.45 sin �360
365.25(284 + 𝑛𝑛)� (7)
Where 𝛿𝛿 = 𝑙𝑙𝑒𝑒𝑐𝑐𝑠𝑠𝑠𝑠𝑛𝑛𝑠𝑠𝑙𝑙𝑠𝑠𝑠𝑠𝑛𝑛 𝑠𝑠𝑛𝑛𝑎𝑎𝑠𝑠𝑒𝑒, n=number of days Solar azimuth angle The position of the sun at any time of the day can be describes in term of its latitude angle 𝑠𝑠 and its azimuth angle∅𝑠𝑠. By convention, the azimuth angle is positive in the morning with the sun in the east and negative in the afternoon with the sun at west[17]
𝑠𝑠𝑠𝑠𝑛𝑛∅𝑠𝑠 =𝑐𝑐𝑠𝑠𝑠𝑠𝛿𝛿 ∗ 𝑠𝑠𝑠𝑠𝑛𝑛𝑠𝑠
𝑐𝑐𝑠𝑠𝑠𝑠𝑠𝑠 ( 8 )
Where H = hour angle, 𝑠𝑠 = 𝑠𝑠𝑠𝑠𝑠𝑠𝑠𝑠𝑠𝑠 𝑠𝑠𝑠𝑠𝑙𝑙𝑠𝑠𝑙𝑙𝑙𝑙𝑙𝑙𝑒𝑒, 𝛿𝛿 = 𝑠𝑠𝑠𝑠𝑠𝑠𝑠𝑠𝑠𝑠 𝑙𝑙𝑒𝑒𝑐𝑐𝑠𝑠𝑠𝑠𝑛𝑛𝑠𝑠𝑙𝑙𝑠𝑠𝑠𝑠𝑛𝑛 𝑠𝑠𝑛𝑛𝑎𝑎𝑠𝑠𝑒𝑒 The expression for solar altitude at solar noon is given by [17]
𝑠𝑠𝑁𝑁 = 90 − 𝐿𝐿 − 𝛿𝛿 ( 9) Where 𝑠𝑠𝑁𝑁 = 𝑠𝑠𝑠𝑠𝑠𝑠𝑠𝑠𝑠𝑠 𝑠𝑠𝑠𝑠𝑙𝑙𝑠𝑠𝑙𝑙𝑙𝑙𝑙𝑙𝑒𝑒 𝑠𝑠𝑛𝑛𝑎𝑎𝑠𝑠𝑒𝑒 𝑠𝑠𝑙𝑙 𝑛𝑛𝑠𝑠𝑠𝑠𝑛𝑛, 𝐿𝐿 = 𝑠𝑠𝑠𝑠𝑙𝑙𝑠𝑠𝑙𝑙𝑙𝑙𝑙𝑙𝑒𝑒, 𝛿𝛿 = 𝑙𝑙𝑒𝑒𝑐𝑐𝑠𝑠𝑠𝑠𝑛𝑛𝑠𝑠𝑙𝑙𝑠𝑠𝑠𝑠𝑛𝑛 𝑠𝑠𝑛𝑛𝑎𝑎𝑠𝑠𝑒𝑒 The expression for calculating solar altitude angle is given by[17]
𝑠𝑠𝑠𝑠𝑛𝑛𝑠𝑠 = 𝑐𝑐𝑠𝑠𝑠𝑠𝐿𝐿𝑐𝑐𝑠𝑠𝑠𝑠𝑠𝑠 + 𝑠𝑠𝑠𝑠𝑛𝑛𝐿𝐿𝑠𝑠𝑠𝑠𝑛𝑛𝛿𝛿 (10) Where L=latitude, H=hour angle,𝛿𝛿 = 𝑙𝑙𝑒𝑒𝑐𝑐𝑠𝑠𝑠𝑠𝑛𝑛𝑠𝑠𝑙𝑙𝑠𝑠𝑠𝑠𝑛𝑛 𝑠𝑠𝑛𝑛𝑎𝑎𝑠𝑠𝑒𝑒,𝑠𝑠 = 𝑠𝑠𝑠𝑠𝑠𝑠𝑠𝑠𝑠𝑠 𝑠𝑠𝑠𝑠𝑙𝑙𝑠𝑠𝑙𝑙𝑙𝑙𝑙𝑙𝑒𝑒 angle The hour angle H is the number of degree that earth must rotate before the sun will be directly over your local meridian given by [17] 𝑠𝑠 = 15°∗ℎ𝑠𝑠𝑙𝑙𝑠𝑠 𝑏𝑏𝑒𝑒𝑜𝑜𝑠𝑠𝑠𝑠𝑒𝑒 𝑛𝑛𝑠𝑠𝑠𝑠𝑛𝑛
ℎ𝑠𝑠𝑙𝑙𝑠𝑠 𝑠𝑠𝑠𝑠 𝑠𝑠 = −15°
ℎ𝑠𝑠𝑙𝑙𝑠𝑠∗ ℎ𝑠𝑠𝑙𝑙𝑠𝑠𝑏𝑏𝑒𝑒𝑜𝑜𝑠𝑠𝑠𝑠𝑒𝑒 𝑛𝑛𝑠𝑠𝑠𝑠𝑛𝑛 ( 11)
Single diode PV cell model The simplest empirical model of a PV cell is an equivalent circuit consisting of photocurrent source𝐼𝐼𝑠𝑠ℎ and diode current 𝐼𝐼𝐷𝐷 in parallel with the resistor 𝑅𝑅𝑠𝑠in series[18]
Figure. 2 Equivalent circuit of PV cell [18]
The equation describing the V-I and P-V characteristics curve of the PV cell is derived using Kirchhoff’s current law as follows[19]
𝐼𝐼𝑠𝑠 = 𝐼𝐼𝑃𝑃ℎ − 𝐼𝐼𝐷𝐷 ( 12 )
Where 𝐼𝐼𝐷𝐷 = 𝐼𝐼𝑂𝑂 �e�(𝑞𝑞(𝑣𝑣𝑠𝑠+𝑅𝑅𝑠𝑠𝐼𝐼𝑆𝑆 )
𝑘𝑘𝑘𝑘𝑚𝑚 � − 1 � ( 13)

International Journal of Scientific and Research Publications, Volume 7, Issue 4, April 2017 185 ISSN 2250-3153
www.ijsrp.org
And q=1.6 × 10⁻¹⁹C , k=1.38× 10⁻²³J/K, m is ideality factor of PV panel and 𝐼𝐼0 is diode saturation current
And thus 𝐼𝐼𝑠𝑠 = 𝐼𝐼𝑠𝑠ℎ − 𝐼𝐼𝑂𝑂 �𝑒𝑒�(𝑞𝑞(𝑣𝑣𝑠𝑠+𝑅𝑅𝑠𝑠𝐼𝐼𝑆𝑆 )
𝑘𝑘𝑘𝑘𝑚𝑚 � − 1� (14 )
𝐼𝐼𝑠𝑠ℎ = [𝐼𝐼𝑠𝑠𝑐𝑐 + 𝐾𝐾𝑙𝑙∆𝑚𝑚] ×𝐺𝐺𝐺𝐺𝑠𝑠𝑙𝑙𝑐𝑐
(15)
Where ∆𝑚𝑚 𝑠𝑠𝑠𝑠 change in temperature, G is solar irradiance,𝐺𝐺𝑠𝑠𝑙𝑙𝑐𝑐 is irradiance at standard condition, 𝐾𝐾𝑙𝑙Temperature coefficient. of𝐼𝐼𝑠𝑠𝑐𝑐 The expression of input power is given by (Abdelhady,Foud& Khalil,2016)
𝑃𝑃𝑠𝑠𝑛𝑛 = 𝐺𝐺 × 𝐴𝐴𝑆𝑆 ( 17) WhereG is solar irradiance,𝐴𝐴𝑠𝑠 surface area of panel. The expression of efficiency is given by(Abdelhady,Foud& Khalil,2016) 𝐸𝐸𝑜𝑜𝑜𝑜𝑠𝑠𝑐𝑐𝑠𝑠𝑒𝑒𝑛𝑛𝑐𝑐𝐸𝐸 = 𝑃𝑃𝑘𝑘𝑠𝑠𝑚𝑚
𝑃𝑃𝑠𝑠𝑛𝑛×100% (18)
The above equation (18) was used in the evaluation of efficiency of PV module at a particular point.
III. METHOD The experimental method was adopted for this work. The experiment took place at M block hostel in the Bayero university old campus. The photovoltaic module used is a 15W Panel with model number as (YL 015P-17b) which is silicon polycrystalline panel. Two intelligent digital multimeter with model number (MS 345) were used for the panel current and voltage measurement. Additional Rheostat (SR 451) was used for varying the resistance in step. The panel was aligned to the direction facing north south and used latitude of the location as inclination angle of the panel. The open circuit and short circuit values of currents and voltages were obtained by opening and shortening the circuit terminal[19] these instruments were connected as shown in Fig 3.The experimental connection in fig3 was used to obtain the characteristics currents and voltages of PV module by varying Rheostat in step. The circuit connection was repeated with the used of plane mirror placed at an angle of 60°between the panel and then measured the characteristics currents and voltages of PV module with mirror also by varying the resistance in step.Experiment was repeated five times in three days. Simulation for panel with mirror and without mirror was carried out. The I-V and P-V characteristics curves of PV module with and without mirrorwere plotted for the five times values of the three days 3.1DIAGRAM OF THE EXPERIMENTAL SETUP
Figure.3. Experimental setup for the field measurement[19]\
IV. RESULTS AND DISCUSSION The experimental and simulated results of the Photovoltaic module performances with mirror and without the mirror as concentrator are compared graphically.
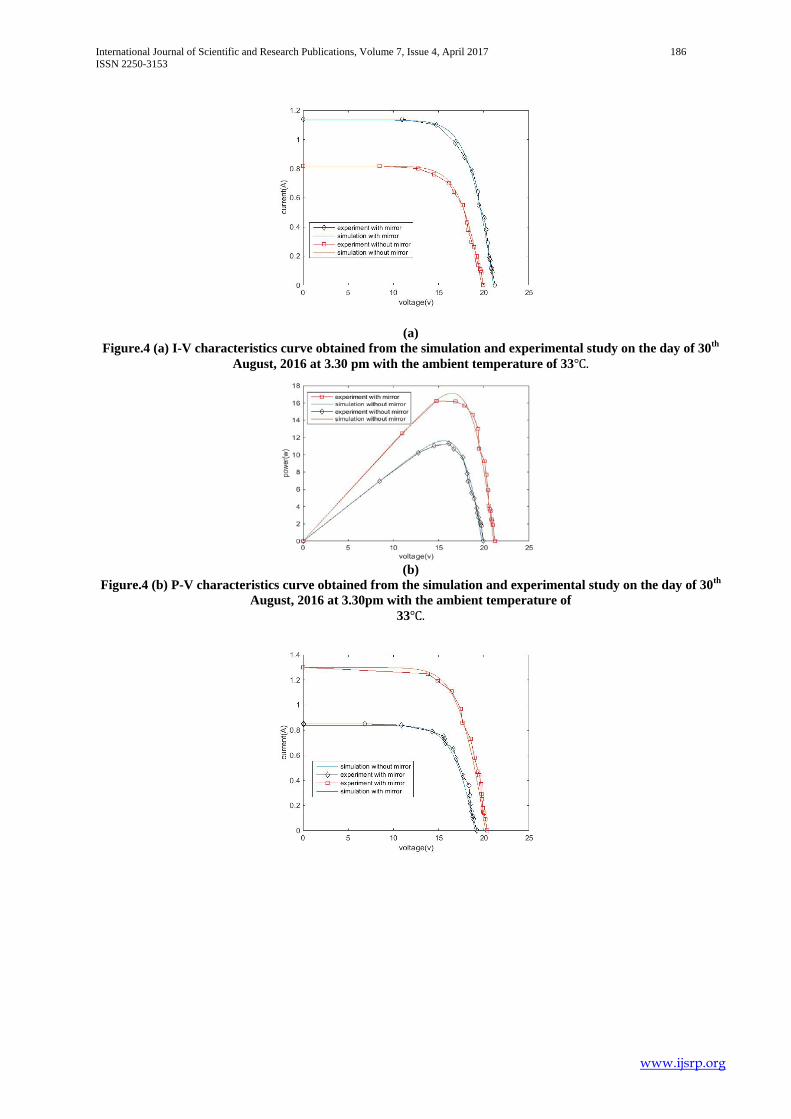
International Journal of Scientific and Research Publications, Volume 7, Issue 4, April 2017 186 ISSN 2250-3153
www.ijsrp.org
(a) Figure.4 (a) I-V characteristics curve obtained from the simulation and experimental study on the day of 30th
August, 2016 at 3.30 pm with the ambient temperature of 33℃.
(b)
Figure.4 (b) P-V characteristics curve obtained from the simulation and experimental study on the day of 30th August, 2016 at 3.30pm with the ambient temperature of
33℃.
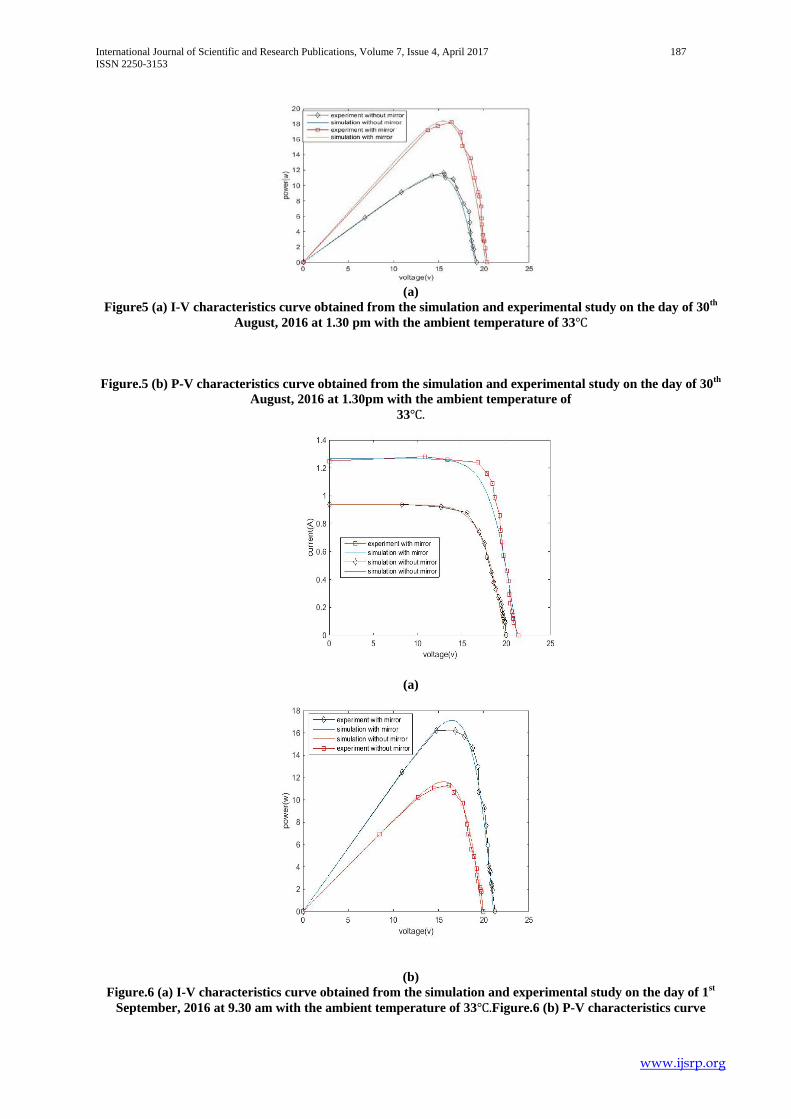
International Journal of Scientific and Research Publications, Volume 7, Issue 4, April 2017 187 ISSN 2250-3153
www.ijsrp.org
(a)Figure5 (a) I-V characteristics curve obtained from the simulation and experimental study on the day of 30th
August, 2016 at 1.30 pm with the ambient temperature of 33℃
Figure.5 (b) P-V characteristics curve obtained from the simulation and experimental study on the day of 30th August, 2016 at 1.30pm with the ambient temperature of
33℃.
(a)
(b) Figure.6 (a) I-V characteristics curve obtained from the simulation and experimental study on the day of 1st
September, 2016 at 9.30 am with the ambient temperature of 33℃.Figure.6 (b) P-V characteristics curve
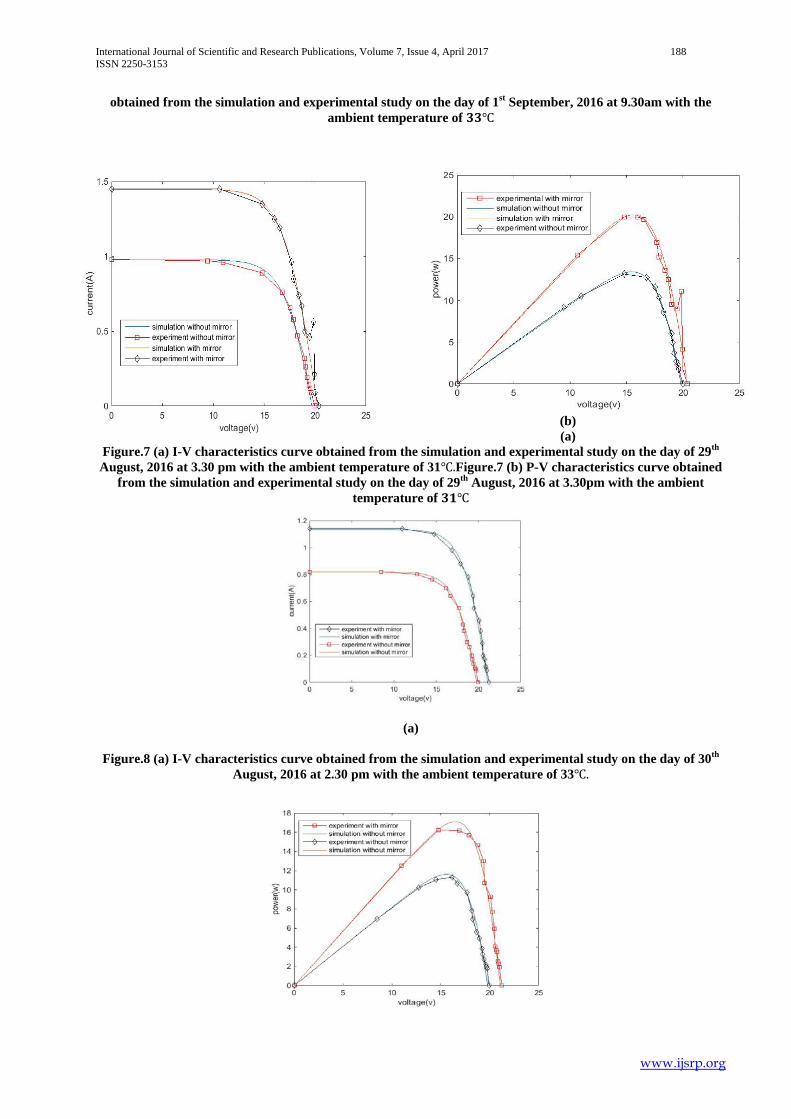
International Journal of Scientific and Research Publications, Volume 7, Issue 4, April 2017 188 ISSN 2250-3153
www.ijsrp.org
obtained from the simulation and experimental study on the day of 1st September, 2016 at 9.30am with the ambient temperature of 𝟑𝟑𝟑𝟑℃
(b) (a)
Figure.7 (a) I-V characteristics curve obtained from the simulation and experimental study on the day of 29th August, 2016 at 3.30 pm with the ambient temperature of 31℃.Figure.7 (b) P-V characteristics curve obtained
from the simulation and experimental study on the day of 29th August, 2016 at 3.30pm with the ambient temperature of 𝟑𝟑𝟑𝟑℃
(a)
Figure.8 (a) I-V characteristics curve obtained from the simulation and experimental study on the day of 30th August, 2016 at 2.30 pm with the ambient temperature of 33℃.

International Journal of Scientific and Research Publications, Volume 7, Issue 4, April 2017 189 ISSN 2250-3153
www.ijsrp.org
(b) Figure.8 (b) P-V characteristics curve obtained from the simulation and experimental study on the day of 30th
August, 2016 at 2.30pm with ambient temperature of 33℃

International Journal of Scientific and Research Publications, Volume 7, Issue 4, April 2017 190 ISSN 2250-3153
www.ijsrp.org
It can be seen that in all the graphs that the curve with mirror is always above the one without mirror. In the above figures (1-8) simulation curves closely matched the experimental curves indicating minimal errors in the experimental measurement.
Table 4.1 Values obtained from experiment at M-Block Hostel (Latitude11.9832N, Long8.4768E)
Date Experiment Time of the day Efficiency (without mirror)%
Efficiency (with mirror)%
𝑐𝑐ℎ𝑠𝑠𝑛𝑛𝑎𝑎𝑒𝑒 𝑠𝑠𝑛𝑛 efficiency%
30/08/2016 I 3.30pm 14.44 17.68 3.24 30/08/2016 II 1.30pm 13.33 18.41 5.08 29/08/2016 III 3.30pm 14.95 18.83 3.88 30/08/2016 IV 2.30pm 15.87 19...85 4.18 01/09/2016 V 9.30am 14.92 18.46 3.54
V. CONCLUSION We found the use of plane mirror as concentrator improved the performance of photovoltaic module. The increase in performance recorded with mirror as the Reflector for the five experiment was 20.4W. In all the above figures, the simulated curves are found to closely fit the experimental ones indicating minimal errors in the experiment. The addition of the mirror can be seen to bring additional solar radiation of about 305.6 W𝑘𝑘−2. Since the performance of PV module increase with increase in the solar insolation, the use of plane mirror can also bring increase in the PV module performance .Thus the effect of dust, snow, shade and irradiance fluctuation could be reduced with the use of plane mirror as reflector.
REFERENCES [1] O. S. Ohunakin, M. S. Adaramola, O. M. Oyewola, and R. O. Fagbenle, “Solar energy applications and development in Nigeria: Drivers and barriers,” Renew.
Sustain. Energy Rev., vol. 32, pp. 294–301, 2014. [2] K. H. Solangi, T. N. W. Lwin, N. A. Rahim, M. S. Hossain, R. Saidur, and H. Fayaz, “Development of solar energy and present policies in Malaysia,” in 2011
IEEE 1st Conference on Clean Energy and Technology, CET 2011, 2011, pp. 115–120. [3] V. Kumar, R. L. Shrivastava, and S. P. Untawale, “Solar Energy: Review of Potential Green & Clean Energy for Coastal and Offshore Applications,” Aquat.
Procedia, vol. 4, no. Icwrcoe, pp. 473–480, 2015. [4] K. Kalyanasundaram, “Photochemical energy conversion,” in Photochemistry: Volume 39, vol. 39, 2011, pp. 112–190. [5] K. M. Gangotri and M. K. Bhimwal, “The photochemical conversion of solar energy into electrical energy: Eosin-fructose system,” Environ. Prog. Sustain.
Energy, vol. 30, no. 3, pp. 493–499, 2011. [6] A. Malviya and P. P. Solanki, “Photogalvanics: A sustainable and promising device for solar energy conversion and storage,” Renewable and Sustainable Energy
Reviews, vol. 59. pp. 662–691, 2016. [7] M. Jamal, “Shading Effect in Solar Energy and Solar Cell,” Int. Adv. Res. J. Sci. Eng. Technol., vol. 3, no. 2, 2016. [8] M. S. Abd-Elhady, M. M. Fouad, and T. Khalil, “Improving the efficiency of photovoltaic (PV) panels by oil coating,” Energy Convers. Manag., vol. 115, pp. 1–
7, 2016. [9] M. J. Adinoyi and S. A. M. Said, “Effect of dust accumulation on the power outputs of solar photovoltaic modules,” Renew. Energy, vol. 60, pp. 633–636, 2013. [10] D. Bechki, H. Bouguettaia, J. Blanco-Galvez, S. Babay, B. Bouchekima, S. Boughali, and H. Mahcene, “Effect of partial intermittent shading on the performance
of a simple basin solar still in south Algeria,” Desalination, vol. 260, no. 1–3, pp. 65–69, 2010. [11] C. G. Popovici, S. V. Hudişteanu, T. D. Mateescu, and N.-C. Cherecheş, “Efficiency Improvement of Photovoltaic Panels by Using Air Cooled Heat Sinks,”
Energy Procedia, vol. 85, pp. 425–432, 2016. [12] S. Odeh and M. Behnia, “Improving Photovoltaic Module Efficiency Using Water Cooling,” Heat Transf. Eng., vol. 30, no. 6, pp. 499–505, 2009. [13] A. Rao, R. Pillai, M. Mani, and P. Ramamurthy, “Influence of dust deposition on photovoltaic panel performance,” in Energy Procedia, 2014, vol. 54, pp. 690–
700. [14] K. Narasimman and I. Selvarasan, “Design construction and analysis of solar ridge concentrator photovoltaic (PV) system to improve battery charging
performance,” Ecotoxicol. Environ. Saf., vol. 127, pp. 187–192, 2016. [15] E. Hossain, R. Muhida, and A. Ali, “Efficiency improvement of solar cell using compound parabolic concentrator and sun tracking system,” in 2008 IEEE
Electrical Power and Energy Conference - Energy Innovation, 2008. [16] J. Rizk and M. Nagrial, “Impact of Reflectors on Solar Energy Systems,” Technology, pp. 563–567, 2009. [17] G. M. Masters, Renewable and Efficient Electric Power Systems. 2004. [18] R. P. Vengatesh and S. E. Rajan, “Investigation of cloudless solar radiation with PV module employing Matlab-Simulink,” Sol. Energy, vol. 85, no. 9, pp. 1727–
1734, 2011.
AUTHORS First Author – ALIYU ABUBAKAR, Department of physics ,Bayero University Kano, Nigeria, [email protected] Second Author – M.H ALI, Department of physics ,Bayero University Kano, Nigeria, [email protected]

International Journal of Scientific and Research Publications, Volume 7, Issue 4, April 2017 191 ISSN 2250-3153
www.ijsrp.org
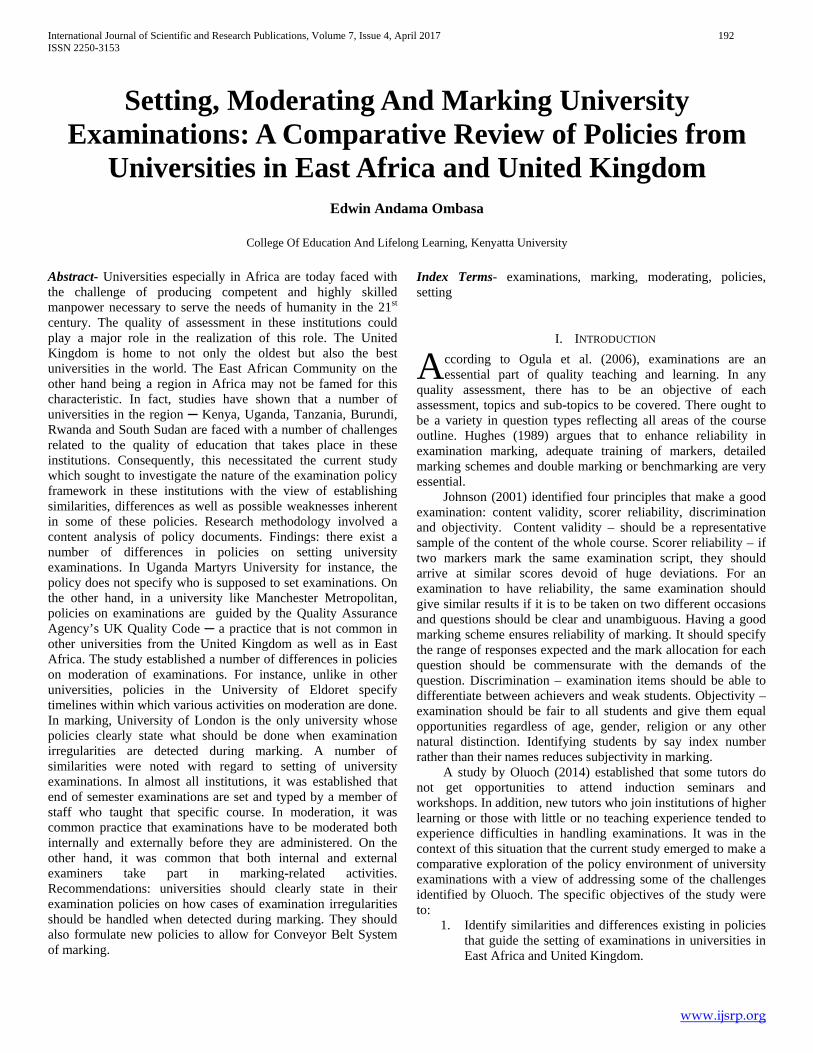
International Journal of Scientific and Research Publications, Volume 7, Issue 4, April 2017 192 ISSN 2250-3153
www.ijsrp.org
Setting, Moderating And Marking University Examinations: A Comparative Review of Policies from
Universities in East Africa and United Kingdom Edwin Andama Ombasa
College Of Education And Lifelong Learning, Kenyatta University
Abstract- Universities especially in Africa are today faced with the challenge of producing competent and highly skilled manpower necessary to serve the needs of humanity in the 21st century. The quality of assessment in these institutions could play a major role in the realization of this role. The United Kingdom is home to not only the oldest but also the best universities in the world. The East African Community on the other hand being a region in Africa may not be famed for this characteristic. In fact, studies have shown that a number of universities in the region ─ Kenya, Uganda, Tanzania, Burundi, Rwanda and South Sudan are faced with a number of challenges related to the quality of education that takes place in these institutions. Consequently, this necessitated the current study which sought to investigate the nature of the examination policy framework in these institutions with the view of establishing similarities, differences as well as possible weaknesses inherent in some of these policies. Research methodology involved a content analysis of policy documents. Findings: there exist a number of differences in policies on setting university examinations. In Uganda Martyrs University for instance, the policy does not specify who is supposed to set examinations. On the other hand, in a university like Manchester Metropolitan, policies on examinations are guided by the Quality Assurance Agency’s UK Quality Code ─ a practice that is not common in other universities from the United Kingdom as well as in East Africa. The study established a number of differences in policies on moderation of examinations. For instance, unlike in other universities, policies in the University of Eldoret specify timelines within which various activities on moderation are done. In marking, University of London is the only university whose policies clearly state what should be done when examination irregularities are detected during marking. A number of similarities were noted with regard to setting of university examinations. In almost all institutions, it was established that end of semester examinations are set and typed by a member of staff who taught that specific course. In moderation, it was common practice that examinations have to be moderated both internally and externally before they are administered. On the other hand, it was common that both internal and external examiners take part in marking-related activities. Recommendations: universities should clearly state in their examination policies on how cases of examination irregularities should be handled when detected during marking. They should also formulate new policies to allow for Conveyor Belt System of marking.
Index Terms- examinations, marking, moderating, policies, setting
I. INTRODUCTION ccording to Ogula et al. (2006), examinations are an essential part of quality teaching and learning. In any
quality assessment, there has to be an objective of each assessment, topics and sub-topics to be covered. There ought to be a variety in question types reflecting all areas of the course outline. Hughes (1989) argues that to enhance reliability in examination marking, adequate training of markers, detailed marking schemes and double marking or benchmarking are very essential. Johnson (2001) identified four principles that make a good examination: content validity, scorer reliability, discrimination and objectivity. Content validity – should be a representative sample of the content of the whole course. Scorer reliability – if two markers mark the same examination script, they should arrive at similar scores devoid of huge deviations. For an examination to have reliability, the same examination should give similar results if it is to be taken on two different occasions and questions should be clear and unambiguous. Having a good marking scheme ensures reliability of marking. It should specify the range of responses expected and the mark allocation for each question should be commensurate with the demands of the question. Discrimination – examination items should be able to differentiate between achievers and weak students. Objectivity – examination should be fair to all students and give them equal opportunities regardless of age, gender, religion or any other natural distinction. Identifying students by say index number rather than their names reduces subjectivity in marking. A study by Oluoch (2014) established that some tutors do not get opportunities to attend induction seminars and workshops. In addition, new tutors who join institutions of higher learning or those with little or no teaching experience tended to experience difficulties in handling examinations. It was in the context of this situation that the current study emerged to make a comparative exploration of the policy environment of university examinations with a view of addressing some of the challenges identified by Oluoch. The specific objectives of the study were to:
1. Identify similarities and differences existing in policies that guide the setting of examinations in universities in East Africa and United Kingdom.
A
International Journal of Scientific and Research Publications, Volume 7, Issue 4, April 2017 193 ISSN 2250-3153
www.ijsrp.org
2. Identify similarities and differences existing in policies that guide the moderation of examinations in universities in East Africa and United Kingdom.
3. Identify similarities and differences existing in policies that guide the marking of examinations in universities in East Africa and United Kingdom.
II. SETTING OF UNIVERSITY EXAMINATIONS This is the process of preparing questions to be used in assessing content learnt (Ogula et al., 2006). Ogula is of the view that it is common that academic staffs are responsible for producing their own examinations together with their marking schemes and thereafter send copies of these to external examiners for moderation. Ogula goes ahead to say that examination papers and marking schemes should be set, internally moderated, vetted by the external examiner, printed and proof read at the appropriate time. In producing quality examinations, if an examiner wants to use color in their questions, they should make sure that this does not disadvantage color blind students. They should also ensure that their choice of question style avoids an excessively high standard deviation in the students’ marks. This generally results from papers where hard-working but weaker students can find nothing to answer. They should set questions where weaker students can do at least part of the question. When doing this, examiners should try to make their questions coherent and progressive, rather than a sequence of disjointed and unrelated parts. Besides, they should ensure that questions are not all directly lifted from classroom notes. When setting examinations, the setter should give guidance to the students by asking themselves these questions: do students understand what is expected of them in the examination? Do they understand the level of detail and accuracy required in a good answer? Do they know the format or areas to be tested? On the other hand, Ogula et al., (2006) says that given that members of university academic staff write their own examination papers, it is vital that they proof-read their examination questions carefully to ensure that there are no errors. According to Bloom (1994), quality examinations should incorporate Bloom’s six cognitive domains of knowledge: knowledge ─ ability to remember facts, terms and basic concepts without necessarily understanding what they mean; comprehension ─ ability to demonstrate understanding of facts and ideas by organizing, comparing, interpreting and describing the main ideas; application ─ ability to use acquired knowledge to solve practical problems in new situations; analysis ─ ability to examine and break information into component parts, determining how the parts relate to one another, identifying motives or causes and making inferences and find evidence to support generalizations; synthesis ─ ability to build a structure or pattern from diverse elements and putting parts together to form a whole; evaluation ─ ability to present and defend opinions by making judgments about information, validity of ideas or quality of work based on a set of criteria.
III. MODERATION OF UNIVERSITY EXAMINATIONS Moderation is the process of ensuring that assessments are marked in an academically rigorous manner with reference to agreed marking criteria (Hughes, 1989). Universities accept variety in moderation practices by recognizing the varying demands of different disciplines and the different requirements of various types of assessed material. Hughes argues that Colleges should choose the most appropriate practices for their programs from models of moderation using agreed criteria. Good moderation practices should: seek to ensure accuracy and fairness; be appropriate and acceptable to the discipline being taught; be suitable to the material being assessed; be suitable to the means of assessment being used; and be clearly evidenced in the feedback provided to students. In most universities, moderation policies apply to all aspects of student assessment that contribute to the award or final classification of an award, including: conventional examinations, formally assessed coursework such as projects or dissertations and laboratory or any other practical work (Johnson, 2001). According to Johnson (2001), there exist a variety of models of moderation. Examples are: universal double blind marking ─ the first marker makes no notes of any kind on the work being marked and the second marker examines the work directed by independent judgment. Later, both examiners award marks and make comparisons; universal non-blind double marking ─ the first marker provides feedback for the student on the assessment and the second marker assesses the work with this information known but without accessing marks awarded by the first marker; moderation of the entire cohort as check or audit ─ the first marker provides feedback for the student and awards a mark; moderation by sampling of the cohort ─ the second marker samples work already first marked with feedback for students and marks attached, in order to check overall standards; partial moderation ─ any of the above may be applied to particular types such as fails, firsts or borderlines.
IV. MARKING OF UNIVERSITY EXAMINATIONS Ogula et al., (2006) defines marking as the process of judging the correctness of a student’s academic work based on a specified criterion. Marking criteria have categories such as from 70 % to 100 %, from 60 % to 69 %, from 0 % to 39 % and so on. Marking advice is usually made available to markers in relation to all forms of assessment used within Schools or Departments. In pursuit of assessment practices that are fair, valid and reliable universities apply double-marking (preferably “blind” where the first mark is not made known to the second marker). Besides this, for formal written examinations most universities operate anonymous marking system. CASE 1: UGANDA MARTYS UNIVERSITY This is a private university located in Nkozi town, Uganda. It was established in 1993 by the Roman Catholic Church in Uganda. By 2014, the university had a population of slightly over 5, 000 students and over 400 administrative staff. The university operates a total of nine campuses among them the main campus in Nkozi, Lira, Mbarara and Mbale campus. It was randomly sampled because it is located in one of the countries of

International Journal of Scientific and Research Publications, Volume 7, Issue 4, April 2017 194 ISSN 2250-3153
www.ijsrp.org
East Africa ─ Kenya, Uganda, Tanzania, South Sudan, Rwanda and Burundi. The following section highlights the policies that guide examination processes in this university. Setting of examinations
1. Quality assurance mechanisms for determining student assessments, both continuous and final shall be developed.
Moderation of examinations 1. Uganda Martyrs University shall establish a systematic
mechanism for the internal and external moderation of examinations. Guides for examinations and coursework moderation and external examiners shall be developed and followed accordingly.
2. In the absence of external examiners, departments shall develop systems that are coherent with the quality assurance framework approved by University Senate. These shall include a minimum of internal moderation procedures that ensure validity of student assessment and reliability of marking and a maximum of external examination.
2. Moderators shall be required to be academically competent in the field they are called upon to moderate. Their primary concern according to the policy is to check the accuracy of the examination papers, their suitability and relevance for the level for which they are intended to be addressed.
Duties of moderators before examinations are done (pre-examination period):
i. Moderating all examination questions, paying attention to language use and spelling.
ii. Moderating the marking scheme with regard to and allocation of marks and scoring criteria.
iii. Moderating the general instructions on the front cover of the question paper.
iv. Ensuring that there is a balance between time allocated for the paper in relation to the questions and marks allocated.
v. Ensuring that special tables, formulae and other technical documents accompanying the question paper are available.
vi. Editing and suggesting improvements to the questions in collaboration with the examiners.
Duties of moderators during examinations:
i. They shall be available to attend to any query from candidates in case the examiner is not around for whatsoever reason as well as provide any assistance as may be required.
Duties of moderators after examinations are done (post exam period): After all examination scripts have been marked, the moderator shall:
i. Check if the marking scheme/indicative marking criteria has been strictly followed.
ii. Check if all questions are properly marked and marks entered on the performance sheet.
iii. Check the accuracy of all totals. iv. Report to the Administrative Officer in charge of
examinations through the Dean/Director on any anomalies noted.
Marking of examinations 1. Uganda Martyrs University shall establish a Board of
Examiners consisting of internal and external examiners for each program on offer. The Board of Examiners shall determine whether a candidate has successfully completed or failed an examination on the basis of the set pass mark.
CASE 2: UNIVERSITY OF ELDORET This is a public university situated in Eldoret town, Kenya. The university was founded in 1946 by white settlers as a large scale farmers’ training center before becoming a fully fledged university in 2013. Currently it has over 33, 000 students pursuing various programs. It was sampled purposefully because it is one of the many universities that have acquired charters recently and therefore one of the growing academic institutions in the country. The following section highlights the policies that guide examination processes in this university. Setting of examinations
1. University of Eldoret examinations in collaborating institutions shall be set, invigilated, marked, moderated and released by the relevant schools.
2. Setting and typing shall be done by the course lecturer (internal examiner).
3. Lecturers responsible for a course shall set questions for regular, supplementary and special examinations and prepare marking schemes within the first four weeks of the semester.
Moderation of examinations 1. Departmental Board of Examiners consisting of the
Dean of School, Head of Department, Examination Coordinator and Timetable Coordinator shall moderate papers internally before sending them to External Examiners.
2. A copy of the question papers with marking schemes and course outlines shall be sent to External Examiners for moderation.
3. Heads of Departments shall ensure that comments from External Examiners are discussed and incorporated into the question paper by Internal Examiners.
4. The Principal Internal Examiner or Head of Department shall send copies of moderated examinations to the registrar in charge of academic affairs for reproduction and safe custody five weeks before the start of regular examinations.
5. All copies of draft examination papers except the moderated ones shall be destroyed by shredding.
Marking of examinations 1. Internal Examiners shall mark and enter Continuous
Assessment Tests (CATs) as well as regular examination marks and submit them to the Principal Internal Examiner six weeks from the last day of the semester examinations.

International Journal of Scientific and Research Publications, Volume 7, Issue 4, April 2017 195 ISSN 2250-3153
www.ijsrp.org
2. All the examination individual mark sheets shall be accurately completed, checked and signed by the internal examiner, the Head of Department and the Dean of the School.
3. Examiners shall not divulge marks to candidates. 4. Internal examiners shall mark scripts on a semester
basis and release examination results to the Head of Department within a period of two weeks after the end of the examinations.
5. The Head of Department shall forward examination results to the respective Deans who shall relay provisional results to senate for consideration and approval. Senate shall accept, vary or modify provisional examination results presented to it.
6. After release of provisional results, a candidate may appeal for remarking within a period of two weeks through the Dean of School and a copy sent to the Deputy Vice Chancellor in charge of academics giving reasons thereof.
7. A fee of five hundred Kenya shillings per paper shall be paid for remarking.
8. The Dean, in consultation with the Head of Department, shall nominate an independent examiner who had not taught or examined the candidate in that particular course to remark the scripts and forward marks to the Chairperson of Senate for consideration through the Deputy Vice Chancellor in charge of academic affairs.
CASE 3: ST. JOHN’S UNIVERSITY The university is private and it was established in 2007 by the Anglican Church of Tanzania. It is located in Dodoma city, Tanzania. The university has a population of over 4, 500 students. It was sampled randomly to represent universities in Tanzania. The following section highlights the policies that guide examination processes in this university. Setting of examinations
1. The process of examining shall be done under maximum confidentiality and integrity. The staff member setting the examination papers shall be responsible for the security of the papers.
2. Two papers shall be set for each course. One will be randomly chosen by the Head of Department for use in the university examination. The one not used for the first sitting shall be used for any supplementary and or special examination that shall be offered.
3. All examinations shall be set by a member of the academic staff who coordinated the course or by the Head of Department.
4. An external examiner shall be a reliable person competent in the subject area and not an employee of St. John’s University.
5. External examiners shall be appointed by the Dean of School, Director of Institute or Center, subject to approval by senate.
Moderation of examinations
1. All examinations shall be internally moderated in the presence of the staff member responsible for the paper or by at least one appropriate senior member of staff.
2. The final version of examination questions and the authorized syllabus shall be moderated by the External Examiner in the second semester of every academic year during the process of moderating the marking.
3. All examinations set by internal examiners shall be externally moderated in second semester of every academic year.
Marking of examinations
1. All tests, assignments, semester papers and other forms of assessment done during the semester shall be marked before examination week by the internal examiners.
2. Marking of all examinations and the compilation of results shall be done by internal examiners in accordance with a time schedule given by the Deputy Vice Chancellor in charge of academic affairs.
CASE 4: MANCHESTER METROPOLITAN UNIVERSITY This is a public university located in Manchester city, United Kingdom. The university was established in 1970 as a polytechnic before gaining university status in 1992. By 2016, it had a population of 32, 485 students, hence making it the fifth largest university in UK by student numbers. This was the main reason why it was purposefully sampled for the study. The following section highlights the policies that guide examination processes in this university. Setting of examinations Policies on university examinations are developed in line with the Quality Assurance Agency’s UK Quality Code.
1. Assignment briefs shall be verified before being given to students. This verification shall consider the consistency of the assignment task in relation to other units at the same level in the same discipline, check that the learning outcomes will be fully addressed by the task and that the marking criteria conforms to those in the program specification and that the feedback strategy fits with the program and the university’s policy.
2. This internal verification shall be done by a member of staff who does not directly contribute to that particular assessment.
3. External verification shall be done by the subject’s external examiner. This examiner shall look at a sample of assignment briefs which is sufficient to confirm the currency, appropriateness and standards shown by the brief.
Moderation of examinations Internal moderation of marking:
1. It shall involve a review of a sample of marks and comments on assignment tasks to ensure that marking criteria have were fairly, accurately and consistently applied during first marking.
2. It shall be done by colleagues from the discipline.

International Journal of Scientific and Research Publications, Volume 7, Issue 4, April 2017 196 ISSN 2250-3153
www.ijsrp.org
3. Moderation may begin before all of the work for a cohort has been assessed, provided that a reasonable sample is available which represents a range of marks and if possible, markers.
External moderation of marking: 1. External moderators shall do a review of a sample of
marked and submitted work by the appointed external examiner for the program or subject.
2. External examiners shall not be involved in the determination of marks for individual students but rather provide the program team with an external, independent overview of their marking processes and the fairness and effectiveness of these processes.
Marking of examinations Since examination scripts are not routinely shared with students, the marker does not need to write detailed feedback on the scripts except insofar as it may help with showing how marking decisions were made. Besides this, the marker shall initial each page to indicate that it has been marked, and to initial the final mark box to indicate that it has been checked.
1. First marking First marking shall involve judging student responses against the criteria in the assignment brief. Marking of examinations shall be routinely made anonymous.
2. Second marking It shall be required for assignment tasks which exceed 30 credits in value and recommended for 4 others. Second marking shall take any of these three forms: Independent marking – where the second marker marks the assignment exactly as it was submitted, with no comments appended by the first marker and no access to the marking and feedback comments provided by the first marker; Team marking ─ where two or more markers work together in making judgments and providing feedback on submitted work; Seen marking – when the second marker marks the assignment with access to the marks and feedback provided by the first marker.
3. Third marking Third marking shall be considered when second marking results in a significant difference between marks awarded by the two markers and the markers are unable to agree on a final mark. It shall be necessary to consult with external markers at this point but external examiners shall not act as second or third markers. Their role shall only be limited to moderation of the process. CASE 5: UNIVERSITY of LONDON INTERNATIONAL ACADEMY The university is located in London city, England. It is a public university with a population of over 54, 000 students spread out in over 180 countries. It was established in 1858. Its affiliated institutions of higher learning include Kings’ College London, London School of Economics, UCL Institute of Education and Heythrop College. It was sampled purposefully because it is one of the oldest universities in not only UK but also the world, and therefore an institution with stable systems. Besides this, the researcher chose it because it offers its programs internationally. The following section highlights the policies that guide examination processes in this university.
Setting of examinations 1. Internal Examiners shall participate in setting
examinations and shall be expected to attend any meetings of the Examination Board held to determine the outcome of examinations.
2. External and intercollegiate Examiners shall be invited to participate in the setting of examinations.
3. Every examination paper shall be approved by at least one external or Intercollegiate Examiner.
Moderation of examinations 1. External Examiners shall be appointed to take part in
moderation of examination scripts. Marking of examinations
1. Every examination script shall be marked by at least 2 examiners or by one assessor and one examiner, who shall thereafter prepare an agreed list of marks.
2. The Chair of the Board of Examiners shall assign examiners into pairs for the purpose of double marking and shall ensure that the performance of pairs of Examiners is monitored by the Board.
3. Where both first and second marks are known to examiners, they must report to a Chief Examiner or chair on any significant difference which can’t be resolved with the other marker.
4. Associate Examiners shall be qualified and experienced colleagues who shall not be employees of the University and shall be appointed to mark examinations in line with university policy.
5. Assistant Examiners shall be appointed to assist in marking scripts where there are large numbers of candidates.
6. The University and all Examiners shall be required to comply with the Data Protection Act of 1998 which establishes legal rights for individuals with regard to the processing of their personal data, including examination results.
7. Examiners shall be vigilant in their assessment of all elements of the examination for instance irregularities (collusion , impersonation or presentation of unauthorized material) and shall refer it to the Senior Assessment Manager in charge of examinations.
8. Examiners shall be responsible for agreeing the final mark of each element of assessment and ensuring the correct recording of marks on all scripts and mark sheets presented to the university.
9. Where there is divergence of opinion between examiners and in the mark awarded by each, Examiners shall be required to display how those differences were resolved.
10. Examiners shall ensure the confidentiality of candidates by making reference to the candidate number only in all documentation.
11. External/Intercollegiate Examiners shall inspect all scripts and other examination-related materials to be able to assess whether marking and classification are of an appropriate standard and consistent. This shall include: a sample of scripts from the top, middle and at the bottom of the range.

International Journal of Scientific and Research Publications, Volume 7, Issue 4, April 2017 197 ISSN 2250-3153
www.ijsrp.org
12. On illegible examination scripts: If an examination script is illegible or incomprehensible by the markers, the following procedure shall be followed: i. If the first pair of markers is unable to understand
the relevant text, it will be referred through the Chair of the Board of Examiners to a second set of markers.
ii. If the second pair of markers is unavailable, the Chair of the Board of Examiners shall refer the script to an External or Intercollegiate Examiner.
iii. If the second pair of markers (or External/Intercollegiate Examiner) is also unable to read the text, a mark of zero shall be awarded for those parts.
iv. If a candidate is awarded a zero mark on the above basis, the candidate shall be notified of the reason for the zero mark upon release of examination results.
CASE 6: UNIVERSITY of ST. ANDREWS The University of St. Andrews is a British public research university founded in 1410. Currently, it has a population of over 10, 745 students, 1, 059 academic staff and 1, 480 administrative staff. It is located in St. Andrews, Fife, Scotland, United Kingdom. The university is made up from a variety of institutions, including three constituent colleges ─ United College, St. Mary’s College and St. Leonard’s College and 18 academic schools organized into 4 faculties. Students are from over 120 nationalities. The institution was sampled purposefully because one, it is an institution with a long history of existence and two because it offers it has an international presence. The following section highlights the policies that guide examination processes in this university. Setting of examinations
1. Assessment shall be made up of students’ abilities in the various modules that they take. It shall take place against published criteria that are appropriate for the work in hand and must reflect what modules and programs at specific levels intend to deliver.
2. Standard setting shall not involve relative (norm-referenced) methodology that requires the fitting of marks to predetermined, normally distributed, grade curve such that a fixed proportion of students achieve certain grades.
3. For more qualitative works such as essays, the normal standard setting methodology is that every student’s work is assessed individually using criterion referenced standards e.g. marking schemes.
4. In some disciplines such as Medicine where assessments are likely to vary in difficulty, procedures which take cognizance of the degree of difficulty may be used for instance the Bute Medical School. It ensures consistency of results between different forms of assessment and between different modules and requires that specific levels of competency be shown in order to pass a test.
5. External examiners and Deans shall play a critical role in standard setting. They shall play a role in approving examination questions.
Moderation of examinations
1. In moderation, a sample of scripts shall be second marked and the moderator either endorses the first marker’s evaluation or suggests changes.
2. Moderation shall be carried out by suitably qualified members of staff who shall scrutinize a sample of marked work. The moderator shall see samples of work in each assessment banding, including fails, plus any contentious, borderline or undecided marks.
3. Following moderation (or second/double marking), a discussion shall take place between the examiner and moderator, which may lead to some adjustment of the original marks.
4. Where a module is to be marked by a single member of staff, a significant element of the assessed work must be moderated internally.
5. University policy does not require that an External Examiner always reviews examination scripts but he/she shall be invited to moderate a mix up of course work and examinations across the year thought their term in office.
Marking of examinations
1. A student’s final module grade shall not be awarded on the basis of a single individual’s assessment of all elements. In extraordinary cases where this occurs, it shall be communicated to the External Examiner and the relevant Deans.
2. In blind double marking, two markers shall attribute a mark and a full set of comments to a script without conferring during the initial marking process.
3. In second marking, the second marker shall produce his or her mark and comments having seen the annotations and comments of the first marker.
4. Systematic double marking and second marking of all assessed work are not a requirement of the University policy but some Schools may choose to adopt these practices.
5. Postgraduate students, inexperienced markers and all members of staff who are new to St. Andrews shall always be supported through second marking or moderation by more experienced colleagues until they are completely familiar with the relevant practices.
6. External Examiners shall not act as markers, but shall be asked to routinely review examinations on a rolling schedule. Such a schedule shall ensure that some assessed work from each element of a school’s programs is seen by an External Examiner at least once every 3 to 4 years.
V. RESEARCH DESIGN AND METHODOLOGY The study adopted a descriptive survey methodology. According to Orodho (2009) a descriptive survey design is a method of gathering data from respondents under settings which

International Journal of Scientific and Research Publications, Volume 7, Issue 4, April 2017 198 ISSN 2250-3153
www.ijsrp.org
have not been controlled or manipulated in any way. This design was suitable for the study since the researcher aimed at gathering data by analyzing policy documents without manipulating any variables by carrying out experiments. The researcher sampled a total of 6 universities through purposive and simple random sampling techniques. Out of these, three were from the East African region (1 public and 2 private) and the other three were from the United Kingdom (both public). Data collection involved doing a document analysis of policy documents that touch on university examinations. This analysis was based on the study objectives and it mainly focused on
establishing similarities and differences with regard to setting, moderating and marking of examinations in these institutions.
VI. FINDINGS This section presents the study findings along three main themes: setting, moderating and marking of university examinations. In each of these themes, policy similarities and differences were identified.
Differences observed in policies on setting university examinations
UNIVERSITY DIFFERENCES IN POLICIES ON SETTING EXAMINATIONS Uganda Martyrs University Policy does not specify who is supposed to set examinations. Manchester Metropolitan University
Policies on setting examinations are developed according to the Quality Assurance Agency’s UK Quality Code.
An academic staff member from the department who didn’t teach the course being assessed is the one who sets the examination.
University of Eldoret Timelines on setting examinations and preparing marking schemes are specified ─ within the first 4 weeks of the semester.
Examinations in the main university and all collaborating institutions are set by the relevant schools.
St. Johns’ University Two papers are usually set for every course whereby one is randomly selected by the Head of Department to be used for regular examination whereas the other is used for any supplementary or special examination that shall be offered.
University of London Internal and Intercollegiate Examiners collaborate to set common examinations. University of St. Andrews Standard setting doesn’t involve norm-referenced methodology that requires
performance to assume a normal curve. In some disciplines such as medicine, procedures which take cognizance of the degree of
difficulty may be used e.g. The Bute Medical School.
Table 1: Differences in policies on setting examinations
VII. DISCUSSION As presented above, there exist a number of differences in policies on setting university examinations. In Uganda Martyrs University for instance, the policy does not specify who is supposed to set examinations. On the other hand, in a university like Manchester Metropolitan, policies on examinations are guided by the Quality Assurance Agency’s UK Quality Code ─ a practice that is not common in universities from the United Kingdom as well as in East Africa. University of Eldoret policies seem to be clearer on timelines for doing various procedures related with setting examinations ─ something that lacks in other
universities. In Tanzania’s St. Johns’ University, whenever examinations are set policy requires that two different papers be set whereby one is subsequently used for regular exams and the other used for any special or supplementary exams that may be on offer. Apart from University of London, policies in the other universities do not specify if internal and intercollegiate examiners in any way collaborate when they set common university examinations. The study also established that it was only in University of St. Andrews whereby in some disciplines such as Medicine, procedures which take cognizance of the degree of difficulty are used such as the Bute Medical School.
Differences observed in policies on moderating university examinations
UNIVERSITY DIFFERENCES IN POLICIES ON MODERATING EXAMINATIONS Uganda Martyrs University In the absence of external examiners, departments are allowed to develop systems that
are coherent with the quality assurance framework approved by university Senate. The role of moderators is three fold: before examinations are done, during examinations
and after examinations are done. Before examinations, they moderate examination questions, the marking scheme, instructions etc. During examinations they are required to be there and provide any necessary assistance to students. After examinations, they check if the marking scheme is being followed by markers and accuracy of tallies.

International Journal of Scientific and Research Publications, Volume 7, Issue 4, April 2017 199 ISSN 2250-3153
www.ijsrp.org
Manchester Metropolitan University
No major differences noted.
University of Eldoret Timelines within which to send copies of moderated papers to the registrar in charge of academics are specified ─ 5 weeks before the start of regular examinations.
All copies of examination papers except the moderated ones are destroyed by shredding. St. Johns’ University Moderation of papers set to be done can take place in the presence of the course lecturer
or any other appropriate senior member of staff. Examination questions and the authorized syllabus are moderated by External Examiners
in the second semester of every academic year during moderation of marking. Examinations set by internal examiners are moderated internally in the second semester
of every academic year. University of London No major differences noted. University of St. Andrews Where a module is to be marked by a single member of staff, a significant portion of the
assessed work must be moderated internally.
Table 2: Differences in policies on moderating examinations Discussion The study established a number of differences in policies on moderation of examinations. In Uganda Martyrs University, the study found out that the role of moderators extends from the pre-examination period to the post-examination period. Unlike in other universities, policies in the University of Eldoret specify timelines within which various activities on moderation are done.
In St. John’s University, moderation is usually done in the second semester of every academic year. This is not observed in other universities. It was only in St. Andrews that the policy requires that a significant proportion of a student’s work be moderated internally where a module is marked by a single member of staff.
Differences observed in policies on marking university examinations
UNIVERSITY DIFFERENCES IN POLICIES ON MARKING EXAMINATIONS Uganda Martyrs University No major differences noted. Manchester Metropolitan University
Markers are not supposed to write feedback on scripts especially if it doesn’t help with showing how marking decisions were arrived at.
University policy allows for first, second and even third marking. Second marking is required for assignment tasks which exceed 30 credits whereas third marking is considered when second marking results in significant differences between marks awarded by the two markers.
University of Eldoret Timelines within which internal examiners are supposed to submit marks to the Principal Internal Examiner are clearly specified ─ 6 weeks from the last day of the semester examinations.
Examiners are not allowed to divulge marks to candidates. Timelines within which Internal Examiners are supposed to mark and submit marks for
end of semester examinations are specified ─ 2 weeks after the end of the examination period.
After release of examinations, a candidate can appeal for remarking within 2 weeks. A fee of 500 Kenya shillings per paper must be paid by the student before remarking is
done. St. Johns’ University All tests and other forms of assessment done during the semester are marked before
examination week. Marking of examinations and compilation of results by internal examiners is done in
accordance with a time schedule given by the Deputy Vice Chancellor in charge of academic affairs.
University of London Every examination script is marked by at least 2 examiners. Chair of Board of Examiners assigns examiners into pairs for double marking. Associate examiners are allowed to mark live scripts. Assistant examiners are appointed to assist in marking scripts where there are large
numbers of candidates. Examiners are required to comply with the Data Protection ACT of 1998 which
establishes legal rights for individuals with regard to the processing of their personal data.

International Journal of Scientific and Research Publications, Volume 7, Issue 4, April 2017 200 ISSN 2250-3153
www.ijsrp.org
Instances of examination irregularities are reported to the Senior Assessment Manager in charge of examinations.
Only candidates’ numbers are used to in all examination-related documentation. Where there are illegible scripts, two different pairs of examiners mark it. In case the
second pair is not able to read, a mark of zero is awarded for those parts. University of St. Andrews Postgraduate students are allowed to mark examinations provided that they are closely
guided by experienced colleagues. Systematic double marking and second marking are not a requirement of university
policy but discretion of respective Schools. A single examiner cannot mark a candidate’s entire work, unless in extra-ordinary cases
and with prior communication to the external examiner and the relevant Deans.
Table 3: Differences in policies on marking examinations Discussion The study established that unlike in other universities, policies in University of Eldoret give timelines within which various activities associated with marking should be done. In this university also, for a student to be considered for remarking, they must pay a fee of 500 Kenya shillings per paper. However, this was not a policy requirement in the other universities. The University of London is the only university whose policies on marking clearly state what should be done when examination irregularities such as plagiarism, collusion and submission of unauthorized materials occur. Besides this, it was in this institution only that the policy allows two pairs of markers to mark illegible scripts. Moreover, unlike in other institutions,
examination policies allow assistant examiners to be appointed for marking in cases where there is a large candidature in a paper. It was also established that it was only in this university that examiners are required to comply with the UK Data Protection Act of 1998 which establishes legal rights for individuals with regard to the processing of personal data. In university of Manchester, the policy allows for first, second and even third marking. In University of St. Andrews, the policy allows postgraduate students to participate in marking examinations, unlike the case was in other universities. On the same note, in St. Andrews systematic double marking and second marking are not a requirement of university policy but discretion of respective Schools.
Similarities observed in policies on setting university examinations
UNIVERSITY SIMILARITIES IN POLICIES ON SETTING EXAMINATIONS Uganda Martyrs University No major similarities noted. Manchester Metropolitan University
Examinations are moderated internally by a member of staff who does not directly contribute to that particular assessment.
Examinations are moderated by external examiners before they are administered. University of Eldoret Setting and typing of examinations is done by the course lecturer (internal examiner)
who also prepares marking schemes. St. Johns’ University Examinations are set by a member of academic staff who coordinated/taught the course
or by the Head of Department. University of London Internal Examiners participate in setting examinations. University of St. Andrews For qualitative works such as essays, every student’s work is assessed individually using
criterion referenced standards e.g. marking schemes. External examiners and Deans play a critical role in standard setting by approving
examination questions. Table 4: Similarities in policies on setting examinations
Discussion A number of similarities were noted with regard to setting of university examinations. In almost all institutions, it was established that end of semester examinations are set and typed
by a member of staff who taught that specific course. Setting of other essential documents such as marking schemes was also a common policy requirement.
Similarities observed in policies on moderating university examinations
UNIVERSITY SIMILARITIES IN POLICIES ON MODERATING EXAMINATIONS Uganda Martyrs University There is both internal and external moderation of examinations.
Moderators are required to be academically competent in the field they are called upon to moderate.
The primary concern of moderators is to check the accuracy of the examination papers,

International Journal of Scientific and Research Publications, Volume 7, Issue 4, April 2017 201 ISSN 2250-3153
www.ijsrp.org
their suitability and relevance for the level for which they are intended to be addressed. Manchester Metropolitan University
Internal moderation of marking involves a review of a sample of marks and comments on assignment tasks to ensure that marking criteria are fairly, accurately and consistently applied.
Internal moderation is done by employees of the university. External examiners are not involved in the determination of marks for individual
students, but rather provide the program team with an external, independent overview of their marking processes and the fairness and effectiveness of these processes.
University of Eldoret Departmental Board of Examiners moderate papers internally before sending them to External Examiners.
Copies of examination papers with marking schemes and course outlines are sent to External Examiners for moderation.
Heads of Departments ensure that comments from External Examiners are discussed and incorporated into the examination papers by Internal Examiners.
St. Johns’ University All examinations are moderated internally. Final versions of examination questions and authorized syllabuses are moderated by
External Examiners. University of London External Examiners take part in moderation of examination scripts. University of St. Andrews In moderation, a sample of scripts is second marked and the moderator either endorses
the first marker’s evaluation or suggests changes. Internal moderation is done by suitably qualified members of staff. External Examiners review examination scripts.
Table 5: Similarities in policies on setting examinations Discussion Just like in setting, the study established that there were a number of similarities in policies on moderation of examinations. In all universities, policies require that examinations have to be moderated both internally and externally before they are administered. On the same note, policies required that other
related documents such as marking schemes and course syllabuses be moderated before marking commences. In most universities, policies recommend that external examiners should not actually mark examination scripts but rather evaluate the fairness and effectiveness of marking processes.
Similarities observed in polices on marking university examinations
UNIVERSITY SIMILARITIES IN POLICIES ON MARKING EXAMINATIONS Uganda Martyrs University Board of Examiners consisting of internal and external examiners for each program on
offer determine whether a candidate has successfully completed or failed an examination on the basis of the set pass mark after marking.
Manchester Metropolitan University
No major similarities noted.
University of Eldoret Internal and external examiners take part in marking examinations at the end of every semester.
St. Johns’ University No major similarities noted. University of London Associate Examiners (external examiners in other universities) are qualified and
experienced colleagues who are not employees of the University and who get appointed to mark examinations in line with university policy.
External Examiners inspect all scripts and other examination-related materials to assess whether marking and classification are of an appropriate standard and consistent.
University of St. Andrews External Examiners do not act as markers; their role is to routinely review examinations on a rolling schedule.
Table 6: Similarities in policies on marking
Discussion A number of similarities were noted in marking of university examinations. In all universities, both internal and external examiners are required by policy to take part in
marking-related activities. External examiners do not actually mark examination scripts but rather provide an independent overview of the fairness and effectiveness of marking processes.

International Journal of Scientific and Research Publications, Volume 7, Issue 4, April 2017 202 ISSN 2250-3153
www.ijsrp.org
VIII. RECOMMENDATIONS After a thorough analysis of various policy documents on university examinations, the researcher made a number of observations that subsequently led to the following recommendations:
i. Universities should clearly state in their examination policies on how cases of examination irregularities such as plagiarism, collusion and impersonation should be handled when detected during marking.
ii. Universities should formulate new policies to allow for Conveyor Belt System of marking.
iii. Those universities whose policy frameworks do not clearly give timelines on when various setting, moderation and marking-related activities should take place should adjust their policies to include this.
REFERENCES [1] Bloom, B., S. (1994). “Reflections on the Development and Use of the
Taxonomy”. In Rehage, Kenneth, J; Anderson, Lorin, W; Sosniak, Lauren A. Bloom’s Taxonomy: A Forty-year Retrospective. Yearbook of the National Society for the Study of Education. 93. Chicago: National Society for the Study of Education. ISSN 1744 - 7984.
[2] Hughes, A. (1989). Testing for Language Teacher. Cambridge: CUP. [3] Johnson, K. (2001) An Introduction to Foreign Language Learning and
Teaching. Longman: London.
[4] Manchester Metropolitan University ( ????). Procedures for the Verification, Marking and Moderation of Assessments. Unpublished Manuscript.
[5] Ogula, P. A., Muchoki, F., M., Dimba, M., and Machyo, C.(2006). Practical Guide to Teaching Practice for Students and Lecturers. Catholic University of Eastern Africa: Nairobi.
[6] Oluoch, E., S. (2014) Challenges Faced by Tutors in Setting Examinations. Journal of Education and Practice, 5, No. 17 p. 60 – 73.
[7] Orodho, J. A. (2009). Elements of Education and Social Science Research Methods. Maseno: Kanezja Publishers.
[8] St. John’s University of Tanzania (2013). The General University Examination Regulations for Undergraduate Programs. Unpublished Manuscript.
[9] University of St. Andrews Policy on Assessment (2009). Marking and Standard Setting. Unpublished Manuscript.
[10] Uganda Martyrs University (2013) Quality Assurance Policy. Directorate of Quality Assurance: Kampala.
[11] University of London International Academy. (2013). Guidelines for Examinations 2012 – 2013.
[12] University of Eldoret (2014). Policy Guidelines, Rules and Regulations Governing Admission and Examination of Certificate and Diploma Programs. University of Eldoret: Eldoret.
AUTHORS First Author – Edwin Andama Ombasa, Affiliation: College Of Eduction And Lifelong Learning, Kenyatta University, EMAIL: [email protected], CELL: 0710817426

International Journal of Scientific and Research Publications, Volume 7, Issue 4, April 2017 203 ISSN 2250-3153
www.ijsrp.org
MULTIPLE INTELLIGENCE ASSESSMENT BASED ON HOWARD GARDNER’S RESEARCH
MR. SREENIDHI S K, MS. TAY CHINYI HELENA
Oscar Murphy Life Strategists
Abstract-Howard Earl Gardner (born July 11, 1943 in Scranton, Pennsylvania) is an American developmental psychologist. Howard Gardner's theory of Multiple Intelligences utilizes aspects of cognitive and developmental psychology, anthropology, and sociology to explain the human intellect. The theory was introduced in 1983, with Gardner's book, Frames of Mind. Well publicised studies in Brain research, interviews with stroke victims, prodigies, and individuals with autism conducted by Howard Gardner of Harvard University, demonstrate that there are many different intelligences present in every human brain. Gardner's Theory of Multiple Intelligences states that human beingshave many different ways to learnand process information.However, it also says that these are independent of each other: leading to multiple "intelligences" as opposed to a general intelligence factor among correlated abilities. This article is based on Howard Gardner’s theory of Multiple Intelligences. According to him intelligence is located in different areas of the brain.Intelligences are inter-connected and depend on each other but can work independently if needed.Multiple Intelligences can be developed with the right nine different potential. The theory of “multiple intelligence” developed by Howard Gardner provides nine different potential pathways to learning – Language, Logical / Mathematical, Visual / Spatial -Pictures & dimensions, Bodily-Hands-on / Kinaesthetic – Action, Naturalist, Musical Harmony & Rhythm, Interpersonal - Understanding and getting along with people, Intra-personal / Self Knowledge, Metaphysical.All human beings possess all 9 intelligences in varying degrees.The 9 intelligences may operate in consort or independently from one another. To achieve an edge in learning, an individual can leverage that intelligence where he shows a strength so as to develop in the area where they may have a challenge.For instance, a person who is exceptionally skilled in music and not so in logical or mathematical intelligence can use music to learn mathematics.
Keywords- Howard Gardner, Multiple Intelligence theory, nine different potentials, develop strengths.
I. INTRODUCTION Conceptualization of intelligence Intelligence is a very broad term which can take on different meanings and has been defined in several different ways. For example, in a survey asking people to define what they meant by intelligence, respondents suggested that intelligence encompassed problem-solving ability, verbal abilities and social competence. Some others give more importance to abstract thought, capacity to learn and adjustment to environment however, to psychologists, “Intelligence is the capacity to understand the world, think rationally, and use resources effectively when faced with challenges” (Wechsler, 1974). Psychologists who studied intelligence often disagreed on the issue of intelligence being either a unitary factor or a multifaceted factor. Those who believed that intelligence was a unitary concept such as Charles Spearman (1927), supported his G-factor theory which suggests that there is a single, broad, general intelligence factor (G) that underlay performance on any cognitive task. Many others such as L. L. Thurstone (1938), Howard Gardner (1993), Guildford, Robert Sternberg (1995) and Raymond Cattell (1963) believed that intelligence had many factors contributing to it. Unfortunately, however, neither the layperson’s nor the psychologist’s conception of

International Journal of Scientific and Research Publications, Volume 7, Issue 4, April 2017 204 ISSN 2250-3153
www.ijsrp.org
intelligence is of much help when it comes to distinguishing, with any degree of precision, more intelligent people from less intelligent ones. To overcome this problem, psychologists who study intelligence have focused much of their attention on the development of intelligence tests and have relied on such tests to identify a person’s level of intelligence.
History of measuring intelligence The first person to suggest that intelligence could be quantified and measured in an objective manner was Sir Francis Galton. He believed that intelligence was inherited and hypothesized that head configuration, was related to brain size and therefore related to intelligence. However, his theories were proved wrong. Alfred Binet was later, the first to develop intelligence tests. According to him, performance could be used to distinguish more intelligent people from less intelligent ones within a particular age group. On the basis of the Binet test, children were assigned a score relating to their mental age-i.e. the average age of individuals who achieve a particular level of performance on a test. However, this did not allow adequate comparisons among people of different chronological ages. A solution to this problem came in the form of intelligence quotient, which was the term proposed by William Stern in 1912. This score takes into account an individual’s mental and chronological ages. To obtain the score, an examiner divided a student’s mental age by his/her chronological age and then multiplied this number by 100. However, it is important to note that Stanford-Binet test is now in its fourth edition where the test consists of a series of items that vary in nature according to the age of the person being tested. It is administered orally and the examiner begins by finding a mental age level at which the person is able to answer all questions correctly, and then moves on to successively more difficult problems. The test will come to an end when a mental age level is reached at which no items can be answered. An important feature of Stanford-Binet and Wechsler’s intelligence tests is that these tests required individualized one on one administration, which is relatively difficult and time consuming to administer and score them on a large scale basis. Thus, today we see a number of IQ tests that allow group administration as well, and are comparatively easier. Theoretical background After almost eighty years after intelligence tests had been developed, Howard Gardner, a Harvard Psychologist, challenged the traditional beliefs and conceptualization of intelligence. Operating on the notion that the conventional definition of intelligence was too narrow, he developed the Multiple Intelligence Theory. He defined intelligence as, “the ability to solve problems or to create products that are valued within one or more cultural settings”. Gardner felt that traditional ways of testing may be biased to certain individuals. According to him, human beings have nine different kinds of intelligence that reflect different ways in which people interact with the world. Although each individual has all nine types of intelligence, no two people possess them in the same configuration. The nine types of intelligence that Gardner referred to are Linguistic, Logical/Mathematical, Musical, Bodily-Kinesthetic, Spatial, Interpersonal, Intrapersonal, Naturalistic and Existential. Gardner wanted to define human potential by going beyond the IQ score. His theory has led to the development of intelligence tests that contain questions for which more than one answer can be correct. This provides an opportunity for the test taker to demonstrate creative thinking. These tests are based on the idea that different types of intelligence can produce different but equally valid answers to the same question.
Characteristics of the nine types of intelligence

International Journal of Scientific and Research Publications, Volume 7, Issue 4, April 2017 205 ISSN 2250-3153
www.ijsrp.org
Linguistic: The capacity to use words effectively, whether orally (e.g., as a storyteller, orator, or politician) or in writing (e.g., as a poet, playwright, editor, or journalist). This intelligence includes the ability to manipulate the syntax or structure of language, the phonology or sounds of language, the semantics or meanings of language, and the pragmatic dimensions or practical uses of language. Some of these uses include rhetoric (using language to convince others to take a specific course of action), mnemonics (using language to remember information), explanation (using language to inform), and meta-language (using language to talk about itself). Logical-mathematical: The capacity to use numbers effectively (e.g., as a mathematician, tax accountant, or statistician) and to reason well (e.g., as a scientist, computer programmer, or logician). This intelligence includes sensitivity to logical patterns and relationships, statements and propositions (if-then, cause-effect), functions, and other related abstractions. The kinds of processes used in the service of logical-mathematical intelligence include categorization, classification, inference, generalization, calculation, and hypothesis testing. Spatial: The ability to perceive the visual-spatial world accurately (e.g., as a hunter, scout, or guide) and to perform transformations upon those perceptions (e.g., as an interior decorator, architect, artist, or inventor). This intelligence involves sensitivity to color, line, shape, form, space, and the relationships that exists between these elements. It includes the capacity to visualize, to graphically represent visual or spatial ideas, and to orient oneself appropriately in a spatial matrix. Bodily-kinesthetic: Expertise in using one's whole body to express ideas and feelings (e.g., as an actor, a mime, an athlete, or a dancer) and facility in using one's hands to produce or transform things (e.g., as a craftsperson, sculptor, mechanic, or surgeon). This intelligence includes specific physical skills such as coordination, balance, dexterity, strength, flexibility, and speed, as well as proprioceptive, tactile, and haptic capacities. Musical: The capacity to perceive (e.g., as a music aficionado), discriminate (e.g., as a music critic), transform (e.g., as a composer), and express (e.g., as a performer) musical forms. This intelligence includes sensitivity to the rhythm, pitch or melody, and timbre or tone color of a musical piece. One can have a figural or "top-down" understanding of music (global, intuitive), a formal or "bottom-up" understanding (analytic, technical), or both. Interpersonal: The ability to perceive and make distinctions in the moods, intentions, motivations, and feelings of other people. This can include sensitivity to facial expressions, voice, and gestures; the capacity for discriminating among many different kinds of interpersonal cues; and the ability to respond effectively to those cues in some pragmatic way (e.g., to influence a group of people to follow a certain line of action). Intrapersonal: Self-knowledge and the ability to act adaptively on the basis of that knowledge. This intelligence includes having an accurate picture of oneself (one's strengths and limitations); awareness of inner moods, intentions, motivations, temperaments, and desires; and the capacity for self-discipline, self-understanding, and self-esteem.

International Journal of Scientific and Research Publications, Volume 7, Issue 4, April 2017 206 ISSN 2250-3153
www.ijsrp.org
Naturalist: Expertise in the recognition and classification of the numerous species—the flora and fauna—of an individual's environment. This also includes sensitivity to other natural phenomena (e.g., cloud formations, mountains, etc.) and, in the case of those growing up in an urban environment, the capacity to discriminate among inanimate objects such as cars, sneakers, and CD covers. Existential (Metaphysical): This type of intelligence is concerned with ‘ultimate issues’, what Gardner considers to be the capacity to locate oneself with existential features of the human condition such as the significance of life, the meaning of death and the fate of both the physical and psychological worlds. Each individual possesses all nine types of intelligence, albeit to different degrees. Therefore, they are not mutually exclusive. They are used simultaneously, complementing each other as people develop skills to solve problems.
II. METHODOLOGY Purpose of the assessment The aim of the test is to identify the extent to which each individual possesses all nine types of intelligence. This will provide both awareness and understanding about how they think, behave and respond to their respective environments.
Target audience
The Multiple Intelligence Assessment is applicable and used by individuals from various backgrounds, with children below 8 years of
age being an exception.
Applicability of the assessment
The Multiple Intelligence Assessment can be used in schools to assess how well a student can be expected to perform and to determine if special educational programs are necessary. Such intelligence tests can also be used in business, by employers to select job applicants and to predict who would learn new information required for the job or who would make “smart” decisions on the job.
Quality of the items
The quality of the assessment is enhanced as it’s an easy to use intelligence assessment with the items catering to a wide range of audiences. The items do not include any racial or gender stereotyped comments, while the interpretation and scoring of the assessment is simple and easily comprehensible. The derived score is reliable, as the assessment is administered under standardized settings and extraneous variables such as instructions and the administrator have a minimal influence on the variation in scores as these are standardized across situations. The assessment also meets requisite practical aspects as it includes the following considerations: 1. The items are formulated in simple layman English 2. The assessment is legible (can be easily understood) 3. The assessment material is durable (does not change across time)
Nature of the items
All the items in the questionnaire belong to the content domain which facilitate in assessing an individual’s intelligence. The 54 items are characteristic of the nine types of intelligence being assessed. These items represent the preferences of people which are subsequently linked to the respective type of intelligence. The items are standardized as they are the same for every respondent with respect to the content, form and order.
Assessment administrator qualifications

International Journal of Scientific and Research Publications, Volume 7, Issue 4, April 2017 207 ISSN 2250-3153
www.ijsrp.org
The user needs to an average of 2 years work experience in managing people, or a PG in Psychology/Sociology or an MBA.
Similarities and differences with similar assessments
Intelligence tests such as the General Mental ability test rely on language, numbers and abstractions as test items. The General Mental Ability test also assesses an individual’s performance on language based problems. Bhatia’s battery of intelligence although a performance test, also measures intelligence by assessing the analytic and synthetic ability of the cognitive mind, the power to grasp relations or abstract reasoning under appropriate circumstances. Whether it is the GMA or Bhatia’s battery of intelligence, the result is the same – an IQ score. This score essentially represents the intelligence level of an individual. The Multiple Intelligence Assessment does not produce an IQ score. It only serves to indicate an individual’s strengths/potentials across all nine types of intelligence. By demonstrating the extent to which an individual possesses all nine types of intelligence, direction towards suitable paths can be decided.
Instructions for the assessment administrator
Make sure the subject is seated comfortably in a well-lit and ventilated room. Build rapport with the subject, make him feel at ease. Educate the subject on the confidentiality element of the assessment. Give instructions of the assessment (as specified below) Clear doubts if any. After assessment completion give instructions on the scoring methodology. Interpret the scores and clear doubts that may arise.
Instructions for test takers
There are 54 items measured on a 4-point Likert scale that represent 9 different intelligence domains. There is no right, ideal or wrong response for any of the items. Please choose which alternative is most applicable to you
o Very often o Often o Sometimes o Rarely
Mark your answer with a check () in the appropriate box that is either Very often, Often, Sometimes or Rarely. If you make a mistake, cross it out and check another box.
Sample item: 1. I am able to use spoken or written words to influence or persuade others.
Kindly be as honest as possible and do not guess or look for a response that may seem right as there is no right or wrong response. Do not leave any items unanswered. Do not take too much time or ponder over an item, answer as quickly as you can. There are no time limits observed but the assessment takes 15-20 minutes for completion. The results of the assessment will be kept confidential and may be used for research/ career development purposes only.
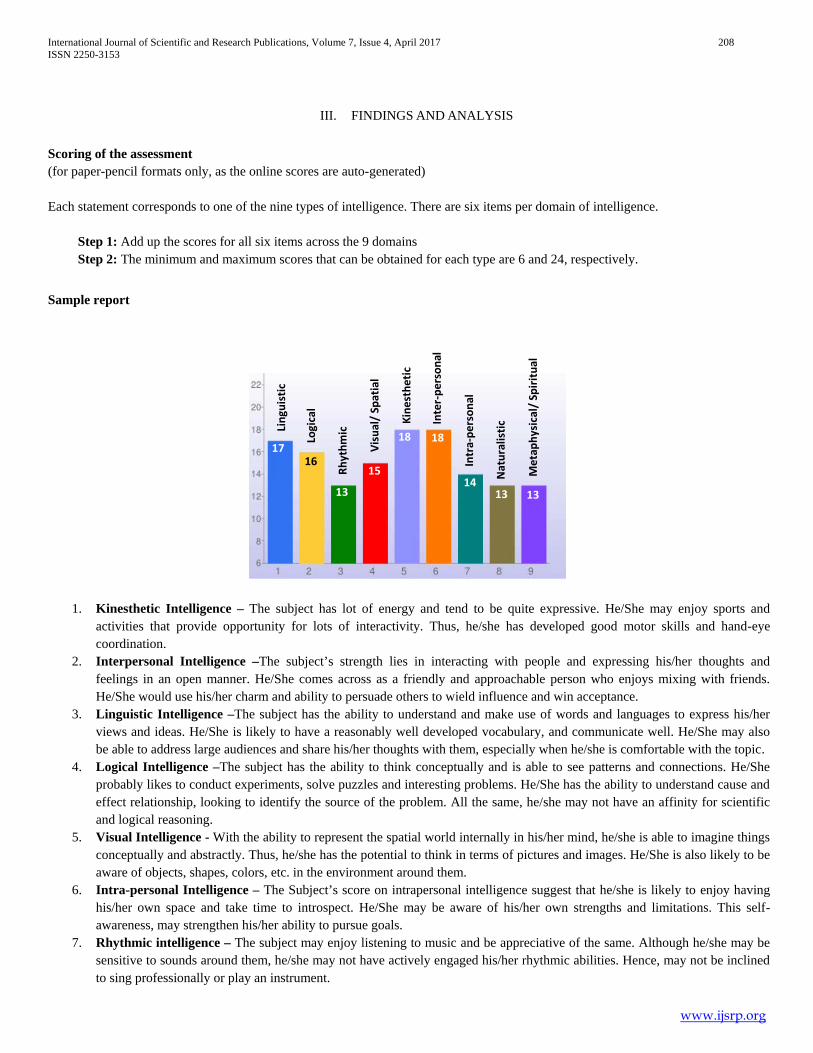
International Journal of Scientific and Research Publications, Volume 7, Issue 4, April 2017 208 ISSN 2250-3153
www.ijsrp.org
III. FINDINGS AND ANALYSIS Scoring of the assessment (for paper-pencil formats only, as the online scores are auto-generated) Each statement corresponds to one of the nine types of intelligence. There are six items per domain of intelligence.
Step 1: Add up the scores for all six items across the 9 domains Step 2: The minimum and maximum scores that can be obtained for each type are 6 and 24, respectively.
Sample report
1. Kinesthetic Intelligence – The subject has lot of energy and tend to be quite expressive. He/She may enjoy sports and
activities that provide opportunity for lots of interactivity. Thus, he/she has developed good motor skills and hand-eye coordination.
2. Interpersonal Intelligence –The subject’s strength lies in interacting with people and expressing his/her thoughts and feelings in an open manner. He/She comes across as a friendly and approachable person who enjoys mixing with friends. He/She would use his/her charm and ability to persuade others to wield influence and win acceptance.
3. Linguistic Intelligence –The subject has the ability to understand and make use of words and languages to express his/her views and ideas. He/She is likely to have a reasonably well developed vocabulary, and communicate well. He/She may also be able to address large audiences and share his/her thoughts with them, especially when he/she is comfortable with the topic.
4. Logical Intelligence –The subject has the ability to think conceptually and is able to see patterns and connections. He/She probably likes to conduct experiments, solve puzzles and interesting problems. He/She has the ability to understand cause and effect relationship, looking to identify the source of the problem. All the same, he/she may not have an affinity for scientific and logical reasoning.
5. Visual Intelligence - With the ability to represent the spatial world internally in his/her mind, he/she is able to imagine things conceptually and abstractly. Thus, he/she has the potential to think in terms of pictures and images. He/She is also likely to be aware of objects, shapes, colors, etc. in the environment around them.
6. Intra-personal Intelligence – The Subject’s score on intrapersonal intelligence suggest that he/she is likely to enjoy having his/her own space and take time to introspect. He/She may be aware of his/her own strengths and limitations. This self-awareness, may strengthen his/her ability to pursue goals.
7. Rhythmic intelligence – The subject may enjoy listening to music and be appreciative of the same. Although he/she may be sensitive to sounds around them, he/she may not have actively engaged his/her rhythmic abilities. Hence, may not be inclined to sing professionally or play an instrument.
Ling
uist
ic
Logi
cal
Kine
sthe
tic
Inte
r-pe
rson
al
Intr
a-pe
rson
al
Nat
ural
istic
Met
aphy
sica
l/ S
pirit
ual
Rhyt
hmic
Visu
al/
Spat
ial
1716
13
15
18 18
1413 13

International Journal of Scientific and Research Publications, Volume 7, Issue 4, April 2017 209 ISSN 2250-3153
www.ijsrp.org
8. Naturalistic Intelligence –While subject may have a basic understanding of flora and fauna, he/she is not very excited or fond of exploring “nature”. He/She may not show interest in learning about different species of plants / animals or gardening. He/She may only explore outdoor/natural surroundings when accompanied by friends.
9. Metaphysical Intelligence –The subject comes across as a broad-minded person who is open to new and novel ways of working. He/She likes to contemplate about abstract topics like, the meaning of life, death, etc. Being curious he/she tends to ask a lot of questions about these abstract topics. He/She may enjoy taking part in religious activities when he/she finds them to be meaningful.
Norms
Norms are standard models or patterns regarded as being typical. A norm of one type or the other is a basic requirement of all tests. A norm-referenced test / NRT is a type of test, assessment, or evaluation which yields an estimate of the position of the tested individual in a predefined population, with respect to the trait being measured. This estimate is derived from the analysis of test scores and possibly other relevant data from a sample drawn from the population. The test was administered on a sample of 1247 students, aged between 13-19 years from both public and private schools across different cities in India and Singapore. The items of the assessment were subjected to quantitative analysis using WINSTEPS (based on Rasch’s model) to assess the suitability of items and the differential functions based on gender, race and field of study during the academic year 2010.
Reliability & Validity Establishing reliability, validity and norms of an instrument is extremely essential for any psychometric instrument as it ensures that the results are consistent with the person’s true behaviour. Therefore, the data collected through research enables one to establish sound psychometric properties of assessments, irrespective of the construct they are designed to measure. Data analysis – Stage 1 Data are analyzed using Rasch model with the application of WINSTEPS to test the validity and reliability of the instrument. The Rasch model also takes into account the ability of the candidate or the respondent who answered questionnaires, tests or instruments as well as the difficulty of each test item or items (Rasch, 1980). Smith (1992) suggests using item fit statistics to evaluate the extent to which items are tapped into the same construct and places test-takers in the same order to assess the items’ technical quality empirically in the Rasch analysis. He argues that test-takers should be ranked consistently by items measuring the same construct. Otherwise, the misfit items (items that measure a different construct compared to other items in the test) should be revised or eliminated. Table 1 shows the criteria used as benchmarks for determining the validity of the instrument. According to Wright and Stone (1979), the conditions to produce a useful measurement are:
1. use of valid items in the measurement process to determine the construct measurement, 2. definition of concepts and constructs are clear and consistent with the supporting theory, 3. testing item on appropriate individuals provides results that are consistent with the purpose of measurement, and 4. the application of valid response patterns. Without a valid response pattern, the individuals cannot be defined precisely.
Criteria Statistical Information Results
Item Validity
a. Item Polarity PTMEA CORR > 0 (positive value)
Item 63
Item Misfit = 09
b. Item Fit Total mean square in-fit and out-fit of 0.6 - 1.4
c. Separation (SE) All items show • 2.0
Reliability d. Person reliability Value close to 0.8 value (0.62 < x <0.78)
Reliability e. Item reliability Value > 0.8

International Journal of Scientific and Research Publications, Volume 7, Issue 4, April 2017 210 ISSN 2250-3153
www.ijsrp.org
Table 1. Summary of item validity and reliability in the multiple intelligences instrument using Rasch model
Reliability
Reliability refers to the consistency of a test, or the degree to which the test produces approximately the same results over time under similar conditions. Ultimately, reliability can be seen as a measure of a test’s precision. The reliability of the respondents indicates that the interpretation is equivalent to that of Cronbach’s alpha or KR-20 (Wright and Masters, 1982). The respondent’s reliability index of 0.98 is a good value (Pallant, 2001) for the expected consistency on the log-it scale for the answers on different sets of items that measure the same construct (Wright and Masters, 1982). Linacre (2007) stated that the reliability of respondents of • 0.8 and respondents’ separation index of • 2.0 as good indices. The statistics generated by Rasch analysis estimate the degree of items suitability that measure latent variables, assuring the item-fit of the instrument are within an acceptable range. There are 09 items removed because the mean square in-fit and out-fit radius are outside the range of 0.6 to1.4 as proposed by Bond and Fox (2007).
Validity
Validity refers to the degree to which a test measures what it claims to measure. A test is valid to the extent that inferences made from it are appropriate, meaningful and useful. The statistics generated by Rasch analysis estimate the degree of items suitability that measure latent variables, assuring the item-fit of the instrument are within an acceptable range. There are 09 items removed because the mean square in-fit and out-fit radius are outside the range of 0.6 to1.4 as proposed by Bond and Fox (2007). Structural Equation Modeling was used to assess the quality of the instrument while Confirmatory Factor Analysis was used to assess construct validity of the items. The CFA shows that all 54 constructs of the online instrument fits the empirical data based on the Comparative Fit Index (CFI) of 0.9, and the Tucker Lewis Index (TLI) of 0.9. The results of the analysis indicate that the instrument is deemed acceptable according to Arbuckle and Wothke (1999).
The Multiple Intelligences Psychometric Assessment is made of 54 perception items of four-point Likert scale that represent nine different intelligence domains. It uses a quantitative methodology that involves the collection of data using both a paper and pencil as well as an online questionnaire. The benefits of the On-line assessment are rater-free automated scoring, quick feedback, and easy accessibility. Benefits associated with educational assessment include the ability to process detailed data and the potential to build tasks that assess skills that cannot be easily done by other means of assessment (Zoanetti, 2010). The remarkable advantage of internet is the effortless access to information that has led to a new, fast and handy range of tools and capabilities for innumerable fields of activity (Boboila&Boboila, 2007). The instrument is administered on a large sample of 1247 students aged 13 to 19 by random sampling across private and public schools in different cities of India and Singapore. Items are quantitatively analyzed using WINSTEPS that is based on the Rasch model to assess the suitability of items and the differential functions based on gender, race and field of study during the academic year 2010. Data analysis - Stage 2 To ensure accuracy and consistency of this finding, we conducted yet another study using the same instrument and data, applying the Structural Equation Modelling (SEM) using AMOS. Items that have been tested on the validity and reliability form a model representing each construct. SEM is an approach to measure the quality of instruments whilst Confirmatory Factor Analysis (CFA) is an approach to measure the validity of construct items. The application of SEM over CFA helps to assess the validity of the main structural factors. A measurement model that is assessed by CFA would link factors in a model (Kline, 2005). Modification indices provided by AMOS suggests that improvement in model fit could be made by allowing several measurement errors to correlate (Byrne, 2001; Joreskog, 1993).

International Journal of Scientific and Research Publications, Volume 7, Issue 4, April 2017 211 ISSN 2250-3153
www.ijsrp.org
The following shows the suitability index for both hypothesized and revised model for every nine constructs that have gone through the CFA application. The constructs are:
1. Logical-mathematical intelligence (LoM), 2. Verbal-linguistic intelligence (VeL), 3. Visual-spatial intelligence (ViR), 4. Musical intelligence (MuZ), 5. Bodily-kinaesthetic intelligence (KiB), 6. Interpersonal intelligence (InE), 7. Intrapersonal intelligence (InA), 8. Naturalistic intelligence (NaR), and 9. Spiritual intelligence (KeR).
Hypothesized Model: LoM .74 & .55 VeL .43 & .18 ViR .73 & .53 MuZ .44 & .20 KiB .61 & .37 InE .69 & .48 InA .56 & .33 NaR .53 & .28 KeR .51 & .26 Chi Square/df – 3.085, P-000, RMSEA - .106, CFI – 875, TLI - 833 Revised Model: LoM .74 & .55 VeL .44 & .20 ViR .73 & .53 MuZ .44 & .15 KiB .62 & .38 InE .71 & .50 InA .57 & .33 NaR .53 & .28 KeR .47 & .22 Chi Square/df – 1.415, P-078, RMSEA - .048, CFI – 976, TLI - 967 The overall results of analysis proof shows an overall fit and are deemed acceptable according to Arbuckle and Wothke (1999). The CFA shows that all 54 constructs of the online instrument fits the empirical data based on the Comparative Fit Index (CFI) of • 0.9, and the Tucker Lewis Index (TLI) of • 0.9. Meanwhile, the Root Mean Square Error of Approximation (RMSEA) of 0.08 is at an acceptable index, and the Chi-Square value of <2.0 or <3.0 indicates an acceptable fit between the model and the data. Result of the study shows that the good psychometric properties can be used to obtain the multiple intelligences profiles of teenage students. The validity and reliability of each item in the instrument are essential. Data is also important and the accuracy of data entry needs to be ensured as it contributes to the validity and reliability of the results. When the validity and reliability of the instrument is proven high, it can be construed that the instrument is valid and reliable. Although the pen-and-paper version had been tested on the validity and reliability by previously, the instrument is yet retested since inferences obtained earlier were only suitable for a certain purpose and sample especially when the analysis were done using the

International Journal of Scientific and Research Publications, Volume 7, Issue 4, April 2017 212 ISSN 2250-3153
www.ijsrp.org
classical test theory (CTT). The item response theory (IRT) with the application of the Rasch model using WINSTEPS should indicate high item reliability index and person reliability index. The second analysis using the SEM approach is in line with Stapleton (1997) who explained that the CFA method is suitable for testing a model developed based on theories, where the researcher starts with a hypothesized model before the analysis is conducted. The hypothesized model determines which indicator or variable are associated with latent variables. A set of measurements are done to assess the goodness of fit. The Multiple Intelligence assessment indicates that the items contribute to the measurement of each construct, while all the nine constructs show high construct validity. Thus the structure of nine constructs containing 54 items produce a valid measurement model and is deemed effective in assessing the level of multiple intelligences. The findings of an assessment will inform the relevant parties in an educational institution on the possibilities of implementing interventions that can enhance students’ competencies and skills described by the multiple intelligences. Students should also be made aware of their performance and tendencies, and the opportunity to improve themselves to a level of excellence before they embark on future undertakings.
IV. CONCLUSION
Benefits of the assessment:
• The assessment helps individuals realize their unique talents and boosts confidence. • It can be used to enhance the academic performance of students. • The assessment scores serve as a foundation for examining suitable careers for people. • It enables employees to ascertain their strengths and weaknesses, thereby, highlighting areas of improvement. • Training, development, mentoring and educational inputs – discover the sort of instruction and teacher or mentor a person is
likely to benefit most from, what activities he/she will best respond to. • Selection and placement – helps in evaluating an individual's suitability to positions, organizations and work environments. • Helps create competent teams with balanced talent mix for efficient completion of specific assignments.
V. REFERENCES Arbuckle, J.L &Wothke,W. ( 1999 ). Amos user’s guide version 4.0, Chicago, IL: Small Bond, T. & Fox, C. (2007). Applying the Rasch model: Fundamental measurement in the human sciences (2nd). Mahwah, NJ: LEA. Cattell, R. B. &Scheier, I. H. (1963). Handbook for the IPAT Anxiety Scale Questionnaire. Champaign IL: Institute for Personality and Ability Testing Copenhagen: nielsen&Lydiche. Reprinted 1980 by MeSA Press, Chicago. Spearman, C E (1927). The Abilities of Man: Their Nature and Measurement. London: Macmillan. Feldman, S.R. (2004) “Understanding Psychology” (6thed.). New Delhi: Tata McGraw Hill Publishing Company Ltd. Gardner, H. (1993). Frames of mind: a theory of multiple intelligences. New York: Basic Books. Gardner, H. (2006). The development and education of the mind: the selected works of Howard Gardner (pp.50). New York: Routledge. Linacre, J. M. (2007). From Microscale to Winsteps: 20 years of Rasch Software development. Rasch Measurement Transactions, 17(4), 958. Pallant, J. (2001). SPSS survival manual: a step by step guide to data analysis using SPSS for windows. (Ver.10). Illinois: Allen & Unwin Rasch, G. (1980). Probabilistic Models for Some Intelligence and Attainment Tests. Smith, R.M. Sternberg, R. J., &Lubart, T. I. (1992). Defying the crowd: Cultivating creativity in a culture of conformity. New York: Free Press. Thurstone, L.L. (1938). Primary mental abilities. Psychometric Monographs (no. 1) Wechsler, D. (1974). Manual for the Wechsler Intelligence Scale for Children—Revised. New York: Psychological Corporation Wright, B.D. & Masters, G.N. (1982). Rating scale analysis. Rasch measurement. Chicago: Mesa Press Wright, B.D. & Stone, M.H. (1979). Best test design. Chicago: MESA Press.

International Journal of Scientific and Research Publications, Volume 7, Issue 4, April 2017 213 ISSN 2250-3153
www.ijsrp.org
VI. AUTHORS
MR. SREENIDHI S K - Managing Director, Oscar Murphy Life Strategists, Bangalore. [email protected] MS. TAY CHINYI HELENA - Executive Director, Oscar Murphy Life Strategists, Bangalore. [email protected] Correspondence Author – Mr. Sreenidhi S K, [email protected], [email protected], 9901983545

International Journal of Scientific and Research Publications, Volume 7, Issue 4, April 2017 214 ISSN 2250-3153
www.ijsrp.org
Improved LEACH algorithm for enhancing lifetime of WSN – A Survey
Deepa* & Dr. Nipin Gupta**
* M.Tech. Student, Vaish College of Engineering, Rohtak, HR ** Head of the Deptt. (ECE), Vaish College of Engineering, Rohtak, HR
Abstract- Wireless Sensor Networks (WSNs) consist of multiple nodes, usually tens to thousands, that are deployed to gather useful information from the environment/field. These nodes share information and carry out cooperative processing by communicating through wireless channels. These Wireless Sensor Nodes are generally grouped in clusters to increase the efficiency of the network and enhance the scalability of the network system. However, since the nodes have limited power capabilities, limited computation power and finite battery life, it becomes critical to conserve the limited resources in order to increase the up-time of the network. This paper surveys the literature and discusses approaches to select cluster head by using swarm intelligence techniques. Ant Colony Optimization (ACO) is one such biologically inspired mechanism for routing that is based on swarm intelligence. ACO is a reliable and dynamic protocol that provides energy-aware, data gathering routing structures in a WSN. Modified versions of ACO can be employed over LEACH algorithm for efficient and effective cluster head selection. This approach is expected to considerably reduce the amount of average energy consumption. Index Terms- ACO, LEACH, Sensors, Swarm Intelligence, WSN
I. INTRODUCTION A Wireless Sensor Network (WSN) consists of sensor nodes which are connected wirelessly. These sensor nodes are small, low cost, low power and multi-functional. They can communicate over short distances. Each of these sensor nodes consist of components that can sense data, process data, and communicate with each other. Such sensor nodes collaborate to form wireless sensor networks. Applications of these sensor networks include sensing environmental variables like temperature, pressure, etc. Such WSNs can also be deployed in manufacturing setups to monitor different parameters and processes. They may also be used to measure deficiencies in structures, vehicles, infrastructures, etc. A lot of research work is being carried out in this area. Nevertheless, there is a great scope of improvement and improvisation in the design and deployment of WSNs using modern meta-heuristic route optimization techniques that are inspired from natural swarm. Fig. 1 below illustrates the architecture of a WSN network.
Fig. 1: Wireless Sensor Network (WSN) Architecture Legend: CH – Cluster Head, BS – Base Station
Ant Colony Optimization (ACO) was proposed by Marco Dorigo in 1992. It is a probabilistic technique that can be used for solving computational problems that involve finding the shortest path. The first algorithm of ACO was aimed at searching for an optimal path in a graph. The basis is the behavior of ants seeking a path between their colony and a source of food. In the real world, ants initially move randomly, and after finding a food source they return to their colony while laying down chemical pheromone trails. The amount of pheromone deposited depends on the quantity and quality of the food. Whenever other ants find such a trail, they are likely not to keep travelling at random, but to follow that trail instead, returning and reinforcing it if they eventually find the food. Thus the pheromone amount guides other ants to find the food source. As a result of this phenomenon, the optimal solution derives rapidly. By using this behavior of the ants, optimal cluster head can be selected. This original idea based on movement of real ants, after improvements, can be replicated to solve a wider class of numerical problems.
Source
CH
BS
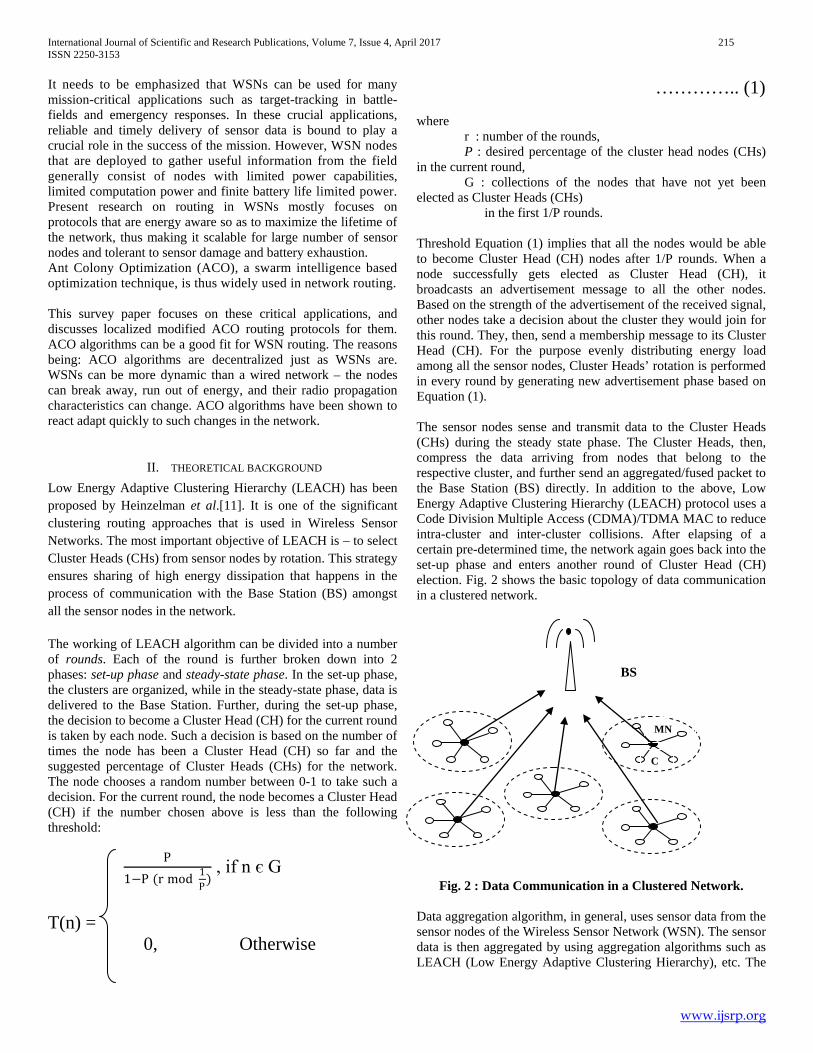
International Journal of Scientific and Research Publications, Volume 7, Issue 4, April 2017 215 ISSN 2250-3153
www.ijsrp.org
It needs to be emphasized that WSNs can be used for many mission-critical applications such as target-tracking in battle-fields and emergency responses. In these crucial applications, reliable and timely delivery of sensor data is bound to play a crucial role in the success of the mission. However, WSN nodes that are deployed to gather useful information from the field generally consist of nodes with limited power capabilities, limited computation power and finite battery life limited power. Present research on routing in WSNs mostly focuses on protocols that are energy aware so as to maximize the lifetime of the network, thus making it scalable for large number of sensor nodes and tolerant to sensor damage and battery exhaustion. Ant Colony Optimization (ACO), a swarm intelligence based optimization technique, is thus widely used in network routing. This survey paper focuses on these critical applications, and discusses localized modified ACO routing protocols for them. ACO algorithms can be a good fit for WSN routing. The reasons being: ACO algorithms are decentralized just as WSNs are. WSNs can be more dynamic than a wired network – the nodes can break away, run out of energy, and their radio propagation characteristics can change. ACO algorithms have been shown to react adapt quickly to such changes in the network.
II. THEORETICAL BACKGROUND Low Energy Adaptive Clustering Hierarchy (LEACH) has been proposed by Heinzelman et al.[11]. It is one of the significant clustering routing approaches that is used in Wireless Sensor Networks. The most important objective of LEACH is – to select Cluster Heads (CHs) from sensor nodes by rotation. This strategy ensures sharing of high energy dissipation that happens in the process of communication with the Base Station (BS) amongst all the sensor nodes in the network. The working of LEACH algorithm can be divided into a number of rounds. Each of the round is further broken down into 2 phases: set-up phase and steady-state phase. In the set-up phase, the clusters are organized, while in the steady-state phase, data is delivered to the Base Station. Further, during the set-up phase, the decision to become a Cluster Head (CH) for the current round is taken by each node. Such a decision is based on the number of times the node has been a Cluster Head (CH) so far and the suggested percentage of Cluster Heads (CHs) for the network. The node chooses a random number between 0-1 to take such a decision. For the current round, the node becomes a Cluster Head (CH) if the number chosen above is less than the following threshold:
P1−P (r mod 1P)
, if n є G
T(n) =
0, Otherwise
………….. (1) where
r : number of the rounds, P : desired percentage of the cluster head nodes (CHs)
in the current round, G : collections of the nodes that have not yet been
elected as Cluster Heads (CHs) in the first 1/P rounds.
Threshold Equation (1) implies that all the nodes would be able to become Cluster Head (CH) nodes after 1/P rounds. When a node successfully gets elected as Cluster Head (CH), it broadcasts an advertisement message to all the other nodes. Based on the strength of the advertisement of the received signal, other nodes take a decision about the cluster they would join for this round. They, then, send a membership message to its Cluster Head (CH). For the purpose evenly distributing energy load among all the sensor nodes, Cluster Heads’ rotation is performed in every round by generating new advertisement phase based on Equation (1). The sensor nodes sense and transmit data to the Cluster Heads (CHs) during the steady state phase. The Cluster Heads, then, compress the data arriving from nodes that belong to the respective cluster, and further send an aggregated/fused packet to the Base Station (BS) directly. In addition to the above, Low Energy Adaptive Clustering Hierarchy (LEACH) protocol uses a Code Division Multiple Access (CDMA)/TDMA MAC to reduce intra-cluster and inter-cluster collisions. After elapsing of a certain pre-determined time, the network again goes back into the set-up phase and enters another round of Cluster Head (CH) election. Fig. 2 shows the basic topology of data communication in a clustered network.
Fig. 2 : Data Communication in a Clustered Network. Data aggregation algorithm, in general, uses sensor data from the sensor nodes of the Wireless Sensor Network (WSN). The sensor data is then aggregated by using aggregation algorithms such as LEACH (Low Energy Adaptive Clustering Hierarchy), etc. The
C
MN
BS
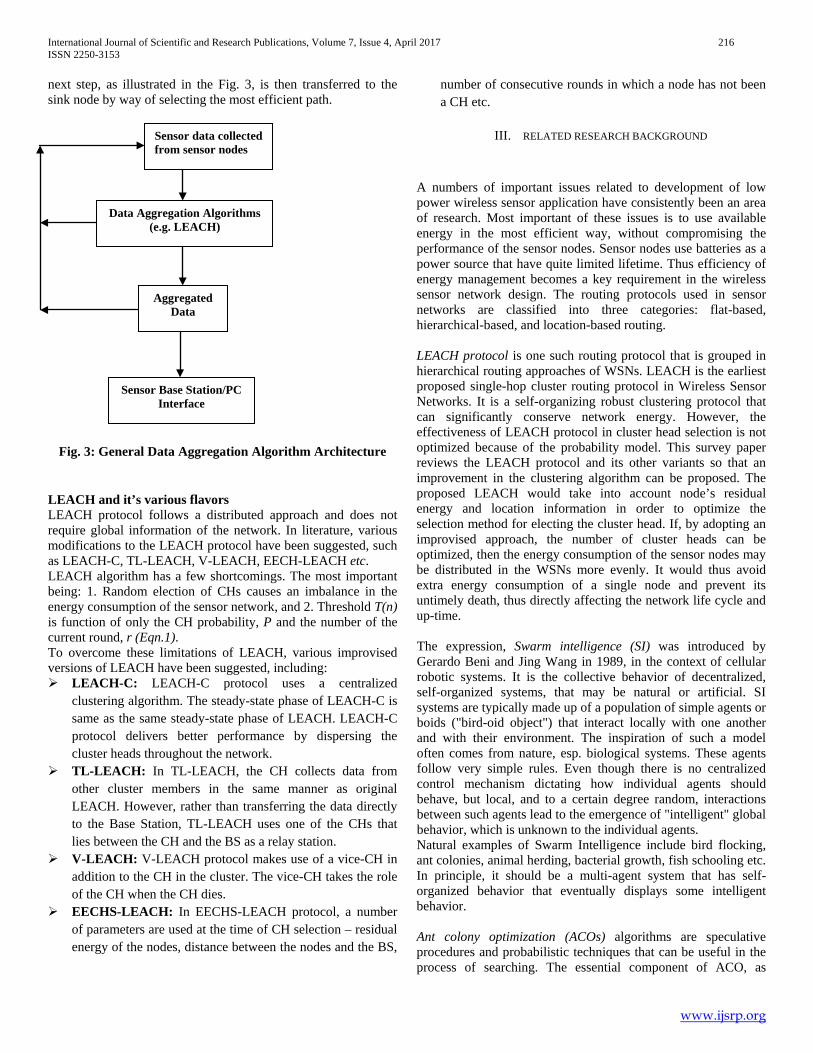
International Journal of Scientific and Research Publications, Volume 7, Issue 4, April 2017 216 ISSN 2250-3153
www.ijsrp.org
next step, as illustrated in the Fig. 3, is then transferred to the sink node by way of selecting the most efficient path.
Fig. 3: General Data Aggregation Algorithm Architecture LEACH and it’s various flavors LEACH protocol follows a distributed approach and does not require global information of the network. In literature, various modifications to the LEACH protocol have been suggested, such as LEACH-C, TL-LEACH, V-LEACH, EECH-LEACH etc. LEACH algorithm has a few shortcomings. The most important being: 1. Random election of CHs causes an imbalance in the energy consumption of the sensor network, and 2. Threshold T(n) is function of only the CH probability, P and the number of the current round, r (Eqn.1). To overcome these limitations of LEACH, various improvised versions of LEACH have been suggested, including: LEACH-C: LEACH-C protocol uses a centralized
clustering algorithm. The steady-state phase of LEACH-C is same as the same steady-state phase of LEACH. LEACH-C protocol delivers better performance by dispersing the cluster heads throughout the network.
TL-LEACH: In TL-LEACH, the CH collects data from other cluster members in the same manner as original LEACH. However, rather than transferring the data directly to the Base Station, TL-LEACH uses one of the CHs that lies between the CH and the BS as a relay station.
V-LEACH: V-LEACH protocol makes use of a vice-CH in addition to the CH in the cluster. The vice-CH takes the role of the CH when the CH dies.
EECHS-LEACH: In EECHS-LEACH protocol, a number of parameters are used at the time of CH selection – residual energy of the nodes, distance between the nodes and the BS,
number of consecutive rounds in which a node has not been a CH etc.
III. RELATED RESEARCH BACKGROUND
A numbers of important issues related to development of low power wireless sensor application have consistently been an area of research. Most important of these issues is to use available energy in the most efficient way, without compromising the performance of the sensor nodes. Sensor nodes use batteries as a power source that have quite limited lifetime. Thus efficiency of energy management becomes a key requirement in the wireless sensor network design. The routing protocols used in sensor networks are classified into three categories: flat-based, hierarchical-based, and location-based routing. LEACH protocol is one such routing protocol that is grouped in hierarchical routing approaches of WSNs. LEACH is the earliest proposed single-hop cluster routing protocol in Wireless Sensor Networks. It is a self-organizing robust clustering protocol that can significantly conserve network energy. However, the effectiveness of LEACH protocol in cluster head selection is not optimized because of the probability model. This survey paper reviews the LEACH protocol and its other variants so that an improvement in the clustering algorithm can be proposed. The proposed LEACH would take into account node’s residual energy and location information in order to optimize the selection method for electing the cluster head. If, by adopting an improvised approach, the number of cluster heads can be optimized, then the energy consumption of the sensor nodes may be distributed in the WSNs more evenly. It would thus avoid extra energy consumption of a single node and prevent its untimely death, thus directly affecting the network life cycle and up-time. The expression, Swarm intelligence (SI) was introduced by Gerardo Beni and Jing Wang in 1989, in the context of cellular robotic systems. It is the collective behavior of decentralized, self-organized systems, that may be natural or artificial. SI systems are typically made up of a population of simple agents or boids ("bird-oid object") that interact locally with one another and with their environment. The inspiration of such a model often comes from nature, esp. biological systems. These agents follow very simple rules. Even though there is no centralized control mechanism dictating how individual agents should behave, but local, and to a certain degree random, interactions between such agents lead to the emergence of "intelligent" global behavior, which is unknown to the individual agents. Natural examples of Swarm Intelligence include bird flocking, ant colonies, animal herding, bacterial growth, fish schooling etc. In principle, it should be a multi-agent system that has self-organized behavior that eventually displays some intelligent behavior. Ant colony optimization (ACOs) algorithms are speculative procedures and probabilistic techniques that can be useful in the process of searching. The essential component of ACO, as
Sensor data collected from sensor nodes
Data Aggregation Algorithms (e.g. LEACH)
Aggregated Data
Sensor Base Station/PC Interface

International Journal of Scientific and Research Publications, Volume 7, Issue 4, April 2017 217 ISSN 2250-3153
www.ijsrp.org
discussed earlier, is the pheromone model, which is used to sample the search space equally. Ant colony algorithm can be applied on a routing mechanism for finding the best path from the cluster heads to the base station. ACO, thus, can be used for solving computational problems which can be further reduced to finding paths. This concept can be adapted and applied in WSNs, for finding the optimal paths from the source nodes to the base station, wherein each node maintains its probabilistic routing table, also called as pheromone tables. On the basis of the death of the first node, ant colony algorithm can be applied on the LEACH protocol in the Wireless Sensor Network. The proposed algorithm is focused on enhancing the network lifetime, which in-turn affects the performance of LEACH protocol in terms of energy consumption. A number of researchers have already implemented various routing algorithms on Wireless Sensor Network for better performance and longer up-time. Mohammad El-Basioni et al. [10] implemented hierarchical protocols such as EAP protocol – which is essentially LEAP protocol which works around LEACH. Later on, the EAP routing protocol was further improved and named as LLEAP. The author experimented with this protocol and has observed better results as compared to previous routing protocols mentioned earlier in the paper. This routing protocol only improves the other parameters except network lifetime over EAP. Heinzelman[11] have proposed LEACH which is adaptive clustering protocol for distributing the energy load among the sensor nodes in the network. LEACH protocol uses randomized rotation of the cluster base stations or cluster heads and the corresponding clusters. It is thus able to distribute energy dissipation evenly throughout the sensors in the Wireless Sensor Network, thus increasing the up-time to almost double. The clusters are used for transmitting data to the base station and provide the advantages of smaller transmitting distances for most of the nodes, thus necessitating the need of only a few nodes for transmission of the data from far-off distances to the base station. It further increases the performance of classical clustering algorithms by using adaptive clusters and rotating cluster heads. In addition to the above, the specified protocol is able to perform local computation in each cluster which reduces the amount of data that must be transmitted to the base station. This also helps in achieving a large reduction in the energy dissipation in the WSN. Zhao et. al.[8] have highlighted that the classical hierarchical protocols such as LEACH and LEACH-C have better performance in saving the energy consumption. However, the selection formula neglects the change of nodes’ energy, thus making the nodes act as cluster heads too many times. Such nodes, then, die early owing to the consumption of too much energy. They also remark that the high frequency of re-clustering wastes certain amount of energy. The traditional equation used for selecting cluster heads has thus been improved by considering the dynamic change of nodes’ energy in order to distribute the energy more evenly among different nodes. It has
also been proposed to establish a vice cluster head for each cluster during the communication process, with the intent to diminish the energy consumption spent on re-clustering and to prolong the time of being in a steady-state phase. Elrahim[6] in his paper has proposed an energy efficient data forwarding protocol called Energy Aware Geographic Routing Protocol (EAGRP) for wireless sensor networks to extend the life time of the network. In EAGRP, both position information and energy are available at nodes used to route packets from sources to destination. The routing design of EAGRP is based on two parameters: location and energy levels of nodes. Each node knows the location and energy level of its neighbors. The performance measures have been analyzed with variable number of nodes. The results of the research show that EGARP does efficiently and effectively extend the network lifetime by increasing the successful data delivery rate. Basile et. al.[7] did a formal analysis of a key management protocol, called LEAP (Localized Encryption and Authentication Protocol), intended for wireless sensor networks through the high level formal language HLSPL and checked using the AVISPA tool for attacks on the security and authenticity of the exchanges. They focused on the protocol’s establishment of pairwise keys for nearest neighbors and for multi-hop neighbors. They then used this foundation to test the protocol’s method of cluster key redistribution. Chaturvedi et. al.[4] illustrated that the main issues in wireless Sensor Networks (WSNs) are efficient uses of limited resources and appropriate routing of network path. They suggested multiple sinks to be the most efficient and effective in overcoming these issues when used with proper routing protocols. The authors further compared residual energy status of entire network nodes of single stationary and multiple sinks, compared and evaluated the performances. They further suggested that properly framed heuristic algorithms are the most suitable for query based routing protocol. The performance of multiple stationary sink is better than the single stationary sink because almost all the nodes generally get the opportunity to do the job of Cluster Head (CH). Thus, the authors conclude that the WSN life time can be prolonged by using multiple sinks. Prajapati et. al.[1] proposed modified Geographical energy aware routing in WSN. In this approach, separation of the sensor nodes is based on their location using GPS, wherein certain regions are classified. Base Station (i.e. Sink Node) is established away from the sensing region and a gateway node is present at the middle of sensing region. When the distance of sensor nodes from sink node and gateway node is relatively less than the pre-defined distance threshold, then the node uses direct communication for data transmission. It separates the rest of nodes into the equal regions whose distance is more than the threshold distance. Cluster Heads (CHs) are selected in each region independently of the other regions. Such selection is based on the probability and residual energy of nodes. The author has found out that the proposed routing protocol performance with LEACH and their results showed better in terms of network energy consumption, lifetime and packet transmission to base station.
International Journal of Scientific and Research Publications, Volume 7, Issue 4, April 2017 218 ISSN 2250-3153
www.ijsrp.org
Bishnoi et. al.[3] discussed the developments of wireless sensor networks technology with respect to how to prolong the lifetime of Wireless Sensor Network and reduce energy consumption by the sensor nodes. The authors analyzed the cluster head selection phase of LEACH protocol and proposed the improved approach of LEACH i.e. CSLQ (Cluster-head based on link quality) that improves the lifetime of the network. In CSLQ the cluster – head is selected on the basis of link quality so that number of packets lost decrease as compared to the LEACH-C protocol. In the proposed model, sensor nodes are deployed to sense information and send it to the CH and then CH sends that information to the BS. The authors also evaluated both LEACH-C and CSLQ showing that CBLQ protocol performs better than the LEACH-C protocol. Rajasekaran et. al.[2] emphasized that Wireless Sensor Networks (WSN) is an emerging technology which is challenging due to its scope, limited processing power, and associated low energy. Thus WSN routing differs from conventional routing in fixed networks. The reasons being – it lacks infrastructure, has unreliable wireless links, sensor nodes are susceptible to fail and routing protocols are expected to meet tough energy saving requirements. Data aggregation is essential in WSN because it effectively saves limited resources. The objective of data aggregation algorithms is gathering and aggregation of data in an energy efficient manner so as to improve the network life. Clustering is used to extend the network life by reducing energy consumption. The authors propose a better cluster head selection in sensor networks for efficient data aggregation. Their proposed algorithm is based on Local search and incorporated in Low Energy Adaptive Cluster Hierarchy protocol (LEACH). Siddiqui F.A. et al.[5] suggest that the lifetime of WSNs is affected by the cluster head (CH) selection. CH consumes more power than a regular (non-CH) node. Consequently, an energy efficient cluster head selection in Mobile Wireless Sensor Networks has been proposed, analysed and validated on the basis of residual energy and randomized selection of the node. The proposed approach has shown significant improvements when compared with LEACH in terms of energy consumption of sensor nodes, enhanced network lifetime and efficient data gathering.
IV. ACKNOWLEDGEMENTS This work has been inspired and supported by Electronics & Communication Engineering Department of Vaish College of Engineering Rohtak. In particular, Head of the Department, Dr. Nipin Gupta deserves special thanks and gratitude for his guidance, constant support and encouragement.
V. REFERENCES [1] Singh P.K., Prajapati A.K., Singh Arunesh, Singh R.K.: Modified
Geographical Energy-Aware Routing Protocol in Wireless Sensor Networks. International Conference on Emerging Trends in Electrical, Electronics and Sustainable Energy Systems (ICETEESES–16), 208-2012 (2016).
[2] Rajasekaran A., Dr V. Nagarajan: Improved Cluster Head Selection For Energy Efficient Data Aggregation In Sensor Networks. International Journal of Applied Engineering Research ISSN 0973-4562 Volume 11, Number 2 (2016) pp 1379-1385.
[3] Manjeet, Bishnoi S.: Cluster Head Selection Protocol Which Improved the Lifetime of Wireless Sensor Network. International Journal of All Research Education and Scientific Methods (IJARESM), ISSN: 2455-6211, Volume 4, Issue 5 (2016).
[4] Kumar P., Chaturvedi A.: Performance Analysis of Energy Aware Routing Protocol for Wireless Sensor Networks. 2nd International Conference on Devices, Circuits and Systems (ICDCS) (2014).
[5] Arshad M., Aalsalem M.Y., Siddiqui F.A.: Energy Efficient Cluster Head Selection in Mobile Wireless Sensor Networks. Journal of Engineering Science and Technology Vol. 9, No. 6, 728 – 746 (2014).
[6] Elrahim Adel Gaafar A.: Energy Aware Routing Protocol for Low Energy Sensor Networks. International Conference on Computing, Electrical and Electronics Engineering (ICCEEE), 109-114 (2013).
[7] Verma R.M., Basile B.E.: Modeling and Analysis of LEAP, a Key Management Protocol for Wireless Sensor Networks. IEEE International Workshop on Security and Privacy of Mobile, Wireless, and Sensor Networks (MWSN), 65-67 (2013).
[8] Zhao F., Xu You, Li Ru: Improved LEACH Routing ommunication Protocol for aWireless Sensor Network. International Journal of Distributed Sensor Networks, Article ID 649609, 6 pages (2012).
[9] Xuxun Liu: A Survey on Clustering Routing Protocols in Wireless Sensor Networks. ISSN 1424-8220 (2012).
[10] El-Basioni et. al.: An Optimized Energy-aware Routing Protocol for Wireless Sensor Network. Egyptian Informatics Journal, 61–72 (2011).
[11] Heinzelman W., Chandrakasan A., Balakrishnan H.: Energy-Efficient Communication Protocol for Wireless Microsensor Networks. Proceedings of the Hawaii International Conference on System Sciences, January 4-7, Maui, Hawaii (2000).
VI. AUTHORS First Author – Deepa, M.Tech. Student, Vaish College of Engineering, Rohtak, HR E-mail: [email protected] Second Author – Dr. Nipin Gupta, Head of the Deptt. (ECE), Vaish College of Engineering, Rohtak, HR E-mail: [email protected]

International Journal of Scientific and Research Publications, Volume 7, Issue 4, April 2017 219 ISSN 2250-3153
www.ijsrp.org
4Cs -INNER MOTIVATION STYLES
BASED ON DR. WILLIAM MARSTON’S RESEARCH
MR. SREENIDHI S K,MS. TAY CHINYI HELENA, MS. SHOBA ABY JOHN
Oscar Murphy Life Strategists
Abstract- This article talks about the research work of Dr. William Marston. He believed that behaviour of individuals are greatly influenced by their upbringing and environment. He developed the “four quadrant behavioural model of inner motivation” It is aself-awareness profile that indicates the Controlling, Convincing, Conforming and Consistent emotional responses of people due to long-standing influences of upbringing from the individuals’ environment, in order to assess various aspects like drive to overcome barriers, ability to persuade etc. It throws light on individuals as people oriented or task oriented, reflecting the style by which they will get work done. It also helps find out if an individual is ‘Active or Passive’ in their approach to work and life. It also shows whether an individual wouldlead by providing a vision of future possibilities or by making best possible use of available opportunities. This article helps the readers to understand their inner motivation styles and excel in both: their personal as well as professional life, since success at work while handling peoplecomes from knowing the motivational drives, emotional responses and behaviour patterns of individuals and leveraging on them to meet the needs of the situation. Keywords – Inner Motivation Styles, William Marston, Controlling, Convincing, Conforming, Consistent, Active, Passive, motivational drives, emotional responses, Behavioural patterns, Personal & professional excellence
I. INTRODUCTION 4C is a self-awareness profile which indicates the Controlling, Convincing, Conforming, Consistency of individuals, to assess various aspects like drive to overcome barriers, ability to persuade etc. It categorizes individuals as people oriented or task oriented, which in turn reflects the style by which an individual gets the work done. 4C also helps to find out if an individual is Active or Passive. THE EVOLUTIONARY APPROACH TO PERSONALITY In the realm of biological approaches to personality, the most recent development has been the emergence of an evolutionary perspective. Evolutionary psychologists assert that the patterns of behaviour seen in a species are products of evolution in the same way that anatomical characteristics are. Evolutionary psychology examines behavioral processes in terms of their adaptive value for members of a species over the course of many generations. The basic premise of evolutionary psychology is that natural selection favors behaviors that enhance organisms’ reproductive success—that is, passing on genes to the next generation. Thus, evolutionary analyses of personality focus on how various traits—and the ability to recognize these traits in others—may have contributed to reproductive ness in ancestral human populations. HISTORY OF 4C’S
4C’s is the four quadrant behavioral model based on the work of William Moulton Marston Ph.D. (1893–1947) to examine the behavior of individuals in their environment or within a specific situation (otherwise known as environment). It therefore focuses on the styles and preferences of such behavior.
Dr. William Marston, a physiological psychologist writing in the 1920s and 1930s, explored the meaning of normal human emotions by relating how a person perceives himself or herself in relation to the environment and describing how the person is likely to behave in response.
Dr.William Marston

International Journal of Scientific and Research Publications, Volume 7, Issue 4, April 2017 220 ISSN 2250-3153
www.ijsrp.org
The two dimensions of Marston’s model:
• The environment is perceived as favorable or unfavorable. • The individual perceives him or herself more or less powerful than the environment. In response to the environment, the
individual either acts on or accommodates to that environment which is seen as either favorable or unfavorable. Marston sought to explain how people adjust to varying environments, by starting with their emotional response to it and relating this response to behavior. Long before personality and social psychologists agreed that an individual and his or her environment are related in complex ways and behavior cannot be understood without understanding the situation in which it occurs, Dr. William M. Marston developed a theory of how Individuals respond to features of their environment. He defined the environment by its favorability. Favorable environments are supportive of the person, and he or she can feel comfortable in them. Unfavorable environments are antagonistic to the person, and he or she feels challenged by them. In both cases, a person responds emotionally either positively or negatively. This is the first principle. The individual's behavioral response to the situation depends on how much power the person feels in relation to the supportive or antagonistic forces in the environment. This is the second principle. These two principles intersect to produce four responses directed by emotions:
• The dominant response acts on an environment perceived as unfavorable to the self • The inducement response (later called influence) acts on an environment perceived as favorable • The submissive response (later called steadiness) accommodates to an environment perceived as favorable • The compliance response (later called conscientiousness) accommodates to an environment perceived as unfavorable
CLARKE’S CONTRIBUTION TO THE DEVELOPMENT OF DISC In 1948, Walter V. Clarke established his new business with his associates to utilize the years of development and research he had undertaken after listening to a lecture at Harvard by Prescott Leckey which postulated that it was possible with a high degree of accuracy to determine and predict the long-term behavior of an individual based upon a set of questions. Working with Marston, he was able to name four vectors of behavior, namely Assertiveness, Sociability, Tranquility, and Dependence, and the means to identify the relative propensity of individuals to behave according to these predictive scales. This system of dimensions of observable behaviour has become known as the universal language of behavior. Research has found that characteristics of behavior can be grouped into these four major 'personality styles' and they tend to exhibit specific characteristics common to that particular style. All individuals possess all four, but what differs from one to another is the extent of each. For most, these types are seen in shades of grey rather than black or white, and within that, there is an interplay of behaviors, otherwise known as blends. The denotation of such blends starts with the primary (or stronger) type, followed by the secondary (or lesser) type, although all contribute more than just purely the strength of that 'signal'. Having understood the differences between these blends makes it possible to integrate individual team members with less troubleshooting. In a typical team, there are varying degrees of compatibility, not just toward tasks but interpersonal relationships as well. However, when they are identified, energy can be spent on refining the results. Each of these types has its own unique value to the team, ideal environment, general characteristics, what the individual is motivated by, and value to team. Although the original company to create behavioral assessments, W. V. Clarke and Associates, is still operating, many other systems based upon this original work have been developed especially by people who originally worked with Clarke, and these have mostly used the DISC notation. There are probably several thousand derivatives of this work.

International Journal of Scientific and Research Publications, Volume 7, Issue 4, April 2017 221 ISSN 2250-3153
www.ijsrp.org
CHARACTERISTICS OF 4C’S - Controlling – C1 (Dominance in Marston’s time) relating to control, power and assertiveness Convincing – C2 (Inducement in Marston’s time) relating to social situations and communication Conforming – C3 (or caution, compliance in Marston's time) – relating to structure and organization Consistency- C4 (submission in Marston's time) – relating to patience, persistence, and thoughtfulness These four dimensions can be grouped in a grid with C1 and C2 sharing the top row and representing extroverted aspects or “Active Initiator” of the personality. C3 and C4 below representing introverted aspects or “Passive Responder” C1 and C3 then share the left column and represent task-focused aspects, and C3 and C4 share the right column and represent People- Oriented aspects. CONTROLLING (C1): People who score high in the intensity of the "C1" styles factor are very active in dealing with problems and challenges, while low "C1" scores are people who want to do more research before committing to a decision. High "C1" people are described as demanding, forceful, egocentric, strong willed, driving, determined, ambitious, aggressive, and pioneering. Low C1 scores describe those who are conservative, low keyed, cooperative, calculating, undemanding, cautious, mild, agreeable, modest and peaceful. CONVINCING (C2): People with high "C2" scores influence others through talking and activity and tend to be emotional. They are described as convincing, magnetic, political, enthusiastic, persuasive, warm, demonstrative, trusting, and optimistic. Those with low "C2" scores influence more by data and facts, and not with feelings. They are described as reflective, factual, calculating, skeptical, logical, suspicious, matter of fact, pessimistic, and critical. CONFORMITY (C3): People with high "C3" styles adhere to rules, regulations, and structure. They like to do quality work and do it right the first time. High "C3" people are careful, cautious, exacting, neat, systematic, diplomatic, accurate, and tactful. Those with low "C3" scores challenge the rules and want independence and are described as self-willed, stubborn, opinionated, unsystematic, arbitrary, and careless with details. CONSISTENCY (C4):
D +
I +
S C
People Oriented
Task Oriented
D + I
S + C
Active Initiator
Passive Responder

International Journal of Scientific and Research Publications, Volume 7, Issue 4, April 2017 222 ISSN 2250-3153
www.ijsrp.org
People with high "C4" styles scores want a steady pace, security, and do not like sudden change. High "C4" individuals are calm, relaxed, patient, possessive, predictable, deliberate, stable, consistent, and tend to be unemotional and poker faced. Low "C4" intensity scores are those who like change and variety. People with low "C4" scores are described as restless, demonstrative, impatient, eager, or even impulsive.
II. METHODOLOGY PURPOSE OF THE ASSESSMENT: Aim of 4C’s is to understand and identify behavioral styles of individuals along with motivational needs. This understanding helps to gain insight into the behavioral patterns and how they respond to their environment. TEST AUDIENCE: 4C’s is applicable to a wide range of audience from extensive backgrounds. 4C’s can be administered to individuals who are 15 and above. BENEFITS OF THE ASSESSMENT: 4C’s has a wide range of applicability widely used across various fields to gain a better understanding of self and others including personnel selection, individual development, enhancing interpersonal relations, understanding group dynamics, leadership training, executive coaching, student coaching, personal development, marriage counseling, conflict resolution, teamwork, career consultation, organizational climate survey and for research purposes etc. (Decisions ranging from career to marriage consultation or personnel selection however, are not taken based just on one assessment, they are most accurate when taken on the basis of a battery). INSTRUCTIONS FOR THE TEST ADMINISTRATOR (FOR PAPER PENCIL FORMAT):
Make sure the subject is seated comfortably in a well-lit and ventilated room. Build rapport with the subject, make him feel at ease. Educate the subject on the confidentiality element of the test. Give instructions of the test (as specified below) Clear doubts if any. After test completion give instructions on the scoring methodology. Interpret the scores and clear doubts that may arise.
INSTRUCTIONS FOR THE TEST TAKERS: This assessment comprises of 16 sets of statements. Each set contains 4 statements. For each set please rank statements as follows.
• 4 is Most Like You • 1 is Least Like You • 3 is Tend To Be More Like You • 2 is Tend To Be Least Like You
Each of the Four Multiple Choices should get a 4 or 3 or 2 or 1 in the order that you decide. Total must be ten for each statement and 4 or 3 or 2 or 1 can appear only once. Please be honest and do not guess or look for what is right. There is no Right or Wrong answers. All Answers are Correct. Answer in the present and look for the real, not the ideal. The allotted time for the completion of this test is 25 minutes.
SCORING OF THE TEST(for paper - pencil formats only, as the online scoring is auto generated): STEP 1:

International Journal of Scientific and Research Publications, Volume 7, Issue 4, April 2017 223 ISSN 2250-3153
www.ijsrp.org
Add up total points of each of the shapes, separately and enter the total in the space provided below their respective shapes. Divide each of the scores by 1.6 to get the percentage score for their respective shapes. STEP 2: Add C1 + C2 to get the score on Active Initiator Add C3 + C4 to get the score on Passive Responder Add C1 + C3 to get the score on Task Oriented Add C2 + C4 to get the score on People Oriented The scoring system of the test is objective as any qualified person involved in scoring the test items will give same scores for same answers (depending on the responses marked by the individual) NORMS Norms are standard models or patterns regarded as being typical. A norm of one type or the other is a basic requirement of all tests. However, there can be exceptions, especially in the case of ipsative tests, where only intra-individual interpretation is recommended. In such cases the applications of norms do not hold good, as is with 4C’s. RELIABILITY Reliability refers to the consistency of a test, or the degree to which the test produces approximately the same results over time under similar conditions. Ultimately, reliability is seen as a measure of a test’s precision. Number of different methods for estimating reliability can be used, depending on the types of items on the test, the characteristics a test is intended to measure, and the test user’s needs. The most commonly used methods to assess reliability are the Test-retest and Split half methods. TEST- RETEST RELIABILITY This method looks at the stability of the test scores over time by administering the same test to the same people after a reasonable time interval. The 4C’s assessment is purely based on environmental factors that influence a person. Therefore, if an individual takes a test after a period-of-time there is bound to be a minimal amount of change in the scores based on the environments the individual is exposed to and the inputs gained by the environment. INTERNAL CONSISTENCY RELIABILITY Indicates the homogeneity of the test. If all the items of the test measure the same function or trait, the test is said to be homogenous. The most common method of estimating internal consistency reliability is by the Split half method. In this method, a test is divided into two forms and scores on the two forms are correlated with each other to assess the degree to which all the items are assessing the same characteristic. The 4C’s assessment which consists of 16 items was split into two forms and administered to verify if the pair contributes in assessing an individual’s personality style. It was observed that 4C’s is high on split half reliability as both the forms are symbolic of an individual’s personality style. VALIDITY

International Journal of Scientific and Research Publications, Volume 7, Issue 4, April 2017 224 ISSN 2250-3153
www.ijsrp.org
Validity refers to the degree to which a test measures what it claims to measure. A test is valid to the extent that inferences made from it are appropriate, meaningful and useful. The different ways of obtaining validity are grouped into three categories namely Content, Criterion-related and Construct validity CONTENT VALIDITY: Refers to how well a test covers the characteristics it is intended to measure. Thus, items are assessed to see if they are: tapping into the characteristic being measured, comprehensive in covering all relevant aspects and balanced in their coverage of the characteristics being measured. Content validity is usually assessed by careful examination of individual test items and their relation to the whole test. CRITERION – RELATED VALIDITY: Deals with the extent to which test scores can predict a certain behaviour referred to as the criterion. Criterion is defined as an external and independent measure of essentially the same variable that the test claims to measure. Concurrent and Predictive validity are two types of criterion related validity.
a) Predictive validity refers to how well the scores on a test predict certain behaviors. In predictive validity, a test is correlated against the criterion to be made available sometime in the future.
b) Concurrent Validity is similar to predictive validity except that there is no time gap in obtaining test scores. The correlation between test scores and the criterion variable indicate the degree of criterion- related validity.
CONSTRUCT VALIDITY: Is defined as the extent to which the test measures a construct. A construct is a non-observable trait such as personality, intelligence etc. which explains our behaviour. Construct validity deals with how well a test assesses the characteristics it is intended to assess (in this case personal effectiveness). There is no single method for assessing a test’s construct validity. Drawing close parallel with content validity. FACE VALIDITY: A test has face validity if it looks valid to the users, examiners and examinees. It is a matter of social acceptability and not a technical form of validity. Though not a technical form it is needed in all types of tests. The 4C’s is high on face validity as the 16 items in the questionnaire are symbolic of the various personality styles and the environmental stimuli an individual is encountered with, that help serve as a valid base for a personality assessment.
III. ANALYSIS & FINDINGS This Assessment assesses the influence of an individual’s environmental conditions, i.e. upbringing as well as work environment. Such factors steer them to behave the way they do. It gives an insight into the intrinsic motivation, preferences and traits of the assessed individual. This is represented as interplay of 4 basic behavioral factors namely Controlling, Convincing, Conforming and being Consistent.
International Journal of Scientific and Research Publications, Volume 7, Issue 4, April 2017 225 ISSN 2250-3153
www.ijsrp.org
SCORES:
Controlling (C1) Convincing (C2) Conforming (C3) Consistent (C4)
26.5 26 23 24.5
Active Initiator (C1+C2) Passive Responder (C3+C4) Task Oriented (C1+C3)
People Oriented (C2+C4)
52.5 47.5 49.5 50.5
CHARACTERISTICS Unlikely Strength
Limited Strength
Fair Strength
Good Strength
Great Strength
Over Strength
Brings in lots of energy and enthusiasm
Highly system and process driven
Displays strong listening skills
Operates independently and takes charge of situations
Accommodates easily, prioritizes others’ needs
Pays attention to detail and ensures accuracy
Takes quick decisions confidently
Engages with people easily and has a way with words
Questions status quo
Follows a logical methodology
Aspires to be the best, driven to achieve
Maintains composure and provides a steadying influence
Dreams and gets others to dream
Focuses on one thing at a time, concentrating for prolonged periods
Relies on information, data, facts and figures
Lively, positive and optimistic in outlook
International Journal of Scientific and Research Publications, Volume 7, Issue 4, April 2017 226 ISSN 2250-3153
www.ijsrp.org
MOTIVATORS Weak Mild Moderate Significant Strong Powerful
Democratic environments
Well-established routines
Independence and freedom of operation
Clearly defined rules and processes
Being in the limelight and standing out of the crowd
Pleasant relationships and harmonious environment
Using tried and tested methods
Challenges and difficult tasks
Being given reassurance
Freedom of expression; wielding influence
Positions of power/authority
Collaborative activities; lending a helping hand
Networking and opportunities to socialize
Meeting set standards/benchmarks
Opportunities for individual accomplishment
Being given appreciation for work well done
ACTIVE INITIATOR VS. PASSIVE RESPONDER

International Journal of Scientific and Research Publications, Volume 7, Issue 4, April 2017 227 ISSN 2250-3153
www.ijsrp.org
ACTIVE INITIATOR • Steps out of comfort zone • Leads by inspiration & charisma • Makes a start without delay; takes new initiatives • Goes to great lengths to influence others • Utilizes internal & external resources • Strives to shape the environment
PASSIVE RESPONDER
• Sticks to comfort zone • Leads by example • May wait for instructions • Assumes conventional methods • Tends to bottle up feelings • Adjusts to environment • Implements set processes • Maximizes internal resources • Works behind the scenes
TASK ORIENTED VS. PEOPLE ORIENTED
TASK ORIENTED
• Focuses on task • Wants to get things done • Pushes for quick and immediate results • Highly goal driven and result oriented • Strives to get things right • Adheres to set standards and timelines
PEOPLE ORIENTED
• Focuses on people • Wants to accommodate people’s needs • Does not wish to hurt others • Prefers to take people along • Brings people together • Strives to maintain harmony

International Journal of Scientific and Research Publications, Volume 7, Issue 4, April 2017 228 ISSN 2250-3153
www.ijsrp.org
ANALYSIS: The subject is a balanced person with regard to acquired personality styles and have the potential to tap into one’s strengths as required by the environment. With thisability to adapt, he/she is likely to deal effectively with varied situations and different people. The subject comes across as a strong individual with the ability to influence people by articulating his/her views and ideas in a manner that is appreciated. With a desire to gain popularity, the subject is likely to assume leadership, take charge and deal with hurdles that may come in his/her way to achieve targets. His/hercompetitive spirit guides him/her to seek opportunitiesfor individual accomplishment and is often motivated by the level of difficulty or complexity involved in the work. Seeking autonomy, the subject is likely to prefer working in control-free environments. Driven by social interactions, he/she might have a wide network of relationships. Being able to understand the value ofthe relationships you hold, he/she makes an effort to maintain harmony. The subject is also comfortable to work within a structured environment and therefore may be able to meet the defined standardsthat are put in place. He/she tends to respect authority and hence is likely to abide by the rules and adhere to policies and regulations. With the need to be correct, he/she is likely to seek reassurance from others to confirm that he/she is going in the right direction. With the ability to concentrate, the subject tends to worksteadily and calmly; thus, he/she is able to handle long term assignments and will continue to work until the completion of an assignment. Being an active initiator, the subject is likely to step out of thecomfort zone and take charge of tasks in order to improve things. He/she is likely to lead by inspiration and charisma. Displaying almost equal preference towards tasks and people, the subject has the ability to get things done as well as maintain healthy relations and gain social recognition.
IV. CONCLUSION
MULTIPLE BENEFITS OF THE TEST
• Understand the motivation of each individual to ensure better understanding • Helps you assign tasks best suited to the employees’ personality style
• Gives an accurate direction for effective training and development programs to optimize people strengths
• Helps create competent teams with balanced talent mix for efficient completion of specific assignments
• Improve interpersonal interactions by structuring and flexing communication
• Enhances team working abilities by recognizing and adapting to the different Behavioral styles
• Helps you interact with your clients/customers better, by flexing your style to their styles
• Selection and placement – helps in evaluating an individual's suitability to positions, organisations and work environments
• Team building - helps identify how people complement each other's strengths and weaknesses, approaches and
communication styles

International Journal of Scientific and Research Publications, Volume 7, Issue 4, April 2017 229 ISSN 2250-3153
www.ijsrp.org
• Managing individuals effectively – helps in understanding a subordinate's needs, the type of reinforcement they value, and
type of feedback that is to be given
• Conflict resolution between people – helps understand the differences in their styles, values, ways of communicating and expressing their feelings
• Training, development, mentoring and educational inputs – discover the sort of instruction and teacher or mentor a person is
likely to benefit most from, what activities he/she will best respond to
• Marriage/relationships - create greater understanding of the partners and the dynamics involved in their relationship, exploring priorities and values, and resolving and preventing conflict
• Organisation culture change - insight into preferred roles and ways of doing things for individuals and teams
• Career and vocational guidance - finding out what is most important to a person, what would give him/her most satisfaction
REFERENCES
• WILLIAM MOULTON MARSTON- LONDON KEGAN PAUL, TRENCH, TRUBNER & Co. Ltd. Emotions of Normal People
• Environmental Psychology: a psycho social introduction by Mirilia Bonnes, Gianfranco Secchiaroli
• PERSONALITY. By K. G. Gordon, M.D.,D,Sc.,M.R.C.P.Ed. 10/6 net
• EDUCATIONAL PSYCHOLOGY; its Problems and Methods By Charles Fox, M.A., Lecturer on Education in the University of Cambrio!ge.
• PROBLEMS OF PERSONALITY : a Volume of Essays in honour of Morton Prince.
• http://www.discprofile.com/whatisdisc.htm
• www.wikipedia.org
AUTHORS
First Author– Mr. Sreenidhi S K, Managing Director, Oscar Murphy Life Strategists and [email protected]. Second Author – Ms. Tay Chinyi Helena, Executive Director, Oscar Murphy Life Strategists and [email protected]. Third Author – Ms. Shoba Aby John, Content Developer, Oscar Murphy Life Strategists and [email protected]. Correspondence Author – Mr. Sreenidhi S K, [email protected], [email protected], 9901983545

International Journal of Scientific and Research Publications, Volume 7, Issue 4, April 2017 230 ISSN 2250-3153
www.ijsrp.org
MINIMUM UNORTHODOX MEASURE OF ENTROPY FOR RESCRIBED ARITHMETIC MEAN
AND SECOND ORDER MOMENT Shalu Garg**
** MITRC, Alwar, India
Abstract-Minimum entropy probability distribution is necessary
for complete information of probability distribution. But it has
not been calculated so much whenever Maximum entropy
probability distribution has been obtained by using different
measures. Due to concave nature of entropy, minimization is
complicated than maximization. In the present paper, We use
Unorthodox measure of entropy to obtain minimum entropy for
given Arithmetic mean and Second order moment. . Index Terms- Unorthodox measure, switching point, consistent values of moments, feasible region.
I. INTRODUCTION The word ‘Uncertainty’ is associated with entropy. Shannon
introduced the concept of entropy [7] in 1948 to provide a
quantitative measure of this uncertainty. After this measure many
other measures of entropy came in existence. These are Renyi’s
[6], Havrda – Charvat [3] measure etc. Since Shannon entropy is
concave function, a lot of work has been done on its
maximization and its applications.
Kapur [4] introduced Unorthodox measure of entropy, S = − 𝑙𝑙𝑙𝑙 𝑝𝑝𝑚𝑚𝑚𝑚𝑚𝑚
where 𝑝𝑝𝑚𝑚𝑚𝑚𝑚𝑚 = max(𝑝𝑝1,𝑝𝑝2.−−−−𝑝𝑝𝑙𝑙)
It is concave function of probability distribution.
Entropy is maximum when probability distribution is as equal as
possible . Here we have minimum information about system. As
we increase information consistent with initial information in the
form of moments, entropy decreases. This decreases until we obtain minimum entropy probability distribution. Now, we have
complete information about system. . Maximum entropy
probability distribution is most unbiased, most uniform and most
random while minimum entropy probability distribution is most biased, least uniform and least random. Entropy is concave
function so minimization of entropy is complicated than
maximization.
Kapur [5] initiated the work to obtain minimum
Shannon entropy. Anju Rani [2] obtained minimum entropy for
Shannon measure and Havrda- Charvat measure when one
moment is prescribed. In this paper, we have obtained analytical
expressions for minimum Unorthodox measure of entropy for
given Arithmetic mean and Second order moment. We have
obtained also numerical values of entropy for given these two
moments.
II MINIMUM VALUE OF AN UNORTHODOX MEASURE
OF ENTROPY WHEN ARITHMETIC MEAN AND
SECOND ORDER MOMENT ARE GIVEN: SPECIAL
CASE:
Let x be a discrete variate which takes all values from 1
to n with probabilities, 𝑝𝑝1,𝑝𝑝2.−−−−𝑝𝑝𝑙𝑙 . The Arithmetic mean and
Second order moment of this distribution are prescribed as M and
�μ ′2�
1/2. There will be many distributions having these
particular values of M & �μ ′2�
1/2 and each of these will have a
particular value of entropy. Out of these entropies our aim is to
find out minimum value of entropy i.e. Smin. Hence, we have to
minimize
S= − 𝑙𝑙𝑙𝑙 𝑝𝑝𝑚𝑚𝑚𝑚𝑚𝑚 - -(1)
subject to
� 𝑙𝑙
𝑖𝑖=1
𝑝𝑝𝑖𝑖 = 1 , � 𝑖𝑖𝑙𝑙
𝑖𝑖=1
𝑝𝑝𝑖𝑖 = M , � 𝑖𝑖2𝑝𝑝𝑖𝑖
𝑙𝑙
𝑖𝑖=1
= μ ′2
- -(2)

International Journal of Scientific and Research Publications, Volume 7, Issue 4, April 2017 231 ISSN 2250-3153
www.ijsrp.org
Since there are three linear constraints, the minimum entropy
probability distribution will have at most three non-zero
components. Let these be 𝑝𝑝ℎ ,𝑝𝑝𝑘𝑘 ,𝑝𝑝𝑙𝑙 at points ℎ, 𝑘𝑘 and 𝑙𝑙
respectively, where 1≤ ℎ < 𝑘𝑘 < 𝑙𝑙 ≤ n . Then from equation (2)
𝑝𝑝ℎ + 𝑝𝑝𝑘𝑘 + 𝑝𝑝𝑙𝑙 = 1 , ℎ𝑝𝑝ℎ + 𝑘𝑘𝑝𝑝𝑘𝑘 + 𝑙𝑙𝑝𝑝𝑙𝑙 = M , h2𝑝𝑝ℎ + 𝑘𝑘2𝑝𝑝𝑘𝑘 + 𝑙𝑙2𝑝𝑝𝑙𝑙 = μ ′2
- -(3)
from equation (3)
𝑝𝑝ℎ =μ ′2+�𝑘𝑘𝑙𝑙−M(𝑘𝑘+𝑙𝑙)�
𝑘𝑘𝑙𝑙−ℎ(𝑘𝑘+𝑙𝑙−ℎ) , 𝑝𝑝𝑘𝑘 =
μ ′2+�ℎ𝑙𝑙−M(ℎ+𝑙𝑙)�
ℎ𝑙𝑙−𝑘𝑘(ℎ+𝑙𝑙−𝑘𝑘) ,
𝑝𝑝𝑙𝑙 =μ ′2+�ℎ𝑘𝑘−M(ℎ+𝑘𝑘)�
ℎ𝑘𝑘−𝑙𝑙(ℎ+𝑘𝑘−𝑙𝑙) - -(4)
Here we study the shifting behavior of 𝑝𝑝𝑚𝑚𝑚𝑚𝑚𝑚 to calculate
minimum entropy. Probability 𝑝𝑝ℎ increases with ℎ & 𝑘𝑘 and
decreases with 𝑙𝑙 ; 𝑝𝑝𝑘𝑘 decreases with ℎ and increases with k & 𝑙𝑙
;𝑝𝑝𝑙𝑙 increases with ℎ, decreases with 𝑘𝑘, 𝑙𝑙. According to this we
study the shifting of 𝑝𝑝𝑚𝑚𝑚𝑚𝑚𝑚 from one set of (ℎ, 𝑘𝑘, 𝑙𝑙) to another set
of (ℎ, 𝑘𝑘, 𝑙𝑙).
First we calculate feasible range of �μ ′2�
1/2 for given value
of M. For this we use following expressions by Anju Rani [2].
(i) If M is an integer , then
�μ ′2�𝑚𝑚𝑖𝑖𝑙𝑙
1/2= M - -(5)
If M is not an integer, M = [M] + L , 0 < L < 1, where [M]
represents integral part of M. Then
�μ ′2�𝑚𝑚𝑖𝑖𝑙𝑙
= [M]2 + L(2[M] + 1) - -(6)
(ii) The expression for maximum value of �μ ′2�𝑚𝑚𝑚𝑚𝑚𝑚
is
given as
�μ ′2�𝑚𝑚𝑚𝑚𝑚𝑚
= M(n + 1) − n - -(7)
For the given values of M and �μ ′2�𝑚𝑚𝑖𝑖𝑙𝑙
, probability 𝑝𝑝ℎ is
zero at point (1, 𝑚𝑚, 𝑚𝑚 + 1) or 𝑝𝑝𝑙𝑙 is zero at point (𝑚𝑚, 𝑚𝑚 + 1, 𝑙𝑙) &
for the given values of M and �μ ′2�𝑚𝑚𝑚𝑚𝑚𝑚
, probability 𝑝𝑝𝑘𝑘 = 0 at
point (1, 𝑙𝑙 − 1, 𝑙𝑙). Here 𝑝𝑝ℎ = 0 for {1 ≤ ℎ < 𝑘𝑘 < H ≤ 𝑙𝑙 ≤ 𝑙𝑙} or {1 ≤ ℎ < 𝑘𝑘 ≤ H < 𝑙𝑙 ≤ 𝑙𝑙} and 𝑝𝑝𝑙𝑙 = 0 for {1 ≤ ℎ ≤ H < 𝑘𝑘 < 𝑙𝑙 ≤
n} or {1 ≤ ℎ < H ≤ k < 𝑙𝑙 ≤ n}. For the given values of M and
�μ ′2�𝑚𝑚𝑖𝑖𝑙𝑙
, the values of entropies are same at all existing points
and similarly for the given values of M and �μ ′2�𝑚𝑚𝑚𝑚𝑚𝑚
, the values
of entropies are same at all existing points. Here (a, a+1] is
interval in which Arithmetic mean lies.
Every interval is divided into many subintervals such that for
given value of Arithmetic mean, the value of minimum entropy
for any two subintervals is same. These values are called
switching points. For these values, we switch over entropy from
one set of values of (ℎ, 𝑘𝑘, 𝑙𝑙) to another set of values of (ℎ, 𝑘𝑘, 𝑙𝑙).
Let M ∈ (a, a+1] , 1 ≤ a < n , where a is an integer. h can take values 1,2,….,a; k can take values h+1,….,n-1; l can
take values a+1,….…..,n. We calculate probability distribution
in each possible interval for different values of M and �μ ′2�
1/2.
For value �μ ′2�𝑚𝑚𝑖𝑖𝑙𝑙
, probability distribution is calculated at point
(𝑚𝑚, 𝑚𝑚 + 1, 𝑙𝑙) for 𝑚𝑚 < 𝑙𝑙 − 1 and at point (1,𝑚𝑚, 𝑚𝑚 + 1) for a = n-1. On the basis of probability distribution, we consider two cases. CASE I: WHEN 𝒂𝒂 < 𝒏𝒏 − 𝟏𝟏 There are three possibilities: (a) When 𝒑𝒑𝒉𝒉 is maximum probability at point (a, a+1, a+2): In this case, minimum entropy occurs at point 𝑝𝑝ℎ (a, a+1, a+2). From equations (1) &(4)
s𝑚𝑚𝑖𝑖𝑙𝑙 = −𝑙𝑙𝑙𝑙 �μ ′
2+( �𝑚𝑚+1)(𝑚𝑚+2)−M(2𝑚𝑚+3)�
(𝑚𝑚+1)(𝑚𝑚+2)−𝑚𝑚(𝑚𝑚+3) � - -(8)
(b) When 𝒑𝒑𝒌𝒌 is maximum probability at point (a, a+1, a+2): For value �μ ′
2�𝑚𝑚𝑖𝑖𝑙𝑙
, 𝑝𝑝𝑘𝑘(𝑚𝑚,𝑚𝑚 + 1,𝑚𝑚 + 2) = 𝑝𝑝𝑙𝑙(𝑚𝑚 − 1,𝑚𝑚,𝑚𝑚 + 1)
then 𝑝𝑝𝑙𝑙(a-1, a, a+1) is considered as maximum probability since
𝑝𝑝𝑘𝑘 is decreasing and 𝑝𝑝𝑙𝑙 is increasing with respect to Second order
moment for given value of Arithmetic mean.
From equations (1) & (4)
s𝑚𝑚𝑖𝑖𝑙𝑙 = −𝑙𝑙𝑙𝑙 �μ ′2+(�𝑚𝑚−1)𝑚𝑚−M(2𝑚𝑚−1)�
(𝑚𝑚−1)𝑚𝑚−(𝑚𝑚+1)(𝑚𝑚−2) � - -(9)
(c) When 𝒑𝒑𝒉𝒉(𝒂𝒂, �𝒂𝒂� + 𝟏𝟏,𝒂𝒂 + 𝟐𝟐) = 𝒑𝒑𝒌𝒌(𝒂𝒂, �𝒂𝒂� + 𝟏𝟏,𝒂𝒂 + 𝟐𝟐):

International Journal of Scientific and Research Publications, Volume 7, Issue 4, April 2017 232 ISSN 2250-3153
www.ijsrp.org
In this situation, also 𝑝𝑝𝑘𝑘(a-1, a, a+1) = 𝑝𝑝𝑙𝑙(a-1, a, a+1) for �μ ′
2�𝑚𝑚𝑖𝑖𝑙𝑙
. Since 𝑝𝑝𝑘𝑘 is decreasing, 𝑝𝑝ℎ and 𝑝𝑝𝑙𝑙 are increasing with
respect to sth order moment , then 𝑝𝑝ℎ (a, a+1, a+2) and 𝑝𝑝𝑙𝑙(a-1, a, a+1) are considered. Out of these values one may be maximum for μ ′
2, where μ ′
2 ≳ �μ ′
2�𝑚𝑚𝑖𝑖𝑙𝑙
.Now we take greatest among
these probabilities. Hence, From equation (8)
s𝑚𝑚𝑖𝑖𝑙𝑙 = −𝑙𝑙𝑙𝑙 �μ ′
2+( �𝑚𝑚+1)(𝑚𝑚+2)−M(2𝑚𝑚+3)�
(𝑚𝑚+1)(𝑚𝑚+2)−𝑚𝑚(𝑚𝑚+3) �, for 𝑝𝑝ℎ > 𝑝𝑝𝑙𝑙
- -(10) and, from equation (9)
s𝑚𝑚𝑖𝑖𝑙𝑙 = −𝑙𝑙𝑙𝑙 �μ ′2+(�𝑚𝑚−1)𝑚𝑚−M(2𝑚𝑚−1)�
(𝑚𝑚−1)𝑚𝑚−(𝑚𝑚+1)(𝑚𝑚−2) � ,for 𝑝𝑝𝑙𝑙 > 𝑝𝑝ℎ
- -(11) CASE II: WHEN 𝒂𝒂 = 𝒏𝒏 − 𝟏𝟏 There are two possibilities. These are (a) If 𝒑𝒑𝒌𝒌 is maximum probability for point (1, a, a+1): In this case, s𝑚𝑚𝑖𝑖𝑙𝑙 = −𝑙𝑙𝑙𝑙𝑝𝑝𝑘𝑘(1, 𝑚𝑚, 𝑚𝑚 + 1)
s𝑚𝑚𝑖𝑖𝑙𝑙 = −𝑙𝑙𝑙𝑙 ��μ ′2+(�𝑚𝑚+1)−M(𝑚𝑚+2)�
(𝑚𝑚+1)−2𝑚𝑚 ��(from eq. 4)
- -(12) (b) If 𝒑𝒑𝒍𝒍 is maximum probability at point (1, a, a+1): In this case we consider point (a-1, a, a+1) for entropy to be minimum since 𝑝𝑝𝑙𝑙 is maximum for maximum value of h and
𝑝𝑝𝑙𝑙(1,𝑚𝑚,𝑚𝑚 + 1) = 𝑝𝑝𝑙𝑙(𝑚𝑚 − 1,𝑚𝑚,𝑚𝑚 + 1), for �μ ′2�𝑚𝑚𝑖𝑖𝑙𝑙
then, s𝑚𝑚𝑖𝑖𝑙𝑙 = −𝑙𝑙𝑙𝑙𝑝𝑝𝑙𝑙(𝑚𝑚 − 1, 𝑚𝑚, 𝑚𝑚 + 1)
s𝑚𝑚𝑖𝑖𝑙𝑙 = −𝑙𝑙𝑙𝑙 ��μ ′2+(�𝑚𝑚−1)𝑚𝑚−M(2𝑚𝑚−1)�
(𝑚𝑚−1)𝑚𝑚−(𝑚𝑚+1)(𝑚𝑚−2) �� - -(13)
Now, we study three types of points to calculate minimum
entropy
and its shifting behavior. These are-
(𝐴𝐴) 𝑝𝑝ℎ at point (a, a+∝,𝑚𝑚+∝+1) (𝐵𝐵) 𝑝𝑝𝑙𝑙 at point (a+ 𝛽𝛽, a+𝛽𝛽+1, a+ 𝛾𝛾)
(𝐶𝐶)𝑝𝑝𝑘𝑘 at point (1, a+𝛿𝛿,𝑙𝑙)
where 1 ≤ ∝ ≤ n-2, 1-a ≤ 𝛽𝛽 ≤ n-3, 2 ≤ 𝛾𝛾 ≤ n-1,
1≤ 𝛿𝛿 ≤ n-2 .
IF MAXIMUM PROBABILITY OCCURS AT
𝒑𝒑𝒉𝒉(a, a+∝,𝒂𝒂+∝+1):
There are two cases:
(a) a > 1 (b) a=1
(a) When a > 1: We study the shifting of minimum entropy
from point (a, a+∝,𝑚𝑚+∝+1) to another point. Maximum
probability or minimum entropy may shifts from point
𝑝𝑝ℎ (a, a+∝, 𝑚𝑚+∝+1) to point 𝑝𝑝𝑙𝑙(a-1, a, a+1). Since 𝑝𝑝𝑙𝑙 is
maximum for maximum value of h & minimum value of k and
l. Now, we are equating probabilities at two different points to
find out switching point, at which maximum probability shifts
from one point to another point. These probabilities are as:
𝑝𝑝ℎ(𝑚𝑚,𝑚𝑚+∝,𝑚𝑚+∝ +1) = 𝑝𝑝𝑙𝑙(𝑚𝑚 − 1,𝑚𝑚,𝑚𝑚 + 1)
μ ′2+(�𝑚𝑚+∝)(𝑚𝑚+∝+1)−M(2𝑚𝑚+2∝+1)�
(𝑚𝑚+∝)(𝑚𝑚+∝+1)−𝑚𝑚(𝑚𝑚+2∝+1) =
μ ′2+(�𝑚𝑚−1)𝑚𝑚−M(2𝑚𝑚−1)�
𝑚𝑚(𝑚𝑚−1)−(𝑚𝑚+1)(𝑚𝑚−2)
- -(14) by solving this equation, we get
��μ ′2�
a= A{(�𝑚𝑚−1)𝑚𝑚−M(2𝑚𝑚−1)}−B{(�𝑚𝑚+∝)(𝑚𝑚+∝+1)−M(2𝑚𝑚+2∝+1) �} �
B−A �
- -(15)
Where A = (𝑚𝑚+∝)(𝑚𝑚+∝ +1) − 𝑚𝑚(𝑚𝑚 + 2 ∝ +1)
B = 𝑚𝑚(𝑚𝑚 − 1) − (𝑚𝑚 + 1)(𝑚𝑚 − 2) Now, two cases arise:
(A) �μ ′2�
a lies in the feasible region.
(B) �μ ′2�
a does not lie in the feasible region.
(A) �𝛍𝛍 ′𝟐𝟐�𝐚𝐚 lies in the feasible region:
It means, probability distribution should exist for �μ ′2�
a at
corresponding points. In this case minimum entropy shifts
from 𝑝𝑝ℎ (a, a+∝,𝑚𝑚+∝+1) to 𝑝𝑝𝑙𝑙(a-1, a, a+1). So,
s𝑚𝑚𝑖𝑖𝑙𝑙 = −𝑙𝑙𝑙𝑙 ��μ ′2+(�𝑚𝑚+∝)(𝑚𝑚+∝+1)−M(2𝑚𝑚+2∝+1)�
(𝑚𝑚+∝)(𝑚𝑚+∝+1)−𝑚𝑚(𝑚𝑚+2∝+1) ��,
for μ ′2
≤ �μ ′2�
a - -(16)
and s𝑚𝑚𝑖𝑖𝑙𝑙 = −𝑙𝑙𝑙𝑙 ��μ ′2+(�𝑚𝑚−1)𝑚𝑚−M(2𝑚𝑚−1)�
𝑚𝑚(𝑚𝑚−1)−(𝑚𝑚+1)(𝑚𝑚−2) ��,
for �μ ′2�
a ≤ μ ′
2 - -(17)

International Journal of Scientific and Research Publications, Volume 7, Issue 4, April 2017 233 ISSN 2250-3153
www.ijsrp.org
(B) If �𝛍𝛍 ′𝟐𝟐�𝐚𝐚 does not lie in the feasible region: In this
case maximum probability can not shift from 𝑝𝑝ℎ (a, a+∝
,𝑚𝑚+∝+1) to 𝑝𝑝𝑙𝑙(a-1, a, a+1). Depending on the value of 𝑚𝑚,
there are two cases:
(B1) 𝑚𝑚 = 2 (B2) 𝑚𝑚 > 2
(B1)When 𝒂𝒂 = 𝟐𝟐:
Maximum probability shifts to 𝑝𝑝𝑙𝑙(a-1, a, a+2) since
value of h can not be reduced further. Then 𝑝𝑝ℎ(𝑚𝑚,𝑚𝑚+∝,𝑚𝑚+∝ +1) = 𝑝𝑝𝑙𝑙(𝑚𝑚 − 1,𝑚𝑚,𝑚𝑚 + 2) - -(18)
μ ′2
+ (�𝑚𝑚+∝)(𝑚𝑚+∝ +1) − M(2𝑚𝑚 + 2 ∝ +1)�
(𝑚𝑚+∝)(𝑚𝑚+∝ +1) − 𝑚𝑚(𝑚𝑚 + 2 ∝ +1)
= �μ ′
2+ (�𝑚𝑚 − 1)𝑚𝑚 − M(2𝑚𝑚 − 1)�
𝑚𝑚(𝑚𝑚 − 1) − (𝑚𝑚 + 2)(𝑚𝑚 − 3) �
by solving this equation , we get
�μ ′2�
b=
A{( �𝑚𝑚−1)𝑚𝑚−M(2𝑚𝑚−1)}−C{( �𝑚𝑚+∝)(𝑚𝑚+∝+1)−M(2𝑚𝑚+2∝+1)�}� C−A
- -
(19) Where C = 𝑚𝑚(𝑚𝑚 − 1) − (𝑚𝑚 + 2)(𝑚𝑚 − 3)
If �μ ′2�
b lies in the feasible region then maximum probability
shifts from 𝑝𝑝ℎ(𝑚𝑚,𝑚𝑚+∝,𝑚𝑚+∝ +1) to 𝑝𝑝𝑙𝑙(𝑚𝑚 − 1,𝑚𝑚,𝑚𝑚 + 2). Then,
s𝑚𝑚𝑖𝑖𝑙𝑙 = −𝑙𝑙𝑙𝑙 �μ ′2+(�𝑚𝑚+∝)(𝑚𝑚+∝+1)−M(2𝑚𝑚+2∝+1)�
(𝑚𝑚+∝)(𝑚𝑚+∝+1)−𝑚𝑚(𝑚𝑚+2∝+1) � ,
for μ ′2
≤ �μ ′2�
b - -(20)
and s𝑚𝑚𝑖𝑖𝑙𝑙 = −𝑙𝑙𝑙𝑙 �μ ′2+(�𝑚𝑚−1)𝑚𝑚−M(2𝑚𝑚−1)�
𝑚𝑚(𝑚𝑚−1)−(𝑚𝑚+2)(𝑚𝑚−3) �,
for �μ ′2�
b ≤ μ ′
2 - -(21)
If �μ ′2�
b does not lie in the feasible region then value of 𝑙𝑙 is
increased gradually upto 𝑚𝑚+∝ in 𝑝𝑝𝑙𝑙(𝑚𝑚 − 1,𝑚𝑚,𝑚𝑚 + 2) and
probabilities will be equated with 𝑝𝑝ℎ(𝑚𝑚,𝑚𝑚+∝,𝑚𝑚+∝ +1) as
above. And if any switching point can not be obtained then
probabilities are equated as
𝑝𝑝ℎ(𝑚𝑚,𝑚𝑚+∝,𝑚𝑚+∝ +1) = 𝑝𝑝ℎ(𝑚𝑚,𝑚𝑚+∝ +1,𝑚𝑚+∝ +2). - -(22)
by solving this equation, we get
�μ ′2�
c= (2𝑚𝑚+∝ +1) − 𝑚𝑚(𝑚𝑚+∝ +1) - -(23)
Minimum entropy shifts from 𝑝𝑝ℎ(𝑚𝑚,𝑚𝑚+∝,𝑚𝑚+∝ +1) to
𝑝𝑝ℎ(𝑚𝑚,𝑚𝑚+∝ +1,𝑚𝑚+∝ +2).
For μ ′2
≤ �μ ′2�
c
s𝑚𝑚𝑖𝑖𝑙𝑙 = −𝑙𝑙𝑙𝑙 �μ ′2+(�𝑚𝑚+∝)(𝑚𝑚+∝+1)−M(2𝑚𝑚+2∝+1)�
(𝑚𝑚+∝)(𝑚𝑚+∝+1)−𝑚𝑚(𝑚𝑚+2∝+1) �
- -(24)
And, for �μ ′2�
c ≤ μ ′
2
s𝑚𝑚𝑖𝑖𝑙𝑙 =
−𝑙𝑙𝑙𝑙 �μ ′2+(�𝑚𝑚+∝+1)(𝑚𝑚+∝+2)−M(2𝑚𝑚+2∝+3)�
(𝑚𝑚+∝+1)(𝑚𝑚+∝+2)−𝑚𝑚(𝑚𝑚+2∝+3) �
- -(25) (B2) When 𝒂𝒂 > 𝟐𝟐 :
In this case, values of ℎ and 𝑘𝑘 are decreased by one from 𝑝𝑝𝑙𝑙(𝑚𝑚 − 1,𝑚𝑚,𝑚𝑚 + 1) simultaneously and probabilities are equated as: 𝑝𝑝ℎ(𝑚𝑚,𝑚𝑚+∝,𝑚𝑚+∝ +1) = 𝑝𝑝𝑙𝑙(𝑚𝑚 − 2,𝑚𝑚 − 1,𝑚𝑚 + 1) - -(26) μ ′2+(�𝑚𝑚+∝)(𝑚𝑚+∝+1)−M(2𝑚𝑚+2∝+1)�
(𝑚𝑚+∝)(𝑚𝑚+∝+1)−𝑚𝑚(𝑚𝑚+2∝+1) =
μ ′2+(�𝑚𝑚−2)(𝑚𝑚−1)−M(2𝑚𝑚−3)�
(𝑚𝑚−2)(𝑚𝑚−1)−(𝑚𝑚+1)(𝑚𝑚−4)
by solving this equation, we get
�μ ′2�
d=
A{(�𝑚𝑚−2)(𝑚𝑚−1)−(2𝑚𝑚−3)M}−D{(�𝑚𝑚+∝)(𝑚𝑚+∝+1)−M(2𝑚𝑚+2∝+1)�}� D−A
- -(27) where, D = (𝑚𝑚 − 2)(𝑚𝑚 − 1) − (𝑚𝑚 + 1)(𝑚𝑚 − 4)
If �μ ′2�
d lies in the feasible region then maximum probability
shifts from 𝑝𝑝ℎ(𝑚𝑚,𝑚𝑚+∝,𝑚𝑚+∝ +1) to 𝑝𝑝𝑙𝑙(𝑚𝑚 − 2,𝑚𝑚 − 1,𝑚𝑚 + 1) and if �μ ′
2�
d does not lie in the feasible region then we
proceed similarly as above by decreasing the values of ℎ & 𝑘𝑘 from 𝑝𝑝𝑙𝑙(𝑚𝑚 − 1,𝑚𝑚,𝑚𝑚 + 1) and equating probabilities with 𝑝𝑝ℎ(𝑚𝑚,𝑚𝑚+∝,𝑚𝑚+∝ +1). If any value of switching point can not be obtained then probabilities are equated as: 𝑝𝑝ℎ(𝑚𝑚,𝑚𝑚+∝,𝑚𝑚+∝ +1) = 𝑝𝑝ℎ(𝑚𝑚,𝑚𝑚+∝ +1,𝑚𝑚+∝ +2) by solving this equation, we get �μ ′
2�
c (eq. 23)

International Journal of Scientific and Research Publications, Volume 7, Issue 4, April 2017 234 ISSN 2250-3153
www.ijsrp.org
For 𝑚𝑚+∝ +1 = 𝑙𝑙 , minimum entropy shifts from 𝑝𝑝ℎ(𝑚𝑚,𝑚𝑚+∝, 𝑚𝑚+∝+1 to 𝑝𝑝𝑘𝑘1,𝑚𝑚, 𝑙𝑙 and switching point for this shifting is �μ ′
2�
c.
(b)When 𝒂𝒂 = 𝟏𝟏: In this situation, maximum probability
shifts from 𝑝𝑝ℎ(𝑚𝑚,𝑚𝑚+∝,𝑚𝑚+∝ +1) to 𝑝𝑝ℎ(𝑚𝑚,𝑚𝑚+∝ +1,𝑚𝑚+∝
+2. So, 𝑝𝑝ℎ(𝑚𝑚,𝑚𝑚+∝,𝑚𝑚+∝ +1) = 𝑝𝑝ℎ(𝑚𝑚,𝑚𝑚+∝ +1,𝑚𝑚+∝ +2) - -(28) by solving this equation, we get �μ ′
2�
c as switching point.
For 𝑚𝑚+∝ +2 = n , 𝑝𝑝ℎ(𝑚𝑚,𝑚𝑚+∝ +1,𝑚𝑚+∝ +2) becomes 𝑝𝑝ℎ(1,𝑙𝑙 − 1,𝑙𝑙) and maximum probability may shifts from 𝑝𝑝ℎ(1,𝑙𝑙 − 1,𝑙𝑙) to 𝑝𝑝𝑙𝑙(1, 2,𝑙𝑙). For getting switching point for this shifting, probabilities are equated as: 𝑝𝑝ℎ(1,𝑙𝑙 − 1,𝑙𝑙) = 𝑝𝑝𝑙𝑙(1, 2,𝑙𝑙) - -(29) by solving this equation, we get �μ ′
2�
e - -(30)
s𝑚𝑚𝑖𝑖𝑙𝑙 = −𝑙𝑙𝑙𝑙𝑝𝑝ℎ(1, 𝑙𝑙 − 1, 𝑙𝑙) for μ ′2
≤ �μ ′2�
e
s𝑚𝑚𝑖𝑖𝑙𝑙 = −𝑙𝑙𝑙𝑙𝑝𝑝𝑙𝑙( 1,2 , 𝑙𝑙) for �μ ′2�
e ≤ μ ′
2.
IV IF MAXIMUM PROBABILITY OCCURS AT
𝒑𝒑𝒍𝒍(𝒂𝒂 + 𝛃𝛃,𝒂𝒂 + 𝛃𝛃 + 𝟏𝟏,𝒂𝒂 + 𝜸𝜸): There are two cases:
(a) 𝑚𝑚 + β > 1 (b) 𝑚𝑚 + β = 1
(a) When 𝒂𝒂 + 𝛃𝛃 > 1: From calculation, we observe that maximum probability shifts
from 𝑝𝑝𝑙𝑙(𝑚𝑚 + β,𝑚𝑚 + β + 1,𝑚𝑚 + 𝛾𝛾) to 𝑝𝑝𝑙𝑙(𝑚𝑚 + β − 1,𝑚𝑚 + β,𝑚𝑚 +
𝛾𝛾. So, probabilities are equated as:
𝑝𝑝𝑙𝑙(𝑚𝑚 + β,𝑚𝑚 + β + 1,𝑚𝑚 + 𝛾𝛾) = 𝑝𝑝𝑙𝑙(𝑚𝑚 + β − 1,𝑚𝑚 + β,𝑚𝑚 + 𝛾𝛾) - -(31)
by solving this equation, we get
�μ ′2�
f= M(2𝑚𝑚 + β + 𝛾𝛾) − (𝑚𝑚 + β)(𝑚𝑚+ 𝛾𝛾) - -(32)
Now, for μ ′2
≤ �μ ′2�
f,
s𝑚𝑚𝑖𝑖𝑙𝑙 = −𝑙𝑙𝑙𝑙 �μ ′2+(�𝑚𝑚+β)(𝑚𝑚+β+1)−M(2𝑚𝑚+2β+1)�
(𝑚𝑚+β)(𝑚𝑚+β+1)−(𝑚𝑚+𝛾𝛾)(𝑚𝑚+2β−𝛾𝛾+1) � -(33)
And, for �μ ′2�
f ≤ μ ′
2 ,
s𝑚𝑚𝑖𝑖𝑙𝑙 = −𝑙𝑙𝑙𝑙 �μ ′2+(�𝑚𝑚+β−1)(𝑚𝑚+β)−M(2𝑚𝑚+2β−1)�
(𝑚𝑚+β−1)(𝑚𝑚+β)−(𝑚𝑚+𝛾𝛾)(𝑚𝑚+2β−𝛾𝛾−1) � - -(34)
Similarly, we reduce the values of ℎ and 𝑘𝑘 by one from
𝑝𝑝𝑙𝑙(𝑚𝑚 + β − 1,𝑚𝑚 + β,𝑚𝑚 + 𝛾𝛾) simultaneously and find out
switching points. We continue the process till ℎ = 1, 𝑘𝑘 = 2.
(b) When 𝒂𝒂 + 𝛃𝛃 = 𝟏𝟏:
From calculation, we observe that maximum probability shifts
from 𝑝𝑝𝑙𝑙(1, 2,𝑚𝑚 + 𝛾𝛾) to 𝑝𝑝𝑘𝑘(1,𝑚𝑚 + 𝛾𝛾, n). So
𝑝𝑝𝑙𝑙(1, 2,𝑚𝑚 + 𝛾𝛾) = 𝑝𝑝𝑘𝑘(1, 𝑚𝑚 + 𝛾𝛾,𝑙𝑙) - -(35)
by solving this equation, we get
�μ ′2�
g= M(𝑚𝑚 + 𝛾𝛾 + 1) − (𝑚𝑚 + 𝛾𝛾) - -(36)
Now, for μ ′2
≤ �μ ′2�
g
s𝑚𝑚𝑖𝑖𝑙𝑙 = −𝑙𝑙𝑙𝑙 �μ ′2+2 �−3M)�
2−(𝑚𝑚+𝛾𝛾)(3−𝑚𝑚−𝛾𝛾) � - -(37)
and, for �μ ′2�
g ≤ μ ′
2
s𝑚𝑚𝑖𝑖𝑙𝑙 = −𝑙𝑙𝑙𝑙 �μ ′2+𝑙𝑙 �−M(𝑙𝑙+1)�
𝑙𝑙−(𝑚𝑚+𝛾𝛾)(𝑙𝑙+1−𝑚𝑚−𝛾𝛾) � - -(38)
V IF MAXIMUM PROBABILITY OCCURS AT
𝒑𝒑𝒌𝒌(𝟏𝟏,𝒂𝒂 + 𝛅𝛅,𝒏𝒏): To obtain switching point for minimum
entropy, probabilities are equated as:
𝑝𝑝𝑘𝑘(1,𝑚𝑚 + δ,𝑙𝑙) = 𝑝𝑝ℎ(𝑚𝑚 + δ − 1,𝑚𝑚 + δ,𝑚𝑚 + δ + 1) - -(39)
μ ′2�+𝑙𝑙−M(𝑙𝑙+1) �
𝑙𝑙−�(𝑚𝑚+δ)�(𝑙𝑙+1−𝑚𝑚−δ) =
μ ′2��+(𝑚𝑚+δ)�(𝑚𝑚+δ+1)−M(2𝑚𝑚+2δ+1)�
�(𝑚𝑚+δ)�(𝑚𝑚+δ+1)−(𝑚𝑚+δ−1)(𝑚𝑚+δ+2)
by solving this equation, we get
�μ ′2�
h = E ��{(𝑚𝑚+δ)�(𝑚𝑚+δ+1)−M(2𝑚𝑚+2δ+1)}−F{𝑙𝑙−M(𝑙𝑙+1)} �
F−E
- -(40) where, E = 𝑙𝑙 − (𝑚𝑚 + δ)(𝑙𝑙 + 1 − 𝑚𝑚 − δ)
F = (𝑚𝑚 + δ)(𝑚𝑚 + δ + 1) − (𝑚𝑚 + δ− 1)(𝑚𝑚 + δ + 2) And 𝑝𝑝𝑘𝑘(1,𝑚𝑚 + δ,𝑙𝑙) = 𝑝𝑝𝑙𝑙(𝑚𝑚 + δ− 1,𝑚𝑚 + δ,𝑚𝑚 + δ + 1)- -(41)
μ ′2�+𝑙𝑙−M(𝑙𝑙+1) �
𝑙𝑙−�(𝑚𝑚+δ)�(𝑙𝑙+1−𝑚𝑚−δ) =
μ ′2��+(𝑚𝑚+δ−1)(𝑚𝑚+δ)�−M(2𝑚𝑚+2δ−1)�
�(𝑚𝑚+δ−1)(𝑚𝑚+δ)�−(𝑚𝑚+δ+1)(𝑚𝑚+δ−2)
by solving this equation, we get
�μ ′2�
i= E ��{(𝑚𝑚+δ−1)(𝑚𝑚+δ)�−M(2𝑚𝑚+2δ−1)}−G{𝑙𝑙−M(𝑙𝑙+1)} �
G−E
- -(42) where, G = (𝑚𝑚 + δ − 1)(𝑚𝑚 + δ) − (𝑚𝑚 + δ + 1)(𝑚𝑚 + δ− 2)
First, we check the existence of probability
distributions for values �μ ′2�
h and �μ ′
2�
i at corresponding
points. If both values lie in the feasible region then minimum
value out of �μ ′2�
h and �μ ′
2�
i is considered as switching
point. If one of these values �μ ′2�
h and �μ ′
2�
i lies in the

International Journal of Scientific and Research Publications, Volume 7, Issue 4, April 2017 235 ISSN 2250-3153
www.ijsrp.org
feasible region then feasible value is considered as switching
point whether this value is greater or smaller.
If �μ ′2�
h lies in the feasible region and is minimum then
minimum entropy shifts from 𝑝𝑝𝑘𝑘(1,𝑚𝑚 + δ,𝑙𝑙) to 𝑝𝑝ℎ(𝑚𝑚 + δ −1, 𝑚𝑚+δ,𝑚𝑚+δ+1. So, for μ′2 ≤ μ′2h
s𝑚𝑚𝑖𝑖𝑙𝑙 = −𝑙𝑙𝑙𝑙 ���μ ′2�+𝑙𝑙−M(𝑙𝑙+1)�
𝑙𝑙−�(𝑚𝑚+δ)�(𝑙𝑙+1−𝑚𝑚−δ) ��� (from eq. 1 & 4) - -(43)
and, for �μ ′2�
h ≤ μ ′
2
s𝑚𝑚𝑖𝑖𝑙𝑙 = −𝑙𝑙𝑙𝑙 ���μ ′2��+(𝑚𝑚+δ−1)(𝑚𝑚+δ)�−M(2𝑚𝑚+2δ−1)�
�(𝑚𝑚+δ−1)(𝑚𝑚+δ)�−(𝑚𝑚+δ+1)(𝑚𝑚+δ−2) ��� - -(44)
And, if �μ ′2�
i lies in the feasible region and is minimum then
minimum entropy shifts from 𝑝𝑝𝑘𝑘(1,𝑚𝑚 + δ,𝑙𝑙) to 𝑝𝑝𝑙𝑙(𝑚𝑚 + δ −
1, 𝑚𝑚+δ,𝑚𝑚+δ+1.Hence, for μ′2 ≤ μ′2i
s𝑚𝑚𝑖𝑖𝑙𝑙 = −𝑙𝑙𝑙𝑙𝑝𝑝𝑘𝑘(1, 𝑚𝑚 + δ, 𝑙𝑙)
and, for �μ ′2�
i ≤ μ ′
2
s𝑚𝑚𝑖𝑖𝑙𝑙 = −𝑙𝑙𝑙𝑙 �μ ′2��+(𝑚𝑚+δ−1)(𝑚𝑚+δ)�−M(2𝑚𝑚+2δ−1)�
�(𝑚𝑚+δ−1)(𝑚𝑚+δ)�−(𝑚𝑚+δ+1)(𝑚𝑚+δ−2) � - -(45)
If both �𝛍𝛍 ′𝟐𝟐�𝐡𝐡 and �𝛍𝛍 ′
𝟐𝟐�𝐢𝐢 do not lie in the feasible
region: In this case, minimum entropy does not shift from
𝑝𝑝𝑘𝑘 at point (1,𝑚𝑚 + δ,𝑙𝑙) to 𝑝𝑝ℎ or 𝑝𝑝𝑙𝑙 at point (𝑚𝑚 + δ− 1,𝑚𝑚 +
δ,𝑚𝑚+δ+1. So, three cases arise-
(a) If +δ− 1 > 1 , 𝑚𝑚 + δ + 1 = 𝑙𝑙 (b) If +δ− 1 = 1 , 𝑚𝑚 + δ + 1 < 𝑙𝑙 (c) If +δ− 1 > 1 , 𝑚𝑚 + δ + 1 < 𝑙𝑙
(a) If +𝛅𝛅 − 𝟏𝟏 > 𝟏𝟏 , 𝒂𝒂 + 𝛅𝛅 + 𝟏𝟏 = 𝒏𝒏
Since probability 𝑝𝑝ℎ is maximum for maximum values of ℎ, k & 𝑝𝑝𝑙𝑙 is maximum for maximum value of ℎ and minimum
value of 𝑘𝑘. Then for equating probabilities, value of ℎ is
reduced by one from 𝑝𝑝ℎ(�𝑚𝑚 + δ − 1�,𝑚𝑚 + δ,𝑚𝑚 + δ +
1 and values of ℎ,𝑘𝑘 are reduced by one from
𝑝𝑝𝑙𝑙(�𝑚𝑚 + δ − 1�,𝑚𝑚 + δ,𝑚𝑚 + δ + 1). Hence probabilities are
equated as:
𝑝𝑝𝑘𝑘(1,𝑚𝑚 + δ,𝑙𝑙) = 𝑝𝑝ℎ(𝑚𝑚 + δ − 2,𝑚𝑚 + δ,𝑚𝑚 + δ + 1)
μ ′2�+𝑙𝑙−M(𝑙𝑙+1) �
𝑙𝑙−�(𝑚𝑚+δ)�(𝑙𝑙+1−𝑚𝑚−δ) =
μ ′2��+(𝑚𝑚+δ)�(𝑚𝑚+δ+1)−M(2𝑚𝑚+2δ+1)�
�(𝑚𝑚+δ)�(𝑚𝑚+δ+1)−(𝑚𝑚+δ−2)(𝑚𝑚+δ+3)
- -(46)
by solving this equation, we get
�μ′2�
j= E ��{(𝑚𝑚+δ)(𝑚𝑚+δ+1)�−M(2𝑚𝑚+2δ+1)}−H{𝑙𝑙−M(𝑙𝑙+1)}�
H−E
- -(47)
Again, we are equating probabilities as: 𝑝𝑝𝑘𝑘(1,𝑚𝑚 + δ,𝑙𝑙) = 𝑝𝑝𝑙𝑙(𝑚𝑚 + δ − 2,𝑚𝑚 + δ − 1,𝑚𝑚 + δ + 1)
𝑝𝑝𝑘𝑘(1,𝑚𝑚 + δ,𝑙𝑙) =μ ′
2��+(𝑚𝑚+δ−2)(𝑚𝑚+δ−1)�−M(2𝑚𝑚+2δ−3)�
�(𝑚𝑚+δ−2)(𝑚𝑚+δ−1)�−(𝑚𝑚+δ−4)(𝑚𝑚+δ+1) - -(48)
by solving this equation, we get
�μ ′2�
k= E ��{(𝑚𝑚+δ−2)(𝑚𝑚+δ−1)�−M(2𝑚𝑚+2δ−3)}−I{𝑙𝑙−M(𝑙𝑙+1)} �
I−E
- -(49)
Where, I = (𝑚𝑚 + δ − 2)(𝑚𝑚 + δ− 1) − (𝑚𝑚 + δ − 4)(𝑚𝑚 + δ +
1
If �μ ′2�
j lies in the feasible region and is minimum
then minimum entropy shifts from 𝑝𝑝𝑘𝑘(1,𝑚𝑚 + δ,𝑙𝑙) to 𝑝𝑝ℎ(𝑚𝑚 +
δ−2, 𝑚𝑚+δ,𝑚𝑚+δ+1. For μ′2 ≤ μ′2j
s𝑚𝑚𝑖𝑖𝑙𝑙 =μ ′2�+𝑙𝑙−M(𝑙𝑙+1)�
𝑙𝑙−�(𝑚𝑚+δ)�(𝑙𝑙+1−𝑚𝑚−δ) - -(50)
and, for �μ ′2�
j ≤ μ ′
2
s𝑚𝑚𝑖𝑖𝑙𝑙 = −𝑙𝑙𝑙𝑙 �μ ′2��+(𝑚𝑚+δ)�(𝑚𝑚+δ+1)−M(2𝑚𝑚+2δ+1)�
�(𝑚𝑚+δ)�(𝑚𝑚+δ+1)−(𝑚𝑚+δ−2)(𝑚𝑚+δ+3) � - -(51)
If �μ ′2�
k lies in the feasible region and is minimum then
minimum entropy shifts from 𝑝𝑝𝑘𝑘(1,𝑚𝑚 + δ,𝑙𝑙) to 𝑝𝑝𝑙𝑙(𝑚𝑚 +
δ−2, 𝑚𝑚+δ−1,𝑚𝑚+δ+1.
s𝑚𝑚𝑖𝑖𝑙𝑙 = −𝑙𝑙𝑙𝑙𝑝𝑝𝑘𝑘(1, 𝑚𝑚 + δ, 𝑙𝑙) , for μ ′2
≤ �μ ′2�
k
and, for �μ ′2�
k ≤ μ ′
2
s𝑚𝑚𝑖𝑖𝑙𝑙 = −𝑙𝑙𝑙𝑙 �μ ′2��+(𝑚𝑚+δ−2)(𝑚𝑚+δ−1)�−M(2𝑚𝑚+2δ−3)�
�(𝑚𝑚+δ−2)(𝑚𝑚+δ−1)�−(𝑚𝑚+δ−4)(𝑚𝑚+δ+1) � - -(52)

International Journal of Scientific and Research Publications, Volume 7, Issue 4, April 2017 236 ISSN 2250-3153
www.ijsrp.org
If �μ ′2�
j and �μ ′
2�
k do not lie in the feasible region then we
proceed similarly and find out switching points by decreasing
the values of ℎ & 𝑘𝑘 from 𝑝𝑝𝑙𝑙 upto 1 & 2 respectively and only
value of ℎ from 𝑝𝑝ℎ up to 1.
(b) If +𝛅𝛅 − 𝟏𝟏 = 𝟏𝟏 , 𝒂𝒂 + 𝛅𝛅 + 𝟏𝟏 < 𝒏𝒏
In this case, ℎ = 1 is fixed. So there will be no change in
value of ℎ. 𝑝𝑝ℎ is maximum for maximum value of 𝑘𝑘 &
minimum value of 𝑙𝑙 and 𝑝𝑝𝑙𝑙 is maximum for minimum values
of 𝑘𝑘 & 𝑙𝑙 then value of 𝑘𝑘 is increased by one and hence value
of 𝑙𝑙 is increased by one from 𝑝𝑝ℎ(�𝑚𝑚 + δ − 1�,𝑚𝑚 +
δ,𝑚𝑚+δ+1 and value of 𝑙𝑙 is increased by one from
𝑝𝑝𝑙𝑙(�𝑚𝑚 + δ − 1�,𝑚𝑚 + δ,𝑚𝑚 + δ + 1). Hence, we equate
probabilities as:
𝑝𝑝𝑘𝑘(1,𝑚𝑚 + δ,𝑙𝑙) = 𝑝𝑝ℎ(1,𝑚𝑚 + δ + 1,𝑚𝑚 + δ + 2)
μ ′2�+𝑙𝑙−M(𝑙𝑙+1)�
𝑙𝑙−�(𝑚𝑚+δ)�(𝑙𝑙+1−𝑚𝑚−δ) = �
μ ′2��+(𝑚𝑚+δ+1)�(𝑚𝑚+δ+2)−M(2𝑚𝑚+2δ+3) �
�(𝑚𝑚+δ+1) �(𝑚𝑚+δ+2)−(2𝑚𝑚+2δ+2) �
- -(53)
by solving this equation, we get
�μ ′2�
l= E ��{(𝑚𝑚+δ+1)(𝑚𝑚+δ+2)�−M(2𝑚𝑚+2δ+3)}−J{𝑙𝑙−M(𝑙𝑙+1)} �
J−E
- -(54)
Again, we are equating probabilities as: 𝑝𝑝𝑘𝑘(1,𝑚𝑚 + δ,𝑙𝑙) = 𝑝𝑝𝑙𝑙(1,𝑚𝑚 + δ,𝑚𝑚 + δ + 2)
μ ′2�+𝑙𝑙−M(𝑙𝑙+1) �
𝑙𝑙−�(𝑚𝑚+δ)�(𝑙𝑙+1−𝑚𝑚−δ) =
μ ′2��+(𝑚𝑚+δ)�−M(𝑚𝑚+δ+1)�
�2(𝑚𝑚+δ+1)� - -(55)
by solving this equation, we get
�μ ′2�
m= E ��{(𝑚𝑚+δ)�−M(𝑚𝑚+δ+1)}−K{𝑙𝑙−M(𝑙𝑙+1)} �
K−E - -(56)
Where, K = 2(𝑚𝑚 + δ + 1)
If �μ ′2�
l lies in the feasible region and is minimum
then minimum entropy shifts from point 𝑝𝑝𝑘𝑘(1,𝑚𝑚 + δ,𝑙𝑙) to
𝑝𝑝ℎ(1,𝑚𝑚 + δ + 1,𝑚𝑚 + δ + 2). Then, for μ ′2
≤ �μ ′2�
l
s𝑚𝑚𝑖𝑖𝑙𝑙 = −𝑙𝑙𝑙𝑙𝑝𝑝𝑘𝑘(1, 𝑚𝑚 + δ, 𝑙𝑙)
and, for �μ ′2�
l ≤ μ ′
2
s𝑚𝑚𝑖𝑖𝑙𝑙 = −𝑙𝑙𝑙𝑙 �μ ′2��+(𝑚𝑚+δ+1)�(𝑚𝑚+δ+2)−M(2𝑚𝑚+2δ+3)�
�(𝑚𝑚+δ+1)�(𝑚𝑚+δ+2)−(2𝑚𝑚+2δ+2) � - -(57)
And, if �μ ′2�
m lies in the feasible region and is minimum then
minimum entropy shifts from 𝑝𝑝𝑘𝑘(1, 𝑚𝑚 + δ,𝑙𝑙) to 𝑝𝑝𝑙𝑙(1, 𝑚𝑚 + δ,𝑚𝑚 + δ +
2, then
s𝑚𝑚𝑖𝑖𝑙𝑙 = −𝑙𝑙𝑙𝑙𝑝𝑝𝑘𝑘(1, 𝑚𝑚 + δ, 𝑙𝑙) , for μ ′2
≤ �μ ′2�
m
and, for �μ ′2�
m ≤ μ ′
2
s𝑚𝑚𝑖𝑖𝑙𝑙 = −𝑙𝑙𝑙𝑙 �μ ′2��+(𝑚𝑚+δ)�−M(𝑚𝑚+δ+1)�
�2(𝑚𝑚+δ+1)� � - -(58)
If both �μ ′2�
l and �μ ′
2�
m do not lie in the feasible region then
we proceed similarly and increase the value of 𝑙𝑙 upto 𝑙𝑙 and
find out switching points.
(c) If 𝒂𝒂 + 𝛅𝛅 − 𝟏𝟏 > 𝟏𝟏 and 𝒂𝒂 + 𝛅𝛅 + 𝟏𝟏 < 𝒏𝒏 : In this case probabilities are equated as follow:
𝑝𝑝𝑘𝑘(1,𝑚𝑚 + δ,𝑙𝑙) = 𝑝𝑝ℎ(𝑚𝑚 + δ − 1,𝑚𝑚 + δ + 1,𝑚𝑚 + δ + 2) and 𝑝𝑝𝑘𝑘(1, 𝑚𝑚 + δ, 𝑙𝑙) = 𝑝𝑝𝑙𝑙(𝑚𝑚 + δ − 2, 𝑚𝑚 + δ − 1, 𝑚𝑚 + δ + 1) Now, 𝑝𝑝𝑘𝑘(1,𝑚𝑚 + δ,𝑙𝑙) = 𝑝𝑝ℎ(𝑚𝑚 + δ − 1,𝑚𝑚 + δ + 1,𝑚𝑚 + δ + 2)
μ ′2�+𝑙𝑙−M(𝑙𝑙+1) �
𝑙𝑙−�(𝑚𝑚+δ)�(𝑙𝑙+1−𝑚𝑚−δ) =
μ ′2��+(𝑚𝑚+δ+1)�(𝑚𝑚+δ+2)−M(2𝑚𝑚+2δ+3)�
�(𝑚𝑚+δ+1)�(𝑚𝑚+δ+2)−(𝑚𝑚+δ−1)(𝑚𝑚+δ+4)
- -(59)
by solving this equation, we get
�μ ′2�
n= E ��{(𝑚𝑚+δ+1)(𝑚𝑚+δ+2)�−M(2𝑚𝑚+2δ+3)}−L{𝑙𝑙−M(𝑙𝑙+1)} �
L−E
- -(60)
Where,L = (𝑚𝑚 + δ + 1)(𝑚𝑚 + δ + 2) − (𝑚𝑚 + δ − 1)(𝑚𝑚 + δ +
4 Again, we are equating probabilities as:
𝑝𝑝𝑘𝑘(1,𝑚𝑚 + δ,𝑙𝑙) = 𝑝𝑝𝑙𝑙(𝑚𝑚 + δ − 2,𝑚𝑚 + δ − 1,𝑚𝑚 + δ + 1)
μ ′2�+𝑙𝑙−M(𝑙𝑙+1) �
𝑙𝑙−�(𝑚𝑚+δ)�(𝑙𝑙+1−𝑚𝑚−δ) =
μ ′2��+(𝑚𝑚+δ−2)�(𝑚𝑚+δ−1)−M(2𝑚𝑚+2δ−3)�
�(𝑚𝑚+δ−2)�(𝑚𝑚+δ−1)−(𝑚𝑚+δ+1)(𝑚𝑚+δ−4)
- -(61)
by solving this equation, we get
�μ ′2�
o= E ��{(𝑚𝑚+δ−2)(𝑚𝑚+δ−1)�−M(2𝑚𝑚+2δ−3)}−M{𝑙𝑙−M(𝑙𝑙+1)} �
M−E
- -(62)
Where, M = (𝑚𝑚 + δ − 2)(𝑚𝑚 + δ − 1) − (𝑚𝑚 + δ + 1)(𝑚𝑚 + δ −
4)

International Journal of Scientific and Research Publications, Volume 7, Issue 4, April 2017 237 ISSN 2250-3153
www.ijsrp.org
If �μ ′2�
n lies in the feasible region and is minimum then
minimum entropy shifts from 𝑝𝑝𝑘𝑘(1,𝑚𝑚 + δ,𝑙𝑙) to 𝑝𝑝ℎ(𝑚𝑚 + δ −
1, 𝑚𝑚+δ+1,𝑚𝑚+δ+2, then
s𝑚𝑚𝑖𝑖𝑙𝑙 = −𝑙𝑙𝑙𝑙𝑝𝑝𝑘𝑘(1, 𝑚𝑚 + δ, 𝑙𝑙) , for μ ′2
≤ �μ ′2�
n
And, for �μ ′2�
n ≤ μ ′
2
s𝑚𝑚𝑖𝑖𝑙𝑙 = −𝑙𝑙𝑙𝑙 �μ ′2��+(𝑚𝑚+δ+1)�(𝑚𝑚+δ+2)−M(2𝑚𝑚+2δ+3)�
�(𝑚𝑚+δ+1)�(𝑚𝑚+δ+2)−(𝑚𝑚+δ−1)(𝑚𝑚+δ+4) � - -(63)
And if �μ ′2�
o lies in the feasible region and is minimum then
minimum entropy shifts to 𝑝𝑝𝑙𝑙(𝑚𝑚 + δ − 2,𝑚𝑚 + δ − 1,𝑚𝑚 + δ +
1, then
s𝑚𝑚𝑖𝑖𝑙𝑙 = −𝑙𝑙𝑙𝑙𝑝𝑝𝑘𝑘(1, 𝑚𝑚 + δ, 𝑙𝑙) , for μ ′2
≤ �μ ′2�
o
And, for �μ ′2�
o ≤ μ ′
2
s𝑚𝑚𝑖𝑖𝑙𝑙 = −𝑙𝑙𝑙𝑙 �μ ′2��+(𝑚𝑚+δ−2)�(𝑚𝑚+δ−1)−M(2𝑚𝑚+2δ−3)�
�(𝑚𝑚+δ−2)�(𝑚𝑚+δ−1)−(𝑚𝑚+δ+1)(𝑚𝑚+δ−4) � - -(64)
If �μ ′2�
n and �μ ′
2�
o do not lie in the feasible region then we
proceed similarly and increase the values of 𝑘𝑘 & 𝑙𝑙 up to 𝑙𝑙 − 1
& 𝑙𝑙 in 𝑝𝑝ℎ and decrease the values of ℎ & 𝑘𝑘 up to 1 & 2 from
𝑝𝑝𝑙𝑙 respectively.
VI MINIMUM VALUE OF AN UNORHTODOX
MEASURE OF ENTROPY WHEN ARITHMETIC
MEAN AND SECOND ORDER MOMENT ARE GIVEN:
SIX FACED DICE: Now we calculate minimum value of entropy of an
unorthodox measure for six faced dice i.e. 𝑙𝑙 = 6. We find out
probability distributions for given moments belong to all
possible intervals and observe how the maximum probability
shifts from one set of points of non-zero probability to another
set of points of non-zero probability.
Here we have to minimize
s = −𝑙𝑙𝑙𝑙𝑝𝑝𝑚𝑚𝑚𝑚𝑚𝑚 - -(65)
subject to
� 6
𝑖𝑖=1
𝑝𝑝𝑖𝑖 = 1 , � 𝑖𝑖2𝑝𝑝𝑖𝑖
6
𝑖𝑖=1
= μ ′2
, � 𝑖𝑖6
𝑖𝑖=1
𝑝𝑝𝑖𝑖 = M
- -(66)
CASE - 1 we consider the case when M ∈ (2,3]. In this
interval we take values M=2.25, 2.5, 2.75, 3.0. But in the
present paper we are considering only for M=2.25. Values of
entropies are given in the table 1 for given M=2.25. In this
case h=1,2; k=2,3,4,5; l=3,4,5,6. (a) M=2.25
From equations (6) & (7), �μ ′2�𝑚𝑚𝑖𝑖𝑙𝑙
1/2= 2.2913
and �μ ′2�𝑚𝑚𝑚𝑚𝑚𝑚
1/2= 3.1225 [table 1].
For �μ ′2�𝑚𝑚𝑖𝑖𝑙𝑙
1/2 , 𝑝𝑝𝑘𝑘 is maximum probability. From equation
(22),
[s𝑚𝑚𝑖𝑖𝑙𝑙 ]𝑝𝑝ℎ (𝑚𝑚 ,𝑚𝑚+∝,𝑚𝑚+∝+1) = [s𝑚𝑚𝑖𝑖𝑙𝑙 ]𝑝𝑝ℎ (𝑚𝑚 ,𝑚𝑚+∝+1,𝑚𝑚+∝+2)
here a=2, ∝=1, M=2.25.
[s𝑚𝑚𝑖𝑖𝑙𝑙]𝑝𝑝ℎ (2,3,4) = [s𝑚𝑚𝑖𝑖𝑙𝑙 ]𝑝𝑝ℎ (2,4,5)
−𝑙𝑙𝑙𝑙 �μ ′
2−3.75
2� = −𝑙𝑙𝑙𝑙 �
μ ′2−.25
6�
by solving this equation, we get �μ ′2�
1
1/2= 2.3452 [table 1].
The value of �μ ′2�
1
1/2 can be obtained from equation (23) for
a=2, ∝=1, H=2.25.
s𝑚𝑚𝑖𝑖𝑙𝑙 = − 𝑙𝑙𝑙𝑙 �μ ′
2−3.75
2� for �μ ′
2�
1/2 ∈ [2.2913, 2.3452]
From equation (22),
[s𝑚𝑚𝑖𝑖𝑙𝑙 ]𝑝𝑝ℎ (𝑚𝑚 ,𝑚𝑚+∝,𝑚𝑚+∝+1) = [s𝑚𝑚𝑖𝑖𝑙𝑙 ]𝑝𝑝ℎ (𝑚𝑚 ,𝑚𝑚+∝+1,𝑚𝑚+∝+2)
here a=2, ∝=2, M=2.25.
[s𝑚𝑚𝑖𝑖𝑙𝑙 ]𝑝𝑝ℎ (2,4,5) = [s𝑚𝑚𝑖𝑖𝑙𝑙 ]𝑝𝑝ℎ (2,5,6)
−𝑙𝑙𝑙𝑙 �μ ′
2− .25
6� = −𝑙𝑙𝑙𝑙 �
μ ′2
+ 5.25
12�
by solving this equation, we get�μ ′2�
2
1/2= 2.3979
The value of �μ ′2�
2
1/2 can be obtained from equation (23) for
a=2, ∝=2, M=2.25.

International Journal of Scientific and Research Publications, Volume 7, Issue 4, April 2017 238 ISSN 2250-3153
www.ijsrp.org
s𝑚𝑚𝑖𝑖𝑙𝑙 = − 𝑙𝑙𝑙𝑙 �μ ′
2−.25
6� for �μ ′
2�
1/2 ∈ [2.3452, 2.3979]
Here 𝑚𝑚+∝ +2 = 𝑙𝑙, then maximum probability shifts from
point 𝑝𝑝ℎ(𝑚𝑚,𝑚𝑚+∝ +1,𝑚𝑚+∝ +2) to 𝑝𝑝𝑘𝑘(1,𝑚𝑚,𝑙𝑙).
[s𝑚𝑚𝑖𝑖𝑙𝑙 ]𝑝𝑝ℎ (𝑚𝑚 ,𝑚𝑚+∝+1,𝑚𝑚+∝+2) = [s𝑚𝑚𝑖𝑖𝑙𝑙 ]𝑝𝑝𝑘𝑘(1,𝑚𝑚 ,𝑙𝑙) [s𝑚𝑚𝑖𝑖𝑙𝑙 ]𝑝𝑝ℎ (2,5,6) = [s𝑚𝑚𝑖𝑖𝑙𝑙 ]𝑝𝑝𝑘𝑘(1,2,6)
−𝑙𝑙𝑙𝑙 �μ ′
2+5.25
12� = −𝑙𝑙𝑙𝑙 �
9.75−μ ′2
4�
by solving this equation, we get �μ ′2�
3
1/2= 2.4495
s𝑚𝑚𝑖𝑖𝑙𝑙 = − 𝑙𝑙𝑙𝑙 �μ ′
2+5.25
12�, for �μ ′
2�
1/2 ∈ [2.3979, 2.4495]
[s𝑚𝑚𝑖𝑖𝑙𝑙 ]𝑝𝑝𝑘𝑘(1,2,6) = [s𝑚𝑚𝑖𝑖𝑙𝑙 ]𝑝𝑝ℎ (1,4,5)
−𝑙𝑙𝑙𝑙 �9.75−μ′
24
� = −𝑙𝑙𝑙𝑙 �μ ′
2−.25
3�
by solving this equation, we get�μ ′2�
4
1/2= 2.7157
s𝑚𝑚𝑖𝑖𝑙𝑙 = − 𝑙𝑙𝑙𝑙 �9.75−μ′
24
�, for �μ ′2�
1/2 ∈ [2.4495, 2.7157]
Now, we equate entropies from equation (35) as:
[s𝑚𝑚𝑖𝑖𝑙𝑙 ]𝑝𝑝ℎ (1,4,5) = [s𝑚𝑚𝑖𝑖𝑙𝑙 ]𝑝𝑝ℎ (1,5,6)
−𝑙𝑙𝑙𝑙 �μ ′
2−.25
3� = −𝑙𝑙𝑙𝑙 �
μ ′2
+5.25
20�
by solving this equation, we get �μ ′2�
5
1/2= 2.9155
s𝑚𝑚𝑖𝑖𝑙𝑙 = − 𝑙𝑙𝑙𝑙 �μ ′
2−.25
3�, for �μ ′
2�
1/2 ∈ [2.7157, 2.9155]
s𝑚𝑚𝑖𝑖𝑙𝑙 = − 𝑙𝑙𝑙𝑙 �μ ′
2+5.25
20� , for �μ ′
2�
1/2 ∈ [29155, 3.1225]
�μ ′2�
1/2
h,k,l
2.2913 2.3 2.3452 2.3979
1,2,3 (0,.75,.25) (.02,.71,.27) (.125,.50,.375)
(.25,.25,.50)
1,2,4 (0,.875,.125) (.0833,.75,.1667)
1,2,5 (0,.9167,.08
33) 2,3,4 (.75,.25,0) (.77,.21,.02) (.875,
0,.125)
2,3,5 (.75,.25,0) (.7633,.23,.0067)
(.8333,.125,.0417)
(.9167, 0, .08333)
2,3,6 (.75,.25,0) (.76,.2367,.0033)
(.8125,.1667,.0208)
(.875,.0833,.0417)
2,4,5 (.875,.125,0) (.9167, 0,. 0833)
2,4,6 (.875,.125,0) (.9063,.0625,.0313)
2.5,6 (.9167,.0833
,0)
Contd….
�μ ′2�
h,k,l
2.4 2.4495 2.5 2.6
1,2,3 (.255,.24,.505) (.375 ,0,.625)
1,2,4 (.0867..745..1683)
(.1667,.625,.2083)
(.25,.50,.25)
(.42,.245,.335)
1,2,5 (.0025,.9133..0842)
(.0625,.8333,.1042)
(.125,.75,.125)
(.2525,.58,.1675)
1,2,6 (0,.9375,.0625)
(.05,.875,.075)
(.152,.7475,.1005)
1.3,4 (.375,.625,0) (.4167,.50,.0833)
(.5017,.245,.2533)
1.3,5 (.375,.625,0) (.4063,.5625,.0313)
(.47,.435,.095)
1,3,6 (.375,.625,0) (.40,.5833,.0167)
(.451,.4983,.0507)
2,3,6 (.8775,.08,.042
5)
(.8775,.08,.042
5)
2,4,6 (.9075,.06,.0325)
(.9075,.06,.0325)
2.5,6 (.9175,.08,.0025)
(.9175,.08,.0025)
Contd….
�μ ′2�
1/
h,k,l
2.6926 2.7 2.8 2.9
1,2,4 (.5833,0,.4167)
(.385,.4033,.2117)
(.5225,.22,.2575)
(.665,.03,.305)
1,2,5 (.375,.4167,.2083)
(.258,.615,.127)
(.368,.4775,.1545)
(.482,.335,.183)
1,2,6 (.25,.625,.125)
1.3,4 (.5833,0,.4167)
(.5363,.3025,.161
3)
(.605,.165,.23)
(.6763,.0225,.3013)
1.3,5 (.5313,.3125,.1563)
(.504,.41,.086)
(.559,.3183,.1227)
(.616,.2233,.1607)
1,3,6 (.50,.4167,.0833)
(.5867,.4023,.01)
(.6325,.22,.1475)
(.68,.03,.29)
1,4,5 (.5833,.4167,0)
(.586,.41,.004)
(.6227,.3183,.059)
(.6607,.2233,.116)
1,4,6 (.5833,.4167,0)
Contd…
�𝛍𝛍 ′𝟐𝟐� 𝟏𝟏
2.9155 3.0 3.1 3.1225

International Journal of Scientific and Research Publications, Volume 7, Issue 4, April 2017 239 ISSN 2250-3153
www.ijsrp.org
h,k,l
1,2,5 (.6875,0,.3125,)
1,2,6 (.50,.3125,.1875)
(.60,.1875,.212
5)
(.722,.035,.24
3)
(.75,0,.25)
1.3,5 (.6875,0,.3125)
1,3,6 (.625,.2083,.1607)
(.675,.125,.20) (.736,.0233,.2
407)
(.75,0,.25)
1,4,5 (.6875,0,.3125)
1,4,6 (.6667,.2083,.125)
(.70,.125,.175) (.7407,.0233,.236)
(.75,0,.25)
1,5,6 (.6875,.3125,0)
(.7125,.1875,.10)
(.743,.035,.222)
(.75,0,.25)
Table [1] Similarly, we can obtain minimum entropy for all values of
Arithmetic mean and Second order moment.
VII CONCLUDING REMARKS:
We have obtained the expressions of minimum
unorthodox measure of entropy for the given values of
Arithmetic mean and Second order moment. So, we observe
that
1. For the given values of M and �μ ′2�𝑚𝑚𝑖𝑖𝑙𝑙
, probability
distribution is same at all existing points and similarly for the
given values of M and �μ ′2�𝑚𝑚𝑚𝑚𝑚𝑚
, probability distribution is
same at all existing points.
2. s𝑚𝑚𝑖𝑖𝑙𝑙 is piecewise concave function of �μ ′2�
1/2, for the given
value of M.
3. In a given interval, if 𝑝𝑝𝑘𝑘 is maximum then minimum entropy
increases with Second order moment for a given value of
Arithmetic mean.
4. If 𝑝𝑝ℎ and 𝑝𝑝𝑙𝑙 are maximum probabilities then minimum entropy
decreases with Second order moment for a given value of
Arithmetic mean.
REFERENCES
1. Anju Rani, Maximum and Minimum value of a
moment of a probability distribution when value of some
other moment is prescribed, Pure and Applied
Mathematical Science 66(1997), 57-67.
2. Anju Rani, Minimum Entropy Probability Distribution
in presence inequalities constraint, Recent Advances in
Information Theory. Statistics and Computer Application,
Department of Mathematics and Statistics, C.C.S.,
Haryana Agriculture University, Hisar (1997), 166-170.
3. J.H. Havrda, & F. Charvat, Quantification Methods of
Classificatory Process: Concept of Structural α Entropy,
Kybernatica 3(1967), 30-35.
4. J.N. Kapur, , On minimum entropy probability
distribution, MI&TA, JW&S(1994), 203-218.
5. J.N. Kapur, , An unorthodox measure of entropy,
MI&TA, JW&S(1994), 3-11.
6. A. Renyi, , On measures of information and entropy,
Proc. 4th Berkely Symposium Maths Stat.
Prob.(1961), 547-561.
7. C.E. Shannon, , A mathematical theory of
communication , Journal of Bell System Tech. 27(1948),
379-423.
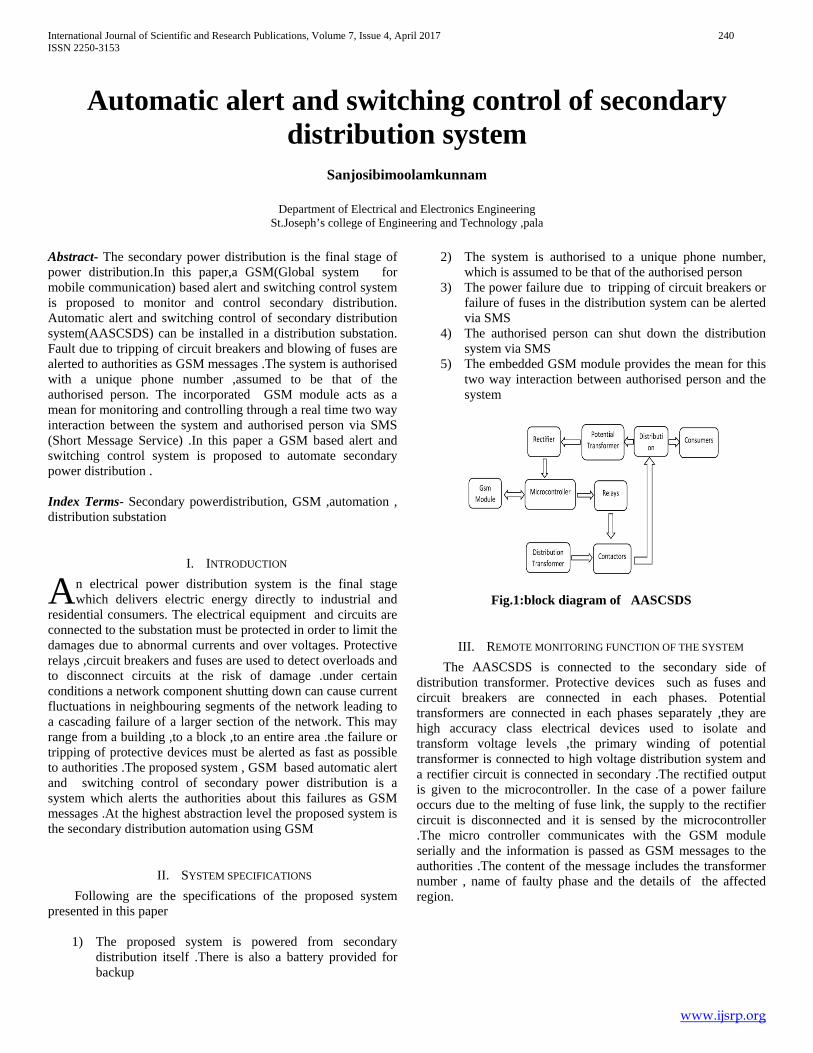
International Journal of Scientific and Research Publications, Volume 7, Issue 4, April 2017 240 ISSN 2250-3153
www.ijsrp.org
Automatic alert and switching control of secondary distribution system
Sanjosibimoolamkunnam
Department of Electrical and Electronics Engineering St.Joseph’s college of Engineering and Technology ,pala
Abstract- The secondary power distribution is the final stage of power distribution.In this paper,a GSM(Global system for mobile communication) based alert and switching control system is proposed to monitor and control secondary distribution. Automatic alert and switching control of secondary distribution system(AASCSDS) can be installed in a distribution substation. Fault due to tripping of circuit breakers and blowing of fuses are alerted to authorities as GSM messages .The system is authorised with a unique phone number ,assumed to be that of the authorised person. The incorporated GSM module acts as a mean for monitoring and controlling through a real time two way interaction between the system and authorised person via SMS (Short Message Service) .In this paper a GSM based alert and switching control system is proposed to automate secondary power distribution . Index Terms- Secondary powerdistribution, GSM ,automation , distribution substation
I. INTRODUCTION n electrical power distribution system is the final stage which delivers electric energy directly to industrial and
residential consumers. The electrical equipment and circuits are connected to the substation must be protected in order to limit the damages due to abnormal currents and over voltages. Protective relays ,circuit breakers and fuses are used to detect overloads and to disconnect circuits at the risk of damage .under certain conditions a network component shutting down can cause current fluctuations in neighbouring segments of the network leading to a cascading failure of a larger section of the network. This may range from a building ,to a block ,to an entire area .the failure or tripping of protective devices must be alerted as fast as possible to authorities .The proposed system , GSM based automatic alert and switching control of secondary power distribution is a system which alerts the authorities about this failures as GSM messages .At the highest abstraction level the proposed system is the secondary distribution automation using GSM
II. SYSTEM SPECIFICATIONS Following are the specifications of the proposed system presented in this paper
1) The proposed system is powered from secondary distribution itself .There is also a battery provided for backup
2) The system is authorised to a unique phone number, which is assumed to be that of the authorised person
3) The power failure due to tripping of circuit breakers or failure of fuses in the distribution system can be alerted via SMS
4) The authorised person can shut down the distribution system via SMS
5) The embedded GSM module provides the mean for this two way interaction between authorised person and the system
Fig.1:block diagram of AASCSDS
III. REMOTE MONITORING FUNCTION OF THE SYSTEM The AASCSDS is connected to the secondary side of distribution transformer. Protective devices such as fuses and circuit breakers are connected in each phases. Potential transformers are connected in each phases separately ,they are high accuracy class electrical devices used to isolate and transform voltage levels ,the primary winding of potential transformer is connected to high voltage distribution system and a rectifier circuit is connected in secondary .The rectified output is given to the microcontroller. In the case of a power failure occurs due to the melting of fuse link, the supply to the rectifier circuit is disconnected and it is sensed by the microcontroller .The micro controller communicates with the GSM module serially and the information is passed as GSM messages to the authorities .The content of the message includes the transformer number , name of faulty phase and the details of the affected region.
A
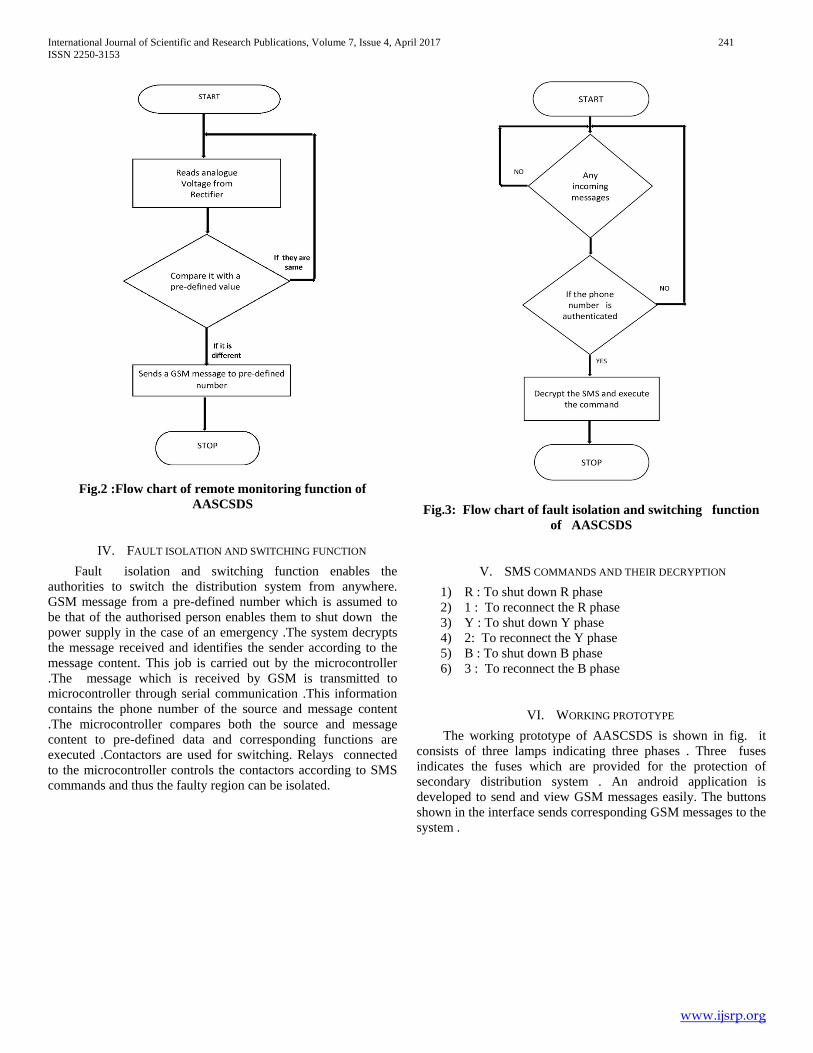
International Journal of Scientific and Research Publications, Volume 7, Issue 4, April 2017 241 ISSN 2250-3153
www.ijsrp.org
Fig.2 :Flow chart of remote monitoring function of AASCSDS
IV. FAULT ISOLATION AND SWITCHING FUNCTION Fault isolation and switching function enables the authorities to switch the distribution system from anywhere. GSM message from a pre-defined number which is assumed to be that of the authorised person enables them to shut down the power supply in the case of an emergency .The system decrypts the message received and identifies the sender according to the message content. This job is carried out by the microcontroller .The message which is received by GSM is transmitted to microcontroller through serial communication .This information contains the phone number of the source and message content .The microcontroller compares both the source and message content to pre-defined data and corresponding functions are executed .Contactors are used for switching. Relays connected to the microcontroller controls the contactors according to SMS commands and thus the faulty region can be isolated.
Fig.3: Flow chart of fault isolation and switching function of AASCSDS
V. SMS COMMANDS AND THEIR DECRYPTION 1) R : To shut down R phase 2) 1 : To reconnect the R phase 3) Y : To shut down Y phase 4) 2: To reconnect the Y phase 5) B : To shut down B phase 6) 3 : To reconnect the B phase
VI. WORKING PROTOTYPE The working prototype of AASCSDS is shown in fig. it consists of three lamps indicating three phases . Three fuses indicates the fuses which are provided for the protection of secondary distribution system . An android application is developed to send and view GSM messages easily. The buttons shown in the interface sends corresponding GSM messages to the system .
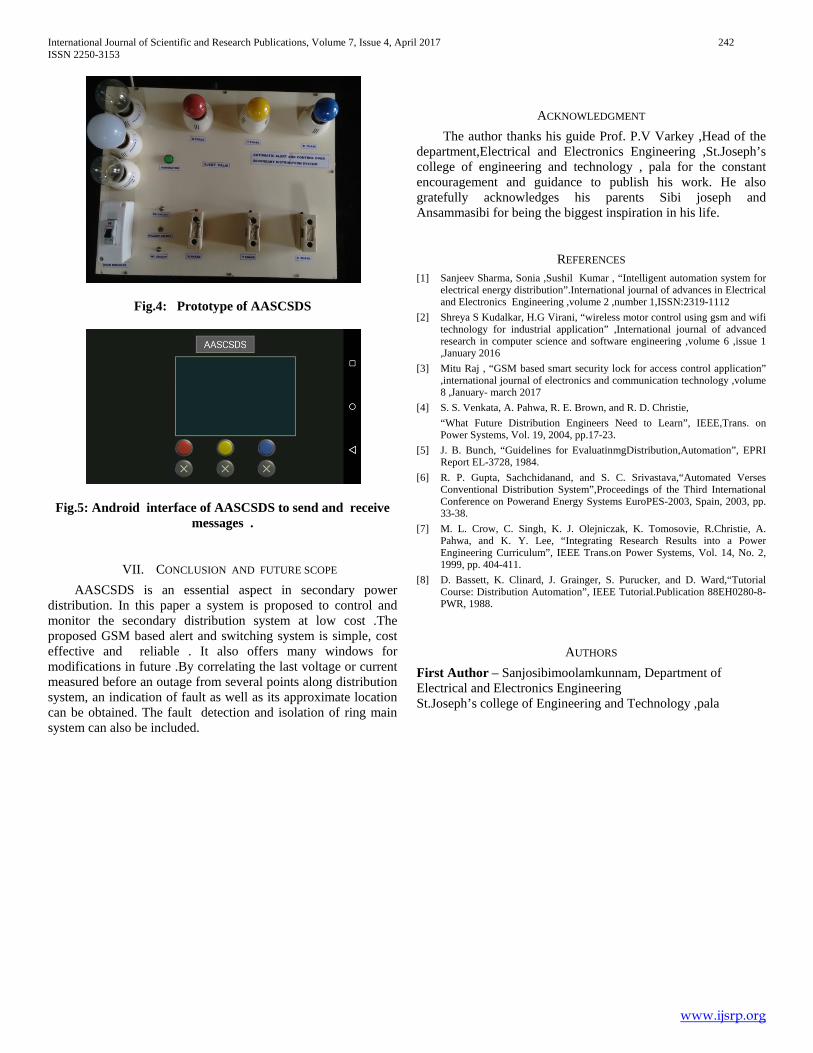
International Journal of Scientific and Research Publications, Volume 7, Issue 4, April 2017 242 ISSN 2250-3153
www.ijsrp.org
Fig.4: Prototype of AASCSDS
Fig.5: Android interface of AASCSDS to send and receive messages .
VII. CONCLUSION AND FUTURE SCOPE AASCSDS is an essential aspect in secondary power distribution. In this paper a system is proposed to control and monitor the secondary distribution system at low cost .The proposed GSM based alert and switching system is simple, cost effective and reliable . It also offers many windows for modifications in future .By correlating the last voltage or current measured before an outage from several points along distribution system, an indication of fault as well as its approximate location can be obtained. The fault detection and isolation of ring main system can also be included.
ACKNOWLEDGMENT The author thanks his guide Prof. P.V Varkey ,Head of the department,Electrical and Electronics Engineering ,St.Joseph’s college of engineering and technology , pala for the constant encouragement and guidance to publish his work. He also gratefully acknowledges his parents Sibi joseph and Ansammasibi for being the biggest inspiration in his life.
REFERENCES [1] Sanjeev Sharma, Sonia ,Sushil Kumar , “Intelligent automation system for
electrical energy distribution”.International journal of advances in Electrical and Electronics Engineering ,volume 2 ,number 1,ISSN:2319-1112
[2] Shreya S Kudalkar, H.G Virani, “wireless motor control using gsm and wifi technology for industrial application” ,International journal of advanced research in computer science and software engineering ,volume 6 ,issue 1 ,January 2016
[3] Mitu Raj , “GSM based smart security lock for access control application” ,international journal of electronics and communication technology ,volume 8 ,January- march 2017
[4] S. S. Venkata, A. Pahwa, R. E. Brown, and R. D. Christie, “What Future Distribution Engineers Need to Learn”, IEEE,Trans. on Power Systems, Vol. 19, 2004, pp.17-23.
[5] J. B. Bunch, “Guidelines for EvaluatinmgDistribution,Automation”, EPRI Report EL-3728, 1984.
[6] R. P. Gupta, Sachchidanand, and S. C. Srivastava,“Automated Verses Conventional Distribution System”,Proceedings of the Third International Conference on Powerand Energy Systems EuroPES-2003, Spain, 2003, pp. 33-38.
[7] M. L. Crow, C. Singh, K. J. Olejniczak, K. Tomosovie, R.Christie, A. Pahwa, and K. Y. Lee, “Integrating Research Results into a Power Engineering Curriculum”, IEEE Trans.on Power Systems, Vol. 14, No. 2, 1999, pp. 404-411.
[8] D. Bassett, K. Clinard, J. Grainger, S. Purucker, and D. Ward,“Tutorial Course: Distribution Automation”, IEEE Tutorial.Publication 88EH0280-8-PWR, 1988.
AUTHORS First Author – Sanjosibimoolamkunnam, Department of Electrical and Electronics Engineering St.Joseph’s college of Engineering and Technology ,pala
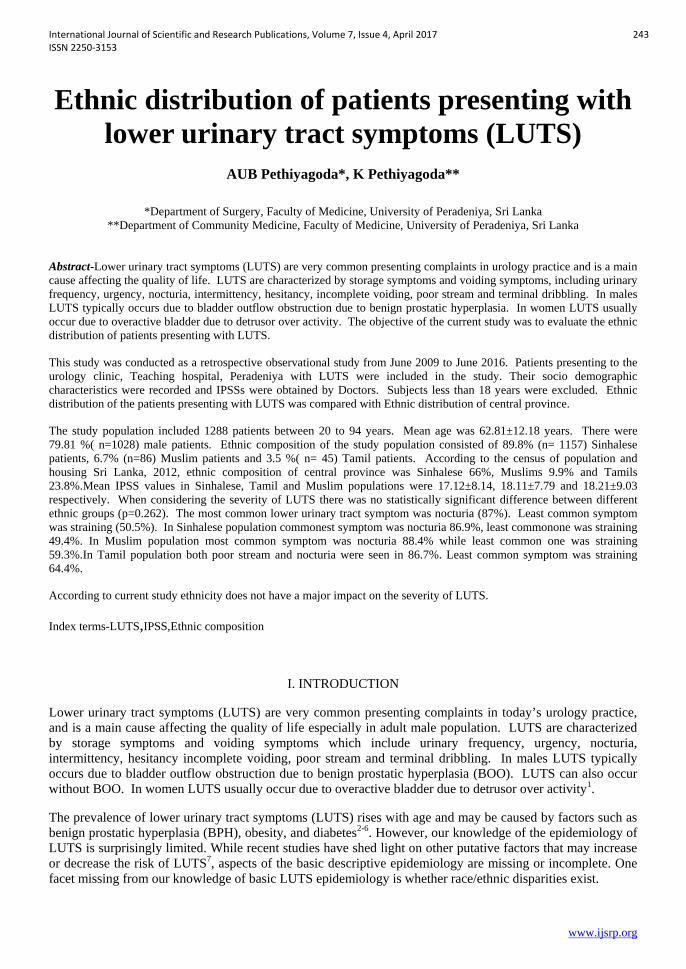
International Journal of Scientific and Research Publications, Volume 7, Issue 4, April 2017 243 ISSN 2250-3153
www.ijsrp.org
Ethnic distribution of patients presenting with lower urinary tract symptoms (LUTS)
AUB Pethiyagoda*, K Pethiyagoda**
*Department of Surgery, Faculty of Medicine, University of Peradeniya, Sri Lanka **Department of Community Medicine, Faculty of Medicine, University of Peradeniya, Sri Lanka
Abstract-Lower urinary tract symptoms (LUTS) are very common presenting complaints in urology practice and is a main cause affecting the quality of life. LUTS are characterized by storage symptoms and voiding symptoms, including urinary frequency, urgency, nocturia, intermittency, hesitancy, incomplete voiding, poor stream and terminal dribbling. In males LUTS typically occurs due to bladder outflow obstruction due to benign prostatic hyperplasia. In women LUTS usually occur due to overactive bladder due to detrusor over activity. The objective of the current study was to evaluate the ethnic distribution of patients presenting with LUTS.
This study was conducted as a retrospective observational study from June 2009 to June 2016. Patients presenting to the urology clinic, Teaching hospital, Peradeniya with LUTS were included in the study. Their socio demographic characteristics were recorded and IPSSs were obtained by Doctors. Subjects less than 18 years were excluded. Ethnic distribution of the patients presenting with LUTS was compared with Ethnic distribution of central province.
The study population included 1288 patients between 20 to 94 years. Mean age was 62.81±12.18 years. There were 79.81 %( n=1028) male patients. Ethnic composition of the study population consisted of 89.8% (n= 1157) Sinhalese patients, 6.7% (n=86) Muslim patients and 3.5 %( n= 45) Tamil patients. According to the census of population and housing Sri Lanka, 2012, ethnic composition of central province was Sinhalese 66%, Muslims 9.9% and Tamils 23.8%.Mean IPSS values in Sinhalese, Tamil and Muslim populations were 17.12±8.14, 18.11±7.79 and 18.21±9.03 respectively. When considering the severity of LUTS there was no statistically significant difference between different ethnic groups (p=0.262). The most common lower urinary tract symptom was nocturia (87%). Least common symptom was straining (50.5%). In Sinhalese population commonest symptom was nocturia 86.9%, least commonone was straining 49.4%. In Muslim population most common symptom was nocturia 88.4% while least common one was straining 59.3%.In Tamil population both poor stream and nocturia were seen in 86.7%. Least common symptom was straining 64.4%.
According to current study ethnicity does not have a major impact on the severity of LUTS.
Index terms-LUTS,IPSS,Ethnic composition
I. INTRODUCTION
Lower urinary tract symptoms (LUTS) are very common presenting complaints in today’s urology practice, and is a main cause affecting the quality of life especially in adult male population. LUTS are characterized by storage symptoms and voiding symptoms which include urinary frequency, urgency, nocturia, intermittency, hesitancy incomplete voiding, poor stream and terminal dribbling. In males LUTS typically occurs due to bladder outflow obstruction due to benign prostatic hyperplasia (BOO). LUTS can also occur without BOO. In women LUTS usually occur due to overactive bladder due to detrusor over activity1.
The prevalence of lower urinary tract symptoms (LUTS) rises with age and may be caused by factors such as benign prostatic hyperplasia (BPH), obesity, and diabetes2-6. However, our knowledge of the epidemiology of LUTS is surprisingly limited. While recent studies have shed light on other putative factors that may increase or decrease the risk of LUTS7, aspects of the basic descriptive epidemiology are missing or incomplete. One facet missing from our knowledge of basic LUTS epidemiology is whether race/ethnic disparities exist.

International Journal of Scientific and Research Publications, Volume 7, Issue 4, April 2017 244 ISSN 2250-3153
www.ijsrp.org
The objective of the current study was to evaluate the ethnic distribution of patients presenting with LUTS.
II.MATERIALS AND METHODS
This study was conducted as a retrospective observational study from June 2009 to June 2016. Patients presenting to the urology clinic, Teaching hospital Peradeniya with a history of LUTS were included in the study. Their socio demographic characteristics including ethnicity were recorded in the history and IPSSs of the patients were obtained by doctors. Subjects less than 18 years of age were excluded. Ethnic distribution of the patients presenting with LUTS was compared with Ethnic distribution of central province. Severity of LUTS was determined by total IPSS. According to total international prostate symptom score LUTS can be categorize into mild (symptom score less than or equal to 7) moderate (symptom score range 8-19) and severe (symptom score range 20-35). Analysis was carried out using SPSS 20th version.
III.RESULTS
The study population included 1288 patients between 20 to 94 years. Mean age was 62.81 ±12.18 years. There were 1028 male patients and 80 female patients. Ethnic composition of the study population consisted of, 89.8% (n=1157) Sinhalese patients, 6.7% (n=86) Muslim patients and 3.5% (n=45) Tamil patients. According to the census of population and housing Sri Lanka in 2012, ethnic composition of central province was Sinhalese 66%, Muslims 9.9% Tamil 23.8% and others 0.3%.
Mean IPSS values in Sinhalese, Tamil and Muslim populations were 17.12±8.14, 18.11±7.79 and 18.21± 9.03 respectively. Regarding the severity of IPSS there was no statistically significant difference between different ethnic groups. (P=0.262)
In our study population most common lower urinary tract symptom was nocturia which was present in 87% of study population. Least common symptom was straining which was seen in 50.5%. Other symptoms were poor stream 79.9%, increased frequency 75.6%, urgency 71.5%, and incomplete voiding 71.3% and intermittency 70.6%.
In Sinhalese population most common symptom was nocturia 86.9%, least common one was straining 49.4%. Others included poor stream 80.1%, increased frequency 75%, intermittency 71.7%, incomplete voiding 71.2% and urgency 71%. In Sinhalese population severe LUTS was seen in 39.6%, moderate in 47% and mild LUTS in 13.4%.
In Muslim population most common symptom was nocturia 88.4% while least common one was straining 59.3%. Others included increased frequency 80.2%, urgency 77.9%, poor stream 73.3%, incomplete voiding 68.6% and intermittency 67.4%. In Muslim population severe LUTS was seen in 47.7%, moderate in 34.9 % and mild LUTS in 17.4%.
In Tamil population both poor stream and nocturia were seen in 86.7%. Least common symptom was straining 64.4%. Others included frequency 82.2%, incomplete voiding 77.8% and intermittency and urgency 73.3%. In Tamil population severe and moderate LUTS were seen in 44.4% each and mild LUTS in 11.1%.
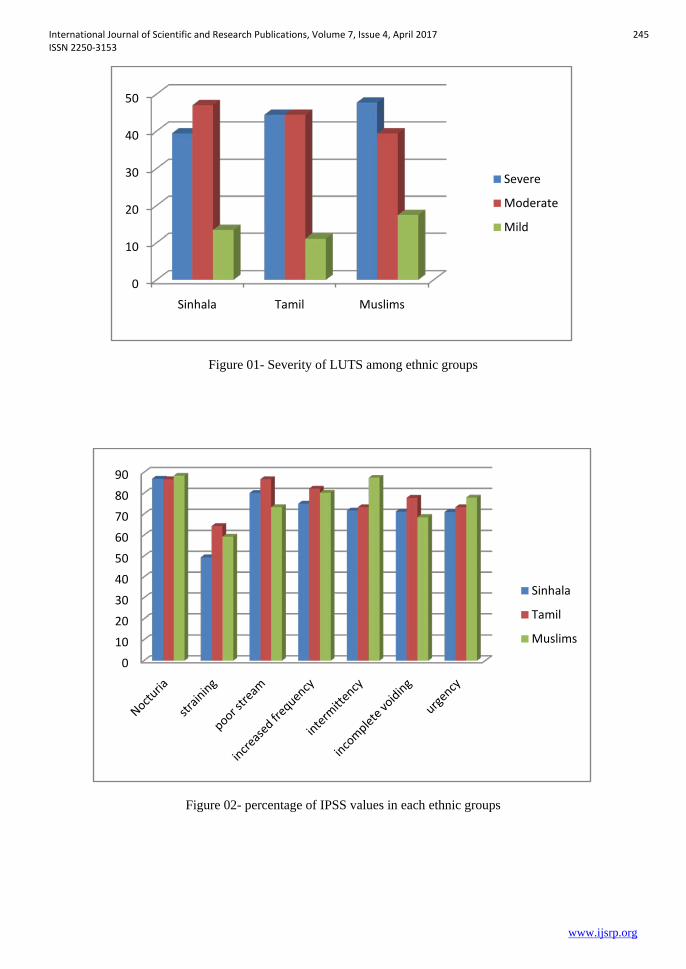
International Journal of Scientific and Research Publications, Volume 7, Issue 4, April 2017 245 ISSN 2250-3153
www.ijsrp.org
Figure 01- Severity of LUTS among ethnic groups
Figure 02- percentage of IPSS values in each ethnic groups
0
10
20
30
40
50
Sinhala Tamil Muslims
Severe
Moderate
Mild
0102030405060708090
Sinhala
Tamil
Muslims
International Journal of Scientific and Research Publications, Volume 7, Issue 4, April 2017 246 ISSN 2250-3153
www.ijsrp.org
1V. DISCUSSION
According to our study results mean total IPSS was higher in Muslim population compared to other two. But there was no statistically significant difference in the severity of LUTS in different ethnic groups. Most common LUTS in the whole population was noctria which in the same time was the most common symptom in all three ethnic groups. In a study conducted, by C.Hernández et al. using502 Spanish patients with lower urinary tract symptoms found out that, the overall prevalence of nocturia in their study population was 83.1%.8Comparatively our study group had a slightly higher percentage of nocturia.
Compared to ethnic distribution of central province in Sri Lanka in 2012, a higher percentage of Sinhalese patients seek treatment for LUTS even though severe LUTS was commonly seen other two ethnic groups. This can be due to the fact that LUTS may be common in Sinhalese population compared to other two or they seek medical attention earlier than other two ethnic groups. Results highlighted that compared to the ethnic distribution of the central province the prevalence of Tamil patients seeking medical attention are significantly low. This can be due to lack of awareness regarding LUTS in that population and poor accessibility to health care system. According to Census of Population and Housing - 2012, percentage of literate population in the urban sector is 97.7 %, in the rural sector 95.7% and estate sector 86.1 %. In the estate sector most of the people are Tamils. Therefore the poor literacy level among them can be a contributory factor for lack of awareness about LUTS. Since LUTS has a significant impact on the quality of life of an individual it is important to take measure to educate those regarding LUTS and the treatment options.
One of the other study which is conducted by Stephen K. et.al found that LUTS increased with age within each race/ethnic group, as expected. A Boston-area study found no significant differences by race/ethnicity in the prevalence of LUTS (defined as AUASI ≥8) in a sample that included men and women. Exposures or factors that occur over the life span that increase inflammation in the prostate or alter may explain the disparities.9
In a study conducted by Lim et al, using 1021 men, found out that the age, ethnicity, prostate volume and history of hypertension and hypercholesterolemia were independent factors associated with severity of LUTS. 10
Even though international data suggest that there is a contribution of ethnicity towards LUTS due to many factors including genetic factors, life style factors and various dietary practices and religious practices among various ethnic groups, our study did not show any statistically significant association between ethnicity and the severity of LUTS. 10
V. CONCLUSION
According to the current study ethnicity does not have a major impact on severity or the individual symptoms of LUTS, though a comparatively higher percentage of Sinhalese patients seek medical attention for LUTS.
REFERENCES

International Journal of Scientific and Research Publications, Volume 7, Issue 4, April 2017 247 ISSN 2250-3153
www.ijsrp.org
1.Andersson, K. and Chapple, C. (2014). Current pharmacotherapy of lower urinary tract symptoms. Surgery (Oxford), 32(6), pp.292-296.
2. Kristal AR, Arnold KB, Schenk JM, et al. Race/ethnicity, obesity, health related behaviors and the risk of symptomatic benign prostatic hyperplasia: results from the prostate cancer prevention trial. J Urol. 2007;177:1395.
3. Giovannucci E, Rimm EB, Chute CG, et al. Obesity and benign prostatic hyperplasia. Am J Epidemiol. 1994;140:989. 4. Meigs JB, Mohr B, Barry MJ, et al. Risk factors for clinical benign prostatic hyperplasia in a community-based population of healthy aging men. J ClinEpidemiol. 2001;54:935. 5. Sarma AV, Kellogg PJ. Diabetes and benign prostatic hyperplasia: emerging clinical connections. CurrUrol Rep. 2009;10:267. 6. Rohrmann S, Smit E, Giovannucci E, et al. Associations of obesity with lower urinary tract symptoms and noncancer prostate surgery in the Third National Health and Nutrition Examination Survey. Am J Epidemiol. 2004;159:390. 7. Parsons JK. Modifiable risk factors for benign prostatic hyperplasia and lower urinary tract symptoms: new approaches to old problems. J Urol. 2007;178:395. 8.Hernández, C., Estivill, E., Prieto, M. and Badía, X. (2008). Nocturia in Spanish patients with lower urinary tract symptoms suggestive of benign prostatic hyperplasia (LUTS/BPH). Current Medical Research and Opinion, 24(4), pp.1033-1038.
9.Stephen K. Van Den Eeden, PhD,1,5Jun Shan, PhD,1Steven J. Jacobsen, MD, PhD,2David Aaronsen,3Reina Haque, PhD,2Virginia P. Quinn, PhD,2Charles P. Quesenberry, Jr, PhD,1 and Urologic Diseases in America Project4 . Evaluating race/ethnic disparities in lower urinary tract symptoms (LUTS) in menJ Urol. 2012 Jan; 187(1): 185–189. 10.Lim, J., Bhoo-Pathy, N., Sothilingam, S., Malek, R., Sundram, M., Tan, G., Bahadzor, B., Ong, T., Ng, K. and Abdul Razack, A. (2015). Cardiovascular Risk Factors and Ethnicity Are Independent Factors Associated with Lower Urinary Tract Symptoms. PLOS ONE, 10(6), p.e0130820.
AUTHORS
First Author – AUB Pethiyagoda, Consultant genito-urinary surgeon/ Senior lecturer, Department of Surgery, Faculty of Medicine, University of Peradeniya, Sri Lanka. Email: [email protected]. Telephone: 0094773079078
Second Author – K Pethiyagoda, MSc in community medicine & PhD in occupational health, Senior lecturer in community medicine, Department of Community Medicine, Faculty of medicine, University of Peradeniya, Sri Lanka. Email: [email protected]

International Journal of Scientific and Research Publications, Volume 7, Issue 4, April 2017 248 ISSN 2250-3153
www.ijsrp.org
Concept of Peace in World’s Major Religions: An
Analysis
Dr. Muhammad Rafique Anjum* MD
Abstract- Peace has been a long cherished dream of humanity since times immemorial; but its
relevance and scope in the modern world has increased many-fold. The word Peace having no agreed upon
single definition has been explained by some, as tranquility or quiet, freedom from disturbance or conflict,
absence or cessation of war, a state of security or order, and a reconciliation after strife etc. It could however be
best understood and appreciated by absence of the antonyms like war, conflict, unrest, violence, terrorism,
destruction etc. Religion is central to the existence of almost every society and has been defined as “a set of
beliefs concerning the cause, nature and purpose of life and the universe, especially when considered as the
creation of a supernatural agency”
All major religions of Humanity have always prescribed calm and exhorted people for universal brotherhood.
Whereas Ahimsa or non-violence forms a cardinal principle of almost all Aryan religions like Hinduism,
Buddhism and Jainism; the Semitic religions; the Judaism, Christianity and Islam that share the basic concepts
of Monotheism, Prophets and Life after death; describe peace and reconciliation among intra and interreligious
groups as carrying great rewards in the hereafter. Religions usually incorporate a code of ethics that concern the
behavior of the individual; but men don’t always live up to the standards they profess.
This paper, tries to analyze with scientific objectivity, the perspective of peace in sacred texts of different
‘Major World Religions’; their ethical commandments for peace and war as well as the ways and means of
achieving this goal. The paper concludes with the argument that to make the world a better place to live, the
religions rather than nation states will have to come forward; promote tolerance, engage in interreligious
dialogues and devise a strategy for ending conflicts to reap the dividends of peace with patience and wisdom.
Key words:Dialogue, Islam, Peace, Religion,
* Dr. Anjum is a ‘Doctor of Medicine’ and a multifaceted litterateur having special interest in literature and
comparative study of religions presently pursuing Ph.D. in Islamic Studies from University of Kashmir, SGR.
He can be accessed at {[email protected]//9469000044}
Introduction:
Peace has been a long cherished dream of humanity since times immemorial that always remained a
mirage for man. But its relevance and scope in the modern world has increased many fold. The term "peace"
has innumerable connotations. The word Peace having no agreed upon single definition has been explained
variously as tranquility or quiet, freedom from disturbance or conflict, absence or cessation of war, a state of
security or order, and reconciliation after strife. It could however be best understood and appreciated by
absence of the antonyms like war, conflict, unrest, violence, terrorism, etc.
The New Webster Dictionary defines peace as:

International Journal of Scientific and Research Publications, Volume 7, Issue 4, April 2017 249 ISSN 2250-3153
www.ijsrp.org
“A state of tranquility or quiet; freedom from civil disturbance; a state of security or order within a community
provided for by law or custom; specifically, absence or cessation of war; a state of reconciliation after strife or
enmity etc.”1
Religion is central to the existence of almost every society and has been defined as “a set of beliefs concerning
the cause, nature and purpose of life and the universe, especially when considered as the creation of a
supernatural agency” 2
All major religions of Humanity have always prescribed calm and exhorted people for universal brotherhood.
Ahimsa or non-violence forms a cardinal principle of almost all Aryan religions like Hinduism, Buddhism and
Jainism. The Semitic Religions; the Judaism, Christianity and Islam share the basic concepts of Monotheism,
Prophet-hood and Life after death as fundamental beliefs, though they have differences in their shariahs. But as
regard their teachings all of these prescribe mercy, peace and reconciliation among intra and interreligious
groups as carrying great rewards in the hereafter. The widening gulf between essence and praxis of different
religions and association of recent escalation of violence with a particular religion demand special attention.
Most religions offer teachings on war and conflict. And over time religion has been at the heart of conflict
between nations. Religions usually incorporate a code of ethics that concern the behavior of the individual; but
men don’t always live up to the standards they profess. 2
The relationship between religion and peace in general is quite controversial. 4Some scholars, such as Asghar
Ali Engineer, argue that Islam as a religion is all peace and does not allow for violence.5i
On a wider scale,
Engineer generally rejects drawing any integral relationship between any religion, including Islam, and
violence. Rather, he sees violence as a social phenomenon that takes place as a result of certain negative
conditions in specific societies where religion may be manipulated as a result. What a religion teaches can,
therefore, be different from how its followers hold it to be in practice, due to the influence of “self-justifying
groups” such as religious or political institutions or cultural traits. 6
Place in world religions: We have endeavored to find out from holy texts of religions; a) their teachings on
peace, b), Restrictions on violence and c), the social phenomena that contribute to creation of peaceful
atmosphere among individuals and communities.
1. HINDUISM
Hinduism is the most ancient of all living religion of the world. It was not founded by any individual prophet.
Though Hinduism preserves an exhaustive list of sacred scriptures; mainly the Vedas, Upnishads, Bhagvad-
Gita and six Darshanas form the fundamental scriptures and great storehouses of Hindu philosophy. 3 Though
it has undergone tremendous changes in essence and praxis over the centuries the original texts speak volumes
about its rich heritage. Peace is an essential part of Hinduism. By examining the core teachings of Hinduism, it
is possible to demonstrate the way Hinduism guides individuals in accomplishing global peace, through
attainment of inner peace.
A Quote from Valmiki Ramayan says: “A superior being doesn’t return evil for evil.”
“Speak the truth, speak what is pleasant, but don’t speak the unpleasant truth”. Manusmriti 4:138.

International Journal of Scientific and Research Publications, Volume 7, Issue 4, April 2017 250 ISSN 2250-3153
www.ijsrp.org
A Vedic Prayer:
“May there be peace in the heavens, Peace in the atmosphere, peace on earth,
Let there be coolness in water, healing in the herbs;
And peace radiating from trees,
Let there be harmony in the planets, and in the stars,
And perfection in eternal knowledge! May everything in the universe be at peace!
Let peace pervade everywhere at all times!
May I experience that peace with my own heart” YajurVed, 36:17
Ahimsa (a very important belief in Hinduism) means trying to fight injustice and evil but without using any
physical force. Mahatma Gandhi was a great advocate of Ahimsa who, through his ‘Satyagraha’ based on
peaceful, on-violent protest, successfully led India to freedom. According to Encyclopedia Britannica,” Gandhi
was the first to interpret ahimsa positively and in the sense of a social obligation”. 7
Gandhi believed:
“Nonviolence is the greatest force at the disposal of mankind. It is mightier than the mightiest weapon of
destruction devised by the ingenuity of man.” 8
Most religions offer teachings on war and conflict. And over time religion has been at the heart of conflict
between nations. The war is not forbidden in Hinduism. The gods of the Vedas are asked to send prayers to help
in battles and to take soldiers who are killed in battle straight to the afterlife. The Hindu approach to war and
peace are found in many of the scriptures, but the Laws of Manu, the Rig Veda and the Mahabarata make
important points.
The Mahabarata (in the Bhagavad Gita) a sacred text, expresses the Hindu attitude to war and peace through
the terrible dilemma faced by Arjuna. Arjuna faced going into battle against his kinsmen, his cousins and
teachers and the thought of the slaughter that would follow appalled him. Krishna gave him the advice that it is
sometimes necessary to fight a just war to overcome evil forces. Krishna reminds Arjuna that to fight for peace,
justice and truth is to fulfill the law of God. Bhagavad Gita( 2:31) says: “Think thou also of thy duty and do
not waver. There is no greater good for a warrior than to fight in a righteous war.”
Hindus believe that it is right to use force in self-defense:
“May your weapons be strong to drive away the attackers,
may your arms be powerful enough to check the foes,
let your army be glorious, not the evil-doer.” Rig Veda 1-39:2
The Laws of Manu tell Hindus about the right ways to behave during war. It says that Kashatryas should fight
out of duty. “They must show honor and mercy and not attack the elderly, women or children. Also they must
not attack people who are asleep or who have surrendered.”
The Rig Veda sets down the rules for conduct during a war as: 9

International Journal of Scientific and Research Publications, Volume 7, Issue 4, April 2017 251 ISSN 2250-3153
www.ijsrp.org
“The warrior should not poison the tip of his arrow, he must not attack the sick or the old, a child, or a woman
or from behind. These are sinful acts and lead to hell even if the warrior is the winner.” Rig Veda 6-75:15
2. BUDHISM
Like all of the major world religions, Buddhism at its core, is a religion of peace. Buddhism, one of the Aryan
religions, founded by Gautama Buddha (b.567 BC) is regarded as a Godless religion (agnostic not atheistic),
for unlike other religions, it doesn’t entertain belief in God as a central concept. 3
The basis of Buddhism is
essentially a moral philosophy or an ethical way of life aimed at personal reform. One of the principles laid
down by Buddha makes it abundantly clear.
“One must renounce all desires and all thoughts of lust, bitterness and cruelty. One must harm no living
creature. One must abstain from all killing. One must work in an occupation that benefits others and harms
none.”10
In Buddhist texts Ahimsa (or avihiṃsāinPāli ) is part of the Five Precepts(Pañcasīla), the first of which
has been to abstain from killing. According to Buddha, the true path of salvation is attainable not by worshiping
God but by doing good. 11
The five commandments of Buddha or Panchshila) include: 3
Do not kill any living being.
Do not take what is not given to you.
Do not speak untruth.
Do not take intoxicating drinks.
Do not commit adultery.
This core teaching of Buddhism is supported by many examples from the sacred texts of this creed. An early
Buddhist collection of verses on practice in everyday life, the Pali (Theravadin) Dhammapada, (the way of
virtue) makes this abundantly clear: 12
"Hatred is never appeased by hatred.
Hatred is only appeased by Love (or, non-enmity).
This is an eternal law." (Verse 5/423)
The famous, 8th century Mahayana poet, in his great work, the ‘Bodhicaryavatara’, portrays the same theme
through these verses:
"There is no evil equal to hatred and no spiritual practice equal to forbearance. Therefore, one ought to
develop forbearance, by various means, with great effort." (Ch. 6, verse 2).
It is based on these principles of pacifism that Buddhism has found a place of prominence in the contemporary
world torn by violence all around. 12
3. JAINISM
Jainism is a living faith in India and its teachings claim to be of universal application.11
In Jainism, the
understanding and implementation of Ahimsāis more radical, and comprehensive than in any other religion.
Killing any living being out of passions is considered hiṃsā (to injure) and abstaining from such an act is
ahimsā (noninjury). The vow of ahimsā is considered the foremost among the 'five vows of Jainism'. Other

International Journal of Scientific and Research Publications, Volume 7, Issue 4, April 2017 252 ISSN 2250-3153
www.ijsrp.org
vows like satya (truthfulness), asteys (non-stealing),Brahmacharya (chastity) and aparigraha (non attachment)
are meant for safeguarding the vow of ahimsā. The statement ahimsāparamodharmaḥ is often found inscribed
on the walls of the Jain temples.
The system of Jaina ethics is optimized in the principle of three Jewels (ratnatraya) that include: the Right
faith, Right knowledge, and Right conduct. These are the major contributory factors for achievement of a state
of peace.ii11
There goes the final saying of Mahavira: “truth, non-violence and penance are the root sources of religion”.3
The doctrine of Jainism is summed up in the maxim: “ahimsa paramo dharma”. All rules of conduct are based
on mercy which has four forms: 3
To perform a kind act without expectation of a reward.
To rejoice at the well being of others.
To sympathize with the distressed people to relieve their sufferings.
To pity the criminals.
4. SIKHISM
One of the youngest religions based on numinous experiences of its founder Guru Nanak (1469-1539); the
sacred text of Sikhism the Guru GranthSahb contains pithy sayings and virtuous poetry of many mystic poets
and seers. Sikhism is the most materialistic of Indian religions, as takes the material world to be potentially
useful for the good of mankind. It has independent ethical system that requires man to serve one’s fellow-men
in a selfless manner.11
In addition to their exemplary hospitality, langar, charity and service to humanity; their
sacred scriptures contain clear instructions and code of conduct for all situations.
Sikhs are well known as one of the brave and martial races and there is a sanction for just war against
oppression. But at the same time there are laid down principles to be followed during such situations. Sikhism
does not teach total pacifism but approves of any action to promote human rights and harmony. Guru Nanak
(the first Guru) wrote:
“No one is my enemy; No one is a foreigner; with all I am at peace. God within us renders us incapable
of hate and prejudice.”
DharamYudh is a war fought in the defense of righteousness, similar to the concept of a Just War. The
conditions of DharamYudh are: 14
The war must be the last resort - all other ways of resolving the conflict must be tried first
The motive must not be revenge or anger; the army must be disciplined.
Only the minimum force needed for success should be used
civilians must not be harmed
There must be no looting, territory must not be taken, and property taken must be returned.
All treaties and ceasefires must be honored.
No places of worship (of any faith) should be damaged.

International Journal of Scientific and Research Publications, Volume 7, Issue 4, April 2017 253 ISSN 2250-3153
www.ijsrp.org
Soldiers who surrender should not be harmed.
5. JUDAISM Peace is a concept that is central to Judaism. Along with truth and justice, it is one of the
three key Jewish values. The Hebrew word for peace is shalom which is derived from one of the names
of God, meaning "complete" or "whole".22
The history of Judaism goes back more than three thousand
years. According to Jewish traditions, when the Israelites left Egypt and reached the Sinai desert, God
gave them the fundamental Ten Commandments that were to govern their social existence. These Laws
and commandments are in fact meant to serve as guides to fostering a good relationship with God and
other people. The 10 commandments/Decalogue of Judaism among others, include (6-10):
{Deuteronomy 5:6-21) &
Exodus,20:13}
Honour thy father and mother.
You shall not kill.
You shall not commit adultery
You shall not steal
You shall not covet your neighbor’s house, his wife, his servants, his animals or anything he
owns.
While explaining the verse, “You shall not kill” from Torah, a Jewish scholar observes:
“It is not enough merely to keep in mind the negative admonition not to kill, but to transmute human
energy and efforts into peaceful and constructive actions”
Another injunction in the words of torah is as follows.“What is hateful (or hurtful) to you, don’t do to any other
man.” Referring to this verse of torah, one Jewish scholar has rightly observed: “that is the whole of Torah, the
rest is but commentary”
Peace, according to the Jewish sages, is the ultimate purpose of the whole Torah:
"All that is written in the Torah was written for the sake of peace." TanhumaShoftim 18
"God announceth to Jerusalem that they [Israel] will be redeemed only through peace." Deuteronomy Rabah
5:15
The ideal world of justice in the words of the prophets is described as :
“And they (people) shall beat their swords into plowshares, and their spears into pruning hooks; nation
shall not lift up sword against nation, neither shall they learn war anymore. “
(Isaiah 2:4 and Micah 4:3)
6. CHRISTIANITY
The word peace is used in the Bible in a very broad sense. It takes in the wellbeing and health of people, as well
as the absence of violence. The teachings of Jesus Christ are enshrined in the New Testament. The Jesus’ well
known ‘Sermon on the Mount’ goes as:

International Journal of Scientific and Research Publications, Volume 7, Issue 4, April 2017 254 ISSN 2250-3153
www.ijsrp.org
“To him who strikes you on the one cheek, offer the other also. And from him, who takes away your cloak, do
not withhold your tunic either. Give to everyone who asks of you. And from him, who takes away your goods, do
not ask them back.” (6:29-30)
Attaching great importance to peace Christ observed: ” Blessed are peacemakers, for they shall be called
the sons of God”. (5:9)
Christian Ethics: The New Testament in fact does not present a new code of ethical behavior, but it emphasizes
a new motive for it.” A large part of Jesus’ teachings was ethical. When an earnest young man asked him,
“what should I do to inherit eternal life?” Jesus answered in accordance with the old law and said, “Do not kill,
do not commit adultery, do not steal, do not bear false witness and do not defraud. Honor your father and your
mother”.
The contributions of Christian missionary schools, hospitals, relief and rescue operations and many more
welfare schemes in the contemporary world need no introduction. Let us look at the scriptures that emanate
such brilliant principles. Further the details of Christian ethics include the teachings of the Bible advising its
followers to:
Be fruitful: The message from parable of fig tree … “A believer should lead a fruitful life, and not just
live for himself”. Luke, 13:6-8
Love your enemy: “Love your enemies and pray for those who persecute you, so that you may
become the sons of your Father in heaven. For He makes His sun shine on bad and good people alike”
(Mathew, 5:44-46)
Do unto others as you would have them do unto you. “No one could expect others to be good to him, while
he himself had no care for their feelings.” Luke, 6:3
On questions of peace and war, Christian ethics seeks to combine Jesus’ message of love with the responsible
exercise of power in society and the polity. Christian leaders and theologians have often sanctioned the use of
violence in self-defense.
The Just War theory specifies conditions for judging if it is just to go to war, and conditions for how the war
should be fought. The Just War Theory is largely a Christian philosophy that provides a guide to the right way
for states to act in potential conflict situations. The theory is not intended to justify wars but to prevent them, by
showing that going to war except in certain limited circumstances is wrong, and thus motivate states to find
other ways of resolving conflicts. A just war is permissible because it's a lesser evil, but it's still an evil. 24
Principles of the Just War
A just war can only be waged as a last resort.
A war is just only if it is waged by a legitimate authority.
the cause is just (self-defense and the protection of innocent human life)
A war can only be just if it is fought with a reasonable chance of success.
The ultimate goal of a just war is to re-establish peace.
The violence used in the war must be proportional to the injury suffered.

International Journal of Scientific and Research Publications, Volume 7, Issue 4, April 2017 255 ISSN 2250-3153
www.ijsrp.org
The weapons used in war must discriminate between combatants and non-combatants.
III ISLAM & PEACE
Islam is the youngest revealed religion of the word. It is in fact not a new religion, but a revised and enlarged
edition of eternal Divine religion based on Unity of God (Tauheed), medium of Prophets (Risalah) and the
concept of After-life (Akhirah). Islam shares these three fundamentals with the other living Abrahamic faiths
i.e. Judaism and Christianity. This is explicit from the Quranic text itself:
“The same religion has He established for you as that which He enjoined on Noah—that which we have sent by
inspiration to thee—and that which we enjoined on Abraham, Moses, and Jesus.” (Al-Quran 42:13)
The relationship between religion and peace in general is quite controversial. Some scholars, such as Asghar
Ali Engineer, argue that Islam as a religion is all peace and does not allow for violence. On a wider scale,
Engineer generally rejects drawing any integral relationship between any religion, including Islam, and
violence. Rather, he sees violence as a social phenomenon that takes place as a result of certain negative
conditions in specific societies where religion may be manipulated as a result.[4]
What a religion teaches can,
therefore, be different from how its followers hold it to be in practice, due to the influence of “self-justifying
groups” such as religious or political institutions or cultural traits. [4, 5
]
The very word Islam (from the Arabic silm) connotes peace. One of the attributes of Allah described in the
Quran is ‘As salaam’, which means peace and security. In the Quran, divine guidance is likened to the path of
peace. (Al-Quran, 5:16). According to Islam, paradise is the ideal human abode, and is thus called ‘home of
peace’. It is also mentioned that people of paradise will greet each other with the word, ‘salaam’ (peace). 13
Though Islam promises the ideal world of peace only in the hereafter; the efforts for establishing order
in the human world carries great reward in the next world irrespective of the outcome of these efforts in this
world. The Islamic concept of peace encompasses whole range of human sphere may it be political, social,
family or personal life.Peaces being the greatest concern of man, all religions attach much importance to it. But
Islam’s concept of peace needs to be studied in more detail as, in the present times; violence is mostly spoken
of with reference to Islam.
Concept of peace in Quran and Hadith: There are many verses in the Qur’an that prefer peace to war and
forgiveness to hatred.6This is evidenced by the fact that only some 60 verses out of 6,666 verses in the Qur’an
deal with the rules of war and armed jihad(0.6%), while the rest deal with faith and moral issues.
Islamic primary texts the Holy Quran and the Hadith of Prophet (PBUH) are replete with instructions and
exhortations for peace. Let’s have a look at few versesfrom the Quran: 22
“Allah calls to the home of peace”. (Al-Quran; 10:25)
“Disturb not the peace of the earth after the fair ordering thereof by God.” (Al-Quran 7:56& 7:85)
In Islam, the right to life is an absolute value: 35
“He who kills a soul unless it be (in legal punishment) for
murder or for causing disorder and corruption on the earth will be as if he had killed all humankind; and he

International Journal of Scientific and Research Publications, Volume 7, Issue 4, April 2017 256 ISSN 2250-3153
www.ijsrp.org
who saves a life will be as if he had saved the lives of all humankind.”
(Al-Quran 5:32)
Now let’s turn to precedence from the Sunnah of Holy Prophet of Islam (PBUH):
The prophet of Islam (PBUH) was a man of peace and reconciliation. He urged his companions to ask God for
peace. For the prophet’s main task was the communication of divine message to the people and an atmosphere
of peace and good will was essential to perform this duty.
“God grants to peace what he doesn’t grant to violence” (Muslim:2593)
“Do good to those who harm you” (Al-Tirmidhi)
"One, who betrays, harms, or deceives a Muslim, is not of us." ( Muslim,101,102.)
"A Muslim is one from whose hand and tongue people are safe. A believer is one from whom people know that
their wealth and lives are safe." (Bukharî, Iman, 3, 5; Muslim, Iman, 64, 65; Nasaî, Iman, 8, 104, 105.)
It becomes thus amply clear that Islam is primarily a religion of peace having nothing to do with violence. Or
the violence prevalent in the contemporary world has no sanction from the Quran or the life of the Prophet of
Islam (PBUH).
Jihad in Islam The word jihad is derived from the Arabic ‘Juhd’ which actually means to struggle, to strive, to
exert oneself to the utmost to achieve one’s goal. Therefore, in the Islamic sense, Jihad means to struggle or
strive in the way of God. 2
Al-Farabi (874-950) a renowned Muslim philosopher, maintained a clear distinction between “war” and “jihad”
in his writings. War is only one form of jihad, which refers to military action. The true essence of jihad for al-
Farabi is the internal struggle within one’s soul between the forces of reason, on the one hand, and one’s desires
on the other, with the aim of the first to control or moderate the second so that virtue may prevail. More
important is that the jihad for justice is grounded on the moral concept of responsibility to Allah. While
Muslims struggle all the time to excel in their attempts to follow in the path of Allah, the way in which they
interpret His laws is still bound in social, historical and political realities.4
Similarly in the words of Sayyid Muhammad Rizvi: “ Like other major religions of the world, Islam does have
a place for this minor jihad or the armed struggle, but its scope and indications carry certain riders before
embarking on such an important campaign. Granting permission for Jihad the Quran clearly indicates its
purpose:
“Permission is granted to those who are fighting because they have been oppressed…those who have been
expelled from their homes without any just cause…” (Al-Quran, 22:39-40)
“And what is the matter with you that you do not fight in the way of God for the oppressed men, women, and
children who pray: ‘Our Lord, take us out of this town whose people are oppressors, and appoint for us from
Thee a guardian and a helper” (Al-
Quran,4:75)
“Prepare against them (i.e., the enemy) with whatever force and trained horses you can in order to frighten
thereby Allah’s enemy, your enemy, and others besides them who you do not know but Allah knows them.”

International Journal of Scientific and Research Publications, Volume 7, Issue 4, April 2017 257 ISSN 2250-3153
www.ijsrp.org
(Al-Quran, 8:60)
We can infer from these verses that Islam allows armed struggle in certain situations with specific aims and
proper discipline. E.g. Oppression (22:39, 4:75) & religious persecution (22:39-40); consolidation of military
might to frighten the enemy; (8:60) and self defense. (2:190).
Further there are rules to be followed by armed men, even during jihad differentiating it from the indiscriminate
use of violence. Islam teaches that Muslims should be strong in order to defend themselves, but that does not
mean they have to become aggressive and unjust. Fighting should be directed only against fighting troops, and
not against civilians. Thus, the Quran says:
“Fight in the way of God those who are fighting against you; and do not exceed (the limits).Verily Allah
does not love those who exceed (the limits).” (2:190)
Following the tradition of Prophet of Islam,Abu-Bakr, the First Caliph once instructed Yazid ibn-Abi Sufian: “I
give you Ten Commandments: Don’t kill a woman or a child or an old person, and don’t cut trees
or ruin dwellings or slay a sheep but for food. Don’t bum palm trees or drown them. And don’t be spiteful or
unjust.”24
Islam is the religion of peace. It therefore enjoins peace even in war when the enemy is inclined to peace.
“If the enemy is inclined towards peace you should also incline towards peace and trust in God.” (Al-
Quran 8:61)
The truth is that Islam in the full sense is a religion of peace. In no way it is a religion of war. In Islam peace is
the rule and war is only a rare exception. Further any stray acts of aggression are not enough for Muslims to
rush into war. (18)
Just because the term “jihad” is misused by some Muslims for their political agenda, Muslims
don’t have to abandon this noble concept of their faith. Many Muslims describe only the major (spiritual) jihad
and shy away from the jihad in the sense of armed struggle for defense. As Muslims, we stand by our teachings
and don’t need to apologize for it even if some misguided souls hijack the terms of faith for their own political
ends. (16)
It is no exaggeration to say that Islam and violence are contradictory to each other. An attempt to
bracket violence with Islam amounts to casting doubt upon the very eternity of the Islamic religion. The truth of
the matter is that, all the teachings of Islam are based on the principle of peace.17
IV Conclusions: As “Allah calls to the home of peace” (Al-Quran; 10:25), let’s respond positively…!!
And here lies the wisdom. From the whole discussion we can draw few practical lessons that could be
applied for achieving a lasting peace in this world and the hereafter where we need it most.
Education: Religions usually incorporate a code of ethics that concern the behavior of the individual;
but men don’t always live up to the standards they profess (2);
The religious leaders will have to come
forward and take the responsibility of bridging this gap through moral education of young generation
and reconnecting them to original sources of their religions.
Inter-Religious Dialogue: Dr. Hans Kung, a Professor of Ecumenical Theology rightly echoes all
peace lovers when he says “there will be no peace among nations, without peace among the religions
and there will be no peace among religions without dialogue among the religions”.2 So the need of the
hour is to come closer to each other through religious tolerance and intercommunity dialogues.
Be pragmatic in controversial matters. It is greatest wisdom to be content with pragmatic goals when
the ideal goal is not achievable. 18

International Journal of Scientific and Research Publications, Volume 7, Issue 4, April 2017 258 ISSN 2250-3153
www.ijsrp.org
Right Information: There is a lot of misinformation and misunderstanding of the Islamic faith. It is
essential that Muslims be judged in the light of Islamic ideals: Islam should not be judged in the light of
what Muslims do in the name of Islam.(19)
‘Return good for evil’ Make a friend out of foe as the power of peace is stronger than power of
violence. (Al-Quran 41:34); (Mathew, 5:44-46)
Be Fruitful: (Luke, 13:6-8); and a Hadith from KanzulUmmal 16/44154: Hadith: “The best amongst
mankind is one who benefits humanity”
In conclusion I leave you with these thoughts for today:
1) "There is no path to peace; peace is the path." (A.J. Muste)
2) Let there be peace everywhere and “Let it Begin with me”.
References
1. The New International Webster’s Comprehensive Dictionary of the English Language (Deluxe
Encyclopedic Edition), Trident Press International,Naples, 2001, p.927.
2. Khanam, Dr. Farida; “A Study of World’s Major Religions” Goodword Books Nizamuddin West New
Delhi.2014. P-35,162,236-37.
3. Mohapatra, A.R. “Philosophy of Religions (An Approach to World Religions)” Sterling Publishers
Private Limited. P-119,124,135-36,139,142-43,152.
4. HishamSoliman ‘Toward an Islamic Concept of Peace’ in “The Potential for Peace building in
Islam”Volume 2. Issue 2, Spring 2009
5. Engineer, Ali, Asghar: “On the Concept of Compassion in Islam,”
http://www.andromeda.rutgers.edu/~rtavakol/engineer/compassion.htm, accessed on 28 March 2007.
6. Randall, Albert B., Theologies of War and Peace among Jews, Christians, and Muslims (New York:
Edwin Mellen Press, 1998), 289-90.
7. Encyclopedia Britanica;1984-13/847.
8. Gandhi, K. Mohandas: The Essential Gandhi: An Anthology of His Writings on His Life, Work, and
Ideas, edited by Louis Fischer, with a Preface by EknathEaswaran
9. www.markedbyteachers.com/gcse/religious.../hinduism-and-peace-1.html/accessed 04/03/2017
10. Khan, Wahiduddin: “The Ideology of Peace”, Goodword Books, New Delhi. P-94.
11. Ahmed, Moinuddin“Religions of All Mankind” KitabBhawan, New Delhi-110002. P-65, 70, 99,139.
12. Willis, Jan “Buddhism and Peace” - Faith in Peace Seminar, G6B People's Summit - Calgary,
Alberta, Canada{www.g6bpeoplessummit.org}
13. Jainism-wikipedia(http://en.m.wikipedia.org>wiki>jainism. Accessed 12/03/2017
14. www.bbc.com>sikhism>sikhethics>war
15. Vaswani, J.P. “Many Paths,:One Goal”, Gita pubishingHouse,Pune, p.157)
16. Rizvi,Sayyid Muhammad , “Peace and Jihad in Islam”:© Ahlul Bayt Digital Islamic Library Project
1995-2017
17. Khan, Wahiduddin: “The True Jihad”, Goodword Books, New Delhi.P-29-31.
18. Khan, Wahiduddin: The Age of Peace:Goodword Books, New Delhi.P-67,162
19. Khan, Wahiduddin: The Creation Plan of God:Goodword Books, New Delhi.P-21.
20. Khan, Wahiduddin: The Quran, Arabic text, Translation and Commentary of the Quran,Goodword
Books, New Delhi
21. MasudulHassan;The Digest of the Holy Quran.3rd
edition.kitabBhawan, New delhi 110002, p.276,405
22. Judaism-wikipedia(http://en.m.wikipedia.org>wiki>judaism. Accessed 12/03/2017

International Journal of Scientific and Research Publications, Volume 7, Issue 4, April 2017 259 ISSN 2250-3153
www.ijsrp.org
23. Just-war-wikipedia(http://en.m.wikipedia.org>wiki>just-war. Accessed 12/03/2017
24. HATHOUT, DR. HASSAN, “WAR ETHICS IN ISLAM” THE MINARET PUBLISHING HOUSE
Islamic Centre of Southern California,434 South Vermont, LOS ANGELES, CA 90020
International Journal of Scientific and Research Publications, Volume 7, Issue 4, April 2017 263 ISSN 2250-3153
www.ijsrp.org
Impact of Participation in Microfinance on Women Empowerment: Evidence from the Women Enterprise
Fund Beneficiaries in Nairobi County, Kenya Margaret Wawira Ndwiga*, Dr. Florence Ondieki-Mwaura**, Dr. Winifred Karugu***
* PhD Student, Department of Development Studies, School of Communication and Development Studies, Jomo Kenyatta University of Agriculture
and Technology (JKUAT) **Senior Lecturer, Department of Development Studies, School of Communication and Development Studies Jomo Kenyatta University of
Agriculture and Technology (JKUAT) ***Director, JKUAT Enterprises, Jomo Kenyatta University of Agriculture and Technology (JKUAT)
Abstract- Researchers have argued that if programmes are appropriately designed, microfinance could make an important contribution to women’s empowerment. Empowerment is about changing power relations to favour those who previously had limited power over their own lives. Participation of women in microfinance programmes provides them with resources that enhance their individual ability to make choices and consequently gain control over their own lives. An example of programmes providing microfinance services targeting women clients is the Women Enterprise Fund (WEF), an initiative of the government of Kenya. This paper employs a descriptive approach to examine effect of duration of participation in the WEF micro finance programme on women empowerment in Nairobi County. The paper is based on the findings of a wider study on the impact of WEF Microfinance intervention programme on women empowerment, carried out between October 2015 and January 2016 in Nairobi County. A sample of 385 women was drawn randomly from 167 active self help groups that were beneficiaries of microcredit and other financial services from WEF. Data was collected using a structured questionnaire, as well as through focus group discussions. According to the findings, participating in the WEF programme had a positive influence on various dimensions of empowerment, but the duration of women’s participation (the number of years women had received credit in form of loans, and other services from WEF) had very limited impact on empowerment outcomes. Index Terms- Participation, Empowerment, Microfinance
I. INTRODUCTION 1.1 Justification for Women-only Microfinance
interventions growing body of contemporary literature indicates that the issue of women empowerment has become a central aspect in programs and activities of most government and non-governmental organizations. It is considered crucial in achieving an all-round development of societies and nations (Mandal, 2013). The need for empowerment of women stems from the fact that many women have limited decision-making power and choices in life (or within their households), because in most socio-economic areas, they are considered worse off than men,
for instance, in terms of literacy and labour force participation. Microfinance institutions targeting women clients act as interventions to improve access to financial resources, in an attempt to reduce existing inequalities, and to create equal opportunities for participation in development. If appropriately designed, microfinance can make an important contribution to women’s empowerment (Adjei-Bosompem, 2013), and hence a critical tool to empower women from poor households (Pokhriyal et al, 2014; Khan & Noreen, 2011). The Women Enterprise Fund is an example of an intervention that creates an opportunity for women to access microfinance services, the main product being provision of microcredit in form of affordable loans to women. Though individual women also access its financial services, WEF’s microfinance services mainly target women belonging to self help groups, with the aim of helping them initiate or improve their business enterprises, generate income and in the process achieve empowerment. This paper looks at the relationship between women’s participation in the WEF microfinance programme and empowerment outcomes in Nairobi County. 1.2 Understanding the concept of Women Empowerment A growing body of contemporary literature indicates that the issue of women empowerment has become a central aspect in programs and activities of most government and non-governmental organizations. There are varied definitions of empowerment, and methodological critique within literature with regard to the empowerment concept still persists, due to inconsistencies in its operationalization, conceptualization and measurement (Shimamoto, 2014). Nevertheless, most definitions imply some form of achievement, especially in relation to women’s relative position in the household and society. Empowerment as a term has a connotation of power, and is about changing power relations to favour those who previously had limited power over their own lives. Some scholars have however argued that the empowerment idea is not related to the kind of power that dominates other people, but power to enable one to achieve goals and ends (Musonera & Heshmati, 2016). This power enables individuals gain control over resources (physical, human, intellectual, financial and self), as well as control over ideology in terms of beliefs, values and attitudes. Empowerment can therefore be considered as a process of gaining control
A
International Journal of Scientific and Research Publications, Volume 7, Issue 4, April 2017 264 ISSN 2250-3153
www.ijsrp.org
(Batliwala, 1993, cited in Cornwall, 2016), in this context, control of one’s life. Empowerment has also been defined as a process that brings people who are outside decision-making process into it. When applied to women, it is considered important as it leads to a positive change that improves women’s fall-back position and bargaining power within a patriarchal system, while creating awareness and capacity building (Rahman, 2013). Women empowerment entails change, and the ability to make choices (Kabeer, 2005), also referred to as strategic life choices. Kabeer’s concept of “choices” encompasses three inter-related components that define empowerment: resources, which constitute the pre-conditions under which choices are made (pre-conditions of empowerment); agency (the process - which includes control of resources and decision-making), and achievements, the outcomes of choices (Malhotra et al, 2002). In this paper, empowerment is considered as a multi-dimensional concept that encompasses financial advancement, change in spending on human development, economic decision-making and social/psychological empowerment. 1.3 Empowerment of Women in Kenya through the Women Enterprise Fund The Women Enterprise Fund (WEF), a Kenya government women-only financial intervention programme that came into existence in 2007 is geared towards provision of affordable financial and business support services to Kenya’s women (WEF, 2017), based on the premise that most women have historically faced difficulties in accessing credit from traditional financial institutions such as banks. It provides services to individual women entrepreneurs or women-owned companies and their organizations through a number of products and services. The most popular product is the ‘Tuinuke’ loan, a form of microcredit available to women in self-help groups (SHGs) with a minimum membership of ten persons. The product is available to women SHGs all over the country, and is accessed alongside other microfinance services such as training and market linkage. The objective of this paper is to determine whether the duration (in years) of participation in the WEF microfinance programme has an influence on women empowerment outcomes in Nairobi County. The study focused on women members of SHGs accessing the Women Enterprise Fund’s ‘Tuinuke’ product loans in Nairobi County, Kenya. The product is available to members of registered self-help groups in Kenya. For the groups to benefit from WEF services, their membership must be composed of 70% women.
II. THEORETICAL CONTEXT OF MICROFINANCE AND REVIEW OF EMPIRICAL EVIDENCE
2.1 Theoretical Context Access to microfinance enables women to initiate or expand business enterprises that help them earn income. The income earned is expected to improve women’s economic position, alleviate poverty and contribute to improved living standards, especially for poor women. Increasing income levels to alleviate poverty (anti-poverty approach) can consequently contribute to women empowerment by enabling women make choices in life. Microfinance programs provide women with
access to financial services to improve the economic/financial position of households (Kabeer, 2005a), which in turn enhances food security, housing and improved health (Mayoux, 2001). 2.2 Literature Review Research shows that women’s participation in microfinance programmes leads to empowerment outcomes such as increased earnings, savings and short term expenditures as evidenced in Asia (Jain & Jain, 2012; Mazumdar & Wencong, 2013; Sultana & Hasan 2010), Northern Uganda’s Women’s Income Generating Support (WINGS) program (Blattman et al, 2013), and some parts of Kenya (in Mugotio constituency by Maru & Razia, 2013; Narok town by Mutai & Achieno, 2013; Nandi by Magugui et al, 2013). It also benefits children in terms of schooling, nutrition (Khandker et al, 1998), medical services, household goods and clothes (Dobra, 2011; Caretta, 2010), and is significantly associated with higher spending on education (Magugui et al, 2013), food, and reduced spending on alcohol and tobacco (Ranis & Stewart, 2005 citing a Côte d’Ivoire study by Hoddinott & Haddad,1991). Studies also point at improved social and economic conditions of women (Mukayiranga, 2013), improved social and psychological well-being (Sarumathi & Mohan, 2011), social status and decision making (Karuga, 2014), social and political awareness (Hashemi, et al, 1996), reducing violence by intimate partners (Gupta et al, 2013), and general household well being (Awojobi, 2014). Other studies reveal greater ability to influence investment decisions, gaining more respect from husbands, with women’s opinions and roles more valued in economic decision-making (Haneef et al, 2014; Loomba, 2013), more control over income and savings (Kato & Kratzer, 2013), general household decision-making and bargaining power in households where income is invested jointly (Ngo & Wahhaji, 2011). Beneficiaries of microfinance in parts of Ghana, Tanzania and Kenya also report improved self esteem and confidence (Seddoh, 2014; Kato & Kratzer, 2013; Caretta, 2010), and in Uganda, improved self value and self image (Lakwo, 2006). Women also report gaining greater ownership over businesses, household assets (Lakwo, 2006), and houses (Magugui et al, 2013). In regard to impact of duration of participation in microfinance on empowerment, a review of findings from a number studies reveal no significant association between length of involvement in a microcredit programme and women empowerment (Awaworyi, 2014). A study in Burma could not also conclusively determine whether length of membership in microfinance has any effect on empowerment (Ringkvist, 2013). Literature reviewed therefore indicates that participation in microfinance indeed may have an impact on women empowerment, but evidence on the impact of length/duration of participation on empowerment outcomes is inconclusive, hence the need to contribute to knowledge on this aspect by focusing on not just participation, but the duration in years that women have participated and accessed services from a microfinance programme.

International Journal of Scientific and Research Publications, Volume 7, Issue 4, April 2017 265 ISSN 2250-3153
www.ijsrp.org
III. RESEARCH ELABORATIONS The data analysed in this paper were collected as part of a wider study to examine the impact of WEF micro-finance intervention on women empowerment in Nairobi County. A survey was conducted with women members of SHGs that had accessed credit from the Women Enterprise Fund for at least three years. A sample of 385 women picked randomly from 167 SHGs (that were identified as active), were interviewed during the survey, which was carried out between October and December 2015. Data were collected using a structured survey questionnaire. The analysis and compilation of the wider research report, which included a bivariate as well as multivariate analysis, was completed by July 2016. The survey questionnaire included questions related to the four selected WEF intervention variables: Duration (in years) of participation in the WEF programme, access to credit (amount and number of times), access to training (frequency and type) and SHG support. This paper employs a descriptive approach to present findings of bivariate analysis of the relationship between participation in the WEF programme (indicator:the number of years women had received loans and other services), and women empowerment. The indicators of empowerment (which was considered as a multidimensional concept), were:
1) Financial advancement, measured by: change in monthly incomes, contribution to household expenditure, change in amount of personal savings
2) Change in spending on human development aspects: children’s education, Nutrition and health
3) Economic decision-making measured by attitude towards sale of three types of assets
(Land; household goods such as furniture & electronics; kitchen items such as cookers/stoves, pots, cutlery/plates), and control of income earned.
4) Social/psychological empowerment. To assess this, a 5-point Likert scale ranking responses to eight indicators/items that described decision-making and/or status of social/psychological empowerment was developed. The scale ranged from the highest decision-making level/empowerment status, to the lowest/absence of empowerment as (5 – always, 4 – almost always, 3 – sometimes may be/not sure 2 - rarely 1 – never). Responses on the indicators/items covered the status of empowerment at the time of the survey (following exposure to WEF microfinance services), as well as the reported status before exposure to WEF microfinance services. The eight indicators/items, for which Cronbach's alpha coefficient of reliability was observed as 0.625 (for responses on reported situation after accessing WEF microfinance services) and 0.763 (for reported status before accessing WEF microfinance services), were as follows:
i. I am involved in household decision-making regarding choice of schools
My children or dependants attend ii. I participate in household decision-making in
regard to family health care
iii. I participate in household decision-making in regard to children’s shopping and major household purchases
iv. I am free from family tension/violence within the household (from partner/husband/members of family/household
v. I interact with other people in meetings/social gatherings with ease – feeling of self confidence
vi. I can visit friends/family/attend meetings/functions: I do not have to seek permission from husband/family
vii. There is equitable sharing of household work/chores between me and husband/family members when at home
viii. I believe in my ability to solve issues and make the right decisions about life/family matters – feeling of self-worth/esteem.
In this paper, the responses to the social/psychological empowerment indicators/items were re-grouped into three: 3-Always/almost always (high level empowerment), 2-sometimes may be/not sure (moderate or unsure), and 1-rarely/never (low empowerment).
IV. SOCIO-DEMOGRAPHIC AND BUSINESS PROFILES OF SURVEYED WOMEN
The first part of the survey questionnaire contained questions on the women respondents’ background, to provide information on their socio-demographic and business profiles. Table 1 shows the socio-demographic profiles of the women respondents.
Table 1 Socio-demographic Profile of Surveyed women respondents
Characteristic Percentage (%)
of women No. of women
Age in 5 year age groups
20-24 1.0 4 25-29 8.3 32 30-34 13.0 50 35-39 16.1 62 40-44 16.1 62 45-49 12.7 49 50-54 10.6 41 55-59 6.0 23 60-64 9.7 37 65-69 4.2 16 70+ 2.3 9 Total 100 385 Years of Schooling
No Schooling 0.8 12 1-6 3.1 12 7-8 12.5 48
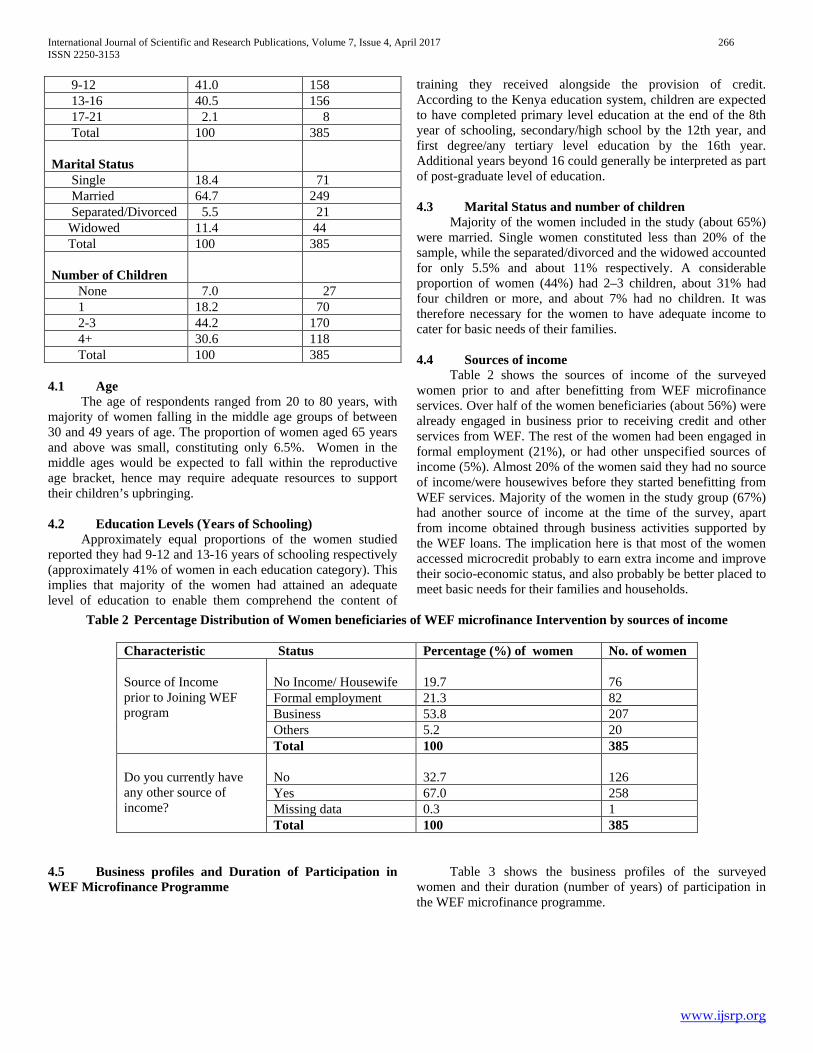
International Journal of Scientific and Research Publications, Volume 7, Issue 4, April 2017 266 ISSN 2250-3153
www.ijsrp.org
9-12 41.0 158 13-16 40.5 156 17-21 2.1 8 Total 100 385 Marital Status
Single 18.4 71 Married 64.7 249 Separated/Divorced 5.5 21 Widowed 11.4 44 Total 100 385 Number of Children
None 7.0 27 1 18.2 70 2-3 44.2 170 4+ 30.6 118 Total 100 385
4.1 Age The age of respondents ranged from 20 to 80 years, with majority of women falling in the middle age groups of between 30 and 49 years of age. The proportion of women aged 65 years and above was small, constituting only 6.5%. Women in the middle ages would be expected to fall within the reproductive age bracket, hence may require adequate resources to support their children’s upbringing. 4.2 Education Levels (Years of Schooling) Approximately equal proportions of the women studied reported they had 9-12 and 13-16 years of schooling respectively (approximately 41% of women in each education category). This implies that majority of the women had attained an adequate level of education to enable them comprehend the content of
training they received alongside the provision of credit. According to the Kenya education system, children are expected to have completed primary level education at the end of the 8th year of schooling, secondary/high school by the 12th year, and first degree/any tertiary level education by the 16th year. Additional years beyond 16 could generally be interpreted as part of post-graduate level of education. 4.3 Marital Status and number of children Majority of the women included in the study (about 65%) were married. Single women constituted less than 20% of the sample, while the separated/divorced and the widowed accounted for only 5.5% and about 11% respectively. A considerable proportion of women (44%) had 2–3 children, about 31% had four children or more, and about 7% had no children. It was therefore necessary for the women to have adequate income to cater for basic needs of their families. 4.4 Sources of income Table 2 shows the sources of income of the surveyed women prior to and after benefitting from WEF microfinance services. Over half of the women beneficiaries (about 56%) were already engaged in business prior to receiving credit and other services from WEF. The rest of the women had been engaged in formal employment (21%), or had other unspecified sources of income (5%). Almost 20% of the women said they had no source of income/were housewives before they started benefitting from WEF services. Majority of the women in the study group (67%) had another source of income at the time of the survey, apart from income obtained through business activities supported by the WEF loans. The implication here is that most of the women accessed microcredit probably to earn extra income and improve their socio-economic status, and also probably be better placed to meet basic needs for their families and households.
Table 2 Percentage Distribution of Women beneficiaries of WEF microfinance Intervention by sources of income
Characteristic Status Percentage (%) of women No. of women Source of Income prior to Joining WEF program
No Income/ Housewife
19.7
76
Formal employment 21.3 82 Business 53.8 207 Others 5.2 20 Total 100 385
Do you currently have any other source of income?
No
32.7
126
Yes 67.0 258 Missing data 0.3 1 Total 100 385
4.5 Business profiles and Duration of Participation in WEF Microfinance Programme
Table 3 shows the business profiles of the surveyed women and their duration (number of years) of participation in the WEF microfinance programme.
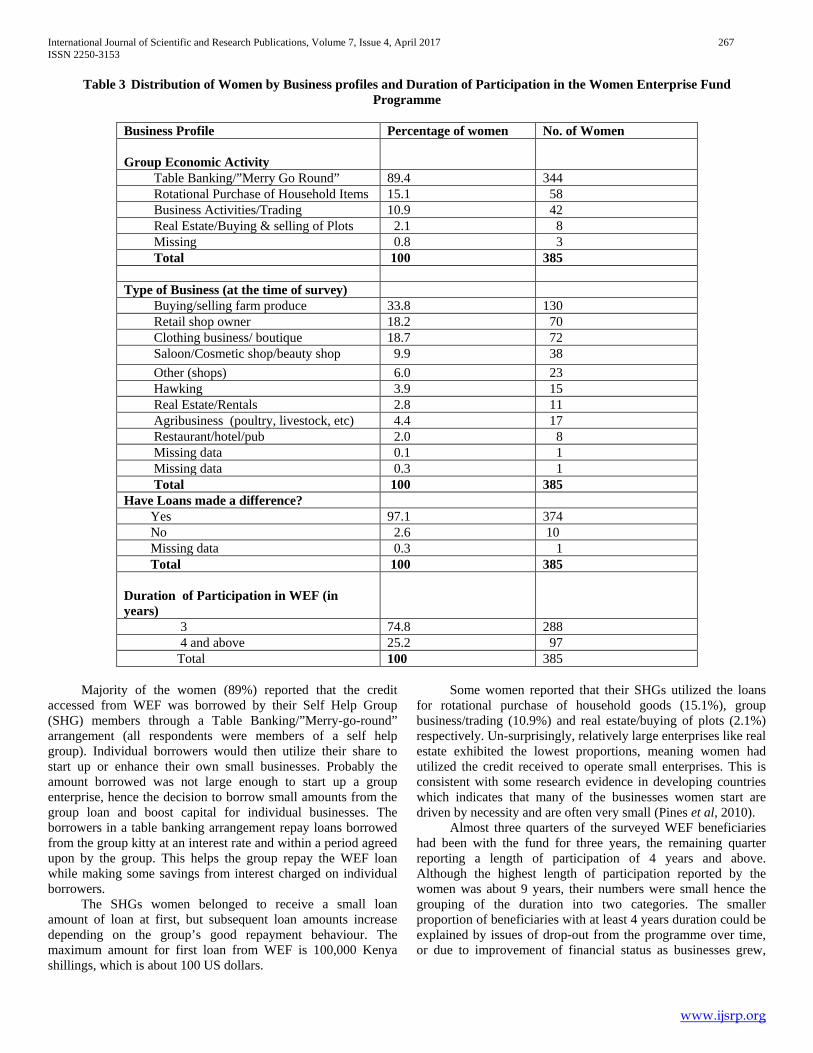
International Journal of Scientific and Research Publications, Volume 7, Issue 4, April 2017 267 ISSN 2250-3153
www.ijsrp.org
Table 3 Distribution of Women by Business profiles and Duration of Participation in the Women Enterprise Fund Programme
Business Profile Percentage of women No. of Women Group Economic Activity
Table Banking/”Merry Go Round” 89.4 344 Rotational Purchase of Household Items 15.1 58 Business Activities/Trading 10.9 42 Real Estate/Buying & selling of Plots 2.1 8 Missing 0.8 3 Total 100 385 Type of Business (at the time of survey) Buying/selling farm produce 33.8 130 Retail shop owner 18.2 70 Clothing business/ boutique 18.7 72 Saloon/Cosmetic shop/beauty shop 9.9 38 Other (shops) 6.0 23 Hawking 3.9 15 Real Estate/Rentals 2.8 11 Agribusiness (poultry, livestock, etc) 4.4 17 Restaurant/hotel/pub 2.0 8 Missing data 0.1 1 Missing data 0.3 1 Total 100 385 Have Loans made a difference? Yes 97.1 374 No 2.6 10 Missing data 0.3 1 Total 100 385 Duration of Participation in WEF (in years)
3 74.8 288 4 and above 25.2 97 Total 100 385
Majority of the women (89%) reported that the credit accessed from WEF was borrowed by their Self Help Group (SHG) members through a Table Banking/”Merry-go-round” arrangement (all respondents were members of a self help group). Individual borrowers would then utilize their share to start up or enhance their own small businesses. Probably the amount borrowed was not large enough to start up a group enterprise, hence the decision to borrow small amounts from the group loan and boost capital for individual businesses. The borrowers in a table banking arrangement repay loans borrowed from the group kitty at an interest rate and within a period agreed upon by the group. This helps the group repay the WEF loan while making some savings from interest charged on individual borrowers. The SHGs women belonged to receive a small loan amount of loan at first, but subsequent loan amounts increase depending on the group’s good repayment behaviour. The maximum amount for first loan from WEF is 100,000 Kenya shillings, which is about 100 US dollars.
Some women reported that their SHGs utilized the loans for rotational purchase of household goods (15.1%), group business/trading (10.9%) and real estate/buying of plots (2.1%) respectively. Un-surprisingly, relatively large enterprises like real estate exhibited the lowest proportions, meaning women had utilized the credit received to operate small enterprises. This is consistent with some research evidence in developing countries which indicates that many of the businesses women start are driven by necessity and are often very small (Pines et al, 2010). Almost three quarters of the surveyed WEF beneficiaries had been with the fund for three years, the remaining quarter reporting a length of participation of 4 years and above. Although the highest length of participation reported by the women was about 9 years, their numbers were small hence the grouping of the duration into two categories. The smaller proportion of beneficiaries with at least 4 years duration could be explained by issues of drop-out from the programme over time, or due to improvement of financial status as businesses grew,
International Journal of Scientific and Research Publications, Volume 7, Issue 4, April 2017 268 ISSN 2250-3153
www.ijsrp.org
after which the beneficiaries could have become eligible for access to other financial services that hitherto were out of reach.
V. RESEARCH FINDINGS AND DISCUSSION 5.1 Participation and Financial Advancement Table 4 shows the relationship between duration of participation in WEF microfinance and change in monthly incomes. Overall, 89% of the women reported that their income levels had increased, with only 6% indicating that their income
levels had decreased after joining the WEF programme. The remaining 4.9% reported that income levels had not changed. This means that though for about 11% of the women the loans either did not make a difference or worsened their financial position, majority reported an increase in incomes. This is consistent with findings from other studies in Kenya (Maru & Razia, 2013; Mutai & Achieno, 2013; Magugui et al, 2013), which associate participation in microfinance with improved incomes, among other gains.
Table 4 Percentage Distribution of Women by Duration of participation change in monthly incomes
Years of Participation
Percentage distribution by nature of change in income
Percentage distribution by magnitude of change in income (income now, minus income before)
Has your monthly income increased, decreased or remained the same since your Self help group started benefitting from WEF microfinance?
Income per month (in shillings) had Changed by
Increased
Remained the same
Decreased
Total
Less than 0 to -50,000
0
>0 to 9,000
10,000 to 19,000
20,000 and above
Total
3
89.9
4.2
5.9
100
6.2
3.8
46.2
25.0
18.8
100
4 and above
86.6
7.2
6.2
100
5.2
8.2
42.3
21.6
22.7
100
Total
89.1
4.9
6.0
100
6.0
4.9
45.2
24.2
19.7
100
The proportion of those whose income had increased dropped slightly with increase in years of participation, from 89.9% of those that had participated for three years, to 86.6% of those that had participated for four years or more. Findings imply that income levels for most women had increased after they joined the WEF microfinance programme, but number of years of participation beyond 3 years had diminishing effect on incomes. For a sizeable proportion of women who reported an increase in incomes (45.2%), the magnitude of increase in income was less than 10,000 shillings. Only 19.7% had increases
of 20,000 shillings and above, but situation was not significantly influenced by years of participation. This could be attributed to the size of enterprises/businesses that women were involved with, most of which were relatively small. The other measure of financial advancement was the women’s contribution to household /family expenditure once they earned their own income. Table 5 shows the impact of duration of participation on contribution to household expenditure.
Table 5 Percentage Distribution of surveyed women by Duration of participation and status of contribution to Household
Expenditure
Years of Participation
Percentage distribution by status of contribution to household expenditure Were you contributing to household/family expenditure before your group joined WEF?
Are you contributing now?
Yes
No
Total
Yes
No
Total
3
74.3
25.7
100
94.1
5.9
100
4 and above
80.4
19.6
100
90.7
9.3
100
Total
75.8
24.2
100
93.2
6.8
100
International Journal of Scientific and Research Publications, Volume 7, Issue 4, April 2017 269 ISSN 2250-3153
www.ijsrp.org
For all women respondents, the proportion of those reporting they contributed to household expenditure increased from 75.8% for reported situation before WEF microfinance intervention to 93.2% for the reported situation after WEF, implying that participating in microfinance may have enabled them to get involved in financial contributions to run their households. Conversely, the proportion of those who reported not having been contributing to this expenditure reduced from 24% (before benefitting from WEF microfinance) to only 6.8% (status after benefitting), an implication that a large proportion of those not contributing before had shifted to the status of contributing to household expenditure after benefitting from the programme. Participating in WEF microfinance could therefore have
enhanced the women’s income levels, enabling them to contribute towards household expenditure. Duration of participation did not have a positive effect on status of contribution to household expenditure after participating in microfinance, because the proportion of women that were contributing decreased from 94.1% of those that had participated for 3 years to 90.7% of those that had participated for four years or more. This means that it is the joining of the WEF programme that had an impact, but not the number of years of participation. Respondents were also asked to indicate whether their personal savings had changed as a result of their participation in WEF microfinance programme (table 6).
Table 6 Percentage Distribution of Respondents by Duration of participation and change in amount of Personal savings
Years of Participation in WEF
Has the amount of personal savings changed since joining WEF microfinance?
Percentage (%) increase in personal savings
Yes
No
Total
0
1- 19
20-39
40-59
60 and above
Total
3
89.9
10.1
100
10.1
52.1
18.1
14.6
5.2
100
4 and above
89.9
10.3
100
10.3
50.5
17.5
12.4
9.3
100
Total
89.9
10.1
100
10.1
51.7
17.9
14.0
6.2
100
About nine out of ten respondents (89.9%) indicated that the amount of personal savings had changed since they started benefitting from WEF microfinance. This proportion generally remained almost the same irrespective of the number of years of participation. This implies that joining the WEF microfinance programme was positively associated with change in amount of savings, but the duration of participation had no effect. For slightly over half of all women (51.7%), amount of personal savings had increased by less than 20%. For most of the percentage increase categories, the proportions of respondents reduced with increase in duration of participation. On the other hand, in just one out of ten respondents (about 10%), there was no increase in amount of savings, whether they had participated
in the program for three years or four years and above. In summary, amount of personal savings for women had increased after participation in WEF microfinance programme, but duration of participation did not have an appreciable effect. 5.2 Participation and indicators of Human Development Table 7 shows the relationship between duration of participation and respondents’ reported status of contribution to selected aspects of human development at household level. Respondents were asked to indicate whether their spending on children’s/dependants’ education, nutrition and health had increased decreased or remained the same, now that they had been able to access microfinance services from WEF.
Table 7 Percentage Distribution of Women by Duration of participation and Human Development indicators
Human Development Indicator
Percentage Distribution by years of participation in WEF microfinance 3
4 and above
Total
Spending on Children’s Education had: Increased 65.3 66.0 65.5 Decreased 4.5 8.2 5.5 Remained the same 13.2 10.3 12.5 Began spending after WEF
3.1 1.0 2.6
Do not spend on Education 10.4 11.3 10.6 Missing data or no children 3.5 3.2 3.3
International Journal of Scientific and Research Publications, Volume 7, Issue 4, April 2017 270 ISSN 2250-3153
www.ijsrp.org
Total 100 100 100 Spending on Children’s Nutrition had: Increased 62.2 72.2 64.7 Decreased 8.0 9.3 8.3 Remained the same 18.1 12.4 16.6 Began spending after WEF 2.4 - 1.8 Do not spend on Nutrition 6.3 4.1 5.7 Missing data or no children 3.0 2.0 2.9 Total 100 100 100 Spending on Children’s Health had: Increased 45.1 48.5 46.0 Decreased 17.4 12.4 16.1 Remained the same 23.3 25.8 23.9 Began spending after WEF 2.8 3.1 2.9 Do not spend on Health 8.7 9.3 8.8 Missing data or children 2.7 1.0 2.3 Total 100 100 100
The majority of respondents (65.5%) had increased their contribution towards children’s education, with an almost negligible variation between those with three years of participation (at 65.3%) and those with a participation span of four years and above (66.0%). There was however a sizeable proportion (about 23%) whose contribution either remained the same (12.5%) or were not contributing to children’s education at all (10.6%), but which also varied negligibly with years of participation in WEF microfinance services. This proportion signified a situation where women may not have been obliged to contribute to children’s education or spouses/other family members took care of the responsibility, a status probably related to influence of traditional gender roles in a patriarchal society, where men take major household responsibilities like children’s education. With regard to children’s nutrition, still a majority of respondents (64.7%), albeit lower than the proportion on education, reported to have increased their spending on children’s nutrition. However, unlike the case of spending on education, data revealed a considerable increase in proportions from 62% of those who had participated for three years to 72.2% of those that had participated for four years and above, an increase of 10 percentage points. Also, the proportion of those whose spending did not change was higher (16.6%) in comparison with the case of spending on education, but reduced with years of participation. The proportion of respondents not spending on nutrition was low on average (5.7%), and also dropped from 6.3% of those who had participated for 3 years to 4.1% of those with four years and above. The results with regard to spending on education and nutrition point at some increase in spending, despite the somewhat mixed findings. Findings therefore confirm research findings that participation of women in microfinance benefits children in terms of schooling and nutrition (Khandker et al, 1998). A different picture emerged in relation to spending on health; less than half of the women (46%) reported to have increased their spending on health/medical care. This could be
interpreted as a positive impact in the sense that with increased spending in other aspects (education and nutrition), households could be experiencing reduced health problems and hence spend less of their income on medical services. The results also revealed a small variation by years of participation. Forty five percent (45%) of those with three years of participation reported they had increased spending on health compared to a slightly higher proportion (48.8%) for those with four years and above. Overall, findings showed that participation in WEF microfinance positively influenced spending on children’s education (65.5% reported an increase) and nutrition (64.7% reported increase), and health (46.0% reported an increase). A longer duration of participation however increased chances of increased spending on education only, again indicating it could be participation in microfinance that may have an impact on aspects of human development, but not how long one remains on the programme. 5.3 Participation and Economic Decision-making Table 8 is a presentation of the relationship between duration of participation and economic decision-making. Women were asked whether if they owned some named assets, they would make a decision to sell the assets (if there was need to) without obtaining permission from a husband/partner or family member (table 8). The three listed assets were land (a capital asset), household goods like electronics and furniture, and kitchen items like stoves, pots, cutlery and others. Interestingly, a comparison across the three types of assets showed that women would most likely make the decision to sell kitchen items without permission (56.9%) while they would least likely make the decision to sell land without permission (only 32.7%), an observation probably linked to persisting culturally assigned gender roles in an African patriarchal setting, where assets such as land are expected to be controlled by men. Historically according to the origin of patriarchy theories (in relation to private property ownership), the centre of power and ownership of property rested with the men, who passed it on to their own children (Sultana, 2011).
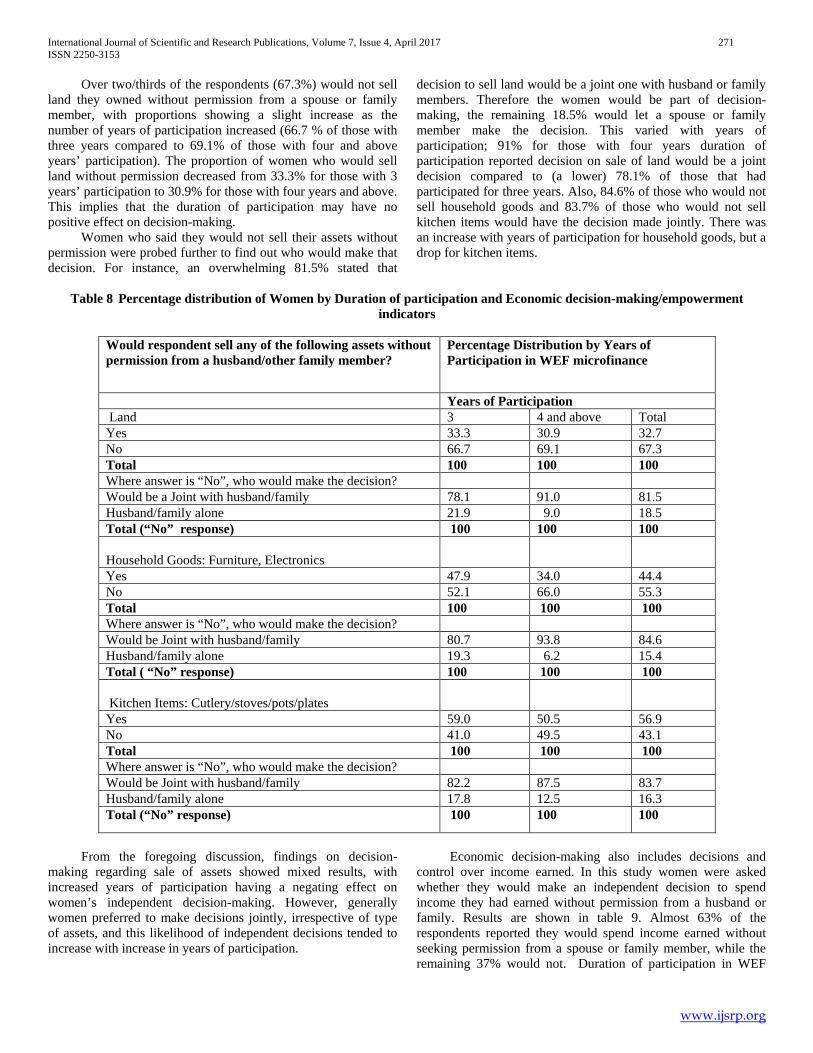
International Journal of Scientific and Research Publications, Volume 7, Issue 4, April 2017 271 ISSN 2250-3153
www.ijsrp.org
Over two/thirds of the respondents (67.3%) would not sell land they owned without permission from a spouse or family member, with proportions showing a slight increase as the number of years of participation increased (66.7 % of those with three years compared to 69.1% of those with four and above years’ participation). The proportion of women who would sell land without permission decreased from 33.3% for those with 3 years’ participation to 30.9% for those with four years and above. This implies that the duration of participation may have no positive effect on decision-making. Women who said they would not sell their assets without permission were probed further to find out who would make that decision. For instance, an overwhelming 81.5% stated that
decision to sell land would be a joint one with husband or family members. Therefore the women would be part of decision-making, the remaining 18.5% would let a spouse or family member make the decision. This varied with years of participation; 91% for those with four years duration of participation reported decision on sale of land would be a joint decision compared to (a lower) 78.1% of those that had participated for three years. Also, 84.6% of those who would not sell household goods and 83.7% of those who would not sell kitchen items would have the decision made jointly. There was an increase with years of participation for household goods, but a drop for kitchen items.
Table 8 Percentage distribution of Women by Duration of participation and Economic decision-making/empowerment
indicators
Would respondent sell any of the following assets without permission from a husband/other family member?
Percentage Distribution by Years of Participation in WEF microfinance
Years of Participation Land 3 4 and above Total Yes 33.3 30.9 32.7 No 66.7 69.1 67.3 Total 100 100 100 Where answer is “No”, who would make the decision? Would be a Joint with husband/family 78.1 91.0 81.5 Husband/family alone 21.9 9.0 18.5 Total (“No” response) 100 100 100 Household Goods: Furniture, Electronics
Yes 47.9 34.0 44.4 No 52.1 66.0 55.3 Total 100 100 100 Where answer is “No”, who would make the decision? Would be Joint with husband/family 80.7 93.8 84.6 Husband/family alone 19.3 6.2 15.4 Total ( “No” response) 100 100 100 Kitchen Items: Cutlery/stoves/pots/plates
Yes 59.0 50.5 56.9 No 41.0 49.5 43.1 Total 100 100 100 Where answer is “No”, who would make the decision? Would be Joint with husband/family 82.2 87.5 83.7 Husband/family alone 17.8 12.5 16.3 Total (“No” response) 100 100 100
From the foregoing discussion, findings on decision-making regarding sale of assets showed mixed results, with increased years of participation having a negating effect on women’s independent decision-making. However, generally women preferred to make decisions jointly, irrespective of type of assets, and this likelihood of independent decisions tended to increase with increase in years of participation.
Economic decision-making also includes decisions and control over income earned. In this study women were asked whether they would make an independent decision to spend income they had earned without permission from a husband or family. Results are shown in table 9. Almost 63% of the respondents reported they would spend income earned without seeking permission from a spouse or family member, while the remaining 37% would not. Duration of participation in WEF
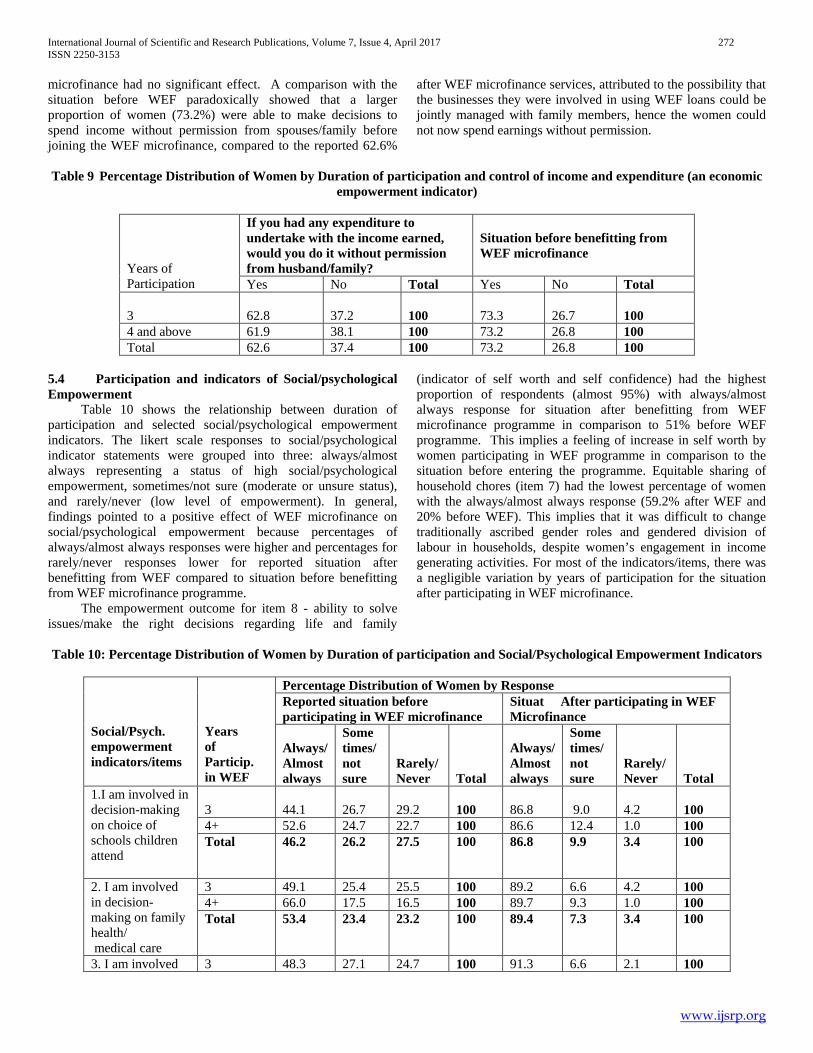
International Journal of Scientific and Research Publications, Volume 7, Issue 4, April 2017 272 ISSN 2250-3153
www.ijsrp.org
microfinance had no significant effect. A comparison with the situation before WEF paradoxically showed that a larger proportion of women (73.2%) were able to make decisions to spend income without permission from spouses/family before joining the WEF microfinance, compared to the reported 62.6%
after WEF microfinance services, attributed to the possibility that the businesses they were involved in using WEF loans could be jointly managed with family members, hence the women could not now spend earnings without permission.
Table 9 Percentage Distribution of Women by Duration of participation and control of income and expenditure (an economic
empowerment indicator)
Years of Participation
If you had any expenditure to undertake with the income earned, would you do it without permission from husband/family?
Situation before benefitting from WEF microfinance
Yes No Total Yes No Total 3
62.8
37.2
100
73.3
26.7
100
4 and above 61.9 38.1 100 73.2 26.8 100 Total 62.6 37.4 100 73.2 26.8 100
5.4 Participation and indicators of Social/psychological Empowerment Table 10 shows the relationship between duration of participation and selected social/psychological empowerment indicators. The likert scale responses to social/psychological indicator statements were grouped into three: always/almost always representing a status of high social/psychological empowerment, sometimes/not sure (moderate or unsure status), and rarely/never (low level of empowerment). In general, findings pointed to a positive effect of WEF microfinance on social/psychological empowerment because percentages of always/almost always responses were higher and percentages for rarely/never responses lower for reported situation after benefitting from WEF compared to situation before benefitting from WEF microfinance programme. The empowerment outcome for item 8 - ability to solve issues/make the right decisions regarding life and family
(indicator of self worth and self confidence) had the highest proportion of respondents (almost 95%) with always/almost always response for situation after benefitting from WEF microfinance programme in comparison to 51% before WEF programme. This implies a feeling of increase in self worth by women participating in WEF programme in comparison to the situation before entering the programme. Equitable sharing of household chores (item 7) had the lowest percentage of women with the always/almost always response (59.2% after WEF and 20% before WEF). This implies that it was difficult to change traditionally ascribed gender roles and gendered division of labour in households, despite women’s engagement in income generating activities. For most of the indicators/items, there was a negligible variation by years of participation for the situation after participating in WEF microfinance.
Table 10: Percentage Distribution of Women by Duration of participation and Social/Psychological Empowerment Indicators
Social/Psych. empowerment indicators/items
Years of Particip. in WEF
Percentage Distribution of Women by Response Reported situation before participating in WEF microfinance
Situat After participating in WEF Microfinance
Always/ Almost always
Some times/ not sure
Rarely/ Never
Total
Always/ Almost always
Some times/ not sure
Rarely/ Never
Total
1.I am involved in decision-making on choice of schools children attend
3
44.1
26.7
29.2
100
86.8
9.0
4.2
100
4+ 52.6 24.7 22.7 100 86.6 12.4 1.0 100 Total 46.2 26.2 27.5 100 86.8 9.9 3.4 100
2. I am involved in decision-making on family health/ medical care
3 49.1 25.4 25.5 100 89.2 6.6 4.2 100 4+ 66.0 17.5 16.5 100 89.7 9.3 1.0 100 Total 53.4 23.4 23.2 100 89.4 7.3 3.4 100
3. I am involved 3 48.3 27.1 24.7 100 91.3 6.6 2.1 100

International Journal of Scientific and Research Publications, Volume 7, Issue 4, April 2017 273 ISSN 2250-3153
www.ijsrp.org
in decision-making on children’s shopping & household purchases
4+ 50.5 27.8 21.6 100 77.3 21.1 1.0 100 Total 48.8 27.3 23.9 100 87.8 10.4 1.8 100
4.I am free from family tension/ violence within the household
3 28.8 24.0 47.2 100 68.8 15.6 15.6 100 4+ 41.2 27.8 30.9 100 66.0 9.3 24.7 100 Total 31.9 24.9 43.1 100 68.1 14.0 17.9 100
5.I interact with other people freely/address gatherings with ease
3 36.5 28.5 35.1 100 87.2 8.0 4.9 100 4+ 42.3 33.0 24.7 100 78.4 20.6 1.0 100 Total 37.9 29.6 32.5 100 84.9 11.2 3.9 100
6. I can visit friends /family, attend functions: I do not have to seek permission
3 30.2 25.7 44.1 100 76.7 12.5 10.8 100 4+ 48.5 23.7 27.8 100 80.4 10.3 9.3 100 Total 34.8 25.2 40.0 100 77.6 12.0 10.4 100
7. There is equitable sharing of household work/chores
3 19.1 28.5 52.4 100 61.5 17.7 20.8 100 4+ 22.7 24.7 52.6 100 52.6 10.3 37.1 100 Total 20.0 27.5 52.5 100 59.2 15.8 24.9 100
8. I believe in my ability to make the right decisions on life/family - self confidence/esteem
3 47.9 22.9 29.2 100 94.4 4.9 0.7 100 4+ 60.8 22.7 16.5 100 94.8 5.2 - 100 Total 51.2 22.9 26.0 100 94.5 4.5 0.5 100
VI. CONCLUSIONS AND RECOMMENDATIONS In terms of financial advancement, income levels for most women had increased after they joined the WEF microfinance programme, but number of years of participation beyond 3 years had diminishing effect on incomes. The duration of participation did not have a positive effect on status of contribution to household expenditure after participating in microfinance. Also, the amount of personal savings for women had increased after participation in WEF microfinance programme, but duration of participation did not have an appreciable effect. This means that it is the joining of the WEF programme that had an impact, but not the number of years of participation. Overall, findings showed that overall, participation in WEF microfinance had a greater influence on spending on children’s education and nutrition, compared to health. A longer duration of participation however increased chances of increased spending on education only, again indicating it could be participation in microfinance that may have an impact on aspects of human development, but not how long one remains on the programme. Findings on decision-making regarding sale of assets showed mixed results, but generally, an increase in years of participation had a negating effect on women’s (independent) economic decision-making. Nevertheless, women preferred to make decisions on sale of assets jointly. The likelihood of joint
decisions tended to increase with increase in years of participation. WEF microfinance had a positive effect on social/psychological empowerment when situation after benefitting from WEF compared to reported situation before benefitting from WEF microfinance programme. The most outstanding social/psychological empowerment outcome was ability to solve issues/make the right decisions regarding life and family (indicator of self worth and self confidence). Equitable sharing of household chores appeared to be difficult to achieve for the women. For most of the indicators/items, years of participation had a negligible impact for the situation after participating in WEF microfinance. The general conclusion of the study is that participating in Microfinance by women leads to empowerment outcomes along the various dimensions, but the duration of participation does not significantly influence the empowerment outcomes. Also, participation in microfinance had limited impact on some culturally determined gender roles such as women’s responsibility over household chores, despite engaging in income generation. The study therefore recommends further research to determine the factors leading to the limited impact of duration of participation on empowerment outcomes. A qualitative approach research would also provide insights on the cultural factors that may influence empowerment outcomes of women participating in microfinance programmes.
International Journal of Scientific and Research Publications, Volume 7, Issue 4, April 2017 274 ISSN 2250-3153
www.ijsrp.org
REFERENCES Adjei-Bosompem, E. (2013). Micro-credit Lending and Women's Empowerment:
The experiences of Rural Kasoa Women. Journal of Global Gender Studies, 1(1) 2013, 1-39
Awaworyi, S. (2014). Impact of Microfinance on Female Empowerment: A Review of the Empirical Literature Conference Paper. Department of Economics. Monash University, Australa. Retrieved from https://editorialexpress.com/cgi- bin/conference/download.cgi?db_name=IAFFE23AC&paper_id=41
Awojobi, O. N. (2014). Empowering Women through Microfinance: Evidence from Nigeria. Australian Journal of Business and Management Research 4 (1), 17-26
Blattman, C., Green E., Annan, J., Jameson J., with Aryemo, F., Carlson, N., Emeriau, M., & Segura, A. (2013). Building Women’s Economic and Social Empowerment through Enterprise: An Experimental Assessment of the Women’s Income-Generating Support (WINGS) Program in Uganda. Innovations for Action (IPA). April 2013.
Caretta, M. A. (2010). Testing Virtuous Spirals; Exploring the Process of Women’s Empowerment through Microcredit Schemes in Kisumu, Kenya. Master of Science Thesis, Lund University. Retrieved from http://www.lumes.lu.se/database/alumni/08.10/Thesis/Caretta_MartinaAngela_Thesis_2010.pdf
Cornwall, A. (2016). Women’s Empowerment: What Works? Journal of International Development, 28 (3), 342-359.
Dobra, A. (2011). Micro-finance: Champion in Poverty Alleviation and Failure in Female Empowerment. MPRA Paper 32413, July 2011.
Gupta, J., Falb, K. L., Lehmann, H., Kpebo, D., Xuan, Z., Zimmerman, C., Watts, C., & Annan, J. (2013).Gender Norms and Economic Empowerment Intervention to reduce Intimate Partner Violence against Women in Rural Côte d’Ivoire: A Randomized Controlled Pilot Study. BMC International Health and Human Rights 2013, 13:46
Hashemi, S. M., Schuler, S. R. & Riley, A. P. (1996). Rural Credit Programs and Women Empowerment in Bangladesh. World Development, 24(4), 635-653.
Jain, D. & Jain, B. (2012). Does Micro-finance Empower Rural Women? Empirical Study in Udaipur District, Rajasthan. Journal of Arts, Science and Commerce, III (2), 76-89.
Kabeer, N. (2005). Gender Equality and Women’s Empowerment: A Critical Analysis of the Third Millenium Development Goal 1. Gender and Development, 13 (1), 13-24.
Karuga, C. W. (2014). The Effect of Microfinance on Rural Women Empowerment in Kikuyu Constituency, Kiambu County in Kenya. MSC Finance Thesis, School of Business, University of Nairobi. Retrieved from http://erepository.uonbi.ac.ke/bitstream/handle/11295/75573/Karuga
Kato, M. P., & Kratzer, J. (2013). Empowering Women through Microfinance: Evidence From Tanzania. ACRN Journal of Entrepreneurship Perspectives, 2(1), 31-59.
Khandker, S. R., Samad, H. A., & Khan, Z. H. (1998). Income and Employment Effects of Micro-credit Programs: Village Level Evidence from Bangladesh. The Journal of Development Studies, 35(2), 96-124.
Khan, R. E., & Noreen, S. (2011). Microfinance and Women Empowerment: A Case Study of District Bahawalpur (Pakistan).African Journal of Business Management, 6(12), 4514-4521.
Lakwo, A. (2006). Microfinance, Rural Livelihoods and Women’s Empowerment in Uganda. Research Report 85, 2006. African Studies Centre, Leiden. Retrieved March 20, 2014, from http://www.ascleiden.nl/Pdf/rr85lakwo.pdf
Magugui, C. K., Kogei, J. K., & Chepkemei, A. (2013). Microfinance in the Achievement of Millenium Development Goals – A Case of Koilot Division, Nandi County – Kenya. European Journal of Logistics Purchasing and Supply Chain Management, 1(2), 36-41.
Malhotra, A., Schuler, S & Boender, C. 2002. ‘Measuring Women's Empowerment as a Variable in International Development’. International Center for Research on Women and the Gender and Development Group of the World Bank. Retrieved http://siteresources.worldbank.org/INTGENDER/Resources/MalhotraSchulerBoender.pdf
Mandal, K. C. (2013). Concept and Types of Women Empowerment. International Forum of Teaching and Studies 9 (2), 17-30.
Maru, L & Razia, C. (2013). Microfinance Interventions and Empowerment of Women Entrepreneurs Rural Constituencies in Kenya. Research Journal of Finance and Accounting, 4(9), 2013, 84-95.
Mazumder, M. S., & Wencong, L. (2013). Micro-Credit and Poverty Reduction: A Case Study of Bangladesh. Prague Economic Papers, 3, 403-414.
Mukayiranga, A. (2013). Contribution of Microfinance in Women Empowerment. A Case Study of Pro-femme/twesehamwe through Duterimbere Microfinance Institution. Master of Commerce in Finance Specialisation. Lovely Professional University, Rwanda. Memoire Online. Retrieved from http://www.memoireonline.com/07/13/7239/m_Contribution-of-microfinance-in-omen- empowerment-A-case- study-of-pro-femmetwese- hamwe-through-Dut0
Musonera, A & Heshmati, A. (2016). Measuring Women Empowerment in Rwanda. East Africa Research Papers in Economics and Finance. Retrieved February 21, 2017, from http://ju.se/download/18.b50f8081553242769960d3/1465522619859/EARP-EF+2016-02+Musonera.pdf
Mutai, R. K., & Achieno, G. O. (2013). Impact of Microfinance on Economic Empowerment of Women: The Case of Microfinance Institutions’ Clients in Narok Town. Proceedings of the 2nd International Conference on Management, Economics and Finance (2nd Icmef 2013), 28 -29 October 2013. Novotel 1borneo, Kota Kinabalu, Sabah, Malaysia. Retrieved from http://www.internationalconference.com.my/proceeding/icmef2013_proceeding/2ndicmef_proceeding/033_130_2ndICMEF2013_Proceeding_p394.pdf
Ngo, T. M., & Wahhaj, Z. (2011). Microfinance and Gender Empowerment. Journal of Development Economics (2011).
Pines, A. M., Lerner, M & Schwartz, D. (2010). Gender Differences in Entrepreneurship. Equality, Diversity and Inclusion: An International Journal 29 (2), 186-198.
Pokhriyal, A. K., Rani, R & Uniyal, J. (2014). Role of Micro-Finance in the Empowerment of the Women. Journal of Business and Finance, 02 (01), 2014, 21-31
Rahman, A. (2013). Women’s Empowerment: Concept and Beyond. Global Journal of Human Social Sciences, Sociology and Culture, 13(6), 9-13.
Ringkvist, J. (2013). Women Empowerment through Microfinance – A Case Study on Burma, a Minor Field Study. Series 229. Department of Economics, University of Lund. Rtrieved from https://liveatlund.lu.se/intranets/LUSEM/NEK/mfs/MFS/229.pdf
Sarumathi, S & Mohan, K. (2011). Role of Micro finance in Women’s Empowerment (An Empirical Study in Pondicherry Region Rural SHG’s). Journal of Management and Science, 1(1), 1-10.
Seddoh, J. (2014). The Impact of Plan Ghana’s Microfinance Scheme on Poverty Reduction among Women in Lower Manya Krobo. Journal of African Studies and Development, 6 (8), 132-139.
Shimamoto, K. (2014). Identifying the Structure and Multiple Dimensions of Women’s Empowerment: Methodological Considerations in Examining Empowerment and Reproductive Health. Conference Paper. Retrieved, from http://paa2015.princeton.edu/uploads/151761
Sultana, S. & Hasan, S. S. (2010). Impact of Micro-Credit on Economic Empowerment of Rural Women. The Agriculturists 8(2), 43-49 (2010). ISSN-1729-5211
Sultana, A. (2011).Patriarchy and Women’s Subordination: A Theoretical Analysis. University of Dhaka. The Arts Faculty Journal, 1-18.
AUTHORS First Author – Margaret Wawira Ndwiga, PhD Student, Department of Development Studies, School of Communication and Development Studies, Jomo Kenyatta University of Agriculture and Technology (JKUAT), Email: [email protected], Tel +254 205210649

International Journal of Scientific and Research Publications, Volume 7, Issue 4, April 2017 275 ISSN 2250-3153
www.ijsrp.org
Second Author – Dr. Florence Ondieki-Mwaura, Senior Lecturer, Department of Development Studies, School of Communication and Development Studies Jomo Kenyatta University of Agriculture and Technology (JKUAT)
Third Author – Dr. Winifred Karugu, Director, JKUAT Enterprises, Jomo Kenyatta University of Agriculture and Technology (JKUAT)
International Journal of Scientific and Research Publications, Volume 7, Issue 4, April 2017 276 ISSN 2250-3153
www.ijsrp.org
Analysis of Factors Affecting Profitability in XYZ Bank
(One of Commercial Bank in Indonesia)
AndhinaDyahSulityowati*, NoerAzamAchsani**, Tanti Novianti***
*Student, Bogor Agricultural Institute School of Business, Bogor, Indonesia 16151 ** Professor, Bogor Agricultural Institute School of Business, Bogor, Indonesia 16151
*** Lecturer, Depatement of Economic and Management, Bogor Agricultural Institute, Bogor, Indonesia 16680
Abstract- The aim of this study was to determine the factors that influence the profitability in one of commercial bank in Indonesia, both internal and external. Assessment of the financial performance of banks is important for stakeholders and may also increase of the level of customers’ trust. Profitability of banks can be seen from the Return on Asset (ROA), Return on Equity (ROE) and Return On Investment (ROI) ratio. This research used secondary data taken from the banks’ annual reports and website of Bank Indonesia. The method used in this study was the Vector Error Correction Model. The results showed that nearly all of the company’s internal variables such as LDR, ROA, NIM and CAR had significant effect in the short term, while all external variables did not have significant effect towards profitability in both the short and long term. Impulse Response Function (IRF) analysis results indicate that the shock of one standard deviation on all internal variables except NPL gives corresponding response while external variables fluctuated in coherence with ROA, ROE and ROI. Forecast Error Variance Decomposition (FEVD) analysis results, as well as BI and ROA were dominantlyinfluencing the value of ROA, NIM and GDP were dominantlyinfluencing the value of ROE, meanwhile the CAR and inflation rate were dominant in influencing the value of ROI. Index Terms-Profitability, internal factors, external factors, VECM
I. INTRODUCTION Profitability is the level of banks' ability to generate profits for a certain period expressed as a percentage. The level of bank
profitability is calculated by using the ratio Return on Assets (ROA), which is the ratio between netincome by total assets. ROA reflects management ability of banks to generate profits from assets owned bank (Athanasoglou, 2005). According to Robbert (1997), in addition to ROA level of profitability can be calculated from the ratio Return On Equity (ROE) and Return On Investment (ROI). Three of these ratios can be seen and measured by analysis of financial statements. Analysis of the financial statements is very important to keep the leadership of the company can obtain information related to the company's financial position and results have been achieved by a company every year in order to determine future strategy.
XYZ Bank is the only national private commercial bank which is wholly owned by the natives. This bank also one of the leading banks in Indonesia which has a medium-sized primary focus on Small, Medium and Micro Enterprises (SME). By looking at the dynamics and fluctuations in financial ratios for commercial banks, it is important to be able to determine the internal and external factors that influence the performance of this bank, especially profitability. So that it can be used by the management company to improve efficiency and improved performance in the future which in turn can also help promote the SME sector which has considerable influence on the economy of Indonesia.
Macroeconomic conditions such as rising fuel prices, the weakening of the rupiah, fluctuations in commodity prices is uncertain, and changes in government regulations and other factors, which could increase the threat of inflation will result in the increase of bad debts ratio. Therefore an increase of bad loans will lead to increase of provisioning of productive assets that will affected to profitability.
This study analyzes number of factors that impact on the profitability of XYZ Bank aims to; 1. Analyze the influence of internal factors on the performance of banks XYZ Bank measured approach ROA, ROE and ROI. 2. Analyze the influence of external factors on the performance of banks XYZ Bank measured approach ROA, ROE and ROI. 3. Formulate alternative strategy for XYZ Bank in increasing efficiency and improving its performance in the future.
II. LITERATURE REVIEW Profitability is the ability of a company for a profit (profit) in a given period. Husnan (2001) stated that profitability is the
ability of a company to generate profit (profit) on the level of sales, assets, and a specific share capital. In the other hand, according to Michelle and Megawati (2005), the profitability is a company's ability to generate profits (profit) which will be the basis of dividend companies.
Profitability ratio is the ratio that shows the combined effects of liquidity, asset and debt management to assess the operating results for the company's ability to make a profit (Kashmir, 2008). This ratio also provides a measure of the effectiveness of

International Journal of Scientific and Research Publications, Volume 7, Issue 4, April 2017 277 ISSN 2250-3153
www.ijsrp.org
management of a company. According to S. Munawir (2004), the analysis of the profitability of a company's ability to generate profits for a certain period. This analysis measures the overall performance, the company and efficiency in the management of assets, liabilities and wealth. There are three ratios are often used to measure profitability, namely Return ON Assets (ROA), Return On Investment (ROI) and Return On Equity (ROE).
Research on the measurement of bank performance with regard to profitability by using financial ratios have been conducted in several countries. Anto and Wibowo (2011) examines the impact of macroeconomic variables on the profitability of Islamic banking in Indonesia. This study uses error correction models (ECM) using samples of three Islamic banks have published financial statements of the first quarter of 2006 until the third quarter of 2011. Results from this study showed that the only variable interest rate has an influence on the profitability of Islamic banking in Indonesia. Test Dickey-Fuller (DF) and Augmented Dickey-Fuller (ADF) to prove that there is a long-term co integration between the Gross Domestic Product (GDP), inflation, interest rates, market share, money supply and profitability of Islamic banking.
Masood (2009) conducted research on an empirical study on the profitability of banks in Saudi Arabia. This study aimed to analyze the determinants of profitability of banks in Saudi Arabia in the period 1999-2007 to investigate the cointegration and the interrelationships between the Return On Assets (ROA) and Return On Equity (ROE). Analyses were performed using Augmented Dickey Fuller test (ADF), Johansenscointegration test and Granger causality test. The results of this study indicate that there is a strong cointegration relationship between the variables.
In 2012, Masood also doing research on whether there is cointegration and reciprocal relationship between non-stationary variables on the profitability of banks in China. This study took data from the 2003-2007 period, with the variables studied are the total assets and total equity of banks in China. Data analysis used Augmented Dickey Fuller (ADF), Johansen cointegration test and Granger causality test. The results of this study suggest that the relationship between the two variables is proven and cointegrated strongly.
Cudia (2012) in his study stated that the global financial crisis in 2008 led to huge losses at financial institutions and led to a decrease in economic activity. Research conducted to analyze the impact of the financial crisis on the export sector in the Philippines using vector auto regression (VAR). Variables studied form of Gross Domestic Product (GDP), the currency movement in the exchange rate Philippine Peso (PHP) to US Dollar (USD) as well as changes in the value of GDP of USA and the import value of the USA as the main trading partner of the Philippines. The results of this study indicate that the global financial crisis affect the export performance as the Philippines and also affects the changes in export policies in the Philippines.
KAYIKCI conduct research on the determinants of the current account in Turkey by using vector auto regression approach in 2011. The aim of this study was to examine similarities between the theoretical research results with a current account deficit of economic variables in Turkey. The data used are taken from the period 1987 to 2009. Selection of variables related to the current account have economic explanations difficult to decide until the end of the variables used is the ratio to GDP Current Account (CA), Real Gross Domestic Product Growth Rate (GROWTH), the ratio of Gross Capital Fornation to GDP (INV), the ratio of Saving to GDP (SAV), the ratio of Exports and Imports to GDP (OPEN), Growth of Brent Oil Prices in Europe (OIL), the Consumer Price Index Growth Rate (INF) and Reel Effective Exchange Rate (REER). The results of this study show that inflation has a positive influence on the current account in which growth, the ratio of exports and imports, high oil prices and the appreciation of the exchange rate caused the current account balance deteriorated.
Based on the above results, still need to be tested again internal and external factors affecting the profitability ofXYZ Bank. This study aimed to analyze the influence of the internal and external factors on the performance of XYZ Bank measured approach ROA, ROE and ROI. Problem in this study was to examine whether factors internal and external factors have an influence on the profitability of XYZ Bank. From the results of this study are expected to be useful and provide an alternative managerial implications for XYZ Bank in increasing efficiency and improving its performance in the future.
III. METHODOLOGY
The data used in this research is quantitative data. The dependent variable data such as ROA, ROE and ROI derived from published financial statements of XYZ Bank in website of Bank Indonesia. Data of independent variable in the form of LDR, CIR, CAR, NIM and NPL derived from the publication of the annual financial report of XYZ Bank in websiteof Bank Indonesia. Independent variable data such as BI Rate, Exchange Rate, Inflation, GDPwas also obtained from the website of Bank Indonesia. All data will be used is a time series data from 2000 to June 2015 per three months.
The method used in this research is Autoreggression Vector (VAR) or Vector Error Correction Model (VECM), followed by analysis of the response to shocks by using Impulse Response Function (IRF) and continued with the analysis of the contribution using the Forecast Error Variance Decomposition (FEVD). To meet the rules of statistics, testing the pre-estimation, among others, the unit root test with the purpose of examining stationarity data by using Augmented Dickey-Fuller Test (ADF), then proceed with the determination of the optimal lag. The selected candidate lag is the lag length according to the criteria Likelihood Ratio (LR), Final Prediction Error (FPE), Akaike Information Criterion (AIC), Schwarz Information Criterion (SC) and Hannan-Quinn Criterion (HQ). The next test is to determine whether there is cointegration relationship between variables. If there is no cointegration relationship, unrestricted VAR models can be applied. But if there is a relationship between the series cointegration, VECM models used. Pre-testing phase last estimate is Granger causality test to determine whether or not two-way relationship between variables. The following is a general equation of testing using the VAR / VECM;

International Journal of Scientific and Research Publications, Volume 7, Issue 4, April 2017 278 ISSN 2250-3153
www.ijsrp.org
ROA Profitability Test 1. Internal Factor
ROAt = C1 + α1ROAt-1 + α1LDRt-1 + α1CIRt-1 + α1NIMt-1 + α1CARt-1 + α1NPLt-1 2. External Factor
ROAt = C1 + α1ROAt-1 + α1BI Ratet-1 + α1Exct-1 + α1Inft-1 + α1GDPt-1 + α1JCIt-1 ROE Profitability Test 1. Internal Factor
ROEt = C1 + α1ROE t-1 + α1LDR t-1 + α1CIRt-1 + α1NIM t-1 + α1CAR t-1 + α1NPL t-1 2. External Factor
ROEt = C1 + α1ROEt-1 + α1BI Ratet-1 + α1Exct-1 + α1Inft-1 + α1GDPt-1 + α1JCIt-1
ROI Profitability Test 1. Internal Factor
ROIt = C1 + α 1ROI t-1 + α1LDR t-1 + α1CIRt-1 + α1NIM t-1 + α1CAR t-1 + α1NPL t-1 2. External Factor
ROIt = C1 + α 1ROI t-1 + α1BI Rate t-1 + α1Exct-1 + α1Inft-1 + α1GDP t-1 + α1JCIt-1 Legenda: ROA = Return On Asset CAR = Capital Adequacy Ratio ROE = Return On Equity NPL = Non Performing Loan ROI = Return On Investment BI Rate = Benchmark Rate C = Constanta Exc = USD-IDRExchange Rate LDR = Loan to Deposit Ratio Inf = Inflation value CIR = Cost to Income Ratio GDP = Gross Domestic Product NIM = Net Interest Margin JCI = Jakarta Composite Index
IV. RESULTS AND DISCUSSIONS The data used in this study has been carried out pre-test estimates include unit root test (unit root test). ROA unit root test
results as well as internal and external variables XYZ Bankentire data are stationary at first difference where it appears that the value of the whole variable ADF is smaller than the critical value McKinnon. The next test is to determine the optimal lag by comparing the Akaike Information criterion (AIC) and the Schwartz Criterion (SC) of each test lag. Johansen cointegration test results with Cointegration Test to determine the cointegrating rank indicates that there is cointegration between variables. Due to the cointegration, that means the data can be analyzed using Vector Error Correction Model. VECM estimation results on internal factors variables on ROA, ROE, and ROI can be seen in Table 1. Table 1. Estimation results VECM internal variable factors against ROA, ROE and ROI
VARIABLE
SHORT TERM ROA ROE ROI
Coefisient T-Statistic Coefisient T-Statistic Coefisient T-
Statistic CointEq1 0.088297 0.47172 0.004277 0.13843 2.27927 9.40133
D(ROA(-1)) 0.565742* 3.08303 - 0.104536 -0.639 -0.334094* -2.47526 D(ROA(-2)) 0.2925 1.83984 0.070596 1.12315 -0.009746* -2.27057 D(LDR(-1)) -0.002545 -0.40415 0.071365 1.14039 -0.009563* -2.1918
D(LDR(-2)) -0.010206* -1.67076 0.262221 0.90847 - 0.001359 -0.08142
D(CIR(-1)) 0.032785 0.95321 0.583479 2.09514 0.006544 0.41868
D(CIR(-2)) 0.064564* 2.19496 - 1.345819* -2.14021 0.03848 1.09100]
D(NIM(-1)) -0.115497 -1.76051 1.198979* 1.86404 0.058707 1.52651 D(NIM(-2)) -0.056364 -0.81667 0.317091 0.86352 -0.045325 1.68403 D(CAR(-1)) -0.049726 -1.21528 0.03404 0.08805 0.065555* 2.50253 D(CAR(-2)) -0.015699 -0.40786 -0.304767 -0.33724 -0.045464 -0.84201 D(NPL(-1)) 0.021113 0.17203 - 0.592693 -0.7141 - 0.061145 -1.26056

International Journal of Scientific and Research Publications, Volume 7, Issue 4, April 2017 279 ISSN 2250-3153
www.ijsrp.org
D(NPL(-2)) -0.139333 -1.45866 LONG TERM
LDR(-1) - 0.001233 -0.23651 -0.904811 -3.10232 0.004149 3.95472 CIR(-1) -0.074775 -2.392 1.745871 1.00213 0.009576 1.57769 NIM(-1) 0.142676 1.58362 13.02601 2.57266 0.034439 1.54304 CAR(-1) 0.17483 6.08235 7.050276 4.15555 0.065871 11.2459 NPL(-1) 0.508608 4.06806 9.089183 1.33324 0.000162 0.64208
The estimation results of Vector Error Correction model shown in Table 1 shows that in the short term ROA leave a positive
and significant impact on ROA itself amounted to 0.565742. This means that the ROA with a lag of one month before giving a boost ROA coming months amounted to 0.565742% (ceteris paribus). Similarly, the variable CIR significant positive effect on ROA of 0.0064564, which means that the increase in ROA two months earlier will lead two months later ROA increased by 0.0064564%. LDR variable is negative and significant effect in the short term to ROA amounted to 0.010206, which means that an increase in the LDR with a lag of two months earlier resulted in a decrease in ROA two months of the coming of 0.010206%.
VECM estimation results to the ROE variable internal factors shown in Table1 also shows that in the short term CIR have negative and significant impact on ROE amounted to 1.345819. This means that the increase of CIR that occurred in the two previous periods will lower ROE in two periods thereafter of 1.345819%. Another variable that has a short-term impact is NIM with a negative and significant influence amounted to 1.198979, which means that the increase in NIM of the previous period will have an effect on increasing ROE amounted to 1.198979% in the period thereafter.
VECM estimation result of internal factors on the ROI variables shown in Table 1 shows that in the short term ROI variables gives a negative influence and significant to himself for two years in a row amounted to 0.957003 and 0.334094. This means that the improvement that occurred in the ROI of the previous period resulted in a decrease in ROI for a period thereafter of 0.957003% and increased ROI in the two previous periods led to a lower ROI on two periods thereafter of 0.334094%. Variable LDR also have a negative influence and significant for two years against an ROI of 0.009746% and 0.009563%, which means that the increase in LDR at one and two previous periods resulted in ROI on one and two periods thereafter decreased respectively by 0.009746% and 0.009563%. Another variable that has the effect of CAR which are significant positive effect on ROI of 0.065555, the meaning is that the increase in CAR in the two previous periods affect the ROI on two periods thereafter of 0.065555%. VECM estimation results of external factors on ROA, ROE, and ROI can be seen in Table 2. Table 2. Estimation results VECM external variable factors againstROA, ROE andROI
VARIABLE
SHORT TERM ROA ROE ROI
Coefisient T-
Statistic Coefisient T-
Statistic Coefisient T-Statistic CointEq1 -0.013583 -0.11282 0.127127 1.05007 -0.009202 -0.40247
D(ROA(-1)) 0.521406* 2.8672 0.135711 0.71409 0.347426* 2.6543 D(ROA(-2)) 0.512775* 2.90077 - 0.131366 -0.77539 0.595047* 4.55911
D(BI_RATE(-1)) - 0.076171 -0.49597 1.026554 0.84168 - 0.059909 -0.40995
D(BI_RATE(-2)) 0.14498 1.04599 - 0.111898 -0.09483 0.093528 0.73431
D(EXC(-1)) - 0.000017 -0.11893 0.000448 0.30662 -0.00001 -0.07448 D(EXC(-2)) -0.000185 -1.41541 - 0.001138 -0.84971 -0.0000767 -0.59497 D(INF(-1)) -0.003363 -0.07289 -0.181741 -0.47826 '-0.057314 -1.16138 D(INF(-2)) 0.015613 0.36297 - 0.081692 -0.21536 0.011482 0.23066 D(GDP(-1)) 0.054391 0.30977 -1.318902 -0.95385 '-0.042442 -0.28271 D(GDP(-2)) - 0.193739 -1.25273 - 0.652802 -0.4806 0.087478 0.58402 D(JCI (-1)) 0.000208 0.74016 0.000709 0.24747 -0.0000189 -0.06332 D(JCI(-2)) -0.000608 -0.19543 - 0.001500 -0.48783 -0.0000637 -0.19989
LONG TERM BI_RATE(-1) - 0.055123 -0.91531 2.609573 5.45397 1.244754 5.57948
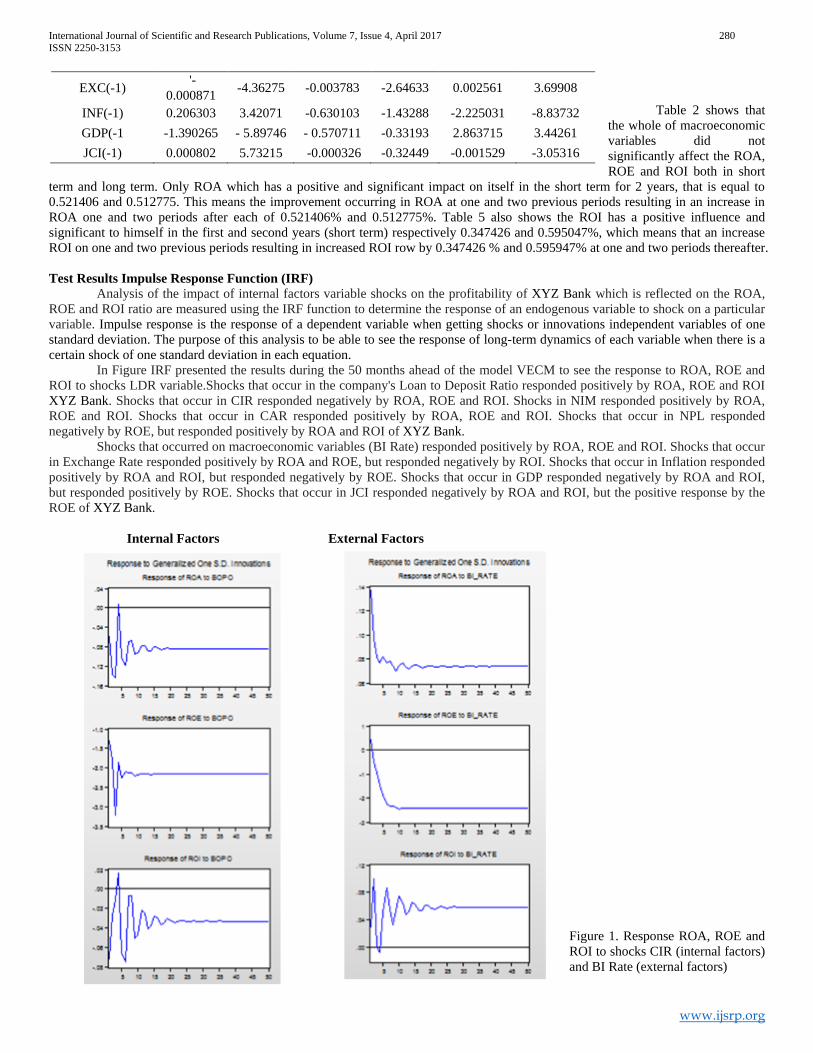
International Journal of Scientific and Research Publications, Volume 7, Issue 4, April 2017 280 ISSN 2250-3153
www.ijsrp.org
Table 2 shows that the whole of macroeconomic variables did not significantly affect the ROA, ROE and ROI both in short
term and long term. Only ROA which has a positive and significant impact on itself in the short term for 2 years, that is equal to 0.521406 and 0.512775. This means the improvement occurring in ROA at one and two previous periods resulting in an increase in ROA one and two periods after each of 0.521406% and 0.512775%. Table 5 also shows the ROI has a positive influence and significant to himself in the first and second years (short term) respectively 0.347426 and 0.595047%, which means that an increase ROI on one and two previous periods resulting in increased ROI row by 0.347426 % and 0.595947% at one and two periods thereafter. Test Results Impulse Response Function (IRF)
Analysis of the impact of internal factors variable shocks on the profitability of XYZ Bank which is reflected on the ROA, ROE and ROI ratio are measured using the IRF function to determine the response of an endogenous variable to shock on a particular variable. Impulse response is the response of a dependent variable when getting shocks or innovations independent variables of one standard deviation. The purpose of this analysis to be able to see the response of long-term dynamics of each variable when there is a certain shock of one standard deviation in each equation.
In Figure IRF presented the results during the 50 months ahead of the model VECM to see the response to ROA, ROE and ROI to shocks LDR variable.Shocks that occur in the company's Loan to Deposit Ratio responded positively by ROA, ROE and ROI XYZ Bank. Shocks that occur in CIR responded negatively by ROA, ROE and ROI. Shocks in NIM responded positively by ROA, ROE and ROI. Shocks that occur in CAR responded positively by ROA, ROE and ROI. Shocks that occur in NPL responded negatively by ROE, but responded positively by ROA and ROI of XYZ Bank.
Shocks that occurred on macroeconomic variables (BI Rate) responded positively by ROA, ROE and ROI. Shocks that occur in Exchange Rate responded positively by ROA and ROE, but responded negatively by ROI. Shocks that occur in Inflation responded positively by ROA and ROI, but responded negatively by ROE. Shocks that occur in GDP responded negatively by ROA and ROI, but responded positively by ROE. Shocks that occur in JCI responded negatively by ROA and ROI, but the positive response by the ROE of XYZ Bank.
Internal Factors External Factors
Figure 1. Response ROA, ROE and ROI to shocks CIR (internal factors) and BI Rate (external factors)
EXC(-1) '-0.000871 -4.36275 -0.003783 -2.64633 0.002561 3.69908
INF(-1) 0.206303 3.42071 -0.630103 -1.43288 -2.225031 -8.83732 GDP(-1 -1.390265 - 5.89746 - 0.570711 -0.33193 2.863715 3.44261 JCI(-1) 0.000802 5.73215 -0.000326 -0.32449 -0.001529 -3.05316
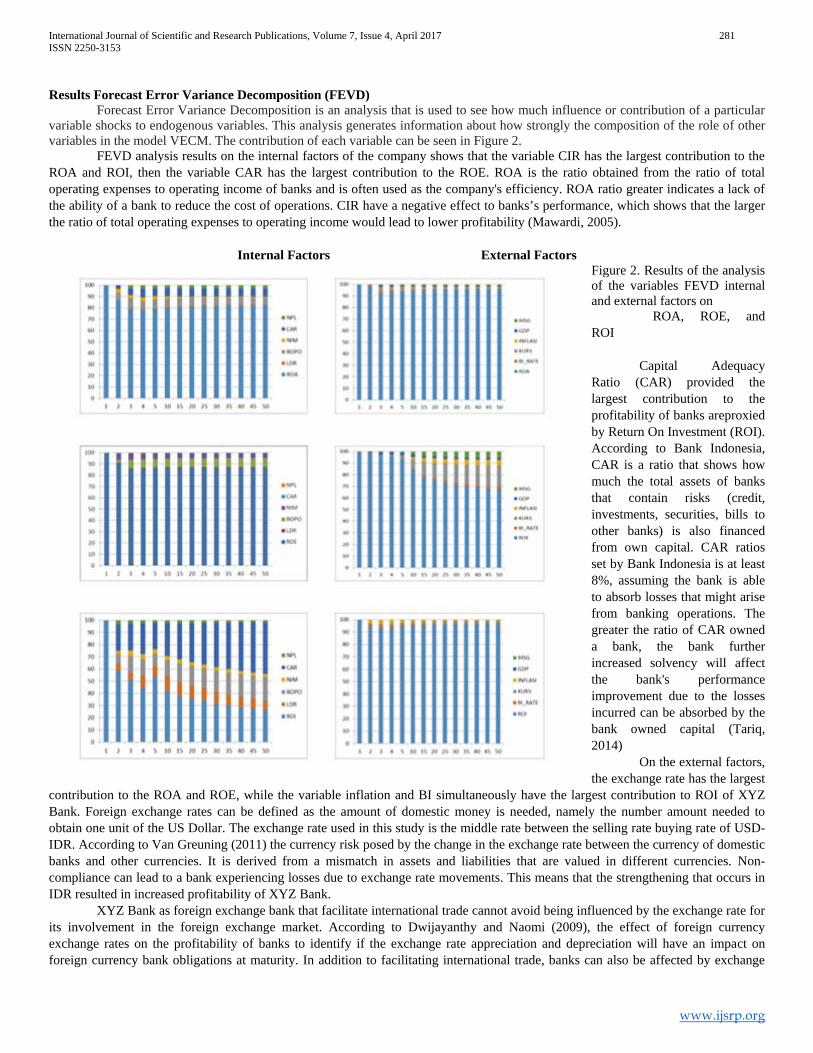
International Journal of Scientific and Research Publications, Volume 7, Issue 4, April 2017 281 ISSN 2250-3153
www.ijsrp.org
Results Forecast Error Variance Decomposition (FEVD)
Forecast Error Variance Decomposition is an analysis that is used to see how much influence or contribution of a particular variable shocks to endogenous variables. This analysis generates information about how strongly the composition of the role of other variables in the model VECM. The contribution of each variable can be seen in Figure 2.
FEVD analysis results on the internal factors of the company shows that the variable CIR has the largest contribution to the ROA and ROI, then the variable CAR has the largest contribution to the ROE. ROA is the ratio obtained from the ratio of total operating expenses to operating income of banks and is often used as the company's efficiency. ROA ratio greater indicates a lack of the ability of a bank to reduce the cost of operations. CIR have a negative effect to banks’s performance, which shows that the larger the ratio of total operating expenses to operating income would lead to lower profitability (Mawardi, 2005).
Internal Factors External Factors
Figure 2. Results of the analysis of the variables FEVD internal and external factors on ROA, ROE, and ROI
Capital Adequacy Ratio (CAR) provided the largest contribution to the profitability of banks areproxied by Return On Investment (ROI). According to Bank Indonesia, CAR is a ratio that shows how much the total assets of banks that contain risks (credit, investments, securities, bills to other banks) is also financed from own capital. CAR ratios set by Bank Indonesia is at least 8%, assuming the bank is able to absorb losses that might arise from banking operations. The greater the ratio of CAR owned a bank, the bank further increased solvency will affect the bank's performance improvement due to the losses incurred can be absorbed by the bank owned capital (Tariq, 2014)
On the external factors, the exchange rate has the largest
contribution to the ROA and ROE, while the variable inflation and BI simultaneously have the largest contribution to ROI of XYZ Bank. Foreign exchange rates can be defined as the amount of domestic money is needed, namely the number amount needed to obtain one unit of the US Dollar. The exchange rate used in this study is the middle rate between the selling rate buying rate of USD-IDR. According to Van Greuning (2011) the currency risk posed by the change in the exchange rate between the currency of domestic banks and other currencies. It is derived from a mismatch in assets and liabilities that are valued in different currencies. Non-compliance can lead to a bank experiencing losses due to exchange rate movements. This means that the strengthening that occurs in IDR resulted in increased profitability of XYZ Bank.
XYZ Bank as foreign exchange bank that facilitate international trade cannot avoid being influenced by the exchange rate for its involvement in the foreign exchange market. According to Dwijayanthy and Naomi (2009), the effect of foreign currency exchange rates on the profitability of banks to identify if the exchange rate appreciation and depreciation will have an impact on foreign currency bank obligations at maturity. In addition to facilitating international trade, banks can also be affected by exchange

International Journal of Scientific and Research Publications, Volume 7, Issue 4, April 2017 282 ISSN 2250-3153
www.ijsrp.org
rate depreciation by customers who have substantial funds in the form of US dollars, as a result the profitability of banks will be amended (Arifin, 2009).
The second largest contribution is BI Rate. Bank Indonesia interest rate is the interest rate that reflects the policy stance of monetary policy set by Bank Indonesia and announced to the public. Bank Indonesia to raise the BI rate when inflation is expected to exceed the target set, and vice-versa. The annual rise in the BI Rate will lead to an increase in interest rates Third Party Fund (DPK). If the interest rate increase in deposits is not in line with or greater than the rise in mortgage interest rates will cause a reduction in bank profits as a result of increased interest expense (Zulfiah and Susilowibowo, 2014).
V. CONCLUSION
The study of internal factors of XYZ Bank, which is reflected through the Capital Adequacy Ratio, Loan to Deposit Ratio, Cost to Income Ratio, Net Interest Margin and IDR exchange rate against the USD, Gross Domestic Product, Inflation and Jakarta Composite Index shows the influence of the dynamics of Return on Assets, Return on Equity and Return on Investment. VECM estimation results show that almost all companies except NPL internal factors have a significant effect on profitability in the short term, while external factors do not have a significant impact in both the short and long term. IRF analysis results indicate that the shock of one standard deviation in the entire internal variables except NPL responded accordingly, while the variable external factors fluctuated responded by ROA, ROE and ROI. Results of FEVD analysis, CIR variable is quite dominant in the exchange rate affect the value of ROA, NIM and Exchange rate dominant variable in influencing the value of ROE and ROA, whileInflation and BI Rate has it dominance in influencing value of ROI.
Based on the above conclusions, the management of XYZ Banksneed to pay attention to internal factors that significantly influence the profitability of the company, as of CAR, LDR, CIR and NIM. Several managerial implications related to the research are as follows; 1. Increased expansion of the company require additional capital sufficient strength and can absorb losses that might come up with
ways to improve the company's assets through additional paid-in capital through retained earnings or by launching debentures (bonds).
2. Profitability of the company can be increased by increasing the effectiveness and efficiency, by lowering operational costs such as overhead and interest expense as credit expansion is done so that the greater the margin earned.
3. Giving credit to customers to be more selective and effective so that the amount of bad loans can be minimized in order to avoid an increase in reserve assets which will affect the increase in operating costs.
4. It should be varied banking products and services that generate non-interest operating income in the form of fee-based income and improve the utilization of products and services from existing customers so that operating income does not always depend on interest income.
REFERENCES
Ang R. (1997),BukuPintarPasarModalIndonesia. Jakarta: MediasoftIndonesia Anto,Wibowo MG. (2011). ”Faktor-FaktorPenentuTingkatProfitabilitasBankUmumSyariahdiIndonesia”;JurnalEkonomiIslamLa_Riba. Vol. VI, No. 2, 147-160 ArifinZ. 2009. Dasar-DasarManajemenBankSyariah. Jakarta: PustakaAlvabet Athanasoglou PP, Brissmis SN,Delis MD. (2005). Bank-Specific, Industry-SpecificandMacroeconomicDeterminantsofBankProfitability. WorkingPaper, BankofGreece Cudia CP. (2012). “TheEffectofGlobalFinancialCrisisOnThePhillippines’ ExportSector: AVectorAuto-RegressionAnalysis”.
JournalofInternationalBusinessResarchVol. 11, No. 2, 13-29 Dwijayanthy, F and Prima N. (2008). “Analisis Pengaruh Inflasi, BI Rate dan Nilai Tukar Mata Uang terhadap Profitabilitas Bank Periode 2003-2007”. Karisma, Vol.
3, No. 2,87-98 HusnanS. (2001). ManajemenKeuanganTeoridanPenerapan (KeputusanJangkaPendek).Yogyakarta: BPFE Kashmir.(2008). AnalisisLaporanKeuangan.Jakarta: BumiAksara KAYIKÇIF. (2011).”DeterminantsofTheCurrentAccountBalanceinTurkey: VectorAutoRegression (VAR) Approach”. AfricanJournalofBusinessManagement, Vol. 6,
No. 17, 5725-5736 MasoodO, Aktan B,Chaudhary S. (2009). “AnEmpiricalStudyOnBanksProfitabilityinTheKSA: ACo-integrationApproach”. AfricanJournalofBusinessManagement,
Vol. 3, No. 8, 374-382 Masood O, Thapa PDP, Bellalah M, Levyne O, Teulon F, Triki R. (2012). “DoesCo-integrationandCausalRelationshipExistBetweentheNon-
stationaryVariablesforChineseBank’sProfitability? AnEmpiricalEvidence”. InternationalJournalofBusiness, Vol. 17, No. 2, 194-208 Mawardi, W. (2005).“AnalisisFaktor-Faktor yang MempengaruhiKinerjaKeuangan Bank Umum di Indonesia (StudiKasusPada Bank UmumDengan Total Assets
Kurangdari 1 Triliun)”.JurnalBisnisStrategi, Vol. 14, No. 1, 83-94 Michelle andMegawati.(2005). “MemprediksiTingkatPengembalianInvestasiMelaluiRasioProfitabilitas, Likuiditas, danLeverage
(StudipadaPerusahaanManufakturyangListingdiBEIPeriodePengamatanTahun 2001-2004)”.[thesis]. Surabaya: UniversitasAirlangga MunawirS. (2004). “AnalisisLaporanKeuanganEdisiKeempat”. Yogyakarta(ID): Liberty Tariq W. (2014).“DeterminantsofCommercialBank’sProfitability: EmpiricalEvidencefromPakistan. InternationalJournalofAccountingandFinancialReporting”.Vol. 4,
No. 2, 1-22 Van Greening, HandBratanovic SB. (2011), “AnalisisRisikoPerbankan, Jakarta:PenerbitSalembaEmpat Zulifiah F,Susilowibowo J. (2014). “PengaruhInflasi, BIRate, CapitalAdequacyRatio (CAR), NonPerformingFinance, BiayaOperasionaldanPendapatanOperasional
(BOPO) terhadapProfitabilitasBankUmumSyariahPeriode 2008-2012”. JurnalIlmuManajemenUniversitasNegeriSurabaya. Vol. 2, No. 3, 759-770
AUTHORS First Author – AndhinaDyahSulistyowati, Email: [email protected]. Phone Address: 62812 88998310, Student at Bogor Agricultural Institute School of Business, Bogor,Indonesia 1615

International Journal of Scientific and Research Publications, Volume 7, Issue 4, April 2017 283 ISSN 2250-3153
www.ijsrp.org
Buckling and bonding behaviour of glass fiber reinforced epoxy resin composite column under
compressive loading mechanism. 1Srinath T, 2Shyam Kumar E,
1, 2 Assistant Professor , Department of Civil Engineering, Sri Shakthi Institute of Engineering and Technology, Coimbatore.
Abstract—Glass Fiber – reinforced polymer (GFPR) has been used as an alternative to steel due to high strength –to-weight ratio, high stiffness- to – weight ratio and corrosion and fatigue resistance. GFRP have been found to be more attractive in asian region due to their cost competitiveness. Hence effort is required to find the bonding and buckling behaviors of fiber reinforced composite(FRC) column made using epoxy resin and glass fiber sheet with Triethylenetetramine (TETA) as hardener for curing of resin. To achieve the objective, an experimental setup was prepared with, specimen of hollow circular section is casted and compressive loading was applied to specimen. This will help in finding the buckling nature of the section.
Keywords—FRC,Epoxy Resin,E-Glass Fiber,
polyurathanetetraamine
INTRODUCTION
Composite materials are materials with two or more constituents combined to form a material with different properties than those of the individual constituents. Fiber reinforced composites (FRC) is a composite material that consists of two constituents: a series of fibers surrounded by a solid matrix. FRC is high-performance fiber composite achieved by cross-linking fiber molecules with resins in the FRC material matrix through a proprietary molecular re-engineering process, yielding a product of exceptional structural properties. As with many other composite materials such as reinforced concrete, the two materials act together, each overcoming the deficits of the other. Whereas the plastic resins are strong in compressive loading and relatively weak in tensile strength, the fibers are very strong in tension but tend not to resist compression. By combining these two materials, FRC becomes a material that resists both compressive and tensile forces well.
Objective
The main objective of this thesis work is to study the Behavior of FRC circular column under axial compression by Theoretical analysis using eulers equation and Experimental Study.
COMPONENTS OF FRC
A. FIBER Fiber is a natural or synthetic substance that is
significantly longer than its width. The strongest engineering materials often incorporate carbon fibers, for example fiber and ultra-high-molecular-weight polyethylene. Synthetic fibers are often being produced very cheaply and in large amounts compared to natural fibers. There are two major types of Fiber
such as natural and man-made fibers. Here, we go for man-made fiber. Each fiber has its own property. Table-1 shows the some of the man-made fibers with their properties. A Fabric is defined as a manufactured assembly of fibers to produce a flat sheet of one or more layers of fibers. These layers are held together either by mechanical interlocking of fibers themselves or with a secondary material to bind these fibers together. Based on the orientation of the fibers used, and by the various construction methods used to hold the fibers together fabrics are categorized into Unidirectional Fabric, Woven Fabrics, Hybrid Fabrics, Multiaxial Fabrics.
Table-1 Types and Properties of fiber
Fibers Properties
Glass Fibers
Strength, Elasticity, heat resistance, Moisture resistance, Chemical resistance, Thermal conductivity, Electrical properties, High strength, Lightweight
Wood Fibers Flexural strength, Tensile modulus, Tensile Strength
Carbon and Aramid Fibers
High stiffness to weight ratio, High strength, Corrosion resistant, Fatigue resistant, Energy Absorption on Impact, Tailored material properties
B. RESIN The resins that are used in fiber reinforced
composites can also be referred to as 'polymers'. All polymers exhibit an important common property that they are composed of long chain-like molecules consisting of many simple repeating units. Man-made polymers are generally called synthetic resins that act as bonding agent and also transfers stress between reinforcing fibers and to protect them from mechanical and environmental damage. Polymers can be classified into thermoplastic and thermosetting resin, according to the effect of heat on their properties. A thermosetting plastic, also known as a thermoset polymer material that irreversibly cures by heat, generally above 200°C (392 °F), through a chemical reaction, or suitable irradiation. Thermoset materials are usually liquid or malleable prior to curing and designed to be moulded into their final form, or used as adhesives. Once hardened a thermoset resin cannot be reheated and melted to be shaped differently. A thermoplastic or thermo softening plastic is a polymer with

International Journal of Scientific and Research Publications, Volume 7, Issue 4, April 2017 284 ISSN 2250-3153
www.ijsrp.org
high molecular weight that becomes pliable above a specific temperature, and returns to a solid state upon cooling. The polymer chains associate through intermolecular forces, which permits thermoplastics to be remoulded. Few resins and their properties are tabulated in Table-2
From the review of literature, it is found that the type and orientation of Fibers, type of resin affects the strength of FRC material. Strength of FRC section also depends on its Structural shape, where previous literatures are available for Box and I-sections. Here circular column sections are focused. Selection of correct combination of resin and fibers will be a challenge. Here we use Epoxy resin and Glass fibers as it is considered to be stronger than other combinations as well as Economic.
Table-2 Properties and Application of resins
Resins Application Properties
Polyester Transportation and marine
Excellent resistance to water and acidic environments
Vinyl ester
Corrosion application such as tanks, pipes and ducts
Resistance to Aggressive environments
Phenolic resins Mass Transit - Fire Resistance & High Temperature
Low flammability, low smoke production
Epoxy resins
FRC Strengthening Systems, FRC Rebar, FRC Stay-in-Place Forms
excellent electrical insulation, are less affected by water and heat, low shrinkage, high strength, low toxicity
MATERIAL COLLECTION AND TESTING
C. EPOXY RESIN Epoxy resins are low molecular weight pre-polymers
or higher molecular weight polymers which normally contain at least two epoxide groups. The epoxide group is also sometimes referred to as a glycidyl or oxirane group. Epoxy resins may react (cross-linked) either with themselves through catalytic homo polymerization, or with a wide range of co-reactants including poly functional amines, acids (and acid anhydrides), phenols, alcohols and thiols. These co-reactants are often referred to as hardeners or curatives, and the cross-linking reaction is commonly referred to as curing. Reaction of polyepoxides with themselves or with poly functional hardeners forms a thermosetting polymer, often with high mechanical properties, temperature and chemical resistance. Testing and results of epoxy resin are given below in table -3.
Table-3 Chemical Properties of Resin
S.no. Tests performed
Test method Specification Results
1. Visual appearance In house Clear liquid
resin Clear
liquid resin
2. Color Index, Gardner
ISO-4630-2
0 - 1
0.1
3. Epoxide index (Eq/Kg) ISO-3001 5.3 – 5.45 5.43
4. Viscosity
dynamic at 250C , mPa.s
ISO- 12058
10000 – 12000 10250
5.
Chlorine content
(hydrolysable), ppm
AMTM 116 0.0 – 400 240
D. HARDENER Hardeners are substances that are used for the
setting/Curing of the resins. The chemical hardener used here is “polyurathanetetramine”. It is primarily used as a cross linker in Epoxy curing..It is soluble in polar solvents and exhibits the reactivity typical for amines. For FRC using epoxy resin, the mix proportion is 150 grams of hardener is mixed with 1000 grams of Epoxy resin as per company recommendation.
E. E-GLASS FIBER Glass Fibers are among the most versatile industrial
materials known today. Fiberglass is much more sustainable than Aluminium, steel or timber. There are no large smoke plumes or other forms of environmental pollution from the manufacture of fiberglass. They exhibit useful properties such as hardness, transparency, resistance to chemical attack, stability, and inertness, as well as desirable fiber properties such as strength, flexibility, and stiffness. This acts as the reinforcing material in FRC. E- glass fiber as reinforcing material in polymer matrix composite is extremely common. Optimal strength is attained when straight and continuous are aligned in single direction. Hence here unidirectional fabrics are used. For promoting strength in other direction , Laminate structures are constructed with continuous fibres aligned in other direction. such type of structures are used in tanks.
Fig-1 E-glass fiber with unidirectional fabrics

International Journal of Scientific and Research Publications, Volume 7, Issue 4, April 2017 285 ISSN 2250-3153
www.ijsrp.org
SPECIMEN CASTING AND ANALYSIS
A. FRC HAND LAY-UP PROCESS A release agent, either in wax or liquid form, is applied to the chosen PVC Pipe used as mould. This will allow the finished product to be removed cleanly from the mould. Resin is mixed with its hardener and applied to the surface. Sheets of fiber matting are laid into the mould, then more resin mixture is added using a brush or roller. The material must conform to the mould, and air should not be trapped between the fiber and the mould. Additional resin is applied and possibly additional sheets of fiber. Hand pressure, vacuum or rollers are used to make sure the resin saturates and fully wets all layers, and any air pockets are removed. The work must be done quickly enough to complete the job before the resin starts to cure, unless high temperature resins are used which will not cure until the part is warmed in an oven. In some cases, the work is covered with plastic sheets and vacuum is drawn on the work to remove air bubbles and press the FRC to the shape of the mould. The process is explained in Fig-2.
Fig-2 Hand lay-up process
B. CASTING PROCEDURE
Two specimens are casted by the process of Hand layup process shown in fig-3.. Whose dimensional length is 1000mm,external diameter of 100mm and internal diameter as 70mm,80mm.Initially the hardener and Epoxy resin was mixed according to the ratio. PVC pipe was used as a mould. The pipe was thoroughly cleaned and it was surrounded by a film for easy removing after curing. Initially the resin mixture was applied to the surface. After that Sheets of fiber matting were laid into the mold, then resin mixture was added using a brush or roller. The material must conform to the mold, and air must not be trapped between the fiber and the mold. The fiber was added layer by layer. Totally 16 layers were added for attaining 15 mm thickness. Four layers were coated per day because during this process enormous amount of energy was released. Finally the casting and curing was done within 4 days.
Fig-3 Casting of specimen
C. THEORETICAL ANALYSIS The beam is theoretically analyzed by the following formula. Pcr = π2EI / le2
The sectional properties and loading values of column are given in Table-4
Table-4
properties Section1 Section2
shape Hollow circular section
Hollow circular section
Length (mm) 1000 1000
Ext.diameter (mm) 100 100
Int.diameter (mm) 70 80
Young’s modulus (GPa)
39 39
Moment of inertia (mm4) 3.7 x 10⁶ 2.9x 10⁶
End condition One end fixed;other end hinged
One end fixed;other end hinged
Critical load (KN) 1424 1116.25
D. EXPERIMENTAL ANALYSIS
The section was analyzed using loading frame Capacity of 100 tonneThe values for loads and deflection are tabulated in table-5 below.
Table-5
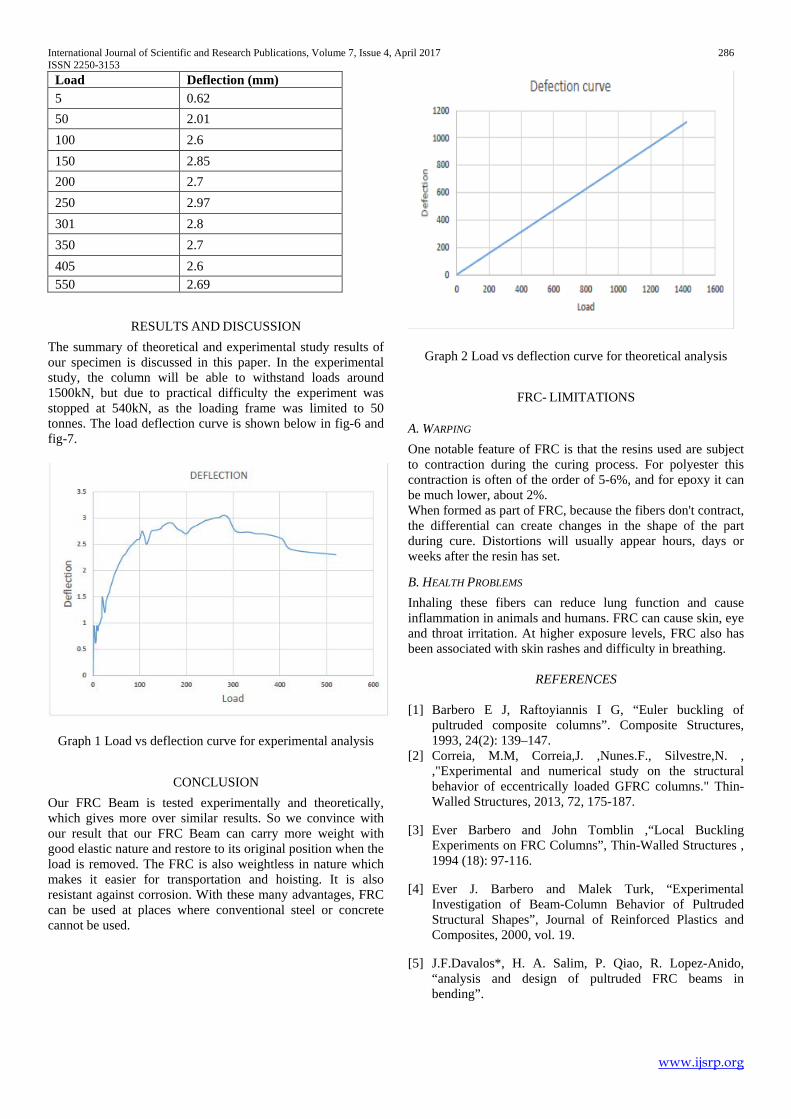
International Journal of Scientific and Research Publications, Volume 7, Issue 4, April 2017 286 ISSN 2250-3153
www.ijsrp.org
Load Deflection (mm) 5 0.62 50 2.01 100 2.6 150 2.85 200 2.7 250 2.97 301 2.8 350 2.7 405 2.6 550 2.69
RESULTS AND DISCUSSION The summary of theoretical and experimental study results of our specimen is discussed in this paper. In the experimental study, the column will be able to withstand loads around 1500kN, but due to practical difficulty the experiment was stopped at 540kN, as the loading frame was limited to 50 tonnes. The load deflection curve is shown below in fig-6 and fig-7.
Graph 1 Load vs deflection curve for experimental analysis
CONCLUSION Our FRC Beam is tested experimentally and theoretically, which gives more over similar results. So we convince with our result that our FRC Beam can carry more weight with good elastic nature and restore to its original position when the load is removed. The FRC is also weightless in nature which makes it easier for transportation and hoisting. It is also resistant against corrosion. With these many advantages, FRC can be used at places where conventional steel or concrete cannot be used.
Graph 2 Load vs deflection curve for theoretical analysis
FRC- LIMITATIONS
A. WARPING One notable feature of FRC is that the resins used are subject to contraction during the curing process. For polyester this contraction is often of the order of 5-6%, and for epoxy it can be much lower, about 2%. When formed as part of FRC, because the fibers don't contract, the differential can create changes in the shape of the part during cure. Distortions will usually appear hours, days or weeks after the resin has set.
B. HEALTH PROBLEMS Inhaling these fibers can reduce lung function and cause inflammation in animals and humans. FRC can cause skin, eye and throat irritation. At higher exposure levels, FRC also has been associated with skin rashes and difficulty in breathing.
REFERENCES
[1] Barbero E J, Raftoyiannis I G, “Euler buckling of
pultruded composite columns”. Composite Structures, 1993, 24(2): 139–147.
[2] Correia, M.M, Correia,J. ,Nunes.F., Silvestre,N. , ,"Experimental and numerical study on the structural behavior of eccentrically loaded GFRC columns." Thin-Walled Structures, 2013, 72, 175-187.
[3] Ever Barbero and John Tomblin ,“Local Buckling Experiments on FRC Columns”, Thin-Walled Structures , 1994 (18): 97-116.
[4] Ever J. Barbero and Malek Turk, “Experimental Investigation of Beam-Column Behavior of Pultruded Structural Shapes”, Journal of Reinforced Plastics and Composites, 2000, vol. 19.
[5] J.F.Davalos*, H. A. Salim, P. Qiao, R. Lopez-Anido, “analysis and design of pultruded FRC beams in bending”.

International Journal of Scientific and Research Publications, Volume 7, Issue 4, April 2017 287 ISSN 2250-3153
www.ijsrp.org
[6] Pizhong Qiao, Julio F. Davalos, and Jialai Wang, “Local Buckling of Composite FRC shapes by Discrete Plate Analysis”, Journal of Structural Engineering, March, 2001, Vol. 127, No. 3,.
[7] Sang Kyoon Jeong and Soon Jong Yoon, “Elastic Buckling of Orthotropic Open Section Compression Members with Edge Stiffeners”. KSCE Journal of Civil Engineering, 1998, Vol.2, 377-386.
.

International Journal of Scientific and Research Publications, Volume 7, Issue 4, April 2017 288 ISSN 2250-3153
www.ijsrp.org
COMPETITIVE INTELLIGENCE AND PRODUCT DEVELOPMENT IN SELECTED
PHARMACEUTICAL FIRMS IN ANAMBRA STATE OF NIGERIA
1Moneme, Chigozie Patrick ([email protected]), 2Nzewi, Hope Ngozi (PhD)
([email protected]) & 3Mgbemena, Ijeamaka Charity ([email protected]) 1-3 Department of Business Administration, Nnamdi Azikiwe University, Nigeria
ABSTRACT In today’s dynamic business environment, pharmaceutical firms are focusing their strategies on product development. For a product to secure market acceptance it must meet customers’ needs. Competitive intelligence (CI) equips organisations with the necessary information and knowledge needed for product development. With new and unique insights gained from CI, organisations are able to develop new or improve existing products that add value to customers.This study therefore, examined the influence of Competitive intelligence on Product Development of Selected Pharmaceutical Firms in Anambra State. To achieve this objective, a model was specified and competitive intelligence diffused into sub variables of Competitive risks, Core assumptions, Competitor threats, Marketplace opportunities, and Key Vulnerabilities. The study adopted descriptive research design. Data were obtained from primary source, and analysed using Principal Component Analysis and Multiple Regression Analysis. The result of the analysis revealed a significant relationship between competitive intelligence and product development of selected pharmaceutical firms. From the findings, it was concluded that the role of Competitive Intelligence on product and service innovation is to provide strategic information that will guide pharmaceutical firms in producing valuable products that meet customers’ needs. The study recommended among other things that for pharmaceutical firms to increase their performance, they should leveraged on useful information gathered in their environment to engage not only in new product development but also in constantly making relevant modifications to their existing product offerings.
Key Words: Business Environment, Competitive Intelligence, Product Development, and Strategic Information
Introduction Globally, business environment has become increasingly uncertain and unprecedented due to fierce competition with shorter product life cycles, and dynamic requirement of customers in terms of price, specifications, quality, quantity and delivery (Ganguly, Nilchiani, & Farr, 2009). The trend has been strengthened through fundamental developments in communication and information technologies. The consequences of these activities and host of others are an increasing need and pressure for efficiency, productivity and competitiveness in organisations. For an organization to survive and remain competitive in such an aggressive environment, a better understanding and knowledge of the competitive forces that reshape the behaviour of the environment is imperative. Karim (2011) agrees that knowledge is the main source of competitive advantage. Organisations are using information to expand and maintain competitive advantage in the current information age in which knowledge is power (Haag, Cummings & Philips, 2007). Ishikawa and Nakagawa (2013) emphasize that those organisations that can understand their environment, their competitors and establish competitive management strategies will win in this rapidly globalized information society. Thus, having access to information and knowledge of the environment, and application of the intelligent information are essential elements for organisational survival. Competitive intelligence (CI) is the acquisition and use of knowledge and information about competitors, customers and suppliers to
International Journal of Scientific and Research Publications, Volume 7, Issue 4, April 2017 289 ISSN 2250-3153
www.ijsrp.org
support decision making process that will enhance competitiveness of the organization (Anica and Cucui, 2009). CI involves legal and ethical methods of collecting and analyzing environmental data and information relating to competitors, customers, suppliers, industry and market trends and future behavioural patterns for improved strategic decisions and actions (Fleisher, 2008). Du Toit (2009) argued that CI is conceptualized as a process of monitoring the competitive environment, identifying opportunities and threats in the industry with the aim of providing actionable intelligence that will result to competitive advantage. Efficient CI activities can help an organisation to assess its strengths and weaknesses in relation to its competitors, and consequently plan ahead of competitors’ moves (Peltoniemi & Vuori 2008). By analysing the capabilities, vulnerabilities, intentions and moves of competitors, CI allows an enterprise to anticipate market developments proactively rather than merely react to them. This in turn enables the enterprise to remain competitive by improving its strategic decisions and performing better than its competitors (Johns & Van Doren 2010). Competitive intelligence supports competitive advantage and better organization performance by permitting product and service innovation, market segmentation and new market development (Porter, 1980). Product and service innovation process cannot be successful without information regarding the needs and requirements of customers whom the innovated product or service will serve. Such information is crucial in determining the nature of the new product and service that will provide a greater value than the one provided in the past and the one provided by competitors. Organisation that fails to modify its products or services to suit current and prospective consumers’ taste may be surpassed in terms of market demand and sales by competitors who identify such need to constantly apply changes that improve their products and make them current and relevant in the market. Organisations can use CI for such reasons as assessing a competitor’s strategies, defining the customers’ requirement, discovering and evaluating trends in the industry or identifying emerging new opportunities in the marketplace and accordingly offered innovative products and services to that effect (Gabber, 2007). The practice of CI has become more critical in pharmaceutical industry as competitive intensity in the industry has increased owing to complex technology, product availability and variety, strict regulations, and consumer sophistication. This industry is characterized by long development cycle and high expenditure in product development. Hence, any firm that produces new drug needs time to recover their investments before generic drugs enter into the market. More specifically, the pharmaceutical industry is highly complex since it depends on Research & Development (R&D) for survival. The cost of the R&D in this sector is huge and the risk of “no success” is high. However, the successful development of a new drug can generate abnormal profit for a period. Thus, pharmaceutical firms must devote greater attention in obtaining information about customers, products, competitors and the environment for effective strategic decision (Ettorre, 1995). Without the CI information, a pharmaceutical firm may miss market opportunities, ignore competitive threats, or produce products that fail to add value to consumers. Statement of the Problem In recent years, business organisations are witnessing hyper competition, and that of pharmaceutical industry is not an exception. The pharmaceutical industry is a complex, highly regulated and technical industry where the ability to outperform competitors and to achieve above industry average lies in the pursuit and execution of appropriate competitive strategy (Yoo, Lemak & Choi, 2006) and in most cases product innovation. The successful development of a new drug has been identify as major source of competitive advantage in pharmaceutical industry as it increases sales and overall performance of the firm (EFPIA, 2010). However, each new drug that enters the pharmaceutical market is an outcome of long, risky and very expensive R&D process. Another complex dimension to the competitive trend in pharmaceutical industry is the nature of competition and partnership. Sometimes firms may enter into partnership with their rival to undertake expensive research programme. During the programme period, they may be confronted to divulge some strategic information. Apart from this, pharmaceutical industry as a highly regulated industry is required to disclose virtually all information concerning them to the public. As such, they always face with decision of how much information to publish or keep private because if they publish information sooner than they should, competitors may respond with new products, or even take pre-emptive action against them (Sawka & Hohhof, 2008). Therefore, the main problem facing pharmaceutical firms is how to protect their
International Journal of Scientific and Research Publications, Volume 7, Issue 4, April 2017 290 ISSN 2250-3153
www.ijsrp.org
organisations against environment of unguarded information, and at the same time gather and analyze information about competitors, products, customers, suppliers, technologies, potential business relationships, and other environmental forces with the aim of providing actionable intelligence to secure competitive edge. Objective of the Study The broad objective of this study was to examine the influence of competitive intelligence on product development of Pharmaceutical firms in Anambra State; while the specific objective was to determine the extent to which competitive intelligence dimensions influence product innovation in selected Pharmaceutical firms in Anambra State. Hypothesis
H1 Competitive intelligence dimensions have significant influence on product innovation in selected Pharmaceutical firms in Anambra State.
Significance of the Study The need for competitive intelligence in today’s business environment characterised by information overload cannot be over emphasized. Hence, this study is highly imperative to academia and business practitioners. It provides insight to managers on how to assess and exploit competitive intelligence concept to avoid surprises and manage proactively by taking actionable intelligence. The study also contributes to the body of knowledge especially in the area of strategic management. Scope of the Study The study focuses on examining the influence of competitive intelligence on product development of Pharmaceutical industry using three selected Pharmaceutical firms in Anambra state of Nigeria. The study adopts stratified random sampling technique for determining selected firms. This was done by first identifying the three major cities in the state (Onitsha, Nnewi, and Awka), and then randomly picking one firm from each city, hence these three pharmaceutical firms- Christ the King Pharmaceutical Company Limited, Nnewi, Juhel Nigeria Limited, Awka, and Rico Pharmaceutical Industry Limited, Onitsha. REVIEW OF RELATED LITERATURE Conceptual Review Competitive Intelligence (CI) is a relatively new management concept developed from the main idea of Porter’s five competitive forces (Pellissier and Nenzhele, 2013). To ensure an understanding of CI concept the study reviews some definitions and discussions from scholars. Priporas (2005), states that CI can be considered as both a product and a process. The product is data on the firm’s competitors that is used as the foundation for action. The process is the methodical acquisition, analysis and evaluation of data for competitive advantage over known and potential competitors. This data helps executives, to understand their competitors and make strategic decisions. Karim (2011) reports that CI is a systematic process that allows for identifying competition’s plans and intentions to obtain some advantage. This process involves collecting, processing, analyzing, and distributing to top management and other decision makers any information about an organizations’ external environment. Blenkhorn and Fleisher (2005) define CI as a continuously evolving process that involves discovering, analysing and using intelligence regarding competitors and the general business environment from publicly available, non-proprietary information sources and converting it into knowledge on a continuing basis. The Society of Competitive Intelligence Professionals (SCIP, 2008) defines CI as a systematic and ethical process for gathering, analysing and managing external information that can affect the company's plans, decisions and operations. Viviers, Saayman, and Muller (2005) state in their study that competitive intelligence has the purpose of providing strategic advantage and it incorporates information on customers, suppliers, technologies and environment. CI means a systematic process initiated by organizations in order to gather and analyze information about competitors and the general socio-political and economic environment of the firm (Colakoglu, 2011). It is conceptualized as a process of monitoring the competitive environment, with a goal to provide actionable intelligence that will provide a competitive edge to the organization (Kahaner, 1998). Kahaner (1998) identifies four objectives of using competitive intelligence. They are; to discover new potential competitors or customers and support the start of new businesses. To identify and analyse new technologies, products and processes that influence organization’s activities and behaviour. To identify and analyze political or legislative standards or regulations that influence
International Journal of Scientific and Research Publications, Volume 7, Issue 4, April 2017 291 ISSN 2250-3153
www.ijsrp.org
organization’s activities and behaviour. Finally, to identify and analyze situations from competitors, customers, suppliers and others that evolved into successes or failures. McGonagle and Vella (2002) describe CI as a formalized but developing process that is used by managers to evaluate the evolution of their industry and the capabilities and behaviour of their competitors and those who might be their competitors in future. It is assumed that CI is the analytical process that transforms scattered information about competitors and customers into relevant, accurate and usable strategic knowledge on market evolution, business opportunities and threats (Teo & Choo, 2001). The key points of various definitions refer CI as an ethical and legal business practice, as opposed to industrial espionage which is illegal, the focus is on the external business environment, and there is a process involved in gathering information, converting it into intelligence and then utilizing it for strategic decisions. CI professionals emphasize that if information gathered are not usable (or actionable) then it is not intelligence. Fleisher (2001) considers CI as the process in which organizations capture information on competitors and their environment and applies it in their decision making process and planning with the purpose of improving the performance of the business. Fleischer and Bensoussan (2003); and Gray (2010) identify several strategic analytical techniques available to transform collected information into intelligence for strategic decision making. They are; SWOT (Strengths, Weaknesses, Opportunities, and Threats) analysis, Competitor profiles, Environmental scanning, PEST, Industry analysis (Porters Five Forces Model), Financial analysis, BCG growth/share portfolio matrix, GE Business screen matrix, Scenarios, War gaming, and Value chain analysis. They indicated that while these techniques are available and have been used by organisations for many years, there is no one right analytical tool that can solve the problems of every organisation. Thus, the complexity and depth of the analysis, and the tools and techniques that will be chosen are dependent on the business situation and the needs of the organisation. Fahey (2007) in his research identify five strategic inputs to be focused on while studying competitive intelligence. Those inputs are market place opportunities, competitor threats, competitor risks, key vulnerabilities and core assumptions. Hence, this study adopts Fahey’s (2007) competitive intelligence model to examine CI influence on product innovation of the selected Pharmaceutical firms. Consequently, CI is captured in this study with market place opportunities, competitor threats, competitive risks, key vulnerabilities and core assumptions. Marketplace Opportunities Marketplace opportunity is a strategy concerned with creating and realizing new opportunities in the market. This involves new ways of creating and developing value for customers: new product development; extending existing product lines, modifying existing product, and others (Fahey, 2007). Competitor Threats Fahey defines competitor’s threats as ability of a rival to prevent a company’s strategy from succeeding in the market. If threats are detected too late, resources invested in supporting a strategy may be wasted, if threats are detected long before coming to full action, strategy can be adapted to eliminate, ameliorate or avoid the threat (Fahey, 2007). Therefore, opportunities would be so much easier to realize in the absence of current and potential competitors threats. Competitive Risks Competitive risk involves change in and around the marketplace driven by customers, channels, suppliers, governmental agencies, technological development, amongst others. Competitive risks include any changes in the market that can negatively impact the firm’s current or potential strategy (Fahey, 2007). Organisations, therefore, should critically study competitive trends, patterns and discontinuities to detect risks and how it can negatively affects the achievement of their objectives. Key Vulnerabilities Key vulnerabilities are those factors that have the potential to affect our strategies and we have least control over them. Key vulnerabilities compel organisations to go beyond merely listing competitor threats, and competitive risks. It propels the analysis and ranking of current and potential threats and risks, to identify those that could most severely impede strategies success (Fahey, 2007). Core Assumptions Firms strive to identify their competitors’ strategy by gathering a huge amount of information, and this competitive information is surrounded by many assumptions. These assumptions atimes may be misleading.
International Journal of Scientific and Research Publications, Volume 7, Issue 4, April 2017 292 ISSN 2250-3153
www.ijsrp.org
The impact of such error may cause serious drawback in recognizing important competitive event, or late recognition of competitors’ action (Fahey, 2007). Product Innovation/Development Product innovation and product development are used interchangeably in this study. Lee and AbuAli (2011) define product innovation as development of new product, changes in design of established product, or use of new materials or components to modify existing product. In other words, anything which is new to the business and its product range is counted as innovation, even if similar products are available elsewhere or if the change is an incremental one. For an offering to satisfy as a product, it must have these five characteristics; quality level, features, design, a brand name, and packaging (Sattar, 2003). These characteristics are the variables organisations can use to manipulate and differentiate their products for competitive advantage. Quality level involves the level to which a product conforms to the required standard and at the same time effective over a stipulated period of time which is also called shelf-life of a product. All drugs have their standard profile, which act as a standard when a product is evaluated in terms of its quality level (Ahmed, 2012). Features are the benefits that customers need from the product. For pharmaceutical product, this will mean the profile of a drug, what it does, its side effects, and other features. Product Design is concerned with physical nature of product. A pharmaceutical product can be in the form of capsules, tablets, syrup, injection or ointment. This is one of the major determinant factors when chosen a product for treating a patient (Stephen, 2003). Brand name; unlike consumer products, where every product invariably carries a brand name, pharmaceutical product may or may not be branded. Some firms may decide to market their products as under a generic name, instead of giving it a brand name (Kola, 2004) but most pharmaceutical firms prefer to market their products under branded names, which allow them to position and promote their products effectively (Filmore, 2004). Packaging plays significant role in pharmaceutical products. It goes beyond just acting as outer container to ensure the conditions required for stability of the medicine are maintained. A pharmaceutical firm cannot just select the packaging material arbitrarily, but has to consider if the packaging selected conforms to the standards required for a particular product profile or not (Gilbert, 2003). Product Innovation and Competitive Intelligence Cavalcanti (2005), states that competitive intelligence begins with environmental scanning activities, which involves transforming data, information and knowledge into intelligence as a final product. However, competitive intelligence as a final product becomes useful when the final consumers’ needs have been satisfactorily met. Today the role that CI plays in product innovation is enormous. The key success factor in the implementation of product innovation is information, especially information about the wishes and requirements of the customers as well as information about the business environment. Kahaner (1998) asserts that CI is the action of gathering, analyzing, and applying information about products, competitors, suppliers, regulators, partners, and costumers for short-term and long-term planning needs of an organization. In essence, CI helps organisation to have a better understanding of market, regulations, customers' current and future needs, competitors’ strengths and weaknesses, and accordingly offer innovative product that will meet the need of the customers (Gordon et al., 1993). In addition to that, CI gives direction to organisation’s research and development. Organization through CI may identify potential opportunities for investing in new technology or help incorporate new technologies into their own products. By so doing, they identify potential technology-based threats and possibly partner for collaborative research and development (Vedder & Guynes, 2002). Theoretical Framework This study is guided by Open system theory developed by Ludwig von Bertanlanffy (1956). Open systems theory states that organizations are strongly influenced by their environment. The environment consists of other players that exert various forces of an economic, political, and social in nature. Open systems possess porous boundaries that permit interaction across their boundary through which new information or ideas are readily absorbed, and permitting the incorporation and diffusion of viable new ideas. Because of this, they can adapt more quickly to changes in the external environment in which they operate. Open systems approach views the organizations’ continuous interaction with the external environment as vital for organizational survival and success. Thus, alertness and sensitivity to the environment is very essential

International Journal of Scientific and Research Publications, Volume 7, Issue 4, April 2017 293 ISSN 2250-3153
www.ijsrp.org
ingredient of business success, survival and longevity, because of the firm’s dependence on it for resources inputs and services outputs. Open system theory therefore, explains how organisations interact with their environment through CI to gather data, information and knowledge about actors in environment (competitors, customers, suppliers, government etc) in order to develop or improve products and services that meet or even exceed customers’ expectations. Hence, open system theory conceptualise competitive Intelligence as an ethical and legal business practice that focuses on gathering information from external business environment, converts it into actionable intelligence, and utilises it for developing innovative products and services that are valuable to the customer.
Interaction of Organisations with environment through Competitive Intelligence
New Product Development/Redesigning Existing Products
Competitives Intelligence (market place opportunities, competitors’ threats, competitive risks, key vulnerabilities and core assumptions)
Fig. 2.1 Conceptual Framework
Empirical Review Ahmed, Ahmad, Khoso, Arif, and Palwishah (2014) examined competitive Intelligence and Marketing Effectiveness of Organizations in Pakistan. Competitive intelligence was diffused into sub variables including market opportunities, competitor risks, competitor threats, technological intelligence, technical intelligence, and strategic intelligence. In order to prove the importance of competitive intelligence in business this research tested whether competitive intelligence was being used by the organizations in Pakistan and also the extent to which it was used. T-test was used to individually test each variable to check for significance. The results of the research show that all the sub variables are significantly used by the organizations in Pakistan to make their marketing effective and that competitive intelligence is important to make the marketing effective for a business. Lynnette, Mphahlele, and Awosejo ( 2014) examined the extent to which the utilization of competitive intelligence (CI) gives rise to enhanced competitive performance in small and medium enterprise (SMEs) by examining the roles of a selection of technological, and specific environmental factors in enhancing competitive advantage for SMEs, within the Telecommunications Industry in South Africa. Two models – technology acceptance model (TAM) and the Perceived ease of use Model (PEOU) were applied to investigate the extent to which SMEs in the context of South Africa can leverage CI. Quantitative research approach was applied and Purposive sampling was utilized as a data collecting tool from a number of individuals at lower, middle and top management levels in five different SMEs in Gauteng Province. Results indicated that perceived ease of use (PEOU) and Perceived Usefulness are the most important factors that determine the application of CI tools for competitive advantage in SMEs and that IT Training, SWOT and Political, economic, social and technology (PEST) are significant explanatory factors of Competitive Intelligence (CI) in the context of Small and Medium sized Enterprises. DuToit and Sewdass (2014) examined the current situation with regards to competitive intelligence (CI) activities in Morocco. This study was exploratory in nature. A questionnaire survey method was used for the study where a questionnaire was administered to CI experts in organisations to determine the current state of CI in Morocco. It was found that 21 percent of the companies with less than 50 employees in the organisations use CI as a strategic tool and that the CI function had been in existence for more than five years in only 30 percent of the companies.
Organisations Competitors/ Environmment
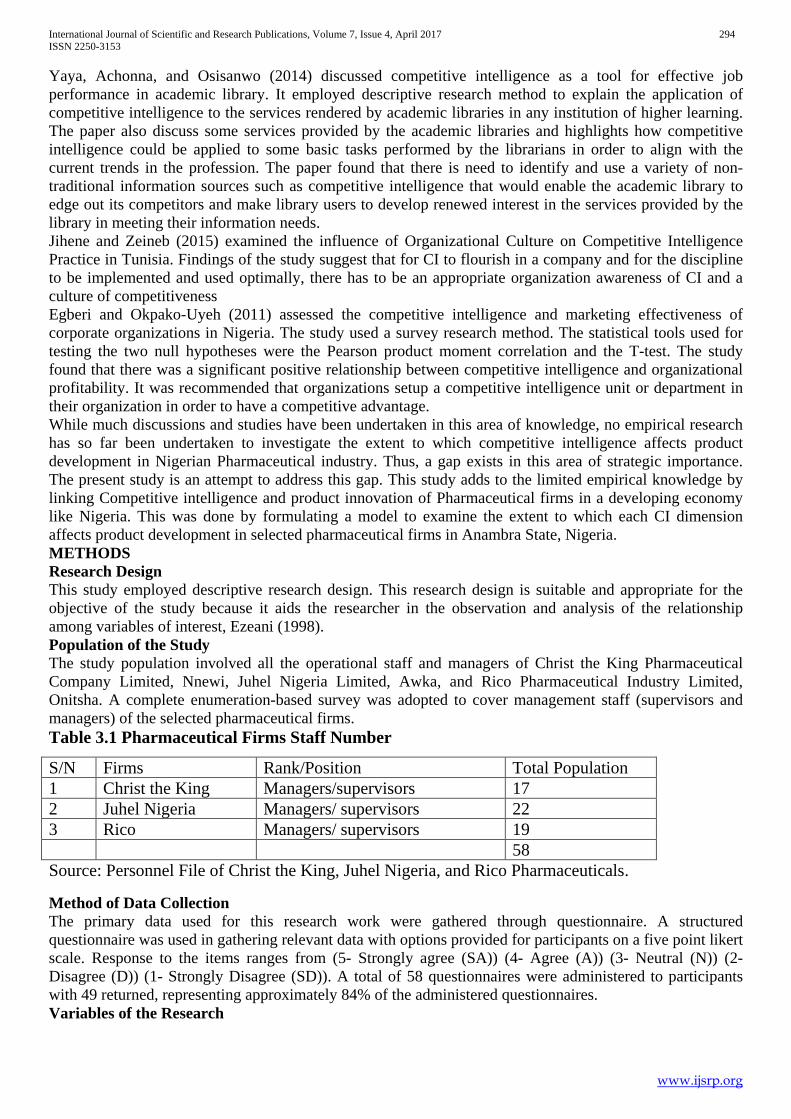
International Journal of Scientific and Research Publications, Volume 7, Issue 4, April 2017 294 ISSN 2250-3153
www.ijsrp.org
Yaya, Achonna, and Osisanwo (2014) discussed competitive intelligence as a tool for effective job performance in academic library. It employed descriptive research method to explain the application of competitive intelligence to the services rendered by academic libraries in any institution of higher learning. The paper also discuss some services provided by the academic libraries and highlights how competitive intelligence could be applied to some basic tasks performed by the librarians in order to align with the current trends in the profession. The paper found that there is need to identify and use a variety of non-traditional information sources such as competitive intelligence that would enable the academic library to edge out its competitors and make library users to develop renewed interest in the services provided by the library in meeting their information needs. Jihene and Zeineb (2015) examined the influence of Organizational Culture on Competitive Intelligence Practice in Tunisia. Findings of the study suggest that for CI to flourish in a company and for the discipline to be implemented and used optimally, there has to be an appropriate organization awareness of CI and a culture of competitiveness Egberi and Okpako-Uyeh (2011) assessed the competitive intelligence and marketing effectiveness of corporate organizations in Nigeria. The study used a survey research method. The statistical tools used for testing the two null hypotheses were the Pearson product moment correlation and the T-test. The study found that there was a significant positive relationship between competitive intelligence and organizational profitability. It was recommended that organizations setup a competitive intelligence unit or department in their organization in order to have a competitive advantage. While much discussions and studies have been undertaken in this area of knowledge, no empirical research has so far been undertaken to investigate the extent to which competitive intelligence affects product development in Nigerian Pharmaceutical industry. Thus, a gap exists in this area of strategic importance. The present study is an attempt to address this gap. This study adds to the limited empirical knowledge by linking Competitive intelligence and product innovation of Pharmaceutical firms in a developing economy like Nigeria. This was done by formulating a model to examine the extent to which each CI dimension affects product development in selected pharmaceutical firms in Anambra State, Nigeria. METHODS Research Design This study employed descriptive research design. This research design is suitable and appropriate for the objective of the study because it aids the researcher in the observation and analysis of the relationship among variables of interest, Ezeani (1998). Population of the Study The study population involved all the operational staff and managers of Christ the King Pharmaceutical Company Limited, Nnewi, Juhel Nigeria Limited, Awka, and Rico Pharmaceutical Industry Limited, Onitsha. A complete enumeration-based survey was adopted to cover management staff (supervisors and managers) of the selected pharmaceutical firms. Table 3.1 Pharmaceutical Firms Staff Number
S/N Firms Rank/Position Total Population 1 Christ the King Managers/supervisors 17 2 Juhel Nigeria Managers/ supervisors 22 3 Rico Managers/ supervisors 19 58 Source: Personnel File of Christ the King, Juhel Nigeria, and Rico Pharmaceuticals.
Method of Data Collection The primary data used for this research work were gathered through questionnaire. A structured questionnaire was used in gathering relevant data with options provided for participants on a five point likert scale. Response to the items ranges from (5- Strongly agree (SA)) (4- Agree (A)) (3- Neutral (N)) (2- Disagree (D)) (1- Strongly Disagree (SD)). A total of 58 questionnaires were administered to participants with 49 returned, representing approximately 84% of the administered questionnaires. Variables of the Research

International Journal of Scientific and Research Publications, Volume 7, Issue 4, April 2017 295 ISSN 2250-3153
www.ijsrp.org
Variables in this study are Product Development (Y) variable, as the dependent variable, and Competitive intelligence as independent variable (X). Competitive intelligence was decomposed by Competitive risks (X1), Core assumptions (X2), Competitor threats (X3), Marketplace opportunities (X4), and Vulnerabilities (X5). Model Specification This model denotes the influence of various Competitive Intelligence dimensions on Product Development of the selected pharmaceutical firms. Y = bo + b1X1 + b2X2 + b3X3 + b4X4 + b5X5 + U Where: bo = the intercept b1 – b5 = the coefficient of independent variables and Y = Product Development X1 = Competitive risks X2 = Core assumptions X3 = Competitor threats X4 = Marketplace opportunities X5 = Vulnerabilities U = the error term. Analysis of data The statistical package SPSS (version 21) was used for data analysis. The analysis of data involved two steps. Principle component analysis was first used for data dimensionality, where original set of items were reduced and represented by a concise number of latent variables. At second step, multiple regression analysis was performed to find out the relationship and extent to which the identified Competitive Intelligence variables affect Product Innovation of the selected pharmaceutical firms. Validity of the Research To test the validity of the instrument, content and construct validity were analyzed. Before data collection, the content validity was established by expert reviews of the questionnaire to make sure that the instrument measured correctly, what it sets out to measure. Exploratory factor analysis was used to evaluate the construct validity of the instrument. The results of the factor analysis revealed factor loadings for the items range from 0.528 to 0.923. The KMO measure of sampling adequacy for the latent constructs ranges from 0.585 to 0.722, and Bartlett test of sphericity which indicates sufficient correlation between variables were all significant (p=0.000) for the latent constructs. Hence, all the mentioned results of factor analysis are in acceptable range. Reliability of the Instrument An instrument is reliable if measurement of the same phenomena with the same instrument at different times and places yields the same result. That is, the instrument can give consistent results at different point in time. Cronbach’s alpha coefficient is widely use as a measure of reliability. The alpha level of 0.60 or above is considered acceptable as suggested by (Sekaran, 2003). The results of the Cronbach’s alpha coefficient of the variables were 83% reliable. This implied that the instrument is reliable.
PRESENTATION AND ANALYSIS OF RESULT This section is devoted to presentation and analysis of results using appropriate statistical tools. It also involves interpretation of statistical results as a basis for not rejecting or rejecting the alternate hypothesis of the research study. Regression Result Table 4.1: Results of Regression Model, Dependent Variable; Product Development Variable Coefficient Std. Error t-Statistic Prob. C -1.001E-013 .093 .000 1.000 Competitive risks -.534 .115 -4.648 .000

International Journal of Scientific and Research Publications, Volume 7, Issue 4, April 2017 296 ISSN 2250-3153
www.ijsrp.org
Core assumptions .223 .124 1.805 .078 Competitor threats .237 .107 2.211 .032 Marketplace opportunities .653 .123 5.323 .000 Vulnerabilities .479 .154 3.115 .003 Sources: Extract from SPSS Ver. 21 Output Durbin-Watson = 0.723 Adjusted R2 = 0.575 F-Statistics = 14.003, Prob (F-Statistics) = 0.0000 Analysis of Result The results of the regression analysis revealed that all the independent variables except coefficient of core assumptions are statistically significant. The result also showed positive relationships between the independent variables and dependent variable except competitive risk that assumed a negative sign. The Adjusted R-squared (R²) value of 0.575 showed that 57.5% changes in the dependent variable were explained by the independent variables. The Durbin-Watson (DW) result 0.723 indicated presence of negative autocorrelation. The f-statistic was found to be statistically significant, with p-value of 0.000 percent. This implies that the independent variables (Competitive Intelligence dimensions) put together have a statistically significant relationship with dependent variable (Product development). Therefore, with the ANOVA result (F-statistics) we accept alternate hypothesis and concluded that Competitive Intelligence has a significant influence on Product Development of selected Pharmaceutical firms. FINDINGS, CONCLUSION AND RECOMMENDATIONS Discussion of Findings The research model captured competitive intelligence with Competitive risks, Core assumptions, Competitor threats, Marketplace opportunities, and Vulnerabilities. After the analysis, the result revealed that competitive intelligence influenced product development of the selected firms. The result also confirmed significant relationship between the dependent variable and independent variables except core assumptions. Coefficient of Competitor threats has a positive sign and statistically significant. This is consistent with the finding of Hay and Morris (1979) who argue that competitors’ threats can be mitigated through competitive interdependence where competitive uncertainty pushes firms to enter into alliances to limit number of competitors and sometimes engage in joint research resulting to product development. The coefficient of Marketplace opportunities is positive and statistically significant. This finding was supported by Fahey (2007) who states that market opportunities are new methods and means to develop values which manifest in form of new products development, or redesigning existing product.
The coefficient of Competitive risks assumed a negative sign and is statistically significant. This result is at variance with the work of Wright et al. (2005) who assert that the hostility of the environment (that is, Competitive risks) influences innovativeness. Therefore, the higher the Competitive risks the higher the product innovation. Firms operating in a highly competitive hostile market are likely to be more successful innovators than firms operating in a static environment. Coefficient of Vulnerabilities poses a positive sign and statistically significant. This is in conflict with the work of Cooper (2003) who suggests that organisational vulnerability (in terms of internal problems) affects product failure because of organisation’s inability to meet product performance standard, reliability, or cost requirements. Conclusion The need for competitive intelligence as regards to product development cannot be over emphasized. In the research model, Competitive risks, Competitor threats, Marketplace opportunities, and Vulnerabilities were significant. This supports the notion that gathering, analysing and sharing information about the marketplace enables organisations to realize new market needs and rival plans, and accordingly respond to it with appropriate strategic actions. The findings revealed that competitive intelligence is the necessary tool for improving firms’ product innovation in terms of new product novelty and improvement of existing products, thus leading to competitive advantage. Hence, the study concludes that the roles of Competitive Intelligence
International Journal of Scientific and Research Publications, Volume 7, Issue 4, April 2017 297 ISSN 2250-3153
www.ijsrp.org
on Product Development are to provide actionable intelligence for strategic decisions, identify customer needs, and reveals competitors’ strategies and consequently help organisations to locate themselves on the competitive scale and provide innovative products that meet customers’ need. Recommendations
1) In their quest for increase in sales volume, pharmaceutical firms should not only engage in new product development but also constantly make relevant modifications to their existing product offerings for it to be continually relevant in satisfying the ever-changing market needs.
2) Organisations should exploit the knowledge of competitive intelligence to analyse customer’s needs, adapt their offering to those needs, react to competitors’ actions and respond with innovative product.
3) Organizations should have a formal position for competitive Intelligence unit to regularly monitor the activities of competitors and business environment with the aim of evaluating the organizations actions in line with that of competitors.
REFERENCES Ahmed, R., Parmar. V., & Ahmed, J. (2012), Factors that affect attitude towards Generic Drugs Perception:
Comparison of Physicians & General Practitioners of Karachi City. International Journal of Marketing and Technology, 2(11)
Anica-Popa, I. & Cucui G. (2009). A framework for enhancing competitive intelligence capabilities using decision support system based on web mining techniques. International Journal of Computers Communications and Control, 4, 326-334.
Bertalanffy, L. (1950). An Outline of General System Theory British Journal for the Philosophy of Science, (1)2, pp.134-165
Blenkhorn, D., & Fleisher, C. (2005). Competitive Intelligence and Global Business. Greenwood Publishing Group, Westport.
Cavalcanti P. (2005). The relationship between business intelligence and business success Journal of Competitive Intelligence and Management, (3)1
Colakoglu, T. (2011). The problematic of competitive intelligence: How to evaluate and develop competitive intelligence, Procedia Social and Behavioral Sciences, 24, pp.1615– 1623
Cooper, L.P., 2003. A research agenda to reduce risk in new product development through knowledge management: a practitioners perspective. Journal of Engineering and Technological Management 20, pp. 117–140.
Davenport. H., & Harris, J. (2007). Competing on analytics. The new science on winning. Boston, Massachusetts: Harvard Business School Press.
Du Toit, A., & Sewdass, N. (2014). Competitive Intelligence (CI) in Morocco. Afr. J. Lib. Arch. & Inf. Sc. (24)1, pp. 3-13
Egberi, A. K,. & Okpako-Uyeh, B. (2011). Competitive intelligence and marketing effectiveness of corporate business organizations in Nigeria. International Journal of Economic Development Research and Investment, (2)3
Etorre B. (1995). Managing competitive intelligence. Management Review, 84(10), 15-19.
European Federation of Pharmaceutical Industries and Associations, (2010), The Pharmaceutical Industry in figures,
Ezeani, S. (1998). Research methods: A realistic approach. Ibadan: Elohim Publishers. Fahey, L, (2007). Connecting strategy and competitive intelligence refocussing intelligence to produce
critical strategy inputs. Strategy Leadership, 35(1): 4-12.

International Journal of Scientific and Research Publications, Volume 7, Issue 4, April 2017 298 ISSN 2250-3153
www.ijsrp.org
Fleisher, C. (2001). An introduction to the management and practices of competitive intelligence (CI)”, in Fleisher, C.G. and Blenkhorn, D.L. (Eds), Managing Frontiers in Competitive Intelligence, Quorum Books, Westport, CT, pp. 3-18.
Fleisher, C. (2008). Using open source data in developing competitive and marketing intelligence. European Journal of Marketing, 42 (7/8), 852-866.
Fleisher, S., & Bensoussan, B. (2003). Strategic and Competitive Analysis: Methods and Techniques for Analyzing Business Competition. Upper Saddle River, NJ:Prentice Hall.
Gabber, H. (2007). Competitive intelligence topology analyze for improved plan operation. Industrial Management and Data Systems, 107(2), 198-236.
Ganguly, A., Nilchiani, R., & Farr, J. (2009). Evaluating agility in corporate enterprises. International Journal of Production Economics, 118 (2) pp. 410-23.
Gordon, G., Kaminski, R., Catalone C., & Benedetto, (1993). Linking customer knowledge with successful service innovation. Journal of Applied Business Research, 9(2), 129-140.
Gray P. (2010). Competitive intelligence, Business Intelligence Journal, 15(4), 31-37.
Haag, S., Cummings, M., & Philips, A. (2007). Management Information Systems for the Information Age. 6th
Edition. Boston: McGraw-Hill/Irwin.
Hay, D., & Morris, D. (1979). Industrial Economics: Theory and Evidence, Business Review Journal, 14(6), pp.419-32.
Heppes, D. & Du Toit, A. (2009). Level of maturity of the competitive intelligence function: case study of a retail bank in South Africa. Aslib Proceedings, 61(1), 48-66.
Jihene, C., & Zeineb, B. (2014). Critical sucess factors of competitive intelligence implementation: a conceptual framework. International Conference on Business, Economics, Marketing & Management Research (BEMM’13) Volume Book: Economics & Strategic Management of Business Process (ESMB), (2), pp. 41-46
Johns, P., & Van Doren, D. (2010). Competitive intelligence in service marketing: A new approach with practical application. Marketing Intelligence & Planning, 28(5), 551–570.
Kahaner, L. (1998). Competitive Intelligence, Touchstone Books, New York, USA.
Karim, A. (2011). The value of competitive business intelligence system (CBIS) to stimulate competitiveness in global market. International Journal of Business and Social Science, 19(2), 196–203.
Kola, J. (2004). Can the pharmaceutical industry reduce attrition rates? Nature Reviews
Lee, J., & AbuAli, M. (2011). Innovative product advanced service systems (I-PASS): methodology, tools, and applications for dominant service design. Int J Adv Manuf Technol, Vol. 52, 2011, pp. 1161 – 1173.
Lynnette, M., Mphahlele, M., & Awosejo, O. (2014). Utilization of competitive intelligence to enhance firm performance: A case of South African small and medium enterprises. International Journal of Advanced Computer Research, (4)2
McGonagle, J., & Vella, C. (2002). Bottom Line Competitive Intelligence, Westport, CT: Quorum Books
Nenzhelele, T., & Pellissier, R. (2013). Towards a universal definition of competitive intelligence. South African Journal of Information Management, 15(2).
Peltoniemi, M., & Vuori, E. (2008). Competitive intelligence as a driver of co-evolution within an enterprise population. Journal of Competitive Intelligence and Management, 4(3), 50–62.
Phathutshedzo. N., & Tiko, I. (2011). The impact of competitive intelligence on products and services innovation in organizations. International Journal of Advanced Computer Science and Applications, (2)11
International Journal of Scientific and Research Publications, Volume 7, Issue 4, April 2017 299 ISSN 2250-3153
www.ijsrp.org
Porter, M. (1980). Competitive Strategy: Techniques for analyzing industries and competitors. New York: The free press.
Priporas C., Gatsoris L., & Zacharis, V. (2005). Competitive Intelligence activity: evidence from Greece. Marketing Intelligence & Planning, 23(7), pp. 659-669.
Rizwan, R., Imamuddin, K., Khawaja, A., & Rana, I. (2014). Competitive intelligence and marketing effectiveness of organizations: an investigation from Pakistan. Middle-East Journal of Scientific Research, 22 (10)
Sattar, I., & Maqsood, A. (2003). A marketing mix model for pharmaceutical industry - a pakistani perspective. The Journal of Independent Studies and Research, 1(2)
Sawka, K., & Hohhof, B. (2008). Starting a Competitive Intelligent Function. Competitive intelligence foundation, Alexandria.
SCIP, 2008, Society for Competitive Intelligence Professionals.
Sekaran, U. (2003). Researcher Methods for Business. U.S.A. John Wiley & Sons.
Stephen, R. (2003). ethical considerations in the use of direct-to-consumer advertising and pharmaceutical promotions: the impact on pharmaceutical sales and physicians. Journal of Business Ethics
Teo, T. & Choo, W. (2001). Assessing the Impact of Using the Internet for Competitive Intelligence. Information and Management, (39)1, pp. 67.
Vedder, R., & Guynes, C. (2002). Guynes CIOS’ perspectives on competitive intelligence, Information Systems Management, Fall,
Wright, R., Palmer, D., & Perkins, (2005). Types of product innovations and small business performance in hostile and benign environments. Journal of Small Business Strategy 15(2): 33-44.
Yoo, J., Lemak, D., & Choi, Y. (2006). Principles of management and competitive strategies: using Fayol to implement Porter. Journal of Management History, 12(4), 352-368.

International Journal of Scientific and Research Publications, Volume 7, Issue 4, April 2017 300 ISSN 2250-3153
www.ijsrp.org
Single Server Bulk Queueing System with Three Stage Heterogeneous Service, Compulsory Vacation and
Balking S. Uma*, P. Manikandan**
* Department of Mathematics, D. G. Govt. Arts College for Women, Mayiladuthurai-609001.
**Department of Mathematics, Anjalai Ammal-Mahalingam Engineering College, Kovilvenni-614403.
Abstract- The concept of this paper studies with the customers arriving in bulk or group, in a single server queueing system, in Poisson distribution which provides three types of general services in bulk of fixed size M (≥ 1) in first come first served basis. After first two stage service, the server must provide the third stage service. After the completion of third stage service, the server takes compulsory vacation under exponential distribution. If the required bulk of customers are not available on the return of the server, the server again goes for vacation or remains in the system till bulk is reached. The arriving batch balks during the period when the server is busy or when the server is on vacation or other constraints. This may result in the impatient behavior of the customers. From the above concept, we compute the time dependent probability generating functions and from it the corresponding steady state results are obtained. The average queue size and the system size are derived. Key words - balking, bulk arrival, bulk service, probability generating function, vacation.
I. INTRODUCTION mong the eminent researchers, Chaudhry and Templeton [4], Cooper [5], Gross and Harris [9] have widely done research in bulk queue. Vacation queue has been surveyed widely by Doshi [7]. Madan [11] has been explained the queueing system with
compulsory vacation. Thangaraj and Vanitha [15] have explained M/G/1 queue with two stage heterogeneous service compulsory vacation. Uma and Punniyamoorthy [17] have been worked the bulk queueing system with two choices of service and compulsory vacation. Ayyappan and Sathiya [2] have briefed the three stage heterogeneous service and server vacations. Queueing system with balking and vacation have detailed by Charan Jeet Singh, Madhu Jain and Binay Kumar [3], Monita Baruah, Madan and Tillal Eldabi [14], Punniyamoorthy and Uma [15].
This paper, we suggest to study single server bulk queue with three stages of service and compulsory vacation. The arrival is
under Poisson distribution, the services are general distribution and vacation is an exponential distribution. After the second stage service, the server must provide the third stage service. The bulk of customers are served under first come first served basis. The arriving batch balks when the server is busy or when the server is on vacation or other constraints. This may reflect customer’s impatient behavior. Queueing systems with impatient customers appear in many real life situations such as those involving production-inventory systems, telephone switching systems, hospital emergency service and so forth.
This paper is organized as follows: The mathematical model is briefed in section 2. Definitions and Notations are described
in section 3. Equations governing the system are given in section 4. The time dependent solutions have been discussed in section 5 and the corresponding steady state results have been calculated clearly in section 6. The average queue size and the system size are calculated in section 7.
II. THE MATHEMATICAL MODEL
We assume the following to describe the queueing model of our study: 1) Customers (units) arrive at the system in batches of variable size in a compound Poisson process.
A

International Journal of Scientific and Research Publications, Volume 7, Issue 4, April 2017 301 ISSN 2250-3153
www.ijsrp.org
2) Let 𝜆𝜆𝜋𝜋𝑖𝑖𝑑𝑑𝑑𝑑 (𝑖𝑖 = 1,2,3, … ) be the first order probability that a batch of 𝑖𝑖 customers arrives at the system during a short interval of time (𝑑𝑑, 𝑑𝑑 + 𝑑𝑑𝑑𝑑], where 0 ≤ 𝜋𝜋𝑖𝑖 ≤ 1, ∑ 𝜋𝜋𝑖𝑖∞
𝑖𝑖=1 = 1, 𝜆𝜆 > 0 is the mean arrival rate of batches. 3) We consider the case when there is single server providing parallel service of three types on a first come first served basis
(FCFS); after first two stages of service, the server must provide the third stage service 4) The service of customers (units) is rendered in batches of fixed size 𝑀𝑀(≥ 1) or min(𝑛𝑛,𝑀𝑀), where 𝑛𝑛 is the number of customers
in the queue. 5) We assume that the random variable of service time 𝑆𝑆𝑗𝑗 (𝑗𝑗 = 1,2) of the 𝑗𝑗𝑑𝑑ℎ kind of service follows a general probability law with
distribution function 𝐺𝐺𝑗𝑗 �𝑠𝑠𝑗𝑗 �, 𝑔𝑔𝑗𝑗 �𝑠𝑠𝑗𝑗 � is the probability density function and 𝐸𝐸(𝑆𝑆𝑗𝑗𝑘𝑘) is the 𝑘𝑘𝑑𝑑ℎ moment (𝑘𝑘 = 1,2, … ) of service time 𝑗𝑗 = 1,2,3.
6) Let 𝜇𝜇𝑗𝑗 (𝑥𝑥) be the conditional probability of type 𝑗𝑗 service completion during the period (𝑥𝑥, 𝑥𝑥 + 𝑑𝑑𝑥𝑥], given that elapsed service time is 𝑥𝑥, so that
𝜇𝜇𝑗𝑗 (𝑥𝑥) =𝑔𝑔𝑗𝑗 (𝑥𝑥)
1−𝐺𝐺𝑗𝑗 (𝑥𝑥), 𝑗𝑗 = 1,2 (1)
and therefore
𝑔𝑔𝑗𝑗 �𝑠𝑠𝑗𝑗 � = 𝜇𝜇𝑗𝑗 �𝑠𝑠𝑗𝑗 �𝑒𝑒−∫ 𝜇𝜇𝑗𝑗 (𝑥𝑥)𝑑𝑑𝑥𝑥𝑠𝑠𝑗𝑗
0 , 𝑗𝑗 = 1,2 (2) 7) After completion of continuous service to the batches of fixed size 𝑀𝑀(≥ 1), the server will go for compulsory vacation. 8) Server vacation starts after the completion of service to a batch. The duration of the vacation period is assumed to be exponential
with mean vacation time 1𝛼𝛼.
9) On returning from vacation the server instantly starts the service if there is a batch of size 𝑀𝑀 or he remains idle in the system. 10) We assume that (1 − 𝑎𝑎1)(0 ≤ 𝑎𝑎1 ≤ 1) is the probability that an arriving batch balks during the period when the server is busy
(available on the system) and (1 − 𝑎𝑎2)(0 ≤ 𝑎𝑎2 ≤ 1) is the probability that an arriving batch balks during the period when the server is on vacation.
11) Finally, it is assumed that the inter-arrival times of the customers, the service times of each kind of service and vacation times of the server, all these stochastic processes involved in the system are independent of each other.
III. DEFINITIONS AND NOTATIONS We define: 𝑃𝑃𝑛𝑛 ,𝑗𝑗 (𝑥𝑥, 𝑑𝑑) : Probability that at time 𝑑𝑑, the server is active providing and there are 𝑛𝑛 (𝑛𝑛 ≥ 0) customers in the queue, excluding a batch of 𝑀𝑀 customers in type 𝑗𝑗 service, 𝑗𝑗 = 1,2,3 and the elapsed service time of this customer is 𝑥𝑥. Accordingly, 𝑃𝑃𝑛𝑛 ,𝑗𝑗 (𝑑𝑑) = ∫ 𝑃𝑃𝑛𝑛 ,𝑗𝑗 (𝑥𝑥, 𝑑𝑑)𝑑𝑑𝑥𝑥∞
0 denotes the probability that there are 𝑛𝑛 customers in the queue excluding a batch of 𝑀𝑀 customers in type 𝑗𝑗 service, 𝑗𝑗 = 1,2,3 irrespective of the elapsed service time 𝑥𝑥. 𝑉𝑉𝑛𝑛(𝑑𝑑) : Probability that at time 𝑑𝑑, there are 𝑛𝑛 (𝑛𝑛 ≥ 0) customers in the queue and the server is on vacation. 𝑄𝑄(𝑑𝑑) : Probability that at time 𝑑𝑑, there are less than 𝑀𝑀 customers in the system and the server is idle but available in the system.
IV. EQUATIONS GOVERNING THE SYSTEM According to the Mathematical model mentioned above, the system has the following set of differential-difference equations: 𝜕𝜕𝜕𝜕𝑥𝑥𝑃𝑃𝑛𝑛 ,1(𝑥𝑥, 𝑑𝑑) + 𝜕𝜕
𝜕𝜕𝑑𝑑𝑃𝑃𝑛𝑛 ,1(𝑥𝑥, 𝑑𝑑) + �𝜆𝜆 + 𝜇𝜇1(𝑥𝑥)�𝑃𝑃𝑛𝑛 ,1(𝑥𝑥, 𝑑𝑑) = 𝜆𝜆𝑎𝑎1 ∑ 𝜋𝜋𝑘𝑘𝑃𝑃𝑛𝑛−𝑘𝑘 ,1(𝑥𝑥, 𝑑𝑑)𝑛𝑛
𝑘𝑘=1 + 𝜆𝜆(1 − 𝑎𝑎1)𝑃𝑃𝑛𝑛 ,1(𝑥𝑥, 𝑑𝑑) (3) 𝜕𝜕𝜕𝜕𝑥𝑥𝑃𝑃0,1(𝑥𝑥, 𝑑𝑑) + 𝜕𝜕
𝜕𝜕𝑑𝑑𝑃𝑃0,1(𝑥𝑥, 𝑑𝑑) + �𝜆𝜆 + 𝜇𝜇1(𝑥𝑥)�𝑃𝑃0,1(𝑥𝑥, 𝑑𝑑) = 𝜆𝜆(1 − 𝑎𝑎1)𝑃𝑃0,1(𝑥𝑥, 𝑑𝑑) (4)
𝜕𝜕𝜕𝜕𝑥𝑥𝑃𝑃𝑛𝑛 ,2(𝑥𝑥, 𝑑𝑑) + 𝜕𝜕
𝜕𝜕𝑑𝑑𝑃𝑃𝑛𝑛 ,2(𝑥𝑥, 𝑑𝑑) + �𝜆𝜆 + 𝜇𝜇2(𝑥𝑥)�𝑃𝑃𝑛𝑛 ,2(𝑥𝑥, 𝑑𝑑) = 𝜆𝜆𝑎𝑎1 ∑ 𝜋𝜋𝑘𝑘𝑃𝑃𝑛𝑛−𝑘𝑘 ,2(𝑥𝑥, 𝑑𝑑)𝑛𝑛
𝑘𝑘=1 + 𝜆𝜆(1 − 𝑎𝑎1)𝑃𝑃𝑛𝑛 ,2(𝑥𝑥, 𝑑𝑑) (5) 𝜕𝜕𝜕𝜕𝑥𝑥𝑃𝑃0,2(𝑥𝑥, 𝑑𝑑) + 𝜕𝜕
𝜕𝜕𝑑𝑑𝑃𝑃0,2(𝑥𝑥, 𝑑𝑑) + �𝜆𝜆 + 𝜇𝜇2(𝑥𝑥)�𝑃𝑃0,2(𝑥𝑥, 𝑑𝑑) = 𝜆𝜆(1 − 𝑎𝑎1)𝑃𝑃0,2(𝑥𝑥, 𝑑𝑑) (6)
𝜕𝜕𝜕𝜕𝑥𝑥𝑃𝑃𝑛𝑛 ,3(𝑥𝑥, 𝑑𝑑) + 𝜕𝜕
𝜕𝜕𝑑𝑑𝑃𝑃𝑛𝑛 ,3(𝑥𝑥, 𝑑𝑑) + �𝜆𝜆 + 𝜇𝜇3(𝑥𝑥)�𝑃𝑃𝑛𝑛 ,3(𝑥𝑥, 𝑑𝑑) = 𝜆𝜆𝑎𝑎1 ∑ 𝜋𝜋𝑘𝑘𝑃𝑃𝑛𝑛−𝑘𝑘 ,3(𝑥𝑥, 𝑑𝑑)𝑛𝑛
𝑘𝑘=1 + 𝜆𝜆(1 − 𝑎𝑎1)𝑃𝑃𝑛𝑛 ,3(𝑥𝑥, 𝑑𝑑) (7) 𝜕𝜕𝜕𝜕𝑥𝑥𝑃𝑃0,3(𝑥𝑥, 𝑑𝑑) + 𝜕𝜕
𝜕𝜕𝑑𝑑𝑃𝑃0,3(𝑥𝑥, 𝑑𝑑) + �𝜆𝜆 + 𝜇𝜇3(𝑥𝑥)�𝑃𝑃0,3(𝑥𝑥, 𝑑𝑑) = 𝜆𝜆(1 − 𝑎𝑎1)𝑃𝑃0,3(𝑥𝑥, 𝑑𝑑) (8)
𝑑𝑑𝑑𝑑𝑑𝑑𝑉𝑉𝑛𝑛(𝑑𝑑) + (𝜆𝜆 + 𝛼𝛼)𝑉𝑉𝑛𝑛(𝑑𝑑) = 𝜆𝜆𝑎𝑎2 ∑ 𝜋𝜋𝑘𝑘𝑉𝑉𝑛𝑛−𝑘𝑘(𝑑𝑑)𝑛𝑛
𝑘𝑘=1 + 𝜆𝜆(1 − 𝑎𝑎2)𝑉𝑉𝑛𝑛(𝑑𝑑) + ∫ 𝑃𝑃𝑛𝑛 ,3(𝑥𝑥, 𝑑𝑑)𝜇𝜇3(𝑥𝑥)𝑑𝑑𝑥𝑥∞0 (9)
𝑑𝑑𝑑𝑑𝑑𝑑𝑉𝑉0(𝑑𝑑) + (𝜆𝜆 + 𝛼𝛼)𝑉𝑉0(𝑑𝑑) = 𝜆𝜆(1 − 𝑎𝑎2)𝑉𝑉0(𝑑𝑑) + ∫ 𝑃𝑃0,3(𝑥𝑥, 𝑑𝑑)𝜇𝜇3(𝑥𝑥)𝑑𝑑𝑥𝑥∞
0 (10)

International Journal of Scientific and Research Publications, Volume 7, Issue 4, April 2017 302 ISSN 2250-3153
www.ijsrp.org
𝑑𝑑𝑑𝑑𝑑𝑑𝑄𝑄(𝑑𝑑) + 𝜆𝜆𝑄𝑄(𝑑𝑑) = 𝛼𝛼𝑉𝑉0(𝑑𝑑) + 𝜆𝜆(1 − 𝑎𝑎1)𝑄𝑄(𝑑𝑑) (11)
Equations (5) – (11) are to be solved subject to the following boundary conditions: 𝑃𝑃𝑛𝑛 ,1(0, 𝑑𝑑) = 𝛼𝛼𝑉𝑉𝑛𝑛+𝑀𝑀(𝑑𝑑) (12) 𝑃𝑃0,1(0, 𝑑𝑑) = 𝛼𝛼∑ 𝑉𝑉𝑏𝑏(𝑑𝑑)𝑀𝑀
𝑏𝑏=1 + 𝜆𝜆𝑎𝑎1𝑄𝑄(𝑑𝑑) (13) 𝑃𝑃𝑛𝑛 ,2(0, 𝑑𝑑) = ∫ 𝑃𝑃𝑛𝑛 ,1(𝑥𝑥, 𝑑𝑑)𝜇𝜇1(𝑥𝑥)𝑑𝑑𝑥𝑥∞
0 (14)
𝑃𝑃𝑛𝑛 ,3(0, 𝑑𝑑) = ∫ 𝑃𝑃𝑛𝑛 ,2(𝑥𝑥, 𝑑𝑑)𝜇𝜇2(𝑥𝑥)𝑑𝑑𝑥𝑥∞0 (15)
We assume that initially the server is available but idle because of less than 𝑀𝑀 customers so that the initial conditions are 𝑉𝑉𝑛𝑛(0) = 0; 𝑉𝑉0(0) = 0; 𝑄𝑄(0) = 1 𝑃𝑃𝑛𝑛 ,𝑗𝑗 (0) = 0, for 𝑛𝑛 = 0,1,2, … and 𝑗𝑗 = 1,2,3. (16)
V. PROBABILITY GENERATING FUNCTION OF THE QUEUE SIZE:THE TIME DEPENDENT SOLUTION We define the following probability generating functions:
�
𝑃𝑃𝑗𝑗 (𝑥𝑥, 𝑧𝑧, 𝑑𝑑) = ∑ 𝑃𝑃𝑛𝑛 ,𝑗𝑗 (𝑥𝑥, 𝑑𝑑)𝑧𝑧𝑛𝑛∞𝑛𝑛=0 , 𝑗𝑗 = 1,2,3
𝑃𝑃𝑗𝑗 (𝑧𝑧, 𝑑𝑑) = ∑ 𝑃𝑃𝑛𝑛 ,𝑗𝑗 (𝑑𝑑)𝑧𝑧𝑛𝑛∞𝑛𝑛=0 , 𝑗𝑗 = 1,2,3
𝑉𝑉(𝑧𝑧, 𝑑𝑑) = ∑ 𝑉𝑉𝑛𝑛(𝑑𝑑)𝑧𝑧𝑛𝑛∞𝑛𝑛=0
𝜋𝜋(𝑧𝑧) = ∑ 𝜋𝜋𝑛𝑛𝑧𝑧𝑛𝑛∞𝑛𝑛=1 ⎭
⎪⎬
⎪⎫
(17)
Define the Laplace-Stieltjes Transform of a function 𝑓𝑓(𝑑𝑑) as follows: 𝑓𝑓(𝑠𝑠) = 𝐿𝐿{𝑓𝑓(𝑑𝑑)} = ∫ 𝑒𝑒−𝑠𝑠𝑑𝑑𝑓𝑓(𝑑𝑑)𝑑𝑑𝑑𝑑∞
0 (18) Taking Laplace Transform of equations (3) – (15) and using (16), we get, 𝜕𝜕𝜕𝜕𝑥𝑥𝑃𝑃�𝑛𝑛 ,1(𝑥𝑥, 𝑠𝑠) + �𝑠𝑠 + 𝜆𝜆 + 𝜇𝜇1(𝑥𝑥)�𝑃𝑃�𝑛𝑛 ,1(𝑥𝑥, 𝑠𝑠) = 𝜆𝜆𝑎𝑎1 ∑ 𝜋𝜋𝑘𝑘𝑃𝑃�𝑛𝑛−𝑘𝑘 ,1(𝑥𝑥, 𝑠𝑠)𝑛𝑛
𝑘𝑘=1 + 𝜆𝜆(1 − 𝑎𝑎1)𝑃𝑃�𝑛𝑛 ,1(𝑥𝑥, 𝑠𝑠) (19) 𝜕𝜕𝜕𝜕𝑥𝑥𝑃𝑃�0,1(𝑥𝑥, 𝑠𝑠) + �𝑠𝑠 + 𝜆𝜆 + 𝜇𝜇1(𝑥𝑥)�𝑃𝑃�0,1(𝑥𝑥, 𝑠𝑠) = 𝜆𝜆(1 − 𝑎𝑎1)𝑃𝑃�0,1(𝑥𝑥, 𝑠𝑠) (20)
𝜕𝜕𝜕𝜕𝑥𝑥𝑃𝑃�𝑛𝑛 ,2(𝑥𝑥, 𝑠𝑠) + �𝑠𝑠 + 𝜆𝜆 + 𝜇𝜇2(𝑥𝑥)�𝑃𝑃�𝑛𝑛 ,2(𝑥𝑥, 𝑠𝑠) = 𝜆𝜆𝑎𝑎1 ∑ 𝜋𝜋𝑘𝑘𝑃𝑃�𝑛𝑛−𝑘𝑘 ,2(𝑥𝑥, 𝑠𝑠)𝑛𝑛
𝑘𝑘=1 + 𝜆𝜆(1 − 𝑎𝑎1)𝑃𝑃�𝑛𝑛 ,2(𝑥𝑥, 𝑠𝑠) (21) 𝜕𝜕𝜕𝜕𝑥𝑥𝑃𝑃�0,2(𝑥𝑥, 𝑠𝑠) + �𝑠𝑠 + 𝜆𝜆 + 𝜇𝜇2(𝑥𝑥)�𝑃𝑃�0,2(𝑥𝑥, 𝑠𝑠) = 𝜆𝜆(1 − 𝑎𝑎1)𝑃𝑃�0,2(𝑥𝑥, 𝑠𝑠) (22)
𝜕𝜕𝜕𝜕𝑥𝑥𝑃𝑃�𝑛𝑛 ,3(𝑥𝑥, 𝑠𝑠) + �𝑠𝑠 + 𝜆𝜆 + 𝜇𝜇3(𝑥𝑥)�𝑃𝑃�𝑛𝑛 ,3(𝑥𝑥, 𝑠𝑠) = 𝜆𝜆𝑎𝑎1 ∑ 𝜋𝜋𝑘𝑘𝑃𝑃�𝑛𝑛−𝑘𝑘 ,3(𝑥𝑥, 𝑠𝑠)𝑛𝑛
𝑘𝑘=1 + 𝜆𝜆(1 − 𝑎𝑎1)𝑃𝑃�𝑛𝑛 ,3(𝑥𝑥, 𝑠𝑠) (23) 𝜕𝜕𝜕𝜕𝑥𝑥𝑃𝑃�0,3(𝑥𝑥, 𝑠𝑠) + �𝑠𝑠 + 𝜆𝜆 + 𝜇𝜇3(𝑥𝑥)�𝑃𝑃�0,3(𝑥𝑥, 𝑠𝑠) = 𝜆𝜆(1 − 𝑎𝑎1)𝑃𝑃�0,3(𝑥𝑥, 𝑠𝑠) (24)
(𝑠𝑠 + 𝜆𝜆 + 𝛼𝛼)𝑉𝑉�𝑛𝑛(𝑠𝑠) = 𝜆𝜆𝑎𝑎2 ∑ 𝜋𝜋𝑘𝑘𝑉𝑉�𝑛𝑛−𝑘𝑘(𝑠𝑠)𝑛𝑛𝑘𝑘=1 + 𝜆𝜆(1 − 𝑎𝑎2)𝑉𝑉�𝑛𝑛(𝑠𝑠) + ∫ 𝑃𝑃�𝑛𝑛 ,3(𝑥𝑥, 𝑠𝑠)𝜇𝜇3(𝑥𝑥)𝑑𝑑𝑥𝑥∞
0 (25) (𝑠𝑠 + 𝜆𝜆 + 𝛼𝛼)𝑉𝑉�0(𝑠𝑠) = 𝜆𝜆(1 − 𝑎𝑎2)𝑉𝑉�0(𝑠𝑠) + ∫ 𝑃𝑃�0,3(𝑥𝑥, 𝑠𝑠)𝜇𝜇3(𝑥𝑥)𝑑𝑑𝑥𝑥∞
0 (26) (𝑠𝑠 + 𝜆𝜆)𝑄𝑄�(𝑠𝑠) = 1 + 𝛼𝛼𝑉𝑉�0(𝑠𝑠) + 𝜆𝜆(1 − 𝑎𝑎1)𝑄𝑄�(𝑠𝑠) (27) 𝑃𝑃�𝑛𝑛 ,1(0, 𝑠𝑠) = 𝛼𝛼𝑉𝑉�𝑛𝑛+𝑀𝑀(𝑠𝑠) (28) 𝑃𝑃�0,1(0, 𝑠𝑠) = 𝛼𝛼∑ 𝑉𝑉�𝑏𝑏(𝑠𝑠)𝑀𝑀
𝑏𝑏=1 + 𝜆𝜆𝑎𝑎1𝑄𝑄�(𝑠𝑠) (29) 𝑃𝑃�𝑛𝑛 ,2(0, 𝑠𝑠) = ∫ 𝑃𝑃�𝑛𝑛 ,1(𝑥𝑥, 𝑠𝑠)∞
0 𝜇𝜇1(𝑥𝑥)𝑑𝑑𝑥𝑥 (30)
𝑃𝑃�𝑛𝑛 ,3(0, 𝑠𝑠) = ∫ 𝑃𝑃�𝑛𝑛 ,2(𝑥𝑥, 𝑠𝑠)∞0 𝜇𝜇2(𝑥𝑥)𝑑𝑑𝑥𝑥 (31)
Multiplying the equation (19) by 𝑧𝑧𝑛𝑛 and summing over 𝑛𝑛 from 1 to ∞, adding equation (20) and using the generating functions defined in (17), we obtain, 𝜕𝜕𝜕𝜕𝑥𝑥𝑃𝑃�1(𝑥𝑥, 𝑧𝑧, 𝑠𝑠) + �𝑠𝑠 + 𝜆𝜆𝑎𝑎1�1 − 𝜋𝜋(𝑧𝑧)� + 𝜇𝜇1(𝑥𝑥)�𝑃𝑃�1(𝑥𝑥, 𝑧𝑧, 𝑠𝑠) = 0 (32)
Performing similar operations on equations (21) – (26), we obtain, 𝜕𝜕𝜕𝜕𝑥𝑥𝑃𝑃�2(𝑥𝑥, 𝑧𝑧, 𝑠𝑠) + �𝑠𝑠 + 𝜆𝜆𝑎𝑎1�1 − 𝜋𝜋(𝑧𝑧)� + 𝜇𝜇2(𝑥𝑥)�𝑃𝑃�2(𝑥𝑥, 𝑧𝑧, 𝑠𝑠) = 0 (33)

International Journal of Scientific and Research Publications, Volume 7, Issue 4, April 2017 303 ISSN 2250-3153
www.ijsrp.org
𝜕𝜕𝜕𝜕𝑥𝑥𝑃𝑃�3(𝑥𝑥, 𝑧𝑧, 𝑠𝑠) + �𝑠𝑠 + 𝜆𝜆𝑎𝑎1�1 − 𝜋𝜋(𝑧𝑧)� + 𝜇𝜇3(𝑥𝑥)�𝑃𝑃�3(𝑥𝑥, 𝑧𝑧, 𝑠𝑠) = 0 (34)
�𝑠𝑠 + 𝜆𝜆𝑎𝑎2�1 − 𝜋𝜋(𝑧𝑧)� + 𝛼𝛼�𝑉𝑉�(𝑧𝑧, 𝑠𝑠) = ∫ 𝑃𝑃�3(𝑥𝑥, 𝑧𝑧, 𝑠𝑠)𝜇𝜇3(𝑥𝑥)𝑑𝑑𝑥𝑥∞0 (35)
Multiplying the equation (28) by 𝑧𝑧𝑛𝑛+𝑀𝑀 and summing over 𝑛𝑛 from 1 to ∞ and adding, multiplying the equation (29) by 𝑧𝑧𝑀𝑀, and using the generating functions defined in (17) and using (27), we obtain, 𝑃𝑃�1(0, 𝑧𝑧, 𝑠𝑠) = 𝑧𝑧−𝑀𝑀𝛼𝛼 𝑉𝑉�(𝑧𝑧, 𝑠𝑠) + 𝛼𝛼∑ (1 − 𝑧𝑧−𝑀𝑀+𝑏𝑏)𝑉𝑉�𝑏𝑏(𝑠𝑠)𝑀𝑀−1
𝑏𝑏=1 + [𝜆𝜆𝑎𝑎1 − (𝑠𝑠 + 𝜆𝜆)𝑎𝑎1𝑧𝑧−𝑀𝑀]𝑄𝑄�(𝑠𝑠) + 𝑧𝑧−𝑀𝑀 (36) Multiplying the equation (30) by 𝑧𝑧𝑛𝑛 and summing over 𝑛𝑛 from 0 to ∞ and using the generating functions defined in (17), we obtain, 𝑃𝑃�2(0, 𝑧𝑧, 𝑠𝑠) = ∫ 𝑃𝑃�1(𝑥𝑥, 𝑧𝑧, 𝑠𝑠)𝜇𝜇1(𝑥𝑥)𝑑𝑑𝑥𝑥∞
0 (37) Performing similar operations on equation (31), we obtain, 𝑃𝑃�3(0, 𝑧𝑧, 𝑠𝑠) = ∫ 𝑃𝑃�2(𝑥𝑥, 𝑧𝑧, 𝑠𝑠)𝜇𝜇2(𝑥𝑥)𝑑𝑑𝑥𝑥∞
0 (38) We now integrate equations (32) - (34) between the limits 0 and 𝑥𝑥 and obtain,
𝑃𝑃�1(𝑥𝑥, 𝑧𝑧, 𝑠𝑠) = 𝑃𝑃�1(0, 𝑧𝑧, 𝑠𝑠)𝑒𝑒−𝑅𝑅𝑥𝑥−∫ 𝜇𝜇1(𝑥𝑥)𝑑𝑑𝑥𝑥𝑥𝑥0 (39)
𝑃𝑃�2(𝑥𝑥, 𝑧𝑧, 𝑠𝑠) = 𝑃𝑃�2(0, 𝑧𝑧, 𝑠𝑠)𝑒𝑒−𝑅𝑅𝑥𝑥−∫ 𝜇𝜇2(𝑥𝑥)𝑑𝑑𝑥𝑥𝑥𝑥0 (40)
𝑃𝑃�3(𝑥𝑥, 𝑧𝑧, 𝑠𝑠) = 𝑃𝑃�3(0, 𝑧𝑧, 𝑠𝑠)𝑒𝑒−𝑅𝑅𝑥𝑥−∫ 𝜇𝜇3(𝑥𝑥)𝑑𝑑𝑥𝑥𝑥𝑥0 (41)
Where 𝑅𝑅 = 𝑠𝑠 + 𝜆𝜆𝑎𝑎1�1 − 𝜋𝜋(𝑧𝑧)� Integrating equations (39) - (41) by parts, with respect to 𝑥𝑥, we get,
𝑃𝑃�1(𝑧𝑧, 𝑠𝑠) = 𝑃𝑃�1(0, 𝑧𝑧, 𝑠𝑠) �1−��𝐺1(𝑅𝑅)𝑅𝑅
� (42)
𝑃𝑃�2(𝑧𝑧, 𝑠𝑠) = 𝑃𝑃�2(0, 𝑧𝑧, 𝑠𝑠) �1−��𝐺2(𝑅𝑅)𝑅𝑅
� (43)
𝑃𝑃�3(𝑧𝑧, 𝑠𝑠) = 𝑃𝑃�3(0, 𝑧𝑧, 𝑠𝑠) �1−��𝐺3(𝑅𝑅)𝑅𝑅
� (44) Where ��𝐺𝑗𝑗 (𝑅𝑅) = ∫ 𝑒𝑒−𝑅𝑅 𝑥𝑥𝑑𝑑𝐺𝐺𝑗𝑗 (𝑥𝑥)∞
0 , is the Laplace Transform of 𝑗𝑗𝑑𝑑ℎ type of service, 𝑗𝑗 = 1,2,3. Multiplying the equations (39), (40) and (41) by 𝜇𝜇1(𝑥𝑥), 𝜇𝜇2(𝑥𝑥)and 𝛼𝛼(𝑥𝑥) integrating by parts, with respect to 𝑥𝑥, we get, ∫ 𝑃𝑃�1(𝑥𝑥, 𝑧𝑧, 𝑠𝑠)𝜇𝜇1(𝑥𝑥)𝑑𝑑𝑥𝑥∞
0 = 𝑃𝑃�1(0, 𝑧𝑧, 𝑠𝑠)��𝐺1(𝑅𝑅) (45)
∫ 𝑃𝑃�2(𝑥𝑥, 𝑧𝑧, 𝑠𝑠)𝜇𝜇2(𝑥𝑥)𝑑𝑑𝑥𝑥∞0 = 𝑃𝑃�2(0, 𝑧𝑧, 𝑠𝑠)��𝐺2(𝑅𝑅) (46)
∫ 𝑃𝑃�3(𝑥𝑥, 𝑧𝑧, 𝑠𝑠)𝜇𝜇3(𝑥𝑥)𝑑𝑑𝑥𝑥∞0 = 𝑃𝑃�3(0, 𝑧𝑧, 𝑠𝑠)��𝐺3(𝑅𝑅) (47)
Substituting (45) in (37) we get, 𝑃𝑃�2(0, 𝑧𝑧, 𝑠𝑠) = 𝑃𝑃�1(0, 𝑧𝑧, 𝑠𝑠)��𝐺1(𝑅𝑅) (48) Substituting (36) in (48) we get, 𝑃𝑃�2(0, 𝑧𝑧, 𝑠𝑠) = [𝑧𝑧−𝑀𝑀𝛼𝛼 𝑉𝑉�(𝑧𝑧, 𝑠𝑠) + 𝛼𝛼∑ (1 − 𝑧𝑧−𝑀𝑀+𝑏𝑏)𝑉𝑉�𝑏𝑏(𝑠𝑠)𝑀𝑀−1
𝑏𝑏=1 + [𝜆𝜆𝑎𝑎1 − (𝑠𝑠 + 𝜆𝜆)𝑎𝑎1𝑧𝑧−𝑀𝑀]𝑄𝑄�(𝑠𝑠) + 𝑧𝑧−𝑀𝑀]��𝐺1(𝑅𝑅) (49) Substituting (46) in (38) we get, 𝑃𝑃�3(0, 𝑧𝑧, 𝑠𝑠) = 𝑃𝑃�2(0, 𝑧𝑧, 𝑠𝑠)��𝐺2(𝑅𝑅) (50) Substituting (49) in (50) we get, 𝑃𝑃�3(0, 𝑧𝑧, 𝑠𝑠) = [𝑧𝑧−𝑀𝑀𝛼𝛼 𝑉𝑉�(𝑧𝑧, 𝑠𝑠) + 𝛼𝛼∑ (1 − 𝑧𝑧−𝑀𝑀+𝑏𝑏)𝑉𝑉�𝑏𝑏(𝑠𝑠)𝑀𝑀−1
𝑏𝑏=1 + [𝜆𝜆𝑎𝑎1 − (𝑠𝑠 + 𝜆𝜆)𝑎𝑎1𝑧𝑧−𝑀𝑀]𝑄𝑄�(𝑠𝑠) + 𝑧𝑧−𝑀𝑀]��𝐺1(𝑅𝑅)��𝐺2(𝑅𝑅) (51) Substituting (36), (49) and (50) in (42), (43) and (44) respectively, we get,
𝑃𝑃�1(𝑧𝑧, 𝑠𝑠) = [𝑧𝑧−𝑀𝑀𝛼𝛼 𝑉𝑉�(𝑧𝑧, 𝑠𝑠) + 𝛼𝛼∑ (1 − 𝑧𝑧−𝑀𝑀+𝑏𝑏)𝑉𝑉�𝑏𝑏(𝑠𝑠)𝑀𝑀−1𝑏𝑏=1 + [𝜆𝜆𝑎𝑎1 − (𝑠𝑠 + 𝜆𝜆)𝑎𝑎1𝑧𝑧−𝑀𝑀]𝑄𝑄�(𝑠𝑠) + 𝑧𝑧−𝑀𝑀] �1−��𝐺1(𝑅𝑅)
𝑅𝑅� (52)
𝑃𝑃�2(𝑧𝑧, 𝑠𝑠) = [{𝑧𝑧−𝑀𝑀𝛼𝛼 𝑉𝑉�(𝑧𝑧, 𝑠𝑠) + 𝛼𝛼∑ (1 − 𝑧𝑧−𝑀𝑀+𝑏𝑏)𝑉𝑉�𝑏𝑏(𝑠𝑠)𝑀𝑀−1𝑏𝑏=1 + [𝜆𝜆𝑎𝑎1 − (𝑠𝑠 + 𝜆𝜆)𝑎𝑎1𝑧𝑧−𝑀𝑀]𝑄𝑄�(𝑠𝑠) + 𝑧𝑧−𝑀𝑀}��𝐺1(𝑅𝑅)] �1−��𝐺2(𝑅𝑅)
𝑅𝑅� (53)
𝑃𝑃�3(𝑧𝑧, 𝑠𝑠) = [{𝑧𝑧−𝑀𝑀𝛼𝛼 𝑉𝑉�(𝑧𝑧, 𝑠𝑠) + 𝛼𝛼∑ (1 − 𝑧𝑧−𝑀𝑀+𝑏𝑏)𝑉𝑉�𝑏𝑏(𝑠𝑠)𝑀𝑀−1𝑏𝑏=1 + [𝜆𝜆𝑎𝑎1 − (𝑠𝑠 + 𝜆𝜆)𝑎𝑎1𝑧𝑧−𝑀𝑀]𝑄𝑄�(𝑠𝑠) + 𝑧𝑧−𝑀𝑀}��𝐺1(𝑅𝑅)��𝐺2(𝑅𝑅)] �1−��𝐺3(𝑅𝑅)
𝑅𝑅�(54)
Substituting (47) in (35) and using (51), we get,

International Journal of Scientific and Research Publications, Volume 7, Issue 4, April 2017 304 ISSN 2250-3153
www.ijsrp.org
𝑉𝑉�(𝑧𝑧, 𝑠𝑠) = {𝛼𝛼 ∑ �1−𝑧𝑧−𝑀𝑀+𝑏𝑏�𝑉𝑉�𝑏𝑏 (𝑠𝑠)𝑀𝑀−1𝑏𝑏=1 +�𝜆𝜆−(𝑠𝑠+𝜆𝜆)𝑧𝑧−𝑀𝑀�𝑄𝑄�(𝑠𝑠)+𝑧𝑧−𝑀𝑀 }��𝐺1(𝑅𝑅)��𝐺2(𝑅𝑅)��𝐺3(𝑅𝑅)
�𝑠𝑠+𝜆𝜆𝑎𝑎2�1−𝜋𝜋(𝑧𝑧)��+𝛼𝛼−𝑧𝑧−𝑀𝑀𝛼𝛼��𝐺1(𝑅𝑅)��𝐺2(𝑅𝑅)��𝐺3(𝑅𝑅) (55)
We note that there are 𝑀𝑀 unknowns, 𝑄𝑄�(𝑠𝑠)and 𝑉𝑉�𝑏𝑏(𝑠𝑠), 𝑏𝑏 = 1,2, … ,𝑀𝑀 − 1 appearing in equation (55). Now, (55) gives the probability generating function of the service system with 𝑀𝑀 unknowns. By Rouche’s theorem of complex variables, it can be proved that �𝑠𝑠 + 𝜆𝜆𝑎𝑎2�1 − 𝜋𝜋(𝑧𝑧)�� + 𝛼𝛼 − 𝑧𝑧−𝑀𝑀𝛼𝛼��𝐺1(𝑅𝑅)��𝐺2(𝑅𝑅)��𝐺3(𝑅𝑅) has 𝑀𝑀 zeroes inside the contour |𝑧𝑧| = 1. Since 𝑃𝑃�1(𝑧𝑧, 𝑠𝑠), ,𝑃𝑃�2(𝑧𝑧, 𝑠𝑠),𝑃𝑃�3(𝑧𝑧, 𝑠𝑠) and 𝑉𝑉�(𝑧𝑧, 𝑠𝑠) are analytic inside the unit circle |𝑧𝑧| = 1, the numerator in the right hand side of equations(55) must vanish at these points, which gives rise to a set of 𝑀𝑀 linear equations which are sufficient to determine 𝑀𝑀unknowns.
VI. THE STEADY STATE RESULTS To define the steady state probabilities and corresponding generating functions, we drop the argument 𝑑𝑑, and for that matter the argument 𝑠𝑠 wherever it appears in the time-dependent analysis up to this point. Then the corresponding steady state results can be obtained by using the well-known Tauberian Property lim𝑠𝑠→0 𝑠𝑠𝑓𝑓(𝑠𝑠) = lim𝑑𝑑→∞ 𝑓𝑓(𝑑𝑑) (56) if the limit on the right exists. Now (52), (53), (54) and (55) we have,
𝑃𝑃1(𝑧𝑧) = {𝛼𝛼𝑧𝑧−𝑀𝑀𝑉𝑉(𝑧𝑧) + 𝛼𝛼𝑧𝑧−𝑀𝑀𝑈𝑈 + 𝜆𝜆𝑎𝑎1(1 − 𝑧𝑧−𝑀𝑀)𝑄𝑄} �1−��𝐺1�𝑓𝑓(𝑧𝑧)�𝑓𝑓(𝑧𝑧)
� (57)
𝑃𝑃2(𝑧𝑧) = {𝛼𝛼𝑧𝑧−𝑀𝑀𝑉𝑉(𝑧𝑧) + 𝛼𝛼𝑧𝑧−𝑀𝑀𝑈𝑈 + 𝜆𝜆𝑎𝑎1(1 − 𝑧𝑧−𝑀𝑀)𝑄𝑄}��𝐺1�𝑓𝑓(𝑧𝑧)� �1−��𝐺2�𝑓𝑓(𝑧𝑧)�𝑓𝑓(𝑧𝑧)
� (58)
𝑃𝑃3(𝑧𝑧) = {𝛼𝛼𝑧𝑧−𝑀𝑀𝑉𝑉(𝑧𝑧) + 𝛼𝛼𝑧𝑧−𝑀𝑀𝑈𝑈 + 𝜆𝜆𝑎𝑎1(1 − 𝑧𝑧−𝑀𝑀)𝑄𝑄}��𝐺1�𝑓𝑓(𝑧𝑧)���𝐺2�𝑓𝑓(𝑧𝑧)� �1−��𝐺3�𝑓𝑓(𝑧𝑧)�𝑓𝑓(𝑧𝑧)
� (59)
𝑉𝑉(𝑧𝑧) = �𝛼𝛼𝑈𝑈+𝜆𝜆�𝑧𝑧𝑀𝑀−1�𝑄𝑄���𝐺1�𝑓𝑓(𝑧𝑧)���𝐺2�𝑓𝑓(𝑧𝑧)���𝐺3�𝑓𝑓(𝑧𝑧)�𝑧𝑧𝑀𝑀𝑓𝑓1(𝑧𝑧)+𝑧𝑧𝑀𝑀𝛼𝛼−𝛼𝛼��𝐺1�𝑓𝑓(𝑧𝑧)���𝐺2�𝑓𝑓(𝑧𝑧)���𝐺3�𝑓𝑓(𝑧𝑧)�
(60)
The 𝑀𝑀 unknowns, 𝑄𝑄 and 𝑉𝑉𝑏𝑏 , 𝑏𝑏 = 1,2, … ,𝑀𝑀 − 1can be determined as before. Where 𝑓𝑓(𝑧𝑧) = 𝜆𝜆𝑎𝑎1�1 − 𝜋𝜋(𝑧𝑧)�; 𝑓𝑓1(𝑧𝑧) = 𝜆𝜆𝑎𝑎2�1 − 𝜋𝜋(𝑧𝑧)� and 𝑈𝑈 = ∑ (𝑧𝑧𝑀𝑀 − 𝑧𝑧𝑏𝑏)𝑉𝑉𝑏𝑏𝑀𝑀−1
𝑏𝑏=1 Let 𝐴𝐴𝑞𝑞(𝑧𝑧) denote the probability generating function of the queue size irrespective of the state of the system. i. e. ,𝐴𝐴𝑞𝑞(𝑧𝑧) = 𝑃𝑃1(𝑧𝑧) + 𝑃𝑃2(𝑧𝑧) + 𝑃𝑃3(𝑧𝑧) + 𝑉𝑉(𝑧𝑧) (61) In order to find 𝑄𝑄, we use the normalization condition 𝐴𝐴𝑞𝑞(1) + 𝑄𝑄 = 1 (62)
Note that for 𝑧𝑧 = 1, 𝐴𝐴𝑞𝑞(1) is indeterminate of 00 form.
Therefore, we apply L’Hôpital’s Rule on (61), we get,
𝐴𝐴𝑞𝑞(1) = 𝐸𝐸∗[𝛼𝛼𝑈𝑈+𝜆𝜆𝑎𝑎1𝑀𝑀𝑄𝑄]𝑀𝑀𝛼𝛼−𝜆𝜆𝐸𝐸(𝐼𝐼){𝑎𝑎2+𝛼𝛼𝑎𝑎1𝐸𝐸1}
(63)
Where 𝐸𝐸∗ = 𝛼𝛼𝐸𝐸(𝑆𝑆1) + 𝛼𝛼𝐸𝐸(𝑆𝑆2) + 𝛼𝛼𝐸𝐸(𝑆𝑆3) + 1 and 𝐸𝐸1 = 𝐸𝐸(𝑆𝑆1) + 𝐸𝐸(𝑆𝑆2) + 𝐸𝐸(𝑆𝑆3) We used ��𝐺𝑗𝑗 (0) = 1, 𝑗𝑗 = 1,2,3, 𝑉𝑉�(0) = 1, 𝜋𝜋′(1) = 𝐸𝐸(𝐼𝐼), where 𝐼𝐼 denotes the number of customers in an arriving batch and therefore, 𝐸𝐸(𝐼𝐼) is the mean of the batch size of the arriving customers. Similarly 𝐸𝐸(𝑆𝑆1), 𝐸𝐸(𝑆𝑆2),𝐸𝐸(𝑆𝑆3) are the mean service times of type 1, type 2, type 3 services, respectively. Therefore, adding 𝑄𝑄 to equation (63) and equating to 1 and simplifying we get,
𝑄𝑄 = 1 − 𝐸𝐸∗(𝑀𝑀𝜆𝜆+𝛼𝛼𝑈𝑈 )𝑀𝑀𝛼𝛼+𝜆𝜆𝑎𝑎1𝑀𝑀𝐸𝐸∗−𝜆𝜆𝐸𝐸(𝐼𝐼)[𝛼𝛼𝑎𝑎1𝐸𝐸1+𝑎𝑎2]
(64)
Equation (64) gives the probability that the server is idle.

International Journal of Scientific and Research Publications, Volume 7, Issue 4, April 2017 305 ISSN 2250-3153
www.ijsrp.org
From equation (64) the utilization factor, 𝜌𝜌 of the system is given by
𝜌𝜌 = 𝐸𝐸∗(𝑀𝑀𝜆𝜆+𝛼𝛼𝑈𝑈 )𝑀𝑀𝛼𝛼+𝜆𝜆𝑎𝑎1𝑀𝑀𝐸𝐸∗−𝜆𝜆𝐸𝐸(𝐼𝐼)[𝛼𝛼𝑎𝑎1𝐸𝐸1+𝑎𝑎2]
(65)
Where 𝜌𝜌 < 1 is the stability condition under which the steady state exists.
VII. THE AVERAGE QUEUE SIZE AND THE SYSTEM SIZE Let 𝐿𝐿𝑞𝑞denote the mean number of customers in the queue under the steady state.
Then 𝐿𝐿𝑞𝑞 = 𝑑𝑑𝑑𝑑𝑧𝑧�𝐴𝐴𝑞𝑞(𝑧𝑧)�
𝑧𝑧=1 (66)
Since the formula gives indeterminate form, then we write 𝐴𝐴𝑞𝑞(𝑧𝑧) as
𝐴𝐴𝑞𝑞(𝑧𝑧) =𝑁𝑁(𝑧𝑧)𝐷𝐷(𝑧𝑧) + 𝐶𝐶(𝑧𝑧)
Where 𝑁𝑁(𝑧𝑧) and 𝐷𝐷(𝑧𝑧) are the numerator and denominator of the first term and 𝐶𝐶(𝑧𝑧)is the second term of the right hand side of 𝐴𝐴𝑞𝑞(𝑧𝑧) respectively. Then using L’Hôpital’s Rule twice we obtain,
𝐿𝐿𝑞𝑞 = limz→1𝐷𝐷′ (𝑧𝑧)𝑁𝑁′′ (𝑧𝑧)−𝑁𝑁′ (𝑧𝑧)𝐷𝐷′′ (𝑧𝑧)
2�𝐷𝐷′ (𝑧𝑧)�2 + 𝑑𝑑𝑑𝑑𝑧𝑧�𝐶𝐶(𝑧𝑧)|𝑧𝑧=1 (67)
Where primes and double primes in (67) denote first and second derivatives at 𝑧𝑧 = 1, respectively. Carrying out the derivatives at 𝑧𝑧 = 1 we have, 𝑁𝑁′(1) = 𝐸𝐸∗[𝛼𝛼𝑈𝑈 + 𝜆𝜆𝑎𝑎1𝑀𝑀𝑄𝑄] (68) 𝐷𝐷′(1) = 𝛼𝛼𝑀𝑀 − 𝜆𝜆𝐸𝐸(𝐼𝐼)(𝑎𝑎2 + 𝛼𝛼𝑎𝑎1𝐸𝐸1) (69) 𝑁𝑁′′ (1) = [2𝜆𝜆𝑎𝑎1𝐸𝐸(𝐼𝐼)𝐸𝐸∗𝐸𝐸1 + 𝛼𝛼{𝜆𝜆𝑎𝑎1𝐸𝐸(𝐼𝐼)(𝐸𝐸∗∗ + 2𝐸𝐸1
∗) − 2𝑀𝑀𝐸𝐸1}][𝛼𝛼𝑈𝑈 + 𝜆𝜆𝑎𝑎1𝑀𝑀𝑄𝑄] + 𝑈𝑈∗𝐸𝐸∗ (70)
𝐷𝐷′′ (1) = 𝛼𝛼𝑀𝑀(𝑀𝑀 − 1) − 2𝜆𝜆𝑎𝑎2𝑀𝑀𝐸𝐸(𝐼𝐼) − 𝜆𝜆𝐸𝐸�𝐼𝐼(𝐼𝐼 − 1)�{𝑎𝑎2 + 𝛼𝛼𝑎𝑎1𝐸𝐸1} − 𝛼𝛼𝜆𝜆2𝑎𝑎12�𝐸𝐸(𝐼𝐼)�2{𝐸𝐸∗∗ + 2𝐸𝐸1
∗} (71) 𝑑𝑑𝑑𝑑𝑧𝑧�𝐶𝐶(𝑧𝑧)|𝑧𝑧=1 = 𝐸𝐸1(𝑀𝑀𝑎𝑎1𝜆𝜆𝑄𝑄 + 𝛼𝛼𝑈𝑈) (72)
Therefore, the mean number of customers in the queue is
𝐿𝐿𝑞𝑞 =
{𝛼𝛼𝑀𝑀−𝜆𝜆𝐸𝐸(𝐼𝐼)(𝑎𝑎2+𝛼𝛼𝑎𝑎1𝐸𝐸1)}��2𝜆𝜆𝑎𝑎1𝐸𝐸(𝐼𝐼)𝐸𝐸∗𝐸𝐸1
+𝛼𝛼�𝜆𝜆𝑎𝑎1𝐸𝐸(𝐼𝐼)(𝐸𝐸∗∗+2𝐸𝐸1∗)
−2𝑀𝑀𝐸𝐸1��
[𝛼𝛼𝑈𝑈+𝜆𝜆𝑎𝑎1𝑀𝑀𝑄𝑄]+𝑈𝑈∗𝐸𝐸∗�−𝐸𝐸∗[𝛼𝛼𝑈𝑈+𝜆𝜆𝑎𝑎1𝑀𝑀𝑄𝑄]�
𝛼𝛼𝑀𝑀(𝑀𝑀−1)−2𝜆𝜆𝑎𝑎2𝑀𝑀𝐸𝐸(𝐼𝐼)−𝜆𝜆𝐸𝐸�𝐼𝐼(𝐼𝐼−1)�{𝑎𝑎2+𝛼𝛼𝑎𝑎1𝐸𝐸1}
−𝛼𝛼𝜆𝜆2𝑎𝑎12�𝐸𝐸(𝐼𝐼)�2{𝐸𝐸∗∗+2𝐸𝐸1
∗}�
2{𝛼𝛼𝑀𝑀−𝜆𝜆𝐸𝐸(𝐼𝐼)(𝑎𝑎2+𝛼𝛼𝑎𝑎1𝐸𝐸1)}2 (73)
Where 𝐸𝐸1
∗ = 𝐸𝐸(𝑆𝑆1)𝐸𝐸(𝑆𝑆2) + 𝐸𝐸(𝑆𝑆2)𝐸𝐸(𝑆𝑆3) + 𝐸𝐸(𝑆𝑆3)𝐸𝐸(𝑆𝑆1), 𝐸𝐸∗∗ = 𝐸𝐸(𝑆𝑆1
2) + 𝐸𝐸(𝑆𝑆22) + 𝐸𝐸(𝑆𝑆3
2)and𝑈𝑈∗ = 𝛼𝛼∑ {𝑀𝑀(𝑀𝑀 − 1) − 𝑏𝑏(𝑏𝑏 − 1)}𝑉𝑉𝑏𝑏 + 𝜆𝜆𝑎𝑎1𝑀𝑀(𝑀𝑀 − 1)𝑀𝑀−1𝑏𝑏=1 𝑄𝑄
Also, where 𝐸𝐸�𝐼𝐼(𝐼𝐼 − 1)� is the second factorial moment of the batch size of the arriving customers. Similarly,𝐸𝐸(𝑆𝑆1
2),𝐸𝐸(𝑆𝑆22)and 𝐸𝐸(𝑆𝑆3
2) are the second moments of the service times of type 1, type 2 and type 3 services, respectively. 𝑄𝑄 has been obtained in (64). Further, the average number of customers in the system can be found as 𝐿𝐿𝑠𝑠 = 𝐿𝐿𝑞𝑞 + 𝜌𝜌 by using Little’s formula.
VIII. CONCLUSION The single server bulk queue with three stage heterogeneous, compulsory vacation and balking is discussed. The transient solution, steady state results, the average number of customers in the queue and the system are computed in this paper.
REFERENCES [1] G. Ayyappan, G and K. Sathiya, “M[X]/G/1 Feedback queue with three stage heterogeneous service and server vacations having restricted admissibility” Journal
of Computations and Modelling, 3 (2), 2013, pp. 203-225. [2] J. E. A. Bagyam, K. U. Chandrika and K. P. Rani, “Bulk Arrival Two Phase Retrial Queueing System with Impatient Customers, Orbital Search, Active
Breakdowns and Delayed Repair”, International Journal of Computer Applications, 73, 2013, pp. 13-17. [3] Charan Jeet Singh, Madhu Jain and Binay Kumar, “Analysis of 𝑀𝑀𝑋𝑋/𝐺𝐺 /1 queueing model with balking and vacation”, Int. J. Operational Research, Vol.19, No.2,
2014, 154-170. [4] M. L. Chaudhry and J. G. C. Templeton, A First Course in Bulk Queues, John Wiley and sons, New York, 1983.

International Journal of Scientific and Research Publications, Volume 7, Issue 4, April 2017 306 ISSN 2250-3153
www.ijsrp.org
[5] R. B. Cooper, Introduction to Queueing Theory, 2nd Edition, Elsevier, North Holland, New York, 1981. [6] Dequan Yue, Wuyi Yue, Zsolt Saffer and Xiaohong Chen, “Analysis of an M/M/1 queueing with impatient customers and a variant of multiple vacation policy,”
Journal of Industrial and Management Optimization, 10 (1), 2014, pp. 89-112. [7] B. T. Doshi, Queueing Systems with Vacations – a survey, Queueing Systems, 1, 1986, 29-66. [8] Gautam Choudhury and Paul Madhuchanda, “Analysis of a Two Phases Batch Arrival Queueing Model with Bernoulli Vacation Schedule”, Revista Investgacion
Operacional, 25, 2004, pp. 217-228. [9] D. Gross and C. M. Harris, The Fundamentals of Queueing Theory, 2nd edition, John Wiley and sons, New York, 1985. [10] R. Kalyanaraman and P. Nagarajan, “Bulk Arrival, Fixed Batch Service Queue with Unreliable Server and with Compulsory Vacation”, Indian Journal of Science
and Technology, Vol. 9(38), 2016, pp. 1-8. [11] K. C. Madan, An M/G/1 Queueing system with Compulsory Server Vacations, Trabajos De Investigacion Operativa, 7 (1), 1992, pp. 105-115. [12] Kailash C. Madan, Z. R. Ab-Rawi and Amjad D. Al-Nasser, “On MX/�G1
G2�/1/G(BS)/VS Vacation Queue with Two Types of General Heterogeneous Service”,
Journal of Applied Mathematics and Decision Sciences, 3, 2005, pp. 123-135. [13] J. Medhi, Stochastic Processes, 2nd edition, New Age International (P) Limited Publishers, India, 1994. [14] Monita Baruah, Kailash C. Madan and Tillal Eldabi, “Balking and re-service in a vacation queue with batch arrival and two types of heterogeneous service,”
Journal of Mathematics Research,4 (4), 2012, pp. 114-124. [15] K. Punniyamoorthy and S. Uma, “Analysis of Single Server Bulk Queue with Two Choices of Service with Compulsory Vacation, Balking and Re-service”, Int. J.
of Mathematical Sciences and Applications, Vol. 6, No. 2, 2016. pp. 731-742. [16] V. Thangaraj and S. Vanitha, “M/G/1 Queue with Two Stage Heterogeneous Service Compulsory Server Vacation and Random Breakdowns”, Int. J. Contemp.
Math. Sciences, 5, 2010, pp. 307-322. [17] N. Tian and Z. G. Zhang, Vacation Queueing Models: Theory and Applications, Springer, New York, 2006. [18] S. Uma and K. Punniyamoorthy, “Single Server Bulk Queue with Feedback, Two Choices of Service and Compulsory Vacation”, International Journal of
Mathematical Archive, 7(11), 2016, pp.1-8.
AUTHORS First Author :
Dr. S. Uma, M. Sc.. M. Phil., Ph.D., Associate Professor, Department of Mathematics, D. G. Govt. Arts College for Women, Mayiladuthurai-609001, Nagappattinam (Dt.),Tamil Nadu, India. Email: [email protected]
Second Author : Mr. P. Manikandan, M. Sc., M. Phil., Assistant Professor, Department of Mathematics, Anjalai Ammal-Mahalingam Engineering College, Kovilvenni-614403, Tiruvarur (Dt.),Tamil Nadu, India. Email: [email protected]
Correspondence Author :
Mr. P. Manikandan, M. Sc., M. Phil., Assistant Professor, Department of Mathematics, Anjalai Ammal-Mahalingam Engineering College, Kovilvenni-614403, Tiruvarur (Dt.),Tamil Nadu, India. Email: [email protected]

International Journal of Scientific and Research Publications, Volume 7, Issue 4, April 2017 307 ISSN 2250-3153
www.ijsrp.org
Study on the Spatial Pattern of Commercial Area, Based on the Energy Electrical Distribution Singgih Hartanto*, Soegiono Soetomo**, Broto Sunaryo**, Wisnu Pradoto**
*Post Graduate Student, Architecture and Urban Planning Departement, Diponegoro University, Semarang
Email: [email protected] **Urban and Regional Planning Departement,Diponegoro University
Abstract- Urban pattern describes the "pattern" and representing the spatial characteristic of the urban area. Whereas efficiency energy was one of the hottest topics related to spatial pattern. This paper presents a study about the correlation between urban pattern and distribution of electrical energy. The aim of this research is to find out the patterns of urban space that can provide efficiency in electrical energy distribution. The research method used quantitative positivist approach, while the data collection used Geographic Information System (GIS). As object of study is commercial area around Semarang city square. There are four steps analysis i.e. electric transient and analysis program to calculate losses value, nearest neighbor analysis to determine the spatial patterns, ordinary least square to determine the relationship among variables and hot spot analysis to determine the optimum distance of spatial pattern. Based on the analysis, the most suitable spatial pattern to create the most efficient in electrical distribution in commercial area was cluster. The maximum distance for each activity was 146 m for shopping complex, 165 m for trade and service area and 358 m for hotel and supermarket. In addition, to create efficiency in electrical distribution in commercial area, the proportion of business area must be higher than other areas. Then followed by shopping complex and for the last was hotel and supermarket. Keywords :Commercial area, electrical distribution, losses, spatial pattern, urban pattern
I. INTRODUCTION rban pattern describes a “pattern”, representing the spatial characteristic of the urban area at a certain time and also a “process”, indicating the spatial change over time [1]. Furthermore, Lu et al., [1] said that social, economic, or cultural aspect closely linked
to the forming of urban patter. Energy become a crucial topic in the urban pattern as relates to established factors (economic, social and cultural). It is known that
energy consumption spread globally and concentrated in urban areas, where more than 65%-80% of the energy absorbed by urban activities, and for developing countries, energy resources still depend on the fossil fuels [2] [3]. Wolpeand Reddy [4],also said that the transport sector, made up of passenger and commercial/industrial transport, dominatesurban energy consumption, arround 60–70% of total energy.
Term of planning in uban space planning in Indonesia only based on the needs of spaceallocation. Whereas, the other aspects such as energy consumption have not been integrated in the city planning, therefore the aspects of energy efficiency in the city scale are difficult to achieve.
Energy usage pattern and the potential for optimization vary depending on urban sectors and it demands modelling[5]. Thus at the highest level into domestic, commercial, industrial, and transport sector with a number of further subdivision possible within each sector to indicate specific activities and user types.
This diversity poses a significant problem for policy-relevant urban energy modelling. A few studies of this kind, illustrating both the range of applications and the often significant data requirements or technical expertise required to use each model.
Table 1.Review in the selection of urban energy modelling studies Citation Technique Notes
Lin and Feng (2003) [6] Non-linear programming Optimises layout of urban area, in part based on transport energy
Brownsword et al. (2005) [7]
Linear programming Identifies cost-effective energy or CO2 reduction targets for buildings
Parshall et al. (2009) [8] GIS-based inventory Uses emissions database to estimate urban energy consumption
Girardin et al. (2010) [9] GIS-based optimisation model Focuses on district heat and cooling in Geneva
Connolly et al. (2010) [10] Review of 37 studies Highlights different scales of energy integration models and
U

International Journal of Scientific and Research Publications, Volume 7, Issue 4, April 2017 308 ISSN 2250-3153
www.ijsrp.org
Citation Technique Notes
difficulty identifying an all-purpose `ideal' model.
Keirstead (2010) [11] Integrated modelling of urban energy systems
Bring together state-of-the-art optimisation and simulation models so that urban energy use at different stages of a city's design can be examined within a single platform.
It has been argued that more dense development is likely to result in more energy-efficient and sustainable cities [12]. However
Jenk dan Burgess [12], also said that compact city cant be done step by step and difficult to applied in developing countries. This is because the density in the cities in developing contries still being debated. However, very little is known about the precise magnitude of possible energy savings from more compact urban form.
Contemporary compact city approaches have become one form of achieving ‘sustainable urban development’, but that is not to say that they are coterminous with it [12]. Furthermore, there have been a number of attempts to define and clarify the concept of the compact city and its relationship to sustainable urban development, there remain questions over what should be the principal spatial point of reference in undertaking compaction [12].
Related to electrical energy efficiency, the main problem in the electrical energy is losses [13]. Furthermore, according to Ibrahim [13], losses in the system of electrical power is one of measured parameter to find out whereas the operation of power system efficient or not. The occurrence of losses also have an impact on the increase in energy consumption, that means will further increase CO2 emissi [14]. To obtain an efficient condition, the value of losses should be reduced as low as possible.
Up to date, the indicators of losses only seen based on the length of electrical network, conductors, connectors, substations, over load , load balance, voltage and power factor [13]. There are no research that studied a contributions of urban space toward losses indicator. It become a question, whether the pattern of urban space can contribute in the efficiency of electrical energy?
Based on the previous studies, it is known that studies on the spatial aspect of urban pattern has been done. Some of them can be seen in the table 2.
Table 2. Previous studien in urban pattern Citation Result of research
Ourng dan Rodrigues (2012) [15]
Identify the pattern of urban growth from 1993 to 2011 in Siem reap town, Cambodia. Result shows the development of core settlement areas in Siem Reap revealed to be concentrated along main roads and along the river in the past and still keeping the same trend in the present.
Ma et al. (2008) [16] Developed research on the urban sprawl pattern in the mining area, a case study on Sunan, China. The research denoted that Sunan’s urban cluster are becoming more and more homogenous and compact and are growing along the transportation axes.
Savaranan et al. (2010) [17]
Introduced visualization approach with the help of city model-Monocentric to identify the urban sprawl pattern in Maduarai region, India. he result showed that the pattern of urban sprawl of Maduarai is identified as linear along the major roads.
Alabi (2009) [18] Measured the urban sprawl pattern in Lokoja, Nigeria. The aim of study was to measure the behaviour of sprawl. The measurement of entropy is derived based on the two location factors, distance from roads and distance from the town center to reveal and capture spatial patterns of urban sprawl. The results showed that Lokoja is experienced grow along the major highways.
Huiping et al. (2005) [19]
Proposed the study on developing urban growth prediction from spatial indicators based on multi-temporal images. The aim of the research was to detect the spatial distribution of land use and spatio-temporal pattern over the years. The resultf was integrating land use/land cover pattern with multivariate spatial model to estimate the spatial distribution of future urban expansion.
Huynh et al. ( 2016) [20]
Study the spatial pattern of cities across the globe by analysing the distribution of public transportpoints within the cities. Theanalysis reveals that different spatial distributions of points could be classified into four groups with distinct features, indicating whether the points are clustered, dispersed orregularly distributed. Furthermore,the results provide evidence for the existence of two different types of urban system: well-planned and organically grown.
Wegener dan Kuzman (1996) [21]
In spatial terms the growth of the modern city is linked to the spread of industrialisation across the continent.
Wei dan Jiang (2013) [22]
Study on the urban characteristic commercial streets. Case study historical streets in Suzhou, China. Results of the study state that the commercial streets will create spaces that have economic value, social value, cultural value and ecological value.
Leps and Kindlmann (1987) [23]
Random patterns may be a result of the changes in initial aggregated pattern caused by competition among neighbours.
Yang hun et al. (2012) [24]
The spatial pattern of firms has a profound impact on the economic viability and conditions for economic growth in a region. The locations of firms will impact on transportationflows, since they are

International Journal of Scientific and Research Publications, Volume 7, Issue 4, April 2017 309 ISSN 2250-3153
www.ijsrp.org
Citation Result of research important attractors and producers of both personal and freight traffic.
Feitosa et al. (2005) [25]
Segregation measures can be regarded as useful tools for analyzing the spatial distribution of socially vulnerable families in urban areas. Using alternative spatial segregation measures, global and local, for the identification of familiesunder a socially vulnerable condition established by the combination of poverty and segregation.
Based on the review results in table 2, it is known that there has been no research that studied topic of urban pattern and efficiency
in distribution of electrical energy. Therefore, we conducted a research to find out the patterns of urban space that can provide efficiency in electrical energy distribution.
II. RESEARCH METHOD AND DATA In this research, we used quantitative positivist approach. As object study is commercial sectors in the area of Semarang city
square, Semarang city, Indonesia, can be seen infigure 1.
Figure 1.a). Location of Object Study-Area of Semarang City Square (Source : https://maps.google.com); b). Measurement instrument- Global Positioning System (GPS); c). Substation
Research data devided into primary data and secondary data. The primary data were the distance between the object of study to the
city squere substation in Gajah Mada street. A step-down substation 150kV/20kV, the total power capacity is 120 MVA with 2 transformers. Each transformer is 60 MVA, consists of 13 feeders that supply center of Semarang region that dominated with central business district. While the secondary data were the data of electrical load in 2016. Data were collected using a Global Positioning System (GPS). Therea are three variables used in this study :
1. Independent variable : spatial urban pattern, position of substation. 2. Dependent variable : losses 3. Control variable : distance, load of electrical energy consumption. Whereas data analysis devided into four steps, i.e. : a. Losses calculation using Electric Transient and Analysis Program (ETAP). The calculation of lossescan be seen in % (percen).
Geographic Information System (GIS systems) can provide good information that can be beneficial in evaluating when and where losses were occured.The bigger losses value, the more inefficient.
b. As for the spatial analysis used Nearest Neighbor analysis whichdisplays the distribution pattern of space location based on the calculation of distance, number of point location and region. The results of Nearest Neighbor analysis are Z-Score and P-Value, indicating whether the area cluster, random or dispersed [26]. There are three standart of Nearest Neighbor analysis, i.e. : Nearest Neighbor analysis result 1: spatial pattern random. Nearest Neighbor analysis result < 1 spatial pattern cluster. Nearest Neighbor analysis result > 1 spatial pattern dispersed
The Area Of Semarang City Squere
a
b c
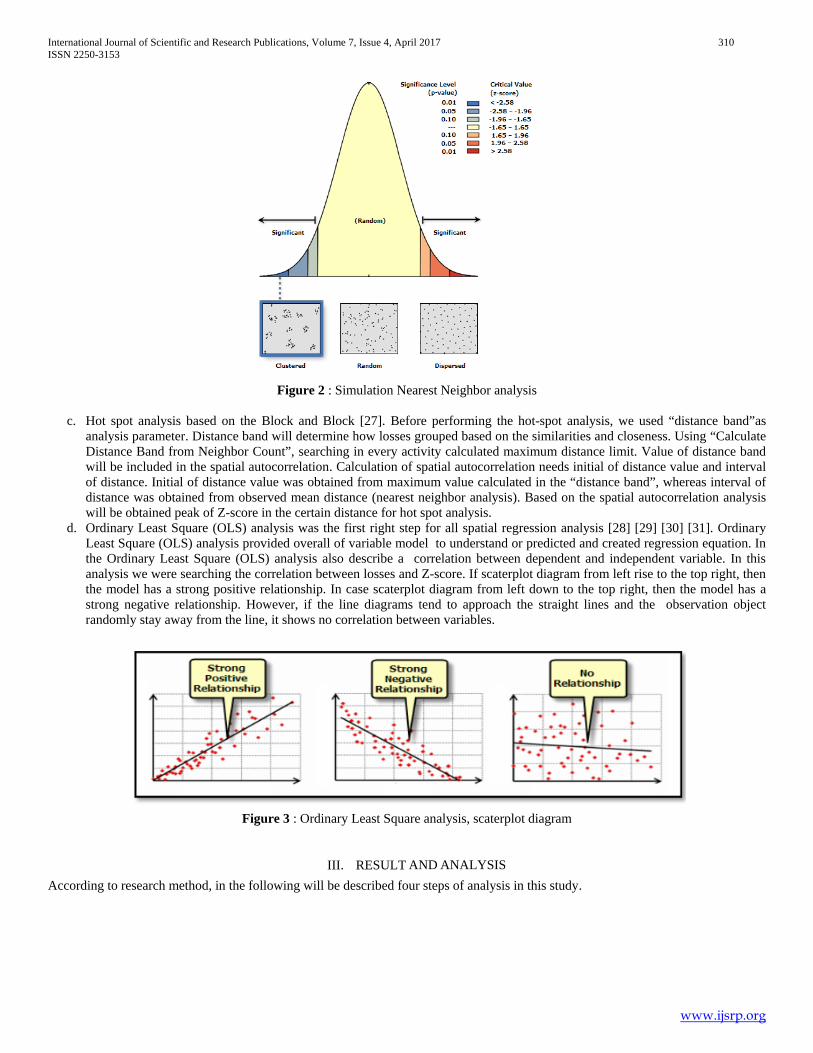
International Journal of Scientific and Research Publications, Volume 7, Issue 4, April 2017 310 ISSN 2250-3153
www.ijsrp.org
Figure 2 : Simulation Nearest Neighbor analysis
c. Hot spot analysis based on the Block and Block [27]. Before performing the hot-spot analysis, we used “distance band”as analysis parameter. Distance band will determine how losses grouped based on the similarities and closeness. Using “Calculate Distance Band from Neighbor Count”, searching in every activity calculated maximum distance limit. Value of distance band will be included in the spatial autocorrelation. Calculation of spatial autocorrelation needs initial of distance value and interval of distance. Initial of distance value was obtained from maximum value calculated in the “distance band”, whereas interval of distance was obtained from observed mean distance (nearest neighbor analysis). Based on the spatial autocorrelation analysis will be obtained peak of Z-score in the certain distance for hot spot analysis.
d. Ordinary Least Square (OLS) analysis was the first right step for all spatial regression analysis [28] [29] [30] [31]. Ordinary Least Square (OLS) analysis provided overall of variable model to understand or predicted and created regression equation. In the Ordinary Least Square (OLS) analysis also describe a correlation between dependent and independent variable. In this analysis we were searching the correlation between losses and Z-score. If scaterplot diagram from left rise to the top right, then the model has a strong positive relationship. In case scaterplot diagram from left down to the top right, then the model has a strong negative relationship. However, if the line diagrams tend to approach the straight lines and the observation object randomly stay away from the line, it shows no correlation between variables.
Figure 3 : Ordinary Least Square analysis, scaterplot diagram
III. RESULT AND ANALYSIS According to research method, in the following will be described four steps of analysis in this study.

International Journal of Scientific and Research Publications, Volume 7, Issue 4, April 2017 311 ISSN 2250-3153
www.ijsrp.org
Table 3.Losses Calculation
Feeder Distance (m)
Drop Voltage (kv)
Business
(%)
Residential
(%) mva mw %
SPL-01 1200 19,842 92,74 7,26 6,377 5,708 0,175
SPL-02 3200 19,296 76,23 23,77 15,634 13,834 1,467
SPL-03 3200 19,406 75,24 24,53 16,49 14,58 0,837
SPL-04 2200 19,621 95,48 4,52 11,758 10,46 0,504
SPL-05 1900 19,694 86,40 11,55 9,409 8,393 0,441
SPL-06 520 19,935 100,00 0,00 2,759 2,477 0,081
SPL-08 2600 19,495 87,68 12,32 12,087 10,749 0,986
SPL-09 2400 19,671 90,29 9,71 8,602 7,669 0,574
SPL-10 5000 19,233 69,73 24,48 14,746 13,011 1,483
SPL-11 3600 19,538 81,27 17,44 8,994 8,003 0,975
SPL-12 3900 19,247 24,69 48,12 16,708 14,748 1,336
SPL-13 3700 19,537 76,44 23,56 9,033 8,037 0,971
*SPL = substation
Figure 4. Map of losses and spatial analysis, existing condition. The blue area is the lowest losses.

International Journal of Scientific and Research Publications, Volume 7, Issue 4, April 2017 312 ISSN 2250-3153
www.ijsrp.org
Based on the losses calculation, areas with high density have higher losses than areas with low density, can be seen in figure 4. This is because the percentage of residential area higher than commercial area. In other word, the percentage of land use will influence the losses calculation.
Then, in table 3 can be seen that SPL 1 has lowest losses percentage and SPL 2 has highest losses percentage. Eventhough SPL 10 has highest losses percentage, but its residential percentage is the lowest than SPL 2. Therefore, for analysis we choose SPL 1 and SPL 2.
In spatial calculation of SPL 1 and SPL 2, we were identified type of activities and spacious of service area. Because of SPL 1 and SPL 2 included in the area with lowest and highest losses, then it needed to deeper identify related to its spatial forming. In the identify of activity, we used area of shopping complex, trade and service area, and also hotel and supermarket area. The activities in this area related to the function of SPL1 and SPL 2 where as commercial area in Semarang City.
3.1. Ordinary Least Square (OLS) Analysis In the ordinary least square (OLS) analysis, we used the following formula :
Y = a + b1x1 + b2x2 + b3x3 + b4x4
Y = 41.499921 + 0.019742 x1 + 0.000030 x2 + 0.000060 x3-2.075053 x4 Nomenclature: a = Intercept b1 = Coefficient x1 b2 = Coefficient x2 b3 = Coefficient x3 b4 = Coefficient x4 x1 = Z-Score variable x2 = Load variable x3 = Distance variable x4 = Voltage variable
Based on the result of modelling simulation, can be seen the correlation among variables, the values were positive. It showed that there is a correlation among variables toward losses. The increase and decrease of losses can be influenced by those three variables. Whereas in the voltage variable showed negative value. It means, voltage variable did not has influence toward losses. When Z-score value increased (random or disperse), then will increase losses value too. In case, the bigger load value, the higher losses value.When the substation distance getting further, then the higher losses value. It was vice versa. The following is the results of calculation in redudancies value :

International Journal of Scientific and Research Publications, Volume 7, Issue 4, April 2017 313 ISSN 2250-3153
www.ijsrp.org
If value of varian inflation factorin (VTF) model showed 7.5 or more, thenthere is one or more variable that discuss similiar thing. It was causing biased model, therefore needed to erase one by one the variables which have bigger value. The result in ordinary least squaremodel, the value of varian inflation factorin can be seen between 1 - 1,3. It showed that the value of variable under the value of varian inflation factorinand and can be used.
Probability [b] and Robust_Pr [b] showed statistically significant coefficient. Star mark in the probability means the variables
significant toward model. Eventhough there is no star mark in load variabel, but there is positive correlation that influenced losses.
Adjusted R-squared was 0-1 and indicated how many independent variables was expladaned by dependent variables. The result of adjusted R-squered was 0.894766 showed that percentage of model losses correlationwas 89%.
3.2. Average nearest neighbor analysis in SPL 1 The following were the results of Average Nearest Neighbor analysis in SPL 1.
Table 4.Results of Average Nearest Neighbor analysis in SPL 1
No Aktivities Z-Score P-Value Closeness ratio Pattern Observed Mean
Distance (m) Expected Mean
Distace (m)
1 Shopping complex -5.287317 0 0.55744 Clustered 27.890076 50.032425
2 Trade -6.710144 0 0.527045 Clustered 22.204982 42.131073
3 Hotel and supermarket 0.405582 0.68505 1.094812 Random 152.981316 139.732960
Based on the analysis results in table 4: a. Shopping complex : z-score in this area was --5.287317, the results was lower than critival value -2.58 that mean the pattern
was cluster. However based on the analysis, P-value was 0 that means impossible the characteristic of spatial pattern was random.
b. Trade and service area : z-score in this area was -6.710144 lower than critival value -2.58. The result of spatial pattern was cluster and P-value was 0 thatmeans impossible the characteristic of spatial pattern was random..
c. Hotel and supermarket: z-score in this area was 0.405582 and occured in the range of critivalvalue -1.65–1.65. Result of P-value was 0 and spatial pattern possibility was random.
Table 5 will show the result of distance band analysis in SPL 1.
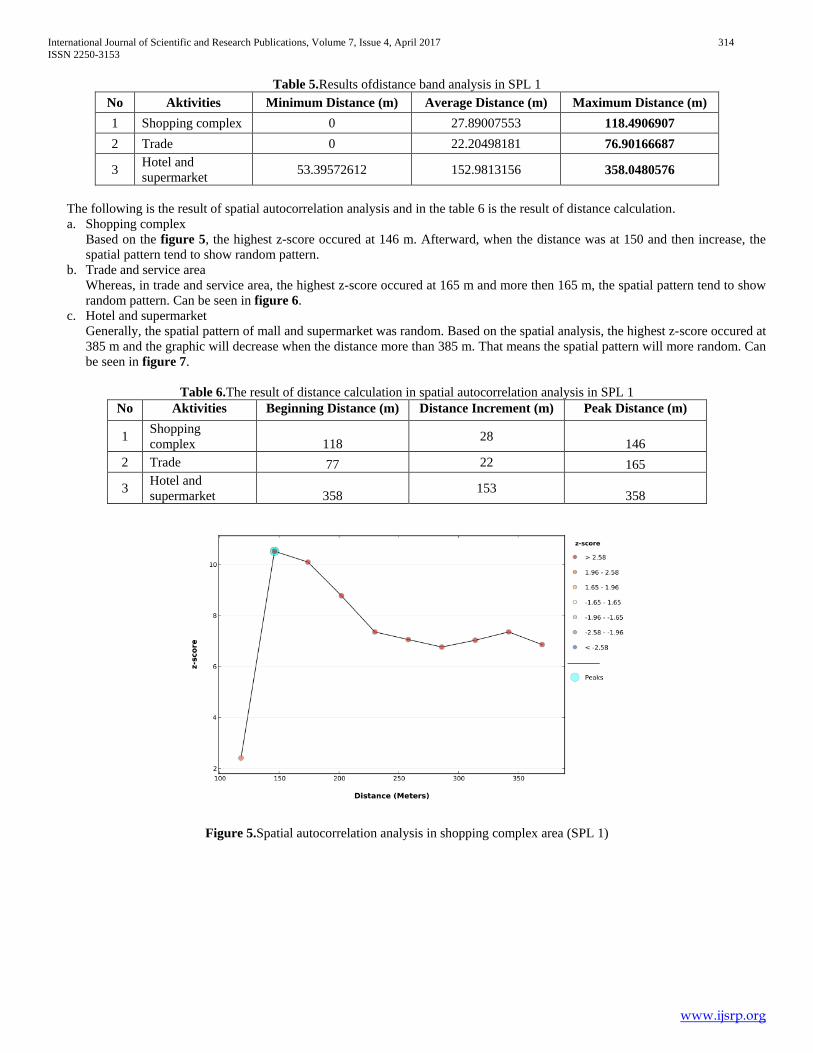
International Journal of Scientific and Research Publications, Volume 7, Issue 4, April 2017 314 ISSN 2250-3153
www.ijsrp.org
Table 5.Results ofdistance band analysis in SPL 1 No Aktivities Minimum Distance (m) Average Distance (m) Maximum Distance (m) 1 Shopping complex 0 27.89007553 118.4906907 2 Trade 0 22.20498181 76.90166687
3 Hotel and supermarket 53.39572612 152.9813156 358.0480576
The following is the result of spatial autocorrelation analysis and in the table 6 is the result of distance calculation. a. Shopping complex
Based on the figure 5, the highest z-score occured at 146 m. Afterward, when the distance was at 150 and then increase, the spatial pattern tend to show random pattern.
b. Trade and service area Whereas, in trade and service area, the highest z-score occured at 165 m and more then 165 m, the spatial pattern tend to show random pattern. Can be seen in figure 6.
c. Hotel and supermarket Generally, the spatial pattern of mall and supermarket was random. Based on the spatial analysis, the highest z-score occured at 385 m and the graphic will decrease when the distance more than 385 m. That means the spatial pattern will more random. Can be seen in figure 7.
Table 6.The result of distance calculation in spatial autocorrelation analysis in SPL 1
No Aktivities Beginning Distance (m) Distance Increment (m) Peak Distance (m)
1 Shopping complex 118 28 146
2 Trade 77 22 165
3 Hotel and supermarket 358 153 358
Figure 5.Spatial autocorrelation analysis in shopping complex area (SPL 1)
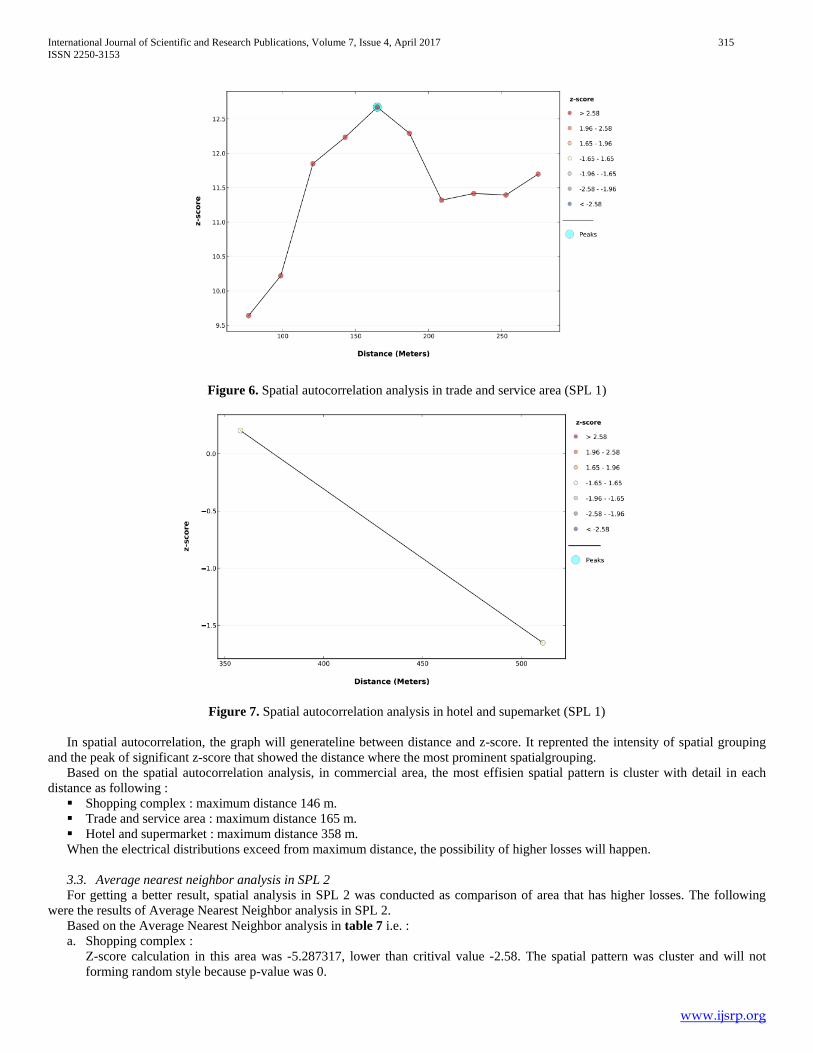
International Journal of Scientific and Research Publications, Volume 7, Issue 4, April 2017 315 ISSN 2250-3153
www.ijsrp.org
Figure 6. Spatial autocorrelation analysis in trade and service area (SPL 1)
Figure 7. Spatial autocorrelation analysis in hotel and supemarket (SPL 1)
In spatial autocorrelation, the graph will generateline between distance and z-score. It reprented the intensity of spatial grouping and the peak of significant z-score that showed the distance where the most prominent spatialgrouping.
Based on the spatial autocorrelation analysis, in commercial area, the most effisien spatial pattern is cluster with detail in each distance as following : Shopping complex : maximum distance 146 m. Trade and service area : maximum distance 165 m. Hotel and supermarket : maximum distance 358 m. When the electrical distributions exceed from maximum distance, the possibility of higher losses will happen. 3.3. Average nearest neighbor analysis in SPL 2 For getting a better result, spatial analysis in SPL 2 was conducted as comparison of area that has higher losses. The following
were the results of Average Nearest Neighbor analysis in SPL 2. Based on the Average Nearest Neighbor analysis in table 7 i.e. : a. Shopping complex :
Z-score calculation in this area was -5.287317, lower than critival value -2.58. The spatial pattern was cluster and will not forming random style because p-value was 0.
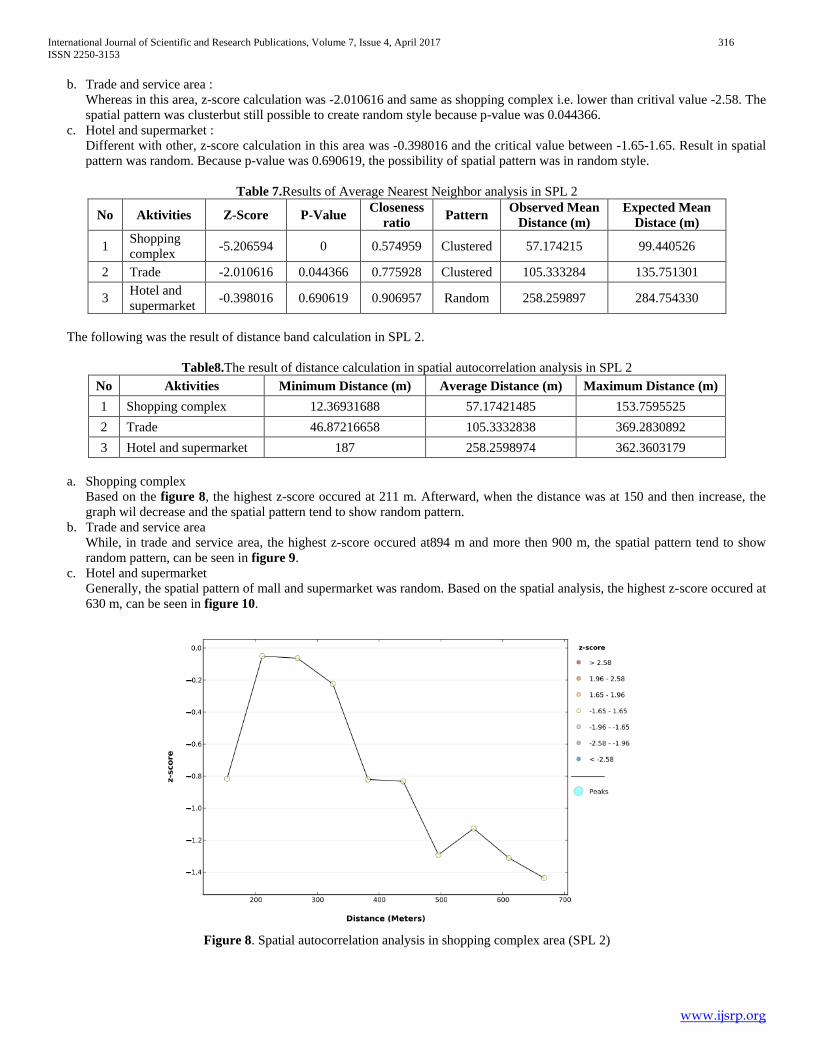
International Journal of Scientific and Research Publications, Volume 7, Issue 4, April 2017 316 ISSN 2250-3153
www.ijsrp.org
b. Trade and service area : Whereas in this area, z-score calculation was -2.010616 and same as shopping complex i.e. lower than critival value -2.58. The spatial pattern was clusterbut still possible to create random style because p-value was 0.044366.
c. Hotel and supermarket : Different with other, z-score calculation in this area was -0.398016 and the critical value between -1.65-1.65. Result in spatial pattern was random. Because p-value was 0.690619, the possibility of spatial pattern was in random style.
Table 7.Results of Average Nearest Neighbor analysis in SPL 2
No Aktivities Z-Score P-Value Closeness ratio Pattern Observed Mean
Distance (m) Expected Mean
Distace (m)
1 Shopping complex -5.206594 0 0.574959 Clustered 57.174215 99.440526
2 Trade -2.010616 0.044366 0.775928 Clustered 105.333284 135.751301
3 Hotel and supermarket -0.398016 0.690619 0.906957 Random 258.259897 284.754330
The following was the result of distance band calculation in SPL 2.
Table8.The result of distance calculation in spatial autocorrelation analysis in SPL 2
No Aktivities Minimum Distance (m) Average Distance (m) Maximum Distance (m) 1 Shopping complex 12.36931688 57.17421485 153.7595525 2 Trade 46.87216658 105.3332838 369.2830892 3 Hotel and supermarket 187 258.2598974 362.3603179
a. Shopping complex
Based on the figure 8, the highest z-score occured at 211 m. Afterward, when the distance was at 150 and then increase, the graph wil decrease and the spatial pattern tend to show random pattern.
b. Trade and service area While, in trade and service area, the highest z-score occured at894 m and more then 900 m, the spatial pattern tend to show random pattern, can be seen in figure 9.
c. Hotel and supermarket Generally, the spatial pattern of mall and supermarket was random. Based on the spatial analysis, the highest z-score occured at 630 m, can be seen in figure 10.
Figure 8. Spatial autocorrelation analysis in shopping complex area (SPL 2)
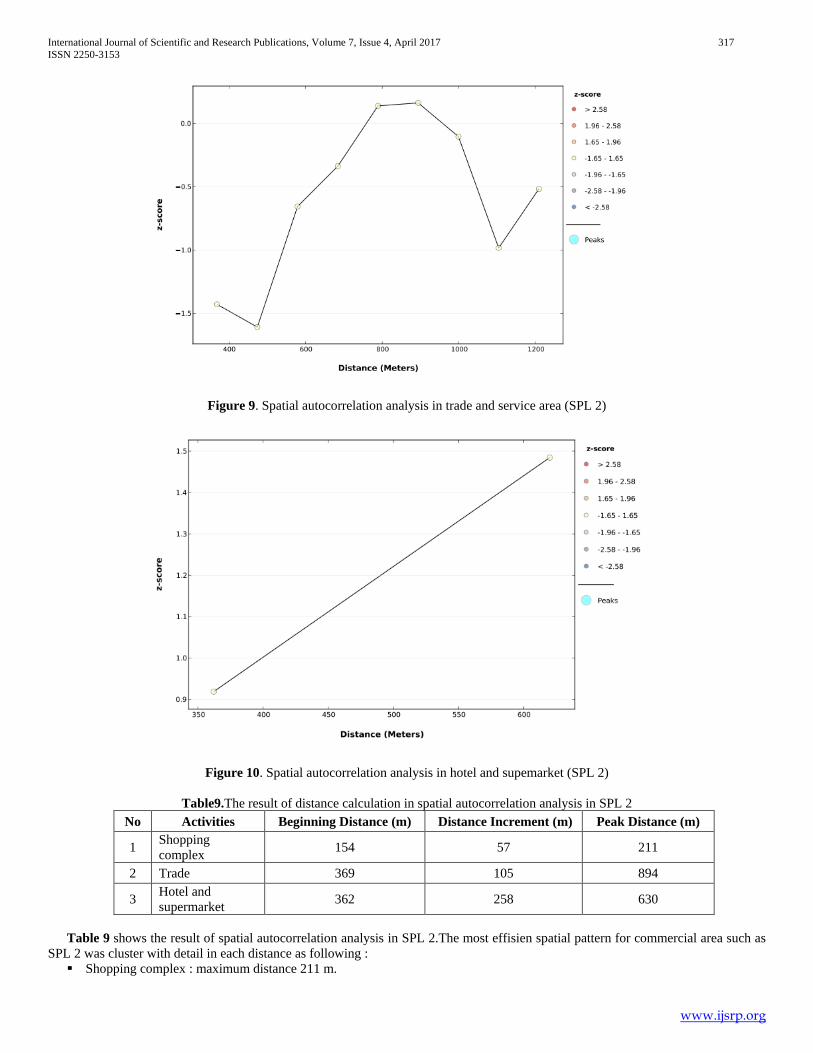
International Journal of Scientific and Research Publications, Volume 7, Issue 4, April 2017 317 ISSN 2250-3153
www.ijsrp.org
Figure 9. Spatial autocorrelation analysis in trade and service area (SPL 2)
Figure 10. Spatial autocorrelation analysis in hotel and supemarket (SPL 2)
Table9.The result of distance calculation in spatial autocorrelation analysis in SPL 2 No Activities Beginning Distance (m) Distance Increment (m) Peak Distance (m)
1 Shopping complex 154 57 211
2 Trade 369 105 894
3 Hotel and supermarket 362 258 630
Table 9 shows the result of spatial autocorrelation analysis in SPL 2.The most effisien spatial pattern for commercial area such as
SPL 2 was cluster with detail in each distance as following : Shopping complex : maximum distance 211 m.

International Journal of Scientific and Research Publications, Volume 7, Issue 4, April 2017 318 ISSN 2250-3153
www.ijsrp.org
Trade and service area : maximum distance 894 m. Hotel and supermarket : maximum distance 630 m. If the electrical distributions exceed from maximum distance, the possibility of higher losses will happen. Later on, after the result in SPL 1 and SPL 2 compared, an be seen in table 10, we can see that SPL 1 with higher business
percentage was more efficient in electrical distribution. The structure of business area tend to compact with shorter distances among the electrical consumer.
Therefore, to create efficiency in electrical distribution in commercial area, the proportion of business area must be higher than other areas. Then followed by shopping complex and for the last was hotel and supermarket.
Table 10.Comparing result in SPL 1 and SPL 2
No Activities Maximum distance Spatial pattern SPL 01 SPL 02 SPL 01 SPL 02
1 Shopping complex 146 m 211 m Clustered Clustered 2 Trade 165 m 894 m Clustered Clustered
3 Hotel and supermarket 358 m 630 m Random Random
IV. CONCLUTION Nowadays, energy has become a hot topic. The urban pattern become one of studies that hypothesized will influence the efficiency
of distribution in electrical energy. Up to days, the previous researchs just studied spatial pattern based on the street pattern, social economic condition, and urban growth. Whereas for energy efficiency, mostly the researchers just studied related to urban transportation.
To enhance the previous researchs, we conducted a study to find out the patterns of urban space that can provide efficiency in electrical energy distribution. In this study, we used four steps analysis i.e. Electric Transient and Analysis Program (ETAP), Nearest Neighbor analysis, Hot spot analysis and Ordinary Least Square (OLS).
Based on the analysis, the most suitable spatial pattern to create the most efficient in electrical distribution in commercial area was cluster. The maximum distance for each activity was 146 m for shopping complex, 165 m for trade and service area and 358 m for hotel and supermarket.
Except distance factor, to create efficiency in electrical distribution in commercial area, the proportion of business area must be higher than other areas. Then followed by shopping complex and for the last was hotel and supermarket.
REFERENCES [1] Lu, X., Huang, J., Sellers, J.M.,A global comparative analysis of urban form. 2006. (manuscript) Wong, K.., Shen, J., Feng, Z., Gu, C., An analysis of Dual-Track
Urbanization in the Pearl River Delta Since 1980. Tijdschr. Econ. Soc. Ge. 2003, 94, Page 205-218. [2] Annual energy outlook 2013, with projections to 2040. U.S. Energy Information Administration (EIA). (DOE/EIA-0383, 2013).Accessed on
http://www.eia.gov/outlooks/aeo/pdf/0383(2013).pdf [3] Grubler, A.,Grand designs: historical patterns and future scenarios of energy technological change. Historical case studies of energy technology innovation in:
chapter 24, the global energy assessment. Grubler A., Aguayo, F., Gallagher, K.S., Hekkert, M., Jiang, K., Mytelka, L., Neij, L., Nemet, G. & C. Wilson. (Cambridge University Press, Cambridge, UK, 2012).
[4] Wolpe, P. and Reddy, Y., The contribution of low-carbon cities to South Africa’s greenhouse gas emissions reduction goals. Briefing on urban energy use and greenhouse gas emissions. Sustainable Energy Africa. Prepared with the support of Bloomberg Philanthropies (Stockholm environment institute, 2015).
[5] Keirstead, J. and Shah, N., Urban energy systems: an integrated approach (London and New York: Routledge, Taylor & Francis Group, 2013). [6] Lin, J.J. and Feng, C.M.,A bi-level programming model for the land use-network design problem. The Annals of Regional Science, 37(1), 2003, 93-105. [7] Brownsword, R. A., Fleming, P. D., Powell, J. C., Pearsall, N., Sustainable cities: modelling urban energy supply and demand,Applied Energy, 82(2), 2005, 167-
180. [8] Parshall, L., Gurney, K., Hammer, S. A., Mendoza, D., Zhou, Y., Geethakumar, S.,Modeling energy consumption and co2 emissions at the urban scale:
methodological challenges and insights from the united states. energy policy, (in press, 2009). [9] Girardin, L., Dubuis, M., Darbellay, N., Marechal, F., and Favrat, D., Energis: a geographical information based system for the evaluation of integrated energy
conversion systems in urban areas, Energy, 35(2), 2010, 830-840. [10] Connolly, D., Lund, H., Mathiesen, B., Leahy, M., A review of computer tools for analysing the integration of renewable energy into various energy
systems,Applied Energy, 87(4), 2010, 1059-1082. [11] Keirstead, J.,Identifying lessons for energy-efficient cities using an integrated urban energy systems model, BP Urban Energy Systems projecty Imperial College
London, 2010). [12] Jenk, Mike and Burgess, Rob, Compact cities: sustainable urban forms for developing countries, in Jenk, M. And Burgess, R. (Ed), (London and New York: Spon
press, Taylor & Francis Group, 2000). [13] Ibrahim, H. D., Key note speech Seminar Losses Energi 2004. Universitas Gajah Mada. Yogyakarta, 2004. [14] Baute E.T., Arderius D.D., Sanin M.E., CO2 content of energy losses, International Academic Symposium Energy and Environmental Policy, 2016.

International Journal of Scientific and Research Publications, Volume 7, Issue 4, April 2017 319 ISSN 2250-3153
www.ijsrp.org
[15] Ourng, C and Rodrigues, D. S., Urban growth pattern identification: a case study in Siem Reap, Cambodia, 2012. [16] Ma, R., Gu, C., Ma, X., Pu, Y., Mining the urban sprawl pattern: a case study on Sunan, China, Sensors, 8, 2008, 6371-6395. [17] Saravanan, P. and Ilangovan, P., Identification of urban sprawl pattern for Madurai Region using GIS, International Journal of Geomatics and Geosciences, 1 (2),
2010. [18] Alabi, M., Urban sprawl, pattern and measurement in Lokoja, Nigeria, Theoretical and Empirical Research in Urban Management,4(13), 2009. [19] Huiping, L. and Qiming, Z., Developing urban growth predictions from spatial indicators based on multi-temporal images,Computers, Environment and Urban
Systems, 29 (5), 2005, 580-594. [20] Huynh, H. N., Makarov, E., Legara, E. F., Monterolas, C. Chew, L. Y., Spatial patterns in urban systems, 2016. Retrieved from https://arxiv.org/abs/1604.07119v1. [21] Wegener, M. and Kunzmann, K. R., 1996. New spatial patterns of European urbanisation, in Pumain, D., Saint-Julien, T. (Eds.), Urban networks in Europe. (Paris:
John Libbey, 1996) 7-17. [22] Wei, G. and Jiang, Z., Analysis of the spatial characteristics of commercial streets in China's Southern Cities: a case of three commercial streets in Suzhou. 49th
ISOCARP Congress, 2013. [23] Leps, J. and Kindlmann, P., Models of the development of spatial patyernof an even-aged plant population over time,Ecological Modellingo, 39, 1987, 45-57. [24] Yang, J-H., Ettema, D.,Frenken, K., Modelling the emergence of spatial patterns of economic activity, Urban and Regional Research Centre, Faculty of
Geosciences, Utrecht University., 2012. [25] Feitosa, F.F., Monteiro, A.M.V., Câmara, G. Residential segregation indices as tools foridentifying socially vulnerable families. II Simpósio Nacional de Geografia
da Saúde, Rio deJaneiro, 2005. [26] Dixion, M. P., Nearest neighbor methods, 2012. [27] Block, R. L., and Block, C.R., Space, place, and crime: hot spot areas and hot places of liquor-related crime in J.E.E. and D. Weisburd, (Ed), (New York: Criminal
Justice Press, 1995). [28] Tutorial Regression Analysis. Retrieved fromeclectic.ss.uci.edu/~drwhite/pdf/Tutorial-RegressionAnalysis.pdf [29] Draper, N. R. and Smith, H., Applied regression analysis (3rd Ed), (New York: John Wiley & Sons, Inc, 1998). [30] Fotheringham, A. S., Brunsdon, C., Charlton, M., Geographically weighted regression: the analysis of spatially varying relationships, Journal of Chemical
Information and Modeling, 53, (Chichester: John Wiley & Sons Ltd, 2002). Retrieved from http://doi.org/10.1017/CBO9781107415324.004. [31] Fotheringham, A. S., Brunsdon, C., Charlton, M. E., Geographically weighted regression: a natural evolution of the expansion method for spatial data analysis.
Environment and Planning A, 30, 1998, 1905–1927. Retrieved from https://pdfs.semanticscholar.org/12e2/3a0643b893b84bd3ba7f8642575f1faaf3ea.pdf.
AUTHORS First Author – Singgih Hartanto, Urban Energy System, Architecture and Urban Planning Departement, Diponegoro
University,[email protected]. Second Author – Soegiono Soetomo,Urban and Regional Planning, Architecture and Urban Planning Departement, Diponegoro
University. Third Author – Broto Sunaryo,Urban and Regional Planning, Architecture and Urban Planning Departement, Diponegoro University. Fourth Author – Wisnu Pradoto,Urban and Regional Planning, Architecture and Urban Planning Departement, Diponegoro
University. Correspondence Author – Singgih Hartanto, [email protected], +62812-2828-790
International Journal of Scientific and Research Publications, Volume 7, Issue 4, April 2017 320 ISSN 2250-3153
www.ijsrp.org
Analogy Based Software Project Effort Estimation Using Projects Clustering
M.Kowsalya*, H.OormilaDevi*, N.ShivaKumar**
* Computer Science and Engineering Department, Thiagarajar College Of Engineering , Madurai * * Assistant Professor , Computer Science and Engineering Department, Thiagarajar College Of Engineering , Madurai
Abstract— Software effort estimation is the methodology predicting the amount of effort required to develop or maintain the particular software. The Software effort estimation is task which is done in the requirement engineering phase where a requirement is taken and the effort needed for that particular requirement is found. The accuracy value of the effort must be very high because it may lead to the financial loss or the loss of reputation of the company. K-Means clustering algorithm is one of the machine learning oriented techniques. The clustering of the dataset is done using the K-Means clustering algorithm to estimate the effort accurately and efficiently. After clustering, the analogy based estimation technique is used. The non-algorithmic model like the analogy based effort estimation performs better than the algorithmic model like COCOMO. The effort estimated using the analogy based effort estimation coincides mostly with the actual effort obtained from the software effort estimation dataset. The results of the effort estimation were analyzed using the Magnitude of Relative Error (MRE) and Mean Magnitude Relative Error (MMRE) to prove its accuracy.
Index Terms - Analogy, Clustering, Effort, Estimation.
I. INTRODUCTION Software effort estimation is one of the major and the important task in the software engineering. It is used for calculating the amount of effort required for the development and the management of the software project. It is one of the challenging task because whenever we estimate the effort for a particular software project we overestimate or underestimate the actual effort required. Resources are very limited in amount so a careful estimation of the effort must be done. Estimates of effort is usually measured in terms of person-months for a software project. Effort estimates must be very accurate because it may lead to financial loss or loss of reputation of the organization. Various algorithmic and non-algorithmic methods are used to estimate the effort of a particular software project. The ways of categorizing estimation approaches, are Expert estimation where the effort is calculated using the judgmental processes of the experts in the organization. The experience of the experts is used for the effort estimation. Second is the Formal estimation model or the algorithmic model where the effort estimation is based on mechanical processes i.e., the mathematical and predefined formula is used. Some of the formal estimation model are COCOMO, Use case method etc.,
Third is the Learning Oriented estimation or the non-algorithmic model where the effort estimation is based on a machine learning techniques. One of the machine learning oriented technique which is useful for the efficient effort estimation is the K-Means Clustering Algorithm. K-Means algorithm is one of the non-hierarchical algorithm for clustering. K-Means clustering algorithm aims to partition n dataset observations into k number of clusters. Since the accuracy value of the effort is very high we have chosen this algorithm for the effort estimation and the effort value found by this algorithm mostly coincides with the actual effort value. Learning oriented technique has the ability to learn from the previous historical data given and from that learned technique, the effort value can be easily measured accurately. After the clustering of the dataset, analogy based estimation technique is followed to estimate the effort of the software project accurately. In the analogy based software project effort estimation, the comparison of the current project with the historical project is done and as a result similar projects to the current project is obtained, using which the effort value is estimated. The performance indicators used are the Magnitude of Relative Error (MRE) and Mean Magnitude of Relative Error (MMRE).These values must be as minimum as possible to make sure that the effort estimated is accurate and it mostly coincides with the actual effort given in the dataset. Remaining sections of the paper are organized as follows: Section II describes the background of the work i.e. Analogy based software project effort estimation, K-Means Clustering and evaluation criteria. Section III describes the related work in the field of software estimation. Section IV shows the combined model of K-Means clustering and analogy based estimation technique which is proposed in this paper. Section V describes the case study that is performed for result analysis. At the end of this paper, section VI shows the conclusion of the paper.
II. BACKGROUND This section describes the various terms which are the core part of this paper such as k-means clustering, analogy based estimation technique and Evaluation criteria.

International Journal of Scientific and Research Publications, Volume 7, Issue 4, April 2017 321 ISSN 2250-3153
www.ijsrp.org
A. K-Means Clustering K-means was introduced by James MacQueen in 1967. K-
Means algorithm is one of the non-hierarchical algorithm for clustering .K-Means clustering algorithm aims to partition n dataset observations into k number of clusters.
B. Evaluation criteria Mean Relative Error (MRE) : MRE computes the percentage of error between actual and estimated effort for each reference project.
MRE = (Actuali-Estimatedi)/ Actuali
Mean Magnitude Relative Error (MMRE) : MMRE calculates the average of MRE over all referenced projects.
MMRE = ∑MREi
C. Analogy Based Effort Estimation Analogy based estimation technique is followed to estimate the effort of the software project accurately. In the analogy based software project effort estimation, the comparison of the current project with the historical project is done and as a result similar projects to the current project is obtained, using which the effort value is estimated. Similarities are found by calculating the Euclidean distance in an n-dimensional space where each dimension represents a variable.
III. RELATED WORK Clustering is one of the vital data processing task .It has been used extensively by variety of researchers for various application areas like finding similarities in pictures, text information etc., K-Means algorithm is one in all the popular clustering algorithm [2]. A new hybrid toolbox based on soft computing techniques for effort estimation is introduced. Particle swarm optimization and cluster analysis has been enforced to perform economical estimation of effort values with intelligence [8]. The initial cluster centre is chosen by using particle swarms clustering algorithm underneath default variety of cluster, then optimizes the cluster, and last carries out cluster merging supported multiclass merging condition, so as to get the simplest cluster results [7]. This analysis uses some computing intelligence techniques, like Pearson product-moment correlation coefficient method and unidirectional ANOVA methodology to pick key factors, and K-Means cluster algorithmic rule to cluster the dataset and then estimate the software project effort [9]. A new methodology on Quad-tree and K-means algorithms which supports data processing ideas is outlined to assist the error between the actual effort and the estimated effort, within the initial stages of the project [5]. Analogy-based effort estimation (ABE) one in all the best and accurate ways for software project effort estimation .It has the outstanding performance and capability of handling noisy datasets. The effort worth is found accurately by doing clustering of the dataset using the K-Means cluster then
analogy based effort estimation is done. The dataset used here is the ISBSG software effort estimation dataset. It has 17 attributes and 93 instances. The Performance indicators used here is the MRE and the MMRE values which gives the accuracy of the actual and the estimated effort values [1].The development effort is calculable by a comparison method during which the similar projects like a new project is chosen. Using the chosen projects, effort is then estimated for the new project. Due to simplicity and estimation capability, ABE has been extensively employed in terms of software development effort estimation.
IV. PROPOSED WORK In the proposed work, initially the K-Means Clustering Algorithm is done to cluster the dataset into k number of clusters. The number of clusters into which the dataset is to be divided is found using the elbow plot. Once the clustering is completed the effort of the software project is found using the Analogy based effort estimation model.
A. Finding number of clusters Finding the number of clusters in the K-Means clustering is always an issue. The number of clusters, k into which the dataset is to be divided is found using the elbow plot method. In the elbow plot method, the sum of squared error (SSE) value is used. The value of k is found such that it gives a better modeling of the data. The optimal number of clusters can be identified using the following steps : Input: Dataset
1. Initially, compute the K-Means Clustering algorithm for the varying values of k i.e., from 2 to 10.
2. For each values of k, find the SSE value. 3. Plot the curve for SSE and the number of cluster k
values. 4. Find the knee point, which gives the number of
clusters, k. Output: Number of clusters
B. K-Means Clustering
K-Means clustering algorithm aims to partition n dataset observations into k number of clusters.The K-means clustering algorithm is as follows
Input: Number of clusters, Dataset
1. Choose k objects from data sets as the centroids 2. Select the data points and find the Euclidean distance 3. Assign the data points to the cluster which has the
minimum value 4. ReCalculate the centroid 5. If any changes in centroid redo the steps.
Output: k clusters
C. Analogy Based Effort Estimation After the clustering of the dataset, analogy based estimation technique is followed to estimate the effort of the software
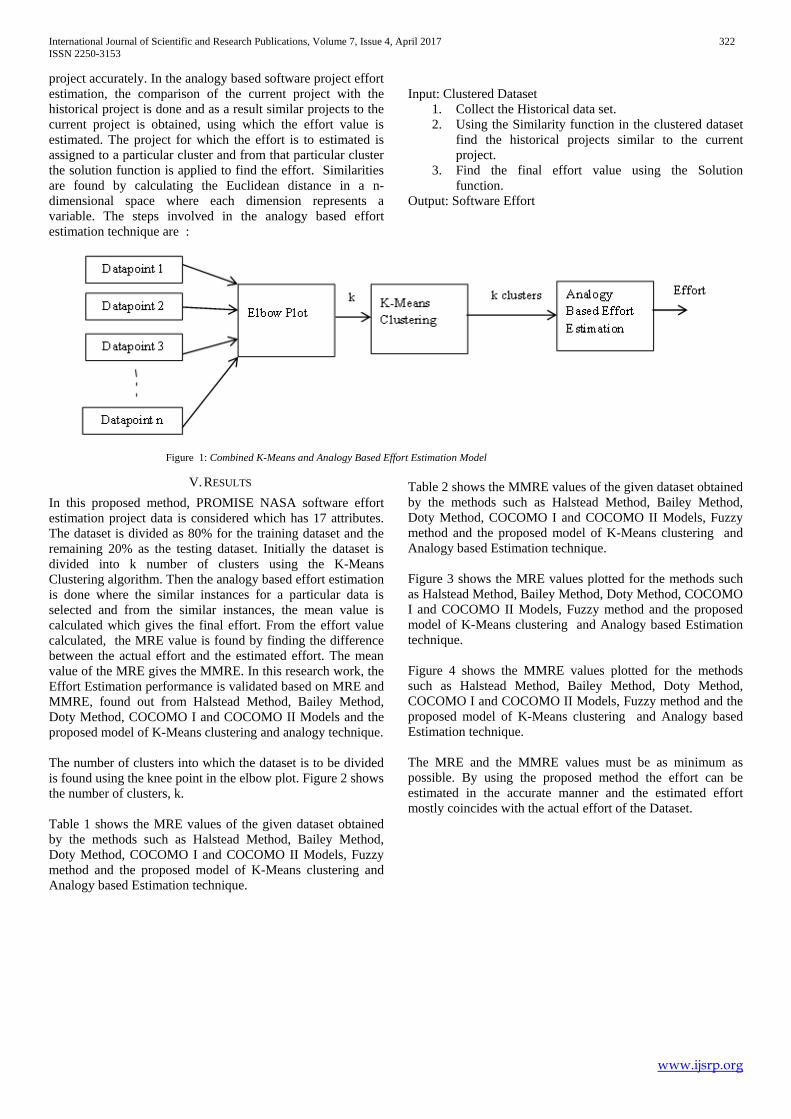
International Journal of Scientific and Research Publications, Volume 7, Issue 4, April 2017 322 ISSN 2250-3153
www.ijsrp.org
project accurately. In the analogy based software project effort estimation, the comparison of the current project with the historical project is done and as a result similar projects to the current project is obtained, using which the effort value is estimated. The project for which the effort is to estimated is assigned to a particular cluster and from that particular cluster the solution function is applied to find the effort. Similarities are found by calculating the Euclidean distance in a n-dimensional space where each dimension represents a variable. The steps involved in the analogy based effort estimation technique are :
Input: Clustered Dataset
1. Collect the Historical data set. 2. Using the Similarity function in the clustered dataset
find the historical projects similar to the current project.
3. Find the final effort value using the Solution function.
Output: Software Effort
Figure 1: Combined K-Means and Analogy Based Effort Estimation Model
V. RESULTS In this proposed method, PROMISE NASA software effort estimation project data is considered which has 17 attributes. The dataset is divided as 80% for the training dataset and the remaining 20% as the testing dataset. Initially the dataset is divided into k number of clusters using the K-Means Clustering algorithm. Then the analogy based effort estimation is done where the similar instances for a particular data is selected and from the similar instances, the mean value is calculated which gives the final effort. From the effort value calculated, the MRE value is found by finding the difference between the actual effort and the estimated effort. The mean value of the MRE gives the MMRE. In this research work, the Effort Estimation performance is validated based on MRE and MMRE, found out from Halstead Method, Bailey Method, Doty Method, COCOMO I and COCOMO II Models and the proposed model of K-Means clustering and analogy technique. The number of clusters into which the dataset is to be divided is found using the knee point in the elbow plot. Figure 2 shows the number of clusters, k. Table 1 shows the MRE values of the given dataset obtained by the methods such as Halstead Method, Bailey Method, Doty Method, COCOMO I and COCOMO II Models, Fuzzy method and the proposed model of K-Means clustering and Analogy based Estimation technique.
Table 2 shows the MMRE values of the given dataset obtained by the methods such as Halstead Method, Bailey Method, Doty Method, COCOMO I and COCOMO II Models, Fuzzy method and the proposed model of K-Means clustering and Analogy based Estimation technique. Figure 3 shows the MRE values plotted for the methods such as Halstead Method, Bailey Method, Doty Method, COCOMO I and COCOMO II Models, Fuzzy method and the proposed model of K-Means clustering and Analogy based Estimation technique. Figure 4 shows the MMRE values plotted for the methods such as Halstead Method, Bailey Method, Doty Method, COCOMO I and COCOMO II Models, Fuzzy method and the proposed model of K-Means clustering and Analogy based Estimation technique. The MRE and the MMRE values must be as minimum as possible. By using the proposed method the effort can be estimated in the accurate manner and the estimated effort mostly coincides with the actual effort of the Dataset.

International Journal of Scientific and Research Publications, Volume 7, Issue 4, April 2017 323 ISSN 2250-3153
www.ijsrp.org
1 2 3 4 5 6 7 8 90
1
2
3
4
5
6
7x 10
5
Dataset
Sum
Of S
quar
es
Figure 2: Elbow Plot for the PROMISE NASA Software Effort Estimation Dataset
Table 1: Comparing MRE Values
Dataset No.
MRE Values
Halstead Bailey Doty COCOMO I COCOMO II Fuzzy Proposed Method
1 1318.386 63.889 44.048 33.598 58.862 0.794 0.559807
2 2761.833 44.750 104.417 5.583 32.750 3.833 37.77551
3 11262.886 187.629 1044.330 427.835 321.649 1.031 145.1538
4 490.954 77.995 5.868 27.873 17.604 11.736 1.823077
5 639.687 77.383 6.543 25.747 16.074 6.970 3.032967
6 30.222 96.519 85.185 89.185 97.704 0.000 11.0989
7 318.125 83.542 29.583 46.458 72.292 0.000 3.7932
8 128.047 89.983 56.761 67.780 77.129 3.005 11.92517
9 42.326 91.860 65.581 75.349 82.326 4.419 62.33333
10 163.798 93.322 73.434 78.125 89.924 18.544 0.411538
Table 2: Comparing MMRE Values
MMRE Values
Halstead Bailey Doty COCOMO I COCOMO II Fuzzy Proposed Method
1007.718 86.390 125.374 86.756 85.631 108.891 5.292
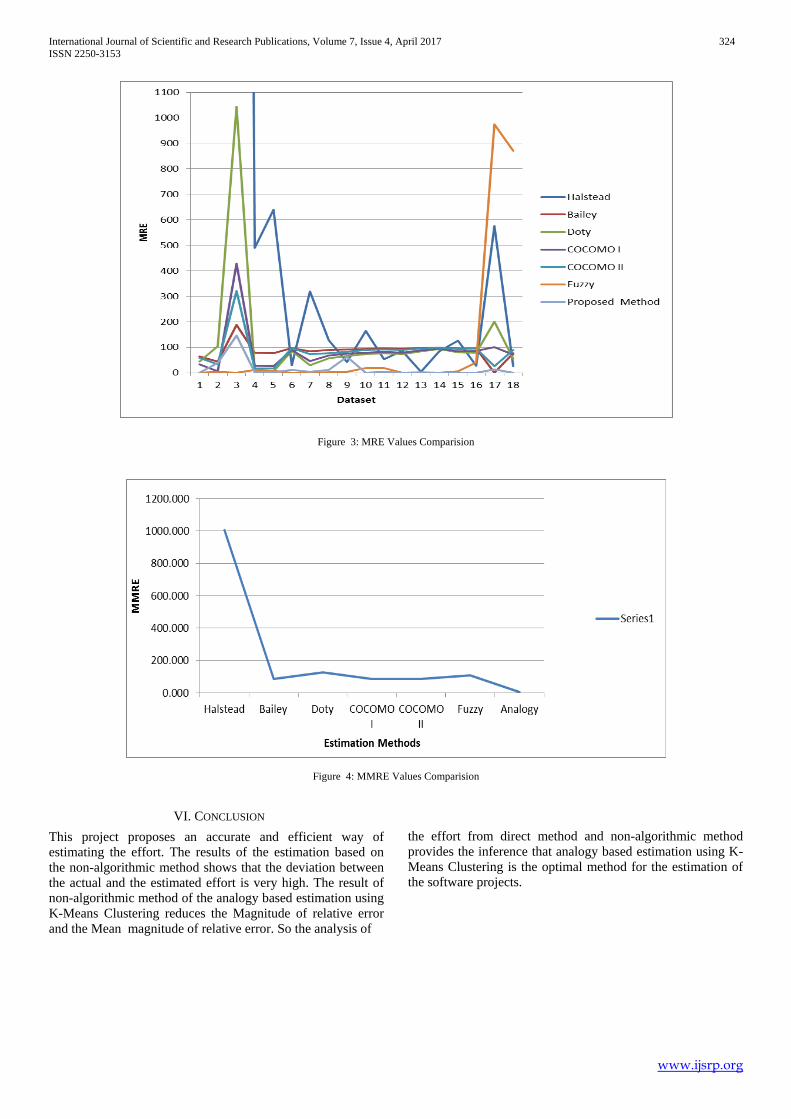
International Journal of Scientific and Research Publications, Volume 7, Issue 4, April 2017 324 ISSN 2250-3153
www.ijsrp.org
Figure 3: MRE Values Comparision
Figure 4: MMRE Values Comparision
VI. CONCLUSION This project proposes an accurate and efficient way of estimating the effort. The results of the estimation based on the non-algorithmic method shows that the deviation between the actual and the estimated effort is very high. The result of non-algorithmic method of the analogy based estimation using K-Means Clustering reduces the Magnitude of relative error and the Mean magnitude of relative error. So the analysis of
the effort from direct method and non-algorithmic method provides the inference that analogy based estimation using K-Means Clustering is the optimal method for the estimation of the software projects.

International Journal of Scientific and Research Publications, Volume 7, Issue 4, April 2017 325 ISSN 2250-3153
www.ijsrp.org
REFERENCES
[1] Khatibi E and Khatibi Bardsiri V, "Model to estimate the software development effort based on in-depth analysis of project attributes", Software, IET, vol.9 no.4, 2015, pp:109-118. [2] Mrs.Nidhi Singh,Dr.Divakar Singh, "The Improved K-Means with Particle Swarm Optimization", Journal of Information Engineering and Applications, Vol 3,No11,2013. [3] Mohammad Azzeh, Ali Bou Nassif, "Analogy-based effort estimation: a new method to discover set of analogies from dataset characteristics", IET Software,, Vol. 9, Iss. 2,2015. [4] Jovan Zivadinovic et al., "Methods of Effort Estimation In Software Engineering", I International Symposium Engineering Management and Competitiveness 2011 (EMC2011), June 24-25, 2011. [5] Rutvi Vanapalli,ch.Satyananda Reddy, "Predicting Error in Software Effort Estimate using K-Means and Quad Tree", International Journal of Computer Science and Information Technologies, Vol 5,2014. [6] Ekrem Kocaguneli, Jacky Keung, "Active learning and effort estimation: Finding the essential content of software effort estimation data", IEEE Transactions on Software Engineering, vol.39, 2013, pp.1040-1053. [7] Hari.CH.V.M.K,Tegjyot Singh Sethi,Kaushal.B.S.S,Jagadeesh.M, "SEEPC-A Toolbox for Software Effort Estimation using Soft Computing Techniques", International Journal of Computer Applications, Vol 31,2011.
[8] Youcheng Lin,Nan Tong,Majie Shi,Kedi Fan,Di Yuan,Lincong Qu,Qiang Fu, "K-means Optimization clustering Algorithm Based on Particle Swarm Optimization and Multiclass Merging", Advances in CSIE, Vol 1,2012. [9] Jin-Cherng Lin,Yueh-Ting Lin,Han-Yuan Tzeng and Yan-Chin Wang, "Using Computing Intelligence Techniques To Estimate Software Effort", International Journal of Software Engineering and Applications, Vol 4,2013.
AUTHORS First Author – M.Kowsalya, M.E(Computer Science and Engineering Department), Thiagarajar College Of Engineering, Madurai , [email protected]. Second Author – H.OormilaDevi, M.E(Computer Science and Engineering Department), Thiagarajar College Of Engineering, Madurai , [email protected] Third Author – N.ShivaKumar, Assistant Professor(Computer Science and Engineering Department), Thiagarajar College Of Engineering, Madurai , [email protected].

International Journal of Scientific and Research Publications, Volume 7, Issue 4, April 2017 326 ISSN 2250-3153
www.ijsrp.org
SERVICE MANAGEMENT AND HUMAN RESOURCES MANAGEMENT OF EDUCATIONAL
INSTITUTIONS IN JAKARTA, INDONESIA Dr. Mustainah, M.Si
Department of Public Administration
University of Tadulako Palu, Central Sulawesi, Indonesia [email protected]
Abstract—A high quality service is a must for any educational institutions. The reason is simply because by providing a high quality service, the educational institutions will not merely have economic benefits, but more importantly it could make the institutions becoming as the second home of the students and other stakeholders of the schools. However, studies examining the quality of the service management and the human resources of educational institution in Indonesia have been limited. For this reason, this study using secondary data, observations and experiences aims at examining these issues. The study found that the educational institutions in Jakarta still needed many improvements not only in terms of the service management, but also in terms of human resource management. The new paradigm of service management based on navigational map can be used as the guide in formulating educational programs. This is because there have been many changes in the educational needs as a consequence of the globalization. To improve service management, there are at least five dimensions that need to be improved. These dimensions are tangibles, reliable, responsiveness, assurance and empathy. Furthermore, it was found that the educational institutions in Jakarta are still needed to improve their human resource management. This can be done, for instance, by making a good planning, recruitment and selection and training and development as well as performance assessment. Finally, a conducive environment in the institutions should also be improved in a better shaped by motivating the employees and improve the job satisfaction of the staff and lecturers working in the institutions. A better compensation in the form of wage salary and awards should be in accordance with the performance of employees. Thus, much remain to be done by the educational institutions in Jakarta.
Index terms- service management, human resources management, motivation, work ethics, job satisfaction, educational institutions,
I. INTRODUCTION
Educational institution was established in order to educate the people of any nations. The success factor of the educational institution in the current globalization era was not determined by the number of graduates, but it depends on the ability of the institutions to give satisfaction as well as benefits to the students and other stakeholders including the staffs, lecturers/teachers and members of other educational institutions. These stakeholders play important roles in supporting the institution to reach the goals. The staffs, lecturers/teachers and members of other educational institutions here are called as organizational members. These mean that if the members of the organization are satisfied and motivated with their works, then the services given by them to the students and the stakeholders will also be satisfaction. If not, both the members of the institution and the students will not be satisfied and motivated. Motivation, spirit and moral support are the part of work ethics. All of these factors need to be given attention by any educational institutions.
A high quality service given by the educational institution may be realised if and only if the members of the institution have a work ethic, motivation, job satisfaction and high morale in the work. The job satisfaction of the member of educational institutions can be realized if the working environment is well managed by an excellent human resources management. Job satisfaction can also be supported by the provision of adequate salaries given to the staffs

International Journal of Scientific and Research Publications, Volume 7, Issue 4, April 2017 327 ISSN 2250-3153
www.ijsrp.org
and lecturers in the educational institution. This statement was in line the views highlighted by Robbins and Judge (2009: 118-119):
"In fact, of the major job-satisfaction facets (work itself, pay, advancement opportunities, supervision, co-workers). You've probably noticed that the pay comes up Often when people discuss job satisfaction ".
Robbins and Judge (2009: 225) further added that:
"Although it's clear that so-called re-enforcers such as pay can motivate people, it's just as clear that for people the process is much more complicated than stimulus-response".
Thus, when the educational institutions paid an adequate salary, it is no doubt the lectures, staffs and other employees in the institution will be satisfied on one hand and they prepare to work more productive.
One of the services that need to be given attention by the educational institutions is when the institution opens the student recruitment process. Activities that are needed to be given high quality services at this stage are not only limited at the students’ acceptance state, but it also include when the potential students have to fill out the registration form, registration payment, entrance testing as well as after they have been stated that they are accepted by the educational institution. To make the services given to the potential students satisfactorily, the educational institution should provide conducive facilities and incentives to the staffs to serve well. These conditions are important to make the staffs working professionally, integrity, highly motivated, and satisfactorily.
However, studies that examine the quality of services given by the educational institutions are relatively limited. For this reason, this paper aims at examining the management services, Human Resource Management and the influence of the behaviour of the educational institution toward high quality services. As there have been many educational institutions in Indonesia, this study will focus on the educational institutions in Jakarta, the Capital City of Indonesia. Methods used to collect the data and information were by using secondary data supporting by direct observation and experiences as lecturer at the university of Tadulako, Palu, Central Sulawesi, Indonesia. Before discussing the above issues, section 2 below will address definitions and concepts of human resources management including the high quality services, work ethics, and motivation advanced in the literatures as the background. Section 3 then discussed the results of the study. Finally, concluding notes are drawn in section 4.
2. LITERATURE REVIEW
A high quality service or locally called pelayanan prima can easily be defined as a superior service given to any people. Deming cited in Hasibuan (2001) defined quality as a predictable degree of uniformity and dependability at low cost and suit to the market. Whilst Philip Crosby cited in Hasibuan (2001) defined quality as conformance to requirements, not goodness. These definitions suggest that the quality refers to conformity towards the demands. These demands associated with consumers or customers, price and market price. In other words, the quality of goods and services is determined by the comfort perceived by the user as well as the price level expected by customers towards the goods or services.
Lindsay (1997: 111), however, defines quality is meeting or exceeding customer expectation. This means that the quality must meet customer expectations. Further, Malcom (2000:124) views quality if it is meeting customer requirements, fitness for purpose, and perhaps even delighting our customers. This means that the quality is meeting the demands of customers, suitable and even enlightening consumers. Whilst Gaspers (1998:245) simply defines quality if it is meeting the need of the customer. In other words, quality is everything that is able to meet the desires or needs of customers. Similarly, Fields (2013:76) defines quality if it is meeting or exceeding the expectation of your customers.
Unlike the above definitions, Certo (2010:98) defines quality in a broad sense. He defines quality as the degree on the which the product and service can be ranked on the basis of selected features or characteristics. In other

International Journal of Scientific and Research Publications, Volume 7, Issue 4, April 2017 328 ISSN 2250-3153
www.ijsrp.org
words, the quality is the degree to which a product or service can be determined and ranked based on appearance and characteristics. However, Griffin (2004:225) defined quality as the totality of features and characteristics of a product or service that bear on its ability to satisfy state or implied needs. Barnet (1985:123) defined a quality related to product in that he said that a quality product or service is one that is fit for its intended purposes and is produced at an acceptable cost.
Furthermore, Ross (2011: 89) defines quality by distinguishing characteristics of products and service. He distinguished characteristics of products and services by : (1) the behaviour of the delivery person, (2) the image of the organization, (3) the measure of output, but it does not relate with the variance and acceptance and it should be adjusted with the control system if the customer is present. Lindsay Patrick stressed the quality into the following dimensions, that is, time, timeliness, completeness, courtesy, consistency, accessibility and convenience, accuracy, responsiveness. Finally, Zeithaml cited by Hasibuan ( 2001) views quality based on five dimensions, namely, tangibles, reliability, responsiveness , assurance and empathy. Tangibles dimension in quality services include physical facilities, equipment, employees, and means of communication. Dimensions reliability includes the ability to provide the services promised to promptly and satisfactorily. Dimensions of responsiveness include interest in providing services to customers quickly and well. Dimensions assurance cover ability, courtesy, and trustworthiness owned by the employees without any doubt. Finally, empathy dimensions include ease in the relationship.
Therefore, definition of quality has been many in the literatures. These suggest that the definition of quality varies in the context of costumers’ demand and expectation, product and services offer by the company or organization and appearance and characteristics of products.
In terms of the definition of Human Resource Management (HRM), there are also many definitions. Hadari Nawawi (2001: 42) defined HRM as the process of utilizing the human resources as workers in a human way so that the potential physical and psychological functioning optimally to the achievement of its objectives organisation. Whilst Anwar King Mangkunegara (2005: 2) defines HRM as a planning, organizing, coordinating, implementing and monitoring of procurement, development, provision of remuneration, integration, maintenance, and the division of labour in order to achieve organizational goals.
Moreover, Hariandja (2002: 23) defines HRM as an activity to enhance the contribution of human resources in achieving organizational goals. Achievement of these goals is done through a variety of activities that is preparation and procurement activities which include job analysis, human resource planning, recruitment and selection, assessment, development, compensation, job satisfaction and motivation, and increase the synergistic relationship between management and workers.
Finally, Henry Simamora (2010) defines HRM as utilization, development, assessment, provision of services and management replies to individual members of the organization or working group. HRM also involves the design and implementation planning, personnel, employee development, career management, job evaluation, compensation of employees and a good labour relations.
The work ethic, according to Sinamo (2009: 27) however, was defined into eight forms : 1. work is a grace (I worked sincerely and grateful) .2. Work is a mandate (I really worked with full responsibility) .3. Work is a duty call (I work with full integrity) .4. Work is actualization (I work excitedly hard) .5. Work is worship (I work seriously with full of love) .6. Work is art (I work creatively and smartly. 7. Work is an honour (I worked diligently with full advantage) .8. Work is as my serve (I worked with full hearted ). Further Sinamo (2009: 245) views that if you concentrate you serve your customers, then you do not need to chase money, because money will always come to you, now and forever.
The definition of motivation has also been many. Stoner and Freeman (1989: 425), for instance, define motivation as factors that cause, distribute, and maintain people's behaviour. Whilst Moorhead and Griffin (1992: 127-128) define motivation as a series of impulse that causes people to behave in a certain way. The point here is that the individual will be easily motivated to some different things. Weihrich and Koontz (1993: 462-465), however,

International Journal of Scientific and Research Publications, Volume 7, Issue 4, April 2017 329 ISSN 2250-3153
www.ijsrp.org
define motivation as a general term that applies similar impulses, that is, if leaders motivate employees, they expect that employees will be able to work anything that is expected by the institutions.
Similar to the above definition, Robbins (1993: 205-206) defines the motivation as the desire to expend great effort for the achievement of organizational goals which is conditioned by the business's ability to satisfy individual needs. In other words, motivation is a process that motivates needs. Dessler (2001: 320 -321) defines motivation as the intensity of one's desire to do some activities. In this case the most important task of a leader is to motivate employees, while Mullins (2005: 471-472) defined motivation as the persistence to do actions or the freedom to make an action. Mullins (2005) suggests four characteristics of the underlying definition of motivation, namely (1) the motivation is symbolized as an individual phenomenon, (2) motivation is described usually as an intention, (3) motivation covers various aspects, (4) to predict behaviour.
Also, Daft (2005: 294) defines motivation to refer to the internal and or external encouragement to someone who raises enthusiasm and persistence to pursue a series of specific actions. The motivation here is expected to affect the employees to increase productivity of services and is the leader's job to channel motivation toward its goals and vision of the organization. Whilst Gomez-Mejia and Balkin (2002: 300-301) define motivation as what is done by the effective leaders to give energy, driving and sustaining business employees.
There have been many other definitions of motivation advanced in the literature. Robbins and Judge (2007: 209) defined motivation as a process that is associated with the intensity, direction, and persistence of individual efforts towards achieving objectives. In this case the intensity related to how hard a person tries. Effort directed towards and consistent with the goals of the organization is the type of business you are looking for. In the end, the motivation has a persistence dimension that measures how long a person can maintain their business. Also, Gibson (2006: 132) defines the motivation as the inner factors that push individuals to initiate and direct his/her behaviour. This means that there is a difference in motivation and behaviour intensity. It also shows the direction of individual behaviour.
Similar definition to the above has been put forward by Colquitt (2009: 178-179). He defined motivation as a series of vigorous encouragement that comes from within and outside the employee, who started the business in connection with the work, and determine the direction, intensity and persistence. This definition is supported by Nelson and Quick (2006: 150) in that they defined motivation as the process of moving and maintaining of individuals towards goals, while Newstrom (2007: 101) defines motivation as a series of internal and external factors that led to employees to select a set of actions and perform certain behaviours. Ideally, this behaviour is directed at achieving organizational goals. Finally, Luthans (2008: 158) defines motivation as a process that starts from psychological deficiency into active behaviour intended to achieve the goals or incentives. The key to understanding the motivation process lies at the meaning of the relationship between needs, drives, and incentives.
In terms of the job satisfaction, there are also many definitions. In this paper, there are only five definitions are cited here. The first is the definition given by Qolquitt, Le Pine and Wasson (2010). They defined job satisfaction as the state of emotional pleasure resulting from the appraisal of one's job or job experiences. This means that job satisfaction is defined as an unpleasant emotional state assessment results from a job or work experience. Whilst Gibson, et.al. (1987) defined job satisfaction as an attitude that individuals have about their jobs. This means that job satisfaction is the individual's attitude towards his job. Gibson, et al (1987) also suggest that based on the Path-Goal Model theory, job satisfaction apart from the performance, it also includes an outcomes that are influenced by perception and work motivation of the employees.
Moreover, Robbins (2007) defines job satisfaction as a positive feeling about one's job resulting from an evaluation of its characteristics. This means that job satisfaction is a positive feeling about the work of someone as the result of an evaluation of his/her characteristics. Whilst Mullins (2005) defines job satisfaction as a complex and multifaceted concept, which can mean different things to different people. This suggests that job satisfaction is a complex concept of the various aspects that can have different meanings for different people. Finally, Ivancevich, Konopaske and Matteson cited in Gibson (1987) define job satisfaction as an attitude that workers have about their
International Journal of Scientific and Research Publications, Volume 7, Issue 4, April 2017 330 ISSN 2250-3153
www.ijsrp.org
jobs, it results from their perception of the jobs. This indicates that job satisfaction is employee attitudes towards work which is the result of the perception of the work (Gibson, 1987: 99).
III. RESULTS AND DISCUSSION
The study found that any educational institutions have done service management in their institutions to minimise competition among educational institutions. However, the service management that was offered to the stakeholders is mostly the same between one institution and others. Due to the tight competition as a consequence of the globalization era, many educational institutions especially in Jakarta shift their service management paradigm from the old paradigm to the so called the 'navigation map' as a guide of their working program. This “new” paradigm is intended to raise the confidence of internal parties, while a new image is intended to restore the confidence toward the external party. The mentioned new paradigm above can be illustrated as in Diagram 1 as follows :
Diagram 1. The Navigational Map
From the above Diagram 1, it can be seen there have been many changes of the educational institution. These changes are as follows. The first is to change the organization's vision and mission of the institution. The new vision is to "to become the educational institution at the national level that is able to provide the best educational services at competitive prices to any market segment. The second is to have benchmark to other similar educational institutions.
The above changes are done among others by improving the service management. These changes of service management are undertaken by following Zeithaml service management methods. These are by improving five dimensions, namely, tangibles, reliability, responsiveness, assurance and empathy. Changes in tangibles dimension in
Internal Changes
Educational Institution
External changes
Vision-Mission towards new Educational Institution
New strategy
New Culture
New Image
International Journal of Scientific and Research Publications, Volume 7, Issue 4, April 2017 331 ISSN 2250-3153
www.ijsrp.org
quality services include physical facilities, equipment, employees, and means of communication. Changes in reliability dimension include the ability to provide the services promised to the stakeholders promptly and satisfactorily, whilst changes in responsiveness dimension include the desire to give service to customers promptly and properly. In terms of changes in assurance dimensions, the educational institution in Jakarta improved their ability, courtesy, and trustworthiness to the employees. Finally, in terms of empathy dimensions, changes are made in respect to individual attention to customers.
Towards human resources management, apart from updating the vision and mission of the institutions, there are changes that were made particularly in respect to the leadership. This leadership changes is considered is necessary in facing the current conditions in that the leaders should be more alert, nimble and more willing to take decisions to improve organizational performance. However, the leadership changes that were made by the institution are considered not so simple. This is because if it is not wisely done, it will negatively affect the performance of the organization. For this reason, changes toward leadership in service management should be carefully done.
Thus, details changes in the leadership in particular and human resources management in general in the educational institution need further developed in accordance to the educational institution in question. The management of human resource should be based on a concept that every human being is not a machine and they are not merely an organizational resource that can be used only to reach a common goal of the organization. There are at least three aspects in making human resource management well-implemented. These include the importance of a good planning, recruitment and selection process, and training, development and performance assessment. As stated by Armstrong (1997: 507) and Harris and De Simone (1992: 2) that : "Human resource development can be defined as a set of systematic and planned activities designed by an organization to provide its members with necessary skills to meet current and future job demands.
In respect to work motivation towards employees, as mentioned previously that work motivation has influence towards the achievement of institutional goals. If the employees are motivated to do the job, the institution will easily reach the goal. As stated by Stoner and Freeman (1989: 425), that the motivation are factors that cause, distribute and maintain people's behaviour. Of many external factors that can drive motivation, the leader plays important role. The leader should try hard to design work to motivate employees to perform their jobs well, enjoy their work and receive the results he/she deserves. The leader need to focus on what makes a job can be motivated intrinsically. By the time employees are intrinsically motivated, then a good performance will make them feel good. These feelings motivate the employees to continue their job well. This hopefully will result a good performance at a higher level. This good performance will further be self-reinforcing. The important of work motivation has been known by the leader of the educational institutions in Jakarta. However, the study found that this work motivation has been given limited attention by the educational institution in Jakarta.
Finally, in respect to job satisfaction, the study found that there still limited attention towards job satisfaction. This is particularly related not only to the work itself, but also to salary payment, promotion, supervision and co-workers. The work itself is generally a facet that is most closely associated with high levels of job satisfaction overall, with interesting jobs that provide training, variety, freedom and control, satisfying the majority of employees. In other words, most individuals prefer work that is challenging and uplifting of the working predictable and routine. This is in line with the theory of job satisfaction expressed by Robbins (2007).
Job satisfaction also has relationship with motivation, but the nature of the relationship is not clear. This is because job satisfaction tend towards attitude that comes from the inside of an employee. Job satisfaction may be associated with one's feelings for a success of both quantitative and qualitative. Job satisfaction is one of the few working attitude of someone in organizational behaviour. In addition to job satisfaction, there are other work attitudes such as job involvement, and organizational commitment. Work attitude contain positive or negative evaluations owned by employees about aspects of their work environment. Job satisfaction is also influenced by factors of motivation, meaning employees who are highly motivated in carrying out its activities are expected to provide job satisfaction for him/her as an individual. Likewise, low motivation can minimise an individual to satisfy with his/her jobs. The main benefit of motivation is to create passion towards his/her works, so that the job satisfaction increases.

International Journal of Scientific and Research Publications, Volume 7, Issue 4, April 2017 332 ISSN 2250-3153
www.ijsrp.org
Therefore, further efforts should be directed and more consistent with the purpose of the organization's objectives. The contribution of leadership and the role of HRM are critical in directing and motivating the employees of the educational institution in Jakarta. If not, the contribution of the stakeholders of the educational institutions in Jakarta will very much minimum. This will further lead not only to low quality of the graduates, but it also affects the competitiveness of the educational institutions in facing the dynamic changes of education systems.
IV. CONCLUDING NOTES
The educational institutions in Jakarta still needed many improvements not only in terms of the service management, but also in terms of human resource management. The reason is simply because both the service and human resource management play critical roles in achieving the institutional goal as well as improving the quality of the students in particular and nation in general.
The new paradigm of service management based on navigational map can be used as the guide in formulating educational programs. This is because there have been many changes in the educational needs as a consequence of the globalization. To improve service management, there are at least five dimensions that need to be improved. These dimensions are tangibles, reliable, responsiveness, assurance and empathy.
Furthermore, it was found that the educational institutions in Jakarta are still needed to improve their human resource management. This can be done, for instance, by making a good planning, recruitment and selection and training and development as well as performance assessment. Finally, a conducive environment in the institutions should also be improved in a better shaped by motivating the employees and improve the job satisfaction of the staff and lecturers working in the institutions. A better compensation in the form of wage salary and awards should be in accordance with the performance of employees. Thus, much remain to be done by the educational institutions in Jakarta.
REFERENCES (1) Anwar Prabu Mangkunegara, 2001. Manajemen Sumber Daya Manusia. Bandung. PT. Rosda Karya. (2) Dessler, G. 1997. Manajemen Sumber Daya Manusia Jilid 1 Edisi 7. PT. Prenhalindo. Jakarta. (3) Hasibuan, Melayu SP, 2001. Manajemen Sumber Daya Manusia. Edisi Revisi: Bumi Aksara. Hal.202 (4) Moch, As’ad. 1995. Psikologi Industri. Jakarta: Liberty. Hal. 104 (5) http://mypsikologiawesome.blogspot.co.id/2013/11/pengembangan-sdm.html (diakses pada 10 Februari 2017) (6) http://adiprakosa.blogspot.com/2007/12/teori-komunikasi-organisasi.html (7) http://jurnal-sdm.blogspot.co.id/2009/07/iklim-komunikasi-dalam-organisasi.html (8) http://info-gua.blogspot.com/2010/05/pengaruh-komunikasi-organisasi-terhadap.html (9) http://joejoe.blogdetik.com/2010/05/20/komunikasi-dalam-organisasi/ (10) Stoner, James A.F., 1996. Manajemen. Jakarta. Erlangga. (11) Sugitono. 2001. Metode Penelitian Bisnis. Bandung. CV. Alfabeta. (12)Wayne Pace dan Don F. Faules. 2006. Komunikasi Organisasi; Strategi Meningkatkan Kinerja Perusahaan.
Bandung: PT Remaja Rosdakarya. (13)Winardi, Kepemimpinan Dalam Manajemen. Jakarta: PT Rineka Cipta. 2000. Hal. 161.

International Journal of Scientific and Research Publications, Volume 7, Issue 4, April 2017 333 ISSN 2250-3153
www.ijsrp.org
Water Quality Assessment Of Wyitt and Environs, Part Of Jos-Bukuru Metropolis, North
Central Nigeria
Joyce Ayuba Ramadan* Department of Mineral and Petroleum Resources Engineering, Plateau state Polytechnic, Barkin Ladi, P. M.B 02023, Bukuru,
Plateau state. Abstract - The quality of the water resource within the area was imperative owing to the fact that the most decent source utilized by the residents for domestic and other uses is the groundwater from wells and boreholes. This aroused the need for the chemical and bacteriological analysis of both ground and surface water within the study area with the sole aim of verifying the water sources in order to determine the suitability for consumption which would aid in controlling outbreaks of water borne diseases within the area of investigation. The Garmin Global Positioning System (GPS) was used to locate the sample points with a total of 36 (thirty six) water samples represented by 15 (fifteen) groundwater from wells and 3 (three) stream channels all taken in pairs inside sterilized polythene containers and subsequently transported to the laboratory. A pair of 18 (eighteen) samples were analyzed for the following chemical constituents Cr, As, Ca, Fe and Mg; others include Pb, Cd, Ni and K. using the Atomic Absorption Spectrometry (AAS) technique. The second pair of 18 (eighteen) water samples were analyzed for microbes employing the tube dilution method in order to test for total coliform bacteria resulting to the Total Coliform Counts (TCU) which gives a general indication of the sanitary condition of a water samples taken. The results from the both analyses were compared with the World Health Organization (WHO) standard for drinking water quality. The outcome from the chemical analysis reveal arsenic abov the WHO standard in sample 1,2,3,4,5,13,15 and 18, likewise iron in samples 3,4,5,6,7,8,9,10,11,13,15 and 16. Lead was also discovered above the required standard in samples 3,13 and 16; similarly, Cadmium was detected in sample 3 and 11 in excess of the standard value. Sample points 2,3,4,6,7,8,10 and 16 contained nickel above the WHO permissible level. The microbial analysis of the samples equally revealed an alarming contamination with all the samples which contained coliform bacteria. The surface water sources represented by sample 1,3 and 5 were more contaminated with an evidence of the infiltration of same in the wells situated close to these sources(SP 2 and 4). Treatment of both surface and groundwater sources within the area before consumption was recommended to lessen the health hazards that inhabitants would be exposed to. Index Terms- Chemical, Bacteriological, Groundwater, Surface water, Analysis
1. INTRODUCTION The study area is located within the Jos-Bukuru metropolis and has experienced a sudden growth in population lately; this has led to an intense competition on the available resources including water. Also, the generation and indiscriminate dumping of wastes in water ways and the use of available land resources for dry and wet season farming with the application of fertilizer to same has triggered this piece of research. The main objective here is to establish the evidence of the interaction between the human activities and the water sources within the study area. However, it is pertinent to note the fact that the inhabitants within the area depend solely on groundwater for domestic use as no pipe-borne water is connected in the area. Therefore the health and well being of the population depends on the quality of this very fundamental resource. Surface water is open to several kinds of abuse which renders it more contaminated than groundwater though the two sources are interdependent as surface water in most cases recharges the groundwater. Generally, it is difficult to correct groundwater pollution depending on the level and type of groundwater pollutants [2] and so, the need for the protection of both sources. In general, shallow aquifers are mostly affected from the negative impacts of anthropogenic soil use in urban agglomerates and owing to the large quantity of effluent discharged into most surface waters, the natural processes of pathogen reduction are inadequate for protection of public health [13] posing a significant danger to the immediate consumers of same as sanitizing the waters will be expensive and may not even be achieved before use. Prevention of water sources is therefore important and this requires effective monitoring by sampling the parameters from time to time as check. The bacteriological examination of water has a special significance in pollution studies, as it is a direct measurement of lethal effect of pollution on human health [13]. So also the chemical investigation as

International Journal of Scientific and Research Publications, Volume 7, Issue 4, April 2017 334 ISSN 2250-3153
www.ijsrp.org
this enables one to identify and quantify the chemical components and properties of a certain water. This usually forms the groundwork for water quality and pollution studies.
2. LOCATION, PHYSIOGRAPHY AND GEOLOGY The area under investigation is part of the Jos Plateau, located in the north-central part of Nigeria (Fig. 1) and lies within latitudes 80 51’ 33’’N and 80 52’ 26’’N and longitudes 90 47’ 30’’E and 90 49’27’’E (Fig. 2). It covers an area extent of about 4.0 km2, and is accessible through several untarred roads and footpaths linking the major Jos-Bukuru express way. The settlements are situated on a gently undulating terrain with mined out areas (ponds) sited at the eastern part of the study area. The topographic elevations vary from 4000m to 4200m above sea level and is drained up by a major river channel which is a tributary of river N’gell (fig. 2). The study area is underlain by the rocks of the Basement complex which were intruded by Younger Granite complex rocks (fig. 3) seen as outcrops within the area. These rocks include the Rayfield Gona biotite granite, Bukuru biotite granite, N’gell biotite granite and the Jos biotite granite.
3. METHODS OF STUDY The equipment used to carry out this research include the Global Positioning System (GPS) used to take the coordinates as well as the elevations of the sampling points .In addition, 18 (eighteen) water samples were collected from a mined-out pond (dumpsite), stream channels (seasonal farmlands) and wells in sterilized plastic containers which were labeled appropriately and taken to the laboratory for analysis. This was done in pairs so as to conduct both the chemical and bacteriological analysis concurrently.
A. Chemical Analysis Atomic Absorption Spectrometry (AAS) is a technique for measuring quantities of chemical elements present in environmental samples by measuring the absorbed radiation by the chemical element of interest [10]. A total number of eighteen (18) water samples were collected in sterilized polythene containers, which were labeled appropriately. These were acidified with conc. HNO3 for preservation and then immediately transported to the laboratory for the analysis using Atomic Absorption Spectroscopy (AAS) technique. The samples were first of all stored under refrigeration to stabilize the metals for up to two weeks and then analyzed directly with 1-2% of HNO3 at blank and standard level. One (1) liter of each of the samples was evaporated with 25ml of HNO3 to 100ml volume for 10 times concentration and analyzed with aqueous 1-2% of HNO3 blank and standard to give total metal which are extractable, suspended and dissolved. While analyzing for Lead (Pb) only, one (1) liter of sample was extracted with a pH=2, with 0.2 grams Dithizone and 20ml MIBK for a 50 times concentration which was further analyzed with oil-based Pb standard in MIBK and extracted at an aqueous standard for calibration. Also, the Global Positioning System (GPS) was used to document the exact locations where these samples were acquired and plotted eventually on the map.
B. Bacteriological analysis The microbiological examination of water emphasizes assessment of the hygienic quality of the supply. This requires the isolation and enumeration of organisms that indicate the presence of faecal contamination (www.who.int/water_sanitation_health/dwq/2edvol3d.pdf). Similarly, a set of eighteen (18) water samples were collected in sterilized plastic containers and transported to the laboratory for the microbial analysis which was done to determine the Colony Forming Unit (CFU) i.e. coliform bacteria (Escherichia coli) present in the samples using the tube dilution method. 1ml of each sample was inoculated into 10ml of already prepared sterile lactose broth containing inverted durham tubes. The tubes were then incubated at 37 C for 24 hours and further observed for acid and gas production which is usually an indication of the presence of coliform.

International Journal of Scientific and Research Publications, Volume 7, Issue 4, April 2017 335 ISSN 2250-3153
www.ijsrp.org
Fig. 1 Location Map of the Study Area
Sokoto
Borno
Bauchi
Niger
Rivers
Lagos
FCT Plateau
kirana
Whyitt
C o go ye g
4000
4050
4150
4200
8 5 60
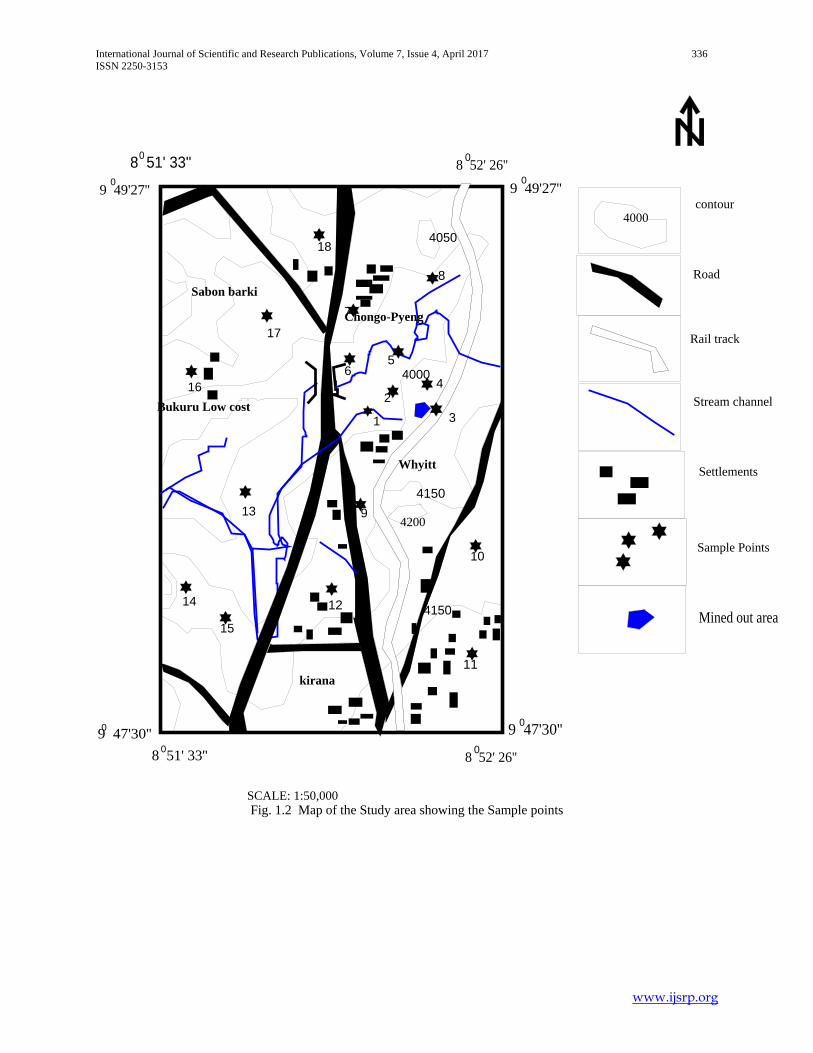
International Journal of Scientific and Research Publications, Volume 7, Issue 4, April 2017 336 ISSN 2250-3153
www.ijsrp.org
Fig. 1.2 Map of the Study area showing the Sample points
kirana
Whyitt
Chongo-Pyeng
Sabon barki
Bukuru Low cost
4000
4050
4150
4200
4150
4000contour
Road
Rail track
Stream channel
Settlements
Sample Points
1
23
4
56
7
8
9
10
11
12
13
14
15
16
17
18
8 51' 33''0
8 51' 33''08 52' 26''0
8 52' 26''09 47'30''0 9 47'30''0
9 49'27''0 9 49'27''0
SCALE: 1:50,000
Mined out area
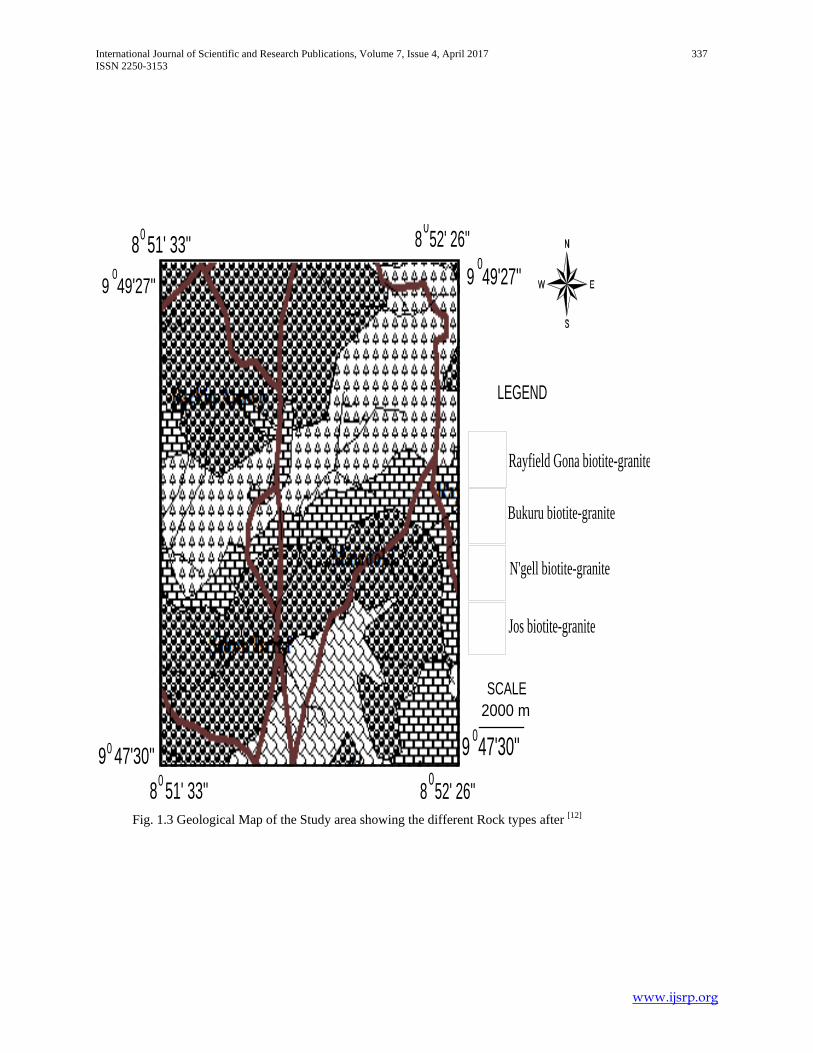
International Journal of Scientific and Research Publications, Volume 7, Issue 4, April 2017 337 ISSN 2250-3153
www.ijsrp.org
Fig. 1.3 Geological Map of the Study area showing the different Rock types after [12]
Rayfield Gona biotite-granite
Bukuru biotite-granite
N'gell biotite-granite
Jos biotite-granite
LEGEND
SCALE2000 m
8 51' 33''09 47'30''0
8 52' 26''0
9 47'30''0
8 51' 33''0
9 49'27''0
8 52' 26''0
9 49'27''0

International Journal of Scientific and Research Publications, Volume 7, Issue 4, April 2017 338 ISSN 2250-3153
www.ijsrp.org
4. RESULTS AND DISCUSSIONS A. Chemical Analysis
The outcome of the chemical analysis of the samples collected were compared with the World Health Organization (WHO) standard for drinking water quality as displayed on Table 1 below. This was done to check the excesses /deficiencies and proffer solutions that would be useful to the inhabitants within and around the area under investigation. pH is categorized as one of the most significant water quality parameters. Measurement of pH relates to the acidity or alkalinity of the water where a sample is considered to be acidic if the pH is below 7.0 or alkaline if above 7.0. The pH values of all the samples were measured range from 6.5 – 7.0 (Table 1) below. This was achieved on the field, using a pH meter. All the values recorded against the sample points fall within the WHO standard range of 6.5 – 8.5 and are therefore considered acceptable. Chromium (Cr) is one of the less common elements and does not occur naturally in elemental form, but only in compounds. Major sources of Cr-contamination include releases from electroplating processes and the disposal of Cr containing wastes [16]. The chemical analysis confirm that there is no Cr- contamination in any of the samples collected, which is evident in the display of results in Table 1 above. Arsenic (As) was also analyzed for and detected above the WHO permissible level in Sample Points (SP) 1,2,3,4 and 5, others include SP 13,15 and 18 (Table 1) above. Arsenic is associated with skin damage, increased risk of cancer, and problems with circulatory system [15]. Also Long-term exposure to arsenic via drinking-water causes cancer of the skin, lungs, urinary bladder, and kidney, as well as other skin changes such as pigmentation changes and thickening (hyperkeratosis). Calcium (Ca) was detected in all the samples collected as displayed in Table 1above; and within the acceptable WHO standard for drinking water quality. Iron (Fe) making up at least 5 percent of the earth’s crust, iron is one of the earth’s most plentiful resources. Rainwater as it infiltrates the soil and underlying geologic formations dissolves iron, causing it to seep into aquifers that serve as sources of groundwater for wells. Iron is not hazardous to health, but it is considered a secondary or aesthetic contaminant and the WHO recommends that the iron content of drinking water should not be greater than 0.3 mg/L (Table 1). On the contrary, the iron content of groundwater is important in small amounts because it helps transport oxygen in the blood [8]. From the analysis of the samples collected within the study area, SP 3,SP 4, SP 5,SP 6, SP 7 and SP 8 contained iron above the recommended quantity by WHO. Similarly, SP 9, SP 10, SP 11, SP 13, SP 15 and SP 16 comprised iron which exceeded the recommended limit (Table 1). Magnesium (Mg) is present in all natural waters and have many beneficial effects which makes it essential to human health [3]. All the samples analysed within the area of investigation comprised magnesium within the acceptable WHO standard limit as shown in Table 1. Lead (Pb) is a toxic metal that is harmful to human health. It has been estimated that up to 20 % of the total lead exposure in humans can be attributed to a waterborne route, i.e., consuming contaminated water [5]. From the investigation conducted, lead (Pb) was discovered above the WHO standard in SP 3, SP 13 and SP 16 and high levels of lead contamination in a child can result in convulsions, major neurological damage, organ failure, coma, and ultimately death. Moderate to low levels of exposure may result in hearing loss, inhibit growth, and cause learning disabilities [4]. It is pertinent to note that some of the effects of lead poisoning cannot be cured, but it is possible to reduce exposure to lead.

International Journal of Scientific and Research Publications, Volume 7, Issue 4, April 2017 339 ISSN 2250-3153
www.ijsrp.org
Cadmium (Cd) is a metal found in natural deposits as ores containing other elements. Cadmium occurs naturally in zinc, lead, copper and other ores which can serve as sources to ground and surface waters, especially when in contact with soft, acidic waters. Major industrial releases of cadmium are due to waste streams and leaching of landfills, and from a variety of operations that involve cadmium or zinc. In particular, cadmium can be released to drinking water from the corrosion of some galvanized plumbing and water main pipe materials[7] within the study area, Cadmium was detected in some samples though below the WHO permissible level while in some others it was not detected at all. However in SP 3 and 5, cadmium was discovered above the WHO permissible level (Table 1) and it is not surprising as the sample was collected from an abandoned Tin mine pond though in use as irrigation water for dry season farming. The potential dangers to human health if exposed to it over a prolonged period of time are kidney, liver, bone and blood damage. Nickel (Ni) is a naturally occurring, hard but pliable, silvery-white metal found in nearly all soils or released through industrial wastewater which ends up in soil or sediment where it attaches to particles containing iron or manganese. Therefore when it rains small particles of nickel in the soil can be washed into surface water by runoff combined with other elements to form compounds that are often green and dissolve fairly easily in water. Major sources of exposure for most people are by eating food and drinking water that contain natural amounts of nickel [11]. From the display of results in Table 1, nickel was observed above the WHO standard in SP 2, 3, 4, 5, 6, 7, 8 and 10 which could be quite hazardous to the human health if it gets into the system by any means. The most common harmful health effect of nickel in humans is an allergic reaction, others include cancers and birth defects [1]. Potassium (K) is an essential element in humans and is seldom, if ever, found in drinking water at levels that could be a concern for healthy humans. This is factual of all the samples collected within the study area as displayed in Table 1.
B. Microbial Analysis In like manner, Table 2 below is an exhibition of the results of the microbial analysis placed side by side with the World health Organization standard. Coliforms are bacteria that are always present in the digestive tracts of animals, including humans, and are found in their wastes. They are also found in plant and soil material [6]. It is important to note that the presence of pathogens is determined with indirect evidence by testing for an “indicator” organism such as coliform bacteria. The most basic test for bacterial contamination of a water supply is the test for total coliform bacteria resulting to the total coliform counts which gives a general indication of the sanitary condition of a water supply. From the analysis of the water samples carried out within the study area, it is apparent that all the samples contain coliform bacteria (Table 1), however Total coliform bacteria are not likely to cause illness, but their presence indicates that your water supply may be vulnerable to contamination by more harmful microorganisms [9] thereby increasing the risk of contracting a water-borne illness.
5. CONCLUSION This research revealed that the surface water sources (SP 1, 3 and 5) are more contaminated than the well/groundwater sources. Also, it would not be out of place to conclude that the surface water sources contribute immensely to recharging groundwater within the area; this was made evident by the groundwater samples collected from wells sited closer to the streams and pond (SP 2 and 4) which comprise more contaminants than the wells sited farther away from the surface sources. In addition, from the results of the chemical and bacteriological analysis a presentation of most of the drinking water sources show contamination and if consumed without treatment then health problems would be imminent.
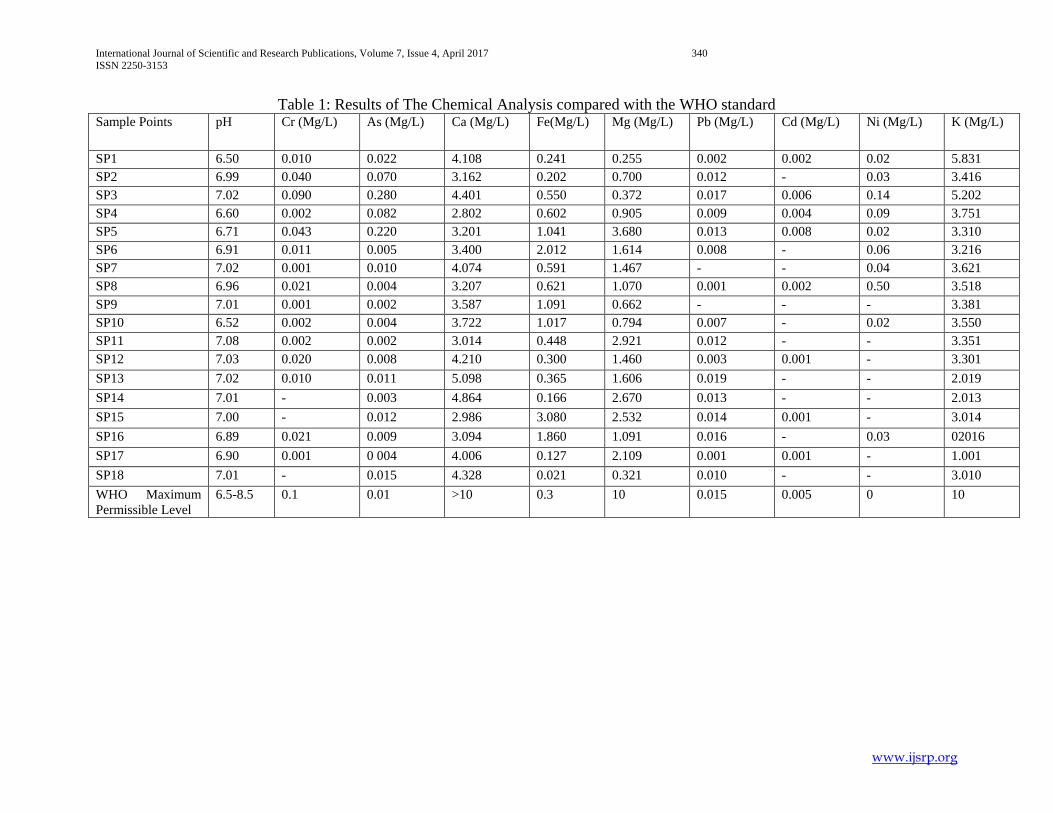
International Journal of Scientific and Research Publications, Volume 7, Issue 4, April 2017 340 ISSN 2250-3153
www.ijsrp.org
Table 1: Results of The Chemical Analysis compared with the WHO standard Sample Points pH Cr (Mg/L) As (Mg/L) Ca (Mg/L) Fe(Mg/L) Mg (Mg/L) Pb (Mg/L) Cd (Mg/L) Ni (Mg/L) K (Mg/L)
SP1 6.50 0.010 0.022 4.108 0.241 0.255 0.002 0.002 0.02 5.831 SP2 6.99 0.040 0.070 3.162 0.202 0.700 0.012 - 0.03 3.416 SP3 7.02 0.090 0.280 4.401 0.550 0.372 0.017 0.006 0.14 5.202 SP4 6.60 0.002 0.082 2.802 0.602 0.905 0.009 0.004 0.09 3.751 SP5 6.71 0.043 0.220 3.201 1.041 3.680 0.013 0.008 0.02 3.310 SP6 6.91 0.011 0.005 3.400 2.012 1.614 0.008 - 0.06 3.216 SP7 7.02 0.001 0.010 4.074 0.591 1.467 - - 0.04 3.621 SP8 6.96 0.021 0.004 3.207 0.621 1.070 0.001 0.002 0.50 3.518 SP9 7.01 0.001 0.002 3.587 1.091 0.662 - - - 3.381 SP10 6.52 0.002 0.004 3.722 1.017 0.794 0.007 - 0.02 3.550 SP11 7.08 0.002 0.002 3.014 0.448 2.921 0.012 - - 3.351 SP12 7.03 0.020 0.008 4.210 0.300 1.460 0.003 0.001 - 3.301 SP13 7.02 0.010 0.011 5.098 0.365 1.606 0.019 - - 2.019 SP14 7.01 - 0.003 4.864 0.166 2.670 0.013 - - 2.013 SP15 7.00 - 0.012 2.986 3.080 2.532 0.014 0.001 - 3.014 SP16 6.89 0.021 0.009 3.094 1.860 1.091 0.016 - 0.03 02016 SP17 6.90 0.001 0 004 4.006 0.127 2.109 0.001 0.001 - 1.001 SP18 7.01 - 0.015 4.328 0.021 0.321 0.010 - - 3.010 WHO Maximum Permissible Level
6.5-8.5 0.1 0.01 >10 0.3 10 0.015 0.005 0 10

International Journal of Scientific and Research Publications, Volume 7, Issue 4, April 2017 341 ISSN 2250-3153
www.ijsrp.org
Table 2: Results of the Bacteriological Analysis compared with the WHO standard Sample Point Physical Observation Total Coliform Counts WHO Permissible
Standard SP1 Clear 188 0 SP2 Clear 120 0 SP3 Colloidal 245 0 SP4 Colloidal 134 0 SP5 Colloidal 233 0 SP6 Clear 180 0 SP7 Clear 155 0 SP8 Clear 162 0 SP9 Clear 108 0 SP10 Clear 111 0 SP12 Colloidal 123 0 SP13 Clear 104 0 SP14 Clear 106 0 SP15 Colloidal 117 0 SP16 Colloidal 118 0 SP17 Colloidal 120 0 SP18 Clear 113 0
6. RECOMMENDATION By way of minimizing the health hazards that would be experienced in event of consumption of such waters, the following suggestions are made:
• Treatment of water sources that contain Arsenic, Iron and Lead above the WHO permissible level can be achieved through the Reverse Osmosis (RO) technique as it is considered effective and most cost effective in the removal of inorganic molecules. This is filtration at molecular level. It works by forcing water through a special, selective membrane that has microscopic pores, specially sized to allow water molecules through, while trapping larger inorganic molecules like lead, iron, chromium and arsenic.
• Similarly, Reverse Osmosis will remove 95 - 98% of the cadmium in the water, others include the use of sodium form cation exchanger (softener) and electrodialysis which will also remove the majority of the cadmium.
• Reverse osmosis will remove 97 - 98% of the nickel from drinking water. Also Nickel can be removed by a strong acid cation exchanger and reduced in extent by the activated-carbon filtration.
• For water sources contaminated with coliform bacteria, disinfection is recommended. The most commonly used well water disinfectants are sodium hypochlorite (chlorine bleach) and calcium hypochlorite. Other options include ozonation,boiling and iodination.
REFERENCES
[1] Agency for Toxic Substances and Disease Registry (ATSDR), Retrieved March 27, 2017 from https://www.atsdr.cdc.gov [2] Alile, O.M., Ojuh, D.O., Iyoha, A., and Egereonu, J.C. (2011). Geoelectrical investigation and hydrochemical analysis of groundwater
in a waste dump environment, Isolo, Lagos. African Journal of Environmental Science and Technology Vol. 5, No. 10, pp. 795-806. [3] Arabi A .S., Funtua I. I., Dewu B. B. M., Garba M. L., Okoh S., Kwaya M.Y and Bolori M. T (2013): Assessment of Calcium and
Magnesium Concentrations in Groundwater as Supplements for Sleep Related Ailments. J. Appl. Environ. Biol. Sci., 3(7)29-35 [4] Brian. O. (2010). Drinking Water Help Guide. Retrieved March 27, 2017, from http://water.epa.gov/drink/info/lead/index.cfm [5] Brian .O. (2012): Is my Drinking water safe? Retrieved March 27, 2017 from http://www.bfenvironmental.com [6] Coliform bacteria in Drinking water supply, Retrieved March 23, 2017 from
https://www.health.ny.gov/environmental/water/drinking/docs/coliform_bacteria.pdf [7] Drinking Water Contaminants- Cadmium (APEC WATER), Retrieved March 20, 2017 from http://www.freedrinkingwater.com/water-contamination/cadmium-contaminants-removal-water.htm [8] Environmental Health Protection (2017): Retrieved March 27, 2017 from http://www.idph.state.il.us/ehhome.htm [9] Facts on Drinking water, Retrieved March 23, 2017 form http://www.rpc.ca/english/pdf/water/Coliforme.pdf [10] García. R and Báez A. P. (2012). Atomic Absorption Spectrometry (AAS), Atomic Absorption Spectroscopy, Dr. Muhammad Akhyar
Farrukh (Ed.), ISBN: 978-953-307-817-5, InTech, Available from: http://www.intechopen.com/books/atomic-absorption-spectroscopy/atomic-absorption-spectrometry-aas-
[11] Guidelines For drinking water Quality, Retrieved March 20, 2017 from www.who.int/water_sanitation_health/dwq/2edvol3d.pdf [12] MacLeod, W.N. and Turner, D.C. (1971). Geology of Jos Plateau. Bulletin 32, vol.2, Geological Survey of Nigeria.

International Journal of Scientific and Research Publications, Volume 7, Issue 4, April 2017 342 ISSN 2250-3153
www.ijsrp.org
[13] Olatunji B.O., Tart C.O., Ciesielski B.G., McGrath P.B., Smits J.A. (2011): Specificity of disgust vulnerability in the distinction and treatment of OCD. Journal of Psychiatric Research, 45 (9), pp. 1236–1242
[14] Nickel in Drinking Water (2005): Retrieved March 27, 2017 from www.who.int/water_sanitation_health/gdwqrevision/nickel2005.pdf [15] Scragg, A. (2006): Environmental Biotechnology. Oxford University Press, Oxford, UK, 2nd edition. [16] Smith L.A.,Means J.L., Chen A. (1995). Remedial Options for metals – contaminated sites. Lewis Publishers, BocaRaton, Fla, U.S.A. [17] World Health Organization (1996). Guidelines for drinking water, 2nd edition, Geneva Author’s Biography: My name is Joyce Ayuba Ramadan, I have obtained a B.sc. in Geology and Mining form University of Jos, Nigeria in
1999; a Master of Science degree in Hydrogeology and Engineering Geology from University of Jos in the year 2009 and currently a PhD research student in Abubakar Tafawa Balewa University (ATBU) Bauchi, in Nigeria. I am a lecturer with Plateau state Polytechnic, Barkin Ladi, attached to the Department of Mineral and Petroleum Resources Engineering.
E-mail: [email protected]

International Journal of Scientific and Research Publications, Volume 7, Issue 4, April 2017 343 ISSN 2250-3153
www.ijsrp.org

International Journal of Scientific and Research Publications, Volume 7, Issue 4, April 2017 344 ISSN 2250-3153
www.ijsrp.org
Research Challenges in Professional Communication Dr. Neeta Pandey
Assistant Professor in the Department of English, GD Rungta College of Engineering and Technology, Kohka-Kurud Road Bhilai
I. INTRODUCTION ill Gates-- the founder of Microsoft, the world’s largest Software Company and the wealthiest man on the planet,
strongly feels that “ I’m a great believer that any tool that enhances communication has profound effects in terms of how people can learn from each other, and how they can achieve the kind of freedoms that they’re interested in.” Billionaire Warren Buffet highly places the value of Communication Skills by saying that “If you can’t communicate, it’s like winking at a girl in the dark. One can improve one’s value 50 percent if one has better Communication Skills.” Cline (2005) conducted a survey while he was undertaking his research in a Corporate sector. He based it on 330 employers. The result wasn’t astonishing as 96 % of the executives considered Communication Skills to be the most important feature of an employee trait. It can be said that “Poor communication can negatively affect employee recruitment and retention (CCH, 2000), as well as the “bottom line” (Washatka, 2004). The language of the Professionals depends upon their job and work culture. The Research done on this can help in Interdisciplinary undertaking and can help in getting the desired results.The research carried on language of the Professional can be based on the domain or the field which determines the use of language. According to Christopher N Candlin, its literature can be categorised into 3 heads: 1. Written Communication or Text-based Studies -- It relates to the written texts or communication which is an essential part of Business Communication. It includes the Letters, Tender Notice, Quotation, Reports, and the maintenance of the Registers which is a pre-requisite for any enterprise. 2. Interactive or Oral Communication-- It includes conversations or talks in meetings, discussions, job Interview, performance appraisal etc. It forms the routine in the Corporate Sector and there lies the success of a Business Enterprise. For lawyers it would be cross-examining the witnesses in courtrooms, for Managers and Doctors that would be a discussion, or a meeting or a Performance appraisal. 3. Problem-centered-- It includes the discourse based on hands-on experience—the real-life situations which a professional experiences and which marks the basis of communication research. It includes the discourse analyses which takes in between the Communication Specialist and other members of the Profession. The change in the structure or the delivery is discussed and analysed though interactions. The Mission of Professional Communication Research is based on Trust involved in between the Speaker and the Listener, the level of Risk prevalent in a particular Profession and the Standard Quality or Satisfaction expected out of a particular job. The Research can be carried at both the levels-- Micro as well as
Macro level. The expected results determine the level. If an extensive research has to be made, various categories should be Identified. For this,the age is an important factor. For example, if the research has to be made on Novice Professional in Corporate Sector, then 30-35 age-group should be focused upon. If the research is based on Hotel Professionals in a five-star hotel, the Ethnic Class should be taken into consideration. If the Fashion Industry is being researched, both men and women would be taken into account. The culture of the people to a large extent, plays an important role in research. Various factors like food, language, behaviour, and attitude of the people decide the level of satisfaction and the efficiency of the people, and the resultant output. Attaining of Statistical data is an important factor in research, it display even the risk involved in outcome. The discussion between the researcher and other lay members lead to good reasoning and appropriate results.The analysis is based upon Knowledge, Attitude, and Skills of the Professionals. Metaphoric expressions in language deserve special attention not only because of the positive and negative connotations evoked by their source domains but also because they often occur “at the scientific verge, ( when) words routinely fail to refer” (Gross, 1996, p.84). A lot of metaphors are used in economics. The economy is shown as organism, namely, economic growth or infant; as a patient, like healthy economy and economic depression; as people like giant , sister company; as animate like the market is falling, the market is bouncing; types of traders as types of animals, for example, bear run, bull run, bullish, etc. Hedging has an important place in communicating the nature of Inter-Personal Communication. Stance and Engagement in writing, Politeness in television-mediated campaigns, Humour in Workplace, Pragmatics, Workplace Culture, Media Choice, Media Content, and Semantic Network has much influence on Verbal Communication. Colour Metaphor in discourse, as mentioned by Lan Li and Mac Gregor Lucy, helps in imagination, clarifying the meaning of the language, and Effective Communication. Metaphors are used everywhere, in everyday life, not just in language, but in thought and action as well. Black, white, green, red, yellow, blue, brown, and grey colours Metaphors are used Internationally. Black and White are universal colours, the most common in world languages. Blacksmith, blacklist, black sheep, black cloud, black market, black and white, are used much as Black Metaphors in English Language. White elephant, white wash, white paper, white lie, white collar are common White Metaphors used in English Communication. Red carpet, red tape, red carpet, red letter days, red faced signify the usage of Red Metaphors mostly used in Politics, Economics and other fields. Green light, green belt, green paper, green chip, are Green Metaphors which are used in Science, Computer, Politics, Social-Science, and various other field. The Yellow metaphor signify negative attribute of an Individual, that is, one’s Coward attitude.
B
International Journal of Scientific and Research Publications, Volume 7, Issue 4, April 2017 345 ISSN 2250-3153
www.ijsrp.org
Whereas yellow also attributes one’s Positive attitude, one’s nobility and wealth. Blue chips, blue ribbon, blue collar, bolt from the blue are common examples of Blue Metaphors. Grey and Brown Colour Metaphors are less used in Communication Skills. Grey is used as grey market, grey area, grey face, grey matter and so on. Brown is used as brown goods, brown majority and so on. According to Ho Janet in “Fear in Stock Market Crash: A Corpus-based Metaphoric Study”, Metaphors have been used for Journals based on various domains or sources. About 36%of journals and its content are used as metaphors which arise from organic source. It co-relates to a living entity. About 66% of Journals are personified, for example, Journal is endeavouring....Remaining equate to an animal or a plant like ‘in a healthy state’ personifies an animal, whereas, if it says that ‘issues to a large extent are intertwined’..., then it personifies a plant. About 27 % of the Journals are functional. According to this, Journal is a vehicle which is to be steered in the right direction by its editor. It will be controlling the reins. Or it can be a source of entertainment, for example, ‘last exciting change’. About 20 % of the journals are called as container metaphors which can be opened and filled with contributions, for example, ‘ the issue contains a set of book reviews’, or building metaphors, for example, ‘strictures derived from...’ About 17 % of the Journals have Spatial source. These metaphors represent the journal’s life as a journey by road like ‘ looking back at the first issue’, or ‘We are reaching a stage’. If we see various across domains, the use of Metaphors experience Variations. In Applied Linguistics, the editor is endowed with multi-faceted identity but never appears as a conversant or host. The journal is qualified by organic, functional or spatial metaphors. In Economics, the editor has a multi-faceted identity which hardly ever involves the family. The journal is identified by organic-human, functional- vehicle or material- container metaphors. In Law, the editor is represented either as an enquirer or as a part of a family. The journal is qualified by organic or functional- vehicle metaphors. In Medicine, the editor has a multi-faceted identity but without any instances of emoting. The Media influences much the effect which the language produces on its readers. The year 2008 experienced crisis in global financial market and there was decline in banking and investment sector. But some journalists tried to tone down the emotion in their news reports regarding the shift in stock market “ This year, the media have been accused of contributing to the collapse of both Stearns and Lady Mac, a large California thrift, so journalists are more aware of the risk of stoking fear and the risk of being blamed... In fact, ‘panic’ heads the list of words that major news organisations have avoided using because they are seen as potentially self-fulfilling.” ( The New York Times, September 22 2008). Media plays an important in the construction of emotions. One of the ways to express emotional attitude is the use of metaphors.(Kovecses,1995). Two metaphors--’fear’ and ‘panic’ show different degrees of fear. If we see Webster’s Dictionary, panic is a sudden overpowering fright’, whereas fear means ‘to have a reverent awe of God. If semantic meaning is studied, fear means something unpleasant may happen or can cause danger. But panic focus on the consequences of such human emotions,
and hence in panic people may take action without thinking. In Media, Few Disaster Metaphors are used. Turmoil whose frequency is 186, is the highest. Other metaphors in financial market are Meltdown, Wall street meltdown, credit market meltdown, crash, catastrophe, tsunami, whirlwind etc. Use of Hedging Expressions in Language—certain words or phrases, can soften or weaken a speaker’s standpoint. This helps him to shield himself from being challenged by the hearer. It has been recognised that an appropriate use of hedges is essential in successful communication ( Brown & Levinson, 1987). Modal auxiliary verbs are used as hedging. Modals like may, might, can, could, could, should, and would are used maximum times, which comprise 30.23 percent. May is used 37.20 percent as hedge, could 18.60 percent. Action verbs like to appear, to see, to believe, to think, to argue, to propose, to speculate, to assume also act as hedging. Adjective like possible, probable, un-likely; Nouns like assumption, claim, possibility, estimate, and suggestion and Adverbs like virtually, sapparently, practically are also used to make Communication effective. In Professional Written Texts, Status, occupational role, ethnicity, gender, and power are important features. In Appoinment Letter, Farewell Letter, Re-Union Gathering, Quotation, Tender etc also Modals are used extensively like Could You Please...; Would You Please..... Use of politeness Marker—‘Po’ in Media, is widely used in Philippines . Research has shown that ‘Po’ is one of the ways of showing respect not only to elders, but also to peers or even younger people. Bonvillain (2003) cites Japanese language. They use ‘sensei’, which means ‘teacher’, although the person may be a doctor, politician, or any other person in other profession. Ide( as cited in Bonvillain,2003) gives 3 other rules in Japanese social etiquette ( p.136). Japanese give much importance to courtesy. They feel that one should be polite to a person of higher social position, to a person with power and to an older person. Indians also consider Courtesy to be one of the main features for Effective Oral Communication. Recently, the Corporate Sector has analysed and found that both IQ- Intelligence Quotient and EQ-Emotional Quotient play an important role in making competent leaders. IQ helps an individual to trace academic qualities of an individual, and EQ enables an individual to understand and empathize with the team so as to give the desired results. According to Fyodor Dostoyevsky, “Much unhappiness has come into the world because of bewilderment and things left unsaid.” That supports the need for research and training in Professional Communication as a pre-requisite for a successful enterprise.
REFERENCES [1] qtd. in Morreale, S.P & Pearson, J.C. “ Why Communication is Important:
The Centrality of the Discipline in the 21st Century”. National Communication Association. Jan 2008 http://www.natcom.org/...Discipline/PDF-ATD-JACA...
[2] Gates, Bill. “ AZ quotes.com”. www.azquotes.com/quote/107322. [3] Buffet, Warren. “ K.I.S.S.Speaking Tips: Knowledge Impacts Speaking
Success.www.kiss.speaking-tips.com/if-you-cant-communicate-warren-buffet-quote/.
[4] qtd. in Morreale, S.P & Pearson, J.C. “ Why Communication is Important: The Centrality of the Discipline in the 21st Century”. National Communication Association. Jan 2008 http://www.natcom.org/...Discipline/PDF-ATD-JACA...

International Journal of Scientific and Research Publications, Volume 7, Issue 4, April 2017 346 ISSN 2250-3153
www.ijsrp.org
[5] Giannoni, Davide Simone. “ In My Own Words: Metaphoric Identity Across Academic Domains”. The Hong Kong Polytechnic University. HongKongSARChina2009. www.unitbv.ro/limbajulprofesional/pdf/LanguageforProfesssional communication.pdf.
[6] Ho, Janet. “ Fear in Stock Market Crash: A Corpus-based Metaphoric Study.” The Hong Kong Polytechnic University HongKongSARChina2009. www.unitbv.ro/limbajulprofesional/pdf/LanguageforProfesssional communication.pdf.
[7] Kong, Leung ChiHedging. Hedging. The Hong Kong Polytechnic University.HongKongSARChina2009. www.unitbv.ro/limbajulprofesional/pdf/LanguageforProfesssional communication.pdf.
[8] Gocheco, Paulina M. The Use of Politeness Marker Po in Television- Mediated Political Campaign Advertisements in the Philippines. TheHongKong PolytechnicUniversity.HongKongSARChina2009. www.unitbv.ro/limbajulprofesional/pdf/LanguageforProfesssional communication.pdf.
[9] Dostoyevsky, Fyodor. Quotes About Communication www.goodreads.com/quotes/tag/communication
AUTHORS First Author – Dr. Neeta Pandey, Assistant Professor in the Department of English, GD Rungta College of Engineering and Technology, Kohka-Kurud Road Bhilai
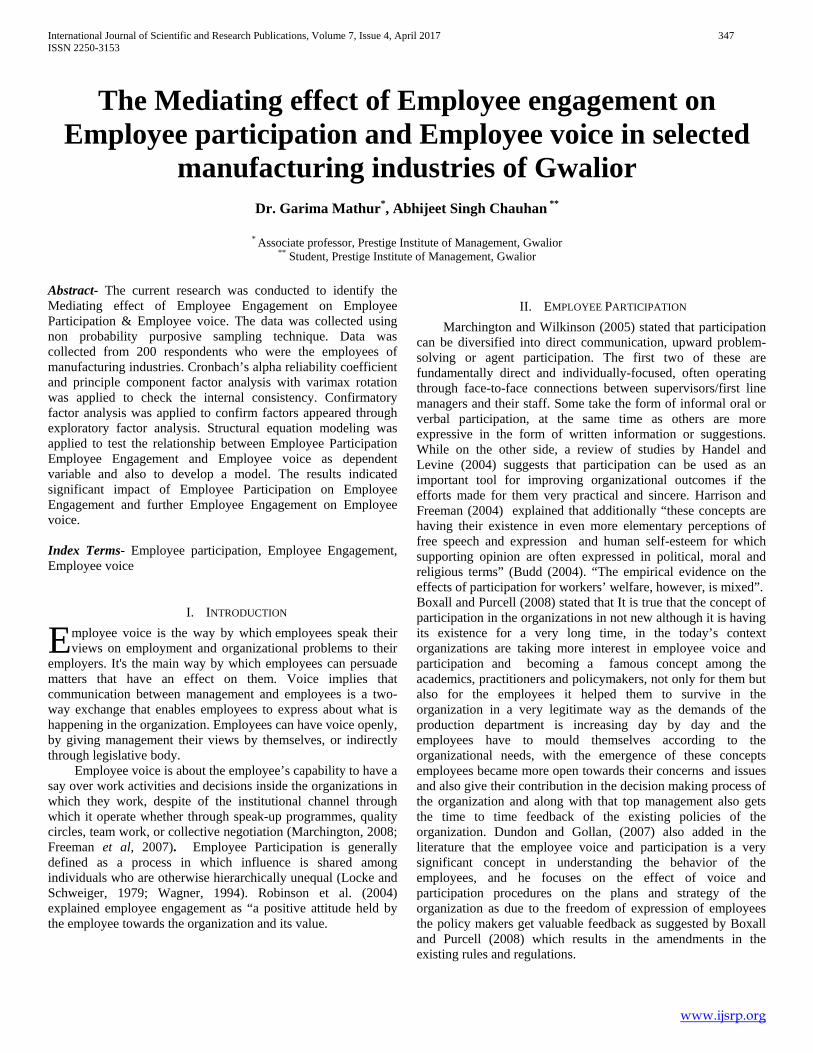
International Journal of Scientific and Research Publications, Volume 7, Issue 4, April 2017 347 ISSN 2250-3153
www.ijsrp.org
The Mediating effect of Employee engagement on Employee participation and Employee voice in selected
manufacturing industries of Gwalior Dr. Garima Mathur*, Abhijeet Singh Chauhan **
* Associate professor, Prestige Institute of Management, Gwalior
** Student, Prestige Institute of Management, Gwalior Abstract- The current research was conducted to identify the Mediating effect of Employee Engagement on Employee Participation & Employee voice. The data was collected using non probability purposive sampling technique. Data was collected from 200 respondents who were the employees of manufacturing industries. Cronbach’s alpha reliability coefficient and principle component factor analysis with varimax rotation was applied to check the internal consistency. Confirmatory factor analysis was applied to confirm factors appeared through exploratory factor analysis. Structural equation modeling was applied to test the relationship between Employee Participation Employee Engagement and Employee voice as dependent variable and also to develop a model. The results indicated significant impact of Employee Participation on Employee Engagement and further Employee Engagement on Employee voice. Index Terms- Employee participation, Employee Engagement, Employee voice
I. INTRODUCTION mployee voice is the way by which employees speak their views on employment and organizational problems to their
employers. It's the main way by which employees can persuade matters that have an effect on them. Voice implies that communication between management and employees is a two-way exchange that enables employees to express about what is happening in the organization. Employees can have voice openly, by giving management their views by themselves, or indirectly through legislative body. Employee voice is about the employee’s capability to have a say over work activities and decisions inside the organizations in which they work, despite of the institutional channel through which it operate whether through speak-up programmes, quality circles, team work, or collective negotiation (Marchington, 2008; Freeman et al, 2007). Employee Participation is generally defined as a process in which influence is shared among individuals who are otherwise hierarchically unequal (Locke and Schweiger, 1979; Wagner, 1994). Robinson et al. (2004) explained employee engagement as “a positive attitude held by the employee towards the organization and its value.
II. EMPLOYEE PARTICIPATION Marchington and Wilkinson (2005) stated that participation can be diversified into direct communication, upward problem-solving or agent participation. The first two of these are fundamentally direct and individually-focused, often operating through face-to-face connections between supervisors/first line managers and their staff. Some take the form of informal oral or verbal participation, at the same time as others are more expressive in the form of written information or suggestions. While on the other side, a review of studies by Handel and Levine (2004) suggests that participation can be used as an important tool for improving organizational outcomes if the efforts made for them very practical and sincere. Harrison and Freeman (2004) explained that additionally “these concepts are having their existence in even more elementary perceptions of free speech and expression and human self-esteem for which supporting opinion are often expressed in political, moral and religious terms” (Budd (2004). “The empirical evidence on the effects of participation for workers’ welfare, however, is mixed”. Boxall and Purcell (2008) stated that It is true that the concept of participation in the organizations in not new although it is having its existence for a very long time, in the today’s context organizations are taking more interest in employee voice and participation and becoming a famous concept among the academics, practitioners and policymakers, not only for them but also for the employees it helped them to survive in the organization in a very legitimate way as the demands of the production department is increasing day by day and the employees have to mould themselves according to the organizational needs, with the emergence of these concepts employees became more open towards their concerns and issues and also give their contribution in the decision making process of the organization and along with that top management also gets the time to time feedback of the existing policies of the organization. Dundon and Gollan, (2007) also added in the literature that the employee voice and participation is a very significant concept in understanding the behavior of the employees, and he focuses on the effect of voice and participation procedures on the plans and strategy of the organization as due to the freedom of expression of employees the policy makers get valuable feedback as suggested by Boxall and Purcell (2008) which results in the amendments in the existing rules and regulations.
E

International Journal of Scientific and Research Publications, Volume 7, Issue 4, April 2017 348 ISSN 2250-3153
www.ijsrp.org
III. EMPLOYEE ENGAGEMENT Salanova and Schaufeli (2008) stated that organizations should give some amount of academic support to their workforce as it will result in the engagement and this engagement will positively results in their higher productivity and overall job experience and satisfaction. Alfes, Truss, Soane, Rees and Gatenby (2009) also added to the concept in their research that our concern is not only about making the employees engaged and deriving the desired work from them but our concern is related with focusing on the antecedents of the employee voice and we found in our study that the various antecedents of the employee voice are positively correlated with each other and significantly effecting the employees engagement in the organization. While, Purcell, Kinnie, Hutchinson, Rayton and Swart (2003) stated the employees who always express their views in an open ways they don’t keep their issues and concerns only with themselves but they try to express them and these employees are very positive and have a problem solving tendency and with the help of effective voice procedure organizations can get a good and effecting work done from the employees and leading to their work engagement. Saks (2006) argues that that the philosophy which says that for employees only way of repaying to organization is the engagement but here engagement is directly correlated with the resources available to them so we can’t predict a higher employee engagement if there are no sufficient resources available in front of the organization. Additionally Schaufeli, Bakker and Salanova (2006) describe three interrelated dimensions of vigor, dedication and absorption as creating an internal state of engagement. Christian, Garza and Slaughter (2011) stated that employee engagement is a very significant and functional concept influencing the work perceptions and attitudes of the employees. Rousseau, Sitkin, Burt and Camerer (1998) stated “A higher level of trust in the employer will increase the assurance that they will fulfill their obligations in the future so that employees are more likely to be engaged with their job”.
IV. EMPLOYEE VOICE According to Levine and Tyson (1990) employee voice can take place either directly between employees and management (e.g. through employee involvement programs), or indirectly via worker representatives. Doucouliagos (1995) and Levine and Tyson (1990) survey the extensive research on direct voice (participation) and find a positive (often small) effect on productivity, sometimes a zero or statistically insignificant effect, and almost never a negative effect. Cotton et al. (1988) assert that employee direct voice is most effective in increasing employee satisfaction and performance when employees have a substantial amount of
influence in decision-making, and when the participation program is direct, permanent, focused on work-related issues, and of substantial duration. Heller (1998) observed that ‘high degrees of influence sharing are associated with a better quality and effectiveness of decisions and a significant reduction in the underutilization of people’s experience and skills’.
V. OBJECTIVES OF THE STUDY • To Re-standardize measures to evaluate Employee
voice, Employee participation and Employee engagement.
• To find out the underlying factors of Employee participation, Employee engagement and Employee voice.
• To measure the Causal relationship between Employee Participation, Employee engagement and Employee voice.
VI. RESEARCH METHODOLOGY The study was causal in nature. Data collection was based on survey method. The population included Employees from manufacturing industries of Gwalior region (Cadbury, Surya Roshini and Badri Vishal Agro). Individual Employees were the sampling element. Non probability purposive sampling technique was used to select the sample. The sample size was 200 Employees. Standardized scales of Botero, I. C., & Van Dyne, L. (2009) for Employee Voice, Muindi, F. K. (2011) for Employee Participation and Soane, E., Truss, C., Alfes, K., Shantz, A., Rees, C., & Gatenby, M. (2012) for Employee Engagement were used for conducting this research on a Likert scale of 5 points where 1 stands for strongly disagree and 5 stands for strongly agree. Reliability of all the constructs in the study (Employee Participation, Employee Engagement and Employee voice) was established through computation of Cronbach’s Alpha reliability coefficient for each construct separately. Reliability values were 0.805 for Employee Participation, 0.728 for Employee Engagement and 0.735 for Employee Voice. The alpha values more than 0.7 are acceptable as stated by Nunnally (1978).
VII. ANALYSIS Exploratory Factor Analysis (EFA) using Principle Components Analysis (PCA) as method of convergence and Kaiser as method of normalization was applied to identify underlying factors. Confirmatory factor analysis was applied using AMOS 18 to confirm the items of the factors of the variables in the questionnaire, Structural equation Modeling was applied using AMOS 18 to check effect of independent variable on dependent variable and to test the model.
Kaiser – Meyer – Olkin Measures of Sampling Adequacy and Bartlett’s Test of Sphericity: The results are shown in the table
S.No. Variable Name KMO value
Bartlet’s Test of Sphericity (Chi Square Value)
Significance Level
1. Employee participation 0.847 469.843 0.000 2. Employee engagement 0.776 317.029 0.000 3. Employee voice 0.816 363.767 0.000

International Journal of Scientific and Research Publications, Volume 7, Issue 4, April 2017 349 ISSN 2250-3153
www.ijsrp.org
Kaiser – Meyer – Olkin Measures of Sampling Adequacy test was applied to check the adequacy of the sample in other words that data was normally distributed or not if the value of KMO lies between 0.5 to 1 then data is normally distributed from the table we can see that all the measures having the value greaten then the 0.5 hence the data is quite adequate to consider the data for factor analysis. Bartlett’s Test of Sphericity test was applied to check the null hypothesis that item- to- item correlation matrix was an identity matrix. The hypothesis was tested through Chi- Square test; the values of Chi- Square for Employee participation (469.843), Employee engagement (317.029), Employee voice
(363.767), all are significant at 0% level of significance. Therefore, null hypothesis was rejected, indicating that the item- to- item correlation matrix is not an identity matrix and therefore data of all the measures were suitable for the factor analysis. Factor Analysis: Principle component factor analysis with Varimax Rotation was applied to find out the underlying factors of the questionnaire. The factor analysis for Employee participation resulted in 2 factors, factor analysis for Employee engagement resulted in 2 factors, factor analysis for Employee voice resulted in 2 factors. The details about factors, the factor name, Eigen value, and items converged; factor lodgings and variance% are shown follows:
Description of factors: The scale was developed and extracted by Elizabeth. F. Cabrera (2011) and various factors were emerged namely Consultation, Delegation, Private or public status, Percentage of Employee unionized, Competition, Sector, Quality strategy, Service Strategy, Indirect participation, Organization Size, In this study the data emerged in to two factors:
1. Consultation: This factor emerged as the first important determinant of the research with a total variance of 2.712 and Percentage of variance explained was 27.115.
2. Delegation: This factor emerged as the next important determinant of research with a total variance of 2.145 and percentage of variance explained was 21.454.
Employee Participation Items Factor1 Factor2 My boss is available for me to discuss my concerns, worries or suggestions. 0.660 The decisions in my department are made through consultation with members of the department 0.530
I am given an opportunity to solve problems connected with my work. 0.754 If I want extra responsibility my boss will find a Way to give it to me I have regular meetings with my boss to discuss how I can improve and develop? 0.754 I am left to work without interference from my boss but help is available if I want it. 0.609 I know what the company’s aims and targets are The decisions in my department are made by those individuals in the department who charged with the task.
0.760
My boss asks me politely to do things gives me reasons why, and invites my suggestions 0.693
I call my boss and my boss’s boss by their first name. 0.563
Eigen value 2.712 2.145
% of variance explained 27.115 21.454

International Journal of Scientific and Research Publications, Volume 7, Issue 4, April 2017 350 ISSN 2250-3153
www.ijsrp.org
Description of factors: The scale was developed and extracted by Emma Suane & Katie Truss (2012) and 3 factors were emerged namely Intellectual engagement, Social engagement, Affective engagement In this study the same factors were emerged:
1. Intellectual Engagement: Thi
s fact
or emerged as the first important determinant of the research with a total variance of 2.712 and Percentage of variance explained was 27.115.
2. Social and Affective Engagement: This factor emerged as the next important determinant of research with a total variance of 2.145 and percentage of variance explained was 21.454.
Description of factors: The scale was developed and extracted by Masaki Matsunage (2014) and various factors were emerged namely Direct overture, Cautious disclosure, Waiting, Peer mediating Communication, Deniable, Computer mediated communication & Expression of thoughts and ideas. In this study the data emerged into two factors:
1. Direct overture: This factor emerged as the first important determinant of the research with a total variance of 2.370 and Percentage of variance explained was 29.622.
2. Expression of thoughts and ideas: This factor emerged as the next important determinant of research with a total variance of 1.794 and percentage of variance explained was 22.429.
Confirmatory factor analysis Confirmatory factor analysis of Employee participation (Figure – 1)
Employee Engagement Items
Factor 1 Factor 2
I focus hard on my work 0.538 I concentrate on my work 0.718 I pay a lot of attention to my work 0.798 I share the same work values as my colleagues 0.527 I share the same work goals as my colleagues I share the same work attitudes as my colleagues 0.660 I feel positive about my work 0.770 I am enthusiastic in my work 0.816 Eigen value 2.370 1.794 % of variance explained 29.622 22.429
Employee voice Items Factor 1 Factor 2
I develop and make recommendations to my work supervisor concerning issues that affect my work.
0.724
I speak up and encourage others in my work unit to get involved in issues that affects our work.
0.754
I communicate my opinions about work issues to others in my work unit even if their opinions are different and they disagree with me.
0.547
I keep well informed about issues at work where my opinions can be useful. 0.649 I speak up to my supervisor with ideas for new projects or changes in procedures at work.
0.579
I get involved in issues that affect the quality of life in my work unit. 0.639 I Ask someone in the work group to pass my idea on to the boss 0.634 I Send an e-mail, rather than talking face-to-face, to discuss my ideas.
0.704
I Wait until i find a good chance to bring up my thoughts to the supervisor. 0.641
Eigen value 2.370 1.794
% of variance explained 29.622 22.429

International Journal of Scientific and Research Publications, Volume 7, Issue 4, April 2017 351 ISSN 2250-3153
www.ijsrp.org
After applying EFA on Employee Participation 2 factors of Employee Participation were identified Delegation (7 items) and Consultation (3 items). CFA was applied and to improve goodness fit some items were dropped from some of the factors.
The final composition of factors after CFA was – Delegation (4 items) and Consultation (3 items). Therefore the final measure of Employee Participation had seven items converged.
Criteria
χ2 P Df Absolute fit measures
Incremental fit measures
Parsimony fit measures
χ2/df GFI AGFI RMSEA NFI CFI TLI PNFI PCFI 24.775 .025 13 1< χ2/df<3
1.906 ≥0.9 .968
≥0.9 .930
≤0.05 .067
≥0.9 .903
≥0.9 .949
≥0.9 .918
≥0.5 .559
≥0.5 .588
Note: χ2=Chi square; df=degree of freedom; GFI = Goodness of fit index; RMSEA=Root mean square error of approximation; NFI = Normated fit index; AGFI = Adjusted Goodness of fit Index; CFI = Comparative fit index; TLI= Tucker – Lewis Index; PNFI=Parsimonious Normated fit Index; PCFI= Parsimonious Comparative fit Index First of all goodness of fit indices were evaluated to test the model. Chi square value was found to be 24.775 significant at 0.025. Similarly the χ2/df value was 1.906 which was falling between 1 and 3 indicating that the model was a good fit. The value of other goodness of fit indices such as GFI was 0.968 ≥ 0.9 as well as AGFI (.930) NFI (.903), CFI (.949), TLI (.918) were all above 0.9 as well as the parsimony values i.e. PNFI (.559) and PCFI (.588) were higher than 0.5 indicating a good fit.
The badness of fit index RMSEA is .067 which needs to be lower than 0.5 but it is close to 0.5 indicating a good model fit. HOELTER
Model HOELTER .05
HOELTER .01
Default model 180 223 Independence model 26 31

International Journal of Scientific and Research Publications, Volume 7, Issue 4, April 2017 352 ISSN 2250-3153
www.ijsrp.org
Hoelter test indicated that this model could have been achived with a sample size of 180 at 5% level of significance and
223 at 1% level of significance whereas the sample size of current study was 200 indicating a good fit of model to the data.
Confirmatory factor analysis of Employee Engagement (Figure – 2)
After applying EFA on Employee Engagement 2 factors of Employee Participation were identified Intellectual Engagement (5 items) and Social and Affective Engagement (2 items). CFA was applied and to improve goodness fit some items were
dropped from some of the factors. The final composition of factors after CFA was – Delegation (3 items) and Consultation (2 items). Therefore the final measure of Employee Engagement had Five items converged.
Criteria
χ2 P Df Absolute fit measures
Incremental fit measures
Parsimony fit measures
χ2/df GFI AGFI RMSEA NFI CFI TLI PNFI PCFI 6.130 .190 4 1< χ2/df<3
1.533 ≥0.9 .988
≥0.9 .955
≤0.05 .052
≥0.9 .947
≥0.9 .980
≥0.9 .949
≥0.5 .579
≥0.5 .592
Note: χ2=Chi square; df=degree of freedom; GFI = Goodness of fit index; RMSEA=Root mean square error of approximation; NFI = Normated fit index; AGFI = Adjusted Goodness of fit Index; CFI = Comparative fit index; TLI= Tucker – Lewis Index; PNFI=Parsimonious Normated fit Index; PCFI= Parsimonious Comparative fit Index
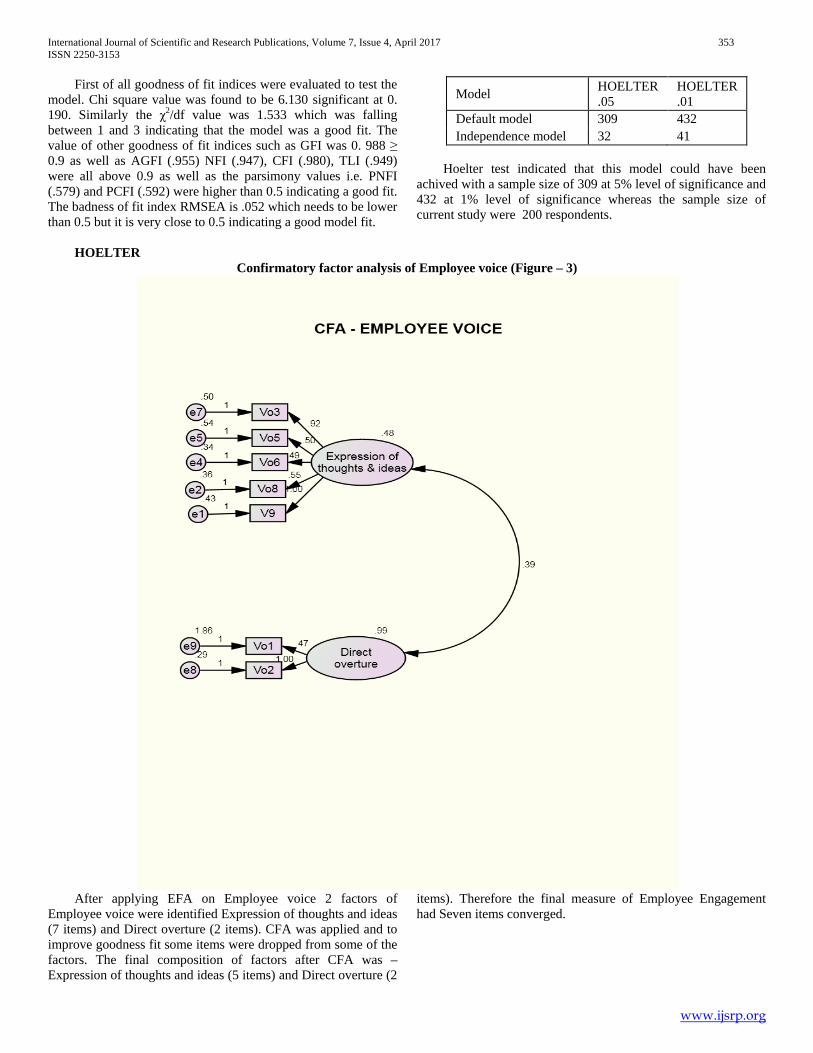
International Journal of Scientific and Research Publications, Volume 7, Issue 4, April 2017 353 ISSN 2250-3153
www.ijsrp.org
First of all goodness of fit indices were evaluated to test the model. Chi square value was found to be 6.130 significant at 0. 190. Similarly the χ2/df value was 1.533 which was falling between 1 and 3 indicating that the model was a good fit. The value of other goodness of fit indices such as GFI was 0. 988 ≥ 0.9 as well as AGFI (.955) NFI (.947), CFI (.980), TLI (.949) were all above 0.9 as well as the parsimony values i.e. PNFI (.579) and PCFI (.592) were higher than 0.5 indicating a good fit. The badness of fit index RMSEA is .052 which needs to be lower than 0.5 but it is very close to 0.5 indicating a good model fit. HOELTER
Model HOELTER .05
HOELTER .01
Default model 309 432 Independence model 32 41
Hoelter test indicated that this model could have been achived with a sample size of 309 at 5% level of significance and 432 at 1% level of significance whereas the sample size of current study were 200 respondents.
Confirmatory factor analysis of Employee voice (Figure – 3)
After applying EFA on Employee voice 2 factors of Employee voice were identified Expression of thoughts and ideas (7 items) and Direct overture (2 items). CFA was applied and to improve goodness fit some items were dropped from some of the factors. The final composition of factors after CFA was – Expression of thoughts and ideas (5 items) and Direct overture (2
items). Therefore the final measure of Employee Engagement had Seven items converged.

International Journal of Scientific and Research Publications, Volume 7, Issue 4, April 2017 354 ISSN 2250-3153
www.ijsrp.org
Criteria
χ2 P Df Absolute fit measures
Incremental fit measures
Parsimony fit measures
χ2/df GFI AGFI RMSEA NFI CFI TLI PNFI PCFI 23.869 .032 13 1< χ2/df<3
1.836 ≥0.9 .968
≥0.9 .931
≤0.05 .065
≥0.9 .902
≥0.9 .951
≥0.9 .921
≥0.5 .558
≥0.5 .589
Note: χ2=Chi square; df=degree of freedom; GFI = Goodness of fit index; RMSEA=Root mean square error of approximation; NFI = Normated fit index; AGFI = Adjusted Goodness of fit Index; CFI = Comparative fit index; TLI= Tucker – Lewis Index; PNFI=Parsimonious Normated fit Index; PCFI= Parsimonious Comparative fit Index
First of all goodness of fit indices were evaluated to test the model. Chi square value was found to be 23.869 significant at 0.032. Similarly the χ2/df value was 1.836 which was falling between 1 and 3 indicating that the model was a good fit. The value of other goodness of fit indices such as GFI was 0. 968 ≥ 0.9 as well as AGFI (.931) NFI (.902), CFI (.951), TLI (.921) were all above 0.9 as well as the parsimony values i.e. PNFI (.558) and PCFI (.589) were higher than 0.5 indicating a good fit. The badness of fit index RMSEA is .065 which needs to be lower than 0.5 but it is close to 0.5 indicating a good model fit. HOELTER
Hoelter test indicated that this model could have been achived with a sample size of 187 at 5% level of significance and 231 at 1% level of significance whereas the sample size of current study was 200 indicating a good fit of model to the data.
VIII. STRUCTURAL EQUATION MODELLING SEM Model Showing Employee Participation As Antecedent To Employee Voice And Employee Engagement As A Mediating Varable Structural equation modeling was applied to test the model having Employee engagement and participation as independent variables and Employee voice as dependent variable. To fulfill the objective first impact of Employee participation on Employee engagement was calculated and then impact of Employee engagement was checked on Employee voice where Employee engagement was acting as a mediating variable.
Fig.4. SEM Model showing relationship between variables
Initially model fit was evaluated based upon different criteria’s such as: Chi Square was found to be 26.852 with a p-value of 0.082. The finding was also supported by value of CMIN/DF (1.492) which was between 1 & 2. The other goodness of fit statistics also supports the overall goodness of fit,
as the value of GFI was 0.968, NFI, CFI and TLI was .919, .971, .954 respectively all higher than 0.9. Parsimony values i.e. PNFI (.591) and PCFI (.624) higher than 0.5.The badness of fit index RMSEA value was also ≥ 0.05 i.e 0.050 indicating a good model fit.
Criteria
χ2 P Df Absolute fit measures
Incremental fit measures
Parsimony fit measures
χ2/df GFI AGFI RMSEA NFI CFI TLI PNFI PCFI 26.852 .082 18 1< χ2/df<3
1.492 ≥0.9 .968
≥0.9 .937
≤0.05 .050
≥0.9 .919
≥0.9 .971
≥0.9 .954
≥0.5 .591
≥0.5 .624
Note: χ2=Chi square; df=degree of freedom; GFI = Goodness of fit index; RMSEA=Root mean square error of approximation; NFI = Normated fit index; AGFI = Adjusted Goodness of fit Index; CFI = Comparative fit index; TLI= Tucker – Lewis Index; PNFI=Parsimonious Normated fit Index; PCFI= Parsimonious Comparative fit Index
Model HOELTER .05
HOELTER .01
Default model 187 231 Independence model 27 32

International Journal of Scientific and Research Publications, Volume 7, Issue 4, April 2017 355 ISSN 2250-3153
www.ijsrp.org
HOELTER
Model HOELTER .05
HOELTER .01
Default model 214 258 Independence model 25 30
Hoelter test indicated that this model could have been achived with a sample size of 187 at 5% level of significance and 231 at 1% level of significance whereas the sample size of current study was 200 indicating a good fit of model to the data. Regression Weights: (Group number 1 - Default model) H01: There is no effect of Employee participation on Employee engagement H02: There is no effect of Employee engagement on Employee voice
Estimate S.E. C.R. P Results Employee engagement
<--- Employee participation
.695 .134 5.175 *** Rejected
Employee voice <--- Employee Engagement
1.544 .262 5.888 *** Rejected
The regression value between Employee participation as independent variable and Employee engagement as dependent variable was .695 as well as Employee engagement as independent variable and Employee voice as dependent variable was 1.544 both significant at p value of 0.000. Thus there was a significant cause and effect relationship between Employee participation and Employee engagement as well as between Employee engagement and Employee voice. Hence our hypothesis H01 and H02 are rejected. The result of our study shows that Employee participation has a significant effect towards Employee engagement. Although a large number of studies have found strong causal effect of Employee participation and Employee engagement like Benn, S., Teo, S. T., & Martin, A. (2015) analyzed using path analysis, showed that participation in environmental initiatives is directly associated with higher levels of employee engagement with the organization. Supported by Yoerger, M., Crowe, J., & Allen, J. A. (2015) where they found a positive and significant effect of employee participation in decision making on the engagement levels of employees in the organization. Thus, there is evidence that Employee participation as antecedent of Employee engagement is well accepted. Further, the results indicate that Employee engagement has a significant effect towards Employee voice. Although a large number of studies have found strong causal effect of Employee engagement and Employee voice including Wong, C. A., Spence laschinger, H. K., & Cummings, G. G. (2010) who have conducted their research on Authentic leadership and nurses' voice behavior and perceptions of care quality where they found that Authentic leadership significantly and positively influenced staff nurses’ trust in their managers and work engagement which in turn predicted voice behavior having trust and employee engagement as mediating variables. In the study Employee engagement mediate variable between Employee participation
and Employee voice. Michel, E. J., Wayne, S. J., & Liao, C. (2015) also found a positive relationship between engagement and employee voice and their findings suggests that engaged employees are more likely to speak up their issues and problems in the organization as supported by Chris Rees, Kerstin Alfes & Mark Gatenby (2013). Their study reported the links between employee voice behaviour directed towards the group and engagement, showing that the relationship between both variables is mediated by trust in senior management and to a lesser extent by the employee–line manager relationship. Thus, there is evidence that Employee engagement as antecedent of Employee voice is well accepted.
IX. CONCLUSION Employee voice is an important factor in studying participative management. From an organizational point of view, it would be in the company’s best interest to engage a participative management program that includes several employee voice mechanisms. By influencing employee voice in the workplace through various methods, an organization can fulfill an moral and political need while also invigorating their bottom line by avoiding high exit and resignation rates. Employee voice takes many forms both individually and collectively and also verbally and non-verbally. The models that have been published seem to have relevant and historic value to the subject and many studies that have been conducted verify the theories. Additionally, the idea behind employee voice seems to be a timeless concept, as many of the publications throughout the past forty years have agreed with each other.
REFERENCES [1] Dietz, G., Wilkinson, A. & Redman, T. (2009). Involvement and
Participation. In Wilkinson, A., Bacon, N., Redman, T. & Snell, S. The Sage handbook of human resource management. London: Sage.
[2] Wilkinson, A., Dundon, T., Marchington, M. & Ackers, P. (2004). Changing patterns of employee voice: Case studies from the UK and Republic of Ireland. Journal of Industrial Relations, 46, 298-322
[3] Marchington, M. & Wilkinson. (2005). A. Direct participation and involvement. In S. Bach (Ed.), Managing Human Resources, 4th ed2. Oxford: Blackwell, 398-423.
[4] Handel, M.J. & Levine, D.I. (2004). Editors’ introduction: The effects of new work practices on workers. Industrial Relations, 43, 1-43.
[5] Harrison, J.S. & Freeman, R.E. (2004). Democracy in and around organizations: Is organizational democracy worth the effort? Academy of Management Executive, 18, 49–53.
[6] Budd, J.W. Employment with a human face: Balancing efficiency, equity, and voice. Ithaca, NY: Cornell University Press, 2004.
[7] Boxall, P. & Purcell, J. Strategy and human resource management, 2nd Ed. New York: Palgrave Macmillan, 2008.
[8] Dundon, T. &Gollan, P.J. (2007). Re-conceptualizing voice in the non-union workplace. International Journal of Human Resource Management, 18, 1182-98.

International Journal of Scientific and Research Publications, Volume 7, Issue 4, April 2017 356 ISSN 2250-3153
www.ijsrp.org
[9] Christina Cregan and Michelle Brown (2014). The influence of union membership on workers. Economic and Industrial Democracy February 1, 35, 115-142
[10] Salanova, M. & Schaufeli, W.B. (2008). Job resources, engagement and proactive behaviour. International Journal of Human Resource Management, 19, 116-131.
[11] Bakker, A.B., and Xanthopoulou, D. (2009), The crossover of daily work engagement: Test of an actor–partner interdependence model, Journal of Applied Psychology, 94, 1562-1571
[12] Alfes, K., Truss, C., Soane, E.C., Rees, C., and Gatenby, M. (2010). Creating an Engaged Workforce, Wimbledon: CIPD.
[13] Purcell J, Kinnie N, Hutchinson S, Rayton B, Swart N (2003). Understanding the People and Performance Link: Unlocking the Black Box, Research Report, London: CIPD
[14] Saks A (2006), ‘Antecedents and consequences of engagement’, Journal of Managerial Psychology, 21(7), 600-619
[15] Schaufeli, W.B., Baker, A.A. & Salanova, M. (2006).Educational and Psychological Measurment. The measurement of work engagement with a short questionnaire. A Cross National Study. 66(4).
[16] Christian, M., Garza, A., & Slaughter, J. (2011). Work engagement: a quantitative review and test of its relations with task and contextual performance. Personnel Psychology, 64, 89-136.
AUTHORS First Author – Dr. Garima Mathur, Associate professor, Prestige Institute of Management, Gwalior. Email: [email protected] Second Author – Abhijeet Singh Chauhan, Student, Prestige Institute of Management, Gwalior
International Journal of Scientific and Research Publications, Volume 7, Issue 4, April 2017 357 ISSN 2250-3153
www.ijsrp.org
The Determinants of Commercialization of Households Farmers Rice Tidal Land in Tanjung Jabung Timur
District, Jambi Provincy
Ira Wahyuni*), Amruzi Minha*), Andy Mulyana*), Zulkifli Alamsyah**)
*)Department of Agribusiness, Faculty of Agriculture, Sriwijaya University, Padang Selasa Street No.542 Palembang 30139
**)Department of Agribusiness, Faculty of Agriculture, Jambi University, Lintas Jambi-Muara Bulian Street Km.15, Mendalo Darat, Jambi Luar Kota District, Jambi 36122
Corresponding author: Hp. +628127491117
ABSTRACT
Demand for agricultural products has been will continue to change, grow and develop at high speed, it is time offender production (farmer households) rice with multi commodity and multi product aims to meet the needs of the consumer. The aim of research to determine the performance level of commercialization of farming and household enterprises rice farmers in Tanjung Jabung Timur District. The method used in the writing of this paper, do a comprehensive analysis of secondary data, secondary data from the Agricultural Census 2013 in Tanjung Jabung Timur District, Jambi Province, some data from field surveys and literature. From the research, farming tidal land is entirely run household. Only a small proportion of agricultural businesses are managed agricultural enterprises. Farm households cultivate diverse (diversified) business diverse products of subsistence and commercial commodities produced. Commercial commodity in the tidal land that has been developed, farm households have got used to manage annual crops of high economic value is a commodity areca, coconut/copra, coffee, while the new crops are oil palm and rubber Other local wisdom is to choose short-term crops (annuals) or other commercial semi commodities. This is possible because of the chance pull factors and the push factors of each commodity are: (1) the availability of land resources (wet and dry); (2) limited human resources/labor, both in quality and quantity; (3) lack of capita/ capital markets; (4) technological mastery commodity/local wisdom, (5) the farmer institutions: farmers' groups combined/farmers groups and market (the auction market, their product distribution channels farming and lane farm; land and waterways, price information) and (6) ease other cash income by obtaining periodic/weekly. Commercialization level of households and farming of tidal land has not entered full commercial category, but classified as semicommercial farming. Key words: commercialization, farming, households, land tidal and rice.
INTRODUCTION
In early July 2015, the first forecast figures of paddy production in 2015 reached 75.55 million tons of dried paddy (GKG), or an increase of 6.65 percent compared to production in 2014 reached 70.8 million tons. The figure is equivalent to 41 million tons of rice. If the number of rice consumption of 114.12 kg/capita/year, the total consumption of rice for 253 million people hover around 30 million tonnes. That is, Indonesia has reached the target surplus of over 10 million tons. In 2014, Indonesia also had a surplus of 8.8 million tonnes and so did in 2013 a surplus of 9.5 million tonnes (BPS, 2015).
The government's target for food self-sufficiency next three years, is not an easy target to be achieved, given the problems of food will always be associated with the key issues concerning the availability of land, provision of production facilities and infrastructure, the provision of supporting infrastructure, processing technology, capital and institutional, competitiveness commodity and market competition, human resource capacity, consistency of central and local government policy in implementing sustainable agricultural development, and the impact of international policies relating to food products and agricultural products Indonesia
In an effort to maintain and preserve food self-sufficiency, especially paddy/rice nationally with regard to continued population increase and the conversion of agricultural land for non-agriculture, one of the strategies pursued by the government is to optimize the utilization of tidal land. Tidal land has a great potential for the development of agriculture with high productivity when done by applying specific technologies and supported by institutional conductive (Haryono, 2013). Tidal land in Jambi province is Tanjung Jabung Timur district area of 33 827 ha (64.06%) of the total land area of existing (BPS, Jambi Province, 2014). Increased production of rice or further production of other commodities, can be constrained due to relatively many wars commodities in a limited area with limited human resources. in 2014, as many as 18 commodity crops planted in areas of Indonesia, which continues to be encouraged by the government's productivity. Various commodities were competing with the

International Journal of Scientific and Research Publications, Volume 7, Issue 4, April 2017 358 ISSN 2250-3153
www.ijsrp.org
program and the program are to come from the same institution and different. This condition is an opportunity for farmers to determine the decision in production. Orientation of production of farmers and farm family members to determine the quality and quantity of output produced or inputs used.
With the application of appropriate agricultural technology and the role of government, including institutional engineering together or each of the past and to date has now changed the rice shortage become self-sufficient and even surplus. So it is going in Tanjung Jabung Timur, various commodities were competing with the program and the program are to come from the same institution and different. Housekeeping rice farmers are also in addition to conducting on-farm, also off-farm activities (processing, marketing and services in the field of agriculture) and non farm. Housekeeping future farmers are the ones who have the ability to do business, managerial ability, leadership, and entrepreneurship. Looking at agriculture as a business venture, businesses in agriculture.
With limited household and the number of alternative business opportunities, this condition is an opportunity for domestic farmers to improve the welfare of farmers to determine the decision of many choices of commodity and business opportunities or existing market opportunities in production, whether peasant households remain subsistence or turned into commercial production orientation. In this paper, the authors are interested in discussing how the level of commercialization efforts neighbor household tidal land rice farmers and also how the performance of the farm in Tanjung Jabung Timur.
REASEARCH ELABORATIONS
Eskola (2005), examined the determinants of farmers' participation in market output in Tanzania using a linear regression model. Increasing the distance to negatively affect the market found a level of commercialization. In addition, access to market and price information affects the level of commercialization of local households, but to a certain extent. Gibreel and Bauer (2007), using OLS models to assess the influence of socio-economic variables to the decision of the commercialization of farming households in western Sudan. Commercialization level of output is negatively correlated with the number of children in a family, the cost of inputs (pesticides), and transportation costs. On the other hand, the commercialization of the output was found positively correlated with the level of education and income outside of farming.
Asfaw et al. (2010), utilizing a regression model with propensity score, to examine the relationship between the increase in the increased use of inputs and commercialization in Ethiopia. Research results revealed that the use of good agricultural technology, the capital (assets) and the availability of family labor has a positive impact on the production of marketed surplus, while the age of the head of household and the distance to the market have a negative impact on the surplus production is marketed. Larson and the Deininger (2001), used a model tobit to examine the determinants of farmers' participation in market output in Uganda. A higher level of participation of farmers to markets higher output in the market when the price of output. Komarek (2010), used the model tobit and double hurdle models to examine the determinants of market commercialization of bananas in western Uganda. Farmers with higher yields and access to information that is found to sell more output while farmers further into the market found to be less participate in the market. The rise in prices of products were also found to attract more participation in the market. Studies from various African countries also demonstrates the potential synergies or trade-offs between investment cash crops and food crops production. The study found that the presence of commercial crops, such as cotton and peanuts have positive benefits for the small farmer food production in certain regions. Positive benefits include increased adoption of fertilizer on food crops is made possible by the distribution of crop inputs that can be purchased by cash. And increased availability of agricultural credit through accelerated cash crop that can be used to hire labor and finance additional investment in productive assets like draft oxen and traction equipment. These studies raise the possibility that the promotion of commercial crop production may, if appropriate be applied, have positive spill-over effects are important food crop intensification and productivity (Strasberg et. al., 1999). Strasberg et. al. (1999) found that the commercialization of multi-commodity plants correlated with the area of land ownership or cultivation areas among households surveyed in several areas of Kenya. Research results also mentions the commercialization of farming households, generally have a positive effect and significant on the use of fertilizers and crop productivity. The results also show that a 10 percent increase in the index of commercialization households (HCI) from an average rate of 39 percent, resulting in an average additional use of fertilizers 8 kg per hectare of fertilizer used on food crops and additional crop production averaging 7 percent.
Research results Govereh et. al., (1999), found no relationship, either directly or indirectly, between commercialization and productivity of wheat crop. Commercialization also contribute to the capital increase of grain production farm. In his research, found that the level of commercialization of farmers in Zimbabwe are significantly influenced by education of household head. Education of household head are also significant to farm productivity in Mozambique and Zimbabwe. In Zimbabwe, investment in human capital training program for cotton has a positive effect on the productivity of marketable surplus of food crops. It is well known that a high value commodity prices is the reason for the intensification. Additional evidence from other parts of Africa have shown that the process of intensification of agriculture and the growth of productivity increase of production is sold in the market (von Braun and Kennedy, 1994). In short, all of which are reviewed literature supports that by intensifying crop commercial to increase production and positive impact on household income of farmers in African countries.
RESEARCH METHODOLOGY The method used in the writing of this paper, do a comprehensive analysis of secondary data, secondary data from the Agricultural Census 2013 in Tanjung Jabung, Jambi Province, some data from field surveys and literature. This study, analyzing the data the district and sub-district, by taking the 4 districts of 11 districts in Tanjung Jabung, namely Muara Sabak Timur, District Rantau Rasau,

International Journal of Scientific and Research Publications, Volume 7, Issue 4, April 2017 359 ISSN 2250-3153
www.ijsrp.org
District and Sub-district Berbak Nipah Panjang. The reasons for selecting sub-district is the region becomes the highest tidal land rice farming households and other reasons are analyzed districts is part of a research area for research dissertation author ongoing. The level of commercialization of rice farming households measured by the value of sales output of all commodities to market compared with the output value of all commodities (Govereh et al. 1999, Strasberg et al., 1999). The level of commercialization of rice farming, assessed in terms of sales in terms of output and input purchases paddy (Von Braun et al., 1994).
RESULTS AND DISCUSSION
Performance of farming and households farming is farming activity whose activities produce farming with the aim of some or all production sold. Farming in this paper covers the business of food crops, horticulture and farming, including agricultural services. Specialty crops (rice and pulses) although it is not for sale (self-consumption) remains covered as a business. Farmer households (household farming) are households in which one or more members of the household manage agricultural enterprises with the purpose of part or all of the results are to be sold, either agricultural enterprises own property, in the result, or the property of others with pay, in this case, including agricultural services.
Agricultural enterprises in Tanjung Jabung Timur dominated by households. This is reflected in the large number of farming households when compared with agricultural companies incorporated or other businesses that besides household and agricultural companies incorporated. Total household agricultural enterprises in Tanjung Jabung Timur, years 2013, there were 41,059 households, an increase of 6.91 percent from 2003 which recorded as many as 38,404 households. Results Agricultural Cencus 2013, the largest increase in farm households in the plantation subsector (oil palm, rubber and betel nut), then the increase in domestic rice farmers, while household food crop farmers and other household commodities decline. While the number of agricultural companies incorporated in 2013 there were 13 companies and other businesses as much as two units. Although only a small amount of agricultural companies but the impact on the commercialization of farming households, farmers are very significant, especially for a commercial commodity. In Tanjung Jabung Timur, on land that affect the tides, the more varied farming with their wetlands and dry land. Based on the results Agricultural Cencus, 2013 known that households simply planting paddy percentage (1-19%) are very small paddy in Tanjung Jabung Timur dominated by households manage horticultural crops, then commodities, crops, rice cereal crops and legumes. For the details can be seen Table 1. Table 1. Number of Households Farming According to the District and Sub who Endeavored, in Tanjung Jabung Timur, Years 2013
Districts Food Crops
(Households) Cereal Crops and Legumes Horticulture
(House- holds)
Plantation (House-holds)
Paddy Cereal Crops and Legumes
Paddy/Cereal Crops and Legumes
Muara Sabak Timur 5.466
60 (1,10)*)
2.014 (36,85)
982 (17,97)
4.719 (86,33)
1.994 (36,48)
Rantau Rasau 5.442
279 (5,13)
2.486 (45,68)
1.210 (22,23)
5.133 (94,32)
2.377 (43,68)
Berbak 2.415
450 (18,63)
2.055 (85,09)
1.030 (42,65)
1.857 (76,89)
2.047 (84,76)
Nipah Panjang 4.264
249 (5,84)
1.875 (43,97)
1.161 (27,22)
3.524 (82,65)
1.847 (43,32)
Tanjung Jabung Timur 41.059
2.177 (5,30)
11.488 (27,98)
11.329 (27,59)
36.341 (88,51)
10.344 (25,19)
*) In parentheses figures in percent. Source: Data processed BPS Tanjung Jabung Timur (2014). From Table 1, it can be seen that the highest number of households is the business of horticultural crops, then venture commodities and the least amount of household is the household paddy. Paddy even though the outcomes sold production goal is for the primary needs of the family so that the rice including subsistence commodities. Crops include groups of grains, legumes, and tubers. The most commonly cultivated crops farmer households are peanuts, green beans, cassava, sweet potato, taro and others. Commodities commodity come into one's vision as a major cause of land conversion which is a commercial commodity. Orientation production of commodities is a market with a number of larger initial investment than other commodities. Old commodity that survive and thrive are the commodities of local wisdom and includes a commercial commodity is a commodity of coconut, areca, coffee and newly developed commercial commodities are oil palm and rubber and cinnamon. Land Farming and Wetland The use of land controlled by peasant households on average 2-3 hectare for land in Tanjung Jabung Timur domestic rice farmers cultivate several commodities at the same time, it is possible because the land is controlled by households consisting of agricultural land and non-agricultural land, while the land farm, consisting of wetland and not the wetland. and data Agricultural Census 2013 explain number of households is increasing and land held also expanding. Data show that although the commodity is a

International Journal of Scientific and Research Publications, Volume 7, Issue 4, April 2017 360 ISSN 2250-3153
www.ijsrp.org
commodity commercially cultivated (areca, coconut, oil palm, rubber, coffee, etc.), but the management is still the traditional ways (subsistence).
On the side of the means of production, the problems facing is insufficient availability of seeds/seedlings of superior quality, fertilizer, feed, pesticides/medicine, tools and agricultural machinery to the farm level, as well as underdeveloped institutional service providers the means of production. Not to later development effort seed/seedling broadly up in seed production centers resulting price/seedlings to be expensive, even resulting in a lot of circulation of seeds/seedlings false in society that are ultimately detrimental to farmers.
Seed is an important tool for businesses in agriculture, if the seeds/seedlings available is not good or false then the results are not as expected. In addition, procurement of seeds have not matched the growing season, usually the seed to the location after the planting season and sometimes the seed has expired. Condition of infrastructure, facilities and infrastructure, systems difficult to development because it requires substantial investment. Not many are willing to invest the private sector to venture seed/seedling. On the other hand, government is not empowered to handle.
Wetland is part of the area of agricultural land held by households of farmers and agricultural businesses the number of households by districts and groups controlled vast wetland in Tanjung Jabung Timur, can be seen in Table 2. Table 2. Total Household Farming According to the District and Group Size Controlled Wetland in Tanjung Jabung Timur, Years 2013
District Land Use in Farm Paddy (Hectare) < 0,50 0,50-0,99 1,00-1,99 2,00-4,99 5-9,99 ≥ 10
Muara Sabak Timur 3.680 454 954 359 8 1 Rantau Rasau 3.440 665 1.129 207 1 - Berbak 576 442 934 433 11 - Nipah Panjang 2.726 489 679 337 29 4 Tanjung Jabung Timur 32.260 2.533 4.508 1.688 63 7
Source: Data compiled from BPS Jambi (2014) Table 2, it can be revealed that the number of households has a land area of 0.50 ha of rice farming on a relatively large although more households have a smaller area of 0.5 ha. Agricultural census data of 2013, showed an increase in the number of domestic rice farmers in four districts of the previous year 2003. There is the possibility of increasing the number of farming households due to the many programs to increase rice production and for land improvement productivity optimal and suboptimal land. Increasing the number of farm households could increase kept dwindling in the next year. This possibility is great, due to paddy as subsistence commodities compete with other commercial commodity in many ways. Competing in commodity prices, the use of human resources, land use and the opportunity to increase revenue and participation. Commercial crops (oil palm, areca, coconut/copra, palm oil) does not need a lot of human resources, with no harvest and post-harvest handling, and without participating direct marketing of products and ensure the cash revenue regularly/periodically. Human Resources Another potential in the swamp tidal an increasing number of households agricultural enterprises in 2013 compared to 2003, and an increase in most farming households in the plantation subsector (oil palm, rubber and betel nut), then the increase in domestic rice farmers, while peasant households other food crops declined. Although the number of households increased agricultural businesses of farmers but farmers human resources limited in number, this is an obstacle in farm management. In Tanjung Jabung, Timur the number of farming households as many as 41.059 households by the number of farmers 48 642 inhabitants. So that the number of households is not much different from the number of farmers. For details, can be shown by Table 3. Table 3. Total Household Farming and Number of Household Members and Number of Farmers According to The District in Tanjung Jabung Timur, Year 2013
District Member of Households Farmers (Person)
Member Of Household Total Farmers (Person) Male
(Person) Female (Person)
Total (Person)
Muara Sabak Timur 5.466 11.262 10.930 22.192 5.896 Rantau Rasau 5.442 10.160 9.844 20.004 5.834 Berbak 2.415 4.648 4.436 9.084 3.225 Nipah Panjang 4.264 8.687 8.690 17.377 5.238 Tanjung Jabung Timur 41.059 82.527 79.671 162.198 48.642
Source: Data compiled from BPS Jambi (2014) Table 3, show in one household only 1-2 people per household farmers. If the estimated number of members an average of 5 persons per household means there are 3-4 people who are not involved in managing the farm. It can be concluded their limited

International Journal of Scientific and Research Publications, Volume 7, Issue 4, April 2017 361 ISSN 2250-3153
www.ijsrp.org
human resources constraints (family labor) in managing the farm. Quantitatively labor for agriculture is less available in Tanjung Jabung Timur district. Factors that strongly supports human resources are their institutional farmer who is very strong both institutional farming (aquaculture) and institutional markets, such The combined group of farmers and farmer groups there every village by the leading commodity in the area. Decreasing the number of farmers who are not many indications of the decreasing interest of young people to work in the agriculture sector. Agricultural Technology Agricultural technology has grown rapidly from the production process in the upstream to downstream processing. Many applications of the technology used in modern agriculture industry in Indonesia to pursue a high yield with lower production costs. Various technological innovations have been produced by the Department of Agriculture (Department of Agriculture, 2015). Through the Institute for Agricultural Technology in the areas that generate location-specific agricultural technology, to encourage agricultural systems and efficient business, by utilizing agricultural resources optimally. The technologies include the management of water resources such as water harvesting technology, technology, water use efficiency through drip irrigation, irrigation networks village level (JIDES) and farm level irrigation networks (JITUT). The use of tools and agricultural machinery, water pump technology, tractors (hand-tractor) for land management, produce new varieties, other products. Post-harvest technology and crop thresher technology (power thresher) grain, technology dryers (dryer) grain. However, the use of modern technology is in addition constrained human resource quality is relatively low, households are not supported financial situation of farmers. Besides being able to accelerate the process of paddy into rice-producing plant but also if it is true that the use of the technology is less precise can cause shrinkage/loss of crops. Similarly, the technology associated with marketing, eg packaging technology, storage, sorting and others that would be a challenge for research institutes to produce technology that is applicable. Various packages are expected to appropriate technology that can be used by farmers to increase the quantity, quality and productivity of agricultural products. Commercialization efforts Farmer Households Sales Results In Tanjung Jabung Timur only a small fraction (<1%) were sold all their crops, 55.59%, which sells most of his crop and 43.56% selling all the produce consumed own crops. To detail can be seen in Table 4. Table 4. Sales of Products Rice Farmer Households in the district of Tanjung Jabung Timur, Year 2013
District Number of Households by Sales Results Rice Production (Household) Total Household Sold all Sold Most Not Sold
Muara Sabak Timur 11 (0,55)*) 1.117 (55,99) 867 (43,56) 1.995 Rantau Rasau 17 (0,71) 1.126 (47,31) 1.237 (51,97) 2.380 Berbak 18 (0,87) 1.348 (65,82) 682 (33,30) 2.048 Nipah Panjang 14 (0,73) 1.140 (59,65) 757 (39,61) 1.911 Tanjung Jabung Timur 88 (0,85) 5.763 (55,59) 4.516 (43,56) 10.367
*) Figures in parentheses in percent Source: BPS, Tanjung Jabung Timur (2014) In contrast to the domestic rice farmers, most of the households of farmers crops (36.55 percent), which sells some of the crops cereal crops and legumes. Meanwhile, households that consume the entire crop cereal crops and legumes alone there are about 32.47 percent (12 436 households), while the number of households who sells all his crop amounted to 30.98 percent. Characteristics sale of the crop that most households sell the entire harvest crops cereal crops and legumes in corn, soybean, sweet potato and taro/canna. The majority of households growing commodities peanuts and green beans just sell part of their crops. Especially for cassava, most households that plant has a purpose that harvest timber parsnip later will be entirely used for own consumption and partly sold. In contrast to the household rice, most households crops (36.55 percent), which sells some of the crops cereal crops and legumes. Meanwhile, households that consume the entire crop cereal crops and legumes alone there are about 32.47 percent (12 436 households), while the number of households who sells all his crop amounted to 30.98 percent. With the commercialization of agriculture will increase the income of farm households. The increase in income will increase the demand for agricultural products including food crops on the other side. Domestic market demand, in addition to increasing the number, also need a diversity of product variety, so it will open greater opportunities to diversify products. Commodity diversification will lead to the diversification of products. Commercialization will also affect the harvesting and harvesting equipment. In Tanjung Jabung Timur, the main harvesting system used by most households effort rice crop is harvested own with simple equipment. Commodity Diversification With so many activities of members of the household rice farmers, meaning peasant households must allocate labor their families for a variety of activities, Household rice farmers cultivate a variety of businesses crops of rice and other food (corn, soy), horticulture (bananas, cucumbers, peppers), plants plantations (coconut, palm oil, coffee, nuts, rubber), farming and pisciculture,

International Journal of Scientific and Research Publications, Volume 7, Issue 4, April 2017 362 ISSN 2250-3153
www.ijsrp.org
motorcycle transport business, small boat and other businesses. Farm commodity diversification, products and business outside the farming is done adapted to the physical infrastructure available (rivers, ditches/main canal is wide, swamp/pool, main roads and cross streets). Rice farmer households currently managing more than one commodity at a time other than rice (commodity diversification), mostly a commercial commodity (oil palm, rubber, coffee, areca nut, coconut) and a few others are commodity crops (subsistence) others. This triggered several reasons: (1) improvement in the market/and commodity prices, (2) limited human resources (labor) and technology tools and agricultural machinery (3) limited capital for production activities (aquaculture), harvest and post-harvest, and ( 4) ease of obtaining cash income regularly (daily/weekly). From some of these reasons, despite their stated farming development, commercialization efforts rice farmer households tidal swamp land not yet commercially available. Household rice farmers obtain the production of various commodities and income from various sources, which are used for the consumption of food and non food, investment in farming activities and human resources of farmers, take out a loan (credit) if you want to develop their farming and save when there is excess cash once covered all the household expenses. Commercial or subsistence farming household economic behavior is a choice of farm households. Each has advantages and disadvantages. Commercialization of farming is the process of transition from subsistence, semi-subsistence to semi commercial and then to full commercialization (Pingali and Rosegrant, 2012). Through the process of commerliaziation farming, farming changed the purpose of to feed itself becomes earn cash income and profit (Pingali, 2013). Commercialization of farming can occur on the output side with the increase in products sold (marketed surplus), but may also occur on the input side with an increase in the use of the purchase of inputs (von Braun, 1995). Commercialization of farming is the ratio of the land allocated for individual farming (people) of the total farmland, the ratio of the value of the input (input) which is derived from the value of production (output) in the market, the sales ratio of output relative to the output value (Balint, 2014). Commercialization of farmer households can also be seen as a dynamic process of how the speed of the proportion of output sold and purchased inputs change from time to time at the household level (Moti et al., 2010). The success and failure of the commercialization of farming households affected by many factors (physical, political, economic, social, cultural, technological and individual) and these factors could be an inhibiting factor and the factors driving commercialization. Commercialization is not restricted to food crops as traditional crops are marketed to a certain extent also concerns the commercial crop is definitely a market-oriented (Gabremadhin and Moti, 2010). Specialization as a commodity crops traditionally regarded as a commodity that can be marketed during the commercialization process from subsistence to commercial. The concept of commercialization of farming households in the production of traditional crops, the decision will be targeting the market, rather than just for surplus production (Pingali and Rosegrant, 2012). Commercialization of domestic rice farmers constrained by limited human resources (labor), the lack of accessibility of households of farmers to markets, especially market information so weak bargaining position of farmers, the accessibility of farmers to the capital, lack of mastery of technology (on farm and off farm) by farmers and the use of production factors is not optimal. In this case the government should support a change towards the commercialization of domestic rice farmers and rice farming by providing accessibility of farm households towards market input and output markets, accessibility of farmers to capital and agricultural finance / credit, technology, production and pricing information, accessibility of farmers to resources , as well as the development of agribusiness area.
CONCLUSION Performance of households farming on tidal land in the selection of commodities and variance commodities have led to the performance of the household farmers is commercial, especially in the selection. Selection of a commercial commodity or subsistence commodities on pull factor and push factors of each of these commodities. Commercial of households farmers means farmers trying to households farmers with rational, is a threat to subsistence commodities, mainly food crops, especially rice. With the development program wetlands (tidalland) by central and local government, is the opportunity for domestic rice farmers and the government can determine production in swamp tidal, whether market orientation or commercial orientation or survive on subsistence, and can be developed models for both options.
REFERENCES
[1] A.Komarek, The Determinants of Banana Market Commercialization in Westen Uganda, African Journal of Agricultural Research, 2010. vol. 5 (9), pp. 755-784. Available at: http://www.academicjournals.org/AJAR [accessed September, 2009]. [2] A.Mulyana, Performance of Supply and Demand Prospects Rice Indonesia and the Free Trade Era Toward Self-Sufficiency: A Simulation Analysis, Doctoral Dissertation, Graduate School, Bogor Agricultural University, Bogor, 1998. [3] A.Mulyana, Constraints and Social Capital in Suboptimal Land Management to Improve Traditional Farmers Welfare. Proceedings of the National Seminar on Land Suboptimal 2014, Palembang 26 to 27 September 2014. ISBN 979-587-529-9. [4] A.Zulkifli, Impact of Trade Liberalization Of Performance of the Indonesian Palm Oil Industry and Trade of the World Palm Oil. Doctoral Dissertation. Graduate program. Bogor Agricultural Institute. Bogor. 2000. [5] B. Balint, Institutional Factors Influencing Agricultural Sales of the Individual Farmers in Romania. Studies on the Agricultural and Food Sector in Central and Eastern Europe, Hall (Saale), IAMO, 2014. vol. 25, pp. 238-256. [6] BPS. Jambi Province. Farming Images Jambi According Subsector (The results of Agricultural Census 2013 Complete Enumeration Survey of Income and Household Pertania 2013), Central Bureau of Statistics (BPS), Jambi Province. Jambi, 2014. [7] BPS. Tanjung Jabung Timur, Image Agricultural Business District Tanjung Jabung Timur According Subsector (Results Complete Enumeration Survey Agricultural Census 2013 and Household Income Agriculture, 2013), BPS Tanjung Jabung Timur. Muara Sabak, 2014. [8] B. Gebremedhin, and J. Moti, Commercialization of Smallholders: Is Market Participation Enough? Contributed Paper Presented at the Joint 3rd African

International Journal of Scientific and Research Publications, Volume 7, Issue 4, April 2017 363 ISSN 2250-3153
www.ijsrp.org
Association of Agricultural Economists (AAAE) and 48th Agricultural Economists Association of South Africa (AEASA) Conference, Cape Town, South Africa, September. 2011, pp. 19-23 [9] E. Eskola, Commercialisation and Proverty in Tanzania: Household-Level Analysis. 2006. Available at: ideas.repec.org/p/egc/wpaper/798.html [accessed 14 Juni 2010]. [10] Govereh J, Jayne TS, Nyoro J., Smallholder Commercialization, Interlinked Markets and Food Crop Productivity: Cross-country Evidence in Eastern and Southern Africa. 1999. http://www.aec.msu.edu/fs2/ag_transformation/atw_govereh [11] I.Wahyuni, The Level of Commercialization of Paddy Farming and Social Factors That Influence it. Thesis, Faculty of Agriculture, University Jambi.1986 [12] J. Govereh, T.S. Jayne, and J. Nyoro, Smallholder Commercialization, Interlinked Markets and Food Crop Productivity: Cross-country Evidence in Eastern and Southern Africa. 1999. pp. 24-29 [13] J. Von Braun, Agricultural Commercialization: Impacts On Income and Nutrition and Implications for Policy, Food Policy, 1995, vol. 20 (3), pp 187-202. [14] Haryono, Policy Strategy 2013, The Ministry of Agriculture in Optimization Suboptimal Land Support National Food Security, Proceedings of the National Seminar on Land Suboptimal "Suboptimal the intensification of Land Management to Support National Food Self-Reliance", Palembang 20-21 September 2013 ISBN 979-587-501-9. [15] Ministry of Agriculture, Strategic Plan of the Ministry of Agriculture Year 2015-2019, The Ministry of Agriculture of the Republic of Indonesia, 2015. [16] J. Moti, G. Berhanu, and D. Hoekstra, Smallholder Commercialization: Processes, Determinants and Impact, Discussion Paper No.18. Improving Productivity and Market Success (IPMS) of Ethiopian Farmers Project, ILRI (International Livestock Research Institute), Nairobi, Kenya, 1999. [17] J. Von Braun and Kennedy, (Eds.), Agricultural Commercialization, Economic Development, and Nutrition, Published for IFPRI by Johns Hopkins University Press, Baltimore. 1994 [18] J. Von Braun, Agricultural Commercialization: Impacts On Income and Nutrition and Implications for Policy, Food Policy, 1995, vol. 20 (3), pp 187-202. [19] K. Deininger, and J. Okidi, Rural Households: Incomes, Productivity, and Nonfarm Enterprises. In Reinikka R and Collier P (Eds.), Uganda’s Recovery: The Role of Farm, Firms, and Government. Fourtain Publishers, Kampala, Uganda. 2001. [20] L.P. Pingali, and M.W. Rosegrant, Agricultural Commercialisation and Diversification: Process and Polices, Food Policy, 2012. Vol. 20 (3), pp 171–185. [21] L.P. Pingali, From Subsistence to Commercial Production System: The Transformation of Asian Agriculture, American Journal of Agricultural Economics, 2013, vol.79 (2), pp 628-634. [22] P.J. Strasberg, T.S. Jayne, T. Yamano, J. Nyoro, D. Karanja, J. Strauss, Effects of Agricultural Commercialization on Food Crop Input Use and Productivity in Kenya, Michigan State University International Development Working Papers No. 71. Michigan, USA, 1999. [23] P.J. Strasberg, T.S.Jayne, T. Yamano, J. Nyoro, D. Karanja, J. Strauss, Effects of Agricultural Commercialization on Food Crop Input Use and Productivity in Kenya. Michigan State University International Development Working Papers No. 71. Michigan, USA. 1999. [24] S. Asfaw, B. Shiferaw, and F. Simtone, Does Technology Adoption Promote Commercocialization? Evidence from Chickpea Technologies in Ethiopia. 2010. Availbable at : www.csae.ox.ac.uk/conferences/2010-EdiA/papers/121-Asfaw.pdf [accessed 10 June 2011]. [25] T.M. Gibreel, and S. Bauer, Targeting the Challenges of Agro-forestry system Disappearance under Rapit Commercialisation: Factors Affecting Farmer Land Use Options in Gum-Belt of Western Sudan, Conference paper, Tropetang, 2007. Available at: http://www.tropentag.de/2007/abstracts/full/157.pdf.
AUTHORS First Author – Ira Wahyuni, Lecturer at Jambi University, Indonesia; Ph.D. at Sriwijaya University, Jambi, Indonesia. [email protected] Second Author – Amruzi Minha, lecturer at Sriwijaya University, Palembang, Indonesia, [email protected] Third Author – Andy Mulyani, lecturer at Sriwijaya University, Palembang, Indonesia, [email protected] Fourth Author – Zulkifli Alamsyah, lecturer at Jambi University, Jambi , Indonesia, [email protected]
International Journal of Scientific and Research Publications, Volume 7, Issue 4, April 2017 364 ISSN 2250-3153
www.ijsrp.org
Physico-Chemical Analysis of Drinking Water (in case of Mettu town, Southwest Ethiopia)
Bizualem Wakuma* and Tolesa Fita**
* MSc. in Applied Chemistry **MSc. in Inorganic Chemistry
Abstract- Due to various natural and anthropogenic activities, quality of water was deteriorated in most towns of the country. These changes make the community to depend on unsafe and poor water consumption. Under the present investigation some physicochemical parameters of water from Mettu town for drinking purpose was characterized. The analyzed laboratory result of some heavy/trace metals from the town were Zn (from source point, tap and distribution was 0.06429 ± 0.00242, 0.00759 ± 0.00235 and 0.03594 ± 0.00238 respectively), Pb (from source point, tap and distribution was respectively 0.04348 ± 0.04376, 0.11141 ± 0.04450 and 0.07744 ± 0.04413). Among the three heavy metals the concentration of Lead (Pb) recorded was above the maximum permissible limit of lead in drinking water (0.01 mg/L) according to WHO standard. Some selected laboratory result of physicochemical parameters was pH [Ms (6.44), Mt (6.61) & Md (6.32)]. Electrical Conductivity (µS/cm-
1) [Ms (274), Mt (259) & Md (267).Turbidity (NTU) [Ms (8.21), Mt (5.63) & Md (5.87). Comparatively the maximum value for almost all physicochemical parameters were recorded at Mettu town which indicates further treatment process needs for this town. Index Terms- Physicochemical, Heavy metals, Drinking water
I. INTRODUCTION ater is one of the most important compounds that constitute the largest part of life on earth. 70.9% of the
surface of our planate is covered by water. Of which; 97% of the total water wealth is concentrated in oceans while ice caps comprises 2.4%. Other surface water bodies such as rivers, lakes and ponds constitute 0.6% and 1.6% retained underground (Hirsch et al., 2006). It is the most crucial thing that life can exist on earth and involved for several purposes including drinking, cleaning, dissolving, oxygenating, photo-synthesis, transportation, habitat formation, etc. (WHO, 1992). Drinking water is the second prerequisite for life next to oxygen (Shan e al., 2013; Roohul-Amin., et al., 2012). However, majority of the world’s population still live without access to healthy water due to continuous contamination with several contaminants such as sewage and industrial effluents (Goel, 2006). The contamination of drinking water with physical, chemical and microbial contaminates have been posing serious threats to millions of people across the globe. In both the developing and developed nations, microbial pathogens recognized as a cause of severe morbidity and mortality of
individuals through periodic outbreaks of diarrhoeal diseases (Corso et al., 2003; Mac-Kenzie et al., 1994 and Bouzid et al., 2008). In addition, water sources including rivers, springs, wells and underground water sources have increasingly become polluted with municipal sewage, industrial waste, industrial toxics, heavy metals, fertilizers, chemicals, radioactive substances, land sediment and so on (Bartram and Balance, 1996). Physicochemical parameters such as turbidity, pH, temperature, nitrate and others with respect to water quality are widely accepted as other critical water quality parameters describing the quality of drinking water. In Ethiopia, access to improved water supply and sanitation is very low and it is estimated to be 38% and 12% respectively (UNICEF and WHO, 2008). In the country, over 60% of the communicable diseases are assumed to be caused by poor environmental health conditions that emerged from unsafe and inadequate drinking water supply besides from poor hygienic and sanitation practices (MOH, 2007). The WHO Guidelines for Drinking Water Quality (GDWQ) describes the need to protect public health through the adoption of a water safety plan (WSP). It establishes general guidelines for drinking water quality providing a common point of reference for all nations to determine the safe level of drinking water. This necessitates proper protection of water supply from contamination and the need for regular surveillance of water resources. Frequent examination of indicator organisms remains one of the best methods of assessing the hygienic condition of drinking water (Mengesha Admasu et al., 2004). Thus, surveillance of drinking water is imperative to minimize such contaminations and ensures continuous supplies of healthy water to the people of Mettu town, Illubabor zone, Southwest Ethiopia. Statements of the Problem Water bodies usually consist of different bio-assimilation and bio-accumulation of metals in aquatic organisms which have long-term potential implications on human health and ecosystem. Heavy metals in different water bodies and sediments are most investigated recently. The toxicity of these heavy metals has long been concerned since it is very important to the health of people and ecology. They also accumulate in water at toxic levels as a result of long-term application of untreated wastewaters (Bartram and Balace, 1996; Ahmed et al., 2010). Informal information speaks; drinking water quality of Mettu, Bedelle and Gore is not good enough to drink and mostly become contaminated with variety of physical and biological contaminants that usually result in the establishment of frequent diarrhoea in the inhabitant peoples.
W

International Journal of Scientific and Research Publications, Volume 7, Issue 4, April 2017 365 ISSN 2250-3153
www.ijsrp.org
In addition, there are no scientific evidences that show the quality status of drinking waters from these areas in the literatures. Consequently, the present study is aimed at evaluating the physicochemical parameters and such as turbidity, trace metals (Cu, Zn, Cd, Ag and Pb), pH, temperature; nitrate, phosphate, chloride, TDS, TSS, total hardness, sodium, potassium with respect to water quality parameters are widely accepted as other critical water quality parameters describing the quality of drinking water of Mettu town southwest Ethiopia for the first time. Significances of the study The study is designed to conduct the determination of physicochemical quality of drinking water of Mettu, Bedelle and Gore towns from December, (2013) to April, (2014). The work will help to assess the pollution status of drinking water which is being supplied to inhabitants of the already mentioned selected towns. Similarly, the study is also important for providing scientific evidences before someone using tap water of the towns for drinking purposes that help them to take care from being infected. Materials and Methods Description of study area Mettu is found in south-west Ethiopia of Oromia region. Mettu is found 600 km from Addis Ababa south west part of Ethiopia and it is 170 km from Gambela region on the way to Jimma town. Mettu is the capital city of Illubabor zone. Sampling Point Selection and Location Three sampling points/sites from the town were selected for analyzing the physicochemical water quality parameters as well as some selected heavy metals concentration of drinking water. The selected sampling points were: Source point, Tap water and Distribution or reservoir point. Water sample was collected from each sampling points. To collect water sample from each sampling point different points was selected to represent the whole sample and finally composite sample was collected and was transported to the laboratory for analysis. Water samples were collected three times from each sampling points by using polyethylene and glass bottles. Water sample was carried out during the dry time, single volume of water taken all at one. Once the sample is collected from each sampling point, all physicochemical parameters selected were analyzed both in the laboratory and at the field. Water Water samples from each of four sampling points were collected by direct immersion of bottles into the river and handled by rope. Before collection of water samples, bottles were washed with concentrated nitric acid and distilled water to avoid contamination.
Methods, Materials and Chemicals Chemicals and reagents used during analysis periods were analytical grade. For all sampling points pH of the water sample was measured by using pH meter (pH 600 Milwaukee (Mauritius) at in-situ. pH meter was calibrated by buffer standards at pH 4, 7 and 10 (AWWA, 2002). Electrical conductivity (EC) was measured by digital conductometer. Total Alkalinity was measured by the titration method using methyl orange indicator and titrating with standardized sulphuric acid. Calcium was measured by titration using Murexide indicator with standardized EDTA solution as a titrant. Chloride was measured by titration using Potassium chromate indicator and with standardized silver nitrate solution. Turbidity was measured by digital Turbidimetrc 2100A instrument. Total dissolved solids (TDS) were measured by Digital Conductometer. Magnesium was measured by titration method using Eriochrome Black T as an indicator and titrating with standardized EDTA solution. Total hardness was measured by titration using Eriochrome Black T as an indicator and with standardized EDTA solution. Ammonia (by stannous chloride method), nitrate, and phosphate (by Phenate method) were measured by Uv-vis spectrophotometer (ELICO SL 160, INDIA). Sulphate was determined by Gravimetric Method with Ignition of Residue. Potassium and sodium was measured by Flame Emission Spectrophotometer (ELICO CL 378 Flame Photometer, India). For Trace metals analysis Flame Atomic Absorption Spectrometer (Analytikjena model nov AA 300) was used. The analyzed laboratory result taken from all sampling points was evaluated and compared with the WHO and the Draft Ethiopian drinking water quality standards, EPA standards and interpreted in accordance with the result obtained from the laboratory and with the maximum WHO allowable limits. Results and Discussions Determination of Heavy Metal Concentration Concentration of heavy metals (Pb, Cu and Zn) for all sampling points was determined using Flame Atomic Absorption Spectrophotometer (Analytikjena model nov AA 300) at Jimma University; Applied Chemistry Laboratory. Method Optimization Process During the optimization process, different digestion procedures that employ HNO3, HClO4 and H2O2 mixtures were selected from literature and assessed (AWWA, 2002). The optimization procedure was selected on the basis of clarity of digestate, minimal acid volume consumption, digestion temperature and minimum time consumed. The optimum procedure chosen based on these criteria required a total of 3 hours for the complete digestion of 50 ml of water sample with 6 ml HNO3, 4 ml HClO4 and 2 ml H2O2.
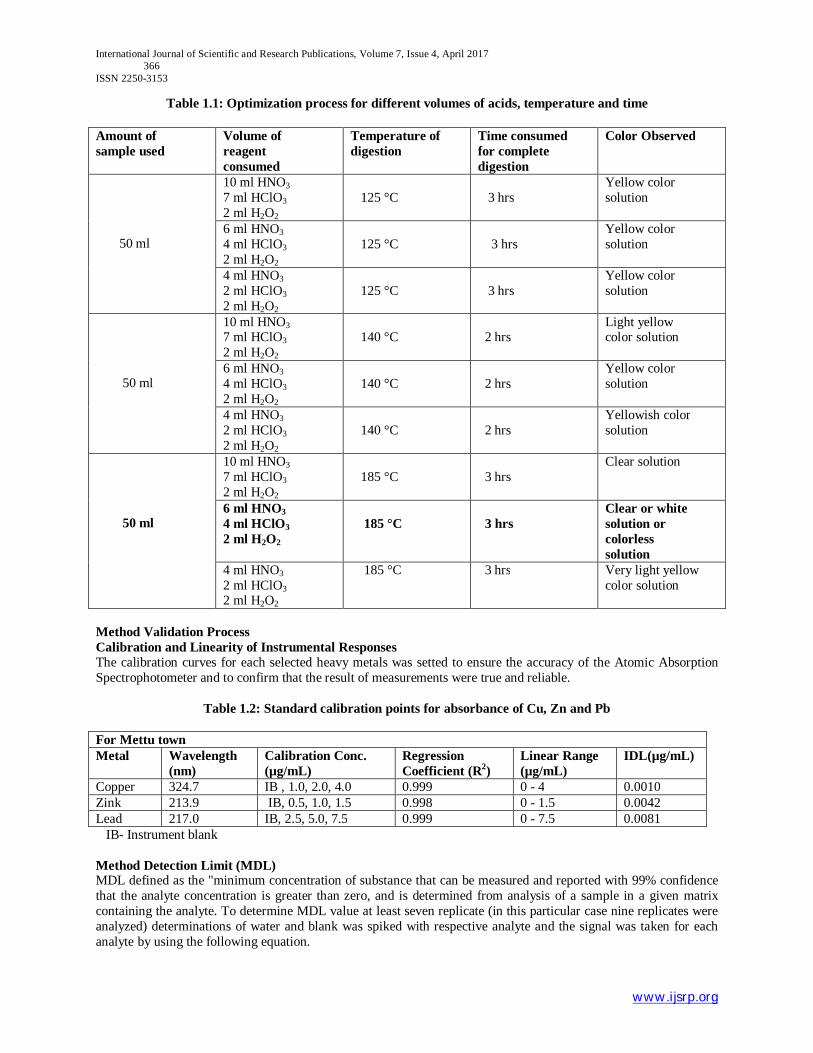
International Journal of Scientific and Research Publications, Volume 7, Issue 4, April 2017 366 ISSN 2250-3153
www.ijsrp.org
Table 1.1: Optimization process for different volumes of acids, temperature and time
Method Validation Process Calibration and Linearity of Instrumental Responses The calibration curves for each selected heavy metals was setted to ensure the accuracy of the Atomic Absorption Spectrophotometer and to confirm that the result of measurements were true and reliable.
Table 1.2: Standard calibration points for absorbance of Cu, Zn and Pb For Mettu town Metal Wavelength
(nm) Calibration Conc. (µg/mL)
Regression Coefficient (R2)
Linear Range (µg/mL)
IDL(µg/mL)
Copper 324.7 IB , 1.0, 2.0, 4.0 0.999 0 - 4 0.0010 Zink 213.9 IB, 0.5, 1.0, 1.5 0.998 0 - 1.5 0.0042 Lead 217.0 IB, 2.5, 5.0, 7.5 0.999 0 - 7.5 0.0081 IB- Instrument blank Method Detection Limit (MDL) MDL defined as the "minimum concentration of substance that can be measured and reported with 99% confidence that the analyte concentration is greater than zero, and is determined from analysis of a sample in a given matrix containing the analyte. To determine MDL value at least seven replicate (in this particular case nine replicates were analyzed) determinations of water and blank was spiked with respective analyte and the signal was taken for each analyte by using the following equation.
Amount of sample used
Volume of reagent consumed
Temperature of digestion
Time consumed for complete digestion
Color Observed
50 ml
10 ml HNO3 7 ml HClO3 2 ml H2O2
125 °C
3 hrs
Yellow color solution
6 ml HNO3 4 ml HClO3 2 ml H2O2
125 °C
3 hrs
Yellow color solution
4 ml HNO3 2 ml HClO3 2 ml H2O2
125 °C
3 hrs
Yellow color solution
50 ml
10 ml HNO3 7 ml HClO3 2 ml H2O2
140 °C
2 hrs
Light yellow color solution
6 ml HNO3 4 ml HClO3 2 ml H2O2
140 °C
2 hrs
Yellow color solution
4 ml HNO3 2 ml HClO3 2 ml H2O2
140 °C
2 hrs
Yellowish color solution
50 ml
10 ml HNO3 7 ml HClO3 2 ml H2O2
185 °C
3 hrs
Clear solution
6 ml HNO3 4 ml HClO3 2 ml H2O2
185 °C
3 hrs
Clear or white solution or colorless solution
4 ml HNO3 2 ml HClO3 2 ml H2O2
185 °C 3 hrs Very light yellow color solution

International Journal of Scientific and Research Publications, Volume 7, Issue 4, April 2017 367 ISSN 2250-3153
www.ijsrp.org
MDL = SD x t Where: - MDL- method detection limit SD- standard deviation of measured replicates t- Student’s t- value measured at 99% confidence level (In this particular case N=9, t=2.821) Instrumental Detection Limit (IDL) Instrument Detection Limit (IDL) is also defined as the concentration equivalent to a signal, due to the analyte of interest, which is the smallest signal that can be distinguished from background noise by a particular instrument. The IDL should always be below the method detection limit, and is not used for compliance data reporting, but may be used for statistical data analysis and comparing the attributes of different instruments (Erich P., 2010),
Table 1.3: Results of IDL and MDL for water sample
Metal IDL (ppm) MDL (ppm)
Cu 0.0010 0.0042
Zn 0.0023 0.0042
Pb 0.0070 0.0081
Recovery Test One of the most important quality assessment tools is testing the recovery of a known addition or spike of analyte to a method blank, field blank or sample. In situations where of standard reference materials are not available it is common practice to perform spiking experiment to evaluate the efficiency of an acid digestion method (Erich P., 2010). Performance of the selected digestion method for water sample measured by conducting recovery test on spiked samples using composite standard solution of the analyzed metals.Percent recovery for the metals was calculated using the following equation:-
Where: - R- percent recovery. Cs- measured concentration of a metal in the spiked sample. C- Average concentration of the metals in the samples (water or sediment) S- Concentration equivalent added to the spiked sample
Table 1.4: Determination of percent recovery of water sample
Metal Cs C S % R
Cu (mg/L) 1.20 0.29 1.05 86 0.0115
Zn (mg/L) 1.48 0.63 1.05 85 0.0456
Pb (mg/L) 3.51 2.51 1.05 95 0.0762 Analysis of Metals in Water Samples The average results of heavy metals analyzed for water sample from all sampling points and from all replicate analysis were summarized in the following table.
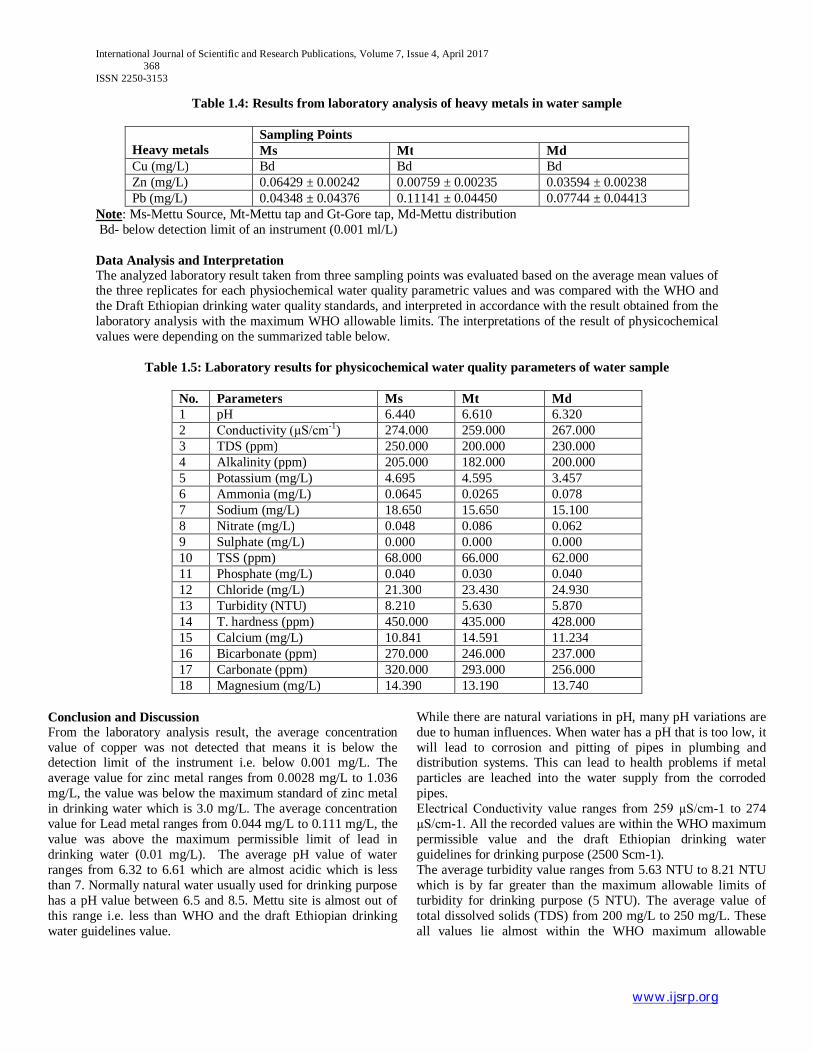
International Journal of Scientific and Research Publications, Volume 7, Issue 4, April 2017 368 ISSN 2250-3153
www.ijsrp.org
Table 1.4: Results from laboratory analysis of heavy metals in water sample
Heavy metals
Sampling Points Ms Mt Md
Cu (mg/L) Bd Bd Bd Zn (mg/L) 0.06429 ± 0.00242 0.00759 ± 0.00235 0.03594 ± 0.00238 Pb (mg/L) 0.04348 ± 0.04376 0.11141 ± 0.04450 0.07744 ± 0.04413
Note: Ms-Mettu Source, Mt-Mettu tap and Gt-Gore tap, Md-Mettu distribution Bd- below detection limit of an instrument (0.001 ml/L) Data Analysis and Interpretation The analyzed laboratory result taken from three sampling points was evaluated based on the average mean values of the three replicates for each physiochemical water quality parametric values and was compared with the WHO and the Draft Ethiopian drinking water quality standards, and interpreted in accordance with the result obtained from the laboratory analysis with the maximum WHO allowable limits. The interpretations of the result of physicochemical values were depending on the summarized table below.
Table 1.5: Laboratory results for physicochemical water quality parameters of water sample
No. Parameters Ms Mt Md 1 pH 6.440 6.610 6.320 2 Conductivity (µS/cm-1) 274.000 259.000 267.000 3 TDS (ppm) 250.000 200.000 230.000 4 Alkalinity (ppm) 205.000 182.000 200.000 5 Potassium (mg/L) 4.695 4.595 3.457 6 Ammonia (mg/L) 0.0645 0.0265 0.078 7 Sodium (mg/L) 18.650 15.650 15.100 8 Nitrate (mg/L) 0.048 0.086 0.062 9 Sulphate (mg/L) 0.000 0.000 0.000 10 TSS (ppm) 68.000 66.000 62.000 11 Phosphate (mg/L) 0.040 0.030 0.040 12 Chloride (mg/L) 21.300 23.430 24.930 13 Turbidity (NTU) 8.210 5.630 5.870 14 T. hardness (ppm) 450.000 435.000 428.000 15 Calcium (mg/L) 10.841 14.591 11.234 16 Bicarbonate (ppm) 270.000 246.000 237.000 17 Carbonate (ppm) 320.000 293.000 256.000 18 Magnesium (mg/L) 14.390 13.190 13.740
Conclusion and Discussion From the laboratory analysis result, the average concentration value of copper was not detected that means it is below the detection limit of the instrument i.e. below 0.001 mg/L. The average value for zinc metal ranges from 0.0028 mg/L to 1.036 mg/L, the value was below the maximum standard of zinc metal in drinking water which is 3.0 mg/L. The average concentration value for Lead metal ranges from 0.044 mg/L to 0.111 mg/L, the value was above the maximum permissible limit of lead in drinking water (0.01 mg/L). The average pH value of water ranges from 6.32 to 6.61 which are almost acidic which is less than 7. Normally natural water usually used for drinking purpose has a pH value between 6.5 and 8.5. Mettu site is almost out of this range i.e. less than WHO and the draft Ethiopian drinking water guidelines value.
While there are natural variations in pH, many pH variations are due to human influences. When water has a pH that is too low, it will lead to corrosion and pitting of pipes in plumbing and distribution systems. This can lead to health problems if metal particles are leached into the water supply from the corroded pipes. Electrical Conductivity value ranges from 259 µS/cm-1 to 274 µS/cm-1. All the recorded values are within the WHO maximum permissible value and the draft Ethiopian drinking water guidelines for drinking purpose (2500 Scm-1). The average turbidity value ranges from 5.63 NTU to 8.21 NTU which is by far greater than the maximum allowable limits of turbidity for drinking purpose (5 NTU). The average value of total dissolved solids (TDS) from 200 mg/L to 250 mg/L. These all values lie almost within the WHO maximum allowable

International Journal of Scientific and Research Publications, Volume 7, Issue 4, April 2017 369 ISSN 2250-3153
www.ijsrp.org
drinking water quality ranges and the draft Ethiopian drinking water guidelines 1000 ppm and 1176 ppm respectively. The average TSS value of water ranges 62 mg/L to 68 mg/L. These all values lie almost within the WHO maximum allowable drinking water quality ranges and the draft Ethiopian drinking water guidelines 500 ppm. The average result of total hardness (TH) for the three towns ranges from 428 mg/L CaCO3 to 450 mg/L CaCO3. All values obtained are within the standards of WHO 500 mg/L CaCO3 but the result from Mettu town was greater than Ethiopian drinking water guidelines standard which is 392 mg/L CaCO3. All the average values are categorized under slightly hard water range ((120- 180) mg/L CaCO3). The laboratory result indicates that the average value for alkalinity ranges from 182 mg/L to 205 mg/L. This result is slightly greater than the standards. This may indicate that drinking water from Mettu town contains nutrients contributing alkalinity like OH-, CO32- and HCO3-. From the laboratory result the average value obtained for potassium ranges from 3.457 mg/L to 4.695 mg/L. Comparatively the maximum value was recorded at Mettu town, even though all the recorded values lies within or below WHO, EPA and draft Ethiopian drinking standard guidelines for drinking purpose (30 mg/L). The average concentration value of ammonia ranges from 0.026 mg/L to 0.078 mg/L. All the recorded values are below WHO standards for drinking purpose which is 1.5 mg/L. The average value recorded for sodium ranges from 15.10 mg/L to 18.65 mg/L. All the recorded average values lie within the range of or below WHO standard for drinking purpose which is 200 mg/L. The analyzed laboratory result of Nitrate ranges from 0.048 mg/L to 0.086 mg/L. All the recorded values was by far less than the maximum allowable limit WHO standard (50 mg/L) and Draft Ethiopian Drinking Water Standards for drinking purpose (50 mg/L). The analyzed laboratory average result of phosphate ranges from 0.03 mg/L to 0.04 mg/L. All the recorded average values was by far below the WHO (50 mg/L) and draft Ethiopian drinking standard maximum allowable limit value for drinking purpose. The average chloride concentration value recorded from laboratory analysis ranges from 21.30 mg/L to 24.93 mg/L. The recorded values was by far less than the that of WHO standard value and EPA standard value of water for drinking purpose (250 mg/L). The average value recorded for calcium ranges from 10.841 mg/L to 14.591 mg/L. All the recorded average value was below the WHO’s maximum permissible value of calcium in water for drinking purpose 200 mg/L. The average concentration value of magnesium ranges from 13.19 mg/L to 14.39 mg/L. All the recorded values lies below the WHO maximum allowable for drinking purpose limits which are 150 mg/L. The average concentration value of carbonate ranges from 256 mg/L to 320 mg/L. All these values lie within the WHO and EPA standard value of water for drinking purpose. The average concentration value of bicarbonate ranges from 237 mg/L to 270 mg/L.
Recommendation The increasing value of some physicochemical water quality parameters from the laboratory analysis especially Turbidity, Total alkalinity and among heavy metals like Lead was recorded as maximum value when compared with reference standards (WHO, EPA and draft Ethiopian drinking standard). As it was pointed out in the literature review part, high turbidity level of water indicates water that lacks transparency of ions and other important substances which is important for drinking as well as for plants and animals which live inside water body and also it is not good for irrigation purpose. Similarly, high turbidity level indicates there exists high amount or level of suspended solids in water bodies. Especially, high turbidity value was recorded at Mettu town of source point. Total alkalinity value of the town was recorded greater than the standard values. Maximum level of alkalinity may indicate that drinking water or any other water contains nutrients contributing alkalinity like OH-, CO32- and HCO3-, but from the laboratory result, the pH value recorded was below 7.0 which is not basic; this may indicate nutrients contributing alkalinity for this town may be due to CO32- and HCO3-. Among heavy metals Lead was recorded above the maximum limit at all sites. This increment may be due to improper use or long term use of the pipe for transporting/distributing of water. Generally, the increment of all parameters may be controlled by treatment process; especially water treatment plant of Mettu town still has a problem. The concerned body should take immediate mechanism in order to control increment of contaminants getting into water bodies and also revise their water treatment process. The final recommendation to the town (Mettu) will be, please take into consideration this research value and check your water treatment process or mechanism.
REFERENCES [1] Ahmad et al., (2010).Heavy metals in water, sediment and some fishes of
Buriganga River, Bangladesh.Int. J. Environ. Res. 4(2):321-332. [2] AWWA, (2002), American Water Works Association Standard Methods for
the Determination of Water and wastewater. [3] Bartram, J., and Balance, R. (1996). Water quality monitoring- A practical
guide to the Design and implementation of fresh water quality studies and monitoring programmes.
[4] Corso, P.S., Kramer, M.H., Blair, K.A., Addiss, D.G., Davis, J.P., Haddix, A.C. (2003). Cost of Illness in the 1993.Waterborne Cryptosporidium Outbreak, Milwaukee, Wisconsin. Emerg. Inf. Dis. 9: 426–431.
[5] Erich P., (2010) Analytical measurement terminology handbook of terms used in quality assurance of analytical measurement’, University of Birmingham, pp 55-57.
[6] Goel, P.K. (2006). Water pollution.Causes, Effects and Control. 2nd Ed. Y.C. College of Science, Vidyanaga, Maharashtra, pp. 354.
[7] Hirsch, R.M., Hamilton, P.A. and Miller, T.L. (2006).US Geological Survey perspective on water-quality monitoring and assessment.J.Env. Monitoring.8: 512-518.
[8] Mengesha, A., Mamo, W., and Beyene, G. (2004).A survey of bacteriological quality of drinking water in North Gondar.Ethiop. J. Health Dev.18 (2):113-135.
[9] MOH. (2007). Need Assessment to achieve Universal Access to Improved Sanitation and Hygiene, Unpublished Document, Addis Ababa, Ethiopia.
[10] Shan, Lv., Li-Guang, T., Qin, L., Men-Bao, Q., Qing, F., Peter, S., Jia-Xu, C., Guo-Jing, Y., Kun, Y., and Xiao-Nong, Z. (2013). Water-Related Parasitic Diseases in China.Int. J. Environ. Res. Public Health.10: 1977-2016.

International Journal of Scientific and Research Publications, Volume 7, Issue 4, April 2017 370 ISSN 2250-3153
www.ijsrp.org
[11] UNICEF and WHO. (2008). Joint Monitoring Programme for Water Supply and Sanitation; Meeting the MDG Drinking Water and Sanitation Target, A Mid-Term Assessment of Progress. New York.
[12] WHO. (1992). Our Planet, our Health: Report of the WHO Commission on Health and Environment, Geneva, Switzerland.
AUTHORS First Author – Bizualem Wakuma (MSc. in Applied Chemistry)[email protected]
Second Author – Tolesa Fita (MSc. in Inorganic Chemistry) - [email protected] Correspondence Author – Bizualem Wakuma ([email protected] ) Mettu University, P. O. Box: 318

International Journal of Scientific and Research Publications, Volume 7, Issue 4, April 2017 371 ISSN 2250-3153
www.ijsrp.org
Increasing the Quality and Yield Attributes of Late Sown Forage Sorghum through Seed Priming of Different
Growth Substances Muhammad ZeeshanMazher*, Asif Iqbal*, Wajid Saeed*, Naveed Arsalan*, Muhammad Usman
Asghar*,Qaiser*, Babar Usman*, Nadia Manzoor**
*Department of Agronomy, University of Agriculture, Faisalabad, Pakistan **Agriculture officer pesticide quality control laboratory, Bahawalpur, Punjab, Pakistan
Abstract- A field trial was conducted at Agronomic Research Area, University of Agriculture Faisalabad during August 2015, to evaluate the effect of priming and foliar applications of different growth promoting substances on sorghum. The experiment was laid out in randomized complete block design (RCBD) with three replications. Net plot size was 3 m × 1.8 m. The research trial was comprised of eight treatments i.e. control (no seed treatment), hydropriming, priming with CaCl2, hardening with CaCl2, priming with moringa leaves extract, priming + foliar application of CaCl2, priming + foliar application of moringa leaves extract and hardening+ foliar application of CaCl2. All the priming treatments significantly affected E50, MET, plant height, stem diameter, fresh weight of plant, dry weight of plant, number of leaves, leaf area, fresh weight of leaves, protein contents, fiber contents, total ash percentage fresh forage yield and dry matter yield of the sorghum crop. It may be concluded that seed priming along with foliar applications of growth promoting substances may serve as an appropriate treatment for accelerating the emergence as well as final yield of the crop and priming, along with foliar applications of MLE is the best choice in this regard.
Index Terms- seed priming, sorghum, yield and quality, hydro priming, moringa extract, CaCl2
I. INTRODUCTION ooder crops in Pakistan are grown on an area of 2236 thousand hectares, with production of 49237 thousand tons of green fodder (Government of Pakistan, 2015). Existing forage production in Pakistan is far less than requirement. Fodders supply 2-3 times
cheaper feed than other concentrates (Shehzadet al., 2012).
In Pakistan, there are two fodder scarcity periods i.e. May-June and October-November. There are many factors that limits the production of livestock in Pakistan, among which fodder scarcity periods and allotting more area to cash crops are important. Due to this reason the animals are generally underfed which affect the production of livestock. Due to the shortage of fodder crops, dairy farmers depends on wheat straw and other concentrates which are used as larger rates to feed animals, moreover wheat straw does not contain sufficient amount of nutrients to fulfill the nutritional demand of animals.
Sorghum (Sorghum bicolor L.), locally known as jowar or charry, belongs to family Poaceae, is a multi-purpose cereal crop used for forage as well as for grain purpose. Sorghum is a dual-purpose, short- day annual crop of kharif season mostly grown as a fodder crop in Pakistan. Its fodder is quite succulent, palatable and highly relished by milch animals.
Sorghum is grown on an area of 171,000 hectares with annual production of 103,000 tons (Govt. of Pakistan, 2015). As it is mentioned earlier that sorghum is a drought resistant crop so, it enjoys reasonable importance in rain-fed areas of Pakistan and covers almost 50 % of the requirement of rain-fed areas with providing feed to livestock even in winter fodder scarcity periods. Many factors can reduce the forage yield and quality of sorghum such as improper sowing time (Sattaret al., 2010), poor seed health (Farooq et al., 2006), imbalanced use of fertilizer, improper irrigation (Kibeet al., 2006), planting of low yielding varieties and weeds infestation (Abouziena et al., 2008). In addition to this, the poor crop stand which is caused by temperature and water stress in rainfed areas affect the sorghum crop (Sharma-Natuet al., 2006). All these factors lead to fodder scarcity issue in Pakistan.
Early onset of monsoon especially in arid areas of the country due to which sowing of crop at optimum time is difficult, reduces the yield as well as the quality of sorghum crop. So there is a need of technique that might enhance germination rate, repair
F

International Journal of Scientific and Research Publications, Volume 7, Issue 4, April 2017 372 ISSN 2250-3153
www.ijsrp.org
damaged seeds and give good crop establishment, so that the goal of obtaining the maximum yield with late sowing of crop could be achieved. Presently exogenous application of growth promoting substances is a new, easy and short gun approach to increase germination rate, growth and yield (Afzal et al., 2008; Bakhtet al., 2011). As sorghum produces allelo chemicals internally, so it respond better to exogenous applied plant hormones also (Davies, 1987).
Seed priming is the technology that enhances early emergence and stand establishment and enable the crop to capture more soil moisture, nutrients and solar radiation. Rapid and uniform crop emergence is an essential pre-requisite to obtain the yield potential and quality in annual crops, which ultimately increase the profit (Parera and Cantliffe, 1994). Priming repairs damaged seeds (Butler et al., 2009) or the seeds which are exposed to abiotic stresses such as salinity (Ehsanfaret al., 2006), and improves the germination performance.
Different priming techniques are used to enhance the germination and seedling growth under controlled conditions, among which osmopriming, hydropriming, halopriming and hormone priming are important (Ghiyasiet al., 2008).
Moringaoleiferabelonging to family Morangaceae is exceedingly valuable tree and proved as a good source of antioxidant agents (Khalafallaet al., 2010). The extract of moringa leaves is a good growth promoter of different crops (Afzal et al., 2012; Ashfaqet al., 2012). The foliar application of moringa leaf extract is important to increase the seasonal leaf area duration (SLAD), photosynthesis, chlorophyll contents and time to stay green there by delaying leaf senescence (Yasmeen et al., 2013).
Keeping all in view the present study was planned to evaluate different priming and foliar application techniques on the productivity and quality of late sown forage sorghum.
II. MATERIALS AND METHODS To assess the quality and yield of forage sorghum through seed priming and foliar applications of different growth promoting
substances an experiment was carried out at Agronomic Research Area, University of Agriculture Faisalabad, The experiment was laid out in randomized complete block design (RCBD) with three replications. Net plot size was 3 m × 1.8 m. Sorghum variety ‘Hegari’ was used for this experiment. Crop was sown during last week of August, 2015 using seed rate of 80 kg ha-1. Crop was sown in 30 cm apart rows. Recommended dose of nitrogen and phosphorous @ 150 kg ha-1 and 60 kg ha-1,respectively was applied to all the experimental plots uniformly. Half dose of nitrogen and all phosphorous was applied with 1st irrigation while remaining half dose of nitrogen was applied 30 days after sowing. Irrigations was applied according to the need of the crop. The treatments used were: control (no seed treatment), hydropriming, priming with CaCl2, hardening with CaCl2, priming with moringa leaves extract, priming + foliar application of CaCl2, priming + foliar application of moringa leaves extract and hardening+ foliar application of CaCl2. After each treatment seeds were dried at their original moisture. Daily observation for emerging seedling continued for 9 days after sowing. The seedlings were evaluated as described in Seedling Evaluation Handbook (AOSA. 1991). Time taken for 50 % emergence of seedlings (E50) was calculated by using the formula of Coolbearet al. (1984).
𝐸𝐸50 = 𝑡𝑡𝑡𝑡 + (𝑁𝑁
2− 𝑛𝑛𝑡𝑡)(𝑡𝑡𝑡𝑡 − 𝑡𝑡𝑡𝑡)𝑛𝑛𝑡𝑡 − 𝑛𝑛𝑡𝑡
Where N is the final number of seeds emerged, niand njare the cumulative number of seeds germinated by adjacent counts at time tiand tj.
Mean emergence time (MET) was calculated by using the equation of Ellis and Roberts (1981).
𝑀𝑀𝐸𝐸𝑀𝑀 = Σ 𝐷𝐷𝑛𝑛Σ 𝑛𝑛
Where n is the number of seeds emerged and D is number of days.Plant density at harvest, plant height, stem diameter, number of leaves per plant, fresh weight of leaves per plant, leaf area per plant, fresh weight per plant and dry weight per plant were recorded of 5 randomly selected plants per replicate and averaged. Fresh forage yield was calculated by selecting the whole plot of each replication then cut and weighted (kg) separately with the help of spring balance, then converted into tons per hectare. Dry matter yield was determined by known weights of chopped green forage from each plot was taken and dried at 105 0C for 24 hours. Dry

International Journal of Scientific and Research Publications, Volume 7, Issue 4, April 2017 373 ISSN 2250-3153
www.ijsrp.org
matter percentage was calculated and this dry matter percentage was further used for determining dry matter yield per plot, which was then converted into tons per hectare.
Crude fiber was calculated by using following procedure:
2 g of oven dried sample was taken, digested it into 200 ml of 1.25 % H2SO4 in 500 ml beaker, heated for 30 minutes. Then the contents were filtered through a thick linen cloth, then the residues were washed and digested again with 200 ml of 1.25 % NAOH for 30 minutes. Then the residues were put in a pre-weighted china dish and dried in hot air for 24 hours at 105 0C. After recording the dry weight, samples were placed in muffle furnace at 600 0C till grey or white ash was obtained. The weight of ash was recorded. Crude fiber was calculated by using following formula:
Crude fiber % age =Weight of dry residue− weight of ash
𝑊𝑊𝑊𝑊𝑡𝑡𝑊𝑊ℎ𝑡𝑡𝑡𝑡𝑡𝑡𝑡𝑡𝑡𝑡𝑡𝑡𝑡𝑡𝑡𝑡𝑡𝑡𝑡𝑡𝑊𝑊 × 100
Crude protein was calculated by using following procedure: 2 g of oven dried grinded plant material was taken. 30 ml of concentrated H2SO4 and 5 g digestion mixture (K2SO4: CuSO4: FeSO4 = 100: 10: 5 g) were added to it and then digested it on gas heater in Kjeldhal digestion flask until the light green color was appeared, cooled it and made up the volume up to 100 ml. I put 10 ml of that diluted solution in micro Kjeldhal distillation apparatus and add concentrated solution of NaOH. I put a receiving flask containing 10 ml of N/10 standard solution or 2 % boric acid solution and mixed indicator (Bromocresol green and methyl red) in such a way that the delivery after coming through condenser dipped into it. I opened the steam generator plug and let the content of the distillation tube be boiled until whole ammonia was liberated. It was titrated against standard N/10 H2SO4. Reading was obtained after titration against H2SO4 then multiplied by 6.25 for crude protein determination.
Total ash percentage was calculated by: 5 g of oven dried sample was taken in a pre-weighted china dish. The samples were placed in a muffle furnace at dull red heat (600-650 0C) till white or grey ash was obtained. Cooled the residue in desiccators and recorded the weight.
Ash percentage = Weight of ash
Weight of sample× 100
Statistical Analysis: Data collected on different parameters was statistically analyzed using Fisher’s analysis of variance technique and the treatments’ means were compared by using Honestly Significant Difference (HSD) test at 0.05 probability level (Steel et al., 1997).
III. RESULTS AND DISCUSSION Priming and foliar applications of different growth promoting substances significantly affected the stand establishment, growth parameters and final yield of sorghum. Higher emergence rate, time taken to 50 % emergence and mean emergence time was observed in priming + foliar application of moringa leaves extract (MLE), while all other priming and foliar applications of growth promoting substances significantly affected the stand establishment parameters. In case of growth and yield parameters, priming + foliar application of moringa leaves extract (MLE) performed better compared to all other treatments as shown in table 1 and 2. In case of quality parameters priming + foliar application of moringa leaves extract perfomed best as compared to all other treatments (Table 3).
Treatments Means
E50 MET PP Height SD NL
No Seed Treatment 5.47a 5.83a 27.67d 205.8e 0.993b 7.67d
Hydropriming 5.05ab 5.16b 31.33d 222.3d 1.126ab 8.00d

International Journal of Scientific and Research Publications, Volume 7, Issue 4, April 2017 374 ISSN 2250-3153
www.ijsrp.org
Table: 1. Effect of seed priming and foliar applications of different growth promoting substances on emergence and growth parameters of sorghum under field conditions.
*Means sharing the same letter do not differ significantly at P= 0.05. E50, time to 50% emergence; MET, mean emergence time; PP, plant density at harvest; SD, stem diameter; NL, number of leaves
Table: 2. Effect of seed priming and foliar applications of different growth promoting substances on growth parameters of sorghum under field conditions.
Treatments Means
FWL LA FW DW FFY DMY
No Seed Treatment 35.67e 312.3d 209.6e 62.0e 40.67e 6.19f
Hydropriming 41.33d 320.6cd 221.3e 64.5e 41.00e 6.87e
Priming with CaCl2 46.67c 339.6c 249.3d 76.5d 46.33d 8.15d
Hardening with CaCl2 46.33c 335.0cd 253.3d 77.3cd 46.00d 7.96d
Priming with MLE 47.00c 343.6bc 294.3b 85.1b 46.67d 8.38d
Priming + Foliar application of CaCl2 51.67a 365.0ab 269.3c 80.1c 51.00b 11.77b
Priming + Foliar application of MLE 52.33a 381.0a 322.0a 90.6a 53.00a 13.59a
Hardening + Foliar application of CaCl2 49.33b 339.0c 313.3a 89.2a 49.67c 9.57c
HSD at 0.05 1.6478 23.271 12.413 3.0261 1.1757 0.6327
*Means sharing the same letter do not differ significantly at P= 0.05. FWL, fresh weight of leaves; LA, leaf area per plant; FW, fresh weight per plant; DW, dry weight per plant; FFY, fresh forage yield; DMY, dry matter yield
Priming with CaCl2 4.00bcd 4.00c 41.00c 238.6bc 1.283ab 9.33cd
Hardening with CaCl2 4.61abc 4.01c 41.67c 235.8c 1.323a 9.33cd
Priming with MLE 3.37cd 3.01d 50.00b 239.7bc 1.333a 9.67cd
Priming + Foliar application of CaCl2
3.26cd 3.75c 52.00b 247.3b 1.370a 12.00ab
Priming + Foliar application of MLE
2.95d 3.00d 59.33a 259.5a 1.376a 13 .67a
Hardening + Foliar application of CaCl2
4.36abc 3.80c 50.67b 243.5bc 1.360a 10.33bc
HSD at 0.05 1.1472 0.3406 6.2649 9.5741 0.3159 2.2108
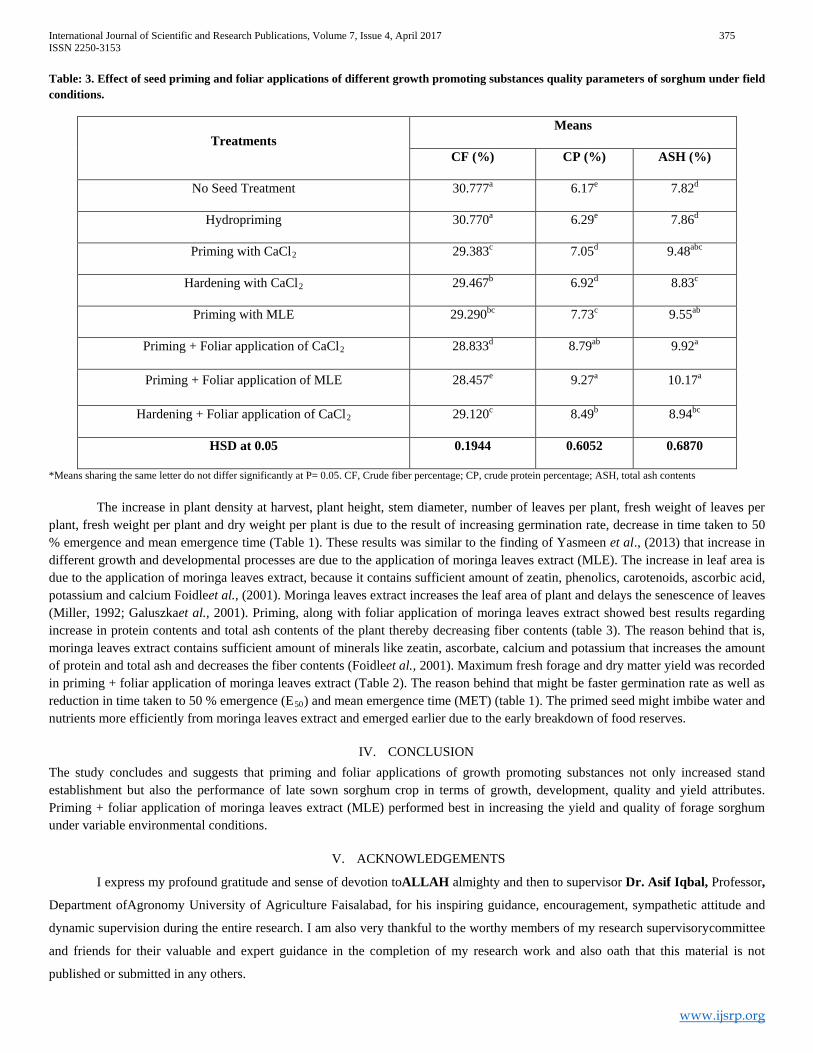
International Journal of Scientific and Research Publications, Volume 7, Issue 4, April 2017 375 ISSN 2250-3153
www.ijsrp.org
Table: 3. Effect of seed priming and foliar applications of different growth promoting substances quality parameters of sorghum under field conditions.
Treatments Means
CF (%) CP (%) ASH (%)
No Seed Treatment 30.777a 6.17e 7.82d
Hydropriming 30.770a 6.29e 7.86d
Priming with CaCl2 29.383c 7.05d 9.48abc
Hardening with CaCl2 29.467b 6.92d 8.83c
Priming with MLE 29.290bc 7.73c 9.55ab
Priming + Foliar application of CaCl2 28.833d 8.79ab 9.92a
Priming + Foliar application of MLE 28.457e 9.27a 10.17a
Hardening + Foliar application of CaCl2 29.120c 8.49b 8.94bc
HSD at 0.05 0.1944 0.6052 0.6870
*Means sharing the same letter do not differ significantly at P= 0.05. CF, Crude fiber percentage; CP, crude protein percentage; ASH, total ash contents
The increase in plant density at harvest, plant height, stem diameter, number of leaves per plant, fresh weight of leaves per plant, fresh weight per plant and dry weight per plant is due to the result of increasing germination rate, decrease in time taken to 50 % emergence and mean emergence time (Table 1). These results was similar to the finding of Yasmeen et al., (2013) that increase in different growth and developmental processes are due to the application of moringa leaves extract (MLE). The increase in leaf area is due to the application of moringa leaves extract, because it contains sufficient amount of zeatin, phenolics, carotenoids, ascorbic acid, potassium and calcium Foidleet al., (2001). Moringa leaves extract increases the leaf area of plant and delays the senescence of leaves (Miller, 1992; Galuszkaet al., 2001). Priming, along with foliar application of moringa leaves extract showed best results regarding increase in protein contents and total ash contents of the plant thereby decreasing fiber contents (table 3). The reason behind that is, moringa leaves extract contains sufficient amount of minerals like zeatin, ascorbate, calcium and potassium that increases the amount of protein and total ash and decreases the fiber contents (Foidleet al., 2001). Maximum fresh forage and dry matter yield was recorded in priming + foliar application of moringa leaves extract (Table 2). The reason behind that might be faster germination rate as well as reduction in time taken to 50 % emergence (E50) and mean emergence time (MET) (table 1). The primed seed might imbibe water and nutrients more efficiently from moringa leaves extract and emerged earlier due to the early breakdown of food reserves.
IV. CONCLUSION The study concludes and suggests that priming and foliar applications of growth promoting substances not only increased stand establishment but also the performance of late sown sorghum crop in terms of growth, development, quality and yield attributes. Priming + foliar application of moringa leaves extract (MLE) performed best in increasing the yield and quality of forage sorghum under variable environmental conditions.
V. ACKNOWLEDGEMENTS
I express my profound gratitude and sense of devotion toALLAH almighty and then to supervisor Dr. Asif Iqbal, Professor,
Department ofAgronomy University of Agriculture Faisalabad, for his inspiring guidance, encouragement, sympathetic attitude and
dynamic supervision during the entire research. I am also very thankful to the worthy members of my research supervisorycommittee
and friends for their valuable and expert guidance in the completion of my research work and also oath that this material is not
published or submitted in any others.

International Journal of Scientific and Research Publications, Volume 7, Issue 4, April 2017 376 ISSN 2250-3153
www.ijsrp.org
I offer my gratitude especially to my father, mother, brothers and sisters, whose prayers and inspirations are the torch to
my destination.
(Muhammad ZeeshanMazhar)
REFERENCES
[1] Abouziena, H. F., A. A. Sharafaida and E. R. El-desoki. 2008. Efficiency of cultivar selectivity and weed control treatments on wheat yield and associated weeds in sandy soils. World J. Agric. Sci., 4: 384-389.
[2] Afzal, I., B. Hussain, S. M. A. Basra and H. Rehman. 2012. Priming with moringa leaf extract reduces imbibitional chilling injury in spring maize. Seed Sci. Technol., 6: 271-276.
[3] Afzal, I., S.M.A. Basra, M. Shahid and M. Saleem. 2008. Physiological enhancements of spring maize (Zea mays L.) under cool conditions. Seed Sci. Technol., 36: 497-503.
[4] Ashfaq, M., S. M. A. Basra and U. Ashfaq. 2012. Moringa: A Miracle Plant of Agro-forestry. J. Agric. Soc. Sci., 8: 115-122. [5] Association of Official Seed Analysis (AOSA).(1991). Rules for testing seeds.Seed Science and Technology. 12:18-19. [6] Bakht, J., M. Shafi, Y. Jamal and H. Sher. 2011. Response of maize (Zea mays L.) to seed priming with NaCl and salinity stress. Spanish J. Agric. Res., 9: 252-
261. [7] Butler, L. H., F. R. Hay, R. H. Ellis, R. D. Smith and T. B. Murray. 2009. Priming and re-drying improve the survival of mature seeds of Digitalis purpurea during
storage, Ann. Bot.103: 1261-1270. [8] Coolbear, P., A. Francis and D. Grierson. 1984. The effect of low temperature pre-sowing treatment under the germination performance and membrane integrity
of artificially aged tomato seeds. J. Exper. Botany. 35: 1609-1617. [9] Davies, J.P. 1987. Plant hormones and their role in plant growth and development. Martinus Nijhoff Publishers, Drodrecht, The Netharlands. [10] Ehsanfar, S., S. A. M. Sanavy and R. T. Afshari. 2006. Effects of osmo-priming on seed germination of canola (Brassica napus L.) under salinity stress, Commun.
Agric. Appl. Biol. Sci. 71: 155-159. [11] Farooq, M., S. M. A. Basra, and A. Wahid. 2006. Priming of field-sown rice seed enhances germination, seedling establishment, allometry and yield. Plant
Growth Regul. 49: 285-294. [12] Farooq, M., S. M. A. Basra, I. Afzal and A. Khaliq. 2006. Optimization of hydropriming techniques for rice seed invigoration. Seed Sci. Technol., 34: 507-512. [13] Foidle, N., H. P. S. Makkar and K. Becker. 2001. The potential of Moringaoleifera for agricultural and industrial uses. In: What development potential for
Moringa products? October 20th - November 2nd 2001. Dar-es- Salaam. [14] Galuszka, P., I. Frebort, M. Sabela, P. Sauer and S. Jacobsen. 2001. Cytokinin oxidase or dehydrogenase mechanism of cytokinin degradation in cereals.
European J. Biochem., 268: 450-461. [15] Ghiyasi, M., M. P. Miyandoab and M. Tajbakhsh. 2008. Influence of osmopriming treatment on emerengency and yield of maize (Zea mays L.). Res. J. of Biol.
Sci. 3(12): 1452-1455. [16] Government of Pakistan. 2015. Agricultural Statistics of Pakistan, 2014-15. Statistics Division, Pakistan Bureau of Statistics, Islamabad, Pakistan. [17] Govt. of Pakistan. 2015. Economic Survey of Pakistan. 2014-2015. Economics Advisor's wing, Finance Division, Islam. Pakistan. pp. 29. [18] Khalafalla, M.M., E. Abdellatef, H.M. Dafalla, A.A. Nassrallah, K.M. Aboul-Enein and D.A. Lightfoot. 2010. Active principle form MoringaoleiferaL. Lam
leaves effective against two leukemias and a hepatocacinoma. African J. Biotechnol., 9: 94-97. [19] Kibe, A. M., S. Singh and N. Kalrac. 2006. Water-nitrogen relationships for wheat growth and productivity in late sown conditions. Agric. Water Manag., 84:
221-228. [20] Miller, C.O. 1992. Cytokinin control of some oxidative processes. In: Kaminek, M., D.W.S. Mok and E. Zazimalova (eds.). Physiology and Biochemistry of
Cytokinins in Plants, pp: 289-293. Academic Publishing, The Hague. [21] Parera, C.A. and D.J. Cantliffe. 1994. Pre-sowing seed priming. Hortic. Rev., 13: 109-141. [22] Sattar, A., M. A. Cheema, M. Farooq, M. A. Wahid, A. Wahid and B. H. Babar. 2010. Evaluating the performance of wheat cultivars under late sown conditions.
Int. J. Agric. Biol., 12: 561-565. [23] Sharma-Natu, P., K.V. Sumesh, V.D. Lohot, and M.C. Ghildiyal. 2006. High temperature effect on grain growth in wheat cultivars: An evaluation of responses.
Indian J. Pl. physiol., 11: 239-245. [24] Shehzad, M., M. Ayub, A.U.H. Ahmad, M. Yaseen. 2012. Influence of priming techniques on emergence and seedling growth of forage sorghum (Sorghum
bicolor L.) J. Anim. plant sci., 22: 154-158. [25] Steel, R. G. D., J. H. Torrie and D. Dickey. 1997. Principles and Procedure of Statistics. A Biometrical Approach 3rd Ed. McGraw Hill Book Co. Inc., New York.
p. 352-358. [26] Yasmeen, A., S. M. A. Basra, A. Wahid, W. Nouman and H. U. Rehman. 2013. Exploring the potential of Moringaoleiferaleaf extract (MLE) as a seed priming
agent in improving wheat performance. Turk. J. Bot., 37: 512-520.
AUTHORS
First Author – Muhammad zeeshanmazhar, M.Sc. (Hons.) Agronomy, Department of agronomy, University of agriculture Faisalabad,[email protected]
Second Author – Agriculture officer pesticide quality control laboratory, Bahawalpur, Punjab, Pakistan. [email protected]

International Journal of Scientific and Research Publications, Volume 7, Issue 4, April 2017 377 ISSN 2250-3153
www.ijsrp.org
Correspondence Author – Muhammad zeeshanmazhar, University of agriculture Faisalabad, Pakistan [email protected] , +923405106030
International Journal of Scientific and Research Publications, Volume 7, Issue 4, April 2017 378 ISSN 2250-3153
www.ijsrp.org
Evaluation of Saline Tolerant Wheat (Triticum aestivum L.) in
F2 Segregating Populations
Adeel Feroz1*
, Zulfiqar Ali1*
, Babar Usman2*
, Mohsin Niaz2*
, Wajid Saeed2**
, Mudassir Abbas2***
, Umair
Khalid2****
, Nadia Manzoor3*****
and Waseem Hassan3*****
* Department of Plant Breeding and Genetics, Faculty of Agriculture, University of Agriculture Faisalabad, Punjab, Pakistan
** Department of Agronomy, Faculty of Agriculture, University of Agriculture Faisalabad, Punjab, Pakistan ***Horticultural Research Institute, National Agricultural Research Centre, Islamabad, Pakistan
**** Department of Plant Breeding and Genetics Faculty of Agriculture, University of Sargodha, Punjab, Pakistan *****Pesticide Quality Control Laboratory, Bahawalpur, Punjab, Pakistan
Abstract- Wheat is the major staple food crop worldwide and
frequently cultivated on saline soil. Salinity is the serious factor
hampering wheat productivity with adverse effect on
germination, growth and final economic yield. This study was
carried out to evaluate six F2 segregating populations at Pindi
Bhattiyan, Pakistan under normal and saline conditions during
2013-14. Individual plants of each population were selected and
evaluated on the basis of plant height, number of tillers, spike
length, spikelets per spike, grain per spike, grains weight per
spike, 100 grain weight and average grain yield per plant under
saline and normal environments using biplot analysis. Biplot
analysis appeared valuable screening tool to identify the slat
tolerant wheat genotypes due to its graphical nature. Based on
biplot plants of each F2 population are classified into four groups.
First group A contained the F2plant with high saline tolerance
suitable for saline environment. Second group B having the F2
plant with good performance under normal condition. 3rd
group C
and 4th
group D having the poor performing F2 plant in both
normal and saline environmental condition.
Index Terms- Biplot analysis, F2 population, Saline tolerance,
Wheat
I. INTRODUCTION
alinity is the major threat to crop yield worldwide (Ali et al.,
2012), and also restrict lands which are uncultivated. More
than 6 % of areas through-out the world is saline affected (FAO,
2010) most importantly in semi-arid and arid areas of the world.
It has been expected that about 12 billion US dollar loss of world
economy (Lauchli and Luttge, 2004), 20 % of irrigated lands
(Dashti et al., 2012), 20 % of agriculture lands and 50 % of
cropped lands in the world suffer due to salinity (Flowers and
Yeo, 1995).Saline soils amelioration is non-economical process,
selection and breeding has received the considerable attention as
it is an effective, efficient and cheaper strategy to improve
salinity tolerance in crops (Ashraf, 2009). Enhancing the saline
tolerance of two staple crops viz. rice, wheat are of major
concern to meet the demand of rapid increasing population than
improving the un-cultivated land (FAO 2010).
Wheat (Triticum aestivum L.) is major staple food crop
worldwide and frequently cultivated on saline soils. Soil salinity
affects the wheat productivity with a loss of about 1.2 Million
tons account for 150 US Dollar M per annum in Pakistan (FAO,
2005). Genetic improvement of wheat for salinity tolerance and
enhancement of production by using existing genetic resources
are the key aims of our breeding program. Screening
methodology for evaluating the available genetic resources,
prevalence of genetic variation for salinity tolerance,
implementation of suitable breeding methodology and
appropriate biometrical techniques is perquisite for improving
the salinity tolerance. The best way for yield improvement and
its stability under saline condition, is to develop saline tolerant
varieties.
Salinity tolerance is the complex quantitative trait. Various
statistical measures like relative salt tolerance (Ali et al., 2007),
absolute salt tolerance (Dewy, 1962) and stress susceptibility
index (Fisher and Maurer, 1978), provide the confusing and
complicated results. Therefore there is need to evaluate the salt
tolerance by the use of simple, ease to interpret the results and
accuracy of the statistical methods is high priority. In this regard
biplot is simple, accurate and easy to understand the results
because of its graphical nature. Biplot analysis also explains the
genotype × environment interactions.
The objective of this study is to exploit variation within wheat
F2segregating populations for salinity tolerance and to identify
new saline tolerant lines
II. MATERIALS AND METHODS
Plant Material and Layout
Three lines and two testers viz, PARC-9, PARC-10, WN-
73, WN-64 and WN-85 respectively were crossed in line × tester
fashion. PARC-9, PARC-10 was collected from NARC,
Islamabad, Pakistan and WN-73, WN-64 and WN-85 from
CIMMYT. F2 plant material is raised through the F1generation
which was developed by line × tester fashion including six F2
generations and their respective parents.
The plant material was sown following two factor factorial
randomized complete block design with three replicates under
normal and saline conditions. One row of each parent, check and
twelve rows of each F2 population were sown per replication.
Each row was one meter long and kept 22 cm apart while plants
were spaced 15 cm apart. Two seeds per hole were sown with the
help of dibbler and later thinned to one healthy seedling per hole
after germination.
S
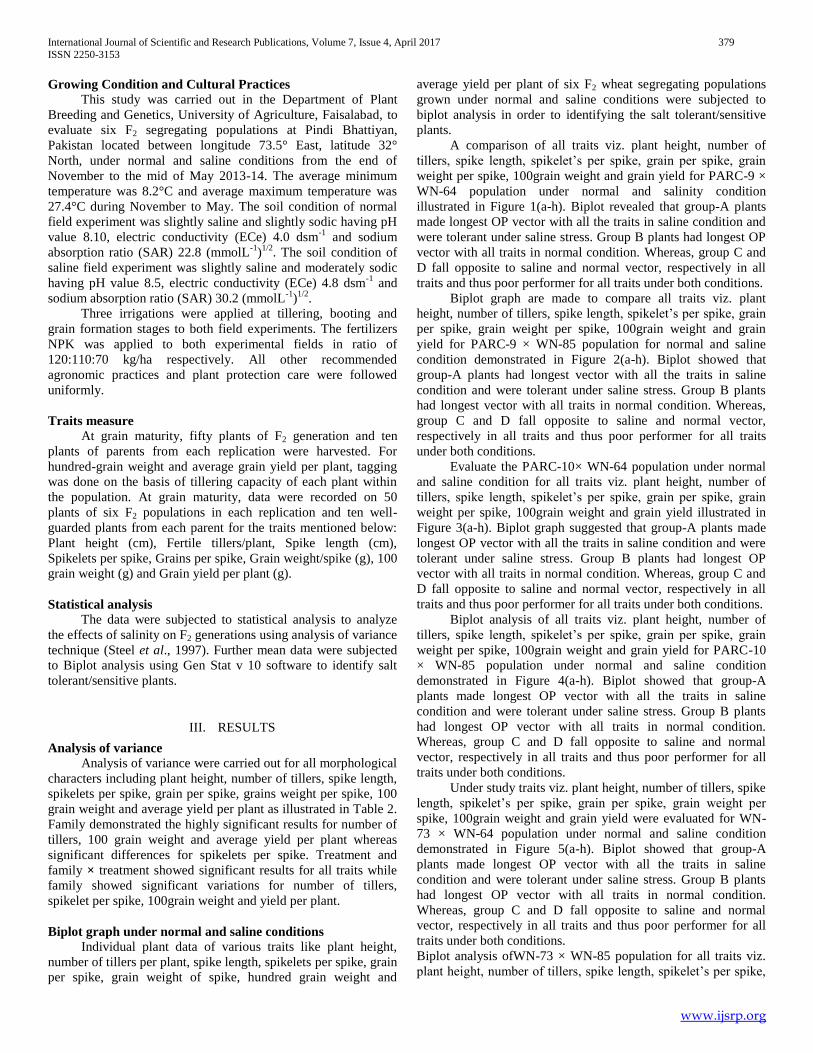
International Journal of Scientific and Research Publications, Volume 7, Issue 4, April 2017 379
ISSN 2250-3153
www.ijsrp.org
Growing Condition and Cultural Practices
This study was carried out in the Department of Plant
Breeding and Genetics, University of Agriculture, Faisalabad, to
evaluate six F2 segregating populations at Pindi Bhattiyan,
Pakistan located between longitude 73.5° East, latitude 32°
North, under normal and saline conditions from the end of
November to the mid of May 2013-14. The average minimum
temperature was 8.2°C and average maximum temperature was
27.4°C during November to May. The soil condition of normal
field experiment was slightly saline and slightly sodic having pH
value 8.10, electric conductivity (ECe) 4.0 dsm-1
and sodium
absorption ratio (SAR) 22.8 (mmolL-1
)1/2
. The soil condition of
saline field experiment was slightly saline and moderately sodic
having pH value 8.5, electric conductivity (ECe) 4.8 dsm-1
and
sodium absorption ratio (SAR) 30.2 (mmolL-1
)1/2
.
Three irrigations were applied at tillering, booting and
grain formation stages to both field experiments. The fertilizers
NPK was applied to both experimental fields in ratio of
120:110:70 kg/ha respectively. All other recommended
agronomic practices and plant protection care were followed
uniformly.
Traits measure
At grain maturity, fifty plants of F2 generation and ten
plants of parents from each replication were harvested. For
hundred-grain weight and average grain yield per plant, tagging
was done on the basis of tillering capacity of each plant within
the population. At grain maturity, data were recorded on 50
plants of six F2 populations in each replication and ten well-
guarded plants from each parent for the traits mentioned below:
Plant height (cm), Fertile tillers/plant, Spike length (cm),
Spikelets per spike, Grains per spike, Grain weight/spike (g), 100
grain weight (g) and Grain yield per plant (g).
Statistical analysis
The data were subjected to statistical analysis to analyze
the effects of salinity on F2 generations using analysis of variance
technique (Steel et al., 1997). Further mean data were subjected
to Biplot analysis using Gen Stat v 10 software to identify salt
tolerant/sensitive plants.
III. RESULTS
Analysis of variance
Analysis of variance were carried out for all morphological
characters including plant height, number of tillers, spike length,
spikelets per spike, grain per spike, grains weight per spike, 100
grain weight and average yield per plant as illustrated in Table 2.
Family demonstrated the highly significant results for number of
tillers, 100 grain weight and average yield per plant whereas
significant differences for spikelets per spike. Treatment and
family × treatment showed significant results for all traits while
family showed significant variations for number of tillers,
spikelet per spike, 100grain weight and yield per plant.
Biplot graph under normal and saline conditions
Individual plant data of various traits like plant height,
number of tillers per plant, spike length, spikelets per spike, grain
per spike, grain weight of spike, hundred grain weight and
average yield per plant of six F2 wheat segregating populations
grown under normal and saline conditions were subjected to
biplot analysis in order to identifying the salt tolerant/sensitive
plants.
A comparison of all traits viz. plant height, number of
tillers, spike length, spikelet’s per spike, grain per spike, grain
weight per spike, 100grain weight and grain yield for PARC-9 ×
WN-64 population under normal and salinity condition
illustrated in Figure 1(a-h). Biplot revealed that group-A plants
made longest OP vector with all the traits in saline condition and
were tolerant under saline stress. Group B plants had longest OP
vector with all traits in normal condition. Whereas, group C and
D fall opposite to saline and normal vector, respectively in all
traits and thus poor performer for all traits under both conditions.
Biplot graph are made to compare all traits viz. plant
height, number of tillers, spike length, spikelet’s per spike, grain
per spike, grain weight per spike, 100grain weight and grain
yield for PARC-9 × WN-85 population for normal and saline
condition demonstrated in Figure 2(a-h). Biplot showed that
group-A plants had longest vector with all the traits in saline
condition and were tolerant under saline stress. Group B plants
had longest vector with all traits in normal condition. Whereas,
group C and D fall opposite to saline and normal vector,
respectively in all traits and thus poor performer for all traits
under both conditions.
Evaluate the PARC-10× WN-64 population under normal
and saline condition for all traits viz. plant height, number of
tillers, spike length, spikelet’s per spike, grain per spike, grain
weight per spike, 100grain weight and grain yield illustrated in
Figure 3(a-h). Biplot graph suggested that group-A plants made
longest OP vector with all the traits in saline condition and were
tolerant under saline stress. Group B plants had longest OP
vector with all traits in normal condition. Whereas, group C and
D fall opposite to saline and normal vector, respectively in all
traits and thus poor performer for all traits under both conditions.
Biplot analysis of all traits viz. plant height, number of
tillers, spike length, spikelet’s per spike, grain per spike, grain
weight per spike, 100grain weight and grain yield for PARC-10
× WN-85 population under normal and saline condition
demonstrated in Figure 4(a-h). Biplot showed that group-A
plants made longest OP vector with all the traits in saline
condition and were tolerant under saline stress. Group B plants
had longest OP vector with all traits in normal condition.
Whereas, group C and D fall opposite to saline and normal
vector, respectively in all traits and thus poor performer for all
traits under both conditions.
Under study traits viz. plant height, number of tillers, spike
length, spikelet’s per spike, grain per spike, grain weight per
spike, 100grain weight and grain yield were evaluated for WN-
73 × WN-64 population under normal and saline condition
demonstrated in Figure 5(a-h). Biplot showed that group-A
plants made longest OP vector with all the traits in saline
condition and were tolerant under saline stress. Group B plants
had longest OP vector with all traits in normal condition.
Whereas, group C and D fall opposite to saline and normal
vector, respectively in all traits and thus poor performer for all
traits under both conditions.
Biplot analysis ofWN-73 × WN-85 population for all traits viz.
plant height, number of tillers, spike length, spikelet’s per spike,

International Journal of Scientific and Research Publications, Volume 7, Issue 4, April 2017 380
ISSN 2250-3153
www.ijsrp.org
grain per spike, grain weight per spike, 100grain weight and
grain yield under normal and saline condition demonstrated in
Figure 6(a-h). Biplot showed that group-A plants made longest
OP vector with all the traits in saline condition and were tolerant
under saline stress. Group B plants had longest OP vector with
all traits in normal condition. Whereas, group C and D fall
opposite to saline and normal vector, respectively in all traits and
thus poor performer for all traits under both conditions.
IV. DISCUSSION
Highly significant differences among six F2families for
traits viz. plant height, number of tillers, spike length, spikelet’s
per spike, grain per spike, grain weight per spike, 100grain
weight and grain yield revealed the prevalence of genetic
variability and possibility of selection under both normal and
saline conditions. Environmental variances were also found to be
highly significant suggested that all traits were influenced under
both normal and saline environmental conditions. The family ×
environment interactions were also found to be highly significant
for all traits. Table 2 suggested the six families were influenced
by both environmental conditions. These results were in
accordance with earlier studies (Ali et al., 2012; Babar et al,
2015 and Nourai Rad et al., 2012), indicated the importance of
G × E interaction. The importance of G × E interaction has been
demonstrated by different breeding programs for major crops.
Plant breeders have great interest to evaluate the genotype ×
environment interaction and select the superior plants with stable
performance under both normal and saline conditions. G × E
interaction also complicates the selection of superior genotypes
over the range of environment (Yaghotipoor and Farshadfar,
2007).
Scientists have been made different attempts to develop the
statistical analysis for the better understanding and explanation of
G × E interaction. Biplot analysis is popular among the plant
breeder for investigating the genotype performance and mega-
environment identification (Yan et al., 2001). Biplot is easy to
understand and interpret the salt tolerance and susceptible
genotype because of graphical demonstration of data. It also
demonstrated the overall average performance of six families
across environments and helped to identify the salt tolerant plants
across the treatment. These advantages of biplot analysis over the
other biometrical analysis, considered as reliable procedure for
evaluating the genotype performance under both environments
(Ali et al., 2012), hence biplot method is recommended for
screening analysis. Results concluded that significant genetic
variation for salt tolerance was observed among six families.
Biplot identified the group A as tolerant group of plants whereas
group C and B plants were identified as most susceptible.

International Journal of Scientific and Research Publications, Volume 7, Issue 4, April 2017
381 ISSN 2250-3153
www.ijsrp.org
[1] Appendix
Table 1: List of wheat plant material including six F2 generations and their parents
Sr. No. Genotype Parentage
1 PARC-9 × Wn-85 (FERT2/KURUKU//FERT2) × (WBLLI*2/BRAMBLING)
2 PARC-9 × Wn-64 (FERT2/KURUKU//FERT2) × (WAXWING*2/KUKUNA)
3 PARC-10 × Wn-85 (RAWAL 87/80 73) × (WBLLI*2/BRAMBLING)
4 PARC-10 × Wn-64 (RAWAL 87/80 73) × (WAXWING*2/KUKUNA)
5 Wn-73 × Wn-85 (WAXWING*2/TUKURU) × (WBLLI*2/BRAMBLING)
6 Wn-73 × Wn-64 (WAXWING*2/TUKURU) ×(WAXWING*2/KUKUNA)
7 Wn-85 WBLLI*2/BRAMBLING
8 Wn-64 WAXWING*2/KUKUNA
9 PARC-9 FERT2/KURUKU//FERT2
10 PARC-10 RAWAL 87/80 73
11 Wn-73 WAXWING*2/TUKURU
Table 2: Analysis of variance analysis results for eight yield and yield related traits of six F2 populations
under normal and saline conditions
S. No. Characters Family Treatment Family × Treatment
1 Plant Height 20.41ns
2379.00**
29.41*
2 Number of Tiller 1.70**
50.67**
1.50**
3 Spike Length 0.998 ns
37.78**
0.980**
4 Spikelet per Spike 6.27* 69.78
** 3.50
**
5 Grain per spike 29.95 ns
2868.67**
105.11**
6 Grain Weight per Spike 0.088 ns
3.074**
0.197**
7 100 Grain Weight 0.152**
0.389**
0.018**
8 Average Yield per Plant 13.63**
204.97**
0.654**
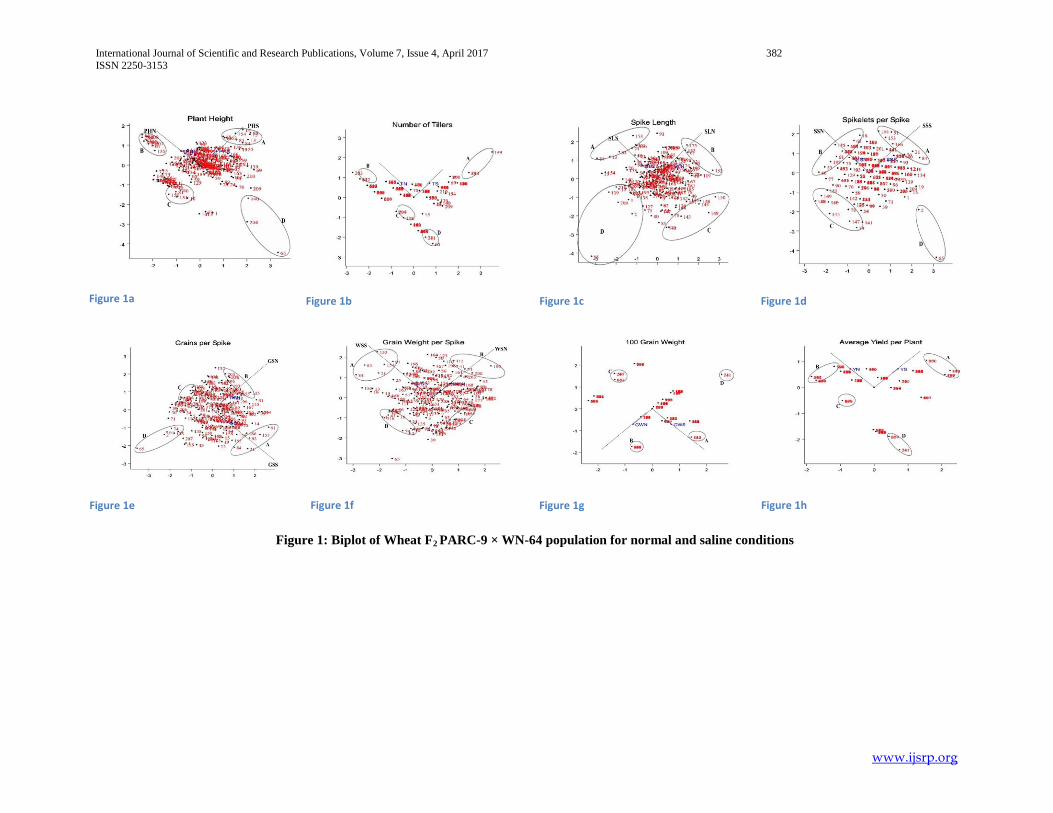
International Journal of Scientific and Research Publications, Volume 7, Issue 4, April 2017 382
ISSN 2250-3153
www.ijsrp.org
Figure 1: Biplot of Wheat F2 PARC-9 × WN-64 population for normal and saline conditions
Figure 1a Figure 1b Figure 1c Figure 1d
Figure 1e Figure 1f Figure 1g Figure 1h

International Journal of Scientific and Research Publications, Volume 7, Issue 4, April 2017 383
ISSN 2250-3153
www.ijsrp.org
Figure 2: Biplot of Wheat F2 PARC-9 × WN-85 population for normal and saline conditions
Figure 2a Figure 2b Figure 2c Figure 2d
Figure 2e Figure 2f Figure 2g Figure 2h
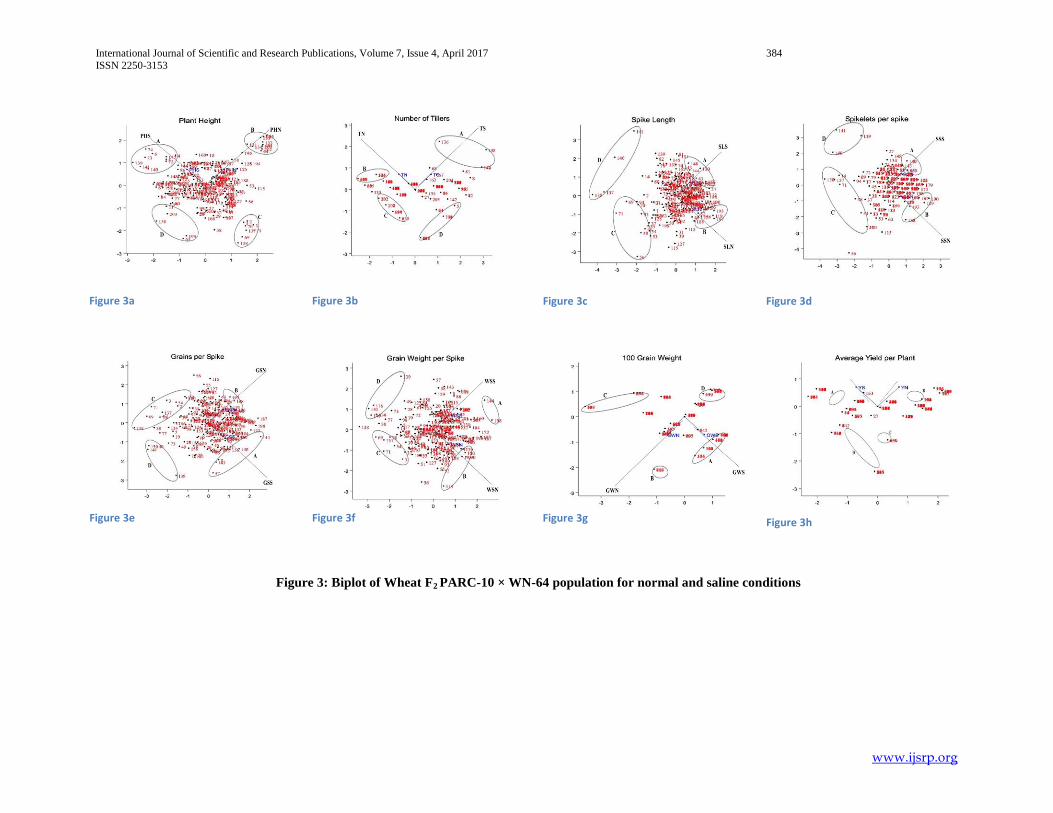
International Journal of Scientific and Research Publications, Volume 7, Issue 4, April 2017 384
ISSN 2250-3153
www.ijsrp.org
Figure 3: Biplot of Wheat F2 PARC-10 × WN-64 population for normal and saline conditions
Figure 3a Figure 3b Figure 3c Figure 3d
Figure 3e Figure 3f Figure 3g Figure 3h
International Journal of Scientific and Research Publications, Volume 7, Issue 4, April 2017 385
ISSN 2250-3153
www.ijsrp.org
Figure 4: Biplot of Wheat F2 PARC-10 × WN-85 population for normal and saline conditions
Figure 4a Figure 4b Figure 4c Figure 4d
Figure 4e Figure 4f Figure 4g Figure 4h
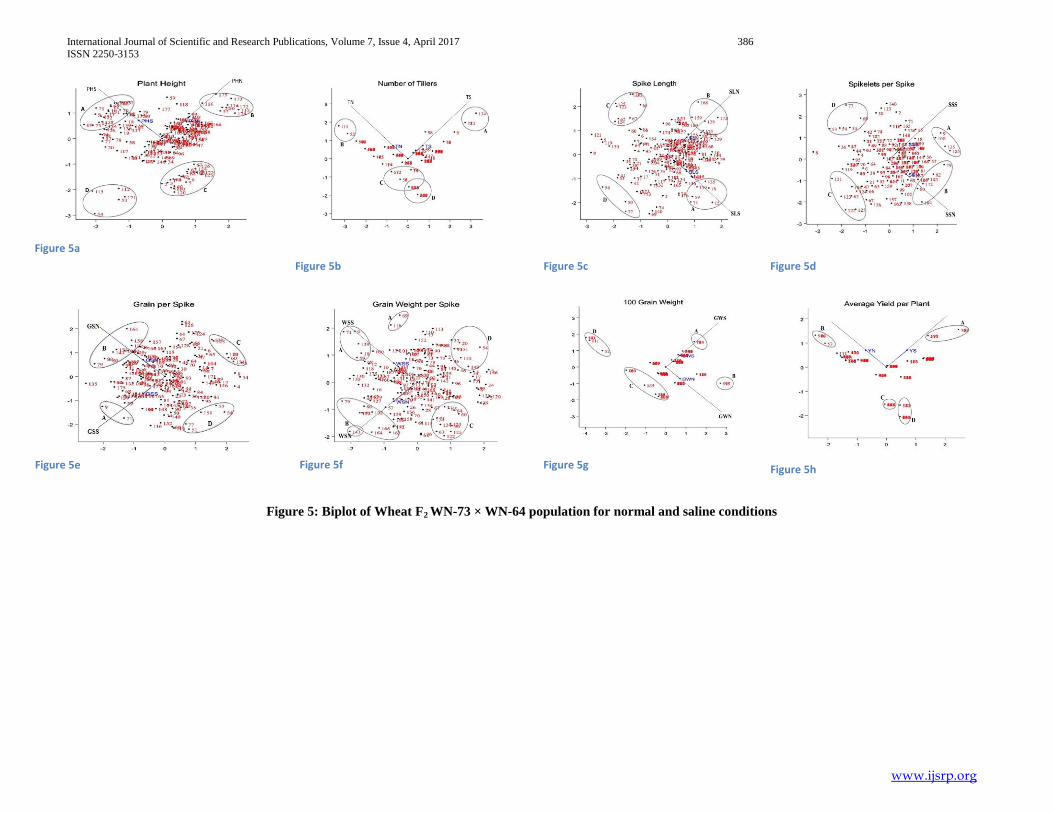
International Journal of Scientific and Research Publications, Volume 7, Issue 4, April 2017 386
ISSN 2250-3153
www.ijsrp.org
Figure 5: Biplot of Wheat F2 WN-73 × WN-64 population for normal and saline conditions
Figure 5a
Figure 5b Figure 5c Figure 5d
Figure 5e Figure 5f Figure 5g Figure 5h
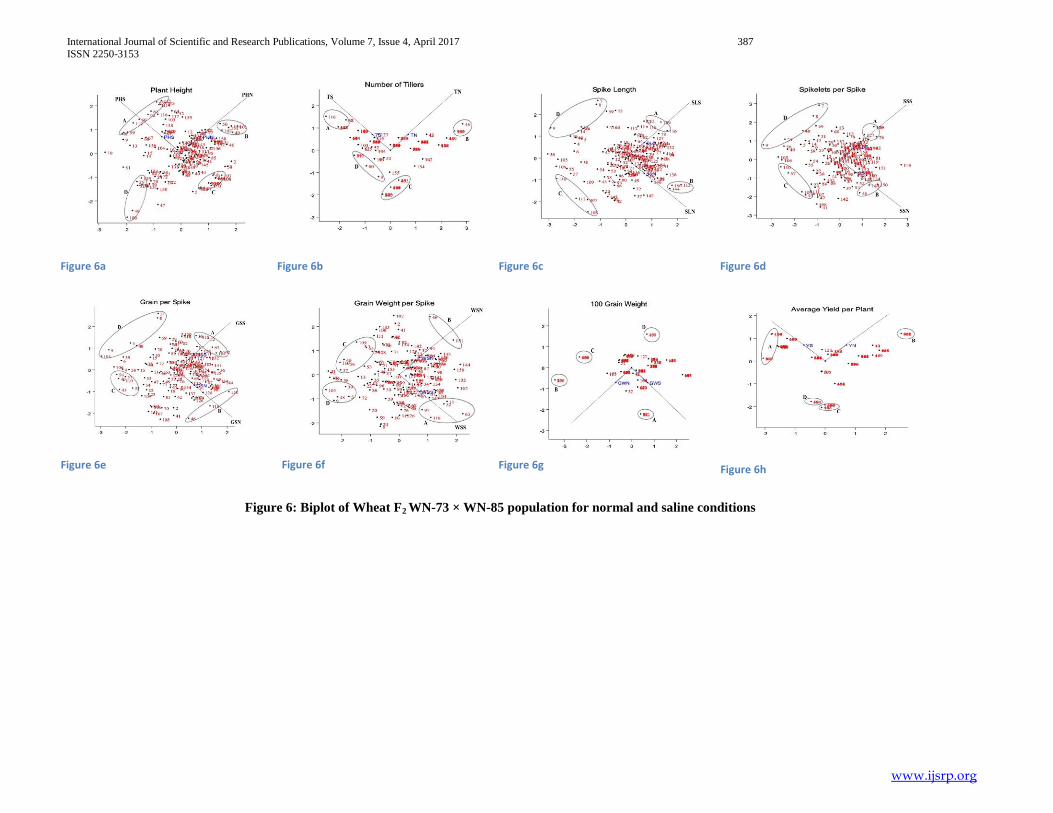
International Journal of Scientific and Research Publications, Volume 7, Issue 4, April 2017 387
ISSN 2250-3153
www.ijsrp.org
Figure 6: Biplot of Wheat F2 WN-73 × WN-85 population for normal and saline conditions
Figure 6a Figure 6b Figure 6c Figure 6d
Figure 6e Figure 6f Figure 6g Figure 6h

International Journal of Scientific and Research Publications, Volume 7, Issue 4, April 2017 388
ISSN 2250-3153
www.ijsrp.org
ACKNOWLEDGMENTS
We thank Dr. Nisar Ahmad and Dr. Muhammad Kashif for
careful reading of the manuscript. We also thank to Dr. Zulifqar
Ali for providing us necessary material and resources to
complete this research. We apologize to colleagues whose work
could not be cited owing to space limitations.
REFERENCES
[1] Ali, Z., A. Salam, F.M. Azhar and I.A. Khan, 2007. Genotypic variation in salinity tolerance among spring and winter wheat (TriticumaestivumL.) accessions. S. Afr. J. Bot., 73: 70-75.
[2] Ali, Z., A. Salam, F.M. Azhar, I.A. Khan, A.A. Khan, S. Bahadur, T. Mahmood, A. Ahmad and R. Trethowan, 2012. The response of genetically distinct bread wheat genotypes to salinity stress. Plant Breed., 131: 707-715.
[3] Ashraf, M. 2009. Biotechnological approach of improving plant salt tolerance using antioxidants as markers. Biotechnol. Adv., 27: 84-93.
[4] Dashti, H., M.R. Bihamta, H. Shirani and M.M. Majidi, 2012. Genetic analysis of salt tolerance in vegetative stage in wheat (Triticumaestivum L). Plant Omics J., 5:19-23.
[5] Dewey, D.R. 1962. Breeding crested wheatgrass for salt tolerance. Crop Sci., 40: 3-407.
[6] FAO., 2005. http://www.fao.org/nr/aboutnr/nrl/en/. [7] FAO., 2010. FAO land and plant nutrition management service.
www.fao.org. (accessed 10 Dec. 2010).
[8] Fischer, R.A. and R. Maurer, 1978. Drought resistance in spring wheat cultivars: I. Grain yield responses. Aust. J. Agric. Res., 29: 897-912.
[9] Flowers, T.J. and A.R. Yeo, 1995. Breeding for salinity resistance in crop plants. Aust. J. Plant Physiol., 22: 875-884.
[10] Hussain, B., A.S. Khan and Z. Ali, 2015. Genetic variation in wheat germplasm for salinity tolerance at seedling stage: improve statistical inference. Turk. J. Agric For., 39: 182-192.
[11] Lauchli, A. and U. Luttge, 2004. Salinity: Environment – Plants – Molecules. Amsterdam, the Netherlands: Springer.
[12] Naroui Rad, M.R., M.A. Kadir, M.Y. Rafii, H.Z.E. Jaafar and M. Danaee, 2013. Gene action for physiological parameters and use of relative water content (RWC) for selection of tolerant and high yield genotypes in F2 population of wheat. Aust. J. Crop Sci., 7: 407-413.
[13] Steel, R.G.D., J.H. Torrie and D.A. Dickey, 1997. Principles and procedures of statistics: A biometrical approach (3rded.). McGraw- Hill, New York.
[14] Yaghotipoor, A. and E. Farshadfar, 2007. Non-parametric estimation and component analysis of phenotypic stability in chickpea (Cicerarietinum L.). Pak. J. Biol. Sci., 10: 2646-2648.
[15] Yan, W., L.A. Hunt, Q. Sheng and Z. Szlavnics, 2000. Cultivar evaluation and mega-environment investigation based on the GGE biplot. Crop Sci., 40: 597-605.
AUTHORS
First Author –Adeel Feroz, M.Sc (Hons.), University of
Agriculture Faisalabad, [email protected].
Second Author – Babar Usman, Ph.D. Scholar, University of
Agriculture Faisalabad, [email protected].
Third Author – Nadia Manzoor, Agriculture Officer, Pesticide
Quality Control Laboratory Bahawalpur, Multan, Pakistan,
Corresponding Author – Dr. Zulfiqar Ali, Associate Professor.,
University of agriculture Faisalabad, [email protected] .

International Journal of Scientific and Research Publications, Volume 7, Issue 4, April 2017 389
ISSN 2250-3153
www.ijsrp.org
Enhancement the Output Power from Solar Cell
Using Lens
Khalid S.Shibib*, Haneen D. Jabbar*, Mohammed S. Hamza*
*Department of laser &Optoelectronics Engineering, University of Technology Baghdad, Iraq
Abstract- In this work, a hemispherical lens was used as a
solar concentrator to concentrate solar light components (direct
normal and diffused direct normal radiation) on the solar cell
to increase the electrical output power from the solarcell.
Optical properties of the hemispherical lens, electrical
parameters of the polycrystalline Si-Solar cell, solar radiation
components (direct normal and diffused direct normal
radiation) with and without a lens, and output power from used
a solar cell with and without lens were measured. Some
conclusions are obtained; the hemispherical lens was used
practically to concentrate sunlight components on solar cell
where the concentration was found to be about 2x solar light
components, the used hemispherical lens was found to increase
the electrical output power from the solar cell about 25 % for
direct normal plus diffused solar light intensitywhich relates to
the action of used hemispherical lens and properties of the
used solar cell.
Index Terms-Hemispherical lens, Solar cell, Output power.
I.INTRODUCTION
As a result of increased need for energy use and
related requirements and limited of available resources, it is
noticed that there is much dependence on the fossil fuels for
the fulfillment of energy needs. This gives a wide range and
field to find new ways of renewable and alternative ways of
energy. Solar energy is one of the most economic and freely
available source of energy today [1].The development of
photovoltaic (PV) concentrator innovation started adequately
in 1976 at national Sandia laboratories. This early work
determined and attempted to solve problems linked to
concentration systems and gave satisfactory responses to a
considerable lot of them. The basic idea of a photovoltaic (PV)
concentrator is to utilize optics such as mirror or lenses to
concentrate sunlight radiation on a small delivering solar cell.
In the present, the standard of concentration photovoltaic
(CPV) is the use of cost-efficient concentrating optics that
severally diminish the cell area, taking into consideration the
utilization of more costly, high-efficiency cells and possibly a
leveled cost of electricity competitive with concentrated solar
oriented power and standard flat-plate photovoltaic (PV)
technology in certain sunny zones with high direct normal
irradiance (DNI) [2].Using optical concentrator to concentrate
solar radiation reduce the area of the used solar cell, increase
the intensity of solar radiation on the solar cell, and may
reduce the cost of concentration system [3].
In this paper a hemispherical lens was used as a solar
concentrator, the solar radiation components (direct normal
and diffused direct normal radiation) were measured
practically with and without lens and the output power from
the poly-crystalline silicon solar cell was measured with and
without lens and the resultwere compared where the aim is to
increase the output power from the solar cell.
II. THEORY
1. Solar Irradiation Equation
The total solar irradiation Itθ of a terrestrial surface of
any orientation and tilt with an incident angle θ is the amount
of the direct normal componentsIDN Cos θplus the diffuse
elementIdθcoming from the sky plus the element of reflected
shortwave radiation Irthat can reach the surface from the earth
or from adjacent surfaces [4]:
Itθ= IDN Cos θ +Idθ+Ir (1)
Where:
Itθ:is the amount of radiation and the diffuse solar radiation on
a surface also called as global radiation on the surface (W/m2)
[5].
IDN: is the direct normal radiation (W/m2).
θ: is the angle between the beam radiation that incident on a
surface and the normal to that surface [5].
Idθ: isthe diffused radiation on a horizontal surface (W/m2).
Ir: is the reflected radiation (W/m2) which is neglected in this
work.
Stephenson [6] displayed that the intensity of the direct
normal irradiation IDNat the surface of the earth on a clear day
can be calculated by [4]:
IDN= A 𝑒−𝐵
cos 𝛽 (2)
Where
β = The solar altitude angle between the horizontal surface and
the line to the sun that is the complement of the zenith angle
[5].
Both A and B are functions of the date and take into account
the seasonal difference of the earth-sun distance and the air’s
water vapor content[4]. This equation can be utilized to
estimate the value of diffuse radiationIdθthat arrives a tilted or
vertical surface [4] that is a sun-oriented radiation got from the
sun after its direction has been altered because of diffusing by
the environment (atmosphere). Diffuse solar light radiation is
alluded to in some meteorological literature as sky radiation or
sunlight based sky radiation [4]:-
Idθ= C IDNFss (3)

International Journal of Scientific and Research Publications, Volume 7, Issue 4, April 2017 390
ISSN 2250-3153
www.ijsrp.org
Where
C:is the ratio of the diffuse radiation on a horizontal surface to
the direct normal irradiation [5].
Fss: is the angle factor between the surface and the sky;
Fss = 1+cos Σ
2 (4)
And cos θ = cos β cos γ sin Σ + sin β cos Σ (5)
Where:-
γ :The Surface azimuth angle that is deviation of the projection
on a horizontal surface of the normal to the surface from the
local meridian, with zero to the south, east negative, and west
positive; −180◦ ≤ γ ≤ 180◦ [5].
Σ:The tilt angle. Without further discussion, the solar angles
and the equation of time that translate time from solar to local
time can be found in ASHRAE standard [4].
2 Ideal Geometrical Optics Concentrator
Different systems have been formulated that work in
the n2Limit for focusing [7]. One system is the optical
hemispherical lens of diameter (NW), where (W) is known as
the width of the attached absorber (solar cell) and (n) is known
as the refractive index of the dome, seefig.1. Solar light enters
to the dome and is refracted to the exit plane. This concentrator
has a variable entrance aperture in that various portions which
are utilized at various incident angles. For any input angle, the
rays that can intercept the dome that would also have crossed
the diameter area of the optical hemisphere face of the lens
will reach exit aperture [7].
Figure 1: Hemispherical lens that used to generate a
concentration ratio of 𝐧𝟐[7].
This system is one of the only few imaging systems that works
close to perfect or ideal concentration limits. Actually, if one
views the solar cell through the dome at any angle, one sees a
2x magnified image. The optical hemisphere lens has
properties of no spherical aberration or coma and is identified
with the aplanatic lens used in microscopy [7]. When light
incident on the spherical face of hemispherical lens with
incident angle θi , light will be refracted with refracted
angle θrand therefractive index of the hemispherical lens can
be found from following equation [8]:
𝑛 =sin θr
sin θi (6)
And the focal length of the hemispherical lens can be found
from the following equation [8]:-
1
f = (n − 1)(
1
R1+
1
R2) (7)
Where:-
F: Focal length of lens (cm).
n: Refractive index of hemispherical lens.
R1, R2: - radiuses (with a sign) of spherical surfaces of a lens
(cm).
III. EXPERIMENTAL WORK
1. Measurement of optical properties of hemispherical lens
The optical properties of used hemispherical lens
(polymer) such as focal length, refractive index, and
reflectivity were measured using a laser. The diameter and
height of lens are 6 cm and 3.5 cm respectively. The focal
length of the hemispherical lens was measured using an
experimental setup that consists of He-Ne laser (power 0.38
mW and wavelength 632 nm) incident on the spherical face of
the hemispherical lens at distance 8 cm and screen at 28 cm
from He-Ne laser. The clear focal length of the hemispherical
lens was found to be 6.2 cm as shown in Fig. 2.Theoretically
using eq. (7) the error in determining focal length was found to
be equal to 4%
Figure 2: Experimental setup using He-Ne laser to measure focal length of hemispherical lens
The refractive index and reflectivity of used hemispherical lens
were measured using experimental setup consists of diode
laser (Wavelength 632 nm) incident on spherical face of used
hemisphericallens that is placed horizontally on axis with
different incident angles 20∘,40∘ and 60∘ laser beam refracted
with different refraction angles, laser traveled from medium of
less density (air) to medium of more density (polymer), so the
refractive index of used hemispherical lens was calculated

International Journal of Scientific and Research Publications, Volume 7, Issue 4, April 2017 391
ISSN 2250-3153
www.ijsrp.org
using Snell's law, and it is found to be equal to 1.49 as shown
in fig. 3a,b,c. Also, the reflectivity of the lens is tested by
subjecting known source power of laser on the lens at different
angles of incident (20∘, 40∘, 60∘) and the reflecting laser power
is tested.The reflectivity is found to be equal to 0.2, as shown
in fig. 3a, b, and c.
(a) (b)(c)
Figure 3 a,b,c: Experimental setup of diode laser (𝐖𝐚𝐯𝐞𝐥𝐞𝐠𝐡𝐭 𝟔𝟑𝟐 𝐧𝐦) at different angle of incident to
measurerefractive index and reflectivity of the hemisphericallens.
2. measurement of output parameters of used solar cell
Electrical output parameters of solar cell such as short
circuit current (Isc), open circuit voltage (Voc), output power
(Pout), maximum output power (Pm) were measured.
Experimental setup that consists of solar cell (poly-crystalline
silicon solar cell) placed horizontally and illuminated vertically
with light source at different intensities from zero to 2000
W/m2 which is measured using solar power meter (TES
1333R, Taiwan, ranging from 0-2000 W/m2) that placed
horizontally under light source is as shown in fig. 4. The solar
cell was connected in series with anammeter (UNI-T, UT61A)
and a variable resistor (0-100KΩ) and parallel with a voltmeter
(ASWAR, DT830D).The short circuit current (mA) and open
circuit voltage (V) were measured for each variation in
variable resistance and intensities, where the current-voltage
characteristic of the used solar cell was obtained. The variable
resistance was set to its maximum value, where the output
voltage of the solar cell is equal to open circuit voltage and
output current is equal to zero. Variable resistance is decreased
until it reaches its minimum value (no-load), at this value the
output current of the solar cell is equal to short-circuitcurrent,
and the output voltage is equal to zero. The output power
(mW) of used solar cell was calculated by multiplying the
output current (mA) with the output voltage (Volt).
Figure 4: Experimental setup to measure output parameters of the used solar cell.
3. Measurements of solar radiation
Components with and without lens
Solar radiation components (direct normal and diffused direct
normal radiation) were measured from the sunrise to sundown
in Baghdad for specific days during the year 2016 (23 March,
13 May, 26 June, and 8 August) every 15 min. and the local
time was converted to solar time based on ASHRAE standard
[4].Direct normal light intensity was measured using solar
power meter (TES 1333R, Taiwan, Ranging from 0-2000
W/m2) fixed at the end of a pipe ,1 cm in diameter and 50 cm
in length,coated with black color from inside soas to absorb the
diffused and reflected components of sunlight and allow only
direct normal light intensity to pass through [9].Diffused direct
normal light intensity was measuredusing solar power meter
(TES 1333R,Taiwan,Ranging from 0-2000 W/m2) which is
fixed at the end of the pipe of 6 cm in diameter and 8 cm in

International Journal of Scientific and Research Publications, Volume 7, Issue 4, April 2017 392
ISSN 2250-3153
www.ijsrp.org
length coated with white color from inside to reflect all the
incoming diffused solar component [9]. The other end of the
pipe is shaded to avoid direct sunlight. The output intensity
from hemispherical lens was measured using the previously
mentioned solar power meter (TES 1333R,Taiwan, Ranging
from 0-2000 W/m2) which is fixed at the end of a pipe of 6 cm
in diameter and 8 cm in length coatedwith white color from
inside to reflect all the incoming diffused sun ray back to the
pipe, the setup is shown in fig. 5.It is to be noted that every
reading has been repeated for ten times by
followingchauvenent's criterion [10] and some extreme bias
readings were dismissed to obtain the average values which
were regarded as the acceptable reading.
Figure 5: Experiment setup to measure and concentrate solar light component (W/m2) using the hemispherical lens.
4. Measurements of output power from solar cell with
and without lens
Electrical output power from the solar cell with and
without hemispherical lens was measured using ammeter
(UNI-T, UT61A) connected in series with a solar cell to
measure current (mA) and voltmeter (ASWAR, DT830D)
connected in parallel with a solar cell to measure voltage
(Volt), see fig. 5.
The cooling system has been placed behind the used solar cell
to avoid boost in its temperature and to fix its temperature at
25 °C to standardize the solar cell performance [11].
IV. RESULTS AND DISCUSSION
1. Measurement of optical properties of the hemispherical
lens.
The optical properties of used hemispherical lens
were measured in this work as shown in fig. 2 and 3. The focal
length is equal to 6.2 cm, the refractive index is equal to
1.49,and the reflectivity is equal to 0.2.
2. Measurement of output parameters of used solar cell
The output parameters of used polycrystalline silicon
solar cell were measured. The maximum output power that
could be obtained from the cell at intensity 1000 (W/m2) is as
shown in fig. 6. The characteristic curve is drawn between I-V
which match the result that obtained from [12]. The maximum
power of 1 sun (1000 W/m2) is obtained which is closeto that
obtained from reference [12].
Figure 6: Maximum power of the used solar cell at 𝟏𝟎𝟎𝟎 (𝐖 𝐦𝟐)⁄ intensity.
The variation of maximum output power from the used solar
cell with different intensities were measured and plotted, see
fig. 7. It shows a sharp increase at low intensities and a slow
increase in the output power from solar cell as intensities
increased beyond 200 (W m2) ⁄ which is also become less
steply as the intensity increased toward 2000 (W m2)⁄ , this is
due to that, the intensity becomes closer to that of solar cell
saturation.

International Journal of Scientific and Research Publications, Volume 7, Issue 4, April 2017 393
ISSN 2250-3153
www.ijsrp.org
Figure 7: Variation of maximum output power from thesolar cell with intensity.
3. Measurements of solar radiation components with and
without lens and comparison.
The sunlight components (direct normal and diffused direct
normal radiation) with and without hemispherical lens were
measured using the setup shown in fig. 5.The readings of solar
light intensity with and without lens are shown in fig.
8assuming the input intensity is the direct normal plus diffused
direct normal component of sunlight. An average
concentration of 2x is observed due to the action of the lens.
The experimental and theoretical sum of direct normal
components is shown in fig. 8, with and without a lens. It
shows experimental values of sunlight components as the lens
is used to concentrate them. March is found to have the
maximum sum of the sunlight components where more power
is expected as a solar cell is directed normal to the sun.
4 8 12 16 20
Solar time(hr)
0
400
800
1200
1600
2000
Ligh
t in
tens
ity(W
/m2 )
23 March 2016
4 8 12 16 20
Solar time(hr)
0
400
800
1200
1600
2000
Lig
ht
inte
nsity(W
/m2
)
13 May 2016
4 8 12 16 20
Solar time(hr)
0
400
800
1200
1600
2000
ligh
t in
ten
sity(W
/m2)
26 Jun. 2016
0 4 8 12 16 20
Solar time (hr)
0
400
800
1200
1600
2000
Lig
ht
inte
nsity (
W/m
2)
8 Aug. 2016
Figure 8: Solar light intensity without lens (solid line) and with hemispherical lens (dashed line) that best fit
experimental data (solid triangle) at 23 Mar., 13 May, 26 Jun., and 8 Aug.
4. Measurements of output power from used solar cell with and
without lens
A polycrystalline silicon solar cell was usedwhich is
shown in fig. 5. The maximumoutput power of used solar cell
with and without hemispherical lens was measured using
ammeter (UNI-T,UT61A)that measuring current (mA) and a
voltmeter(ASWAR, DT830D)to measure voltage (Volt). The
output powerin (mW) produced by solar cell was calculated by
multiplying current and voltage. Assume the input solar
International Journal of Scientific and Research Publications, Volume 7, Issue 4, April 2017 394
ISSN 2250-3153
www.ijsrp.org
intensity was the sum of direct normal and diffused direct
normal components that shown in fig. 8.Where Marchseems to
produce the maximum output power due to the fact that the
maximum sum of solar light components is happening at this
month.An increase of about 25 % in the output power of the
solar cell is observed as the lens is used which is the main goal
of this work.
V. CONCLUSIONS
The optical properties of used hemispherical lens were
measured experimentally using lasers and verified theoretically
whenever available. The hemispherical lens was used
practically to concentrate sunlight components on the solar
cell. The electrical output parameters of the used solar cell
were measured practically where the used hemispherical lens
was found to increase the electrical output power from the
solar cell which was related to the action of used hemispherical
lens and properties of the used solar cell. An increase in the
output power is observed (about 25 % for direct normal plus
diffused solar light). The used lens was approved to
concentrate solar irradiation by a factor of about 2x due to the
action of the lens and the characteristic properties of the solar
cell. March seems to produce maximum input power to solar
cell which constituentlyproduce more power from solar cell.
REFERENCES
[1] Ankit S. Gujrathi1 and Prof. Dilip Gehlot,"Testing and the
performance of the convex lens concentrating solar power
panel Prototype", International Journal of Emerging
Technology and Advanced Engineering, Volume 4, Issue 6,
2014.
[2] Mehrdad khamooshi, hanasalati, fuategelioglu,
alihooshyarfaghiri, judytarabishi, and saeedbabadi," a review
of solar photovoltaic concentrators",international journal of
photo energy, 2014, pp: 17.
[3]Firdaus Muhammad-sukki, robertoramirez-iniguez, scott g
mcmeekin, brian g stewart, and barry clive," solar
concentrators",international journal of applied sciences (ijas),
volume (1), issue (1), 2010.
[4] ASHRAE, " Applications Handbook (SI)",In:Solar energy
use,2003.
[5] Muhammad Iqbal,"An introduction to solar radiation",
University of British Columbia,1983.
[6] Stephenson, D.G," tables of solar altitude and azimuth;
intensity and solar heat gain tables", Technical paper: division
of building research, national research council of Canada, No.
(243), Ottawa, 1967.
[7] G. Smestad,H. Ries, andR. Winston," The thermodynamic
limits of light concentrators ", Solar Energy Materials, North
Holland, 21, 1990, pp: 99-111.
[8] Alexander ivanovichmilanich ,"ideal thick
lenses",international journal of engineering science and
innovative technology (ijesit), volume 3, issue 6, 2014,pp:3.
[9] John A. Duffie (Deceased) and William A. Beckman,
"Solar Engineering of Thermal Process", In: Available Solar
Radiation, Fourth Edition, 2013, pp: 44-48.
[10] J. P. Holman,” experimental methods for engineers”, in:
analysis of experimental data, eighth edition, southern
Methodist university, 2012, pp: 60-112.
[11] Michael J Morgan, Greg Jakovidis and Ian McLeod,"An
experiment to measure the I- V Characteristics of a silicon
solar cell", Monash University, Australia, Volume 29, issue 4,
1994, pp:252-254.
[12] J. P. Holman," experimental methods for engineers", in:
analysis of experimental data, eighth edition, southern
Methodist university, 2012, pp: 60-112.
International Journal of Scientific and Research Publications, Volume 7, Issue 4, April 2017 401 ISSN 2250-3153
www.ijsrp.org
The elements of popular culture in “The Great Gatsby” Rima Subhi Taher
PhD Candidate
Abstract- That period was characterized by economic prosperity and tremendous social, artistic, and cultural dynamism. The Twenties witnessed the large usage of automobiles, telephones, motion pictures, accessible electricity, as well as accelerated consumer demand and aspirations, and brought about significant changes in lifestyle and culture. Social and cultural innovations began in leading metropolitan centers such as Chicago, New York, New Orleans, Los Angeles, and Philadelphia, then spread more widely. Popular culture in the 1920s was characterized by innovation in film, visual art and architecture, radio, music, dance, fashion, literature, and intellectual movements.
I. INTRODUCTION he Great Gatsby” was published by Scribners on 10 April 1925. The quintessential tale of the glory and tragedy of
American aspiration won Fitzgerald great critical respect. It also helped create a caricature of the era that continues to this day. "The popular impression of the Twenties as a time of hedonism, alcoholic orgies, and high jinks is in some part based on misreadings of Fitzgerald's fiction," wrote Matthew J. Bruccoli, a Fitzgerald scholar. "Gatsby's party has become the quintessential Twenties party. Fitzgerald's characters have become confused with the cartoons of sheiks in raccoon coats and flappers in short skirts. Fitzgerald's view of the Twenties was serious and complex, for he recognized the glamour as well as the waste, the charm as well as the self-destruction”. F. Scott Fitzgerald's "The Great Gatsby" is considered one of the great American novels of the 20th century. It defines the era that came to be known as the "Jazz Age," a phrase coined by Fitzgerald himself. The novel focuses on four central characters, the narrator Nick Carraway, wealthy young couple Tom and Daisy Buchanan and a wealthy mystery man Jay Gatsby, in Long Island's North Shore. In a way that celebrities set the standard for current popular culture, this novel illustrates the culture in a post-war, Prohibition world. Given its continued popularity, the novel has had numerous reference in popular culture and film. Fitzgerald utilizes societal developments of the 1920s to build Gatsby's stories from simple details like automobiles, the evolution of jazz music, flapper culture, to broader themes like Fitzgerald's discreet allusions to the organized crime culture and bootlegging which was the source of Gatsby's fortune. Fitzgerald educates his readers about the garish society of the Roaring Twenties by placing a timeless, relatable plotline within the historical context of the era. Gatsby seems to believe that he can create a personality based on the values of American popular culture. Thus, at the age of seventeen, he defines for himself a completely new identity. Gatsby hears “the drums of his destiny” as defined by a version of the American dream of success that applies to m
The story of Jay Gatsby, shown from the perspective of Gatsby's friend and neighbour, Nick Carraway, a bonds salesman in New York. As the readers can observe, Gatsby is represented as a young, mysterious millionaire with shady business connections (later revealed that he was a bootlegger), who originally came from North Dakota. He was in love with Daisy Buchanan, a love that bore an untamed obsession in its essence. Other important characters are Daisy Buchanan, Tom Buchanan, and Myrtle Wilson. Gatsby wasfacinated by the same New York crowds that provide the background for Fitzgerald.In the novel, Fitzgerald writes with authority about ads, photos, automobiles, magazines, and Broadway musical as if these things too fuel the energies of art “the cars from New York are parked five deep in the drive, and already the halls and salones and verandas are gaudy with primary colors and hair shoren in strange new ways and shawls beyond thedreams of Castle”.Productions, entertainment, style, and consumption are native subjects of Modernism, often displaying what is merely natural. The world Jay Gatsby is a version of the new social world feared by the tradition of American moralists, it is a world of broken relationships and false relatioships; a world of money and success rather than of social responsibility – a world in which individuals are all too free to determine their moral destinies. Gatsby’s idea of the good life seems merely to be the acquisition of money, things, real estate.Possibly the most famous literary possession of the twentieth century is his car, in “a dich cream color, bright with nickle, swollen here and there in its monstrous length with a triumphant hatboxes and supper-boxes and tool boxes, and terraced with a labyrinth of wind-shields that mirror a dozen suns.” Gatsby’ house is a showcase of consumption. He is materialistic because Americans did not have many other alternatives. Material life offered one of the few recognized ways in which the Americans could express their idea The readers face racism in The Great Gatsby, such as when Tom states that “it’s up to the dominant race to watch out or these other races will have control of things.” The story took place in a time of radical changes. Tom, and all of the others who were currently wealthy, resisted change because it threatened his comfortable way of life. However, this discrimination is kept out of sight until the chaos at the Plaza Hotel. As Tom and Gatsby fight over Daisy’s love, Tom claims that: “Nowadays people begin by sneering at family life and family institution and next they'll throw everything overboard and have intermarriage between black and white”. Though Gatsby’s lavish parties certainly embody the “American Dream,” Fitzgerald used these two instances to subtly remind the readers that the white population was not the only ones who were restlessly moving around the social life of America.
T

International Journal of Scientific and Research Publications, Volume 7, Issue 4, April 2017 402 ISSN 2250-3153
www.ijsrp.org
“As a state of mind and a dream, America had existed long before its discovery. Ever since the early days of Western civilization, peoples had dreamed of a lost Paradise, of a Golden Age characterized by abundance, absence of war, and absence of toil. With the first accounts of the New World, it was felt that these dreams and yearnings had become a fact, a geographical reality fraught with unlimited possibilities During the 1920s, the perception of the American Dream was that an individual can achieve success in life regardless of family history or social status if they only work hard enough. The American Dream originated in the early days of the American settlement, with the mostly poor immigrants searching for opportunities. It was first manifested in the Declaration of Independence, which describes an attitude of hope. The Declaration of Independence states that “all men are created equal and that they are endowed with certain unalienable rights, among which are life, liberty and pursuit of happiness”. In “The Great Gatsby”, the American Dream plays a big role. In the novel you can see what happened to it during the 1920s. The values totally changed - instead of striving for equality, people just wanted to get as rich as they could. The culture of the wealthy Americans represented in the novel was defined mainly by consumerism and excessive material wealth. Wherever given the opportunity, Jay Gatsby is inclined to ostentation as shown in his flamboyant dressing style, what Tom refers to as his “circus wagon” car, and of course, his huge mansion where he throws lavish, drunken parties. This was a boisterous period characterized by rapidly changing lifestyles, financial excesses, and the fast pace of technological progress. Life moved fast as a new sense of prosperity and freedom emerged at the end of World War I. New technology became available for ordinary citizens, such as the telephone, radio, and As Fitzgerald’s description of technology in “The Great Gatsby” indicates -those speedy green and white and yellow automobiles driven by Gatsby, Jordan ,and Daisy, could indeed symbolise the pleasure-seeking irresponsibility and self-centredness of the generation and the era. Another prominent aspect of the twenties in America was the ban on alcohol, i. e. the Prohibition. Though it shaped the entire decade to a great extant, the enforcement of this new law was sporadic and underfunded, faced with opposition in many states and big cities, even in small towns, where many prohibition laws were repealed. Prohibition mainly had an impact on beer-drinking working classes who could not afford bootleg liquor, and not on the crème de la crème, who set much of the tone and style of the decade. Given the lax enforcement of the law, many Americans viewed prohibition as something of a joke. Bootleggers smuggled liquor, while speakeasies in every city provided alcohol illegally. Organized crime controlled the distribution of alcohol in major American cities. Most towns totally depended upon booze and beer, as prostitution and gambling spread. But prohibition failed not because it was institutionally impossible but because it was more than an institutional reform. It was a ‘symbolic reform’ which gave recognition and legitimacy to the norms and values of rural, Protestant America, of the old America, all the while the average American became more enamored of wealth and everyday luxuries, fun, money, sex, dance, and wasting time.
Throughout this essay, the historical surge is put into focus, given it has had a large and noticeable change in the history of North America, a change that touched mainstream culture of the period - a wealth-driven culture. The change can be easily seen in everyday life of the 1920s Americans, such as in fashion, automobiles, technology, electric tools and appliances that became required depending on the economic possibilities of the American households. A deep sense of disillusionment was created by the violence of the war; many viewed the war as an extended act of senseless brutality that destroyed the innocence neglected by the society at the turn of the 20th century. Large numbers of Americans wanted to regain their own identity and accomplish their dreams through materialism. What became a widespread dream for the masses, was the pursuit of pleasures and obtaining money in any way, even illegally, via organized crime. This unstable social atmosphere of the Roaring Twenties was shown in the character of Great Gatsby who, as well as almost anybody else at the time, tried to achieve his dream of becoming well-off and marrying a classy girl he loved deeply. By using Gatsby's dream, Fitzgerald portraited the American Dream, one of the main pillars that has constituted the USA since it won its independence.
II. CONCLUTION From my point of view, these changes in life and culture had a positive side too, for they helped in breaking the restrictions and norms that imprisoned people. Americans could now express their opinions and choose what they wanted or needed without any interference imposed by religion and tradition, which was not allowed before the Jazz Age. Among the most important of these freedoms was the liberation of women from the constraints in their lives. Women were finally able to participate in society's decision-making, they were no longer attached to kichen and housekeeping affairs. Women fought for their right to vote like men, the right to decide on the job they considered appropriate for them, the freedom to pick the style of their clothes, and determine the course of their own life as it pleased them, with no male intervention whatsoever. Despite their negative sides, such as the susceptibility to criminal activities, the Roaring Twenties were the years of women's social upheaval, the years for tremendous changes in the organization of life in general. The change similar to the American exists and is tangible in the Arabic societies as well - here we have the same example of materialism becoming the inevitable cultural element. However, the Arabs reject any change that may affect the customs and traditions of the majority of citizens. They remain closed, unwilling to accept new ideas that could shake their religious beliefs. Secularism would be a huge step forward in the government of the Arabic countries, people would understand better their human rights and a gift of free will, like Americans did in the Roaring Twenties.

International Journal of Scientific and Research Publications, Volume 7, Issue 4, April 2017 403 ISSN 2250-3153
www.ijsrp.org
REFERENCES [1] http://www.planetebook.com/ebooks/The-Great-Gatsby.pdf [2] Bruccoli, Matthew J, New Essays on The Great Gatsby, 1985, Cambridge
University Press; [3] Zilboorg, Caroline,American Prose and Poetry in the 20th Century.
Cambridge University Press,2000; [4] Mizener, Arthur, F.Scott Fitzgerald, Prentice-Hall. INC,1963;
[5] Prigozy, Ruth, F.ScothFitzgerald.Cambrige University Press,2002; [6] Spiller,Robert,E…..et,al,Literary History of the USA ,The Macmillan
Company, New York,1963;
AUTHORS First Author – Rima Subhi Taher, PhD Candidate

International Journal of Scientific and Research Publications, Volume 7, Issue 4, April 2017 404 ISSN 2250-3153
www.ijsrp.org
Factors Affecting Timely Completion of Public
Construction Projects in Trans-Nzoia County
Silas Harun Murithi*, Dr. Elizabeth Nabuswa Makokha (PhD)**
, Dr. Calvin Otieno (PhD)**
* Department of Leadership and Management, Jomo Kenyatta University of Agriculture and Technology ** Department of Computing and Information Technology, Jomo Kenyatta University of Agriculture and Technology
Abstract- There are a good number of construction projects at different stages of implementation in Trans-Nzoia County; Kenya.
However, there are conflicting views on the schedule performance of most of the projects with some stakeholders especially the
intended users arguing that they are delayed while the implementers believe that they are on course. Although schedule delays are
common features in all construction projects the identification of the main causes of schedule delays and the implementation of
actions that prevent these delays are fundamental steps for resolving delay related issues. This research aimed to achieve the
following four objectives; to examine the role of resource allocation on timely completion of public construction projects, to find
out the role of project leadership on timely completion of public construction projects, to establish the effects of project planning
on timely completion of public construction projects and to determine the effects of project monitoring on timely completion of
public construction projects in Trans Nzoia County. This research was significant because the knowledge that will be generated
from it will assist in informing policy formulation by relevant authorities in project planning process and implementation. The
research was guided by the following theories; contingency theory, general systems theory, the ADKAR model and the utility
theory. This research used survey research with a sample of 32 projects drawn from a list of 85 projects that were being
undertaken by the county government or that had already been implemented over the last four years of the first county
government. Upon completion of the data collection exercise, all completed research instruments were assembled, coded,
summarized, entered into the computer; and analyzed using the statistical package for social science (SPSS). Both descriptive and
inferential statistics were used for analysis. Qualitative data was analysed using content analysis. Multiple regression analysis was
used to determine whether independent variables can be used to test the relationship between the variables of the study. The study
shows that 6% of the surveyed projects had time overruns of over 200% while most of the projects (81%) had time overruns of
between 100 and 200%. Only 13 percent of the projects were completed before the projected time. Most respondents mentioned
insufficient funding (12) as a major hindrance to timely project completion. This was followed closely by mention of lack of
public engagements represented by 11 respondents as a factor causing delay in project completion. Misappropriation of funds at
10 mentions attracted more passionate explanations together with lack of public engagement. The study determined that project
monitoring and timely project completion were highly correlated (r = 0.942), (P < 0.05). The study concludes that adequate
resource allocation, strong project leadership and close project monitoring are essential elements in timely project delivery. The
performance of public construction projects had a negative relationship with project planning. These results implied that
performance of public construction projects may be low despite there being a very good project plan. The most significant
predictor of whether a project will be completed in time is project monitoring according to the model developed by the study.
Timely project completion is fairly better than the national average obtained by studies done by Munano (2012) and MOPW
(2012). The study concluded that it is an improved performance going forward. This could be attributed to the devolution of
functions to county government brought about by the constitution of Kenya 2010. From the conclusions arrived at, the following
three recommendations were made. First, the county government should ensure adequate resource allocation for all the projects
they are undertaking, develop and implement avenues for reporting corruption and be committed towards zero tolerance to
corruption. Secondly, the county government should form agencies to deal with project implementation with responsibilities like
those of agencies like KENHA. These agencies will ensure that there is professionalism in project implementation and reduce
political interference, ensure that project planning is above board. Thirdly, the county government should provide adequate and
factual information to the public about the progress and the expected impact of all the projects under implementation.
Index Terms- project, project management
I. INTRODUCTION
1.1. Background of the study
project can be viewed as a temporary endeavor to create a unique product, service or result (PMBoK 2013). Construction
projects usually include the design and build of a new structure (Zwikael 2006). The project schedule is the tool that
communicates what work needs to be performed, which resources of the organization will perform the work and the timeframes in
which that work needs to be performed (PMBoK, 2013). According to Shi et al cited in Yang et al (2013) the concept of a
delayed activity refers to delays in the completion of the activity in question; these delays may result from unanticipated
extensions in activity duration and/or activity start times that are later than expected (Shi, et al 2001). Timely project completion is
A

International Journal of Scientific and Research Publications, Volume 7, Issue 4, April 2017 405 ISSN 2250-3153
www.ijsrp.org
the projected completion time as in the contract for the construction of the project (Munano, 2012). Trans Nzoia County is one
of the 47 devolved units of governance created by the constitution of Kenya 2010.
A project is delayed because the critical activities of the project were delayed. A delayed critical activity implies that the
completion of the activity has been delayed because the activity was started later than expected and/or because the activity
required an unexpectedly extensive duration to complete. Therefore, the causes of project delays can be identified through an
examination of the causes that produce these delayed start times or extended durations (Yang et al 2013). According to Menches
and Hanna (2006) timely completion is an important aspect in determining project success. However, public construction projects
are frequently behind schedule due to various uncertainties. According to Al-saggat cited in Yang et al (2013) identifying the
causes that affect the critical path and consequently the completion of a project is the most important aspect of delay analysis. In
other words, although schedule delays are common features in all construction projects the identification of the main causes of
schedule delays and the implementation of actions that prevent these delays are fundamental steps for resolving delay related
issues.
According to PMI 2006 cited in Zwikael (2006) a project life cycle has five processes/phases a) the initiation is the phase of
formally authorising a new project. b) Planning processes define and refine objectives and select the best of the alternative courses
of action to attain the objectives that the project was undertaken to address. c) Executing processes that involve coordination of
people and other resources (which can be seen to as project leadership and resource allocation functions), such as equipment and
material, to carry out the plan in order to perform the project. d) Monitoring and controlling processes ensure the high-quality
achievements of the project plan and updating it when necessary. e) Closing processes formalize acceptance of the project by its
customers and other stakeholders and bring it to an orderly conclusion.
1.1.1. Global Factors Affecting Timely Project Completion
The building industry is important for both the developing and developed economies. It contributes 10% towards GDP for
developed economies and more than 4% for the developing countries (Gwaya et al, 2014).Construction time has always been used
as one of the benchmarks for assessing the performance of a project and the efficiency of an organization. There are severe
criticisms of the industry when projects take far longer than planned (Jagboro & Ogunsemi, 2006). Chan and Kumaraswamy
(1996) found out that seven eighths of the projects surveyed in Australia in the late 1960s were completed after schedule while in
Hong Kong, 70% of the building projects were delayed. In Saudi Arabia Al-Khahil and Al-Ghafly (1999) observed that
contractors agreed that 37% of all their projects were delayed while seven out of ten projects in Nigeria suffered delays during
their execution (Jagboro & Ogunsemi, 2006).
In Jordan, Al-Momani identified the main causes of project delay as poor project design, change orders and weather. Change
orders refer to design changes by the owner or his agent during the course of the construction. In Malaysia Yau et al identified
improper planning, poor site management and inadequate contractor experience while in Hong Kong, Tung et al identified
inadequate resources due to lack of capital, unforeseen ground conditions and exceptionally low bids as the major factors that
cause project delay. Over several years, a great deal of attention around the world has been devoted to attempts to identify the
potential causes of construction project delays and thereby facilitate the efforts of project management teams to address these
possible delays. For instance, a previous study investigated the causes of delays in building projects in the United States by
conducting a survey of architects, engineers, and contractors. From the survey results, weather, labor supply, and subcontractors
were the primary causes of construction delays (Baldwin & Manthei, 1971) Many researchers have identified additional delay
causes for various types of projects in different countries. All of the delay causes can be classified into two categories: universal
causes, such as change orders (Al- Momani, 2000) and local causes, such as the effects of social and cultural factor (Assaf & Al-
Hejji, 2006). A previous study concluded that improper planning, public interruptions, resource shortfalls caused by contractor
issues or deficiencies in capital, setbacks during the preparation and approval of drawings, the financial difficulties of contractors,
and change orders are the most severe delay causes in various countries (Long et al., 2008;Yang et al,
2013).
Improvement methods are necessary actions to minimize losses. Proper planning and payment of the contractor are the basic
measures that can be put in place to avoid project delay. Mamon et al (2014) in their investigation on how to improve time
performance in construction projects in Malaysia through a quantitative research targeting contractors identified, proper work
planning, committed leadership and management, close monitoring sending clear and complete messages to workers and hiring
skilled workers as the main improvement methods among the 13 that they identified.
1.1.2. Regional Factors Affecting Timely Project Completion
Kikwasi (2012) investigating the causes of delay and disruptions in construction projects in Tanzania, through
questionnaire found that only 22%, 30% and 44% of the projects were completed on estimated time according to clients,
consultants and contractors respectively while the maximum time overrun was 78%, 70% and 56% for clients, consultants and
contractors respectively. Frimpong in his study on the causes of delay in construction of ground water projects in Ghana observes
that monthly payment difficulties from agencies, poor contractor management and material procurement are the critical factors
causing project delay, (Huang et al, 2012).
In addition, Mubarak et al when investigating the causes of delay in Egyptian construction projects cited financial problems of the
contractor and delays in payment by project sponsor these problems can slow project progress and result in the suspension of
International Journal of Scientific and Research Publications, Volume 7, Issue 4, April 2017 406 ISSN 2250-3153
www.ijsrp.org
ongoing work and the delay of both critical activities and the completion of the construction project as a whole. Design changes is
another cause of delay that he established that arises if the original scope of the work in a contract has been changed for example if
the size and scope of a project have been expanded without allowances for extended scope (Yang
2013).
1.1.3. Local Factors Affecting Timely Project Completion
Kenya is a developing country still at the stage of providing infrastructures such as health, education, agriculture and
administrative as well as living facilities for its rapidly growing population (Vision 2030, 2007; Gwaya et al, 2014). Munano
(2012) did a study on factors that influence timeliness of project completion for public sector in Kenya. Of the sampled
projects, completion time exceeded by a mean of 209.8% and the projects were at an average of 87.54% of completion. According
to the study the project that had the minimum percentage elapsed was 91% while the maximum was 481%. This indicates that a
project could take up to a maximum of five times the expected time.
The ministry of public works which is mandated to provide and maintain projects for the public sector (2012) gives 38.60% as the
average percentage project completion rate for 2005-2011. The overall observations on the reasons for delayed delivery given
earlier by the chief architect in the ministry include additional work, inadequate funding, delayed engagements of sub-contractors,
delayed payment, to the contractor and slow decision making (MOPW, 2009). Msafiri (2015) in his study on factors causing
delays in road construction projects in Kenya using a survey on consultants found out that the overall top causes of delay are;
delayed payment by the client, slow decision making and bureaucracy in client organization, inadequate planning/scheduling and
rain. Munano identifies inadequate resources, non-performance by the contractor and delayed payments as the major issues
affecting project delivery in Kenya.
The county government of Trans Nzoia through the ministry of lands housing, physical planning and urban development lists the
following as the challenges that is affecting timely project completion, i) litigation issues; ii) limited funding; iii) lack of
comprehensive legislations to guide the housing sector; iv) slow adoption and application of Appropriate Building Technology
(ABT); v) weak mainstreaming of monitoring and evaluation in projects implementation; vi) rapid rate of urbanization leading to
proliferation of informal settlements; vii) high cost of housing inputs; viii) environmental degradation as a result of infrastructural
development; ix) lack of maintenance culture in the built- environment; x) increasing landlessness in the county; xi) inadequate
capacity of the county land office; xii) uncoordinated land administration between Nairobi headquarters, the county land office
and offices at the sub county level (CIDP 2013-2017).
According to the report of the auditor-general on the financial operations of Trans Nzoia County Executive for the period 1 July
2013 to 30 June 2014 payments totaling over 140 million were made to various firms for bush clearing, heavy roads grading and
other road maintenance in various county wards. However, the report concludes that in all cases, there were no documents
to support how the firms were identified and the contract sums determined. In addition, the list of roads that were to be graded,
road contract sums allocated to each contractor and the necessary supporting documents were not availed for audit review. This
assertion points to corruption and incompetence on the part of the county officials in ensuring that projects are implemented in an
effective and efficient environment for the benefit of the residents.
Vision 2030 envisions providing cost-effective world-class infrastructure facilities and services. Vision 2030 report points out that
poor infrastructure was identified under ERS as a major constraint to doing business and a necessity to improving the
livelihoods of people. Infrastructure is also important in improving our security. It therefore calls for a considerable shift in
the manner in which Kenya deploys her resources to acquire the necessary capacity and access to infrastructure services
(transport, telecommunications, energy, water, sewerage and sanitation and meteorological services) by firms and citizens in
their wealth-creation efforts.
NCA is established and mandated by the National Construction Authority Act 2011 to carry out among others the following roles:
(a) Promote and stimulate the development, improvement and expansion of the construction industry; (b) Advise and make
recommendations to the Minister on matters affecting or connected with the construction industry; (c) Undertake or
commission research into any matter relating to the construction industry; (d) Prescribe the qualifications or other attributes
required for registration as a contractor under this Act; (e) Provide consultancy and advisory services with respect to the
construction industry; (f) Promote quality assurance in the construction industry; (f) Encourage the standardization and
improvement of construction techniques and materials; (g) Initiate and maintain a construction industry information system; (h)
Provide, promote, review and co-ordinate training programmes organized by public and private accredited training centers for
skilled construction workers and construction site supervisors; (i) Accredit and register contractors and regulate their professional
undertakings; and (l) Accredit and certify skilled construction workers and construction site supervisors (G.O.K., 2011).
The NCA have come up with regulations requiring that a contractor, whether foreign or local, be registered under the category of
construction works they propose to undertake. The works are classified under eight categories; NCA-1 to NCA-8, ranging in
monetary value from unlimited value contracts (NCA-1 contract) to contracts valued for Kenya Shillings five million and below
(NCA-8) (G.O.K., 2011). Registration under each category of the Works is on a point basis pegged on criteria such as financial
capacity, experience, available equipment and technical expertise. Gacheru (2015) in her study on the challenges in regulating
building contractors found out that the challenges faced by contractors in ensuring compliance with NCA regulations include:
high registration fees imposed by NCA, high construction levy imposed by NCA, poor attitude towards the NCA as a government

International Journal of Scientific and Research Publications, Volume 7, Issue 4, April 2017 407 ISSN 2250-3153
www.ijsrp.org
regulator, corruption in the regulation process, lack of adequate sensitization about NCA rules and regulations, inadequate NCA
capacity leading to poor enforcement of regulations, and Inadequate contractor capacity to ensure compliance to regulations. She
also found out from NCA itself after interviewing its officials that the main challenges they face in registration and regulation of
contractors were: inadequate capacity to detect errant behaviour in contractors by conducting frequent random surveys, inadequate
NCA capacity leading to poor enforcement of regulations, lack of adequate sensitization about NCA rules and regulations, lack of
prosecutorial powers, poor attitude towards the NCA as a government regulator, inadequate contractor capacity to ensure
compliance to regulations, and inadequate use of ICT in the process of triggering timely inspection.
From her findings she recommends that; (a) NCA sets up fully equipped and staffed offices in all 47 counties to supplement the 10
regional offices currently in operation, (b) The NCA should conduct rigorous sensitization programs to educate contractors on the
rationales for the NCA regulations and code of conduct and possible means of compliance, (c) The NCA should make proposals
for the revision of the NCA Act in order to provide the Authority with prosecutorial power. (d) The NCA should come up with
programs to fund upcoming contractors in order to enhance contractor capacity to comply with NCA regulations. What is evident
is however that there have been failures from different sources and that a solution is required.
1.2. Statement of the Problem
There are a good number of construction projects in Trans Nzoia County at different stages of implementation (CIDP 2013-2017).
For instance the county official website list the referral hospital and the construction of a modern bus park and modern parking
bays as some of the ongoing flagship project for the county. There are however, conflicting views on the schedule performance of
most of the projects with some stakeholders especially the intended users arguing that they are delayed while the
implementers believe that they are on course (The Star, June 2016; The Standard, December 2014). According to Nixon citing
Lim and Mohamed, for those involved with a project, project success is normally thought of as the achievement of some pre‐determined project goal (Nixon et al 2012). Lim and Mohamed suggest that project success needs to be considered from the
perspectives of stakeholders and they identified two perspectives: a macro perspective, which aggregates all stakeholders and a
micro perspective, which considers only those directly involved with the execution of the project.
According to the county integrated development plan 2013-2017 the county has a total road network of 4,060.94 kilometers
comprising of 154 kilometers of bitumen roads, 167.07 kilometers of gravel, and 786.37 kilometers earth roads and 2953.5
kilometers of rural access roads. The report continues to state that most of the roads are in poor condition and are usually
impassable during the rainy season and therefore a major bottleneck to development in the County which is rich in agricultural
produce (CIDP 2013-2017). The number of trading centres in the County is 169 with Kitale as the county headquarters and the
main market centres being Kiminini, Kachibora, Endebess, Gitwamba, Maili Saba, Sikhendu, Mucharage, Sibanga, and Kesogon.
The integrated plan notes that the development of markets and urban centres have led to an influx of people and increase in
economic activities thereby leading to higher demand for facilities and services therefore exerting pressure on available facilities
and space.
The court cases filed by the major public transport providers against the county government in 2015 against unlawful eviction
from their former sites of operation without appropriate alternative is a pointer to an urgent need for fast tracking these projects
(Business Daily, May 2015). In addition there is a significant growth in retail, estate, entertainment and lifestyle facilities, modern
office parks and hotel space attributed to expansion of the middle class across the country (Deloitte, 2016). This therefore
necessitates infrastructural development that matches the felt needs of this generation and future generations. There is an
expected infrastructural growth that is currently not in place or requires to be hastened.
According to Kenya Economic Report (2014) infrastructure forms the bedrock of national growth and development and plays a
critical role in determining the nations competitiveness. Vision 2030 (2007) observes that infrastructure is important in improving
the livelihoods of people and security of the country. One of the goals for 2012 (Vision 2030, 2007) was improving efficiency and
effectiveness of the infrastructure development process at all levels of planning, contracting and construction. In pursuit of
this goal the strategy was to strengthen institutional framework and accelerate speed of project completion. Raising efficiency and
quality of projects and increasing the pace of implementation of projects so that they are completed in specified time frames
(Vision 2030, 2007). However, according to Muriungi (2011), various organizations have been crying foul over the many
projects whose performances fall below target and scarce resources go down the drain. The number of projects that have so far
proved defunct and futile ventures in relation to their objectives is terribly alarming (Munano, 2012; Muriungi, 2011). The
purpose of this research therefore was to evaluate the factors affecting timely completion of public construction projects in Trans-
Nzoia County and to propose actions that can be implemented to prevent and resolve delay related issues.
1.3. Research Objectives
The study was guided by the following objectives.
1.3.1. The General Objective
The overall objective of the study was to evaluate the factors affecting timely completion of public building projects in Trans
Nzoia County.
1.3.2. Specific Objectives
a) To examine the role of resource allocation on timely completion of public construction projects in Trans Nzoia County.

International Journal of Scientific and Research Publications, Volume 7, Issue 4, April 2017 408 ISSN 2250-3153
www.ijsrp.org
b) To find out the role of project leadership on timely completion of public construction projects in Trans Nzoia County.
c) To establish the role of project planning on timely completion of public construction projects in Trans Nzoia County.
d) To establish the role of project monitoring on timely completion of public construction projects in Trans Nzoia County.
1.4. Justification of the Study
Delayed completion of a project has serious consequences including cost overruns and delayed use of the project which may lead
to the project not meeting the set objectives. If the county fails to meet set objectives, realizing the strategic plan may not be
possible which would eventually impact negatively on the vision, mission and core mandate. This would affect the service
delivery to the residents thus violating their constitutional right to better and quality services. Further this research was
important because the knowledge that was generated from it will assist in informing policy formulation by relevant authorities in
project planning and implementation process.
1.5. Scope of the Study
The study was confined to construction projects implemented or in the process of implementation by Trans Nzoia County
government in the last three years that the county governments have been in existence. The county covers an area of 2,496
Km2. The county has five constituencies namely Endebess, Cherangany, Saboti, Kwanza and Kiminini and 25 Wards
(County Integrated Plan 2013-2017).
1.6. Limitations of the Study
Several respondents were unreliable in providing adequate information in time. Some could not return the questionnaire even after
several follow ups. Some respondents provided inaccurate information especially when asked to state the expected date of
completion and the percentage already complete for the project. The researcher later realize that some projects that were declared
as complete or obtained a certain percentage of completion were not actually in that position. These problems were solved by
giving the questionnaire to a more reliable person since what was sampled was the projects and not respondents themselves.
II. LITERATURE REVIEW
2.1. Introduction
This chapter reviews literature with particular attention to project schedule and project planning. The chapter has the following
sections; conceptual framework/empirical review, critique of the existing literature relevant to the study, research gaps and
summary.
2.2. Theoretical Framework
This study was guided by four management theories namely contingency theory, general systems theory, the ADKAR model and
the utility theory.
2.2.1. Contingency Theory
Theory by Fred Edward Fiedler asserts that when managers make a decision, they must take into account all aspects of the current
situation and act on those aspects key to the situation at hand. Each construction project is unique and with its own complexities
and therefore should be managed according to its specific characteristics and environment in that particular period of time
(Sawega 2015). The contingency theory recognizes this aspect and attempts to identify practices that best suit the unique demands
of different projects. This theory rejects the idea of one best way to manage projects because of the varying management
situations. According to Mutema (2013), contingency theory takes into account the interaction and interrelation between the
organization and the environment.
This theory recognizes that there are a range of contextual variables also referred to as risk factors which influence the project
objectives differently. Examples of these variables are: external environment, technology, organizational structure and size, cost,
culture, people involved and strategy. Contingencies for both budgets and schedules provide the project manager with the
estimating caution they need to protect their projects from cost and time overruns (PMI 2006). Effectively allocating these
contingencies can help project managers control much of the projects uncertainties.
2.2.2. General Systems Theory
Theory by Bertalanffy Ludwig Von (1971) asserts that a system is a collection of parts unified to accomplish an overall goal. If
one part of the system is removed, the nature of the system is changed as well. For example, a functioning car is a system if you
remove the carburetor you no longer have a working car. A project can also be viewed as a system with inputs, processes and
outputs. Any project success is dependent on the harmonious interaction of its parts and therefore the project team must be able to
put this into perspective. Improvement methods by Memon et al (2013) indicates that failure of different parties to a project to
work seamlessly leads to infighting that eventually derail the completion of a project.
2.2.3. The ADKAR Model of Change
Hiatt (2006) developed the ADKAR model for change management based on his experience as an engineer and a project leader.
According to him cited in Sawega (2015) project failure is caused by resistance to change and that effective management of this
could enhance project success. The model was based on many change management techniques but presented in one clear model
with a key underlying message that the key to successful change is in understanding how to facilitate change with one person.

International Journal of Scientific and Research Publications, Volume 7, Issue 4, April 2017 409 ISSN 2250-3153
www.ijsrp.org
ADKAR is an acronym for: A – Awareness of the need for change, D – Desire to support and participate in the change, K –
Knowledge of how to change, A – Ability to implement the required skills and behaviors, R – Reinforcement to sustain change.
All the five elements of the ADKAR model are sequential. When bringing about change it is important that everyone understands
the need for change because the natural reaction of employees or project team to change is to resist. The precondition for
implementing change is sound and extensive knowledge, learning new skills and steering towards a different behavior. After
change has been implemented it is important that this change is sustained in order to prevent a lapse into the former behavior.
Project management institute (PMI, 2012) states that 73% of the organizations using project management use change
management. Successful project management largely depends on the ability of the project team to manage change (Hornstein,
2010). Projects do not only generate change but also can be used to formally manage change (Fieldler 2010, Lundy and Morin
2013).
2.2.4. Utility Theory
Utility is a measure of desirability or satisfaction; a degree of satisfaction or welfare coming from an economic activity. Value of a
project depends on its utility while utility depends on the specific circumstances of the stakeholders. The criteria of projects
success should include longer term aspects of the project outcome such as its impact. Utility theory should therefore be
considered as an important element in the definition of project lead time (Al- Carlos, 2014). According to PMI (2006) the project
manager can use a utility- based approach to develop a long-range contingency allocation plan, an approach informed by the
relationship between expected utility and the challenges in allocating a project‟s cost and time contingencies. This relates utility
theory to contingency allocation to improve performance. Delay in project completion impacts negatively to the expected users in
that it denies them the utility they would have had from the project were it complete on time.
2.3. Conceptual Framework
According to Mugenda & Mugenda (2003) cited in Sawega (2014), a conceptual framework is a diagrammatical
representation of hypothesized relationship between independent and dependent variables of the study. From the literature
reviewed project resource allocation, project leadership, project planning and project monitoring are the independent variables
that make project timeliness more likely while the dependent variable was timely project completion.
Figure 2. 1 The Conceptual Framework
2.4. Review of Variables
This section will review each of the four independent variables and demonstrate how they influence timely project
completion.
2.4.1. Project Resource Allocation
Resources refer to materials that the project requires for smooth implementation such as labour, equipment and facilities. Activity
resource estimation helps determine which resources in terms of labour, materials and others are needed for each activity (PMI,

International Journal of Scientific and Research Publications, Volume 7, Issue 4, April 2017 410 ISSN 2250-3153
www.ijsrp.org
2010; Conchuir 2011). It involves estimating the type and quantities of material, human resources and equipments required to
perform each activity. Wrong resource estimation is hypothesized to affect negatively project schedule because the duration
estimation depends in a big way on availability and correct estimation of resources. This in effect affects timely project
completion. These estimates have to be as accurate as possible.
The Machakos 33km Road is a good example to illustrate the importance of efficient resource allocation and utilization. The road
that was built by the county government of Machakos is a critical linkage cutting across the county and joining Garissa Road to
Machakos-Kitui Road. The road was built in a record three months, from 18th
March, 2014 to 18th
June, 2014. The original cost
estimate by KENHA which is the agency that deals with national highways was 1.6 billion. However, the road was constructed for
650 million (Standard July, 2014). The project was completed three days before schedule and had road signage, street lights, and
CCTV cameras covering its entire length (The Star June, 2014; Standard July, 2014). This must be a result of proper planning,
focused leadership and adequate resource allocation.
The road has opened Machakos for engagement with other counties and eased the problem of transportation in the county
(Standard July, 2014). There are several concerns however that the road was substandard and was already peeling off three weeks
after commissioning. This has been difficult to verify because of the political overtones that have surrounded the project after
completion. In addition there is no authoritative report or publication from a formal evaluation that justifies the project as a failure.
It can also be argued that a tarmacked road cannot be compared with one that is undone.
A sufficiently well allocated resource is one of the success factors of a project (Fortune & White, 2006 cited in Ballard, 2014).
There is a problem of scarce resources and therefore, a combination of resource utilization for competitive advantage and
minimization of costs of resource requirements in projects subject to fixed completion time is necessary. According to Feng et al
(2000), traditional time-cost trade-off analysis assumes that the time and cost of an option within an activity are deterministic.
However, in reality the time and cost are uncertain. Therefore, in analysing the time-cost trade-off problem, uncertainties should
be considered when minimizing project duration or cost.
According to Piet Joubert (2010 cited in Yatich, 2016), resources are the means we use to achieve project objectives. The primary
resource is people with applicable skills and competencies. The other main grouping of resources includes capital, facilities,
equipment, material and information. In order to ensure a cost effective application of required resources a proper needs analysis
in order to define the project goals and objectives needs to be done. The project’s baseline that must be resourced will be known
after a requirement specification has been completed. The WBS is the base document for determining resource requirements. The
requirement specification will spell out the real requirements to achieve through the project.
PMI (2013) explain the resource requirements using the following processes; plan cost management which is the process that
establishes the policies, procedures, and documentation for planning, managing, expending, and controlling project costs to
provide guidance and direction on how the project costs will be managed throughout the project, resource estimation which is a
structured prediction of the cost and other resources required to execute a task to establish a control basis, budgeting which is the
process of aggregating the estimated costs of individual activities or work packages to establish an authorized cost baseline against
which project performance can be monitored and controlled and costs control which is the process of monitoring the status of the
project to update the project costs and managing changes to the cost baseline to provides the means to recognize variance from the
plan in order to take corrective action and minimize risk. Therefore the more accurate the estimation, the more reliable the control
system becomes.
Yatich (2016) citing Talbot (1982) identifies resource acquisition as another process which refers to the process of physically
securing the necessary inputs. All resources required have to be paid for. The resources which may be required in a project include
those which are limited on a period-to-period basis such as skilled labour, as well as money, which are consumed and constrained
over the life of the project. At the planning stage the user of resource-constrained project scheduling with time-resource trade-offs
approach is permitted to identify several alternative ways of accomplishing each job in the project. The financing of a project
therefore plays an essential role in the acquisition process. The acquisition process must be managed properly to take care of
possible seasonal shortages, labour disputes, equipment breakdowns, competing demands, delayed deliveries and other things that
may go wrong. The project plan may have to be modified to accommodate or work around supply problems. The same analysis
appears to point to resource leveling as another important aspect which ensures resource demand does not exceed resource
availability and vice versa. If you are forced to reschedule a task on the critical path it would influence the completion dates of
successive tasks.
2.4.2. Project Leadership
According to Müller and Turner (2010) leadership competency profiles and stakeholder management (Turner and Müller, 2004)
are important success factor in project management. Kalsen et al (2014) suggested how project managers can influence and
encourage team members in order to achieve successful results. They based their argument on positive psychology theory that is
an optimistic human vision. They listed use of signature strength, positive meaning, positive emotions and positive relations to
create positive results. The project manager leads and influences his/her employees by influencing their thought, meaning and self-
talk. A culture is required where everyone uses their competence and resources to maximize project performance rather than trying
to advocate for own interest in the project. This can be done by promoting appealing project visions, goals and milestones.
To illustrate the importance of leadership to project implementation, this study gives the example of the Thika super highway. The
transformation of the road from Nairobi to Thika to a super highway was one of the Kenya’s large-scale construction projects
(KARA 2012). The initial budget for the project was Ksh 27 billion and the project began in 2009 following the signing of an
agreement between the Kenyan government and three Chinese construction firms. It was expected that the project would be

International Journal of Scientific and Research Publications, Volume 7, Issue 4, April 2017 411 ISSN 2250-3153
www.ijsrp.org
completed in July 27, 2011. It was however, completed in November 2012 at a cost of Ksh 31 billion (Business Review Nov,
2012). The cost increased by 35% (KARA, 2012) and the reasons for increased costs were given as; increased cost of construction
materials, inflation and additional features that changed the design work. Although with various misgivings the project has been
hailed as a success with many positive impacts. It has eased traffic congestion and frequent road accidents and also reduced time
of travel between Nairobi and Thika. The road connects Nairobi to Marsabit, Isiolo, Moyale and Mandera; primary commercial
centres of Kenya (AfDB, 2012). The road has also opened up urban areas along the stretch to unprecedented growth (KARA
2012).The road was a project with great importance to the political leaders of the time and the residents in and around Nairobi and
therefore enjoyed goodwill from the leadership.
Ballard et al (2014) using three case studies found that use of an adaptive management approach may lead to successful results.
They observed that aligned governance and the adopted contract strategy serves as a foundation for project execution. A good
interaction created both inside the project, among partners and with the external stakeholders is a success factor. External
stakeholders include the local community and the national government. Meetings by stakeholders and discussions in the local
community creates trust and secure commitment and acceptance from local decision makers. In addition well developed
governance and procedures as well as proven tools that includes project tools and risk management are important for successful
accomplishment of project tasks. Muller (2012) observe that project governance is the most important environmental factor
impacting the effectiveness of the applied project management approach while stakeholder management and change management
are impacted most by environmental factors.
Lundy and Morin (2013) citing Pinto et al (1998) contend that numerous authors have considered leadership skills to be essential
to project success and adds that successful transformation is 70% to 90% leadership and only 10% to 30% management. The
International Project Management Association (IPMA) specifically addresses leadership as one of 46 competencies seen as
instrumental to project managers’ success (ICB-IPMA, 2006; PMI, 2007; Lundy and Morin 2013).
According to Nixon et al (2012), in considering the effect of leadership performance on the success or failure of a project observes
that it is important to understand the differences between project management and project leadership. Citing Anantatmula (2010)
he suggests that project management refers to the planning and organizing of project activities, through decision‐making processes
that improve the efficiency and effectiveness of a project. Leadership, conversely, is about guiding others towards the attainment
of project objectives, motivating and guiding people to realize their potential and achieve tougher and challenging organizational
goals. Successful leadership convinces people of the need to change, stimulates new ways of thinking and problem solving, and
then encourages them to work together in order to accomplish project objectives in difficult work environments (Keller, 1992;
Anantatmula, 2010; Nixon et al 2012).
Traditionally, it was believed that leaders were born based on the great man theory however in modern times this theory has been
discarded. There are different schools of leadership theory in which transformational leadership can be found amongst the most
contemporary perspectives (Keegan and Den Hartog, 2004; Turner and Müller, 2005). Transformational leadership has been
defined by the ability of the leader to create a shared vision and a strong identification with team members that is based on more
than just rewarding completion of project activities (Bass, 1985; Keegan and Den Hartog, 2004). Through this shared vision, the
transformational leader is then able to mobilize commitment and improve the performance of both the individual and the project as
a whole. Such leaders are said to show charisma, as a means of motivating others to integrate into the collective vision, and a
strong consideration of and support for individual team member needs (Keegan and Den Hartog, 2004). Developing connections
between the leader and individual team members is also thought to help individuals achieve their full potential
2.4.3. Project Planning
Planning is an institutionalized activity comprising of a series of predetermined and coordinated actions and processes for carrying
out operations for the identification, preparation, appraisal and implementation of projects (Nyandomo and Kongere, 2010). The
PMBoK Guide identifies five processes in the project’s life cycle (PMI 2004, cited in Zwikael 2009). The processes are the
initiation phase that formally authorizes a new project; planning that define and refine objectives and select the best course of
action to attain project objectives; executing that coordinate people and other resources to carry out the plan; monitoring and
controlling that ensures high-quality achievements of the project plan and closing that formalizes acceptance of the project by its
customers and other stakeholders and bring the project to an orderly conclusion. Project planning is the establishment of a set of
directions in sufficient detail to tell the project team exactly what must be done, and what resources to use in order to produce the
deliverables of the project successfully (Meredith and Mantel 2006). The major benefits of planning are to eliminate or reduce
uncertainty, improve efficiency, obtain better understanding of project objectives and to provide basis for monitoring and
controlling of work (Kerzner 2006).
London Olympic Games 2012 is a good example to illustrate the impacts of good project planning. The London Olympic Games
project was intended to develop infrastructure for the Olympic Games scheduled in August, 2012 in London. Olympic Games is
an example of a megaproject which is time critical in that it has a definite day to finish and cannot be delayed. Without counting
the bidding process the project took seven years to plan and execute (Al-Carlos, 2013). The initial budget was £ 2.4 billion but
shot to about £11 billion (Committee of Public Accounts UK, 2011). This was after recalculations and consideration of
contingencies (Boykoff, 2012). The infrastructure was ready one year before the beginning of the games. The ninth report of the
session 2006-2007, House of commons 2007, observes that there was strong governance and delivering structures, clearly and
effectively managed budget, effective procurement practices, planning, effective progress monitoring and risk management
(Munano 2012)
According to Project Management Institute project schedule refers to the analysis of activity durations and resource requirements
to create the project timetable (PMI, 2010). The successful planning and management of construction projects requires careful
planning, scheduling and coordination of numerous interrelated activities (Huang, 1997). These activities are represented by

International Journal of Scientific and Research Publications, Volume 7, Issue 4, April 2017 412 ISSN 2250-3153
www.ijsrp.org
networks which indicate various activities in their proper order of implementation and therefore provide a clear picture of the
relationships between the activities. The networks also indicate how the time schedule will affect the system behavior.
According to Wolf (1985) the Critical Path Method (CPM) is one of the major techniques for dealing with project scheduling. It
uses schematic diagrams to represent the sequence and the interrelationships of the project activities. It is possible to analyze the
completion time of each activity and to determine its effects on the completion of the overall project and the relevant project cost
(PMI, 2010; Wolf et al 1985). This information can be used to achieve optimal time/cost allocations. The CPM assumes that the
activity times and costs are deterministic, that is, they can be reliably predicted without significant uncertainty. Huang et al (2008)
believes that the Program Evaluation and Review Technique (PERT) is a more useful method for project planning under
uncertainty than the CPM because PERT uses probabilistic time estimates, which require three time estimates of the duration of
each activity from people who are most conversant with the activity at hand (Wolf et al, 1985; PMI, 2010).
The Project Management Institute (2010) observes that the optimal critical path time can be reduced by crashing the network, that
is, one or more activities can be performed in less time, but normally at a higher cost (also known as fast tracking). The additional
cost can be estimated and used to decide whether, and/or how a project should be crashed. Critical planning process is a key factor
that significantly improves project success. Zwikael and Globerson (2006) cited in Zwikael (2009) identified six planning
processes that highly contribute to project success as: definition of activities to be performed, schedule development,
organizational planning, staff acquisition, communications and development of a project plan.
According to Thiruvengadam, (2004), the fast-tracking delivery method has received considerable attention over the last decade,
and its time saving feature has placed it as a possible alternative to the traditional more sequential method. Along with its benefits,
however, fast-tracking also has greater potential to impact the project development process than the traditional method. This is
usually attributed to the increased level of uncertainty and research on fast-tracking has mainly focused on uncertainty reduction.
A closer observations of the project development process suggest that to effectively handle uncertainty and minimize the negative
impact of fast tracking, the feedback processes involved in fast-tracking need to be identified, and the dynamic behaviour of
construction resulting from those feedback processes needs to be dealt with in a systematic manner.
2.4.4. Project Monitoring
The project manager must regularly ensure that the planned work is proceeding according to schedule. The purpose here is to
ensure that the project is being implemented as planned and acting to resolve problems. The Gantt chart and the schedule network
are updated continually (PMI 2010, Conchuir 2011). Performance measurement is a basic requirement for tracking cost, time and
quality of a project (Yang et al 2010). Narbaev (2013) citing Pewdum et al. (2009) observes that the primary purpose of managing
a facility construction project is to complete it on time and within the budget while conforming to the established requirements and
specifications (Pewdum et al., 2009). To achieve that objective he argues, substantial effort on managing the construction
process must be provided and could not be done without an effective performance monitoring system. No matter how perfect
the construction project plan is, if no regular and timely reviews are performed during the project execution, neither the project
progress nor the effectiveness of the plan can be evaluated (Cleland and Ireland, 2007; Narbaev 2013). Project monitoring
allows to determine what has happened and to foresee what may happen in the future if previous performance is expected to
continue or if there are no changes in the management of a project. There are three metrics that any project team tries to keep on
track: cost, time, and scope of work. Monitoring compares actual to planned performance and take preventive and corrective
actions based on the finding. Late corrections are ineffective and can cause cost and time overrun (Narbaev 2013).
Earned value management is a powerful quantitative technique for objectively monitoring the physical project progress. It
enables the actual work performance to be compared with the agreed plan (PMI 2005). It can therefore be argued that any
project with a significant time overrun misses the steps early in the project implementation but the project manager does not
realize it until it is too late. When the problem is realized too late in the day the ability to recover the project to achieve its planned
objectives is already diminished (Alvarado et al, 2004).
The key practice of EVM includes two steps: first, establishing a performance measurement baseline (PMB) and, second,
measuring and analyzing a projects performance against the PMB. Steps to effectively build a PMB includes decomposition of
work scope to a manageable level, assigning responsibilities, developing a time-phased budget for each work task, and
maintaining PMB integrity throughout the project. Performance measurement and analysis comprises recording resource usage
during the project execution, objectively measuring the actual physical work progress, analyzing and forecasting cost/schedule
performance, reporting performance problems, and taking corrective actions (PMI, 2011).
EVM relies on three key variables which represent fundamentals of its analysis: budgeted cost of work scheduled (BCWS),
budgeted cost of work performed (BCWP), which is also referred to as EV, and actual cost of work performed (ACWP). The
fourth data point is the budget at completion (BAC): it represents the total BCWS for the project. The four data points are used for
deriving variances of actual versus budgeted performance and associated indices, and for forecasting a project‟s cost and time at
completion. The PMB is the standard against which the project actual cost (ACWP) and progress (BCWP) is compared from start
to finish. The difference between a PMB and the actual status is measured by using two variances revised continuously throughout
the project life. The variances give precise monetary values of positive or negative status. Cost variance (CV) is a measure of the
budgetary conformance of ACWP: CV = BCWP – ACWP; while schedule variance (SV) is the difference between BCWP and
BCWS. Positive values of these variances indicate under budget and ahead of schedule, respectively, while negative – over budget
and behind schedule, respectively. In the above formulae, 1.00 indicates that performance is on target; more than 1.00 indicates
excellent, and less than 1.00 indicates inefficient performance. To consider project past behaviour and actual performance the
original values are corrected by the corresponding performance indices, as given in equations (1) and (2):

International Journal of Scientific and Research Publications, Volume 7, Issue 4, April 2017 413 ISSN 2250-3153
www.ijsrp.org
Though universally accepted as a benchmark for cost and time estimates at completion these two fundamental formulae have been
largely reviewed and criticized with regard to CPI accuracy and SV and SPI reliability respectively. The problem with schedule
relates not only to TEAC itself, but also to its determinants: SV and SPI. In general, EVM method has one mental hurdle: defining
these schedule indicators not in units of time but in units of currency, e.g. dollar. EVM is not directly connected to schedule; as far
as these schedule indicators are in units of currency there is no way to evaluate the project progress thus leading to false
conclusions with regard to schedule performance assessment. This lack of EVM can be seen when there are some activities that
may be accomplished out of sequence. Some activities which have less value but critical can be behind schedule while more costly
tasks are completed ahead of schedule (Lipke, 2005; Russell, 2008). Thus, both measures are entirely associated with cost
performance only and no time constraint is taken into account as it relates to the execution of a project in a chronological sequence
(Howes, 2000).
The other defect to schedule assessment is that as far as a project progresses to its end the SV tends to 0 and the SPI to 1 even if
the project is behind schedule meaning the project is on time without delay even if there is a delay. At some point to a project
completion both SV and SPI lose their management value in most projects regardless nature and structure. These indicators are
only useful when a project is from15 to 20 percent complete until 60-70 percent. Thus, to overcome these two weaknesses an
extension to the EVM theory, named earned schedule (ES) was created by Lipke (2003). The ES method is based on two new
variables: actual time (AT) and ES. Here, ES is determined by comparing BCWP to BCWS, and the value of ES is determined by
projecting BCWP at a certain point in time (AT) to BCWS curve which represents ES: a point in time when the current BCWP
should actually have been achieved. This point can be before or after AT depending on whether a project is ahead or behind
schedule. Then, the technique renames the two traditional SV and SPI into SV ($) and SPI ($) that is clearly in units of currency.
The uniqueness of the ES concept is that both SV (t) and SPI (t) behave suitably reasonable throughout the project life.
Respectively, ES and TEAC (t) are defined as per equations (3) and (4):
where C is the number of whole time increments of the PMB for which
BCWP≥ BCWS:
2.4.5. Timely project Completion
Timely project completion is the projected completion time as in the contract for the construction of the project (Munano, 2012).
Construction time has always been used as a benchmark for assessing the performance of a project and the efficiency of the
implementing organization. It is very important to the stakeholders especially the users because they are waiting to use the product
as soon as possible. Timely completion therefore as observed earlier in this study is a success factor. Project success is a term that
has elicited enormous research with differing views on various aspects of it. Its definition has changed over the years for instance
in the 1960s, project success was measured in technical terms. However later, project success was stated in terms of meeting the
following objectives: completed within planned time, planned budget and the required quality level (Kerzner 1998 cited in Gwaya
et al, 2014). According to Gwaya (2014) all the three objectives are internal to the project and do not necessarily indicate the
preference of the client. After the TQM, a project was considered to be a success by not only meeting the above three objectives
but also making sure that the project is accepted by the client. For a project to be said to be a success therefore, it needs to be
completed on a schedule that is satisfactory to the client.
According to Conchuir (2011) there are six key time management processes, five of which are in the planning process group and
one in the monitoring and controlling (PMI 2010).The first process is to identify each activity that has to be carried out, then base
the time estimates on these components of work. This helps to communicate with the stakeholders objectively, to ensure that all
activities are included and to bring understanding of what has to be done. Once the activities have been defined, the next step is to
define their order. This uses the complete list of activities together with enough detail about each to work out relationships
between them. Sequencing process sorts the various activities into the order in which they will be implemented (PMI, 2010;
Conchuir, 2011). Failure to follow the sequence may be too costly. The major tools and techniques used at this level are the
schedule network diagrams like the CPM diagrams.
The next step is to estimate the work periods which will be needed to complete individual tasks or activities (PMI, 2010). The
Project Management Institute states several inputs for this process with expert judgement as one of the key tools and techniques.

International Journal of Scientific and Research Publications, Volume 7, Issue 4, April 2017 414 ISSN 2250-3153
www.ijsrp.org
The fourth step is to determine which resources in terms of labour, equipment; facilities etc are needed for each activity (PMI,
2010; Conchuir 2011). These estimates have to be as accurate as possible. This process uses various tools and techniques
according to the Project Management Institute that includes bottom-up estimating and use of the project management software.
Once all the activity durations and their sequence have been determined they are used to create the project schedule (order) (PMI,
2010, Conchuir, 2011). This tells us when every activity will take place. The Project Management Institute list schedule network
analysis as one of the tools and techniques to develop schedule. The project manager must regularly control that the planned work
is proceeding according to schedule. The purpose here is to ensure that the project is being implemented as planned and acting to
resolve problems.
2.5. Critique of the Existing Literature Relevant to the Study
In previous studies researchers have identified various causes of schedule delay among them, improper planning and inadequate
resource allocation due to lack of capital (Huang, 2013). Improvement methods identified include proper work planning,
committed leadership and management and close monitoring. However, the analysis of each cause and determination of ways to
prevent them has been missing in the literature. The literature has also identified an extensive list of causes of project delay
however, what seems missing is the assessment of projects based on the urgency of the project. Urgently required projects require
greater attention because their delayed delivery has greater ramifications to the stakeholders. There is also a failure to consider
circumstances that projects operate in when determining causes of project delay. In addition, most of the traditional
publications on project management present approaches to project management that in some cases are stretched to the limit or are
deemed ineffective (Al- Carlos 2014).
Project schedule performance is one of the major factors that have been used to determine project success. Difficulties occur when
we try to identify which schedule is being referred to: the initial schedule approved in the initial plan or the modified schedule as
approved by the client or owner as the project progresses through its life cycle (Thomas et al 2008). Schedule performance of
construction projects undertaken by Trans Nzoia County government have seldom been assessed by research. To the extent that
the above statement is true, the role of schedule performance has been given less importance than it ought to.
2.6. Research Gaps
According to Menches and Hanna (2006) schedule performance is an important aspect in determining project success,
however there has been little research done on schedule performance of construction project in Trans Nzoia County. In addition,
most of the traditional publications on project management present approaches to project management that in some cases
are stretched to the limit or are deemed ineffective (Al-Carlos 2014). It is important therefore to look for adaptive project
management approaches that best fit our unique environment.
2.7. Summary
The reviewed literature examined the various business and project management theories that support the conceptualized
variables. The review identified project resource allocation, project leadership, project planning and monitoring as the main
variables affecting timely project completion. Critique of the relevant literature observed that schedule performance of
construction projects undertaken by Trans Nzoia County government has been given less importance than it ought to.
III. RESEARCH METHODOLOGY
3.1. Introduction
This chapter of the study covers the methodology that was applied in carrying out the research project. The chapter is structured
within the following topics: research design, target population, sampling frame, sampling design, instruments, data collection
procedures, pilot testing and finally concludes with data processing and analysis.
3.2. Research Design
This research used survey research design. Survey research design is appropriate when the target population is large
(Kothari, 2004) like in this case where the target population is the entire construction projects being undertaken by the county
government of Trans Nzoia. The reason for this being to save on cost and increase accuracy since the researcher will have a better
control of data collection errors (Mugenda and Mugenda2003). Survey research uses questionnaires or interviews to collect
data from a sample that has been selected to represent a population to which findings can be generalized (Kothari, 2004).
3.3. Target Population
According to Kenya Institute of Management (2009), target population defines all the subjects in the research study. For the
purpose of this research the target population was 10 construction projects in transport and support infrastructure,
20 in water/ sanitation projects, 25 housing projects (medical centres, residential offices) and 30 education and
communication facilities (County Integrated Plan 2013-2017).
3.4. Sampling Frame
This is the source material or device from which a sample is drawn. It is a list of all those within a population who can be sampled
and may include individuals, households or institutions (Kothari, 2004).The sampling frame of this study was 85 construction

International Journal of Scientific and Research Publications, Volume 7, Issue 4, April 2017 415 ISSN 2250-3153
www.ijsrp.org
projects drawn from a list of projects being undertaken by the county government or that has already been implemented over the
last three years (County Integrated plan 2013-2017).
3.5. Sample and Sampling Techniques
Sampling design describes a case where a representative sample is drawn from the entire population where the elements can be
generalized (Kothari, 2004). Random sampling to pick projects from the list of 85 was employed. Random sampling ensures that
each member of the population has the same chance of being included in the sample KIM (2009). Convenience sampling was used
to determine the respondents’ list, meaning the respondents who have the best knowledge of the research subject. This was
repeated until saturation is achieved. This will enable the research to answer questions that meet the objectives of the study.
According to Mugenda and Mugenda (2003) 10% is a sizeable representation of the population but since 10% 0f this population is
too small and would therefore not result into an unbiased estimate, the researcher undertook to interview 32 respondents such
that 𝑛 ≥ 30.
Table 3.1. Summary of the sampling process
After determining the sample size sampling was done by first serializing all the 85 projects and then subjecting the list to
Microsoft Excel Version 2010 random sampling formula to pick the 32 numbers to represent the 85.
3.6. Data Collection Instruments Interviews were conducted through questionnaires with various project stakeholders. The questionnaire documents were structured
to facilitate easy and short answering of questions by the respondents and respondents were given enough time to give their
feedback.
3.7. Data collection Procedures Data collection was conducted in two steps. The first involved, as a requirement, that prior to actual data collection the researcher
secure a letter of introduction from the university; stating the intention to carry out a study and requesting those concerned to
give permission to conduct the approved research. The researcher then sought a permit to carry out the empirical research
from the National Council for Science, Technology and Innovation (NACOSTI). The researcher then proceeded to inform the
management of the ministry and the institutions about the intended research. Their authorization letters was collected by the
researcher before administering the instruments.
The researcher self-administered the questionnaires to the respondents and conducted interviews with the assistance of trained
research assistants. The data for the study was obtained from both primary and secondary sources. According to (Leed &
Ormrod, 2005) data is said to be primary if it is collected firsthand by researcher for a determined purpose. The primary data
was collected by use of semi-structured questionnaires that was administered to selected respondents. The respondents were
expected to possess the requisite knowledge of the subject matter.
The secondary data was obtained from up to date information from journals, research project reports, newspapers, publications,
PMBoK, conference papers, and presentations as well as updated information from relevant websites especially from the
County Government of Trans Nzoia. The aim of the secondary source was to interpret, offer commentary, analysis and draw
conclusions about events described in primary sources.

International Journal of Scientific and Research Publications, Volume 7, Issue 4, April 2017 416 ISSN 2250-3153
www.ijsrp.org
3.8. Pilot Testing This refers to mini versions of a full-scale study as well as the specific pre- testing of a particular research instrument such as a
questionnaire or interview schedule. Prior to using the questionnaire therefore, there was a pilot testing to refine it to ensure that
respondents do not have problems answering and that there was no problems recording the data. According to Borg and Gall
(2003), piloting of research instruments is important for validity and reliability tests of the instruments. For pilot purposes the
questionnaire was administered to ten respondents.
3.8.1. Validity of the Research Instruments A research instrument is said to be valid if it measures what it is supposed to measure (Borg and Gall 2003). The draft
questionnaires were given to an expert in research to ascertain the items suitability in obtaining information according to research
objectives of the study. This process assisted in eliminating any potential problems of the research instrument and to test the
validity and workability of the instrument.
3.8.2. Reliability of the Research Instruments Reliability of instruments concerns the degree to which a particular instrument gives similar results over a number of repeated
trials (Mugenda and Mugenda, 2003). Pilot test was done to check the questionnaire structure and the sequence, meaning
and ambiguity of questions. This was supplemented by Cronbachs alpha 0.7 which have been proven to give a more reliable score
(Nunnaly, 1978 cited in Kiiru, 2015; Cooper and Schindler, 2008).
3.9. Data Processing and Analysis and the Regression Model Upon completion of the data collection exercise, all completed research instruments were assembled, coded, summarized, entered
into the computer; and analyzed using the statistical package for social science (SPSS). Both descriptive and inferential statistics
were used for analysis. Descriptive statistics consisted of computation of sums, means, standard deviations, frequencies and
percentages.
The analyses was further amplified by subjecting selected results to use of graphical and tabular techniques allowing some of the
results to be presented in form of tabular matrices and pie/bar charts for clarity and to make it more visible and easy to interpret.
Qualitative data was analysed using content analysis. This provided ways of discerning, examining, comparing and contrasting,
and interpreting meaningful patterns or themes from data (Miles and Huberman, 1994 cited in Sawega, 2015). Meaningfulness
was determined by the particular objectives of the research study. Qualitative approaches to data analysis tend to focus on the
descriptive or theoretical aspects of the transcript data.
The study adopted factor analysis in order to reduce the number of indicators or factors under each research variable, retain the
indicators capable of explaining the factors that affect timely completion of public projects in Trans- Nzoia County. Multiple
regression analysis was used to determine whether the independent variables notably, X1 = project resources, X2 = project
leadership, X3 = project planning and X4 project monitoring critically affects timely project completion. As a result, this
subsection will examine whether the multiple regression equation could be used to explain the nature. Multiple regression model
presented below was used to test on the relationship between the variables of the study:
Where:
Y -Timely Project Completion
β 0 -The constant
X1 -Project resources
X2 -Project leadership
X3 -Project planning
β1, β2, β3 & β4 - Coefficients
X4 -Project monitoring
Ɛ -Error term
In this study ANOVA test was used to determine the impact of the independent variables on the dependent variables in the model.
The SPSS computer programme was used in this study, to analyse the variance and establish whether the whole model was
a significant fit of the data. ANOVA is a data analysis procedure that is used to determine whether there are significant differences
between two or more groups or samples at a selected probability level (Mugenda & Mugenda, 2003).

International Journal of Scientific and Research Publications, Volume 7, Issue 4, April 2017 417 ISSN 2250-3153
www.ijsrp.org
IV. RESEARCH FINDINGS AND DISCUSSION
4.1. Introduction This chapter presents the results obtained from the findings of the research study. It includes the general information of the
respondents that were targeted in the study. The presentation provides raw data first followed by discussions. Analysis was based
on the research objectives and the independent variables. The data was analyzed and presented in frequencies and converted into
percentages and thereafter presented into tabular forms to make it is easy to understand and interpret. The total number of
questionnaires administered for the study was 32 and all of them were returned. Reasons that relate to the high return rate were
that contact persons were appointed individuals of good repute and were reminded through their email addresses. In case one
failed to return the questionnaire it was given to a more reliable person.
4.2 Bio Data of the Respondents Finding out the general information of the respondents is very important because it enables the researcher to gauge the reliability
and validity of the data received and to know the type of people that he/she is dealing with. This information includes years or
period in operation.
4.2.1 Distribution by Gender The respondents were asked to state their gender to determine whether each gender is fairly represented in issues of project
implementation.
Figure 4. 1 Gender of the Respondents
84% of those interviewed were male with only 16% were female. This was even made worse by the fact that not a single woman
was involved as a contractor in the projects that were sampled. This is despite the fact that at least one thirds of any gender should
be involved in all government activities as provided for in the constitution of Kenya 2010.
4.2.2 Distribution by Age The researcher found that it was important to collect data on the age of the respondents. Age plays a critical role in understanding
how people of different ages view the implementation of projects, to a larger extent an older employee is more experienced and is
likely to relate issues more directly than relatively younger employees, while the younger employees are perceived to be more
receptive to new technologies in the work place. It was also meant to determine whether the respondents were young, mature or
old.
Table 4.2. Respondents Age Distribution

International Journal of Scientific and Research Publications, Volume 7, Issue 4, April 2017 418 ISSN 2250-3153
www.ijsrp.org
(∑FX)/n = 1166/32=36.44
Most of the respondents stated their age to be between 21 to 40 years represented by 75% of all the respondents with the average
age being 36 years. This indicates that individuals involved in project development in the county are relatively young. This may
imply that they can be able to adapt to new technologies and modern practices with ease. It is also worth noting that most of the
contractors were relatively young this being a plus because it is a constitutional requirement that the youth be involved in project
implementation and be given tenders to supply the government.
4.2.3 Distribution by Education Level The level of education was critical in this study as it indicated the level of theoretical concepts exposure for the respondents that
may influence their job performance.
Figure 4. 2 Respondents Educational Level
9% of the respondents had O‟ Level qualifications, 28% had a college certificates and diplomas, 34% had undergraduate degrees
while others represented by 28% had post graduate degrees.
4.3.1. Respondents’ Working Experience Respondents with longer period of service are more experienced and are in a position to explain processes and activities involved
in project implementation. They have adequate and enough working experience and are in a better position to understand
the organizations activities well. The respondents had an average of 11 years of experience in project implementation. This
therefore shows that most of the respondents had wide knowledge and experience on project implementation.
4.2.2 Respondents' Role in the Project
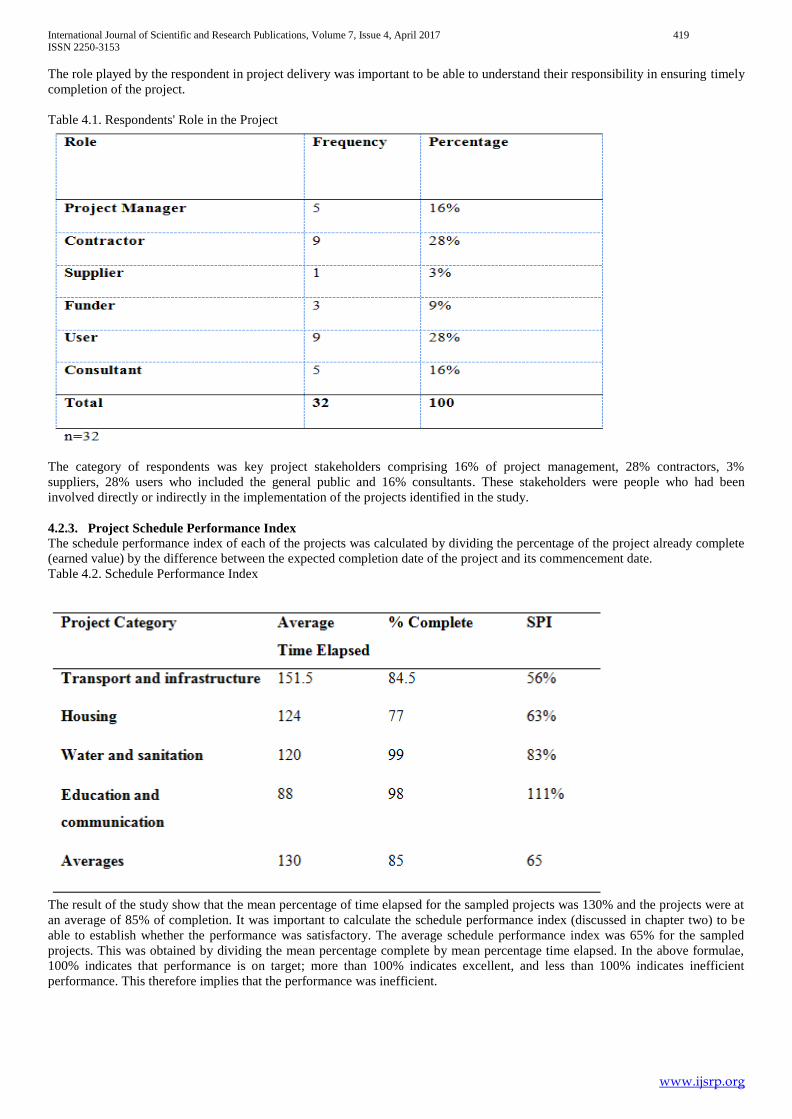
International Journal of Scientific and Research Publications, Volume 7, Issue 4, April 2017 419 ISSN 2250-3153
www.ijsrp.org
The role played by the respondent in project delivery was important to be able to understand their responsibility in ensuring timely
completion of the project.
Table 4.1. Respondents' Role in the Project
The category of respondents was key project stakeholders comprising 16% of project management, 28% contractors, 3%
suppliers, 28% users who included the general public and 16% consultants. These stakeholders were people who had been
involved directly or indirectly in the implementation of the projects identified in the study.
4.2.3. Project Schedule Performance Index The schedule performance index of each of the projects was calculated by dividing the percentage of the project already complete
(earned value) by the difference between the expected completion date of the project and its commencement date.
Table 4.2. Schedule Performance Index
The result of the study show that the mean percentage of time elapsed for the sampled projects was 130% and the projects were at
an average of 85% of completion. It was important to calculate the schedule performance index (discussed in chapter two) to be
able to establish whether the performance was satisfactory. The average schedule performance index was 65% for the sampled
projects. This was obtained by dividing the mean percentage complete by mean percentage time elapsed. In the above formulae,
100% indicates that performance is on target; more than 100% indicates excellent, and less than 100% indicates inefficient
performance. This therefore implies that the performance was inefficient.

International Journal of Scientific and Research Publications, Volume 7, Issue 4, April 2017 420 ISSN 2250-3153
www.ijsrp.org
Table 4.3. Descriptive Statistics
There was a huge variance (1645) witnessed on the percentage time elapsed as some projects took too long to complete while
others took a shorter time. There were 9 projects (28%) that were 100% completed on time (although this was sometimes
disputable). Both percentage time elapsed and percentage completion were skewed right (positively skewed) meaning more
values were below the mean.
4.2.4 Status of the Project In addition this study sought the opinion of the respondents on the status of the project to be able to ascertain the completion
rate of public construction projects in Trans-Nzoia County the results are as indicated in figure 4.3.
Figure 4. 3. Status of Project
The data indicated that only 47% of the surveyed projects were complete, 34% of the projects were still ongoing while 19% of the
projects had stalled. It is however important to note that most of the major projects are still ongoing and only small projects like
putting culverts were completed on time. The average time elapsed for the projects were 130% while the projects were at an
average of 85 percentage of completion.
Table 4.4. Summary of Project Characteristics
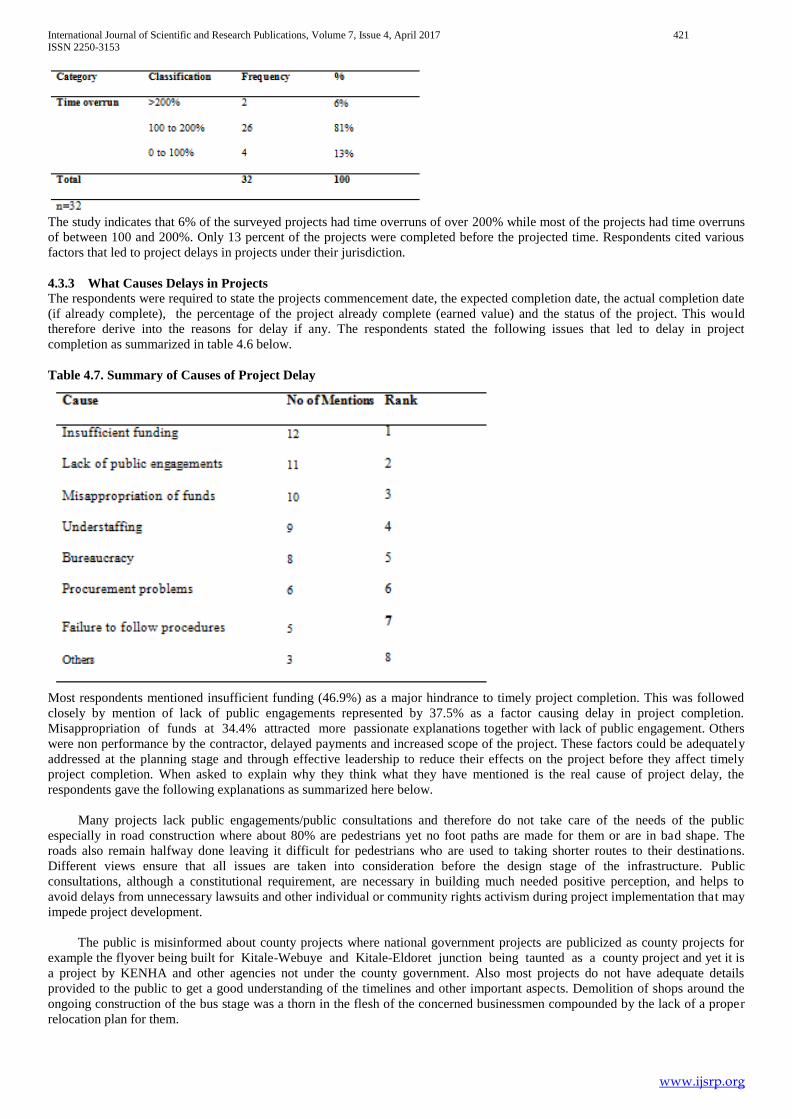
International Journal of Scientific and Research Publications, Volume 7, Issue 4, April 2017 421 ISSN 2250-3153
www.ijsrp.org
The study indicates that 6% of the surveyed projects had time overruns of over 200% while most of the projects had time overruns
of between 100 and 200%. Only 13 percent of the projects were completed before the projected time. Respondents cited various
factors that led to project delays in projects under their jurisdiction.
4.3.3 What Causes Delays in Projects The respondents were required to state the projects commencement date, the expected completion date, the actual completion date
(if already complete), the percentage of the project already complete (earned value) and the status of the project. This would
therefore derive into the reasons for delay if any. The respondents stated the following issues that led to delay in project
completion as summarized in table 4.6 below.
Table 4.7. Summary of Causes of Project Delay
Most respondents mentioned insufficient funding (46.9%) as a major hindrance to timely project completion. This was followed
closely by mention of lack of public engagements represented by 37.5% as a factor causing delay in project completion.
Misappropriation of funds at 34.4% attracted more passionate explanations together with lack of public engagement. Others
were non performance by the contractor, delayed payments and increased scope of the project. These factors could be adequately
addressed at the planning stage and through effective leadership to reduce their effects on the project before they affect timely
project completion. When asked to explain why they think what they have mentioned is the real cause of project delay, the
respondents gave the following explanations as summarized here below.
Many projects lack public engagements/public consultations and therefore do not take care of the needs of the public
especially in road construction where about 80% are pedestrians yet no foot paths are made for them or are in bad shape. The
roads also remain halfway done leaving it difficult for pedestrians who are used to taking shorter routes to their destinations.
Different views ensure that all issues are taken into consideration before the design stage of the infrastructure. Public
consultations, although a constitutional requirement, are necessary in building much needed positive perception, and helps to
avoid delays from unnecessary lawsuits and other individual or community rights activism during project implementation that may
impede project development.
The public is misinformed about county projects where national government projects are publicized as county projects for
example the flyover being built for Kitale-Webuye and Kitale-Eldoret junction being taunted as a county project and yet it is
a project by KENHA and other agencies not under the county government. Also most projects do not have adequate details
provided to the public to get a good understanding of the timelines and other important aspects. Demolition of shops around the
ongoing construction of the bus stage was a thorn in the flesh of the concerned businessmen compounded by the lack of a proper
relocation plan for them.

International Journal of Scientific and Research Publications, Volume 7, Issue 4, April 2017 422 ISSN 2250-3153
www.ijsrp.org
Misappropriation of funds/corruption received a substantial mention by the respondents with some providing more
information about how they think it affects project delivery. County projects are overpriced for example road grading that usually
cost Ksh15-20 per square kilometer is quoted at Ksh
2,500. Many rogue contractors are paid even before they commence any work on the project. Contractors are paying kickbacks to
get contracts and even get paid over 50% upfront a fraction of which they have to part with. They also have to pay cartels
positioned around approving agencies to do their work. Once the bribes are paid to the cartels the contractor remains with little
money to move on with the project. He therefore has to borrow from commercial banks to plug the deficit. After completing the
first phases of the project, when inspection is done, it is noticed that the work done is a fraction of what was paid for. The
contractors proceed to next phases and similarly the verdict is the same; the work done is still a fraction of what was paid for. This
leaves them with little options but to abandon the project altogether.
4.4. Raw Data on the Specific Objectives of the Study This section deals with the specific information with regards to specific objectives of the study.
4.4.1 Introduction Finding a solution to a problem requires first admitting its existence and then getting an understanding of the background
of the particular problem and issues around it. This section highlights the findings on the factors affecting timely completion of
public construction projects.
4.4.2. Influence of Resource Allocation on Timely Project Completion Respondents were asked to state whether they consider resource estimates for activities in the particular project they are
participating in as being realistic. 88% of the respondents admitted that resource estimates for activities in the projects were not
realistic. When asked to explain they stated that most resource estimates are not based on any professional guidelines but are
totally exaggerated. The respondents also were required to state the extent to which they agree with the following statements on
project resource allocation in relation to timely completion of a project. SD= Strongly Disagree D=Disagree N= Not Sure A=
Agree SA= Strongly Agree.
Table 4.8 Resource Allocation
On resources, 50.00% of the respondents interviewed strongly agreed that adequate resource allocation improves timely project
completion, 18.75% agreed, 12.50% disagreed while 9.38% strongly disagreed. This implies that the respondents generally agreed
that adequate resources are essential for project success. When asked whether resource allocation to that particular project was
adequate 15.63% strongly agreed, 28.13% agreed, 37.50% disagreed while 12.50% strongly disagree. This indicates that majority
of the respondents felt that the resources allocated to the project they were undertaking was not adequate. Similarly, 68.75% of the
respondents strongly agreed, 15.63% agreed, 9.38% disagreed while 3.13% strongly disagreed that financial problems and
payments problems of completed work had actually led to project delays. In addition 12.50% of the respondents strongly agreed,
46.88% agreed, 18.75% neutral, 18.75% disagreed while 3.13% strongly disagreed that delay was caused by material procurement
difficulties
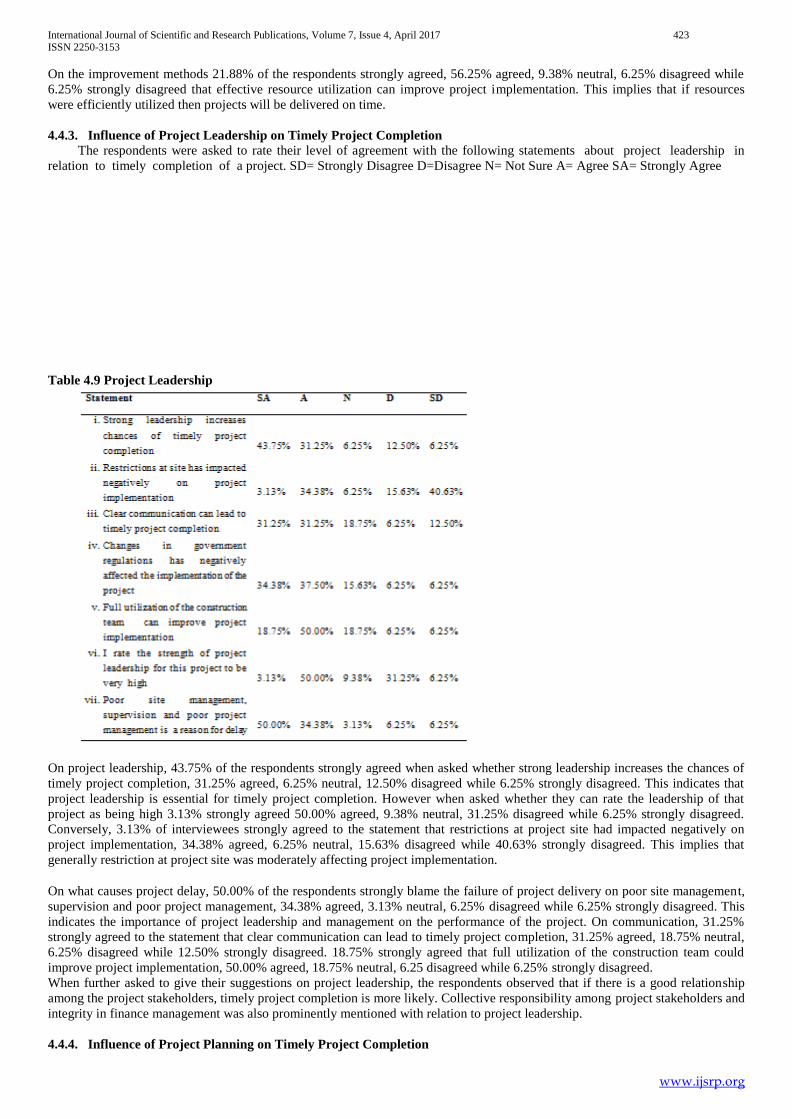
International Journal of Scientific and Research Publications, Volume 7, Issue 4, April 2017 423 ISSN 2250-3153
www.ijsrp.org
On the improvement methods 21.88% of the respondents strongly agreed, 56.25% agreed, 9.38% neutral, 6.25% disagreed while
6.25% strongly disagreed that effective resource utilization can improve project implementation. This implies that if resources
were efficiently utilized then projects will be delivered on time.
4.4.3. Influence of Project Leadership on Timely Project Completion The respondents were asked to rate their level of agreement with the following statements about project leadership in
relation to timely completion of a project. SD= Strongly Disagree D=Disagree N= Not Sure A= Agree SA= Strongly Agree
Table 4.9 Project Leadership
On project leadership, 43.75% of the respondents strongly agreed when asked whether strong leadership increases the chances of
timely project completion, 31.25% agreed, 6.25% neutral, 12.50% disagreed while 6.25% strongly disagreed. This indicates that
project leadership is essential for timely project completion. However when asked whether they can rate the leadership of that
project as being high 3.13% strongly agreed 50.00% agreed, 9.38% neutral, 31.25% disagreed while 6.25% strongly disagreed.
Conversely, 3.13% of interviewees strongly agreed to the statement that restrictions at project site had impacted negatively on
project implementation, 34.38% agreed, 6.25% neutral, 15.63% disagreed while 40.63% strongly disagreed. This implies that
generally restriction at project site was moderately affecting project implementation.
On what causes project delay, 50.00% of the respondents strongly blame the failure of project delivery on poor site management,
supervision and poor project management, 34.38% agreed, 3.13% neutral, 6.25% disagreed while 6.25% strongly disagreed. This
indicates the importance of project leadership and management on the performance of the project. On communication, 31.25%
strongly agreed to the statement that clear communication can lead to timely project completion, 31.25% agreed, 18.75% neutral,
6.25% disagreed while 12.50% strongly disagreed. 18.75% strongly agreed that full utilization of the construction team could
improve project implementation, 50.00% agreed, 18.75% neutral, 6.25 disagreed while 6.25% strongly disagreed.
When further asked to give their suggestions on project leadership, the respondents observed that if there is a good relationship
among the project stakeholders, timely project completion is more likely. Collective responsibility among project stakeholders and
integrity in finance management was also prominently mentioned with relation to project leadership.
4.4.4. Influence of Project Planning on Timely Project Completion
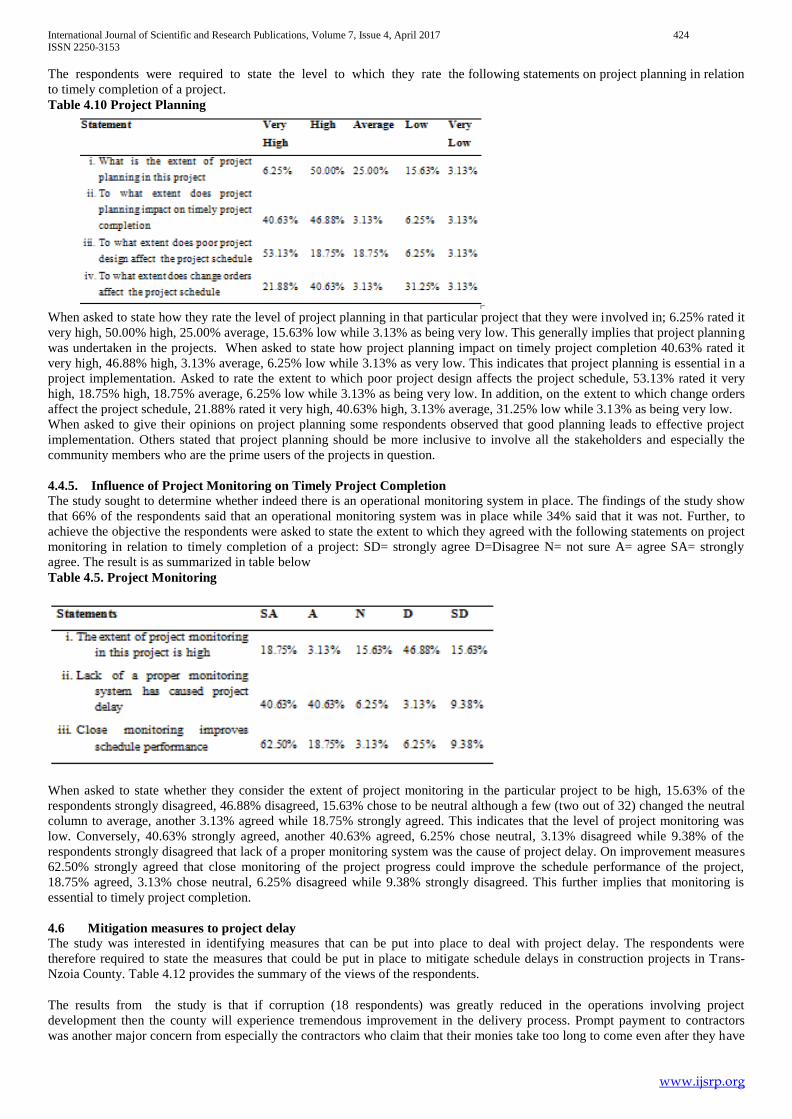
International Journal of Scientific and Research Publications, Volume 7, Issue 4, April 2017 424 ISSN 2250-3153
www.ijsrp.org
The respondents were required to state the level to which they rate the following statements on project planning in relation
to timely completion of a project.
Table 4.10 Project Planning
When asked to state how they rate the level of project planning in that particular project that they were involved in; 6.25% rated it
very high, 50.00% high, 25.00% average, 15.63% low while 3.13% as being very low. This generally implies that project planning
was undertaken in the projects. When asked to state how project planning impact on timely project completion 40.63% rated it
very high, 46.88% high, 3.13% average, 6.25% low while 3.13% as very low. This indicates that project planning is essential in a
project implementation. Asked to rate the extent to which poor project design affects the project schedule, 53.13% rated it very
high, 18.75% high, 18.75% average, 6.25% low while 3.13% as being very low. In addition, on the extent to which change orders
affect the project schedule, 21.88% rated it very high, 40.63% high, 3.13% average, 31.25% low while 3.13% as being very low.
When asked to give their opinions on project planning some respondents observed that good planning leads to effective project
implementation. Others stated that project planning should be more inclusive to involve all the stakeholders and especially the
community members who are the prime users of the projects in question.
4.4.5. Influence of Project Monitoring on Timely Project Completion The study sought to determine whether indeed there is an operational monitoring system in place. The findings of the study show
that 66% of the respondents said that an operational monitoring system was in place while 34% said that it was not. Further, to
achieve the objective the respondents were asked to state the extent to which they agreed with the following statements on project
monitoring in relation to timely completion of a project: SD= strongly agree D=Disagree N= not sure A= agree SA= strongly
agree. The result is as summarized in table below
Table 4.5. Project Monitoring
When asked to state whether they consider the extent of project monitoring in the particular project to be high, 15.63% of the
respondents strongly disagreed, 46.88% disagreed, 15.63% chose to be neutral although a few (two out of 32) changed the neutral
column to average, another 3.13% agreed while 18.75% strongly agreed. This indicates that the level of project monitoring was
low. Conversely, 40.63% strongly agreed, another 40.63% agreed, 6.25% chose neutral, 3.13% disagreed while 9.38% of the
respondents strongly disagreed that lack of a proper monitoring system was the cause of project delay. On improvement measures
62.50% strongly agreed that close monitoring of the project progress could improve the schedule performance of the project,
18.75% agreed, 3.13% chose neutral, 6.25% disagreed while 9.38% strongly disagreed. This further implies that monitoring is
essential to timely project completion.
4.6 Mitigation measures to project delay The study was interested in identifying measures that can be put into place to deal with project delay. The respondents were
therefore required to state the measures that could be put in place to mitigate schedule delays in construction projects in Trans-
Nzoia County. Table 4.12 provides the summary of the views of the respondents.
The results from the study is that if corruption (18 respondents) was greatly reduced in the operations involving project
development then the county will experience tremendous improvement in the delivery process. Prompt payment to contractors
was another major concern from especially the contractors who claim that their monies take too long to come even after they have
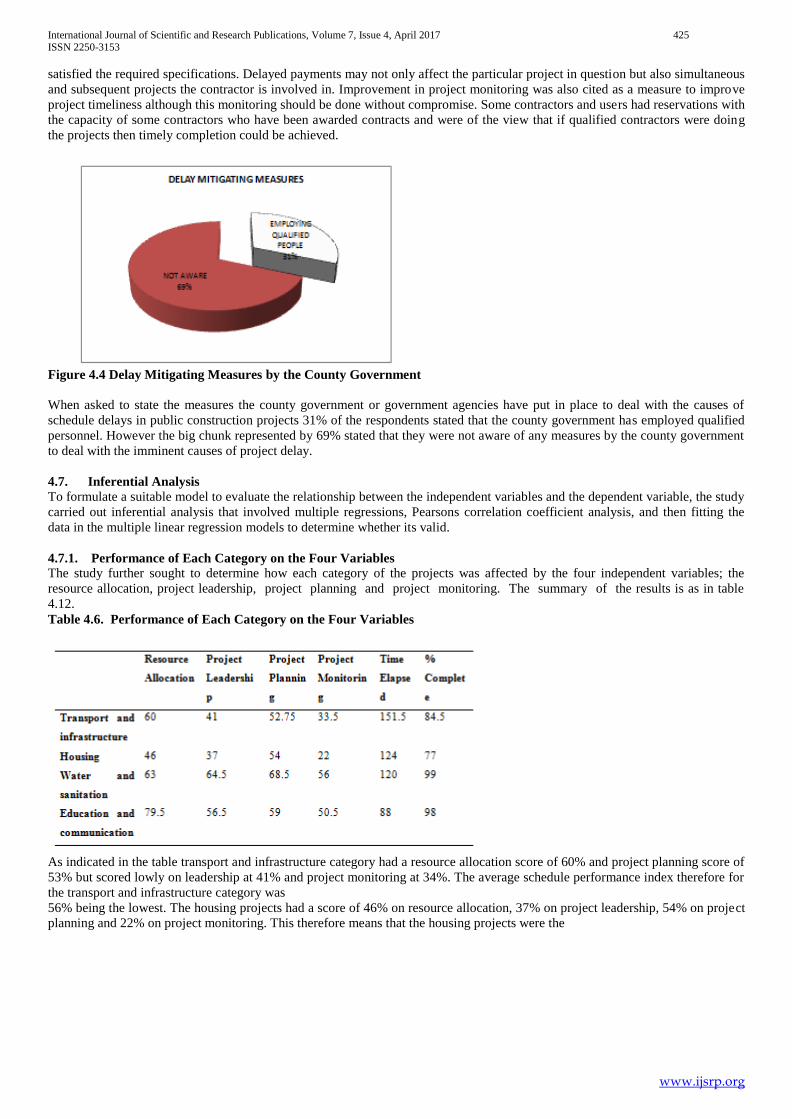
International Journal of Scientific and Research Publications, Volume 7, Issue 4, April 2017 425 ISSN 2250-3153
www.ijsrp.org
satisfied the required specifications. Delayed payments may not only affect the particular project in question but also simultaneous
and subsequent projects the contractor is involved in. Improvement in project monitoring was also cited as a measure to improve
project timeliness although this monitoring should be done without compromise. Some contractors and users had reservations with
the capacity of some contractors who have been awarded contracts and were of the view that if qualified contractors were doing
the projects then timely completion could be achieved.
Figure 4.4 Delay Mitigating Measures by the County Government
When asked to state the measures the county government or government agencies have put in place to deal with the causes of
schedule delays in public construction projects 31% of the respondents stated that the county government has employed qualified
personnel. However the big chunk represented by 69% stated that they were not aware of any measures by the county government
to deal with the imminent causes of project delay.
4.7. Inferential Analysis To formulate a suitable model to evaluate the relationship between the independent variables and the dependent variable, the study
carried out inferential analysis that involved multiple regressions, Pearsons correlation coefficient analysis, and then fitting the
data in the multiple linear regression models to determine whether its valid.
4.7.1. Performance of Each Category on the Four Variables The study further sought to determine how each category of the projects was affected by the four independent variables; the
resource allocation, project leadership, project planning and project monitoring. The summary of the results is as in table
4.12.
Table 4.6. Performance of Each Category on the Four Variables
As indicated in the table transport and infrastructure category had a resource allocation score of 60% and project planning score of
53% but scored lowly on leadership at 41% and project monitoring at 34%. The average schedule performance index therefore for
the transport and infrastructure category was
56% being the lowest. The housing projects had a score of 46% on resource allocation, 37% on project leadership, 54% on project
planning and 22% on project monitoring. This therefore means that the housing projects were the
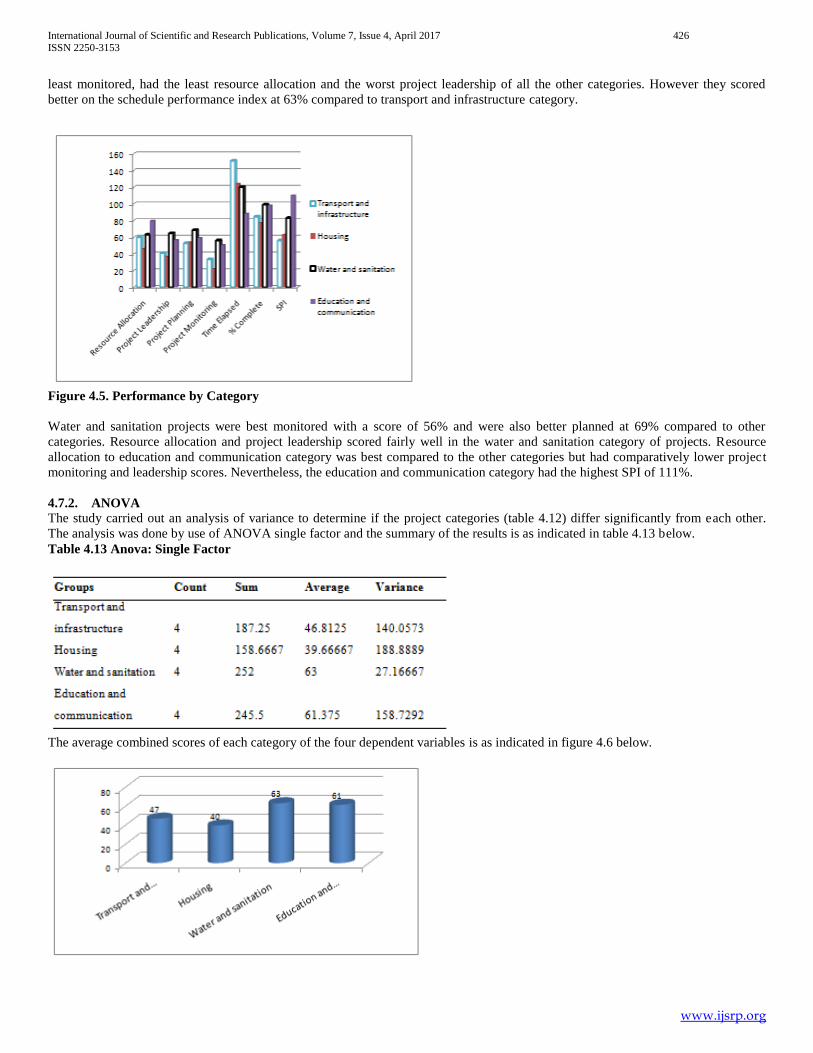
International Journal of Scientific and Research Publications, Volume 7, Issue 4, April 2017 426 ISSN 2250-3153
www.ijsrp.org
least monitored, had the least resource allocation and the worst project leadership of all the other categories. However they scored
better on the schedule performance index at 63% compared to transport and infrastructure category.
Figure 4.5. Performance by Category
Water and sanitation projects were best monitored with a score of 56% and were also better planned at 69% compared to other
categories. Resource allocation and project leadership scored fairly well in the water and sanitation category of projects. Resource
allocation to education and communication category was best compared to the other categories but had comparatively lower project
monitoring and leadership scores. Nevertheless, the education and communication category had the highest SPI of 111%.
4.7.2. ANOVA The study carried out an analysis of variance to determine if the project categories (table 4.12) differ significantly from each other.
The analysis was done by use of ANOVA single factor and the summary of the results is as indicated in table 4.13 below.
Table 4.13 Anova: Single Factor
The average combined scores of each category of the four dependent variables is as indicated in figure 4.6 below.

International Journal of Scientific and Research Publications, Volume 7, Issue 4, April 2017 427 ISSN 2250-3153
www.ijsrp.org
Figure 4.6 Average Performance
Housing projects scored lowly in the combined averages while water and sanitation scored best in combining the four independent
variables; resource allocation, project leadership, project planning and project monitoring.
Table 4.14 Significance in Variation
Based on the p-value the conclusion is that the four independent variables; the resource allocation, project leadership, project planning
and project monitoring differ significantly among the four project categories.
4.7.2. Reliability Reliability of instruments concerns the degree to which a particular instrument gives similar results over a number of repeated trials
(Mugenda and Mugenda, 2003). This was done by use of Cronbachs alpha 0.7 which have been proven to give a reliable score
(Nunnaly, 1978 cited in Kiiru, 2015; Cooper and Schindler, 2008). To measure the reliability of the gathered data, Cronbach‟s alpha
was used. It is a coefficient of reliability that gives an unbiased estimate of data generalizability (Zinberg, 2005 cited in Sawega 2015).
An alpha coefficient of 0.70 or higher indicated that the gathered data was reliable as it has a relatively high internal consistency and
can be generalized to reflect opinions of all respondents in the target population (Zinbarg, 2005).
Table 4.15: Reliability Test
4.7.3. Factor Analysis and Results The study adopted factor analysis in order to reduce the number of indicators or factors under each research and retained the indicators
capable of explaining the factors affecting timely completion of public construction projects in Trans-Nzoia County. The
retained factors had loading values of above 0.4 and were used for further analysis. According to Hair et al. (1998) and Tabachnick
and Fidell (2007) cited in Sawega (2015) factors with factor loading above 0.4 shall be retained for further study where they described
the factor loadings as follows: 0.32 (poor), 0.45 (fair), 0.55 (good), 0.63 (very good) or 0.71 (excellent).
4.7.4. Pearson’s Correlation Coefficient
The study used Pearsons correlation coefficient (r) technique to analyse the degree of relationship between two variables (independent
and dependent). Correlation therefore is the measure of the relationship or association between two continuous numeric variables.
Correlation indicates both direction and degree to which they co vary with one another from case to case without implying that one is
causing the other. Correlation analysis results give a correlation coefficient which measures the linear association between two
variables (Crossman, 2013).
The value of correlation coefficient ranges between -1 and +1. A correlation coefficient of +1 indicates that two variables are perfectly
related in a positive linear. A correlation of -1 indicates that two variables are negatively linearly related and a correlation coefficient
of 0 indicates that there is no linear relationship between two variables. The independent variables of this study were, project resource
allocation, project leadership, project planning and project monitoring while the dependent variable was timely project
completion.

International Journal of Scientific and Research Publications, Volume 7, Issue 4, April 2017 428 ISSN 2250-3153
www.ijsrp.org
Table 4.16 Correlation
As shown in the table, project monitoring and timely project completion was found to be highly correlated (r = 0.942), (P < 0.05). This
indicated that, if project monitoring is high then timely project completion is also high and therefore public construction project with
high project monitoring index are completed on time. The researcher also found out that, there is a high significance between project
leadership and timely project completion of the public construction projects (r = 0.895) (highly correlated) and therefore, if the project
leadership index is high then public construction project are completed on time. Public construction projects with strong project
leadership achieved higher level of performance. However, from the table above, project planning was not strongly correlated with
timely completion while resource allocation was fairly correlated with timely completion
4.7.5. The Regression Model In this study, regression analysis was used to assess the relationship between the variables.
On fitting the multiple linear regression model of the form,
Y = β 0 + β1X1 + β2X2 + β3X3+ β4X4 + Ɛ
Where:
Y -Timely Project Completion
β 0 -The constant
X1 -Project resources X2 -Project leadership X3 -Project monitoring
β1, β2, β3 & β4 - Coefficients
X4 -Project monitoring
Ɛ -Error term
Table 4.17 Coefficients

International Journal of Scientific and Research Publications, Volume 7, Issue 4, April 2017 429 ISSN 2250-3153
www.ijsrp.org
In this model the most significant predictor of whether a project will be completed in time is project monitoring. Further if all
the other variables are kept constant, a unit increase in project monitoring will lead to a 0.12 increase in performance of public
construction projects. A unit increase in project leadership will lead to a 0.025 increase in performance of public construction
projects. However, the performance of public construction projects had a negative relationship with project planning. These results
may imply that performance of public construction projects may be low despite there being a very good project plan. The findings
show that all the variables tested were statistically significant with p-values less than 0.05.
Table 4.18 Validity
The model was found to be valid {f (4, 31) = 62.54, P< 0.05)}, however this model can only predict 90.8% of the variation in
performance index and therefore 9.2% is explained by other factors not explained in this study.
Table 4.19 Significance Level
ANOVA
The significance value is less than 0.05 thus the model is statically significance in predicting how project resource allocation,
project leadership, project planning and project monitoring affect timely project completion.
V. SUMMARY, CONCLUSIONS AND RECOMMENDATIONS
5.1. Introduction
This chapter presents the summary of the findings, conclusions, recommendations and suggestion for further studies. The chapter is
guided by the findings of the preceding chapter and the objectives of the study. The sample population for this study was 32

International Journal of Scientific and Research Publications, Volume 7, Issue 4, April 2017 430 ISSN 2250-3153
www.ijsrp.org
respondents who were actively involved in construction projects in Trans-Nzoia County as, project managers, contractors, suppliers,
users and consultants. The study was set to determine the factors that affect timely completion of public construction projects in
Trans-Nzoia County.
5.2. Summary
The study sampled 32 projects from the following categories; 5 transport and support infrastructure, 9 water/ sanitation projects, 8
housing projects (medical centres, residential, offices) and 10 Education and communication facilities. The result of the study is that
the mean percentage of time elapsed for the sampled projects was 130% and the projects were at an average of 85% of completion.
The average schedule performance index was 0.65 for the sampled projects. This therefore implies that the performance was
inefficient. The data indicated that only 47% of the surveyed projects were complete, 34% of the projects were still ongoing while
19% of the projects had stalled. It is however important to note that most of the major projects were still ongoing and only small
projects like putting culverts were completed on time. 84% of those interviewed were male with only 16% being women. This was
even made worse by the fact that not a single woman was involved as a contractor in the projects that were sampled.
The category of respondents was key project stakeholders comprising 16% of project management, 28% contractors, 3% suppliers,
28% users who included the general public and 16% consultants. These stakeholders were people who had been involved directly or
indirectly in the implementation of the projects identified in the study. Most of the respondents stated their age to be between 21 to 40
years represented by 75% of all the respondents with the mean age being 37 years. This indicates that individuals involved in project
development in the county especially the contractors are relatively young. 9% of the respondents had O’ Level qualifications, 28% had
a college certificates and diplomas, 34% had undergraduate degrees while others represented by 28% had post graduate degrees.
The study shows that 6% of the surveyed projects had time overruns of over 200% while most of the projects (81%) had time overruns
of between 100 and 200%. Only 13 percent of the projects were completed before the projected time. Respondents cited various
factors that led to project delays in projects under their jurisdiction. Most respondents mentioned insufficient funding (46.9%) as a
major hindrance to timely project completion. This was followed closely by mention of lack of public engagements represented by
37.5% as a factor causing delay in project completion. Misappropriation of funds at 34.4% attracted more passionate explanations
together with lack of public engagement. Others were non performance by the contractor, delayed payments and increased scope of
the project. These factors could be adequately addressed at the planning stage and through effective leadership to reduce their effects
on the project before they affect timeliness in project completion.
5.2.1. Project Resource Allocation
69% of the respondents interviewed agreed that adequate resource allocation improves timely project completion but when asked
whether resource allocation to that particular project was adequate the data was split 50-50 for those who believe that it was adequate
and for those that believe it was not. Similarly, all the respondents stated that financial problems and payments problems of completed
work had actually led to project delays; in addition the majority of the respondents (59%) stated that delay was caused by material
procurement. This implies that resource allocation is an essential element in the process of project implementation. However, county
projects are overpriced riddled with rogue contractors, payment of kickbacks to get contracts, cartels positioned around approving
agencies and improper/irregular payments. This leaves the project team with little synergy to complete the projects on time and this is
the reason for delayed projects.
On the improvement methods the majority of the respondents agree that effective resource utilization can improve project
implementation while 69% was neutral when asked whether using new construction technologies like IBS-Industrialize System can
improve project implementation. The results of the study show that project resource allocation has a significant influence on timely
completion of public construction projects. This is despite the fact that about 50% of the projects had adequate resources and yet did
not complete on time.
5.2.2. Project leadership
85% of the respondents agreed when asked whether strong leadership increases the chances of timely project completion. However
when asked to rate the strength of project leadership for that particular project, 10% chose to be neutral while 31% disagreed that the
leadership was strong. This implies that despite project leadership being a very important ingredient in the process of project
implementation what was on the ground was not measuring up to the task. Conversely, 66% of interviewees disagreed to the statement
that restrictions at project site had impacted negatively on project implementation. The majority (84%) of the respondents blame the
failure of project delivery on poor site management, supervision and poor project management. 62.6% agreed to the statement that
clear communication can lead to timely project completion while another 68.8% felt that full utilization of the construction team could
improve project implementation.
When further asked to give their suggestions on project leadership, the respondents observed that if there is a good relationship among
the project stakeholders, timely project completion is more likely. Collective responsibility among project stakeholders and integrity in
finance management was also prominently mentioned with relation to project leadership. The results of the study have established that
project leadership has a significant influence on timely completion of public construction projects with a p-value of 0.04 (p value <
0.05).
5.2.3. Project Planning
56.4% of the respondents agree that the extent of project planning in that particular project that they were involved in was high, 25%
were neutral while 19.2% rated the extent of project planning as being low. Despite that, 87.2% of the respondents agreed that project
planning impacts on timely project completion. Asked to rate the extent to which poor project design affects the project schedule,
International Journal of Scientific and Research Publications, Volume 7, Issue 4, April 2017 431 ISSN 2250-3153
www.ijsrp.org
71.4% rated the effect as high, while 19% as neutral. In addition, 62.6% rated the extent to which change orders affect the project
schedule as being high while 34.2% disagreed. Project planning was generally above average in the sampled projects.
When asked to give their opinions on project planning some respondents observed that good planning leads to effectiveness in project
implementation. Others stated that project planning should be more inclusive to involve all the stakeholders and especially the
community members who are the prime users of the projects in question. The results of the study have established that project
planning has a significant influence on timely completion of public construction projects with a p-value of 0.02 (p value < 0.05).
5.2.4. Project Monitoring
When asked to state whether they consider the extent of project monitoring in the particular project to be high, 62% of the respondents
disagreed. Conversely, 80.8% of the respondents believe that lack of a proper monitoring system was the cause of project delay. On
improvement measures over 81% of the respondents believe that close monitoring of the project progress could improve the schedule
performance of the project. The results of the study show that project monitoring has a significant influence on timely completion of
public construction projects with a p-value of 0.0001 (p value < 0.05). This therefore indicates that lack of proper project monitoring is
one of factors why projects are falling behind schedule.
5.2.5. Timely Project Completion
The study determined that project monitoring and timely project completion were highly correlated (r = 0.942), (P < 0.05). This
indicated that, if project monitoring is high then timely project completion is also high and therefore public construction project with
high project monitoring index are completed on time. The study also found out that, there is a high significance between project
leadership and timely project completion of the public construction projects (r = 0.895) (highly correlated) and therefore, if the project
leadership index is high then public construction project are completed on time. Public construction projects with strong project
leadership achieved higher levels of performance. However, project planning was not strongly correlated with timely completion
while resource allocation was fairly correlated with timely completion. This implies that even if good project planning or resource
allocation was in place this alone could not lead to timely project delivery.
The study further sought to determine how each category of the projects was affected by the four independent variables; the resource
allocation, project leadership, project planning and project monitoring. The study established that transport and infrastructure category
had a resource allocation score of 60% and project planning score of 53% but scored lowly on leadership at 41% and project
monitoring at 34%. The average schedule performance index therefore for the transport and infrastructure category was 56% being the
lowest. The housing projects had a score of 46% on resource allocation, 37% on project leadership, 54% on project planning and 22%
on project monitoring. This therefore means that the housing projects were the least monitored, had the least resource allocation and
the worst project leadership of all the other categories. However they scored better on the schedule performance index at 63%
compared to transport and infrastructure category.
Water and sanitation projects were best monitored with a score of 56% and were also better planned at 69% compared to other
categories. Resource allocation and project leadership scored fairly well in the water and sanitation category of projects. Resource
allocation to education and communication category was best compared to the other categories but had comparatively lower project
monitoring and leadership scores. Nevertheless, the education and communication category had the highest SPI of 111%. The study
carried out an analysis of variance to determine if the project categories differ significantly from each other. Housing projects scored
lowly in the combined averages while water and sanitation scored best in combining the four independent variables; resource
allocation, project leadership, project planning and project monitoring. Based on the p-value the conclusion is that the four
independent variables; the resource allocation, project leadership, project planning and project monitoring differ significantly among
the four project categories.
The study developed a model that can be used to predict the nature of construction projects schedule performance in the county. The
model is 𝑌 = 5.1 + 0.014𝑋1 + 0.025𝑋2 − 0.07𝑋3 + 0.12𝑋4 in this model the most significant predictor of whether a project will
be completed in time is project monitoring. Further if all the other variables are kept constant, a unit increase in project monitoring
will lead to a 0.12 increase in performance of public construction projects. A unit increase in project leadership will lead to 0.025
increases in performance of public construction projects. However, the performance of public construction projects had a negative
relationship with project planning. These results may imply that performance of public construction projects may be low despite there
being a very good project plan. The results show that all the variables tested were statistically significant with p-values less than 0.05.
5.3. Conclusions
The main objectives to be addressed by this study were; a) To examine the role of resource allocation on timely completion of public
construction projects in Trans Nzoia County, b) To find out the role of project leadership on timely completion of public construction
projects in Trans Nzoia County, c) To establish the role of project planning on timely completion of public construction projects in
Trans Nzoia County and d) To determine the effect of project monitoring on timely completion of public construction projects in
Trans Nzoia County.
From the results of the study, the conclusion is that adequate resource allocation improves timely project completion however resource
allocation has not been given the necessary attention it requires from the stakeholders. Effective resource utilization and use of new
construction technologies like IBS-Industrialize System can improve project implementation. County projects are overpriced, riddled
with rogue contractors, payment of kickbacks to get contracts, cartels positioned around approving agencies and improper/irregular
payments. This leaves the project team with little synergy to complete the projects on time and this is the reason for delayed projects.
The results of the study show that although project leadership is an essential element in timely project delivery the people charged
with that responsibility have not shown the required level of performance that could steer project delivery to best practice. Projects

International Journal of Scientific and Research Publications, Volume 7, Issue 4, April 2017 432 ISSN 2250-3153
www.ijsrp.org
lacked public engagements/public consultations yet different views ensure that all issues are taken into consideration before the design
stage of the infrastructure. In addition, public consultations help to avoid delays from unnecessary lawsuits and other individual or
community rights activism during project implementation that may impede project development.
The performance of public construction projects had a negative relationship with project planning. These results imply that
performance of public construction projects may be low despite there being a very good project plan. This confirms the assertion that
Kenyans are good at coming up with good plans but very poor implementation track record. Project planning should be more inclusive
to involve all the stakeholders and especially the community members who are the prime users of the projects in question.
Regarding the fourth objective, there appeared to be a general agreement that poor monitoring was a major cause of project delay.
Close monitoring of the project progress could therefore improve the schedule performance of the project. The most significant
predictor of whether a project will be completed in time is project monitoring according to the model developed by the study. It is
therefore of essence that project monitoring is streamlined in accordance with the needs of the projects to ensure timely and successful
completion of projects.
Timely project completion is fairly better than the national average obtained by studies done by Munano (2012) where of the projects
she sampled, completion time exceeded by a mean of 209.8% and the projects were at an average of 87.54% of completion. Similarly
the minimum percentage elapsed was 91% while the maximum was 481%. The ministry of public works (2012) gave 38.60% as the
average percentage project completion rate for 2005-2011. The results of this study was that the mean percentage of time elapsed for
the sampled projects was 130% and the projects were at an average of 85% of completion, with the minimum percentage elapsed
being 65% and the maximum being 210%. The study can conclude that it is an improved performance going forward. This could be
attributed to the devolution of functions to county government brought about by the constitution of Kenya 2010.
5.4 Recommendations
From the conclusions arrived at, the following three recommendations were made. First, the county government should ensure
adequate resource allocation for all the projects they are undertaking. In addition it should develop and implement avenues for
reporting corruption and be committed towards zero tolerance to corruption. It should also come up with preventive measures and be
alert to detect corruption and seal all loopholes that could lead to embezzlement of public funds. Further they should come up with
corrective initiatives and ensure that corruption remains to its bare minimum. On the same the law should be changed such that the
counties come up with itemized budgets which would require the treasury to send money in respect to that as opposed to present
where all the chunk of money comes and the executive is left with the responsibility of allocating it (money should come after
planning and not vice versa).
Second, the county government should form agencies to deal with project implementation with responsibilities like those of agencies
like KENHA. These agencies will ensure that there is professionalism in project implementation and reduce political interference.
Such agencies will ensure balanced public participation devoid of political interests. They will ensure that project planning is above
board and follow the same to conclusion. Recent infrastructure developments have shown that private development follows the laying
of public infrastructure. Hotels, shops, malls, and estates, followed by schools and churches, will inevitably frank the new
infrastructure. It is therefore important to plan for their impact carefully and professionally. They will also ensure that project
monitoring is streamlined in accordance with the needs of the projects to ensure timely and successful completion.
Third, every citizen has a right to information held by the state or any state organ and this is guaranteed by article 35 of the
constitution. The article requires the state publish and publicize any important information that may affect the nation. It is therefore
incumbent upon the county government to give adequate and factual information to the public about the progress and the expected
impact of all the projects under implementation. Currently, public hearings are a sham while the websites are dormant.
5.5 Areas for Further Research
For further research other project stakeholders should be included in the study to bring out the holistic view as far as project
implementation is concerned. These stakeholders should be provided with a platform that ensures that they provide adequate, truthful
and useful information that could inform policy formulation to ensure smooth implementation of public construction projects.
VI ACKNOWLEDGMENT
I wish to acknowledge the JKUAT Kitale campus fraternity who spared nothing in supporting me in my studies. Immense appreciation
goes to Dr. Calvin Otieno, the deputy director and also one of my supervisors for without his help and effective supervision I would
not have made it. Dr. Elizabeth’s guidance and correction was extremely vital. I thank my fiancée Ann for her understanding, my
family for their prayers and support, my classmates for the many times we stood together and everyone who wished me well and
played one role or another in assisting me in this process. Finally, I acknowledge the Almighty God who has been with me through the
whole process.
REFERENCES
[1] Aibinu, A. & Jagboro G. The Effects of Construction Delays on Project Delivery in Nigerian Construction Industry. International Journal of Project Management, Vol. 20, pp. 2002 593–9.
[2] Ajmal, S., Farooq, M. Z., Sajid, N., & Awan, S. Role of Leadership in Change Management Process. Abasyn University Journal of Social Sciences,5(2) 2012.

International Journal of Scientific and Research Publications, Volume 7, Issue 4, April 2017 433 ISSN 2250-3153
www.ijsrp.org
[3] Al- Carlos, E. Y. S. ,"When do Megaprojects Start and Finish? Redefining Project Lead Time for Megaproject success", International Journal of Managing Projects in Business, Vol. 7 Iss 4 pp. 2014 624 - 637
[4] Alberto, T. N., "Earned Value-Based Performance Monitoring of Facility Construction Projects", Journal of Facilities Management, Vol. 11 Iss 1 2013 pp. 69 – 80.
[5] Al-Khahil, M., & Al-Ghafly, M. Causes of Delay of Projects in Saudi Arabia. Construction Management and Economics, 1999, 647-55.
[6] Al-Mashari, M., & Zairi, M. Information and business process equality: the case of SAP R/3 implementation. The Electronic Journal of Information Systems in Developing Countries 2000.
[7] Al-Momani, A. H. Construction Delay: A Quantitative Analysis International Journal of Project Management, 18(1), 51–59.Business, Vol. 7 Iss 4, 2000, pp. 624 - 637
[8] Alvarado, C.M., Silverman, R.P. & Wilson, D.S. “Assessing the Performance Of Construction Projects: Implementing Earned Value Management at the General Services Administration”, Journal of Facilities Management, Vol. 3 No. 1, 2004, pp. 92-105.
[9] Anantatmula, V., “Project manager leadership role in improving project performance”, Engineering Management Journal, Vol. 22
No. 1, 2010, pp. 13‐22
[10] Anders R. and Par A., Organizational Slack and Knowledge Creation in Product Development Projects: The Role of Project Deliverables, 2010.
[11] Artkinson, R. (1999). Project management: cost,time, and quality, two best guesses and a phenomenon, its time to accept other succfess criteria. Intrenational Journal of Project Management, 17, 337-342.
[12] Ballard, G., Asbjørn R., Iris T. & Per M. S. (2014),"Understanding project success through analysis of project management approach", International Journal of Managing Projects in Business, Vol. 7 Iss 4 pp. 638-660 http://dx.doi.org/10.1108/IJMPB-09-2013-0048
[13] Balogun, J. and Hope Hailey, V. (2004) Exploring Strategic Change, 2nd ed, London: Prentice Hall.
[14] Bass, B. M. (1991). Bass and Stogdill's handbook of leadership: Theory, research and managerial applications. New York: The Free Press.
[15] Best, J.W and Khan, J. V. (2009). Research in Education, (Tenth Edition); New Delhi; PHI Leaning Private.
[16] Boleslaw Rok, (2009) Ethical context of the participative leadership model: taking people into account, Corporate Governance: The international journal of business in society, Vol. 9 Iss: 4, pp.461 – 472
[17] Bowerman, J. K. (2003) Leadership development through action learning: an executive monograph, Leadership in Health Services, Vol. 16 Iss: 4, pp.6 - 14
[18] Boykoff, J. (2012). What is the Real Price of the London Olympics? The Guardian, London.
[19] Bromilow, F. (1974). Measurement and Scheduling of Construction time and cost performance in the Building Industry . The Chartered Builder ,
10(9), 57.
[20] Chandra, P. (2008). Projects planning, Analysis selection , financing implementation review 6th edition. New Delhi: Macraw Hill Publishing Company Ltd.
[21] Cho, C. and Gibson Jr., G. (2001). ”Building Project Scope Definition Using Project Definition Rating Index.” J. Archit. Eng., 7(4), 115–125.
[22] Chua, D. and Godinot, M. (2006). ”Use of a WBS Matrix to Improve Interface Management in Projects.” J. Constr. Eng. Manage., 132(1), 67–79.
[23] Conchuir, D. (2011). Overview of the PMBOK Guide. Berlin: Springer-Verlag Heidelberg.
[24] Cooke-Davies, T.J. (2002). The “Real” success Factors on Projects. International journal of Project Management Vol 20: 185-190
[25] Cooper, D.R. & Schindler P.S. (2008). Business Research Methods. (10th ed). Singapore: McGraw-Hill.
[26] Deloitte (2016). A 360° View Africa Construction Trends Report 2015. Deloitte Africa ICP
[27] Dissanayaka, S., & Kumaraswamy, M. (1999). Comparing contributors to time & cost performance in building projects. Building and Environment ,34(1), 31-42.
[28] Dissanayaka, S., & Kumaraswamy, M. (1999). Evaluation of factors affecting time and cost performance in Hong Kong building projects. Engineering, Construction and Architectural Management, 6(3):287-298.
[29] F. Brian Talbot, (1982): Resource-Constrained Project Scheduling with Time- Resource trade-offs: The non-pre-emptive Case
[30] Feng, C., Liu, L., and Burns, S. (2000). ”Stochastic Construction Time-Cost rade-Off Analysis.” J. Comput. Civ. Eng., 14(2), 117–126.
[31] Frimpong, Y. Oluwoye J. & Crawford L. (2003). Causes of Delay and Cost Overruns in Construction of Groundwater Projects in Developing Countries; Ghana as a Case Study. International Journal of Project Management.
[32] Gall & Borg (2007). An educational research and introduction 8th edition, Pearson International Edition Printed in the USA
[33] Gichunge, H. (2000). Risk management in the building industry in Kenya, an Analysis of time and cost risks . Unpublished PHD Thesis.
[34] Gündüz, M., Nielsen Y, Özdemir M. (2013). Quantification of Delay Factors Using the Relative Importance Index Method for Construction Projects in Turkey. Journal of Management in Engineering, 133–139.
[35] Gwaya, A. O., Sylvester M. M.& Walter O. O., (2014). Development of a Benchmarking Model for Construction Projects in Kenya. International Journal of Soft Computing and Engineering (IJSCE) ISSN: 2231-2307, Volume-4 Issue-5
[36] Ifte, C. M. (2002). Relationship between construction time and project cost of health sector construction in Bangladesh. Blacksburg, Virginia: Virginia Polytehnic Institute and State University.
[37] Jagboro, D., & Ogunsemi, G. (2006). Time-cost model for Building projects in Nigeria. Construction Management and Economics , 253-258.
[38] Kikwasi, G. J. (2012). „Causes and Effects of Delays and Disruptions in Construction Projects in Tanzania‟, Australasian Journal of Construction Economics and, Conference Series, 1 (2) 52-59
[39] Kim, K. and Paulson, B., Jr. (2003). ”Agent-Based Compensatory Negotiation Methodology to Facilitate Distributed Coordination of Project Schedule Changes.” J. Comput. Civ. Eng., 17(1), 10–18.
[40] Kothari, C. R. (2004). Research Methodology; Methods & Techniques. New Delhi, India: New Age International Publishers.
[41] Leed, P. D.& Ormrod,J.E. (2005). Practical Research-Planning and design.USA: Pearson Prentice.
[42] Levy, J. & Dvir, D. (1997). Mapping the Dimensions of project success. project management journal , 8 (2) 5-13.
[43] Lewis, P., Saunder, M., & Thornhill. (2007). Research Methods for Business Students. London: Pearson Education Limited.
[44] Lim, C. S., & Mohammed, M. Z. (1999). Criteria of project success: an explaratory reexamination. International Journal of project management, 17, 243-248.
[45] Lim, C.S. and Mohamed, Z. (1999), “Criteria of project success: an exploratory re‐examination”, International Journal of Project Management, Vol. 17 No. 4, pp. 243‐8.

International Journal of Scientific and Research Publications, Volume 7, Issue 4, April 2017 434 ISSN 2250-3153
www.ijsrp.org
[46] Love, P., Skitmore, M., & Earl, G. (1998). Selecting a Suitable Procurement Method for a Building Project. Construction Management and Economics, 16:221-233.
[47] Memon, A.H., Roslan N. &Zainun N.Y. (2014). Improving Time Performance in Construction Projects: Perspective of Contractor. J Am Sci;
10(8):46-50].
[48] Menches, Cindy L. & Awad S. H., (2006). Quantitative Measurement of Successful Performance from the Project Manager‟s Perspective. Journal of Construction Engineering and Management
[49] Meredith, J.R. and Mantel, S.J. (2006). Project Management – A Managerial Approach, 6th ed., Wiley, New York, NY.
[50] MOPW. (2009). A report on causes of delay for stalled projects. Nairobi: Chief architect.
[51] MOPW. (2012). Annual works programme. Nairobi: Chief Architect.
[52] Morin, P. & Valerie L., (2013). Project Leadership Influences Resistance to Change: The Case of the Canadian Public Service. Project Management Journal.
[53] Msafiri, A. S., (2015). An Investigation into Factors Causing Delays in Road Construction Projects in Kenya. American Journal of Civil Engineering. Vol. 3, No. 3, pp. 51-63.
[54] Mugenda, O. M., & Mugenda, A.G. (2003). Research Methods. Qualitative and Quantitative Approach. Nairobi: Acts Press.
[55] Müller, K. J., (2012), "Critical Success Factors in Projects", International Journal of Managing Projects in Business, Vol. 5 Iss 4 pp. 757- 775
[56] Müller, R. and Turner, J. R. (2010). “Leadership Competency Profiles of Successful Project Managers”, International Journal of Project Management, Vol. 28 No. 5, pp. 437-448.
[57] Munano, A. N. (2012).Preconstruction Monitoring: Exploring The Factors That Influence Timeliness of Project Completion for Public Sector s in Kenya.Unpublished MSC Thesis.
[58] Muriungi, A. K., (2011). Factors Affecting the Performance of Non- Governmental Organisations' Projects in Kenya; A Case of Marsabit District. Unpublished MBA Research Project.
[59] Mutema, J. K., & Muturi, W.M. (2013). Factors Influencing Risk Management in Construction Projects in the Petroleum Industry in Kenya. International Press.
[60] Ng, S. M. (2001). The predictive ability of Bromilow's time-cost model. Construction Management and Economics , 165-73.
[61] Ogunsemi, D. R. & G. O. Jagboro (2006). Time‐cost model for projects in Nigeria, Construction Management and Economics, 24:3, 253-258.
[62] Phil Nixon, Megan H., David P., (2012), "Leadership performance is significant to project success or failure: a critical analysis", International Journal of Productivity and Performance Management, Vol. 61 Iss: 2, pp.204 - 216
[63] Pinto, J. K. and Slevin, D.P. (1988a), “Project success: definition and measurement techniques”, Project Management Journal, Vol. 19 No. 1, pp. 67‐71.
[64] Pinto, J. K. and Slevin, D.P. (1988b), “Critical success factors in effective project implementation”, in Cleland, D.I. and King, W.R. (Eds),
[65] Project Management Handbook, 2nd ed., Van Nostrand Reinhold, New York, NY, pp. 479‐512.
[66] Project Management Institute (2010).Project Management Body of Knowlege; A Guide to Project Management Handbook.
[67] Republic of Kenya (2007).Kenya Vision 2030. Nairobi: Government Printers. Sawega, J. W., (2015). Effect of Change Management Capacity on the Delivery of Quality Education in Public Technical and Vocational
[68] Institutions in Kenya. Unpublished PhD thesis, Nairobi Shenhar, A. J., & Levy, O. (1997). Mapping the dimensions of project success.
Project management journal, 5, 5-13.
[69] Wolf, G. L. & Hauck W. C., PERT/CPM: A Tool for Managing
Projects. Industrial Management, Volume 27, no 1 1985.
[70] Yang, J., Mei-Yi C. & Kuei-Mei H., An Empirical Study of Schedule Delay Causes Based on Taiwan‟s Litigation Cases. Project Management Journal 2013.
AUTHORS
First Author – Silas Harun Murithi, MSC Project management, Jomo Kenyatta university of agriculture and technology and
Second Author – Dr. Elizabeth Nabuswa Makokha (PhD
Third Author – Dr. Calvin Otieno (PhD

International Journal of Scientific and Research Publications, Volume 7, Issue 4, April 2017 459 ISSN 2250-3153
www.ijsrp.org
Ratio Estimators in two Stage Sampling Using Auxiliary Information
A.K.P.C. Swain *, S. S. Mishra **
* Former Professor of Statistics Utkal University, Bhubaneswar 751004, Odisha, India ** Lecturer in Statistics,Salipur( Autonomous) College, Salipur, Cuttack, Odisha, India.
Abstract- In this paper certain ratio estimators in two-stage sampling set up with unequal first stage units, using information on two auxiliary variables (x and z) are considered and their efficiencies are compared with estimator without using second auxiliary variables z. Index Terms- Ratio Estimator, auxiliary information, two stage sampling AMS Classification: 62D05.
I. INTRODUCTION n sample surveys using multi-stage sampling the survey practitioner comes across more than one auxiliary variable either positively or negatively correlated with main variable (y) under study at different stages. Under these circumstances we consider in the
following sections certain estimates of the population mean of the study variable (y) in two-stage sampling setup with unequal first stage units, using information on two auxiliary variables (x and z) which may be available at the first stage or at the second stage or at both the stages. In the following sections we make use of first stage information on second auxiliary variable z to improve estimators formed with the help of first stage or second stage information at both the stage on the main auxiliary variable x. Further, z may be either positively or negatively correlated with x.
II. SAMPLING METHOD, DEFINITIONS AND NOTATIONS Consider a finite population U partitioned into N first stage units (fsu) denoted by U1, U2, …,UN. Let Mi be the number of
second stage units in Ui (i = 1, 2, …, N). Define
N
ii 1
M M=
= ∑and
N
ii 1
1M MN =
= ∑. Let ij ijy , x
and ijz denoted values of the study
variable y and the auxiliary variable x, z respectively for the jthssu of Ui, (j = 1, 2, …, Mi, i = 1, 2, …, N).
Define
i iM M
i ij i ijj 1 j 1i i
1 1Y y , X x ,M M= =
= =∑ ∑and
iM
i ijj 1i
1Z zM =
= ∑( i = 1, 2, …, N)
The population mean of y, x, z are respectively
N
i ii 1
1Y u YN =
= ∑
N
i ii 1
1X u XN =
= ∑
N
i ii 1
1Z u Z ,N =
= ∑ where
ii
MuM
=
Further, define
2
1 2 1 2
Y Y YR , R , R RX Z X Z
= = = and
ii
i
YRX
= (i = 1, 2, …, N)
N2 2
by i ii 1
1S (u Y Y)N 1 =
′ = −−∑
N2 2
bx i ii 1
1S (u X X)N 1 =
′ = −−∑
I

International Journal of Scientific and Research Publications, Volume 7, Issue 4, April 2017 460 ISSN 2250-3153
www.ijsrp.org
N2 2
bz i ii 1
1S (u Z Z)N 1 =
′ = −−∑
( )
N
bxy i i i ii 1
1S (u Y Y) u X XN 1 =
′ = − −−∑
( )( )
N
bxz i i i ii 1
1S u X X u Z ZN 1 =
′ = − −−∑
( )( )
N
byz i i i ii 1
1S u Y Y u Z ZN 1 =
′ = − −−∑
( )iM 22
iy ij ij 1i
1S y YM 1 =
= −−∑
i = 1, 2, …,N.
( )iM 22
ix ij ij 1i
1S x XM 1 =
= −−∑
i = 1, 2, …,N.
( )( )iM
ixy ij i ij ij 1i
1S x X y YM 1 =
= − −−∑
i = 1, 2, …,N. Define,
im
i ijj 1i
1y ym =
= ∑,
im
i ijj 1i
1x xm =
= ∑,
im
i ijj 1i
1z zm =
= ∑
n
i ii 1
1y u yn =
= ∑,
n
i ii 1
1x u xn =
= ∑,
n
i ii 1
1z u zn =
= ∑
( )
n 22by i i
i 1
1s u y yn 1 =
′ = −−∑
, ( )
n 22bx i i
i 1
1s u x xn 1 =
′ = −−∑
, ( )
n 22bz i i
i 1
1s u z zn 1 =
′ = −−∑
( )( )
n
bxy i ii i ii 1
1s u y y u x xn 1 =
′ = − −−∑
, ( )( )
n
bxz i i i iii 1
1s u x x u z zn 1 =
′ = − −−∑
( )( )
n
byz i i i iii 1
1s u y y u z zn 1 =
′ = − −−∑
( )im 22
iy ij ij 1i
1s y ym 1 =
= −−∑
, ( )im 22
ix ij ij 1i
1s x xm 1 =
= −−∑
( )( )im 2
ixy ij i ij ij 1i
1s y y x xm 1 =
= − −−∑
, (i = 1,2, …, n)
bxy ixybxy ixy
by bx iy ix
S S, ,
S S S S′
ρ = ρ =′ ′
(i = 1,2, …, N).
byz bxzbyz bxz
by bz bx bz
S S,S S S S′ ′
ρ = ρ =′ ′ ′ ′
bybx bzbx by bz
SS SC , C , CX Y Z
′′ ′= = =

International Journal of Scientific and Research Publications, Volume 7, Issue 4, April 2017 461 ISSN 2250-3153
www.ijsrp.org
iyix izix iy iz
i i i
SS SC , C , C ,X Y Z
= = = (i = 1,2, …, N).
1. Proposed Ratio Estimators Several ratio estimators using auxiliary variable x and first stage information on second auxiliary variable z may be formulated as follows:
(i)
n n
i i i ii 1 i 1
1 n
i ii 1
1 1u y u Zn nT .X.1 Zu xn
= =
=
′ =
∑ ∑
∑
(ii)
n
i ii 1
1 n n
i i i ii 1 i 1
1 u y ZnT .X.1 1u x u Zn n
=
= =
′′=
∑
∑ ∑
(iii)
n
i ini i 1
2 i ii 1 i
1 u Z1 y nT u X .n x Z
=
=
′ =
∑∑
(iv)
ni
2 i i ni 1 i
i ii 1
1 y ZT u X 1n x u Zn
=
=
′′=
∑∑
(v)
n n
i i i ii 1 i 1
3 n
i ii 1
1 1u y u Zn nT .X.1 Zu Xn
= −
=
′ =
∑ ∑
∑
(vi)
n
i ii 1
3 n n
i i i ii 1 i 1
1 u y ZnT .X1 1u X u Zn n
=
= −
′′=
∑
∑ ∑
(vii)
n nii i i ii 1 i i 1
4 n
i ii 1
1 y 1u X u Zn x nT X1 Zu Xn
= =
=
′ =
∑ ∑
∑
(viii)
ni
i ii 1 i
4 n n
i i i ii 1 i 1
1 yu XZn xT X1 1u X u Z
n n
=
= =
′′=
∑
∑ ∑
III. BIASAND MEAN SQUARE ERRORS OF ESTIMATORS To first order of approximations the biases and mean square errors of estimators are given below

International Journal of Scientific and Research Publications, Volume 7, Issue 4, April 2017 462 ISSN 2250-3153
www.ijsrp.org
( )2
bxy byzbx bxz1 2
S SS S1 1B T Yn N X Y.X XZ YZ
′ ′′ ′ ′ = − − − +
2Nixy2 ix
i 2i 1 i i
S1 1 1 SY. unN m M X Y.X=
+ − −
∑
2 2 2 2 2
1 by 2 bz 1 bx 2 byz 1 bxy 1 2 bxz
1 1MSE(T ) S R S R S 2R S 2R S 2R R Sn N
′ ′ ′ ′ ′ ′ ′ = − + + + − −
N2 2 2 2i iy 1 ix 1 ixy
i 1 i i
1 1 1u S R S 2R SnN m M=
+ − + −
∑
( )2
bxy byzbx bxz1 2
S SS S1 1B T Yn N X YX YZ XZ
′ ′′ ′ ′′ = − − − +
2Nixy2 ix
i 2i 1 i i
S1 1 1 SY. unN m M X Y.X=
+ − −
∑
2 2 2 2 2
1 by 2 bz 1 bx 2 byz 1 bxy 1 2 bxz
1 1MSET ) S R S R S 2R S 2R S 2R R Sn N
′′ ′ ′ ′ ′ ′ ′ = − + + − − +
N2 2 2 2i iy 1 ix 1 ixy
i 1 i i
1 1 1u S R S 2R SnN m M=
+ − + −
∑
( ) 2 2 22 by 2 bz 2 byz
1 1MSE T S R S 2R Sn N
′ ′ ′ ′ = − + +
N2 2 2 2i iy 1i ix 1i ixy
i 1 i i
1 1 1u S R S 2R SnN m M=
+ − + −
∑
2 2 2
2 by 2 bz 2 byz
1 1MSE(T ) S R S 2R Sn N
′′ ′ ′ ′ = − + −
N2 2 2 2i iy 1i ix 1i ixy
i 1 i i
1 1 1u S R S 2R SnN m M=
+ − + −
∑
( )2
bxy byzbx bxz3 2
S SS S1 1B T Yn N X Y.X X.Z Y.Z
′ ′′ ′ ′ = − − − +
( ) 2 2 2 2 23 by 2 bz 1 bx 2 byz 1 2 bxz 1 bxy
1 1MSE T S R S R S 2R S 2R R S 2R Sn N
′ ′ ′ ′ ′ ′ ′ = − + + + − −
N2 2i iy
i 1 i i
1 1 1u SnN m M=
+ −
∑
( )2
bxy byzbx bxz3 2
S SS S1 1B T Yn N X Y.X YZ X.Z
′ ′′ ′ ′′ = − − − +
( ) 2 2 2 2 23 by 1 bx 2 bz 1 bxy 2 byz 1 2 bxz
1 1MSE T S R S R S 2R S 2R S 2R R Sn N
′′ ′ ′ ′ ′ ′ ′ = − + + − − +

International Journal of Scientific and Research Publications, Volume 7, Issue 4, April 2017 463 ISSN 2250-3153
www.ijsrp.org
N2 2i iy
i 1 i i
1 1 1u SnN m M=
+ −
∑
( )2
bxy byzbx bxz4 2
S SS S1 1B T Yn N X Y.X X.Z Y.Z
′ ′′ ′ ′ = − − − +
( ) 2 2 2 2 24 by 2 bz 1 bx 2 byz 1 bxy 1 2 bxz
1 1MSE T S R S R S 2R S 2R S 2R R Sn N
′ ′ ′ ′ ′ ′ ′ = − + + + − −
N2 2 2 2i iy i1 ix 1i ixy
i 1 i i
1 1 1u S R S 2R SnN m M=
+ − + −
∑
( )2
bxy byzbx bxz4 2
S SS S1 1B T Yn N X Y.X Y.Z X.Z
′ ′′ ′ ′′ = − − − +
( ) 2 2 2 2 24 by 1 bx 2 bz 1 bxy 2 byz 1 2 bxz
1 1MSE T S R S R S 2R S 2R S 2R R Sn N
′′ ′ ′ ′ ′ ′ ′ = − + + − − +
N2 2 2 2i iy 1i ix 1i ixy
i 1 i i
1 1 1u S R S 2R SnN m M=
+ − + −
∑
IV. COMPARISONOF EFFICIENCIES
(i) Comparison of 1T′ and 2T′′ with estimator without using second auxiliary variable z.
MSE ( 1T′ ) – MSE(T1)
2 22
bz byz bxz2
1 1 Y Y YS 2S 2Sn N Z Z Z X
′ ′ ′= − + −
1 1MSE(T ) MSE(T )′′ −
2 22
bz byz bxz2
1 1 Y Y YS 2S 2Sn N Z Z Z X
′ ′ ′= − − +
Thus 1T′ will be more efficient than T1 if
bz byz by bxz bxC 2 C 2 C+ ρ < ρ
and further 1T′′ will be more efficient than T1 is
bz bxz bx byz byC 2 C 2 C+ ρ < ρ
(ii) Comparison of 2T′ and 2T′′ with estimator without using second auxiliary variable z.
22
2 2 bz byz2
1 1 Y YMSE(T ) MSE(T ) S . 2Sn N Z Z
′′ ′ ′− = − +
22
2 2 bz byz2
1 1 Y YMSE(T ) MSE(T ) S . 2Sn N Z Z
′′ ′ ′− = − −
Thus 2T′ will be more efficient than 2T if

International Journal of Scientific and Research Publications, Volume 7, Issue 4, April 2017 464 ISSN 2250-3153
www.ijsrp.org
bzbyz
by
C12 C
ρ <
Further, 2T′′ will be more efficient than T2 is
bzbyz
by
C12 C
ρ <
(iii) Comparison of 3T′ and 3T′′ with estimators without using second auxiliary variable z.
2 22
3 3 bz byz bxz2
1 1 Y Y YMSE(T ) MSE(T ) S . 2S . 2S .n N Z Z Z X
′ ′ ′ ′− = − + −
2 22
3 3 bz byz bxz2
1 1 Y Y YMSE(T ) MSE(T ) S . 2S . 2S .n N Z Z Z X
′′ ′ ′ ′− = − − +
Thus 3T′ will be more efficient than T3 is
bz byz by bxz bxC 2 C 2 C+ ρ < ρ
and further 3T′′ will be more efficient than T3 if
bz bxz bx byz byC 2 C 2 C+ ρ < ρ
(iv) Comparison of 4T′ and 4T′′ with estimators without using second auxiliary variable z.
4 4MSE(T ) MSE(T )′ −
2 22
bz byz bxz2
1 1 Y Y YS . 2S . 2S .n N Z Z Z X
′ ′ ′= − + −
4 4MSE(T ) MSE(T )′′ −
2 22
bz byz bxz2
1 1 Y Y YS . 2S . 2S .n N Z Z Z X
′ ′ ′= − − +
Thus 4T′ will be more efficient than T4 is
bz byz by bxz bxC 2 C 2 C+ ρ < ρ
and further 4T′′ will be more efficient than T4 is
bz bxz bx byz byC 2 C 2 C+ ρ < ρ
V. NUMERICAL STUDY This population is MU 284 population available in Sarndal, Swensson and Wretman (1992, P- 660, Appendix –C). It consists of 284 Municipalities (ssu) divided into 15 clusters (fsu) with three variables i.e. Revenues from the 1985 municipal taxation as y, 1975 population as x and 1985 population as z. For comparison of mean square error of T0, T1, T2, T3, T4,
T5,. 1 1 2 2 3 3 4 4T , T , T , T , T , T , T , T′ ′′ ′ ′′ ′ ′′ ′ ′′, 1Y , CY we consider two-stage sampling with n = 5 and mi (i = 1, 2, … 15) are assumed to be
2, 2, 2, 2, 2, 2, 3, 2, 3, 2, 2, 3, 2, 3, 2.
Table 1: Comparison of Mean Square Errors (MSE)
Estimator MSE Estimator MSE Estimator MSE

International Journal of Scientific and Research Publications, Volume 7, Issue 4, April 2017 465 ISSN 2250-3153
www.ijsrp.org
T0 35564.168 1T′
12139.82 1T′′
8124.30
T1 548.375 2T′
45093.81 2T′′
438.25
T2 13182.34 3T′
34302.88 3T′′
30287.36
T3 22711.44 4T′
11921.06 4T′′
7905.54
T4 329.61
Remarks From the above numerical illustration, (i) MSE(T4) < MSE(T1) < MSE(T2) < MSE(T3) < MSE(T0) (ii) MSE(T'4) < MSE(T'1) < MSE(T'3) < MSE(T'2) (iii) MSE(T''2) < MSE(T''4) < MSE(T''1) < MSE(T''3) Also, T4 is more efficient than all other estimators under comparison. However, the results obtained through numerical illustration is not conclusive because of limitations of data. Moreover, the efficiency of an estimator using second auxiliary variable z at the primary stage depends on the correlation structure between x and z at the primary stage.
VI. SUMMARY AND CONCLUSION Using first stage information on second auxiliary variable z, a number of ratio type estimators in two-stage sampling have been suggested and it is seen that the proposed estimators are more efficient than the competitive estimators using auxiliary information on x only under certain sufficient conditions.
REFERENCES [1] Chand, L. (1975). Some ratio type estimators based on two or more auxiliary variables. Ph. D thesis submitted to IOWA State University, Ames, IOWA, USA. [2] Sukhatme, P.V. and Sukhatme, B.V. (1970). Sampling theory of surveys with applications. second edition, Asia Publishing House, Bombay, India. [3] Swain, A.K.P.C. (1970). A note on the use of multiple auxiliary variables in sample surveys. Trabajos de Estadistica, 21, 135-141. [4] Murthy, M.N. (1967). Sampling Theory and Methods. Statistical Publishing Society, Calcutta, India. [5] Srivastava, S.K., (1967). An estimator using auxiliary information in sample surveys, cal. Stat. Assoc. Bull., 16, 121-132. [6] Panda, P. (1998). Some strategies in two-stage sampling using auxiliary information. Unpublished Ph.D. Dissertation, Utkal University, Odisha, India.
AUTHORS First Author – A.K.P.C. Swain, Former Professor of Statistics, Utkal University, Bhubaneswar 751004, Odisha, India. Second Author – S. S. Mishra, Lecturer in Statistics,Salipur( Autonomous) College, Salipur, Cuttack, Odisha, India. E-mail: [email protected]

International Journal of Scientific and Research Publications, Volume 7, Issue 4, April 2017 466 ISSN 2250-3153
www.ijsrp.org
Medical Doctors’ Knowledge about Patients’ Ionizing Radiation Exposure Dose and Its Associated Risks at Jimma University Specialized Hospital, South West
Ethiopia MesfinZewdu *, Elias Kadir **, MelkamuBerhane ***
* MSc. Medical Physicist Jimma University Radiology Department
** MD. Radiologist, Jimma University Radiology Department ** MD. Pediatrician, Jimma University Pediatric & child health Department
Abstract- In the present day scenario, ionizing radiation is widely used to diagnose many diseases both in developed and developing world. Excessive use of ionizing radiation has an increased risk of fatal cancer. It is believed that the awareness of medical doctors about hazards of ionizing radiation and radiation dose values is one of the first step in protecting patients from radiation exposure. The aim of this study was to assess medical doctors’ knowledge about patients’ ionizing radiation exposure dose and its associated risks at Jimma University Specialized Hospital.Descriptive cross- sectional study was conducted among 110 physicians working in Jimma University Specialized Hospital.A structured, self-administered and pre-tested questionnaire was used to collect data from sampled population. A 122 self-administered questionnaire was circulated among physician randomly selected from the different categories of physicians; out of which 110 questionnaires were completed and used in this study giving a response rate of 90%. Almost one fourth of the study participants overestimated the average amount of radiation absorbed by a patient during a single chest X-ray examination. Among the respondents, 26 (23.6%) were incorrect in their assumption that abdominal ultrasound examinations involved theuse of ionizing radiation, whereas 11 (10%) mistakenly thought that an abdominal MRIused ionizing radiation. Findings from this study show thatknowledge of doctors about radiation exposure and risks associated with diagnostic imaging modalities is limited.The results indicate a need for further education in the field in order to minimize unnecessary exposure to patients. A suggested target of better education regarding the risks of ionizing radiation associated with imaging modalities is needed to reach all practicing Doctors. Index Terms- Physician Knowledge, Radiation Dose, Radiation Protection, Ethiopia.
I. INTRODUCTION onizing radiation has been proven to have adverse biological effects on living organisms. These adverse effects vary
according to dose and duration of exposure [1]. Previous studies in United Kingdom show that 100-250 death per year occurred
because of harmful effects of medical radiation exposure [2]. Similarly, in USA, National Council on Radiation Protection and Measurement had reported that medical x-rays and nuclear medicine account for only 15% of all radiation exposures[3]. As reported by study in UK, CT has been shown to account for merely 6% of diagnostic procedures, yet represented 47% of the entire radiation dose received by patients [4]. A published study USA in 2002 reported that CT may account for only 15% of the procedures performed in a radiology department and it is responsible for up to 75% of the medically administered radiation dose to the population [5]. Another study in Norway show that, CT examination contribute 59% for the collective medical radiation dose to the population [6]. Furthermore, the number of referrals for paediatric CT studies has increased exponentially, raising substantial concerns regarding cancer risk in this highly radiosensitive population [7]. Not surprisingly, concerns are growing over the risks associated with these high levels of exposure, particularly the potential increased lifetime risk of cancer [8]. According to the recommendationby the European Council Eurotom directive of 1997,it is imperative that medical professionals are aware of the radiation exposures associated with diagnostic imaging investigations including CT [9]. Patients coming for radiological investigations are being referred by the referring doctors from various clinics, and study did however, show that there is lack of adequate knowledge of radiation among doctors concerning radiation doses received by patients when they undergo such radiological investigations. More so, it has been noted that most of the doctors are submitting their patients to a radiation dose that is 16 times larger than they thought it was and it has been shown that the average mean dose of irradiation is six times the quantity estimated by the doctors [10-12]. Therefore, based on the researchers’ knowledge the situation in these centers might not be different from what is happening in the study locality, and it was the trigger of this study. There is shortage of literature regarding the level of doctor’s knowledge on radiation received by patients during radiological examinations in developing countries. In Ethiopia, there is no documented literature on knowledge of physician about radiation dose and its risk to the best of our knowledge. The aim of this study was to assess medical doctors’ knowledge
I

International Journal of Scientific and Research Publications, Volume 7, Issue 4, April 2017 467 ISSN 2250-3153
www.ijsrp.org
about patients’ ionizing radiation exposure dose and its associated risks at Jimma University specialized hospital (JUSH).
II. MATERIALS AND METHODS Study design and setting Descriptive cross- sectional was conducted among physicians working in JUSH. The target population comprises all non-radiologist physicians (GP, medical interns, residents and different specialist physicians) working in all departments and wards during the study period Sample size and sampling Technique Systematic random sampling method was employed taking the physician in each department as a study unit. Accordingly, 110 physicians was sampled who was on duty during data collection from all departments and wards. Data Collection procedure Structured, standardized and self-administered questionnaires was designed and used by reviewing previous similar literatures [13, 14].The questionnaires was pre-tested at the study place on 15% of the respondents prior to the actual data collection to ensure quality, clarity, understandability and completeness of the data. Depending on the result of pre-test, correction and modification was made on the questionnaires before actual data collection on the study population was started. Various variables like socio-demographic data, field of specialty and specific questions to determine knowledge of radiation exposure, the dose and risks of various radiologic procedures to which a patient is exposed during various radiologic investigative modalities were included in the questionnaire. Data Analysis Procedure Obtained data was checked for error and then data entry was done using Epi Info version 3.5.2. The entered data was cleaned and analyzed by using SPSS version 20.0 software. Distribution of variables was assessed using descriptive statistics.
III. RESULT AND DISCUSSION Respondent demographics & Practice characteristics:
Table 1-Qualification distribution of respondents, in JUSH,2016.
Qualification Frequency Percent Intern 37 33.6 GP 14 12.7 Resident 43 39.1 Specialized 16 14.5 Total 110 100.0
Among the 122 questionnaires distributed 110 were filled andreturned giving a response rate of 90%.The age of the respondents ranged from 25 to 52years. Among the respondents 25 were female & 85 male. The responding doctors included 16 specialized, 43 residents, 37 medical interns & 14 GPs (Table1).
Table 2.Distribution of study participants according to descriptive features, JUSH, 20016
Frequency Percent Gender Male 85 77.3 Female 25 22.7 Year of service Intern 37 33.6 <10 years 67 60.9 >10 years 23 20.9 Specialty Internal Medicine 4 3.6 Surgery 3 2.7 Gynecology/Obstetrics 5 4.5 Pediatrics 4 4.5 No specialty 94 85.5 Total 110 100.0
The number of years in practice ranged from one to fifteen, with an average time in practice of 7.8 years. Greater than half of respondents (60.9%) practicing less than ten years. Concerning the specialty of the respondents 4 were from internal medicine, 3 from Surgery, 5 from Gynecology/Obstetrics, 4 from Pediatrics, & 51 had no Specialty (i.e. Interns & GPs) (Table 2). Knowledge of radiation exposure Table-3: Knowledge of respondents about the radiation dose
in a single Chest X-Ray, JUSH 2016
Absorbed Dose (mSv)
Frequency Percent
0.2mSv 20 18.2 0.02mSv 13 11.8 2mSv 18 16.4 20mSv 11 10.0 Do not know 48 43.6 Total 110 100.0
mSv-miliSeviert Knowledge of the radiation dose in a chest x-ray was given in (table 3).Less than fifteen percent 13 (11.8%) of respondents accurately estimated the average amount of radiation absorbed by a patient during a single chest x-ray.Most of the doctors 48 (43.6%) do not know the amount of absorbed dose in a single chest x-ray.Furthermore, the radiation dose from a single chest x-ray was overestimated by 29 (26.4%) of respondents. Radiation dose received during radiological examinations and their equivalents to standard chest X-ray (0.02 mSv), in mSv units, were questioned in other studies; however, in our questionnaire (in order to facilitate responses) we asked about the ionizing dosefrom a single chest x-ray. This study demonstrated that the level of knowledge of the participantswas inadequate.

International Journal of Scientific and Research Publications, Volume 7, Issue 4, April 2017 468 ISSN 2250-3153
www.ijsrp.org
Table 4.Knowledge of the respondents about radiation exposure dose of radiological imaging examinations JUSH
2016.
Imaging Technique
Less than actual Dose n (%)
Equal to actual Dose n (%)
Greater than actual Dose n (%)
Do not know n (%)
Abdomen x-ray
36(32.7) 8(7.3) 39(35.5) 27(24.5)
Bone scan 41(37.3) 9(8.2) 28(25.5) 32(29.1) Barium meal
38(34.5) 7(6.4) 26(23.6) 39(35.5)
Abdomen CT
42(38.2) 11(10.0) 31(28.2) 26(23.6)
PET San 53(48.2) 4(3.6) 19(17.3) 34(30.9) Ankle x-ray
26(23.6) 8(7.3) 31(28.2) 45(40.9)
CT: computed tomography Knowledge of ionizing radiation dose for different radiographs was given in (table 4). Correct estimates of the radiation dose were given for, abdominal x-ray, bone scan and ankle x-rays by 8 (7.3%) to 9 (8.2%) of respondents, while 36 (32.7%), 41 (37.3%) and 26 (23.6%) underestimated the radiation dose associated with these tests.The doses associated with PET scan, barium meal and Abdomen CT were also underestimated by 53 (48.2%), 41 (37.3%) and 42 (38.2%) of respondents and only accurately estimated by 4 (3.6%), 7 (6.4%) and 11 (10%). Radiological examinations have an indispensable role in the diagnosis and treatment of disease, although radiationhas been proven to have adversebiologicaleffects on living organisms.Theseadverse effects vary according tothedose of radiation and duration ofexposure [15 &16].Annually,100–150peopledie as a result of cancer secondaryto medical radiation exposure [17]. Studies and surveys have shown that doctors havepoor knowledge of radiation doses of examinations that are ordered and performed in clinicalpractice (Kong, 2005). The current study revealed that doctors could not appropriately estimate radiation dosesin the field of plain radiography, contrast studies and CT examinations.Most of the doctors either under estimate the dose or did not know the dose. The estimated doses of some of the radiologicalexaminations are much lower than the correct ones. The gross underestimation of radiation doses associated withplain radiography, contrast studies and CT examinations are consistent with previous studies done on physicians in other countries [1,2, 18 &19]. ThisUnderestimation of the actual dose of ionizing radiation might leaddoctors to request radiological examinations more often than it is necessaryandsafe. This means increased risk forpatients.
Table 5.Knowledge of the respondents about radiation exposure dose of radiologicalimaging examinations that do
not use ionizing radiation, JUSH, 2016.
Imaging Technique
Exposure to ionizing radiation Present n(%)
Absent n(%)
Do not Know n(%)
Abdominal US
26 (23.6) 65(59.1) 19 (17.3)
Abdominal MRI
11(10.0) 88 (80.0) 11(10)
US: ultrasonography, MRI: magnetic resonance imaging Knowledge of the respondents about radiation exposure dose of radiological imaging examinations that do not use ionizing radiation was given (table 5).Among the respondents, 26 (23.6%) were incorrect in their assumption that abdominal ultrasound examinations involved theuse of ionizing radiation, whereas 11 (10%) mistakenly thought that an abdominal MRI used ionizing radiation. 19 (17.3%) do not know whether abdominal US involve ionization radiation or not. An alarming finding of both previous studies conducted on physicians as well as this study done on doctor’s knowledge of radiation dose and associations risk is falsely associate non-radiating exams such as MRI and US with doses of ionizing radiation. This study found that 26 (23.6%) and 11(10.0%) of respondents wrongly indicated radiation doses with ultrasound and MRI, respectively. This result are consistent with previous studies which reported thatultrasound scanning and MRI were associatedwith radiation by 4%–11% and 8%–28% ofrespondents, respectively [21 & 22]This seems to reflect a deficit of knowledge of basic scientificprinciples. It may be explained by the fact that MRI was not available in the hospital during the study period and is not accessed by the doctors. Furthermore, this study revealed that 65(59.1%) correctly associated the radiation dose of an abdominal US, and 88 (80.0%) of the doctors correctly indicated the radiation dose associated with MRI. This finding is slightly higher than findings in the literature on physicians. Prior studies on physicians report a 4-5% incorrect association for ultrasound and 5-30% rate for MRI [1,18,19]. Perception of Cancer Risk
Table6: Distribution of respondents in estimating lifetime cancer risk from an Abdominal CT, JUSH 2016.
Risk estimation (ratio) Frequency Percent 1 in 200 35 31.8 1 in 2000 9 8.2 1 in 200,000 28 25.5 Don’t Know 38 34.5 Total 110 100.0
The lifetime risk of inducing a fatal cancer from an abdominal CT examination is estimated to be 1 in 2000 for an adult patient (33); however, only 9 doctors (8.2%) appeared to be

International Journal of Scientific and Research Publications, Volume 7, Issue 4, April 2017 469 ISSN 2250-3153
www.ijsrp.org
aware of this association. 35 (31.8%) doctors mistakenly replied that a CT scan of the abdomen had a lifetime risk of inducing a fatal cancer of less than 1 in 200 (Table-6). In one study, 10–50 mSv of acuteradiation exposure and 50–100 mSvof recurrent exposure were reported to induce cancer [22]. Therefore, inradiological practice, in keeping withALARA (as low as reasonably achieved) principle,minimum exposure of the patient andradiology staff is mandatory. Radiologicalexaminations that are unnecessaryand not supportive of diagnosiscreaterisk for patients.
IV. CONCLUSION Finding from this study show thatknowledge of doctors about radiation exposure and risks associated with diagnostic imaging modalities is limited. This limited knowledge of ionizing radiation, consistent with published studies in different countries. The limited knowledge displayed among doctors is in accordance to the reported absence of on job training regarding the risks associated with radiation exposure and absence of dose saving modalities (MRI) in the hospital. Although this is the only study to be conducted on all category of physicians ( GP, Intern and Specialized ), the results indicate a need for further education in the field in order to minimize unnecessary exposure to patients. A suggested target of better education regarding the risks of ionizing radiation associated with imaging modalities should arranged; however continuing education is needed to reach all practicing Doctors.Moreover, an effective medical education model should be developed in medical schools and health training institutions to address theknowledge gap currently seen in clinical practice. Patient education about radiation should be part of the responsibility of healthcare providers. This studyconcludes that the majority of medical doctors at JUSH have a verylimited knowledge regarding radiation source, risk and essential protection. Misconceptions about exposure andrisk were also observed in the medical community of the hospital. One can hardly refrain from generalizing thatthe problem affects the wider healthcare provider community nationwide in view of the fact that the teachinghospital is the source of most of the professionals practicing in the country. It is identified that a majorcurriculum revision of both undergraduate and graduate medical education regarding awareness on radiation ismandatory to improve this deficiency.
ACKNOWLEDGEMENTS We would liketoacknowledge Jimma University, Collegeof Health Sciencespostgraduateoffice for financially supporting this work. We would also liketo thankalldata collectorsand individuals who contributedto this work.
REFERENCES [1] A. Arslanoglu, S. Bilgin, ZI. Kubal, MN. Ceyhan, MN. Ilhan, I. Maral,
‘’Doctors’ and intern doctors’ knowledge about patients’ ionizing radiation exposure doses during common radiological examinations,’’ Diag. Interv. Rad, 2007, 13, 53-55.
[2] S. Shiralkar, A. Rennie, M. Sno, RB. Galland, MH. Lewis, K. Gower-Thom,‘’ Doctors’ knowledge of radiation exposure: questionnaire study,’’ BMJ, 2003, 32, 371-372.
[3] B. Bury, ‘’ X-ray dose training: are we exposed to enough,’’ Clin. Rad, 2004,59-926.
[4] D. Hart, BF. Wall, ‘’UK population dose from medical X-ray examinations,’’ Eur. Rad, 2004, 50, 285–291
[5] SJ. Yates, LC. Pike, KE. Goldstone, ‘’ Effect of multislice scanners on patient dose from routine CT examinations in East Anglia,’’ Br. J. Radiol, 2004, 77, 472–478.
[6] PC. Shrimpton, MC. Hillier, MA. Lewis, M. Dunn, ‘’ National survey of doses from CT in the UK,’’ Br J Radiol, 2006, 79, 968–980.
[7] D. Brenner, C. Elliston, E. Hall, W. Berdon, ‘’Estimated risks of radiation-induced fatal cancer from pediatric CT,’’ Am J Rad, 2001, 176, 289–296
[8] D. Brenner, E. Hall, D. Phil, ‘’Computed tomography—an increasing source of radiation exposure NEJM, 2007, 357-322
[9] Council Directive 97/43/Euratom of 30 June 1997 on health protection of individuals against the dangers of ionizing radiation in relation to medical exposure and repealing Directive 84/466/ Euratom. Official Journal of the European Communities09/07/ 1997; L180: 0022-0027
[10] AD. Quinn, CG. Taylor, T. Sabharwal, T. Sikdar, ‘’Radiation protection awareness in non-radiologists,’’ Br J Radiol, 1997, 70, 102–106
[11] K. Jacob, G. Vivian, JR. Steel,‘’X-ray dose training: are we exposed to enough?’’ ClinRadiol, 2004, 59, 928–934
[12] A. ARSLANOGLU, et al, ‘’Doctors’ and intern doctors’ knowledge about patients’ ionizing radiation exposure doses during common radiological examinations,’’ Diagn. Interv.Radiol, 2007,13, 53–55.
[13] JA. Soye, A. Paterson, ‘’A Survey of Awareness of Radiation Dose among Health Professionals in Northern Ireland,’’Br. J. Radi, 2008, 81, 525-527.
[14] . DJ. Brenner, R. Doll, DT. Goodhead, et al, ‘’Cancer risks attributable to low doses of ionizing radiation: assessing what we really know,’’ Proc. Natl. Acad. Sci USA 2003, 100, 13761–13766
[15] E. Picano, ‘’Sustainability of medical imaging. Education and Debate,’’ Br. Med. J, 2004, 328, 578–580.
[16] AJ. Einstein, KW. Moser, RC. Thompson, MD. Cerqueira, MJ. Henzlova, ‘’Radiation dose to patients from cardiac imaging,’’ Circulation 116, 2007, 1290–1305.
[17] CL. Eugene, ‘’Radiation Risk From Medical Imaging,’’ Mayo Clin Proc. 85, 2010, 1142-1146.
[18] CM. Heyer, J. Hansmann, et al, ‘’Paediatrician awareness of radiation dose and inherent risks in chest imaging studies--a questionnaire study. Eur. J. Radio, 2010, 76, 288-293.
[19] GB. Keijzers, CJ. Britton, ‘’Doctors' knowledge of patient radiation exposure from diagnostic imaging requested in the emergency department,’’ Medi. J. Australia, 2010, 193, 450-453.
[20] K. Jacob, G. Vivian, JR. Steel, ‘’ X ray dose training: Are we exposed to enough?’’ Clinical Radiology, 59, 2004, 928–934.
[21] A. Arslanoglu, et al, ‘’Doctors’ and intern doctors’ knowledge about patients’ ionizing radiation exposure doses during common radiological examinations,’’ Diagn. Interv.Radiol, 2007, 13, 53–55.
[22] DJ. Brenner, R. Doll, DT. Goodhead, et al, ‘’Cancer risks attributable to low doses of ionizing radiation: assessing what we really know,’’ Proc. Natl. Acad .Sci, USA 2003, 100, 13761–13766
AUTHORS First Author: MesfinZewdu, Lecturer at Radiology Department Jimma University, Ethiopia Second Author: Elias Kadir, Lecturer at Radiology Department Jimma University, Ethiopia Third Author: MelkamuBerhane, Lecturer at Department of Pediatric & child health Jimma University, Ethiopia

International Journal of Scientific and Research Publications, Volume 7, Issue 4, April 2017 470 ISSN 2250-3153
www.ijsrp.org