Form 10-K print version 2020 (00357437.DOCX
38
-
Upload
khangminh22 -
Category
Documents
-
view
0 -
download
0
Transcript of Form 10-K print version 2020 (00357437.DOCX


Dear Fellow Stockholders,
As the entire country and our Arizona and New Mexico communities continue to be challenged by one of the greatest health threats of a generation, our thoughts and prayers go out to those so horribly affected by the COVID-19 pandemic through lost loved ones and continued illnesses, and we wish to thank the healthcare workers and first responders who have stepped up to guide us through the darkness.
Throughout our 87-year history, Bank 34 has risen up to support our clients and communities at the most critical times. We weathered unprecedented challenges throughout 2020 and will continue to do so until this pandemic and its harsh realities are in the rear-view mirror. We know our support during this crisis is essential in keeping our local economies strong, and our actions in that regard will define us well into the future.
PANDEMIC RESPONSE
The spread of the coronavirus caused us to modify business practices. Those activities included temporary branch lobby closures, restricting employee travel, rearranging client contact areas and cancellation of physical participation in meetings, events and conferences. We continue to have some employees working remotely and may take further actions as we determine what are in the best interests of employees, clients and business partners from a safety perspective.
Other COVID-19 pandemic effects on our business included:
• Paycheck Protection Program (PPP). In the second quarter of 2020, Bank 34 funded 278 PPPloans with principal balances of $36 million. The bank began processing applications for thesecond round of PPP loans in January 2021.
• Loan Modifications. Bank 34 offered its loan clients experiencing liquidity challenges due to thepandemic loan payment deferrals on a case-by-case basis to assist them through this difficultperiod. Deferrals peaked around June 30, 2020, with 63 modified loans with $59 million inprincipal balances representing 19% of total non-PPP balances. By December 31, 2020, onlyseven loans were on deferral with principal balances totaling $9 million, representing 3% of totalnon-PPP balances.
• Provision for Loan Losses. The $1.9 million 2020 provision for loan losses included $1.6 millionspecifically for potential COVID-19 related losses representing 55% of the December 31, 2019pre-COVID-19 credit reserve balance. The Bank continues to closely monitor the effects of thepandemic on its borrowers and re-assess their ability to repay their debt obligations.
We entered 2021 in a position of strength and will continue to focus on those strategic initiatives that allow us to remain strong, resilient, and well-positioned to provide that support for our clients, employees and communities while never losing sight of our responsibility to provide a reasonable return and increasing franchise value for our stockholders.

A review of our accomplishments in 2020 is appropriate given they provide the foundation for the success of our franchise through this pandemic and into the future.
In 2020 we saw material growth in loans and deposits, reduced our reliance on wholesale funds, improved credit quality and increased stockholder total returns through stock repurchases, dividends and improved core operating fundamentals.
STRONG AND GROWING BALANCE SHEET
GROWTH – Portfolio loan growth excluding PPP loans was $32 million, or 11%, in 2020 compared to 3% in 2019 which was hampered by late fourth quarter payoffs. We increased commercial and industrial loans (excluding PPP loans) 71% in 2020, compared to 15% in 2019 and 42% in 2018 as we continue to diversify our loan portfolio by adding commercial relationships encompassing loan and deposit elements. Our portfolio loan five-year compound annual growth rate excluding PPP loans was 11%. We accomplished a $67 million, or 22%, increase in total deposits compared to 15% growth in 2019. Savings and NOW deposits increased $54 million, or 32%, and non-interest bearing demand deposits grew $20 million, or 35%. Time deposits decreased $7 million. Our deposit five-year compound annual growth rate was 10%.
CREDIT QUALITY AND RESERVES – Credit quality has continuously improved over the past few years. We have carried no foreclosed properties on our balance sheet for the past four years. Our allowance for loan losses represented 1.47% of total gross loans excluding PPP loans at year end compared to 0.99% at year-end 2019. We’ve achieved four consecutive years of contraction in our nonperforming assets to total assets ratio dropping from 1.81% at year-end 2016 to 0.64% in 2020. We believe the current carrying values of those assets are at realistic levels and the risk of material credit losses on those assets is mitigated as 87% of our nonperforming loan balances are guaranteed by the Small Business Administration.
CAPITAL - In terms of capital strength, Bancorp 34’s equity to assets at December 31, 2020 was a healthy 10.4% and Bank 34’s Tier 1 Risk-Based Capital Ratio was 11.9%. This level of capital provides significant flexibility in supporting organic growth and/or acquisitions, and ample capital resources if needed to offset the potential financial impacts of unanticipated loan quality problems or other unforeseen operating losses.
OPERATING PERFORMANCE
Net income for 2020 was $1.8 million compared with $710,000 in 2019. Diluted net income per share for the year was $0.59, compared with $0.23 for 2019. The year ended December 31, 2019 included $2.0 million of net income from continuing operations partially offset by a $1.3 million loss from discontinued mortgage banking operations including a $845,000 net loss on disposal. The discontinuation of mortgage banking operations reduced our reliance on an earnings stream that can be more cyclical and volatile in order to focus on expanding the more stable earnings from our core commercial banking business.
Net income from continuing operations was $1.8 million for 2020 compared to $2.0 million in 2019. The decrease was primarily caused by an additional $1.6 million in the provision for loan loss for COVID/recession-related losses, $304,000 of officer transition expenses and a $241,000 fixed asset impairment. Net interest income increased $1.9 million or 13% primarily due to a 13% increase in average interest earning assets, partially offset by a six basis point decrease in net interest margin. Average interest bearing liability rates decreased 58 basis points compared to a 54 basis point decrease in average interest earning assets yield. Low PPP loan yields caused an 11 basis point reduction in the 2020 net interest margin.

CAPITAL ACTIVITIES & STOCKHOLDER RETURN
STOCK REPURCHASES - Bancorp 34 adopted its first stock repurchase program in 2017 and its second in 2019. From 2017 through 2019 Bancorp 34 repurchased 328,934 shares at an average price of $15.42 per share. In 2020 the Company completed its second and third repurchase programs with another 69,845 shares repurchased at an average cost per share of $10.17. We will consider similar activities in the future taking into consideration liquidity, share availability, pricing and other strategic initiatives.
DIVIDENDS –Bancorp 34 suspended the payment of regular dividends in July 2012 due to operating losses. In May 2018, recognizing our stockholders had been patient, our balance sheet was strong and operating earnings were improving, Bancorp 34 paid a special dividend of $1.25 per share. Since June 2019 we have been paying regular quarterly dividends of $0.05 per share. We continue to consider dividends a key element of capital planning and stockholder return.
STOCK PRICE & TOTAL RETURN – Despite a 4.5% increase in tangible book value per share, your Bancorp 34 stock finished 2020 at $11.30 per share, 26% below the $15.27 at December 31, 2019. Since the trading range for all small-cap bank stocks remains depressed, it appears the market is discounting them under concerns they may be less prepared than larger banks to weather the storm, maintain their earnings and grow and prosper through and after the recovery. We cannot and will not manage the company specifically to enhance our stock price in the short run, but do hope the stock price recovers in the long run and reflects the substantial progress this company has achieved over time. We believe in continual investment, in good times and bad, expanding the core strengths of the franchise. This positions our company to grow and prosper in the long run. In the five years through December 31, 2019, pre-pandemic, Bancorp 34 stock appreciated 108% and our 127% total return to stockholders (including dividends) outperformed both the S&P 500 and SNL U.S. Bank indexes.
We assure you we have been, and will continue to, strive for long-term franchise value improvement and acceptable stockholder returns. On behalf of every member of the Bancorp 34 team and the Board of Directors, we thank you for your continued support and for entrusting us with your financial assets.
Be safe out there!
James T. Crotty President and Chief Executive Officer
CONTENTS
Page
Report of Independent Public Accounting Firm 2
Consolidated Balance Sheets 3
Consolidated Statements of Comprehensive Income 4
Consolidated Statements of Changes in Stockholders’ Equity 5
Consolidated Statements of Cash Flows 6
Notes to Consolidated Financial Statements 7
1

Report of Independent Auditors
To the Stockholders and the Board of Directors Bancorp 34, Inc.
Report on the Financial Statements
We have audited the accompanying consolidated balance sheets of Bancorp 34, Inc. (the “Company”) as of December 31, 2020 and 2019, the related consolidated statements of comprehensive income, changes in stockholders’ equity, and cash flows for the years then ended, and the related notes to the financial statements (collectively referred to as the “consolidated financial statements”).
Management’s Responsibility for the Financial Statements
Management is responsible for the preparation and fair presentation of these consolidated financial statements in accordance with accounting principles generally accepted in the United States of America; this includes the design, implementation, and maintenance of internal control relevant to the preparation and fair presentation of consolidated financial statements that are free from material misstatement, whether due to fraud or error.
Auditor’s Responsibility
Our responsibility is to express an opinion on these consolidated financial statements based on our audits. We conducted our audits in accordance with auditing standards generally accepted in the United States of America. Those standards require that we plan and perform the audits to obtain reasonable assurance about whether the consolidated financial statements are free from material misstatement.
An audit involves performing procedures to obtain audit evidence about the amounts and disclosures in the consolidated financial statements. The procedures selected depend on the auditor’s judgment, including the assessment of the risks of material misstatement of the consolidated financial statements, whether due to fraud or error. In making those risk assessments, the auditor considers internal control relevant to the entity’s preparation and fair presentation of the consolidated financial statements in order to design audit procedures that are appropriate in the circumstances, but not for the purpose of expressing an opinion on the effectiveness of the entity’s internal control. Accordingly, we express no such opinion. An audit also includes evaluating the appropriateness of accounting policies used and the reasonableness of significant accounting estimates made by management, as well as evaluating the overall presentation of the consolidated financial statements.
We believe that the audit evidence we have obtained is sufficient and appropriate to provide a basis for our audit opinion.
Opinion
In our opinion, the consolidated financial statements referred to above present fairly, in all material respects, the financial position of Bancorp 34, Inc. as of December 31, 2020 and 2019, and the results of their operations and their cash flows for the years then ended in accordance with accounting principles generally accepted in the United States of America.
Phoenix, Arizona February 9, 2021
2

BANCORP 34, INC. CONSOLIDATED BALANCE SHEETS
December 31, 2020 December 31, 2019
ASSETSCash and due from banks 8,201,201$ 4,496,465$ Interest-bearing deposits with banks 3,785,000 24,990,000 Total cash and cash equivalents 11,986,201 29,486,465
Available-for-sale securities, at fair value 54,343,254 44,517,178
Loans held for investment 353,565,535 294,660,719 Allowance for loan losses (4,820,883) (2,921,931) Loans held for investment, net 348,744,652 291,738,788
Premises and equipment, net 8,304,432 8,990,955 Operating lease right-of-use assets 950,042 - Stock in financial institutions, restricted, at cost 1,324,361 4,016,761 Accrued interest receivable 1,657,014 961,105 Deferred income tax asset, net 2,111,019 1,907,876 Bank owned life insurance 11,111,634 10,850,085 Core deposit intangible, net 97,604 133,052 Prepaid and other assets 1,291,463 1,137,090
TOTAL ASSETS 441,921,676$ 393,739,355$
LIABILITIES AND STOCKHOLDERS’ EQUITYLiabilities
DepositsDemand deposits 76,492,839$ 56,401,370$ Savings and NOW deposits 219,777,876 166,107,428 Time deposits 74,479,109 81,387,861
Total deposits 370,749,824 303,896,659
Federal Home Loan Bank advances 19,000,000 40,000,000 Escrows 267,503 254,593 Operating lease liabilities 1,032,758 - Accrued interest and other liabilities 4,838,206 4,271,437 Accrued interest and other liabilities - - discontinued operations - 233,427
Total liabilities 395,888,291 348,656,116
Stockholders’ equityPreferred stock, $0.01 par value, 50,000,000 authorized,
none issued and outstanding - - Common stock, $0.01 par value, 100,000,000 authorized,
3,137,573 and 3,208,618 issued and outstanding. 31,376 32,086 Additional paid-in capital 22,811,166 23,168,176 Retained earnings 24,324,634 23,157,134 Accumulated other comprehensive income 388,416 307,255 Unearned employee stock ownership plan shares (1,522,207) (1,581,412)
Total stockholders’ equity 46,033,385 45,083,239
TOTAL LIABILITIES AND STOCKHOLDERS’ EQUITY 441,921,676$ 393,739,355$
The accompanying notes are an integral part of these consolidated financial statements.
3
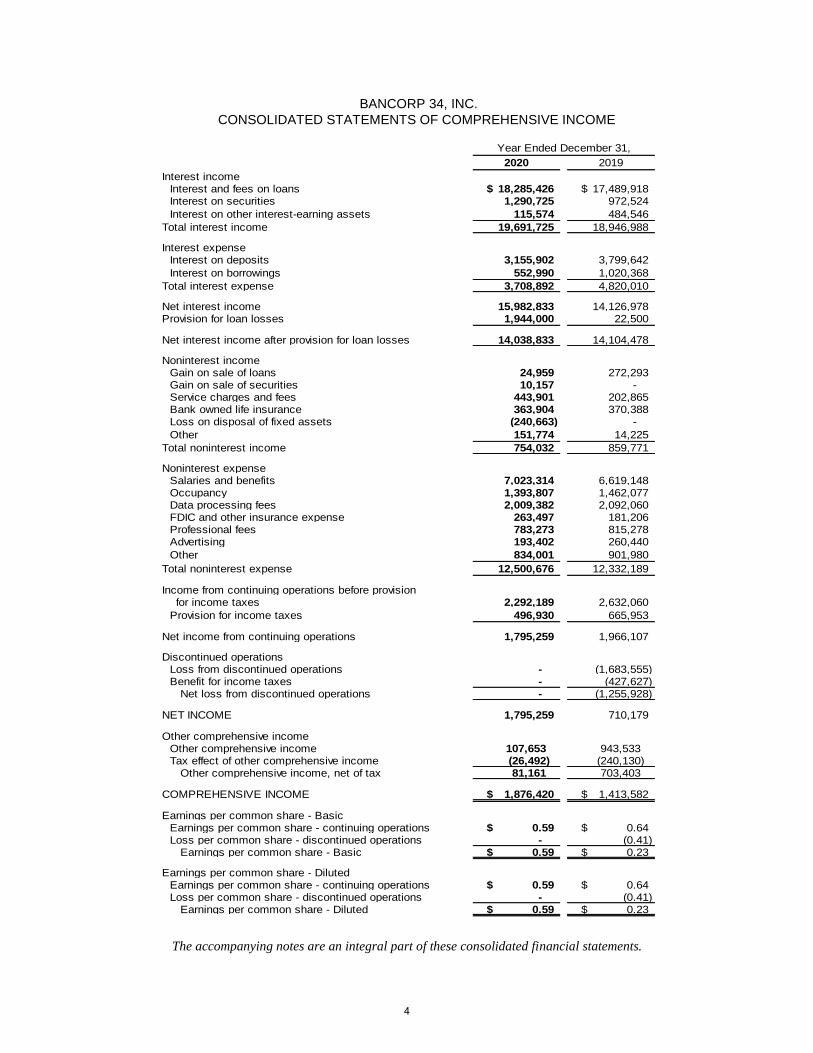
BANCORP 34, INC. CONSOLIDATED STATEMENTS OF COMPREHENSIVE INCOME
Year Ended December 31,
2020 2019Interest income
Interest and fees on loans 18,285,426$ 17,489,918$ Interest on securities 1,290,725 972,524 Interest on other interest-earning assets 115,574 484,546
Total interest income 19,691,725 18,946,988
Interest expenseInterest on deposits 3,155,902 3,799,642 Interest on borrowings 552,990 1,020,368
Total interest expense 3,708,892 4,820,010
Net interest income 15,982,833 14,126,978 Provision for loan losses 1,944,000 22,500
Net interest income after provision for loan losses 14,038,833 14,104,478
Noninterest income Gain on sale of loans 24,959 272,293 Gain on sale of securities 10,157 - Service charges and fees 443,901 202,865 Bank owned life insurance 363,904 370,388 Loss on disposal of fixed assets (240,663) - Other 151,774 14,225
Total noninterest income 754,032 859,771
Noninterest expenseSalaries and benefits 7,023,314 6,619,148 Occupancy 1,393,807 1,462,077 Data processing fees 2,009,382 2,092,060 FDIC and other insurance expense 263,497 181,206 Professional fees 783,273 815,278 Advertising 193,402 260,440 Other 834,001 901,980
Total noninterest expense 12,500,676 12,332,189
Income from continuing operations before provision for income taxes 2,292,189 2,632,060
Provision for income taxes 496,930 665,953
Net income from continuing operations 1,795,259 1,966,107
Discontinued operationsLoss from discontinued operations - (1,683,555) Benefit for income taxes - (427,627) Net loss from discontinued operations - (1,255,928)
NET INCOME 1,795,259 710,179
Other comprehensive incomeOther comprehensive income 107,653 943,533Tax effect of other comprehensive income (26,492) (240,130) Other comprehensive income, net of tax 81,161 703,403
COMPREHENSIVE INCOME 1,876,420$ 1,413,582$
Earnings per common share - BasicEarnings per common share - continuing operations 0.59$ 0.64$ Loss per common share - discontinued operations - (0.41) Earnings per common share - Basic 0.59$ 0.23$
Earnings per common share - DilutedEarnings per common share - continuing operations 0.59$ 0.64$ Loss per common share - discontinued operations - (0.41) Earnings per common share - Diluted 0.59$ 0.23$
The accompanying notes are an integral part of these consolidated financial statements.
4
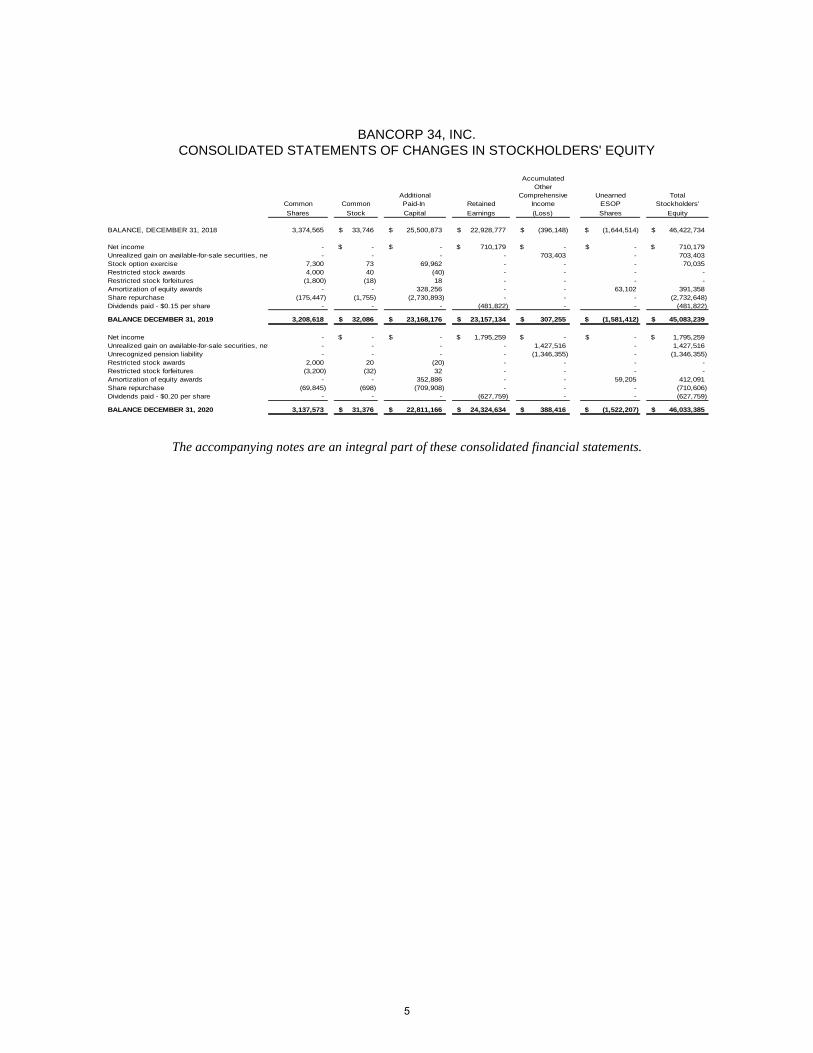
BANCORP 34, INC. CONSOLIDATED STATEMENTS OF CHANGES IN STOCKHOLDERS' EQUITY
Accumulated
OtherAdditional Comprehensive Unearned Total
Common Common Paid-In Retained Income ESOP Stockholders'Shares Stock Capital Earnings (Loss) Shares Equity
BALANCE, DECEMBER 31, 2018 3,374,565 33,746$ 25,500,873$ 22,928,777$ (396,148)$ (1,644,514)$ 46,422,734$
Net income - -$ -$ 710,179$ -$ -$ 710,179$ Unrealized gain on available-for-sale securities, net - - - - 703,403 - 703,403 Stock option exercise 7,300 73 69,962 - - - 70,035 Restricted stock awards 4,000 40 (40) - - - - Restricted stock forfeitures (1,800) (18) 18 - - - - Amortization of equity awards - - 328,256 - - 63,102 391,358 Share repurchase (175,447) (1,755) (2,730,893) - - - (2,732,648) Dividends paid - $0.15 per share - - - (481,822) - - (481,822)
BALANCE DECEMBER 31, 2019 3,208,618 32,086$ 23,168,176$ 23,157,134$ 307,255$ (1,581,412)$ 45,083,239$
Net income - -$ -$ 1,795,259$ -$ -$ 1,795,259$ Unrealized gain on available-for-sale securities, net - - - - 1,427,516 - 1,427,516 Unrecognized pension liability - - - - (1,346,355) - (1,346,355) Restricted stock awards 2,000 20 (20) - - - - Restricted stock forfeitures (3,200) (32) 32 - - - - Amortization of equity awards - - 352,886 - - 59,205 412,091 Share repurchase (69,845) (698) (709,908) - - - (710,606) Dividends paid - $0.20 per share - - - (627,759) - - (627,759)
BALANCE DECEMBER 31, 2020 3,137,573 31,376$ 22,811,166$ 24,324,634$ 388,416$ (1,522,207)$ 46,033,385$
The accompanying notes are an integral part of these consolidated financial statements.
5
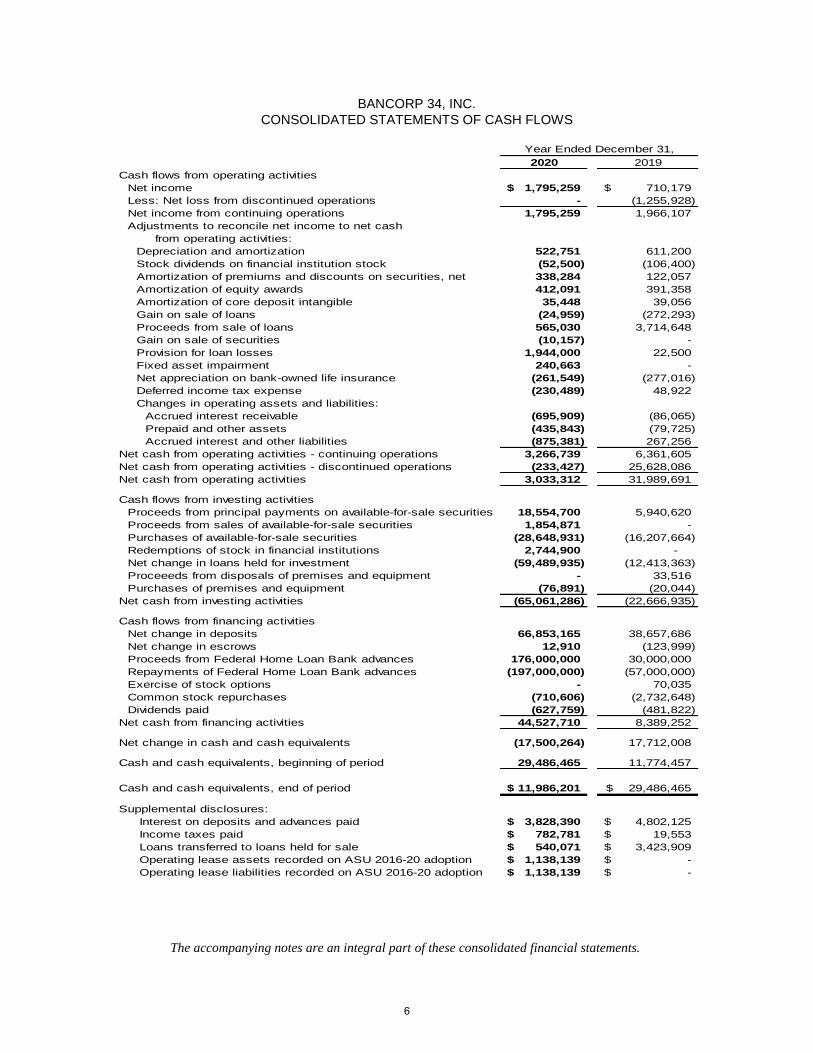
BANCORP 34, INC. CONSOLIDATED STATEMENTS OF CASH FLOWS
2020 2019Cash flows from operating activities
Net income 1,795,259$ 710,179$ Less: Net loss from discontinued operations - (1,255,928) Net income from continuing operations 1,795,259 1,966,107Adjustments to reconcile net income to net cash from operating activities:
Depreciation and amortization 522,751 611,200Stock dividends on financial institution stock (52,500) (106,400)Amortization of premiums and discounts on securities, net 338,284 122,057Amortization of equity awards 412,091 391,358Amortization of core deposit intangible 35,448 39,056Gain on sale of loans (24,959) (272,293)Proceeds from sale of loans 565,030 3,714,648Gain on sale of securities (10,157) - Provision for loan losses 1,944,000 22,500Fixed asset impairment 240,663 - Net appreciation on bank-owned life insurance (261,549) (277,016)Deferred income tax expense (230,489) 48,922 Changes in operating assets and liabilities:
Accrued interest receivable (695,909) (86,065)Prepaid and other assets (435,843) (79,725)Accrued interest and other liabilities (875,381) 267,256
Net cash from operating activities - continuing operations 3,266,739 6,361,605 Net cash from operating activities - discontinued operations (233,427) 25,628,086 Net cash from operating activities 3,033,312 31,989,691
Cash flows from investing activitiesProceeds from principal payments on available-for-sale securities 18,554,700 5,940,620Proceeds from sales of available-for-sale securities 1,854,871 - Purchases of available-for-sale securities (28,648,931) (16,207,664) Redemptions of stock in financial institutions 2,744,900 - Net change in loans held for investment (59,489,935) (12,413,363)Proceeeds from disposals of premises and equipment - 33,516Purchases of premises and equipment (76,891) (20,044)
Net cash from investing activities (65,061,286) (22,666,935)
Cash flows from financing activitiesNet change in deposits 66,853,165 38,657,686Net change in escrows 12,910 (123,999)Proceeds from Federal Home Loan Bank advances 176,000,000 30,000,000Repayments of Federal Home Loan Bank advances (197,000,000) (57,000,000)Exercise of stock options - 70,035Common stock repurchases (710,606) (2,732,648)Dividends paid (627,759) (481,822)
Net cash from financing activities 44,527,710 8,389,252
Net change in cash and cash equivalents (17,500,264) 17,712,008
Cash and cash equivalents, beginning of period 29,486,465 11,774,457
Cash and cash equivalents, end of period 11,986,201$ 29,486,465$
Supplemental disclosures: Interest on deposits and advances paid 3,828,390$ 4,802,125$ Income taxes paid 782,781$ 19,553$ Loans transferred to loans held for sale 540,071$ 3,423,909$ Operating lease assets recorded on ASU 2016-20 adoption 1,138,139$ -$ Operating lease liabilities recorded on ASU 2016-20 adoption 1,138,139$ -$
Year Ended December 31,
The accompanying notes are an integral part of these consolidated financial statements.
6
BANCORP 34, INC. NOTES TO CONSOLIDATED FINANCIAL STATEMENTS
NOTE 1 – NATURE OF OPERATIONS AND SUMMARY OF SIGNIFICANT ACCOUNTING AND REPORTING POLICIES Bancorp 34, Inc. (“Bancorp 34” or the “Company”) is a Maryland corporation organized in 2016 to be the successor to Alamogordo Financial Corp (“AFC”), a savings and loan holding company, upon completion of the October 2016 second-step conversion of Bank 34 (the “Bank”) from the two-tier mutual holding company structure to the stock holding company structure. Bancorp 34 owns 100% of the Bank. In August 2020, Bancorp 34, Inc. voluntarily delisted from the NASDAQ Capital Market and joined the OTCQB Market. As a result of delisting, Bancorp 34, Inc. is no longer a public reporting company obligated to file periodic reports with the SEC, including proxy materials and reports on Forms 10-K, 10-Q and 8-K. The decision was based on numerous factors, including the significant cost savings of no longer filing periodic SEC reports and reductions in accounting fees, legal fees and other costs. The Bank provides a variety of banking services to individuals and businesses through its full-service branches in Alamogordo and Las Cruces, New Mexico, and Scottsdale and Peoria, Arizona. Basis of Presentation – The accompanying consolidated financial statements have been prepared on the accrual basis of accounting in accordance with accounting principles generally accepted in the United States of America (GAAP). Discontinued Operations – In May 2019, Bank 34 took steps to exit the Bank's operations with respect to originating residential mortgage loans for sale into the secondary market ("Mortgage Banking"). The Mortgage Banking operations that were disposed of, and that represent a strategic shift that will have a major effect on operations and financial results, are accounted for as discontinued operations. The Consolidated Financial Statements. Current and prior periods presented in the consolidated statements of comprehensive income as well as the related note disclosures covering income and expense amounts have been retrospectively adjusted for the impact of discontinued operations for comparative purposes. The consolidated balance sheets and related note disclosures for prior periods also reflect the reclassification of certain assets and liabilities to discontinued operations. Additional information on discontinued operations can be found in The Consolidated Financial Statements, Note 2 – Discontinued Operations. Basis of Consolidation – The Consolidated Financial Statements include the accounts of Bancorp 34 and the Bank. All significant intercompany accounts and transactions have been eliminated. Reclassifications – Certain reclassifications have been made to prior period’s financial information to conform to the current period presentation. Use of Estimates – The preparation of financial statements in conformity with GAAP requires management to make estimates and assumptions that affect the reported amounts of assets and liabilities and disclosure of contingent assets and liabilities at the date of the financial statements and the reported amounts of revenues and expenses during the reporting period. Actual results could differ from those estimates. Significant estimates include, but are not limited to, allowance for loan losses, useful lives used in depreciation and amortization, deferred income taxes and related valuation allowance and core deposit intangibles. Subsequent Events - Subsequent events have been evaluated through the date The Consolidated Financial Statements were issued.
7

Cash and Cash Equivalents – Cash and cash equivalents include cash, due from banks, and federal funds sold. Generally, the Company considers all highly-liquid instruments with original maturities of three months or less to be cash equivalents. In monitoring credit risk associated with deposits in other banks, the Bank periodically evaluates the stability of the correspondent financial institutions. Banks are required to maintain reserve funds in cash or on deposit with the Federal Reserve Bank. The reserves required at December 31, 2020 and 2019 were $0 and $1.1 million, respectively, and is included in cash and cash equivalents in the consolidated balance sheets. Available for Sale Securities – The Company reviews its financial position, liquidity, and future plans in evaluating the criteria for classifying securities. Available-for-sale securities consist of bonds, notes, debentures, mortgage-backed securities, municipal obligations and certain equity securities not classified as trading securities or as held-to-maturity securities. Unrealized holding gains and losses, net of tax, on available-for-sale securities are reported as a net amount in a separate component of stockholders’ equity. Gains and losses on the sale of available-for-sale securities are determined using the specific-identification method. Declines in the fair value of individual available-for-sale securities below their cost that are other-than-temporary result in write-downs of the individual securities to their fair value. The related write-downs are included in earnings as realized losses. Premiums and discounts are recognized in interest income using the interest method over the expected life of the security. Loans Held for Sale – Loans held for sale includes one- to four-family residential real estate loans, and periodically, a portion of Small Business Administration (“SBA”) or United States Department of Agriculture (USDA) loans the Bank intends to sell. They are carried at fair value. Gains and losses on the sale of mortgage loans are recognized upon sale and are determined by the difference between the sales proceeds and carrying value of the loans. As discussed in The Consolidated Financial Statements, Note 2 – Discontinued Operations, the Company discontinued originating mortgage loans held for sale in its name in June 2019. Net unrealized losses, if any, are recorded as a valuation allowance and charged to operations. There were no loans held for sale at December 31, 2020 or 2019. Loans Held for Investment, Net – Loans that management has the intent and ability to hold for the foreseeable future or until maturity or payoff are reported at their outstanding unpaid principal balances reduced by any charge-offs or specific allowances and net of any deferred fees or costs. Loans are considered past due or delinquent based on the contractual terms in the loan agreement and how recently repayments have been received. Interest income is recognized based upon principal amounts outstanding. The accrual of interest is discontinued at the time the loan is 90 days past due or when, in the opinion of management, there is doubt about the ability of the borrower to pay interest or principal, unless the credit is well secured and in process of collection. Interest previously accrued but uncollected on such loans is reversed and charged against current income. Subsequent interest collected on such loans is credited to loan principal if, in the opinion of management, collectability of principal is doubtful; otherwise, the interest collected is recognized as income and resumption of interest accruals may occur. Loans are charged-off as uncollectible when, in the opinion of management, collectability of principal is improbable. Personal loans are typically charged off when no later than 180 days past due. The allowance for loan losses is maintained at a level which, in management’s judgment, is adequate to absorb probable credit losses inherent in the loan portfolio. The amount of the allowance is based on management’s evaluation of the collectability of the loan portfolio, including the nature of the portfolio; credit concentrations; trends in historical loss experience; and specific impaired loans and economic conditions. Allowances for impaired loans are generally determined based on collateral values or the present value of estimated cash flows. Because of uncertainties associated with regional economic conditions, collateral values, and future cash flows on impaired loans, it is reasonably possible that management’s estimate of probable credit losses inherent in the loan portfolio and the related allowance may change materially in the near-term. The allowance is increased by a provision for loan losses, which is charged to expense and reduced by charge-offs, net of recoveries. Changes in the allowance relating to impaired loans are charged or credited to the provision for loan losses. Management’s periodic evaluation of the adequacy of the allowance is based on the current level of net loan losses, known and inherent risks in the portfolio, adverse situations that may affect the borrower’s ability to repay, the estimated value of any underlying collateral, and current economic conditions.
8

Loan origination fees, net of certain direct origination costs, are deferred and recognized as an adjustment of the related loan yield using the interest method. Premises and Equipment – Land is carried at cost. Premises and equipment are stated at cost less accumulated depreciation and amortization. Depreciation and amortization are computed using the straight-line method in amounts sufficient to relate the cost of depreciable assets to operations over the estimated useful lives of the assets which range from three to seven years for equipment and fifteen to forty years for leasehold improvements and buildings. Maintenance and repairs that do not extend the useful lives of premises and equipment are charged to expense as incurred. Stock in Financial Institutions - The Bank has investments in The Independent Bankers Bank (TIB), Pacific Coast Bankers’ Bancshares (PCBB) and the Federal Home Loan Bank (FHLB) of Dallas. The Bank is a member of FHLB system. The Bank is required to maintain minimum levels of FHLB stock based on various factors, including the amount of borrowings outstanding, mortgage assets and the Bank’s total assets. Financial institution stock is carried at cost, is classified as a restricted security and is periodically evaluated for impairment based on ultimate recovery. The carrying value of financial institution stocks at December 31, 2020 and 2019 was $1.3 million and $4.0 million, respectively. Cash and stock dividends are recorded in Other Income in the Consolidated Statement of Comprehensive Income. Transfers of Financial Assets – Transfers of financial assets are accounted for as sales when control over the assets has been relinquished. Control over transferred assets is deemed to be surrendered when the assets have been isolated from the Company, the transferee obtains the right, free of conditions that constrain it from taking advantage of that right, to pledge or exchange the transferred assets, and the Company does not maintain effective control over the transferred assets through an agreement to repurchase them before their maturity. Bank Owned Life Insurance (BOLI) – The Bank holds BOLI representing life insurance on the lives of certain executives of the Bank purchased in order to help offset the costs of the Bank’s benefit expenses. BOLI is carried on our consolidated balance sheets at the net cash surrender value of the policies and increases in the net cash surrender value are recorded in noninterest income in the consolidated statements of comprehensive income (loss) as bank owned life insurance income. Core deposit intangible (CDI) – Core deposit intangible represents a premium paid to acquire core deposits representing the net present value of core deposits acquired over their book value on the acquisition date. The core deposit intangible is amortized using the double declining balance method over the 9-year estimated useful lives of the core deposits. Core deposit intangibles are tested for impairment whenever events or changes in circumstances indicate the carrying value of the assets may be larger than the value of the future undiscounted cash flows. Other Real Estate (ORE) – ORE consists of properties acquired through a foreclosure proceeding or acceptance of a deed in lieu of foreclosure. These properties are carried at fair value based on appraisal value less estimated sales costs. Loan losses arising from the acquisition of such properties are charged against the allowance for loan losses; any subsequent valuation adjustments are charged to expense, and the basis of the properties is reduced accordingly. These properties are not held for the production of income and, therefore, are not depreciated. Significant improvements expected to increase the resale value are capitalized and added to the value of the property. Fair Value Measurements – Fair value is defined as the exchange price that would be received for an asset or paid to transfer a liability (an exit price) in the principal or most advantageous market for the asset or liability in an orderly transaction between market participants on the measurement date. Valuation techniques used to measure fair value must maximize the use of observable inputs and minimize the use of unobservable inputs. A three-level fair value hierarchy prioritizes the inputs used to measure fair value:
9

● Level 1 – Quoted prices in active markets for identical assets or liabilities; includes certain U.S. Treasury and other U.S. Government agency debt that is highly-liquid and is actively traded in over-the-counter markets.
● Level 2 – Inputs that are observable, either directly or indirectly, such as quoted prices for similar
assets or liabilities, quoted prices in markets that are not active or other inputs that are observable or can be corroborated by observable market data for substantially the full term of the assets or liabilities.
● Level 3 – Unobservable inputs that are supported by little or no market activity and that are
significant to the fair value of the assets or liabilities. Level 3 assets and liabilities include financial instruments whose value is determined using pricing models, discounted cash flow methodologies, or similar techniques, as well as instruments for which the determination of fair value requires significant management judgment or estimation.
The asset or liability’s fair value measurement level within the fair value hierarchy is based on the lowest level of any input that is significant to the fair value measurement. Valuation techniques used need to maximize the use of observable inputs and minimize the use of unobservable inputs. Escrow Accounts – Funds collected from loan customers for insurance, real estate taxes and other purposes are maintained in escrow accounts and carried as a liability in the Consolidated Balance Sheets. These funds are periodically remitted to the appropriate entities to satisfy those claims. Financial Instruments with Off-Balance-Sheet Risk – In the ordinary course of business, the Bank enters into off-balance-sheet financial instruments consisting of commitments to extend credit and letters of credit. Such financial instruments are recorded in The Consolidated Financial Statements when they are funded or related fees are incurred or received. The credit risk associated with these instruments is evaluated using the same methodology as for loans held for investment. Advertising Cost – The Bank conducts direct and non-direct response advertising and purchases prospective customer lists from various sources. These costs are expensed as incurred. Advertising costs from continuing operations for the years ended December 31, 2020 and 2019 were $193,000 and $260,000, respectively. Employee Stock Ownership Plan (ESOP) – The Bank sponsors an internally leveraged ESOP. The cost of shares issued to the ESOP but not yet released is shown as unearned employee stock ownership plan (ESOP) shares, an element of stockholders’ equity in our consolidated balance sheets. As shares are committed to be released, compensation expense is recorded equal to the market price of the shares, and the shares become outstanding for purposes of earnings per share calculations. To the extent that the fair value of ESOP shares committed differs from the cost of such shares, the difference is charged or credited to additional paid-in capital in stockholders’ equity. Cash dividends on unallocated ESOP shares may be used to make payments on the ESOP loan and may be allocated to participant accounts in proportion to their account balances. Cash dividends paid on allocated shares are recorded as a reduction of retained earnings and, at the direction of the employer may be: a) credited directly to participant accounts in proportion to their account balances, or b) distributed directly to participants (outside the plan) in proportion to their account balances, or c) used to make payments on the ESOP loan requiring the release of shares with at least a similar fair market value be allocated to participant accounts. In addition, participants have the right to receive an immediate distribution of their vested cash dividends paid on shares of common stock credited to their accounts. Other Stock-Based Compensation – The Company has stock-based compensation plans which provide for the award of various benefits to Directors and employees, including restricted stock and options to purchase stock. Each restricted stock award is separated into vesting tranches and compensation expense is recognized based on the fair value at the date of grant for each tranche on a straight-line basis over the vesting period reduced for estimated forfeitures. Cash dividends on unvested restricted shares are charged
10
to compensation expense. The fair value of stock option awards granted is estimated using the Black-Scholes-Merton option pricing model using inputs including the option exercise price and risk free rate of return, and assumptions for expected dividend yield, expected stock price volatility and the expected life of the awards. The closing market price of the Company’s stock on the date of grant is the exercise price for the stock options and the estimated fair value of the restricted stock awards. Expense is recognized over the required service period, defined as the vesting period. For awards with graded vesting, expense is recognized on a straight-line basis over the requisite service period for the entire award. The Company’s accounting policy is to recognize expense net of actual forfeitures. Income Taxes – Income tax expense is the total of the current year income tax due or refundable and the change in deferred tax assets and liabilities. Deferred tax assets and liabilities are the expected future tax amounts for the temporary differences between carrying amounts and tax basis of assets and liabilities, computed using enacted tax rates. A valuation allowance, if needed, reduces deferred tax assets to the amount expected to be realized. Accrued interest and penalties associated with uncertain tax positions are recognized as part of the income tax provision. The Company has no uncertain tax provisions. Comprehensive Income (Loss) – Comprehensive income (loss) consists of net income (loss), net unrealized gains and losses on securities available-for-sale, net of taxes and unrecognized pension liability. Earnings per Common Share - Basic earnings per common share is net income divided by the weighted average number of common shares outstanding during the period. ESOP shares are considered outstanding for this calculation unless unearned. Maryland corporate law does not provide for treasury shares; therefore, shares repurchased are removed from issued and outstanding immediately and would not be considered outstanding. All outstanding unvested share-based payment awards that contain rights to non-forfeitable dividends are considered participating securities for this calculation. Diluted earnings per common share include the dilutive effect of additional potential common shares issuable under stock options. Earnings per share are restated for all stock splits and stock dividends through the date of issuance of the financial statements. The Company has restricted stock awards that participate in dividends (“participating securities”), and is required to apply the two-class method to compute earnings per share. The two-class method is an earnings allocation method under which earnings per share is calculated for each class of common stock and participating security considering both dividends declared (or accumulated) and participation rights in undistributed earnings as if all such earnings had been distributed during the period. Summary of Recent Accounting Pronouncements: Bancorp 34 was an emerging growth company under the JOBS Act and elected to use the extended transition period to delay adoption of new or revised accounting pronouncements applicable to public companies until such pronouncements were made applicable to private companies. Accordingly, our financial statements may not have been comparable to the financial statements of public companies that complied with such new or revised accounting standards. The Company lost its status as an emerging growth company at the end of 2019. Leases – In February 2016, the FASB issued ASU 2016-02 “Leases (Topic 842).” This standard requires entities that lease assets to recognize on the balance sheet the assets and liabilities for the rights and obligations created by those leases. The standard was effective for fiscal years and interim periods within those fiscal years beginning after December 15, 2018 for public companies, but the Company had until the first quarter of 2020 to adopt due to its emerging growth company status. The guidance is required to be applied by the modified retrospective transition approach. Early adoption is permitted. We adopted the standard effective January 1, 2020 on a prospective basis and elected to apply several allowable practical expedients, including carryover of historical lease determinations, classification conclusions and direct cost balances. Adoption of the standard resulted in balance sheet recognition of approximately $1.3 million in operating lease right-of-use assets and $1.4 million operating lease liabilities as of January 1, 2020. These amounts represent the present value of remaining minimum lease payments, discounted using the Company’s incremental borrowing rate at the date of adoption. There was no material impact on the timing of expense or income recognition in the consolidated statements of income. Prior periods were not
11
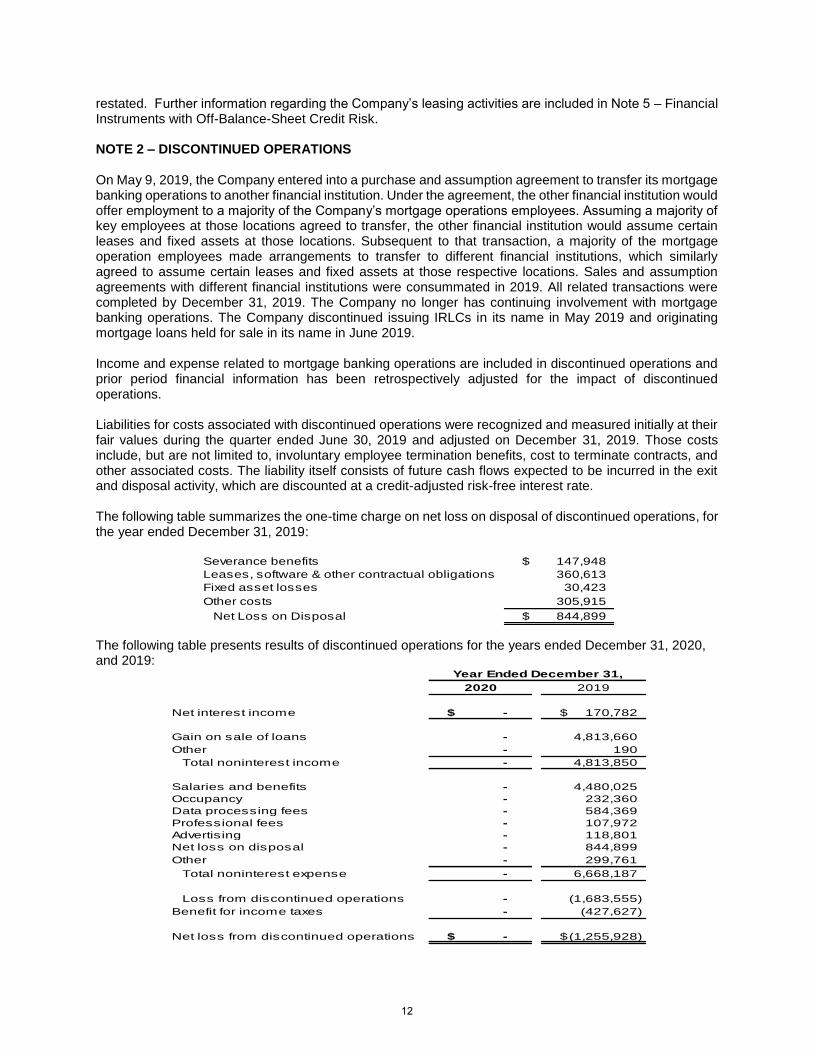
restated. Further information regarding the Company’s leasing activities are included in Note 5 – Financial Instruments with Off-Balance-Sheet Credit Risk. NOTE 2 – DISCONTINUED OPERATIONS On May 9, 2019, the Company entered into a purchase and assumption agreement to transfer its mortgage banking operations to another financial institution. Under the agreement, the other financial institution would offer employment to a majority of the Company’s mortgage operations employees. Assuming a majority of key employees at those locations agreed to transfer, the other financial institution would assume certain leases and fixed assets at those locations. Subsequent to that transaction, a majority of the mortgage operation employees made arrangements to transfer to different financial institutions, which similarly agreed to assume certain leases and fixed assets at those respective locations. Sales and assumption agreements with different financial institutions were consummated in 2019. All related transactions were completed by December 31, 2019. The Company no longer has continuing involvement with mortgage banking operations. The Company discontinued issuing IRLCs in its name in May 2019 and originating mortgage loans held for sale in its name in June 2019. Income and expense related to mortgage banking operations are included in discontinued operations and prior period financial information has been retrospectively adjusted for the impact of discontinued operations. Liabilities for costs associated with discontinued operations were recognized and measured initially at their fair values during the quarter ended June 30, 2019 and adjusted on December 31, 2019. Those costs include, but are not limited to, involuntary employee termination benefits, cost to terminate contracts, and other associated costs. The liability itself consists of future cash flows expected to be incurred in the exit and disposal activity, which are discounted at a credit-adjusted risk-free interest rate. The following table summarizes the one-time charge on net loss on disposal of discontinued operations, for the year ended December 31, 2019:
Severance benefits 147,948$ Leases, software & other contractual obligations 360,613 Fixed asset losses 30,423 Other costs 305,915
Net Loss on Disposal 844,899$
The following table presents results of discontinued operations for the years ended December 31, 2020, and 2019:
Year Ended December 31,2020 2019
Net interest income -$ 170,782$
Gain on sale of loans - 4,813,660 Other - 190
Total noninterest income - 4,813,850
Salaries and benefits - 4,480,025 Occupancy - 232,360 Data processing fees - 584,369 Professional fees - 107,972 Advertising - 118,801 Net loss on disposal - 844,899 Other - 299,761
Total noninterest expense - 6,668,187
Loss from discontinued operations - (1,683,555) Benefit for income taxes - (427,627)
Net loss from discontinued operations -$ (1,255,928)$
12
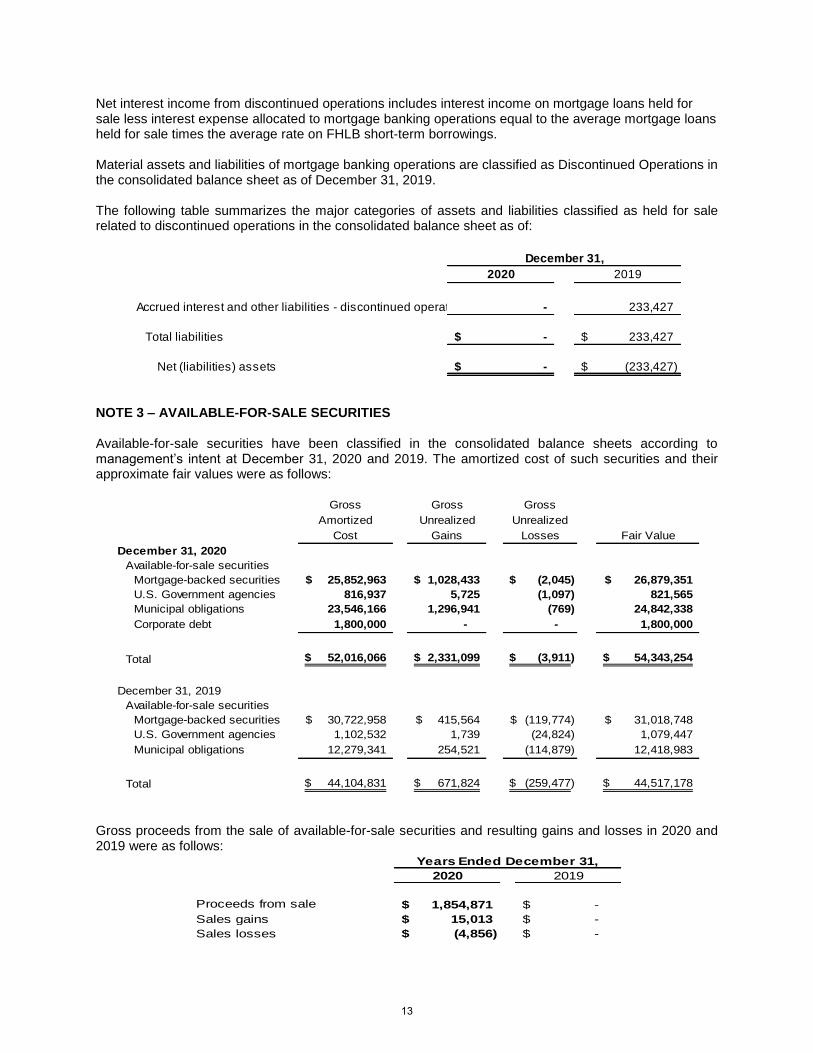
Net interest income from discontinued operations includes interest income on mortgage loans held for sale less interest expense allocated to mortgage banking operations equal to the average mortgage loans held for sale times the average rate on FHLB short-term borrowings. Material assets and liabilities of mortgage banking operations are classified as Discontinued Operations in the consolidated balance sheet as of December 31, 2019. The following table summarizes the major categories of assets and liabilities classified as held for sale related to discontinued operations in the consolidated balance sheet as of:
December 31,2020 2019
Accrued interest and other liabilities - discontinued operations - 233,427
Total liabilities -$ 233,427$
Net (liabilities) assets -$ (233,427)$
NOTE 3 – AVAILABLE-FOR-SALE SECURITIES Available-for-sale securities have been classified in the consolidated balance sheets according to management’s intent at December 31, 2020 and 2019. The amortized cost of such securities and their approximate fair values were as follows:
Gross Gross GrossAmortized Unrealized Unrealized
Cost Gains Losses Fair ValueDecember 31, 2020
Available-for-sale securitiesMortgage-backed securities 25,852,963$ 1,028,433$ (2,045)$ 26,879,351$ U.S. Government agencies 816,937 5,725 (1,097) 821,565 Municipal obligations 23,546,166 1,296,941 (769) 24,842,338 Corporate debt 1,800,000 - - 1,800,000
Total 52,016,066$ 2,331,099$ (3,911)$ 54,343,254$
December 31, 2019Available-for-sale securities
Mortgage-backed securities 30,722,958$ 415,564$ (119,774)$ 31,018,748$ U.S. Government agencies 1,102,532 1,739 (24,824) 1,079,447 Municipal obligations 12,279,341 254,521 (114,879) 12,418,983
Total 44,104,831$ 671,824$ (259,477)$ 44,517,178$
Gross proceeds from the sale of available-for-sale securities and resulting gains and losses in 2020 and 2019 were as follows:
Years Ended December 31,2020 2019
1,854,871$ -$ Sales gains 15,013$ -$ Sales losses (4,856)$ -$
Proceeds from sale
13

Amortized cost and fair value of securities by contractual maturity as of December 31, 2020 and 2019 are shown below. For purposes of the maturity table, mortgage-backed securities, which are not due at a single maturity date, have been allocated over maturity groupings based on the actual contractual maturities of underlying collateral. Expected maturities may differ from contractual maturities because borrowers may call or prepay obligations. The scheduled maturities of available-for-sale securities at December 31, 2020 and 2019 were as follows:
December 31, 2020 December 31, 2019Amortized Fair Amortized Fair
Cost Value Cost Value
2,978,393$ 3,030,784$ -$ -$ Due after one to five years 29,673,627 30,980,536 27,151,751 27,510,536 Due after five to ten years 13,379,347 14,244,927 14,048,273 14,163,270 Due after ten years 5,984,699 6,087,007 2,904,807 2,843,372
Totals 52,016,066$ 54,343,254$ 44,104,831$ 44,517,178$
Due in one year or less
At December 31, 2020 and 2019, mortgage-backed securities included collateralized mortgage obligations of $9.8 million and $13.4 million, respectively, which are backed by single-family mortgage loans. The Company does not hold any securities backed by commercial real estate loans. Gross Unrealized Losses and Fair Value – The following tables show the gross unrealized losses and fair values of securities by length of time that individual securities in each category have been in a continuous loss position.
December 31, 2020
Gross Gross GrossDescription of Unrealized Unrealized Unrealized
Securities Fair Value Losses Fair Value Losses Fair Value Losses
Available-for-sale securities:Mortgage-backed securities 1,133,125$ (2,045)$ -$ -$ 1,133,125$ (2,045)$ U.S. Government agencies 424,680 (830) 210,371 (267) 635,051 (1,097)
Municipal obligations 1,789,908 (769) - - 1,789,908 (769)
Total temporarily impaired
securities 3,347,713$ (3,644)$ 210,371$ (267)$ 3,558,084$ (3,911)$
Less Than 12 Months 12 Months or More Total
December 31, 2019 Less Than 12 Months 12 Months or More Total Gross Gross Gross
Description of Unrealized Unrealized Unrealized Securities Fair Value Losses Fair Value Losses Fair Value Losses
Available-for-sale securities: Mortgage-backed securities $ 10,201,840 $ (64,195 ) $ 6,459,069 $ (55,579 ) $ 16,660,909 $ (119,774 ) U.S. Government agencies - - 843,719 (24,824 ) 843,719 (24,824 )
Municipal obligations 4,676,851 (114,879 ) - - 4,676,851 (114,879 )
Total temporarily impaired
securities $ 14,878,691 $ (179,074 ) $ 7,302,788 $ (80,403 ) $ 22,181,479 $ (259,477 )
14
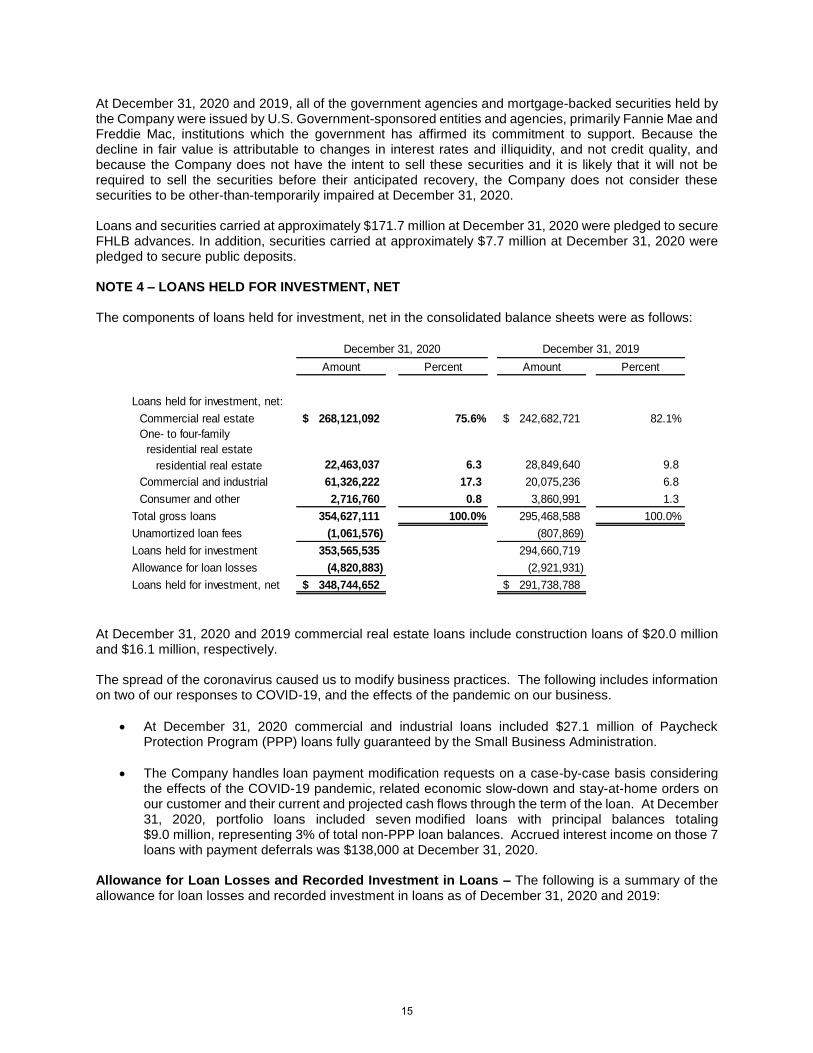
At December 31, 2020 and 2019, all of the government agencies and mortgage-backed securities held by the Company were issued by U.S. Government-sponsored entities and agencies, primarily Fannie Mae and Freddie Mac, institutions which the government has affirmed its commitment to support. Because the decline in fair value is attributable to changes in interest rates and illiquidity, and not credit quality, and because the Company does not have the intent to sell these securities and it is likely that it will not be required to sell the securities before their anticipated recovery, the Company does not consider these securities to be other-than-temporarily impaired at December 31, 2020. Loans and securities carried at approximately $171.7 million at December 31, 2020 were pledged to secure FHLB advances. In addition, securities carried at approximately $7.7 million at December 31, 2020 were pledged to secure public deposits. NOTE 4 – LOANS HELD FOR INVESTMENT, NET The components of loans held for investment, net in the consolidated balance sheets were as follows:
Amount Percent Amount Percent
Loans held for investment, net:Commercial real estate 268,121,092$ 75.6% 242,682,721$ 82.1%One- to four-family residential real estate
residential real estate 22,463,037 6.3 28,849,640 9.8Commercial and industrial 61,326,222 17.3 20,075,236 6.8Consumer and other 2,716,760 0.8 3,860,991 1.3
Total gross loans 354,627,111 100.0% 295,468,588 100.0%Unamortized loan fees (1,061,576) (807,869) Loans held for investment 353,565,535 294,660,719 Allowance for loan losses (4,820,883) (2,921,931) Loans held for investment, net 348,744,652$ 291,738,788$
December 31, 2020 December 31, 2019
At December 31, 2020 and 2019 commercial real estate loans include construction loans of $20.0 million and $16.1 million, respectively. The spread of the coronavirus caused us to modify business practices. The following includes information on two of our responses to COVID-19, and the effects of the pandemic on our business.
At December 31, 2020 commercial and industrial loans included $27.1 million of Paycheck Protection Program (PPP) loans fully guaranteed by the Small Business Administration.
The Company handles loan payment modification requests on a case-by-case basis considering
the effects of the COVID-19 pandemic, related economic slow-down and stay-at-home orders on our customer and their current and projected cash flows through the term of the loan. At December 31, 2020, portfolio loans included seven modified loans with principal balances totaling $9.0 million, representing 3% of total non-PPP loan balances. Accrued interest income on those 7 loans with payment deferrals was $138,000 at December 31, 2020.
Allowance for Loan Losses and Recorded Investment in Loans – The following is a summary of the allowance for loan losses and recorded investment in loans as of December 31, 2020 and 2019:
15

As of December 31, 2020
Commercial Real Estate
One- to Four-Family Residential Real Estate
Commercial and Industrial Other Total
Allowance for loan lossesEnding balance: individually
evaluated for impairment -$ -$ -$ -$ -$ Ending balance: collectively
evaluated for impairment 4,051,438 299,007 426,409 44,029 4,820,883
Total 4,051,438$ 299,007$ 426,409$ 44,029$ 4,820,883$
Gross loansEnding balance: individually
evaluated for impairment 2,442,002$ 279,063$ -$ -$ 2,721,065$ Ending balance: collectively
evaluated for impairment 265,679,090 22,183,974 61,326,222 2,716,760 351,906,046 Total 268,121,092$ 22,463,037$ 61,326,222$ 2,716,760$ 354,627,111$
As of December 31, 2019
Commercial Real Estate
One- to Four-Family Residential Real Estate
Commercial and Industrial Other Total
Allowance for loan lossesEnding balance: individually
evaluated for impairment -$ -$ -$ -$ -$ Ending balance: collectively
evaluated for impairment 2,588,714 187,345 115,502 30,370 2,921,931
Total 2,588,714$ 187,345$ 115,502$ 30,370$ 2,921,931$
Gross loansEnding balance: individually
evaluated for impairment 2,718,731$ 786,557$ -$ -$ 3,505,288$ Ending balance: collectively
evaluated for impairment 239,963,990 28,063,083 20,075,236 3,860,991 291,963,300 Total 242,682,721$ 28,849,640$ 20,075,236$ 3,860,991$ 295,468,588$
The following is a summary of activities for the allowance for loan losses for the years ended December 31, 2020 and 2019:
Commercial Real Estate
One- to Four-Family Residential
Real EstateCommercial
and IndustrialConsumer and Other Total
Balance December 31, 2019 2,588,714$ 187,345$ 115,502$ 30,370$ 2,921,931$
Provision for loan losses 1,462,724 156,710 310,907 13,659 1,944,000
Charge-offs - (53,254) - - (53,254) Recoveries - 8,206 - - 8,206 Net (charge-offs) recoveries - (45,048) - - (45,048)
Balance December 31, 2020 4,051,438$ 299,007$ 426,409$ 44,029$ 4,820,883$
Balance December 31, 2018 2,130,124$ 359,705$ 377,180$ 34,082$ 2,901,091$
Provision for loan losses 458,590 (169,193) (263,185) (3,712) 22,500
Charge-offs - (8,686) - - (8,686) Recoveries - 5,519 1,507 - 7,026 Net (charge-offs) recoveries - (3,167) 1,507 - (1,660)
Balance December 31, 2019 2,588,714$ 187,345$ 115,502$ 30,370$ 2,921,931$
16
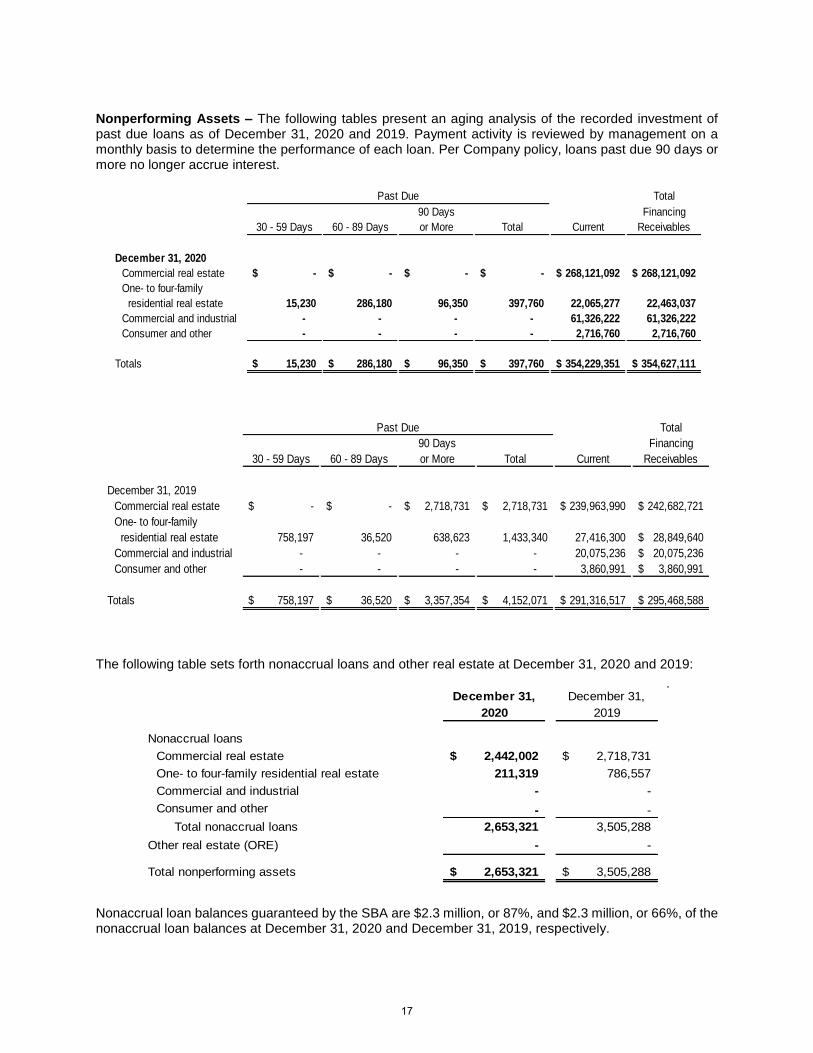
Nonperforming Assets – The following tables present an aging analysis of the recorded investment of past due loans as of December 31, 2020 and 2019. Payment activity is reviewed by management on a monthly basis to determine the performance of each loan. Per Company policy, loans past due 90 days or more no longer accrue interest.
Total90 Days Financing
30 - 59 Days 60 - 89 Days or More Total Current Receivables
December 31, 2020Commercial real estate -$ -$ -$ -$ 268,121,092$ 268,121,092$ One- to four-family residential real estate 15,230 286,180 96,350 397,760 22,065,277 22,463,037 Commercial and industrial - - - - 61,326,222 61,326,222 Consumer and other - - - - 2,716,760 2,716,760
Totals 15,230$ 286,180$ 96,350$ 397,760$ 354,229,351$ 354,627,111$
Past Due
Total90 Days Financing
30 - 59 Days 60 - 89 Days or More Total Current Receivables
December 31, 2019Commercial real estate -$ -$ 2,718,731$ 2,718,731$ 239,963,990$ 242,682,721$ One- to four-family residential real estate 758,197 36,520 638,623 1,433,340 27,416,300 28,849,640$ Commercial and industrial - - - - 20,075,236 20,075,236$ Consumer and other - - - - 3,860,991 3,860,991$
Totals 758,197$ 36,520$ 3,357,354$ 4,152,071$ 291,316,517$ 295,468,588$
Past Due
The following table sets forth nonaccrual loans and other real estate at December 31, 2020 and 2019:
December 31, December 31,2020 2019
Nonaccrual loansCommercial real estate 2,442,002$ 2,718,731$ One- to four-family residential real estate 211,319 786,557 Commercial and industrial - - Consumer and other - -
Total nonaccrual loans 2,653,321 3,505,288 Other real estate (ORE) - -
Total nonperforming assets 2,653,321$ 3,505,288$
Nonaccrual loan balances guaranteed by the SBA are $2.3 million, or 87%, and $2.3 million, or 66%, of the nonaccrual loan balances at December 31, 2020 and December 31, 2019, respectively.
17
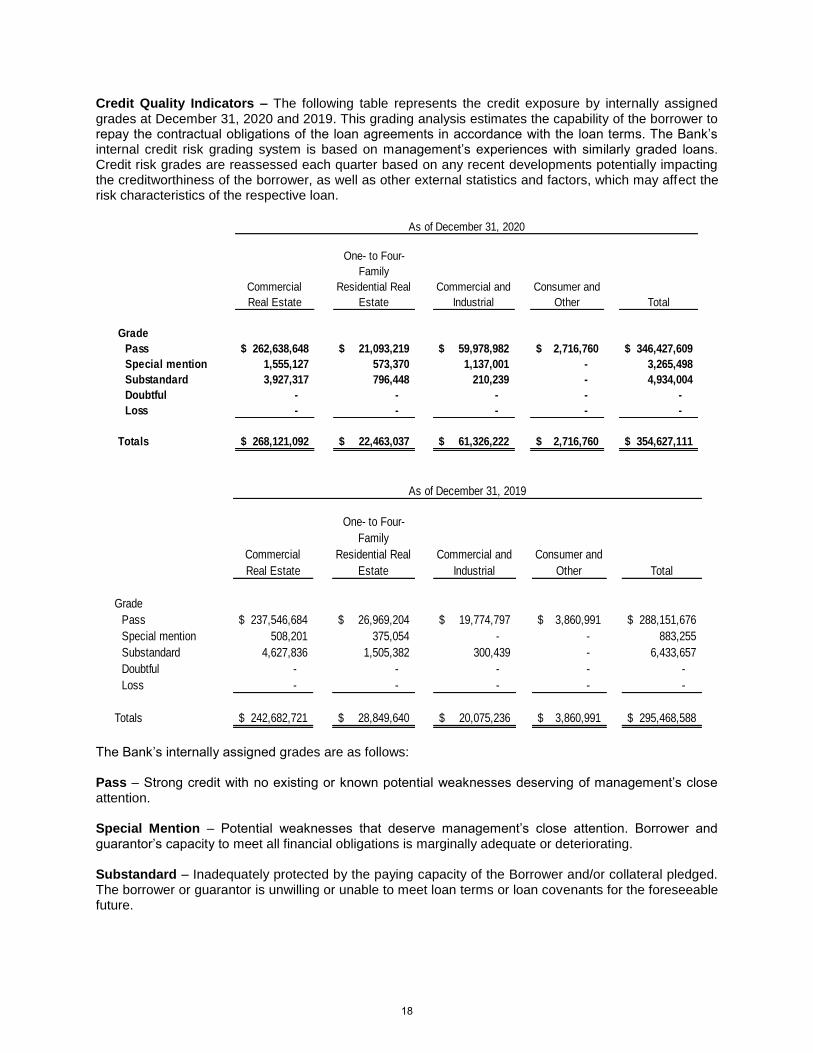
Credit Quality Indicators – The following table represents the credit exposure by internally assigned grades at December 31, 2020 and 2019. This grading analysis estimates the capability of the borrower to repay the contractual obligations of the loan agreements in accordance with the loan terms. The Bank’s internal credit risk grading system is based on management’s experiences with similarly graded loans. Credit risk grades are reassessed each quarter based on any recent developments potentially impacting the creditworthiness of the borrower, as well as other external statistics and factors, which may affect the risk characteristics of the respective loan.
Commercial Real Estate
One- to Four-Family
Residential Real Estate
Commercial and Industrial
Consumer and Other Total
GradePass 262,638,648$ 21,093,219$ 59,978,982$ 2,716,760$ 346,427,609$ Special mention 1,555,127 573,370 1,137,001 - 3,265,498 Substandard 3,927,317 796,448 210,239 - 4,934,004 Doubtful - - - - - Loss - - - - -
Totals 268,121,092$ 22,463,037$ 61,326,222$ 2,716,760$ 354,627,111$
As of December 31, 2020
Commercial Real Estate
One- to Four-Family
Residential Real Estate
Commercial and Industrial
Consumer and Other Total
GradePass 237,546,684$ 26,969,204$ 19,774,797$ 3,860,991$ 288,151,676$ Special mention 508,201 375,054 - - 883,255 Substandard 4,627,836 1,505,382 300,439 - 6,433,657 Doubtful - - - - - Loss - - - - -
Totals 242,682,721$ 28,849,640$ 20,075,236$ 3,860,991$ 295,468,588$
As of December 31, 2019
The Bank’s internally assigned grades are as follows: Pass – Strong credit with no existing or known potential weaknesses deserving of management’s close attention. Special Mention – Potential weaknesses that deserve management’s close attention. Borrower and guarantor’s capacity to meet all financial obligations is marginally adequate or deteriorating. Substandard – Inadequately protected by the paying capacity of the Borrower and/or collateral pledged. The borrower or guarantor is unwilling or unable to meet loan terms or loan covenants for the foreseeable future.
18

Doubtful – All the weakness inherent in one classified as substandard with the added characteristic that those weaknesses in place make the collection or liquidation in full, on the basis of current conditions, highly questionable and improbable. Loss – Considered uncollectible or no longer a bankable asset. This classification does not mean that the asset has absolutely no recoverable value. In fact, a certain salvage value is inherent in these loans. Nevertheless, it is not practical or desirable to defer writing off a portion or whole of a perceived asset even though partial recovery may be collected in the future. Impaired Loans – The following tables include the recorded investment and unpaid principal balances, net of charge-offs for impaired loans with the associated allowance amount, if applicable. Management determined the allocated allowance based on the present value of expected future cash flows, discounted at the loan’s effective interest rate, except when the remaining source of repayment for the loan is the operation or liquidation of the collateral. In those cases, the current fair value of the collateral, less selling costs was used to determine the allocated allowance recorded.
Principal AverageRecorded Net of Related Recorded
Investment Charge-offs Allowance Investment
With no related allowance recorded:Commercial real estate 2,442,002$ 2,442,002$ -$ 2,476,009$
One- to four-family residential real estate 279,063 279,063 - 282,181 Commercial and industrial - - - - Consumer and other - - - -
2,721,065$ 2,721,065$ -$ 2,758,190$
With an allowance recorded: -$ -$ -$ -$
Total:Commercial real estate 2,442,002$ 2,442,002$ -$ 2,476,009$
One- to four-family residential real estate 279,063 279,063 - 282,181 Commercial and industrial - - - - Consumer and other - - - -
2,721,065$ 2,721,065$ -$ 2,758,190$
As of December 31, 2020
Principal AverageRecorded Net of Related Recorded
Investment Charge-offs Allowance Investment
With no related allowance recorded:Commercial real estate 2,718,731$ 2,718,731$ -$ 2,738,545$
One- to four-family residential real estate 786,557 786,557 - 791,476 Commercial and industrial - - - - Consumer and other - - - -
3,505,288$ 3,505,288$ -$ 3,530,021$
With an allowance recorded: -$ -$ -$ -$
Total:Commercial real estate 2,718,731$ 2,718,731$ -$ 2,738,545$
One- to four-family residential real estate 786,557 786,557 - 791,476 Commercial and industrial - - - - Consumer and other - - - -
3,505,288$ 3,505,288$ -$ 3,530,021$
As of December 31, 2019
19

Certain loans within the Company’s loan and ORE portfolios are guaranteed by the Veterans Administration (VA). In the event of default by the borrower, the VA can elect to pay the guaranteed amount or take possession of the property. If the VA takes possession of the property, the Company is entitled to be reimbursed for the outstanding principal balance, accrued interest and certain other expenses. There were no commitments from the VA to take title to foreclosed VA properties at December 31, 2020 and 2019. Troubled Debt Restructurings – Restructured loans are considered “troubled debt restructurings” if due to the borrower’s financial difficulties, the Bank has granted a concession that they would not otherwise consider. This may include a transfer of real estate or other assets from the borrower, a modification of loan terms, rates, or a combination of the two. All troubled debt restructurings placed on nonaccrual status must show no less than six months of repayment performance by the borrower in accordance with contractual terms to return to accrual status. Once a loan has been identified as a troubled debt restructuring, it will continue to be reported as such until the loan is paid in full. In the normal course of business, the Company may modify a loan for a credit worthy borrower where the modified loan is not considered a troubled debt restructuring. In these cases, the modified terms are consistent with loan terms available to credit worthy borrowers and within normal loan pricing. The modifications to such loans are done according to existing underwriting standards which include review of historical financial statements, including current interim information if available, an analysis of the causes of the borrower’s decline in performance, and projections intended to assess repayment ability going forward. There was one troubled debt restructuring with a principal balance of less than $75,000 as of December 31, 2020 and December 31, 2019. NOTE 5 – PREMISES AND EQUIPMENT, NET Components of premises and equipment, net included in the consolidated balance sheets at December 31, 2020 and 2019 were as follows:
2020 2019Cost: Land and improvements 2,281,240$ 2,452,807$ Building and improvements 12,079,605 12,250,011 Furniture and equipment 1,852,760 1,790,529 Automobiles 91,387 91,387 Total cost 16,304,992 16,584,734Accumulated depreciation and amortization (8,000,560) (7,593,779)
Net book value 8,304,432$ 8,990,955$
At December 31,
Depreciation and amortization expense was $522,000 and $611,000 for the years ended December 31, 2020 and 2019, respectively. Fixed asset impairment expenses of $241,000 and $0 were reported in 2020 and 2019, respectively, to bring the carrying value of remote ATM properties held for sale at December 31, 2020 to estimated market value less cost to sell.
20
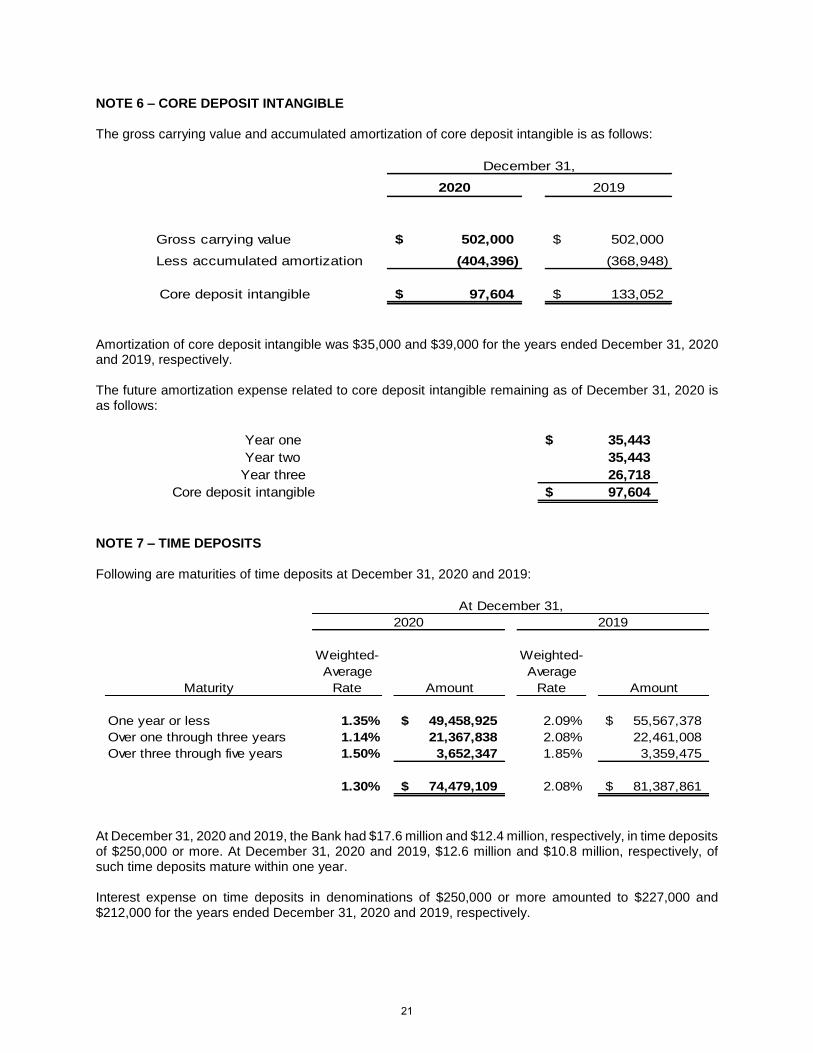
NOTE 6 – CORE DEPOSIT INTANGIBLE The gross carrying value and accumulated amortization of core deposit intangible is as follows:
December 31,2020 2019
Gross carrying value 502,000$ 502,000$ Less accumulated amortization (404,396) (368,948)
Core deposit intangible 97,604$ 133,052$
Amortization of core deposit intangible was $35,000 and $39,000 for the years ended December 31, 2020 and 2019, respectively. The future amortization expense related to core deposit intangible remaining as of December 31, 2020 is as follows:
Year one 35,443$ Year two 35,443
Year three 26,718 Core deposit intangible 97,604$
NOTE 7 – TIME DEPOSITS Following are maturities of time deposits at December 31, 2020 and 2019:
Weighted- Weighted-Average Average
Maturity Rate Amount Rate Amount
One year or less 1.35% 49,458,925$ 2.09% 55,567,378$ Over one through three years 1.14% 21,367,838 2.08% 22,461,008 Over three through five years 1.50% 3,652,347 1.85% 3,359,475
1.30% 74,479,109$ 2.08% 81,387,861$
2020 2019At December 31,
At December 31, 2020 and 2019, the Bank had $17.6 million and $12.4 million, respectively, in time deposits of $250,000 or more. At December 31, 2020 and 2019, $12.6 million and $10.8 million, respectively, of such time deposits mature within one year. Interest expense on time deposits in denominations of $250,000 or more amounted to $227,000 and $212,000 for the years ended December 31, 2020 and 2019, respectively.
21
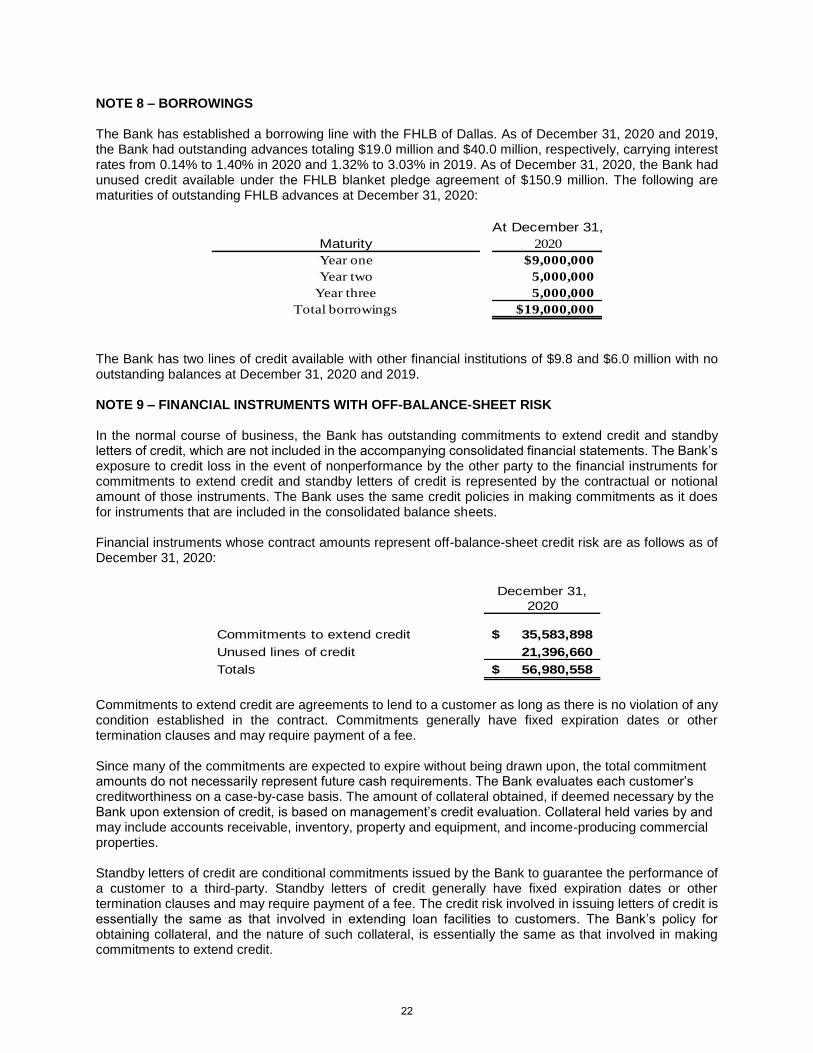
NOTE 8 – BORROWINGS The Bank has established a borrowing line with the FHLB of Dallas. As of December 31, 2020 and 2019, the Bank had outstanding advances totaling $19.0 million and $40.0 million, respectively, carrying interest rates from 0.14% to 1.40% in 2020 and 1.32% to 3.03% in 2019. As of December 31, 2020, the Bank had unused credit available under the FHLB blanket pledge agreement of $150.9 million. The following are maturities of outstanding FHLB advances at December 31, 2020:
At December 31,Maturity 2020
Year one $9,000,000
Year two 5,000,000
Year three 5,000,000
Total borrowings $19,000,000
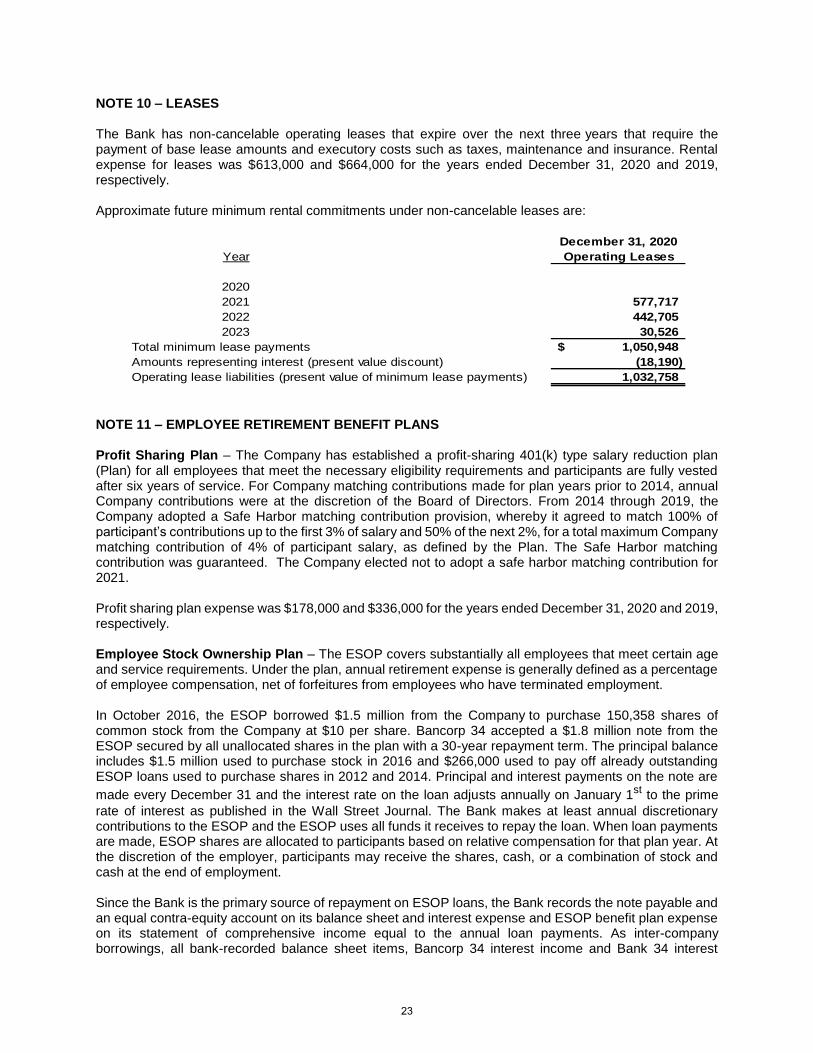
The Bank has two lines of credit available with other financial institutions of $9.8 and $6.0 million with no outstanding balances at December 31, 2020 and 2019. NOTE 9 – FINANCIAL INSTRUMENTS WITH OFF-BALANCE-SHEET RISK In the normal course of business, the Bank has outstanding commitments to extend credit and standby letters of credit, which are not included in the accompanying consolidated financial statements. The Bank’s exposure to credit loss in the event of nonperformance by the other party to the financial instruments for commitments to extend credit and standby letters of credit is represented by the contractual or notional amount of those instruments. The Bank uses the same credit policies in making commitments as it does for instruments that are included in the consolidated balance sheets. Financial instruments whose contract amounts represent off-balance-sheet credit risk are as follows as of December 31, 2020:
December 31,2020
Commitments to extend credit 35,583,898$ Unused lines of credit 21,396,660 Totals 56,980,558$
Commitments to extend credit are agreements to lend to a customer as long as there is no violation of any condition established in the contract. Commitments generally have fixed expiration dates or other termination clauses and may require payment of a fee. Since many of the commitments are expected to expire without being drawn upon, the total commitment amounts do not necessarily represent future cash requirements. The Bank evaluates each customer’s creditworthiness on a case-by-case basis. The amount of collateral obtained, if deemed necessary by the Bank upon extension of credit, is based on management’s credit evaluation. Collateral held varies by and may include accounts receivable, inventory, property and equipment, and income-producing commercial properties. Standby letters of credit are conditional commitments issued by the Bank to guarantee the performance of a customer to a third-party. Standby letters of credit generally have fixed expiration dates or other termination clauses and may require payment of a fee. The credit risk involved in issuing letters of credit is essentially the same as that involved in extending loan facilities to customers. The Bank’s policy for obtaining collateral, and the nature of such collateral, is essentially the same as that involved in making commitments to extend credit.
22
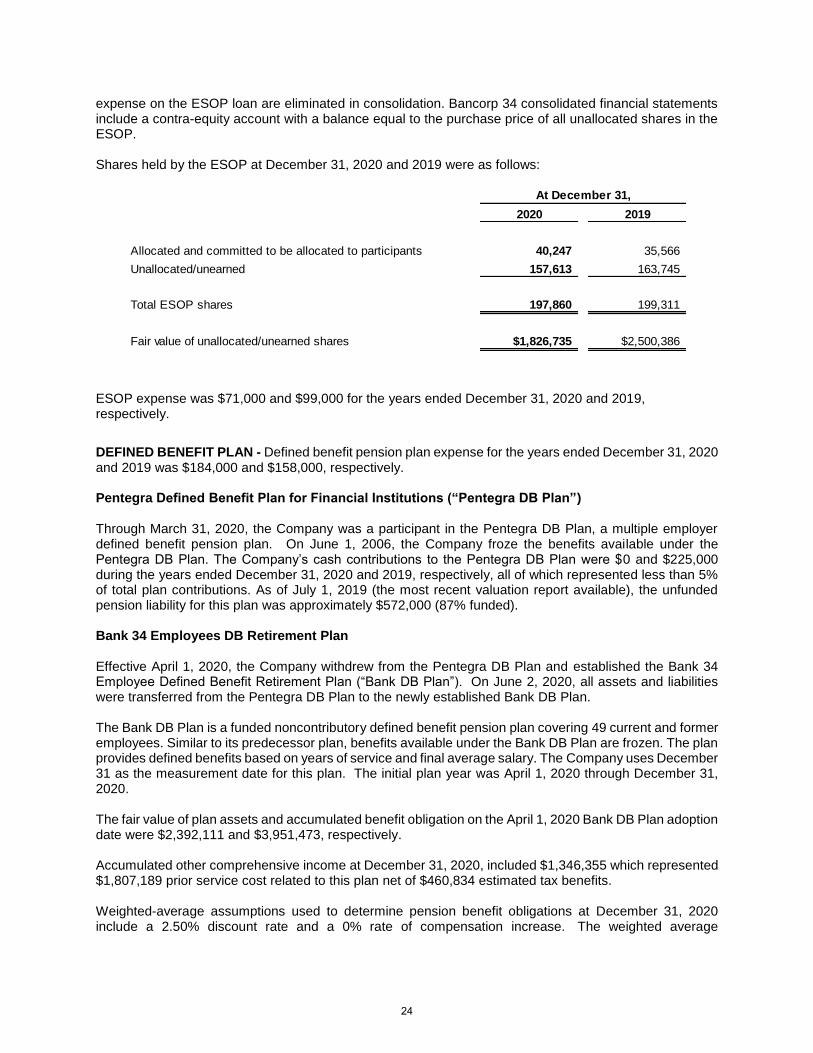
NOTE 10 – LEASES The Bank has non-cancelable operating leases that expire over the next three years that require the payment of base lease amounts and executory costs such as taxes, maintenance and insurance. Rental expense for leases was $613,000 and $664,000 for the years ended December 31, 2020 and 2019, respectively. Approximate future minimum rental commitments under non-cancelable leases are:
December 31, 2020Year Operating Leases
20202021 577,7172022 442,7052023 30,526
Total minimum lease payments 1,050,948$ Amounts representing interest (present value discount) (18,190)Operating lease liabilities (present value of minimum lease payments) 1,032,758
NOTE 11 – EMPLOYEE RETIREMENT BENEFIT PLANS Profit Sharing Plan – The Company has established a profit-sharing 401(k) type salary reduction plan (Plan) for all employees that meet the necessary eligibility requirements and participants are fully vested after six years of service. For Company matching contributions made for plan years prior to 2014, annual Company contributions were at the discretion of the Board of Directors. From 2014 through 2019, the Company adopted a Safe Harbor matching contribution provision, whereby it agreed to match 100% of participant’s contributions up to the first 3% of salary and 50% of the next 2%, for a total maximum Company matching contribution of 4% of participant salary, as defined by the Plan. The Safe Harbor matching contribution was guaranteed. The Company elected not to adopt a safe harbor matching contribution for 2021. Profit sharing plan expense was $178,000 and $336,000 for the years ended December 31, 2020 and 2019, respectively. Employee Stock Ownership Plan – The ESOP covers substantially all employees that meet certain age and service requirements. Under the plan, annual retirement expense is generally defined as a percentage of employee compensation, net of forfeitures from employees who have terminated employment. In October 2016, the ESOP borrowed $1.5 million from the Company to purchase 150,358 shares of common stock from the Company at $10 per share. Bancorp 34 accepted a $1.8 million note from the ESOP secured by all unallocated shares in the plan with a 30-year repayment term. The principal balance includes $1.5 million used to purchase stock in 2016 and $266,000 used to pay off already outstanding ESOP loans used to purchase shares in 2012 and 2014. Principal and interest payments on the note are made every December 31 and the interest rate on the loan adjusts annually on January 1st to the prime rate of interest as published in the Wall Street Journal. The Bank makes at least annual discretionary contributions to the ESOP and the ESOP uses all funds it receives to repay the loan. When loan payments are made, ESOP shares are allocated to participants based on relative compensation for that plan year. At the discretion of the employer, participants may receive the shares, cash, or a combination of stock and cash at the end of employment. Since the Bank is the primary source of repayment on ESOP loans, the Bank records the note payable and an equal contra-equity account on its balance sheet and interest expense and ESOP benefit plan expense on its statement of comprehensive income equal to the annual loan payments. As inter-company borrowings, all bank-recorded balance sheet items, Bancorp 34 interest income and Bank 34 interest
23
expense on the ESOP loan are eliminated in consolidation. Bancorp 34 consolidated financial statements include a contra-equity account with a balance equal to the purchase price of all unallocated shares in the ESOP. Shares held by the ESOP at December 31, 2020 and 2019 were as follows:
2020 2019
Allocated and committed to be allocated to participants 40,247 35,566 Unallocated/unearned 157,613 163,745
Total ESOP shares 197,860 199,311
Fair value of unallocated/unearned shares $1,826,735 $2,500,386
At December 31,
ESOP expense was $71,000 and $99,000 for the years ended December 31, 2020 and 2019, respectively.
DEFINED BENEFIT PLAN - Defined benefit pension plan expense for the years ended December 31, 2020 and 2019 was $184,000 and $158,000, respectively. Pentegra Defined Benefit Plan for Financial Institutions (“Pentegra DB Plan”) Through March 31, 2020, the Company was a participant in the Pentegra DB Plan, a multiple employer defined benefit pension plan. On June 1, 2006, the Company froze the benefits available under the Pentegra DB Plan. The Company’s cash contributions to the Pentegra DB Plan were $0 and $225,000 during the years ended December 31, 2020 and 2019, respectively, all of which represented less than 5% of total plan contributions. As of July 1, 2019 (the most recent valuation report available), the unfunded pension liability for this plan was approximately $572,000 (87% funded). Bank 34 Employees DB Retirement Plan Effective April 1, 2020, the Company withdrew from the Pentegra DB Plan and established the Bank 34 Employee Defined Benefit Retirement Plan (“Bank DB Plan”). On June 2, 2020, all assets and liabilities were transferred from the Pentegra DB Plan to the newly established Bank DB Plan. The Bank DB Plan is a funded noncontributory defined benefit pension plan covering 49 current and former employees. Similar to its predecessor plan, benefits available under the Bank DB Plan are frozen. The plan provides defined benefits based on years of service and final average salary. The Company uses December 31 as the measurement date for this plan. The initial plan year was April 1, 2020 through December 31, 2020. The fair value of plan assets and accumulated benefit obligation on the April 1, 2020 Bank DB Plan adoption date were $2,392,111 and $3,951,473, respectively. Accumulated other comprehensive income at December 31, 2020, included $1,346,355 which represented $1,807,189 prior service cost related to this plan net of $460,834 estimated tax benefits. Weighted-average assumptions used to determine pension benefit obligations at December 31, 2020 include a 2.50% discount rate and a 0% rate of compensation increase. The weighted average
24
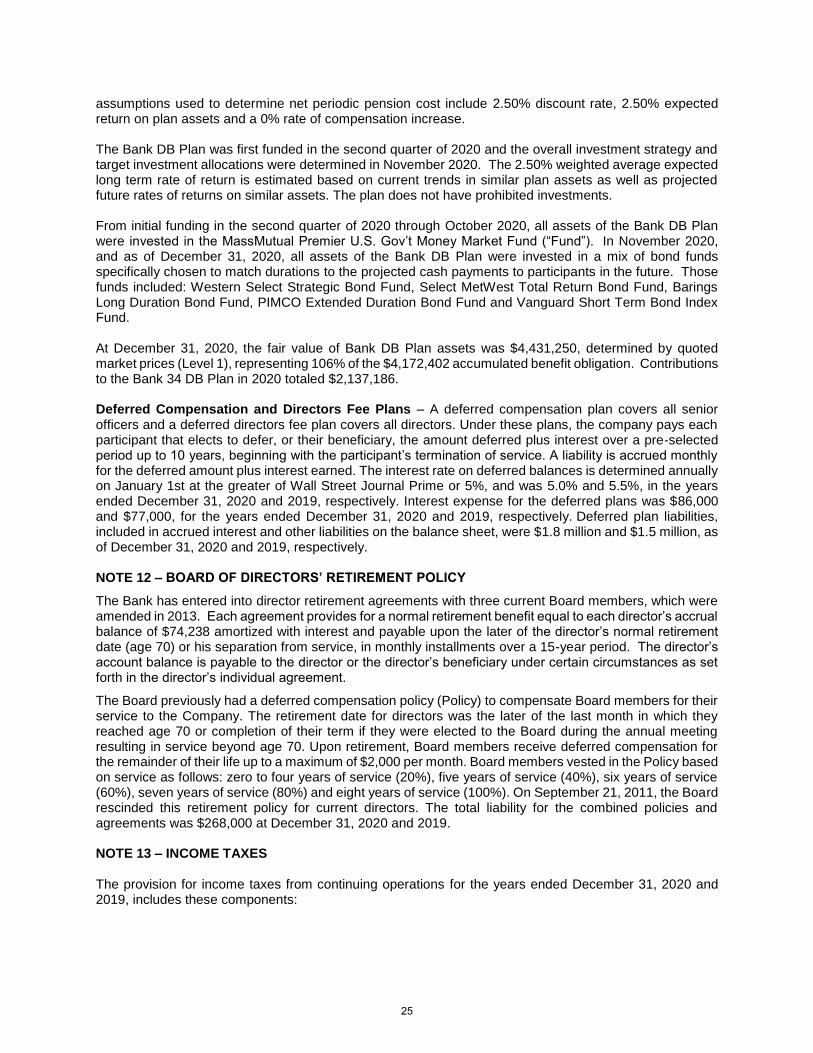
assumptions used to determine net periodic pension cost include 2.50% discount rate, 2.50% expected return on plan assets and a 0% rate of compensation increase. The Bank DB Plan was first funded in the second quarter of 2020 and the overall investment strategy and target investment allocations were determined in November 2020. The 2.50% weighted average expected long term rate of return is estimated based on current trends in similar plan assets as well as projected future rates of returns on similar assets. The plan does not have prohibited investments. From initial funding in the second quarter of 2020 through October 2020, all assets of the Bank DB Plan were invested in the MassMutual Premier U.S. Gov’t Money Market Fund (“Fund”). In November 2020, and as of December 31, 2020, all assets of the Bank DB Plan were invested in a mix of bond funds specifically chosen to match durations to the projected cash payments to participants in the future. Those funds included: Western Select Strategic Bond Fund, Select MetWest Total Return Bond Fund, Barings Long Duration Bond Fund, PIMCO Extended Duration Bond Fund and Vanguard Short Term Bond Index Fund. At December 31, 2020, the fair value of Bank DB Plan assets was $4,431,250, determined by quoted market prices (Level 1), representing 106% of the $4,172,402 accumulated benefit obligation. Contributions to the Bank 34 DB Plan in 2020 totaled $2,137,186. Deferred Compensation and Directors Fee Plans – A deferred compensation plan covers all senior officers and a deferred directors fee plan covers all directors. Under these plans, the company pays each participant that elects to defer, or their beneficiary, the amount deferred plus interest over a pre-selected period up to 10 years, beginning with the participant’s termination of service. A liability is accrued monthly for the deferred amount plus interest earned. The interest rate on deferred balances is determined annually on January 1st at the greater of Wall Street Journal Prime or 5%, and was 5.0% and 5.5%, in the years ended December 31, 2020 and 2019, respectively. Interest expense for the deferred plans was $86,000 and $77,000, for the years ended December 31, 2020 and 2019, respectively. Deferred plan liabilities, included in accrued interest and other liabilities on the balance sheet, were $1.8 million and $1.5 million, as of December 31, 2020 and 2019, respectively. NOTE 12 – BOARD OF DIRECTORS’ RETIREMENT POLICY
The Bank has entered into director retirement agreements with three current Board members, which were amended in 2013. Each agreement provides for a normal retirement benefit equal to each director’s accrual balance of $74,238 amortized with interest and payable upon the later of the director’s normal retirement date (age 70) or his separation from service, in monthly installments over a 15-year period. The director’s account balance is payable to the director or the director’s beneficiary under certain circumstances as set forth in the director’s individual agreement.
The Board previously had a deferred compensation policy (Policy) to compensate Board members for their service to the Company. The retirement date for directors was the later of the last month in which they reached age 70 or completion of their term if they were elected to the Board during the annual meeting resulting in service beyond age 70. Upon retirement, Board members receive deferred compensation for the remainder of their life up to a maximum of $2,000 per month. Board members vested in the Policy based on service as follows: zero to four years of service (20%), five years of service (40%), six years of service (60%), seven years of service (80%) and eight years of service (100%). On September 21, 2011, the Board rescinded this retirement policy for current directors. The total liability for the combined policies and agreements was $268,000 at December 31, 2020 and 2019. NOTE 13 – INCOME TAXES The provision for income taxes from continuing operations for the years ended December 31, 2020 and 2019, includes these components:
25
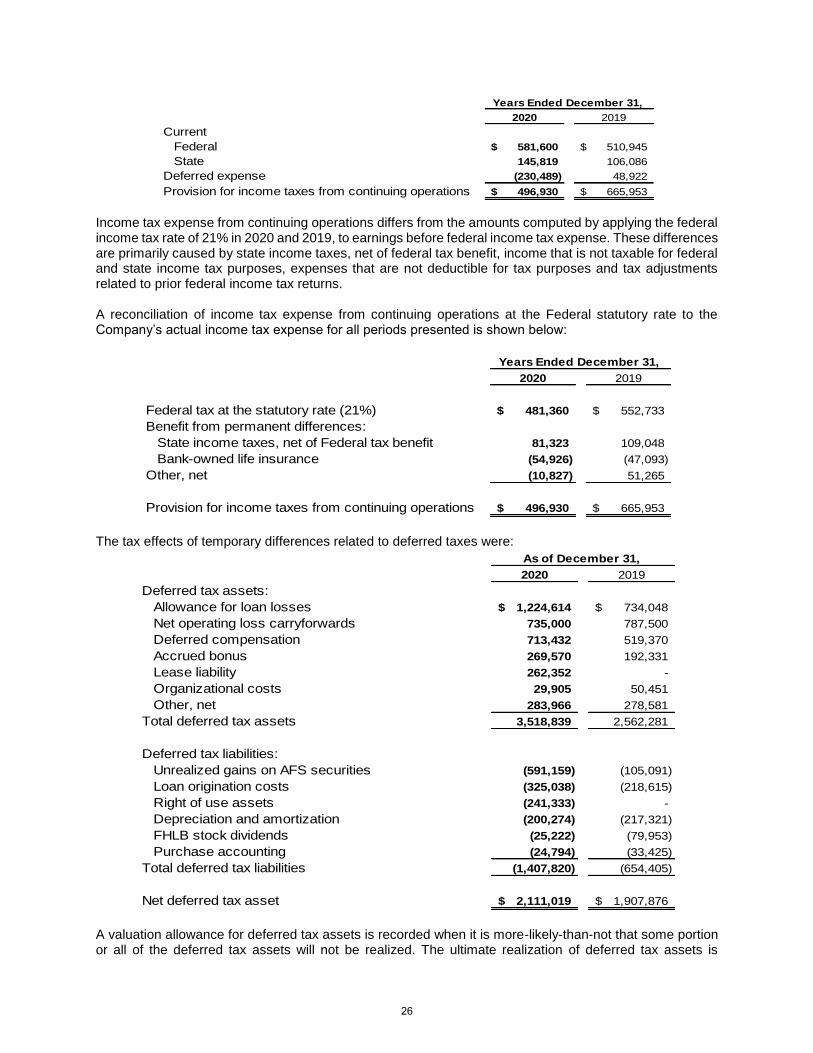
2020 2019Current Federal 581,600$ 510,945$ State 145,819 106,086 Deferred expense (230,489) 48,922 Provision for income taxes from continuing operations 496,930$ 665,953$
Years Ended December 31,
Income tax expense from continuing operations differs from the amounts computed by applying the federal income tax rate of 21% in 2020 and 2019, to earnings before federal income tax expense. These differences are primarily caused by state income taxes, net of federal tax benefit, income that is not taxable for federal and state income tax purposes, expenses that are not deductible for tax purposes and tax adjustments related to prior federal income tax returns. A reconciliation of income tax expense from continuing operations at the Federal statutory rate to the Company’s actual income tax expense for all periods presented is shown below:
2020 2019
Federal tax at the statutory rate (21%) 481,360$ 552,733$ Benefit from permanent differences: State income taxes, net of Federal tax benefit 81,323 109,048 Bank-owned life insurance (54,926) (47,093) Other, net (10,827) 51,265
Provision for income taxes from continuing operations 496,930$ 665,953$
Years Ended December 31,
The tax effects of temporary differences related to deferred taxes were:
2020 2019Deferred tax assets: Allowance for loan losses 1,224,614$ 734,048$ Net operating loss carryforwards 735,000 787,500 Deferred compensation 713,432 519,370 Accrued bonus 269,570 192,331 Lease liability 262,352 - Organizational costs 29,905 50,451 Other, net 283,966 278,581 Total deferred tax assets 3,518,839 2,562,281
Deferred tax liabilities: Unrealized gains on AFS securities (591,159) (105,091) Loan origination costs (325,038) (218,615) Right of use assets (241,333) - Depreciation and amortization (200,274) (217,321) FHLB stock dividends (25,222) (79,953) Purchase accounting (24,794) (33,425) Total deferred tax liabilities (1,407,820) (654,405)
Net deferred tax asset 2,111,019$ 1,907,876$
As of December 31,
A valuation allowance for deferred tax assets is recorded when it is more-likely-than-not that some portion or all of the deferred tax assets will not be realized. The ultimate realization of deferred tax assets is
26

dependent upon the generation of future taxable income and tax planning strategies which will create taxable income during the periods in which those temporary differences become deductible. Management considered the scheduled reversal of deferred tax liabilities, projected future taxable income, NOL carry-back potential, and tax planning strategies in making this assessment. Based upon the Company’s assessment of all available evidence, management determined it was more-likely-than-not that the net deferred tax asset would be realized at December 31, 2020. At December 31, 2020, the Company had federal operating loss carry-forwards of approximately $3.5 million, all of which are subject to Internal Revenue Code (“IRC”) Section 382 limitations, which limit the annual use of acquired losses to $250,000 per year, and begin to expire in 2028. At December 31, 2020, the Company has recorded deferred tax assets of $735,000 related to the Federal net operating loss carry-forwards. It is the Company’s policy to provide for uncertain tax positions and the related interest and penalties based upon management’s assessment of whether a tax benefit is more likely than not to be sustained upon examination by tax authorities. As of December 31, 2020 and 2019, there were no material uncertain tax positions related to federal and state income tax matters. The Company does not expect the amounts of unrecognized tax benefits to significantly increase or decrease within the next 12 months. The Company files consolidated U.S. federal and various state income/franchise tax returns. The Company is no longer subject to examination by U.S. federal taxing authorities for years before 2016 and is no longer subject to examination by state taxing authorities for years before 2015. Our federal and state tax returns have not been audited for the past six years. On March 27, 2020, the Coronavirus Aid, Relief, and Economic Security Act (CARES Act) was enacted in response to the COVID-19 pandemic. The CARES Act, among other things, permits NOL carryovers and carrybacks to offset 100% of taxable income for taxable years beginning before 2021. In addition, the CARES Act allows NOLs incurred in 2018, 2019, and 2020 to be carried back to each of the five preceding taxable years to generate a refund of previously paid income taxes. The Company has evaluated the impact of the CARES Act and determined that none of the changes would result in a material income tax benefit to the Company. NOTE 14 – REGULATORY MATTERS Bank 34 is subject to various regulatory capital requirements administered by the federal banking agencies. Failure to meet minimum capital requirements can initiate certain mandatory and discretionary actions by regulators that if undertaken, could have a direct material effect on the Bank’s financial statements. Under capital adequacy guidelines and the regulatory framework for prompt corrective action, the Bank must meet specific capital guidelines involving quantitative measures of the Bank’s assets, liabilities and certain off-balance-sheet items as calculated under regulatory accounting practices. The Bank’s capital amounts and classification are also subject to qualitative judgments by the regulators about components, risk-weightings and other factors. Quantitative measures established by regulation to ensure capital adequacy require the Bank to maintain minimum amounts and ratios of total risk-based capital and Tier 1 capital to risk-weighted assets, and Tier 1 capital to adjusted total assets. Management believes, as of December 31, 2020 and 2019, the Bank meets all capital adequacy requirements to which it is subject. Banks are also subject to certain restrictions on the amount of dividends that they may declare without prior regulatory approval. As of December 31, 2020, the Bank was categorized as well capitalized under the regulatory framework for prompt corrective action. To be categorized as well capitalized, the Bank has to maintain minimum total risk-based, Tier 1 risk-based, and Tier 1 leverage ratios as disclosed in the table below. There are no conditions or events that management believes have changed the Bank’s prompt corrective action
27

category. The Bank has not opted into the Community Bank Leverage Ratio (“CBLR”) and therefore is required to continue calculating and reporting risk-based capital ratios. The Bank’s actual and required capital amounts and ratios are as follows:
Amount Ratio Amount Ratio Amount Ratio
(Dollars in thousands)As of December 31, 2020:
Total Capital(to Risk-Weighted Assets) 46,789$ 13.15% 28,465$ 8.00% 35,582$ 10.00%
Tier I Capital(to Risk-Weighted Assets) 42,337$ 11.90% 21,349$ 6.00% 28,465$ 8.00%
Common Equity Tier 1 Capital(to Risk-Weighted Assets) 42,337$ 11.90% 16,012$ 4.50% 23,128$ 6.50%
Tier I Capital(to Average Assets) 42,337$ 9.41% 17,995$ 4.00% 22,494$ 5.00%
As of December 31, 2019:
Total Capital(to Risk-Weighted Assets) 42,944$ 14.59% 23,554$ 8.00% 29,443$ 10.00%
Tier I Capital(to Risk-Weighted Assets) 39,982$ 13.58% 17,666$ 6.00% 23,554$ 8.00%
Common Equity Tier 1 Capital(to Risk-Weighted Assets) 39,982$ 13.58% 13,249$ 4.50% 19,138$ 6.50%
Tier I Capital(to Average Assets) 39,982$ 10.30% 15,529$ 4.00% 19,411$ 5.00%
To be WellCapitalized Under
For Capital Prompt CorrectiveActual Adequacy Purposes Action Provisions
NOTE 15 – RELATED PARTY TRANSACTIONS
The Bank periodically enters into transactions with its executive officers, directors, significant stockholders, and their affiliates (related parties). Transactions with such related parties in 2020 and 2019 included:
2020 2019Fees and bonuses paid to directors during the period 227,755$ 218,475$ Consulting fees paid to directors during the period 30,000$ -$ Deposits from related parties held by the Bank at end of period 2,381,064$ 2,392,225$
Years Ended December 31,
There were no loans to such related parties in 2020 or 2019.
NOTE 16 – STOCK-BASED COMPENSATION Stock-based expense for the years ended December 31, 2020 and 2019, included in Salaries and Benefits in our Consolidated Statements of Comprehensive Income, was $316,000 and $299,000, respectively.
28

The Company accounts for forfeitures when they occur by reversing any previously accrued compensation expense on forfeited options in accordance with ASC 718 Compensation – Stock Compensation. On November 17, 2017 the stockholders approved the adoption of the 2017 Equity Incentive Plan (“Incentive Plan”). The Incentive Plan provides for the grant of a maximum of 263,127 shares of the Company’s common stock of which up to 187,948 shares of common stock may be granted for stock options and 75,179 shares of common stock may be issued as restricted stock to Directors and employees of the Company. Stock options and restricted stock awards under the Incentive Plan vest at 20% per year beginning on the first anniversary of date of grant and have a maximum term of seven years. The stock option plan allows for net settlement of vested options. In a net settlement, the Company, at the direction of the optionee, net settles the options by issuing new shares to the optionee with a value, at the current per share trading price, equal to the total in-the-money or intrinsic value of the options less any necessary tax withholdings on the disqualifying disposition of Incentive Stock Options. The optionee is granted newly issued shares and a small amount of cash in lieu of partial shares. There were no net settlements in 2020 and in 2019, 40 shares of common stock were issued in net settlements. In 2019, 2,750 stock options were granted and 4,000 shares of restricted stock were issued. The average grant-date fair value of stock option awards granted in 2019 was $3.72. In 2020, 30,000 stock options were granted and 2,000 shares of restricted stock were issued. The average grant-date fair value of stock option awards granted in 2020 was $3.32. Grant-date fair values for 2020 and 2019 were computed using the Black Scholes Merton options pricing model with the following weighted average inputs and assumptions:
2020 2019
Grant date stock price and exercise price $10.20 $14.71Dividend yield 1.97% 0.86%Expected volatility 41.93% 25.10%Risk-free interest Rate 0.43% 1.84%Expected life in years 6 6
Years Ended December 31,
Historical data is used to estimate expected volatility and the term of options expected to be outstanding and takes into account that options are not transferable. The risk-free interest rate is based on the U.S. Treasury yield curve for the expected term in effect at the date of grant. A summary of stock option activity for the year ended December 31, 2020 is presented below:
AverageWeighted- Remaining AggregateAverage Contractual Intrinsic
Shares Exercise Price Term (years) Value
Outstanding, December 31, 2019 146,300 $ 14.92 5.0 $ 53,166 Granted 30,000 10.20Exercised -Forfeited or expired (2,550) 14.82
Outstanding, December 31, 2020 173,750 $ 14.10 4.4 $ -
Exercisable, December 31, 2020 85,190 $ 14.91 4.0 $ -
For the Year Ended December 31, 2020
29
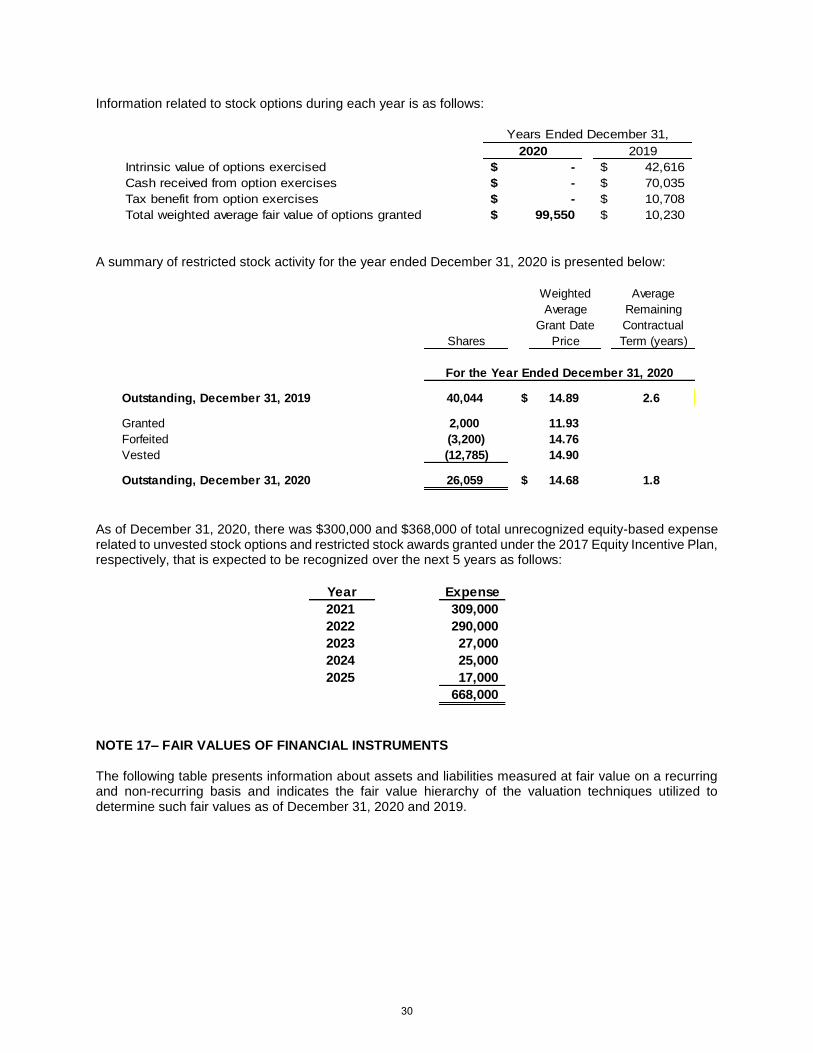
Information related to stock options during each year is as follows:
2020 2019Intrinsic value of options exercised -$ 42,616$ Cash received from option exercises -$ 70,035$ Tax benefit from option exercises -$ 10,708$ Total weighted average fair value of options granted 99,550$ 10,230$
Years Ended December 31,
A summary of restricted stock activity for the year ended December 31, 2020 is presented below:
Weighted AverageAverage Remaining
Grant Date ContractualShares Price Term (years)
Outstanding, December 31, 2019 40,044 $ 14.89 2.6
Granted 2,000 11.93Forfeited (3,200) 14.76Vested (12,785) 14.90
Outstanding, December 31, 2020 26,059 $ 14.68 1.8
For the Year Ended December 31, 2020
As of December 31, 2020, there was $300,000 and $368,000 of total unrecognized equity-based expense related to unvested stock options and restricted stock awards granted under the 2017 Equity Incentive Plan, respectively, that is expected to be recognized over the next 5 years as follows:
Year Expense2021 309,0002022 290,0002023 27,0002024 25,0002025 17,000
668,000
NOTE 17– FAIR VALUES OF FINANCIAL INSTRUMENTS The following table presents information about assets and liabilities measured at fair value on a recurring and non-recurring basis and indicates the fair value hierarchy of the valuation techniques utilized to determine such fair values as of December 31, 2020 and 2019.
30

Quoted Prices Significantin Active Other Significant
Markets for Observable UnobservableIdentical Assets Inputs Inputs
Level 1 Level 2 Level 3 Fair Value
December 31, 2020:Recurring basis
Mortgage-backed securities -$ 26,879,351$ -$ 26,879,351$ - 821,565 - 821,565
Municipal obligations - 24,842,338 - 24,842,338 Corporate debt - 1,800,000 - 1,800,000
Nonrecurring basisImpaired loans - - 2,721,065 2,721,065
Totals -$ 54,343,254$ 2,721,065$ 57,064,319$
December 31, 2019:Recurring basis
Mortgage-backed securities -$ 31,018,748$ -$ 31,018,748$ - 1,079,447 - 1,079,447
Municipal obligations - 12,418,983 - 12,418,983 Nonrecurring basis
Impaired loans - - 3,505,288 3,505,288
Totals -$ 44,517,178$ 3,505,288$ 48,022,466$
Fair Value Measurements Using
U.S. Government agencies
U.S. Government agencies
The fair values of certain of these instruments were calculated by discounting expected cash flows, which involves significant judgments by management and uncertainties. Fair value is the estimated amount at which financial assets or liabilities could be exchanged in a current transaction between willing parties, other than in a forced or liquidation sale. Because no market exists for certain of these financial instruments and because management does not intend to sell these financial instruments, the Bank does not know whether the fair values shown represent values at which the respective financial instruments could be sold individually or in the aggregate. There were no transfers between levels of the fair value hierarchy during the years ended December 31, 2020 or 2019. The following table presents the significant unobservable inputs used in the fair value measurements for Level 3 financial assets measured on a non-recurring basis:
Fair ValueValuation
Methodologies Valuation ModelUnobservable
Input ValuationAt December 31, 2020
Impaired loans
Commercial real estate 2,442,002$ AppraisalAppraisal discount and estimated
selling costs 17-18%
One- to four-family residential real estate 279,063 Appraisal
Appraisal discount and estimated selling costs 17-18%
Total Impaired Loans 2,721,065$
At December 31, 2019Impaired loans
Commercial real estate2,718,731$ Appraisal
Appraisal discount and estimated selling costs 17-18%
One- to four-family residential real estate 786,557 Appraisal
Appraisal discount and estimated selling costs 17-18%
Total Impaired Loans 3,505,288$
31
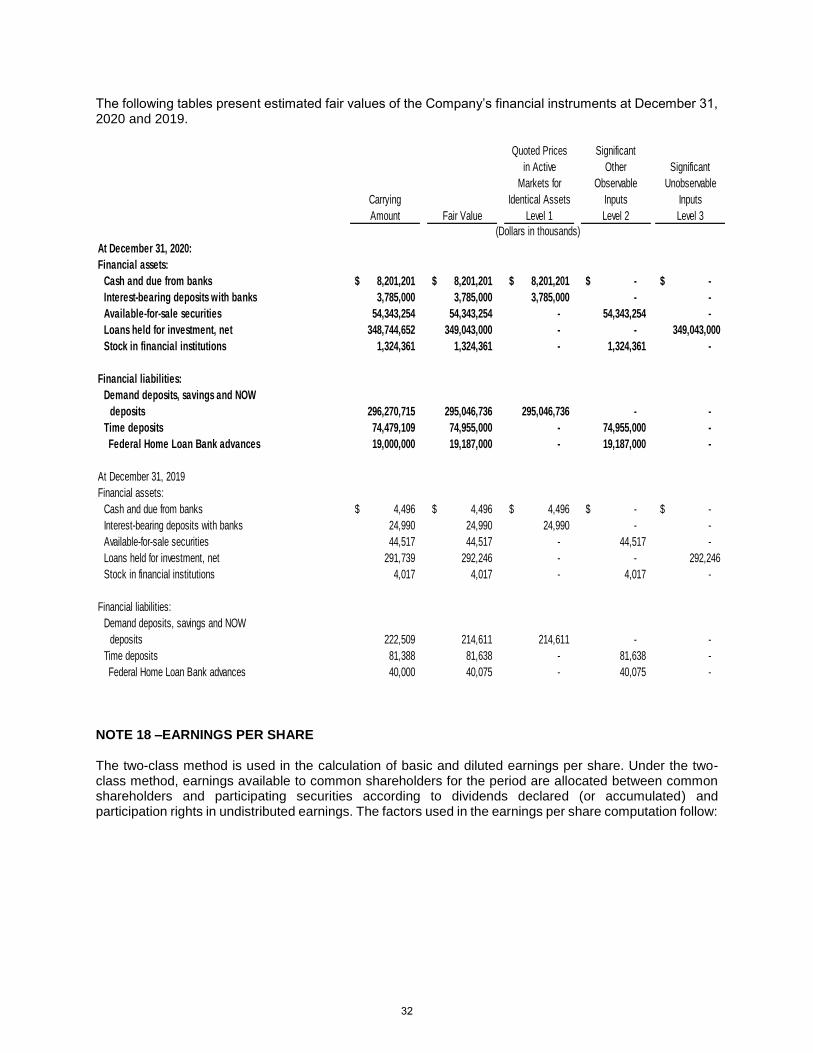
The following tables present estimated fair values of the Company’s financial instruments at December 31, 2020 and 2019.
Quoted Prices Significantin Active Other Significant
Markets for Observable UnobservableCarrying Identical Assets Inputs InputsAmount Fair Value Level 1 Level 2 Level 3
At December 31, 2020:Financial assets:
Cash and due from banks 8,201,201$ 8,201,201$ 8,201,201$ -$ -$ Interest-bearing deposits with banks 3,785,000 3,785,000 3,785,000 - - Available-for-sale securities 54,343,254 54,343,254 - 54,343,254 - Loans held for investment, net 348,744,652 349,043,000 - - 349,043,000 Stock in financial institutions 1,324,361 1,324,361 - 1,324,361 -
Financial liabilities:Demand deposits, savings and NOW
deposits 296,270,715 295,046,736 295,046,736 - - Time deposits 74,479,109 74,955,000 - 74,955,000 -
Federal Home Loan Bank advances 19,000,000 19,187,000 - 19,187,000 -
At December 31, 2019Financial assets:
Cash and due from banks 4,496$ 4,496$ 4,496$ -$ -$ Interest-bearing deposits with banks 24,990 24,990 24,990 - - Available-for-sale securities 44,517 44,517 - 44,517 - Loans held for investment, net 291,739 292,246 - - 292,246 Stock in financial institutions 4,017 4,017 - 4,017 -
Financial liabilities:Demand deposits, savings and NOW
deposits 222,509 214,611 214,611 - - Time deposits 81,388 81,638 - 81,638 -
Federal Home Loan Bank advances 40,000 40,075 - 40,075 -
(Dollars in thousands)
NOTE 18 –EARNINGS PER SHARE The two-class method is used in the calculation of basic and diluted earnings per share. Under the two-class method, earnings available to common shareholders for the period are allocated between common shareholders and participating securities according to dividends declared (or accumulated) and participation rights in undistributed earnings. The factors used in the earnings per share computation follow:
32

2020 2019
Basic:Net income from continuing operations 1,795,259$ 1,966,107$ Net loss from discontinued operations - (1,255,928) Less: Earnings allocated to participating securities (23,520) (11,456)
Net income allocated to common shareholders 1,771,739$ 698,723$
Weighted-average common shares outstanding including participating securities 3,185,081 3,298,548Less: Average participating securities (39,660) (48,982)Less: Average unallocated ESOP Shares (157,876) (164,096)
Average shares 2,987,545 3,085,470
Basic earnings per common share - continuing operations 0.59$ 0.64$ Basic loss per common share - discontinued operations - (0.41)
Basic earnings per common share 0.59$ 0.23$ Diluted:
Net income allocated to common shareholders 1,771,739$ 698,723$
Weighted-average common shares outstanding for basic earnings per common share 2,987,545 3,085,470Add: Dilutive effects of assumed exercises of stock options 3,755 2,766
Weighted average shares and dilutive potential common shares 2,991,300 3,088,236
Diluted earnings per common share - continuing operations 0.59$ 0.64$ Diluted loss per common share - discontinued operations - (0.41)
Diluted earnings per common share 0.59$ 0.23$
Year Ended December 31,
Participating securities are restricted stock awards since they participate in common stock dividends. Stock options for 149,000 and 4,000 shares of common stock were not considered in computing diluted earnings per common share for 2020 and 2019, because they were antidilutive.
33