
2015 RPS Plan - Public Version (00155671).DOCX
198
BEFORE THE PUBLIC UTILITIES COMMISSION OF THE STATE OF CALIFORNIA Order Instituting Rulemaking to Continue Implementation and Administration, and Consider Further Development of, California Renewables Portfolio Standard Program. Rulemaking 15-02-020 (Filed February 26, 2015) PACIFIC GAS AND ELECTRIC COMPANY’S (U 39 E) FINAL 2015 RENEWABLE ENERGY PROCUREMENT PLAN (PUBLIC VERSION) [Redactions in Appendices A, B, C, D, F (in its entirety) and H] Dated: January 14, 2016 CHARLES R. MIDDLEKAUFF M. GRADY MATHAI-JACKSON Pacific Gas and Electric Company P.O. Box 7442 San Francisco, CA 94120 Telephone: (415) 973-6971 Facsimile: (415) 973-5520 Email: [email protected] Attorneys for PACIFIC GAS AND ELECTRIC COMPANY FILED 1-14-16 04:59 PM
-
Upload
khangminh22 -
Category
Documents
-
view
0 -
download
0
Transcript of 2015 RPS Plan - Public Version (00155671).DOCX
BEFORE THE PUBLIC UTILITIES COMMISSION OF THE STATE OF CALIFORNIA
Order Instituting Rulemaking to Continue Implementation and Administration, and Consider Further Development of, California Renewables Portfolio Standard Program.
Rulemaking 15-02-020 (Filed February 26, 2015)
PACIFIC GAS AND ELECTRIC COMPANY’S (U 39 E)
FINAL 2015 RENEWABLE ENERGY PROCUREMENT PLAN
(PUBLIC VERSION)
[Redactions in Appendices A, B, C, D, F (in its entirety) and H]
Dated: January 14, 2016
CHARLES R. MIDDLEKAUFF M. GRADY MATHAI-JACKSON
Pacific Gas and Electric Company P.O. Box 7442 San Francisco, CA 94120 Telephone: (415) 973-6971 Facsimile: (415) 973-5520 Email: [email protected]
Attorneys for PACIFIC GAS AND ELECTRIC COMPANY
FILED1-14-1604:59 PM

1
BEFORE THE PUBLIC UTILITIES COMMISSION OF THE STATE OF CALIFORNIA
Order Instituting Rulemaking to Continue Implementation and Administration, and Consider Further Development of, California Renewables Portfolio Standard Program.
Rulemaking 15-02-020 (Filed February 26, 2015)
PACIFIC GAS AND ELECTRIC COMPANY’S (U 39 E) FINAL 2015
RENEWABLE ENERGY PROCUREMENT PLAN
(PUBLIC VERSION)
Pursuant to Ordering Paragraph (“OP”) 2 in Decision (“D.”) 15-12-025, Pacific Gas and
Electric Company (“PG&E”) respectfully submits its final 2015 Renewable Portfolio Standard
Procurement Plan (“2015 RPS Plan”), which has been modified consistent with D.15-12-025.
This filing includes both clean and redlined versions of the public and confidential versions of
PG&E’s 2015 RPS Plan, with the redline showing changes from the draft 2015 RPS Plan filed
on August 4, 2015. The redlines show all changes made subsequent to, and in compliance with,
the Commission’s approval of the draft 2015 RPS Plan on December 17, 2015. A clean version
of the public 2015 RPS Plan is included as Attachment A and a redline version is included as
Attachment B. A clean version of the confidential 2015 RPS Plan is included as Attachment C
to the confidential version of this filing and a redline version is included as Attachment D to the
confidential version of this filing.
PG&E is also providing the following table, which describes the substantive changes
made in the 2015 RPS Plan as well as the basis for the change. The table below does not include
the correction of grammar, typos, or minor updates in the 2015 RPS Plan. PG&E included minor

2
updates to some portions of the 2015 RPS Plan to reflect legislative or regulatory events which
occurred after the 2015 RPS Plan was filed on August 4, 2015.
Final 2015 RPS Plan Reference
General Description of Change Authority for Change in D.15-12-025
Introduction Changed to reflect approval of PG&E’s 2015 RPS Plan
OP 1
Section 1.2 Added language that PG&E is required to seek permission from the Commission to procure any renewable energy amounts during the time period covered by the 2015 RPS Plan, except for RPS amounts that are separately mandated.
OP 9
Section 2.2 Statutory requirement for the Commission to report on the procurement expenditure limit (“PEL”) by January 1, 2016 was deleted in Senate Bill (“SB”) 350 from California Public Utilities Code Section 399.15, so the date reference was deleted from Section 2.2.
Update
Section 2.3 Added reference to Commission decision approving SB 1122 contracts and tariffs.
Update
Section 2.4 Added section regarding the passage of SB 350. Update and reflecting discussion on pp. 5-6 of D.15-12-025
Section 3.3.1 Added language that PG&E is required to seek permission from the Commission to procure any renewable energy amounts during the time period covered by the 2015 RPS Plan, except for RPS amounts that are separately mandated.
OP 9
Section 7 Included language indicating that the Commission was not specifically approving a bank size proposal and instead would be addressing the appropriate bank size in the implementation of SB 350.
P. 92
Section 9 Added language that PG&E is required to seek permission from the Commission to procure any renewable energy amounts during the time period covered by the 2015 RPS Plan, except for RPS amounts that are separately mandated.
OP 9
Section 9 Added language in response to Ordering Paragraph 7 regarding ensuring there is no double counting between the Integration Cost Adder and Net Market
OP 7

3
Final 2015 RPS Plan Reference
General Description of Change Authority for Change in D.15-12-025
Value components in the Least-Cost Best-Fit methodology.
Section 9.1 Updating Time of Delivery (“TOD”) factors. OP 7
Respectfully submitted, CHARLES R. MIDDLEKAUFF M. GRADY MATHAI-JACKSON By: /s/ Charles R. Middlekauff CHARLES R. MIDDLEKAUFF
Pacific Gas and Electric Company P.O. Box 7442 San Francisco, CA 94120 Telephone: (415) 973-6971 Facsimile: (415) 973-5520 E-mail: [email protected]
Attorneys for PACIFIC GAS AND ELECTRIC COMPANY Dated: January 14, 2016
VERIFICATION
I, Brendan Lucker, am an employee of Pacific Gas and Electric Company, a corporation,
and am authorized to make this verification on its behalf. I have read the foregoing Pacific Gas
and Electric Company’s (U 39 E) Final 2015 Renewable Energy Procurement Plan (Public
Version).
The statements in the foregoing document are true to my own knowledge, except as to
matters which are therein stated on information and belief, and as to those matters I believe them
to be true. I declare under penalty of perjury that the foregoing is true and correct.
Executed on this 8th day of January, 2016 at San Francisco, California.
/s/ Brendan Lucker BRENDAN LUCKER
Manager, Renewable Energy Strategy Pacific Gas and Electric Company

ATTACHMENT A
Clean version of the Public 2015 RPS Plan

Public
PACIFIC GAS AND ELECTRIC COMPANY
RENEWABLES PORTFOLIO STANDARD
FINAL 2015 RENEWABLE ENERGY PROCUREMENT PLAN
JANUARY 14, 2016

i
Public
TABLE OF CONTENTS
1 Summary of Key Issues ....................................................................................... 1
1.1 PG&E’s RPS Position ............................................................................... 1
1.2 PG&E Will Not Hold a Request for Offers in 2015 .................................... 1
1.3 Consideration of Higher RPS Targets Should Be Integrated With Broader State Greenhouse Gas Goals ..................................................... 2
1.4 Renewable Portfolio Growth Increases Customer Rate Impacts .............. 3
1.5 PG&E’s Bank Is Necessary to Ensure Long-Term Compliance ................ 4
1.6 RPS Rules Should Be Applied Consistently and Equitably Across All LSEs .................................................................................................... 5
2 Summary of Important Recent Legislative/Regulatory Changes to the RPS Program ...................................................................................................... 5
2.1 Commission Implementation of Senate Bill 2 (1x) .................................... 5
2.2 Cost Containment ..................................................................................... 6
2.3 Implementation of Bioenergy Legislation .................................................. 7
2.4 Senate Bill 350 .......................................................................................... 7
3 Assessment of RPS Portfolio Supplies and Demand .......................................... 8
3.1 Supply and Demand to Determine the Optimal Mix of RPS Resources ................................................................................................. 8
3.2 Supply ....................................................................................................... 9
3.2.1 Existing Portfolio ............................................................................ 9
3.2.2 Impact of Green Tariff Shared Renewables Program .................. 11
3.2.3 RPS Market Trends and Lessons Learned .................................. 12
3.3 Demand .................................................................................................. 14
3.3.1 Near-Term Need for RPS Resources ........................................... 14
3.3.2 Portfolio Considerations ............................................................... 15
3.4 Anticipated Renewable Energy Technologies and Alignment of Portfolio With Expected Load Curves and Durations .............................. 15
3.5 RPS Portfolio Diversity ............................................................................ 16
3.6 Optimizing Cost, Value, and Risk for the Ratepayer ............................... 17
3.7 Long-Term RPS Optimization Strategy ................................................... 18
4 Project Development Status Update .................................................................. 19
5 Potential Compliance Delays ............................................................................. 20

TABLE OF CONTENTS
(CONTINUED)
ii
5.1 Project Financing .................................................................................... 21
5.2 Siting and Permitting ............................................................................... 23
5.3 Transmission and Interconnection .......................................................... 23
5.4 Curtailment of RPS Generating Resources ............................................ 25
5.5 Risk-Adjusted Analysis ........................................................................... 25
6 Risk Assessment ............................................................................................... 26
6.1 Risks Accounted for in Deterministic Model ............................................ 27
6.1.1 Standard Generation Variability ................................................... 28
6.1.2 Project Failure .............................................................................. 28
6.1.3 Project Delay ................................................................................ 30
6.2 Risks Accounted for in Stochastic Model ................................................ 31
6.2.1 Retail Sales Variability ................................................................. 32
6.2.2 RPS Generation Variability .......................................................... 33
6.2.3 Curtailment ................................................................................... 33
6.2.4 Project Failure Variability ............................................................. 34
6.2.5 Comparison of Model Assumptions .............................................. 35
6.3 How Deterministic Approach Is Modeled ................................................ 36
6.4 How Stochastic Approach Is Modeled .................................................... 37
6.5 Incorporation of the Above Risks in the Two Models Informs Procurement Need and Sales Opportunities ........................................... 38
7 Quantitative Information .................................................................................... 39
7.1 Deterministic Model Results ................................................................... 40
7.1.1 33% RPS Target Results ............................................................. 40
7.1.2 40% RPS Scenario Results ......................................................... 40
7.2 Stochastic Model Results ........................................................................ 41
7.2.1 Stochastically-Optimized Net Short to Meet Non-Compliance Risk Target ‒ 33% RPS Target .................................................... 41
7.2.2 Bank Size Forecasts and Results – 33% RPS Target .................. 43
7.2.3 Minimum Bank Size – 33% RPS Target ....................................... 44
7.2.4 Stochastically-Optimized Net Short to Meet Non-Compliance Risk Target ‒ 40% RPS Scenario ................................................ 46
7.2.5 Bank Size Forecasts and Results – 40% RPS Scenario .............. 47
7.2.6 Minimum Bank Size – 40% RPS Scenario ................................... 48
TABLE OF CONTENTS
(CONTINUED)
iii
7.3 Implications for Future Procurement ....................................................... 49
8 Margin of Procurement ...................................................................................... 50
8.1 Statutory Minimum Margin of Procurement ............................................. 50
8.2 Voluntary Margin of Procurement ........................................................... 51
9 Bid Selection Protocol ....................................................................................... 52
9.1 Proposed TOD Factors ........................................................................... 53
10 Consideration of Price Adjustment Mechanisms ............................................... 54
11 Economic Curtailment ....................................................................................... 55
12 Expiring Contracts ............................................................................................. 58
13 Cost Quantification ............................................................................................ 59
13.1 RPS Cost Impacts .................................................................................. 59
13.2 Procurement Expenditure Limit ............................................................... 60
13.3 Cost Impacts Due to Mandated Programs .............................................. 60
14 Imperial Valley ................................................................................................... 62
15 Important Changes to Plans Noted .................................................................... 63
16 Safety Considerations ....................................................................................... 65
16.1 Development and Operation of PG&E-Owned, RPS-Eligible Generation .............................................................................................. 65
16.2 Development and Operation of Third-Party–Owned, RPS-Eligible Generation .............................................................................................. 68
17 Energy Storage .................................................................................................. 70

iv
LIST OF APPENDICES
Appendix A: Redline Showing Changes in January 14, 2016 Final 2015 RPS Plan Compared to August 4, 2015 Draft RPS Plan
Appendix B: Project Development Status Update
Appendix C: Quantitative Information
Appendix C.1a: Renewable Net Short Calculations – 33% RPS Target
Appendix C.1b: Renewable Net Short Calculations – 40% RPS Scenario
Appendix C.2a: Alternate Renewable Net Short Calculations – 33% RPS Target
Appendix C.2b: Alternate Renewable Net Short Calculations – 40% RPS Scenario
Appendix D: Procurement Information Related to Cost Quantification
Appendix E: RPS-Eligible Contracts Expiring 2015-2025
Appendix F: Stochastic Modeling Results
Appendix F.1: Retail Sales Variability (2015 Vintage)
Appendix F.2a: Project Failure Variability – 33% RPS Target
Appendix F.2b: Project Failure Variability– 40% RPS Scenario
Appendix F.3a: RPS Generation Variability – 33% RPS Target
Appendix F.3b: RPS Generation Variability – 40% RPS Scenario
Appendix F.4a: RPS Deliveries Variability – 33% RPS Target
Appendix F.4b: RPS Deliveries Variability – 40% RPS Scenario
Appendix F.5a: RPS Target Variability – 33% RPS Target
Appendix F.5b: RPS Target Variability – 40% RPS Scenario
Appendix G: Other Modeling Assumptions Informing Quantitative Calculation
Appendix H: Responses to Renewable Net Short Questions
1
Pacific Gas and Electric Company (“PG&E”) respectfully submits its Final 2015
Renewables Portfolio Standard (“RPS”) Plan (“2015 RPS Plan”) to the California Public
Utilities Commission (“CPUC” or “Commission”) as directed by the Commission in
Decision (“D.”) 15-12-025. PG&E’s 2015 RPS Plan includes a summary of key issues
and important legislative and regulatory developments impacting California’s RPS
requirements, and then addresses each of the specific requirements identified in the
Assigned Commissioner’s Revised Ruling Identifying Issues and Schedule of Review
for 2015 Renewable Portfolio Standard Procurement Plans (“ACR”) issued in this
proceeding on May 28, 2015.1
1 Summary of Key Issues
1.1 PG&E’s RPS Position
PG&E projects that under both the current 33% RPS by 2020 target, as well as
a 40% by 2024 scenario, it is well-positioned to meet its RPS compliance requirements
for the second (2014-2016) and third (2017-2020) compliance periods and will not have
incremental procurement need until at least 2022. Under the current 33% RPS target,
PG&E projects that it will have incremental procurement need beginning in XXXX, after
applying banked volumes of excess procurement (“Bank”) beginning in XXX. Under the
40% RPS by 2024 scenario, PG&E projects that it will have incremental procurement
need beginning in XXXX, after applying Bank beginning in XXXX. In both situations,
PG&E anticipates additional steady, incremental long-term procurement in subsequent
years to avoid the need to procure large volumes in any single year to meet compliance
needs and maintain minimum Bank levels.
1.2 PG&E Will Not Hold a Request for Offers in 2015
Given its current RPS compliance position, PG&E will not hold an RPS
solicitation in 2015. PG&E has sufficient time in the coming years to respond to
changing market, load forecast, or regulatory conditions and will reassess the need for 1 See ACR, pp. 8-20.
2
future solicitations in next year’s RPS Plan. Although many factors could change its
RPS compliance position, PG&E believes that its existing portfolio of executed RPS
contracts, its owned RPS-eligible generation, and its expected Bank balances will be
adequate to ensure compliance with near-term RPS requirements. Additionally, PG&E
expects to procure additional volumes of incremental RPS-eligible contracts through
mandated procurement programs in 2016.2 PG&E will seek permission from the
Commission to procure any amounts other than amounts separately mandated by the
Commission (i.e., Feed-In Tariff (“FIT”) and RAM) during the time period covered by the
2015 solicitation cycle. In 2016, PG&E will reassess its Renewable Net Short (“RNS”)
position and determine its updated procurement needs. PG&E’s decision to not hold a
2015 RPS solicitation is consistent with a proposal made by San Diego Gas & Electric
Company (“SDG&E”) in its 2014 RPS Plan, and approved by the Commission given
SDG&E’s lack of need.3
1.3 Consideration of Higher RPS Targets Should Be Integrated With Broader State Greenhouse Gas Goals
California’s RPS has played, and will continue to play, an important role in
lowering electric sector greenhouse gas (“GHG”) emissions and meeting the state’s
clean energy goals. PG&E supports maintaining the existing requirements that load-
serving entities (“LSE”) provide a minimum of 33% RPS in 2020, moving towards 50%
in 2030. However, PG&E believes California’s clean energy policy should be centered
on achieving the most cost-effective GHG reductions needed to meet the Governor’s
2030 goal of emissions that are 40% below 1990 levels.4
2 Mandated programs include Renewable Auction Mechanism (“RAM”), Renewable Market
Adjusting Tariff (“ReMAT”), and Bioenergy Market Adjusting Tariff (“BioMAT”). In addition, while not pursuant to the RPS mandate, PG&E expects to procure additional volumes over the next year for the Green Tariff Shared Renewables (“GTSR”) Program.
3 D.14-11-032, p. 32, Ordering Paragraph 17.
4 Office of California Governor Edmund G. Brown, Executive Order 4-29-2015 (available at http://gov.ca.gov/news.php?id=18938).

3
Before taking any action that would increase the RPS requirements, the
Commission should consider how the RPS program fits within a comprehensive GHG
policy framework built to achieve emissions reductions through a combination of
actions, as opposed to potentially inefficient carve-out mechanisms.5 Renewable
energy policy should be more completely aligned with this broader policy context in
order to ensure that GHG reduction targets are achieved in an integrated and
economically efficient manner. Rather than reflexively raise the RPS targets, the CPUC
should adopt a strategy focused on flexibility, equitable rules for all LSEs, affordability,
and market and system stability.6
1.4 Renewable Portfolio Growth Increases Customer Rate Impacts
As a part of this RPS Plan, PG&E is providing historic and forecasted RPS cost
and rate information. From 2003-2015, PG&E’s annual RPS-eligible procurement and
generation costs have continued to increase. The costs of the RPS Program have
already and will continue to impact customer bills. From 2003-2016, PG&E estimates
its annual rate impact from RPS procurement has increased from 0.7 cents per
kilowatt-hour (“¢/kWh”) in 2003 to an estimated 3.5¢/kWh in 2016.7 The growth in rates
due to RPS procurement costs will continue to increase through 2020, as the average
rate impact is forecasted to increase to 3.9¢/kWh, or approximately $2.3 billion. Further
detail regarding RPS costs is provided in Section 13 and the annual rate impact of
forecasted procurement is detailed in Table 2 of Appendix D.
5 For further discussion of the cost impacts of mandated procurement programs,
see Section 13.3.
6 For further discussion, see PG&E’s opening and reply comments in response to Order Instituting Rulemaking to Continue Implementation and Administration, and Consider Further Development, of California Renewables Portfolio Standard Program (R.15-02-020) filed on March 26, 2015 and April 6, 2015, respectively.
7 “Annual Rate Impact” should be interpreted as an estimate of a system average bundled rate for RPS-eligible procurement and generation, not a renewable “premium.” In other words, the amount shown captures the total cost of the renewable generation and not the additional cost incurred by receiving renewable energy instead of an equivalent amount of energy from conventional generation sources.

4
To address these rate impacts, PG&E’s procurement strategy attempts to
minimize cost and maximize value to customers, while satisfying the RPS program
requirements. To accomplish this goal, PG&E promotes competitive processes to
procure incremental RPS volumes, strategically uses its Bank, and avoids long-term
over-procurement.
As described above, a more integrated GHG policy framework that enables
LSEs to adapt to changing needs, costs, and circumstances and manage the integration
of variable resources would provide additional opportunities to lower customer costs.
New technologies will emerge and the mix and cost-effectiveness of GHG emissions
reduction strategies will undoubtedly evolve over the next several years. PG&E
believes that a more flexible implementation of the RPS Program that allows LSEs to
optimize a portfolio of different GHG reduction strategies would facilitate meeting the
State’s environmental goals at the lowest possible costs and best portfolio fit, and
provide the maximum benefits to customers. Similarly, as discussed in Section 13.3,
mandated procurement programs within the RPS reduce the program’s efficiency while
increasing costs.
1.5 PG&E’s Bank Is Necessary to Ensure Long-Term Compliance
PG&E views its Bank as necessary to: (1) mitigate risks associated with
variability in load; (2) protect against project failure or delay exceeding forecasts; and
(3) avoid intentional over-procurement above the 33% RPS target by managing
year-to-year generation variability from performing RPS resources. The Bank allows
PG&E to mitigate the need to procure additional RPS products at potentially high
market prices in order to meet near-term compliance deadlines. With an adequate
Bank, PG&E aims to minimize customer cost by having the flexibility not to procure in
“seller’s market” situations. More information on forecasted Bank size and minimum
Bank levels under both 33% and 40% RPS is provided in Section 7 below.
PG&E will continue to assess the value to its customers of sales of surplus
procurement. Currently, PG&E’s RNS, future RPS cost projections, and assessment of

5
the current Renewable Energy Credit (“REC”) market do not lead to an expectation of
material projected sales of RECs. However, PG&E will consider selling surplus
non-bankable RPS volumes and may consider selling surplus bankable volumes if it can
still maintain an adequate Bank and if market conditions are favorable.
1.6 RPS Rules Should Be Applied Consistently and Equitably Across All LSEs
PG&E’s long-term position is a forecast based on a number of assumptions,
including a certain amount of load departure due to Community Choice Aggregation
(“CCA”) and distributed generation growth. While it is possible that this forecasted load
departure may not fully materialize or occur at the rate assumed in the forecast, PG&E’s
forecast is a reasonable scenario based on current trends. Under the existing
percentage-based RPS targets, any departure of PG&E’s load to CCAs naturally results
in both a reduction of PG&E’s required RPS procurement quantities and a
corresponding increase in RPS procurement by CCAs. Thus, CCAs will be required to
shoulder an increasing portion of the State’s RPS procurement goals. The consistent
and equitable application of all RPS rules and requirements to all Commission-
jurisdictional LSEs, including CCAs and Energy Service Providers (“ESPs”), will help to
ensure that all LSEs are helping California achieve its ambitious renewable
energy goals.
2 Summary of Important Recent Legislative/Regulatory Changes to the RPS Program
PG&E’s portfolio forecast and procurement decisions are influenced by ongoing
legislative and regulatory changes to the RPS Program. The following is a description
of recent changes to the RPS Program that have impacted PG&E’s RPS procurement.
2.1 Commission Implementation of Senate Bill 2 (1x)
Senate Bill (“SB”) 2 (1x), enacted in April 2011 and effective as of December 11,
2011, made significant changes to the RPS Program, most notably extending the RPS
goal from 20% of retail sales of all California investor-owned utilities (“IOUs”), ESPs,
publicly owned utilities, and CCAs by the end of 2010, to a goal of 33% of retail sales by

6
2020. The Commission issued an Order Instituting Rulemaking to implement SB 2 (1x)
in May 2011 and has subsequently issued a number of key decisions implementing
certain “high priority” issues needed to implement the complex provisions of SB 2 (1x).
In February 2015, the Commission opened a new Rulemaking (R.) 15-02-020 to
address remaining issues from this earlier proceeding, as well as other elements of the
ongoing administration of the RPS Program. Commission action on remaining and new
key issues may impact PG&E’s procurement need and actions going forward,
notwithstanding the forecasts and projections included in this Plan.
Key Commission decisions issued to date implementing SB 2 (1x) include
D.11-12-052 which defined portfolio content categories (“PCC”), D.11-12-020 which
outlined compliance period targets for the 33% RPS target, and D.12-06-038 which
implemented changes to the RPS compliance rules for retail sellers, including treatment
of prior procurement to meet RPS obligations for both the 20% and 33% RPS
Programs. D.12-06-038 also adopted rules on calculating the RPS Bank, meeting the
portfolio balance requirements, and for reporting annually to the Commission on RPS
procurement. Finally, on December 4, 2014, the CPUC adopted D.14-12-023 setting
RPS compliance and enforcement rules under SB 2 (1X).
2.2 Cost Containment
When California’s legislature passed SB 2 (1x), it required the CPUC to develop
a limitation on total RPS costs for each electrical corporation. The legislature specified
that the cost limitation must prevent the 33% RPS target from causing “disproportionate
rate impacts.” If PG&E exceeds the Commission-approved cost cap, it may refrain from
entering into new RPS contracts and constructing RPS-eligible facilities unless
additional procurement can be undertaken with only “de minimis” rate impacts.
PG&E has made every effort to procure least-cost and best-fit renewable
resources. However, recognizing the potential cost impact that RPS procurement can
have on customers, PG&E strongly supports the establishment of a clear, stable, and
meaningful Procurement Expenditure Limitation (“PEL”) that both informs procurement

7
planning and decisions, and promotes regulatory and market certainty. PG&E urges the
Commission to finalize the PEL as soon as possible.
2.3 Implementation of Bioenergy Legislation
On September 27, 2012, SB 1122 was passed, requiring California’s IOUs to
procure 250 megawatts (“MW”) in total of new small-scale bioenergy projects 3 MW or
less through the FIT Program. The total IOU program MWs are allocated into
three technology categories: 110 MW for biogas from wastewater plants and green
waste; 90 MW for dairy and other agriculture bioenergy; and 50 MW for forest waste
biomass. The allocation of MWs by project type for each IOU, as well as the program
design, is being determined by the Commission in proceedings currently underway.
PG&E has worked with the Commission and stakeholders in order to ensure that the
SB 1122 program is implemented in a way that balances the needs of the bioenergy
industry with clear cost containment mechanisms that protect customers from excessive
costs. On December 18, 2014, the Commission issued D.14-12-081 to implement
SB 1122 and required the IOUs to file a tariff and contract for SB 1122 eligible
generation. The IOUs filed their proposed contract and tariff on February 6, 2015,
which were approved with modifications in D.15-09-004. PG&E’s SB 1122 program
(“BioMAT”) began accepting participants on December 1, 2015 and the first program
period will start on February 1, 2016.
2.4 Senate Bill 350
On October 7, 2015, Governor Brown signed SB 350 (de Leon), known as the
Clean Energy and Pollution Reduction Act of 2015. Among other provisions, SB 350
increases the RPS target from 33% in 2020 to 50% in 2030. The Commission will begin
implementation of SB 350 in 2016.

8
3 Assessment of RPS Portfolio Supplies and Demand
3.1 Supply and Demand to Determine the Optimal Mix of RPS Resources
Meeting California’s RPS goals in a way that achieves the greatest value for
customers continues to be a top priority for PG&E. In particular, PG&E continues to
analyze its need to procure cost-effective resources that will enable it to achieve and
maintain California’s 33% RPS target. PG&E is currently required to procure the
following quantities of RPS-eligible products:
2011-2013 (First Compliance Period): 20% of the combined bundled retail sales.
2014-2016 (Second Compliance Period): A percentage of the combined bundled retail sales that is consistent with the following formula: (.217 * 2014 retail sales) + (.233 * 2015 retail sales) + (.25 * 2016 retail sales).
2017-2020 (Third Compliance Period): A percentage of the combined bundled retail sales that is consistent with the following formula: (.27 * 2017 retail sales) + (.29 * 2018 retail sales) + (.31 * 2019 retail sales) + (.33 * 2020 retail sales).
2021 and beyond: 33% of combined retail sales in 2021.8
Based on preliminary results presented in Appendix C.2a, PG&E delivered
27.0% of its power from RPS-eligible renewable sources in 2014.
As described more fully in Section 7 and reported in the current RNS
calculations in Appendix C.2a, based on forecasts and expectations of the ability of
contracted resources to deliver, PG&E is well-positioned to meet its RPS compliance
requirements for the second (2014-2016) and third (2017-2020) compliance periods.
Under the 33% RPS target, PG&E projects that it will not have incremental procurement
need until at least 2022, with need beginning in XXXX, after applying Bank beginning in
XXXX.
8 SB 350 establishes the following new multi-year RPS compliance period: 40% by the end
of 2021-2024; 45% by the end of 2025-2027; and 50% by the end of 2028-2030 and each year thereafter.
9
Under a 40% RPS scenario, PG&E modeled the same trajectory through 2020
as described above, but modeled the following RPS requirements starting in 2021:
33% of combined bundled retail sales in 2021;
37% of combined bundled retail sales in 2022;
37% of combined bundled retail sales in 2023; and
40% of combined bundled retail sales in 2024 and each year thereafter.
For this scenario, based on forecasts and expectations of the ability of
contracted resources to deliver, PG&E projects that it is well-positioned to meet its RPS
compliance requirements for the second (2014-2016) and third (2017-2020) compliance
periods. PG&E projects that it will have incremental procurement need beginning in
XXXX, after applying its Bank towards its physical net short beginning in XXXX.9
3.2 Supply
3.2.1 Existing Portfolio
PG&E’s existing RPS portfolio is comprised of a variety of technologies, project
sizes, and contract types. The portfolio includes over 8,000 MW of active projects,
ranging from utility-owned solar and small hydro generation to long-term RPS contracts
for large wind, geothermal, solar, and biomass to small FIT contracts for solar
photovoltaic (“PV”), biogas, and biomass generation. This robust and diversified supply
provides a solid foundation for meeting current and future compliance needs; however,
the portfolio is also subject to uncertainties as discussed below and in more detail in
Sections 6 and 7.
As described in further detail in Section 7.1, for the 2015 RPS Plan, PG&E
assumes a volumetric success rate for all executed in-development projects in its RPS
portfolio of approximately 99% of total contracted volumes. This rate continues its
general trend of increasing from 60% in RPS Plans prior to 2012, to 78% in PG&E’s
9 This projection includes future volumes from mandated programs, such as the RAM and
FIT Programs.

10
2012 RPS Plan, to 100% in PG&E’s 2013 RPS Plan, and 87% in PG&E’s 2014 RPS
Plan. This success rate is evolving and highly dependent on the nature of PG&E’s
portfolio, the general conditions in the renewable energy industry, and the timing of the
RPS Plan publication date relative to recent project terminations. While PG&E has
continued to see a general trend towards higher project success rates, the change in its
success rate assumption from 2014 to 2015 (from 87% to 99%) reflects the recent
removal of several projects from PG&E’s portfolio due to contract terminations and an
update to the “Closely Watched” category described in Section 6.
Consistent with the project trends reported in its 2014 RPS Plan, PG&E has
observed continued progress of key projects under development in its portfolio. Tax
incentives (e.g., the federal Investment Tax Credit (“ITC”) and Production Tax Credit
(“PTC”)) have continued to increase many projects’ cost-effectiveness, contributing to
their eventual completion. Progress in the siting and permitting of projects has also
supported PG&E’s sustained high success rate. As described in more detail in
Section 3, PG&E believes the renewable development market has stabilized for the
near-term and the renewable project financing sector will continue to evolve well into
the future.
Notwithstanding these positive trends, the timely development of renewable
energy facilities remains subject to many uncertainties and risks, including regulatory
and legal uncertainties, permitting and siting issues, technology viability, adequate fuel
supply, and the construction of sufficient transmission capacity. These challenges and
risks are described in more detail in Sections 5 and 6.
For purposes of calculating its demand for RPS-eligible products through the
modeling described in Section 6, PG&E does not assume that expiring RPS-eligible

11
contracts in its existing portfolio are re-contracted,10 although these resources are
encouraged to bid into PG&E’s future competitive solicitations.
3.2.2 Impact of Green Tariff Shared Renewables Program
In 2013, SB 43 enacted the GTSR Program that allows PG&E customers to
meet up to 100% of their energy usage with generation from eligible renewable energy
resources. On January 29, 2015, the Commission adopted D.15-01-051 implementing
a GTSR framework, approving the IOUs’ applications, and requiring the IOUs to begin
procurement for the GTSR Program in advance of customer enrollment.
Pursuant to D.15-01-051, PG&E has submitted several advice letters related to
implementation of the GTSR program that are currently pending before the
Commission. In February, PG&E filed an advice letter containing its plans for advance
procurement for the GTSR Program and identifying the eligible census tracts for
environmental justice projects in its service territories.11 In May, together with Southern
California Edison Company and SDG&E, PG&E submitted a Joint Procurement
Implementation Advice Letter, addressing each utility’s plans for ongoing GTSR
Program procurement and RPS resource and REC separation and tracking.12
Concurrently, PG&E filed a Marketing Implementation Advice Letter13 and a
Customer-Side Implementation Advice Letter14 with details regarding implementation.
In addition, to accommodate GTSR procurement, PG&E filed Advice Letter 4605-E to
10 Although the physical net short calculations in PG&E’s deterministic model do not include
any assumptions related to the re-contracting of expiring RPS-eligible contracts, the stochastic model can re-contract volumes to meet procurement need. Such re-contracting amounts are illustrative only and not prescriptive. PG&E’s deterministic and stochastic models are described in more detail below in Section 6.
11 PG&E Advice Letter 4593-E (supplemented March 25, 2015).
12 Advice Letter 4637-E.
13 Advice Letter 4638-E.
14 Advice Letter 4639-E.
12
change its RAM 6 Power Purchase Agreements (“PPA”) and Request for Offer (“RFO”)
instructions, consistent with the minimum goals for 2015 identified in D.15-01-051.15
The GTSR program will impact PG&E’s RPS position in two ways: (1) PG&E’s
RPS supply may be affected; and (2) PG&E’s retail sales will be reduced corresponding
to program participation. The GTSR decision permits the IOUs to supply Green Tariff
customers from an interim pool of existing RPS resources until new dedicated Green
Tariff projects come online. Generation from these interim facilities would no longer be
counted toward PG&E’s RPS targets, which will result in PG&E’s RPS supply
decreasing. However, there is also a possibility that RPS supply might increase in the
future if generation from Green Tariff dedicated projects exceeds the demand of Green
Tariff customers. PG&E will implement tracking and reporting protocols for tracking
RECs transferred to and from the RPS portfolio and Green Tariff programs. Because
the GTSR implementation Advice Letters discussed above16 have not yet been
approved, PG&E’s RNS calculation submitted with this RPS Plan does not reflect the
impact of GTSR on PG&E’s RPS position. Due to the relatively small volumes of the
GTSR interim pool compared to PG&E’s overall RNS position, PG&E believes that its
forecasts of meeting the second and third compliance period RPS targets as well as its
incremental need year under either a 33% or 40% RPS would remain the same once
these small GTSR volumes are incorporated. PG&E will update future RNS
calculations to reflect GTSR program impacts after the advice letters implementing the
program are approved.
3.2.3 RPS Market Trends and Lessons Learned
As PG&E’s renewable portfolio has expanded to meet the RPS goals, PG&E’s
procurement strategy has evolved. PG&E’s strategy continues to focus on the
three key goals of: (1) reaching, and sustaining, the 33% RPS target; (2) minimizing
15 See D.15-01-051, Section 4.2.4, pp. 25-28.
16 Advice Letters 4637-E, 4638-E and 4639-E.
13
customer cost within an acceptable level of risk; and (3) ensuring it maintains an
adequate Bank of surplus RPS volumes to manage annual load and generation
uncertainty. However, PG&E is continually adapting its strategy to accommodate new
emerging trends in the California renewable energy market and regulatory landscape.
The California renewable energy market has developed and evolved significantly
over the past few years. The market now offers a variety of technologies at generally
lower prices than seen in earlier years of the RPS Program. The share of these
technologies in PG&E’s portfolio is changing as a result. For some technologies, such
as solar PV, prices have dropped significantly due to various factors including
technological breakthroughs, government incentives, and improving economies of scale
as more projects come online.
Another trend driven by growth of renewable resources in the California
Independent System Operator (“CAISO”) system is the downward movement of mid-day
market prices. Many renewable energy project types have little to no variable costs and
therefore additions tend to move market clearing prices down the dispatch stack. This
has led to a change in the energy values associated with RPS offers, with decreasing
value of renewable projects that generate during mid-day hours.
The growth of renewable resources has also produced operational challenges,
such as overgeneration situations and negative market prices. Provisions that provide
PG&E with greater flexibility to economically bid RPS-eligible resources into the CAISO
markets are critical to helping address overgeneration and negative pricing situations
that are likely to increase in frequency in the future. These provisions have both
operational and customer benefits. From an operational perspective, this flexibility
allows PG&E to offer its RPS-eligible resources into the CAISO’s economic dispatch,
which can reduce the potential for overgeneration conditions and facilitate reliable
operation of the electrical grid. In addition, economic bidding enables RPS-eligible
resource generation to be curtailed during negative pricing intervals when it is economic

14
to do so, which protects customers from higher costs. Economic curtailment is
discussed in greater detail in Section 11.
3.3 Demand
PG&E’s demand for RPS-eligible resources is a function of multiple complex
factors including regulatory requirements and portfolio considerations. Compliance
rules for the RPS Program were established in D.12-06-038. In addition, the
Commission issued D.11-12-052, to define three statutory PCCs of RPS-eligible
products that retail sellers may use for RPS compliance, which impacts PG&E’s
demand for different types of RPS-eligible products. Finally, PG&E’s demand is a
function of the risk factors discussed in more detail in Section 6; in particular,
uncertainty around bundled retail sales can have a major impact on PG&E’s demand for
RPS resources, as further detailed below.
3.3.1 Near-Term Need for RPS Resources
Because PG&E has no incremental procurement need through XXXX under a
33% RPS requirement and through XXXX under a 40% RPS scenario, PG&E plans not
to hold an RPS solicitation in 2015. As discussed in the summary of key issues, PG&E
has sufficient time in the coming years to respond to changing market, load forecast, or
regulatory conditions and will reassess the need for future RFOs in next year’s
RPS Plan. Although many factors could change PG&E’s RPS compliance position,
PG&E believes that its existing portfolio of executed RPS-eligible contracts, its owned
RPS-eligible generation, and its expected Bank balances will be adequate to ensure
compliance with near-term RPS requirements. Additionally, PG&E expects to procure
additional volumes of incremental RPS-eligible contracts in 2016 through mandated
procurement programs, such as the RAM, ReMAT, and BioMAT Programs. PG&E will
seek permission from the Commission to procure any amounts other than amounts
separately mandated by the Commission (i.e., FIT and RAM) during the time period
covered by the 2015 solicitation cycle.

15
3.3.2 Portfolio Considerations
One of the most important portfolio considerations for PG&E is the forecast of
bundled load. PG&E’s most recent Load Forecast, which is used in this RPS Plan, is an
April 2015 updated version of the Alternate Scenario Forecast used in the 2014 Bundled
Procurement Plan (“BPP”) submitted in October 2014 in R.13-12-010. PG&E updates
the bundled load forecasts annually to reflect any new events and to capture actual load
changes. It is important to emphasize that PG&E’s Alternative Scenario is a forecast
that includes a number of assumptions regarding events which may or may not occur.
PG&E is currently projecting a decrease in retail sales in 2015 and a continued
retail sales decrease through 2024, followed by modest growth thereafter. These
changes are driven by the increasing impacts of Energy Efficiency, customer-sited
generation, and Direct Access (“DA”) and CCA participation levels, and are offset
slightly by an improving economy and growing electrification of the transportation
sector. As described in more detail in Section 6.2.1, PG&E uses its stochastic model to
simulate a range of potential retail sales forecasts.
In addition to retail sales forecasts, as discussed in Sections 6, 7, and 8, PG&E’s
long-term demand for new RPS-eligible project deliveries is driven by: (1) PG&E’s
current projection of the success rate for its existing RPS portfolio, which PG&E uses to
establish a minimum margin of procurement; and (2) the need to account for its
risk-adjusted need, including any Voluntary Margin of Procurement (“VMOP”) as
determined by PG&E’s stochastic model. The risk and uncertainties that justify the
need for VMOP are further detailed and quantified in Sections 6 and 7.
3.4 Anticipated Renewable Energy Technologies and Alignment of Portfolio With Expected Load Curves and Durations
PG&E’s procurement evaluation methodology considers both market value and
the portfolio fit of RPS-eligible resources in order to determine PG&E’s optimal
renewables product mix. With the exception of specific Commission-mandated
programs such as the RAM, ReMAT, and BioMAT Programs, PG&E does not identify
specific renewable energy technologies or product types (e.g., baseload, peaking

16
as-available, or non-peaking as-available) that it is seeking to align, or fit, with specific
needs in its portfolio. Instead, PG&E identifies an RPS-eligible energy need in order to
fill an aggregate open position identified in its planning horizon and selects project offers
that are best positioned to meet PG&E’s current portfolio needs. This is evaluated
through the use of PG&E’s Portfolio Adjusted Value (“PAV”) methodology, which
ensures that the procured renewable energy products provide the best fit for PG&E’s
portfolio at the least cost. Starting in the 2014 RPS RFO, PG&E began utilizing the
interim integration cost adder to accurately capture the impact of intermittent resources
on PG&E’s portfolio. When this adder is finalized by the Commission, PG&E’s Net
Market Value (“NMV”) methodology will be updated to use the values and
methodologies of the final integration cost adder. PG&E’s PAV and NMV
methodologies were described in detail in PG&E’s 2014 RPS Solicitation Protocol.17
3.5 RPS Portfolio Diversity
PG&E’s RPS portfolio contains a diverse set of technologies, including solar PV,
solar thermal, wind, small hydro, bioenergy, and geothermal projects in a variety of
geographies, both in-state and out-of-state. PG&E’s procurement strategy addresses
technology and geographic diversity on a quantitative and qualitative basis.
In the NMV valuation process, PG&E models the location-specific marginal
energy and capacity values of a resource based on its forecasted generation profile.
Thus, if a given technology or geography becomes “saturated” in the market, then those
projects will see declining energy and capacity values in their NMV. This aspect of
PG&E’s valuation methodology should result in PG&E procuring a diverse resource mix
if technological or geographic area concentration is strong enough to change the
relative value of different resource types or areas. In addition, technology and
geographic diversity have the potential to reduce integration challenges. PG&E’s use of
17 See PG&E, 2014 RPS Solicitation Protocol, pp. 24-28 (available at
http://www.pge.com/includes/docs/pdfs/b2b/wholesaleelectricsuppliersolicitation/RPS2014/RPS_Solicitation_Protocol_01052015.pdf).

17
the integration cost adder in its NMV valuation process may also result in procurement
of different technology types.
Diversity is also considered qualitatively when making procurement decisions.
Resource diversity may decrease risk to PG&E’s RPS portfolio given uncertainty in
future hourly and locational market prices as well as technology-specific
development risks.
PG&E recognizes that resource diversity is one option to minimize the
overgeneration and integration costs associated with technological or geographic
concentration. In general, PG&E believes that less restrictive procurement structures
provide the best opportunity to maximize value for its customers, allowing proper
response to changing market conditions and more competition between resources,
while geographic or technology-specific mandates add additional costs to RPS
procurement. PG&E’s current quantitative and qualitative approach to resource
diversity would remain the same under a 40% RPS scenario as the existing approach
described above.
3.6 Optimizing Cost, Value, and Risk for the Ratepayer
From 2003 to 2012, PG&E’s annual RPS-eligible procurement and generation
costs from its existing contracts and utility-owned portfolio grew at a relatively modest
pace. However, the costs of the RPS program are becoming more apparent on
customer bills and will increase as RPS projects come online in significant quantities.
Over the period of two years (2013 and 2014), the renewable generation in PG&E’s
portfolio increased by approximately the same amount that it grew over the entire prior
history of the RPS Program (2003-2012). In addition to cost impacts resulting from the
direct procurement of renewable resources, customer costs are also impacted by the
associated indirect incremental transmission and integration costs.
PG&E is aware of these direct and indirect cost impacts and will attempt to
mitigate them whenever possible, particularly when entering into incremental long-term
commitments. PG&E’s fundamental strategy for mitigating RPS cost impacts is to

18
balance the opposing objectives of: (1) delaying additional RPS-related costs until
deliveries are needed to meet a physical compliance requirement; and (2) managing the
risk of being caught in a “seller’s market,” where PG&E faces potentially high market
prices in order to meet near-term compliance deadlines. When these objectives are
combined with the general need to manage overall RPS portfolio volatility based on
demand and generation uncertainty, PG&E believes it is prudent and necessary to
maintain an adequate Bank through the most cost-effective means available.
In addition, PG&E seeks to minimize the overall cost impact of renewables over
time through promoting competitive processes that can encourage price discipline, and
using the Bank to help limit long-term over-procurement. PG&E generally supports the
use of competitive procurement mechanisms that are open to all RPS-eligible
technologies and project sizes. As described in greater detail in Section 13.3, as PG&E
makes progress toward achieving the 33% RPS target, it expects that the cost impacts
of mandated procurement programs that focus on particular technologies or project size
may increase the overall costs of PG&E’s RPS portfolio for customers as procurement
from these programs comprise a larger share of PG&E’s incremental procurement
goals. This further underscores the need to implement an RPS cost containment
mechanism that provides a cap on costs. PG&E supports a technology-neutral
procurement process, in which all technologies can compete to offer the best value to
customers at the lowest cost.
3.7 Long-Term RPS Optimization Strategy
PG&E’s long-term optimization strategy seeks to both achieve and maintain
RPS compliance through and beyond 2020 and to minimize customer cost within an
acceptable level of risk. PG&E’s optimization strategy continues to evolve as its RPS
compliance position through 2020 and beyond continues to improve. Although PG&E
remains mindful of meeting near-term compliance targets, it also seeks to refine
strategies for maintaining compliance in a least-cost manner in the long-term
(post-2020). PG&E’s optimization strategy includes an assessment of compliance risks

19
and approaches to protect against such risks by maintaining a Bank that is both prudent
and needed to manage a 33% RPS operating portfolio after 2020. PG&E employs
two models in order to optimize cost, value, and risk for the ratepayer while achieving
sustained RPS compliance. This optimization analysis results in PG&E’s
“stochastically-optimized net short” (“SONS”), which PG&E uses to guide its
procurement strategy, as further described in Sections 6 and 7.
PG&E’s long-term optimization strategy includes three primary components:
(1) incremental procurement; (2) possible sales of surplus procurement; and
(3) effective use of the Bank. Although PG&E will not hold a 2015 RPS solicitation,
future incremental procurement to avoid the need to procure extremely large volumes in
any single year remains a central component of PG&E’s long-term RPS optimization
strategy. In addition to procurement, PG&E’s optimization strategy includes
consideration of sales of surplus procurement that provide a value to customers.
The third component of the optimization strategy is effective use of the Bank.
Under the existing 33% RPS target and current market assumptions, PG&E plans to
apply a portion of its projected Bank to meet compliance requirements beginning in
XXXX. Additionally, PG&E plans to use a portion of its Bank as a VMOP to manage
additional risks and uncertainties accounted for in PG&E’s stochastic model, while
maintaining a minimum Bank size of at least XXXXXXXXXXXXXXXXXXXX.
Under a 40% RPS by 2024 scenario, the components of PG&E’s optimization
strategy would remain the same. However, under the 40% RPS scenario and current
market assumptions, PG&E would plan to maintain a minimum Bank size of at least
XXXXXXXX. See Section 7 for additional information regarding the use and size of
PG&E’s Bank.
4 Project Development Status Update
In Appendix B, PG&E provides an update on the development of RPS-eligible
resources currently under contract but not yet delivering energy. The table in
Appendix B updates key project development status indicators provided by

20
counterparties and is current as of June 17, 2015.18 These key project development
status indicators help PG&E to determine if a project will meet its contractual milestones
and identify impacts on PG&E’s renewable procurement position and procurement
decisions.
Within PG&E’s active portfolio,19 there are 107 RPS-eligible projects that were
executed after 2002. Seventy-six of these contracts have achieved full commercial
operation and started the delivery term under their PPAs. Thirty-one contracts have not
started the delivery term under their PPAs. Of the 31 contracts that have not started the
delivery term under their PPAs with PG&E: 18 have not yet started construction;
five have started construction but are not yet online; and eight are delivering energy, but
have not yet started the delivery term under their PPAs. Based on historic experience,
projects that have commenced construction are generally more viable than projects in
the pre-construction phase, although PG&E expects most of the pre-construction
projects currently in its portfolio to achieve commercial operation under their PPA.
5 Potential Compliance Delays
Through the considerable experience it has gained over the past decade of RPS
procurement, PG&E is familiar with the obstacles confronting renewable energy
developers. These include securing financing, siting and permitting projects, expanding
transmission capacity, and interconnecting projects to the grid. At both the federal and
state levels, new programs and measures continue to be implemented to address these
18 Appendix B includes PPAs procured through the RAM and PV Programs, but does not
include small renewable FIT PPAs. PG&E currently has 72 executed Assembly Bill 1969 PPAs in its portfolio and 29 ReMAT PPAs, totaling 104 MW of capacity. These small renewable FIT projects are in various stages of development, with 60 already delivering to PG&E under an AB 1969 PPA and 11 delivering to PG&E under a ReMAT PPA. Information on these programs is available at http://www.pge.com/feedintariffs/.
19 PG&E’s active portfolio includes RPS-eligible projects that were executed (but not terminated or expired) and CPUC-approved as of June 17, 2015, not including amended post-2002 QF contracts, contracts for the sale of bundled renewable energy and green attributes by PG&E to third parties, Utility-Owned Generation (“UOG”) projects, or FIT projects.

21
issues. However, even with these efforts, challenges remain that could ultimately
impact PG&E’s ability to meet California’s RPS goals. Moreover, operational issues,
such as curtailment, may impact PG&E’s RPS compliance. This section describes the
most significant RPS compliance risks and some of the steps PG&E is taking to
mitigate them.20
5.1 Project Financing
The financing environment for solar PV and wind projects continues to be
healthy, with access to low-cost capital and a variety of ownership structures for project
developers. However, for renewable technologies that are less proven, less viable, or
reflect a higher risk profile, the financing environment is more constrained, with higher
costs of capital and fewer participants willing to lend or invest.
Federal and state incentives such as the PTC and ITC continue to fuel
renewable growth in California. In 2015, the Internal Revenue Service extended the
applicable dates for the “beginning of construction” guidance for PTC-eligible facilities to
January 1, 2015, and the “placed in service” date to January 1, 2017.21 This allows the
PTC or ITC tax benefits for non-solar facilities to continue well beyond 2014. Solar
energy facilities continue to be eligible for a 30% ITC if they are placed in service by
December 31, 2016.22 The five-year and seven-year Modified Accelerated Cost
20 This section is not intended to provide a detailed justification for an enforcement waiver or a
reduction in the portfolio content requirements pursuant to Sections 399.15(b)(5) or 399.16(e). To the extent that PG&E finds that it must seek such a waiver or portfolio balance reduction in the future, it reserves the right to set forth a more complete statement, based upon the facts as they appear in the future, in the form of a petition or as an affirmative defense to any action by the Commission to enforce the RPS compliance requirements.
21 Notice 2015-2025 allows a taxpayer to claim a PTC under Section 45 of the Internal Revenue Code (“IRC”), or a 30% ITC under Section 48 (ITC) in lieu of the PTC, for eligible facilities such as wind, geothermal, biomass, marine, landfill gas, and hydro, if the facility began construction before January 1, 2015 or was placed in service by January 1, 2017.
22 Section 48 of the IRC allows for a tax credit equal to 30% of project’s qualifying costs for certain types of commercial energy projects, including solar, geothermal, fuel cells, and small wind projects, and a 10% tax credit for geothermal, micro turbines and combined heat and power. The tax credit is realized in the year that the project is placed in service.

22
Recovery System (“MACRS”) allows for accelerated tax depreciation deductions to
renewable tangible property.23 These tax incentives and the MACRS depreciation
deductions enable businesses to reduce their tax liability and accelerate the rate of
return on renewable investments. They also provide a workable framework for projects
to negotiate financing. As a result, tax incentives have spurred significant investment in
renewable energy and generally amount to between 35 and 60 cents per dollar (“¢/$”) of
capital cost.
Tax equity remains a core financing tool for renewable developments, and
ownership structures such as Master Limited Partnerships and Yield Cos are also being
utilized as project sponsors market and investors competitively shop for solar and wind
investments. These structures allow developers who cannot use tax benefits efficiently
to barter the benefits to large corporations or investors in exchange for cash infusions
for their projects. At this time, tax incentive structures after 2016 are unknown. The
PTC and 30% ITC incentives end in 2016. Unless the tax code is modified or extended,
the renewable energy ITC will drop to 10% after December 31, 2016. However, there
are efforts underway to extend or modify the PTC and ITC.24 Despite the uncertainty
surrounding renewable energy project tax incentives, PG&E believes there are
indications that healthy trends for renewable project financing will continue.
23 MACRS provides for a five-year tax cost recovery period for renewable solar, wind,
geothermal, fuel cells and combined heat and power tangible property. Certain biomass property is eligible for a seven-year tax cost recovery period under MACRS.
24 H.R. 2412 would extend the renewable energy ITC for a period of five years for eligible renewable solar, small wind energy, fuel cell, micro turbine, thermal energy and combined heat and power system properties that begin construction before January 1, 2022.
In addition, in its proposed budget for fiscal year 2016, the Obama administration proposes to modify and permanently extend the renewable PTC and ITC. For facilities that begin construction in 2016 or later, the proposal would make the PTC permanent and refundable. Solar facilities that qualify for the ITC would be eligible to claim the PTC. The proposal would also permanently extend the ITC at the 30 percent credit level, which is currently scheduled to expire for properties placed in service after December 31, 2016, and it would make permanent the election to claim the ITC in lieu of the PTC for qualified facilities eligible for the PTC.

23
5.2 Siting and Permitting
PG&E works with various stakeholder groups toward finding solutions for
environmental siting and permitting issues faced by renewable energy development.
For example, PG&E works collaboratively with environmental groups, renewable energy
developers and other stakeholders to encourage sound policies through a Renewable
Energy Working Group, an informal and diverse group working to protect ecosystems,
landscapes and species, while supporting the timely development of energy resources
in the California desert and other suitable locations. Long-term and comprehensive
planning and permitting processes can help better inform and facilitate renewable
development.
PG&E is hopeful that these and other efforts will establish clear requirements
that developers and other interested parties can satisfy in advance of the submission of
offers to PG&E’s future solicitations, and will, as a result, help decrease the time it takes
parties to site and permit projects while ensuring environmental integrity.
Permitting challenges for projects are improving as a result of these and other
efforts to streamline and adjust the permitting process for renewable energy projects.
While these improvement efforts are ongoing, permitting and siting hurdles remain for
renewables projects. Common issues may include challenges related to farmland
designation and Williamson Act contracts, tribal and cultural resources areas, protected
species, and county-imposed moratoriums. These hurdles may impact development
schedules for projects.
5.3 Transmission and Interconnection
Achieving timely interconnection is an important part of the project development
process. Delays in achieving interconnection can occur for various reasons, including
the delay of substation construction, permitting issues, telecommunications delays, or
overly aggressive timeline assumptions. While delays in interconnection can lead to
delays in project development, such delays to date have not had a major impact on
PG&E’s ability to meet its RPS procurement targets.

24
Over the past few years, the CAISO and the IOUs have seen significant
increases in the number of requests for grid interconnection. As the number of
proposed RPS-eligible projects continues to increase in California, planning for how
these projects would be connecting into the California grid has become increasingly
challenging. The growth in these requests has, in turn, extended estimated project
development timelines, which creates a significant barrier to financing projects
endeavoring to come online within tight contractual milestone dates. Similarly, the
growth in interconnection requests has made it difficult to estimate reliable
interconnection study results and to identify necessary transmission build-outs.
Accordingly, PG&E has initiated a number of internal efforts and collaborated on
external initiatives to address these challenges at both the transmission and distribution
levels. Recent notable changes in the distribution-level interconnection process
included: (1) amending the Wholesale Distribution Tariff in October 2014 to address
modifications similar to those made to the CAISO’s Tariff; and (2) amending Rule 21 in
January 2015 to capture the technological advances offered by smart inverters.
Additionally, over the past few years, PG&E has worked with the CAISO and
industry stakeholders in ongoing stakeholder initiatives enhancing the transmission-
level interconnection processes. Most significant among the changes has been the
Generator Interconnection and Deliverability Allocation Procedures, which has
streamlined the process for identifying customer-funded transmission additions and
upgrades under a single comprehensive process. This initiative also provides
incentives for renewable energy developers to interconnect to the CAISO grid at the
most cost-effective locations. PG&E has also actively contributed to the CAISO’s
Interconnection Process Enhancements stakeholder initiative that seeks to continuously
review potential enhancements to the generator interconnection procedures.
Finally, at the intersection of transmission-level and distribution-level
interconnections, is the Distributed Generation Deliverability (“DGD”) process. In 2013,
PG&E collaborated extensively with the CAISO to implement the first annual cycle, and

25
the second and third cycles were successfully completed in 2014 and 2015,
respectively. Under the DGD Program, the CAISO conducts an annual study to identify
MW amounts of available deliverability at transmission nodes on the CAISO-controlled
grid. Based on the deliverability assessment results, distributed generation facilities that
are located or seeking interconnection at nodes with identified available deliverability
may apply to the appropriate Participating Transmission Owner (“PTO”) to receive an
assignment of deliverability for Resource Adequacy (“RA”) counting purposes.
5.4 Curtailment of RPS Generating Resources
As discussed in more detail in Section 11, if RPS curtailed volumes increase
substantially due to CAISO market or reliability conditions, curtailment may present an
RPS compliance challenge. In order to better address this challenge, PG&E’s
stochastic model incorporates estimated levels of curtailment, which enables PG&E to
plan for appropriate levels of RPS procurement to meet RPS compliance even when
volumes are curtailed. Additional detail on these assumptions is provided in
Section 6.2.
5.5 Risk-Adjusted Analysis
PG&E employs both a deterministic and stochastic approach to quantifying its
remaining need for incremental renewable volumes. As described further in Section 6,
deliveries from projects experiencing considerable development challenges associated
with project financing, permitting, transmission and interconnection, among others, are
excluded from PG&E’s net short calculation.
PG&E’s experience with prior solicitations is that developers often experience
difficulties managing some of the development issues described above. As described in
Section 8, PG&E’s current expected RPS need calculation incorporates a minimum
margin of procurement to account for some anticipated project failure and delays in
PG&E’s existing portfolio, which are captured in PG&E’s deterministic model. These
deterministic results are time-sensitive and do not account for all of the risks and
uncertainties that can cause substantial swings in PG&E’s portfolio.

26
While it has made reasonable efforts to minimize risks of project delays or
failures in an effort to comply with the 33% RPS Program procurement targets, PG&E
cannot predict with certainty the circumstances—or the magnitude of the
circumstances—that may arise in the future affecting the renewables market or
individual project performance.
6 Risk Assessment
Dynamic risks, such as the factors discussed in Section 5 that could lead to
potential compliance delays, directly affect PG&E’s ability to plan for and meet
compliance with the RPS requirements. To account for these and additional
uncertainties in future procurement, PG&E models the demand-side risk of retail sales
variability and the supply-side risks of generation variability, project failure, curtailment,
and project delays in quantitative analyses.
Specifically, PG&E uses two approaches to modeling risk: (1) a deterministic
model; and (2) a stochastic model. The deterministic model tracks the expected values
of PG&E’s RPS target and deliveries to calculate a “physical net short,” which
represents a point-estimate forecast of PG&E’s RPS position and constitutes a
reasonable minimum margin of procurement, as required by the RPS statute. These
deterministic results serve as the primary inputs into the stochastic model. The
stochastic model25 accounts for additional compounded and interactive effects of
various uncertain variables on PG&E’s portfolio to suggest a procurement strategy at
25 The stochastic model specifically employs both Monte Carlo simulation of risks and genetic
algorithm optimization of procurement amounts. A Monte Carlo simulation is a computational algorithm commonly used to account for uncertainty in quantitative analysis and decision making. A Monte Carlo simulation provides a range of possible outcomes, the probabilities that they will occur and the distributions of possible outcome values. A genetic algorithm is a problem-solving process that mimics natural selection. That is, a range of inputs to an optimization problem are tried, one-by-one, in a way that moves the problem’s solution in the desired direction—higher or lower—while meeting all constraints. Over successive iterations, the model “evolves” toward an optimal solution within the given constraints. In the case of PG&E’s stochastic model, a genetic algorithm is employed to conduct a first-order optimization to ensure compliance at the identified risk threshold while minimizing cost.

27
least cost within a designated level of non-compliance risk. The stochastic model
provides target procurement volumes for each compliance period, which result in a
designated Bank size for each compliance period. The Bank is then primarily utilized as
Voluntary Margin of Procurement or VMOP to mitigate dynamic risks and uncertainties
and ensure compliance with the RPS.
This section describes in more detail PG&E’s two approaches to risk mitigation
and the specific risks modeled in each approach. Section 6.1 identifies the three risks
accounted for in PG&E’s deterministic model. Section 6.2 outlines the four additional
risks accounted for in PG&E’s stochastic model. Section 6.3 describes how the risks
described in the first two sections are incorporated into both models, including details
about how each model operates and the additional boundaries each sets on the risks.
Section 6.4 notes how the two models help guide PG&E’s optimization strategy and
procurement need. Section 7 discusses the results for both the deterministic and
stochastic models and introduces the physical and optimized net short calculations
presented in Appendices C.2a and C.2b. Section 8 addresses PG&E’s approach to the
statutory minimum and voluntary margins of procurement.
6.1 Risks Accounted for in Deterministic Model
PG&E’s deterministic approach models three key risks:
1) Standard Generation Variability: the assumed level of deliveries for categories of online RPS projects.
2) Project Failure: the determination of whether or not the contractual deliveries associated with a project in development should be excluded entirely from the forecast because of the project’s relatively high risk of failure or delay.
3) Project Delay: the monitoring and adjustment of project start dates based on information provided by the counterparty (as long as deliveries commence within the allowed delay provisions in the contract).
The table below shows the methodology used to calculate each of these risks,
and to which category of projects in PG&E’s portfolio the risks apply. More detailed
descriptions of each risk are described in the subsections below.

28
TABLE 6-1 PACIFIC GAS AND ELECTRIC COMPANY
DETERMINISTIC MODEL RISKS
RISK METHODOLOGY APPLIES TO
Standard Generation Variability
For non-QF projects executed post-2002, 100% of contracted volumes
For non-hydro QFs, typically based on an average of the three most recent calendar year deliveries
Hydro QFs, UOG and IDWA generation projections are updated to reflect the most recent hydro forecast.
Online Projects
Project Failure
In Development projects with high likelihood of failure are labeled “OFF” (0% deliveries assumption)
All other In Development projects are “ON” (assume 100% of contracted delivery)
In Development Projects
Project Delay Professional judgment/Communication with counterparties
Under Construction Projects/ Under Development Projects/ Approved Mandated Programs
6.1.1 Standard Generation Variability
With respect to its operating projects, PG&E’s forecast is divided into
three categories: non-Qualifying Facilities (“QF”); non-hydro QFs; and hydro projects.
The forecast for non-QF projects is based on contracted volumes. The forecast for
non-hydro QFs is based on the average of the three most recent calendar year
deliveries. The forecast for hydro QFs is typically based on historical production,
calendar year deliveries, and regularly updated with PG&E’s latest internal hydro
updates. The UOG and Irrigation District and Water Agency (“IDWA”) forecast is based
on PG&E’s latest internal hydro updates. Future years’ hydro forecasts assume
average water year production. These assumptions are included in this RPS Plan as
Appendix G.
6.1.2 Project Failure
To account for the development risks associated with securing project siting,
permitting, transmission, interconnection, and project financing, PG&E uses the data
29
collected through PG&E’s project monitoring activities in combination with best
professional judgment to determine a given project’s failure risk profile. PG&E
categorizes its portfolio of contracts for renewable projects into two risk categories:
OFF (represented with 0% deliveries) and ON (represented with 100% deliveries). This
approach reflects the reality of how a project reaches full development; either all of the
generation from the project comes online, or none of the generation comes online.
1. OFF/Closely Watched – PG&E excludes deliveries from the “Closely Watched”
projects in its portfolio when forecasting expected incremental need for renewable
volumes. “Closely Watched” represents deliveries from projects experiencing
considerable development challenges as well as once-operational projects that
have ceased delivering and are unlikely to restart. In reviewing project development
monitoring reports, and applying their best professional judgment, PG&E managers
may consider the following factors when deciding whether to categorize a project as
“Closely Watched”:
Actual failure to meet significant contractual milestones (e.g., guaranteed construction start date, guaranteed commercial operation date, etc.).
Anticipated failure to meet significant contractual milestones due to the project’s financing, permitting, and/or interconnection progress or to other challenges (as informed by project developers, permitting agencies, status of CAISO transmission studies or upgrades, expected interconnection timelines, and/or other sources of project development status data).
Significant regulatory contract approval delays (e.g., 12 months or more after filing) with no clear indication of eventual authorization.
Developer’s statement that an amendment to the PPA is necessary in order to preserve the project’s commercial viability.
Whether a PPA amendment has been executed but has not yet received regulatory approval.
Knowledge that a plant has ceased operation or plant owner/operator’s statement that a project is expected to cease operations.

30
Final forecasting assessments are project-specific and PG&E does not consider the
criteria described above to be exclusive, exhaustive, or the sole criteria used to
categorize a project as “Closely Watched.”26
2. ON – Projects in all other categories are assumed to deliver 100% of contracted
generation over their respective terms. There are three main categories of these
projects. The first category, which denotes projects that have achieved commercial
operation or have officially begun construction, represents the majority of “ON”
projects. Based on empirical experience and industry benchmarking, PG&E
estimates that this population is highly likely to deliver. The second category of
“ON” projects is comprised of those that are in development and are progressing
with pre-construction development activities without foreseeable and significant
delays. The third category of “ON” projects represents executed and future
contracts from CPUC-mandated programs. While there may be some risk to
specific projects being successful, because these volumes are mandated, the
expectation is that PG&E will replace failed volumes with replacement projects
within a reasonable timeline.
6.1.3 Project Delay
Because significant project delays can impact the RNS, PG&E regularly
monitors and updates the development status of RPS-eligible projects from PPA
execution until commercial operation. Through periodic reporting, site visits,
communication with counterparties, and other monitoring activities, PG&E tracks the
progress of projects towards completion of major project milestones and develops
estimates for the construction start (if applicable) and commercial operation of projects.
26 For instance, PG&E may elect to count deliveries from projects that meet one or more of
the criteria if it determines, based on its professional judgment, that the magnitude of challenges faced by the projects do not warrant exclusion from the deterministic forecast. Similarly, the evaluation criteria employed by PG&E could evolve as the nature of challenges faced by the renewable energy industry, or specific sectors of it, change.

31
6.2 Risks Accounted for in Stochastic Model
The risk factors outlined in the deterministic model are inherently dynamic
conditions that do not fully capture all of the risks affecting PG&E’s RPS position.
Therefore, PG&E has developed a stochastic model to better account for the
compounded and interactive effects of various uncertain variables on PG&E’s portfolio.
PG&E’s stochastic model assesses the impact of both demand- and-supply-side
variables on PG&E’s RPS position from the following four categories:
1) Retail Sales Variability: This demand-side variable is one of the largest drivers of
PG&E’s RPS position.
2) Project Failure Variability: Considers additional project failure potential beyond
the “on-off” approach in the deterministic model.
3) Curtailment: Considers buyer-ordered (economic), CAISO-ordered or
PTO-ordered curtailment.
4) RPS Generation Variability: Considers additional RPS generation variability
above and beyond the small percentages in the deterministic model.
When considering the impacts that these variables can have on its RPS position,
PG&E organizes the impacts into two categories: (1) persistent across years; and
(2) short-term (e.g., effects limited to an individual year and not highly correlated from
year-to-year). Table 6-2 below lists the impacts by category, while showing the size of
each variable’s overall impact on PG&E’s RPS position.
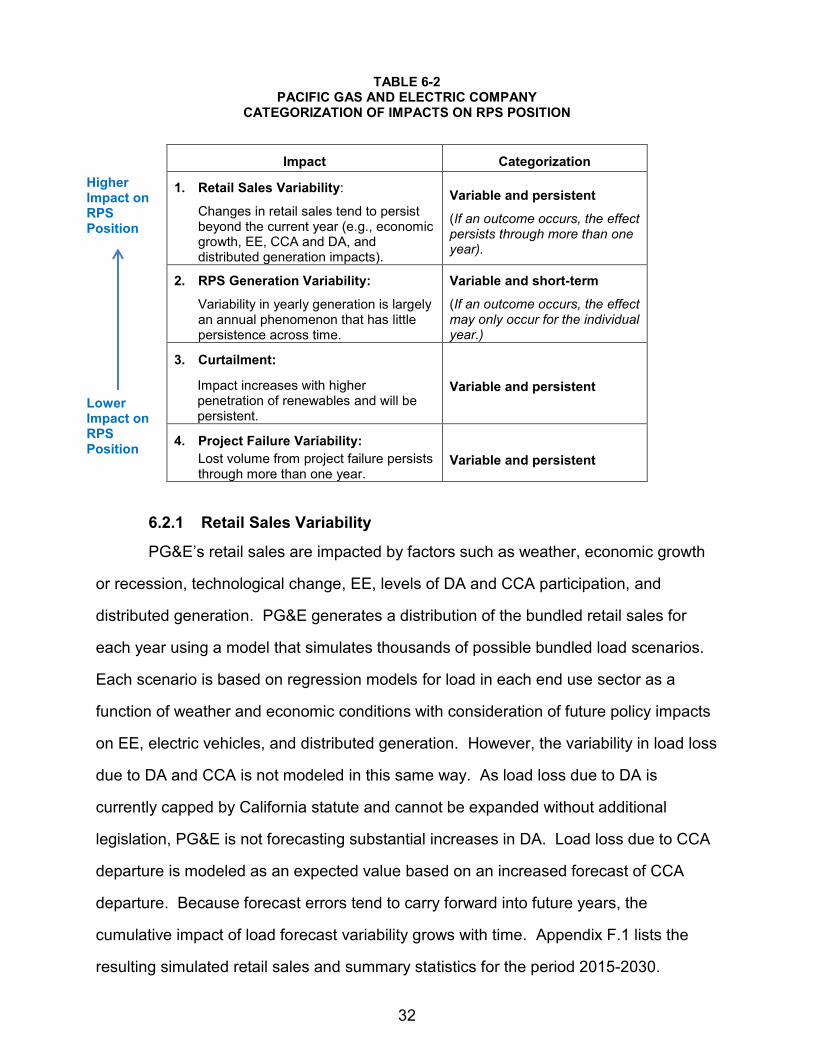
32
TABLE 6-2 PACIFIC GAS AND ELECTRIC COMPANY
CATEGORIZATION OF IMPACTS ON RPS POSITION
Impact Categorization
1. Retail Sales Variability:
Changes in retail sales tend to persist beyond the current year (e.g., economic growth, EE, CCA and DA, and distributed generation impacts).
Variable and persistent
(If an outcome occurs, the effect persists through more than one year).
2. RPS Generation Variability:
Variability in yearly generation is largely an annual phenomenon that has little persistence across time.
Variable and short-term
(If an outcome occurs, the effect may only occur for the individual year.)
3. Curtailment:
Impact increases with higher penetration of renewables and will be persistent.
Variable and persistent
4. Project Failure Variability: Lost volume from project failure persists through more than one year.
Variable and persistent
6.2.1 Retail Sales Variability
PG&E’s retail sales are impacted by factors such as weather, economic growth
or recession, technological change, EE, levels of DA and CCA participation, and
distributed generation. PG&E generates a distribution of the bundled retail sales for
each year using a model that simulates thousands of possible bundled load scenarios.
Each scenario is based on regression models for load in each end use sector as a
function of weather and economic conditions with consideration of future policy impacts
on EE, electric vehicles, and distributed generation. However, the variability in load loss
due to DA and CCA is not modeled in this same way. As load loss due to DA is
currently capped by California statute and cannot be expanded without additional
legislation, PG&E is not forecasting substantial increases in DA. Load loss due to CCA
departure is modeled as an expected value based on an increased forecast of CCA
departure. Because forecast errors tend to carry forward into future years, the
cumulative impact of load forecast variability grows with time. Appendix F.1 lists the
resulting simulated retail sales and summary statistics for the period 2015-2030.
Higher Impact on RPS Position
Lower Impact on RPS Position

33
Appendices F.5a and F.5b show the resulting simulated RPS target when accounting
for the retail sales variability for the period 2015-2030 in the 33% and 40% RPS,
respectively.
6.2.2 RPS Generation Variability
Based on analysis of historical hydro generation data from XXXXXXX, wind
generation data from XXXXXXX, and generation data from solar and other technologies
where available, PG&E estimated a historical annual variability measured by the
coefficient of variation of each resource type. XXXXXXXXXXXXXXXXXXXXXXXXXXX
XXXXXXXXXXXXXXXXXXXXXXXXXXXXXXXXXXXXXXXXXXXXXXXXXXXXXXXXXX
XXXXXXXXXXXXXXXXXXXXXXXXXXXX Due to significant variability in annual
precipitation, small hydro demonstrates the largest annual variability (coefficient of
variation of XXX). The remaining resource types range in annual variability from XX for
biomass and geothermal, XX for solar PV and solar thermal to XX for wind.
Collectively, technology diversity helps to reduce the overall variation, because
variability around the mean is essentially uncorrelated among technologies.
Appendices F.3a and F.3b list the resulting simulated generation and summary statistics
for the period 2015-2030 in the 33% and 40% RPS, respectively.
To better understand the wide range of variability of the above risks and thus,
the need for a stochastic model to optimize PG&E’s procurement volumes,
Appendices F.4a and F.4b, combine the Project Failure and RPS Generation Variability
factors into a “total deliveries” probability distribution, shows how these variables
interact in the 33% and 40% RPS, respectively.
6.2.3 Curtailment
The stochastic model also estimates the potential for RPS curtailment.
Curtailment can result from either buyer-ordered (economic), CAISO-ordered or
PTO-ordered curtailment (the latter two driven by system stability issues, not
economics). XXXXXXXXXXXXXXXXXXXXXXXXXXXXXXXXXXXXXXXXXXXXXXXX
XXXXXXXXXXXXXXXXXXXXXXXXXXXXXXXXXXXXXXXXXXXXXXXXXXXXXXXXX

34
XXXXXXXXXXXXXXXXXXXXXXXXXXXXXXXXXXXXXXXXXXXXXXXXXXXXXXXXX
XXXXXXXXXXXXXXXXXXXXXXXXXXXXXXXXXXXXXXXXXXXXXXXXXXXXXXXX
XXXXXXXXXXXXXXXXXXXXXXXXXXXXXXXXXXXXXXXXXXXXXXXXXXXXXXXXXX
XXXXXXXXXXXXXXXXXXXXXXXXXXXXXXXXXXXXXXXXXXXXXXXXXXXXXXXX
XXXXXXXXXXXXXXXXXXXXXXXXXX27 These modeling assumptions will not
necessarily align with the actual number of curtailment hours, but are helpful in terms of
considering the impact of curtailment on long-term RPS planning and compliance.
Please see Section 11 for more information regarding curtailment.
6.2.4 Project Failure Variability
To model the project failure variability inherent in project development, PG&E
assumes that project viability for a yet-to-be-built project is a function of the number of
years until its contract start date. That is, a new project scheduled to commence
deliveries to PG&E next year is considered more likely to be successful than a project
scheduled to begin deliveries at a much later date. The underlying assumption is that
both PG&E and the counterparty know more about a project’s likelihood of success the
closer the project is to its initial delivery date, and the counterparty may seek to amend
or terminate a non-viable project before it breaches the PPA. Working from this
assumption, PG&E assigns a probability of project success for new, yet-to-be-built
projects equal to XXXXXXXXXXXXXXXXXXXXXXXXXXXXXXXXXXXXXXXXXXXXX
XXXX. For example, a project scheduled to come online in five years or more is
assumed to have a XXXXXXXXX chance of success. This success rate is based on
experience and is reflective of higher project development success rates of PG&E’s
RPS portfolio in more recent years.
27 XXXXXXXXXXXXXXXXXXXXXXXXXXXXXXXXXXXXXXXXXXXXXXXXXXXXXXXXXXXX
XXXXXXXX XXXXXXXXXXXXXXXXXXXXXXXXXXXXXXXXXXXXXXXXXXXXXXXXXXXXXXXXXXXX XX
35
Although PG&E’s current existing portfolio of projects may have higher rates of
success, the actual success rate for projects in the long-term may be higher or lower.
Projects that are re-contracted, in contrast, are modeled at a XXXX success rate.
Appendices F.2a and F.2b list PG&E’s simulated failure rate and summary statistics for
the period 2015-2030 in the 33% and 40% RPS, respectively.
6.2.5 Comparison of Model Assumptions
Table 6-3 below shows a comparison of how PG&E’s deterministic and
stochastic models each handle uncertainty with regard to retail sales, project failure,
RPS generation, and curtailment. Section 7 provides a more detailed summary of the
results from PG&E’s deterministic and stochastic modeling approaches.

36
TABLE 6-3 COMPARISON OF UNCERTAINTY ASSUMPTIONS
BETWEEN PG&E’S DETERMINISTIC AND STOCHASTIC MODELS
Uncertainty Deterministic Model Stochastic Model
1) Retail Sales Variability
Uses most recent PG&E bundled retail sales forecast for next 5 years and 2014 LTPP for later years
Distribution based on most recent (2015) PG&E bundled retail sales forecast.
2) Project Failure Variability
Only turns “off” projects with high likelihood of failure per criteria. “On” projects assumed to deliver at Contract Quantity.
Uses XXXXXXXXXXXXXXXXXXXXXXXXXXX XXXXXXXXXXXXX to model a success rate for all “on” yet-to-be-built projects in the deterministic model. Thus, for a project scheduled to come online in 5 years, the project success rate is XXXXXXXXXX. This success rate is based on PG&E’s experience that the further ahead in the future a project is scheduled to come online, the lower the likelihood of project success. Re-contracted projects are assumed to have a XXXX success rate.
3) RPS Generation Variability
Non-QF projects executed post-2002, 100% of contracted volumes For non-hydro QFs, typically based on an average of the three most recent calendar year deliveries Hydro QFs, UOG and IDWA generation projections are updated to reflect the most recent hydro forecast.
Hydro: XXX annual variation
Wind: XX annual variation
Solar: XX annual variation
Biomass and Geothermal: XX annual variation
4) Curtailment28 None
33% RPS Target: XX of RPS requirement
40% RPS Scenario: XX of RPS requirement through 2021, increasing to XXX in 2024 and beyond.
6.3 How Deterministic Approach Is Modeled
The deterministic model is a snapshot in time of PG&E’s current and forecasted
RPS position and procurement need. The deterministic model relies on currently
available generation data for executed online and in development RPS projects as well
28 These modeling assumptions will not necessarily align with the actual number of
curtailment hours, but are helpful in terms of considering the impact of curtailment on long-term RPS planning and compliance.

37
as PG&E’s most recent bundled retail sales forecast. The results from the deterministic
model determine PG&E’s “physical net short,” which represents the best current point-
estimate forecast of PG&E’s RPS position today. The deterministic model should not
be seen as a static target because the inputs are updated as new information is
received.
6.4 How Stochastic Approach Is Modeled
The stochastic model adds rigor to the risk-adjustment embedded in the
deterministic model—using Monte Carlo simulation—and optimizes its results to
achieve the lowest cost possible given a specified risk of non-compliance and the
stochastic model’s constraints.
The methodology for the stochastic model is as follows:
1) Create an optimization problem by establishing the (a) objectives, (b) inputs, and
(c) constraints of the model.
a. The objective is to minimize procurement cost.
b. The inputs are a range of potential incremental RPS-eligible deliveries (new and re-contracted volumes29) in each year of the XXXXXXX timeframe. The potential incremental procurement is restricted to a range of no less than zero and no more than XXXX GWh, which is in addition to volumes available for re-contracting.30
c. The constraints are: (1) to keep PG&E’s risk of non-compliance to less than XX XXXXXXXXXXXXXXXXXX; and (2) to restrict PG&E’s Bank over time to the size necessary to meet compliance objectives within the specified risk threshold.
29 Although the physical net short calculations do not include any assumptions related to the
re-contracting of expiring RPS-eligible contracts, the stochastic model can also re-contract volumes to meet procurement need. Such re-contracting amounts are illustrative only and not prescriptive.
30 PG&E limited modeling to a maximum addition of XXXX GWh per year in order to avoid modeling outcomes that required “lumpy” procurement patterns. Large swings in annual procurement targets could lead to boom/bust development cycles and could expose PG&E’s customers to additional price volatility risk.

38
2) The stochastic model then solves the optimization problem by examining thousands
of combinations of procurement need in each year. For each of these
combinations, the model runs hundreds of iterations as part of its Monte Carlo
simulation of uncertainty for each of the risk factors in the stochastic model to test if
the constraints are met. If the solution for that combination of inputs fits within the
given constraints, it is a valid outcome.
3) For each valid outcome, the mean Net Present Value (“NPV”) cost of meeting that
procurement need is calculated based on PG&E’s RPS forward price curve.
4) Finally, the model sorts the NPV of the potential procurement outcomes from
smallest to largest, thus showing the optimal RPS-eligible deliveries needed in the
years XXXXXXXX to ensure compliance based on the modeled assumptions.
The modeled solution becomes a critical input into PG&E’s overall RPS
optimization strategy, but the outputs are subject to further analysis based upon best
professional judgment to determine whether factors outside the model could lead to
better outcomes. For example, the model does not currently consider speculating on
price volatility through sales of PG&E’s Bank in the near-term and additional
incremental procurement in the long-term. Nor does the model consider the opposite
strategy of advance procurement of RPS-eligible products in 2015 for purposes of
reselling those products in the future at a profit. As a general matter, PG&E does not
approach RPS procurement and compliance as a speculative enterprise and so has not
modeled or otherwise proposed such strategies in this Plan. However, PG&E will
consider selling surplus non-bankable RPS volumes in its portfolio and, in doing so,
may seek to sell surplus bankable volumes if it can still maintain an adequate Bank and
if market conditions are favorable.
6.5 Incorporation of the Above Risks in the Two Models Informs Procurement Need and Sales Opportunities
Incorporating inputs from the deterministic model, the stochastic model provides
results that lead to a forecasted procurement need or SONS, expected Bank usage and

39
thus an anticipated Bank size, for each compliance period. The SONS for the 33% and
40% RPS are shown in Row La of PG&E’s Alternate RNS in Appendices C.2a
and C.2b.
The stochastic model does not provide guidance on potential sales of excess
banked procurement at this time. However, as PG&E encounters economic
opportunities to sell volumes, PG&E will use the stochastic model to help evaluate
whether the proposed sale will increase the cumulative non-compliance risk for
XXXXXXXX above the XX threshold.
The results of both the deterministic and stochastic models are discussed further
in Section 7 and minimum margin of procurement is addressed in Section 8.
7 Quantitative Information
As discussed in Section 6, PG&E’s objectives for this RPS Plan are to both
achieve and maintain RPS compliance and to minimize customer cost within an
acceptable level of risk. To do that, PG&E uses both deterministic and stochastic
models. This section provides details on the results of both models and references
RNS tables provided in Appendix C. Appendices C.1a and C.1b presents the RNS in
the form required by the Administrative Law Judge’s Ruling on Renewable Net Short
issued May 21, 2014 in R.11-05-005 (“ALJ RNS Ruling”) and includes results from
PG&E’s deterministic model only, while Appendices C.2a and C.2b are a modified
version of Appendices C.1a and C.1b to present results from both PG&E’s deterministic
and stochastic models. These modifications to the table are necessary in order for
PG&E to adequately show its results from its stochastic optimization.
This section includes a discussion of PG&E’s forecast of its bank size and
PG&E’s analysis of the minimum bank needed. However, in approving the 2015 RPS
Plan, the Commission expressly rejected any specific bank size proposal and instead
indicated that proposals regarding bank size should be considered in SB 350’s
implementation.

40
7.1 Deterministic Model Results
Results from the deterministic model under the 33% RPS target are shown as
the physical net short in Row Ga of Appendices C.1a and C.2a, while the results from
the deterministic model under the 40% RPS scenario are shown as the physical net
short in Row Ga of Appendices C.1b and C.2b. Appendices C.1a and C.1b provide a
physical net short calculation using PG&E’s Bundled Retail Sales Forecast for years
2015-2019 and the LTPP sales forecast for 2020-2035, while Appendices C.2a
and C.2b rely exclusively on PG&E’s internal Bundled Retail Sales Forecast. Following
the methodology described in Section 6.1, PG&E currently estimates a long-term
volumetric success rate of approximately 99% for its portfolio of
executed-but-not-operational projects. The annual forecast failure rate used to
determine the long-term volumetric success rate is shown in Row Fbb of
Appendices C.2a and C.2b. This success rate is a snapshot in time and is also
impacted by current conditions in the renewable energy industry, discussed in more
detail in Section 5, as well as project-specific conditions. In addition to the current
long-term volumetric success rate, Rows Ga and Gb of Appendices C.2a and C.2b
depict PG&E’s expected compliance position using the current expected need scenario
before application of the Bank.
7.1.1 33% RPS Target Results
Under the current 33% RPS target, PG&E is well-positioned to meet its second
(2014-2016) and third (2017-2020) compliance period RPS requirements. As shown in
Row Gb of Appendix C.1b, the deterministic model shows a forecasted second
compliance period RPS Position of 30.3% and a third compliance period RPS position
of XXXX. Row Ga of Appendix C.2a also shows a physical net short of approximately
500 GWh beginning in 2022.
7.1.2 40% RPS Scenario Results
Under a 40% RPS scenario, PG&E is forecasted to meet its second (2014-2016)
and third (2017-2020) compliance period RPS requirements. As shown in Row Gb of

41
Appendix C.2b, PG&E has a forecasted second compliance period RPS Position
of 30.3% and a third compliance period RPS position of XXXX. Row Ga of
Appendix C.2b shows a physical net short of approximately 3,000 GWh beginning
in 2022.
7.2 Stochastic Model Results
This subsection describes the results from the stochastic model and the SONS
calculation for both the current 33% RPS target and a 40% RPS scenario. All
assumptions and caveats stated in the discussion of the 33% RPS target results apply
to the 40% RPS scenario results, unless otherwise stated. However, note that the
40% RPS scenario results apply to this particular RPS scenario only, and PG&E’s
optimization strategy may differ under other scenarios that have a different RPS target
or timeline. Because PG&E uses its stochastic model to inform its RPS procurement,
PG&E has created an Alternate RNS in Appendix C.2a for the current 33% RPS target
and Appendix C.2b for the 40% RPS scenario. Appendices C.1a and C.1b provide an
incomplete representation of PG&E’s optimized net short, as the formulas embedded in
the RNS form required by the ALJ RNS Ruling do not enable PG&E to capture its
stochastic modeling inputs and outputs. In Appendices C.2a and C.2b, two additional
rows have been added. Rows Gd and Ge show the stochastically-adjusted net short,
which incorporates the risks and uncertainties addressed in the stochastic model. This
is prior to any applications of the Bank, but includes additional procurement needed for
maintaining an optimized Bank size. Additionally, PG&E has modified the calculations
in Rows La and Lb in order to more accurately represent PG&E’s SONS.
7.2.1 Stochastically-Optimized Net Short to Meet Non-Compliance Risk Target ‒ 33% RPS Target
To evaluate possible procurement strategies, PG&E selected a cumulative
(XXXXXXXXXXXXXXX) non-compliance risk target of XX, which PG&E views as the
maximum reasonable level of non-compliance risk. Figure 7-1 shows the model’s
forecasted procurement need and resulting Bank usage under the current 33% RPS.

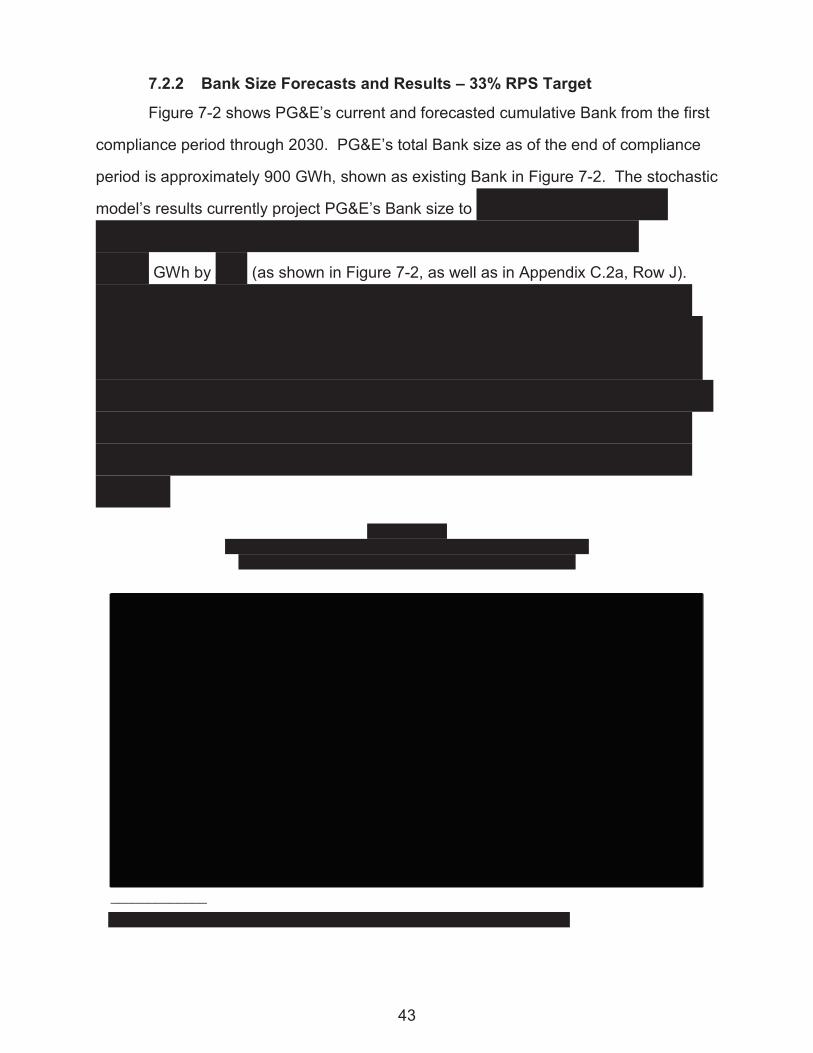

44
There is a trade-off between non-compliance risk and Bank size. A larger Bank
size decreases non-compliance risk. However, a larger Bank size may also increase
procurement costs. Higher risk scenarios would result in a lower Bank size and, as
discussed above, would increase PG&E’s probability of being in a position in which
PG&E might need to make unplanned purchases to comply with its RPS requirement.
In that situation, PG&E might not be able to avoid higher procurement costs due to the
potential for upward pressure on prices caused by the need for unplanned purchases.
7.2.3 Minimum Bank Size – 33% RPS Target
PG&E performed a simulation of variability in PG&E’s future generation and
RPS compliance targets over XXX years—i.e., the amount of the RPS generation
(“delivery”) net of RPS compliance targets (“target”)—and found that a Bank size of at
least XXXXXXXX is the minimum Bank necessary to maintain a cumulative non-
compliance risk of no greater than XX. The difference between delivery and target can
be thought of as the potential “need” (if negative) or “surplus” (if positive) that PG&E has
in any one year.
Figure 7-3 shows this distribution based on the deterministic procurement
necessary to meet the expected RPS targets with expected generation during
XXXXXXXX. This time period was selected as it best represents a “steady state” period
when the Bank approaches a minimum level and moderate incremental procurement is
required to maintain compliance. Note that given the uncertainty around the inputs in
the stochastic model, without a Bank to accommodate such uncertainty, the amount of
RPS generation is almost as likely to miss the RPS target as exceed it. One standard
deviation over XXXXXXXX is approximately XXXX GWh, as indicated on Figure 7-3.
That is, given this particular procurement scenario, about 68% of the simulations have a
difference that is up to plus or minus approximately XXXX GWh.
However, this does not suggest that a Bank of XXX GWh would be adequate to
cover potential shortfalls over this XX-year period. It would result in an unacceptable
non-compliance risk over XXXXXXXX of approximately XX. Thus, PG&E must maintain


46
Because the model inputs change over time, estimates of the Bank size
resulting from the implementation of the procurement plan will also change. In practice,
the actual outcome will more likely be a mix of factors both detracting from and
contributing to meeting the target, which is what the probability distribution in Figure 7-3
illustrates.
7.2.4 Stochastically-Optimized Net Short to Meet Non-Compliance Risk Target ‒ 40% RPS Scenario
Figure 7-4 shows the model’s forecasted procurement need and recommended
Bank usage in the 40% RPS scenario. Under this projection, a portion of the Bank is
used to meet PG&E’s compliance need beginning in XXXXXXXXXXXXXXXXXXXXXX
XXXXXXXXXXXXX, while reserving a portion of the Bank to be maintained as VMOP to
manage risks discussed in Section 6. Appendix C.2b provides the detailed results.
Annual forecasted Bank usage can be seen in Row Ia of this Appendix. The first year of
procurement need is currently forecasted as XXX. This compliance period need
represents PG&E’s SONS, which is detailed in Row La. The SONS for XXX is
approximately XXXX GWh, which increases to approximately XXXXX GWh by XXX.
The XXX SONS is XXXXX than the physical net short shown in Row Ga for XXXXXX
XXXXXXXXXXXXXXXXXXXXXXXXXXXXXXXXXXXXXXXXXXXXXXXXXXXXXX
XXXXXXXXXXXXXXXXX.


50
However, PG&E will consider selling non-bankable surplus volumes in its portfolio and,
in doing so, may identify and propose in the future opportunities to secure value for its
customers through the sale of bankable surplus procurement. PG&E will update its
physical RNS if it executes any such sale agreements and will include in its optimized
RNS and SONS specific future plans to sell RPS procurement.
8 Margin of Procurement
When analyzing its margin of procurement, PG&E considers two key
components: (1) a statutory minimum margin of procurement to address some
anticipated project failure or delay, for both existing projects and projects under contract
but not yet online, that is accounted for in PG&E’s deterministic model; and (2) a VMOP,
which aims to mitigate the additional risks and uncertainties that are accounted for in
PG&E’s stochastic model. Specifically, PG&E’s VMOP intends to (a) mitigate risks
associated with short-term variability in load; (b) protect against project failure or delay
exceeding forecasts; and (c) manage variability from RPS resource generation. In so
doing, PG&E’s VMOP helps to eliminate the need at this time to procure long-term
contracts above the 33% RPS target by creating a buffer that enables PG&E to manage
the year-to-year variability that result from risks (a)-(c). This section discusses both of
these components and how each is incorporated into PG&E’s quantitative analysis of its
RPS need.
8.1 Statutory Minimum Margin of Procurement
The RPS statute requires the Commission to adopt an “appropriate minimum
margin of procurement above the minimum procurement level necessary to comply with
the [RPS] to mitigate the risk that renewable projects planned or under contract are
delayed or canceled.”31 PG&E’s reasonableness in incorporating this statutory
minimum margin of procurement into its RPS procurement strategy is one of the factors
31 Cal. Pub. Util. Code § 399.13(a)(4)(D).

51
the Commission must consider if PG&E were to seek a waiver of RPS enforcement
because conditions beyond PG&E’s control prevented compliance.32
As described in more detail in Section 6, PG&E has developed its risk-adjusted
RPS forecasts using a deterministic model that: (1) excludes volumes from contracts at
risk of failure from PG&E’s forecast of future deliveries; and (2) adjusts expected
commencement of deliveries from contracts whose volumes are included in the model
(so long as deliveries commence within the allowed delay provisions in the contract).
PG&E considers this deterministic result to be its current statutory margin of
procurement.33 However, as discussed in Sections 6 and 7, these results are variable
and subject to change, and thus PG&E does not consider this statutory margin of
procurement to sufficiently account for all of the risks and uncertainties that can cause
substantial variation in PG&E’s portfolio. To better account for these risks and
uncertainties, PG&E uses its stochastic model to assess a VMOP, as described
further below.
8.2 Voluntary Margin of Procurement
The RPS statute provides that in order to meet its compliance goals, an IOU
may voluntarily propose a margin of procurement above the statutory minimum margin
of procurement.34 As discussed further in Sections 6 and 7, PG&E plans to use a
portion of its Bank as a VMOP to manage additional risks and uncertainties accounted
for in the stochastic model.
32 Id., § 399.15(b)(5)(B)(iii).
33 In the past PG&E has seen higher failure rates from its overall portfolio of executed-but-not-operational RPS contracts. However, as the renewables market has evolved—and projects are proposed to PG&E at more advanced stages of development—PG&E has observed a decrease in the expected failure rate of its overall portfolio. The more recent projects added to PG&E’s portfolio appear to be significantly more viable than some of the early projects in the RPS Program, resulting in lower current projections of project failure than have been discussed in past policy forums. However, its revised success rate assumption (from 87% to 99%) also reflects several recent contract terminations from PG&E’s portfolio due to and an update to the “Closely Watched” category described in Section 6.
34 Id.,§ 399.13(a)(4)(D).

52
While PG&E’s current optimization strategy projects XXXXXXXXXXXXXXX
XXXXXXXXXXXXXXXXXXXXXXXXXXXXXXXXXXXXXXXXXXXXXXXXXXXXXXXXX
XXXXXXXXXXXXXXXXXXXXXXXXXXXXXXXXXXXXXXXXXXXXXXXXXXXXXXX
XXXXXXXXXXXXXXXXXXXXXXXXXXXXXXXXXXXXXXXXXXXXXXXXXXXXXXXX
XXXXXXXXXXXXXXXXXXXXXXXXXXXXXXXXXXXXXXXXXXXXXXXXXXXXXXXXX
XXXXXXXXXX. When used as VMOP, the Bank will help to avoid long-term
over-procurement above the 33% RPS target, and will thus reduce long-term costs of
the RPS Program. Since the model inputs change over time, estimates of the Bank and
VMOP are not a static target and will change, so these estimates should be seen as a
snapshot in time. Additional discussion on the need for and use of the Bank and VMOP
are included in Sections 6 and 7.
Additionally, as a portion of the Bank will be used as VMOP, PG&E will continue
to reflect zero volumes in Row D of its RNS tables, consistent with how it has displayed
the VMOP in past RNS tables.
9 Bid Selection Protocol
As described in Sections 3 and 7, PG&E is well positioned to meet its RPS
targets, under both a 33% RPS target and a 40% RPS scenario, until at least XXXX. As
a result, PG&E will not issue a 2015 RPS solicitation. PG&E will continue to procure
RPS-eligible resources in 2016 through other Commission-mandated programs, such
as the ReMAT and RAM Programs. To reflect that PG&E will not issue a 2015 RPS
Solicitation, language has been added throughout the final 2015 RPS Plan to confirm
that PG&E is required to seek permission from the Commission to procure any
renewable energy amounts during the time period covered by the 2015 RPS Plan,
except for RPS amounts that are separately mandated.
In D.15-12-025, the Commission required in Ordering Paragraph 7 that PG&E
“include a description of how their process ensures that there is no double counting
between the Integration Cost adder and the Net Market Value components in the Least-
Cost Best-Fit methodology of [its] RPS plan[]. . ..” If PG&E were to procure RPS

53
resources, there would be no double counting between the integration cost adder and
the Net Market Value (“NMV”) components in the Least-Cost Best-Fit (“LCBF”)
methodology that would be used by PG&E. NMV measures the cost of the renewable
resource in terms of direct impacts on ratepayers—PPA payments to the supplier plus
transmission costs and integration costs, less the energy and capacity value of the
resource. It is associated with the marginal value of the energy and capacity produced
directly by the resource—it is the market cost that PG&E no longer incurs because it is
procuring energy and capacity from the resource instead. The integration cost
represents the system costs that are incurred for other resources that are needed to
support the additional renewable resource. The variable cost represents the
incremental cost of running existing flexible units in the short term, and the fixed cost
represents the incremental cost of additional flexible RA capacity to support the
additional renewable resource.
9.1 Proposed Time of Delivery Factors
PG&E sets its Time of Delivery (“TOD”) factors based on expected hourly prices.
Given the high penetration of solar generation expected through 2020 and beyond,
PG&E forecasts that there will be significant periods of time during the mid-day when
net loads are low, resulting in prices that will be low or negative, especially in the spring.
This expectation is consistent with forecasts of net load that have been publicized by
the CAISO.35 In addition, given the low mid-day loads, PG&E sees its peak demand
(and resulting higher market prices) moving to later in the day. Capacity value has also
become significantly less important in the selection process because: (1) market prices
for generic capacity are low; and (2) net qualifying capacity using effective load carrying
capability is also low. Thus, PG&E would simplify its PPAs and include only a single set
of TOD factors to be applied to both energy-only and fully deliverable resources.
35 See, e.g., CAISO Transmission Plan 2014-2015, pp. 162-163 (approved March 27, 2015)
(available at http://www.caiso.com/Documents/Board-Approved2014-2015TransmissionPlan.pdf).

54
PG&E is updating its TOD factors and TOD periods as follows:
New TODs
Move peak period from HE16-HE21 to HE17-HE22
Move mid-day period from HE07-HE15 to HE10-HE16
Move night period from HE22-HE06 to HE23-HE09
Move March back to the “Spring” period
Result: Summer=Jul.-Sep., Winter=Oct.-Feb., Spring=Mar.-Jun.; and Peak=HE17-HE22, Mid-day=HE10-HE16, Night=HE23-HE09
TABLE 9-1 RPS TIME OF DELIVERY FACTORS
Peak Mid-Day Night
Summer 1.479 0.604 1.087 Winter 1.399 0.718 1.122 Spring 1.270 0.280 1.040
10 Consideration of Price Adjustment Mechanisms
The ACR requires each IOU to “describe how price adjustments (e.g., index to
key components, index to Consumer Price Index (“CPI”), price adjustments based on
exceeding transmission or other cost caps, etc.) will be considered and potentially
incorporated into contracts for RPS-eligible projects with online dates occurring more
than 24 months after the contract execution date.”36
PG&E will consider a non-standard PPA with pricing terms that are indexed, but
indexed pricing should be the exception rather than the rule. Customers could benefit
from pricing indexed to the cost of key components, such as solar panels or wind
turbines, if those prices decrease in the future. Conversely, customers would also face
the risk that they will pay more for the energy should prices of those components
increase. Asking customers to accept this pricing risk reduces the rate stability that the
36 ACR, p. 15.

55
legislature has found is a benefit of the RPS Program.37 In order to maximize the RPS
Program’s benefits to customers, cost risk should generally be borne by developers.
Additionally, indexing greatly complicates offer selection, negotiation and
approval. It may be challenging to incorporate contract price adjustment mechanisms
into PPA negotiations when there is no clear, well-established and well-defined
agreed-upon index. There are many components to the cost of construction of a
renewable project, and indexes tied to these various components may move in different
directions. The increased complexity inherent in such negotiations is counter to the
Commission’s expressed desire to standardize and simplify RPS solicitation
processes.38
Moreover, Sellers may not have as much incentive to reduce costs if certain cost
components are indexed. For example, a price adjustment based on the cost of solar
panels (i.e., if panel costs are higher than expected, the price may adjust upward) may
not create enough incentive to minimize those costs. This would create a further level
of complexity in contract administration and regulatory oversight.
Finally, PG&E does not recommend that PPA prices be linked to the CPI. The
CPI is completely unrelated to the cost of the renewable resource, and is instead linked
to increases in prices of oil and natural gas, food, medical care and housing. Indexing
prices to unrelated commodities heightens the derivative and speculative character of
these types of transactions.
11 Economic Curtailment
In D.14-11-042, the Commission approved curtailment terms and conditions for
PG&E’s pro forma RPS PPA.39 In addition, the Commission directed the IOUs to report
on observations and issues related to economic curtailment, including reporting to the
37 See Cal. Pub. Util. Code § 399.11(b)(5).
38 See D.11-04-030, pp. 33-34.
39 D.14-11-042, pp. 43-44.

56
Procurement Review Group (“PRG”).40 In May 2015, PG&E made a presentation to its
PRG on economic curtailment. This section provides information to the Commission
and parties regarding PG&E’s observations and issues related to economic curtailment
both for the market generally, and PG&E’s specific scheduling practices for its
RPS-eligible resources.
With regard to market conditions generally, the frequency of negative price
periods in 2015 has generally increased in the Real-Time Markets, even during the low
hydro conditions of 2015. During January through May 2015, negative price intervals in
the CAISO Five Minute Market for the North of Path 15 Hub occurred more than
1,800 times (4.2% of 5 minute intervals) compared to 1,100 times (2.5%) during the
same period in 2014. Similarly, the ZP26 Hub prices for this period in 2015 were
negative over 4,100 times (9.5%), a substantial increase over the 2014 results of
1,400 times (3.3%). Increased negative price periods have led to increased
curtailments of renewable resources that are economically bid. The specific
occurrences of negative price periods and overgeneration events are largely
unpredictable; XXXXXXXXXXXXXXXXXXXXXXXXXXXXXXXXXXXXXXXXXXXXXX
XXXXXXXXXXXXXXXXXXXXXXXXXXXXXXXXXXXXXXXXXXXXXXXXXXXXXXX
XXXXXXX..
XXXXXXXXXXXXXXXXXXXXXXXXXXXXXXXXXXXXXXXXXXXXXXXXXXXX
XXXXXXXXXXXXXXXXXXXXXXXXXXXXXXXXXXXXXXXXXXXXXXXXXXXXXXX
XXXXXXXXXXXXXXXXXXXXXXXXXXXXXXXXXXXXXXXXXXXXXXXXXXXXXXXXX
XXXXXXXXXXXXXXXXXXXXXXXXXXXXXXXXXXXXXXXXXXXXXXXXXXXXXXX
XXXXXXXXXXXXXXXXXXXXXXXXXXXXXXXXXXXXXXXXXXXXXXXXXXXXXXXXXX
XXXXXXXXXXXXXXXXXXXXXXXXXXXXXXXXXXXXXXXXXXXXXXXXX
XXXXXXXXXXXXXXXXXXXXXXXXXXXXXXXXXXXXXXXXXXXXXXXXX
XXXXXXXXXXXXXXXXXXXXXXXXXXXXXXXXXXXXXXXXXXXXXXXXXXXXXX
40 Id., pp. 42-43.

57
XXXXXXXXXXXXXXXXXXXXXXXXXXXXXXXXXXXXXXXXXXXXXXXXXXXXXX
XXXXX41XXXXXXXXXXXXXXXXXXXXXXXXXXXXXXXXXXXXXXXXXXXXXXXXXXX
XXXXXXXXXXXXXXXXXXXXXXXXXXXXXXXXXXXXXXXXXXXXXXXXXXXXXXXXXX
XXXXXXXXXXXXXX PG&E submits bids for these resources based on the resource’s
opportunity costs, subject to contractual, regulatory, and operational constraints. This
also includes the incremental costs of compliance instruments required to comply with
the 33% RPS target. PG&E provided more detail concerning its RPS bidding strategy in
its proposed 2014 BPP which was filed with the Commission in October 2014 and is
currently pending at the Commission.42
XXXXXXXXXXXXXXXXXXXXXXXXXXXXXXXXXXXXXXXXXXXXXXXXXXX
XXXXXXXXXXXXXXXXXXXXXXXXXXXXXXXXXXXXXXXXXXXXXXXXXXXXXXXXX
XXXXXXXXXXXXXXXXXXXXXXXXXXXXXXXXXXXXXXXXXXXXXXXXXXXXX
XXXXXXXXXXXXXXXXXXXXXXXXXXXXXXXXXXXXXXXXXXXXXXXXXXXXXXXX
XXXXXXXXXXXXXXXXXXXXXXXXXXXXXXXXXXXXXXXXXXXXXXXXXXXXXX
XXXXX43XXXXXXXXXXXXXXXXXXXXXXXXXXXXXXXXXXXXXXXXXXXXXXXXXXX
XXXXXXXXXXXX44 While direct benefits of economic bidding include avoided costs
and CAISO market payments associated with negative prices, there can be other
important benefits, including potentially avoiding the cost impacts across the rest of
PG&E’s portfolio due to extreme negative price periods and also potentially enhancing
CAISO system reliability by helping to mitigate the occurrences, duration, or severity of
negative price periods or overgeneration events.
41 XXXXXXXXXXXXXXXXXXXXXXXXXXXXXXXXXXXXXXXXXXXXX
42 See PG&E, Proposed 2014 Bundled Procurement Plan, R.13-12-010, Appendix K (Bidding and Scheduling Protocol) (October 3, 2014).
43 XXXXXXXXXXXXXXXXXXXXXXXXXXXXXXXXXXXXXXXXXXXXXXXXXXXXXXXXX XXXXXXXXXXX.
44 XXXXXXXXXXXXXXXXXXXXXXXXXXXXXXXXXXXXXXXXXXXXXXXXXXXXXXXXXXX XXXXXXXXXXXXXXXXXXXXXXXXXXXXXXXXXXXXXXXXXXXXX

58
With regard to longer-term RPS planning and compliance, in order to ensure that
RPS procurement need forecasts account for curtailment, PG&E adds curtailment as a
risk adjustment within the stochastic model. Under the 33% RPS target, PG&E
assumes curtailment XXXXXXXXXXXXXXXXXXXXX45 under a 40% RPS scenario,
PG&E expects curtailment to increase in line with recent CAISO estimates XXXXXXXX
XXXXXXXXXXXXXXXXXXXXXXXXXX.46 These modeling assumptions will not
necessarily align with the actual number of curtailment hours, but are helpful in terms of
considering the impact of curtailment on long-term RPS planning and compliance.
PG&E will continue to observe curtailment events and update its curtailment
assumptions as needed. Implementation of these assumptions in PG&E’s modeling is
discussed in more detail in Section 6.2.3.
Finally, PG&E continues to review its existing portfolio of RPS contracts to
determine if additional economic curtailment flexibility may be available to help address
the increase in negative pricing events.
12 Expiring Contracts
The ACR requires PG&E to provide information on contracts expected to expire
in the next 10 years.47 Appendix E lists the projects under contract to PG&E that are
expected to expire in the next 10 years. The table includes the following data:
1. PG&E Log Number
2. Project Name
45 XXXXXXXXXXXXXXXXXXXXXXXXXXXXXXXXXXXXXXXXXXXXXXXXXXXXXXXX
XXXXXXXXXXXXXXXXXXXXXXXXXXXXXXXXXXXXXXXXXXXXXXXXXXXXXXXXXXXX XXXXXXXXXXXXXXXXXXXXXXXXXXXXXXXXXXXXXXXXXXXXXXXXXXXXXXXXXXXX XXXXXXXXXXXXXXXXXXXXXXXXXXXXXXXXXXXXXXXXXXXXXXXXXXXXXXXX XXXXXXXXXXXXXXXXXXXXXXXXXXXXXXXX
46 XXXXXXXXXXXXXXXXXXXXXXXXXXXXXXXXXXXXXXXXXXXXXXXXXXXXXXXXXX XXXXXXXXXXXXXXXXXXXXXXXXXXXXXXXXXXXXXXXXXXXXXXXXXXXXXXXXXX XXXXXXXXXXXXXXXXXXXXXXXXXXXXXXXXXXXXXXXXXXXXXXXX XXXXXXXXXXXXXXXXXXXXXXXXXXXXXXXXXXXXXXXXXXXXXXXXXXXXXXXXXXXX XX
47 ACR, p. 16.

59
3. Facility Name
4. Contract Expiration Year
5. Contract Capacity (MW)
6. Expected Annual Generation (GWh)
7. Contract Type
8. Resource Type
9. City
10. State
11. Footnotes identifying if PG&E has already secured the expiring volumes through a new PPA
As indicated in Appendix G, PG&E’s RNS calculations assume no
re-contracting. Re-contracting is not precluded by this assumption, but rather it reflects
that proposed material amendments (i.e., those needed to avoid project failure) or
extensions to existing contracts will be evaluated against current offers.
13 Cost Quantification
This section summarizes results from actual and forecasted RPS generation
costs (including incremental rate impacts), shows potential increased costs from
mandated programs, and identifies the need for a clear cost containment mechanism to
address RPS Program costs. Tables 1 through 4 in Appendix D provide an annual
summary of PG&E’s actual and forecasted RPS costs and Page 1 of Appendix D
outlines the methodology for calculating the costs and generation.
13.1 RPS Cost Impacts
Appendix D quantifies the cost of RPS-eligible procurement—both historical
(2003-2014) and forecast (2015-2030). From 2003 to 2014, PG&E’s annual
RPS-eligible procurement and generation costs have continued to increase. Compared
to an annual cost of $523 million in 2003, PG&E incurred more than XXXXXXX in
procurement costs for RPS-eligible resources in 2014.

60
RPS Program costs impact customers’ bills. Incremental rate impacts, defined
as the annual total cost from RPS-eligible procurement and generation divided by
bundled retail sales, effectively serve as an estimate of a system average bundled rate
for RPS-eligible procurement and generation. While this formula does not provide an
estimate of the renewable “above-market premium” that customers pay relative to a
non-RPS-eligible power alternative, the annual rate impact results in Tables 1 and 2 of
Appendix D illustrate the potential rate of growth in RPS costs and the impact this
growth will have on average rates, all other factors being equal. Annual rate impact of
the RPS Program increased from 0.7¢/kWh in 2003 to an estimated 3.5¢/kWh in 2016,
meaning the average rate impact from RPS-eligible procurement has increased more
than five-fold in approximately 12 years. This growth rate is projected to continue
increasing through 2020, as the average rate impact is forecasted to increase
to 3.9¢/kWh. In addition to the increasing RPS costs and incremental rate impacts on
customer costs resulting from the direct procurement of the renewable resources, there
are incremental indirect transmission and integration costs associated with that
procurement.
13.2 Procurement Expenditure Limit
Section 399.15(f) provides that the Commission waive the RPS obligations of an
electrical corporation once it meets the cost containment limitation, provided that
additional resources cannot be procured without exceeding “a de minimis increase in
rates.” The methodology for the PEL, the Commission’s cost containment mechanism,
is still under development. As discussed in Section 2.2, PG&E looks forward to the
Commission finalizing the PEL methodology and implementing it, to ensure that
customers are adequately protected and promote regulatory certainty and support
procurement planning.
13.3 Cost Impacts Due to Mandated Programs
As PG&E makes progress toward achieving the RPS goal of 33%, the cost
impacts of mandated procurement programs that focus on particular technologies or

61
project size increase over time, and procurement from those programs increasingly
comprises a larger share of PG&E’s incremental procurement goals. In general,
mandated procurement programs do not optimize RPS costs for customers because
they restrict flexibility and optionality to achieve emissions reductions by mandating
procurement through a less efficient and more costly manner. For instance, research
shows that market-based mechanisms, like cap-and-trade, that allow multiple and
flexible emissions reduction options, have lower costs than mandatory mechanisms like
technology targets that allow only a subset of those options.48 Studies have also
shown that renewable electricity mandates increase prices and costs,49 and
procurement mandates within California’s RPS decrease efficiency in the same way.
Mandates restrict the choices to meet the RPS targets, removing potentially less
expensive options from the market. This can increase prices in two ways: first, by
disqualifying those less expensive participants and second, by creating a less robust
market for participants to compete.50 PG&E’s customers also pay incremental costs
due to the administrative costs associated with managing separate solicitations for
mandated resources. In addition, smaller project sizes for mandated programs create a
greater number of projects which, in turn, affect interconnection and transmission
availability and costs. Finally, mandated programs do not enable PG&E to procure the
48 See, e.g., Palmer and Burtraw, “Cost-Effectiveness of Renewable Electricity Policies”
(2005) (available at http://www.rff.org/Documents/RFF-DP-05-01.pdf); Sergey Paltsev et. al, “The Cost of Climate Policy in the U.S.” (2009) (available at http://citeseerx.ist.psu.edu/viewdoc/download?doi=10.1.1.177.6721&rep=rep1&type=pdf); Palmer, Sweeney, and Allaire, “Modeling Policies to Promote Renewable and Low-Carbon Sources of Electricity” (2010) (available at http://www.rff.org/RFF/Documents/RFF-BCK-Palmeretal%20-LowCarbonElectricity-REV.pdf).
49 See, e.g., Institute for Energy Research, “Energy Regulation in the States: A Wake-up Call” (available at http://www.instituteforenergyresearch.org/pdf/statereport.pdf); Manhattan Institute, “The High Cost of Renewable Electricity Mandates” (available at http://www.manhattan-institute.org/html/eper_10.htm).
50 See, Fischer and Preonas, “Combining Policies for Renewable Energy: Is the Whole Less Than the Sum of Its Parts?” (2010) (available at http://www.rff.org/Documents/Fischer_Preonas_IRERE_2010.pdf).

62
technology, size, vintage, location and other attributes that would best fit its portfolio.
As a result, PG&E’s costs for managing its total generation and portfolio increase. For
these reasons, PG&E supports a technology neutral procurement process, in which all
technologies can compete to demonstrate which projects provide the best value to
customers at the lowest cost.
14 Imperial Valley
For the IOUs’ 2014 RPS solicitations, the Commission did not specifically
require any remedial measures to bolster procurement from Imperial Valley projects but
required continued monitoring of IOUs’ renewable procurement activities in the Imperial
Valley area.51 Even without remedial measures in PG&E’s 2014 RPS Solicitation, the
Independent Evaluator monitoring that solicitation found that:
Overall, the response of developers to propose Imperial Valley projects was robust and PG&E’s selection of Imperial Valley Offers was representative of that response. Arroyo perceives no evidence that PG&E failed in any way to perform outreach to developers active in the Imperial Valley or that there was any structural impediment in the RFO process that hindered the selection of competitively priced Offers for projects in the Imperial Valley.52
Given the robustness of the response from Imperial Valley projects in the
2014 RPS solicitation, as well as the 2013 RPS solicitation, and given the fact that
PG&E is not planning on conducting a 2015 RPS solicitation, there does not appear to
be a need to adopt any special remedial measures for the Imperial Valley as a part of
the RPS Plan.
The ACR also directs the IOUs to report on any CPUC-approved RPS PPA for
projects in the Imperial Valley that are under development, and any RPS projects in the
Imperial Valley that have recently achieved commercial operation.53 PG&E has
one PPA under contract in the Imperial Valley. That project is in development. 51 D.14-11-042, pp. 15-16.
52 PG&E, Advice Letter 4632-E, p. 40, Section 2 (IE Report) (May 7, 2015).
53 ACR, p. 19.

63
Commercial operation is expected in 2016, with deliveries under the PPA beginning
in 2020.
15 Important Changes to Plans Noted
This section describes the most significant changes between PG&E’s 2014 RPS
Plan and its 2015 RPS Plan. A complete redline of the draft 2015 RPS Plan against
PG&E’s 2014 RPS Plan was included as Appendix A of the August 4, 2015 draft RPS
Plan. This section identifies and summarizes the key changes and differences between
the 2014 RPS Plan and the proposed 2015 RPS Plan. Specifically, the table below
provides a list of key differences between the two RPS Plans:
Reference Area of Change Summary of Change Justification
Section 1 Section format and structure
Remove “Executive Summary” from Introduction.
Ease of document flow.
Entire RPS Plan Consideration of a Higher RPS Requirement
Include response to the Specific Requirements for 2015 RPS Procurement Plans, considering both the current 33% by 2020 target and a 40% by 2024 scenario.
ACR at pp.5-6.
Section 2.1 Commission Implementation of SB 2 (1x)
Include discussion of D.14-12-023, setting RPS compliance and enforcement rules under SB 2 (1X).
ACR at p. 4.
Section 3.2.2 Impact of Green Tariff Shared Renewable Program
Include discussion of impact of Green Tariff Shared Renewable Program on RPS position.
D.14-11-042; D.15-01-051.
Section 3.4 Anticipated Renewable Energy Technologies and Alignment of Portfolio With Expected Load Curves and Durations
Include discussion of integration cost adder as part of LCBF bid evaluation methodology.
ACR at p.15.
Section 3.5 RPS Portfolio Diversity Include discussion of efforts to increase portfolio diversity.
ACR at p.10.

64
Reference Area of Change Summary of Change Justification
Section 5.4 Curtailment of RPS Generating Resources
Include discussion of economic curtailment as a potential compliance delay.
ACR at p.16.
Section 11 Economic Curtailment Include discussion of economic curtailment.
ACR at p.16.
Appendix C.1b Renewable Net Short Calculations – 40% RPS Scenario
Include response to the Specific Requirements for 2015 RPS Procurement Plans, considering both the current 33% by 2020 target and a 40% by 2024 scenario.
ACR at pp.5-6.
Appendix C.2b Alternate Renewable Net Short Calculations – 40% RPS Scenario
Include response to the Specific Requirements for 2015 RPS Procurement Plans, considering both the current 33% by 2020 target and a 40% by 2024 scenario.
ACR at pp.5-6.
Appendix F.2b Project Failure Variability – 40% RPS Scenario
Include response to the Specific Requirements for 2015 RPS Procurement Plans, considering both the current 33% by 2020 target and a 40% by 2024 scenario.
ACR at pp.5-6.
Appendix F.3b RPS Generation Variability – 40% RPS Scenario
Include response to the Specific Requirements for 2015 RPS Procurement Plans, considering both the current 33% by 2020 target and a 40% by 2024 scenario.
ACR at pp.5-6.
Appendix F.4b RPS Deliveries Variability – 40% RPS Scenario
Include response to the Specific Requirements for 2015 RPS Procurement Plans, considering both the current 33% by 2020 target and a 40% by 2024 scenario.
ACR at pp.5-6.
Appendix F.5b RPS Target Variability – 40% RPS Scenario
Include response to the Specific Requirements for 2015 RPS Procurement Plans, considering both the current 33% by 2020 target and a 40% by 2024 scenario.
ACR at pp.5-6.
65
16 Safety Considerations
PG&E is committed to providing safe utility (electric and gas) service to its
customers. As part of this commitment, PG&E reviews its operations, including energy
procurement, to identify and mitigate, to the extent possible, potential safety risks to the
public and PG&E’s workforce and its contractors. Because PG&E’s role in ensuring the
safe construction and operation of RPS-eligible generation facilities depends upon
whether PG&E is the owner of the generation or is simply the contractual purchaser of
RPS-eligible products (e.g., energy and RECs), this section is divided into separate
discussions addressing each of these situations.
16.1 Development and Operation of PG&E-Owned, RPS-Eligible Generation
While PG&E is not proposing as part of its 2015 RPS Plan to develop additional
utility-owned renewable facilities, its existing RPS portfolio contains a number of such
facilities. To the extent that PG&E builds, operates, maintains, and decommissions its
own RPS-eligible generation facilities, PG&E follows its internal standard protocols and
practices to ensure public, workplace, and contractor safety. For example, PG&E’s
Employee Code of Conduct describes the safety of the public, employees and
contractors as PG&E’s highest priority.54 PG&E’s commitment to a safety-first culture
is reinforced with its Safety Principles, PG&E’s Safety Commitment, Personal Safety
Commitment and Keys to Life.55 These tools were developed in collaboration with
PG&E employees, leaders, and union leadership and are intended to provide clarity and
support as employees strive to take personal ownership of safety at PG&E.
Additionally, PG&E seeks all applicable regulatory approvals from governmental
54 See PG&E, “Employee Code of Conduct” (August 2013) (available at
http://www.pgecorp.com/aboutus/corp_gov/coce/employee_conduct_standards.shtml). See, e.g., PG&E, “Contractor, Consultant, and Supplier Code of Conduct,” p. 3 (available at http://www.pgecorp.com/aboutus/ethics_compliance/con_con_ven/).
55 See PG&E, “Employee Code of Conduct” supra (describing the Safety Principles, Safety Commitment, Personal Safety Commitment and Keys to Life).

66
authorities with jurisdiction to enforce laws related to worker health and safety, impacts
to the environment, and public health and welfare.
As more fully detailed in PG&E’s testimony in its General Rate Case (“GRC”),56
the top priority of PG&E’s Electric Supply organization is public and employee safety,
and its goal is to safely operate and maintain its generation facilities. In general, PG&E
ensures safety in the development and operation of its RPS-eligible facilities in the
same manner as it does for its other UOG facilities. This includes the use of recognized
best practices in the industry.
PG&E operates each of its generation facilities in compliance with all local, state
and federal permit and operating requirements such as state and federal Occupational
Safety and Health Administration (“OSHA”) and the CPUC’s General Order 167. PG&E
does this by using internal controls to help manage the operations and maintenance of
its generation facilities, including: (1) guidance documents; (2) operations reviews;
(3) an incident reporting process; (4) a corrective action program; (5) an outage
planning and scheduling process; (6) a project management process; and (7) a design
change process.
PG&E’s Environmental Services organization also provides direct support to the
generation facilities, with a focus on regulatory compliance. Environmental consultants
are assigned to each of the generating facilities and support the facility staff.
With regard to employee safety, Power Generation employees develop a safety
action plan each year. This action plan focuses on various items such as clearance
processes and electrical safety, switching and grounding observations, training and
qualifications, expanding the use of Job Safety Analysis tools, peer-to-peer recognition,
near-hit reporting, industrial ergonomics, and human performance.
56 See PG&E, Prepared Testimony, 2014 GRC, Application 12-11-009, Exhibit (PG&E-6),
Energy Supply, pp. 1-11, 2-17, 2-44, 2-66, 4-13 (available at http://www.pge.com/regulation/).

67
Employees also participate in an employee led Driver Awareness Team
established for the sole purpose of improving driving. An annual motor vehicle incident
(“MVI”) Action Plan is developed and implemented each year. This action plan focuses
on vehicle safety culture and implements the Companywide motor vehicle safety
initiatives in addition to specific tools such as peer driving reviews and 1 800 phone
number analysis to reduce MVIs.
The day-to-day safety work in the operation of PG&E’s generation facilities
consists of base activities such as:
Industrial and office ergonomics training/evaluations
Illness and injury prevention
Health and wellness training
Regulatory mandated training
Training and re certification for the safety staff
Culture based safety process
Asbestos and lead awareness training
Safety at Heights Program
Safe driving training
First responder training
Preparation of safety tailboards and department safety procedures
Proper use of personal protective equipment
Incident investigations and communicating lessons learned
Employee injury case management
Safety performance recognition
Public safety awareness
The safety focus of PG&E’s hydropower operations includes the safety of the
public at, around, and/or downstream of PG&E’s facilities; the safety of our personnel at
and/or traveling to PG&E’s hydro facilities; and the protection of personal property

68
potentially affected by PG&E’s actions or operations. With regard to public safety,
PG&E is developing and implementing a comprehensive public safety program that
includes: (1) public education, outreach and partnership with key agencies;
(2) improved warning and hazard signage at hydro facilities; (3) enhanced emergency
response preparedness, training, drills and coordination with emergency response
organizations; and (4) safer access to hydro facilities and lands, including trail access,
physical barriers, and canal escape routes.
PG&E has also funded specific hydro-related projects that correct potential
public and employee safety hazards, such as Arc Flash Hazards, inadequate ground
grids, and waterway, penstock, and other facility safety condition improvements.
PG&E will never be satisfied in its safety performance until there is never an
injury to any of its employees, contractors, or members of the public. Over the past
several years, PG&E’s Power Generation organization has been creating a culture of
safety first with strong leadership expectations and an increasingly engaged workforce.
Fundamental to a strong safety culture is a leadership team that believes every job can
be performed safely and seeks to eliminate barriers to safe operations. Equally
important is the establishment of an empowered grass roots safety team that can act to
encourage safe work practices among peers. Power Generation’s grass roots team is
led by bargaining unit employees from across the organization who work to include
safety best practices in all the work they do. These employees are closest to the
day-to-day work of providing safe, reliable, and affordable energy for PG&E’s customers
and are best positioned to implement change that can improve safety performance.
16.2 Development and Operation of Third-Party–Owned, RPS-Eligible Generation
The vast majority of PG&E’s procurement of products to meet RPS requirements
has been from third-party generation developers. In these cases, local, state and
federal agencies that have review and approval authority over the generation facilities
are charged with enforcing safety, environmental and other regulations for the Project,

69
including decommissioning. While this authority has not changed, PG&E intends to add
additional contract provisions to its contract forms to reinforce the developer’s
obligations to operate in accordance with all applicable safety laws, rules and
regulations as well as Prudent Electrical Practices, which are the continuously evolving
industry standards for operations of similar electric generation facilities. Additionally,
the new provisions will seek to implement lessons learned and instill a continuous
improvement safety culture that mirrors PG&E’s approach to safety.
Specifically, the safety language that PG&E is developing builds upon the former
standard of Good Utility Practices to a new standard of Prudent Utility Practices, which
includes greater detail on the types of activities covered by this standard, including but
not limited to safeguards, equipment, personnel training, and control systems.
Safety is also addressed as part of a generator’s interconnection process, which
requires testing for safety and reliability of the interconnected generation. PG&E’s
general practice is to declare that a facility under contract has commenced deliveries
under the PPA only after the interconnecting utility and the CAISO have concluded such
testing and given permission to commence commercial operations.
PG&E receives monthly progress reports from generators who are developing
new RPS-eligible resources where the output will be sold to PG&E. As part of this
progress report, generators are required to provide the status of construction activities,
including OSHA recordables and work stoppage information. Additionally, the new
contract provisions would require reporting of Serious Incidents and Exigent
Circumstances shortly after they occur. If the generator has repeated safety violations
or challenges, the generator could be at greater risk of failing to meet a key project
development milestone or failing to meet a material obligation set forth in the PPA.
The decommissioning of a third-party generation project is not addressed in the
form contract. In many cases, it may be expected that a third-party generator may
continue to operate its generation facility after the PPA has expired or terminated,
perhaps with another off-taker. Any requirements and conditions for decommissioning

70
of a generation facility owned by a third-party should be governed by the applicable
permitting authorities.
17 Energy Storage
AB 2514, signed into law in September 2010, added Section 2837, which
requires that the IOUs’ RPS procurement plans incorporate any energy storage targets
and policies that are adopted by the Commission as a result of its implementation of
AB 2514. On October 17, 2013, the CPUC issued D.13-10-040 adopting an energy
storage procurement framework and program design, requiring that PG&E execute
580 MW of storage capacity by 2020, with projects required to be installed and
operational by no later than the end of 2024. In accordance with the guidelines in the
decision, PG&E submitted an application to procure energy storage resources on
February 28, 2014. In D.14-10-045, the CPUC approved PG&E’s application with
modifications. PG&E filed final storage RFO results for CPUC approval on December 1,
2015. In addition, PG&E is participating in a new proceeding, R.15-03-011, which the
Commission opened in March 2015 to consider policy and implementation refinements
to the energy storage procurement framework and program design.
PG&E considers eligible energy storage systems to help meet its Energy
Storage Program targets through its RPS procurement process, Energy Storage RFO,
as well as other CPUC programs and channels such as the Self-Generation Incentive
Program. PG&E’s LCBF methodology considers the additional value offered by
RPS-eligible generation facilities that incorporate energy storage. Further detail on
PG&E’s energy storage procurement can be found in its biennial Energy Storage
Plan.57
57 See PG&E, Application of Pacific Gas and Electric Company (U 39-E) for Authorization to
Procure Energy Storage Resources (2014-2015 Biennial Cycle), (available at: http://www.cpuc.ca.gov/NR/rdonlyres/D9CACD21-AB1C-411A-8B79-84FB28E88C58/0/PGE_StorageApplication.pdf).

APPENDIX B
Project Development Status Update
January 14, 2016

Appendix B - Project Development Status UpdateLine No. IOU ID Project Name Primary Developer Technology Type Contract
Capacity (MW)Expected Energy
(GWh)Energy Delivery
Status Vintage CPUC Approval Status Financing Status Permit Status
Guaranteed Construction
Start Date
Expected or Actual
Construction Start Date
Construction Status
Status of Interconnection
AgreementGuaranteed COD Expected or
Actual COD
1 33R255 KansasDominion Solar Holdings, Inc. Solar Photovoltaic 20 47 New CPUC Approved Complete Complete Complete 12/31/2016 12/26/2014
2 33R279 Alamo Solar, LLC Dominion Solar Holdings, Inc. Solar Photovoltaic 20 50 New CPUC Approved Complete N/A Complete Complete 5/20/2015 5/20/2015
3 33R291 Shafter Solar NextEra Energy Resources Solar Photovoltaic 20 53 New CPUC Approved Complete N/A Complete Complete 10/10/2015 6/3/2015
4 33R148 North Star Solar 1Southern Renewable Partnerships, LLC Solar Photovoltaic 60 136 New CPUC Approved Complete Complete 6/20/2015
5 33R278Columbia Solar Energy, LLC
Hanergy Holding America, Inc. Solar Photovoltaic 19 41 New CPUC Approved Complete N/A Complete 5/20/2015
6 33R324 Woodmere Solar Farm sPower Solar Photovoltaic 15 33 New CPUC Approved Complete N/A Complete 2/3/2016
7 33R322Rising Tree Wind Farm II LLC
EDP Renewables North America LLC Wind 20 69 New CPUC Approved Complete N/A Complete Complete 2/3/2016
8 33R254 SPI Biomass Portfolio Sierra Pacific Industries Biomass 58 346 Existing / New CPUC Approved Complete Complete Complete 9/23/2015
9 33R292 Morelos Del SolGestamp Asetym Solar North America Solar Photovoltaic 15 33 New CPUC Approved N/A Complete 12/10/2015
10 33R287 Sand Hill Wind, LLC Ogin, Inc. Wind 20 44 Repowered CPUC Approved
Complete N/A 12/10/2015
11 33R326 Blackwell Solar Park, LLCFrontier Renewables LLC Solar Photovoltaic 20 48 New CPUC Approved Complete N/A Complete 2/3/2016
12 33R367 Altech III Ogin, Inc. Wind 20 53 Repowered CPUC Approved N/A N/A (Existing)
11/1/2016
13 33R375 Westside Solar, LLC
Nextera Energy Resources, LLC and its subsidiary Aries Solar Holding, LLC Solar Photovoltaic 20 55 New CPUC Approved Complete N/A Complete 5/30/2017
14 33R329 Diablo Winds (2)NextEra Energy Resources, LLC Wind 18 62 Existing CPUC Approved Complete N/A N/A (Existing) Complete Complete 7/1/2016
15 33R361Maricopa West Solar PV 2, LLC
E.ON Climate and Renewables North America, LLC Solar Photovoltaic 20 55 New CPUC Approved Complete N/A 1/17/2017
16 33R257 Cuyama Solar Array First Solar, Inc. Solar Photovoltaic 40 104 New CPUC Approved Complete 12/31/2019
17 33R259 Henrietta Solar SunPower Solar Photovoltaic 100 244 New CPUC Approved Complete Complete 10/1/2016
18 33R362Portal Ridge Solar C Project First Solar, Inc. Solar Photovoltaic 11 30 New CPUC Approved Complete N/A Complete 1/17/2017
19 33R374CED Corcoran Solar 3, LLC
Con Edison Development Solar Photovoltaic 20 49 New CPUC Approved N/A Complete 5/30/2017
20 33R364 Sunray 20Cogentrix Solar Holdings, LLC Solar Photovoltaic 20 51 New CPUC Approved Complete N/A 1/17/2017
21 33R133 Potrero Hills Landfill DTE Biomass Energy Biogas Generation 8 56 New CPUC Approved Complete Complete 12/6/2016
22 33R376 Aspiration Solar G LLC FTP Solar LLC Solar Photovoltaic 9 23 New CPUC Approved N/A Complete 3/23/2017
23 33R344California Flats Solar Project First Solar, Inc. Solar Photovoltaic 150 381 New CPUC Approved Complete 12/31/2018
24 33R330 RE Astoria LLC Recurrent Energy Solar Photovoltaic 100 298 New CPUC Approved Complete Complete 1/3/2019
25 33R363SR Solis Oro Loma Teresina, LLC- Project A
Con Edison Development Solar Photovoltaic 10 26 New CPUC Approved N/A Complete 1/17/2017
26 33R366SR Solis Oro Loma Teresina, LLC- Project B
Con Edison Development Solar Photovoltaic 10 26 New CPUC Approved N/A Complete 1/17/2017
27 33R365SR Solis Rocket, LLC - Project A
Con Edison Development Solar Photovoltaic 8 20 New CPUC Approved N/A Complete 1/17/2017
28 33R368SR Solis Rocket, LLC - Project B
Con Edison Development Solar Photovoltaic 8 20 New CPUC Approved N/A Complete 1/17/2017
29 33R258 Blackwell Solar First Solar, Inc. Solar Photovoltaic 12 28 New CPUC Approved Complete Complete Complete 12/31/2019
30 33R256 Lost Hills Solar First Solar, Inc. Solar Photovoltaic 20 47 New CPUC Approved Complete Complete Complete 12/31/2019
31 33R343 Midway Solar Farm ISolar Frontier Americas Holding, LLC Solar Photovoltaic 50 119 New CPUC Approved Complete Complete 6/1/2020
Page 1 of 1

APPENDIX C.1a
Renewable Net Short Calculations – 33% RPS Target
January 14, 2016
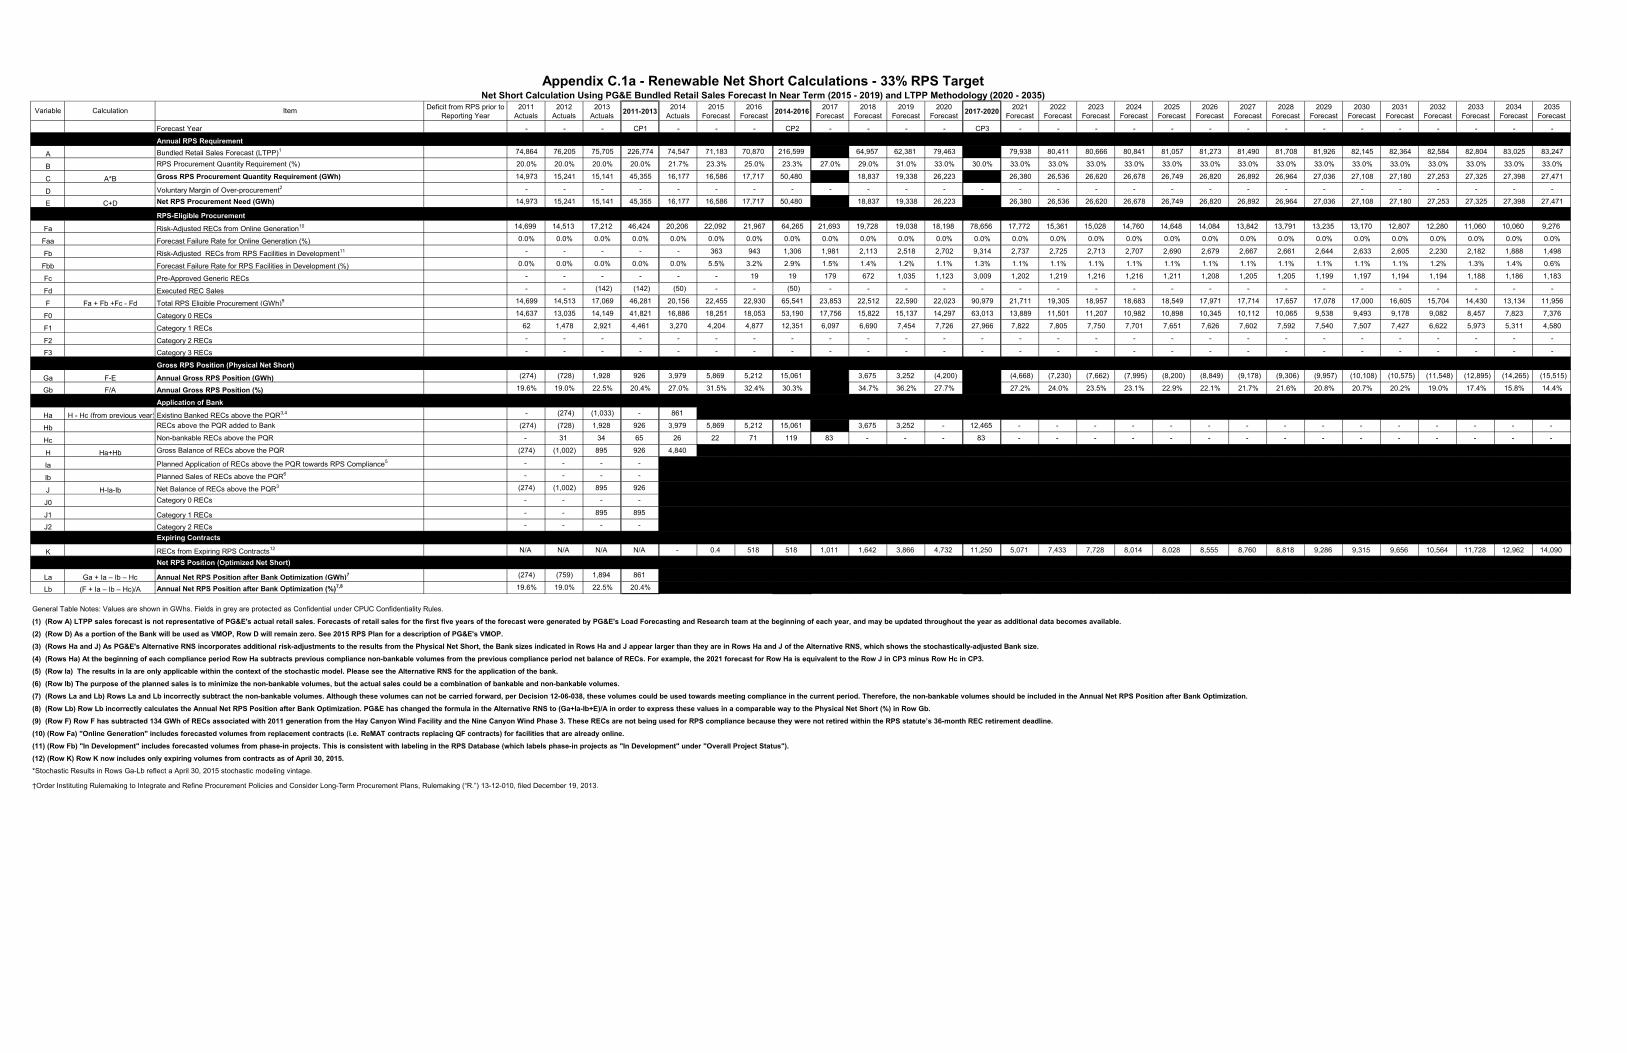
Variable Calculation Item Deficit from RPS prior to Reporting Year
2011 Actuals
2012 Actuals
2013 Actuals 2011-2013 2014
Actuals2015
Forecast2016
Forecast 2014-2016 2017 Forecast
2018 Forecast
2019 Forecast
2020 Forecast 2017-2020 2021
Forecast2022
Forecast2023
Forecast2024
Forecast2025
Forecast2026
Forecast2027
Forecast2028
Forecast2029
Forecast2030
Forecast2031
Forecast2032
Forecast2033
Forecast2034
Forecast2035
Forecast
Forecast Year - - - CP1 - - - CP2 - - - - CP3 - - - - - - - - - - - - - - -
Annual RPS Requirement
A Bundled Retail Sales Forecast (LTPP)1 74,864 76,205 75,705 226,774 74,547 71,183 70,870 216,599 64,957 62,381 79,463 79,938 80,411 80,666 80,841 81,057 81,273 81,490 81,708 81,926 82,145 82,364 82,584 82,804 83,025 83,247
B RPS Procurement Quantity Requirement (%) 20.0% 20.0% 20.0% 20.0% 21.7% 23.3% 25.0% 23.3% 27.0% 29.0% 31.0% 33.0% 30.0% 33.0% 33.0% 33.0% 33.0% 33.0% 33.0% 33.0% 33.0% 33.0% 33.0% 33.0% 33.0% 33.0% 33.0% 33.0%
C A*B Gross RPS Procurement Quantity Requirement (GWh) 14,973 15,241 15,141 45,355 16,177 16,586 17,717 50,480 18,837 19,338 26,223 26,380 26,536 26,620 26,678 26,749 26,820 26,892 26,964 27,036 27,108 27,180 27,253 27,325 27,398 27,471
D Voluntary Margin of Over-procurement2 - - - - - - - - - - - - - - - - - - - - - - - - - - - -
E C+D Net RPS Procurement Need (GWh) 14,973 15,241 15,141 45,355 16,177 16,586 17,717 50,480 18,837 19,338 26,223 26,380 26,536 26,620 26,678 26,749 26,820 26,892 26,964 27,036 27,108 27,180 27,253 27,325 27,398 27,471
RPS-Eligible Procurement
Fa Risk-Adjusted RECs from Online Generation10 14,699 14,513 17,212 46,424 20,206 22,092 21,967 64,265 21,693 19,728 19,038 18,198 78,656 17,772 15,361 15,028 14,760 14,648 14,084 13,842 13,791 13,235 13,170 12,807 12,280 11,060 10,060 9,276
Faa Forecast Failure Rate for Online Generation (%) 0.0% 0.0% 0.0% 0.0% 0.0% 0.0% 0.0% 0.0% 0.0% 0.0% 0.0% 0.0% 0.0% 0.0% 0.0% 0.0% 0.0% 0.0% 0.0% 0.0% 0.0% 0.0% 0.0% 0.0% 0.0% 0.0% 0.0% 0.0%
Fb Risk-Adjusted RECs from RPS Facilities in Development11 - - - - - 363 943 1,306 1,981 2,113 2,518 2,702 9,314 2,737 2,725 2,713 2,707 2,690 2,679 2,667 2,661 2,644 2,633 2,605 2,230 2,182 1,888 1,498
Fbb Forecast Failure Rate for RPS Facilities in Development (%) 0.0% 0.0% 0.0% 0.0% 0.0% 5.5% 3.2% 2.9% 1.5% 1.4% 1.2% 1.1% 1.3% 1.1% 1.1% 1.1% 1.1% 1.1% 1.1% 1.1% 1.1% 1.1% 1.1% 1.1% 1.2% 1.3% 1.4% 0.6%
Fc Pre-Approved Generic RECs - - - - - - 19 19 179 672 1,035 1,123 3,009 1,202 1,219 1,216 1,216 1,211 1,208 1,205 1,205 1,199 1,197 1,194 1,194 1,188 1,186 1,183
Fd Executed REC Sales - - (142) (142) (50) - - (50) - - - - - - - - - - - - - - - - - - - -
F Fa + Fb +Fc - Fd Total RPS Eligible Procurement (GWh)9 14,699 14,513 17,069 46,281 20,156 22,455 22,930 65,541 23,853 22,512 22,590 22,023 90,979 21,711 19,305 18,957 18,683 18,549 17,971 17,714 17,657 17,078 17,000 16,605 15,704 14,430 13,134 11,956
F0 Category 0 RECs 14,637 13,035 14,149 41,821 16,886 18,251 18,053 53,190 17,756 15,822 15,137 14,297 63,013 13,889 11,501 11,207 10,982 10,898 10,345 10,112 10,065 9,538 9,493 9,178 9,082 8,457 7,823 7,376
F1 Category 1 RECs 62 1,478 2,921 4,461 3,270 4,204 4,877 12,351 6,097 6,690 7,454 7,726 27,966 7,822 7,805 7,750 7,701 7,651 7,626 7,602 7,592 7,540 7,507 7,427 6,622 5,973 5,311 4,580
F2 Category 2 RECs - - - - - - - - - - - - - - - - - - - - - - - - - - - -
F3 Category 3 RECs - - - - - - - - - - - - - - - - - - - - - - - - - - - -
Gross RPS Position (Physical Net Short)
Ga F-E Annual Gross RPS Position (GWh) (274) (728) 1,928 926 3,979 5,869 5,212 15,061 3,675 3,252 (4,200) (4,668) (7,230) (7,662) (7,995) (8,200) (8,849) (9,178) (9,306) (9,957) (10,108) (10,575) (11,548) (12,895) (14,265) (15,515)
Gb F/A Annual Gross RPS Position (%) 19.6% 19.0% 22.5% 20.4% 27.0% 31.5% 32.4% 30.3% 34.7% 36.2% 27.7% 27.2% 24.0% 23.5% 23.1% 22.9% 22.1% 21.7% 21.6% 20.8% 20.7% 20.2% 19.0% 17.4% 15.8% 14.4%
Application of Bank
Ha H - Hc (from previous year) Existing Banked RECs above the PQR3,4 - (274) (1,033) - 861
Hb RECs above the PQR added to Bank (274) (728) 1,928 926 3,979 5,869 5,212 15,061 3,675 3,252 - 12,465 - - - - - - - - - - - - - - -
Hc Non-bankable RECs above the PQR - 31 34 65 26 22 71 119 83 - - - 83 - - - - - - - - - - - - - - -
H Ha+Hb Gross Balance of RECs above the PQR (274) (1,002) 895 926 4,840
Ia Planned Application of RECs above the PQR towards RPS Compliance5 - - - -
Ib Planned Sales of RECs above the PQR6 - - - -
J H-Ia-Ib Net Balance of RECs above the PQR3 (274) (1,002) 895 926
J0 Category 0 RECs - - - -
J1 Category 1 RECs - - 895 895
J2 Category 2 RECs - - - -
Expiring Contracts
K RECs from Expiring RPS Contracts12 N/A N/A N/A N/A - 0.4 518 518 1,011 1,642 3,866 4,732 11,250 5,071 7,433 7,728 8,014 8,028 8,555 8,760 8,818 9,286 9,315 9,656 10,564 11,728 12,962 14,090
Net RPS Position (Optimized Net Short)
La Ga + Ia – Ib – Hc Annual Net RPS Position after Bank Optimization (GWh)7 (274) (759) 1,894 861
Lb (F + Ia – Ib – Hc)/A Annual Net RPS Position after Bank Optimization (%)7,8 19.6% 19.0% 22.5% 20.4%
General Table Notes: Values are shown in GWhs. Fields in grey are protected as Confidential under CPUC Confidentiality Rules.
(1) (Row A) LTPP sales forecast is not representative of PG&E's actual retail sales. Forecasts of retail sales for the first five years of the forecast were generated by PG&E's Load Forecasting and Research team at the beginning of each year, and may be updated throughout the year as additional data becomes available.(2) (Row D) As a portion of the Bank will be used as VMOP, Row D will remain zero. See 2015 RPS Plan for a description of PG&E's VMOP.(3) (Rows Ha and J) As PG&E's Alternative RNS incorporates additional risk-adjustments to the results from the Physical Net Short, the Bank sizes indicated in Rows Ha and J appear larger than they are in Rows Ha and J of the Alternative RNS, which shows the stochastically-adjusted Bank size.(4) (Rows Ha) At the beginning of each compliance period Row Ha subtracts previous compliance non-bankable volumes from the previous compliance period net balance of RECs. For example, the 2021 forecast for Row Ha is equivalent to the Row J in CP3 minus Row Hc in CP3.(5) (Row Ia) The results in Ia are only applicable within the context of the stochastic model. Please see the Alternative RNS for the application of the bank.(6) (Row Ib) The purpose of the planned sales is to minimize the non-bankable volumes, but the actual sales could be a combination of bankable and non-bankable volumes.(7) (Rows La and Lb) Rows La and Lb incorrectly subtract the non-bankable volumes. Although these volumes can not be carried forward, per Decision 12-06-038, these volumes could be used towards meeting compliance in the current period. Therefore, the non-bankable volumes should be included in the Annual Net RPS Position after Bank Optimization.(8) (Row Lb) Row Lb incorrectly calculates the Annual Net RPS Position after Bank Optimization. PG&E has changed the formula in the Alternative RNS to (Ga+Ia-Ib+E)/A in order to express these values in a comparable way to the Physical Net Short (%) in Row Gb.(9) (Row F) Row F has subtracted 134 GWh of RECs associated with 2011 generation from the Hay Canyon Wind Facility and the Nine Canyon Wind Phase 3. These RECs are not being used for RPS compliance because they were not retired within the RPS statute’s 36-month REC retirement deadline.(10) (Row Fa) "Online Generation" includes forecasted volumes from replacement contracts (i.e. ReMAT contracts replacing QF contracts) for facilities that are already online.(11) (Row Fb) "In Development" includes forecasted volumes from phase-in projects. This is consistent with labeling in the RPS Database (which labels phase-in projects as "In Development" under "Overall Project Status").(12) (Row K) Row K now includes only expiring volumes from contracts as of April 30, 2015. *Stochastic Results in Rows Ga-Lb reflect a April 30, 2015 stochastic modeling vintage.
†Order Instituting Rulemaking to Integrate and Refine Procurement Policies and Consider Long-Term Procurement Plans, Rulemaking (“R.”) 13-12-010, filed December 19, 2013.
Appendix C.1a - Renewable Net Short Calculations - 33% RPS TargetNet Short Calculation Using PG&E Bundled Retail Sales Forecast In Near Term (2015 - 2019) and LTPP Methodology (2020 - 2035)

APPENDIX C.1b
Renewable Net Short Calculations – 40% RPS Scenario
January 14, 2016

Variable Calculation Item Deficit from RPS prior to Reporting Year
2011 Actuals
2012 Actuals
2013 Actuals 2011-2013 2014
Actuals2015
Forecast2016
Forecast 2014-2016 2017 Forecast
2018 Forecast
2019 Forecast
2020 Forecast 2017-2020 2021
Forecast2022
Forecast2023
Forecast2024
Forecast2025
Forecast2026
Forecast2027
Forecast2028
Forecast2029
Forecast2030
Forecast2031
Forecast2032
Forecast2033
Forecast2034
Forecast2035
Forecast
Forecast Year - - - CP1 - - - CP2 - - - - CP3 - - - - - - - - - - - - - - -
Annual RPS Requirement
A Bundled Retail Sales Forecast (LTPP)1 74,864 76,205 75,705 226,774 74,547 71,183 70,870 216,599 64,957 62,381 79,463 79,938 80,411 80,666 80,841 81,057 81,273 81,490 81,708 81,926 82,145 82,364 82,584 82,804 83,025 83,247
B RPS Procurement Quantity Requirement (%) 20.0% 20.0% 20.0% 20.0% 21.7% 23.3% 25.0% 23.3% 27.0% 29.0% 31.0% 33.0% 30.0% 33.0% 37.0% 37.0% 40.0% 40.0% 40.0% 40.0% 40.0% 40.0% 40.0% 40.0% 40.0% 40.0% 40.0% 40.0%
C A*B Gross RPS Procurement Quantity Requirement (GWh) 14,973 15,241 15,141 45,355 16,177 16,586 17,717 50,480 18,837 19,338 26,223 26,380 29,752 29,846 32,336 32,423 32,509 32,596 32,683 32,770 32,858 32,946 33,034 33,122 33,210 33,299
D Voluntary Margin of Over-procurement2 - - - - - - - - - - - - - - - - - - - - - - - - - - - -
E C+D Net RPS Procurement Need (GWh) 14,973 15,241 15,141 45,355 16,177 16,586 17,717 50,480 18,837 19,338 26,223 26,380 29,752 29,846 32,336 32,423 32,509 32,596 32,683 32,770 32,858 32,946 33,034 33,122 33,210 33,299
RPS-Eligible Procurement
Fa Risk-Adjusted RECs from Online Generation10 14,699 14,513 17,212 46,424 20,206 22,092 21,967 64,265 21,693 19,728 19,038 18,198 78,656 17,772 15,361 15,028 14,760 14,648 14,084 13,842 13,791 13,235 13,170 12,807 12,280 11,060 10,060 9,276
Faa Forecast Failure Rate for Online Generation (%) 0.0% 0.0% 0.0% 0.0% 0.0% 0.0% 0.0% 0.0% 0.0% 0.0% 0.0% 0.0% 0.0% 0.0% 0.0% 0.0% 0.0% 0.0% 0.0% 0.0% 0.0% 0.0% 0.0% 0.0% 0.0% 0.0% 0.0% 0.0%
Fb Risk-Adjusted RECs from RPS Facilities in Development11 - - - - - 363 943 1,306 1,981 2,113 2,518 2,702 9,314 2,737 2,725 2,713 2,707 2,690 2,679 2,667 2,661 2,644 2,633 2,605 2,230 2,182 1,888 1,498
Fbb Forecast Failure Rate for RPS Facilities in Development (%) 0.0% 0.0% 0.0% 0.0% 0.0% 5.5% 3.2% 2.9% 1.5% 1.4% 1.2% 1.1% 1.3% 1.1% 1.1% 1.1% 1.1% 1.1% 1.1% 1.1% 1.1% 1.1% 1.1% 1.1% 1.2% 1.3% 1.4% 0.6%
Fc Pre-Approved Generic RECs - - - - - - 19 19 179 672 1,035 1,123 3,009 1,202 1,219 1,216 1,216 1,211 1,208 1,205 1,205 1,199 1,197 1,194 1,194 1,188 1,186 1,183
Fd Executed REC Sales - - (142) (142) (50) - - (50) - - - - - - - - - - - - - - - - - - - -
F Fa + Fb +Fc - Fd Total RPS Eligible Procurement (GWh)9 14,699 14,513 17,069 46,281 20,156 22,455 22,930 65,541 23,853 22,512 22,590 22,023 90,979 21,711 19,305 18,957 18,683 18,549 17,971 17,714 17,657 17,078 17,000 16,605 15,704 14,430 13,134 11,956
F0 Category 0 RECs 14,637 13,035 14,149 41,821 16,886 18,251 18,053 53,190 17,756 15,822 15,137 14,297 63,013 13,889 11,501 11,207 10,982 10,898 10,345 10,112 10,065 9,538 9,493 9,178 9,082 8,457 7,823 7,376
F1 Category 1 RECs 62 1,478 2,921 4,461 3,270 4,204 4,877 12,351 6,097 6,690 7,454 7,726 27,966 7,822 7,805 7,750 7,701 7,651 7,626 7,602 7,592 7,540 7,507 7,427 6,622 5,973 5,311 4,580
F2 Category 2 RECs - - - - - - - - - - - - - - - - - - - - - - - - - - - -
F3 Category 3 RECs - - - - - - - - - - - - - - - - - - - - - - - - - - - -
Gross RPS Position (Physical Net Short)
Ga F-E Annual Gross RPS Position (GWh) (274) (728) 1,928 926 3,979 5,869 5,212 15,061 3,675 3,252 (4,200) (4,668) (10,447) (10,889) (13,653) (13,874) (14,539) (14,883) (15,026) (15,692) (15,858) (16,340) (17,329) (18,691) (20,077) (21,342)
Gb F/A Annual Gross RPS Position (%) 19.6% 19.0% 22.5% 20.4% 27.0% 31.5% 32.4% 30.3% 34.7% 36.2% 27.7% 27.2% 24.0% 23.5% 23.1% 22.9% 22.1% 21.7% 21.6% 20.8% 20.7% 20.2% 19.0% 17.4% 15.8% 14.4%
Application of Bank
Ha H - Hc (from previous year) Existing Banked RECs above the PQR3,4 - (274) (1,033) - 861
Hb RECs above the PQR added to Bank (274) (728) 1,928 926 3,979 5,869 5,212 15,061 3,675 3,252 - 12,465 - - - - - - - - - - - - - - -
Hc Non-bankable RECs above the PQR - 31 34 65 26 22 71 119 83 - - - 83 - - - - - - - - - - - - - - -
H Ha+Hb Gross Balance of RECs above the PQR (274) (1,002) 895 926 4,840
Ia Planned Application of RECs above the PQR towards RPS Compliance5 - - - -
Ib Planned Sales of RECs above the PQR6 - - - -
J H-Ia-Ib Net Balance of RECs above the PQR3 (274) (1,002) 895 926
J0 Category 0 RECs - - - -
J1 Category 1 RECs - - 895 895
J2 Category 2 RECs - - - -
Expiring Contracts
K RECs from Expiring RPS Contracts12 N/A N/A N/A N/A - 0.4 518 518 1,011 1,642 3,866 4,732 11,250 5,071 7,433 7,728 8,014 8,028 8,555 8,760 8,818 9,286 9,315 9,656 10,564 11,728 12,962 14,090
Net RPS Position (Optimized Net Short)
La Ga + Ia – Ib – Hc Annual Net RPS Position after Bank Optimization (GWh)7 (274) (759) 1,894 861
Lb (F + Ia – Ib – Hc)/A Annual Net RPS Position after Bank Optimization (%)7,8 19.6% 19.0% 22.5% 20.4%
General Table Notes: Values are shown in GWhs. Fields in grey are protected as Confidential under CPUC Confidentiality Rules.
(1) (Row A) LTPP sales forecast is not representative of PG&E's actual retail sales. Forecasts of retail sales for the first five years of the forecast were generated by PG&E's Load Forecasting and Research team at the beginning of each year, and may be updated throughout the year as additional data becomes available.(2) (Row D) As a portion of the Bank will be used as VMOP, Row D will remain zero. See 2015 RPS Plan for a description of PG&E's VMOP.(3) (Rows Ha and J) As PG&E's Alternative RNS incorporates additional risk-adjustments to the results from the Physical Net Short, the Bank sizes indicated in Rows Ha and J appear larger than they are in Rows Ha and J of the Alternative RNS, which shows the stochastically-adjusted Bank size.(4) (Rows Ha) At the beginning of each compliance period Row Ha subtracts previous compliance non-bankable volumes from the previous compliance period net balance of RECs. For example, the 2021 forecast for Row Ha is equivalent to the Row J in CP3 minus Row Hc in CP3.(5) (Row Ia) The results in Ia are only applicable within the context of the stochastic model. Please see the Alternative RNS for the application of the bank.(6) (Row Ib) The purpose of the planned sales is to minimize the non-bankable volumes, but the actual sales could be a combination of bankable and non-bankable volumes.(7) (Rows La and Lb) Rows La and Lb incorrectly subtract the non-bankable volumes. Although these volumes can not be carried forward, per Decision 12-06-038, these volumes could be used towards meeting compliance in the current period. Therefore, the non-bankable volumes should be included in the Annual Net RPS Position after Bank Optimization.(8) (Row Lb) Row Lb incorrectly calculates the Annual Net RPS Position after Bank Optimization. PG&E has changed the formula in the Alternative RNS to (Ga+Ia-Ib+E)/A in order to express these values in a comparable way to the Physical Net Short (%) in Row Gb.(9) (Row F) Row F has subtracted 134 GWh of RECs associated with 2011 generation from the Hay Canyon Wind Facility and the Nine Canyon Wind Phase 3. These RECs are not being used for RPS compliance because they were not retired within the RPS statute’s 36-month REC retirement deadline.(10) (Row Fa) "Online Generation" includes forecasted volumes from replacement contracts (i.e. ReMAT contracts replacing QF contracts) for facilities that are already online.(11) (Row Fb) "In Development" includes forecasted volumes from phase-in projects. This is consistent with labeling in the RPS Database (which labels phase-in projects as "In Development" under "Overall Project Status").(12) (Row K) Row K now includes only expiring volumes from contracts as of April 30, 2015. *Stochastic Results in Rows Ga-Lb reflect a April 30, 2015 stochastic modeling vintage.
†Order Instituting Rulemaking to Integrate and Refine Procurement Policies and Consider Long-Term Procurement Plans, Rulemaking (“R.”) 13-12-010, filed December 19, 2013.
Appendix C.1b - Renewable Net Short Calculations - 40% RPS ScenarioNet Short Calculation Using PG&E Bundled Retail Sales Forecast In Near Term (2015 - 2019) and LTPP Methodology (2020 - 2035)
APPENDIX C.2a
Alternate Renewable Net Short Calculations – 33% RPS Target
January 14, 2016

VariableCalculation in Energy
Division RNS Calculation Template
Revised Calculation Correcting Apparent Errors in Energy
Division TemplateItem
Deficit from RPS prior to
Reporting Year
2011 Actuals
2012 Actuals
2013 Actuals 2011-2013 2014
Actuals2015
Forecast2016
Forecast 2014-2016 2017 Forecast
2018 Forecast
2019 Forecast
2020 Forecast 2017-2020 2021
Forecast2022
Forecast2023
Forecast2024
Forecast2025
Forecast2026
Forecast2027
Forecast2028
Forecast2029
Forecast2030
Forecast2031
Forecast2032
Forecast2033
Forecast2034
Forecast2035
Forecast
Forecast Year - - - CP1 - - - CP2 - - - - CP3 - - - - - - - - - - - - - - -
Annual RPS Requirement
A Bundled Retail Sales Forecast (Alternate)1 74,864 76,205 75,705 226,774 74,547 71,183 70,870 216,599 64,957 62,381 59,668 59,780 59,888 59,988 60,077 60,189 60,407 60,765 61,331 62,067 62,948 64,033 65,355 66,902 68,683 69,892
B RPS Procurement Quantity Requirement (%) 20.0% 20.0% 20.0% 20.0% 21.7% 23.3% 25.0% 23.3% 27.0% 29.0% 31.0% 33.0% 30.0% 33.0% 33.0% 33.0% 33.0% 33.0% 33.0% 33.0% 33.0% 33.0% 33.0% 33.0% 33.0% 33.0% 33.0% 33.0%
C A*B Gross RPS Procurement Quantity Requirement (GWh) 14,973 15,241 15,141 45,355 16,177 16,586 17,717 50,480 18,837 19,338 19,690 19,727 19,763 19,796 19,825 19,862 19,934 20,052 20,239 20,482 20,773 21,131 21,567 22,078 22,665 23,064
D Voluntary Margin of Over-procurement2 - - - - - - - - - - - - - - - - - - - - - - - - - - - -
E C+D Net RPS Procurement Need (GWh) 14,973 15,241 15,141 45,355 16,177 16,586 17,717 50,480 18,837 19,338 19,690 19,727 19,763 19,796 19,825 19,862 19,934 20,052 20,239 20,482 20,773 21,131 21,567 22,078 22,665 23,064
RPS-Eligible Procurement
Fa Risk-Adjusted RECs from Online Generation10 14,699 14,513 17,212 46,424 20,206 22,092 21,967 64,265 21,693 19,728 19,038 18,198 78,656 17,772 15,361 15,028 14,760 14,648 14,084 13,842 13,791 13,235 13,170 12,807 12,280 11,060 10,060 9,276
Faa Forecast Failure Rate for Online Generation (%) 0.0% 0.0% 0.0% 0.0% 0.0% 0.0% 0.0% 0.0% 0.0% 0.0% 0.0% 0.0% 0.0% 0.0% 0.0% 0.0% 0.0% 0.0% 0.0% 0.0% 0.0% 0.0% 0.0% 0.0% 0.0% 0.0% 0.0% 0.0%
Fb Risk-Adjusted RECs from RPS Facilities in Development11 - - - - - 363 943 1,306 1,981 2,113 2,518 2,702 9,314 2,737 2,725 2,713 2,707 2,690 2,679 2,667 2,661 2,644 2,633 2,605 2,230 2,182 1,888 1,498
Fbb Forecast Failure Rate for RPS Facilities in Development (%) 0.0% 0.0% 0.0% 0.0% 0.0% 5.5% 3.2% 2.9% 1.5% 1.4% 1.2% 1.1% 1.3% 1.1% 1.1% 1.1% 1.1% 1.1% 1.1% 1.1% 1.1% 1.1% 1.1% 1.1% 1.2% 1.3% 1.4% 0.6%
Fc Pre-Approved Generic RECs - - - - - - 19 19 179 672 1,035 1,123 3,009 1,202 1,219 1,216 1,216 1,211 1,208 1,205 1,205 1,199 1,197 1,194 1,194 1,188 1,186 1,183
Fd Executed REC Sales - - (142) (142) (50) - - (50) - - - - - - - - - - - - - - - - - - - -
F Fa + Fb +Fc - Fd Total RPS Eligible Procurement (GWh)9 14,699 14,513 17,069 46,281 20,156 22,455 22,930 65,541 23,853 22,512 22,590 22,023 90,979 21,711 19,305 18,957 18,683 18,549 17,971 17,714 17,657 17,078 17,000 16,605 15,704 14,430 13,134 11,956
F0 Category 0 RECs 14,637 13,035 14,149 41,821 16,886 18,251 18,053 53,190 17,756 15,822 15,137 14,297 63,013 13,889 11,501 11,207 10,982 10,898 10,345 10,112 10,065 9,538 9,493 9,178 9,082 8,457 7,823 7,376
F1 Category 1 RECs 62 1,478 2,921 4,461 3,270 4,204 4,877 12,351 6,097 6,690 7,454 7,726 27,966 7,822 7,805 7,750 7,701 7,651 7,626 7,602 7,592 7,540 7,507 7,427 6,622 5,973 5,311 4,580
F2 Category 2 RECs - - - - - - - - - - - - - - - - - - - - - - - - - - - -
F3 Category 3 RECs - - - - - - - - - - - - - - - - - - - - - - - - - - - -
Step 1 Result: Physical Net Short3
Ga F-E Annual Gross RPS Position (GWh) (274) (728) 1,928 926 3,979 5,869 5,212 15,061 3,675 3,252 2,332 1,984 (458) (839) (1,142) (1,314) (1,964) (2,339) (2,582) (3,404) (3,773) (4,526) (5,863) (7,647) (9,532) (11,108)
Gb F/A Annual Gross RPS Position (%) 19.6% 19.0% 22.5% 20.4% 27.0% 31.5% 32.4% 30.3% 34.7% 36.2% 36.9% 36.3% 32.2% 31.6% 31.1% 30.8% 29.7% 29.2% 28.8% 27.5% 27.0% 25.9% 24.0% 21.6% 19.1% 17.1%
PG&E's Alternative RNS Table - Stochastic-Adjustment (2011-2035)
VariableCalculation in Energy
Division RNS Calculation Template
Revised Calculation Correcting Apparent Errors in Energy
Division TemplateItem
Deficit from RPS prior to
Reporting Year
2011 Actuals
2012 Actuals
2013 Actuals
2011-2013Actuals
2014 Actuals
2015 Forecast
2016 Forecast 2014-2016 2017
Forecast2018
Forecast2019
Forecast2020
Forecast 2017-2020 2021 Forecast
2022 Forecast
2023 Forecast
2024 Forecast
2025 Forecast
2026 Forecast
2027 Forecast
2028 Forecast
2029 Forecast
2030 Forecast
2031 Forecast
2032 Forecast
2033 Forecast
2034 Forecast
2035 Forecast
Step 2 Result: Stochastically-Adjusted Net Short (Physical Net Short + Stochastic Risk-Adjustment)4
Gd Stochastically-Adjusted Annual Gross RPS Position (GWh) 926
Ge Stochastically-Adjusted Annual Gross RPS Position (%) 20.4%
Application of Bank
Ha H - Hc (from previous year) J - Hc (from previous year) Existing Banked RECs above the PQR (The Bank at Beg. Of Period)5,6 0 861
Hb RECs above the PQR added to Bank 926
Hc Non-bankable RECs above the PQR 65 119 83 - - - - - - - - - - - - - - -
H Ha+Hb Gross Balance of RECs above the PQR 926
Ia Planned Application of RECs above the PQR towards RPS Compliance -
Ib Planned Sales of RECs above the PQR7 -
J H-Ia-Ib Net Balance of RECs above the PQR (The Bank at End of Period)5 926
J0 Category 0 RECs -
J1 Category 1 RECs 926
J2 Category 2 RECs -
Expiring Contracts
K RECs from Expiring RPS Contracts12 N/A N/A N/A N/A - 0.4 518 518 1,011 1,642 3,866 4,732 11,250 5,071 7,433 7,728 8,014 8,028 8,555 8,760 8,818 9,286 9,315 9,656 10,564 11,728 12,962 14,090
Step 3 Result: Stochastically-Optimized Net Short (Stochastically-Adjusted Net Short + Application of Bank)8
La Ga + Ia – Ib – Hc Gd+Ia-Ib Annual Net RPS Position after Bank Optimization (GWh) 926
Lb (F + Ia – Ib – Hc)/A (Gd+Ia-Ib+E)/A Annual Net RPS Position after Bank Optimization (%) 20.4%
General Table Notes: Values are shown in GWhs. Fields in grey are protected as Confidential under CPUC Confidentiality Rules.
(1) (Row A) PG&E uses its April 30, 2015 internal alternative load forecast for its procurement decisions.†(2) (Row D) As a portion of the Bank will be used as VMOP, Row D will remain zero. See 2015 RPS Plan for a description of PG&E's VMOP.(3) (Step 1 Result: Physical Net Short) Rows Ga and Gb represent PG&E’s physical net short based on PG&E’s internal bundled retail sales forecast, as opposed to the LTPP forecast provided in the RNS. (4) (Step 2 Result: Stochastically-Adjusted Net Short (Physical Net Short+ Stochastic Risk-Adjustment) PG&E added rows Gd and Ge to the Alternative RNS in order to show the stochastically-adjusted physical net short, which incorporates the risks and uncertainties addressed in the stochastic model. For more details on PG&E's stochastically modeled risks, see the 2015 RPS Plan. This is prior to any application of the Bank.
(5) (Rows Ha and J) As PG&E's Alternative RNS incorporates additional risk-adjustments to the results from the Physical Net Short, the Bank sizes indicated in Rows Ha and J appear smaller than they are in Rows Ha and J of the RNS, which shows the non-stochastically-adjusted Bank size.(6) (Rows Ha) At the beginning of each compliance period Row Ha subtracts previous compliance non-bankable volumes from the previous compliance period net balance of RECs. For example, the 2021 forecast for Row Ha is equivalent to the Row J in CP3 minus Row Hc in CP3.(7) (Row Ib) The purpose of the planned sales is to minimize the non-bankable volumes, but the actual sales could be a combination of bankable and non-bankable volumes.(8) (Step 3 Result: Stochastically-Optimized Net Short (Stochastically-Adjusted Net Short + Application of Bank))
(a) Rows La and Lb represent the optimized net short that results from taking Row Gd (Step 2 Result) and then applying Bank usage. Bank can be used for either (i) compliance purposes (row Ia) or (ii) sales (Row Ib).
(b) Row La in the Alternative RNS does not match Row La in the RNS, because the RNS does not include Row Gd (Stochastically-Adjusted Net Short).
(c) PG&E includes the non-bankable volumes in calculating rows La and Lb. Although these volumes can not be carried forward, per Decision 12-06-038, these volumes could be used towards meeting compliance in the current period. Therefore, the non-bankable volumes should be included in the Annual Net RPS Position after Bank Optimization.
(9) (Row F) Row F has subtracted 134 GWh of RECs associated with 2011 generation from the Hay Canyon Wind Facility and the Nine Canyon Wind Phase 3. These RECs are not being used for RPS compliance because they were not retired within the RPS statute’s 36-month REC retirement deadline.(10) (Row Fa) "Online Generation" includes forecasted volumes from replacement contracts (i.e. ReMAT contracts replacing QF contracts) for facilities that are already online.(11) (Row Fb) "In Development" includes forecasted volumes from phase-in projects. This is consistent with labeling in the RPS Database (which labels phase-in projects as "In Development" under "Overall Project Status").(12) (Row K) Row K now includes only expiring volumes from contracts as of April 30, 2015. *Stochastic Results in Rows Gd-Lb reflect a April 30, 2015 stochastic modeling vintage.
†Order Instituting Rulemaking to Integrate and Refine Procurement Policies and Consider Long-Term Procurement Plans, Rulemaking (“R.”) 13-12-010, filed December 19, 2013.
Appendix C.2a - Alternate Renewable Net Short Calculations ‒ 33% RPS TargetStochastically-Optimized Net Short Calculation Using PG&E Bundled Retail Sales Forecast and Corrections to Formulas
Optimization is Based on Compliance Period Only
Optimization is Based on Compliance Period Only
Optimization is Based on Compliance Period Only
Optimization is Based on Compliance Period Only

APPENDIX C.2b
Alternate Renewable Net Short Calculations – 40% RPS Scenario
January 14, 2016

VariableCalculation in Energy
Division RNS Calculation Template
Revised Calculation Correcting Apparent Errors in
Energy Division TemplateItem Deficit from RPS prior to
Reporting Year2011
Actuals2012
Actuals2013
Actuals 2011-2013 2014 Actuals
2015 Forecast
2016 Forecast 2014-2016 2017
Forecast2018
Forecast2019
Forecast2020
Forecast 2017-2020 2021 Forecast
2022 Forecast
2023 Forecast
2024 Forecast
2025 Forecast
2026 Forecast
2027 Forecast
2028 Forecast
2029 Forecast
2030 Forecast
2031 Forecast
2032 Forecast
2033 Forecast
2034 Forecast
2035 Forecast
Forecast Year - - - CP1 - - - CP2 - - - - CP3 - - - - - - - - - - - - - - -
Annual RPS Requirement
A Bundled Retail Sales Forecast (Alternate)1 74,864 76,205 75,705 226,774 74,547 71,183 70,870 216,599 64,957 62,381 59,668 59,780 59,888 59,988 60,077 60,189 60,407 60,765 61,331 62,067 62,948 64,033 65,355 66,902 68,683 69,892
B RPS Procurement Quantity Requirement (%) 20.0% 20.0% 20.0% 20.0% 21.7% 23.3% 25.0% 23.3% 27.0% 29.0% 31.0% 33.0% 30.0% 33.0% 37.0% 37.0% 40.0% 40.0% 40.0% 40.0% 40.0% 40.0% 40.0% 40.0% 40.0% 40.0% 40.0% 40.0%
C A*B Gross RPS Procurement Quantity Requirement (GWh) 14,973 15,241 15,141 45,355 16,177 16,586 17,717 50,480 18,837 19,338 19,690 19,727 22,159 22,195 24,031 24,075 24,163 24,306 24,532 24,827 25,179 25,613 26,142 26,761 27,473 27,957
D Voluntary Margin of Over-procurement2 - - - - - - - - - - - - - - - - - - - - - - - - - - - -
E C+D Net RPS Procurement Need (GWh) 14,973 15,241 15,141 45,355 16,177 16,586 17,717 50,480 18,837 19,338 19,690 19,727 22,159 22,195 24,031 24,075 24,163 24,306 24,532 24,827 25,179 25,613 26,142 26,761 27,473 27,957
RPS-Eligible Procurement
Fa Risk-Adjusted RECs from Online Generation10 14,699 14,513 17,212 46,424 20,206 22,092 21,967 64,265 21,693 19,728 19,038 18,198 78,656 17,772 15,361 15,028 14,760 14,648 14,084 13,842 13,791 13,235 13,170 12,807 12,280 11,060 10,060 9,276
Faa Forecast Failure Rate for Online Generation (%) 0.0% 0.0% 0.0% 0.0% 0.0% 0.0% 0.0% 0.0% 0.0% 0.0% 0.0% 0.0% 0.0% 0.0% 0.0% 0.0% 0.0% 0.0% 0.0% 0.0% 0.0% 0.0% 0.0% 0.0% 0.0% 0.0% 0.0% 0.0%
Fb Risk-Adjusted RECs from RPS Facilities in Development11 - - - - - 363 943 1,306 1,981 2,113 2,518 2,702 9,314 2,737 2,725 2,713 2,707 2,690 2,679 2,667 2,661 2,644 2,633 2,605 2,230 2,182 1,888 1,498
Fbb Forecast Failure Rate for RPS Facilities in Development (%) 0.0% 0.0% 0.0% 0.0% 0.0% 5.5% 3.2% 2.9% 1.5% 1.4% 1.2% 1.1% 1.3% 1.1% 1.1% 1.1% 1.1% 1.1% 1.1% 1.1% 1.1% 1.1% 1.1% 1.1% 1.2% 1.3% 1.4% 0.6%
Fc Pre-Approved Generic RECs - - - - - - 19 19 179 672 1,035 1,123 3,009 1,202 1,219 1,216 1,216 1,211 1,208 1,205 1,205 1,199 1,197 1,194 1,194 1,188 1,186 1,183
Fd Executed REC Sales - - (142) (142) (50) - - (50) - - - - - - - - - - - - - - - - - - - -
F Fa + Fb +Fc - Fd Total RPS Eligible Procurement (GWh)9 14,699 14,513 17,069 46,281 20,156 22,455 22,930 65,541 23,853 22,512 22,590 22,023 90,979 21,711 19,305 18,957 18,683 18,549 17,971 17,714 17,657 17,078 17,000 16,605 15,704 14,430 13,134 11,956
F0 Category 0 RECs 14,637 13,035 14,149 41,821 16,886 18,251 18,053 53,190 17,756 15,822 15,137 14,297 63,013 13,889 11,501 11,207 10,982 10,898 10,345 10,112 10,065 9,538 9,493 9,178 9,082 8,457 7,823 7,376
F1 Category 1 RECs 62 1,478 2,921 4,461 3,270 4,204 4,877 12,351 6,097 6,690 7,454 7,726 27,966 7,822 7,805 7,750 7,701 7,651 7,626 7,602 7,592 7,540 7,507 7,427 6,622 5,973 5,311 4,580
F2 Category 2 RECs - - - - - - - - - - - - - - - - - - - - - - - - - - - -
F3 Category 3 RECs - - - - - - - - - - - - - - - - - - - - - - - - - - - -
Step 1 Result: Physical Net Short3
Ga F-E Annual Gross RPS Position (GWh) (274) (728) 1,928 926 3,979 5,869 5,212 15,061 3,675 3,252 2,332 1,984 (2,853) (3,238) (5,348) (5,527) (6,192) (6,592) (6,875) (7,748) (8,179) (9,008) (10,438) (12,331) (14,340) (16,000)
Gb F/A Annual Gross RPS Position (%) 19.6% 19.0% 22.5% 20.4% 27.0% 31.5% 32.4% 30.3% 34.7% 36.2% 36.9% 36.3% 32.2% 31.6% 31.1% 30.8% 29.7% 29.2% 28.8% 27.5% 27.0% 25.9% 24.0% 21.6% 19.1% 17.1%
PG&E's Alternative RNS Table - Stochastic-Adjustment (2011-2035)
VariableCalculation in Energy
Division RNS Calculation Template
Revised Calculation Correcting Apparent Errors in
Energy Division TemplateItem Deficit from RPS prior to
Reporting Year2011
Actuals2012
Actuals2013
Actuals2011-2013
Actuals2014
Actuals2015
Forecast2016
Forecast 2014-2016 2017 Forecast
2018 Forecast
2019 Forecast
2020 Forecast 2017-2020 2021
Forecast2022
Forecast2023
Forecast2024
Forecast2025
Forecast2026
Forecast2027
Forecast2028
Forecast2029
Forecast2030
Forecast2031
Forecast2032
Forecast2033
Forecast2034
Forecast2035
Forecast
Step 2 Result: Stochastically-Adjusted Net Short (Physical Net Short + Stochastic Risk-Adjustment)4
Gd Stochastically-Adjusted Annual Gross RPS Position (GWh) 926
Ge Stochastically-Adjusted Annual Gross RPS Position (%) 20.4%
Application of Bank
Ha H - Hc (from previous year) J - Hc (from previous year) Existing Banked RECs above the PQR (The Bank at Beg. Of Period)5,6 - 861
Hb RECs above the PQR added to Bank 926
Hc Non-bankable RECs above the PQR 65 119 83 - - - - - - - - - - - - - - -
H Ha+Hb Gross Balance of RECs above the PQR 926
Ia Planned Application of RECs above the PQR towards RPS Compliance -
Ib Planned Sales of RECs above the PQR7 -
J H-Ia-Ib Net Balance of RECs above the PQR (The Bank at End of Period)5 926
J0 Category 0 RECs -
J1 Category 1 RECs 926
J2 Category 2 RECs -
Expiring Contracts
K RECs from Expiring RPS Contracts12 N/A N/A N/A N/A - 0.4 518 518 1,011 1,642 3,866 4,732 11,250 5,071 7,433 7,728 8,014 8,028 8,555 8,760 8,818 9,286 9,315 9,656 10,564 11,728 12,962 14,090
Step 3 Result: Stochastically-Optimized Net Short (Stochastically-Adjusted Net Short + Application of Bank)8
La Ga + Ia – Ib – Hc Gd+Ia-Ib Annual Net RPS Position after Bank Optimization (GWh) 926
Lb (F + Ia – Ib – Hc)/A (Gd+Ia-Ib+E)/A Annual Net RPS Position after Bank Optimization (%) 20.4%
General Table Notes: Values are shown in GWhs. Fields in grey are protected as Confidential under CPUC Confidentiality Rules.
(1) (Row A) PG&E uses its April 30, 2015 internal alternative load forecast for its procurement decisions.†(2) (Row D) As a portion of the Bank will be used as VMOP, Row D will remain zero. See 2015 RPS Plan for a description of PG&E's VMOP.(3) (Step 1 Result: Physical Net Short) Rows Ga and Gb represent PG&E’s physical net short based on PG&E’s internal bundled retail sales forecast, as opposed to the LTPP forecast provided in the RNS. (4) (Step 2 Result: Stochastically-Adjusted Net Short (Physical Net Short+ Stochastic Risk-Adjustment) PG&E added rows Gd and Ge to the Alternative RNS in order to show the stochastically-adjusted physical net short, which incorporates the risks and uncertainties addressed in the stochastic model. For more details on PG&E's stochastically modeled risks, see the 2015 RPS Plan. This is prior to any application of the Bank.
(5) (Rows Ha and J) As PG&E's Alternative RNS incorporates additional risk-adjustments to the results from the Physical Net Short, the Bank sizes indicated in Rows Ha and J appear smaller than they are in Rows Ha and J of the RNS, which shows the non-stochastically-adjusted Bank size.(6) (Rows Ha) At the beginning of each compliance period Row Ha subtracts previous compliance non-bankable volumes from the previous compliance period net balance of RECs. For example, the 2021 forecast for Row Ha is equivalent to the Row J in CP3 minus Row Hc in CP3.(7) (Row Ib) The purpose of the planned sales is to minimize the non-bankable volumes, but the actual sales could be a combination of bankable and non-bankable volumes.(8) (Step 3 Result: Stochastically-Optimized Net Short (Stochastically-Adjusted Net Short + Application of Bank))
(a) Rows La and Lb represent the optimized net short that results from taking Row Gd (Step 2 Result) and then applying Bank usage. Bank can be used for either (i) compliance purposes (row Ia) or (ii) sales (Row Ib).
(b) Row La in the Alternative RNS does not match Row La in the RNS, because the RNS does not include Row Gd (Stochastically-Adjusted Net Short).
(c) PG&E includes the non-bankable volumes in calculating rows La and Lb. Although these volumes can not be carried forward, per Decision 12-06-038, these volumes could be used towards meeting compliance in the current period. Therefore, the non-bankable volumes should be included in the Annual Net RPS Position after Bank Optimization.
(9) (Row F) Row F has subtracted 134 GWh of RECs associated with 2011 generation from the Hay Canyon Wind Facility and the Nine Canyon Wind Phase 3. These RECs are not being used for RPS compliance because they were not retired within the RPS statute’s 36-month REC retirement deadline.(10) (Row Fa) "Online Generation" includes forecasted volumes from replacement contracts (i.e. ReMAT contracts replacing QF contracts) for facilities that are already online.(11) (Row Fb) "In Development" includes forecasted volumes from phase-in projects. This is consistent with labeling in the RPS Database (which labels phase-in projects as "In Development" under "Overall Project Status").(12) (Row K) Row K now includes only expiring volumes from contracts as of April 30, 2015. *Stochastic Results in Rows Gd-Lb reflect a April 30, 2015 stochastic modeling vintage.
†Order Instituting Rulemaking to Integrate and Refine Procurement Policies and Consider Long-Term Procurement Plans, Rulemaking (“R.”) 13-12-010, filed December 19, 2013.
Appendix C.2b - Alternate Renewable Net Short Calculations - 40% RPS ScenarioStochastically-Optimized Net Short Calculation Using PG&E Bundled Retail Sales Forecast and Corrections to Formulas
Optimization is Based on Compliance Period Only
Optimization is Based on Compliance Period Only
Optimization is Based on Compliance Period Only
Optimization is Based on Compliance Period Only

APPENDIX D
Procurement Information Related to Cost Quantification
January 14, 2016

Appendix D – Procurement Information Related to Cost Quantification
Page 1 of 7
Assumptions Table 1 (Actual Costs, $) Items Actual Rows 2 -- 8, 11 (2003-2014)1, 2, 3, 4, 5, 6 Settled contract costs with all RPS-eligible contracts in PG&E’s portfolio for 2003-2014
Row 9
For 2003-2011, capital costs are based on the net book value of PG&E’s RPS-eligible units as of December 2011 multiplied by an assumed fixed charge rate equal to 14%. For 2012 through 2014, capital costs are based on the net book value of PG&E’s RPS-eligible units as of December of that respective year multiplied by a fixed charge rate of 14%. PG&E’s actual operation and maintenance (O&M) costs for each year (2003-2014) were added to each year’s capital costs to calculate total costs.
Row 10 LCOE for each project multiplied by the project’s historical generation
Row 13 PG&E actual bundled retail sales
Row 14 Total Cost / Bundled Retail Sales (Row 12 / Row 13) Table 2 (Forecast Costs, $) Items Forecast
Rows 2 -- 8, 11, 16 -- 22, 25
PG&E’s future expenditures on all RPS-eligible procurement and generation either (1) approved to date or (2) executed prior to April 2015 but pending CPUC approval. 2015 data represent a September 2014 vintage and 2016-2030 data represent a April 2015 vintage to be consistent with the 2015 Integrated Energy Policy Report (IEPR).
Rows 9 and 23 For 2015-2030, annualized capital costs based on the net book value of PG&E’s RPS-eligible units as of December 2014 were added to operation and maintenance (O&M) costs, which were calculated as 2014 O&M costs escalated at 5% annually for each year.
Row 10 and 24 LCOE for each project multiplied by the project’s forecasted generation
Rows 13 and 27 PG&E bundled retail sales forecast
Rows 14 and 28 Total Cost / Bundled Sales
Row 29 Row 14 + Row 28 Table 3 (Actual Generation, MWh) Items Actual Rows 2 -- 111, 3, 4, 5, 6 Generation (MWh) associated with payments for RPS-eligible deliveries Table 4 (Forecast Generation, MWh) Items Forecast
Rows 2 -- 11 and 16-25
Forecasted RPS-eligible generation (MWh) either (1) approved to date or (2) executed prior to April 2015 but pending Commission approval -- assumes no contract failure, and all contractual volumes are forecast at 100% of expected volumes. 2015 data represent a September 2014 vintage and 2016-2030 data represent a April 2015 vintage to be consistent with the 2015 Integrated Energy Policy Report (IEPR).
1 2014 Generation and Costs were updated to reflect best available data as of March 2015. 2 Row 5 includes the aggregate costs (specifically debt service and operation and maintenance) of PG&E's contract with Solano Irrigation District (SID) who supplies power from multiple hydro units, 100% of which are RPS-eligible. SID’s costs include the costs to operate and maintain the hydro units and project facilities (dams and waterways). Yuba County Water Agency (YCWA) does not operate any RPS-eligible hydro units, therefore YCWA cost data is not relevant and thereby not included. 3 RPS-eligible generation reported in 2014 is the best available settlements data as of March 2015 and therefore contains actual data as settlements data for the prior year can continue to be adjusted after January of the current year. As UOG Hydro and UOG Solar estimates are calculated separately, 2013 data for these two technology types is the best available as of April 2014.
4 Energy volumes reported in Rows 2-8 represent the generation (MWh) associated with payments for RPS-eligible deliveries, which can differ from the energy volumes PG&E claims for the purposes of complying with California’s RPS Program. For example, some RPS contracts require PG&E to only pay for RPS-eligible deliveries based on scheduled energy, but entitle PG&E to all green attributes generated and metered by the facility. Since compliance with California’s RPS Program is based on metered generation, scheduled/paid volumes may not always match the metered/compliance volumes. 5 Cost for executed sales are a combination of geothermal and small hydro volumes. As the costs are a combined payment not divided by technology type, PG&E allocated technology specific costs based on the technology specific generation (MWh) of the sale contract. 6 Some immaterial changes have been made to cost and generation data from 2005, 2011, and 2013 as compared to the 2014 RPS Plan. 2005 changes are due to a 2006 RPS wind contract being accidently included in 2005. 2011 data changes are due to a mislabeling of a biogas contract as biomass. 2013 changes represent updated settlements data.
Note: As with any forecasting exercise, projections are predicated on a number of necessarily speculative assumptions and will be impacted by future events, including regulatory decisions resulting in different costs or rate treatments. Thus, PG&E cannot guarantee that the information contained in this summary will reflect actual future rates, revenue requirements, or sales.

Appendix D – Procurement Information Related to Cost Quantification
Page 2 of 7
Joint IOU Cost Quantification Table 1 (Actual Costs, $ Thousands)
Actual RPS-Eligible Procurement and Generation Costs
1 Technology Type 2003 2004 2005 2006 2007 2008 2009 2010 2011 2012 2013 2014
2 Biogas $25,762 $23,856 $25,623 $22,823 $24,126 $23,468 $27,306 $20,216 $16,776 $5,333 $5,063 $11,087
3 Biomass $215,078 $217,923 $217,279 $222,125 $238,524 $259,957 $262,086 $263,994 $245,622 $302,711 $299,205 $317,301
4 Geothermal $110,572 $111,778 $108,720 $118,523 $199,143 $282,227 $200,357 $260,053 $223,575 $209,854 $284,334 $324,050
5 Small Hydro $60,984 $57,470 $80,340 $97,340 $63,161 $72,488 $52,053 $63,296 $84,864 $54,140 $57,213 $45,522
6 Solar PV $0 $0 $0 $0 $0 $0 $2,554 $10,180 $33,370 $176,372 $504,860 $803,806
7 Solar Thermal $0 $0 $0 $0 $0 $0 $0 $0 $0 $0 $1,698 $173,856
8 Wind $65,244 $74,912 $56,891 $67,116 $98,203 $102,516 $199,475 $224,089 $340,517 $379,416 $424,764 $437,159
9 UOG Small Hydro $44,936 $45,059 $46,526 $47,556 $47,933 $49,009 $47,567 $49,684 $52,099 $51,572 $64,691 $66,066
10 UOG Solar $0 $0 $0 $0 $227 $452 $473 $1,498 $5,620 $27,093 $43,882 $52,426
11 Unbundled RECs1 $0 $0 $0 $0 $0 $0 $0 $0
12
Total CPUC-Approved RPS-Eligible Procurement
and Generation Cost [Sum of Rows 2 through 11]
$522,576 $530,998 $535,380 $575,483 $671,317 $790,116 $791,870 $893,010
13 Bundled Retail Sales [Thousands of kWh] 71,099,363 72,113,608 72,371,532 76,356,279 79,078,319 81,523,859 79,624,479 77,485,129 74,863,941 76,205,120 75,705,039 74,546,865
14 Incremental Rate Impact2 0.73 ¢/kWh 0.74 ¢/kWh 0.74 ¢/kWh 0.75 ¢/kWh 0.85 ¢/kWh 0.97 ¢/kWh 0.99 ¢/kWh 1.15 ¢/kWh
1 The cost of Unbundled RECs are separated from their technology type and only reported in the Unbundled RECs row. For example, the cost of an Unbundled REC procured from a wind facility is only reported in the
Unbundled RECs row. 2 Incremental Rate Impact is equal to Row 12 divided by Row 13. While the item is labeled “Incremental Rate Impact,” the value should be interpreted as an estimate of a system average bundled rate for RPS-eligible
procurement and generation, not a renewable “premium.” In other words, the amount shown captures the total cost of the renewable generation and not the additional cost incurred by receiving renewable energy instead of an equivalent amount of energy from conventional generation sources.

Appendix D – Procurement Information Related to Cost Quantification
Page 3 of 7
Joint IOU Cost Quantification Table 2 (Forecast Costs, $ Thousands)
Forecasted Future Expenditures on RPS-Eligible Procurement and Generation Costs 1 Executed But Not CPUC-Approved RPS-Eligible Contracts 2015 2016 2017 2018 2019 2020 2 Biogas $0 $0 $0 $0 $0 $0 3 Biomass $0 $0 $0 $0 $0 $0 4 Geothermal $0 $0 $0 $0 $0 $0 5 Small Hydro $0 $0 $0 $0 $0 $0 6 Solar PV $0 $0 $0 $0 $0 $0 7 Solar Thermal $0 $0 $0 $0 $0 $0 8 Wind $0 $0 $0 $0 $0 $0 9 UOG Small Hydro $0 $0 $0 $0 $0 $0 10 UOG Solar $0 $0 $0 $0 $0 $0 11 Unbundled RECs1 $0 $0 $0 $0 $0 $0
12 Total Executed But Not CPUC-Approved RPS-Eligible Procurement
and Generation Cost [Sum of Rows 2 through 11]
$0 $0 $0 $0 $0 $0
13 Bundled Retail Sales [Thousands of kWh] 71,182,544 70,869,576 64,956,724 62,381,387 59,668,061
14 Incremental Rate Impact2 0.000 ¢/kWh 0.000 ¢/kWh 0.000 ¢/kWh 0.000 ¢/kWh 0.000 ¢/kWh 0.000 ¢/kWh
15 CPUC-Approved RPS-Eligible Contracts (Incl. RAM/FIT/PV Contracts) 2015 2016 2017 2018 2019 2020
16 Biogas $22,780 $23,189 $29,915 $29,994 $29,986 $30,143 17 Biomass $311,380 $270,577 $241,040 $219,990 $193,377 $136,275 18 Geothermal $329,015 $311,371 $314,874 $193,171 $194,611 $196,294 19 Small Hydro $76,539 $71,939 $62,257 $55,181 $52,386 $43,648 20 Solar PV $887,525 $914,533 $970,536 $974,319 $1,000,120 $1,019,418 21 Solar Thermal $329,978 $329,961 $329,165 $328,838 $328,759 $330,446 22 Wind $449,274 $432,664 $427,910 $425,276 $408,949 $409,845 23 UOG Small Hydro $67,407 $68,815 $70,294 $71,847 $73,477 $75,189 24 UOG Solar $51,674 $51,406 $51,139 $50,874 $50,610 $50,347 25 Unbundled RECs1 $0 $0 $0 $0 $0
26 Total CPUC-Approved RPS-Eligible Procurement and Generation Cost [Sum of Rows 16 through 25] $2,474,455 $2,497,131 $2,349,489 $2,332,276 $2,291,605
27 Bundled Retail Sales [Thousands of kWh] 71,182,544 70,869,576 64,956,724 62,381,387 59,668,061
28 Incremental Rate Impact2 3.49 ¢/kWh 3.62 ¢/kWh 3.74 ¢/kWh 3.84 ¢/kWh
29 Total Incremental Rate Impact [Row 14 + 28; Rounding can cause Row 29 to differ from Row 14 + 28] 3.49 ¢/kWh 3.62 ¢/kWh 3.74 ¢/kWh 3.84 ¢/kWh
1 See footnote 1 from Table 1. 2 Incremental Rate Impact is equal to a Total Cost (either Row 12 or 26) divided by Bundled Retail Sales (either Row 13 or 27). While the item is labeled “Incremental Rate Impact,” the value should be interpreted as an estimate of a system average bundled rate for RPS-eligible procurement and generation, not a renewable “premium.” In other words, the amount shown captures the total cost of the renewable generation and not the additional cost incurred by receiving renewable energy instead of an equivalent amount of energy from conventional generation sources.
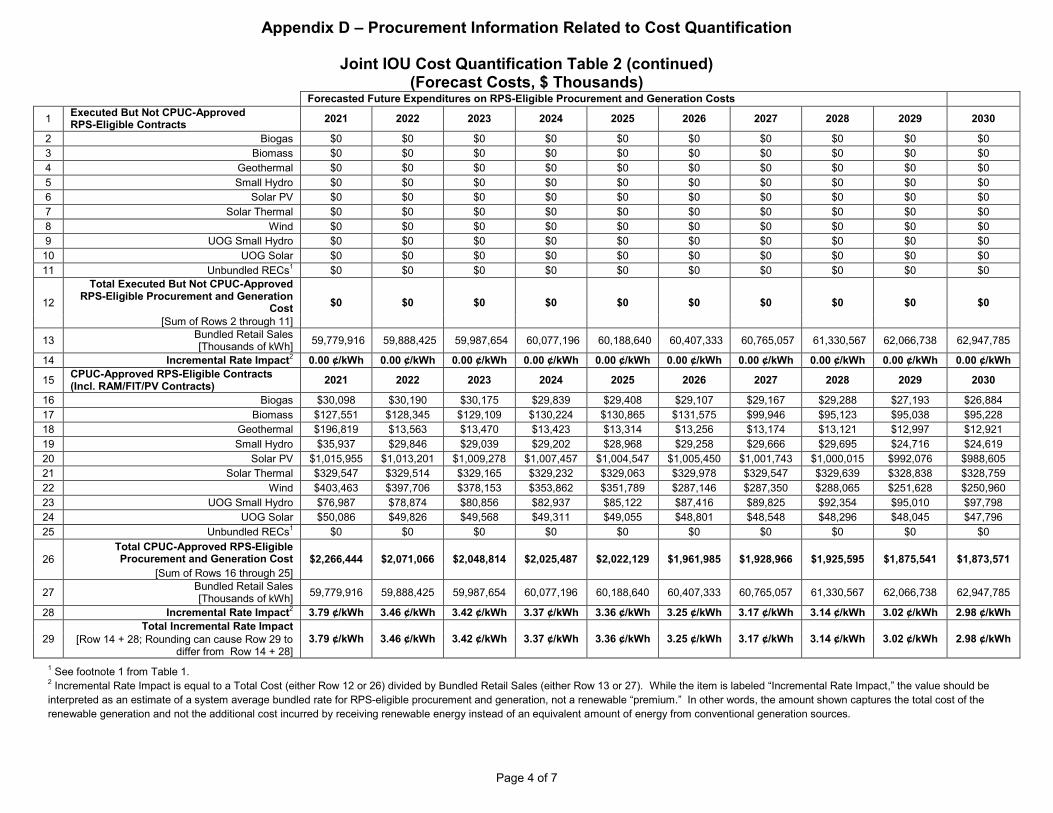
Appendix D – Procurement Information Related to Cost Quantification
Page 4 of 7
Joint IOU Cost Quantification Table 2 (continued) (Forecast Costs, $ Thousands)
Forecasted Future Expenditures on RPS-Eligible Procurement and Generation Costs
1 Executed But Not CPUC-Approved RPS-Eligible Contracts 2021 2022 2023 2024 2025 2026 2027 2028 2029 2030
2 Biogas $0 $0 $0 $0 $0 $0 $0 $0 $0 $0 3 Biomass $0 $0 $0 $0 $0 $0 $0 $0 $0 $0 4 Geothermal $0 $0 $0 $0 $0 $0 $0 $0 $0 $0 5 Small Hydro $0 $0 $0 $0 $0 $0 $0 $0 $0 $0 6 Solar PV $0 $0 $0 $0 $0 $0 $0 $0 $0 $0 7 Solar Thermal $0 $0 $0 $0 $0 $0 $0 $0 $0 $0 8 Wind $0 $0 $0 $0 $0 $0 $0 $0 $0 $0 9 UOG Small Hydro $0 $0 $0 $0 $0 $0 $0 $0 $0 $0 10 UOG Solar $0 $0 $0 $0 $0 $0 $0 $0 $0 $0 11 Unbundled RECs1 $0 $0 $0 $0 $0 $0 $0 $0 $0 $0
12
Total Executed But Not CPUC-Approved RPS-Eligible Procurement and Generation
Cost $0 $0 $0 $0 $0 $0 $0 $0 $0 $0
[Sum of Rows 2 through 11]
13 Bundled Retail Sales [Thousands of kWh] 59,779,916 59,888,425 59,987,654 60,077,196 60,188,640 60,407,333 60,765,057 61,330,567 62,066,738 62,947,785
14 Incremental Rate Impact2 0.00 ¢/kWh 0.00 ¢/kWh 0.00 ¢/kWh 0.00 ¢/kWh 0.00 ¢/kWh 0.00 ¢/kWh 0.00 ¢/kWh 0.00 ¢/kWh 0.00 ¢/kWh 0.00 ¢/kWh
15 CPUC-Approved RPS-Eligible Contracts (Incl. RAM/FIT/PV Contracts) 2021 2022 2023 2024 2025 2026 2027 2028 2029 2030
16 Biogas $30,098 $30,190 $30,175 $29,839 $29,408 $29,107 $29,167 $29,288 $27,193 $26,884 17 Biomass $127,551 $128,345 $129,109 $130,224 $130,865 $131,575 $99,946 $95,123 $95,038 $95,228 18 Geothermal $196,819 $13,563 $13,470 $13,423 $13,314 $13,256 $13,174 $13,121 $12,997 $12,921 19 Small Hydro $35,937 $29,846 $29,039 $29,202 $28,968 $29,258 $29,666 $29,695 $24,716 $24,619 20 Solar PV $1,015,955 $1,013,201 $1,009,278 $1,007,457 $1,004,547 $1,005,450 $1,001,743 $1,000,015 $992,076 $988,605 21 Solar Thermal $329,547 $329,514 $329,165 $329,232 $329,063 $329,978 $329,547 $329,639 $328,838 $328,759 22 Wind $403,463 $397,706 $378,153 $353,862 $351,789 $287,146 $287,350 $288,065 $251,628 $250,960 23 UOG Small Hydro $76,987 $78,874 $80,856 $82,937 $85,122 $87,416 $89,825 $92,354 $95,010 $97,798 24 UOG Solar $50,086 $49,826 $49,568 $49,311 $49,055 $48,801 $48,548 $48,296 $48,045 $47,796 25 Unbundled RECs1 $0 $0 $0 $0 $0 $0 $0 $0 $0 $0
26 Total CPUC-Approved RPS-Eligible Procurement and Generation Cost $2,266,444 $2,071,066 $2,048,814 $2,025,487 $2,022,129 $1,961,985 $1,928,966 $1,925,595 $1,875,541 $1,873,571
[Sum of Rows 16 through 25]
27 Bundled Retail Sales [Thousands of kWh] 59,779,916 59,888,425 59,987,654 60,077,196 60,188,640 60,407,333 60,765,057 61,330,567 62,066,738 62,947,785
28 Incremental Rate Impact2 3.79 ¢/kWh 3.46 ¢/kWh 3.42 ¢/kWh 3.37 ¢/kWh 3.36 ¢/kWh 3.25 ¢/kWh 3.17 ¢/kWh 3.14 ¢/kWh 3.02 ¢/kWh 2.98 ¢/kWh
29 Total Incremental Rate Impact
3.79 ¢/kWh 3.46 ¢/kWh 3.42 ¢/kWh 3.37 ¢/kWh 3.36 ¢/kWh 3.25 ¢/kWh 3.17 ¢/kWh 3.14 ¢/kWh 3.02 ¢/kWh 2.98 ¢/kWh [Row 14 + 28; Rounding can cause Row 29 to differ from Row 14 + 28]
1 See footnote 1 from Table 1. 2 Incremental Rate Impact is equal to a Total Cost (either Row 12 or 26) divided by Bundled Retail Sales (either Row 13 or 27). While the item is labeled “Incremental Rate Impact,” the value should be interpreted as an estimate of a system average bundled rate for RPS-eligible procurement and generation, not a renewable “premium.” In other words, the amount shown captures the total cost of the renewable generation and not the additional cost incurred by receiving renewable energy instead of an equivalent amount of energy from conventional generation sources.

Appendix D – Procurement Information Related to Cost Quantification
Page 5 of 7
Joint IOU Cost Quantification Table 3 (Actual Generation, MWh)
Actual RPS-Eligible Procurement and Generation (MWh) 1 Technology Type 2003 2004 2005 2006 2007 2008 2009 2010 2011 2012 2013 2014
2 Biogas 364,745 333,897 366,514 300,943 293,147 280,795 342,362 306,909 284,129 112,153 85,706 112,161
3 Biomass 2,839,795 2,961,633 2,858,643 2,770,398 2,751,813 2,813,819 3,122,048 2,990,615 3,043,656 3,158,131 3,055,370 3,226,904
4 Geothermal 1,674,702 1,753,043 1,687,360 1,790,870 2,701,970 3,350,232 3,411,798 3,766,700 3,780,954 3,807,728 3,687,236 3,870,952
5 Small Hydro 1,269,233 1,096,183 1,457,339 1,760,707 927,879 945,921 937,626 1,092,707 1,457,714 863,606 652,953 400,300
6 Solar PV 6 4 4 3 1 1 21,706 58,593 179,171 1,006,145 3,358,366 5,266,030
7 Solar Thermal 0 0 0 0 0 0 0 0 0 0 20,581 878,905
8 Wind 940,239 1,078,579 874,204 1,019,451 1,374,337 1,439,796 2,557,988 2,981,660 4,395,377 4,515,452 4,924,052 5,358,546
9 UOG Small Hydro 1,382,934 1,267,084 1,403,130 1,437,196 984,607 993,266 1,103,017 1,157,077 1,254,638 948,734 1,394,189 1,292,552
10 UOG Solar 0 0 0 0 225 445 504 4,642 26,790 165,656 279,500 336,905
11 Unbundled RECs2 0 0 0 0 0 0 0 0 102,888 108,874 101,256 100,581
12
Total CPUC-Approved RPS-Eligible Procurement
and Generation [Sum of Rows 2 through 11]
8,471,654 8,490,423 8,647,195 9,079,568 9,033,979 9,824,276 11,497,048 12,358,903 14,525,317 14,686,479 17,559,209 20,843,836
1 Energy Volumes reported for 2014 in Rows 2 – 11 are the best available settlements data as of March 2015. 2 Row 11 only includes Unbundled RECs with CPUC approval.

Appendix D – Procurement Information Related to Cost Quantification
Page 6 of 7
Joint IOU Cost Quantification Table 4 (Forecast Generation, MWh)
Forecasted Future RPS-Deliveries 2015-2020 (MWh)
1 Executed But Not CPUC-Approved RPS-Eligible Contracts 2015 2016 2017 2018 2019 2020
2 Biogas 0 0 0 0 0 0
3 Biomass 0 0 0 0 0 0
4 Geothermal 0 0 0 0 0 0
5 Small Hydro 0 0 0 0 0 0
6 Solar PV 0 0 0 0 0 0
7 Solar Thermal 0 0 0 0 0 0
8 Wind 0 0 0 0 0 0
9 UOG Small Hydro 0 0 0 0 0 0
10 UOG Solar 0 0 0 0 0 0
11 Unbundled RECs 0 0 0 0 0 0
12 Total Executed But Not CPUC-Approved RPS-
Eligible Deliveries [Sum of Rows 2 through 11]
0 0 0 0 0 0
15 CPUC-Approved RPS-Eligible Contracts (Incl. RAM/FIT/PV Contracts) 2015 2016 2017 2018 2019 2020
16 Biogas 213,398 215,310 267,185 267,182 266,495 266,549
17 Biomass 3,040,682 2,872,745 2,656,538 2,351,353 1,955,668 1,217,664
18 Geothermal 3,940,027 3,846,522 3,835,023 2,319,523 2,318,615 2,324,132
19 Small Hydro 1,055,888 919,433 830,771 756,106 709,157 612,327
20 Solar PV 6,034,593 6,312,470 7,065,526 7,111,196 7,454,367 7,611,582
21 Solar Thermal 1,780,838 1,783,858 1,780,838 1,780,838 1,780,838 1,783,858
22 Wind 5,712,775 5,479,845 5,383,493 5,327,732 5,122,748 5,121,450
23 UOG Small Hydro 1,251,112 1,151,280 1,361,309 1,433,494 1,457,994 1,470,682
24 UOG Solar 343,413 330,121 327,677 325,972 324,276 323,304
25 Unbundled RECs 100,000 0 0 0 0 0
26 Total CPUC-Approved RPS-Eligible Deliveries [Sum of Rows 16 through 25] 23,472,725 22,911,584 23,508,361 21,673,397 21,390,159 20,731,551

Appendix D – Procurement Information Related to Cost Quantification
Page 7 of 7
Joint IOU Cost Quantification Table 4 (continued) (Forecast Generation, MWh)
Forecasted Future RPS-Deliveries 2021-2030 (MWh)
1 Executed But Not CPUC-Approved RPS-Eligible Contracts 2021 2022 2023 2024 2025 2026 2027 2028 2029 2030
2 Biogas 0 0 0 0 0 0 0 0 0 0
3 Biomass 0 0 0 0 0 0 0 0 0 0
4 Geothermal 0 0 0 0 0 0 0 0 0 0
5 Small Hydro 0 0 0 0 0 0 0 0 0 0
6 Solar PV 0 0 0 0 0 0 0 0 0 0
7 Solar Thermal 0 0 0 0 0 0 0 0 0 0
8 Wind 0 0 0 0 0 0 0 0 0 0
9 UOG Small Hydro 0 0 0 0 0 0 0 0 0 0
10 UOG Solar 0 0 0 0 0 0 0 0 0 0
11 Unbundled RECs 0 0 0 0 0 0 0 0 0 0
12 Total Executed But Not CPUC-Approved
RPS-Eligible Deliveries [Sum of Rows 2 through 11]
0 0 0 0 0 0 0 0 0 0
15 CPUC-Approved RPS-Eligible Contracts (Incl. RAM/FIT/PV Contracts) 2021 2022 2023 2024 2025 2026 2027 2028 2029 2030
16 Biogas 265,270 265,284 264,803 261,746 256,235 251,874 251,827 252,519 240,795 238,613
17 Biomass 1,090,072 1,090,072 1,090,072 1,092,821 1,090,072 1,087,042 882,505 851,855 849,722 849,722
18 Geothermal 2,316,815 152,229 151,342 150,941 149,584 148,713 147,846 147,454 146,129 145,278
19 Small Hydro 498,763 413,322 392,430 391,039 384,319 383,913 383,483 378,818 333,264 328,828
20 Solar PV 7,598,989 7,550,029 7,501,666 7,469,194 7,405,927 7,358,546 7,311,489 7,279,915 7,199,970 7,147,369
21 Solar Thermal 1,780,838 1,780,838 1,780,838 1,783,858 1,780,838 1,780,838 1,780,838 1,783,858 1,780,838 1,780,838
22 Wind 4,997,701 4,883,296 4,609,823 4,358,250 4,326,117 3,808,664 3,808,664 3,816,232 3,392,738 3,382,295
23 UOG Small Hydro 1,467,619 1,467,824 1,467,546 1,470,461 1,466,095 1,468,461 1,466,608 1,471,677 1,463,931 1,468,041
24 UOG Solar 320,911 319,242 317,581 316,629 314,286 312,651 311,025 310,093 307,798 306,197
25 Unbundled RECs 0 0 0 0 0 0 0 0 0 0
26 Total CPUC-Approved RPS-Eligible
Deliveries [Sum of Rows 16 through 25]
20,336,980 17,922,135 17,576,101 17,294,939 17,173,473 16,600,702 16,344,285 16,292,421 15,715,185 15,647,181

APPENDIX E
RPS-Eligible Contracts Expiring 2015-2025
January 14, 2016

Log Number Project Name Facility Name
Contract
Expiration Year MW
Expected Annual
Generation (GWh) Contract Type Resource Type City State
01W004 Green Ridge Power LLC (110 MW) Green Ridge Power LLC (110 MW) 2015 144.1 NA Qualifying Facility (QF) Wind Livermore CA
01W018 Green Ridge Power LLC (5.9 MW) Green Ridge Power LLC (5.9 MW) 2015 5.9 NA Qualifying Facility (QF) Wind Tracy CA
01W035 Green Ridge Power LLC (70 MW) Green Ridge Power LLC (70 MW) 2015 54 NA Qualifying Facility (QF) Wind Tracy CA
01W146A Green Ridge Power LLC (100 MW ‒ A) Green Ridge Power LLC (100 MW ‒ A) 2015 43.1 NA Qualifying Facility (QF) Wind Tracy CA
01W146D Green Ridge Power LLC (100 MW ‒ D) Green Ridge Power LLC (100 MW ‒ D) 2015 15 NA Qualifying Facility (QF) Wind Tracy CA
04H061QPA2 Indian Valley Hydro (PURPA) Indian Valley Hydro 2015 3 13.11875 QF/CHP Summit Hydro: Small Clearlake Oaks CA
10G012QPA Amedee Geothermal Venture 1 PURPA Amedee Geothermal Venture 1 2015 0.69 3.5 QF/CHP Summit Geothermal Wendel CA
16W011 Green Ridge Power LLC (23.8 MW) Green Ridge Power LLC (23.8 MW) 2015 10.8 NA Qualifying Facility (QF) Wind Tracy CA
16W014 Altamont Power LLC (3-4) Altamont Power LLC (3-4 ) 2015 4.05 NA Qualifying Facility (QF) Wind Tracy CA
16W015 Altamont Power LLC (4-4) Altamont Power LLC (4-4) 2015 19 NA Qualifying Facility (QF) Wind Tracy CA
16W028 Patterson Pass Wind Farm LLC Patterson Pass Wind Farm 2015 22 NA Qualifying Facility (QF) Wind Tracy CA
25C013 Covanta Mendota L. P. Mendota Biomass Power 2015 25 NA Qualifying Facility (QF) Biomass Mendota CA
04P010 Gas Recovery Sys. (American Cyn) American Canyon 2016 1.5 NA Qualifying Facility (QF) Biogas GenerationAmerican
CanyonCA
10C003 Collins Pine Collins Pine 2016 12 NA Qualifying Facility (QF) Biomass Chester CA
10H002 Lassen Station Hydro Lassen Station Hydro 2016 0.99 NA Qualifying Facility (QF) Hydro: Small Oroville CA
10H013 Hypower, Inc. Hypower, Inc. 2016 10.8 NA Qualifying Facility (QF) Hydro: Small De Sabla CA
12H006 Yuba County Water Agency (Fish Release)Yuba County Water Agency
(Fish Release)2016 0.15 NA Qualifying Facility (QF) Hydro: Small Dobbins CA
13H008 Arbuckle Mountain Hydro Arbuckle Mountain Hydro 2016 0.3 NA Qualifying Facility (QF) Hydro: Small Platina CA
13H014 Mega Renewables (Roaring Crk) Roaring Crk 2016 2 NA Qualifying Facility (QF) Hydro: SmallMontgomery
CreekCA
13H040 Tko Power (South Fork Bear Creek) South Fork Bear Creek 2016 3 NA Qualifying Facility (QF) Hydro: Small Shingletown CA
13H125 Mega Hydro #1 (Clover Creek) Mega Hydro #1 (Clover Creek) 2016 1 NA Qualifying Facility (QF) Hydro: Small Oak Run CA
16H003 Tri-Dam Authority Tri-Dam Authority 2016 16.2 NA Qualifying Facility (QF) Hydro: Small Strawberry CA
16W017 Altamont Power LLC (6-4) Altamont Power LLC (6-4) 2016 19 NA Qualifying Facility (QF) Wind Tracy CA
33R009 Diablo Winds Diablo Winds 2016 18 65 RPS Wind Livermore CA
04H011 Far West Power Corporation Far West Power Corporation 2017 0.4 NA Qualifying Facility (QF) Hydro: Small Potter Valley CA
06W148 Edf Renewable Windfarm V, Inc. (10 MW)EDF Renewable Windfarm V, Inc.
(10 MW)2017 10 NA Qualifying Facility (QF) Wind Suisun City CA
13C038 Burney Forest Products Burney Facility 2017 31 NA Qualifying Facility (QF) Biomass Burney CA
13H001 El Dorado Hydro LLC (Montgomery Creek) El Dorado Irrigation District 2017 2.6 NA Qualifying Facility (QF) Hydro: Small Pollock Pines CA
13H015 Mega Renewables (Hatchet Crk) Hatchet Crk 2017 7 NA Qualifying Facility (QF) Hydro: SmallMontgomery
CreekCA
13H017 Mega Renewables (Bidwell Ditch) Bidwell Ditch 2017 2 NA Qualifying Facility (QF) Hydro: Small Burney CA
13H036 Mega Renewables (Silver Springs) Silver Springs 2017 0.6 NA Qualifying Facility (QF) Hydro: Small Big Bend CA
16P002 Pacific-Ultrapower Chinese StationOgden Power Pacific, Inc.
(Chinese Station)2017 22 NA Qualifying Facility (QF) Biomass Jamestown CA
19P005 DG Fairhaven Power, LLC DG Fairhaven Power, LLC 2017 17.25 NA Qualifying Facility (QF) Biomass Fairhaven CA
33R012 Buena Vista Buena Vista Energy 2017 43 108 RPS Wind Byron CA
33R252 PCWA (RPS) ‒ French Meadows / Oxbow / Hell Hole Multiple 2017 24.6 93 RPS Hydro: Small Multiple Multiple
06W146C Edf Renewable Windfarm V, Inc. (70 MW ‒ C)EDF Renewable Windfarm V, Inc.
(70 MW ‒ C)2018 6.5 NA Qualifying Facility (QF) Wind Suisun City CA
08H013 Santa Clara Valley Water Dist. Santa Clara Valley Water Dist. 2018 0.8 NA Qualifying Facility (QF) Hydro: Small Morgan Hill CA
13H042 Nelson Creek Power Inc. Nelson Creek Power Inc. 2018 1.1 NA Qualifying Facility (QF) Hydro: Small Big Bend CA
13P045 Wheelabrator Shasta Wheelabrator Shasta 2018 54.9 NA Qualifying Facility (QF) Biomass Anderson CA
25W105 International Turbine Research International Turbine Research 2018 34 NA Qualifying Facility (QF) Wind Pacheco Pass CA
33R038 Wadham Energy LP Wadham 2018 26.5 141 RPS Biomass Williams CA
10H010 Five Bears Hydroelectric Five Bears Hydroelectric 2019 0.99 NA Qualifying Facility (QF) Hydro: Small Genesee Valley CA
10P005 HL Power HL Power 2019 32 NA Qualifying Facility (QF) Biomass Wendel CA
12H007 Sts Hydropower (Kanaka) STS Hydropower Ltd. (Kanaka) 2019 1.1 NA Qualifying Facility (QF) Hydro: Small Oroville CA
13H024 Olsen Power Partners Olsen Power Partners 2019 5 NA Qualifying Facility (QF) Hydro: Small Whitmore CA
15H005 Eif Haypress LLC (LWR) Haypress Hydroelectric, Inc. (LWR) 2019 6.1 NA Qualifying Facility (QF) Hydro: Small Sierra City CA
15H006 Eif Haypress LLC (Mdl) Haypress Hydroelectric, Inc. (MDL) 2019 8.7 NA Qualifying Facility (QF) Hydro: Small Sierra City CA
25H037 Friant Power Authority Friant Power Authority 2019 25 NA Qualifying Facility (QF) Hydro: Small Friant CA
25H073 Olcese Water District Kern Hydro (Olcese) 2019 16 NA Qualifying Facility (QF) Hydro: Small Bakersfield CA
25P026 Rio Bravo Fresno Rio Bravo Fresno 2019 26.5 NA Qualifying Facility (QF) Biomass Fresno CA
33R054 Klondike IIIA Klondike IIIA Wind Power 2019 90 263.258 RPS Wind Wasco OR
33R061AB Castelanelli Bros. Biogas Castelanelli Bros. 2019 0.3 1.3 AB1969/FiT Biogas Generation Lodi CA
33R101AB Snow Mountain Hydro (Lost Creek 1) ‒ Contract Lost Creek 1 2019 1.1 9.636 AB1969/FiT Hydro: Small Hat Creek CA
33R102AB Snow Mountain Hydro (Lost Creek 2) ‒ Contract Lost Creek 2 2019 0.5 4.38 AB1969/FiT Hydro: Small Hat Creek CA
12H010 Deadwood Creek (Hydro Sierra Energy, LLC)Deadwood Creek
(Yuba County Water Agency)2020 2 NA Qualifying Facility (QF) Hydro: Small Challenge CA
13H013 Snow Mountain Hydro LLC (Cove) Snow Mountain Hydro (Cove) 2020 5 NA Qualifying Facility (QF) Hydro: SmallMontgomery
CreekCA
13H016 Snow Mountain Hydro LLC (Burney Creek) Burney Creek ‒ Amendment 2020 3 NA Qualifying Facility (QF) Hydro: Small Burney CA
13H035 Snow Mountain Hydro LLC (Ponderosa Bailey Creek)Snow Mountain Hydro
(Ponderosa Bailey Creek)2020 1.1 NA Qualifying Facility (QF) Hydro: Small Manton CA
15P028 Rio Bravo Rocklin Rocklin Facility 2020 25 NA Qualifying Facility (QF) Biomass Rocklin CA
16P054 Thermal Energy Dev. Corp. Thermal Energy Dev. Corp. 2020 21 NA Qualifying Facility (QF) Biomass Tracy CA
25H149 Orange Cove Irrigation Dist. Orange Cove Irrigation Dist. 2020 0.45 NA Qualifying Facility (QF) Hydro: Small Friant CA
25H150 Kings River Hydro Co. Kings River Hydro Co. 2020 1 NA Qualifying Facility (QF) Hydro: Small Sanger CA
33R074 SFWP (RPS) ‒ Sly Creek / Kelly Ridge Multiple 2020 23 106 RPS Hydro: Small Multiple Multiple
33R075 Woodland Biomass Woodland Biomass 2020 25 175 RPS Biomass Woodland CA
33R096AB Combie South FiT Combie South Powerhouse 2020 1.5 3.947 AB1969/FiT Hydro: Small Grass Valley CA
33R141AB NID Scotts Flat FiT Scotts Flat Powerhouse 2020 0.85 3.203 AB1969/FiT Hydro: Small Nevada City CA
33R146AB Blake's Landing ‒ 80kW Generator 80kW Generator 2020 0.08 0.6 AB1969/FiT Biogas Generation Marshall CA
33R015 Shiloh I Wind Project Shiloh I Wind 2021 75 225 RPS Wind Birds Landing CA
33R093 Geysers ‒ 2010 ‒ 50/250/425 MW Multiple 2021 250 2080 RPS Geothermal Multiple Multiple
33R140 El Dorado Irrigation District Multiple 2021 22 99.3 RPS Hydro: Small Multiple Multiple
33R030 Klondike III Klondike III Wind Power 2022 85 265 RPS Wind Wasco OR
33R230AB Wolfsen Bypass FiT Wolfsen Bypass 2022 0.98 5 AB1969/FiT Hydro: Small Los Banos CA
33R231AB San Luis Bypass FiT San Luis Bypass 2022 0.6 3 AB1969/FiT Hydro: Small Los Banos CA
33R240AB South Sutter Water FiT Vanjop No. 1 2022 0.395 2 AB1969/FiT Hydro: Small Sheridan CA
33R246 Wind Resource I ‒ RAM 1 Wind Resource I 2022 8.71 15.41 RPS Wind Tehachapi CA
33R250AB Browns Valley Irrigation District FiT Virginia Ranch Dam Powerhouse 2022 1.04 5.2 AB1969/FiT Hydro: Small Oregon House CA
08C078 City Of Watsonville City Of Watsonville 2023 0.55 NA Qualifying Facility (QF) Biogas Generation Watsonville CA
33R276 Wind Resource II ‒ RAM 2 Wind Resource II (1) 2023 19.955 46.41 RPS Wind Tehachapi CA
33R284 ABEC Bidart-Stockdale LLC Bidart Dairy III (Stockdale) 2023 0.6 1.4 RPS Biogas Generation Bakersfield CA
33R045 Rattlesnake Road Wind Power ProjectArlington Wind Power Project ‒ Rattlesnake
Road2024 102.9 240 RPS Wind Arlington OR
33R077AB Combie North FiT Combie North Powerhouse 2024 0.5 1.316 AB1969/FiT Hydro: Small Grass Valley CA
33R333RM Digger Creek Hydro Digger Creek Hydro 2024 0.65 3.5 AB1969/FiT Hydro: Small Manton CA
33R337RM Clover Flat LFG Clover Flat LFG 2024 0.848 5.747 AB1969/FiT Biogas Generation Calistoga CA
33R053AB Santa Maria II Santa Maria II LFG Power Plant 2025 1.42 12.439 AB1969/FiT Biogas Generation Santa Maria CA
33R058 Hatchet Ridge Hatchet Ridge Wind 2025 103.2 303 RPS Wind Burney CA
33R083 Vantage Wind Energy Center Vantage Wind Energy Center 2025 90 277 RPS Wind Ellensburg WA
33R342RM Water Wheel Ranch Water Wheel Ranch (SB32) 2025 0.975 3.4 AB1969/FiT Hydro: Small Round Mountain CA
Appendix E ‒ RPS‒Eligible Contracts Expiring 2015‒2025
This Expiring Contract List does not include any projects that are non-operational

APPENDICES F.1 – F.5b
Redacted in Entirety
January 14, 2016

APPENDIX G
Other Modeling Assumptions Informing Quantitative Calculation
January 14, 2016

Appendix G – Other Modeling Assumptions Informing Quantitative Calculation
Page 1 of 5
Other Modeling Assumptions Informing Quantitative Calculation1
Assumptions Related to Forecasted Generation Non-QF Projects Contracts Executed Post-2002
Except for the “OFF/Closely Watched” contract category (see Section 4), all non-QF signed contracts are assumed to deliver at 100% of contract volumes, and deliveries commence within the allowed delay provisions in the contract.
QF Non-Hydro Projects Contracts Executed Pre-2002
Forecast is typically based on an average of the three most recent calendar year deliveries. Year 2015 deliveries: Recorded meter data replaces forecasted deliveries for all projects as it becomes
available.
1 All assumptions in this table reflect an April 30, 2015 data vintage which is consistent with the data vintage of Appendices C1 – C4.
Assumptions Related to Procurement Quantity Requirement
Compliance Periods
As implemented by D.11-12-020, SB 2 1X requires retail sellers of electricity to meet the following RPS procurement quantity requirements beginning on January 1, 2011:
o An average of twenty percent of the combined bundled retail sales during the first compliance period (2011-2013).
o Sufficient procurement during the second compliance period (2014-2016) that is consistent with the following formula: (.217 * 2014 retail sales) + (.233 * 2015 retail sales) + (.25 * 2016 retail sales).
o Sufficient procurement during the third compliance period (2017-2020) that is consistent with the following formula: (.27 * 2017 retail sales) + (.29 * 2018 retail sales) + (.31 * 2019 retail sales) + (.33 * 2020 retail sales).
o 33 percent of bundled retail sales in 2021 and all years thereafter. Under the 40 percent scenario, requirements that are consistent with the following formula: (.33 * 2021 retail
sales) + (.37 * 2022 retail sales) + (.37 * 2023 retail sales) + (.40 * 2024 retail sales) and beyond.

Appendix G – Other Modeling Assumptions Informing Quantitative Calculation
Page 2 of 5
QF Hydro Pre-2002 QF, Irrigation District, and Legacy Utility-Owned Assets
Forecast is typically based on historical production, calendar year deliveries, and regularly updated with PG&E’s latest internal hydro updates.
Projects are forecasted at 48% of average water year generation for 2015 (based on PG&E’s April 30, 2015 vintage internal hydro delivery forecast) and reverting to average water years in later years.
Year 2015 deliveries: Recorded meter data replaces forecasted deliveries for all projects as it becomes available.
Non-QF Hydro Utility Owned Generation (UOG) and Irrigation District Water Authority (IDWA)
Forecasts reflect PG&E’s best available projections for hydro conditions. Projects are forecasted at 48% of average water year generation for 2015 (based on PG&E’s April 30, 2015
vintage internal hydro delivery forecast) and reverting to average water years in later years. Year 2015 deliveries: Recorded meter data replaces forecasted deliveries for all projects as it becomes
available.
Future Volumes from Pre-Approved Programs
Feed-in Tariffs E-SRG, E-PWF (AB 1969 FIT) All deliveries from executed contracts are assumed at 100% of contract volumes. Annual energy volumes (for non-operating projects) are modeled based on PG&E's best estimate for project
start dates/initial energy delivery date.
ReMAT All deliveries from executed contracts are assumed at 100% of contract volumes. Modeled start date for generic volumes assumed to begin 7/1/2016 and ramp up linearly until 1/1/2019,
reaching a total of ~114 MW. SB1122 (Bioenergy Feed-in Tariff Program) Modeled start date for generic volumes assumed to begin 7/1/2017 and ramp up linearly until 7/1/2021,
reaching a total of ~111 MW. Renewable Auction Mechanism (Remaining Capacity) For planning purposes PG&E assumed a project start date equal to 12/1/2017. Technology mix assumed to be 32 MW of as-available peaking.

Appendix G – Other Modeling Assumptions Informing Quantitative Calculation
Page 3 of 5
All deliveries from executed contracts are assumed at 100% of contract volumes.
PV Originally Authorized for PG&E Photovoltaic Program Consistent with PG&E’s February 26, 2014 Petition for Modification (PFM)2 requesting to terminate the
PV Program and modify the RAM Decision process to procure the remaining PV Program volumes using RAM solicitation processes PG&E assumed that the Renewable Auction Mechanism accommodates the remaining 200 MW of PG&E’s PV Program volumes.
For planning purposes, PG&E has assumed that a total of 209 MW will be coming online between 2017 and 2018.3
All deliveries from executed contracts are assumed at 100% of contract volumes.
Re-contracting
For the following reasons this risk-adjusted forecast does not assume that expiring volumes are retained: 1. PG&E does not yet have contractual commitments for these expiring volumes; 2. A number of the expiring contracts are with aging generating facilities with limited remaining useful life; 3. Contract-renewal bids may not be competitive with offers for new projects received in future solicitations;
and 4. Assuming re-contracted volumes obscures PG&E’s current real need for additional energy in later years.
Re-contracting is not precluded by this assumption, but rather it reflects that re-contracting will be considered in the future side-by-side with procurement of other new resources.
This forecasting methodology (i.e. not assuming any re-contracting) is consistent with PG&E’s Annual RPS compliance filing that only shows PG&E’s current contractual commitments.
Shortlisted Projects From 2014 Solicitation or Bilateral Offer
No shortlisted projects are included in PG&E’s forecast. Only executed contracts, or generic deliveries from pre-approved procurement programs (i.e., RAM, Feed-in
Tariffs, etc.) are included in PG&E’s forecast.
2 Advice Letter 3809-E. http://www.pge.com/includes/docs/pdfs/b2b/wholesaleelectricsuppliersolicitation/RAM/ELEC_3809-E.pdf. 3 This assumption is based on a modeling vintage of April 2015.

Appendix G – Other Modeling Assumptions Informing Quantitative Calculation
Page 4 of 5
Green Tariff Shared Renewables (GTSR)
If the Commission approves PG&E’s pending advice letters to implement GTSR Program, PG&E plans to allocate small amounts of generation from RPS-eligible resources to serve initial GTSR enrollees until new incremental resources procured for the GTSR program are sufficient to meet program needs.
Once the GTSR program is underway, PG&E would also incorporate any GTSR related impacts on its RPS compliance position into future updates to its RNS.
Banking
PG&E assumes that (1) Category 3 products that do not exceed applicable portfolio content limits are not deducted from bankable volumes, (2) grandfathered (pre-June 1, 2010) short-term products are bankable, and (3) that banked volumes may be applied in any period onward.
PG&E’s accounting is consistent with the direction set forth in Decision 12-06-038.
RPS Sales
PG&E will continue to assess the value to its customers of sales of surplus procurement. Currently, PG&E’s renewable net short (RNS), future RPS cost projections and assessment of the current REC market does not lead to an expectation of material projected sales of RECs. However, PG&E will consider selling surplus non-bankable RPS volumes and may consider selling surplus bankable volumes if it can still maintain an adequate Bank and if market conditions are favorable. PG&E will update its RNS if it executes any such agreements.

Appendix G – Other Modeling Assumptions Informing Quantitative Calculation
Page 5 of 5
Assumptions Related to Forecasted Sales Bundled Retail Sales RNS (App. C1 and C3)
Forecasts of retail sales for the first five years of the forecast were generated by PG&E’s Load Forecasting and Research team in April 2015, and may be updated throughout the year as additional data becomes available.
Forecasts of retail sales beyond the first five years are sourced from the latest LTPP standardized planning assumptions, per the May 21, 2014 ALJ Ruling in R.11-05-005 regarding the methodology for calculating the renewable net short.
Monthly recorded sales replace forecasts as 2015 progresses.
Bundled Retail Sales Alternate RNS (App. C2 and C4)
Forecasts of retail sales were generated by PG&E’s Load Forecasting and Research team in April 2015, and may be updated throughout the year as additional data becomes available.
Monthly recorded sales replace forecasts as 2015 progresses.

APPENDIX H
Responses to Renewable Net Short Questions
January 14, 2016

1
Appendix H - Responses to Renewable Net Short Questions
The following presents PG&E’s responses to questions set forth in the May 21, 2014 Administrative Law Judge’s Ruling on Renewable Net Short.
RPS Compliance Risk
1. How do current and historical performance of online resources in your RPS portfolio impact future projections of RPS deliveries and your subsequent RNS?
PG&E considers historical performance of online resources in both of its models. First, it considers this performance in developing the generation forecast in its deterministic model. As discussed in Appendix G, future projections of RPS deliveries in the deterministic model are based on a blended three year average output for QF contracts.
In addition, within its stochastic model, PG&E considers RPS generation variability based on historical performance of each resource type. A probabilistic distribution is built for each resource based on its calculated coefficient of variation. This captures additional RPS generation variability above and beyond the variances that are captured in the deterministic model. Section 6.2.2 of the RPS Plan describes in more detail how historic generation variability from each resource is used as an input to the stochastic model.
2. Do you anticipate any future changes to the current bundled retail sales forecast? If so, describe how the anticipated changes impact the RNS.
PG&E’s retail sales are impacted by many factors, including weather, economic growth or recession, technological change, energy efficiency, DA and CCA participation levels, and distributed generation. PG&E’s most recent Sales Forecast used in the RPS Plan is an April 2015 updated version of the Alternate Scenario Forecast used in the 2014 Bundled Procurement Plan submitted in October 2014 in Rulemaking 13-12-010. It is important to emphasize that PG&E’s Alternative Scenario is a forecast including a number of assumptions regarding events which may or may not occur. PG&E updates the bundled load forecasts annually to reflect any new events and capture actual load changes. As described in more detail in Section 6.2.1, PG&E uses its stochastic model to simulate a range of potential retail sales forecasts. Changes in retail sales tend to be variable and persistent, xxxxxxxxxxxxxxxxxxxxxxxxxxxxxxxxxxxxxxxxxxxxxxxxxxxxxxxx xxxxxxxxxxxxxxxx, particularly over time. However, PG&E’s modeling results presented in Section 7 are robust to future changes in sales.

2
3. Do you expect curtailment of RPS projects to impact your projected RPS deliveries and subsequent RNS?
To the extent that RPS projects are economically bid and do not clear the market, or are curtailed for system reliability, PG&E expects that curtailment will impact its RNS. As described in Sections 6.2.3 and 11, the stochastic model evaluates uncertainty associated with RPS generation variability, including assumptions of future levels of RPS curtailment.
4. Are there any significant changes to the success rate of individual RPS projects that impact the RNS?
PG&E assumes a volumetric success rate for all executed in-development projects in its RPS portfolio of approximately 99% of total contracted volumes. This rate continues its general trend of increasing from 60% in RPS Plans prior to 2012, to 78% in PG&E’s 2012 RPS Plan, to 100% in PG&E’s 2013 RPS Plan, and 87% in PG&E’s 2014 RPS Plan. This success rate is evolving and highly dependent on the nature of PG&E’s portfolio and the general conditions in the renewable energy industry. While PG&E has continued to see a general trend towards higher project success rates, its revised success rate assumption (from 87% to 99%) reflects the recent removal of several projects from PG&E’s portfolio due to contract termination and an update to the “Closely Watched” category described in Section 6.
In addition, to model the project failure variability inherent in project development, PG&E adds additional success rate assumptions to it stochastic model, which assume that project viability for a yet-to-be-built project is a function of the number of years until its contract start date. These assumptions are used in order to calculate its stochastically-optimized net short (SONS). See the answer to question #5 below for details on these new assumptions.
5. As projects in development move towards their COD, are there any changes to the expected RPS deliveries? If so, how do these changes impact the RNS?
Yes. PG&E may adjust the expected delivery volumes in its deterministic model for RPS projects in development for various reasons. For example, counterparties may make adjustments to their project design, such as decreasing total project capacity, which may lead to changes in expected generation. Counterparties may also experience project delays which impact the delivery date for projects, shifting generation volumes further into the future. In extreme cases, as described in Section 6.1.2, PG&E may categorize projects experiencing considerable development challenges as “Closely Watched” and would in those cases reduce the expected delivery volumes from those projects to zero in its deterministic model. Moving a project to the “Closely Watched” category would therefore decrease future delivery volumes and increase the RNS. PG&E has an extensive program for monitoring the development status of RPS-eligible projects, and the deterministic model is updated regularly to reflect any relevant status changes.
In addition, PG&E further reduces its anticipated deliveries from future projects in its stochastic model, as described in more detail in Section 6.2.4. To model the project

3
failure variability inherent in project development, PG&E assumes that project viability for a yet-to-be-built project is a function of the number of years until its contract start date. PG&E assigns a probability of project success for new, yet-to-be-built projects equal to xxxxxxxxxxxxxxxxxxxxxxxxxxxxxxxxxxxxxxxxxxxxxxxxxxxxxxxxxxxxxxxxx. For example, a project scheduled to come online in five years or more is assumed to have a xxxxx or XXx chance of success. This success rate is based on experience, and although PG&E’s current existing portfolio of projects may have higher rates of success, the actual success rate for projects in the long-term may be higher or lower. Appendices F.2a and F.2b show PG&E’s simulated failure rate and for the period 2015-2030 in the 33% RPS and 40% RPS, respectively.
SUMMARY: COMPARISON OF UNCERTAINTY ASSUMPTIONS
BETWEEN PG&E’S DETERMINISTIC AND STOCHASTIC MODELS
Reference Above and Uncertainty it Represents Deterministic Model Stochastic Model
Question #2: Retail Sales Variability
Uses most recent PG&E bundled retail sales forecast for next 5 years and 2014 LTPP for later years.
Distribution based on most recent (2015) PG&E bundled retail sales forecast.
Question #4 and #5: Project Failure Variability
Only turns “off” projects with high likelihood of failure per criteria. “On” projects assumed to deliver at Contract Quantity.
Uses xxxxxxxxxxxxxxxxxxxxxxxxxxxxxxxxxxx xxxxxxxxxxxxxxxX to model a success rate for all “on” yet-to-be-built projects in the deterministic model. Thus, for a project scheduled to come online in 5 years, the project success rate is xxxxxxxxxxxX. This success rate is based on PG&E’s experience that the further ahead in the future a project is scheduled to come online, the lower the likelihood of project success. Re-contracted projects are assumed to have a xxXX success rate.
Question #1: RPS Generation Variability
Non-QF projects executed post-2002, 100% of contracted volumes For non-hydro QFs, typically based on an average of the three most recent calendar year deliveries Hydro QFs, UOG and IDWA generation projections are updated to reflect the most recent hydro forecast.
Hydro: XXX annual variation Wind: XX annual variation Solar: XX annual variation Biomass and Geothermal: XX annual variation
Question #3: Curtailment1
None 33% Scenario: XX of RPS requirement 40% Scenario: XX of RPS requirement through 2021, increasing to XXxx in 2024 and beyond.
1 These modeling assumptions will not necessarily align with the actual number of curtailment hours,
but are helpful in terms of considering the impact of curtailment on long-term RPS planning and compliance. Please see Section 11 for more information.

4
6. What is the appropriate amount of RECs above the PQR to maintain? Please provide a quantitative justification and elaborate on the need for maintaining banked RECs above the PQR.
As described in Sections 6 and 7, PG&E plans to use a portion of its Bank as a VMOP to manage additional risks and uncertainties accounted for in the stochastic model. PG&E performed a simulation of variability in PG&E’s future generation and RPS compliance targets over Xxx years—i.e., the amount of RPS generation (“delivery”) net of RPS compliance targets (“target”)—and found that a Bank size of at least xxxxx GWh is the minimum Bank necessary to maintain a cumulative non-compliance risk of no greater than xxx. Under a 40% by 2024 scenario and current market assumptions, PG&E would plan to maintain a minimum Bank level of at least xxxxxx GWh. However, because the stochastic model inputs change over time, forecasts of the Bank size will also change, so these estimates should be seen as a point forecast rather than a static target. Please see Section 6 for additional information.
7. What are your strategies for short-term management (10 years forward) and long-term management (10-20 years forward) of RECs above the PQR? Please discuss any plans to use RECs above the PQR for future RPS compliance and/or to sell RECs above the PQR.
As described in Sections 6 and 7, PG&E uses its stochastic model to optimize its procurement. This model currently forecasts Bank levels through xxXX, projecting that PG&E’s forecasted Bank size xxxxxxxxxxxxxxxxxxxxxxxxxxxxxxxxxxxxxxxxxxxxxxxxx GWh by xxxxxxxxxxxxxxxxxxxxxxxxxxxxxxxxxxxxxxxxxxxxxxxxxxxxxxxxxxxxxxxxxxXX xxxxxxxxxxxxxxxxxxxxxxxxxxxxx. Under this projection, xxxxxxxxxxxxxxxxxxxxxxxxXX xxxxxxxxxxxxxxxxxxxxxxxxxxxxxxxxxxxxxxxxxxxxxxxxxxxxxxxxxxxxxxxxxxxxxxxxx Bank will be maintained as VMOP to manage additional risks and uncertainties associated with managing an RPS portfolio.
In the long-term, PG&E will use RECs above the PQR, as needed, to maintain an adequate Bank, as determined by the deterministic and stochastic model or similar means, in order to manage additional risks and uncertainties.
PG&E’s optimization strategy includes consideration of sales of surplus procurement. Consistent with the Commission-approved RNS, PG&E’s physical net short and cost projections do not include any future projected sales of bankable contracted deliveries. However, PG&E will consider selling surplus non-bankable RPS volumes and may consider selling surplus bankable RPS volumes if it can still maintain adequate Bank and if market conditions are favorable. As PG&E encounters economic opportunities to sell volumes, PG&E will use the stochastic model to help evaluate whether the proposed sale will increase the cumulative non-compliance risk for xxxxxxxxxxxxxXX xxxxxxxxxxxxxxx.

5
VMOP
8. Provide VMOP on both a short-term (10 years forward) and long-term (10-20 years forward) basis. This should include a discussion of all risk factors and a quantitative justification for the amount of VMOP.
As discussed in Sections 6 and 7, PG&E plans to use a portion of its Bank as a VMOP to manage additional risks and uncertainties accounted for in the stochastic model. xxxxxxxxxxxxxxxxxxxxxxxxxxxxxxxxxxxxxxxxxxxxxxxxxxxxxxxxxxxxxxxxxxxxxxxxx xxxxxxxxxxxxxxxxxxxxxxxxxxxxxxxxxxxxxxxxxxxxxxxxxxxxxxxxxxxxx, PG&E believes it would be imprudent to use its entire projected Bank toward meeting the 33% RPS target or 40% RPS scenario, rather than to cover unexpected demand and supply variability and project failure or delay exceeding forecasts from projects not yet under contract. When used as VMOP, the Bank will help to avoid long-term over-procurement above the 33% target, and will thus reduce long-term costs of the RPS Program.
9. Please address the cost-effectiveness of different methods for meeting any projected VMOP procurement need, including application of forecast RECs above the PQR.
As discussed in Sections 6 and 7, PG&E’s stochastic model optimizes its results to inform its RPS procurement strategy, which includes using a portion of the Bank as VMOP, to achieve the lowest cost possible given a specified risk of non-compliance. The model suggests a specific level of procurement and resulting Bank usage for each year. PG&E then uses these model results as a tool to guide its actual procurement strategy. While the model provides other possible VMOP usage given a specific level of non-compliance risk, these paths would not be minimum cost under the model’s assumptions.
As a general matter, PG&E does not approach RPS procurement and compliance as a speculative enterprise and so has not modeled or otherwise proposed such strategies in this Plan. However, PG&E will consider selling surplus non-bankable RPS volumes in its portfolio and, in doing so, may seek to sell surplus bankable volumes if it can still maintain an adequate Bank and if market conditions are favorable.
Cost-Effectiveness
10. Are there cost-effective opportunities to use banked RECs above the PQR for future RPS compliance in lieu of additional RPS procurement to meet the RNS?
As discussed in greater detail in Sections 6, 7, and 8 of this Plan, xxxxxxxxxxxxxxXX xxxxxxxxxxxxxxxxxxxxxxxxxxxxxxxxxxxxxxxxxxxxxxxxxxxxxxxxxxxxxxxxxxxxxxxxx xxxxxxxxxxxxxxxxxxxxxxxxxxxxxxxxxxxxxxxxxxxxxxxxxxxxxxxxxxxxxxxxxxxxxxxxx xxxxxxxxxxxxxxxxxxxxxxxxxxxxxxxxxxxxxxxxxxxxxxxxxxxxxxxxxxxxxx. As long as PG&E can continue to maintain an adequate Bank that does not jeopardize PG&E’s ability to manage its non-compliance risk and thus avoid being caught in a “seller’s market,” where PG&E would face potentially high market prices in order to meet near-term compliance deadlines.

6
Overall, PG&E can best meet the objective to minimize customer costs when it can thoroughly examine and take advantage of all cost-effective commercial opportunities to purchase or sell RPS-eligible products consistent with its RPS Plan on a going-forward basis, continually adapting to these uncertain variables. PG&E will continue to use the stochastic model to help guide decisions around minimum Bank size needed to maintain PG&E’s non-compliance risk of xxx for the period of xxxxxxxXX. PG&E will then procure any needed incremental volumes ratably over time.
11. How does your current RNS fit within the regulatory limitations for PCCs? Are there opportunities to optimize your portfolio by procuring RECs across different PCCs?
PG&E’s current RPS portfolio consists of primarily Category 0 and 1 RECs. Category 3 products are a limited, but potentially important, part of PG&E’s procurement strategy as they may provide a low-cost compliance option for PG&E’s customers while at the same time potentially mitigating integration and other operational challenges associated with incremental procurement from typical Category 1 or Category 2 procurement.
While PG&E seeks opportunities across all product categories to procure the most cost-effective resources to achieve the RPS requirements, the existing restrictions on banking of excess procurement limit PG&E’s ability to fully optimize its portfolio. Under the current RPS rules, short-term contracts cannot count towards excess procurement eligible for banking toward a future RPS compliance period. The result is that any entity that has excess procurement during a particular compliance period is effectively restricted from procuring short-term contracts during that compliance period. Only when an entity does not exceed its compliance period target, is it able to count short-term procurement towards meeting its targets.
PG&E currently maintains a bank in order to help mitigate procurement and load variability. Thus, the inability for short-term contracts to contribute to the bank restricts our mitigation strategy. Allowing the unrestricted banking of all RPS products, including those associated with short-term contracts, would enable PG&E to better manage risks and achieve cost-savings for our customers.

ATTACHMENT B
Redline version of the Public 2015 RPS Plan

APPENDIX A
Redline Showing Changes in August 4, 2015 Draft January 14, 2016 Final 2015 RPS Plan Compared to
December 23, 2014 Final (Revision 1) August 4, 2015 Draft RPS Plan
(Excluding Appendices)
August 4, 2015
January 14, 2016

Public
PACIFIC GAS AND ELECTRIC COMPANY
RENEWABLES PORTFOLIO STANDARD
FINAL 2015 RENEWABLE ENERGY PROCUREMENT PLAN (DRAFT VERSION)
AUGUST 4, 2015 JANUARY 14, 2016

i
Public
TABLE OF CONTENTS
1 Summary of Key Issues ..................................................................................... 11
1.1 PG&E’s RPS Position ............................................................................. 11
1.2 PG&E ProposesWill Not to Hold a Request for Offers in 2015 ............... 22
1.3 Consideration of Higher RPS Targets Should Be Integrated With Broader State Greenhouse Gas Goals ..................................................... 2
1.4 Renewable Portfolio Growth Increases Customer Rate Impacts ............ 33
1.5 PG&E’s Bank Is Necessary to Ensure Long-Term Compliance .............. 44
1.6 RPS Rules Should Be Applied Consistently and Equitably Across All LSEs .................................................................................................. 55
2 Summary of Important Recent Legislative/Regulatory Changes to the RPS Program ...................................................................................................... 6
2.1 Commission Implementation of Senate Bill 2 (1x) .................................. 66
2.2 Cost Containment ................................................................................... 77
2.3 Implementation of Bioenergy Legislation ................................................ 77
2.4 Senate Bill 350 .......................................................................................... 8
3 Assessment of RPS Portfolio Supplies and Demand .......................................... 8
3.1 Supply and Demand to Determine the Optimal Mix of RPS Resources ................................................................................................. 8
3.2 Supply ................................................................................................. 1010
3.2.1 Existing Portfolio ...................................................................... 1010
3.2.2 Impact of Green Tariff Shared Renewables Program .................. 11
3.2.3 RPS Market Trends and Lessons Learned .............................. 1313
3.3 Demand .................................................................................................. 14
3.3.1 Near-Term Need for RPS Resources ........................................... 14
3.3.2 Portfolio Considerations ........................................................... 1515
3.4 Anticipated Renewable Energy Technologies and Alignment of Portfolio With Expected Load Curves and Durations .............................. 16
3.5 RPS Portfolio Diversity ........................................................................ 1616
3.6 Optimizing Cost, Value, and Risk for the Ratepayer ........................... 1717
3.7 Long-Term RPS Optimization Strategy ............................................... 1919
4 Project Development Status Update .............................................................. 2020
5 Potential Compliance Delays ......................................................................... 2121

TABLE OF CONTENTS
(CONTINUED)
ii
5.1 Project Financing .................................................................................... 21
5.2 Siting and Permitting ............................................................................... 23
5.3 Transmission and Interconnection ...................................................... 2424
5.4 Curtailment of RPS Generating Resources ............................................ 25
5.5 Risk-Adjusted Analysis ........................................................................... 26
6 Risk Assessment ............................................................................................... 26
6.1 Risks Accounted for in Deterministic Model ........................................ 2828
6.1.1 Standard Generation Variability ............................................... 2929
6.1.2 Project Failure .......................................................................... 2929
6.1.3 Project Delay ............................................................................ 3131
6.2 Risks Accounted for in Stochastic Model ............................................ 3232
6.2.1 Retail Sales Variability ............................................................. 3333
6.2.2 RPS Generation Variability ...................................................... 3434
6.2.3 Curtailment ............................................................................... 3434
6.2.4 Project Failure Variability ......................................................... 3535
6.2.5 Comparison of Model Assumptions .......................................... 3636
6.3 How Deterministic Approach Is Modeled ............................................ 3838
6.4 How Stochastic Approach Is Modeled ................................................ 3838
6.5 Incorporation of the Above Risks in the Two Models Informs Procurement Need and Sales Opportunities ........................................... 40
7 Quantitative Information ................................................................................ 4040
7.1 Deterministic Model Results ................................................................... 41
7.1.1 33% RPS Target Results ......................................................... 4242
7.1.2 40% RPS Scenario Results ......................................................... 42
7.2 Stochastic Model Results .................................................................... 4242
7.2.1 Stochastically-Optimized Net Short to Meet Non-Compliance Risk Target ‒ 33% RPS Target .................................................... 43
7.2.2 Bank Size Forecasts and Results – 33% RPS Target .................. 45
7.2.3 Minimum Bank Size – 33% RPS Target ................................... 4747
7.2.4 Stochastically-Optimized Net Short to Meet Non-Compliance Risk Target ‒ 40% RPS Scenario ................................................ 50
7.2.5 Bank Size Forecasts and Results – 40% RPS Scenario .......... 5151
7.2.6 Minimum Bank Size – 40% RPS Scenario ................................... 53

TABLE OF CONTENTS
(CONTINUED)
iii
7.3 Implications for Future Procurement ....................................................... 55
8 Margin of Procurement ...................................................................................... 55
8.1 Statutory Minimum Margin of Procurement ............................................. 56
8.2 Voluntary Margin of Procurement ........................................................... 57
9 Bid Selection Protocol ....................................................................................... 58
9.1 Proposed TOD Factors ........................................................................... 58
10 Consideration of Price Adjustment Mechanisms ............................................... 60
11 Economic Curtailment ....................................................................................... 61
12 Expiring Contracts ............................................................................................. 64
13 Cost Quantification ............................................................................................ 65
13.1 RPS Cost Impacts .................................................................................. 65
13.2 Procurement Expenditure Limit ............................................................... 66
13.3 Cost Impacts Due to Mandated Programs .............................................. 66
14 Imperial Valley ................................................................................................... 67
15 Important Changes to Plans Noted .................................................................... 68
16 Safety Considerations ....................................................................................... 71
16.1 Development and Operation of PG&E-Owned, RPS-Eligible Generation .............................................................................................. 71
16.2 Development and Operation of Third-Party–Owned, RPS-Eligible Generation .............................................................................................. 74
17 Energy Storage .............................................................................................. 7676

iv
LIST OF APPENDICES
Appendix A: Redline Showing Changes in August 4, 2015 Draft January 14, 2016 Final 2015 RPS Plan Compared to December 23, 2014 Final (Revision 1) August 4, 2015 Draft RPS Plan
Appendix B: Project Development Status Update
Appendix C: Quantitative Information
Appendix C.1a: Renewable Net Short Calculations – 33% RPS Target
Appendix C.1b: Renewable Net Short Calculations – 40% RPS Scenario
Appendix C.2a: Alternate Renewable Net Short Calculations – 33% RPS Target
Appendix C.2b: Alternate Renewable Net Short Calculations – 40% RPS Scenario
Appendix D: Procurement Information Related to Cost Quantification
Appendix E: RPS-Eligible Contracts Expiring 2015-2025
Appendix F: Stochastic Modeling Results
Appendix F.1: Retail Sales Variability (2015 Vintage)
Appendix F.2a: Project Failure Variability – 33% RPS Target
Appendix F.2b: Project Failure Variability– 40% RPS Scenario
Appendix F.3a: RPS Generation Variability – 33% RPS Target
Appendix F.3b: RPS Generation Variability – 40% RPS Scenario
Appendix F.4a: RPS Deliveries Variability – 33% RPS Target
Appendix F.4b: RPS Deliveries Variability – 40% RPS Scenario
Appendix F.5a: RPS Target Variability – 33% RPS Target
Appendix F.5b: RPS Target Variability – 40% RPS Scenario
Appendix G: Other Modeling Assumptions Informing Quantitative Calculation
Appendix H: Responses to Renewable Net Short Questions

1
Pacific Gas and Electric Company (“PG&E”) respectfully submits its Final 2015
Renewables Portfolio Standard (“RPS”) Plan (“2015 RPS Plan”) to the California Public
Utilities Commission (“CPUC” or “Commission”) as directed by the Assigned
CommissionerCommission in this proceeding in the Assigned Commissioner’s Revised
Ruling Identifying Issues and Schedule of Review for 2015 Renewable Portfolio
Standard Procurement Plans (“ACR”) issued on May 28, 2015Decision
(“D.”) 15-12-025. PG&E’s 2015 RPS Plan includes a summary of key issues and
important legislative and regulatory developments impacting California’s RPS
requirements, and then addresses each of the specific requirements identified in the
ACR.1 PG&E believes its 2015 RPS Plan satisfies all of the statutory and Commission
requirements and addresses key policy issues that have arisen as the renewable
energy industry matures and grows in California.Assigned Commissioner’s Revised
Ruling Identifying Issues and Schedule of Review for 2015 Renewable Portfolio
Standard Procurement Plans (“ACR”) issued in this proceeding on May 28, 2015.2
1 Summary of Key Issues
1.1 PG&E’s RPS Position
PG&E projects that under both the current 33% RPS by 2020 target, as well as
a 40% by 2024 scenario, it is well-positioned to meet its RPS compliance requirements
for the second (2014-2016) and third (2017-2020) compliance periods and will not have
incremental procurement need until at least 2022. Under the current 33% RPS target,
PG&E projects that it will have incremental procurement need beginning in XXXX, after
applying banked volumes of excess procurement (“Bank”) beginning in XXXXXXX.
Under the 40% RPS by 2024 scenario, PG&E projects that it will have incremental
procurement need beginning in XXXX, after applying Bank beginning in XXXX. In both
situations, PG&E anticipates additional steady, incremental long-term procurement in
1 See ACR, pp. 8-20.
2 See ACR, pp. 8-20.

2
subsequent years to avoid the need to procure large volumes in any single year to meet
compliance needs and maintain minimum Bank levels.
1.2 PG&E ProposesWill Not to Hold a Request for Offers in 2015
Given its current RPS compliance position, PG&E proposeswill not to hold an
RPS solicitation in 2015. PG&E has sufficient time in the coming years to respond to
changing market, load forecast, or regulatory conditions and will reassess the need for
future solicitations in next year’s RPS Plan. Although many factors could change its
RPS compliance position, PG&E believes that its existing portfolio of executed RPS
contracts, its owned RPS-eligible generation, and its expected Bank balances will be
adequate to ensure compliance with near-term RPS requirements. Additionally, PG&E
expects to procure additional volumes of incremental RPS-eligible contracts through
mandated procurement programs in 2016.3 PG&E will seek permission from the
Commission to procure any amounts other than amounts separately mandated by the
Commission (i.e., Feed-In Tariff (“FIT”) and RAM) during the time period covered by the
2015 solicitation cycle. In 2016, PG&E will reassess its Renewable Net Short (“RNS”)
position and determine its updated procurement needs. PG&E’s proposaldecision to
not to hold a 2015 RPS solicitation is consistent with a proposal made by San Diego
Gas & Electric Company (“SDG&E”) in its 2014 RPS Plan, and approved by the
Commission given SDG&E’s lack of need.4
1.3 Consideration of Higher RPS Targets Should Be Integrated With Broader State Greenhouse Gas Goals
California’s RPS has played, and will continue to play, an important role in
lowering electric sector greenhouse gas (“GHG”) emissions and meeting the state’s
clean energy goals. PG&E supports maintaining the existing requirements that load-
3 Mandated programs include Renewable Auction Mechanism (“RAM”), Renewable Market
Adjusting Tariff (“ReMAT”), and Bioenergy Market Adjusting Tariff (“BioMAT”). In addition, while not pursuant to the RPS mandate, PG&E expects to procure additional volumes over the next year for the Green Tariff Shared Renewables (“GTSR”) Program (“GTSR”)..
4 Decision (“D.”) .14-11-032, p. 32, Ordering Paragraph (“OP”) 17.

3
serving entities (“LSE”) provide a minimum of 33% RPS in 2020 and beyond. As the
state looks beyond 2020, however, moving towards 50% in 2030. However, PG&E
believes California’s clean energy policy should be centered on achieving the most cost-
effective GHG reductions needed to meet the Governor’s 2030 goal of emissions that
are 40% ofbelow 1990 levels.5
Before taking any action that would increase the RPS requirements, the
Commission should consider how the RPS program fits within a comprehensive GHG
policy framework built to achieve emissions reductions through a combination of
actions, as opposed to potentially inefficient carve-out mechanisms.6 Renewable
energy policy should be more completely aligned with this broader policy context in
order to ensure that GHG reduction targets are achieved in an integrated and
economically efficient manner. Rather than reflexively raise the RPS targets, the CPUC
should adopt a strategy focused on flexibility, equitable rules for all LSEs, affordability,
and market and system stability.7
1.4 Renewable Portfolio Growth Increases Customer Rate Impacts
As a part of this RPS Plan, PG&E is providing historic and forecasted RPS cost
and rate information. From 2003-2015, PG&E’s annual RPS-eligible procurement and
generation costs have continued to increase. The costs of the RPS Program have
already and will continue to impact customer bills. From 2003-2016, PG&E estimates
its annual rate impact from RPS procurement has increased from 0.7 cents per
5 Office of California Governor Edmund G. Brown, Executive Order 4-29-2015 (available at
http://gov.ca.gov/news.php?id=18938).
6 For further discussion of the cost impacts of mandated procurement programs, see Section 13.3.
7 For further discussion, see PG&E’s opening and reply comments in response to Order Instituting Rulemaking to Continue Implementation and Administration, and Consider Further Development, of California Renewables Portfolio Standard Program (R.15-02-020) filed on March 26, 2015 and April 6, 2015, respectively.

4
kilowatt-hour (“¢/kWh”) in 2003 to an estimated 3.5¢/kWh in 2016.8 The growth in rates
due to RPS procurement costs will continue to increase through 2020, as the average
rate impact is forecasted to increase to 3.9¢/kWh, or approximately $2.3 billion. Further
detail regarding RPS costs is provided in Section 13 and the annual rate impact of
forecasted procurement is detailed in Table 2 of Appendix D.
To address these rate impacts, PG&E’s procurement strategy attempts to
minimize cost and maximize value to customers, while satisfying the RPS program
requirements. To accomplish this goal, PG&E promotes competitive processes to
procure incremental RPS volumes, strategically uses its Bank, and avoids long-term
over-procurement.
As described above, a more integrated GHG policy framework that enables
LSEs to adapt to changing needs, costs, and circumstances and manage the integration
of variable resources would provide additional opportunities to lower customer costs.
New technologies will emerge and the mix and cost-effectiveness of GHG emissions
reduction strategies will undoubtedly evolve over the next several years. PG&E
believes that a more flexible implementation of the RPS Program that allows LSEs to
optimize a portfolio of different GHG reduction strategies would facilitate meeting the
State’s environmental goals at the lowest possible costs and best portfolio fit, and
provide the maximum benefits to customers. Similarly, as discussed in Section 13.3,
mandated procurement programs within the RPS reduce the program’s efficiency while
increasing costs.
1.5 PG&E’s Bank Is Necessary to Ensure Long-Term Compliance
PG&E views its Bank as necessary to: (1) mitigate risks associated with
variability in load; (2) protect against project failure or delay exceeding forecasts; and
8 “Annual Rate Impact” should be interpreted as an estimate of a system average bundled
rate for RPS-eligible procurement and generation, not a renewable “premium.” In other words, the amount shown captures the total cost of the renewable generation and not the additional cost incurred by receiving renewable energy instead of an equivalent amount of energy from conventional generation sources.

5
(3) avoid intentional over-procurement above the 33% RPS target by managing
year-to-year generation variability from performing RPS resources. The Bank allows
PG&E to mitigate the need to procure additional RPS products at potentially high
market prices in order to meet near-term compliance deadlines. With an adequate
Bank, PG&E aims to minimize customer cost by having the flexibility not to procure in
“seller’s market” situations. More information on forecasted Bank size and minimum
Bank levels under both 33% and 40% RPS is provided in Section 7 below.
PG&E will continue to assess the value to its customers of sales of surplus
procurement. Currently, PG&E’s RNS, future RPS cost projections, and assessment of
the current Renewable Energy Credit (“REC”) market do not lead to an expectation of
material projected sales of RECs. However, PG&E will consider selling surplus
non-bankable RPS volumes and may consider selling surplus bankable volumes if it can
still maintain an adequate Bank and if market conditions are favorable.
1.6 RPS Rules Should Be Applied Consistently and Equitably Across All LSEs
PG&E’s long-term position is a forecast based on a number of assumptions,
including a certain amount of load departure due to Community Choice Aggregation
(“CCA”) and distributed generation growth. While it is possible that this forecasted load
departure may not fully materialize or occur at the rate assumed in the forecast, PG&E’s
forecast is a reasonable scenario based on current trends. Under the existing
percentage-based RPS targets, any departure of PG&E’s load to CCAs naturally results
in both a reduction of PG&E’s required RPS procurement quantities and a
corresponding increase in RPS procurement by CCAs. Thus, CCAs will be required to
shoulder an increasing portion of the State’s RPS procurement goals. The consistent
and equitable application of all RPS rules and requirements to all Commission-
jurisdictional LSEs, including CCAs and ElectricEnergy Service Providers (“ESPs”), will
help to ensure that all LSEs are helping California achieve its ambitious renewable
energy goals.

6
2 Summary of Important Recent Legislative/Regulatory Changes to the RPS Program
PG&E’s portfolio forecast and procurement decisions are influenced by ongoing
legislative and regulatory changes to the RPS Program. The following is a description
of recent changes to the RPS Program that have impacted PG&E’s RPS procurement.
2.1 Commission Implementation of Senate Bill 2 (1x)
Senate Bill (“SB”) 2 (1x), enacted in April 2011 and effective as of December 11,
2011, made significant changes to the RPS Program, most notably extending the RPS
goal from 20% of retail sales of all California investor-owned utilities (“IOUs”), ESPs,
publicly- owned utilities (“POUs”),, and CCAs by the end of 2010, to a goal of 33% of
retail sales by 2020. The Commission issued an Order Instituting Rulemaking to
implement SB 2 (1x) in May 2011 and has subsequently issued a number of key
decisions implementing certain “high priority” issues needed to implement the complex
provisions of SB 2 (1x). In February 2015, the Commission opened a new
rulemakingRulemaking (R.) 15-02-020 to address remaining issues from this earlier
proceeding, as well as other elements of the ongoing administration of the
RPS Program. Commission action on remaining and new key issues may impact
PG&E’s procurement need and actions going forward, notwithstanding the forecasts
and projections included in this Plan.
Key Commission decisions issued to date implementing SB 2 (1x) include
D.11-12-052 which defined portfolio content categories (“PCC”), D.11-12-020 which
outlined compliance period targets for the 33% RPS target, and D.12-06-038 which
implemented changes to the RPS compliance rules for retail sellers, including treatment
of prior procurement to meet RPS obligations for both the 20% and 33% RPS
Programs. D.12-06-038 also adopted rules on calculating the RPS Bank, meeting the
portfolio balance requirements, and for reporting annually to the Commission on RPS
procurement. Finally, on December 4, 2014, the CPUC adopted D.14-12-023 setting
RPS compliance and enforcement rules under SB 2 (1X).

7
2.2 Cost Containment
When California’s legislature passed SB 2 (1x), it required the CPUC to develop
a limitation on total RPS costs for each electrical corporation. The legislature specified
that the cost limitation must prevent the 33% RPS target from causing “disproportionate
rate impacts.” If PG&E exceeds the Commission-approved cost cap, it may refrain from
entering into new RPS contracts and constructing RPS-eligible facilities unless
additional procurement can be undertaken with only “de minimis” rate impacts.
PG&E has made every effort to procure least-cost and best-fit renewable
resources. However, recognizing the potential cost impact that RPS procurement can
have on customers, PG&E strongly supports the establishment of a clear, stable, and
meaningful Procurement Expenditure Limitation (“PEL”) that both informs procurement
planning and decisions, and promotes regulatory and market certainty. PG&E urges the
Commission to finalize the PEL as soon as possible, given that the RPS statute requires
the Commission to report by January 1, 2016 on the status of each IOU in achieving
33% RPS within the adopted PEL, and to propose any necessary modifications to
the PEL.
2.3 Implementation of Bioenergy Legislation
On September 27, 2012, SB 1122 was passed, requiring California’s IOUs to
procure 250 megawatts (“MW”) in total of new small-scale bioenergy projects 3 MW or
less through the Feed-In Tariff (“FIT”) Program. The total IOU program MWs are
allocated into three technology categories: 110 MW for biogas from wastewater plants
and green waste; 90 MW for dairy and other agriculture bioenergy; and 50 MW for
forest waste biomass. The allocation of MWs by project type for each IOU, as well as
the program design, is being determined by the Commission in proceedings currently
underway. PG&E has worked with the Commission and stakeholders in order to ensure
that the SB 1122 program is implemented in a way that balances the needs of the
bioenergy industry with clear cost containment mechanisms that protect customers from
excessive costs. On December 18, 2014, the Commission issued D.14-12-081 to

8
implement SB 1122 and required the IOUs to file a tariff and contract for SB 1122
eligible generation. The IOUs filed their proposed contract and tariff on
February 6, 2015, which were approved with modifications in D.15-09-004. PG&E’s
SB 1122 program (“BioMAT”) began accepting participants on December 1, 2015 and
the first program period will start on February 1, 2016.
2.4 Senate Bill 350
On October 7, 2015, Governor Brown signed SB 350 (de Leon), known as the
Clean Energy and Pollution Reduction Act of 2015. Among other provisions, SB 350
increases the RPS target from 33% in 2020 to 50% in 2030. The Commission will begin
implementation of SB 350 in 2016.
3 Assessment of RPS Portfolio Supplies and Demand
3.1 Supply and Demand to Determine the Optimal Mix of RPS Resources
Meeting California’s RPS goals in a way that achieves the greatest value for
customers continues to be a top priority for PG&E. In particular, PG&E continues to
analyze its need to procure cost-effective resources that will enable it to achieve and
maintain California’s 33% RPS target. PG&E is currently required to procure the
following quantities of RPS-eligible products:
2011-2013 (First Compliance Period): 20% of the combined bundled retail sales.
2014-2016 (Second Compliance Period): A percentage of the combined bundled retail sales that is consistent with the following formula: (.217 * 2014 retail sales) + (.233 * 2015 retail sales) + (.25 * 2016 retail sales).
2017-2020 (Third Compliance Period): A percentage of the combined bundled retail sales that is consistent with the following formula: (.27 * 2017 retail sales) + (.29 * 2018 retail sales) + (.31 * 2019 retail sales) + (.33 * 2020 retail sales).
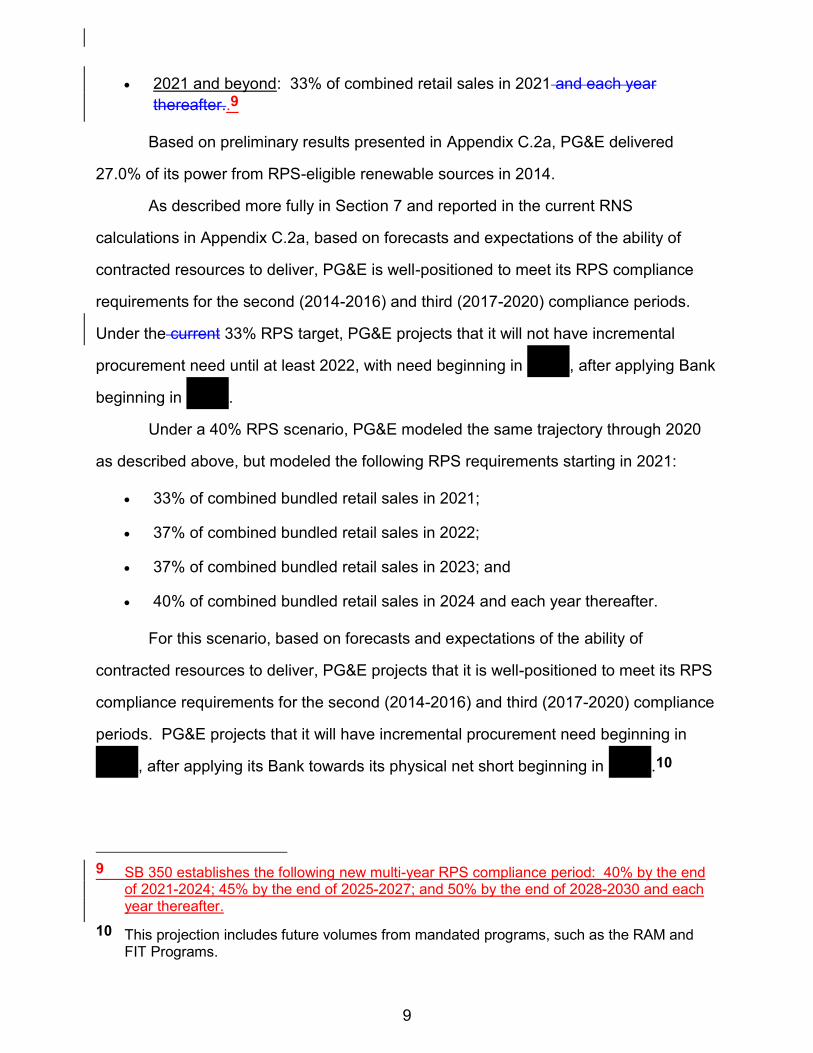
9
2021 and beyond: 33% of combined retail sales in 2021 and each year thereafter..9
Based on preliminary results presented in Appendix C.2a, PG&E delivered
27.0% of its power from RPS-eligible renewable sources in 2014.
As described more fully in Section 7 and reported in the current RNS
calculations in Appendix C.2a, based on forecasts and expectations of the ability of
contracted resources to deliver, PG&E is well-positioned to meet its RPS compliance
requirements for the second (2014-2016) and third (2017-2020) compliance periods.
Under the current 33% RPS target, PG&E projects that it will not have incremental
procurement need until at least 2022, with need beginning in XXXX, after applying Bank
beginning in XXXX.
Under a 40% RPS scenario, PG&E modeled the same trajectory through 2020
as described above, but modeled the following RPS requirements starting in 2021:
33% of combined bundled retail sales in 2021;
37% of combined bundled retail sales in 2022;
37% of combined bundled retail sales in 2023; and
40% of combined bundled retail sales in 2024 and each year thereafter.
For this scenario, based on forecasts and expectations of the ability of
contracted resources to deliver, PG&E projects that it is well-positioned to meet its RPS
compliance requirements for the second (2014-2016) and third (2017-2020) compliance
periods. PG&E projects that it will have incremental procurement need beginning in
XXXX, after applying its Bank towards its physical net short beginning in XXXX.10
9 SB 350 establishes the following new multi-year RPS compliance period: 40% by the end
of 2021-2024; 45% by the end of 2025-2027; and 50% by the end of 2028-2030 and each year thereafter.
10 This projection includes future volumes from mandated programs, such as the RAM and FIT Programs.

10
3.2 Supply
3.2.1 Existing Portfolio
PG&E’s existing RPS portfolio is comprised of a variety of technologies, project
sizes, and contract types. The portfolio includes over 8,000 MW of active projects,
ranging from utility-owned solar and small hydro generation to long-term RPS contracts
for large wind, geothermal, solar, and biomass to small FIT contracts for solar
photovoltaic (“PV”), biogas, and biomass generation. This robust and diversified supply
provides a solid foundation for meeting current and future compliance needs; however,
the portfolio is also subject to uncertainties as discussed below and in more detail in
Sections 6 and 7.
As described in further detail in Section 7.1, for the 2015 RPS Plan, PG&E
assumes a volumetric success rate for all executed in-development projects in its RPS
portfolio of approximately 99% of total contracted volumes. This rate continues its
general trend of increasing from 60% in RPS Plans prior to 2012, to 78% in PG&E’s
2012 RPS Plan, to 100% in PG&E’s 2013 RPS Plan, and 87% in PG&E’s 2014 RPS
Plan. This success rate is evolving and highly dependent on the nature of PG&E’s
portfolio, the general conditions in the renewable energy industry, and the timing of the
RPS Plan publication date relative to recent project terminations. While PG&E has
continued to see a general trend towards higher project success rates, the change in its
success rate assumption from 2014 to 2015 (from 87% to 99%) reflects the recent
removal of several projects from PG&E’s portfolio due to contract terminations and an
update to the “Closely Watched” category described in Section 6.
Consistent with the project trends reported in its 2014 RPS Plan, PG&E has
observed continued progress of key projects under development in its portfolio. Tax
incentives (e.g., the federal Investment Tax Credit (“ITC”) and Production Tax Credit
(“PTC”)) have continued to increase many projects’ cost-effectiveness, contributing to
their eventual completion. Progress in the siting and permitting of projects has also
supported PG&E’s sustained high success rate. As described in more detail in

11
Section 3, PG&E believes the renewable development market has stabilized for the
near-term and the renewable project financing sector will continue to evolve well into
the future.
Notwithstanding these positive trends, the timely development of renewable
energy facilities remains subject to many uncertainties and risks, including regulatory
and legal uncertainties, permitting and siting issues, technology viability, adequate fuel
supply, and the construction of sufficient transmission capacity. These challenges and
risks are described in more detail in Sections 5 and 6.
For purposes of calculating its demand for RPS-eligible products through the
modeling described in Section 6, PG&E does not assume that expiring RPS-eligible
contracts in its existing portfolio are re-contracted,11 although these resources are
encouraged to bid into PG&E’s future competitive solicitations.
3.2.2 Impact of Green Tariff Shared Renewables Program
In 2013, SB 43 enacted the GTSR Program that allows PG&E customers to
meet up to 100% of their energy usage with generation from eligible renewable energy
resources. On January 29, 2015, the Commission adopted D.15-01-051 implementing
a GTSR framework, approving the IOUs’ applications, and requiring the IOUs to begin
procurement for the GTSR Program in advance of customer enrollment.
Pursuant to D.15-01-051, PG&E has submitted several advice letters related to
implementation of the GTSR program that are currently pending before the
Commission. In February, PG&E filed an advice letter containing its plans for advance
procurement for the GTSR Program and identifying the eligible census tracts for
environmental justice projects in its service territories.12 In May, together with Southern
11 Although the physical net short calculations in PG&E’s deterministic model do not include
any assumptions related to the re-contracting of expiring RPS-eligible contracts, the stochastic model can re-contract volumes to meet procurement need. Such re-contracting amounts are illustrative only and not prescriptive. PG&E’s deterministic and stochastic models are described in more detail below in Section 6.
12 PG&E Advice Letter 4593-E (supplemented March 25, 2015).

12
California Edison Company (SCE) and San Diego Gas & Electric Company (SDG&E),,
PG&E submitted a Joint Procurement Implementation Advice Letter (JPIAL),,
addressing each utility’s plans for ongoing GTSR Program procurement and RPS
resource and renewable energy credit (REC) separation and tracking.13 Concurrently,
PG&E filed a Marketing Implementation Advice Letter (MIAL)14 and a Customer-Side
Implementation Advice Letter (CSIAL)15 with details regarding implementation. In
addition, to accommodate GTSR procurement, PG&E filed Advice Letter 4605-E to
change its RAM 6 PPAsPower Purchase Agreements (“PPA”) and Request for Offer
(“RFO”) instructions, consistent with the minimum goals for 2015 identified in D.15-01-
051.16
The GTSR program will impact PG&E’s RPS position in two ways: (1) PG&E’s
RPS supply may be affected; and (2) PG&E’s retail sales will be reduced corresponding
to program participation. The GTSR decision permits the IOUs to supply Green Tariff
customers from an interim pool of existing RPS resources until new dedicated Green
Tariff projects come online. Generation from these interim facilities would no longer be
counted toward PG&E’s RPS targets, which will result in PG&E’s RPS supply
decreasing. However, there is also a possibility that RPS supply might increase in the
future if generation from Green Tariff dedicated projects exceeds the demand of Green
Tariff customers. PG&E will implement tracking and reporting protocols for tracking
RECs transferred to and from the RPS portfolio and Green Tariff programs. Because
the GTSR implementation Advice Letters discussed above17 have not yet been
approved, PG&E’s RNS calculation submitted with this RPS Plan does not reflect the
13 Advice Letter 4637-E.
14 Advice Letter 4638-E.
15 Advice Letter 4639-E.
16 See D.15-01-051, Section 4.2.4, pp. 25-28.
17 Advice Letters 4637-E, 4638-E and 4639-E.

13
impact of GTSR on PG&E’s RPS position. Due to the relatively small volumes of the
GTSR interim pool compared to PG&E’s overall RNS position, PG&E believes that its
forecasts of meeting the second and third compliance period RPS targets as well as its
incremental need year under either a 33% or 40% RPS would remain the same once
these small GTSR volumes are incorporated. PG&E will update future RNS
calculations to reflect GTSR program impacts after the advice letters implementing the
program are approved.
3.2.3 RPS Market Trends and Lessons Learned
As PG&E’s renewable portfolio has expanded to meet the RPS goals, PG&E’s
procurement strategy has evolved. PG&E’s strategy continues to focus on the
three key goals of: (1) reaching, and sustaining, the 33% RPS target; (2) minimizing
customer cost within an acceptable level of risk; and (3) ensuring it maintains an
adequate Bank of surplus RPS volumes to manage annual load and generation
uncertainty. However, PG&E is continually adapting its strategy to accommodate new
emerging trends in the California renewable energy market and regulatory landscape.
The California renewable energy market has developed and evolved significantly
over the past few years. The market now offers a variety of technologies at generally
lower prices than seen in earlier years of the RPS Program. The share of these
technologies in PG&E’s portfolio is changing as a result. For some technologies, such
as solar PV, prices have dropped significantly due to various factors including
technological breakthroughs, government incentives, and improving economies of scale
as more projects come online.
Another trend driven by growth of renewable resources in the California
Independent System Operator (“CAISO”) system is the downward movement of mid-day
market prices. Many renewable energy project types have little to no variable costs and
therefore additions tend to move market clearing prices down the dispatch stack. This
has led to a change in the energy values associated with RPS offers, with decreasing
value of renewable projects that generate during mid-day hours.

14
The growth of renewable resources has also produced operational challenges,
such as overgeneration situations and negative market prices. Provisions that provide
PG&E with greater flexibility to economically bid RPS-eligible resources into the CAISO
markets are critical to helping address overgeneration and negative pricing situations
that are likely to increase in frequency in the future. These provisions have both
operational and customer benefits. From an operational perspective, this flexibility
allows PG&E to offer its RPS-eligible resources into the CAISO’s economic dispatch,
which can reduce the potential for overgeneration conditions and facilitate reliable
operation of the electrical grid. In addition, economic bidding enables RPS-eligible
resource generation to be curtailed during negative pricing intervals when it is economic
to do so, which protects customers from higher costs. Economic curtailment is
discussed in greater detail in Section 11.
3.3 Demand
PG&E’s demand for RPS-eligible resources is a function of multiple complex
factors including regulatory requirements and portfolio considerations. Compliance
rules for the RPS Program were established in D.12-06-038. In addition, the
Commission issued D.11-12-052, to define three statutory PCCs of RPS-eligible
products that retail sellers may use for RPS compliance, which impacts PG&E’s
demand for different types of RPS-eligible products. Finally, PG&E’s demand is a
function of the risk factors discussed in more detail in Section 6; in particular,
uncertainty around bundled retail sales can have a major impact on PG&E’s demand for
RPS resources, as further detailed below.
3.3.1 Near-Term Need for RPS Resources
Because PG&E has no incremental procurement need through XXXX under a
33% RPS requirement and through XXXX under a 40% RPS scenario, PG&E proposes
toplans not to hold an RPS solicitation in 2015. As discussed in the summary of key
issues, PG&E has sufficient time in the coming years to respond to changing market,
load forecast, or regulatory conditions and will reassess the need for future RFOs in

15
next year’s RPS Plan. Although many factors could change PG&E’s RPS compliance
position, PG&E believes that its existing portfolio of executed RPS-eligible contracts, its
owned RPS-eligible generation, and its expected Bank balances will be adequate to
ensure compliance with near-term RPS requirements. Additionally, PG&E expects to
procure additional volumes of incremental RPS-eligible contracts in 2016 through
mandated procurement programs, such as the RAM, ReMAT, and BioMAT Programs.
PG&E will seek permission from the Commission to procure any amounts other than
amounts separately mandated by the Commission (i.e., FIT and RAM) during the time
period covered by the 2015 solicitation cycle.
3.3.2 Portfolio Considerations
One of the most important portfolio considerations for PG&E is the forecast of
bundled load. PG&E’s most recent Load Forecast, which is used in this RPS Plan, is an
April 2015 updated version of the Alternate Scenario Forecast used in the 2014 Bundled
Procurement Plan (“BPP”) submitted in October 2014 in R.13--12--010. PG&E updates
the bundled load forecasts annually to reflect any new events and to capture actual load
changes. It is important to emphasize that PG&E’s Alternative Scenario is a forecast
that includes a number of assumptions regarding events which may or may not occur.
PG&E is currently projecting a decrease in retail sales in 2015 and a continued
retail sales decrease through 2024, followed by modest growth thereafter. These
changes are driven by the increasing impacts of Energy Efficiency (“EE”),,
customer-sited generation, and Direct Access (“DA”) and CCA participation levels, and
are offset slightly by an improving economy and growing electrification of the
transportation sector. As described in more detail in Section 6.2.1, PG&E uses its
stochastic model to simulate a range of potential retail sales forecasts.
In addition to retail sales forecasts, as discussed in Sections 6, 7, and 8,
PG&E’s long-term demand for new RPS-eligible project deliveries is driven by:
(1) PG&E’s current projection of the success rate for its existing RPS portfolio, which
PG&E uses to establish a minimum margin of procurement; and (2) the need to account

16
for its risk-adjusted need, including any Voluntary Margin of Procurement (“VMOP”) as
determined by PG&E’s stochastic model. The risk and uncertainties that justify the
need for VMOP are further detailed and quantified in Sections 6 and 7.
3.4 Anticipated Renewable Energy Technologies and Alignment of Portfolio With Expected Load Curves and Durations
PG&E’s procurement evaluation methodology considers both market value and
the portfolio fit of RPS-eligible resources in order to determine PG&E’s optimal
renewables product mix. With the exception of specific Commission-mandated
programs such as the RAM, ReMAT, and BioMAT Programs, PG&E does not identify
specific renewable energy technologies or product types (e.g., baseload, peaking
as-available, or non-peaking as-available) that it is seeking to align, or fit, with specific
needs in its portfolio. Instead, PG&E identifies an RPS-eligible energy need in order to
fill an aggregate open position identified in its planning horizon and selects project offers
that are best positioned to meet PG&E’s current portfolio needs. This is evaluated
through the use of PG&E’s Portfolio Adjusted Value (“PAV”) methodology, which
ensures that the procured renewable energy products provide the best fit for PG&E’s
portfolio at the least cost. Starting in the 2014 RPS RFO, PG&E began utilizing the
interim integration cost adder to accurately capture the impact of intermittent resources
on PG&E’s portfolio. When this adder is finalized by the Commission, PG&E’s Net
Market Value (“NMV”) methodology will be updated to use the values and
methodologies of the final integration cost adder. PG&E’s PAV and NMV
methodologies were described in detail in PG&E’s 2014 RPS Solicitation Protocol.18
3.5 RPS Portfolio Diversity
PG&E’s RPS portfolio contains a diverse set of technologies, including solar PV,
solar thermal, wind, small hydro, bioenergy, and geothermal projects in a variety of
18 See PG&E, 2014 RPS Solicitation Protocol, pp. 24-28 (available at
http://www.pge.com/includes/docs/pdfs/b2b/wholesaleelectricsuppliersolicitation/RPS2014/RPS_Solicitation_Protocol_01052015.pdf).

17
geographies, both in-state and out-of-state. PG&E’s procurement strategy addresses
technology and geographic diversity on a quantitative and qualitative basis.
In the NMV valuation process, PG&E models the location-specific marginal
energy and capacity values of a resource based on its forecasted generation profile.
Thus, if a given technology or geography becomes “saturated” in the market, then those
projects will see declining energy and capacity values in their NMV. This aspect of
PG&E’s valuation methodology should result in PG&E procuring a diverse resource mix
if technological or geographic area concentration is strong enough to change the
relative value of different resource types or areas. In addition, technology and
geographic diversity have the potential to reduce integration challenges. PG&E’s use of
the integration cost adder in its NMV valuation process may also result in procurement
of different technology types.
Diversity is also considered qualitatively when making procurement decisions.
Resource diversity may decrease risk to PG&E’s RPS portfolio given uncertainty in
future hourly and locational market prices as well as technology-specific
development risks.
PG&E recognizes that resource diversity is one option to minimize the
overgeneration and integration costs associated with technological or geographic
concentration. In general, PG&E believes that less restrictive procurement structures
provide the best opportunity to maximize value for its customers, allowing proper
response to changing market conditions and more competition between resources,
while geographic or technology-specific mandates add additional costs to RPS
procurement. PG&E’s current quantitative and qualitative approach to resource
diversity would remain the same under a 40% RPS scenario as the existing approach
described above.
3.6 Optimizing Cost, Value, and Risk for the Ratepayer
From 2003 to 2012, PG&E’s annual RPS-eligible procurement and generation
costs from its existing contracts and utility-owned portfolio grew at a relatively modest

18
pace. However, the costs of the RPS program are becoming more apparent on
customer bills and will increase as RPS projects come online in significant quantities.
Over the period of two years (2013 and 2014), the renewable generation in PG&E’s
portfolio increased by approximately the same amount that it grew over the entire prior
history of the RPS Program (2003-2012). In addition to cost impacts resulting from the
direct procurement of renewable resources, customer costs are also impacted by the
associated indirect incremental transmission and integration costs.
PG&E is aware of these direct and indirect cost impacts and will attempt to
mitigate them whenever possible, particularly when entering into incremental long-term
commitments. PG&E’s fundamental strategy for mitigating RPS cost impacts is to
balance the opposing objectives of: (1) delaying additional RPS-related costs until
deliveries are needed to meet a physical compliance requirement; and (2) managing the
risk of being caught in a “seller’s market,” where PG&E faces potentially high market
prices in order to meet near-term compliance deadlines. When these objectives are
combined with the general need to manage overall RPS portfolio volatility based on
demand and generation uncertainty, PG&E believes it is prudent and necessary to
maintain an adequate Bank through the most cost-effective means available.
In addition, PG&E seeks to minimize the overall cost impact of renewables over
time through promoting competitive processes that can encourage price discipline, and
using the Bank to help limit long-term over-procurement. PG&E generally supports the
use of competitive procurement mechanisms that are open to all RPS-eligible
technologies and project sizes. As described in greater detail in Section 13.3, as PG&E
makes progress toward achieving the 33% RPS target, it expects that the cost impacts
of mandated procurement programs that focus on particular technologies or project size
may increase the overall costs of PG&E’s RPS portfolio for customers as procurement
from these programs comprise a larger share of PG&E’s incremental procurement
goals. This further underscores the need to implement an RPS cost containment
mechanism that provides a cap on costs. PG&E supports a technology-neutral

19
procurement process, in which all technologies can compete to offer the best value to
customers at the lowest cost.
3.7 Long-Term RPS Optimization Strategy
PG&E’s long-term optimization strategy seeks to both achieve and maintain
RPS compliance through and beyond 2020 and to minimize customer cost within an
acceptable level of risk. PG&E’s optimization strategy continues to evolve as its RPS
compliance position through 2020 and beyond continues to improve. Although PG&E
remains mindful of meeting near-term compliance targets, it also seeks to refine
strategies for maintaining compliance in a least-cost manner in the long-term
(post-2020). PG&E’s optimization strategy includes an assessment of compliance risks
and approaches to protect against such risks by maintaining a Bank that is both prudent
and needed to manage a 33% RPS operating portfolio after 2020. PG&E employs
two models in order to optimize cost, value, and risk for the ratepayer while achieving
sustained RPS compliance. This optimization analysis results in PG&E’s
“stochastically-optimized net short” (“SONS”), which PG&E uses to guide its
procurement strategy, as further described in Sections 6 and 7.
PG&E’s long-term optimization strategy includes three primary components:
(1) incremental procurement; (2) possible sales of surplus procurement; and
(3) effective use of the Bank. Although PG&E proposeswill not to hold a 2015 RPS
solicitation, future incremental procurement to avoid the need to procure extremely large
volumes in any single year remains a central component of PG&E’s long-term RPS
optimization strategy. In addition to procurement, PG&E’s optimization strategy
includes consideration of sales of surplus procurement that provide a value
to customers.
The third component of the optimization strategy is effective use of the Bank.
Under the existing 33% RPS target and current market assumptions, PG&E plans to
apply a portion of its projected Bank to meet compliance requirements beginning in
XXXX. Additionally, PG&E plans to use a portion of its Bank as a VMOP to manage

20
additional risks and uncertainties accounted for in PG&E’s stochastic model, while
maintaining a minimum Bank size of at least XXXXXXXXXXXXXXXXXXXX.
Under a 40% RPS by 2024 scenario, the components of PG&E’s optimization
strategy would remain the same. However, under the 40% RPS scenario and current
market assumptions, PG&E would plan to maintain a minimum Bank size of at least
XXXXXXXXXXXXXXXXX. See Section 7 for additional information regarding the use
and size of PG&E’s Bank.
4 Project Development Status Update
In Appendix B, PG&E provides an update on the development of RPS-eligible
resources currently under contract but not yet delivering energy. The table in
Appendix B updates key project development status indicators provided by
counterparties and is current as of June 17, 2015.19 These key project development
status indicators help PG&E to determine if a project will meet its contractual milestones
and identify impacts on PG&E’s renewable procurement position and procurement
decisions.
Within PG&E’s active portfolio,20 there are 107 RPS-eligible projects that were
executed after 2002. Seventy-six of these contracts have achieved full commercial
operation and started the delivery term under their PPAs. Thirty-one contracts have not
started the delivery term under their PPAs. Of the 31 contracts that have not started the
delivery term under their PPAs with PG&E: 18 have not yet started construction;
19 Appendix B includes PPAs procured through the RAM and PV Programs, but does not
include small renewable FIT PPAs. PG&E currently has 72 executed Assembly Bill (“AB”) 1969 PPAs in its portfolio and 29 ReMAT PPAs, totaling 104 MW of capacity. These small renewable FIT projects are in various stages of development, with 60 already delivering to PG&E under an AB 1969 PPA and 11 delivering to PG&E under a ReMAT PPA. Information on these programs is available at http://www.pge.com/feedintariffs/.
20 PG&E’s active portfolio includes RPS-eligible projects that were executed (but not terminated or expired) and CPUC-approved as of June 17, 2015, not including amended post-2002 QF contracts, contracts for the sale of bundled renewable energy and green attributes by PG&E to third parties, Utility-Owned Generation (“UOG”) projects, or FIT projects.
21
five have started construction but are not yet online; and eight are delivering energy, but
have not yet started the delivery term under their PPAs. Based on historic experience,
projects that have commenced construction are generally more viable than projects in
the pre-construction phase, although PG&E expects most of the pre-construction
projects currently in its portfolio to achieve commercial operation under their PPA.
5 Potential Compliance Delays
Through the considerable experience it has gained over the past decade of RPS
procurement, PG&E is familiar with the obstacles confronting renewable energy
developers. These include securing financing, siting and permitting projects, expanding
transmission capacity, and interconnecting projects to the grid. At both the federal and
state levels, new programs and measures continue to be implemented to address these
issues. However, even with these efforts, challenges remain that could ultimately
impact PG&E’s ability to meet California’s RPS goals. Moreover, operational issues,
such as curtailment, may impact PG&E’s RPS compliance. This section describes the
most significant RPS compliance risks and some of the steps PG&E is taking to
mitigate them.21
5.1 Project Financing
The financing environment for solar PV and wind projects continues to be
healthy, with access to low-cost capital and a variety of ownership structures for project
developers. However, for renewable technologies that are less proven, less viable, or
reflect a higher risk profile, the financing environment is more constrained, with higher
costs of capital and fewer participants willing to lend or invest.
21 This section is not intended to provide a detailed justification for an enforcement waiver or a
reduction in the portfolio content requirements pursuant to Sections 399.15(b)(5) or 399.16(e). To the extent that PG&E finds that it must seek such a waiver or portfolio balance reduction in the future, it reserves the right to set forth a more complete statement, based upon the facts as they appear in the future, in the form of a petition or as an affirmative defense to any action by the Commission to enforce the RPS compliance requirements.

22
Federal and state incentives such as the PTC and ITC continue to fuel
renewable growth in California. In 2015, the Internal Revenue Service extended the
applicable dates for the “beginning of construction” guidance for PTC-eligible facilities to
January 1, 2015, and the “placed in service” date to January 1, 2017.22 This allows the
PTC or ITC tax benefits for non-solar facilities to continue well beyond 2014. Solar
energy facilities continue to be eligible for a 30% ITC if they are placed in service by
December 31, 2016.23 The five-year and seven-year Modified Accelerated Cost
Recovery System (“MACRS”) allows for accelerated tax depreciation deductions to
renewable tangible property.24 These tax incentives and the MACRS depreciation
deductions enable businesses to reduce their tax liability and accelerate the rate of
return on renewable investments. They also provide a workable framework for projects
to negotiate financing. As a result, tax incentives have spurred significant investment in
renewable energy and generally amount to between 35 and 60 cents per dollar (“¢/$”) of
capital cost.
Tax equity remains a core financing tool for renewable developments, and
ownership structures such as Master Limited Partnerships and Yield Cos are also being
utilized as project sponsors market and investors competitively shop for solar and wind
investments. These structures allow developers who cannot use tax benefits efficiently
to barter the benefits to large corporations or investors in exchange for cash infusions
for their projects. At this time, tax incentive structures after 2016 are unknown. The
22 Notice 2015-252025 allows a taxpayer to claim a PTC under Section 45 of the Internal
Revenue Code (“IRC”), or a 30% ITC under Section 48 (ITC) in lieu of the PTC, for eligible facilities such as wind, geothermal, biomass, marine, landfill gas, and hydro, if the facility began construction before January 1, 2015 or was placed in service by January 1, 2017.
23 Section 48 of the IRC allows for a tax credit equal to 30% of project’s qualifying costs for certain types of commercial energy projects, including solar, geothermal, fuel cells, and small wind projects, and a 10% tax credit for geothermal, micro turbines and combined heat and power. The tax credit is realized in the year that the project is placed in service.
24 MACRS provides for a five-year tax cost recovery period for renewable solar, wind, geothermal, fuel cells and combined heat and power tangible property. Certain biomass property is eligible for a seven-year tax cost recovery period under MACRS.

23
PTC and 30% ITC incentives end in 2016. Unless the tax code is modified or extended,
the renewable energy ITC will drop to 10% after December 31, 2016. However, there
are efforts underway to extend or modify the PTC and ITC.25 Despite the uncertainty
surrounding renewable energy project tax incentives, PG&E believes there are
indications that healthy trends for renewable project financing will continue.
5.2 Siting and Permitting
PG&E works with various stakeholder groups toward finding solutions for
environmental siting and permitting issues faced by renewable energy development.
For example, PG&E works collaboratively with environmental groups, renewable energy
developers and other stakeholders to encourage sound policies through a Renewable
Energy Working Group, an informal and diverse group working to protect ecosystems,
landscapes and species, while supporting the timely development of energy resources
in the California desert and other suitable locations. Long-term and comprehensive
planning and permitting processes can help better inform and facilitate renewable
development.
PG&E is hopeful that these and other efforts will establish clear requirements
that developers and other interested parties can satisfy in advance of the submission of
offers to PG&E’s future solicitations, and will, as a result, help decrease the time it takes
parties to site and permit projects while ensuring environmental integrity.
25 H.R. 2412 would extend the renewable energy ITC for a period of five years for eligible
renewable solar, small wind energy, fuel cell, micro turbine, thermal energy and combined heat and power system properties that begin construction before January 1, 2022.
In addition, in its proposed budget for fiscal year 2016, the Obama administration proposes to modify and permanently extend the renewable PTC and ITC. For facilities that begin construction in 2016 or later, the proposal would make the PTC permanent and refundable. Solar facilities that qualify for the ITC would be eligible to claim the PTC. The proposal would also permanently extend the ITC at the 30 percent credit level, which is currently scheduled to expire for properties placed in service after December 31, 2016, and it would make permanent the election to claim the ITC in lieu of the PTC for qualified facilities eligible for the PTC.

24
Permitting challenges for projects are improving as a result of these and other
efforts to streamline and adjust the permitting process for renewable energy projects.
While these improvement efforts are ongoing, permitting and siting hurdles remain for
renewables projects. Common issues may include challenges related to farmland
designation and Williamson Act contracts, tribal and cultural resources areas, protected
species, and county-imposed moratoriums. These hurdles may impact development
schedules for projects.
5.3 Transmission and Interconnection
Achieving timely interconnection is an important part of the project development
process. Delays in achieving interconnection can occur for various reasons, including
the delay of substation construction, permitting issues, telecommunications delays, or
overly aggressive timeline assumptions. While delays in interconnection can lead to
delays in project development, such delays to date have not had a major impact on
PG&E’s ability to meet its RPS procurement targets.
Over the past few years, the CAISO and the IOUs have seen significant
increases in the number of requests for grid interconnection. As the number of
proposed RPS-eligible projects continues to increase in California, planning for how
these projects would be connecting into the California grid has become increasingly
challenging. The growth in these requests has, in turn, extended estimated project
development timelines, which creates a significant barrier to financing projects
endeavoring to come online within tight contractual milestone dates. Similarly, the
growth in interconnection requests has made it difficult to estimate reliable
interconnection study results and to identify necessary transmission build-outs.
Accordingly, PG&E has initiated a number of internal efforts and collaborated on
external initiatives to address these challenges at both the transmission and distribution
levels. Recent notable changes in the distribution-level interconnection process
included: (1) amending the Wholesale Distribution Tariff in October 2014 to address

25
modifications similar to those made to the CAISO’s Tariff; and (2) amending Rule 21 in
January 2015 to capture the technological advances offered by smart inverters.
Additionally, over the past few years, PG&E has worked with the CAISO and
industry stakeholders in ongoing stakeholder initiatives enhancing the transmission-
level interconnection processes. Most significant among the changes has been the
Generator Interconnection and Deliverability Allocation Procedures, which has
streamlined the process for identifying customer-funded transmission additions and
upgrades under a single comprehensive process. This initiative also provides
incentives for renewable energy developers to interconnect to the CAISO grid at the
most cost-effective locations. PG&E has also actively contributed to the CAISO’s
Interconnection Process Enhancements stakeholder initiative that seeks to continuously
review potential enhancements to the generator interconnection procedures.
Finally, at the intersection of transmission-level and distribution-level
interconnections, is the Distributed Generation Deliverability (“DGD”) process. In 2013,
PG&E collaborated extensively with the CAISO to implement the first annual cycle, and
the second and third cycles were successfully completed in 2014 and 2015,
respectively. Under the DGD Program, the CAISO conducts an annual study to identify
MW amounts of available deliverability at transmission nodes on the CAISO-controlled
grid. Based on the deliverability assessment results, distributed generation facilities that
are located or seeking interconnection at nodes with identified available deliverability
may apply to the appropriate Participating Transmission Owner (“PTO”) to receive an
assignment of deliverability for Resource Adequacy (“RA”) counting purposes.
5.4 Curtailment of RPS Generating Resources
As discussed in more detail in Section 11, if RPS curtailed volumes increase
substantially due to CAISO market or reliability conditions, curtailment may present an
RPS compliance challenge. In order to better address this challenge, PG&E’s
stochastic model incorporates estimated levels of curtailment, which enables PG&E to
plan for appropriate levels of RPS procurement to meet RPS compliance even when

26
volumes are curtailed. Additional detail on these assumptions is provided in
Section 6.2.
5.5 Risk-Adjusted Analysis
PG&E employs both a deterministic and stochastic approach to quantifying its
remaining need for incremental renewable volumes. As described further in Section 6,
deliveries from projects experiencing considerable development challenges associated
with project financing, permitting, transmission and interconnection, among others, are
excluded from PG&E’s net short calculation.
PG&E’s experience with prior solicitations is that developers often experience
difficulties managing some of the development issues described above. As described in
Section 8, PG&E’s current expected RPS need calculation incorporates a minimum
margin of procurement to account for some anticipated project failure and delays in
PG&E’s existing portfolio, which are captured in PG&E’s deterministic model. These
deterministic results are time-sensitive and do not account for all of the risks and
uncertainties that can cause substantial swings in PG&E’s portfolio.
While it has made reasonable efforts to minimize risks of project delays or
failures in an effort to comply with the 33% RPS Program procurement targets, PG&E
cannot predict with certainty the circumstances—or the magnitude of the
circumstances—that may arise in the future affecting the renewables market or
individual project performance.
6 Risk Assessment
Dynamic risks, such as the factors discussed in Section 5 that could lead to
potential compliance delays, directly affect PG&E’s ability to plan for and meet
compliance with the RPS requirements. To account for these and additional
uncertainties in future procurement, PG&E models the demand-side risk of retail sales
variability and the supply-side risks of generation variability, project failure, curtailment,
and project delays in quantitative analyses.
27
Specifically, PG&E uses two approaches to modeling risk: (1) a deterministic
model; and (2) a stochastic model. The deterministic model tracks the expected values
of PG&E’s RPS target and deliveries to calculate a “physical net short,” which
represents a point-estimate forecast of PG&E’s RPS position and constitutes a
reasonable minimum margin of procurement, as required by the RPS statute. These
deterministic results serve as the primary inputs into the stochastic model. The
stochastic model26 accounts for additional compounded and interactive effects of
various uncertain variables on PG&E’s portfolio to suggest a procurement strategy at
least cost within a designated level of non-compliance risk. The stochastic model
provides target procurement volumes for each compliance period, which result in a
designated Bank size for each compliance period. The Bank is then primarily utilized as
Voluntary Margin of Procurement or VMOP to mitigate dynamic risks and uncertainties
and ensure compliance with the RPS.
This section describes in more detail PG&E’s two approaches to risk mitigation
and the specific risks modeled in each approach. Section 6.1 identifies the three risks
accounted for in PG&E’s deterministic model. Section 6.2 outlines the four additional
risks accounted for in PG&E’s stochastic model. Section 6.3 describes how the risks
described in the first two sections are incorporated into both models, including details
about how each model operates and the additional boundaries each sets on the risks.
Section 6.4 notes how the two models help guide PG&E’s optimization strategy and
26 The stochastic model specifically employs both Monte Carlo simulation of risks and genetic
algorithm optimization of procurement amounts. A Monte Carlo simulation is a computational algorithm commonly used to account for uncertainty in quantitative analysis and decision making. A Monte Carlo simulation provides a range of possible outcomes, the probabilities that they will occur and the distributions of possible outcome values. A genetic algorithm is a problem-solving process that mimics natural selection. That is, a range of inputs to an optimization problem are tried, one-by-one, in a way that moves the problem’s solution in the desired direction—higher or lower—while meeting all constraints. Over successive iterations, the model “evolves” toward an optimal solution within the given constraints. In the case of PG&E’s stochastic model, a genetic algorithm is employed to conduct a first-order optimization to ensure compliance at the identified risk threshold while minimizing cost.

28
procurement need. Section 7 discusses the results for both the deterministic and
stochastic models and introduces the physical and optimized net short calculations
presented in Appendices C.2a and C.2b. Section 8 addresses PG&E’s approach to the
statutory minimum and voluntary margins of procurement.
6.1 Risks Accounted for in Deterministic Model
PG&E’s deterministic approach models three key risks:
1) Standard Generation Variability: the assumed level of deliveries for categories of online RPS projects.
2) Project Failure: the determination of whether or not the contractual deliveries associated with a project in development should be excluded entirely from the forecast because of the project’s relatively high risk of failure or delay.
3) Project Delay: the monitoring and adjustment of project start dates based on information provided by the counterparty (as long as deliveries commence within the allowed delay provisions in the contract).
The table below shows the methodology used to calculate each of these risks,
and to which category of projects in PG&E’s portfolio the risks apply. More detailed
descriptions of each risk are described in the subsections below.

29
TABLE 6-1 PACIFIC GAS AND ELECTRIC COMPANY
DETERMINISTIC MODEL RISKS
RISK METHODOLOGY APPLIES TO
Standard Generation Variability
For non-QF projects executed post-2002, 100% of contracted volumes
For non-hydro QFs, typically based on an average of the three most recent calendar year deliveries
Hydro QFs, UOG and IDWA generation projections are updated to reflect the most recent hydro forecast.
Online Projects
Project Failure
In Development projects with high likelihood of failure are labeled “OFF” (0% deliveries assumption)
All other In Development projects are “ON” (assume 100% of contracted delivery)
In Development Projects
Project Delay Professional judgment / /Communication with counterparties
Under Construction Projects / Under Development Projects / Approved Mandated Programs
6.1.1 Standard Generation Variability
With respect to its operating projects, PG&E’s forecast is divided into
three categories: non-Qualifying Facilities (“QF”); non-hydro QFs; and hydro projects.
The forecast for non-QF projects is based on contracted volumes. The forecast for
non-hydro QFs is based on the average of the three most recent calendar year
deliveries. The forecast for hydro QFs is typically based on historical production,
calendar year deliveries, and regularly updated with PG&E’s latest internal hydro
updates. The UOG and Irrigation District and Water Agency (“IDWA”) forecast is based
on PG&E’s latest internal hydro updates. Future years’ hydro forecasts assume
average water year production. These assumptions are included in this RPS Plan as
Appendix G.
6.1.2 Project Failure
To account for the development risks associated with securing project siting,
permitting, transmission, interconnection, and project financing, PG&E uses the data

30
collected through PG&E’s project monitoring activities in combination with best
professional judgment to determine a given project’s failure risk profile. PG&E
categorizes its portfolio of contracts for renewable projects into two risk categories:
OFF (represented with 0% deliveries) and ON (represented with 100% deliveries). This
approach reflects the reality of how a project reaches full development; either all of the
generation from the project comes online, or none of the generation comes online.
1. OFF/Closely Watched – PG&E excludes deliveries from the “Closely Watched”
projects in its portfolio when forecasting expected incremental need for renewable
volumes. “Closely Watched” represents deliveries from projects experiencing
considerable development challenges as well as once-operational projects that
have ceased delivering and are unlikely to restart. In reviewing project development
monitoring reports, and applying their best professional judgment, PG&E managers
may consider the following factors when deciding whether to categorize a project as
“Closely Watched”:
Actual failure to meet significant contractual milestones (e.g., guaranteed construction start date, guaranteed commercial operation date, etc.).
Anticipated failure to meet significant contractual milestones due to the project’s financing, permitting, and/or interconnection progress or to other challenges (as informed by project developers, permitting agencies, status of CAISO transmission studies or upgrades, expected interconnection timelines, and/or other sources of project development status data).
Significant regulatory contract approval delays (e.g., 12 months or more after filing) with no clear indication of eventual authorization.
Developer’s statement that an amendment to the PPA is necessary in order to preserve the project’s commercial viability.
Whether a PPA amendment has been executed but has not yet received regulatory approval.
Knowledge that a plant has ceased operation or plant owner/operator’s statement that a project is expected to cease operations.

31
Final forecasting assessments are project-specific and PG&E does not consider the
criteria described above to be exclusive, exhaustive, or the sole criteria used to
categorize a project as “Closely Watched.”27
2. ON – Projects in all other categories are assumed to deliver 100% of contracted
generation over their respective terms. There are three main categories of these
projects. The first category, which denotes projects that have achieved commercial
operation or have officially begun construction, represents the majority of “ON”
projects. Based on empirical experience and industry benchmarking, PG&E
estimates that this population is highly likely to deliver. The second category of
“ON” projects is comprised of those that are in development and are progressing
with pre-construction development activities without foreseeable and significant
delays. The third category of “ON” projects represents executed and future
contracts from CPUC-mandated programs. While there may be some risk to
specific projects being successful, because these volumes are mandated, the
expectation is that PG&E will replace failed volumes with replacement projects
within a reasonable timeline.
6.1.3 Project Delay
Because significant project delays can impact the RNS, PG&E regularly
monitors and updates the development status of RPS-eligible projects from PPA
execution until commercial operation. Through periodic reporting, site visits,
communication with counterparties, and other monitoring activities, PG&E tracks the
progress of projects towards completion of major project milestones and develops
estimates for the construction start (if applicable) and commercial operation of projects.
27 For instance, PG&E may elect to count deliveries from projects that meet one or more of
the criteria if it determines, based on its professional judgment, that the magnitude of challenges faced by the projects do not warrant exclusion from the deterministic forecast. Similarly, the evaluation criteria employed by PG&E could evolve as the nature of challenges faced by the renewable energy industry, or specific sectors of it, change.

32
6.2 Risks Accounted for in Stochastic Model
The risk factors outlined in the deterministic model are inherently dynamic
conditions that do not fully capture all of the risks affecting PG&E’s RPS position.
Therefore, PG&E has developed a stochastic model to better account for the
compounded and interactive effects of various uncertain variables on PG&E’s portfolio.
PG&E’s stochastic model assesses the impact of both demand- and-supply-side
variables on PG&E’s RPS position from the following four categories:
1) Retail Sales Variability: This demand-side variable is one of the largest drivers of
PG&E’s RPS position.
2) Project Failure Variability: Considers additional project failure potential beyond
the “on-off” approach in the deterministic model.
3) Curtailment: Considers buyer-ordered (economic), CAISO-ordered or
PTO-ordered curtailment.
4) RPS Generation Variability: Considers additional RPS generation variability
above and beyond the small percentages in the deterministic model.
When considering the impacts that these variables can have on its RPS position,
PG&E organizes the impacts into two categories: (1) persistent across years; and
(2) short-term (e.g., effects limited to an individual year and not highly correlated from
year-to-year). Table 6-2 below lists the impacts by category, while showing the size of
each variable’s overall impact on PG&E’s RPS position.

33
TABLE 6-2 PACIFIC GAS AND ELECTRIC COMPANY
CATEGORIZATION OF IMPACTS ON RPS POSITION
Impact Categorization
1. Retail Sales Variability:
Changes in retail sales tend to persist beyond the current year (e.g., economic growth, EE, CCA and DA, and distributed generation impacts).
Variable and persistent
(If an outcome occurs, the effect persists through more than one year).
2. RPS Generation Variability:
Variability in yearly generation is largely an annual phenomenon that has little persistence across time.
Variable and short-term
(If an outcome occurs, the effect may only occur for the individual year.)
3. Curtailment:
Impact increases with higher penetration of renewables and will be persistent.
Variable and persistent
4. Project Failure Variability: Lost volume from project failure persists through more than one year.
Variable and persistent
6.2.1 Retail Sales Variability
PG&E’s retail sales are impacted by factors such as weather, economic growth
or recession, technological change, EE, levels of DA and CCA participation, and
distributed generation. PG&E generates a distribution of the bundled retail sales for
each year using a model that simulates thousands of possible bundled load scenarios.
Each scenario is based on regression models for load in each end use sector as a
function of weather and economic conditions with consideration of future policy impacts
on EE, electric vehicles, and distributed generation. However, the variability in load loss
due to DA and CCA is not modeled in this same way. As load loss due to DA is
currently capped by California statute and cannot be expanded without additional
legislation, PG&E is not forecasting substantial increases in DA. Load loss due to CCA
departure is modeled as an expected value based on an increased forecast of CCA
departure. Because forecast errors tend to carry forward into future years, the
cumulative impact of load forecast variability grows with time. Appendix F.1 lists the
resulting simulated retail sales and summary statistics for the period 2015-2030.
Higher Impact on RPS Position
Lower Impact on RPS Position

34
Appendices F.5a and F.5b show the resulting simulated RPS target when accounting
for the retail sales variability for the period 2015-2030 in the 33% and 40% RPS,
respectively.
6.2.2 RPS Generation Variability
Based on analysis of historical hydro generation data from XXXXXXX, wind
generation data from XXXXXXX, and generation data from solar and other technologies
where available, PG&E estimated a historical annual variability measured by the
coefficient of variation of each resource type. XXXXXXXXXXXXXXXXXXXXXXXXXXX
XXXXXXXXXXXXXXXXXXXXXXXXXXXXXXXXXXXXXXXXXXXXXXXXXXXXXXXXXX
XXXXXXXXXXXXXXXXXXXXXXXXXXXX Due to significant variability in annual
precipitation, small hydro demonstrates the largest annual variability (coefficient of
variation of XXX). The remaining resource types range in annual variability from XX for
biomass and geothermal, XX for solar PV and solar thermal to XX for wind.
Collectively, technology diversity helps to reduce the overall variation, because
variability around the mean is essentially uncorrelated among technologies.
Appendices F.3a and F.3b list the resulting simulated generation and summary statistics
for the period 2015-2030 in the 33% and 40% RPS, respectively.
To better understand the wide range of variability of the above risks and thus,
the need for a stochastic model to optimize PG&E’s procurement volumes,
Appendices F.4a and F.4b, combine the Project Failure and RPS Generation Variability
factors into a “total deliveries” probability distribution, shows how these variables
interact in the 33% and 40% RPS, respectively.
6.2.3 Curtailment
The stochastic model also estimates the potential for RPS curtailment.
Curtailment can result from either buyer-ordered (economic), CAISO-ordered or
PTO-ordered curtailment (the latter two driven by system stability issues, not
economics). XXXXXXXXXXXXXXXXXXXXXXXXXXXXXXXXXXXXXXXXXXXXXXXXX
XXXXXXXXXXXXXXXXXXXXXXXXXXXXXXXXXXXXXXXXXXXXXXXX

35
XXXXXXXXXXXXXXXXXXXXXXXXXXXXXXXXXXXXXXXXXXXXXXXXXXXXXXXXX
XXXXXXXXXXXXXXXXXXXXXXXXXXXXXXXXXXXXXXXXXXXXXXXXXXXXXXXXX
XXXXXXXXXXXXXXXXXXXXXXXXXXXXXXXXXXXXXXXXXXXXXXXXXXXXXXXX
XXXXXXXXXXXXXXXXXXXXXXXXXXXXXXXXXXXXXXXXXXXXXXXXXXXXXXXXXX
XXXXXXXXXXXXXXXXXXXXXXXXXXXXXXXXXXXXXXXXXXXXXXXXXXXXXXXX
XXXXXXXXXXXXXXXXXXXXXXXXXXXXXXXXXXXXXXXXXXXXXXXXXXXXX28
These modeling assumptions will not necessarily align with the actual number of
curtailment hours, but are helpful in terms of considering the impact of curtailment on
long-term RPS planning and compliance. Please see Section 11 for more information
regarding curtailment.
6.2.4 Project Failure Variability
To model the project failure variability inherent in project development, PG&E
assumes that project viability for a yet-to-be-built project is a function of the number of
years until its contract start date. That is, a new project scheduled to commence
deliveries to PG&E next year is considered more likely to be successful than a project
scheduled to begin deliveries at a much later date. The underlying assumption is that
both PG&E and the counterparty know more about a project’s likelihood of success the
closer the project is to its initial delivery date, and the counterparty may seek to amend
or terminate a non-viable project before it breaches the PPA. Working from this
assumption, PG&E assigns a probability of project success for new, yet-to-be-built
projects equal to XXXXXXXXXXXXXXXXXXXXXXXXXXXXXXXXXXXXXXXXXXXXX
XXXXXXXXX. For example, a project scheduled to come online in five years or more is
assumed to have a XXXXXXXXXXXXXXXXXXX chance of success. This success rate
28 XXXXXXXXXXXXXXXXXXXXXXXXXXXXXXXXXXXXXXXXXXXXXXXXXXXXXXXXXXXX
XXXXXXXX XXXXXXXXXXXXXXXXXXXXXXXXXXXXXXXXXXXXXXXXXXXXXXXXXXXXXXXXXXXXXXX XXXXXXXXXXXXXXXXXXXXXXXXXXXXXXXXXXXXXXXXXXXXXXXXXXXXXXXXXXXX XX
36
is based on experience and is reflective of higher project development success rates of
PG&E’s RPS portfolio in more recent years.
Although PG&E’s current existing portfolio of projects may have higher rates of
success, the actual success rate for projects in the long-term may be higher or lower.
Projects that are re-contracted, in contrast, are modeled at a XXXX success rate.
Appendices F.2a and F.2b list PG&E’s simulated failure rate and summary statistics for
the period 2015-2030 in the 33% and 40% RPS, respectively.
6.2.5 Comparison of Model Assumptions
Table 6-3 below shows a comparison of how PG&E’s deterministic and
stochastic models each handle uncertainty with regard to retail sales, project failure,
RPS generation, and curtailment. Section 7 provides a more detailed summary of the
results from PG&E’s deterministic and stochastic modeling approaches.

37
TABLE 6-3 COMPARISON OF UNCERTAINTY ASSUMPTIONS
BETWEEN PG&E’S DETERMINISTIC AND STOCHASTIC MODELS
Uncertainty Deterministic Model Stochastic Model
1) Retail Sales Variability
Uses most recent PG&E bundled retail sales forecast for next 5 years and 2014 LTPP for later years
Distribution based on most recent (2015) PG&E bundled retail sales forecast.
2) Project Failure Variability
Only turns “off” projects with high likelihood of failure per criteria. “On” projects assumed to deliver at Contract Quantity.
Uses XXXXXXXXXXXXXXXXXXXXXXXXXXXXXXXXXXXXXXXXXXXXXXXXXXXXXXXXXX XXXXXXXXXXXXX to model a success rate for all “on” yet-to-be-built projects in the deterministic model. Thus, for a project scheduled to come online in 5 years, the project success rate is XXXXXXXXXX. This success rate is based on PG&E’s experience that the further ahead in the future a project is scheduled to come online, the lower the likelihood of project success. Re-contracted projects are assumed to have a XXXX success rate.
3) RPS Generation Variability
Non-QF projects executed post-2002, 100% of contracted volumes For non-hydro QFs, typically based on an average of the three most recent calendar year deliveries Hydro QFs, UOG and IDWA generation projections are updated to reflect the most recent hydro forecast.
Hydro: XXX annual variation
Wind: XX annual variation
Solar: XX annual variation
Biomass and Geothermal: XX annual variation
4) None 33% RPS Target: XX of RPS requirement

38
Curtailment29 40% RPS Scenario: XX of RPS requirement through 2021, increasing to XXX in 2024 and beyond.
6.3 How Deterministic Approach Is Modeled
The deterministic model is a snapshot in time of PG&E’s current and forecasted
RPS position and procurement need. The deterministic model relies on currently
available generation data for executed online and in development RPS projects as well
as PG&E’s most recent bundled retail sales forecast. The results from the deterministic
model determine PG&E’s “physical net short,” which represents the best current point-
estimate forecast of PG&E’s RPS position today. The deterministic model should not
be seen as a static target because the inputs are updated as new information is
received.
6.4 How Stochastic Approach Is Modeled
The stochastic model adds rigor to the risk-adjustment embedded in the
deterministic model—using Monte Carlo simulation—and optimizes its results to
achieve the lowest cost possible given a specified risk of non-compliance and the
stochastic model’s constraints.
The methodology for the stochastic model is as follows:
1) Create an optimization problem by establishing the (a) objectives, (b) inputs, and
(c) constraints of the model.
a. The objective is to minimize procurement cost.
b. The inputs are a range of potential incremental RPS-eligible deliveries (new and re-contracted volumes30) in each year of the XXXXXXX timeframe. The potential incremental procurement is restricted to a range of no less than zero
29 These modeling assumptions will not necessarily align with the actual number of
curtailment hours, but are helpful in terms of considering the impact of curtailment on long-term RPS planning and compliance.
30 Although the physical net short calculations do not include any assumptions related to the re-contracting of expiring RPS-eligible contracts, the stochastic model can also re-contract volumes to meet procurement need. Such re-contracting amounts are illustrative only and not prescriptive.

39
and no more than XXXX GWh, which is in addition to volumes available for re-contracting.31
c. The constraints are: (1) to keep PG&E’s risk of non-compliance to less than XX XXXXXXXXXXXXXXXXXXXXXXXXXXXXXXXXXXX; and (2) to restrict PG&E’s Bank over time to the size necessary to meet compliance objectives within the specified risk threshold.
2) The stochastic model then solves the optimization problem by examining thousands
of combinations of procurement need in each year. For each of these
combinations, the model runs hundreds of iterations as part of its Monte Carlo
simulation of uncertainty for each of the risk factors in the stochastic model to test if
the constraints are met. If the solution for that combination of inputs fits within the
given constraints, it is a valid outcome.
3) For each valid outcome, the mean Net Present Value (“NPV”) cost of meeting that
procurement need is calculated based on PG&E’s RPS forward price curve.
4) Finally, the model sorts the NPV of the potential procurement outcomes from
smallest to largest, thus showing the optimal RPS-eligible deliveries needed in the
years XXXXXXXXXXXXXXX to ensure compliance based on the modeled
assumptions.
The modeled solution becomes a critical input into PG&E’s overall RPS
optimization strategy, but the outputs are subject to further analysis based upon best
professional judgment to determine whether factors outside the model could lead to
better outcomes. For example, the model does not currently consider speculating on
price volatility through sales of PG&E’s Bank in the near-term and additional
incremental procurement in the long-term. Nor does the model consider the opposite
strategy of advance procurement of RPS-eligible products in 2015 for purposes of
reselling those products in the future at a profit. As a general matter, PG&E does not
31 PG&E limited modeling to a maximum addition of XXXX GWh per year in order to avoid
modeling outcomes that required “lumpy” procurement patterns. Large swings in annual procurement targets could lead to boom/bust development cycles and could expose PG&E’s customers to additional price volatility risk.

40
approach RPS procurement and compliance as a speculative enterprise and so has not
modeled or otherwise proposed such strategies in this Plan. However, PG&E will
consider selling surplus non-bankable RPS volumes in its portfolio and, in doing so,
may seek to sell surplus bankable volumes if it can still maintain an adequate Bank and
if market conditions are favorable.
6.5 Incorporation of the Above Risks in the Two Models Informs Procurement Need and Sales Opportunities
Incorporating inputs from the deterministic model, the stochastic model provides
results that lead to a forecasted procurement need or SONS, expected Bank usage and
thus an anticipated Bank size, for each compliance period. The SONS for the 33% and
40% RPS are shown in Row La of PG&E’s Alternate RNS in Appendices C.2a
and C.2b.
The stochastic model does not provide guidance on potential sales of excess
banked procurement at this time. However, as PG&E encounters economic
opportunities to sell volumes, PG&E will use the stochastic model to help evaluate
whether the proposed sale will increase the cumulative non-compliance risk for
XXXXXXXXXXXXXXX above the XX threshold.
The results of both the deterministic and stochastic models are discussed further
in Section 7 and minimum margin of procurement is addressed in Section 8.
7 Quantitative Information
As discussed in Section 6, PG&E’s objectives for this RPS Plan are to both
achieve and maintain RPS compliance and to minimize customer cost within an
acceptable level of risk. To do that, PG&E uses both deterministic and stochastic
models. This section provides details on the results of both models and references
RNS tables provided in Appendix C. Appendices C.1a and C.1b presents the RNS in
the form required by the Administrative Law Judge’s Ruling on Renewable Net Short
issued May 21, 2014 in R.11-05-005 (“ALJ RNS Ruling”) and includes results from
PG&E’s deterministic model only, while Appendices C.2a and C.2b are a modified
41
version of Appendices C.1a and C.1b to present results from both PG&E’s deterministic
and stochastic models. These modifications to the table are necessary in order for
PG&E to adequately show its results from its stochastic optimization.
This section includes a discussion of PG&E’s forecast of its bank size and
PG&E’s analysis of the minimum bank needed. However, in approving the 2015 RPS
Plan, the Commission expressly rejected any specific bank size proposal and instead
indicated that proposals regarding bank size should be considered in SB 350’s
implementation.
7.1 Deterministic Model Results
Results from the deterministic model under the 33% RPS target are shown as
the physical net short in Row Ga of Appendices C.1a and C.2a, while the results from
the deterministic model under the 40% RPS scenario are shown as the physical net
short in Row Ga of Appendices C.1b and C.2b. Appendices C.1a and C.1b provide a
physical net short calculation using PG&E’s Bundled Retail Sales Forecast for years
2015-2019 and the LTPP sales forecast for 2020-2035, while Appendices C.2a
and C.2b rely exclusively on PG&E’s internal Bundled Retail Sales Forecast. Following
the methodology described in Section 6.1, PG&E currently estimates a long-term
volumetric success rate of approximately 99% for its portfolio of
executed-but-not-operational projects. The annual forecast failure rate used to
determine the long-term volumetric success rate is shown in Row Fbb of
Appendices C.2a and C.2b. This success rate is a snapshot in time and is also
impacted by current conditions in the renewable energy industry, discussed in more
detail in Section 5, as well as project-specific conditions. In addition to the current
long-term volumetric success rate, Rows Ga and Gb of Appendices C.2a and C.2b
depict PG&E’s expected compliance position using the current expected need scenario
before application of the Bank.

42
7.1.1 33% RPS Target Results
Under the current 33% RPS target, PG&E is well-positioned to meet its second
(2014-2016) and third (2017-2020) compliance period RPS requirements. As shown in
Row Gb of Appendix C.1b, the deterministic model shows a forecasted second
compliance period RPS Position of 30.3% and a third compliance period RPS position
of XXXX. Row Ga of Appendix C.2a also shows a physical net short of approximately
500 GWh beginning in 2022.
7.1.2 40% RPS Scenario Results
Under a 40% RPS scenario, PG&E is forecasted to meet its second (2014-2016)
and third (2017-2020) compliance period RPS requirements. As shown in Row Gb of
Appendix C.2b, PG&E has a forecasted second compliance period RPS Position
of 30.3% and a third compliance period RPS position of XXXX. Row Ga of
Appendix C.2b shows a physical net short of approximately 3,000 GWh beginning
in 2022.
7.2 Stochastic Model Results
This subsection describes the results from the stochastic model and the SONS
calculation for both the current 33% RPS target and a 40% RPS scenario. All
assumptions and caveats stated in the discussion of the 33% RPS target results apply
to the 40% RPS scenario results, unless otherwise stated. However, note that the
40% RPS scenario results apply to this particular RPS scenario only, and PG&E’s
optimization strategy may differ under other scenarios that have a different RPS target
or timeline. Because PG&E uses its stochastic model to inform its RPS procurement,
PG&E has created an Alternate RNS in Appendix C.2a for the current 33% RPS target
and Appendix C.2b for the 40% RPS scenario. Appendices C.1a and C.1b provide an
incomplete representation of PG&E’s optimized net short, as the formulas embedded in
the RNS form required by the ALJ RNS Ruling do not enable PG&E to capture its
stochastic modeling inputs and outputs. In Appendices C.2a and C.2b, two additional
rows have been added. Rows Gd and Ge show the stochastically-adjusted net short

43
(“SANS”),, which incorporates the risks and uncertainties addressed in the stochastic
model. This is prior to any applications of the Bank, but includes additional procurement
needed for maintaining an optimized Bank size. Additionally, PG&E has modified the
calculations in Rows La and Lb in order to more accurately represent PG&E’s SONS.
7.2.1 Stochastically-Optimized Net Short to Meet Non-Compliance Risk Target ‒ 33% RPS Target
To evaluate possible procurement strategies, PG&E selected a cumulative
(XXXXXXXXXXXXXXX) non-compliance risk target of XX, which PG&E views as the
maximum reasonable level of non-compliance risk. Figure 7-1 shows the model’s
forecasted procurement need and resulting Bank usage under the current 33% RPS.
Under this projection, a portion of the Bank is used to meet PG&E’s compliance need
beginning in XXXX, the first year showing a stochastically-adjusted net short, and
continuing throughout the decade, while reserving a portion of the Bank to be
maintained as VMOP to manage risks discussed in Section 6. Appendix C.2a provides
the detailed results. Annual forecasted Bank usage is shown in Row Ia of this
Appendix. After accounting for Bank usage, the first year of incremental procurement
need is forecasted as XXXX. This compliance period need represents PG&E’s SONS,
which is detailed in Row La. The SONS for XXXX is approximately XXX GWh, which
increases to approximately XXXX GWh by 2030. The XXXX SONS is XXXXX than the
physical net short in Row Ga for XXXX, as the SONS
XXXXXXXXXXXXXXXXXXXXXXXXXXXXXXXXXXXXX
XXXXXXXXXXXXXXXXXXXXXXXXXXXXXXXXXXXXXXXXXXXXXXXXXXXXX.


45
7.2.2 Bank Size Forecasts and Results – 33% RPS Target
Figure 7-2 shows PG&E’s current and forecasted cumulative Bank from the first
compliance period through 2030. PG&E’s total Bank size as of the end of compliance
period is approximately 900 GWh, shown as existing Bank in Figure 7-2. The stochastic
model’s results currently project PG&E’s Bank size to XXXXXXXXXXXXXXXXXX
XXXXXXXXXXXXXXXXXXXXXXXXXXXXXXXXXXXXXXXXXXXXXXXXXXXXXXXXXX
XXXXXXXXXXXXXXXXXXXXXXXXXXXXXXXXXXXXXXXXXXX XXXXX GWh by
XXXXXXX (as shown in Figure 7-2, as well as in Appendix C.2a, Row J).
XXXXXXXXXXXXXXXXXXXXXXXXXXXXXXXXXXXXXXXXXXXXXXXXXXXXXXXX
XXXXXXXXXXXXXXXXXXXXXXXXXXXXXXXXXXXXXXXXXXXXXXXXXXXXXXXXXX
XXXXXXXXXXXXXXXXXXXXXXXXXXXXXXXXXXXXXXXXXXXXXXXXXXXXXXXXX
XXXXXXXXXXXXXXXXXXXXXXXXXXXXXXXXXXXXXXXXXXXXXXXXXXXXXXXXX
XXXXXXXXXXXXXXXXXXXXXXXXXXXXXXXXXXXXXXXXXXXXXXXXXXXXXXXXXX
XXXXXXXXXXXXXXXXXXXXXXXXXXXXXXXXXXXXXXXXXXXXXXXXXXXXXXXX
XXXXXXXXXXXXXXXXXXXXXXXXXXXXXXXXXXXXXXXXXXXXXXXXXXXXXXXX
XXXXXXX


47
In that situation, PG&E might not be able to avoid higher procurement costs due to the
potential for upward pressure on prices caused by the need for unplanned purchases.
7.2.3 Minimum Bank Size – 33% RPS Target
PG&E performed a simulation of variability in PG&E’s future generation and
RPS compliance targets over XXXXX years—i.e., the amount of the RPS generation
(“delivery”) net of RPS compliance targets (“target”)—and found that a Bank size of at
least XXXXXXXX is the minimum Bank necessary to maintain a cumulative non-
compliance risk of no greater than XX. The difference between delivery and target can
be thought of as the potential “need” (if negative) or “surplus” (if positive) that PG&E has
in any one year.
Figure 7-3 shows this distribution based on the deterministic procurement
necessary to meet the expected RPS targets with expected generation during
XXXXXXXXXXXXXXX. This time period was selected as it best represents a “steady
state” period when the Bank approaches a minimum level and moderate incremental
procurement is required to maintain compliance. Note that given the uncertainty around
the inputs in the stochastic model, without a Bank to accommodate such uncertainty,
the amount of RPS generation is almost as likely to miss the RPS target as exceed it.
One standard deviation over XXXXXXXXXXXXXXX is approximately XXXX GWh, as
indicated on Figure 7-3. That is, given this particular procurement scenario, about 68%
of the simulations have a difference that is up to plus or minus approximately
XXXX GWh.
However, this does not suggest that a Bank of XXX GWh would be adequate to
cover potential shortfalls over this XXXXX-year period. It would result in an
unacceptable non-compliance risk over XXXXXXXXXXXXXXX of approximately
XXXXX. Thus, PG&E must maintain a Bank size higher than this amount to limit the
risk of non-compliance to an acceptable level. Based on current model assumptions
and inputs, Figure 7-3 shows that approximately XX of the time, PG&E would have a
greater than XXXXXXSX GWh deficit in meeting compliance for XXXXXXXXXXXXXXX.

48
XXXXXXXX XXXXXXXXXXXXXXXXXXXXXXXXXXXXXXXXXXXXXXXXXXXXXXXXXXXXXXXXXXXXXXXXXX
XXXXXX


50
Because the model inputs change over time, estimates of the Bank size
resulting from the implementation of the procurement plan will also change. In practice,
the actual outcome will more likely be a mix of factors both detracting from and
contributing to meeting the target, which is what the probability distribution in Figure 7-3
illustrates.
7.2.4 Stochastically-Optimized Net Short to Meet Non-Compliance Risk Target ‒ 40% RPS Scenario
Figure 7-4 shows the model’s forecasted procurement need and recommended
Bank usage in the 40% RPS scenario. Under this projection, a portion of the Bank is
used to meet PG&E’s compliance need beginning in XXXXXXXXXXXXXXXXXXXXXX
XXXXXXXXXXXXX, while reserving a portion of the Bank to be maintained as VMOP to
manage risks discussed in Section 6. Appendix C.2b provides the detailed results.
Annual forecasted Bank usage can be seen in Row Ia of this Appendix. The first year of
procurement need is currently forecasted as XXXXXXX. This compliance period need
represents PG&E’s SONS, which is detailed in Row La. The SONS for XXXXXXX is
approximately XXXX GWh, which increases to approximately XXXXX GWh by
XXXXXXX. The XXXXXXX SONS is XXXXX than the physical net short shown in
Row Ga for XXXXXX
XXXXXXXXXXXXXXXXXXXXXXXXXXXXXXXXXXXXXXXXXXXXXXXXXXXXXX
XXXXXXXXXXXXXXXXX.


53
XXXXXXXXXXXXXXXXXXXXXXXXXXXXXXXXXXXXXXXXXXXXXXXXXXXXXXXXXXXXXXXXXXXXX XXXXXXXXXXXXXXXXXXXXXXXXXXXXXXXXXXXXXXXXXXXXXXXXXXXXXXX
7.2.6 Minimum Bank Size – 40% RPS Scenario
Using a similar approach as described in Section 7.2.3, under a 40% by 2024
scenario, a minimum Bank size of at least XXXXX GWh is necessary to maintain a
cumulative non-compliance risk of no greater than XX. The minimum Bank size in this
scenario is greater than the Bank required for the 33% RPS target, as more volumes
are required to meet the higher RPS, but also XXXXXXXXXXXXXXXXXXXXXXXXXX
XXXXXXXXXXXXXXXXXXXXXXXXXXXXXXXXXXXXXXXXXXXXXXXXXXX
XXXXXXXX.

55
The stochastic model’s procurement strategy results show PG&E’s forecasted
XXXXXXXXXXXXXXXXXXXXXXXXXXXXXXXXXXXXXXXXXXXXXXXXXXXXXX
XXXXXXX. Based on current model assumptions and inputs, Figure 5-6 shows that
approximately XX of the time, PG&E would have a greater than XXXXX GWh deficit in
meeting compliance for XXXXXXXXXXXXXXX.
7.3 Implications for Future Procurement
PG&E plans to continually refine both its deterministic and stochastic models,
thus the procurement strategy outlined above is applicable to this RPS Plan only. In
future years, PG&E’s procurement strategy will likely change, based on updates to the
data and algorithms in both models. Additionally, PG&E will continue to assess the
value to its customers of sales of surplus procurement. Consistent with the
Commission’s adopted RNS methodology, PG&E’s physical net short and cost
projections do not include any projected sales of bankable contracted deliveries.
However, PG&E will consider selling non-bankable surplus volumes in its portfolio and,
in doing so, may identify and propose in the future opportunities to secure value for its
customers through the sale of bankable surplus procurement. PG&E will update its
physical RNS if it executes any such sale agreements and will include in its optimized
RNS and SONS specific future plans to sell RPS procurement.
8 Margin of Procurement
When analyzing its margin of procurement, PG&E considers two key
components: (1) a statutory minimum margin of procurement to address some
anticipated project failure or delay, for both existing projects and projects under contract
but not yet online, that is accounted for in PG&E’s deterministic model; and (2) a VMOP,
which aims to mitigate the additional risks and uncertainties that are accounted for in
PG&E’s stochastic model. Specifically, PG&E’s VMOP intends to (a) mitigate risks
associated with short-term variability in load; (b) protect against project failure or delay
exceeding forecasts; and (c) manage variability from RPS resource generation. In so
doing, PG&E’s VMOP helps to eliminate the need at this time to procure long-term

56
contracts above the 33% RPS target by creating a buffer that enables PG&E to manage
the year-to-year variability that result from risks (a)-(c). This section discusses both of
these components and how each is incorporated into PG&E’s quantitative analysis of its
RPS need.
8.1 Statutory Minimum Margin of Procurement
The RPS statute requires the Commission to adopt an “appropriate minimum
margin of procurement above the minimum procurement level necessary to comply with
the [RPS] to mitigate the risk that renewable projects planned or under contract are
delayed or canceled.”32 PG&E’s reasonableness in incorporating this statutory
minimum margin of procurement into its RPS procurement strategy is one of the factors
the Commission must consider if PG&E were to seek a waiver of RPS enforcement
because conditions beyond PG&E’s control prevented compliance.33
As described in more detail in Section 6, PG&E has developed its risk-adjusted
RPS forecasts using a deterministic model that: (1) excludes volumes from contracts at
risk of failure from PG&E’s forecast of future deliveries; and (2) adjusts expected
commencement of deliveries from contracts whose volumes are included in the model
(so long as deliveries commence within the allowed delay provisions in the contract).
PG&E considers this deterministic result to be its current statutory margin of
procurement.34 However, as discussed in Sections 6 and 7, these results are variable
and subject to change, and thus PG&E does not consider this statutory margin of
32 Cal. Pub. Util. Code § 399.13(a)(4)(D).
33 Id., § 399.15(b)(5)(B)(iii).
34 In the past PG&E has seen higher failure rates from its overall portfolio of executed-but-not-operational RPS contracts. However, as the renewables market has evolved—and projects are proposed to PG&E at more advanced stages of development—PG&E has observed a decrease in the expected failure rate of its overall portfolio. The more recent projects added to PG&E’s portfolio appear to be significantly more viable than some of the early projects in the RPS Program, resulting in lower current projections of project failure than have been discussed in past policy forums. However, its revised success rate assumption (from 87% to 99%) also reflects several recent contract terminations from PG&E’s portfolio due to and an update to the “Closely Watched” category described in Section 6.

57
procurement to sufficiently account for all of the risks and uncertainties that can cause
substantial variation in PG&E’s portfolio. To better account for these risks and
uncertainties, PG&E uses its stochastic model to assess a VMOP, as described
further below.
8.2 Voluntary Margin of Procurement
The RPS statute provides that in order to meet its compliance goals, an IOU
may voluntarily propose a margin of procurement above the statutory minimum margin
of procurement.35 As discussed further in Sections 6 and 7, PG&E plans to use a
portion of its Bank as a VMOP to manage additional risks and uncertainties accounted
for in the stochastic model.
While PG&E’s current optimization strategy projects XXXXXXXXXXXXXXX
XXXXXXXXXXXXXXXXXXXXXXXXXXXXXXXXXXXXXXXXXXXXXXXXXXXXXXXXXX
XXXXXXXXXXXXXXXXXXXXXXXXXXXXXXXXXXXXXXXXXXXXXXXXXXXXXXXXX
XXXXXXXXXXXXXXXXXXXXXXXXXXXXXXXXXXXXXXXXXXXXXXXXXXXXXXX
XXXXXXXXXXXXXXXXXXXXXXXXXXXXXXXXXXXXXXXXXXXXXXXXXXXXXXXX
XXXXXXXXXXXXXXXXXXXXXXXXXXXXXXXXXXXXXXXXXXXXXXXXXXXXXXXXX
XXXXXXXXXX. When used as VMOP, the Bank will help to avoid long-term
over-procurement above the 33% RPS target, and will thus reduce long-term costs of
the RPS Program. Since the model inputs change over time, estimates of the Bank and
VMOP are not a static target and will change, so these estimates should be seen as a
snapshot in time. Additional discussion on the need for and use of the Bank and VMOP
are included in Sections 6 and 7.
Additionally, as a portion of the Bank will be used as VMOP, PG&E will continue
to reflect zero volumes in Row D of its RNS tables, consistent with how it has displayed
the VMOP in past RNS tables.
35 Id.,§ 399.13(a)(4)(D).

58
9 Bid Selection Protocol
As described in Sections 3 and 7, PG&E is well positioned to meet its RPS
targets, under both a 33% RPS target and a 40% RPS scenario, until at least XXXX. As
a result, PG&E proposes that itwill not issue a 2015 RPS solicitation. PG&E will
continue to procure RPS-eligible resources in 2016 through other Commission-
mandated programs, such as the ReMAT and RAM Programs. To reflect that PG&E
will not issue a 2015 RPS Solicitation, language has been added throughout the final
2015 RPS Plan to confirm that PG&E is required to seek permission from the
Commission to procure any renewable energy amounts during the time period covered
by the 2015 RPS Plan, except for RPS amounts that are separately mandated.
In D.15-12-025, the Commission required in Ordering Paragraph 7 that PG&E
“include a description of how their process ensures that there is no double counting
between the Integration Cost adder and the Net Market Value components in the Least-
Cost Best-Fit methodology of [its] RPS plan[]. . ..” If PG&E were to procure RPS
resources, there would be no double counting between the integration cost adder and
the Net Market Value (“NMV”) components in the Least-Cost Best-Fit (“LCBF”)
methodology that would be used by PG&E. NMV measures the cost of the renewable
resource in terms of direct impacts on ratepayers—PPA payments to the supplier plus
transmission costs and integration costs, less the energy and capacity value of the
resource. It is associated with the marginal value of the energy and capacity produced
directly by the resource—it is the market cost that PG&E no longer incurs because it is
procuring energy and capacity from the resource instead. The integration cost
represents the system costs that are incurred for other resources that are needed to
support the additional renewable resource. The variable cost represents the
incremental cost of running existing flexible units in the short term, and the fixed cost
represents the incremental cost of additional flexible RA capacity to support the
additional renewable resource.
9.1 Proposed TODTime of Delivery Factors

59
PG&E sets its Time of Delivery (“TOD”) factors based on expected hourly prices.
Given the high penetration of solar generation expected through 2020 and beyond,
PG&E forecasts that there will be significant periods of time during the mid-day when
net loads are low, resulting in prices that will be low or negative, especially in the spring.
This expectation is consistent with forecasts of net load that have been publicized by
the CAISO.36 In addition, given the low mid-day loads, PG&E sees its peak demand
(and resulting higher market prices) moving to later in the day. Capacity value has also
become significantly less important in the selection process because: (1) market prices
for generic capacity are low; and (2) net qualifying capacity using effective load carrying
capability is also low. Thus, PG&E would simplify its PPAs and include only a single set
of TOD factors to be applied to both energy-only and fully deliverable resources.
PG&E is proposing to updateupdating its TOD factors and TOD periods as
follows:
Recommendation (New TODs)
Move peak period from HE16-HE21 to HE17-HE22
Move mid-day period from HE07-HE15 to HE10-HE16
Move night period from HE22-HE06 to HE23-HE09
Move March back to the “Spring” period
Result: Summer=Jul.-Sep., Winter=Oct.-Feb., Spring=Mar.-Jun.; and Peak=HE17-HE22, Mid-day=HE10-HE16, Night=HE23-HE09
TABLE 9-1 [PROPOSED RPS TIME OF DELIVERY FACTORS]
Peak Mid-Day Night
Summer 1.479 0.604 1.087 Winter 1.399 0.718 1.122 Spring 1.270 0.280 1.040
36 See, e.g., CAISO Transmission Plan 2014-2015, pp. 162-163 (approved March 27, 2015)
(available at http://www.caiso.com/Documents/Board-Approved2014-2015TransmissionPlan.pdf).

60
10 Consideration of Price Adjustment Mechanisms
The ACR requires each IOU to “describe how price adjustments (e.g., index to
key components, index to Consumer Price Index, (“CPI”), price adjustments based on
exceeding transmission or other cost caps, etc.) will be considered and potentially
incorporated into contracts for RPS-eligible projects with online dates occurring more
than 24 months after the contract execution date.”37
PG&E will consider a non-standard PPA with pricing terms that are indexed, but
indexed pricing should be the exception rather than the rule. Customers could benefit
from pricing indexed to the cost of key components, such as solar panels or wind
turbines, if those prices decrease in the future. Conversely, customers would also face
the risk that they will pay more for the energy should prices of those components
increase. Asking customers to accept this pricing risk reduces the rate stability that the
legislature has found is a benefit of the RPS Program.38 In order to maximize the RPS
Program’s benefits to customers, cost risk should generally be borne by developers.
Additionally, indexing greatly complicates offer selection, negotiation and
approval. It may be challenging to incorporate contract price adjustment mechanisms
into PPA negotiations when there is no clear, well-established and well-defined
agreed-upon index. There are many components to the cost of construction of a
renewable project, and indexes tied to these various components may move in different
directions. The increased complexity inherent in such negotiations is counter to the
Commission’s expressed desire to standardize and simplify RPS solicitation
processes.39
Moreover, Sellers may not have as much incentive to reduce costs if certain cost
components are indexed. For example, a price adjustment based on the cost of solar
panels (i.e., if panel costs are higher than expected, the price may adjust upward) may 37 ACR, p. 15.
38 See Cal. Pub. Util. Code § 399.11(b)(5).
39 See D.11-04-030, pp. 33-34.

61
not create enough incentive to minimize those costs. This would create a further level
of complexity in contract administration and regulatory oversight.
Finally, PG&E does not recommend that PPA prices be linked to the Consumer
Price Index (“CPI”).CPI. The CPI is completely unrelated to the cost of the renewable
resource, and is instead linked to increases in prices of oil and natural gas, food,
medical care and housing. Indexing prices to unrelated commodities heightens the
derivative and speculative character of these types of transactions.
11 Economic Curtailment
In D.14-11-042, the Commission approved curtailment terms and conditions for
PG&E’s pro forma RPS PPA.40 In addition, the Commission directed the IOUs to report
on observations and issues related to economic curtailment, including reporting to the
Procurement Review Group (“PRG”).41 In May 2015, PG&E made a presentation to its
PRG on economic curtailment. This section provides information to the Commission
and parties regarding PG&E’s observations and issues related to economic curtailment
both for the market generally, and PG&E’s specific scheduling practices for its
RPS-eligible resources.
With regard to market conditions generally, the frequency of negative price
periods in 2015 has generally increased in the Real-Time Markets, even during the low
hydro conditions of 2015. During January through May 2015, negative price intervals in
the CAISO Five Minute Market for the North of Path 15 Hub occurred more than
1,800 times (4.2% of 5 minute intervals) compared to 1,100 times (2.5%) during the
same period in 2014. Similarly, the ZP26 Hub prices for this period in 2015 were
negative over 4,100 times (9.5%), a substantial increase over the 2014 results of
1,400 times (3.3%). Increased negative price periods have led to increased
curtailments of renewable resources that are economically bid. The specific
40 D.14-11-042, pp. 43-44.
41 Id., pp. 42-43.
62
occurrences of negative price periods and overgeneration events are largely
unpredictable; XXXXXXXXXXXXXXXXXXXXXXXXXXXXXXXXXXXXXXXXXXXXXX
XXXXXXXXXXXXXXXXXXXXXXXXXXXXXXXXXXXXXXXXXXXXXXXXXXXXXXX
XXXXXXXXXXXXXXX..
XXXXXXXXXXXXXXXXXXXXXXXXXXXXXXXXXXXXXXXXXXXXXXXXXXXX
XXXXXXXXXXXXXXXXXXXXXXXXXXXXXXXXXXXXXXXXXXXXXXXXXXXXXXX
XXXXXXXXXXXXXXXXXXXXXXXXXXXXXXXXXXXXXXXXXXXXXXXXXXXXXXXXX
XXXXXXXXXXXXXXXXXXXXXXXXXXXXXXXXXXXXXXXXXXXXXXXXXXXXXXX
XXXXXXXXXXXXXXXXXXXXXXXXXXXXXXXXXXXXXXXXXXXXXXXXXXXXXXXXXX
XXXXXXXXXXXXXXXXXXXXXXXXXXXXXXXXXXXXXXXXXXXXXXXXX
XXXXXXXXXXXXXXXXXXXXXXXXXXXXXXXXXXXXXXXXXXXXXXXXX
XXXXXXXXXXXXXXXXXXXXXXXXXXXXXXXXXXXXXXXXXXXXXXXXXXXXXX
XXXXXXXXXXXXXXXXXXXXXXXXXXXXXXXXXXXXXXXXXXXXXXXXXXXXXX
XXXXX42XXXXXXXXXXXXXXXXXXXXXXXXXXXXXXXXXXXXXXXXXXXXXXXXXXX
XXXXXXXXXXXXXXXXXXXXXXXXXXXXXXXXXXXXXXXXXXXXXXXXXXXXXXXXXX
XXXXXXXXXXXXXXXXXXXXXXXXXXXXX PG&E submits bids for these resources
based on the resource’s opportunity costs, subject to contractual, regulatory, and
operational constraints. This also includes the incremental costs of compliance
instruments required to comply with the 33% RPS target. PG&E provided more detail
concerning its RPS bidding strategy in its proposed 2014 Bundled Procurement Plan
(“BPP”) BPP which was filed with the Commission in October 2014 and is currently
pending at the Commission.43
XXXXXXXXXXXXXXXXXXXXXXXXXXXXXXXXXXXXXXXXXXXXXXXXXXX
XXXXXXXXXXXXXXXXXXXXXXXXXXXXXXXXXXXXXXXXXXXXXXXXXXXXXXXXX
XXXXXXXXXXXXXXXXXXXXXXXXXXXXXXXXXXXXXXXXXXXXXXXXXXXXX 42 XXXXXXXXXXXXXXXXXXXXXXXXXXXXXXXXXXXXXXXXXXXXX
43 See PG&E, Proposed 2014 Bundled Procurement Plan, R.13-12-010, Appendix K (Bidding and Scheduling Protocol) (October 3, 2014).
63
XXXXXXXXXXXXXXXXXXXXXXXXXXXXXXXXXXXXXXXXXXXXXXXXXXXXXXXX
XXXXXXXXXXXXXXXXXXXXXXXXXXXXXXXXXXXXXXXXXXXXXXXXXXXXXX
XXXXXX44XXXXXXXXXXXXXXXXXXXXXXXXXXXXXXXXXXXXXXXXXXXXXXXXXX
XXXXXXXXXXXXXXXXXXX45XXXXXXXXXXXXXXXXXXXXXXXXXXXXXXXXXXXXX
XXXXXXXXXXXXXX XXXXXXXXXXXX46 While direct benefits of economic bidding
include avoided costs and CAISO market payments associated with negative prices,
there can be other important benefits, including potentially avoiding the cost impacts
across the rest of PG&E’s portfolio due to extreme negative price periods and also
potentially enhancing CAISO system reliability by helping to mitigate the occurrences,
duration, or severity of negative price periods or overgeneration events.
With regard to longer-term RPS planning and compliance, in order to ensure that
RPS procurement need forecasts account for curtailment, PG&E adds curtailment as a
risk adjustment within the stochastic model. Under the 33% RPS target, PG&E
assumes curtailment XXXXXXXXXXXXXXXXXXXXX47 under a 40% RPS scenario,
PG&E expects curtailment to increase in line with recent CAISO estimates XXXXXXXX
XXXXXXXXXXXXXXXXXXXXXXXXXX.48 These modeling assumptions will not
44 XXXXXXXXXXXXXXXXXXXXXXXXXXXXXXXXXXXXXXXXXXXXXXXXXXXXXXXXX
XXXXXXXXXXX
45 XXXXXXXXXXXXXXXXXXXXXXXXXXXXXXXXXXXXXXXXXXXXXXXXXXXXXXXXX XXXXXXXXXXX.
46 XXXXXXXXXXXXXXXXXXXXXXXXXXXXXXXXXXXXXXXXXXXXXXXXXXXXXXXXXXX XXXXXXXXXXXXXXXXXXXXXXXXXXXXXXXXXXXXXXXXXXXXX
47 XXXXXXXXXXXXXXXXXXXXXXXXXXXXXXXXXXXXXXXXXXXXXXXXXXXXXXXX XXXXXXXXXXXXXXXXXXXXXXXXXXXXXXXXXXXXXXXXXXXXXXXXXXXXXXXXXXXX XXXXXXXXXXXXXXXXXXXXXXXXXXXXXXXXXXXXXXXXXXXXXXXXXXXXXXXXXXXX XXXXXXXXXXXXXXXXXXXXXXXXXXXXXXXXXXXXXXXXXXXXXXXXXXXXXXXXXXXXXXXXXXXXXXXXXXXXXXXXXXXXXXXXXXXXXXXXXXXXXXXXXXXXXXXXX XXXXXXXXXXXXXXXXXXXXXXXXXXXXXXXX
48 XXXXXXXXXXXXXXXXXXXXXXXXXXXXXXXXXXXXXXXXXXXXXXXXXXXXXXXXXX XXXXXXXXXXXXXXXXXXXXXXXXXXXXXXXXXXXXXXXXXXXXXXXXXXXXXXXXXX XXXXXXXXXXXXXXXXXXXXXXXXXXXXXXXXXXXXXXXXXXXXXXXX XXXXXXXXXXXXXXXXXXXXXXXXXXXXXXXXXXXXXXXXXXXXXXXXXXXXXXXXXXXX XX

64
necessarily align with the actual number of curtailment hours, but are helpful in terms of
considering the impact of curtailment on long-term RPS planning and compliance.
PG&E will continue to observe curtailment events and update its curtailment
assumptions as needed. Implementation of these assumptions in PG&E’s modeling is
discussed in more detail in Section 6.2.3.
Finally, PG&E continues to review its existing portfolio of RPS contracts to
determine if additional economic curtailment flexibility may be available to help address
the increase in negative pricing events.
12 Expiring Contracts
The ACR requires PG&E to provide information on contracts expected to expire
in the next 10 years.49 Appendix E lists the projects under contract to PG&E that are
expected to expire in the next 10 years. The table includes the following data:
1. PG&E Log Number
2. Project Name
3. Facility Name
4. Contract Expiration Year
5. Contract Capacity (MW)
6. Expected Annual Generation (GWh)
7. Contract Type
8. Resource Type
9. City
10. State
11. Footnotes identifying if PG&E has already secured the expiring volumes through a new PPA
As indicated in Appendix G, PG&E’s RNS calculations assume no
re-contracting. Re-contracting is not precluded by this assumption, but rather it reflects 49 ACR, p. 16.

65
that proposed material amendments (i.e., those needed to avoid project failure) or
extensions to existing contracts will be evaluated against current offers.
13 Cost Quantification
This section summarizes results from actual and forecasted RPS generation
costs (including incremental rate impacts), shows potential increased costs from
mandated programs, and identifies the need for a clear cost containment mechanism to
address RPS Program costs. Tables 1 through 4 in Appendix D provide an annual
summary of PG&E’s actual and forecasted RPS costs and Page 1 of Appendix D
outlines the methodology for calculating the costs and generation.
13.1 RPS Cost Impacts
Appendix D quantifies the cost of RPS-eligible procurement—both historical
(2003-2014) and forecast (2015-2030). From 2003 to 2014, PG&E’s annual
RPS-eligible procurement and generation costs have continued to increase. Compared
to an annual cost of $523 million in 2003, PG&E incurred more than XXXXXXX in
procurement costs for RPS-eligible resources in 2014.
RPS Program costs impact customers’ bills. Incremental rate impacts, defined
as the annual total cost from RPS-eligible procurement and generation divided by
bundled retail sales, effectively serve as an estimate of a system average bundled rate
for RPS-eligible procurement and generation. While this formula does not provide an
estimate of the renewable “above-market premium” that customers pay relative to a
non-RPS-eligible power alternative, the annual rate impact results in Tables 1 and 2 of
Appendix D illustrate the potential rate of growth in RPS costs and the impact this
growth will have on average rates, all other factors being equal. Annual rate impact of
the RPS Program increased from 0.7¢/kWh in 2003 to an estimated 3.5¢/kWh in 2016,
meaning the average rate impact from RPS-eligible procurement has increased more
than five-fold in approximately 12 years. This growth rate is projected to continue
increasing through 2020, as the average rate impact is forecasted to increase
to 3.9¢/kWh. In addition to the increasing RPS costs and incremental rate impacts on

66
customer costs resulting from the direct procurement of the renewable resources, there
are incremental indirect transmission and integration costs associated with that
procurement.
13.2 Procurement Expenditure Limit
Section 399.15(f) provides that the Commission waive the RPS obligations of an
electrical corporation once it meets the cost containment limitation, provided that
additional resources cannot be procured without exceeding “a de minimis increase in
rates.” The methodology for the PEL, the Commission’s cost containment mechanism,
is still under development. As discussed in Section 2.2, PG&E looks forward to the
Commission finalizing the PEL methodology and implementing it, to ensure that
customers are adequately protected and promote regulatory certainty and support
procurement planning.
13.3 Cost Impacts Due to Mandated Programs
As PG&E makes progress toward achieving the RPS goal of 33%, the cost
impacts of mandated procurement programs that focus on particular technologies or
project size increase over time, and procurement from those programs increasingly
comprises a larger share of PG&E’s incremental procurement goals. In general,
mandated procurement programs do not optimize RPS costs for customers because
they restrict flexibility and optionality to achieve emissions reductions by mandating
procurement through a less efficient and more costly manner. For instance, research
shows that market-based mechanisms, like cap-and-trade, that allow multiple and
flexible emissions reduction options, have lower costs than mandatory mechanisms like
technology targets that allow only a subset of those options.50 Studies have also
50 See, e.g., Palmer and Burtraw, “Cost-Effectiveness of Renewable Electricity Policies”
(2005) (available at http://www.rff.org/Documents/RFF-DP-05-01.pdf); Sergey Paltsev et. al, “The Cost of Climate Policy in the U.S.” (2009) (available at http://citeseerx.ist.psu.edu/viewdoc/download?doi=10.1.1.177.6721&rep=rep1&type=pdf); Palmer, Sweeney, and Allaire, “Modeling Policies to Promote Renewable and Low-Carbon Sources of Electricity” (2010) (available at http://www.rff.org/RFF/Documents/RFF-BCK-Palmeretal%20-LowCarbonElectricity-REV.pdf).

67
shown that renewable electricity mandates increase prices and costs,51 and
procurement mandates within California’s RPS decrease efficiency in the same way.
Mandates restrict the choices to meet the RPS targets, removing potentially less
expensive options from the market. This can increase prices in two ways: first, by
disqualifying those less expensive participants and second, by creating a less robust
market for participants to compete.52 PG&E’s customers also pay incremental costs
due to the administrative costs associated with managing separate solicitations for
mandated resources. In addition, smaller project sizes for mandated programs create a
greater number of projects which, in turn, affect interconnection and transmission
availability and costs. Finally, mandated programs do not enable PG&E to procure the
technology, size, vintage, location and other attributes that would best fit its portfolio.
As a result, PG&E’s costs for managing its total generation and portfolio increase. For
these reasons, PG&E supports a technology neutral procurement process, in which all
technologies can compete to demonstrate which projects provide the best value to
customers at the lowest cost.
14 Imperial Valley
For the IOUs’ 2014 RPS solicitations, the Commission did not specifically
require any remedial measures to bolster procurement from Imperial Valley projects but
required continued monitoring of IOUs’ renewable procurement activities in the Imperial
Valley area.53 Even without remedial measures in PG&E’s 2014 RPS Solicitation, the
Independent Evaluator monitoring that solicitation found that:
51 See, e.g., Institute for Energy Research, “Energy Regulation in the States: A Wake-up Call”
(available at http://www.instituteforenergyresearch.org/pdf/statereport.pdf); Manhattan Institute, “The High Cost of Renewable Electricity Mandates” (available at http://www.manhattan-institute.org/html/eper_10.htm).
52 See, Fischer and Preonas, “Combining Policies for Renewable Energy: Is the Whole Less Than the Sum of Its Parts?” (2010) (available at http://www.rff.org/Documents/Fischer_Preonas_IRERE_2010.pdf).
53 D.14-11-042, pp. 15-16.

68
Overall, the response of developers to propose Imperial Valley projects was robust and PG&E’s selection of Imperial Valley Offers was representative of that response. Arroyo perceives no evidence that PG&E failed in any way to perform outreach to developers active in the Imperial Valley or that there was any structural impediment in the RFO process that hindered the selection of competitively priced Offers for projects in the Imperial Valley.54
Given the robustness of the response from Imperial Valley projects in the
2014 RPS solicitation, as well as the 2013 RPS solicitation, and given the fact that
PG&E is not planning on conducting a 2015 RPS solicitation, there does not appear to
be a need to adopt any special remedial measures for the Imperial Valley as a part of
the RPS Plan.
The ACR also directs the IOUs to report on any CPUC-approved RPS PPA for
projects in the Imperial Valley that are under development, and any RPS projects in the
Imperial Valley that have recently achieved commercial operation.55 PG&E has
one PPA under contract in the Imperial Valley. That project is in development.
Commercial operation is expected in 2016, with deliveries under the PPA beginning
in 2020.
15 Important Changes to Plans Noted
This section describes the most significant changes between PG&E’s 2014 RPS
Plan and its 2015 RPS Plan. A complete redline of the draft 2015 RPS Plan against
PG&E’s 2014 RPS Plan iswas included as Appendix A. of the August 4, 2015 draft RPS
Plan. This section identifies and summarizes the key changes and differences between
the 2014 RPS Plan and the proposed 2015 RPS Plan. Specifically, the table below
provides a list of key differences between the two RPS Plans:
54 PG&E, Advice Letter 4632-E, p. 40, Section 2 (IE Report) (May 7, 2015).
55 ACR, p. 19.

69
Reference Area of Change Summary of Change Justification
Section 1 Section format and structure
Remove “Executive Summary” from Introduction.
Ease of document flow.
Entire RPS Plan Consideration of a Higher RPS Requirement
Include response to the Specific Requirements for 2015 RPS Procurement Plans, considering both the current 33% by 2020 target and a 40% by 2024 scenario.
ACR at pp.5-6.
Section 2.1 Commission Implementation of SB 2 (1x)
Include discussion of D.14-12-023, setting RPS compliance and enforcement rules under SB 2 (1X).
ACR at p. 4.
Section 3.2.2 Impact of Green Tariff Shared Renewable Program
Include discussion of impact of Green Tariff Shared Renewable Program on RPS position.
D.14-11-042; D.15-01-051.
Section 3.4 Anticipated Renewable Energy Technologies and Alignment of Portfolio With Expected Load Curves and Durations
Include discussion of integration cost adder as part of LCBF bid evaluation methodology.
ACR at p.15.
Section 3.5 RPS Portfolio Diversity Include discussion of efforts to increase portfolio diversity.
ACR at p.10.
Section 5.4 Curtailment of RPS Generating Resources
Include discussion of economic curtailment as a potential compliance delay.
ACR at p.16.

70
Reference Area of Change Summary of Change Justification
Section 11 Economic Curtailment Include discussion of economic curtailment.
ACR at p.16.
Appendix C.1b Renewable Net Short Calculations – 40% RPS Scenario
Include response to the Specific Requirements for 2015 RPS Procurement Plans, considering both the current 33% by 2020 target and a 40% by 2024 scenario.
ACR at pp.5-6.
Appendix C.2b Alternate Renewable Net Short Calculations – 40% RPS Scenario
Include response to the Specific Requirements for 2015 RPS Procurement Plans, considering both the current 33% by 2020 target and a 40% by 2024 scenario.
ACR at pp.5-6.
Appendix F.2b Project Failure Variability – 40% RPS Scenario
Include response to the Specific Requirements for 2015 RPS Procurement Plans, considering both the current 33% by 2020 target and a 40% by 2024 scenario.
ACR at pp.5-6.
Appendix F.3b RPS Generation Variability – 40% RPS Scenario
Include response to the Specific Requirements for 2015 RPS Procurement Plans, considering both the current 33% by 2020 target and a 40% by 2024 scenario.
ACR at pp.5-6.
Appendix F.4b RPS Deliveries Variability – 40% RPS Scenario
Include response to the Specific Requirements for 2015 RPS Procurement Plans, considering both the current 33% by 2020 target and a 40% by 2024 scenario.
ACR at pp.5-6.
Appendix F.5b RPS Target Variability – 40% RPS Scenario
Include response to the Specific Requirements for 2015 RPS Procurement Plans, considering both the current 33% by 2020 target and a 40% by 2024 scenario.
ACR at pp.5-6.
71
16 Safety Considerations
PG&E is committed to providing safe utility (electric and gas) service to its
customers. As part of this commitment, PG&E reviews its operations, including energy
procurement, to identify and mitigate, to the extent possible, potential safety risks to the
public and PG&E’s workforce and its contractors. Because PG&E’s role in ensuring the
safe construction and operation of RPS-eligible generation facilities depends upon
whether PG&E is the owner of the generation or is simply the contractual purchaser of
RPS-eligible products (e.g., energy and RECs), this section is divided into separate
discussions addressing each of these situations.
16.1 Development and Operation of PG&E-Owned, RPS-Eligible Generation
While PG&E is not proposing as part of its 2015 RPS Plan to develop additional
utility-owned renewable facilities, its existing RPS portfolio contains a number of such
facilities. To the extent that PG&E builds, operates, maintains, and decommissions its
own RPS-eligible generation facilities, PG&E follows its internal standard protocols and
practices to ensure public, workplace, and contractor safety. For example, PG&E’s
Employee Code of Conduct describes the safety of the public, employees and
contractors as PG&E’s highest priority.56 PG&E’s commitment to a safety-first culture
is reinforced with its Safety Principles, PG&E’s Safety Commitment, Personal Safety
Commitment and Keys to Life.57 These tools were developed in collaboration with
PG&E employees, leaders, and union leadership and are intended to provide clarity and
support as employees strive to take personal ownership of safety at PG&E.
Additionally, PG&E seeks all applicable regulatory approvals from governmental
56 See PG&E, “Employee Code of Conduct” (August 2013) (available at
http://www.pgecorp.com/aboutus/corp_gov/coce/employee_conduct_standards.shtml). See, e.g., PG&E, “Contractor, Consultant, and Supplier Code of Conduct,” p. 3 (available at http://www.pgecorp.com/aboutus/ethics_compliance/con_con_ven/).
57 See PG&E, “Employee Code of Conduct” supra (describing the Safety Principles, Safety Commitment, Personal Safety Commitment and Keys to Life).

72
authorities with jurisdiction to enforce laws related to worker health and safety, impacts
to the environment, and public health and welfare.
As more fully detailed in PG&E’s testimony in its General Rate Case (“GRC”),58
the top priority of PG&E’s Electric Supply organization is public and employee safety,
and its goal is to safely operate and maintain its generation facilities. In general, PG&E
ensures safety in the development and operation of its RPS-eligible facilities in the
same manner as it does for its other UOG facilities. This includes the use of recognized
best practices in the industry.
PG&E operates each of its generation facilities in compliance with all local, state
and federal permit and operating requirements such as state and federal Occupational
Safety and Health Administration (“OSHA”) and the California Public Utilities
Commission’sCPUC’s General Order 167. PG&E does this by using internal controls to
help manage the operations and maintenance of its generation facilities, including:
(1) guidance documents; (2) operations reviews; (3) an incident reporting process; (4) a
corrective action program; (5) an outage planning and scheduling process; (6) a project
management process; and (7) a design change process.
PG&E’s Environmental Services organization also provides direct support to the
generation facilities, with a focus on regulatory compliance. Environmental consultants
are assigned to each of the generating facilities and support the facility staff.
With regard to employee safety, Power Generation employees develop a safety
action plan each year. This action plan focuses on various items such as clearance
processes and electrical safety, switching and grounding observations, training and
qualifications, expanding the use of Job Safety Analysis tools, peer-to-peer recognition,
near-hit reporting, industrial ergonomics, and human performance.
58 See PG&E, Prepared Testimony, 2014 GRC, Application 12-11-009, Exhibit (PG&E-6),
Energy Supply, pp. 1-11, 2-17, 2-44, 2-66, 4-13 (available at http://www.pge.com/regulation/).

73
Employees also participate in an employee led Driver Awareness Team
established for the sole purpose of improving driving. An annual motor vehicle incident
(“MVI”) Action Plan is developed and implemented each year. This action plan focuses
on vehicle safety culture and implements the Companywide motor vehicle safety
initiatives in addition to specific tools such as peer driving reviews and 1 800 phone
number analysis to reduce MVIs.
The day-to-day safety work in the operation of PG&E’s generation facilities
consists of base activities such as:
Industrial and office ergonomics training/evaluations
Illness and injury prevention
Health and wellness training
Regulatory mandated training
Training and re certification for the safety staff
Culture based safety process
Asbestos and lead awareness training
Safety at Heights Program
Safe driving training
First responder training
Preparation of safety tailboards and department safety procedures
Proper use of personal protective equipment
Incident investigations and communicating lessons learned
Employee injury case management
Safety performance recognition
Public safety awareness
The safety focus of PG&E’s hydropower operations includes the safety of the
public at, around, and/or downstream of PG&E’s facilities; the safety of our personnel at
and/or traveling to PG&E’s hydro facilities; and the protection of personal property

74
potentially affected by PG&E’s actions or operations. With regard to public safety,
PG&E is developing and implementing a comprehensive public safety program that
includes: (1) public education, outreach and partnership with key agencies;
(2) improved warning and hazard signage at hydro facilities; (3) enhanced emergency
response preparedness, training, drills and coordination with emergency response
organizations; and (4) safer access to hydro facilities and lands, including trail access,
physical barriers, and canal escape routes.
PG&E has also funded specific hydro-related projects that correct potential
public and employee safety hazards, such as Arc Flash Hazards, inadequate ground
grids, and waterway, penstock, and other facility safety condition improvements.
PG&E will never be satisfied in its safety performance until there is never an
injury to any of its employees, contractors, or members of the public. Over the past
several years, PG&E’s Power Generation organization has been creating a culture of
safety first with strong leadership expectations and an increasingly engaged workforce.
Fundamental to a strong safety culture is a leadership team that believes every job can
be performed safely and seeks to eliminate barriers to safe operations. Equally
important is the establishment of an empowered grass roots safety team that can act to
encourage safe work practices among peers. Power Generation’s grass roots team is
led by bargaining unit employees from across the organization who work to include
safety best practices in all the work they do. These employees are closest to the
day-to-day work of providing safe, reliable, and affordable energy for PG&E’s customers
and are best positioned to implement change that can improve safety performance.
16.2 Development and Operation of Third-Party–Owned, RPS-Eligible Generation
The vast majority of PG&E’s procurement of products to meet RPS requirements
has been from third-party generation developers. In these cases, local, state and
federal agencies that have review and approval authority over the generation facilities
are charged with enforcing safety, environmental and other regulations for the Project,
75
including decommissioning. While this authority has not changed, PG&E intends to add
additional contract provisions to its contract forms to reinforce the developer’s
obligations to operate in accordance with all applicable safety laws, rules and
regulations as well as Prudent Electrical Practices, which are the continuously evolving
industry standards for operations of similar electric generation facilities. Additionally,
the new provisions will seek to implement lessons learned and instill a continuous
improvement safety culture that mirrors PG&E’s approach to safety.
Specifically, the safety language that PG&E is developing builds upon the former
standard of Good Utility Practices to a new standard of Prudent Utility Practices, which
includes greater detail on the types of activities covered by this standard, including but
not limited to safeguards, equipment, personnel training, and control systems.
Safety is also addressed as part of a generator’s interconnection process, which
requires testing for safety and reliability of the interconnected generation. PG&E’s
general practice is to declare that a facility under contract has commenced deliveries
under the PPA only after the interconnecting utility and the CAISO have concluded such
testing and given permission to commence commercial operations.
PG&E receives monthly progress reports from generators who are developing
new RPS-eligible resources where the output will be sold to PG&E. As part of this
progress report, generators are required to provide the status of construction activities,
including OSHA recordables and work stoppage information. Additionally, the new
contract provisions would require reporting of Serious Incidents and Exigent
Circumstances shortly after they occur. If the generator has repeated safety violations
or challenges, the generator could be at greater risk of failing to meet a key project
development milestone or failing to meet a material obligation set forth in the PPA.
The decommissioning of a third-party generation project is not addressed in the
form contract. In many cases, it may be expected that a third-party generator may
continue to operate its generation facility after the PPA has expired or terminated,
perhaps with another off-taker. Any requirements and conditions for decommissioning

76
of a generation facility owned by a third-party should be governed by the applicable
permitting authorities.
17 Energy Storage
AB 2514, signed into law in September 2010, added Section 2837, which
requires that the IOUs’ RPS procurement plans incorporate any energy storage targets
and policies that are adopted by the Commission as a result of its implementation of
AB 2514. On October 17, 2013, the CPUC issued D.13-10-040 adopting an energy
storage procurement framework and program design, requiring that PG&E execute
580 MW of storage capacity by 2020, with projects required to be installed and
operational by no later than the end of 2024. In accordance with the guidelines in the
decision, PG&E submitted an application to procure energy storage resources on
February 28, 2014. In D.14-10-045, the CPUC approved PG&E’s application with
modifications. PG&E will filefiled final storage RFO results for CPUC approval byon
December 1, 2015. In addition, PG&E is participating in a new proceeding,
R.15-03-011, which the Commission opened in March 2015 to consider policy and
implementation refinements to the energy storage procurement framework and
program design.
PG&E considers eligible energy storage systems to help meet its Energy
Storage Program targets through its RPS procurement process, Energy Storage RFO,
as well as other CPUC programs and channels such as the Self -Generation Incentive
Program (SGIP).. PG&E’s LCBF methodology considers the additional value offered by
RPS-eligible generation facilities that incorporate energy storage. Further detail on
PG&E’s energy storage procurement can be found in its biennial Energy Storage
Plan.59
59 See PG&E, Application of Pacific Gas and Electric Company (U 39-E) for Authorization to
Procure Energy Storage Resources (2014-2015 Biennial Cycle), (available at: http://www.cpuc.ca.gov/NR/rdonlyres/D9CACD21-AB1C-411A-8B79-84FB28E88C58/0/PGE_StorageApplication.pdf).