Volume 5, Issue 4 (XIX) : October – December 2018 - Advance ...
116
Volume 5, Issue 4 (XIX) ISSN 2394 - 7780 October - December 2018 UGC University Grants Commission Journal No.: 63571 International Journal of Advance and Innovative Research Indian Academicians and Researchers Association www.iaraedu.com
-
Upload
khangminh22 -
Category
Documents
-
view
1 -
download
0
Transcript of Volume 5, Issue 4 (XIX) : October – December 2018 - Advance ...

Volume 5, Issue 4 (XIX) ISSN 2394 - 7780 October - December 2018
UGC University Grants Commission
Journal No.: 63571
International Journal of
Advance and Innovative Research
Indian Academicians and Researchers Association www.iaraedu.com

International Journal of Advance and Innovative Research Volume 5, Issue 4 ( XIX ): October - December 2018
Editor- In-Chief Dr. Tazyn Rahman
Members of Editorial Advisory Board
Mr. Nakibur Rahman Ex. General Manager ( Project ) Bongaigoan Refinery, IOC Ltd, Assam
Dr. Mukesh Saxena Pro Vice Chancellor, University of Technology and Management, Shillong
Dr. Alka Agarwal Director, Mewar Institute of Management, Ghaziabad
Dr. Archana A. Ghatule Director, SKN Sinhgad Business School, Pandharpur
Prof. (Dr.) Sudhansu Ranjan Mohapatra Dean, Faculty of Law, Sambalpur University, Sambalpur
Prof. (Dr.) Monoj Kumar Chowdhury Professor, Department of Business Administration, Guahati University, Guwahati
Dr. P. Malyadri Principal, Government Degree College, Hyderabad
Prof. (Dr.) Baljeet Singh Hothi Professor, Gitarattan International Business School, Delhi
Prof.(Dr.) Shareef Hoque Professor, North South University, Bangladesh
Prof. (Dr.) Badiuddin Ahmed Professor & Head, Department of Commerce, Maulana Azad Nationl Urdu University, Hyderabad
Prof.(Dr.) Michael J. Riordan Professor, Sanda University, Jiashan, China
Dr. Anindita Sharma Dean & Associate Professor, Jaipuria School of Business, Indirapuram, Ghaziabad
Prof.(Dr.) James Steve Professor, Fresno Pacific University, California, USA
Prof. (Dr.) Jose Vargas Hernandez Research Professor, University of Guadalajara,Jalisco, México
Prof.(Dr.) Chris Wilson Professor, Curtin University, Singapore
Prof. (Dr.) P. Madhu Sudana Rao Professor, Mekelle University, Mekelle, Ethiopia
Prof. (Dr.) Amer A. Taqa Professor, DBS Department, University of Mosul, Iraq
Prof. (Dr.) Himanshu Pandey Professor, Department of Mathematics and Statistics Gorakhpur University, Gorakhpur
Dr. Nurul Fadly Habidin Faculty of Management and Economics, Universiti Pendidikan Sultan Idris, Malaysia
Prof. (Dr.) Agbo Johnson Madaki Faculty, Faculty of Law, Catholic University of Eastern Africa, Nairobi, Kenya
Dr. Neetu Singh HOD, Department of Biotechnology, Mewar Institute, Vasundhara, Ghaziabad
Prof. (Dr.) D. Durga Bhavani Professor, CVR College of Engineering, Hyderabad, Telangana

Prof. (Dr.) Shashi Singhal Professor, Amity University, Jaipur
Prof. (Dr.) Aradhna Yadav Professor, Krupanidhi School of Management, Bengaluru
Prof. (Dr.) Alireza Heidari Professor, Faculty of Chemistry, California South University, California, USA
Prof.(Dr.) Robert Allen Professor Carnegie Mellon University, Australia
Prof. (Dr.) A. Mahadevan Professor S. G. School of Business Management, Salem
Prof. (Dr.) S. Nallusamy Professor & Dean, Dr. M.G.R. Educational & Research Institute,Chennai
Prof. (Dr.) Hemant Sharma Professor, Amity University, Haryana
Prof. (Dr.) Ravi Kumar Bommisetti Professor, Amrita Sai Institute of Science & Technology, Paritala
Dr. C. Shalini Kumar Principal, Vidhya Sagar Women’s College, Chengalpet
Dr. Syed Mehartaj Begum Professor, Hamdard University, New Delhi
Prof. (Dr.) Badar Alam Iqbal Adjunct Professor, Monarch University, Switzerland
Dr. Darshana Narayanan Head of Research, Pymetrics, New York, USA
Prof.(Dr.) D. Madan Mohan Professor, Indur PG College of MBA, Bodhan, Nizamabad
Dr. Rosemary Ekechukwu Associate Dean, University of Port Harcourt, Nigeria
Dr. Sandeep Kumar Sahratia Professor Sreyas Institute of Engineering & Technology
Dr. P.V. Praveen Sundar Director, Shanmuga Industries Arts and Science College
Dr. S. Balamurugan Director - Research & Development, Mindnotix Technologies, Coimbatore
Dr. Manoj P. K. Associate Professor, Cochin University of Science and Technology
Dr. Dhananjay Prabhakar Awasarikar Associate Professor, Suryadutta Institute, Pune
Dr. Indu Santosh Associate Professor, Dr. C. V.Raman University, Chhattisgath
Dr. Mohammad Younis Associate Professor, King Abdullah University, Saudi Arabia
Dr. Pranjal Sharma Associate Professor, Department of Management Mile Stone Institute of Higher Management, Ghaziabad
Dr. Kavita Gidwani Associate Professor, Chanakya Technical Campus, Jaipur
Dr. Lalata K Pani Reader, Bhadrak Autonomous College, Bhadrak, Odisha
Dr. Vijit Chaturvedi Associate Professor, Amity University, Noida
Dr. Pradeepta Kishore Sahoo Associate Professor, B.S.A, Institute of Law, Faridabad
Dr. Marwan Mustafa Shammot Associate Professor, King Saud University, Saudi Arabia
Dr. R. Navaneeth Krishnan Associate Professor, Bharathiyan College of Engg & Tech, Puducherry

Dr. Mahendra Daiya Associate Professor, JIET Group of Institutions, Jodhpur
Dr. G. Valarmathi Associate Professor, Vidhya Sagar Women's College, Chengalpet
Dr. Parbin Sultana Associate Professor, University of Science & Technology Meghalaya
Dr. M. I. Qadir Assistant Professor, Bahauddin Zakariya University, Pakistan
Dr. Kalpesh T. Patel Principal (In-charge) Shree G. N. Patel Commerce College, Nanikadi
Dr. Brijesh H. Joshi Principal (In-charge) B. L. Parikh College of BBA, Palanpur
Dr. Juhab Hussain Assistant Professor, King Abdulaziz University, Saudi Arabia
Dr. Namita Dixit Associate Professor, ITS Institute of Management, Ghaziabad
Dr. V. Tulasi Das Assistant Professor, Acharya Nagarjuna University, Guntur, A.P.
Dr. Nidhi Agrawal Assistant Professor, Institute of Technology & Science, Ghaziabad
Dr. Urmila Yadav Assistant Professor, Sharda University, Greater Noida
Dr. Ashutosh Pandey Assistant Professor, Lovely Professional University, Punjab
Dr. M. Kanagarathinam Head, Department of Commerce Nehru Arts and Science College, Coimbatore
Dr. Subha Ganguly Scientist (Food Microbiology) West Bengal University of A. & F Sciences, Kolkata
Dr. V. Ananthaswamy Assistant Professor The Madura College (Autonomous), Madurai
Dr. R. Suresh Assistant Professor, Department of Management Mahatma Gandhi University
Dr. S. R. Boselin Prabhu Assistant Professor, SVS College of Engineering, Coimbatore
Dr. V. Subba Reddy Assistant Professor, RGM Group of Institutions, Kadapa
Dr. A. Anbu Assistant Professor, Achariya College of Education, Puducherry
Dr. R. Jayanthi Assistant Professor, Vidhya Sagar Women's College, Chengalpattu
Dr. C. Sankar Assistant Professor, VLB Janakiammal College of Arts and Science
Dr. Manisha Gupta Assistant Professor, Jagannath International Management School
Copyright @ 2018 Indian Academicians and Researchers Association, Guwahati All rights reserved. No part of this publication may be reproduced or transmitted in any form or by any means, or stored in any retrieval system of any nature without prior written permission. Application for permission for other use of copyright material including permission to reproduce extracts in other published works shall be made to the publishers. Full acknowledgment of author, publishers and source must be given. The views expressed in the articles are those of the contributors and not necessarily of the Editorial Board or the IARA. Although every care has been taken to avoid errors or omissions, this publication is being published on the condition and understanding that information given in this journal is merely for reference and must not be taken as having authority of or binding in any way on the authors, editors and publishers, who do not owe any responsibility for any damage or loss to any person, for the result of any action taken on the basis of this work. All disputes are subject to Guwahati jurisdiction only.


International Journal of Advance and Innovative Research Volume 5, Issue 4 ( XIX ) : October – December 2018
CONTENTS
Research Papers
FINANCIAL INCLUSION: AN EMPIRICAL STUDY OF BANKING PRODUCTS AND SERVICES WITH SPECIAL REFERENCE TO SELECTED VILLAGES OF ANANAD DISTRICT OF GUJARAT STATE
Dr. Bhautik A. Patel and Jenita Patel
1 – 8
PRE-PAID METER AND POWER SECTOR REFORMS IN MANIPUR
Yaiphaba Ningthoujam
9 – 15
AN EMPIRICAL STUDY OF RELATIONSHIP BETWEEN TRAINING DURATION & PROBLEMS OF MICRO ENTREPRENEURS
Dr. Aradhana Chouksey
16 – 23
ON QUASI – CONFORMAL RECURRENT AND SYMMETRIC SASAKIAN MANIFOLDS OF SECOND ORDER
K. S. Rawat and Sandeep Chauhan
24 – 29
FINE SCALE CHARACTERIZATION OF GREEN SYNTHESIZED SILVER NANOPARTICLE USING ABELMOSCHUS ESCULENTUS
R. Christynal Oliviya, Dr. S. Krishnakumari and Research & Development Centre
30 – 36
DEVELOPMENT OF SCHOOL EDUCATION IN TRIPURA BEFORE THE STATEHOOD
Pratyush Ranjan Deb, Nimai Chand Maiti and Md. Kutubuddin Halder
37 – 40
STUDY OF EMPPLOYEE TURNOVER IN THE TEXTILE MILLS OF NAGPUR REGION
Dr. O. M. Ashtankar
41 – 48
A STUDY OF IMPORTANCE OF CASE STUDY METHOD OF TEACHING IN FINANCIAL MANAGEMENT EDUCATION
Dr. CA Shilpa Vasant Bhide
49 – 56
LIVING A MEANINGFUL LIFE
Dr. Mahesh Uday Mangaonkar
57 – 60
AN ANALYSIS OF FLOWS OF FOREIGN INSTITUTIONAL INVESTORS IN INDIAN STOCK MARKET
Chirayu S Shastri
61 – 64
WORK LIFE BALANCE FOR A WORKING WOMAN IN INDIA
Priya A Sarda
65 – 69
HOUSEHOLD DETERMINANTS OF CHILDREN’S EDUCATIONAL ATTAINMENTS: A HOUSEHOLD LEVEL STUDY OF A BACKWARD MOST DISTRICT OF ASSAM
Baharul Alom Laskar and Sumanash Dutta
70 – 75
PERFORMANCE OF DIESEL ENGINE BY ALTERNATIVE FUEL AS A KARANJA
Dr. Pabbathi Vijaya Rao
76 – 79

CONSUMERS’ PERCEPTION TOWARDS SOCIAL MEDIA MARKETING
Dr. Ravindra Deshmukh and Kavita Kamath
80 – 85
A STUDY ON EMOTIONAL INTELLIGENCE AT WORK PLACE
Dr. Kalpana Deshmukh
86 – 92
AN ANALYSIS OF GROWTH AND PERFORMANCE OF MSMES IN JAMMU AND KASHMIR
Altaf Ahmed and Prof. N. M. P. Verma
93 – 99
MAHMOUD M. AYOUB’S APPROACH TO MUSLIM-CHRISTIAN RELATIONS
Md. Abrarul Haque
100 - 106

International Journal of Advance and Innovative Research Volume 5, Issue 4 (XIX): October - December, 2018
1
ISSN 2394 - 7780
FINANCIAL INCLUSION: AN EMPIRICAL STUDY OF BANKING PRODUCTS AND SERVICES WITH SPECIAL REFERENCE TO SELECTED VILLAGES OF ANANAD DISTRICT OF GUJARAT
STATE
Dr. Bhautik A. Patel1 and Jenita Patel2 Incharge Principal1, Shri D. N. Institute of Business Administration, Anand
Assistant Professor2, SEMCOM, Vallabh Vidyanagar
ABSTRACT Financial Inclusion implies that all having access to financial products and services, for managing their money effectively without social and cultural differences. Globally, most of the nations wish to have high level of financial inclusion of their country but it is not so in many developing and underdeveloped nation. It a policy matter of the country to provide financial services to poor and richer without discrimination. There are many parameters who contribute to financial inclusions such as availability and affordability of financial services, banking facilities and so on is global parameters. In India, Reserve Bank of India has been continuously support for taking number of positive measure to upgrade these kinds of services like installing new ATMs, opening new branch office at village area. The Government of India has also started new schemes i.e., Pradhan Mantri Jan-Dhan Yojana, RuPay debit card and Direct Benefit Transfer scheme for ensuring financial inclusion for all citizens of the nation. Therefore, the present research paper focuses on banking products and services availability, usage pattern of selected villages of Anand district of Gujarat state.
Keywords: Financial Inclusion, Financial services
1. INTRODUCTION People of India have been using banking products and services before independence and post independence also. But after 72 years of independence numbers of people were deprived of services and products which are offered by banks. To provide quality of services of banking Government of India had nationalised 14 banks in 1969 and 6 bank in 1980. To promote private banks Government announced LPG (Liberalization, Privatization and Globalization) in 1991, resulted number of private banks were started their operation. Even after these much efforts citizen of nation do not have their bank account and do not know regarding services and products of banking. Thus, financial inclusion is now a day’s buzz word for policy maker and RBI.
There are many views on financial inclusion and no single definition but some have tried to define financial inclusion. Report of the Committee on Financial Inclusion in India (Chairperson C.Rangarajan) (2008) defines Financial Inclusion as “the process of ensuring access to financial services and timely and adequate credit where needed by vulnerable groups such as weaker sections and low income groups at an affordable cost.”
RBI defines Financial Inclusion as “a process of ensuring access to appropriate financial products and services needed by all sections of the society in general and vulnerable groups such as weaker sections and low income groups in particular, at an affordable cost in a fair and transparent manner by regulated mainstream institutional players”.
Hence, in simple words, “Financial Inclusion implies that all having access to financial products and services, for managing their money effectively without social and cultural differences.”
2. FINANCIAL INCLUSION IN INDIA India is developing nation and to become a developed nation economic growth at a high rate is very essential. There are many factors which can contribute to economic growth are per capita income, affordability and availability of financial services many others. Moreover, citizens of country are having bank accounts they can deposit their money so that deposit can be used by banks for lending money for those who are underprivileged which encourage economic growth. Indian economic growth is very less compare to other countries in the world. One of the reasons for low economic growth is; In India around 60% to 65% people are living in rural area but the real scenario is different in India because of lack of banking facilities in rural area and for poor people. Government of India and Reserve Bank of India has been taking various constructive measures for providing financial services to all citizens.
Government of India has nationalized various banks, started Regional Rural Banks, promoted Cooperatives Banks and allowed private sector banks too. Though many people don’t have bank accounts and deprived from bank services. Current Government lead by Shri Narendra Modi implemented new scheme i.e. Pradhan Mantri Jan-Dhan Yojana, RuPay debit card and Direct Benefit Transfer scheme for ensuring financial inclusion for all citizens of the nation.
International Journal of Advance and Innovative Research Volume 5, Issue 4 (XIX): October - December, 2018
2
ISSN 2394 - 7780
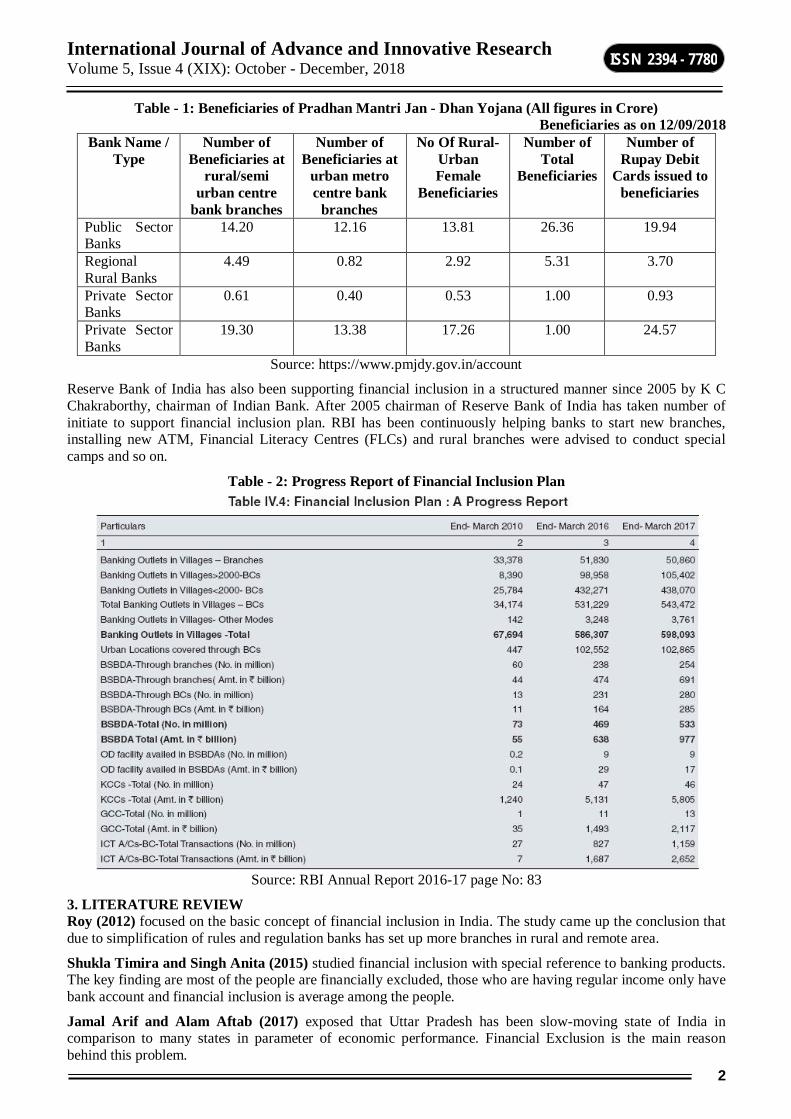
Table - 1: Beneficiaries of Pradhan Mantri Jan - Dhan Yojana (All figures in Crore) Beneficiaries as on 12/09/2018
Bank Name / Type
Number of Beneficiaries at
rural/semi urban centre
bank branches
Number of Beneficiaries at
urban metro centre bank
branches
No Of Rural-Urban Female
Beneficiaries
Number of Total
Beneficiaries
Number of Rupay Debit
Cards issued to beneficiaries
Public Sector Banks
14.20 12.16 13.81 26.36 19.94
Regional Rural Banks
4.49 0.82 2.92 5.31 3.70
Private Sector Banks
0.61 0.40 0.53 1.00 0.93
Private Sector Banks
19.30 13.38 17.26 1.00 24.57
Source: https://www.pmjdy.gov.in/account
Reserve Bank of India has also been supporting financial inclusion in a structured manner since 2005 by K C Chakraborthy, chairman of Indian Bank. After 2005 chairman of Reserve Bank of India has taken number of initiate to support financial inclusion plan. RBI has been continuously helping banks to start new branches, installing new ATM, Financial Literacy Centres (FLCs) and rural branches were advised to conduct special camps and so on.
Table - 2: Progress Report of Financial Inclusion Plan
Source: RBI Annual Report 2016-17 page No: 83
3. LITERATURE REVIEW Roy (2012) focused on the basic concept of financial inclusion in India. The study came up the conclusion that due to simplification of rules and regulation banks has set up more branches in rural and remote area.
Shukla Timira and Singh Anita (2015) studied financial inclusion with special reference to banking products. The key finding are most of the people are financially excluded, those who are having regular income only have bank account and financial inclusion is average among the people.
Jamal Arif and Alam Aftab (2017) exposed that Uttar Pradesh has been slow-moving state of India in comparison to many states in parameter of economic performance. Financial Exclusion is the main reason behind this problem.

International Journal of Advance and Innovative Research Volume 5, Issue 4 (XIX): October - December, 2018
3
ISSN 2394 - 7780
Shastri Aditya (2014) identified that financial inclusion has picked up in India in last few years due to many innovations such as mobile banking, small branches and others in banking products and services but it is still less than required. They have also noted that financial inclusion is in top priority for policy maker in India.
Kapadia Sunil and Madhav Venu (2018) found that policy maker has to concentrate on awareness, financial education about market, administrative reforms, user-friendly environment and many other measures. They have thrown light on people do not take benefits of investment due to lack of knowledge and education.
Dangi Neha and Kumar Pawan (2013) shown that a large no. of population and rural households of India do not have access to banking and other financial services. In addition, new bank branches have been opened and new ATMs have been installed for the purpose of achieving financial inclusion. PSBs and RRBs played a key role in the financial inclusion process. Initiatives have been taken for the implementation of EBT in the process of financial inclusion.
4. RESEARCH METHODOLOGY The present research study is descriptive in nature and the data of five villages of Anand district have been collected to know the level of financial inclusion.
4.1 Objectives of Study The objectives of present study are: 1. To know the level of financial inclusion among the village people of Anand district.
2. To identify the level of awareness, accessibility and usage of banking products and services among different demographic group of users in rural areas of Anand district
4.2 Source of Data For the purpose of present research study primary data have been collected through structured questionnaire from five villages namely Mogri, Sarsa, Vasad, Vehrakhadi, and Bhetasi of Anand district and secondary data have been collected from the various journals, RBI website, RBI annual reports and others.
4.3 Sampling plan Population- People those who live in Villages of Anand Districts
Sampling Unit- People of selected five villages
Sampling Method- Convenient sampling method
Sample Size- 100 respondents (20 respondents each from 5 Villages)
4.4 Statistical tools & techniques applied There are various techniques available for present research study and researchers have used percentage, frequency, cross tabulation, Chi-square analysis and ANOVA (F-Test)
4.5 Data Analysis and Interpretation Table - 3: Demographic Characteristic of Respondent
Variable Characteristics Respondents Percentages (%) Gender Male 73 73 Female 27 27 Total 100 100 Age Up to 25 44 44 26-37 14 14 38-49 28 28 50-60 10 10 above 60 4 4 Total 100 100 Income 0-5000 63 63 5001-10000 13 13 10001-20000 10 10 above 20000 14 14 Total 100 100

International Journal of Advance and Innovative Research Volume 5, Issue 4 (XIX): October - December, 2018
4
ISSN 2394 - 7780
Education Illiterate 18 18 Up to HSC 67 67 Up to Graduation 14 14 Up to PG 1 1 Total 100 100 Occupation Service 16 16 Farmers 12 12 Professionals 2 2 Self Employed 6 6 Business 8 8 Others 56 56 Total 100 100 Availability of bank account Yes 91 91 No 9 9 Total 100 100 Types of Account Saving 80 80 Current 11 11 Don’t have Account 9 9 Total 100 100 Frequency of visit Never 10 10 Twice in month 61 61 Once in week 18 18 Daily 2 2 NA 9 9 Total 100 100 Debit Card Knowledge 80 80 Usage 69 69 Credit Card Knowledge 76 76 Usage 24 24 Kishan credit card Knowledge 32 32 Usage 1 1 Crop Loan Knowledge 39 39 Usage 2 2 Vehicle loan Knowledge 58 58 Usage 22 22 Education Loan Knowledge 56 56 Usage 3 3 Safe Custody (Locker) Knowledge 50 50 Usage 18 18 Home Loan Knowledge 63 63 Usage 7 7 Mobile Banking Knowledge 65 65 Usage 38 38 Mutual Fund Investment Knowledge 33 33 Usage 13 13 ATM Facility available Yes 100 100 Usage Internet Banking Yes 44 44 No 56 56
International Journal of Advance and Innovative Research Volume 5, Issue 4 (XIX): October - December, 2018
5
ISSN 2394 - 7780
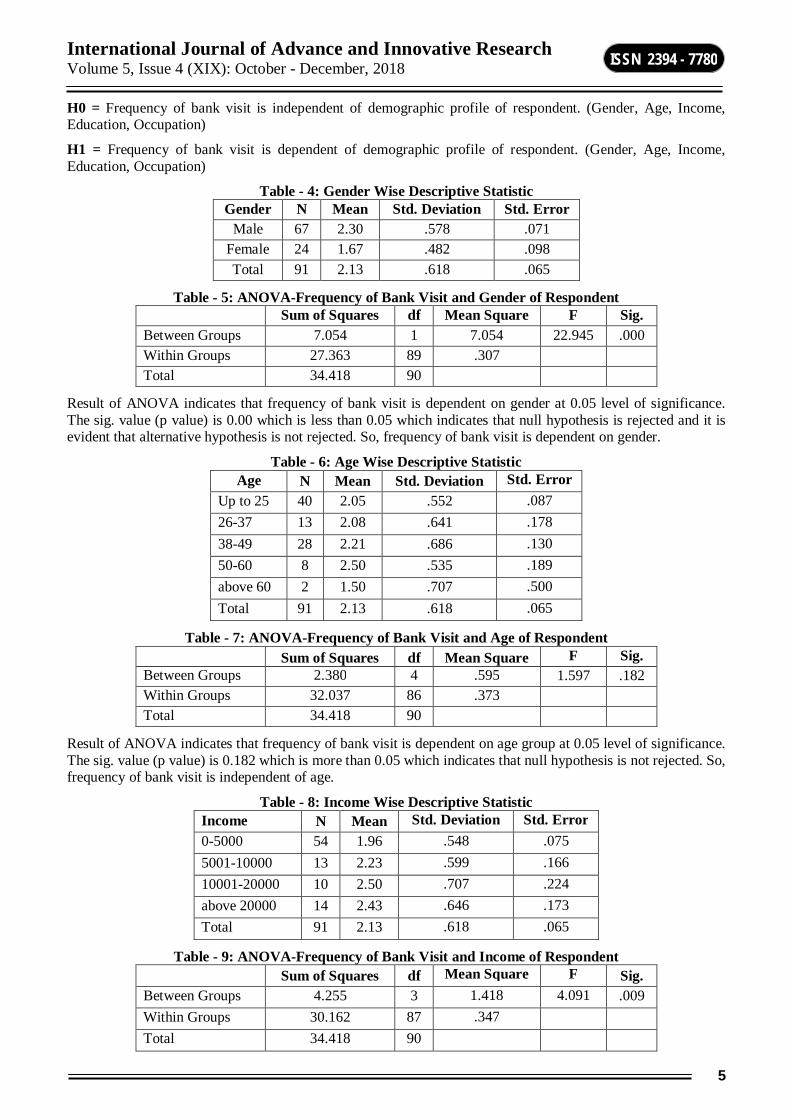
H0 = Frequency of bank visit is independent of demographic profile of respondent. (Gender, Age, Income, Education, Occupation)
H1 = Frequency of bank visit is dependent of demographic profile of respondent. (Gender, Age, Income, Education, Occupation)
Table - 4: Gender Wise Descriptive Statistic Gender N Mean Std. Deviation Std. Error
Male 67 2.30 .578 .071 Female 24 1.67 .482 .098 Total 91 2.13 .618 .065
Table - 5: ANOVA-Frequency of Bank Visit and Gender of Respondent Sum of Squares df Mean Square F Sig. Between Groups 7.054 1 7.054 22.945 .000 Within Groups 27.363 89 .307 Total 34.418 90
Result of ANOVA indicates that frequency of bank visit is dependent on gender at 0.05 level of significance. The sig. value (p value) is 0.00 which is less than 0.05 which indicates that null hypothesis is rejected and it is evident that alternative hypothesis is not rejected. So, frequency of bank visit is dependent on gender.
Table - 6: Age Wise Descriptive Statistic Age N Mean Std. Deviation Std. Error
Up to 25 40 2.05 .552 .087 26-37 13 2.08 .641 .178 38-49 28 2.21 .686 .130 50-60 8 2.50 .535 .189 above 60 2 1.50 .707 .500 Total 91 2.13 .618 .065
Table - 7: ANOVA-Frequency of Bank Visit and Age of Respondent Sum of Squares df Mean Square F Sig. Between Groups 2.380 4 .595 1.597 .182 Within Groups 32.037 86 .373 Total 34.418 90
Result of ANOVA indicates that frequency of bank visit is dependent on age group at 0.05 level of significance. The sig. value (p value) is 0.182 which is more than 0.05 which indicates that null hypothesis is not rejected. So, frequency of bank visit is independent of age.
Table - 8: Income Wise Descriptive Statistic Income N Mean Std. Deviation Std. Error 0-5000 54 1.96 .548 .075 5001-10000 13 2.23 .599 .166 10001-20000 10 2.50 .707 .224 above 20000 14 2.43 .646 .173 Total 91 2.13 .618 .065
Table - 9: ANOVA-Frequency of Bank Visit and Income of Respondent Sum of Squares df Mean Square F Sig. Between Groups 4.255 3 1.418 4.091 .009 Within Groups 30.162 87 .347 Total 34.418 90

International Journal of Advance and Innovative Research Volume 5, Issue 4 (XIX): October - December, 2018
6
ISSN 2394 - 7780
Result of ANOVA indicates that frequency of bank visit is dependent on Income at 0.05 level of significance. The sig. value (p value) is 0.009 which is less than 0.05 which indicates that null hypothesis is rejected and it is evident that alternative hypothesis is not rejected. So, frequency of bank visit is dependent on income.
Table - 10: Education Wise Descriptive Statistic Education N Mean Std. Deviation Std. Error Illiterate 16 1.81 .655 .164 Up to HSC 62 2.21 .604 .077 Up to Graduation 12 2.17 .577 .167 Up to PG 1 2.00 . . Total 91 2.13 .618 .065
Table - 11: ANOVA-Frequency of Bank Visit and Education of Respondent Sum of Squares df Mean Square F Sig. Between Groups 2.039 3 .680 1.826 .148 Within Groups 32.378 87 .372 Total 34.418 90
Result of ANOVA indicates that frequency of bank visit is dependent on education group at 0.05 level of significance. The sig. value (p value) is 0.148 which is more than 0.05 which indicates that null hypothesis is not rejected. So, frequency of bank visit is independent of education.
Table - 12: Occupation Wise Descriptive Statistic Occupation N Mean Std. Deviation Std. Error Service 15 2.40 .507 .131 Farmers 11 2.18 .405 .122 Professionals 2 2.50 .707 .500 Self Employed 6 2.00 .000 .000 Business 8 2.88 .835 .295 Others 49 1.92 .571 .082 Total 91 2.13 .618 .065
Table - 13: ANOVA-Frequency of Bank Visit and Occupation of Respondent Sum of Squares df Mean Square F Sig. Between Groups 8.133 5 1.627 5.260 .000 Within Groups 26.285 85 .309 Total 34.418 90
Result of ANOVA indicates that frequency of bank visit is dependent on occupation at 0.05 level of significance. The sig. value (p value) is 0.00 which is less than 0.05 which indicates that null hypothesis is rejected and it is evident that alternative hypothesis is not rejected. So, frequency of bank visit is dependent on occupation.
H0 = Usage of different banking products and services is independent of knowledge of bank account holders
H1 = Usage of different banking products and services is dependent of knowledge of bank account holders
Table - 14: Chi-Square Tests Services & Products Value df Asymp. Sig. (2-sided) Debit Card 55.645a 1 .000 Credit Card 9.972a 1 .002 Kishan credit card 2.146a 1 .143 Crop Loan 3.192a 1 .074 Vehicle loan 20.424a 1 .000

International Journal of Advance and Innovative Research Volume 5, Issue 4 (XIX): October - December, 2018
7
ISSN 2394 - 7780
Education Loan 2.430a 1 .119 Safe Custody (Locker) 21.951a 1 .000 Home Loan 4.421a 1 .036 Mobile Banking 33.002a 1 .000 Mutual Fund Investment 30.338a 1 .000
The data was analyzed by using chi-square at 0.05 level of significance. The p value <0.05 for different banking products and services such as debit card, credit card, vehicle loan, safety locker, home loan, mobile banking and mutual fund investment. Which indicates that null hypothesis is rejected and it is evident that alternative hypothesis is not rejected. So, use of banking products and services i.e. debit card, credit card, vehicle loan, safety locker, home loan, mobile banking and mutual fund investment is dependent on knowledge of account holder.
While p value >0.05 for different banking products and services such as kishan credit card, crop loan and education loan it means that null is not rejected and all these services (kishan credit card, crop loan and education loan) is independent of knowledge of bank account holder.
H0 = Use of internet banking is independent of demographic profile of respondent. (Gender, Age, Income, Education, Occupation)
H1 = Use of internet banking is dependent of demographic profile of respondent. (Gender, Age, Income, Education, Occupation)
Table - 15: Chi-Square Tests Demographic Profile Value df Asymp. Sig. (2-sided) Gender 3.100a 1 .078 Age 6.975a 4 .137 Income 6.225a 3 .101 Education 7.686a 3 .053 Occupation 7.284a 5 .200
The chi-square test shows that p value>0.05 for use of internet banking and demographic profile (Gender, Age, Income, Education, Occupation) of respondent. Thus, null hypothesis is not rejected and application of internet banking is independent of gender, age, income, education and occupation.
5. FINDINGS 1. It can be seen (Table 3) that majority of respondents are male (73%). 2. It is also highlighted that 44% of total respondent are of below 25 years of age and only 4% are of above
60 years of age. 3. Majority (63%) of the people are having income of up to Rs. 5000 per month and 67% samples are studied
up to HSC. 4. More than half (56%) respondents are doing occupation such as students and home maker only 2% are
professional. 5. 91% sample population have their bank account and rest don’t have even bank account. 6. Out of total sample 80% have saving bank accounts, 11% have current bank account and 9% don’t have
account in the bank. 7. It is found that more than 60% people visits bank twice in a month. 8. It can be identified that 80% people have knowledge about debit card, followed by credit card (76%) and
mobile banking (63%). 9. It is vividly seen that 68%, 67% and 61% people are unaware about Kishan Credit card, Mutual fund
investment and crop loan respectively. 10. It is observed that 1%, 2% and 3% samples use Kishan credit card, crop loan and education loan facility in
order. 11. One noticeable point is all selected villages have ATM facility at their village.
International Journal of Advance and Innovative Research Volume 5, Issue 4 (XIX): October - December, 2018
8
ISSN 2394 - 7780
12. Less than half (44%) respondent use internet banking. 13. Use of banking products and services i.e. debit card, credit card, vehicle loan, safety locker, home loan,
mobile banking and mutual fund investment is dependent on knowledge of account holder and for other banking services and products is independent of knowledge of account holder.
14. Application of internet banking is independent of gender, age, income, education and occupation. 6. CONCLUSION After 7 decades of independence some part of population still deprived from basic banking service. Most of the people don’t know regarding kishan credit card, crop loan. It shows that still Government has to do lot in rural area to make people aware and use the services of banking. Though Government has adopted scheme of Jan Dhan Yojana for opening bank account but some people left from selected villages of Anand district. Every sample village has ATM facility but lack of usage of internet banking thus RBI and Government have to penetrate this service among rural people.
It is also apparent that use of internet banking is not depend on demographic profile and use of some banking products and services like debit card, credit card, mobile banking and so on is depend on awareness of account holder. Hence, Government and RBI should take some measures for awareness of products and services such as kasha credit car, crop loan and education loan. In nutshell, it is said that still some actions are needed in the direction of financial inclusion.
REFERENCES 1. Roy, M., & Chaterjee, T. (2016, October-December). An Analysis of Financial Inclusion. NIRD & PR
Journal of Rural Development, 35(4).
2. Shukla, T., & Singh, A. (2015, September 18-20). Financial Inclusion: An Empirical Study of Banking Products. International Conference on Management and Information Systems, 17-27.
3. Jamal, A., & Alam, A. (2017, September). Status of Financial Inclusion in India: A Conceptual Study with Special Reference to Uttar Pradesh. International Journal of Management Studies, IV (1), 151-161.
4. Shastri, A. (2014, December). Financial Inclusion in Madhya Pradesh: A Study with Reference to Rural Population. Indian Journal of Management & Social Sciences Research, 3 (12), 9-13.
5. Kapadia. S., & Madhav. V. (2018). Financial Literacy and Financial Inclusion in India Revised Paper (Originally meant for- 2ndPolicy Forum on Financial Literacy and Financial Inclusion). International Journal of Pure and Applied Mathematics, 118 (18), 1133-1149.
6. Dangi, N.,& Kumar, P. (2013, August). Current Situation of Financial Inclusion in India and Its Future Visions. International Journal of Management and Social Sciences Research (IJMSSR), 2 (8), 155-166.
7. Aggarwal, V. K. (2014, December). Financial Inclusion in India: An Analytical Study. IRACST – International Journal of Commerce, Business and Management (IJCBM), 3(6), 841-849.
8. Aiyer, S. (2016-17, December-January). Financial Inclusion: An agenda for holistic growth. India Now Business and Economy, 3 (4), 16-19.
9. https://www.pmjdy.gov.in/account retrieved on 19/09/2018
10. Annual Report of RBI for the year 2016-17.
11. https://rbi.org.in
International Journal of Advance and Innovative Research Volume 5, Issue 4 (XIX): October - December, 2018
9
ISSN 2394 - 7780
PRE-PAID METER AND POWER SECTOR REFORMS IN MANIPUR
Yaiphaba Ningthoujam Assistant Professor, CSSEIP, Manipur University, Manipur
ABSTRACT Frequent power cuts and incessant load shedding till the last decade dealt a serious blow to the overall socio- economic development of the state of Manipur. However, since the initiation of the pre-paid meter system in 2011-12, things have changed for the better. The purpose of the present paper is to analyse the overall changes in power supply scenario in the state since the introduction of prepaid meters and ensuing power sector reforms. It also attempts to highlight the shortcomings and problems that the sector still faces. In the process, the paper also shows the disparities among the hill and valley districts of the state in the development of this vital sector.
Keywords: Power, Electricity, Prepaid, Meter, Supply, Manipur, State
1.1 INTRODUCTION It is a well known fact that lack of infrastructure is one of the biggest constraints in the process of growth and development in the state of Manipur. Among infrastructure, the lack of power, a core infrastructure is a major cause of the slow development of the state (GOM, 2008). It has been a perennial problem faced by her people since 1930s when the state began the use of power. Frequent power cuts and load-shedding were the order of the day till the recent past. People had hardly 4-6 hours of electricity per day especially in the lean season and daily routines had to be adjusted according to the pattern of power supply. In short, load shedding had become a way of life of the people of the state. The purpose of the paper is to analyse the changes in power sector after the introduction of pre-paid meter system in Manipur. The paper is divided into six sections. The first section gives an introduction to the whole study while the second section gives a brief review of the introduction of prepaid meter among the countries as well as states in India. While the third section analyses the nature of power supply in Manipur in the recent past as well as present the next section highlights the problems that the sector still faces in the present context in the . The fifth section shows the hill and valley disparities in the development of the sector in the state and the last section conclude.
1.2 THE HISTORY OF PREPAID METER The origin of pre-paid meter dates back to the early end of the 19th century in the United Kingdom. Coin operated pre-paid meters was introduced there for the first time in 1887 for the gas industry which was ultimately adopted by electric utilities also (Deloitte, 2011). From 1980s onwards, the coin operated meters were gradually replaced by metres involving tokens, keys or cards (Owen & Judith, 2010). In South Africa, the installation of pre-paid meters started in 1992 and over six million meters have been installed (Tarannu, et al., 2017). Following the footstep of the success in South Africa many other African countries like Sudan, Madagascar, Zimbabwe, Kenya, Nigeria, Sierra Leone, Ghana etc. have started installation of prepaid electric meters though on a limited and varying scales. In Australia, prepayment meters are used widely in Tasmania and in smaller scale in Northern Territory and South Australia (Owen & Judith, 2010). Argentina and New Zealand have also found favour with the concept of prepaid meters with few thousand installations (Tarannu et al., 2017). Altogether, in around 50 countries, there has been some use of prepayment meters, although some of them are small island states (Owen & Judith, 2010).However, prepayment meters have not found much acceptance in the United States with only a few connections mostly in municipal and corporate utilities in small or rural communities (Delloite,2011). Thus, the prepaid meter system in electricity is confined so far to a few major countries and the system is yet to find favour with most countries due to one reason or the other.
In India, Haryana was the first state to have decided to launch the prepaid meter system in 2004 (The Hindu, 2004). In Delhi, prepaid meter in electricity was installed for the first time in 2005. The Tata Power Delhi Distribution Limited (TPDDL) installed about 3050 meters for domestic consumers at Rohini area during the same year (Powerline, 2017). Further, in 2007 the Power Department of the state decided to install prepaid meters in all state and central government departments as well as autonomous bodies which have a load of above 45 Kw w.e.f 1st July (The Hindu, 2007). In West Bengal, prepaid electric meter was initiated in 2007 by the West Bengal state electricity board in Salt Lake and New Town area (The Times of India, 2007). Prepaid meter was also launched in 2007 in Gujarat in the Umreth division of Madhya Gujarat Vij Company Limited (MGVCL) as a part of DRUM project funded by USAID (Deloitte, 2011). Prepaid meter was initiated Maharashtra in 2011 when MSEDCL started the distribution of meters initially to consumers in Navi Mumbai, Pune, Nagpur, Aurangabad, Kalyan, Kolhapur and other notable tourist spots (The Times of India, 2011).

International Journal of Advance and Innovative Research Volume 5, Issue 4 (XIX): October - December, 2018
10
ISSN 2394 - 7780
Arunachal Pradesh introduced prepaid energy meters and automated remote metering in 2014 and initially 32,000 consumers were planned to be fitted with prepaid units (The Economic Times, 2015). Now, subsequent upon the declaration by the Ministry of Power and New & Renewable Energy, R.K Singh that all electric meters in the country will go prepaid, all the states will initiate the installation of prepaid meters and in matter of time post paid meters will become a thing of the past ( The Economic Times, 2018).
1.3 POWER SUPPLY IN MANIPUR : PAST AND PRESENT Despite the presence of huge hydroelectric power potential in the state, own generation of power in the state is negligible. As a result, it relies heavily on the share of power allocation from central generating stations like NHPC, NEEPCO, OTPC Pallatana Unit I and Baramura power plant to meet her requirements (CRISIL, 2016). However, the power supply from the central sector hydel plants decrease during the lean season consequent upon the recession of water levels in the rain fed water reservoirs (GOM, 2010). The end result is incessant load shedding in the state to the point that electricity has become a luxury for the common people except the so called ‘VIP lines’. In fact, during the lean season the supply of power from the central sources were so poor that even the vital installations like hospital, radio stations, doordharshan kendras and other telecommunications stations could functioned properly (GOM, 2015). Moreover, due to the lack of adequate power supply, whatever small scale industries that survived the political instability in the state met premature deaths (Laithangbam, 2013).
Despite all the darkness, the previous Chief Minister who was also in charge of the ministry of power assured ( in spite of the people’s scepticism) 20 hours of power supply to the consumers daily (The Sangai Express, 2012). In order to fulfill the given assurance, prepaid meters were introduced in 2011 in the core areas of the Imphal in an experiment basis (Kirankumar, 2015). Later it was extended to other parts of the state gradually. In the process, Manipur became the first state in the north east India to install prepaid meter in power supply (Samom, 2016). The installations of prepaid meters was aimed at serving dual functions of weeding out the un-authorised consumers and also to help in cutting down the load along with reducing unnecessary power consumption (Yambem, 2018). Another followed up remarkable reform in the sector was the unbundling of the erstwhile electricity department and corporatizing it into two distinct state owned and functionally independent entities i.e. Manipur State Power Company Limited (MSPCL) as the deemed transmission licensee and Manipur State Power Distribution Company Limited (MSPDCL) as the deemed distributive licensee w.e.f 2014 under the Electricity Act of 2003 (The Sangai Express, 2016). As per provision of the act, two special courts (electricity) were also set up to effectively deal with cases of power theft, tampering of meters etc. and MSPDCL has undertaken several drives and legal action taken thereof against unauthorised and illegal consumers (MSPDCL, 2017). The ensuing reforms resulted in improved power supply in the state, and consequently the duration of power supply in the rural areas increased to about 14 to 18 hours daily while it increased to 24 hours in the urban and state capital (JERC, 2018). Moreover, the installation of prepaid meters instead of open naked low tension (LT) wires has led to the enhancement of the beauty of the state especially in Imphal Town. In fact, the mushrooming or cob webs like electric poles have become a thing of the past (Kirankumar, 2015).
Table – 1: Electricity in Manipur: Improved parameters Year AT & C
Loss (in %)
Collection Efficiency (in
%)
Revenue Collected without govt.
subsidies (in Rs.cr.)
Power Supply Hrs./Day
No. of Consumers
2011-12 58.10 61.18 - - 200137 2012-13 54.14 64.38 - - 215827 2013-14 50.09 71.97 89.66 10-12 229637 2014-15 46.20 83.44 136.57 15-16 258484 2015-16 52.86 82.12 181.11 20-22 280784 2016-17 34.19 91.77 212.00 22-24 436774
SOURCES i) Department of Power, Government of Manipur, Annual Administrative Report, Various Years
ii) MSPDCL, Annual Administrative Report, Various Years
iii) Chandramani, M (2017)

International Journal of Advance and Innovative Research Volume 5, Issue 4 (XIX): October - December, 2018
11
ISSN 2394 - 7780
1.4 MILES TO GO AHEAD Though power sector reform in the state has led to an improved power supply, much still need to be done for the overall improvement of this much vital sector. Despite hugely improved power supply position, shortfall still persists as supply has been unable to meet the ever increasing requirement of power resulting in an increase in the overall shortage of power in the state. The per capita consumption of power of the state is negligible when compared to the all India level. In fact, it is the second lowest among states in India behind Bihar and the lowest in the north eastern states.
Table – 2: Shortfall in energy requirement in Manipur Year Energy
Requirement (MU) Energy Demand
Met (MU) Energy Shortage
(MU) Energy Shortage
(in %) 2012-13 722 646 76 10.5 2013-14 824 681 143 17.3 2014-15 956 692 273 28.5 2015-16 1080 833 247 22.8 2016-17 1241 760 481 38.7
Source: MSPDCL, ARR, 2016-17
Figure - 1: Per capita consumption of electricity in north east India (KWh), 2016-17
Source: https://data.gov.in/
Power sector in Manipur also has a long way to go in terms of improving AT& C loss as well as its financial health. There is still huge gap between the purchase of electricity from outside and revenue collected. According to the report of Comptroller and Auditor General (CAG) of India, MSPDCL is unable to recover a sum of Rs 540 crore as power bill including Rs 68 crores from various government departments up to March 2018. (The People’s Chronicle 2018). In spite of the ensuing power sector reforms in the state, the outstanding dues which could not be collected continue to mount up. In its report on Economic and Revenue Sectors of the Govt. of Manipur for the year ended 2017, the CAG mentioned that the non collection of the outstanding energy charges was detrimental to the overall finances of MSPDCL. It also suggested that the company must take vigorous measures to be able to recover the outstanding dues from the consumers especially the various government departments and institutional consumers (CAG, 2018). Out of the total outstanding due of 540 crores, the four divisions of IED- II, IED- III, IED-IV and Bishnupur account for a total of Rs.353 crores which is about 65 % of the total due.
Figure - 2: Outstanding cumulative energy charges in Manipur (in Rupees Crores)
Source: Comptroller and Auditor General of India, 2018

International Journal of Advance and Innovative Research Volume 5, Issue 4 (XIX): October - December, 2018
12
ISSN 2394 - 7780
Figure 3: Details of outstanding energy charges against the various electrical divisions in Manipur till the end of 2016-17 (in Rupees Crores)
Source: Same as in figure 2
IED- Imphal Electrical Division
The state has also a long way to go in terms of installation of prepaid meters especially in rural and hill areas. As of March 2018, out of the total 4.4 lakh consumers, about 3.38 i.e. 76 % are prepaid users (The Sangai Express, 2018). Nonetheless, the MSPDCL has planned to cover all its consumers in the valley areas as well as the district headquarters in the hill areas with prepaid meters to cover 85 to 90% of the total consumers (CRISIL, 2016).
1.5 HILL AND VALLEY DISPARITIES It is a well known fact that the hill districts of Manipur are less developed than the valley counterparts. There is huge disparity between the hill and valley districts in terms of infrastructure development also (Ningthoujam, 2013). Power sector being no exception, there is a big gap between the hill and the valley when it comes to the consumption of power in the state. In fact, the spread of electricity in the interior areas of the hill districts still remains a major challenge for the administration of the state. In 2015-16, the four valley districts accounted for about 74 % of the total electricity consumption of the state while it is negligible in the hill districts especially Ukhrul and Tamenglong.
Table - 3: District wise electricity consumption, 2015-16 District Total Consumption(MU) Percentage of Total Consumption Senapati 36.28 9.42 Tamenglong 2.32 0.62 Churachandpur 46.73 12.13 Chandel 11.41 2.97 Ukhrul 4.77 1.24 Imphal East 99.44 25.82 Imphal West 111.69 29.00 Bishnupur 33.90 8.80 Thoubal 38.59 10.00 Manipur 385.13 100
Source: GOM, Electricity Department as quoted in Directorate of Economics and Statistics, GOM, Economic Survey, 2016-17.
In terms of both rural electrification and percentages of electrified households also, the hill districts lag far behind the valley districts. As per March 2014, all the four valley districts were fully electrified while the hill districts particularly Churachandpur and Chandel have much catching up to do. There is also a huge disparity among the hill and valley districts when it comes to percentages of electrified households as per 2011 census. Except Thoubal the percentage of electrified household is high in case of the other valley districts while it is high in case of Senapati district only in the hill. Ukhrul and Churachandpur with only 39 % and 47 % of electrified household respectively are at the bottom of this parameter.

International Journal of Advance and Innovative Research Volume 5, Issue 4 (XIX): October - December, 2018
13
ISSN 2394 - 7780
Figure – 4: Percentages of rural electrification among the districts as on 31.03.2014
Source: GOM, Department of Power, AAR, 2013-14
Figure – 5: Percentages of electrified households among the districts as per Census 2011
Source: CRISIL, 2016
1.6 CONCLUSION Power sector in Manipur has seen an enormous transformation since the introduction of prepaid meters. Uninterrupted power supply which was literally unthinkable till the last decade has become a reality now in the state. Yet, the sector has miles to go ahead to be able to provide uninterrupted quality power supply to every nook and corner of the state. In several parameters like per capita consumption, AT & C loss, cost of power supply, etc. the state lags behind the other states by a huge margin. The inability of MSPDCL to collect the huge outstanding electricity charges from the consumers is detrimental to the overall health of this vital sector threatening to undone whatever progress that the sector have achieved recently. The underdevelopment of this critical infrastructure especially in the hill districts magnified by the slow penetration of prepaid meters there is also a cause of worry. Much has improved in terms of power supply since the initiation of prepaid meter system in the state yet more need to be done and the need of the hour is to complete the installation of prepaid metres throughout the state and devise ways to collect the outstanding dues from the consumers in a win -win situation.
REFERENCES CAG (2018). Report of the Comptroller and Auditor General of India on Economic and Revenue Sector for
the Year ended 31 March 2017, GOM, Report No. 1 of 2018.
Chandramani, M. (2017). Manipur State Power Distribution Company Limited (MSPDCL) post Feb’2014: prepaid meter and reduction of AT & C loss [Power point slides]. Retrieved fromhttps://www.uday.gov.in/images/Success_ story_MrChandramani_MSPDCL.pdf
CRISIL (2016). 24X7 Power for all- Manipur: A joint initiative of govt. of India and govt. of Manipur. Retrieved from https://powermin.nic.in/sites/.../joint_initiative_of_govt_of_india_and_manipur. pdf
Deloitte (2011). Evolving measures for the effective implementation of prepaid metering in the country. Retrieved from www.forumofregulators.gov.in/.../ Reports/Evolving % 20 measures % 20 for % 20the % 20e..... .
GOM, Department of Power (2014). Annual Administrative Report, 2013-14.
GOM, Directorate of Economics and Statistics (2008). Economic Survey, Manipur, 2007-08

International Journal of Advance and Innovative Research Volume 5, Issue 4 (XIX): October - December, 2018
14
ISSN 2394 - 7780
________________ (2010). Economic Survey, Manipur, 2009-10.
________________ (2015). Economic Survey, Manipur, 2014-15.
________________ (2017). Economic Survey, Manipur, 2016-17.
Joint Electricity Regulatory Commission (JERC) for Manipur and Mizoram (2018) .Tariff order : True up for FY 2016-17, review for FY 2017-18 and determination of aggregate revenue requirement for MYT period FY 2018-19 to 2022-2013 & retail tariff for FY2018-19 for MSPDCL, Petition (ARR & Tariff ) No. 1 of 2018.
Kirankumar, Th. (2015). Power theft and pre-paid metering in Manipur, Manipur Today, 15th August, DIPR, GOM.
Laithangbam, Iboyaima (2013, March 18). Manipur reels under power shortage. The Hindu. Retrieved from https://www.thehindu.com › Today's Paper › NATIONAL
MSPDCL (2017), Annual Administrative Report, 2016-17.
Ningthoujam, Yaiphaba (2013). Disparities in development: A study with reference to Manipur. In Singh L. Tombi and Th. Bharat Singh (Eds), Social Exclusion and Inclusive Development Vol. II, (pp.293-316). Sunmarg Publishers & Distributors, New Delhi.
Owen, G. and Judith W. (2010). Smart pre-payment in Great Britain, Published by Sustainability First, Sponsored by Centrica, EdF Energy,E.ON UK,Onstream, Consumer Focus, Energy Saving Trust, National Energy Action, Landis & Gyr,PRI,The Brattle Group, and Ofgem.
Powerline (2017). Metering best practices: solutions to improve operational efficiency. Retrieved from https://powerline.net.in/2017/01/19/metering-best-practices/.
Samom, Sobhapati (2016, Friday, July 01). 3.5 lakhs to get prepaid power by December: Ibobi. The Assam Tribune, Retrieved from www.assamtribune.com/scripts/ detailsnew .asp?id=jul0116/oth050
Tarannu ,M., Durga S. & Dharmendra S. (2017). Electricity theft in India: Its measure and solution. International Journal of Advance Research, Ideas and Innovations in Technology, Vol.3, Issue 5 .pp. 406-409.
The Economic Times (2015, January 5). New metering system in Arunachal to curb power pilferage. Retrieved from https://economictimes.indiatimes.com › News › Politics and Nation
_________ (2018, June 07). All electricity meters to be smart prepaid in 3 years: RK Singh. Retrieved from https://economictimes.indiatimes.com › Industry › Energy › Power
The Hindu (2004, June 25). Haryana to introduce prepaid power meters. Retrieved from https://www.thehindu.com/2004/06/25/stories/2004062507670300.htm
________ (2007, June 12). Delhi government departments ordered to install pre-paid electricity meters. Retrieved from https://www.thehindu.com › Today's Paper › NATIONAL › NEW DELHI
The People’s Chronicle (2018, July 24). 540 crore power bill yet to be recovered in state: report. Retrieved from http://thepeopleschronicle.in/daily/english/1821
The Sangai Express (2012, May, 17). 20 hours of power supply in a day Chief Minister at the helm Retrieved from http://www.thesangaiexpress.com/15685-20-hours-of-power-supply-in/
______________ (2016, July 31). 24X7 power supply by 2019: MSPCL. Retrieved from http://www.thesangaiexpress.com/24x7-power-supply-2019-mspcl/
_____________ (2018, March 20). Rs. 28-32 Crore spent in buying power per month. Retrieved from http://e-pao.net/GP.asp?src=10..200318.mar18
The Times of India (2011, March 2). Government starts giving out prepaid electricity meters in state. Retrieved from https://timesofindia.indiatimes.com/city/mumbai/Govt-starts-giving-out-prepaid-electricity-meters-in-state/articleshow/7606303.cms
_____________ (2007, September 16). Salt Lake get prepaid electric meters. Retrieved from https://timesofindia.indiatimes.com/city/kolkata/Salt-Lake-get-pre-paid-electric-meters/articleshow/ 2373093.cms

International Journal of Advance and Innovative Research Volume 5, Issue 4 (XIX): October - December, 2018
15
ISSN 2394 - 7780
Yambem, Sylvia (2018, November 1 &2). Governance, state capability and public services: power reforms in Manipur, Imphal Times. Retrieved from https://www.imphaltimes.com/e-paper/2018-pdf-archive/150-november-2018-pdf-archive
ACRONYMS ARR Annual Administrative Report
AT &C Aggregate Technical and Commercial
CAG Comptroller and Auditor General
DIPR Department of Information and Public Relations
DRUM Distributive Reform Upgradation Management
GOI Government of India
GOM Government of Manipur
JERC Joint Electricity Regulatory Commission
KWh Kilowatt Hour
LT Low Tension
MGVCL Madhya Gujarat Vij Company Limited
MSEDCL Maharashtra State Electricity Distribution Company Limited
MSPCL Manipur State Power Company Limited
MSPDCL Manipur State Power Distribution Company Limited
MU Million Units
NEEPCO North Eastern Electric Power Corporation Limited
NHPC National Hydroelectric Power Corporation
OTPC ONGC Tripura Power Company Limited
TPDDL Tata Power Delhi Distribution Limited
USAID US Agency for International Development
International Journal of Advance and Innovative Research Volume 5, Issue 4 (XIX): October - December, 2018
16
ISSN 2394 - 7780
AN EMPIRICAL STUDY OF RELATIONSHIP BETWEEN TRAINING DURATION & PROBLEMS OF MICRO ENTREPRENEURS
Dr. Aradhana Chouksey Professor, SAGE University, Indore
ABSTRACT The decisive role played by micro enterprises in creation of job opportunities and contribution in economic development is exceptional in Malwa region of Madhya Pradesh (MP). And microfinance has given thrust to self employment initiative and micro enterprise development. It is the need of hour to study the issues which are barrier in deep rooted sustainability of micro enterprises funded by microfinance. The key intention of carrying out this research is to study the relationship if any between problems faced by micro entrepreneurs and training duration. Unification of qualitative and quantitative research methods was used and data is collected from 722 micro entrepreneurs through focus group interviews by using structured questionnaire. This study draws its result by applying statistical tools like descriptive statistics, ANOVA and Post hoc Tamhane test of multiple comparisons. The findings divulge that there is significant differences exist among the groups formed on the basis of training duration and problems of micro entrepreneurs. Marketing issues remain the major concern for all groups even after attending training. It also further reveals new finding that micro entrepreneurs who attended training above 30 days didn’t have any management issues with their micro enterprises. For policy makers this research seeks reflection on the content and duration of entrepreneurial training for micro entrepreneurs. The scope of potential research is to study the regional need of diverse aspect of entrepreneurial training.
Keywords: Micro Finance, Micro Entrepreneurs, Training, Problems, Training duration.
I. INTRODUCTION Microfinance - a result oriented tool of poverty mitigation contributed remarkably in lifting millions out of poverty by providing financial services with training and capacity building services. It is corroborated in the (Miled & Rejeb, 2015) econometric analysis of data collected from 57 countries that micro credit per capita positively contribute in reducing poverty head count ratio. Microfinance an economic development tool based on philosophy as elaborated by Mohd. Yunus, 2003- “(Microcredit) is based on the premise that the poor have skills which remain unutilized or underutilized. It is definitely not the lack of skills which make poor people poor….charity is not the answer to poverty. It only helps poverty to continue. It creates dependency and takes away the individual’s initiative to break through the wall of poverty. Unleashing of energy and creativity in each human being is the answer to poverty.” Micro Finance services like credit, insurance, saving, remittances and many more at reasonable rate with training and capacity building provide opportunities to poor to improve their living standard by starting their micro enterprise. Micro enterprise as defined by Ministry of micro small and medium enterprises is that in the case of manufacturing unit the investment in plant and machinery should not be more than Rs. 25 lakh and if there is service providing unit then investment in equipment should not be more than Rs. 10 lakh. The person who runs these micro enterprises is known as micro entrepreneur.
Microfinance is provided by mainstream financial institutions viz Commercial banks (CB), Regional rural banks (RRB), Cooperative banks and Small finance banks (SFB). Alternative financial institutions are such institution that’s first and foremost business is providing microfinance and they are known as Micro finance institution (MFI). MFIs can be society registered under the societies registration act, 1860; or a company registered under section 8 of the companies act, 2013; or a trust established under any law for the time being in force; or a body corporate; or any other organization, as may be specified by the Reserve Bank. Usually they are known as NGO (Non Government Organisation) MFI and NBFC (Non Banking Financial Companies) MFI. For both i.e. mainstream financial institutions and alternative financial institutions – a common term ‘Funding Institutions’ is used in this research paper.
Microfinance is provided through various lending models (operating models). The indigenous model of India is SHG-bank linkage programme (SBLP), in this model collateral free loan is provided to members of the group, firstly group is formed by 10-20 members known as self help group (SHG) and after completion of all formalities and training they are linked with any funding institution which provide micro loans to start any income generating activities. Another model is Joint Liability Group (JLG) encompasses 4 to 10 members and key purpose of forming group is to avail loan for starting income generating activities. Loan is provided after completion of training when all members give joint undertaking of repayment of loan in due time to funding institution. Next is individual lending model in which loan is provided when individual complete the training.

International Journal of Advance and Innovative Research Volume 5, Issue 4 (XIX): October - December, 2018
17
ISSN 2394 - 7780
Appropriate entrepreneurial training which inculcate the required skills to run successfully the micro enterprise is the dire need of the Malwa region because of acute poverty, to be precise the population below poverty line (BPL) is very high i.e. above 32% of population is in BPL category in all districts of Malwa region, especially in Barwani and Dhar districts where above 44% of population is in BPL category. Furthermore economically active population is higher than the average of MP i.e. it is above 47% and need meaningful employment other than farming. The best solution is encouragement of micro enterprise development. And total population of Malwa region is 15,53,3178 and whereas registered number of micro, small and medium enterprises (MSME) are 69423 and the ratio of MSME per thousand people is approximately 5 MSME per 1000 people, which is quiet low. And countries having high density of MSME have higher income per capita for e.g. Brunei Darussalam have 122 MSME per 1000 people; Paraguay have 95 MSME per 1000 people; Czech Republic have 85 MSME per 1000 people (Source: World Bank, 2010). It is validated by many researchers that there is positive correlation between higher density of MSME and income per capita (Klapper et al., 2008; Kushmir, et al., 2010).
Besides having low density of MSME in Malwa region, there is high failure rate of micro enterprises funded by microfinance programme of any funding institution observed in previous research and according to discussion with employees of MFIs only 50% micro enterprises are sustainable (Chouksey & Karmarkar, 2017). To prevent higher rate of failure of micro enterprise, training is also provided to inculcate entrepreneurial skills and qualities with micro loans so that they can use their loan effectively and their micro enterprise remain sustainable (Roomi et al., 2009). The content of training is designed in such a way that micro entrepreneurs should learn reasonable financial literacy as well as some basics of job specific, for females generally training of handicraft or embroidery or for males on animal rearing, dairy business, related to agriculture sector etc is provided. The training duration is in the range of namely 1-15 days, 15-30 days and above 30 days. After being trained and getting micro finance services, then also clients are facing numerous issues. The main barriers in sustainability of micro enterprises as identified in our earlier research are the various problems which micro entrepreneurs are consistently confronting namely local business environment, high cost of inputs, management skills, lack of resources and marketing issues (Chouksey, 2018). As a result of intellectual curiosity we conducted this research to study the relationship if any between problems faced by entrepreneurs and training duration.
The order of the paper is as follows as. Section II is literature reviews which highlight the literature on training, its duration and its impact on entrepreneur’s performance. The Section III elaborates the methodology adopted for the study. Section V discusses the results i.e. the relationship between problems and training duration and Section V is conclusion and last Section VI is reference section.
Location of the study: The research is located in a region in west-central northern India, occupies a plateau of volcanic origin in the western part of MP state is known as Malwa region. As per MP government Malwa region covers 10 districts: Shajapur, Agar Malwa Ujjain, Indore, Dewas, Barwani, Dhar, Ratlam, Neemuch and Mandsaur.
OBJECTIVE OF THE STUDY To study the relationship if any between problems faced by micro entrepreneurs and training duration.
II. LITERATURE REVIEW Entrepreneurship is recognized in India as reliable tool for proving meaningful employment to huge economically active population. As per World Bank, 2007- Entrepreneurship serves multiple objectives namely uphold economic growth, enhance employment and productivity in underprivileged regions and it is effective in creating jobs and poverty mitigation. Several researches validate that various facets of entrepreneurship can be taught (Kuratko, 2005). That’s why entrepreneurial training is highly prevalent in current scenario. Knowledge, skills and attitude required to perform a task are systematically developed step by step through training (Armstrong, 2006). (Sen and Taylor, 2007) draw attention in their research that training provided to entrepreneurs develops required set of skills and knowledge which make them better and can lead business on the path of success. Impact of training on performance of micro entrepreneurs is diverse. (Dean & Martin, 2006) impact analysis of post training effects reveals that there is increase in sales, enhancement of knowledge and advancement in business processes was observed. (Swain & Varghese, 2010) training for skill development and marketing training imparted by professionals of NGOs and banks has noteworthy positive impact on assets. Other effects of training is that entrepreneurs are repaying loan on specified time and have more consistent income and upward trend is observed in profit and sales (Frisancho et al., 2008). Furthermore Edgcomb (2002) confirmed in research that training has considerable impact on traits of trainees and ultimate outcomes. (Agha et

International Journal of Advance and Innovative Research Volume 5, Issue 4 (XIX): October - December, 2018
18
ISSN 2394 - 7780
al., 2004) impact analysis of five days business skills training of female microfinance clients demonstrate the enhance quality consciousness, consistent and good repayment rate and faithfulness towards MFI.
Conversely the lack of suitable training is one of the causes of reducing rate of micro and small enterprises (Haider, Asad & Aziz, 2015). And some research highlight that there is no effect of training on poverty mitigation (Uddin, Chowdhary & Ahmad, 2015). (Jennings & Hawley, 1996) numerous entrepreneurial training programmes doesn’t serve the actual need of entrepreneurs. Furthermore (Vesper, 1982) in his research on education for entrepreneurship stated that maximum entrepreneurship programmes fail to develop entrepreneurship, and doesn’t contain suitable resources and produce deficient results. (Botha, 2006) entrepreneurial training programme in present scenario extend from one day to one year and usually are of very short duration and it is not feasible to comprise the entrepreneurial needs and such courses are not suitable when we compare them with other career development courses. But it is confirm that if properly designed entrepreneurship courses will bring success and sustainable micro enterprises (Tambwe, 2015).
It is regrettable that there is not a single region based study which demonstrates the relationship between training duration and problems of micro entrepreneurs, so it is not feasible to compare the research result with similar studies.
III. RESEARCH METHODOLOGY Unification of qualitative and quantitative research methods was used in this research. And multi stage proportionate sampling was employed because population consist of many sub groups namely the micro entrepreneurs of SHG model, JLG model and individual lending model. We use sample size calculator of creative research software to ascertain the sample size of SHG model in which population of total members of SHG in all districts of Malwa region is taken, confidence level of 95% and confidence interval of 04 was taken and sample size calculated was 480 clients. We collected data for 500 clients of SHG model, in absence of base line data in case of JLG and individual lending model we collected data for 160 members of JLG model and 62 individuals. In total we collected data from 722 clients in proportion form all districts of Malwa region. For collection of data we used structured questionnaire which comprises close ended and open ended both type of questions and by using it we conducted focus group interview (FGI) for collection of data. In every FGI it was compulsory that minimum five members will attend the interview in case of SHG; in case of JLG minimum four members will attend the interview and separate interview was conducted for all members of individual lending models. So in case of SHG 100 interview was conducted, in case of JLG 40 interview was conducted and 60 interviews was conducted of members of individual lending models. In total there were 200 cases.
CATEGORICAL VARIABLES IN THE STUDY Training duration: Training duration means time required to complete the training offered by specific
funding institution and it is classified as of different duration namely 1-15 days, 15-30 days and above 30 days.
VARIABLE MEASURED ON INTERVAL SCALE Problems and challenges of Micro Entrepreneurs: To measure the problems and challenges of micro
entrepreneurs we identified 20 variables and the measurement of these variables was done on 5 point likert scale - “Very Small Problem”, “Small Problem”, “Average Problem”, “Big Problem”, “Very Big Problem and problems of micro entrepreneurs were identified by conducting factor analysis in our previous research (Chouksey, 2018) and five factors namely Marketing Issues, Management Skills, Lack of Resources, Local Business Environment and High Cost of Inputs were identified as key problems faced by micro entrepreneurs.
Statistical tool used for data analysis: One way ANOVA was applied to analyse the relationship between training duration and five factors namely Marketing Issues, Management Skills, Lack of Resources, Local Business Environment and High Cost of Inputs. Multiple comparisons was applied to further locate the statistically significant difference between different training duration of (1-15 days, 15-30 days and above 30 days) on Marketing Issues, Management Skills, Lack of Resources, Local Business Environment and High Cost of Inputs.
Secondary data: Secondary data is collected from internal sources and external sources both. While collecting data of SHG their respective banks were contacted to which they were credit linked as well as some data gathered from registers maintained by SHG. Other sources namely Census, SHPI ( Self Help Group Promoting Institution), Nabard, Panchayat office, Regional offices/head office of Commercial Banks, RRB and Cooperative banks, head offices of societies & trusts, Rural Development Department, Directorate

International Journal of Advance and Innovative Research Volume 5, Issue 4 (XIX): October - December, 2018
19
ISSN 2394 - 7780
of Institutional Finance (MP). Additionally secondary data is collected from various reports published by, World Bank, MSME, Nabard, State Government, Private Agencies, Journals, Books, articles of News paper, Websites, Conferences, Seminars and Magazines etc
IV. FINDINGS AND DISCUSSION Sustainability and profitability of micro enterprise is the major concern of micro entrepreneurs. And the chief reason of every micro entrepreneur to be part of SHG or JLG or opting individual lending model is to avail loan and for that they attend compulsory training. Training provided are of various duration but maximum micro entrepreneur specifically 73 percent attended training of 1-15 days, which is a quiet less training duration for such less educated clients. 7.5 percent attended training of 15-30 days, and merely 19.5 percent attended training of above 30 days
Table - I: Descriptive Statistics N Minimum Maximum Mean Std.
Deviation Marketing Issues 200 5.00 23.00 13.9750 3.96776 Management Issues 200 5.00 21.00 10.0350 3.32401 Lack of Resources 200 5.00 15.00 11.6000 2.11242 Local business environment 200 5.00 18.00 11.4500 2.29211 High Cost of Inputs 200 5.00 17.00 10.1000 2.42682 Valid N (list wise) 200
According to the mean listed in descriptive statistics table shows that there is difference in magnitude and intensity of different problems & challenges confronted by microfinance clients. Marketing issues have highest mean (M=13.97) followed by lack of resources (M=11.6) and local business environment (M=11.45) which shows the high magnitude of these problems. And further it reveals that though all the micro entrepreneurs attended training of varied duration but marketing issue remain as the critical problem because in training course there is not much emphasis on marketing. Beside that trainers are also not that resourceful which can train these less educated clients about how to market their products and increase sales.
Relationship between Problems faced by entrepreneurs and Training Duration
Table - II: Descriptive Statistics How many days of Training attended N Min. Max. Mean Std. Deviation
1-15 days Marketing Issues 146 5 23 13.260 3.794 Management Issues 146 5 21 10.335 3.367 Lack of Resources 146 5 15 11.445 2.071 Local Business Environment 146 6 18 11.493 2.361 High Cost of Inputs 146 5 17 10.157 2.498 Valid N (listwise) 144 15-30 days Marketing Issues 15 12 21 15.866 2.642 Management Issues 15 6 18 10.4 3.813 Lack of Resources 15 7 15 11.6 2.501 Local Business Environment 15 5 15 10.666 2.82 High Cost of Inputs 15 7 16 10.466 2.416 Valid N (listwise) 15 Above 30 days Marketing Issues 39 6 23 15.923 4.201 Management Issues 39 5 15 8.769 2.679 Lack of Resources 39 7 15 12.179 2.063 Local Business Environment 39 7 16 11.589 1.742 High Cost of Inputs 39 5 14 9.743 2.160 Valid N (listwise) 39
International Journal of Advance and Innovative Research Volume 5, Issue 4 (XIX): October - December, 2018
20
ISSN 2394 - 7780
The mean listed in above descriptive statistics table shows that there is difference in problem faced by the entrepreneurs and training duration. The higher mean point towards that clients attended training duration of 1-15 days are more concerned to marketing issues (M=13.2) followed by lack of resources (M=11.4) and local business environment (M=11.4). Whereas Clients attended training duration of 15-30 days and above 30 days are more concerned to marketing issues (M=15.9) followed by lack of resources (M=12.7).
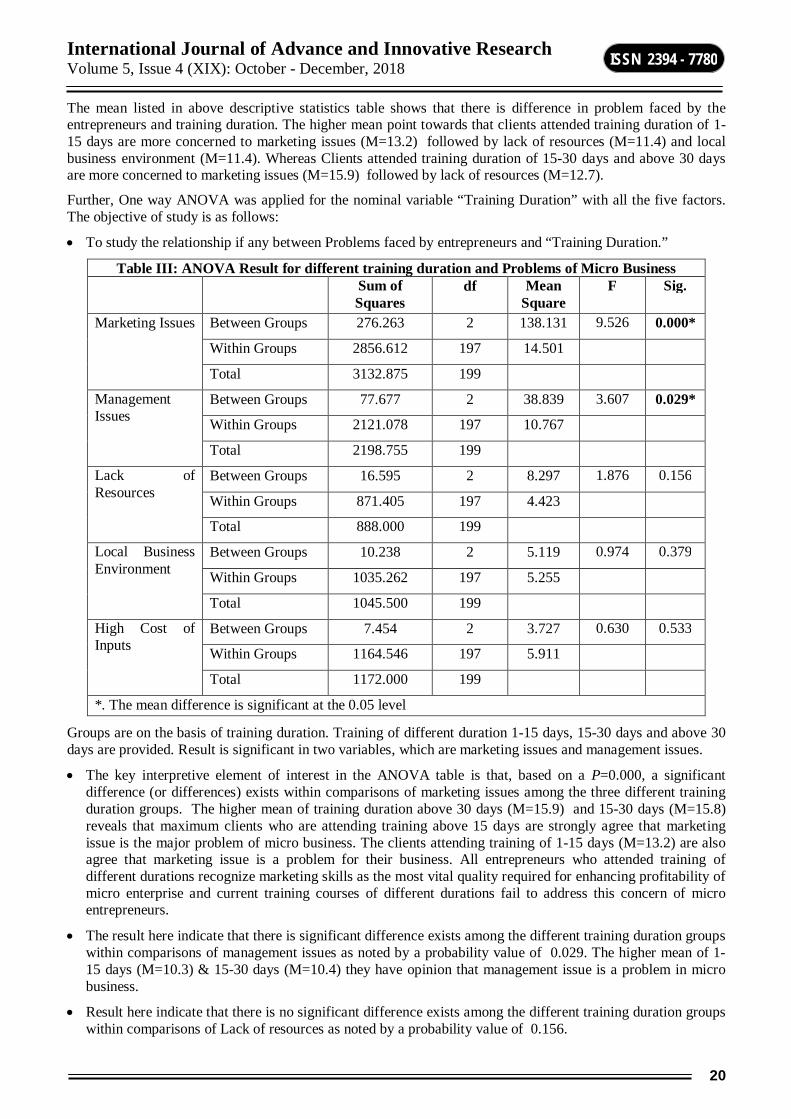
Further, One way ANOVA was applied for the nominal variable “Training Duration” with all the five factors. The objective of study is as follows:
To study the relationship if any between Problems faced by entrepreneurs and “Training Duration.”
Table III: ANOVA Result for different training duration and Problems of Micro Business Sum of
Squares df Mean
Square F Sig.
Marketing Issues Between Groups 276.263 2 138.131 9.526 0.000*
Within Groups 2856.612 197 14.501
Total 3132.875 199
Management Issues
Between Groups 77.677 2 38.839 3.607 0.029*
Within Groups 2121.078 197 10.767
Total 2198.755 199
Lack of Resources
Between Groups 16.595 2 8.297 1.876 0.156
Within Groups 871.405 197 4.423
Total 888.000 199
Local Business Environment
Between Groups 10.238 2 5.119 0.974 0.379
Within Groups 1035.262 197 5.255
Total 1045.500 199
High Cost of Inputs
Between Groups 7.454 2 3.727 0.630 0.533
Within Groups 1164.546 197 5.911
Total 1172.000 199
*. The mean difference is significant at the 0.05 level
Groups are on the basis of training duration. Training of different duration 1-15 days, 15-30 days and above 30 days are provided. Result is significant in two variables, which are marketing issues and management issues.
The key interpretive element of interest in the ANOVA table is that, based on a P=0.000, a significant difference (or differences) exists within comparisons of marketing issues among the three different training duration groups. The higher mean of training duration above 30 days (M=15.9) and 15-30 days (M=15.8) reveals that maximum clients who are attending training above 15 days are strongly agree that marketing issue is the major problem of micro business. The clients attending training of 1-15 days (M=13.2) are also agree that marketing issue is a problem for their business. All entrepreneurs who attended training of different durations recognize marketing skills as the most vital quality required for enhancing profitability of micro enterprise and current training courses of different durations fail to address this concern of micro entrepreneurs.
The result here indicate that there is significant difference exists among the different training duration groups within comparisons of management issues as noted by a probability value of 0.029. The higher mean of 1-15 days (M=10.3) & 15-30 days (M=10.4) they have opinion that management issue is a problem in micro business.
Result here indicate that there is no significant difference exists among the different training duration groups within comparisons of Lack of resources as noted by a probability value of 0.156.

International Journal of Advance and Innovative Research Volume 5, Issue 4 (XIX): October - December, 2018
21
ISSN 2394 - 7780
Result here indicate that there is no significant difference exists among the different training duration groups within comparisons of Local business environment as noted by a probability value of 0.379.
Result here indicate that there is no significant difference exists among the different training duration groups within comparisons of High cost of inputs as noted by a probability value of 0.533.
FOLLOW UP TEST: POST HOC TAMHANE TEST Tamhane test of multiple comparisons is conducted to identify the significant different group means when the ANOVA test was significant.
Table - IV: Multiple Comparisons of training duration and Marketing Issues
(I) How many days of Training attended
(J) How many days of Training
attended
Mean Difference
(I-J)
Std. Error Sig.
95% Confidence Interval
Lower Bound
Upper Bound
0-15 days 15-30 days -2.606* 1.032 0.012* -4.642 -.570
above 30 days -2.662* .686 0.000* -4.016 -1.309 15-30 days
1-15 days 2.606* 1.032 0.012* .570 4.642 above 30 days -0.056 1.156 0.961 -2.338 2.225
above 30 days 1-15 days 2.662* .686 0.000* 1.309 4.016
15-30 days .0564 1.156 0.961 -2.225 2.338 *. The mean difference is significant at the 0.05 level
For each factor (dependent variable), post hoc tests are computed. The above Error! Reference source not found. shows that the mean score for marketing issues were statistically significantly different between 1-15 days and of 15-30 days (P=0.012) and 1-15 days and above 30 days (P= 0.000). The mean score for marketing Issues were not statistically significantly different between 15-30 days and above 30 days (P=0.96). Income generation largely depends on marketing and sales activities and mostly micro entrepreneurs are not able to market their product though quality of product is good. Furthermore due to limited funds it is not feasible to hire any marketing agency.
Table V: Multiple Comparisons of training duration and Management Issues
(I) How many days of Training
attended
(J) How many days of Training
attended
Mean Difference
(I-J)
Std. Error
Sig. 95% Confidence Interval
Lower Bound
Upper Bound
1-15 days 15-30 days -0.0643 0.889 0.942 -1.818 1.690
above 30 days 1.566* 0.591 0.009* 0.400 2.732
15-30 days
1-15 days .0643 0.889 0.942 -1.690 1.818
above 30 days 1.630 0.996 0.103 -0.335 3.596
above 30 days
1-15 days -1.566* 0.591 0.009* -2.732 -0.400
15-30 days -1.630 0.996 0.103 -3.596 0.335
*. The mean difference is significant at the 0.05 level
The above Error! Reference source not found. shows that the mean score for Management Issues were not statistically significantly different between 1-15 days and of 15-30 days (P =0.94) and but statistically significantly different between 1-15 days and above 30 days (P< 0.05). The mean score for Management Issues were not statistically significantly different between 15-30 days and above 30 days (P=0.10). The merit of attending training above 30 days and 15-30 days that micro entrepreneurs are able to manage their business
International Journal of Advance and Innovative Research Volume 5, Issue 4 (XIX): October - December, 2018
22
ISSN 2394 - 7780
more effectively, so training duration more than 15 days serve the purpose and these micro entrepreneurs are able to learn management of business.
V. CONCLUSION It is vital in present scenario to resolve the problems of micro entrepreneurs and the distinctiveness of this research is that it revealed that training duration has significant impact on problems of micro entrepreneurs. It is revealed that if any micro entrepreneur attends training of more than 30 days then they are able to learn the management skills and have no management issues related to their business. Next it is also divulge in research that in training with varied duration provided in current scenario are unable to address the marketing issues. So besides designing content of training it is critical to decide carefully the duration of training also then only benefits of training can be availed. For policy makers this research seeks reflection on the content and duration of entrepreneurial training for micro entrepreneurs. The scope of potential research is to study the regional need of diverse aspect of entrepreneurial training.
VI. REFERENCE I 1. Agha, S., Balal, A., & Okelio, F. O. (2004). “The Impact of a Microfinance Program on Clients
Perceptions of the Quality of Care provided by Private Sector Midwives in Uganda.”Health Service Research, Vol.39 (6 pt 2), pp 2081-2100.
2. Armstrong, M. (2006). “A handbook of human resource management practice.” Kogan page publisher, 10 Eds, New horizons in management, ISBN 0749446315, 9780749446314.
3. Botha, M. (2006). “Measuring the Effectiveness of the Women Entrepreneurship Programmes as a Training Intervention on Potential Start Up & Established Women Entrepreneurs in South Africa.” University of Pretoria etd, South Africa.
4. Chouksey, A. (2018). “An Empirical Study of Key Factors Influencing the Performance of Micro Enterprises.” SJCC Management Research Review, Vol.8 (2), ISSN 2249-4359.
5. Chouksey, A. & Karmarkar, Y. (2017). “Sustainability of Micro business and success of Microfinance - An Empirical study for Madhya Pradesh", Paradigm.Vol.21 (1) pp 1-15, ISSN - 09718907, https:/doi.org/10.1177/0971890717700527; SAGE Publications.
6. Dean, K., & Martin, V. (2011). “Teaching Entrepreneurship: Impact of Business Training on Micro Finance clients and Institutions.”Review of Economics and Statistics, Vol. 93(2), pp 510-527.
7. Edgcomb, E. L. (2002). “What makes for effective micro enterprises training?” Journal of Microfinance, Vol. 4, pp 99-114.
8. Frisancho, V., Karlan, D. S., & Valdivia, M. (2008). “Business training for Microfinance clients: How it matters and for whom? SSRN Electronic Journal, paper no. 1304835, https://doi.org/10.2139/ssrn.
9. HAIDER, S. H., ASAD, M., & AZIZ, A. (2015). “A SURVEY ON THE DETERMINANT OF ENTREPRENEURIAL TRAINING EFFECTIVENESS AMONG MICROFINANCE INSTITUTIONS OF MALAYSIA.”MEDITERRANEAN JOURNAL OF SOCIAL SCIENCES, VOL.6 (6), PP 396-403, DOI 10.5901/MJSS.2015 V6N6S4P396.
10. Jennings, P. L., & Hawley, D. (1996). “Designing Effective Training Programmes.”Proceedings of 19TH INSTITUTE OF SMALL BUSINESS AFFAIRS- SMALL FIRMS NATIONAL CONFERENCE, BIRMINGHAM, PP 1301-1326.
11. Klapper, L., Amit, R., & Guillén, M. F. (2010). “Entrepreneurship and Firm Formation across Countries.” In Lerner, Josh, and Schoar, Antoinette, eds. International Differences in Entrepreneurship. National Bureau of Economic Research Conference Report. Chicago: University of Chicago Press.
12. KURATKO, D.F (2003). “THE EMERGENCE OF ENTREPRENEURSHIP EDUCATION: DEVELOPMENT, TRENDS AND CHALLENGES.” ENTREPRENEURSHIP THEORY AND PRACTICE, VOL. 29(5), PP 577-592.
13. Kushnir, K., Mirmulstein, M.L. & Ramalho, R. (2010). “Micro Small & Medium Enterprises around the World: How many are there and what affects the Count?” MSME Country Indicator, World Bank, IFC.
14. Miled, K. B. H., & Rejeb, J. E. B. (2015). “Microfinance and Poverty Reduction: A Review & Synthesis of Empirical Evidence.” Procedia- Social & Behavioral Sciences, Vol.195, pp 705-712.

International Journal of Advance and Innovative Research Volume 5, Issue 4 (XIX): October - December, 2018
23
ISSN 2394 - 7780
15. ROOMI, M. A., HARRISON, P., & BEAUMONT-KERRIDGE, J. (2009). “WOMEN-OWNED SMALL AND MEDIUM ENTERPRISES IN ENGLAND: ANALYSIS OF FACTORS INFLUENCING THE GROWTH PROCESS.”JOURNAL OF SMALL BUSINESS AND ENTERPRISE DEVELOPMENT, VOL. 16 (2), PP 270-288, HTTPS://DOI.ORG/10.1108/14626000910956056 .
16. SEN, B.A AND TAYLOR, R. (2007): “DETERMINING THE INFORMATION NEEDS OF SMALL AND MEDIUM SIZED ENTERPRISES: A CRITICAL SUCCESS FACTORS ANALYSIS”. INFORMATION RESEARCH, VOL.12, NO.4.
17. SWAIN, R. B., & VARGHESE, A. (2010). “MICROFINANCE PLUS: THE IMPACT OF BUSINESS TRAINING ON INDIAN SELF HELP GROUPS.” WORKING PAPER 2010:24, DEPARTMENT OF ECONOMICS, UPPSALA UNIVERSITY, SWEDEN, ISSN: 1653-6975.
18. TAMBWE, M.A (2015). “THE IMPACT OF ENTREPRENEURSHIP TRAINING ON MICRO AND SMALL ENTERPRISES (MSES) PERFORMANCE IN TANZANIA: THE CASE OF FOOD VENDORS IN ILALA DISTRICT DAR ES SALAAM.” BUSINESS EDUCATION JOURNAL, VOL.1 (1) PP 1-18.
19. Uddin, M. M., Choudhary, M. M., & Ahmad, A. (2015). “The impact of rural development programme on poverty alleviation: A case of Bangladesh.” Global Journal of management & Business Research: A Administration and Management, Vol.15(4), E- ISSN-2249-4588, P-ISSN-0975-5853.
20. VESPER, K. H. (1982). “RESEARCH ON EDUCATION FOR ENTREPRENEURSHIP.” IN ENCYCLOPEDIA OF ENTREPRENEURSHIP, EDS: KENT, SEXTON AND VESPER, ENGLEWOOD CLIFF, N. J. PRENTICE HALL INC.
21. Yunus, M. (2003). “Expanding Microcredit Outreach to Reach the Millennium Development Goals.” International Seminar on Attacking Poverty with Microcredit, Dhaka, Bangladesh.
REFERENCE II Available from https://www.ifc.org/wps/wcm/connec/ 25/11/2018.
Available from worldbank.org/PGLP/Resources/Entrepreneurship/ 26/11/2018.
Available from http://dcmsme.gov.in/data-stat.htm /24/10/18
Available from https://www.censusindia.gov.in/2011 census/ 30/08/2018

International Journal of Advance and Innovative Research Volume 5, Issue 4 (XIX): October - December, 2018
24
ISSN 2394 - 7780
ON QUASI – CONFORMAL RECURRENT AND SYMMETRIC SASAKIAN MANIFOLDS OF SECOND ORDER
K. S. Rawat and Sandeep Chauhan Department of Mathematics, H. N. B. Garhwal University Campus, Badshahi Thaul, Tehri (Garhwal)
ABSTRACT The notion of Sasakian structure was introduce by Sasaki (1960) and Quasi-conformal curvature tensor was defined by Yano and Sawaki (1968). This Curvature tensor has also been defined and studied by Adati & Miyazawa, (1967), Amur and Maralabhavi (1977). Blair (1976) Studied the contact manifold in Riemannian geometry. Yano and Kon (1984) studied an structures on manifolds. Rawat and Dobhal (2008) studied some properties in Kaehlerian manifolds. Further, Rawat and Dobhal (2009) studied bi-recurrent and bi-symmetric Kaehlerian manifolds.
In this paper, we consider Quasi-Conformal curvature tensor in Sasakian recurrent and symmetric manifold of second order and also proved the necessary and sufficient condition for Sasakian manifold with Quasi-Conformal curvature tensor of second order to be Sasakian manifold of second order (for both recurrent and symmetric manifold) and several theorems have been established.
Keywords : Sasakian recurrent manifold, Sasakian symmetric manifold, Quasi-Conformal Curvature tensor.
1. INTRODUCTION Let be a (2m+1) – dimensional differentiable manifold of class covered by a system of Co-ordinate neighbourhoods {U ; } where, here and in the sequel the indices - - - - h ; - - - run over the range {1, 2, 3 - - - , 2 m + 1} Suppose that there are given in a tensor field of type (1,1) a vector field and a 1 – form satisfying
,
… (1.1)
Such a set { F, } is called an almost contact structure and with an almost contact structure is called an almost contact manifold. If, we have
… (1.2)
Where is the Nijenheuis tensor
… (1.3)
Constructed with and , then an almost contact structure is said to be normal and
with a normal almost contact structure is called a normal almost contact manifold.
An almost contact manifold in which a Riemannian metric
… (1.4)
is given as called an almost contact metric manifold in an almost contact metric manifold we denote by . We see that is a skew – symmetric. If an almost contact metric structure satisfies
… (1.5)
Than the almost contact metric structure is said to be contact and a manifold with a normal contact metric structure is called a Sasakian manifold.
In a Sasakian manifold, we have
… (1.6)

International Journal of Advance and Innovative Research Volume 5, Issue 4 (XIX): October - December, 2018
25
ISSN 2394 - 7780
and Ricci-identity is given by
where the (,) denotes the operator of covariant differentiation with respect to the christoffel symbols formed with .
Since is skew – symmetric, is a unit killing vector field.
from equation (1.6) and Ricci-identity , we have
where is the Curvature tensor of the manifold , from which
… (1.7)
where is the Ricci tensor of the manifold, from equation (1.6) and the Ricci-identity, we also find
from which … (1.8)
where using the first Bianchi identity we have from (1.8)
… (1.9)
which shows that is skew – symmetric and Consequently, we have
, … (1.10)
on the other , Since is a Killing vector field, we have
0 ,
where denotes the operator of Lie-derivation with respect to from which using
and (1.10), we get
= 0, … (1.11)
we also have … (1.12)
where R is the scalar curvature of the manifold. The Quasi-conformal curvature tensor is defined by
(1.13)
where a, b are arbitrary Constants s. t. a, b ≠ 0 The contact Bochner Curvature tensor is given by
… (1.14) where
… (1.15)

International Journal of Advance and Innovative Research Volume 5, Issue 4 (XIX): October - December, 2018
26
ISSN 2394 - 7780
… (1.16)
and Consequently
… (1.17)
and
… (1.18)
being defined by
and … (1.19)
now, we shall use the following definitions
Definition (1.1) : A Sasakian manifold is said to be second order recurrent or briefly bi-recurrent if
… (1.20)
for some non-zero tensor field
A Sasakian manifold whose Ricci tensor satisfies the equation
… (1.21)
for some tensor , where is called Ricci – recurrent manifold of second order.
Multiplying (1.21) by , we have
… (1.22)
Note : From (1.20) and (1.21) it is clear that every Sasakian recurrent manifold of second order is Ricci-recurrent manifold of second order, but the Converse is not necessarily true.
2. SASAKIAN RECURRENT MANIFOLD OF SECOND ORDER Definition (2.1) : A Sasakian manifold satisfying the relation
… (2.1)
for some non – zero tensor field will be called Sasakian manifold with recurrent Quasi-conformal curvature tensor of second order.
Definition (2.2) : A Sasakian manifold satisfying the relation
… (2.2)
for some non – zero tensor field will be called Sasakian manifold with recurrent contact Bochner curvature tensor of second order.
Theorem (2.1) : Every Sasakian recurrent manifold of second order is a Sasakian manifold with recurrent Quasi-conformal curvature tensor of second order.
Proof : Differentiating (1.13) covariantly w.r. to , again differentiate the result thus obtained covariantly w.r. to , we have
… (2.3)
Transvecting (1.13) with , than subtracting the result thus obtained from (2.3), we have
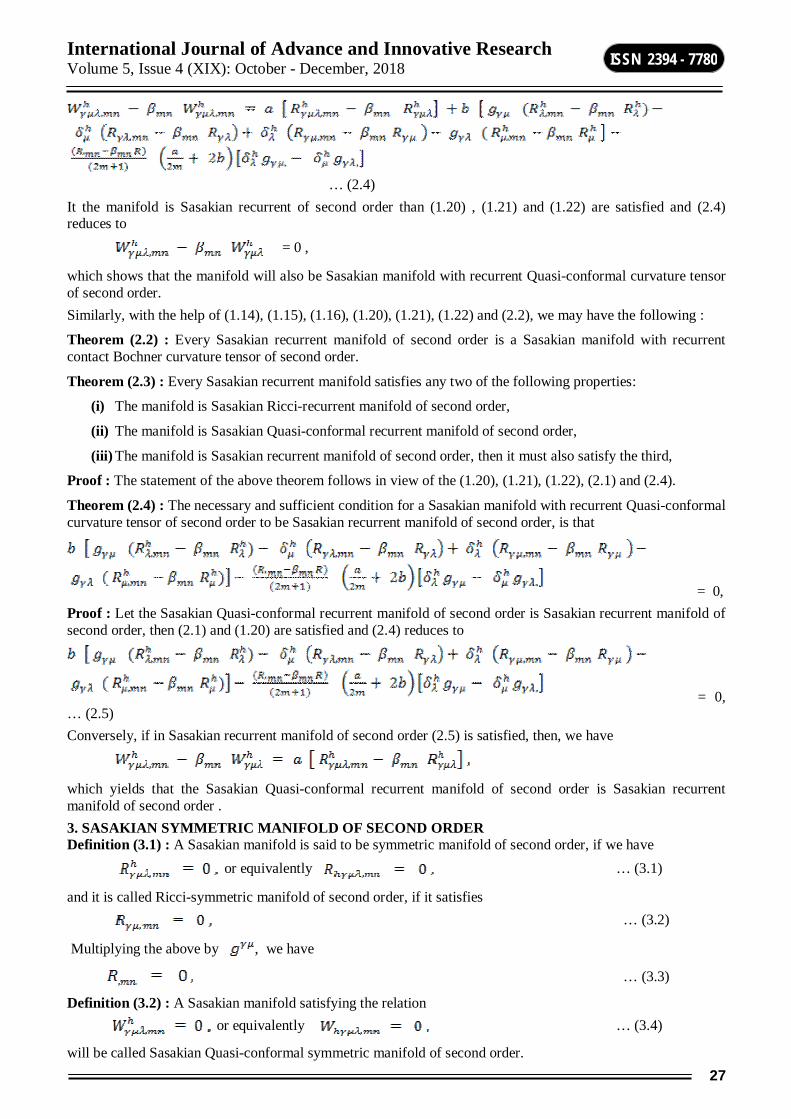
International Journal of Advance and Innovative Research Volume 5, Issue 4 (XIX): October - December, 2018
27
ISSN 2394 - 7780
… (2.4) It the manifold is Sasakian recurrent of second order than (1.20) , (1.21) and (1.22) are satisfied and (2.4) reduces to = 0 ,
which shows that the manifold will also be Sasakian manifold with recurrent Quasi-conformal curvature tensor of second order. Similarly, with the help of (1.14), (1.15), (1.16), (1.20), (1.21), (1.22) and (2.2), we may have the following :
Theorem (2.2) : Every Sasakian recurrent manifold of second order is a Sasakian manifold with recurrent contact Bochner curvature tensor of second order.
Theorem (2.3) : Every Sasakian recurrent manifold satisfies any two of the following properties:
(i) The manifold is Sasakian Ricci-recurrent manifold of second order,
(ii) The manifold is Sasakian Quasi-conformal recurrent manifold of second order,
(iii) The manifold is Sasakian recurrent manifold of second order, then it must also satisfy the third,
Proof : The statement of the above theorem follows in view of the (1.20), (1.21), (1.22), (2.1) and (2.4).
Theorem (2.4) : The necessary and sufficient condition for a Sasakian manifold with recurrent Quasi-conformal curvature tensor of second order to be Sasakian recurrent manifold of second order, is that
= 0, Proof : Let the Sasakian Quasi-conformal recurrent manifold of second order is Sasakian recurrent manifold of second order, then (2.1) and (1.20) are satisfied and (2.4) reduces to
= 0, … (2.5) Conversely, if in Sasakian recurrent manifold of second order (2.5) is satisfied, then, we have
which yields that the Sasakian Quasi-conformal recurrent manifold of second order is Sasakian recurrent manifold of second order . 3. SASAKIAN SYMMETRIC MANIFOLD OF SECOND ORDER Definition (3.1) : A Sasakian manifold is said to be symmetric manifold of second order, if we have or equivalently … (3.1)
and it is called Ricci-symmetric manifold of second order, if it satisfies … (3.2)
Multiplying the above by , we have
… (3.3)
Definition (3.2) : A Sasakian manifold satisfying the relation or equivalently … (3.4)
will be called Sasakian Quasi-conformal symmetric manifold of second order.
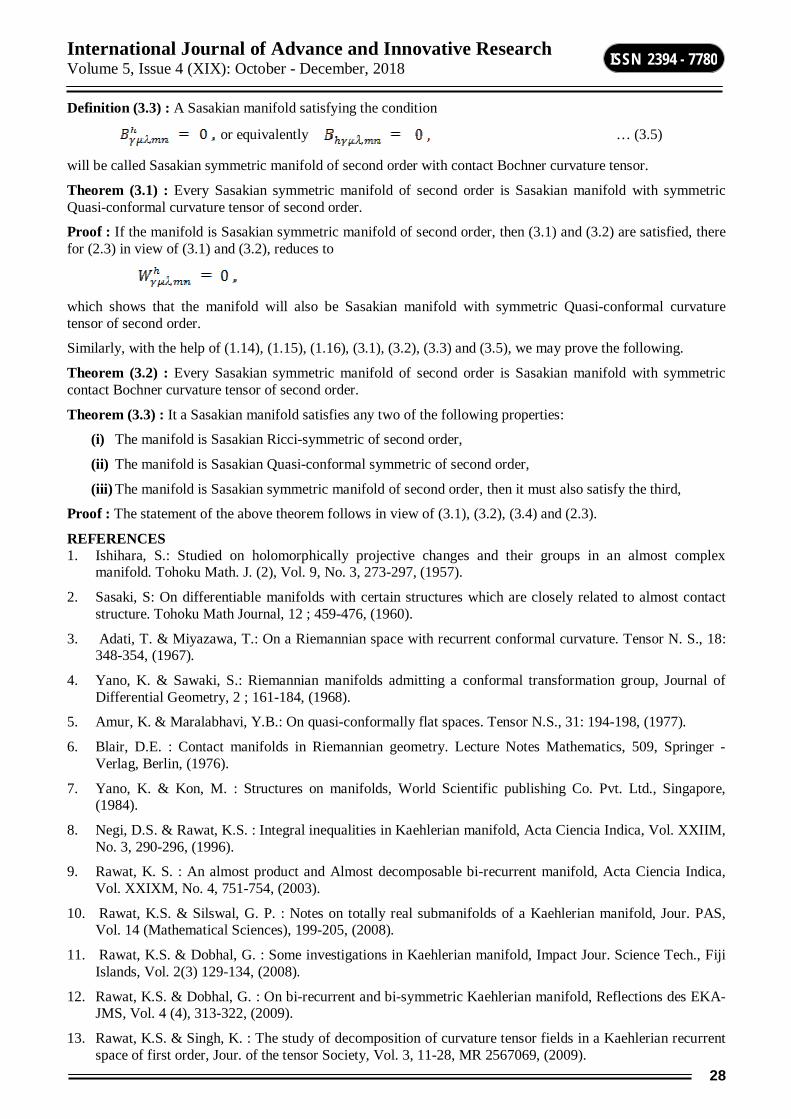
International Journal of Advance and Innovative Research Volume 5, Issue 4 (XIX): October - December, 2018
28
ISSN 2394 - 7780
Definition (3.3) : A Sasakian manifold satisfying the condition
or equivalently … (3.5)
will be called Sasakian symmetric manifold of second order with contact Bochner curvature tensor.
Theorem (3.1) : Every Sasakian symmetric manifold of second order is Sasakian manifold with symmetric Quasi-conformal curvature tensor of second order.
Proof : If the manifold is Sasakian symmetric manifold of second order, then (3.1) and (3.2) are satisfied, there for (2.3) in view of (3.1) and (3.2), reduces to
which shows that the manifold will also be Sasakian manifold with symmetric Quasi-conformal curvature tensor of second order.
Similarly, with the help of (1.14), (1.15), (1.16), (3.1), (3.2), (3.3) and (3.5), we may prove the following.
Theorem (3.2) : Every Sasakian symmetric manifold of second order is Sasakian manifold with symmetric contact Bochner curvature tensor of second order.
Theorem (3.3) : It a Sasakian manifold satisfies any two of the following properties:
(i) The manifold is Sasakian Ricci-symmetric of second order,
(ii) The manifold is Sasakian Quasi-conformal symmetric of second order,
(iii) The manifold is Sasakian symmetric manifold of second order, then it must also satisfy the third,
Proof : The statement of the above theorem follows in view of (3.1), (3.2), (3.4) and (2.3).
REFERENCES 1. Ishihara, S.: Studied on holomorphically projective changes and their groups in an almost complex
manifold. Tohoku Math. J. (2), Vol. 9, No. 3, 273-297, (1957).
2. Sasaki, S: On differentiable manifolds with certain structures which are closely related to almost contact structure. Tohoku Math Journal, 12 ; 459-476, (1960).
3. Adati, T. & Miyazawa, T.: On a Riemannian space with recurrent conformal curvature. Tensor N. S., 18: 348-354, (1967).
4. Yano, K. & Sawaki, S.: Riemannian manifolds admitting a conformal transformation group, Journal of Differential Geometry, 2 ; 161-184, (1968).
5. Amur, K. & Maralabhavi, Y.B.: On quasi-conformally flat spaces. Tensor N.S., 31: 194-198, (1977).
6. Blair, D.E. : Contact manifolds in Riemannian geometry. Lecture Notes Mathematics, 509, Springer -Verlag, Berlin, (1976).
7. Yano, K. & Kon, M. : Structures on manifolds, World Scientific publishing Co. Pvt. Ltd., Singapore, (1984).
8. Negi, D.S. & Rawat, K.S. : Integral inequalities in Kaehlerian manifold, Acta Ciencia Indica, Vol. XXIIM, No. 3, 290-296, (1996).
9. Rawat, K. S. : An almost product and Almost decomposable bi-recurrent manifold, Acta Ciencia Indica, Vol. XXIXM, No. 4, 751-754, (2003).
10. Rawat, K.S. & Silswal, G. P. : Notes on totally real submanifolds of a Kaehlerian manifold, Jour. PAS, Vol. 14 (Mathematical Sciences), 199-205, (2008).
11. Rawat, K.S. & Dobhal, G. : Some investigations in Kaehlerian manifold, Impact Jour. Science Tech., Fiji Islands, Vol. 2(3) 129-134, (2008).
12. Rawat, K.S. & Dobhal, G. : On bi-recurrent and bi-symmetric Kaehlerian manifold, Reflections des EKA-JMS, Vol. 4 (4), 313-322, (2009).
13. Rawat, K.S. & Singh, K. : The study of decomposition of curvature tensor fields in a Kaehlerian recurrent space of first order, Jour. of the tensor Society, Vol. 3, 11-28, MR 2567069, (2009).

International Journal of Advance and Innovative Research Volume 5, Issue 4 (XIX): October - December, 2018
29
ISSN 2394 - 7780
14. Rawat, K.S. & Prasad, V. : On Lie-derivatives of scalars, Vectors and tensors, Pure and Applied Mathematika Sciences, Vol. LXX, No. 1-2, 135-140, (2009).
15. Rawat, K.S. & Kumar, M. : On Curvature Collineations in a Tachibana recurrent space, Aligarh Bull. Math., 28, No.1-2, 63-69, MR2769016, (2009).
16. Rawat, K.S. & Prasad, V. : On holomorphically projectively flat parabolically Kaehlerian spaces, Rev. Bull. Cal. Math. Soc., 18(1), 21-26, (2010).
17. Rawat, K.S. & Uniyal, N. : On Infinitesimal Conformal and Projective transformation of K- space and Kaehlerian recurrent space, International Trans. in Mathematical science and Comp., Vol. 3, No. 2, 205-213, (2010).
18. Rawat, K.S. & Kumar, M. : On hypersurfaces of a Conformally flat Kaehlerian recurrent space, Pure and Applied Mathematika Sciences, Vol. LXXIII, No.1-2, 7-13, (2011).
19. Rawat, K.S. & Uniyal, N. : On Conformal Transformation in an almost Kaehlerian and Kaehlerian spaces, Jour. of Progressive science, Vol. 2, No. 2, 138-141, (2011).

International Journal of Advance and Innovative Research Volume 5, Issue 4 (XIX): October - December, 2018
30
ISSN 2394 - 7780
FINE SCALE CHARACTERIZATION OF GREEN SYNTHESIZED SILVER NANOPARTICLE USING ABELMOSCHUS ESCULENTUS
R. Christynal Oliviya1, Dr. S. Krishnakumari2 and Research & Development Centre3 Assistant Professor1, Department of Biotechnology, Lady Doak College, Madurai
Associate Professor2, Department of Biochemistry, Kongu Nadu Arts and Science College, Coimbatore Research and Development Centre3, Bharathiar University, Coimbatore
ABSTRACT Nanoscale devices differ from the conventional methods of diagnosing and treating diseases, and give certain advantages over them. Several metals are used for the preparation of nanoparticles. Among them, silver plays a major role in the field of nanotechnology because of its unique property as larger surface area to volume ratio. The present study focused on characterization of silver nano particle synthesized using Abelmoschus esculantus which has justified quantity of phytochemicals. This property of the chosen plant gave an intuition to produce pharmacologically useful drug for the treatment of certain diseases such as inflammation, diabetes and some bacterial diseases. It was understood that the efficacy of the drug was enhanced when it is in smaller size. So the plant extract was used to prepare silver nano particle by using AgNO3. The prepared nano particle was confirmed and characterized by UV-Vis spectrophotometry, FTIR, EDAX, X-RAY and SEM. All these characterization techniques have revealed that the green synthesised silver nanoparticle was confirmed and they have spherical in shape, uniform surface and high solubility. These characterization studies will make the plant mediated silver nanoparticle as a potent drug for the treatment of various diseases.
Keywords: Abelmoschus esculantus, Silver nano particle, UV-Vis spectrophotometry, FTIR, AFM, X-RAY, SEM
INTRODUCTION Silver nanoparticles (AgNPs) are progressively more used in various fields, including therapeutic, manufacturing purposes, textile, personal care products and food storage due to their unique physical and chemical properties. [1,4,7]. Because of surface to volume ratio, the nanosized silver particles can change physical and chemical properties significantly. So, such metalic nanoparticles have been used for diverse purposes [5,11]. In order to accomplish the necessity of AgNPs, different methods have been used for production of such nanoparticles. Commonly, the physical and chemical methods of synthesis will be very expensive and hazardous [1,3]. Fascinatingly, the biological methods gave high stable and soluble AgNPs with less cost. [1]. After synthesis, it is essential to characterize the exact particle. In order to concentrate on the safety issue to use the full potential of any nano material in the intention of human benefit, in nanodrug, or in the health care manufacturing, it is important to characterize the synthesised nanoparticles before its use. [6,10]. Hence, the present study focuses on the synthesis and possible characterization approaches of silver nanoparticle to be used as an excellent drug for the treatment of various diseases in a small scale at a target site.
MATERIALS AND METHODS Sample collection and Authentication of plant material The fruits ofAbelmoschusesculentus were collected from Melur Village in Madurai District. Authentication of plant was carried out.
Extraction of mucilage (Rishabha malviya, 2011) Abelmoschusesculentus fruits were used for preparatopn of mucilage. Vegetables were washed with water to remove dirt. The seeds were removed and finely chopped and crushed into a mixer. The crushed fruit material was soaked in warm water for 4 h, boiled for 2 h and kept aside for 2 h for release of mucilage into water. The material was squeezed in muslin cloth to remove the mark from the filtrate. The filtrate was used for further study.
Green Synthesis of Silver Nano Particle ( Govindaraju K et al., 2010) To 5ml of plant extract, 100ml of 1mM AgNo3 in 250 ml Erlenmeyer flask. Flasks were kept in a shaker at 200 rpm for 10minutes [pH of the solution was maintained as slightly acidic (6.5-6.8)] Incubated at room temperature for 7 hours. Colour change was observed.
CHARACTERIZATION OF SYNTHESIZED SILVER NANO PARTICLE (i) UV-Visible spectral analysis (Klulkarni et al., 2011) To 0.2ml of the suspension, 2ml of double distilled water was added and measured at 200 nm in UV-VIS Spectrophotometer.

International Journal of Advance and Innovative Research Volume 5, Issue 4 (XIX): October - December, 2018
31
ISSN 2394 - 7780
(ii) Fourier Transform Infrared Spectroscopy Analysis ( Kumaret al., 2014) A drop of sample was mixed with a pinch of KBr powder. It was pelleted out after drying and the pellet was subjected to FTIR spectroscopy.
(iii) Atomic Force Microscopy (Alahmadet al., 2013) A thin film of the sample was prepared on the glass slide by dropping 100µl of the sample on the slide, and was allowed to dry for 5 minutes. The slide was then scanned under AFM. The characterization was carried out at ambient temperature in non-contact mode using silicon nitride tips varying resonance frequencies at a linear scanning rate of 0.5Hz. R spectra were recorded at a resolution of 4500-350 cm˗ⁱ at visible spectrophotometer.
(iv) Energy Dispersive Analysis of X-ray:( EDAX) : (Jeferson C. et.al,.2011) Responsible for surface capping and reducing agent for the Ag nanoparticles synthesized in silver nanoparticles powder from sample for EDAX analysis.
(v) Scanning Electron Microscope (SEM) (Gratzel M: et .al,2001) SEM measurement was carried out to identify the probable biomolecules responsible for surface capping and reducing agent for the Ag nanoparticles produced from plant extract.
(vi) X-ray Diffractions :(XRD) (Gupta R. et al, 1994) XRD measurement was also carried out to identify the possible biomolecules responsible for surface capping and reducing agent for the Ag nano particles synthesized in silver nano particles powder from sample for XRD.
RESULTS AND DISCUSSION GREEN SYNTHESIS OF SILVER NANO PARTICLE
Abelmoschus esculentus Synthesis of silver nanoparticle
Fig: 1- Synthesis of silver nano particle from Abelmoschus esculantus
UV-Visible Spectroscopic Analysis
Fig: 2- UV-Vis absorption spectra of AgNPs synthesized using Abelmoschus esculentus extract
The silver nanoparticle synthesized from the plant extract was characterized by using UV-Visible spectroscopy and the peak obtained was compared with the standard graph to confirm the presence of nanoparticles. The UV spectra of the synthesized AgNPs, gives a sharp absorbance, at 440 nm at room temperature. It has been observed that Surface Plasmon Resonance band position, or the spectral shape doesn’t change. This revealed that the synthesized AgNPs are very stable at room temperature.

International Journal of Advance and Innovative Research Volume 5, Issue 4 (XIX): October - December, 2018
32
ISSN 2394 - 7780
Fourier Transform Infrared Spectroscopy Analysis
Fig: 3 – Fourier Transform Infrared Spectra of AgNPs synthesized from plant extract
Fourier tansform-infrared (FT-IR) analysis was performed to identify the possible biomolecule responsible for the reduction of the Ag⁺ ions. Strong IR bands were observed at 3,416 and 2,920 cm‾¹ corresponds to –OH stretching and aliphatic -C-H stretching respectively. The bands at 1,629cm‾¹ is due to the C = O and C = C stretching, respectively. The spectrum reveals that the carbonyl groups and –OH stretching and the aliphatic group are involved in the reduction of Ag⁺ to Ag. Therefore, it may be concluded that flavonoids, saponins, tannins,are responsible for capping and efficient stabilization.
ATOMIC FORCE MICROSCOPIC ANALYSIS
Fig: 4- AFM image of Silver nano particle synthesised from Abelmoschus esculantas
AFM image revealed that the particle morphology (shape,size). Fig: 4 shows that there were uniformly packed surface with the height of 54nm. And, the size of the particle was about 30nm and shape of the particle was spherical.

International Journal of Advance and Innovative Research Volume 5, Issue 4 (XIX): October - December, 2018
33
ISSN 2394 - 7780
X-RAY DIFFRACTION1010 10.00KXFI
P o sition [°2 Theta ] (C o p p er (C u))
2 0 3 0 4 0 50 6 0 7 0
C o unts
0
1 0 0
2 0 0 o uts id e wo rk 2_ 3 0
Fig: 5– X-Ray diffraction Spectra of AgNPs synthesized from plant extract
Pos. [°2Th.] Height [cts] FWHM [°2Th.] d-spacing [Å] Rel. Int. [%]
27.6975 93.92 0.2676 3.22083 45.79
29.5504 17.11 0.2676 3.02296 8.34
32.1294 205.11 0.3011 2.78596 100.00
46.1505 82.34 0.3178 1.96698 40.14
54.6791 19.50 0.3346 1.67864 9.51
57.3604 18.53 0.3264 1.60506 9.03
The crystalline nature of nanoparticle was confirmed by X-ray diffraction analysis. The diffracted intensities were recorded from pos-°2Th . The interplanar spacing (calculated) values are 3.22083,3.02296, 2.78596,1.96698,1.67864,1.60506 planes respectively and referred with standard. X-ray diffraction is an easy and one of the most important characterization tools used in nano material research field.
SCANNING ELECTRON MICROSCOPIC ANALYSIS
X2.50K X1.0K

International Journal of Advance and Innovative Research Volume 5, Issue 4 (XIX): October - December, 2018
34
ISSN 2394 - 7780
X5.0K X10K
X15K X 20K
X25K X25Ka
Fig: 6-Scanning Electron Microscopy images of Ag NPs synthesized from plant extract at different
magnifications
SEM was performed to determine the morphology, shape and size of nano particles. SEM micrographs obtained by examined the area of 1 μm and 2 μm surfaces reveals that the nanoparticles are spherical in shape and the size is tiny. The SEM image of silver nanoparticles was due to the interactions of the hydrogen bonds and electrostatic interactions between the biological molecules bound to the AgNPs. The shape and smooth surface of AgNPs is due to the presence of phytochemicals like saponins, tannins, flavonoids and phenols found in the chosen plant.

International Journal of Advance and Innovative Research Volume 5, Issue 4 (XIX): October - December, 2018
35
ISSN 2394 - 7780
ENERGY DISPERSIVE ANALYSIS OF X-RAY
(EDX)
Fig: 7 – EDX for AgNPs synthesized from the A. esculentus plant extract
The presence of functional elements in the silver nanoparticles synthesized from the plant extract was characterized by using Energy Dispersive Analysis of X-ray. The elemental composition of AgNPs with reduced ions was observed in Energy Dispersive X-ray Spectroscopy (EDX). The spectra of EDX formed are related to the atomic mass of the elements being detected. The energy dispersive X-ray analysis (EDX) reveals that there is a strong signal at 3 KeV which is generally shown by the metal nanoparticles due to the Surface Plasmon Resonance.
CONCLUSION Hence, the characteristics of nanoparticles, such as size, shape, surface area, solubility, and stability,etc., are necessary to be assessed before examing toxicity or biocompatibility. These unique material goods of silver nanoparticles make them perfect for numerous biomedical technologies including anti inflammation, anti diabetic, anti cancer and antimicrobial applications as well as for use in toxicological studies.
ACKNOWLEDGEMENT We sincerely acknowledge Ms. R. Karthika and Ms. M. Sangavi for their contributions to this work.
REFERENCE 1. Gurunathan S., Lee K.J., Kalishwaralal K., Sheikpranbabu S., Vaidyanathan R., Eom S.H., (2009),
Antiangiogenic properties of silver nanoparticles. Biomaterials. 2009;30:6341–6350. doi: 10.1016/j.biomaterials. 08.008.
2. Gurunathan S., Kalishwaralal K., Vaidyanathan R., Venkataraman D., Pandian S.R., Muniyandi J., Hariharan N., Eom S.H., (2009), Biosynthesis, purification and characterization of silver nanoparticles using Escherichia coli. Colloids Surf. B Biointerfaces. 2009;74:328–335. doi: 10.1016/j.colsurfb.07.048
3. Gurunathan S., Park J.H., Han J.W., Kim J.H., ( 2015), Comparative assessment of the apoptotic potential of silver nanoparticles synthesized by Bacillus tequilensis and Calocybe indica in MDA-MB-231 human breast cancer cells: Targeting p53 for anticancer therapy. Int. J. Nanomed. 10:4203–4222. doi: 10.2147/IJN.S83953.
4. Li L., Hu J., Yang W.,( 2001), Alivisatos A.P. Band gap variation of size- and shape-controlled colloidal CdSe quantum rods. Nano Lett. ;1:349–351. doi: 10.1021/nl015559r.
5. Li W.R., Xie X.B., Shi Q.S., Zeng H.Y., Ou-Yang Y.S., Chen Y.B., (2010), Antibacterial activity and mechanism of silver nanoparticles on Escherichia coli. Appl. Microbiol. Biotechnol. 8:1115–1122. doi: 10.1007/s00253-009-2159-5.
6. Lin P.C., Lin S., Wang P.C., Sridhar R.( 2013), Techniques for physicochemical characterization of nanomaterials. Biotechnol. Adv. 2014;32:711–726. doi: 10.1016/j.biotechadv. 11.006.

International Journal of Advance and Innovative Research Volume 5, Issue 4 (XIX): October - December, 2018
36
ISSN 2394 - 7780
7. Mukherjee P., Ahmad A., Mandal D., Senapati S., Sainkar S.R., Khan M.I., Renu P., Ajaykumar P.V., Alam M., Kumar R., et al.( 2001) Fungus-mediated synthesis of silver nanoparticles and their immobilization in the mycelial matrix: A novel biological approach to nanoparticle synthesis. Nano Lett. 1:515–519. doi: 10.1021/nl0155274.
8. Murdock R.C., Braydich-Stolle L., Schrand A.M., Schlager J.J., Hussain S.M.,( 2008) Characterization of nanomaterial dispersion in solution prior to in vitro exposure using dynamic light scattering technique. Toxicol. Sci. 101:239–253. doi: 10.1093/toxsci/kfm240.
9. Panáček A., Kolář M., Večeřová R., Prucek R., Soukupová J., Kryštof V., Hamal P., Zbořil R., Kvítek L., (2009),Antifungal activity of silver nanoparticles against Candida spp. Biomaterials. 30:6333–6340. doi: 10.1016/j.biomaterials.2009.07.065.
10. Pleus R. (2012), Nanotechnologies-Guidance on Physicochemical Characterization of Engineered Nanoscale Materials for Toxicologic Assessment. ISO; Geneva, Switzerland:
11. Sriram M.I., Kanth S.B.M., Kalishwaralal K., Gurunathan S.,(2010) Antitumor activity of silver nanoparticles in Dalton’s lymphoma ascites tumor model. Int. J. Nanomed. 5:753–762.
12. Sharma V.K., Yngard R.A., Lin Y., (2012) Silver nanoparticles: Green synthesis and their antimicrobial activities. Adv. Colloid Interface. 2009;145:83–96. doi: 10.1016/j.cis.2008.09.002.
13. Wong K.K., Cheung S.O., Huang L., Niu J., Tao C., Ho C.M., Che C.M., Tam P.K. (2009), Further evidence of the anti-inflammatory effects of silver nanoparticles. ChemMedChem. 4:1129–1135. doi: 10.1002/cmdc.200900049.
14. Zhang X-F, Liu Z-G, Shen W, Gurunathan S.,(2016), Silver Nanoparticles: Synthesis, Characterization, Properties, Applications, and Therapeutic Approaches. Yan B, ed. International Journal of Molecular Sciences. 17(9):1534. doi:10.3390/ijms17091534.
15. Zodrow K., Brunet L., Mahendra S., Li D., Zhang A., Li Q., Alvarez P.J.,( 2008), Polysulfone ultrafiltration membranes impregnated with silver nanoparticles show improved biofouling resistance and virus removal. Water Res. 2009;43:715–723. doi: 10.1016/j.watres.11.014.

International Journal of Advance and Innovative Research Volume 5, Issue 4 (XIX): October - December, 2018
37
ISSN 2394 - 7780
DEVELOPMENT OF SCHOOL EDUCATION IN TRIPURA BEFORE THE STATEHOOD
Pratyush Ranjan Deb1, Nimai Chand Maiti2 and Md. Kutubuddin Halder3 Associate Professor1, Department of Education, Women’s College, Agartala
Professor2, 3, Department of Education, University of Calcutta, Alipore Campus, Kolkata
ABSTRACT The state of Tripura, a princely State of the past , witnessed a rapid change in the area of school education. The erstwhile princely State of Tripura merged with the Indian Union on 15th October, 1949 as Group-C State. It became a Union Territory on 1st July, 1963. Tripura became a full-fledged State on 21st January, 1972. The exploration of different sources reveals that Tripura has had a long continuous history of developmental efforts in the area of school education. The rulers of Tripura continued their efforts for a satisfactory development of school education and support for the establishment of new educational institutions was on the rise. But inspite of these attempts made by the rulers of the State the scenario of education was somewhat gloomy up to the period of merger of the State with the Indian Union. Actually, the educational development of the State took shape since the accession of the territory with the Indian Union in October, 1949 and it gained much momentum in the post-merger period. With this context, the present paper aims to study the development of school education in Tripura before achieving the statehood. The paper is based mainly on secondary data collected from Statistical Abstracts published by the Government of Tripura, different Survey Reports, Census Reports and Selected Educational Statistics published by the State Government. Descriptive method of research is used in the present study. According to the present study, Tripura has shown considerable progress in terms of literacy rate, number of schools, number of teachers and students enrolment since the merger of the state to the Indian Union.
INTRODUCTION Tripura is one of the small states of India in terms of area and population. It has a remote location in the north-eastern part of the country. Tripura was a princely ruled State up to the year 1949. Since its accession to the Indian Union in October, 1949, Tripura started the process of democratisation of its government and all round development. As a result of the reorganisation of States in 1956, Tripura became a centrally administered territory. On and from 21st January, 1972 Tripura became a full-fledged State with its own elected legislature. To safeguard the interest of the tribal population the State Government had set up an Autonomous District Council for the tribal areas in January, 1982.
The princely rulers of Tripura wanted to make their state a modern one. The process of transferring Tripura into a modern one was instigated from the year of 1862 by establishing the first school in Tripura for the common people. A very bold step seemed to have been taken by the administration in 1931 – 32 when compulsory primary education was introduced in the State Capital, Agartala, under the State Act 2 of 1932. After the accession of Tripura to the Indian Union, a separate Directorate of Education was created on April 1, 1953 under the orders of the Government of India to implement the developmental activities under the First Five Year Plan. Tripura made rapid strides in different fields of public life after its accession to the Indian Union and her achievements in the field of education have indeed been very rapid and remarkable during the period 1950 to 1972. OBJECTIVES The objectives of the present study are to find out the progress in the area of literacy, number of schools, number of teachers in schools and enrolment of students in schools in Tripura prior to its of Statehood. METHODOLOGY The study being historical survey type and exploratory in nature, mainly descriptive method of research is used. Data were collected from various secondary sources like Economic Survey (Govt. of Tripura), Tripura District Gazetteers (1975), Statistical Abstract, Govt. of Tripura (1960, 1981) etc. FINDINGS To trace the history of educational development of the State of Tripura we must note some important data regarding the growth of literacy. In the year of 1901 only 2.3 per cent of the population could read and write. After a long journey of 70 years this figure raised to 30.98 per cent in 1971. Practically, from the year 1930 the growth of literacy was in an increasing trend. The following table gives the picture of the growth of literacy in the State from the year 1901. The all-India average of literacy is also given for comparison. It is clear from the facts that the growth in the area of literacy shows a successive increase after the merger of the state to the Indian Union.

International Journal of Advance and Innovative Research Volume 5, Issue 4 (XIX): October - December, 2018
38
ISSN 2394 - 7780
TABLE – 1 ( Literacy : TRIPURA vs. INDIA ) YEAR TRIPURA INDIA
MALE FEMALE TOTAL MALE FEMALE TOTAL 1901 4.5 0.2 2.5 9.83 0.60 5.35 1911 6.9 0.8 4.7 10.56 1.05 5.92 1921 14.3 1.1 8.2 12.21 1.81 7.16 1931 4.9 0.4 2.8 14.59 2.93 9.50 1941 12.7 2.5 7.9 24.90 7.30 16.10 1951 24.63 5.58 15.61 24.95 7.93 16.67 1961 29.61 10.19 20.24 34.44 12.95 24.02 1971 40.20 21.19 30.98 39.45 18.72 29.46
Source: (1) Economic Survey 2002-03, Govt. of Tripura, (2) Some Basic Statistics of Tripura – 2002 , Govt. of Tripura
The report about the education in Tripura as found in the Bengal Administration Report for thye year 1874 – 75 shows that the prospect of education in Tripura was far from bright and very little attention was paid to its improvement. There were about 103 boys undergoing instruction at the two existing schools. The number of schools on 31st March, 1879 was 25 against 18 on the same date in 1878 and 1877. Up to the year 1889 -90 mismanagement in the education sector continued and some arrangements for the betterment of educational institutions were made during the year 1890-91. In 1903, the number of schools was 103. The following table gives the picture of the growth in numbers of primary schools and number of pupils in the State from the year 1907-08.
TABLE – 2 (Number of primary schools and students from 1907-08 to 1945-46)
Year Number of schools Number of pupils 1907-08 137 4011 1916-17 125 4842 1926-27 139 4215 1936-37 111 5110 1945-46 123 5115
Source: Tripura District Gazetteers, 1975
A new chapter in the field of educational development in Tripura seems to have begun in the post-independence era. The rapid stride of achievement can be observed in different field including education. Along with the development of primary and basic education the development of the secondary stage school education can also be seen during this period. During this period the trend in the development of education in Tripura is seen to be much more significant as compared to that of the earlier decades. In the field of Primary, Middle or Senior Basic and High Schools the developmental trend after independence begun to be high. It is to be noted here that even as late as 1947, there were only 9 High Schools in the state of Tripura. In the field of High and Higher Secondary Schools a significant developmental trend can be noticed during the period 1960 to 1972. According to the records, it has been found that a moderate increase was noticed in respect of schools of all level during the period 1947 to 1971 (Table – 3 ).
TABLE – 3 Number of Schools during the period 1947 to 1971
Year Primary Schools Middle/S.B. Schools High / H.S. Schools 1947 123 27 19 1948 228 32 21 1949 379 35 21 1950 399 38 23 1955 907 64 28

International Journal of Advance and Innovative Research Volume 5, Issue 4 (XIX): October - December, 2018
39
ISSN 2394 - 7780
1960 1069 73 32 1965 1359 130 70 1970 1344 215 84 1972 1643 339 103
Source: (1) Statistical Abstract (1960), Govt. of Tripura. (2) Statistical Abstract (1981), Govt. of Tripura.
In regard to enrolment the number of students enrolled in in Primary, Middle, High and Higher Secondary schools in fifties shows a moderate increase. As Table 4 indicate, in 1947 number of enrolled students in the Primary section was 5115 and in Middle school section it was 1982. The number of enrolled students in the High and Higher Secondary section was 604 in the same year. In the year 1955 the number of enrolled students in the Primary section was 48495 and in Middle school section it was 5657. The number of enrolled students in the High and Higher Secondary section was 8610 in the same year. During the next five years there was a sudden rise of number of enrolment in Primary, Middle and High and Higher Secondary schools. In the given table (Table 4) we can see the increase in the number of students enrolled in schools of different level up to the year of achievement of statehood of the State of Tripura.
TABLE – 4 Number of Students during the period 1947 to 1971
Year Primary Schools Middle/S.B. Schools High / H.S. Schools Boys Girls Total Boys Girls Total Boys Girls Total
1947 4129 986 5115 1778 204 1982 502 102 604 1948 7356 1432 8788 1894 312 2206 550 182 732 1949 11978 1784 13762 2498 412 2910 689 208 897 1950 12444 1877 14321 2680 498 3178 778 264 1042 1955 38566 9929 48495 4145 1512 5657 6779 1831 8610 1960 48609 23537 72146 7085 2930 10015 8252 3097 11349 1965 75820 44484 120304 8365 3633 11998 19512 9370 28882 1970 74635 47762 122415 31728 20572 52300 24621 15188 39809 1972 - - 172895 - - 41427 - - 21898
Source: (1) Statistical Abstract (1960), Govt. of Tripura. (2) Statistical Abstract (1981), Govt. of Tripura
In both the Middle schools and the High and Higher Secondary schools growth of the number of employment of teachers was very low in the early fifties. As it is reflected in the table 5 , at the primary stage of schooling the participation of teachers has found 221 in the year 1947 and 441 in the year 1950. In the Middle or Senior Basic schools this figure noticed 110 and 136 respectively. In the High School section the participation of teachers has found 116 in the year 1947 and 216 in the year 1950.
TABLE – 5 Number of Teachers during the period 1947 to 1971
Year Primary Schools Middle/S.B. Schools High / H.S. Schools 1947 221 110 116 1948 250 110 148 1949 391 122 158 1950 441 136 216 1955 1847 319 353 1960 2577 538 543 1965 3618 871 1405 1970 3320 2041 2096 1972 4727 2070 1440
Source: (1) Statistical Abstract (1960), Govt. of Tripura. (2) Statistical Abstract (1981), Govt. of Tripura
Given from the table 5 it become evident that the number of teacher employed in all level of schools was not satisfactory in relation to the number of students during the period 1947 to 1950. During the next five years number of teachers employed in Primary and Middle schools raised in a high rate but this increase was showing a slow rate in case of the number of teachers employed in High and Higher Secondary schools. But in the year

International Journal of Advance and Innovative Research Volume 5, Issue 4 (XIX): October - December, 2018
40
ISSN 2394 - 7780
1972 Primary and Middle school section shows a great rise with respect to the number of teachers. While the High and Higher Secondary sections exhibit a remarkable decrease in the number of the same.
CONCLUSION After a very close examination and analysis of various data available it takes a little hesitation to point out that there is, of course, a steady, though slow rate of development in almost every aspect in the field of school education in Tripura since its merger to the Indian Union. A number of lacunae are there which are to be detected and analysed to facilitate in giving suggestions for the future improvement of school education in Tripura. It requires a planned and systematic intervention from the public agencies involved in catering the school education facilities.
REFERENCES 1. De, N. : A Historical Investigation into the Growth and Development of Education in Tripura.
2. Directorate of Economics and Statistics, : Statistical Abstract, 1960 Govt. of Tripura
3. Directorate of Economics and Statistics, : Statistical Abstract, 1981 Govt. of Tripura
4. Directorate of Economics and Statistics, : Economic Survey 2002-03 Govt. of Tripura
5. Directorate of Economics and Statistics, : Some Basic Statistics of Govt. of Tripura, Tripura - 2002
6. Menon, K. D. (Edt.) : Tripura District Gazetteers, 1975

International Journal of Advance and Innovative Research Volume 5, Issue 4 (XIX): October - December, 2018
41
ISSN 2394 - 7780
STUDY OF EMPPLOYEE TURNOVER IN THE TEXTILE MILLS OF NAGPUR REGION
Dr. O. M. Ashtankar Professor, SJCEM, Palghar
ABSTRACT Employees are the crucial assets for any organizations. Lot of money and time is invested in recruiting and retaining them in their organization. In this era of global competition, organizations should develop tangible products as well as provide services which are based on strategies created by employees. This type of employees are extremely important for the organization due to their contribution in the organization which is generally intangible and not easily replicated. Hence, it is essential that the employees’ turnover should be kept at a minimum level. For this, there is a need to develop full understanding of the employee turnover. This paper is an attempt to explore the factors that contributes to employee turnover and measures that can be used to minimize turnover.
Keywords: Turnover, Job, Organization, job satisfaction, factor, wok
INTRODUCTION Kossen, Stan (1991)17 defined the term turnover in terms of amount of movement in and out (of employees) in an organization. Price (1977)29 defined the concept of “turnover” in terms of ratio as the number of organizational members who have left during the relevant period divided by the average number of people in that organization in the period. Organizations invest a lot on their employees for induction, training, developing, maintaining and retaining them in their organization. Hence, the need of the hour is to minimize the employee’s turnover. Although, there is no standard framework for understanding the employees turnover process as whole, a wide range of factors have been found useful in interpreting employee turnover(Kevin et al. 2004)16. Hence, it is essential to have a comprehensive understanding of the employee turnover especially about the sources of employee turnover, effects and strategies that managers may use to minimize turnover. In this era of global competition, organizations must continue to develop tangible products and provide services which are based on strategies created by employees. These employees are extremely important for the organization since their value to the organization is essentially intangible and not easily replicated (Meaghan et al.2002)23. Therefore, organizations must recognize the importance of employees as a major contributors to the efficient achievement of the organization’s goal. While studying the concept of Employee turnover, it was found that the literature on it is divided into three categories: sources of employee turnover, effects of turnover and the strategies to minimize turnover. Some researchers could find that the high turnover rates might have negative effects on the profitability of organizations. Employees leaving the organization normally join the competitors resulting into valuable talent strengthening the competing entities. Voluntary turnover is treated as a managerial problem and the theory has the premise that people leave if they are not satisfied with their jobs and job alternatives are available. Therefore, majority of the studies have focused on voluntary rather than involuntary turnover. In this study also, only voluntary form of turnover has been considered and discussed. The concept has been discussed with reference to the developed model for turnover which incorporates the factors that explain the turnover process. It includes variables related to both job content and external environment factors that explain turnover.
STATEMENT OF THE PROBLEM Various studies on employee turnover have stated reasons as to what factors causes an employee intending to leave his/her organization. In 1959, Frederick Herzberg, a behavioral scientist proposed a two-factor theory or the motivator-hygiene theory. Thereafter many research scholars have tried to identify the factors responsible for employee turnover. But no model can be developed which comprehensively describe the turnover intentions of employees. However, industry specific and climatic dimensions of turnover intentions are not taken up for investigation in any of the earlier research work. According to the opinion of the author, industry specific dimension and climatic conditions also plays an important role in turnover intentions of the employee. Hence, this research work intends to explore the factors responsible for employee turnover in textile mills in Nagpur region.
LITERATURE REVIEW The concept of Employee turnover can be defined as rotation of workers around the labour market; between firms, jobs and occupations; and between the states of employment and unemployment,(Abassi et al., 2000)1.To study the reasons why an employee turnover a framework of Job Context and Job Content has been used by researchers, (Randall et al., 1983)31. An individual is responsible for the Job-Content factors i.e. those factors that are internally controlled such as achievement, responsibility, training, career development, Overall job

International Journal of Advance and Innovative Research Volume 5, Issue 4 (XIX): October - December, 2018
42
ISSN 2394 - 7780
satisfaction and the quality of work itself. Factors which are externally controlled are called as Job-Context factors i.e. the organization is responsible for controlling those factors. Such factors include job security, salary, benefits, recognition, team work, Flexible working arrangements. Various form of organizational Justice and its impact on Job Satisfaction had been investigated by Mahmud Rahman et al. (2015)21. Organizational Justice can be classified into Distributive justice, Procedural justice and interactional justice. Distributive justice is defined as fairness in awarding outcome among employees on the basis of equity, equality and need( Cropanzano et al.,2007)10. Procedural justice states the fairness of distribution process through which outcome is allocated. Leventhal, et al., (1980)19 identified six components of a fair process, these are accuracy, lack of bias, consistency, representation of all concerned, correction and ethics. Interactional justice reflects whether there exists perceived fairness among employees in terms of interpersonal communication. It indicates whether the higher authority treats the employees with dignity and honesty. Cotton, J. and Tuttle, J. (1986)8 had classified employee turnover factors as external factors, structural or work-related factors and personal characteristics of the employees. Meta-analyses confirm many of the conclusions made in earlier qualitative reviews as age, tenure, pay, overall job satisfaction, employment perceptions, and many other variables were found to be stable, reliable correlates with turnover.
Iqra Saeedet al.,(2014)15 in his research work proved the negative relationship between the job satisfaction and turnover intention. When the job satisfaction is greater the turnover intention will be lesser and vice versa. Job satisfaction can be defined as the feeling of an employee of pleasure or satisfaction while doing that job. It can also be defined as a difference between the employees expected and actually received benefits. Turnover intention is directly correlated with Job satisfaction. Therefore, in order to reduce the turnover intentions of employees the organizations should strive hard to minimize the difference and to make their employees more satisfied. Earlier studies indicated that when the employees are more satisfied they do not think of moving to other organization alternatively they leave the organization if they are not satisfied. Yanjuan Zhang,(2016)37 attempted to make a summary on the factors which influence employee turnover and puts forward counter measures from personal factor, organization and work factor, social and economic factor. Personal Factors includes Individual’s own factors mainly include age, gender, education level, marital status, years of working, individual ability, responsibility and so on. Organization and Work factors includes enterprise culture and system, enterprise benefit and prospect, organization scale, salary, payment and promotion, relationship, training, employee involvement, individual work attitude and organizational justice will influence employee turnover. Third factor, Social and Economic factors includes Society’s economic development level, labor market condition, employment system, job opportunities, enterprise property, transportation, housing, education and health care facilities, the cost of living, quality of life etc. Griffith et al.(2000)13 has developed a
Model for turnover which incorporates the factors that explain the turnover process. It includes variables related to both job content and external environment factors that explain turnover. Ahmed A. Abdel-Halim,(1982)5 in his research examined the moderating or buffering effects of two social support variables-support from the work group and from the supervisor-on the relationships of role conflict and ambiguity to intrinsic job satisfaction and job involvement. Abdul Raziqa and Raheela Maulabakhsha,(2014)2 analysed the impact of working environment on employee job satisfaction by quantitative approach. According to their study the impact of working environment on the Job satisfaction of employees is positive. Bad working conditions restrict employees to portray their capabilities and attain full potential, so it is imperative that the businesses realize the importance of good working environment. J. Richard Hackman and Greg R, Oldham,(1975)35 proposes theory that these critical psychological states are created by the presence of five "core" job dimensions. Experienced meaningfulness of the work is enhanced primarily by three of the core dimensions: skill variety, task identity, and task significance. Experienced responsibility for work outcomes is increased when a job has high autonomy. Knowledge of results is increased when a job is high on feedback. The article reports the development of a measurement tool, the Job Diagnostic Survey (JDS), which may be helpful in filling this void in research and action projects involving the redesign of work.
Vishwanath V. Baba and Muhammad Jamal, (1991)36 said that routinization of job context as indicated by employee participation in routine or non-routine shifts and routinization of job content as indicated by task variety, significance, autonomy, identity and feedback would have an impact on the individual’s perceived quality of working life. People working in routine shifts would demonstrate higher levels of job satisfaction, job involvement, organizational commitment and lower levels of work role ambiguity, conflict, overload, job stress, and turnover motivation compared to those who work non-routine shifts. Dan R. Dalton and William D. Todor,( 1993)12, explained a model that stated that the turnover transfer/absenteeism are interdependent phenomena and said that transfer and absenteeism policies within the organization has an impact on the levels of employee turnover .Dan R. Dalton and Idalene F. Kesner,(1986)11, talked about “windfall account” of turnover is based

International Journal of Advance and Innovative Research Volume 5, Issue 4 (XIX): October - December, 2018
43
ISSN 2394 - 7780
on three fundamental premises: 1) new hires are less expensive to maintain in terms of wages and fringe benefits; 2) when certain employees leave, pension payments made by the organization for the benefit of those employees are recovered; and 3) a return is realized on any saved or recovered funds. Pedro Neves and Robert Eisenberger,(2014)27 research work did not find any statistically significant differences across age, gender or education, previous research has shown that such individual differences are important in certain contexts, but meta-analysis found that whereas men take more risks overall, the magnitude of these gender differences varied significantly across domains, and the gender gap decreased significantly among adult. Oldham (1976)25 examined employee satisfaction with four context factor (satisfaction with pay, Job security, co-worker and supervisor), then examined the relationship between a set of five perceived job characteristics with job satisfaction, job involvement, internal motivation and performance. A framework of Job Context and Job Content factors stated by Randall et al. (1983)32 includes all these factors. Following items were identified to measure factors that may cause employee turnover:
JOB CONTEXT FACTORS 1. Salary ( Heathfield, 2008)14. 2. Work-Life balance (Cunningham, 2002)9. 3. Lack of recognition (Campbell, 2004)7. 4. Working conditions.( Rabiyathul Basariya, 2015)31. 5. Organizational Justice.(Al-Salemi, 2013;Matin et al., 2010)3. 6. Incentives and other staff benefits. (Yanjuan Zhang, 2016)37. 7. Motivation (Rhodes and Steers, 1990)33. 8. Effective grievance procedure. (Parimalakanthi. K.et al., 2015)26. 9. Team working - with common goals rather than unhealthy individual rivalries.(Anne Grinyer et al.,2000). 10. Flexible working arrangements (Aminah Ahmad et al., 2008)4 11. A bad match between the employee’s skills and the job (S. Rabiyathul Basariya, 2015)31. Job Content Factors 1. Training and career development. Noe (1999), (Lauri, Benson & Cheney, 1996)18. 2. Perceived Supervisor Support (Rhoades & Eisenberger, 2002; Maertz et al., 2007)34. 3. Low overall job satisfaction (King, 2008; Porter & Steers, 1973)30 4. Lack of challenge and opportunity (Ban & Drahnak-Faller, 2003)6 RESEARCH METHODOLOGY The study is based mainly on primary data collected from the on-roll employees of Textile mills of Nagpur region. As the study is of exploratory in nature, a sample of 283 employees was drawn from eight textile mills. 30% employees from each organization were considered as it is considered good for reaching to generalization. The responses of employees were taken during working hours through a well-defined pretested questionnaire. Secondary data, regarding total number of leaves allowed and total number of leaves availed by the sampled employees, have been taken from unpublished records of the respective organizations for measuring the demographics of employees.
While designing the questionnaire the factors mentioned above regarding job content and job context were considered and responses were collected on five point Likert scale. Pilot testing of the questionnaire was done on a small sample of 20 employees. Appropriate alterations were done & the same was translated in Hindi language to enable the shop floor employees to understand the questions in right sense.
ANALYSIS AND FINDINGS Firstly the scales were tested for unidimensional, reliability. Exploratory Factor Analysis (EFA) was carried out to test if each of the scales was a one-factor model. Indicator and scale reliability estimates were generated.
Table 4.24: KMO and Bartlett’s Test of Sphericity Measures Kaiser-Meyer-Olkin Measure
of Sampling Adequacy (KMO) Bartlett's Test of Sphericity
Approx. Chi-Square
Df Sig.
Job Context Factors .65 380.422 65 .000 Job Content Factors .565 24.61 8 .004
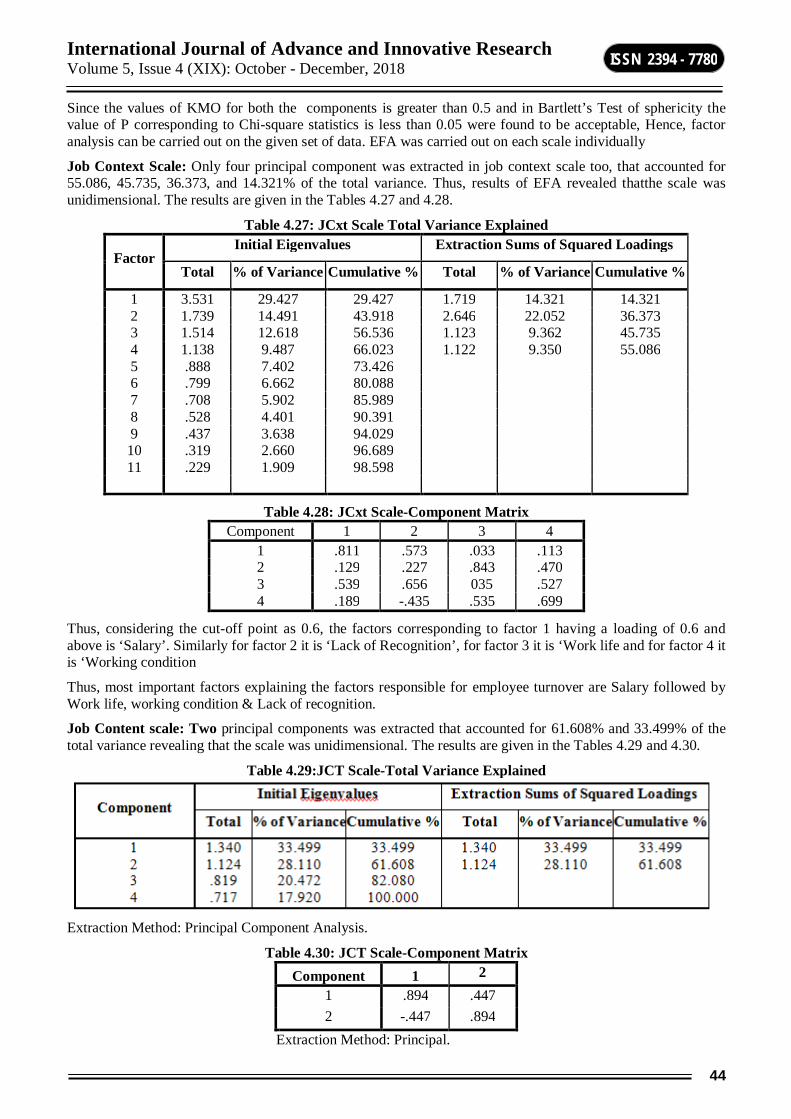
International Journal of Advance and Innovative Research Volume 5, Issue 4 (XIX): October - December, 2018
44
ISSN 2394 - 7780
Since the values of KMO for both the components is greater than 0.5 and in Bartlett’s Test of sphericity the value of P corresponding to Chi-square statistics is less than 0.05 were found to be acceptable, Hence, factor analysis can be carried out on the given set of data. EFA was carried out on each scale individually
Job Context Scale: Only four principal component was extracted in job context scale too, that accounted for 55.086, 45.735, 36.373, and 14.321% of the total variance. Thus, results of EFA revealed thatthe scale was unidimensional. The results are given in the Tables 4.27 and 4.28.
Table 4.27: JCxt Scale Total Variance Explained
Factor Initial Eigenvalues Extraction Sums of Squared Loadings
Total % of Variance Cumulative % Total % of Variance Cumulative %
1 3.531 29.427 29.427 1.719 14.321 14.321 2 1.739 14.491 43.918 2.646 22.052 36.373 3 1.514 12.618 56.536 1.123 9.362 45.735 4 1.138 9.487 66.023 1.122 9.350 55.086 5 .888 7.402 73.426 6 .799 6.662 80.088 7 .708 5.902 85.989 8 .528 4.401 90.391 9 .437 3.638 94.029 10 .319 2.660 96.689 11 .229 1.909 98.598
Table 4.28: JCxt Scale-Component Matrix Component 1 2 3 4
1 .811 .573 .033 .113 2 .129 .227 .843 .470 3 .539 .656 035 .527 4 .189 -.435 .535 .699
Thus, considering the cut-off point as 0.6, the factors corresponding to factor 1 having a loading of 0.6 and above is ‘Salary’. Similarly for factor 2 it is ‘Lack of Recognition’, for factor 3 it is ‘Work life and for factor 4 it is ‘Working condition
Thus, most important factors explaining the factors responsible for employee turnover are Salary followed by Work life, working condition & Lack of recognition.
Job Content scale: Two principal components was extracted that accounted for 61.608% and 33.499% of the total variance revealing that the scale was unidimensional. The results are given in the Tables 4.29 and 4.30.
Table 4.29:JCT Scale-Total Variance Explained
Extraction Method: Principal Component Analysis.
Table 4.30: JCT Scale-Component Matrix Component 1 2
1 .894 .447 2 -.447 .894
Extraction Method: Principal.

International Journal of Advance and Innovative Research Volume 5, Issue 4 (XIX): October - December, 2018
45
ISSN 2394 - 7780
Thus, considering the cut-off point as 0.6, the factors corresponding to factor 1 having a loading of 0.6 and above is ‘Training and Career Development’. Similarly for factor 2 it is ‘Perceived Supervisor Support’. Thus, most important factors explaining the factors responsible for Job Content which results into employee turnover are Training and Career Development and Perceived Supervisor Support.
Scale Reliability After the one-factor model for each study scale is ascertained, estimation of the statistical reliability becomes essential,(Co-oper& Schindler, 2006; Hair et al., 2009). Thus, the scales were tested for reliability.
4.6.1 Reliability Before proceeding with further data analysis, reliability was ascertained.
Indicator Reliability: Indicators are items used to measure a particular construct or latent variable. Indicator reliability presents the reliability of individual indicators. Communalities or indicator reliability are the squared factor loadings for an indicator. It is measured for every single indicator. It may range from 0 to 1 but should preferably be 0.5 or close to it (Schumacker & Lomax,2004; Wu, 2005). In the present study, indicator reliability was more than 0.5 or close to it in most cases. Table 4.31 reveals the indicator reliability for indicators in each scale.
Table 4.31: Indicator Reliability of the Scales Indicator JCxt JNT
1 .950 1.000 2 .863 1.000 3 .947 1.000 4 .940 1.000 5 .720 6 .825 7 .836 8 .757 9 .887 10 .957 11 .830 12 .923
Scale Reliability: Reliability is an assessment of the degree of dependability, stability and internal consistency of a scale. Cronbach alpha is the most common measure used to assess the construct’s internal consistency (Cronbach, 1951). Hair et al. (2009), suggested that the generally agreed upon lower limit for Cronbach alpha is 0.60. Reliability assessment of the study scales returned Cronbach alpha values that are more than the lower acceptable limit of 0.60. Cronbach alpha values given in Table 4.32 suggest high reliability of each scale.
Table 4.32: Scale Reliability Estimates Scale Cronbach Alpha Jcxt .7282 JCT .600
MEASURES FOR REDUCING EMPLOYEE TURNOVER INTENTIONS To counter employee turnover following measures can be adopted The employees should get an opportunity of career and personal growth through training & career
development system.
Fair, transparent and competitive Compensation benefits.
Establishing an effective incentive mechanism.
Counseling for work life balance
Employees should be treated with respect
Continuous monitoring of employees expectations along with counseling or training interventions may be used to influence the thought process of the employees.
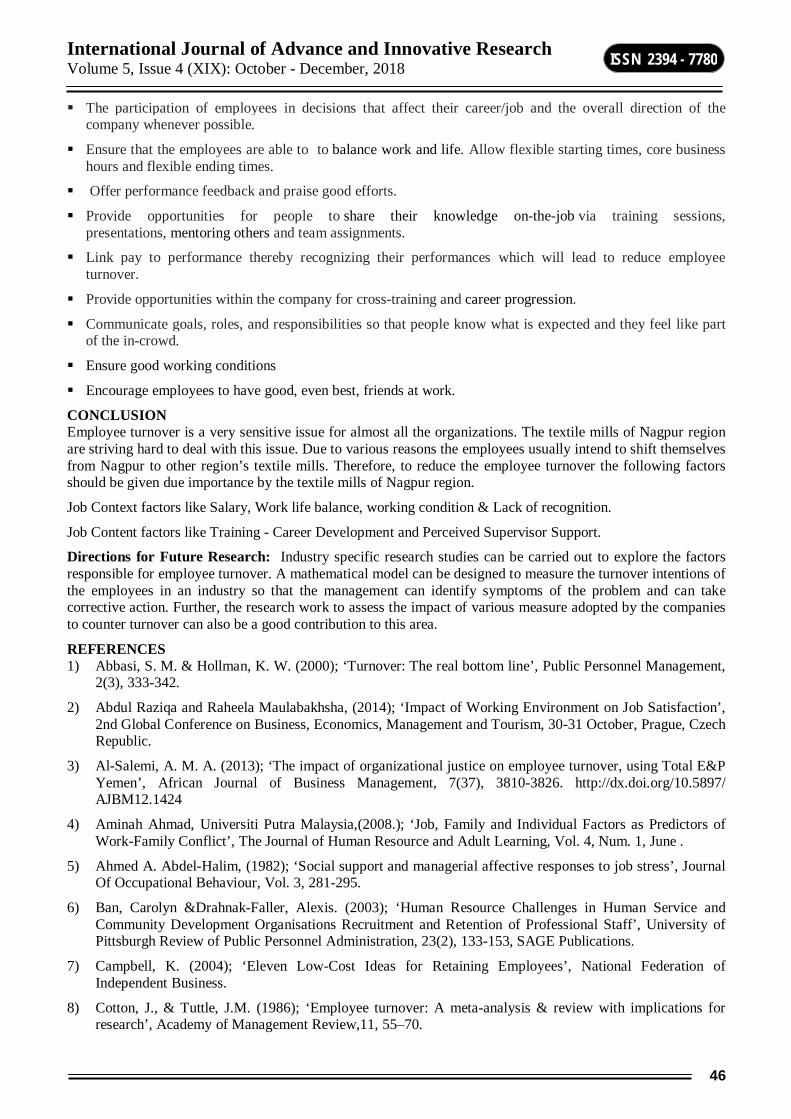
International Journal of Advance and Innovative Research Volume 5, Issue 4 (XIX): October - December, 2018
46
ISSN 2394 - 7780
The participation of employees in decisions that affect their career/job and the overall direction of the company whenever possible.
Ensure that the employees are able to to balance work and life. Allow flexible starting times, core business hours and flexible ending times.
Offer performance feedback and praise good efforts.
Provide opportunities for people to share their knowledge on-the-job via training sessions, presentations, mentoring others and team assignments.
Link pay to performance thereby recognizing their performances which will lead to reduce employee turnover.
Provide opportunities within the company for cross-training and career progression.
Communicate goals, roles, and responsibilities so that people know what is expected and they feel like part of the in-crowd.
Ensure good working conditions
Encourage employees to have good, even best, friends at work.
CONCLUSION Employee turnover is a very sensitive issue for almost all the organizations. The textile mills of Nagpur region are striving hard to deal with this issue. Due to various reasons the employees usually intend to shift themselves from Nagpur to other region’s textile mills. Therefore, to reduce the employee turnover the following factors should be given due importance by the textile mills of Nagpur region.
Job Context factors like Salary, Work life balance, working condition & Lack of recognition.
Job Content factors like Training - Career Development and Perceived Supervisor Support.
Directions for Future Research: Industry specific research studies can be carried out to explore the factors responsible for employee turnover. A mathematical model can be designed to measure the turnover intentions of the employees in an industry so that the management can identify symptoms of the problem and can take corrective action. Further, the research work to assess the impact of various measure adopted by the companies to counter turnover can also be a good contribution to this area.
REFERENCES 1) Abbasi, S. M. & Hollman, K. W. (2000); ‘Turnover: The real bottom line’, Public Personnel Management,
2(3), 333-342.
2) Abdul Raziqa and Raheela Maulabakhsha, (2014); ‘Impact of Working Environment on Job Satisfaction’, 2nd Global Conference on Business, Economics, Management and Tourism, 30-31 October, Prague, Czech Republic.
3) Al-Salemi, A. M. A. (2013); ‘The impact of organizational justice on employee turnover, using Total E&P Yemen’, African Journal of Business Management, 7(37), 3810-3826. http://dx.doi.org/10.5897/ AJBM12.1424
4) Aminah Ahmad, Universiti Putra Malaysia,(2008.); ‘Job, Family and Individual Factors as Predictors of Work-Family Conflict’, The Journal of Human Resource and Adult Learning, Vol. 4, Num. 1, June .
5) Ahmed A. Abdel-Halim, (1982); ‘Social support and managerial affective responses to job stress’, Journal Of Occupational Behaviour, Vol. 3, 281-295.
6) Ban, Carolyn &Drahnak-Faller, Alexis. (2003); ‘Human Resource Challenges in Human Service and Community Development Organisations Recruitment and Retention of Professional Staff’, University of Pittsburgh Review of Public Personnel Administration, 23(2), 133-153, SAGE Publications.
7) Campbell, K. (2004); ‘Eleven Low-Cost Ideas for Retaining Employees’, National Federation of Independent Business.
8) Cotton, J., & Tuttle, J.M. (1986); ‘Employee turnover: A meta-analysis & review with implications for research’, Academy of Management Review,11, 55–70.

International Journal of Advance and Innovative Research Volume 5, Issue 4 (XIX): October - December, 2018
47
ISSN 2394 - 7780
9) Cunningham S. (2002); ‘Retaining Employees in a Competitive World’, Insurance Journal. September 16, 2002, http://www.insurancejournal.com/magazines/insurance-journal-west-2002-09-16/ (date of access 21-6-217, 6.12 pm)
10) Cropanzano, R., Rupp, D.E. and Byrne, Z.S. (2003); ‘The relationship of emotional exhaustion to work attitudes, job performance, and organizational citizenship behaviors’, Journal of Applied Psychology, Vol. 88, pp. 160-169.
11) Dan R. Dalton and Idalene F. Kesner, (1986); ‘The Windfall Account of Employee Turnover Extended: Implications for Two-Tiered Salary Structures’, Journal of Business Research, Volume 14, Issue 3, June, Pages 269-278
12) Dan R. Dalton and William D. Todor,(1993); ‘Turnover, Transfer, Absenteeism: An interdependent Perspective’, Journal of Management, Vol. 19, No. 2, 193-219.
13) Griffeth, R. W., Hom, P. W. &Gaertner, S. (2000); ‘A meta-analysis of antecedents and correlates of employee turnover: Update, moderator test, and research implications for the next millennium’, Journal of Management, 26, 463-488.
14) Heathfield, S.M. (2008); ‘More Tips to Reduce Employee Turnover’, The Lama Review, 20(2), 20., 9, 47.
15) Iqra Saeed, Momina Waseem, Sidra Sikander and Muhammad Rizwan, (2014); ‘The relationship of Turnover intention with job satisfaction, job performance, Leader member exchange, Emotional intelligence and organizational commitment’, International Journal of Learning & Development , Vol. 4, No. 2
16) Kevin MM, Joan LC, Adrian JW (2004); ‘Organizational change and employee turnover’, Personnel Rev. 33 (2):161-166.
17) Kossen, Stan (1991); ‘The Human Side of Organization’, 5th ed.,Harper Collins, New York, 212.
18) Lauri, B., Benson, G and Cheney S. (1996); ‘The top ten trends in training and development’ 11:28-42.
19) Leventhal, G. S. (1980); ‘What should be done with equity theory? New approaches to the study of fairness in social relationships. In K. Gergen, M. Greenberg, & R. Willis (Eds.), Social exchange: Advances in theory and research (pp. 27-55). New York: Plenum.
20) Lewis S. and A. L. Humbert, (2010) “Work-Life Balance, Flexible Working Policies and the Gendered Organization,” Equality, Diversity and Inclusion: An International Jour- nal, Vol. 29, No. 3, pp. 239-254. http://dx.doi.org/10.1108/02610151011028840
21) Mahmud Rahman, Mahbubul Haque, Farzana Elahi and Wafie Miah. (2015); ‘Impact of Organizational Justice on Employee Job Satisfaction: An Empirical Investigation’, American Journal of Business and Management Vol. 4, No. 4, 162-171.
22) Matin, H. Z., Jandaghi, G., & Ahmadi, F. (2010); ‘ A comprehensive model for identifying factors impacting on development of organizational citizenship behavior’, African Journal of Business Management, 4(10), 1932-1945.
23) Meaghan Stovel, Nick Bontis (2002); ‘Voluntary turnover: knowledge management-friend or foe?’, J. intellect. Cap. 3 (3): 303-322.
24) Noe, R.A. (1999); ‘ Employee training and development’, New York: Irwin McGraw-Hill. pp: 212-218.
25) Oldham G.R.Job ( 1976); ‘Characteristics and internal motivation; The moderating effect of inter-personal and individual variables’, Human relations,,29,559-569.
26) Parimalakanthi K. and Divya.V,( 2015); ‘A study on the absenteeism of employees among textile outlets in Palakkad’, International Journal of Advance Research and Innovative Ideas in Education, Vol-1 Issue-5
27) Pedro Neves and Robert Eisenberger, (2014); ‘Perceived organizational support and risk taking’, Journal of Managerial Psychology ,Vol. 29 No. 2, pp. 187-205.
28) Porter, Lyman W. & Steers, Richard M.(1973); ‘Organizational, work, and personal factors in employee turnover and absenteeism’, Psychological Bulletin, 80(2), 151-176.
29) Price, J. L. (1977); ‘The Study of Turnover’, Iowa State University Press, Ames, IA.
International Journal of Advance and Innovative Research Volume 5, Issue 4 (XIX): October - December, 2018
48
ISSN 2394 - 7780
30) Porter, L.W., & Steers, R.M. (1973). Organizational, work, and personal factors in employee turnover and absenteeism. Psychological Bulletin, 80, 151-176.
31) Rabiyathul Basariya S., (2015); ‘Employee Absenteeism in Indian Industries’, International Journal of Science and Research (IJSR) ISSN (Online): 2319-7064 Volume 4 Issue 10, October.
32) Randall B. Dunham,(1983); ‘Job context and job content; A conceptual Perspective’, Journal of Management, vol 9,No2,187-202.
33) Rhoades, L., & Eisenberger, R. (2002); ‘Perceived organizational support: A review of the literature’, Journal of Applied Psychology, 87, 698–714.
34) Richard J. Hackman and Greg R, Oldham, (1975); ‘Development of the Job diagnostic survey’, Journal of Applied Psychology 197S, Vol. 60, No. 2, 159-170
35) Rhodes, S.R., & Steers, R.M. (1990); ‘Managing Employee Absenteeism’, Addison: Wesley Publishing Company.
36) Vishwanath V. Baba and Muhammad Jamal, (1991); ‘ Routinization of job context and job contents related to employees’ quality of working life: A study of Canadian nurses’, Journal Of Organizational Behavior, Vol. 12, 379-386
37) Yanjuan Zhang,(2016); ‘A Review of Employee Turnover Influence Factor and Counter measure’, Journal of Human Resource and Sustainability Studies, 2016, 4, 85-91 Published Online June in SciRes. http://www.scirp.org/journal/jhrss

International Journal of Advance and Innovative Research Volume 5, Issue 4 (XIX): October - December, 2018
49
ISSN 2394 - 7780
A STUDY OF IMPORTANCE OF CASE STUDY METHOD OF TEACHING IN FINANCIAL MANAGEMENT EDUCATION
Dr. CA Shilpa Vasant Bhide Assistant Professor, Department of Management Sciences, Savitribai Phule Pune University, Pune
ABSTRACT Different teaching methodologies are used for teaching financial management subjects. Case study method is one of them. It helps the students not only to understand the subject but also develop analytical skills, communication skills. The paper tries to understand the different aspects of the case study method for the benefit of the students of financial management.
Keywords: Case Study, Financial Management, Education, Theoretical concepts
INTRODUCTION Teaching and learning are unique experiences for the teacher and the student respectively. Teaching can be carried out using various methodologies such as the known methodology of lecture sessions. However, recently various methodologies such as the case study method are being used for the purpose of teaching.
In the case study method of teaching the teacher introduces a case or an example which the students have to analyze. It is generally expected that the case study method helps the students to develop an understanding of the subject. Case study method is an important teaching methodology in the Management domain as it enhanced the student’s capability to apply the theories in practice, but in certain studies it is not found that effective in financial management. (Che, Z., & Che, Z. (2011).
Case study learning helps in the ability of the students to apply the theories in practice, and evolves their thinking process. (Mathews Zanda Nkhoma, Tri Khai Lam, Narumon Sriratanaviriyakul, Joan Richardson, Booi Kam, Kwok Hung Lau, (2017)
Case study is like a real or realistic story , as there are complex, ambiguous , uncertain events and problems. The cases teach the students to differentiate between pertinent and peripheral information, identify the context and parameters of problems and their solution and strategies and recommend actions by taking decisions and confront barriers. (Golich, V. (2000).
The gap between the theory and practice is application. Case study method of teaching is a method can be effectively used for understanding and learning of the application of a theoretical concept. It helps in development of certain important skills such as problem solving, team work and communication. It motivates the students to learn more. (Davis C. and Wilcock E. (2004) The analysis of cases can be done in static as well as dynamic ways. In Dynamic method, the student visualizes the situation and the resources at a current point of time, and in static the student has to analyze as per the resources and issues prevailing at the time when the situation occurred. The students creativity and decision making skills are fine tuned. They are able to make smart decisions by visualizing the different possible scenarios. For making the case study teaching more effective the student and teacher must be involved in the entire process in a disciplined manner. Availability of resources is another key element in making the case study teaching and learning more effective. The cases and their solutions are unique as they are based on real life situations many a times and are therefore difficult to solve (Mantha, S., & Jakka, D. (2012).
REVIEW OF LITERATURE Essential elements for enhancing students learning ability are case study questions, integration of theory and cases, reading, calculations, mentorship programs, interactive teaching to name a few (Smith, R. (2010). Finance Important skills such as synthesis of information, identifying the difference between genuine problems and apparent problems, indentifying the different alternative courses of action, are developed by the case study method of teaching. The students learn to present their views and opinions, share their knowledge, discuss and solve problems. The case study method departs from the routine approach for learning. Martí Sanchis, C. (2007)It is also considered useful for training in an organization or business entity as it helps the learners to know the real life problems and challenges. The learners can have a different perspectives of the problems. The instructors also end up learning as they can study the different reactions of the learners for the same problem. The learners have different perspectives of the same problem and can end up giving multiple solutions. (Naghi Radi Afsouran, et al (2018) .Case study method of teaching can help the instructor or the teacher to enable the students to understand the real time information and data. The case studies can help students and the learners to

International Journal of Advance and Innovative Research Volume 5, Issue 4 (XIX): October - December, 2018
50
ISSN 2394 - 7780
understand the different industrial sectors, varied business situations and problems. The students understand basic and key concepts with the help of the case study methods moreover they become confident to make decision. The case study method can be teamed with role play method to have an in depth study of the financial topics (Correia, C., & Mayall,(2012)
Students inclination towards case study method depends on factors such as case selection, course type and level of course, expertise of the teacher, teaching environment and the teachers perception of the use of case method.( CARLOS J. O. TREJO-PECH, SUSAN WHITE , 2016)
A case study method is effective if the problem solving involved in the case study is a result of a group discussion done by the participants. Analysis and problem solving are the essential outcomes of the case study method. Reading of the cases is not sufficient but the fruitful discussion is important.( Ann Roselle, (1996)
Many teachers and learners prefer online or distance learning options due to their flexibility and customization. The cases used in such a learning option should be free of ambiguity. (Cecilia Hegarty, (2006).
Innovative and path breaking teaching methods always leads to in depth study. The students understanding of concepts are tremendously aided. Enquiry based methods and story methods are essential for understanding and learning. (Michael J.R. Butler, Peter Reddy, (2010).
Sometimes the issue of case study is limited and the authors who prepare or write the case study should ensure that the connection between the research and practice is properly built. There will be an effective knowledge exchange between the researchers who write the case study and the practitioners who participate in the learning process. (T. Grandon Gill , (2014). Finance is rather a difficult subject to teach at the university level students. There are difficult and complex theories. The applications of the theoretical concepts are complicated. These are technique oriented.( Sharon H. Garrison and, Daniel J. Borgia, (1999). Various courses in financial management such as corporate finance, financial modeling, strategic finance and financial analysis require the understanding of application of the theoretical concepts. Case Study method is effective teaching as well as assessment methodology for accounting and accounting principles. It is a valuable methodology in addition to the traditional class room teaching. Several skills right from presentation to research can be gained by the students (Pilato, B., & Ulrich, M. (2014). A study conducted in Turkey revealed that absence of focussed leadership and motivation thwarted the use of case study method, in fact the cultural condition are apt for implementing the methodology as it will be advantages to the education institutions and the students. (Marina Apaydin, (2008).
While teaching a marketing course the previous experience of students, awareness of subject matter, the academic level of the course, the managerial as well as non managerial orientation of the, degree of realism, complexity , knowledge content , skills sets required and the decision making requirement of the case will determine the possibility of a specific case being introduced. (Ross Brennan, (2009).
Helping, facilitating students to learn and assess problems and real life situations is the basic ideology behind case study and there is no specific and single approach for case study methodology when it comes to teaching internal auditing. (Mortimer A. Dittenhofer, (1992) In courses such as organisational development, a living case study can help students develop new skills which they can use in their work place. In a living case study students work with authentic clients on a current , real , ongoing problem which leads them to have a sense of being connected and engaged. (Robert Grassberger, Sue Wilder, (2015). Learning through Games is found to be better than case study approach in some studies.( Wolfe, J., & Guth, G. (1975).
RESEARCH METHODOLOGY AND DATA DESCRIPTION Their basic qualification was engineering, commerce, science or arts. The respondents were already exposed to case method of teaching and learning. During the course of their study the students were studying courses on Management Accounting, Financial Management and Financial Services. The course on Management Accounting includes topics on financial and cost accounting. The course on financial management covers basic concepts of corporate finance, whereas as the course on financial services covers topics such as primary and secondary markets, money markets, mutual funds, securitizations. The 100 respondents were management school students who had studied all the three courses. Case studies were administered to the respondents before the survey was taken. Case study teaching learning methodology was used to teach all three courses and a questionnaire consisting of 11 Likert’s scale questions was administered post completion of the courses. A 7 point Likert’s scale was used for the purpose, where 1 = strongly disagree and 7= strongly agree.
A pilot study was undertaken with 20 samples and the reliability test was conducted. The Cronbach's Alpha was calculated.
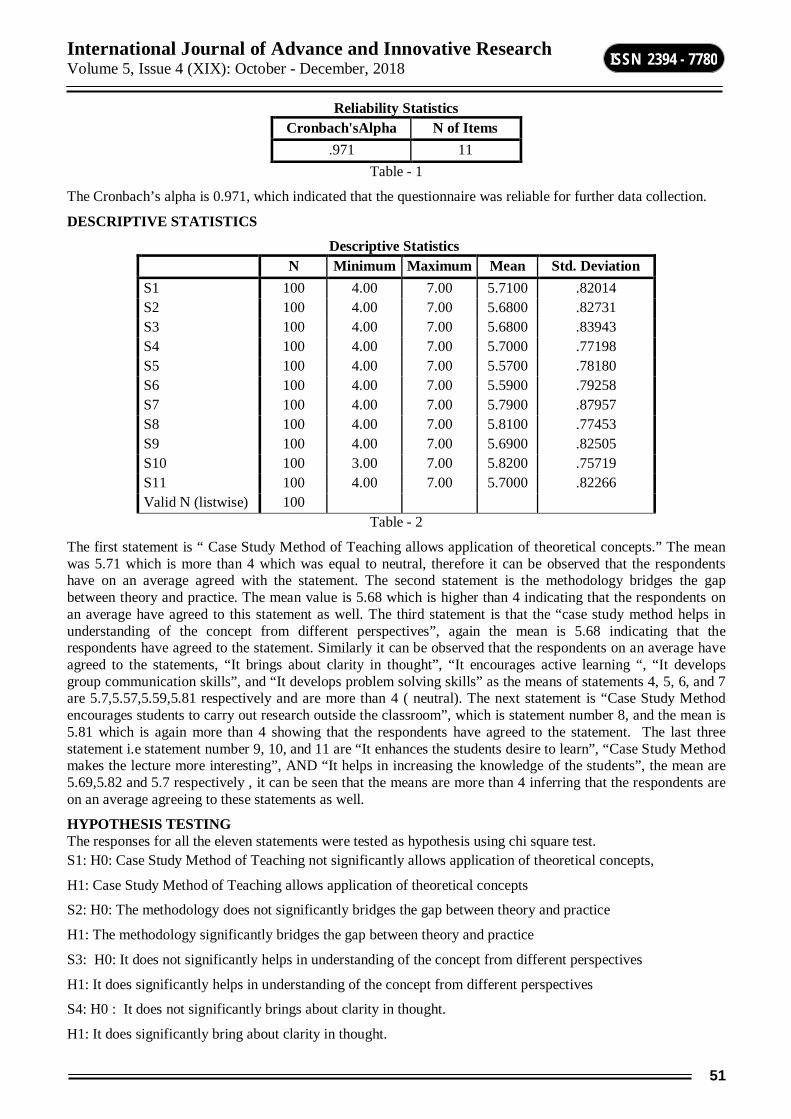
International Journal of Advance and Innovative Research Volume 5, Issue 4 (XIX): October - December, 2018
51
ISSN 2394 - 7780
Reliability Statistics Cronbach'sAlpha N of Items
.971 11 Table - 1
The Cronbach’s alpha is 0.971, which indicated that the questionnaire was reliable for further data collection.
DESCRIPTIVE STATISTICS
Descriptive Statistics N Minimum Maximum Mean Std. Deviation S1 100 4.00 7.00 5.7100 .82014 S2 100 4.00 7.00 5.6800 .82731 S3 100 4.00 7.00 5.6800 .83943 S4 100 4.00 7.00 5.7000 .77198 S5 100 4.00 7.00 5.5700 .78180 S6 100 4.00 7.00 5.5900 .79258 S7 100 4.00 7.00 5.7900 .87957 S8 100 4.00 7.00 5.8100 .77453 S9 100 4.00 7.00 5.6900 .82505 S10 100 3.00 7.00 5.8200 .75719 S11 100 4.00 7.00 5.7000 .82266 Valid N (listwise) 100
Table - 2
The first statement is “ Case Study Method of Teaching allows application of theoretical concepts.” The mean was 5.71 which is more than 4 which was equal to neutral, therefore it can be observed that the respondents have on an average agreed with the statement. The second statement is the methodology bridges the gap between theory and practice. The mean value is 5.68 which is higher than 4 indicating that the respondents on an average have agreed to this statement as well. The third statement is that the “case study method helps in understanding of the concept from different perspectives”, again the mean is 5.68 indicating that the respondents have agreed to the statement. Similarly it can be observed that the respondents on an average have agreed to the statements, “It brings about clarity in thought”, “It encourages active learning “, “It develops group communication skills”, and “It develops problem solving skills” as the means of statements 4, 5, 6, and 7 are 5.7,5.57,5.59,5.81 respectively and are more than 4 ( neutral). The next statement is “Case Study Method encourages students to carry out research outside the classroom”, which is statement number 8, and the mean is 5.81 which is again more than 4 showing that the respondents have agreed to the statement. The last three statement i.e statement number 9, 10, and 11 are “It enhances the students desire to learn”, “Case Study Method makes the lecture more interesting”, AND “It helps in increasing the knowledge of the students”, the mean are 5.69,5.82 and 5.7 respectively , it can be seen that the means are more than 4 inferring that the respondents are on an average agreeing to these statements as well.
HYPOTHESIS TESTING The responses for all the eleven statements were tested as hypothesis using chi square test. S1: H0: Case Study Method of Teaching not significantly allows application of theoretical concepts,
H1: Case Study Method of Teaching allows application of theoretical concepts
S2: H0: The methodology does not significantly bridges the gap between theory and practice
H1: The methodology significantly bridges the gap between theory and practice
S3: H0: It does not significantly helps in understanding of the concept from different perspectives
H1: It does significantly helps in understanding of the concept from different perspectives
S4: H0 : It does not significantly brings about clarity in thought.
H1: It does significantly bring about clarity in thought.

International Journal of Advance and Innovative Research Volume 5, Issue 4 (XIX): October - December, 2018
52
ISSN 2394 - 7780
S5: HO: It does not significantly encourages active learning
H1: It does significantly encourages active learning
S6: HO: It does not significantly develops group communication skills
H1: It does significantly develops group communication skills
S7: HO : It does not significantly develops problem solving skills
H1: It does significantly develops problem solving skills
S8: H0 : Case Study Method does not significantly encourage students to carry out research outside the classroom.
H1 : Case Study Method does significantly encourage students to carry out research outside the classroom.
S9: HO: It does not significantly enhances the students desire to learn
H1: It does not significantly enhances the students desire to learn
S10: H0: Case Study Method does not significantly make the lecture more interesting
H1: Case Study Method does significantly make the lecture more interesting
S11: H0: It does not significantly helps in increasing the knowledge of the students
H1: It does significantly helps in increasing the knowledge of the students
Test Statistics 1 2 3 4 5 6 7 8 9 10 11 Chi-square 38.960a 38.480a 34.240a 57.840a 42.320a 42.960a 25.040a 53.840a 35.920a 63.760a 37.360a df 3 3 3 3 3 3 3 3 3 3 3 Asymp. Sig.
.000 .000 .000 .000 .000 .000 .000 .000 .000 .000 .000
a. 0 cells (.0%) have expected frequencies less than 5. The minimum expected cell frequency is 25.0.
Table - 3
Hypothesis Testing
Statement P value 0.05 < or > Accepted H0 or H1 1 0.000 Less HI 2 0.000 Less HI 3 0.000 Less HI 4 0.000 Less HI 5 0.000 Less HI 6 0.000 Less HI 7 0.000 Less HI 8 0.000 Less HI 9 0.000 Less HI
10 0.000 Less HI 11 0.000 Less HI
Table - 4
Data Analysis The sub groups of the respondents were a) Respondents with or without work experience
b) Respondents from Engineering and Non Engineering graduation
c) Respondents from the non graduation were again classified into sub groups of commerce, science and arts graduations.

International Journal of Advance and Innovative Research Volume 5, Issue 4 (XIX): October - December, 2018
53
ISSN 2394 - 7780
d) Respondents having different years of experience : Less than Year, 1 year to 2 years, 2 to 3 years and more than 3 years
For the sub group analysis the statistical tests used were Sub Group Test
a T Test b T Test c ANOVAs d ANOVAs
Table - 5
Sub Group a) consisted of analysis of Respondents having work experience and respondents having no work experience.
Statement P Value Explanation
1 0.014 T Test revealed that for the statement 1: Case Study Method of Teaching allows application of theoretical concepts, the P Value was 0.014 which was less than 0.05, it indicates that the responses of respondents have work experience and respondents having no work experiences differed. The respondents having work experience were able to connect the practical and the theoretical concepts with the help of the case studies administered to them.
Table - 6
Sub Group b) consisted of respondents from engineering and non engineering back ground
Statement P Value Explanation
2 0.000 T Test reveals that the P is .000 which is less than 0.05 indicating that, the different sub groups of respondents differ on their views regarding the Statement 2 The methodology significantly bridges the gap between theory and practice.
3 0.000 T Test reveals that the P is .000 which is less than 0.05 indicating that, the different sub groups of respondents differ on their views regarding the Statement 2 The methodology bridges the gap between theory and practice
4 0.000 T Test reveals that the P is .000 which is less than 0.05 indicating that, the different sub groups of respondents differ on their views regarding the Statement
5 0.000 T Test reveals that the P is .000 which is less than 0.05 indicating that, the different sub groups of respondents differ on their views regarding the Statement
6 0.000 T Test reveals that the P is .000 which is less than 0.05 indicating that, the different sub groups of respondents differ on their views regarding the Statement
7 0.000 T Test reveals that the P is .000 which is less than 0.05 indicating that, the different sub groups of respondents differ on their views regarding the Statement
8 0.000 T Test reveals that the P is .000 which is less than 0.05 indicating that, the different sub groups of respondents differ on their views regarding the Statement
9 0.000 T Test reveals that the P is .000 which is less than 0.05 indicating that, the different sub groups of respondents differ on their views regarding the Statement
10 0.202 T Test reveals that the P is 0.202 which is more than 0.05 indicating that, the different sub groups of respondents do not differ on their views regarding the Statement.
11 0.000 T Test reveals that the P is .000 which is less than 0.05 indicating that, the different sub groups of respondents differ on their views regarding the Statement
Table - 7

International Journal of Advance and Innovative Research Volume 5, Issue 4 (XIX): October - December, 2018
54
ISSN 2394 - 7780
Sub Group c) Respondents from the non graduation were again classified into sub groups of commerce, science and arts graduations
Statement P Value Explanation
10 0.004 Annova Test reveals that the P Value is 0.0004 which is less than 0.05, the respondents from Science stream found the lectures more interesting than the students from commerce and arts stream. The respondents from commerce and arts stream revealed that case study methodology was studied by them in their graduation and it is not the only parameter for an interesting lecture.
Table - 8
Sub Group d) Respondents having different years of experience : Less than Year, 1 year to 2 years, 2 to 3 years and more than 3 years
Statement P Value Explanation
1 0.010 The ANNOVA test reveals that the P Value is .0.010 which is less than 0.05, it was observed that the respondents having more than 2 years experience mostly agreed to the statement.
2 0.010 The second statement is The methodology bridges the gap between theory and practice. The same observation was found in analysis of statement 2,which corroborates the statement1.
3 0.010 It helps in understanding of the concept from different perspectives
It brings about clarity in thought
It encourages active learning
It develops group communication skills
It develops problem solving skills
Case Study Method encourages students to carry out research outside the classroom.
It enhances the students desire to learn.
For the statements 3,4,5,6,7,8,9, students having the experience of more than 2 years and more agreed , whereas most of the less than one year experience were neutral.
4 0.010
5 0.010
6 0.010
7 0.010
8 0.010
9 0.010
10 0.128 For statement 10,Case Study Method makes the lecture more interesting, the respondents had no difference of opinion as they believed that case study method is just one of the parameters which make a lecture interesting. It was noted that the quality of teaching, knowledge of the teacher are also equally important.
Table - 9
CONCLUSION Courses in financial management such as corporate finance, financial modeling, strategic finance and financial analysis require the understanding of application of the theoretical concept (Pilato, B., & Ulrich, M. (2014). It can be observed that “ Case Study Method of Teaching allows application of theoretical concepts, it bridges the Gap for theory and practical, it develops problem solving skills, which are very essential in financial management, it develops the research skills and enhances their desire to learn as in finance, research and desire to learn is important for the financial field is dynamic and requires constant updating.
REFERENCES AND BIBLIOGRAPHY 1. Che, Z., & Che, Z. (2011). Study on Case Teaching of Financial Management.Higher Education
Studies, 1(2). doi: 10.5539/hes.v1n2p118.
2. Mathews Zanda Nkhoma, Tri Khai Lam, Narumon Sriratanaviriyakul, Joan Richardson, Booi Kam, Kwok Hung Lau, (2017) "Unpacking the revised Bloom’s taxonomy: developing case-based learning activities", Education + Training, Vol. 59 Issue: 3, pp.250-264, https://doi.org/10.1108/ ET-03-2016-0061

International Journal of Advance and Innovative Research Volume 5, Issue 4 (XIX): October - December, 2018
55
ISSN 2394 - 7780
3. Golich, V. (2000). The ABCs of Case Teaching. International Studies Perspectives,1(1), 11-29. doi: 10.1111/1528-3577.00002
4. DavisC. and WilcockE. (2004) Teaching Materials using Case Studies. The Higher Education Academy/UK Centre for Materials Education/Guides. Available at:http://www.materials.ac.uk/guides/casestudies.asp
5. Mantha, S., & Jakka, D. (2012). Case Study Method of Teaching In Management Education. http://www.borjournals.com/a/index.php/jbmssr/article/view/143
6. Smith, R. (2010). Finance Professors’ Use of the Case Method at Harvard and Darden MBA Programs: Ensuring Students’ Technical Knowledge in Finance Courses Using the Case Method. JOURNAL OF ECONOMICS AND FINANCE EDUCATION Summer 2010, 9(1), 31-38. doi: https://www.economics-finance.org/jefe/fin/JEFE%202009-033%20Smithfinalpaper.pdf
7. Martí Sanchis, C. (2007). The case study method: a powerful teaching tool in sports marketing education. International Journal Of Sports Marketing And Sponsorship, 9(1), 2-5. doi: 10.1108/ijsms-09-01-2007-b002
8. Naghi Radi Afsouran, Morteza Charkhabi, Seyed Ali Siadat, Reza Hoveida, Hamid Reza Oreyzi, George C. Thornton III, (2018) "Case-method teaching: advantages and disadvantagesin organizational training", Journal of Management Development, https://doi.org/10.1108/JMD-10-2017-0324
9. Correia, C., & Mayall,(2012) P. THE USE OF THE CASE METHOD IN TEACHING CORPORATE FINANCE: AN EVALUATION. ICICTE 2012 2012 Proceedings 535.
10. Pilato, B., & Ulrich, M. (2014). Is The Case Study Method an Effective Pedagogical Method for Students to Learn the Fundamentals of Financial Accounting?. In ASBBS Annual Conference (pp. 541 Volume 21 Number 1). Las Vegas: ASBBS Annual Conference. Retrieved from http://asbbs.org/files/ASBBS2014/PDF/P/Pilato_Ulrich(P541-554).pdf
11. Ann Roselle, (1996) "The case study method: A learning tool for practising librarians and information specialists", Library Review, Vol. 45 Issue: 4, pp.30-38, https://doi.org/10.1108/00242539610115281
12. Cecilia Hegarty, (2006) "It's not an exact science: teaching entrepreneurship in Northern Ireland", Education+ Training, Vol. 48 Issue: 5, pp.322-335, https://doi.org/10.1108/00400910610677036 Permanent link to this document: https://doi.org/10.1108/00400910610677036
13. Michael J.R. Butler, Peter Reddy, (2010) "Developing critical understanding in HRM students: Using innovative teaching methods to encourage deep approaches to study", Journal of European Industrial Training, Vol. 34 Issue: 8/9, pp.772-789, https://doi.org/10.1108/03090591011080968 Permanent link to this document: https://doi.org/10.1108/03090591011080968
14. T. Grandon Gill , (2014),"The complexity and the case method", Management Decision, Vol. 52 Iss 9 pp. 1564 – 1590 Permanent link to this document:http://dx.doi.org/10.1108/MD-11-2013-0575
15. Sharon H. Garrison and, Daniel J. Borgia, (1999) "Using an Internet‐based distance learning model to teach introductory finance", Campus- Wide Information Systems, Vol. 16 Issue: 4, pp.136-139, https://doi.org/10.1108/10650749910289892 Permanent link to this document: https://doi.org/ 10.1108/10650749910289892
16. Pilato, B., & Ulrich, M. (2014). Is The Case Study Method an Effective Pedagogical Method for Students to Learn the Fundamentals of Financial Accounting?. In ASBBS Annual Conference (pp. 541 Volume 21 Number 1). Las Vegas: ASBBS Annual Conference. Retrieved from http://asbbs.org/files/ASBBS2014/PDF/P/Pilato_Ulrich(P541-554).pdf
17. Marina Apaydin, (2008),"Making a case for the case method in Turkey", Journal of Management Development, Vol. 27 Iss 7 pp. 678 – 692 Permanent link to this document: http://dx.doi.org/ 10.1108/02621710810883599
18. Ross Brennan, (2009),"Using case studies in university-level marketing education", Marketing Intelligence & Planning, Vol. 27 Iss 4 pp. 467 – 473 Permanent link to this document: http://dx.doi.org/ 10.1108/02634500910964038

International Journal of Advance and Innovative Research Volume 5, Issue 4 (XIX): October - December, 2018
56
ISSN 2394 - 7780
19. Mortimer A. Dittenhofer, (1992),"Teaching Internal Auditing: The Case-study Method", Managerial Auditing Journal, Vol. 7 Iss 3 pp. Permanent link to this document: http://dx.doi.org/ 10.1108/02686909210008577
20. Robert Grassberger, Sue Wilder, (2015) "Impacting student learning using a living case study", Higher Education, Skills and Work-Based Learning, Vol. 5 Issue: 4, pp.369-382, https://doi.org/10.1108/ HESWBL-05-2015-0030
21. Wolfe, J., & Guth, G. (1975). The Case Approach Versus Gaming in the Teaching of Business Policy: An Experimental Evaluation. The Journal of Business, 48(3), 349-364. Retrieved from http://www.jstor.org/stable/235222

International Journal of Advance and Innovative Research Volume 5, Issue 4 (XIX): October - December, 2018
57
ISSN 2394 - 7780
LIVING A MEANINGFUL LIFE
Dr. Mahesh Uday Mangaonkar Professor, Indira School of Business Studies (ISBS), Pune
ABSTRACT Meaning in life gives a person a purpose in life, it motivates people to do something they love. Meaning can be extracted from anything, it can derive from a person’s job, hobby or family and we are free to choose. Meaning can also reduce the suffering we experience in this world. Everything we do in life is for the future result of happiness. Most people take life for granted and are only worried about worldly possessions. But does it take death itself to have us stop and think and wonder if our life has been meaningful. It is important to continue asking and trying to answer this question because meaning gives our life a purpose. Eventually we are all going to die but finding the meaning of our life reduces our pain and suffering in this world.
Keywords: Life, happiness, purpose, motivates
INTRODUCTION “Live as if you were to die tomorrow. Learn as if you were to live forever”.
-Mahatma Gandhi
A basic philosophical question asked by the mankind every now and then is: “What is the meaning of life?” Looking at this question through the prism of above brilliant quote by Mahatma Gandhi, one can safely say that life is meant to be lived to the fullest and learn and continuing to learn everyday. Simply put, how would one use his energy if he was to die the next day?
So, how do we live a meaningful life? First, we need good health to be able to accomplish any career path we wish to travel; so choosing healthy foods and proper exercise appear to be necessities. Our bodies do not need much of the food our society offers. Second, our minds can do without much the news and entertainment. They certainly do not make us happier, smarter, healthier, or more creative. Third, we need dreams and personal goals and aspirations that are deeply personal as well as lifelong ambitions. Fourth, we need a comfortable place to live. We are very fortunate to have so many choices where to live and be sheltered. However, living and associating with people who drag us down, have unhealthy lifestyles should be avoided.
You are never too old to learn. If we all stopped learning because we’re going to die someday, we’d all be idiots. As it is, there are too many idiots in this world. It is better to die tomorrow having a little more knowledge than to live another year as an ignorant idiot. Knowledge helps you enjoy life more. Knowledge engages the mind, opens doors to the imagination. The more knowledge you gain, the more fulfilling living becomes. As you live, your thirst for knowledge grows. If you haven’t begun enjoying the moment, thinking there would be many more, you might as well be a mindless drone, whose only purpose is to work so others can enjoy life.
OBJECTIVES OF THE STUDY 1) To understand the value of life.
2) To analyse various factors which will help in living a meaningful life.
RESEARCH METHODOLOGY This is an exploratory research. The researcher has collected the information by using the secondary data source. The data is collected by referring books and websites.
THE VALUE OF A LIFE Life is beautiful but not always easy, it has problems, too, and the challenge lies in facing them with courage, letting the beauty of life act like a balm, which makes the pain bearable, during trying times, by providing hope.
The life given by god has a very special meaning a value in which people sometimes forget to thank or either regret. Many students/adults believe that they are going to be popular if they have money and a good job buy forget that people are influenced by those who have learned something. Also a lot fail to remember, to earn value you must earn it. In today’s economy the government creates a value on the person by looking at the position they are held for.
Happiness, sorrow, victory, defeat, day-night are the two sides of the me coin. Similarly life is full of moments of joy, pleasure, success and comfort punctuated by misery, defeat, failures and problems. There is no human

International Journal of Advance and Innovative Research Volume 5, Issue 4 (XIX): October - December, 2018
58
ISSN 2394 - 7780
being on Earth, strong, powerful, wise or rich, who has not experienced, struggle, suffering or failure. Life is beautiful just as roses but it has challenges which are like thorns and have to be faced and overcome by all. Those, who accept these, challenges and succeed, are the ones, who know how to live life in its true sense. Thus, enjoy life but also be prepared to bear the pricks of pain. Everyone wants personal success and to learn the keys to success. Everyone wants to have a happy, healthy life, do meaningful work, enjoy a career, and achieve financial independence. Everyone wants to make a difference in the world, to be significant, to have a positive impact on those around him or her. Everyone wants to do something wonderful with his or her life. There are periods in your life when you would rather remain passive. This state may be due to a great disappointment, but it may also be a result of boredom. Whatever it is, you have to get out of it. Think about the goals you had and do your best to actualize them.
Develop a good strategy and create daily to-do lists that enable you to achieve the big goals step-by-step. Every single moment is important, so you better learn how to manage your time if you don’t want to waste your potential as a human being.
FACTORS WHICH WILL HELP IN LIVING A MEANINGFUL LIFE 1. Time Management Wasting your energy on multiple tasks is not the perfect way of becoming more effective. Focus is the key to success. Make sure to know your priorities and arrange your acts in accordance.
Have you heard of the Pareto principle (also known as the 80–20 rule)? It’s named after the Italian economist Vilfredo Pareto who first realized that 80% of the effects came from 20% of the causes.
How does this rule apply to your efficiency? 80% of the results you achieve will come from 20% of your efforts. Those 20% are your priorities. When you focus most of your energy on them, you’ll achieve the ultimate level of effectiveness.
2. Find your purpose "Finding your purpose is not the same thing as finding that job that makes you happy," Smith said. "Purpose is less about what you want than about what you give."
Smith explained that the key to purpose is "using your strengths to serve others."
Given that American adults spend a majority of their time at work, Smith said it makes sense that we channel our sense of purpose through our jobs, where we contribute a lot of our time and feel needed.
But as Smith pointed out, the lack of purpose Americans feel at work is translating into "disengagement at work, unemployment and low labor force participation."
"Of course, you don't have to find purpose at work, but purpose gives you something to live for," Smith said, adding it gives you a reason to move forward.
3. Pursue Your Passion I believe everyone should pursue their passion in life. It’s what makes life worth living, and gives our lives true meaning and purpose. Each time you work on something you love, it creates joy inside you like nothing else. Finding a way to use your passions to give back to the world will give your life ultimate meaning.
If you can’t manage (or aren’t ready) to work on your passion for a living, be sure and make time for it every day. By working on your passion and becoming an expert in it, you will eventually have the opportunity to make money from it. Be ready to seize that opportunity!
4. Decluttering Your working space is a complete mess? Then it’s no wonder why you’re constantly under stress (mess >< stress; they even rhyme). You can’t be effective when you have to find your way through the clutter around you.
Take a day to bring everything back to order. Organize your documents and put every piece of paper in its place. Once you achieve order, it will be easy for you to maintain it.
You get sick by the mere thought of cleaning? That doesn’t mean you can neglect the need for order. You can hire a cleaning service that can do the hard work for you.
5. Figure out what activities leave you energized. There are other types of activities that make us feel alive. These are activities that we look forward to, that we focus on completely, and finish having more energy than

International Journal of Advance and Innovative Research Volume 5, Issue 4 (XIX): October - December, 2018
59
ISSN 2394 - 7780
when we started. These are also the activities that we give our best energy to and that we try to make the highest quality. Energizing activities are often our hobbies, like working on machines, collecting items, writing, gardening,
cooking, and so on.
The important thing to remember about these activities is that they require movement on our part—it does not mean watching TV or other screen-watching.
6. Be Self-Aware Be aware of yourself and your actions. Remain mindful of what you do at all times, and make sure you are living life according to your principles, your life’s purpose, and what you are passionate about. Review your actions each day, taking stock of those that strayed from your path. Work towards correcting any incidents in the future. Meditation is a great tool for accomplishing this task. It helps us increase our self-awareness throughout the day.
7. Decide if your career lines up with this plan. You are probably already thinking about your job and whether or not you should keep it if it is a draining activity. The choice is up to you. You have to take stock of things, like how much your family suffers because of your attitude toward work, and if you would be able to find another source of income if you quit. For example, if you have a family who is tired of watching you come home every day without any energy,
you may want to think about getting a different, less draining job; cutting back your hours instead of quitting; or finding a new source of income altogether, like starting your own business selling the product you make (or the service you perform) with your energizing activity.
You can also consider going back to school while you still have your old job if you feel that a different career would make your life more purposeful and meaningful.
The important thing, though, is to find a balance among energizing, neutral, and draining activities.
8. Focus Rather than chasing 3 or 4 goals and making very little progress on them, place all of your energy on one thing. Focus. Not only will you alleviate some of the stress associated with trying to juggle so many tasks, you will be much more successful. Try and align your goal with something you are passionate about, so that there will be an intrinsic drive to work hard and do well.
9. Know what’s Important Know what’s important for you. Write down your top 5 things that you believe are the essence of how you want to live life. This can include things like “family time,” or “sing every day.” It could also include more complex ideas, like “honesty” and “simplicity.”
CONCLUSION “If happiness is about getting what you want, it appears that meaningfulness is about doing things that express yourself”.
“Live as if you were to die tomorrow.” pushes people to do things in life they always wanted to do because their life is almost up and “Learn as if you were to live forever.” Learning is not something you get bored of, rather it is something you take in. Gandhi choose the words “die tomorrow” and “live forever” to allow people to pretend there is no tomorrow and that you should do what you always wanted in life and living forever is the opportunity to learn throughout the years you live. You will never run out of things to learn if you were to live forever.
REFERENCES Books 1. K.Ashwathappa, (2009), ‘Text and Cases Human Resource management,’ Fifth Edition, Tata McGraw Hill
Publications, New Delhi, 205-207
2. Jeffery A. Mello, (2001), ‘Strategic Human Resource Management,’ India Edition, pp.391-395
Websites https://www.wikihow.com/Live-a-Meaningful-Life
https://www.cnbc.com/2017/11/01/4-ways-to-live-a-happier-and-fulfilling-life-according-to-psychology.html

International Journal of Advance and Innovative Research Volume 5, Issue 4 (XIX): October - December, 2018
60
ISSN 2394 - 7780
https://www.liveyourtruestory.com/secrets-living-meaningful-life/
https://www.psychologytoday.com/us/blog/the-time-cure/201509/living-meaningful-life

International Journal of Advance and Innovative Research Volume 5, Issue 4 (XIX): October - December, 2018
61
ISSN 2394 - 7780
AN ANALYSIS OF FLOWS OF FOREIGN INSTITUTIONAL INVESTORS IN INDIAN STOCK MARKET
Chirayu S Shastri Assistant Professor, C P Patel & F H Shah Commerce College, Anand
ABSTRACT Foreign institutional investment is an effective way to generate foreign flows of capital from various countries. There are mainly two sources by which India can generate foreign flow of capital either by foreign direct investment and foreign institutional investment. The special features of FII investment which favors the developing country like India is that FII investment can give control within india which will help for growth and rapid development. FIIs have a huge financial strength and invest for the purpose of income and capital appreciation to any economy in the world. FII specifically provides low cost investment for developing country like India and researcher has tried to find out the FII flow capital of in Indian stock market with due changes, challenges and positive intent for a growth in future. Researcher has tried to find the relationship FII investment and changes taken place in the Indian stock market.
Keywords: Foreign Institutional Investors, Indian Stock Market, Stock Exchange, Equity FII Gross Purchase
INTRODUCTION Investment decisions are taken within the framework provided by a complex of financial institutions and intermediaries which together comprise the capital market. It has a vital role in promoting efficiency and growth. It intermediates the flow of funds from those who want to save a part of their income from those who want to invest in productive assets. It is this market which provides the mechanism for challenging current savings in to investment in productive facilities, that is, for allocating the country’s capital resources among alternatives uses. In effect, the capital market provides an economy’s link with the future, since current decisions regarding the allocation of capital resources are a major determining factor of tomorrow’s output. The crucial role played by the capital market in shaping the pattern and growth of real output imparts a social significance to individual investment and portfolio decisions. The stock exchange play vital role for India as it provides finance form the public both short term and long term. The stock exchange is place where highly motivated investors invest their money in terms of trading in various securities and assist them to buy and sale securities in open ended market base with overall monitoring of the market. Stock exchange is a place where government and private bodies trade their securities to general public under which listed companies invites investment from the general public. Foreign capital can be formed in two ways either foreign direct investment or Foreign institutional investment. FDI investors invests directly in the country keeping control with them while FII investors investment
REVIEW OF LITERATURE PANDEY RAHUL (2016) Researcher has elected the impact of FII investments in Indian Stock market. The research was based on investment Portfolio by FII investor and what are movements that market found. The investments are beneficial up to what extent and what are disadvantageous of the market in terms of growth. This research has found that FII investment affects the sensex movement in to large numbers. Researcher’s objective was to find relationship between FII and Indian stock market and their changes taken place in various groups of scrip.
RAO K.MALLIKARJUNA & RANI H. RANJEETA (2013) Focus in this research paper was to find stock market deviation in terms of number investment taken place in the market. The research paper targeted in finding the number of factor affects the stock market up to what extent. The study was entirely based on secondary data considering the pattern of investment starting from 2007 to 2012. The present study was taken different sectors of various companies like real estate, baulking, information technology and steel. The study was based on gross and net changes taken place which will help the relative changes in the market with considering cumulative investment.
SHAH DR. MAYUR (2018) This research examined the net inflow of FII investment and stock market movement within specific period of investment. The objective of this research was to explore the trend of FII investment, pattern of inflow of foreign capital, and to find behavioural relational changes taken place in stock market especially in Nifty. The data base of the study was secondary sources for selected 13 years of investment. The research methodology analysis tools used were correlation coefficient and regression analysis of net FII investment and CNX Nifty for
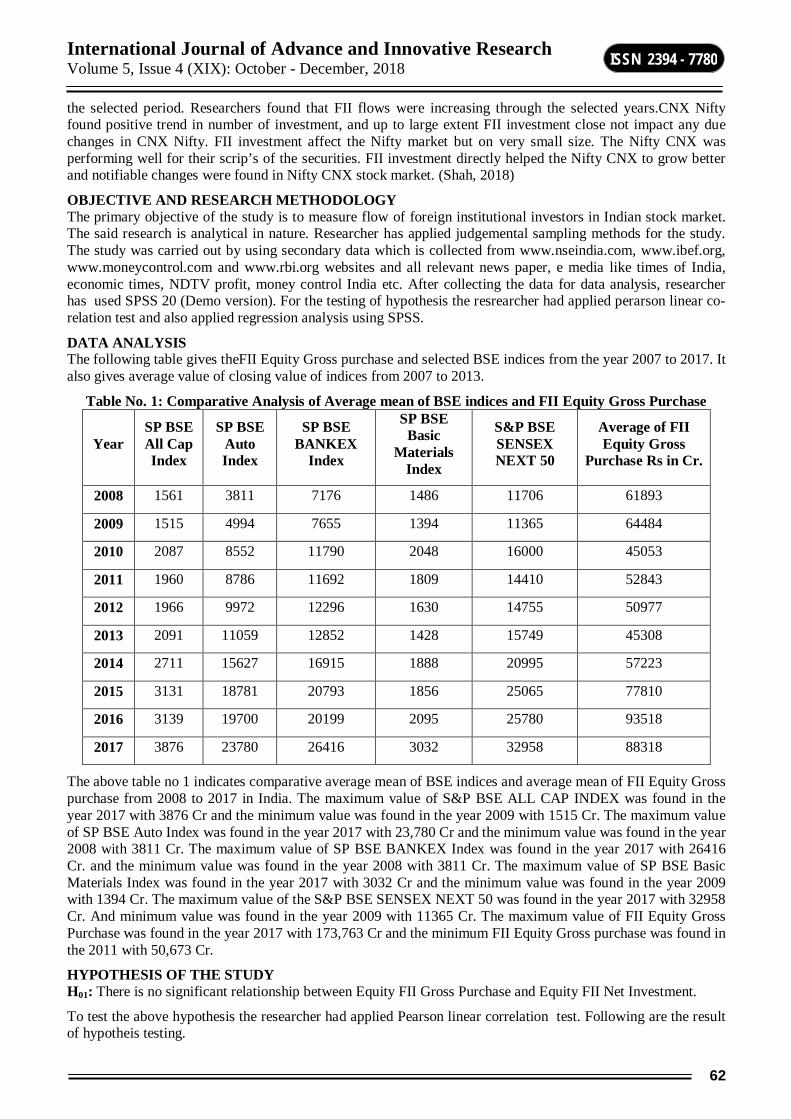
International Journal of Advance and Innovative Research Volume 5, Issue 4 (XIX): October - December, 2018
62
ISSN 2394 - 7780
the selected period. Researchers found that FII flows were increasing through the selected years.CNX Nifty found positive trend in number of investment, and up to large extent FII investment close not impact any due changes in CNX Nifty. FII investment affect the Nifty market but on very small size. The Nifty CNX was performing well for their scrip’s of the securities. FII investment directly helped the Nifty CNX to grow better and notifiable changes were found in Nifty CNX stock market. (Shah, 2018)
OBJECTIVE AND RESEARCH METHODOLOGY The primary objective of the study is to measure flow of foreign institutional investors in Indian stock market. The said research is analytical in nature. Researcher has applied judgemental sampling methods for the study. The study was carried out by using secondary data which is collected from www.nseindia.com, www.ibef.org, www.moneycontrol.com and www.rbi.org websites and all relevant news paper, e media like times of India, economic times, NDTV profit, money control India etc. After collecting the data for data analysis, researcher has used SPSS 20 (Demo version). For the testing of hypothesis the resrearcher had applied perarson linear co-relation test and also applied regression analysis using SPSS.
DATA ANALYSIS The following table gives theFII Equity Gross purchase and selected BSE indices from the year 2007 to 2017. It also gives average value of closing value of indices from 2007 to 2013.
Table No. 1: Comparative Analysis of Average mean of BSE indices and FII Equity Gross Purchase
Year SP BSE All Cap Index
SP BSE Auto Index
SP BSE BANKEX
Index
SP BSE Basic
Materials Index
S&P BSE SENSEX NEXT 50
Average of FII Equity Gross
Purchase Rs in Cr.
2008 1561 3811 7176 1486 11706 61893
2009 1515 4994 7655 1394 11365 64484
2010 2087 8552 11790 2048 16000 45053
2011 1960 8786 11692 1809 14410 52843
2012 1966 9972 12296 1630 14755 50977
2013 2091 11059 12852 1428 15749 45308
2014 2711 15627 16915 1888 20995 57223
2015 3131 18781 20793 1856 25065 77810
2016 3139 19700 20199 2095 25780 93518
2017 3876 23780 26416 3032 32958 88318
The above table no 1 indicates comparative average mean of BSE indices and average mean of FII Equity Gross purchase from 2008 to 2017 in India. The maximum value of S&P BSE ALL CAP INDEX was found in the year 2017 with 3876 Cr and the minimum value was found in the year 2009 with 1515 Cr. The maximum value of SP BSE Auto Index was found in the year 2017 with 23,780 Cr and the minimum value was found in the year 2008 with 3811 Cr. The maximum value of SP BSE BANKEX Index was found in the year 2017 with 26416 Cr. and the minimum value was found in the year 2008 with 3811 Cr. The maximum value of SP BSE Basic Materials Index was found in the year 2017 with 3032 Cr and the minimum value was found in the year 2009 with 1394 Cr. The maximum value of the S&P BSE SENSEX NEXT 50 was found in the year 2017 with 32958 Cr. And minimum value was found in the year 2009 with 11365 Cr. The maximum value of FII Equity Gross Purchase was found in the year 2017 with 173,763 Cr and the minimum FII Equity Gross purchase was found in the 2011 with 50,673 Cr.
HYPOTHESIS OF THE STUDY H01: There is no significant relationship between Equity FII Gross Purchase and Equity FII Net Investment.
To test the above hypothesis the researcher had applied Pearson linear correlation test. Following are the result of hypotheis testing.

International Journal of Advance and Innovative Research Volume 5, Issue 4 (XIX): October - December, 2018
63
ISSN 2394 - 7780
Variables Test Applied R-Value P-Value Result Equity FII Sales Pearson co-relation .916 .000 Significant Equity FII Net Investment Pearson co-relation .051 .559 Insignificant SP BSE Auto Index Pearson co-relation .722 .000 Significant SP BSE BANKEX Index Pearson co-relation .773 .000 Significant SP BSE Basic Materials Index Pearson co-relation .684 .000 Significant SP BSE Capital Goods Index Pearson co-relation .711 .000 Significant SP BSE Consumer Discretionary Goods Services Index Pearson co-relation .768 .000 Significant
SP Consumer Durables Index Pearson co-relation .725 .000 Significant
The above table portrays Pearson linear Correlation for Equity FII Gross Purchase with selected variables of National Stock Exchange. Above table shows correlation (r) and p value. We can observe that for Equity FII Net Investment p value is greater than 0.05, we cannot reject the null hypothesis. It means there is no significant relationship between Equity FII Gross Purchase and Equity FII Net Investment, whereas there is significant relationship between Equity FII Gross Purchase and other selected variables of Bombay stock exchange.
REGRESSION ANALYSIS Regression line of Equity FII Gross Purchase = a1 (1313.546) + β1 (SP BSE SENSEX Value) is significantly fitted.
Variables Entered/Removed
Model Variables Entered Variables Removed Method
1 SP BSE SENSEX --- Enter
a. Dependent Variable: Equity FII Gross Purchase
b. All requested value entered
Model Summary
Model R R Square Adjusted R Square
Std. Error of the Estimate
1 .794a .630 .628 15676.34
a. Predictors: (Constant): SP BSE SENSEX
The above information describes that the co-efficient of determination R2 is .630; it illustrates that model cover consistency. The co-efficient of co-relation R is 0.794a it shows that outcomes and predicted value are strongly co-related. The adjusted R2 can be negative and will always be less than or equal to R2, here adjusted R2 is 0.628 that less than R2. The standard error of the estimate shows the value of 15676.34 which is comparatively high, confirms that definite model is good and enough to define the given relation in the model.
ANOVAa
Model Sum of Squares df Mean Square F Sig.
Regression 54492929266.657 1 54492929266.657 221.743 .000b
Residual 31947200767.085 130 245747698.208
Total 86440130033.742 131
a. Dependent Variable: Equity FII Gross Purchase
b. Predictors: (Constant): SP BSE SENSEX
The above table gives an idea about the analysis of variance (ANOVA). The significant level is lower than 0.05 which is 0.000 which means that the variance of variable is separation into components between the groups is not deviated. (Hypothesis Rejected)

International Journal of Advance and Innovative Research Volume 5, Issue 4 (XIX): October - December, 2018
64
ISSN 2394 - 7780
Co-Efficienta
Model Unstandardized
Coefficients Standardized Coefficients t Sig.
B Std. Error Beta (Constant) 1313.546 4947.028 .266 .791 SP BSE SENSEX 3.426 .230 .794 14.891 .000
a. Dependent Variable: Equity FII Gross Purchase The above detail present significant value in the right column suggest the accepntance of the SP BSE SENSEX of selected BSE and FII INDICES. Here, high t and statistics and low standard error confirm the accuracy and fitness of these variables in the model. We can observe SP BSE SENSEX have positive impact on Equity FII Gross Purchase. It means if SP BSE SENSEX is increases by 1 unit, Equity FII Gross Purchase increases by 3.426 units.
CONCLUSION The present financial system shows that there is huge impact of public entities in taking investment decisions in India. The growth and development in developing country like India is based on the performance of Indian financial system considering investment for economic growth of India. Developing countries like India has more chances for growth as there is an important tool in investment which Foreign institutional investment which will be helpful for bringing foreign capital in India to have faster growth in the economy. FII investments in India are major outsourcing of capital which is available in the form of equity and debt to foreign investors. FII investment has started impacting in GDP of India for positive upward trend on investment. We can observe SP BSE SENSEX have positive impact on Equity FII Gross Purchase.
BIBLIOGRAPHY Bhalla, V. K. (2011). In Investment management: Security analysis and portfolio managament (pp. 189-
212). New Delhi: S.Chand & Company ltd. Bhole, L. M., & Mahakud, J. (2010). In Financial Institutions and Markets: Structure, Growth and
Innovations (pp. 169-241). New Delhi: Tata Mcgraw hill education private limited. Gordon, E., & Natarajan, K. (2011). In Financial Markets and Services (pp. 168-192). New Delhi:
Himalaya publishing House. Gordon, E., & Natarajan, K. (2012). In Banking: Theory, Law and practice. New Delhi: Himalaya
Publishing House. Kothari, C. R. (2011). Research Methodology Methods and Techniques (Second revised edition). New
Delhi: New age international (P) Ltd. Marczyk, G., Demetteo, D., & Festinger, D. (2005). Essentials of Reseach Design and Methodology. New
Jersey: John Wiley & Sons, Inc., Hoboken. Raiyani, J. R. (2012). Research Methodology theory and techniques. New Delhi: New Century Publications
new delhi, india. Sekaran, U., & Bougie, R. (2011). Research Methods for business A skill buikding approach. New Delhi:
Wiley india pvt. ltd. Singh, y. S. (2006). Fundamental of Research Methodology and statistics. New Delhi: New age
international. WEBLIOGRAPHY Bombay stock exchange. (2018, March 4). Retrieved March 4, 2018, from Bombay stock exchange:
https://www.bseindia.com/static/about/introduction.aspx?expandable=0 Jalota, D. (Volume 7,Issue 5, 2017). FII and DII in indian stock market:A behavioural study. International
Journal of reseach in finance and marketing, 2--28. Juneja, S. (Volume 2, December 2013). Understanding the relation between FII and stock market.
International journal of commerce, business and management, 328-324. OTCEI. (2018, March 2). Retrieved March 2, 2018, from The over the counter exchange of india:
http://www.otcei.net/about/ Saba, A., & Neelam, J. (Volume 19, Issue 6. Ver. III (June 2017)). Impact of Foreign Institutional Investors
(FIIs) on Indian Capital Market. IOSR Journal of Business and Management (IOSR-JBM), 42-46.

International Journal of Advance and Innovative Research Volume 5, Issue 4 (XIX): October - December, 2018
65
ISSN 2394 - 7780
WORK LIFE BALANCE FOR A WORKING WOMAN IN INDIA
Priya A Sarda Assistant Professor, Pemraj Sarda College, Ahmednagar
ABSTRACT Life can be defined as living things and their activity. In today’s times the foremost activity that occupies most of the time of an individual is their working time, the time that give in their respective jobs. Work is an expected norm of the society that we live in. One has to work, if one has to survive. It is a natural phenomenon, not rocket science aspect. But what could be a rocket science approach would be whether a person works for work and the work works for he person. Today’s working women is expected to be the best both at home and at the office. She needs to prove herself as a master in the kitchen as well as in the board room. The work environment exerts enormous pressure on the women rendering her at times juggling between the two roles. Review of literature related to this topic has revealed that women of today have to continuously make sacrifices on both fronts. To what extent is work pressure good for women? Does the work bring them money and happiness both? Does the job help them grow financially and spiritually grow? In short how is your work life balance approach? Very few research papers have been extensively dedicated towards explaining the work life balance when it comes to working women. This research paper makes an attempt to understand the issues related to working women. A deep study has been done on the research papers available on this topic over the internet and secondary data that is available. Major consequences of poor work-life balance are high levels of stress and anxiety, disharmony and tension at home, experiencing job burnout and inability to realize full potential. They feel irritable and resentful often due to their inability to balance work and family life both. An important model of work life balance, viz. role-analysis model and three factor model have been studied in this paper to enable working women resolve the conflict caused due to poor work life balance. This model equips women with the mechanism to strike a fine balance and make them smarter, healthier and happier in every facet of their lives. This model assumes greater significance for working women across the world as it helps them resolve the dilemmas of managing their multiple roles in the personal and professional lives.
Keywords: Job burnout, role analysis, work life balance, working women, work pressure
WHAT IS WORK–LIFE BALANCE? Work–life balance is about people on job having a measure of control over when, where and how they work. It is achieved when an individual‘s right to a fulfilled life, inside and outside work is accepted and respected, to the mutual benefit of the individual, business and society. In the words of Jim Bird, CEO of worklifebalance.com, work-life balance does not mean equal balance between professional and personal life. It is careful synchronization of an individual's varied pursuits that may include family, work, leisure, social obligations, health, career and spirituality.
INTRODUCTION “ So it is naturaly with the male and the female , the one is superior , the other is inferior, the one governs, the other is governed.” – Aristotle
“ The relation of male to female is by nature a relation of superior to inferior and ruler to rules.” - Plato
The role and status of the women in India have changed considerably with the changing times. From the medieval ages to the current times, women has donned different roles and adjusted to the different strata of the society. In the modern India, women have held high offices such as that of President , Prime Minister, Scientists , Doctors, Engineers , Governors, etc. out of the total Parliament member, 11.60% is made up by women. India ranks 127th out of a total of 160 countries in gender equality index – 2018, (United Nations Development Program, UNDP, and India). 27.2 % of the total labor force of India is women. Women constitute 48.5% of the total population of India. (Ministry of Statistics and Programme Implementation, Statistical Year book India 2017, Table 2.1 Area and Population by States.)

International Journal of Advance and Innovative Research Volume 5, Issue 4 (XIX): October - December, 2018
66
ISSN 2394 - 7780
RESEARCH OBJECTIVE 1. To study the work-life balance of working women employees in India.
2. To find out problems faced by women
3. To examine the effect of work life balance on women’s performance and work Attitude.
4. To determine the factors affecting work-life balance.
This paper will focus on the factors leading to imbalance in working woman’s life. Data was collected after reviewing and reading various research papers on the said topic and on secondary data available in books and references.
LITERATURE REVIEW Ramos, Hazel Melanie & Francis, Felix & Varughese Philipp, Reuben. (2015). : A research among 139 young adults in the banking industry was conducted to examine the relationship between work-family balance and quality of life using a questionnaire developed by Greenhaus et al. (2003). This study examined relationships between time balance and quality of life, relationship between involvement balance and quality of life and relationship between satisfaction balance and quality of life. Results showed that individuals who are able to maintain time and involvement balance experience better quality of life.
Kalliath, Thomas & Brough, Paula. (2008).: In this article, six conceptualizations of work-life balance were reviewed in the literature: (1) multiple roles; (2) equity across multiple roles; (3) satisfaction between multiple roles; (4) fulfillment of role salience between multiple roles; (5) a relationship between conflict and facilitation; and (6) perceived control between multiple roles. Based on our review of this research we identify the two primary features of the work-life balance definitions and propose a new definition of this construct.
Andukuri, Raj & , Shravanthi & Deshmukh, Sagar & Deepa, N. (2013). : This paper has discussed the challenges for effective implementation of such policies, which can help HR managers to be cautious before introducing WLBPs in their respective organizations. Analysis of literature and available data suggests that family-friendliness of employers in India have been reflected in various welfare provisions which has been a matter of concern for employers since industrialization.
Bharathi, S. Vijayakumar. (2015) : In this research paper, an attempt has been made to find the professional and personal challenges and enhancers for work life balance amongst working women through a survey of 186 women working in the IT sector in India. The main challenges in professional life were found to be extended/odd working hours, travel time between home and workplace and participation in additional jobs and assignments. In personal life, the main stresses were guilty of not being able to take care of self and elders at home. Social media interaction was found to be stress busters for most women. Most women would prefer flexible timing, and supportive spouse, family and friends as well as an environment conducive for work at the office
FACTORS LEADING TO IMBALANCED WORK LIFE FOR A WORKING WOMAN IN INDIA 1. Burden of excessive work: Women have to juggle between many roles. She is a poised socialite, a
motivational leader, an encouraging mother, a competitive colleague, a doting wife, a responsible assistant and a fun friend. There is a constant pressure on women to prove their mettle on every platform.
2. Culture: The Indian culture as modern as it seems on the is still orthodox, mediocre, male chauvinist and narrow minded, when it comes to women stepping outside the threshold of their home to make her make in the male dominated society.
International Journal of Advance and Innovative Research Volume 5, Issue 4 (XIX): October - December, 2018
67
ISSN 2394 - 7780
3. Mentality of the society: According to the traditional Indian society women can be a good follower only, is the start of the thinking process. That is why glass ceiling is still majorly present in the corporate world . Indra Nooyi, Chanda Kocchar are a few who are breaking this stereotype.
4. Peer pressure: Men have a clear vision. Their career goals are set. Family time and family life can be easily sacrificed by them to achieve that target of the month. But this is not case when it comes to women managers. They have a job but they are also considered as the CEO of their homes. When it comes to performance appraisal, men and women both are compared at same scale . But the HR manager what sometimes fails to see is the dual role that women have to perform at work place as well as the home. The women who were handling the office assignments were also time bound by the home duties. They were achieving the company targets side by side taking care of the house, the kids, and the elderly too. So the pressure to be the best, by this dual role performance increases the pressure on the working women of today.
5. Self-guilt infliction: Women love to work, make a mark , prove their talent. But they continuously have that inner feeling of guilt that has biting them from inside as their attention is not fully on their family as the normal case should be. From centuries ago the focus of working women is on corporate goals as well as the grade of the kids. The attention is on the approaching deadlines as well as the birthday and anniversary dates of family members. It is on office politics as well as the approaching festive season preparations.
6. Sense of independence: Male dominance has always been the white elephant in the room .It has always been there. But it has never been talked about. It had never been sorted about. The society has never openly admitted it. By celebrating women’s day and other female oriented day’s one guiltily makes up for the torture inflicted upon women from centuries.
7. Need to be self-reliant : Women don’t wish to dominate . Neither do they wish to be dominated by anyone. All they wish to be is self-reliant. They want to be their own limit.. Be independent and not indifferent with respect to their life partner.
8. Long working hours: Fatigue, stress , anxiety , panic attacks are all caused by long strenuous working hours at the office . Continuous work in front of the screen leads to irritation in eyes, back problems and migraine.
9. Interference of work and family life: Emergencies at work place in the late night hours or long meetings at times of festivals or other important family function, such type of instances lead to disharmony between personal and professional life. At times both the entities come together and choosing one option out of the two is a dilemma for a working woman.
10. No time for one self: Deadlines, meetings, demanding in-laws, kids and their career, are all being juggled by the working woman, day in and day out. This gives little or sometimes no time for the woman to take care of herself. Her whole day goes in fulfilling expectations of everyone around her. She fatigues herself. With no rejuvenation and no adequate time to rest, she sacrifices her hobbies, her health and her peace of mind at times.
STEPS THAT CAN HELP IN BALANCING WORK - LIFE 1. Sort out your priority: A woman knows what she can do best and for what she might need help. She should
prioritize her work place cases and projects that will require her full or partial attention or whether it’s delegable. She should divide her work at home in proper time schedules and give herself a deadline as well as a break too. Draw a line between home and office. Once a working woman reaches home she should forget about her work worries. She should give her full undivided attention to her family, spouse and kids.
2. Flexible working hours: There might be a possibility that a working woman might not be able to give the required 8 hours straight at her work place. To reduce attrition rate and to increase motivation in the women workforce the company can allow them to work in shifts to suit their daily routine.
3. Work from home : Commuting from home to work place could be a hassle for a women especially if she has an ailing family member or a kid who required full time attention at home . In such cases for a particular period of time after HR manager’s approval , she can work from home.
4. Talk it out with the boss: Always be open, honest yet tactful with the employer and HR manager. Try to have flexible working hours. In case of morning hours dedicated to kids and family, evening working time can be lengthened. The female employee has to assure her company that flexibility and freedom in working will not hamper her performance and productivity in any way.

International Journal of Advance and Innovative Research Volume 5, Issue 4 (XIX): October - December, 2018
68
ISSN 2394 - 7780
5. Learn the art of delegation: A single person cannot do everything. A woman will fatigue her mind and body if she decides to do everything on her own. She has to learn to trust her own associates and work taking them along to finish the work in the desired manner.
6. Stay connected: With the advancement of technology that is bridging the gap day by day distance of a thousand kilometers seem small. A working mother can monitor her kid’s activities whether they are at day care, school or home. Thus once assured, she can focus all her attention and energy towards her work. In cases of emergency or illness there is always the option of work from home, in most of the companies of today. The employee has not to be necessarily physically be present there. With the physical boundaries of the office diminishing the office can be set up on the go anywhere and anytime with the help of internet technology.
7. Distract the distractions: Within 24 hours, a lot needs to be done at home and at office. Avoid over talkative co-workers, smartphones mania, causal internet surfing that leads to prolonged hours or wastage of minutes can be crucial. Every minute counts when you have to balance both frontiers home and the office. Allot time slots for socializing at office. Have family dinners at weekend so that the five working days can be guiltlessly allotted to work.
ROLE ANALYSIS MODEL A working woman is constantly confronted with the dilemmas of managing her multiple roles. Every role is of great significance in the context of both her entities, the family and work. It can often, get very difficult for the working woman to draw the right balance because all roles call for her attention at the same time. The expectations are heavy. According to the below figure of role analysis model, imbalance in work-life of a working woman is caused due to role overload in family life and role interference in work life. A working woman is burdened with the responsibility of managing family matters, child care, elderly care and other day to day mundane household work. To add to this, she is also expected to fulfill many social obligations like entertaining friends, being a host to her relatives and attending social functions. Her multiple roles as mother, daughter, daughter-in-law, sister, spouse, friend and so on take a toll on her time and energy causing strain and stress. In her work life, as a sub-ordinate to her boss and a superior to juniors, the working woman experiences role interference. Role interference occurs when the demands of one role interfaces with the demands of

International Journal of Advance and Innovative Research Volume 5, Issue 4 (XIX): October - December, 2018
69
ISSN 2394 - 7780
another. There is a battle between two roles both which are important for her survival. While she has to perform her work roles as required by her superior, the working woman also has to cater to the professional needs of her juniors. In this she is likely to face the problem of role interference resulting in strain. The strain in family life and/or professional life can lead to work-life problems. To manage these conflicts in her personal life, the working woman will resort to overlapping roles. So, while she is a daughter-in-law, she also assumes the role of a nurse to her ailing mother-in-law. In her work life she attempts to manage the conflict by engaging in role interdependence. She tries to bring some truce by establishing superior-subordinate role interdependence through effective inter-personal communication. Role overlap in family life will lead the working woman to role identification through a process of close diagnosis. In work life, role interdependence enables role legitimization for her as a result of diagnosis. This results in harmony between family life and work life through role clarity in the former and role integration in the latter. Therefore the working woman will redesign relationships in the family space and redefine roles in the work space to achieve equilibrium.
REFERENCES 1. Sunderasan Shobha (2014). Work life balance – Implications for working women. Maharani Lakshmi
Ammanni College for women .
2. Uzoechi Nwagbara and Babatunde O. Akanji (2012). The Impact of Work-Life Balance on the Commitment and Motivation of Nigerian Women Employees. International Journal of Academic Research in Business and Social Sciences
3. Ramos, Hazel Melanie & Francis, Felix & Varughese Philipp, Reuben. (2015). Work life balance and quality of life among employees in Malaysia. International Journal of Happiness and Development.
4. Kalliath, Thomas & Brough, Paula. (2008). Work-Life Balance: A review of the meaning of the balance construct. Journal of Management & Organization.
5. Andukuri, Raj & , Shravanthi & Deshmukh, Sagar & Deepa, N. (2013). Work Life Balance of Women in India. International Journal of Research in Management Sciences
6. Bharathi, S. Vijayakumar. (2015). Work Life Balance of Women Employees in the Information Technology Industry. Asian Journal of Management Research.
International Journal of Advance and Innovative Research Volume 5, Issue 4 (XIX): October - December, 2018
70
ISSN 2394 - 7780
HOUSEHOLD DETERMINANTS OF CHILDREN’S EDUCATIONAL ATTAINMENTS: A HOUSEHOLD LEVEL STUDY OF A BACKWARD MOST DISTRICT OF ASSAM
Baharul Alom Laskar1 and Sumanash Dutta2 Research Scholar1 and Professor2, Department of Economics, Assam University, Silchar
ABSTRACT Education is considered as the engine for economic growth and development of a country. In fact education is the key factor to develop the efficiency, knowledge, skills, ability to work, earning of human beings and growth of National income of a country. There are various factors which determine the schooling of children. The present study has been conducted in Hailakandi district of Assam with the help of primary data collected from 373 numbers of households, 5 to 18 years age group of childrens being the target group population of the study. The paper attempts to estimate the mean years of schooling of children according to average households income, assets, fathers and mothers age. Moreover, it also attempts to identify the determinants of schooling of children in the study area. It has been found that, with the rise of average household’s income, assets, fathers and mother’s age, schooling attainments of children have increased in a significant manner. The results suggest that bringing school nearer to households and opening up of earning opportunities of the households will improve the schooling achievements of children in a poorer socio-economic setup.
Keywords: Schooling of Children, Mean years of schooling, Average households income, Average households assets, control variables.
I. INTRODUCTION Education has crucial significance since its builds the foundation of economic growth and development. Besides the personal benefits of education in the life of an individual, it creates positive externality in different segments of society for its further expansion. Education affects skill and earning ability of an individual which help to expand economic growth in the country (Sahn & Younger, 2007).It is observed that the society which possesses higher level of education has higher level of economic growth and development (Schultz, 1961). The conventional theory of Human capital developed by Becker (1962) and Mincer (1974) asserts that, training and education are the two major sources of human capital accumulation. In the present technological era, education and skill have become crucial determinants of productivity of a person and the nation.
The existing literature suggests that parental attitude has tremendous influence on the educational attainment of their children. The decision about whether or not children actually enroll in school when it is available and, if enrolled, by what age and how long they should remain enrolled for completion of grades depends, as a matter of fact, on their parents(Lloyd and Blanc, 1996). Parental attitude towards the educational attainments of their children is a function of diverse cultural, socio-economic and religious factors. Family and household characteristics play a very significant role in parental decision making regarding their children’s schooling. The landmark study of race and education in the United States known as the “Coleman Report” ( Coleman et al, 1966) concluded that family characteristics are the most important determinants of educational achievements ( of children) than school quality, teachers’ experience, particularly in the early stages of education of children. There are significant evidences to support that family factors and household background characteristics are important for deciding the educational outcomes of children in both developed and developing countries (Currie, 1977; King and Lillard, 1987; Wolfe and Behrman, 1984; Buchmann, 2000; Masako and Peter, 2007; Chevalien,Vincert and Walker, 2013; Iarmosh, 2013; Drajea, 2014; Ceka, 2016). The rich literature in this domain of research categorically pointed out that parents’ level of education ( particularly mother’s level of education), family income, household wealth, age and occupation of father and mother, family structure, family size, number of siblings etc have significant impact on the schooling attainments of children.
However, the nature and magnitude of the causal impact of family and household characteristics on children’s education could not yet been firmly established. Contradictory findings are there ( Lavy, 1996; Tansel, 1997, for example) that necessitates further research in this area with micro level data representing diverse settings, regions and countries.
The present study is, therefore, an attempt to understand the role of family and household characteristics in determining the educational achievements of children at school level. The importance of the study further lies on the fact that the sample for the work has been drawn from a geographically isolated and backward most region of Assam which itself is a laggard in regard to some development parameters such as per capita income, state Human Development Index, school enrolment, prevalence of large scale school dropout etc (Assam

International Journal of Advance and Innovative Research Volume 5, Issue 4 (XIX): October - December, 2018
71
ISSN 2394 - 7780
Human Development Report, 2014). The main objectives of the study are (i) to estimate the mean years of schooling completed of children and to array it according to household income, father’s education , mother’s education etc and (ii) to identify the proximate determinants of the schooling attainments of children. The paper is organized into five sections. While the first section introduces the theme of the study, the second section discusses very briefly the salient characteristics of the geographical area of the study; the third section deals with the methodology, the fourth presents the results of the study lastly, the fifth section discusses the implications of the result and draws conclusion.
II. BRIEF PROFILE OF THE GEOGRAPHICAL AREA OF THE STUDY The sample of the study is drawn from Hailakandi District of southern Assam. This district is a constituent part of Barak Valley which includes two other districts viz., Cachar and karimganj. In Hailakandi district, there are 4 revenue circles and 5 Community Development (CD) blocks spread over 331 villages including 1 uninhabited village. The District has 3 towns ( 2 statutory towns and 1 census town). As per census of India, 2011, the total area of Hailakandi district is 1327 km2, out of which more than 50 percent area is covered by forest. The district has an interstate border with Mizoram on its south stretched over a length of 76 km and an inter district border on the other sides with Karimganj and Cachar districts. The population of the district is 659,296 and the DOP is 797 persons per square km, as per Census, 2011. The total number of schools of all categories ( Primary to Higher Secondary, Govt, Private and Unrecognized) in the District is 2245 and the total enrolment in these schools were 169137 as per District Elementary Education Report Card, Hailakandi, 2011-12 ( Elementary Education in India- Where Do We Stand?, Vol. I, NUEPA). The overall percentage of enrolment in recent decades is found to be satisfactory in Assam, but the most disturbing observations in this area are concerning actual enrolment and retention. “Of the total 6-16 year old children in the households, 6.45 percent are found to be out of school. Of the total of school children, more than 28 percent have actually never been enrolled; more than three-fourth of those who were enrolled have dropped out of school at different classes and a smaller proportion of them, although they have not formally given up school, do not go to school either.” (Assam Human Development Report, 2014). The poverty Head Count Ratio of Assam, as estimated in Assam Human Development Report, 2014 \, is 37 percent and it is substantially higher in rural areas. The literacy rate of Assam stands at 73.2 which is marginally higher than the all India average of 73.1 percent, but the state exhibits very high gender and rural-urban disparity (Census Report, 2011). The HDI value of Assam is 0.557 with values of its three components heath index, education index and standard of living index 0.523, 0.661 and 0.501 respectively ( Assam Human Development Report,2014). The study area Hailakandi District is the poorest of the poor districts of Assam with Assam HDI rank 27 out of 27 Districts and the district’s ranking in the dimensions of Health, Education and Standard of Living is 24, 24 and 27 respectively ( AHDR, 2014). These figures are testimonies of the fact that Hailakandi represents the most deprived segment of population of socio-economically backward state of Assam.
III. METHODOLOGY The primary data for present study has been collected from the rural and urban areas of the four revenue circles of Hailakandi district viz, Algapur revenue circle, Hailakandi revenue circle, Lala revenue circle and Katlicherra revenue circle. The urban areas are- Hindustan Paper Corporation (HPC) Township at Panchgram, Hailakandi Municipality area and Lala Town Area. The population of the study comprises of all the households of the four revenue circles along with urban households as per the population and household stratification of Census of India, 2011. The purposive random sampling method has been used by targeting households having children of the age group 5 years to 18 years. A total of 282 households have been surveyed from rural area and 91 households from the urban areas. The Head of the households/ the parents of the targeted children of 5-18 age groups have been interviewed face to face for collection of data with the help of a structured schedule. Simple statistical tables and regression analysis have been used for data analysis purpose.
IV. DATA ANALYSIS, RESULTS AND DISCUSSION For data analysis purpose to meet the objectives of the study, information collected from the field pertaining to some selected variables has been used. The variables used are defined below and their short forms are also shown which are used to present the result of the study. Children’s average education (in years): This variable is denoted as CAE and is estimated by taking the average education attained by children belonging to age group 5-18 yrs. of the household
Father’s Education (in years): This variable is denoted as FE and is measured by the completed years of father’s educational attainment.
Mother’s Education (in years): This variable is denoted as ME and represents the completed years of Mother’s educational attainment

International Journal of Advance and Innovative Research Volume 5, Issue 4 (XIX): October - December, 2018
72
ISSN 2394 - 7780
Household’s Income (in Rs.): This variable is denoted as HHI and represents the total annual income of the households from all sources.
Household’s Assets (in numbers): This variable is denoted as HHA and it represents the number of assets found available in the household out of 5 specified assets which are TV, Computer, Cycle, Motor Cycle and Car.
Family Size (in numbers): This variable is denoted as FS and it shows the total number of persons in a family who are sharing the same kitchen, joint or nuclear.
Family Type (dummy): This variable is denoted as FT which is a dummy variable assuming value 1 for nuclear; 0 for otherwise.
Residence (dummy): This variable is denoted as RESI, a dummy variable assuming value 1 if the household is located in rural areas; 0 otherwise.
Father’s Age (in years): This variable is denoted as FA and it represents father’s current age in years.
Mother’s Age (in years): This variable is denoted as MA and it represents father’s current age in years.
Electricity: This variable is denoted as EL, a dummy variable assuming value 1 if the household has electricity; 0 otherwise.
Number of Rooms: This variable is denoted as NR and it shows the total numbers of rooms available in the household.
Parent’s Outside Mobility Score (in numbers): This variable is denoted as POM and it is calculated by the sum total of values assigned to the following types of movement of parents outside locality - Many times=2, Few times=1, Never=0.
Average Distance from school (in km): This variable is denoted as AD and it represents the average distance of household from the schools the children are found enrolled in or completed grades from.
The descriptive statistics of these variables are shown in Table: 1
Table -1: Mean and Standard Deviation of the dependent and Independent Variables Variables Mean Std. Deviation N
CAE 6.6936 2.77717 373 FE 9.4665 3.86493 373 ME 8.4236 3.50156 373 HHI 193230.8311 124183.42541 373 HHA 1.3941 1.11811 373 FS 5.3164 1.25367 373 FT 1.0000 .00000 373 RESI .7560 .43005 373 FA 46.0161 7.04362 373 MA 39.1903 6.89231 373 EL .8445 .44896 373 NR 3.4424 .95322 373 POM 2.4960 2.27613 373 AD 2.2778 .91085 373
Source: Estimated by the Authors.
The average size of the family is observed to be larger than expected at more than 5 members per family. The FT value 1 implies that there is no joint family in the sample. Regarding Residence of Sample households in the study area it is found that, more than 75 percent of the children are residing in rural areas. The average Father’s Age (FA) is 46 years and that of mother is 39 years implying that majority of the parents groups are at an advance stage of their fertility span. In case of availability of electricity, on an average, 84 percent households possess this facility. The sample households have, in an average, 3 numbers of rooms in their houses. Regarding Parent’s Outside Mobility Score (POM), it is seen that, on an average, parents have high mobility with average score of 2.5 out of the total possible score of 3. However, the high SD value of 2.28 indicates that

International Journal of Advance and Innovative Research Volume 5, Issue 4 (XIX): October - December, 2018
73
ISSN 2394 - 7780
the mobility is not uniformly the same for all households rather there are parents who have very little mobility or no mobility at all. Lastly, regarding Average Distance of households from Schools (AD), the average distance is found to be 2.28 Km which betrays the assurance of the government to provide school within 1 Km of each household.
Table-2 shows the mean years of schooling completed by the target group children according to HHI, HHA, FA and MA.
Table – 2: Education level according to Average Income, assets, average age of fathers and mothers Average Education Level of Children of Household
No. of HH
HHI HHA FA MA
Class 0- V 118 147163.98 1.07 40.42 33.31 Class V- VIII 119 192974.79 1.40 46.55 39.65 Class VIII- X 102 217916.67 1.54 49.53 43.47 Class X- XII 34 279948.53 2.06 53.03 45.18
Source: Field Survey: 2016-17, Estimated by the Authors
The figures in Table-2 clearly show that as the household average income increases, the average education of children of households moves to higher grades. This implies that educational attainment of children improves as household income increases. Same is the case with households having more number of assets. Moreover, older parents have children having higher level of education. This Table figures are indicating towards a positive impact of household income, household assets on children’s educational attainments. The FA and MA can rather be considered as control variable since older parents are expected to have older children attaining higher grades of education.
However, to investigate into the matter further with an objective to identify the proximate determinants of the schooling attainments of children, the following regression model has been constructed with the variable defined above.
β1iFE + β2iME+β3i HHI+β4i HHA+β5i FS+β6i FT+β7i RESI+β8i FA+β9i MA+β10i EL+β11i NR+β12i
POM+β13i AD+ Ui, where βk are the regression coefficients and Ui is the random disturbance term.
The estimated regression result is shown in Table- 3.
Table – 3 : Regression Results Variables Coefficients Std. Error t Sig
(Constant) -3.352 .990 -3.386 .001 FE .007 .042 .174 .862 ME .009 .048 .181 .856 HHI 0.000 .000 1.901 .058 HHA .058 .137 .425 .671 FS -.079 .100 -.793 .428 RESI -.416 .398 -1.046 .296 FA .097 .033 2.905 .004 MA .167 .035 4.799 .000 EL .292 .243 1.203 .230 NR -.006 .145 -.044 .965 POM -.113 .080 -1.425 .155 AD -.380 .166 -2.291 .023
R Square = 0.525, Adj R Square= 0.509, F value = 33.156 ( Significant at 1% level) Source: Estimated by the authors.
Table: 3 summarize the result of the Ordinary Least Square regression model. Although almost all variables have causality with the dependent variable in expected line, only four variables are found to have statistically significant impact of the dependent variable. Household income is found to have positive and statistically

International Journal of Advance and Innovative Research Volume 5, Issue 4 (XIX): October - December, 2018
74
ISSN 2394 - 7780
significant impact on the schooling attainments of children. Father’s age and Mother’s age have also positive and statistically significant impact on children’s education. Lastly, the distance of schools from household is found to be exerting a negative statistically significant impact on the schooling attainments of the children implying that greater the distance less will be the schooling attainments of the children. However, the other variables, although have turned up statistically insignificant, are found to have expected direction of association with the dependent variable.
The Regression Model fit is found to be good with significant F value and the selected independent variables have explained near about 50 percent variation in the values of the dependent variable.
(V) CONCLUSION In this paper a total number of 373 households have been taken into consideration. It is observed that on an average sample children are studying in class VII, fathers and Mother’s education on an average are class IX and VIII respectively. The sample households have average income of Rs. 193230 and households possess more than one asset out of five specified assets. Average family size is of 5 persons and all families are nuclear in type. Nearly 75% sample households belongs to rural area. The study reveals that, with the increase in the average household’s income, assets, age of parents, the educational attainments of children increases. The regression results show that, determinants like household income, age of father and age of mother are positively associated with children’s average education and these are also found to be statistically significant. However the determinant average distance of household from schools is found to be negatively associated with children’s average education and this has turned up statistically significant. Thus it can be suggested that, creation of more income earning opportunities and establishments of schools in rural areas and urban areas can improve the schooling attainments of children.
REFERENCES Arnaud Chevalien, Harmon, Vincert & Walker (2013) “The Impact of Parental Income & Education on the
Schooling of their Children” IZA Journal of Labour Economics, Volume 2(8), Pp: 2-22.
Assam Human Development Report, 2014
Becker, Gary S (1962), “Investment in Human Capital: a Theoretical Analysis” Journal of Political Economy, Volume 70(5), Pp: 9-49.
Buchmann, Claudia (2000): “Family Structure, Parental Perceptions, and Child Labour in Kenya: What Factors Determine Who is Enrolled in School?”, Social Forces, June, 2000 78 (4): 1349-1379.
Ceka, Ardita & R. Murati (2006), “The Role of Parents in the Education of Children” Journal of Education & Practice , Volume 7(5), Pp: 61-64
Census Report of India, 2011.
Coleman, James S.,Ernest Q.Campbell, Carol J. Hobson, James McPartland, Alexander M.Mood, Frederick D.Welfeld, and Robert I.York (1966): “Equality of Educational Opportunity’, Washington, D.C: Office of Education, U.S Department of Health, Education and Welfare.
Currie, Janice (1977): “Family Background, Academic Achievement, and Occupational Status in Uganda”, Comparative Education Review 21, 14- 28.
Drajea, Alice & C. O’Sullivan (2014), “Influence of Parental Education and Family Income on Children’s Education in Rural Uganda” Global Education Review, Volume 1(3), Pp:149-166.
Iarmosh, Ievgeniia (2013) “How Family Size Affects Children’s Educational Outccomes: Evidence from Russia” A Thesis Submitted for Partial fulfillment of MA in Economics, KYIV School of Economics.
King, Elizabeth and Lee Lillard (1987): “Educational Policy and School Attainment in Malaysia and the Philippines.” Economics of Education Review, 6: 167-81.
Lavy (1996): School Supply Constraints and Children’s Educational Outcomes in Rural Ghana by Victor Lavy in Journal of Development Economics, Vol.51, 1996 pp: 291-314.
Lloyd, Cynthia B and Ann K. Blanc (1996): “Children’s Schooling in Sub-Saharan Africa: The Role of Fathers, Mothers, and Others”, Population and Development Review, 22(2):265-298, June.
Mincer, Jacob (1974), “Progress in Human Capital Analysis of the distribution of earnings” NBER working paper No. 53

International Journal of Advance and Innovative Research Volume 5, Issue 4 (XIX): October - December, 2018
75
ISSN 2394 - 7780
Ota, Masako & Peter G. Moffat (2007), “The Within Household Schooling Decision: a Study of Children in Rural Andra Pradesh” Journal of Population Economics, Volume 20, No. 4, Pp: 223-239.
Sahn, David E & S. Younger (2007), “Inequality and Poverty in Africa in an Era of Globalization; Looking beyond Income to Health & Education” Research Paper No. 2007/74, Published by Cornel University, Ithaca.
Schultz, T.W (1961), “Investment in Human Capital” American Economic Review, Volume 51(1), Pp: 1-17
Tansel, Aysit (1997): “Schooling Attainments, Parental Education, and Gender in Cote d’Ivoiry and Ghana”, Economic Development and Cultural Change, 45(4), 825-856.
Wolfe, Barbara and Jere Behrman (1984): “Who is schooled in Developing Countries? The Role of Income, Parental Schooling, Sex, Residence, and Family Size.” Economics of Education Review, 3: 231-45.

International Journal of Advance and Innovative Research Volume 5, Issue 4 (XIX): October - December, 2018
76
ISSN 2394 - 7780
PERFORMANCE OF DIESEL ENGINE BY ALTERNATIVE FUEL AS A KARANJA
Dr. Pabbathi Vijaya Rao Associate Professor, Abdul Kalam Institute of Technology and Science, Kothagudem
ABSTRACT In consideration of fossil fuel in future bio-fuel plays a virtual role in transportation vehicles. In point of biofuels calorific Value, density and some other important properties should be considered. By these consideration emissions and performance of a transportation vehicles is depended. Example biofuel are karanja, Tammanu oil, Chicken fat oil, Neem oil, Caster oil etc. In this research karanja oil was considered as a biofuel. To test the performance four stroke, water cooled eddy current dynamometer, single cylinder, pilot fuel engine is used which is also connected with piezo sensor to check the performance of an engine. The performance like BTE, BSFC & Vol.Eff were calculated and plotted in result and discussions.
Keywords: karanja oil, performance, BTE, BSFC, Vol. Eff.
1. INTRODUCTION The main important energy for the transportation vehicles in this country is gasoline fuel which is day by day expenses and as well gives the better performance to the movable vehicles. To break down the usage of gasoline bio fuel is coming in the usage. Biodiesel is emerging as an excellent alternative choice across the world as a direct replacement for diesel fuel in vehicle engines [1]. It is mainly derived from vegetable oils, animal fats and algae effort has been made to find out feasibility of biodiesel obtained from eucalyptus oil and its impact on diesel engine. The result of investigation shows that Brake Specific Fuel Consumption (BSFC) for two different samples of B 10 blend of eucalyptus biodiesel is 2.34% and 2.93% lower than that for diesel. Brake Thermal Efficiency (BTE) for B 10 blends was found to be 0.52% and 0.94% lower than that for diesel. Biodiesel is one of the technically and economically feasible options to tackle the aforesaid problems [2]. Biodiesel is produced mainly from edible oils. He reviews the necessity and potentiality of the non-edible oils and to identify the emerging technologies to produce biodiesel. Special attention has been paid to the impact of bio fuels on agricultural commodity prices and the food–fuel debate. There is a scope to improve fuel properties of biodiesel from non-edible feed stocks by methods such as catalytic hydro de-oxygenation. The performance and emission characteristics of diesel engine for various blends (B20, B40, B60, B80 and B100) of Karanja biodiesel and commercial diesel [3]. The Oxygen Present in biodiesel is responsible to enhance the complete combustion of the fuel, resulting in the reduction of CO and HC emissions and slightly increased NOx emissions when biodiesel is used. He is found that the performance of diesel engine at the 75% load is efficient. CO, CO2 and HC emission for the biodiesel blends and preheated biodiesel is lower than that of the diesel fuel, this is due to that biodiesel is a green fuel and contain less carbon molecule. This experimental study was aimed to find out performance characteristics and smoke emission with 10%, 20% and 30% biodiesel blend with diesel at varying loads (brake power) of 0.5 to 3.5 kW at a constant speed of 1500 rpm [4]. Brake thermal efficiency, brake specific energy consumption, exhaust gas temperature, mechanical efficiency, volumetric efficiency, air fuel ratio and smoke opacity of biodiesel blended fuel were evaluated and compared with diesel and it has been found satisfactory. On the basis of experimental study, the B20 Karanja biodiesel blend is found more useful among all tested fuels in terms of brake thermal efficiency.
2. Experimental Procedure A research was conducted on 4S, Single cylinder, water cooling, eddy current dynamometer loading, diesel engine. Engine was installed with peizosensor to sense the combustion pressure as well line pressure. The chosen equipment is computerized and highly sensed sensors are built. Installed setup drawn as a schematic view of experimental setup as shown in below figure 1. Initially the equipment was started experiment with pure diesel and reading was captured and later on using of pure diesel replaced by biofuel karanja with percentage wise. Biofuel percentage was increased until 30% data was captured and analyzed. Experiment conducted on pure diesel, 10% Karanja, 20% Karanja and 30% karanja. In these experiments performance were calculated and results were plotted in below mentioned graphs. Performance details like brake thermal Efficiency, Brake specific fuel consumption and Volumetric Efficiency.

International Journal of Advance and Innovative Research Volume 5, Issue 4 (XIX): October - December, 2018
77
ISSN 2394 - 7780
Figure - 1 :Schematic View of Experimental Setup.
3. RESULT AND DISCUSSIONS 3.1. Brake Thermal Efficiency BTE is a main performance parameter of a CI engine it assesses the suitability of a specific running condition. The graph 3.1 shows the BTE of the Engine at several substitutions of Karanja in diesel & compared with that of BTE for pure diesel.
0.5 1.0 1.5 2.0 2.5 3.0 3.55
10
15
20
25
30
BTE
(%)
BP (kW)
Pure Diesel B10 B20 B30
Graph - 3.1: BTE Vs BP at Various Karanja Substitutions in Diesel.
As exposed in graph 3.1 the BTE of the pilot diesel is quite normal and following a typical trend at varying loads, BTE at B20 has been very close to the performance of pilot fuel with only a variation of 2.5% lower than that of pilot fuel at all loads.
The B10 and B30 substitutes of karanja have a deterioration of performance related to that of pilot diesel. Graph 3.1 projects the BTE varying with the switch of Karanja, we infer that at amount load there is almost no change in the BTE with the switch of Karanja. At higher loads, the scene is different, 0% & 20% lowering and then increasing at 10% and 30% substitution.

International Journal of Advance and Innovative Research Volume 5, Issue 4 (XIX): October - December, 2018
78
ISSN 2394 - 7780
3.2. Volumetric efficiency The volumetric efficiency is the conscious volume of the engine, better volumetric efficiency shows healthy engine. The Graph 3.2 shows the volumetric efficiency of various blends, theoretically, the liquid fuels have a little result on the volumetric efficiency but the graph displays a distinction of volumetric efficiency and the volumetric efficiency is observed nearly same for the B20 and pure diesel. Increase in the substitute in the combination increases the post combustion residuals and there by leaving less space for the incoming charge into the combustion-chamber.
0.5 1.0 1.5 2.0 2.5 3.0 3.573.0
73.5
74.0
74.5
75.0
75.5
76.0
76.5
77.0
77.5
78.0
Vo
l.Eff.
(%)
BP (kW)
Pure Diesel B10 B20 B30
Graph - 3.2: Variation of Volumetric efficiency Vs BP at various Blends
Graph 3.2 has the picture of varying volumetric-efficiency at varying karanja switch in the blends. The small diminution in the volumetric-efficiency is noted with the growth in the karanja % in the blends.
3.3 Brake Specific-Fuel Consumption (BSFC) BSFC is another important parameter that determines the performance of any engine. It is the specific-quantity of fuel-used to generate a unit of power. The Graph 3.3 shows the BSFC for innumerable Blends of Karanja & Diesel. Till the part loads of 25% and 50% the BSFC has been varying for different blends but starting from the higher loads 75% and at 100% loads the BSFC is seen almost same to that of diesel for blend B20.
0.5 1.0 1.5 2.0 2.5 3.0 3.50.2
0.3
0.4
0.5
0.6
0.7
0.8
0.9
1.0
BSFC
(kg/
kWh)
BP (kW)
Pure Diesel B10 B20 B30
Graph - 3.3: Variation of BSFC Versus BP for various Blends
International Journal of Advance and Innovative Research Volume 5, Issue 4 (XIX): October - December, 2018
79
ISSN 2394 - 7780
The BSFC at varying substitution of Karanja in the combination is indicated in the display 3.3, increasing substitution Karanja has slight effect on the BSFC at 50%, 75% & loads but at 25% and 100% load there is a small increases of 5% of BSFC at 10% and 30% of Karanja substitution.
4. CONCLUSION The significant conclusions were drawn after the study of the results of the above cases. The result of the various performance parameters such as BTE, volumetric efficiency and BSFC. The blends of karanja in the diesel under standard conditions have shown distinct performances at various loads, B20 has stood best of all the other blends with the BTE & BSFC equal to that of pilot fuel.
REFERENCES 1. Puneet Verma (2016), “Potential use of eucalyptus biodiesel in compressed ignition engine”, Egyptian
Journal of Petroleum, Vol No: 25, Issue No: 1, PP: 91-95.
2. Yunuskhan, T.M., Atabani, A.E., Badruddin, I.A., Badarudin, A., Khayoon, M.S., Triwahyono, S. (2014), “Recent scenario and technologies to utilize non-edible oils for biodiesel production”, Renewable and Sustainable Energy Reviews, Vol No: 37, PP: 840–851.
3. Shikha Gangi, Ranjana Singh, Priyanka Bhavate, Divya Bhagat, Bharat Modhera, (2016), "Evaluation of engine performance and emission with methyl ester of Karanja oil", Perspectives in Science, Vol No: 8, PP: 241-243.
4. Sanjay mohite, Sudhir Kumar, Sagar Maji, (2016), “Experimental Studies on use of Karanja Biodiesel as Blend in a Compression Ignition Engine”, International Journal of Renewable Energy Research, Vol No: 6, Issue No: 2.

International Journal of Advance and Innovative Research Volume 5, Issue 4 (XIX): October - December, 2018
80
ISSN 2394 - 7780
CONSUMERS’ PERCEPTION TOWARDS SOCIAL MEDIA MARKETING
Dr. Ravindra Deshmukh1 and Kavita Kamath2 Associate Professor1, Ahmednagar College, Ahmednagar
Research Student2, RTM Nagpur University, Nagpur
ABSTRACT Social media has emerged as an important tool of the modern day media mix. Social media marketing is growing and various companies are using it to market their products. Facebook, Twitter, YouTube, Instagram etc. are now being used by marketers in various ways to reach out to their target markets and engage their customers. The researcher wanted to study this phenomenon which has brought about dynamic changes in the marketing environment. This paper aims to study how consumers perceive social media marketing by conducting descriptive research in Pune city. For this purpose, the researcher has conducted survey among social media users in Pune city.
Keywords: Social Media, Social Media Marketing (SMM), Traditional Media, Perception.
INTRODUCTION Social media marketing programs usually focus on efforts to create content that attracts attention and encourages readers to share it with their social networks.
The Mc. Kinsay Global Survey-2007 shows that companies are using digital tools from websites to wikis most extensively and one of the major vehicles of online advertisements is online social networking sites.
Selecting the proper blend of media outlets for advertisements is a crucial activity. As Ad campaigns are prepared, decisions are made regarding the appropriate mix of media. Media Planners & Media Buyers are both excellent sources of information about the most effective type of mix for a particular campaign.
Recent studies by Millward Brown & A.C.Nielsen highlight the benefits of combining different media. Media experts work continually to decide which different media go together for individual target markets, goods & services & advertising messages.
Media Mix is a combination of various integrated media used by marketers to attain their communication goals. Basically, Media Mix is nothing but the right selection of one or more media channels including TV, Print Media, Audio Media and Social Media. The Marketing managers or Media Managers in companies face the challenge of designing the right media mix which will have the best possible reach. Reach refers to the total number of different people or households exposed, at least once, to a medium during a given period.
Traditional Media includes the following: television, newspapers, magazines, brochures, pamphlets, product placement, hoardings and billboards, radio, films,etc.
However, the advent of Social Media has brought about a change in the traditional media mix. More and more advertisers are integrating Social Media into their Media Mixes.
In spite of this, it remains to be seen as to which media is perceived more positively by the target audience, which generates a higher recall value, which medium is trusted more by customers, and which one is the most cost effective.
A study in this direction will help marketers identify the pros and cons of each medium and design the optimum and most effective media mix. Recent research has shown that there are an increasing number of marketers who are using more of social media as compared to traditional media for marketing.
Hence, one must find out which media are the most effective and efficient. Efficiency in this case simply translates to the cost of effectively reaching those targeted consumers who are most likely to respond to a marketer’s message. This may be expressed as: cost-per-effective-target-market rating point (CPETRP)
CPETRP depends on the following: The cost of an advertisement. The size of the audience The degree by which the audience of the media vehicle skews towards targeted market members The degrees to which people are counted in the audience are likely to be exposed effectively to the message.
International Journal of Advance and Innovative Research Volume 5, Issue 4 (XIX): October - December, 2018
81
ISSN 2394 - 7780
SCOPE OF THE STUDY The study was conducted in Pune city to find out how social media users perceive social media marketing. The scope was limited to social media users’ perception about social media marketing only.
OBJECTIVES OF THE STUDY 1. The main objective of the study was to understand how consumers perceive social media marketing.
2. The study also aimed to find out which social media sites are effective for marketing products.
3. To understand the perceived benefits and limitations of social media marketing.
RESEARCH METHODOLOGY The research methodology used for this paper is descriptive in nature. It includes primary data collected from 500 social media users. Secondary data too was used which included data from various journal articles, research papers, websites, magazines, & online social media marketing portals. Convenience sampling method was used to select the sample of 500 social media users from Pune city.
LITERATURE REVIEW The Mc. Kinsay Global Survey-2007 shows that online advertising in online social networking sites is increasing. In connection to this Schumacher and Delucchi found that internet usage is increasing rapidly among the general population.
According to the CMO survey conducted by cmosurvey.org in August, 2011 Social media spending is expected to account for 10.1 % over the next 12 months up from 7.1 % in 2011. Moreover, in the next 5 years, it is projected to climb to 17.5% of the total marketing budgets.
In India, too, Social Media Marketing is gaining momentum, leading to a new media mix with traditional media and social media.
With the growing popularity of social networking sites like Facebook and Twitter, companies in India are planning to spend 30-40 per cent of marketing budget, amounting to about Rs 1,200 crores, through digital media platform this fiscal, an Associated Chambers of Commerce and Industry of India (ASSOCHAM) study has found.
The study, which surveyed about 1,400 people, including directors, CEOs, CFOs and managing directors, observed that majority of start-ups, leading national and international companies operating in India are embracing the social media to expand their business. The study titled ‘Explosion of Social Media: Transforming the Corporate Business Scenario,’ observed that majority of start-ups, leading national and international companies operating in India are embracing social media to enhance their business and on an average spending anywhere between Rs two lakh to Rs 50 lakh a year on social marketing campaigns.
As per the Universal McCann(UM) Global Social Media Study 2011 conducted byGraeme Hutton & Maggie Fosdick, in U.S., Brazil, Russia, India, China (BRIC countries), and the European Union (France, Germany, Italy Spain & U.K.), active Internet usage has gone up considerably in all the above mentioned countries. These series of five global Wave studies on Social Media point to the following findings: Social networks are clearly in the ascendancy since 2009. Globally, 18% of users claim that they actively have set up an online Brand community. Such communities
arguably are the ultimate expression of consumers who want to control their relationship with their preferred brands.
There is a strong empirical circumstantial evidence to indicate microblogging is helping fuel the flourishing & exciting phenomenon of Media Meshing. Meshing occurs where consumers actively use 2 media with at least one being an inetrenet enabled mobile device together to enhance their total media experience.
Being part of a movement and having a front seat for new news are key motivators for consumers to join an online brand community.
Nearly 60% of the respondents who said they had joined an independent brand community also claimed that they subsequently were more likely to buy the brand.
A survey was conducted by Yunjae Cheong, Federico De Gregorio, Kihan Kim (Journal of advertising Research, 2010). This survey of 104 U.S. advertising agency media directors was regarding current practices in media schedule evaluations and the application & perceptions of reach-and-frequency estimation models. Results suggest that for online media, a majority of agencies rely on qualitative assessments followed by cost based criteria or Internet-specific measures (page views).

International Journal of Advance and Innovative Research Volume 5, Issue 4 (XIX): October - December, 2018
82
ISSN 2394 - 7780
DATA ANALYSIS AND FINDINGS 1. Gender of the respondents 62 percent of the respondents were males and 38 percent were females. It is important to know the gender as buying behaviour, products bought, etc. differ according to gender.
2. Age of the respondents
Age Number Percentage Below 18 100 20
18 - 25 100 20 25 - 35 100 20 35 - 55 100 20
Above 55 100 20 TOTAL 500 100
Since the researcher wanted equal representation from all age groups, equal percent of all age groups were surveyed.
3. Occupation
Occupation Number Percentage Student 197 39.4 Unemployed 4 0.8 Professional 27 5.4 Salaried 150 30 Housewife 45 9 Self Employed 42 8.4 Retired 35 7 TOTAL 500 100
We can see that majority of respondents were students, followed by salaried employees. Next were housewives, self-employed, retired, profession and unemployed respectively.
4. Income
Annual Income Number Percentage Below 5 lakhs 282 56.4
5 - 7 lakhs 136 27.2 7 - 10 lakhs 66 13.2
10 - 15 lakhs 7 1.4 above 15 lakhs 9 1.8
Total 500 100
The above table shows that most of the respondents had income below 5 lakhs per annum. This was followed by 5-7 lakhs per annum and 7-10 lakhs per annum. Very few had income from 10- 15 lakhs and above 15 lakhs per annum.
5. Active Social Media Users After demographics, the respondents were asked whether they were active on social media. Only if they answered yes, the further questions were asked. Thus all 500 respondents in this study are active social media users.
6. Preferred Media for Watching Advertisements
Weight Television Radio Newspaper Hoarding Social Media
Online Media
Rank 1 6 236 13 51 76 76 48 Rank 2 5 84 90 100 44 126 56 Rank 3 4 84 43 160 64 119 30

International Journal of Advance and Innovative Research Volume 5, Issue 4 (XIX): October - December, 2018
83
ISSN 2394 - 7780
Rank 4 3 43 74 92 126 77 88 Rank 5 2 40 150 64 88 60 98 Rank 6 1 13 130 33 102 42 180
Total 500 500 500 500 500 500 Weighted Average 4.788 2.7 3.77 3.17 3.91 2.66
As per weighted average method, Television is the most preferred media. Social media is the 2nd most preferred media, followed by Print media. This is followed by Hoardings, Radio and then online media respectively.
7. Clicking on Product Pages/Advertisements on Social Media Sites
Response Facebook YouTube Instagram LinkedIn Google+ Twitter Yes 337 269 228 71 146 80 No 163 231 272 429 354 420 Total 500 500 500 500 500 500
This shows that majority of the consumers do click on advertisements. Facebook is the Social media site on which most advertisements are clicked on, followed by YouTube and Instagram. Least number of clicks on ads are on LinkedIn.
8. Perception towards Social Media Marketing
Response Strongly Disagree Disagree Neutral Agree
Strongly Agree Total
Too much advertising 15 10 97 151 227 500
It invades my privacy 18 39 155 214 74 500 Very useful 22 18 140 170 150 500
Information of the product 0 46 100 209 145 500
No attn. towards advert. 54 46 214 102 84 500
Prefer TM over SM 27 49 104 125 195 500
Like SM adverts 41 38 86 219 116 500
SM adverts are effective 9 51 151 145 144 500
SM ads annoying 41 115 92 151 101 500
Bought products based on SM adverts 39 31 164 200 66 500
Active on favorite brand pages 99 40 101 114 146 500
Check Reviews on SM before buying 30 9 102 146 213 500
The above table shows that most respondents feel that there is too much advertising on social media. Majority also agree that it invades their privacy. However, at the same time, many respondents also feel that it is useful and helps them gain information about the product. AMny do not pay attention towards advert. Most respondents prefer Traditional Media over Social Media. Majority of the respondents like Social Media advertisements, and find them effective. While many also feel that they are annoying. However, majority of the respondents have bought products based on SM adverts and are Active on their favourite brand pages
Most respondents also check reviews on SM before buying products.
FINDINGS 1. It was found that most people are active on social media.
2. It was also found that majority of consumers click on product pages or advertisements on social media sites.
3. However, at the same time, many respondents also feel that it is useful and helps them gain information about the product.
International Journal of Advance and Innovative Research Volume 5, Issue 4 (XIX): October - December, 2018
84
ISSN 2394 - 7780
4. Facebook is the most popular site for advertisements, followed by YouTube and Instagram. The growth of Instagram is particularly interesting, as it is the latest entrant in the field of social media as compared to the other two sites.
5. Consumers still prefer traditional media for advertisements as Television emerged as the best media for watching advertisements. Social media was ranked second best for advertisements, followed by print media, radio, hoardings and online media respectively. Thus we can see that customers do prefer social media marketing compared to other traditional media like print media, radio and hoardings.
6. Most respondents feel that there is too much advertising on social media.
7. Majority also agree that it invades their privacy.
8. Most of the respondents do not pay attention towards advertisements.
9. Most respondents prefer Traditional Media over Social Media.
10. Majority of the respondents like Social Media advertisements, and find them effective. While many also feel that they are annoying.
11. However, majority of the respondents have bought products based on SM adverts and are Active on their favourite brand pages
12. Most respondents also check reviews on SM before buying products.
SUGGESTIONS Companies must make use of social media for marketing their products.
Since it is perceived positively by consumers, they must take advantage of this medium to advertise their products, create product pages on social media sites and encourage users to post positive reviews, experiences, etc. which are seen by other consumers or prospects and will help the company.
They must also send updates etc. to consumers who like/follow their brand pages, which will help them stay connected with consumers and fulfill their marketing objectives.
CONCLUSION Thus , from this study, we can see that social media is perceived positively by consumers as they believe that it is useful in providing product information, helps in checking reviews before buying, and is effective. Many consumers click on product pages and advertisements on social media sites, thus showing that it is perceived positively and is an effective medium. So, Marketers must make use of this positive perception and include social media marketing in their marketing programme.
BIBILIOGRAPHY 1. Belch George E., Belch Michael A., Purani Keyoor (2007) Advertising & Promotion, an Integrated
Marketing Communications Perspective. 2. Batra Rajeev, Myers G. John, Aaker A. David (2009) Advertsisng Management. 3. Clow Kenneth E., Baack Donald (2007) Integrated Advertising, Promotion, and Marketing
Communications. 4. O’Guinn T.C., C.T. Allen & R.J. Semenik (2009) Advertising & Integrated Brand Promotion. 5. King K.W., & L.N. Reid (1997) Selecting Media for National Accounts: Factors of Importance to Agency
Media Specialists. 6. Danaher P.J. “Modeling Page Views across Multiple Websites with an Application to Internet Reach &
Frequency Prediction.. 7. Cheong Yunjae, Federico de Gregorio, Kihan Kim (2010) The Power of Reach & Frequency - Journal of
Advertising Research, vol. 50, no.4 8. Enoch Glen, Kelly Johnson, (2010) Cracking the Cross Media Code, JAR Vol. 50 no.2 9. Taylor David, Jeffrey E. Lewin & David Strutton (2011) Friends, Fans & Followers: Do Ads work on
Social Networks? How Gender & age Shape Receptivity – JAR Vol. 51 no.1 10. David Meerman Scott - The New Rules of Marketing and PR: How to Use News Releases, Blogs,
Podcasting, Viral Marketing and Online Media to Reach Buyers Directly.

International Journal of Advance and Innovative Research Volume 5, Issue 4 (XIX): October - December, 2018
85
ISSN 2394 - 7780
11. LaPointe Pat (2011) How Online Buzz and Offline WOM Can Make a Strong Message Even More Powerful – JAR Vol. 51 No.13.
12. Stephen D. Rappaport (2010) Listening Led Marketing Science & Media Strategies and Organizations – JAR Volume 50 no. 3
13. Indian Journal of Marketing ISSN 0973 -8703, Volume 41 No. 10, October, 2011.
14. Boyd D.M. & N.B. Ellison (2008) “Social Network Sites: Definition, History & Scholarship” Journal of Computer Mediated Communication.
15. Brackett L.K. & B.N. Carr (2001) cyberspace Advertsing vs other Media” Journal of Advertising Research Vol. 41, No.5
16. Li C. “How Consumers use Social Networks” Forrester Research, June 22, 2007.
17. Trattner, C., Kappe, F.: (2012) Social Stream Marketing on Facebook: A Case Study. International Journal of Social and Humanistic Computing (IJSHC)
WEBOGRAPHY 1. http://articles.timesofindia.indiatimes.com/2011-06-08/india-business
2. en.wikipedia.org/wiki/Social_media_marketing
3. www.newmediatrendwatch.com
4. www.Practical E-commerce.com
5. www.socialmediaexaminer.com
6. mashable.com/category/social-media-marketing
7. www.whitepapersource.com/socialmediamarketing/report/
8. www.marketingsherpa.com (Social Media Marketing Benchmark Report)
9. ibm.com press release
10. http://businesstoday.intoday.in/
11. www.socialmediatoday.com
12. www.mbaskool.com

International Journal of Advance and Innovative Research Volume 5, Issue 4 (XIX): October - December, 2018
86
ISSN 2394 - 7780
A STUDY ON EMOTIONAL INTELLIGENCE AT WORK PLACE
Dr. Kalpana Deshmukh Assistant Professor, ISBS, Pune
ABSTRACT Emotional Intelligence helps the employees to increase their emotional self-awareness, emotional expression, creativity, increase tolerance, increase trust and integrity, improve relations within and across the organization and thereby increase the performance of each employee and the organization as a whole. “Emotional intelligence is one of the few key characteristics that gives rise to strategic leaders in organizations”. Emotional intelligence plays a significant role in the organization and becomes an important criterion of evaluation for judgment of an effective employee, increases productivity and trust within and across the organization.
Keywords: Emotional Intelligence, Leadership, Employee satisfaction
INTRODUCTION Emotional Intelligence (EI) must somehow combine two of the three states of mind cognition and affect, or intelligence and emotion. Emotional intelligence refers to the ability to perceive, control, and evaluate emotions. Some researchers suggest that emotional intelligence can be learned and strengthened, while other claim it is an inborn characteristic. A number of testing instruments have been developed to measure emotional intelligence, although the content and approach of each test varies. If a worker has high emotional intelligence, he or she is more likely to be able to express his or her emotions in a healthy way, and understand the emotions of those he or she works with, thus enhancing work relationships and performance. Emotional Intelligence is not about being soft! It is a different way of being smart - having the skill to use his or her emotions to help them make choices in the moment and have more effective control over themselves and their impact on others.
Emotional Intelligence allows us to think more creatively and to use our emotions to solve problems. Emotional Intelligence probably overlaps to some extent with general intelligence. The emotionally intelligent person is skilled in four areas: 1. Identifying emotions,
2. Using emotions,
3. Understanding emotions, and
4. Regulating emotions.
The term Emotional Intelligence is only a few years old. It originally developed during the 1970s and 80s by the work and writings of psychologists Howard Gardner, Peter Salovey and John Mayer. EI first appeared in 1985 in a doctoral dissertation by Wayne Leon Payne, which he entitled “A Study of Emotion: Developing Emotional Intelligence.” His thesis on emotional intelligence included a framework to enable people to develop emotional intelligence. Payne asserted that many of the problems in modern civilization stemmed from a suppression of emotion and that it was possible to learn to become emotionally intelligent. Later it was coined by Daniel Goleman, who wrote the pioneering book on the subject. He actually co-authored it with his wife, Tara, triggered by sitting through many frustrating business meetings with her. Emotional Intelligence then appeared in a series of academic articles authored by John D. Mayer and Peter Salovey (1990, 1993). These publications generated little attention. Two years later, emotional intelligence entered the mainstream with Daniel Goleman's(1995) best-seller Emotional Intelligence: Why It Can Matter More Than IQ and subsequent articles in USA Weekend and Time Magazine (October 2, 1995). More recently, Goleman's latest book, working with Emotional Intelligence (1998), has caught the attention of human resource practitioners. Although the term ‘emotional intelligence’ was not used, it is evident that the groundwork for the research was set in motion long before any official work on emotional intelligence.
OBJECTIVE OF THE STUDY The objectives of the study are as follows as
• To study the elements of emotional intelligence of employees at work place
• To know extent of employees awareness towards emotional intelligence
SCOPE OF THE STUDY The scope of the study is to increase the employee’s emotional intelligence at work place and to help in future why some employees are outstanding performers while others are not. Emotional Intelligence calls for

International Journal of Advance and Innovative Research Volume 5, Issue 4 (XIX): October - December, 2018
87
ISSN 2394 - 7780
recognizing and understanding of the issues in the organizations on the basis of the results organization can choose a strategy and actions to improve the performance of their employees.
REVIEW OF LITERATURE Sánchez-Ruiz, Jose, Carlos, Prez-Gonzlez and Petride (2010) “Trait emotional intelligence profiles of students from different university faculties” had examined that the trait emotional intelligence (trait EI or trait emotional self-efficacy) profiles of 512 students from five university faculties: technical studies, natural sciences, social sciences, arts, and humanities. Using the Trait Emotional Intelligence Questionnaire, researchers hypothesised that (a) social sciences would score higher than technical studies in Emotionality, (b) arts would score higher than technical studies in Emotionality, (c) arts would score lower than technical studies in Selfcontrol, and (d) there would be an interaction between gender and faculty, whereby female students would score higher than male students within the social sciences only. Several other exploratory comparisons were also performed. Results supported hypotheses (a), (b), and (d), but not hypothesis (c), although the differences were in the predicted direction.
Nelis, Quoidbach, Mikolajczak and Hansenne (2009) “Emotional Intelligence Interventions to Increase Student success” focused on the construct of emotional intelligence (EI) which refers to the individual differences in the perception, processing, regulation, and utilization of emotional information. As these differences have been shown to have a significant impact on important life outcomes. This study investigated, using a controlled experimental design, whether it is possible to increase EI. Participants of the experimental group received a brief empirically derived EI training while control participants continued to live normally. The researchers found a significant increase in emotion identification and emotion management abilities in the training group. Follow-up measures after 6 months revealed that these changes were persistent. No significant change was observed in the control group. These findings suggest that EI can be improved and open new treatment avenues.
Hopkins & Bilimoria (2008) in his study “Social and Emotional Competencies Predicting Success for Male and Female Executives” explored the relationship between emotional and social intelligence competencies and organizational success. The study illustrates not much of differences between male and female leaders in their demonstration of emotional and social intelligence competencies and also found that when it comes to competency demonstration most successful men and women were more the same than different. However gender did play a reasonable role in the relationship between the demonstration of these competencies and success. 65 Further male leaders were considered to be more successful, even though male and female leaders demonstrated the same level of competencies. The four competencies that divided the most successful male and female leaders from their typical counterparts were Self Confidence, Achievement Orientation, Inspirational Leadership and Change Catalyst.
Koman, E. S., & Wolff, S. B. (2008) “Emotional intelligence competencies in the team and team leader: A multi-level examination of the impact of emotional intelligence on team performance”. This study examines the relationships among team leader EI competencies and team performance. The study was conducted on 349 aircrew and maintenance military team members participated representing 81 aircrew and maintenance teams. Results shows that team leader EI is significantly related to the presence of emotionally competent group norms (ECGN) on the teams they lead, and that ECGN are related to team performance. The authors also provide three suggestions. Firstly, Employee leaders with better EI competencies not only increase their own personal performance but also of the teams they lead. Secondly, by developing or hiring emotionally competent managers. Finally by developing emotionally competent first line leaders, organizations should develop emotionally competent executive leaders because each individual on the executive management team influences the development of ECGNs on the teams he or she leads.
Carmeli and Josman (2006) “The relationship among emotional intelligence, task performance, and organizational citizenship behaviors” this research suggests possible connections between emotional intelligence and positive performance in the workplace. Researchers say that even though research suggests that there is a connection between emotional intelligence and positive performance in the workplace, it is typically based on self reported assessment and it overlooks that work performance is actually multidimensional. Research suggests that possible connections between emotional intelligence and positive performance in the work place. Authors noted that task performance may not reveal the completeness of a leader’s work role. Other behaviors like maintaining civil relationships and helping subordinates with issues, would also influence the work performance. Researchers explored two essentials of the leader: altruism and general compliance could be the reasons that maintain the leader’s respect from subordinates and could, therefore, impact subordinates’ willingness to conscientiously perform work for the leader. Researchers conducted a study on 215 employees in

International Journal of Advance and Innovative Research Volume 5, Issue 4 (XIX): October - December, 2018
88
ISSN 2394 - 7780
different 66 organizations in Israel to see if there was a connection between emotional intelligence with both altruistic behavior and compliant behavior. Data was collected from subordinates and supervisors, as well as the participants, themselves. Their findings suggest that both altruism and compliance were related to task performance. Researchers also found that three elements of EI (appraisal and expression of emotions, regulation of emotions, and utilization of emotions) were related to task performance and to altruistic behaviors, but only partially to compliance behaviors.
Goleman (1998) “Working with emotional intelligence” Competency research in over 200 companies and organizations worldwide shows that about one-third of the difference is due to technical skill and cognitive ability while two-thirds is due to emotional competence. (In top leadership positions, over four-fifths of the difference is due to emotional competence).
Bar-On’s (1997) “The Bar-On Emotional Quotient Inventory (EQ-I): A test of emotional Intelligence” this study portrays social responsibility and empathy as specific interpersonal skills. Goleman’s 1995 model includes the same empathic awareness and attunement, this is the skill required to recognizing emotions in others. Knowing these varying EI models the study of the relationship of EI to moral/ethical behavior and to values has been inconsistent. The moral/ethics/values dimensions are often described as part of the basis for educational programs involving EI a well designed empirical research in this area is very much a necessity.
RESEARCH METHODOLOGY The study is descriptive in nature; relevant data has been collected from both primary and secondary source of information. Random sampling method was used to collect data from 150 respondents in the organization. The data was collected through structured questionnaire which was divided into two parts respondents were asked to reveal their personal characteristics in the first part of the questionnaire i.e. age, education, income, marital status and second part of the questionnaire is to measure the emotional intelligence level of employee constructed by Goelman was used. The Secondary Data were collected from various journals, articles, research report etc.
RESULTS & DISCUSSION The results of the study is discussed below
1. ELEMENTS OF EMOTIONAL INTELLIGENCE OF EMPLOYEES AT WORK PLACE The level of emotional intelligence was measured using Goelman scale, to find the undersating level of the questionnaire, reliability statistics was done. Devellis (1991) suggested that an acceptable level of reliability for psychometric test starts from .65 in this analysis most of the reliability value is above .65. The Cronbach’s alpha value of the study is .884 (88.4%). In this study, the value of Kaiser-Meyer-Olkin Measure of Sampling Adequacy is 0.798 (79.8%) which is adequate for proceeding with factor analysis. The total variance explained for the study is 65.539% by the 10 extracted components that are explained in detail to understand the determinants of employees’ emotional intelligence at work place. They are follows as
RELATIONSHIP FACTOR Relationships are associated with a number of positive outcomes (e.g., happiness, less stress) and are actively pursued for those individuals desiring them. Little attention has to be devoted for finding ways to preserve and pass on social relationships that are so important to business continuity. There are numerous opportunities to form social relationships with their co-workers which brings the team spirit among employees. Mentoring is necessary to pass on social relationships and also social relationships are important for defending relationships between an organization and its customers, suppliers, distributors, and other relevant groups on which the organization depends for success. Without making the effort to pass on these relationships, business can be lost and productivity can suffer. The items loaded on this factor is given below • I work under pressure (.688)
• I build rapport and keep others in the loop (.677)
• I make and maintain personal friendships among work associates (.626)
• I remain undisturbed during the critical (.501)
• I appeal to the core values of the group to clarify the alternatives and make the right decisions (.445)
ADAPTABILITY FACTOR In today’s dynamic workforce change is no longer the exception it is the rule. Adaptability is the Flexibility in adapting to changing situations or overcoming obstacles. Adaptors manage to stay flexible and productive when the demands of the job are pulling them in many different directions at the same time. Employees with

International Journal of Advance and Innovative Research Volume 5, Issue 4 (XIX): October - December, 2018
89
ISSN 2394 - 7780
high adaptability respond well to unforeseen changes by taking apt decisions. In fact, many of them thrive on change. Adaptable managers often are excellent mentors for new employees because they can easily accommodate the schedule changes necessary to guide or help orient another into a new position. The adaptive employee understands the work and finds creative ways to get the job done with little cost to the bottom line. When a new process or procedure is implemented the adaptable employees are great at encouraging at others. Employees who can adapt quickly find opportunities to improve service and will have a better chance at survival. The items loaded on this factor is given below • I face up prejudices and intolerance (.722) • When it is necessary, I can take decisions independently of my position in the organization (.599) • I have a good understanding of the forces that shape the views and actions of clients, customers, or
competitors (.581) • I consistently challenge bias and intolerance (.580) • I am decisive, and able to make sound decisions despite uncertainties and pressures (.522) • I seek out relationships that are mutually beneficial (.478) INITIATIVE OF THE EMPLOYEE The American Heritage Dictionary defines initiative as "the power, ability, or instinct to begin or to follow through energetically with a plan or task; enterprise and determination". Initiative is the readiness to act and seize opportunities. Many employers look for initiative as a "must have" trait for every position they are attempting to staff. In addition, it is critical to demonstrate initiative to be promoted in an organization. Demonstrating initiative proved to be the most powerful work skills tool for bridging the chasm between the intelligent, average worker and the super productive, star worker. If a employee is starting out in a new workplace, they will quickly be judged on whether they will go beyond their specific responsibilities and take initiative to face the challenges. The items loaded on this factor is given below • I consider myself an effective person, capable of taking on challenges and master new tasks (.707)
• I operate more from the expectation of success for fear of failure (.652)
• I actively seek out opportunities to meet the group's mission (.627)
• I insist on getting my goals despite obstacles and setbacks that occur (.428)
RESPONSIBILITY FACTOR When employees become an integral part of the organization they develop a sense of responsibility and pride in the success of the overall program. It is not only responsibility of management but also co-workers to achieve the goal of the organization and enables them to participate in hazard identification and problem-solving efforts. Employee’s involvement is the key to making it work. Employees have a responsibility to help employers create a workplace free of discrimination, and to cooperate with and participate in the employer's attempts to accommodate the employee's needs that are to be protected. The items loaded on this factor is given below • I provide original solutions to problems (.778)
• I do not hesitate to deal with challenging goals and take calculated risks (.724)
• I take responsibility for my actions (.722)
LEADERSHIP FACTOR Inspirational leadership is guiding and motivating with a compelling vision. Good leaders are made not born. If one has the desire and willpower, they can become an effective leader. Outstanding leaders develop through a never ending process of self-study, education, training, and experience (Jago, 1982). Leaders bring more to their jobs than the ability to get the work done from co-workers. Leadership is a process whereby an individual influences a group of individuals to achieve a common goal and is a process by which a person influences others to accomplish an objective and directs the organization in a way that makes it more cohesive and coherent. To inspire the workers into higher levels of teamwork, there are certain things one must know and do. These do not come naturally, but are acquired through continual work and study. Good leaders are continually working and studying to improve their leadership skills, they do not rest on their laurels. It is about enabling an individual to work as a team, understand and complement one another and find innovative solutions to organizational problems. The items loaded on this factor is given below • I respect and relate well to people from varied backgrounds (.830)
• I mentor, give timely coaching, and offer assignments that challenge and grow a person’s skill (.515)

International Journal of Advance and Innovative Research Volume 5, Issue 4 (XIX): October - December, 2018
90
ISSN 2394 - 7780
OPTIMISM Optimism is seeing the upside in events and it is the tendency to look at the bright side of any situation and expect the best possible outcome from any series of events. People who feel optimism live their lives expecting positive outcomes and events. Optimism is powerfully motivational and it is one of the cornerstones of success. Optimism is on the increase among employees working in the creative business. Optimistic employees work harder, longer and with a more innovative spirit. Optimism must be infused in the workplace through the company’s values. Focusing on the simple principle unleashed the optimism of both employees and consumers alike, making them proud to be part of organization. Workplace optimism is a culture attribute nurtured by managers and which is sustained by everyone. The item loaded on this factor is given below • I help out based on understanding other people’s needs and Feelings (.689) • I have confidence in myself (.593)
• I have a guiding awareness of my values and goals (.515)
• I am organized and careful with my work (.435)
TEAM BUILDING Team building is an ongoing process that helps a work group evolve into a cohesive unit. The team members not only share expectations for accomplishing group tasks, but trust and support one another and respect one another's individual differences. The role as a team builder is to lead the team towards cohesiveness and productivity. A team takes on a life of its own and have to regularly nurture and maintain it. Employee involvement, teams, and employee empowerment enable people to make decisions about their work. With good team-building skills, the team builder can unite employees around a common goal and generate greater productivity so it is the responsibility of the team builder to draw all the group members’ participation to achieve companies mission for which team building is very crucial. The item loaded on this factor is given below • I draw all members into active and enthusiastic participation (.734)
LOYALTY FACTOR Loyal employees are the heart of successful companies. When employees feel fulfilled at their jobs, they go above and beyond to help the organization improve. They share expertise, resolve conflicts, suggest improvements, boost morale, help co-workers, conserve resources, and more. "Those behaviors make groups and organizations more effective sales become better , production loss gets lower, everything else would be enhanced,” When employees are involved in decisions making, loyalty is further being increased and foster engagement. The item loaded on this factor given below • I don't hesitate to skip the usual routines when it is necessary to carry out the work (.742)
EMOTIONAL COMPETENCE Nowadays companies are facing an increasing stress of competition. They have to cope with shorter product lifecycles, rising customer demands, quicker technological developments and higher cost pressure. In order to create strategic competitive advantages, companies have to concentrate on their core competencies, which are significantly influenced by the skills and the knowledge of their employees. The main goal of business process management is to increase efficiency and effectiveness of companies by improving business processes and thus to increase the company value. For the employees, change implies continuous learning in order to tackle new challenges and tasks by competing with their emotions. The item loaded on this factor given below • I know that emotions I'm feeling at every moment and why (.826)
• I am willing to sacrifice myself in the name of the organization's goals (.487)
EMPATHY TOWARDS EMPLOYEE Empathy is sensing others' emotions, understanding their perspective, and taking active interest in their concerns. Empathy is one of factor in relationships and it is the ability to experience and relate to the thoughts, emotions, or experience of others. Empathy is more than simple sympathy, which is being able to understand and support others with compassion or sensitivity. Empathy is essential among employees for endorsing a good relationship in workplace. Empathy is also a key part of emotional intelligence that several researchers believe is critical to being an effective leader (Goleman, 1995). The item loaded on this factor given below
• I show sensitivity and understand others perspectives (.762)
• I promote actions that encourage a climate of friendship in the team (.693)

International Journal of Advance and Innovative Research Volume 5, Issue 4 (XIX): October - December, 2018
91
ISSN 2394 - 7780
2. EMPLOYEE AWARENESS TOWARDS EMOTIONAL INTELLIGENCE Many people are disconnected from their emotions especially strong core emotions such as anger, sadness, fear, and joy. This may be the result of negative childhood experiences that taught you to try to shut off your feelings. But although we can misrepresent, refuse, or numb our feelings, we can’t eliminate them. They’re still there, whether we’re aware of them or not. Unfortunately, without emotional awareness, we are unable to fully understand our own motivations and needs, or to communicate effectively with others. The employees are asked to give the awareness towards emotional at work place at various situations. The results are given below
Table -1: AWARENESS TOWARDS EMOTIONS NO. OF RESPONDENTS PERCENT Yes 92 61.3 No 30 20 Sometimes 28 18.7
61.3% of the employees are able to identify and understand the cause of their emotions, and 20% of the employees don’t understand their emotions, where as 18.7% are able to understand only sometime.
Table – 2: CONTROL OVER EMOTIONS NO. OF RESPONDENTS PERCENT Yes 51 34 Not always 78 52 No 21 14
52% of the employees do not control their emotions always, 34% of the respondents are able to control their emotions, where as 14% of they lack in controlling it.
Table - 3: WAYS OF CONTROLLING EMOTIONS NO. OF RESPONDENTS PERCENT Naturally without any effort on its own 31 20.7
With deliberate effort 31 20.7 Distraction by some other activity 62 41.3
Counseling by someone 26 17.3
41.3% of the employees control their emotions mainly by distracting in some other activity or becoming busy, 20.7% of employees control their emotions naturally without any effort on its own and also by taking deliberate effort. 17.3% of the employees control their emotions by the way getting counseling by someone
Table - 4: COLLEAGUES EMOTION
NO. OF RESPONDENTS PERCENT Yes 98 65.3 No 52 34.7
65.3% of employees understand their colleague’s emotion and of which 34.7% of employees do not understand their colleague’s emotion.
SUGGESTION The research revealed that most of the respondents are only average in their emotional competencies, therefore it is suggested that regular programmes at work should be held by the training and development team in order to improve the level of emotional intelligence thereby developing superior performance at work. Management should provide adequate recreational facilities to the employees which helps the superior and
sub-ordinate relationship and mainly reduces job related stress. The management should ensure effective utilization of manpower. Open session within every department can be made as a regular practice every week to know and understand
the views of the employees. It can be used to solve workplace hurdles and it may also serve as a source to get new productive solution.

International Journal of Advance and Innovative Research Volume 5, Issue 4 (XIX): October - December, 2018
92
ISSN 2394 - 7780
For better organizational climate and culture, the company must start hiring emotionally matured persons and must develop the level of emotional intelligence among the existing employees, thereby enabling them to face and overcome tremendous challenges at work.
Emotional intelligence has gained good recognition among the individuals, but still the awareness level among all the employees should be increased.
Emotional intelligence must be promoted among the employees and managers by regularly conducting ‘Emotional Competence’ training programme.
The leaders of the organization must develop emotional stability to ensure the physical and mental health of the self and that of the serving organization.
CONCLUSION Emotional intelligence plays an important role for employees in the organization. This paper has made a better understanding about the various reasons for emotion and better control over the emotion. Handling emotions is an important requirement for a HR for himself and among the employees as well. This will help to increase organizational commitment, improve productivity, efficiency, retain best talent and motivate the employees to give their best. This study confirms that both emotional intelligence and work life balance together create organizational success and develop competitive advantage for organizations. Understanding the potential and the talent that the employees and ensure the difference that employees bring to the work place and value them to make it a part of the organizational success. The work place should be better so that the employees can have a better team work, find solutions for problem, enhanced job responsibility, group mission, challenges, routine work, self confidence among workers. Emotional intelligence will bring in better adaptability, empathy towards employee, leadership qualities, group rapport, participative management, decision making, and understanding among colleagues. Most of the organizations are nowadays taking those employees who are emotionally intelligent, so that they can face the workplace problems easily and they can become more productive for the organization. Emotionally intelligent organization can be made through organizational strategies, leadership skills, development programmes, and self-awareness and self-management tools. The researcher from the study concludes that emotional intelligence is linked at every point of workplace performance and it is of highest importance nowadays. Hence, to be successful in life Emotional intelligence plays a vital role.
REFERENCES Bar-On, R. (1997). The Bar-On Emotional Quotient Inventory (EQ-I): A test of emotional intelligence.
Carmeli, A., & Josman, Z. E. (2006). The relationship among emotional intelligence, task performance, and organizational citizenship behaviors. Human Performance, 19, 403-419
Davies, M., Stankov, L., & Roberts, R. D. (1998). Emotinal intellignece: In search of an elusive construct. Journal of Personality and Social Psychology, 75, 989-101
Goleman, D. (1998). Working with emotional intelligence. New York: Bantam Books
Hopkins, M. M., Bilimoria, D. (2008). Social and Emotional Competencies Predicting Success for Male and Female Executives (1 ed., vol. 27). Journal of Management Development.
Koman, E. S., Wolff, S. B., (2008). Emotional intelligence competencies in the team and team leader: A multi-level examination of the impact of emotional intelligence on team performance. Journal of Management Development, 27(1).
Romanelli, F., Cain, J., & Smith, K., M. (2006). Emotional intelligence as a predictor of academic and/or professional success. American Journal of Pharmaceutical Education, 70(3).
Sánchez-Ruiz, Jose, Carlos, Prez-Gonzlez and Petride (2010) Trait emotional intelligence profiles of students from different university faculties. Australian Journal of Psychology, Volume 62, Issue 1 March 2010 , pages 51 – 57

International Journal of Advance and Innovative Research Volume 5, Issue 4 (XIX): October - December, 2018
93
ISSN 2394 - 7780
AN ANALYSIS OF GROWTH AND PERFORMANCE OF MSMES IN JAMMU AND KASHMIR
Altaf Ahmed1 and Prof. N. M. P. Verma2 Research Scholar1, Department of Economics, BBAU, Lucknow Dean2, School of Economics and Commerce, BBAU, Lucknow
ABSTRACT Micro, Small and Medium Enterprises (MSMEs) have played an imperative role in the economic development of a country. Developing countries like India faces many challenges in providing employment to a large number of population and less efficient to promote the GDP of the country. MSMEs are the backbone of the country and provide a large number of employees to the youths. It contributes to the growth of Indian economy with the wide network of 36 million units as of today and it providing employment to 80 million people. The sector is contributing about 8% to GDP, 45% in gross manufacturing output and about 40% in export. In recent years MSME sector has registered higher growth rate than the overall industrial sector. It is fostering the entrepreneurship among the peoples of the country. Jammu and Kashmir is the most industrially backward state of the country. Large-scale industries are very less in the state. In recent years MSMEs is growing in the state and it had promoted the entrepreneurship development and startup schemes in the state. The state has comprised of twenty-two districts and nowadays MSMEs started to grow in all the districts of the state. The state is facing many challenges to developing these industries in the state. The aim of the present study is to find out the performance and growth of MSMEs. The study had also put light on the problems faced by MSMEs in the state. The present study in empirical in nature and it is based on secondary data. The data collected from Directorate of Industries and Commerce J&K, Annual reports of MSMEs, Journals and periodicals. Paper concludes that MSMEs are growing continuously and creating employment to the jobless economy of the state. Both the central and state government needs to develop the lagging sector of the state. Infrastructure, transportation and huge investment in MSMEs are the ways to develop this sector.
Keywords: Entrepreneurship, Start-ups, MSMEs, Challenges, Employment, J&K, India
INTRODUCTION Micro, Small and Medium Enterprises form a significant part of economic growth both in developing and developed countries. It provides livelihood, equal distribution of income and balanced development in India. MSMEs are the backbone of the country and the economic growth of the country is mostly dependent on MSMEs then large industries. It provides a large employment in Indian economy at low cost than large industries. It performs a key role in the development of the economy with their effective, efficient, flexible and innovative entrepreneurial spirit. The MSME sector contributes significantly to the country’s manufacturing output, employment and exports. The sector have unique advantages due to their size, high labor-capital ratio, extension of smaller markets, low investments and equitable distribution of national income. The sector also facilitates an effective mobilization of resources of capital and skills, which might otherwise remain unutilized and stimulate the growth of industrial entrepreneurship. Indian MSMEs are heterogeneous in nature due to its variety of products and services. The sector performs an important role in socio-economic development of the country. MSMEs are an important pillar of Indian economy as it provides 69% employment to Indian workforce and play a significant role in providing employment to the rural and semi-urban areas. In the financial year, 2017 states that 36.2 million MSMEs are working across India and it contributes to 45% of manufacturing output and 40% to export to the country. MSME sector is contributing 8% in country GDP by employing 80 million people and producing more than 8000 value-added products. Furthermore, the sector is nurturing the entrepreneurship in the country, which is a new emerging sector in the economy. MSME sector is also facing many challenges in finance, marketing, technology and many other consultancy services.
Jammu and Kashmir is the northernmost part of the country, which shares the border with Pakistan, China and Afghanistan. The state has three regions: Jammu, Kashmir and Ladakh. J&K is famous for its natural beauty and it attracts the tourist all over the world. It is said that in January-October 2017, J&K has 7.31 million tourists visited. Gross State Domestic Product (GSDP) of J&K at the current price estimated as 11.61% in 2017-18. J&K is the industrial backward state of India. It is unable to attract investment in the manufacturing sector. J&K is the most disputed state and due to political instability and poor infrastructure, the state is industrially backward. From last few years, the political instability is growing continuously which leads to poor infrastructure and increasing the level of unemployment. Large-scale industries are absent in the state and only MSMEs are working in the state. From the last few years MSMEs are growing in the state at the end of 2014, the total number of MSMEs in the state was 57193, which provide employment to 277653 people. Districts

International Journal of Advance and Innovative Research Volume 5, Issue 4 (XIX): October - December, 2018
94
ISSN 2394 - 7780
Industries Centres were established in all the districts of the state to simplify the registration process according to the data of Directorate of Industries and Commerce J&K,
LITERATURE REVIEW Srinivas. K. T. (2013), in his study entitled with Role of MSMEs in inclusive growth, stated that both state and central government had to make changes in this sector. There are lack of marketing facilities, poor infrastructure and finance problem. The government did not reached up to mark for the upliftment of MSMEs in India. The study concluded that MSME is an engine of economic growth in India, so there is need more improvement from govt. side to upgrade this sector also entrepreneurship development a new initiative of government will promote the MSMEs in India.
Ghatak. Shambhu (2010) stated that India MSMEs are better than the neighbor countries. Pakistan SMEs have only 36% bank account and about 46% SMEs have a bank account in Bangladesh whereas in India 95 percentage SMEs have a bank account. The study "MSMEs in India" needs more improvement to accelerate the growth of this sector.
Venkatesh and Muthiah (2012), analyzed that the role of MSMEs is growing rapidly in the industrial sector. It also becomes a thrust area for the future growth. They also highlight the promotion of SMEs for the economic up-liftmen of the nation.
Singh et al. (2012), examined the performance of SSI and focused on new policy changes in India. The paper concluded the growing performance of registering units, production employment and exports. The study will also suggest the measure to boost the technology upgradation to achieve the growth rate.
Jaswal, s. s. (2014), in his study Problem and Prospects of MSMEs in India tried to examine the growth and performance of MSMEs, the role of MSMEs in GDP growth rate and discussed the problems faced by MSMEs. The study is based on secondary data and concluded that MSMEs have emerged as an engine of economic growth. In these years the employment from agriculture sector is declining, also the large industries have jobless growth; in such a situation the MSMEs has a responsibility to create jobs by improving productivity. Govt. needs to help the sector to promote and to remove the sickness of these units.
Zakkariya, K. A., & Nishanth, P. (2014), explored the barrier faced by MSMEs units in raising finance and tried to identify the various sources of finance. The present study is based on primary source of data collection in which 200 samples from Kozhikode district Kerala were taken. The study divided the different problems to different subgroups. The study found that samples are unaware of government schemes of MSMEs.
Anjum, Darakhshan (2011).This paper provides a complete look at scope, opportunities and challenges for rural entrepreneurs in agriculture, horticulture, handicraft, handloom and sericulture in the state of Jammu and Kashmir. Rural entrepreneurship has an important role to play in the development of a country. It is one of the most important inputs in economic development. The number and competence of entrepreneurs affect the economic growth of the country. Entrepreneurship has been termed as the fuel of economic progress and the prime mover of economic growth and development. Finally, the study concludes with the observation that rural entrepreneurship is a prestigious area in the rural development of the nation. They are playing a pivotal role in India’s economic development. Thus, entrepreneurship is the best way to fight the evil of unemployment.
Parihar, Poonam (2008), the investigation was carried out in a Jammu district of the State to know the impact of motivational factors and role stress on women entrepreneur’s. Total 240 respondents interviewed with the help of pre-tested structured interview questionnaire. The study designed to cover women entrepreneurs operating small-scale commercial enterprises in Jammu district. It was found that ‘’Liking for having an independent occupation’’ (82.5%) ranked first amongst personal motivational factors followed by ‘’Monotony of housework’’ (77.01%). ‘’Existence of business already in the family’’ (97.5%) ranked first amongst non-personal motivational factors followed by ‘’need to get over financial difficulty’’ (92.08%).Women were subjected to a greater stress as the demands of home and career at times caused conflicts, striving for multi-role duties had resulted in conflict stress, ambivalence and overload. Though the conflicts existed, women had realised the advantages of being business women.
OBJECTIVES 1. To analyses the growth performance of MSMEs in Jammu and Kashmir.
2. To discuss the various challenges faced by MSMEs in Jammu and Kashmir.
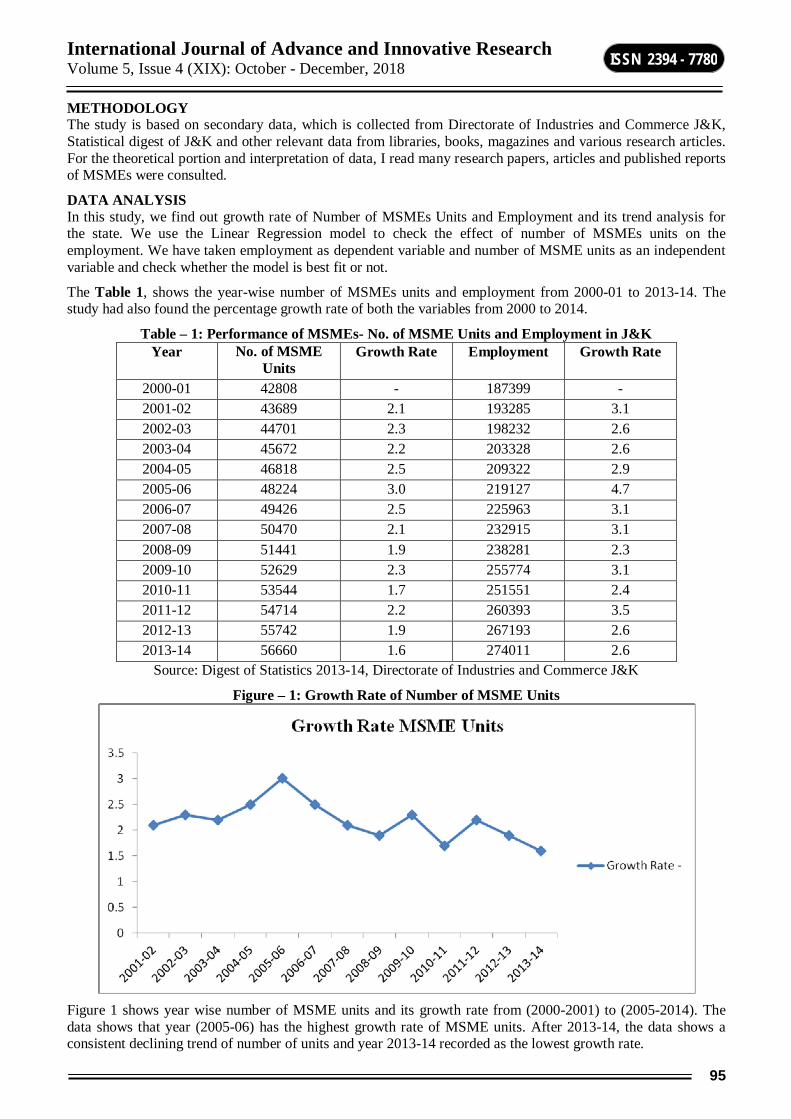
International Journal of Advance and Innovative Research Volume 5, Issue 4 (XIX): October - December, 2018
95
ISSN 2394 - 7780
METHODOLOGY The study is based on secondary data, which is collected from Directorate of Industries and Commerce J&K, Statistical digest of J&K and other relevant data from libraries, books, magazines and various research articles. For the theoretical portion and interpretation of data, I read many research papers, articles and published reports of MSMEs were consulted.
DATA ANALYSIS In this study, we find out growth rate of Number of MSMEs Units and Employment and its trend analysis for the state. We use the Linear Regression model to check the effect of number of MSMEs units on the employment. We have taken employment as dependent variable and number of MSME units as an independent variable and check whether the model is best fit or not.
The Table 1, shows the year-wise number of MSMEs units and employment from 2000-01 to 2013-14. The study had also found the percentage growth rate of both the variables from 2000 to 2014.
Table – 1: Performance of MSMEs- No. of MSME Units and Employment in J&K Year No. of MSME
Units Growth Rate Employment Growth Rate
2000-01 42808 - 187399 - 2001-02 43689 2.1 193285 3.1 2002-03 44701 2.3 198232 2.6 2003-04 45672 2.2 203328 2.6 2004-05 46818 2.5 209322 2.9 2005-06 48224 3.0 219127 4.7 2006-07 49426 2.5 225963 3.1 2007-08 50470 2.1 232915 3.1 2008-09 51441 1.9 238281 2.3 2009-10 52629 2.3 255774 3.1 2010-11 53544 1.7 251551 2.4 2011-12 54714 2.2 260393 3.5 2012-13 55742 1.9 267193 2.6 2013-14 56660 1.6 274011 2.6
Source: Digest of Statistics 2013-14, Directorate of Industries and Commerce J&K
Figure – 1: Growth Rate of Number of MSME Units
Figure 1 shows year wise number of MSME units and its growth rate from (2000-2001) to (2005-2014). The data shows that year (2005-06) has the highest growth rate of MSME units. After 2013-14, the data shows a consistent declining trend of number of units and year 2013-14 recorded as the lowest growth rate.

International Journal of Advance and Innovative Research Volume 5, Issue 4 (XIX): October - December, 2018
96
ISSN 2394 - 7780
Figure – 2: Growth Rate of Employment Generated by MSMEs in J&K
Figure 2 shows a percentage growth rate of employment generated by MSMEs in the state during 2000 to 2014. The data shows that the trend of employment increases in starting and then starts decreasing. There are many ups-downs recorded in the trend. The year 2005-06 recorded as the highest growth rate (4.7%) and the year 2008-09 recorded as the lowest growth rate (2.3%).
DATA ANALYSIS THROUGH REGRESSION Here we used the regression model to analyze the correlation between the variables and tried to established the validity of the regression model. Thus, we established employment as a dependent variable and number of units as an independent variable. To explain the variation of the dependent variable, employment by its covariance with independent variables: number of MSME unit, we use the linear regression model defined as
Y = β0 + β1X1+ µ
Where Y = Explained Variable (Employment) X1 = Explanatory Variable 1 (number of Units) µ = Specification error β0, and β1 are models parameter RESULTS AND DISCUSSION
Sum of Square
df Mean Square
F Prob>F R-Square Adj. R-Sqaure
Regression 1.0807e+10 1 1.0807e+10 1483.91 0.000 0.9920 0.9913 Residual 87395304.3 12 7282942.02 Total 1.0895e+10 13 838048641
Dependent Variable: Employment
Variable Coefficient Std. Error T p>t No. of Units 6.298347 .1635018 38.52 0.000 Constant -83590.27 8166.573 -10.24 0.000
Using STATA, we get the regression equation from this model:
Y = -83590.27+ 6.298347X1
The model shows that with 1% increase in number of units 6.2% change will be in employment. P value is less than 5%, so it is independent variable is explaining the dependent variable. Coefficients of the model are also positive. Therefore, the independent and dependent variables have a positive association. R-square is 0.9920, which shows that 99.2% of variation in dependent variable is explained by independent variable.
Now, check whether the residual of the model is normally distributed or not. We had created a new variable ‘U’. Take hypothesis:

International Journal of Advance and Innovative Research Volume 5, Issue 4 (XIX): October - December, 2018
97
ISSN 2394 - 7780
Null Hypothesis: Residual is normally distributed
Alt. Hypothesis: Residual is not normally distributed
We have used Shapiro-Wilk W test for normal distribution
Variable Obs. W V z Prob>Z U 14 0.95545 0.824 -0.380 0.64802
Here prov>Z is 64.8%, which is greater than 5%. It means we accept the Null hypothesis that residuals are normally distributed.
Now we check whether the model has Heteroscedasticity or not.
Null Hypothesis: Residuals are Homoscedastic
Alt. Hypothesis: Residuals are Heteroscadastic
Here we had applied the Breusch-Pagan / Cook-Weisberg test for Heteroscedasticity.
Ho: Constant variance
Variables: fitted values of employment
chi2 (1) = 1.26
Prob > chi2 = 0.2615
We found that prob>Chi2 is 26.15%, which is greater than 5%. It means we accept null hypothesis that residuals are homoscedastic. Therefore, the model is best fit.
Also check, whether the model is serially correlated or not.
Null Hypothesis: Residuals are not serially correlated or autocorrelated.
To check the serial correlation we had applied Durbin's alternative test for autocorrelation.
lags(p) chi2 df Prob > chi2 1 0.543 1 0.4610
H0: no serial correlation The results we found that prob>chi2 is 46.1%, which is greater than 5%. Therefore, the null hypothesis accepted that residuals have not serially correlated. Therefore, our model is best fit.
PROBLEMS OF MSMES IN JAMMU AND KASHMIR Jammu and Kashmir is most disputed state of India and last few years it faces the problem of political stability. It faces the different challenges in growth and development. These challenges are dissimilar to other states of the country like political instability, the graphical condition of the area, seasonal effect etc. J&K state is rich in its beauty and natural resources but due bad connectivity of state with other states and nations, proper utilization of these resources does not taken. The manufacturing sector is very weak in the state due to improper transportation facilities, infrastructure and technology. Kashmir is hub of tourists, it is most tourist-attracted state, but from last few years due to political instability and violence in the valley, the number of tourist has decreases. According to economic survey J&K 2017, the sector wise growth rate of J&K economy has decreased. The budget shows that the in 2015-16, the growth rate of agriculture sector was 24.7%, Industry 26.2% and the Services sector had 10.8% whereas in 2018-19 the agriculture growth rate is 6.8%, industry 6.0% and services sector is 5.7%. This declining phase of J&K is a challenging aspect for the state. Industrial sector of J&K shows only MSMEs, large industries are not available in the state. Industrial sector does not play only an important role in providing employment to the educated youths but it also the solution of unemployment crisis in the state and contribute to raise the per capita productivity of the state. MSMEs are facing many challenges in its growth; few of its challenges are discussed below:
1. Skilled Labour: The state is facing the problem of the skilled workforce. Most of the labour working in MSME units are unskilled. There are no proper training facilities to make the youth skilled and entrepreneur.
2. Marketing for Finished Products: Marketing is an important factor for MSMEs to survive. Despite large domestic markets in the country, MSMEs are facing marketing problem. To check the performance of
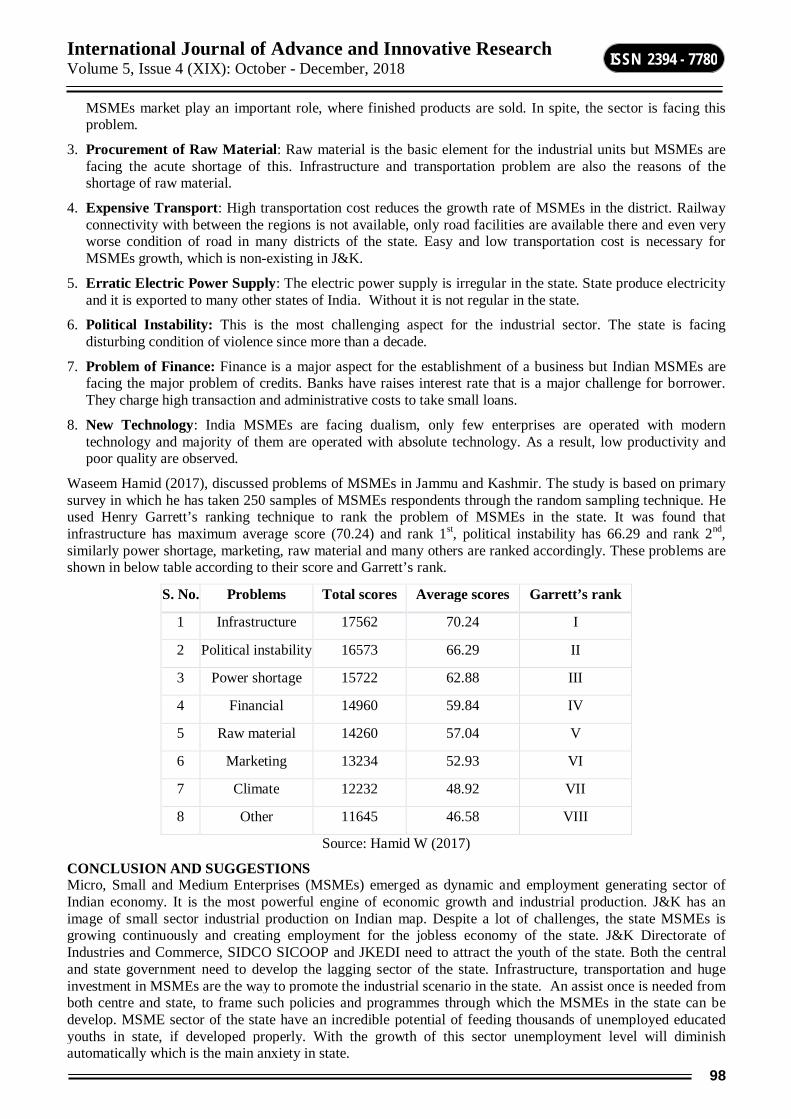
International Journal of Advance and Innovative Research Volume 5, Issue 4 (XIX): October - December, 2018
98
ISSN 2394 - 7780
MSMEs market play an important role, where finished products are sold. In spite, the sector is facing this problem.
3. Procurement of Raw Material: Raw material is the basic element for the industrial units but MSMEs are facing the acute shortage of this. Infrastructure and transportation problem are also the reasons of the shortage of raw material.
4. Expensive Transport: High transportation cost reduces the growth rate of MSMEs in the district. Railway connectivity with between the regions is not available, only road facilities are available there and even very worse condition of road in many districts of the state. Easy and low transportation cost is necessary for MSMEs growth, which is non-existing in J&K.
5. Erratic Electric Power Supply: The electric power supply is irregular in the state. State produce electricity and it is exported to many other states of India. Without it is not regular in the state.
6. Political Instability: This is the most challenging aspect for the industrial sector. The state is facing disturbing condition of violence since more than a decade.
7. Problem of Finance: Finance is a major aspect for the establishment of a business but Indian MSMEs are facing the major problem of credits. Banks have raises interest rate that is a major challenge for borrower. They charge high transaction and administrative costs to take small loans.
8. New Technology: India MSMEs are facing dualism, only few enterprises are operated with modern technology and majority of them are operated with absolute technology. As a result, low productivity and poor quality are observed.
Waseem Hamid (2017), discussed problems of MSMEs in Jammu and Kashmir. The study is based on primary survey in which he has taken 250 samples of MSMEs respondents through the random sampling technique. He used Henry Garrett’s ranking technique to rank the problem of MSMEs in the state. It was found that infrastructure has maximum average score (70.24) and rank 1st, political instability has 66.29 and rank 2nd, similarly power shortage, marketing, raw material and many others are ranked accordingly. These problems are shown in below table according to their score and Garrett’s rank.
S. No. Problems Total scores Average scores Garrett’s rank
1 Infrastructure 17562 70.24 I
2 Political instability 16573 66.29 II
3 Power shortage 15722 62.88 III
4 Financial 14960 59.84 IV
5 Raw material 14260 57.04 V
6 Marketing 13234 52.93 VI
7 Climate 12232 48.92 VII
8 Other 11645 46.58 VIII
Source: Hamid W (2017)
CONCLUSION AND SUGGESTIONS Micro, Small and Medium Enterprises (MSMEs) emerged as dynamic and employment generating sector of Indian economy. It is the most powerful engine of economic growth and industrial production. J&K has an image of small sector industrial production on Indian map. Despite a lot of challenges, the state MSMEs is growing continuously and creating employment for the jobless economy of the state. J&K Directorate of Industries and Commerce, SIDCO SICOOP and JKEDI need to attract the youth of the state. Both the central and state government need to develop the lagging sector of the state. Infrastructure, transportation and huge investment in MSMEs are the way to promote the industrial scenario in the state. An assist once is needed from both centre and state, to frame such policies and programmes through which the MSMEs in the state can be develop. MSME sector of the state have an incredible potential of feeding thousands of unemployed educated youths in state, if developed properly. With the growth of this sector unemployment level will diminish automatically which is the main anxiety in state.

International Journal of Advance and Innovative Research Volume 5, Issue 4 (XIX): October - December, 2018
99
ISSN 2394 - 7780
REFERENCES Aruna, N., 2015. Problems Faced By Micro, Small and Medium Enterprises–A Special Reference to Small
Entrepreneurs in Visakhapatnam. IOSR Journal of Business and Management (IOSR-JBM) e-ISSN, pp.43-49.
Hamid W (2017) Growth, Challenges and Issues related to Micro, Small and Medium Enterprises (MSMEs) in Jammu and Kashmir. Bus Eco J 8: 328. Doi: 10.4172/2151-6219.1000328
Jaswal, S.S., 2014. Problems and Prospects of Micro, Small & Medium Enterprises (MSME’s) in India. International Journal of Innovative Research & Studies, 3(5), pp.140-161.
Khan, D. and Fazili, A., 2016. MSMEs in Jammu and Kashmir-An Exploratory Study. International Journal of Management, IT and Engineering, 6(1), pp.136-145.
Murti, R., Performance, Development Challenges & Opportunity Framework of MSME Sector in Competitive Environment: A Realization Pertaining To Indian Scenario.
Pazir, D. and Hussain, S., 2013. Problems and prospects: Micro, Small and Medium Enterprises (MSMES) in Rajouri and Poonch districts,(J&K). ZENITH International Journal of Business Economics & Management Research, 3(10), pp.187-199.
Reddy, N.S., Reddy, P.V.N., Reddy, S.M. and Kalyan, N.B., 2015. Growth and performance of micro, small and medium enterprises in India. International Journal of Research in Economics and Social Sciences, 5(5), pp.114-134.
Singh, S. and Paliwal, M., 2017. Unleashing The Growth Potential Of Indian MSME Sector. Comparative Economic Research, 20(2), pp.35-52.Bhullar, G. J. S., & Mohan, H. (2014). Growth and performance of micro, small and medium enterprises in India. Indian Journal of Economics and Development, 10(1), 47-53
Zakkariya, K.A. and Nishanth, P., 2014. Barriers faced by micro, small and medium enterprises in raising finance.
http://www.census2011.co.in/census/district/623-punch.html

International Journal of Advance and Innovative Research Volume 5, Issue 4 (XIX): October - December, 2018
100
ISSN 2394 - 7780
MAHMOUD M. AYOUB’S APPROACH TO MUSLIM-CHRISTIAN RELATIONS
Md. Abrarul Haque Research Scholar, Department of Islamic Studies, JMI, New Delhi
ABSTRACT The world has become a global village where events in one part of the world have their consequences on the rest of the world. Therefore, the need to cultivate positive comprehension and communication among all religions has expanded manifold. Muslims and Christians together cover more than half of the world population. Without good relation, harmony and justice between these two major religious communities, there can be no meaningful peace on this planet. The fate of the world relies upon peace and harmony between Muslims and Christians. This paper attempts to discuss Mahmoud Ayoub’s approach towards Muslim-Christian relations. According to his explanation the paper clarifies that there is no need to eliminate differences among different faiths in order to construct a good society, rather to accept and tolerate the differences. It, additionally, emphasizes the need to regard and understand the beliefs of others. The adherents of the two faiths need to participate in opening the door of dialogue and cooperation in order to live peacefully and to eliminate extremism, injustice and intolerance from the society.
Keywords: Muslims-Christians Relations, Christianity, Scriptures, Islam, Quran, Traditions, People of the Book, Religion, Unity of Faith, Mahmoud Ayoub.
MAHMOUD M. AYOUB Mahmoud M. Ayoub was born in 1935 at Ayu Qana, South Lebanon. He got his education at the American University of Beirut (BA, Philosophy, 1964), the University of Pennsylvania (M.A., Religious Thought, 1966), and Harvard University (Ph.D., History of Religion, 1975).i From 1988 to 2008, he was a Professor and director of Islamic Studies in the Department of Religion, Temple University, Philadelphia, an Adjunct Professor at the Duncan Black Macdonald Center, Hartford Seminary, Connecticut, a Research Fellow at the Middle East Center, University of Pennsylvania and the Tolson visiting professor at the Pacific School of Religion, Berkeley California. Currently he is a faculty associate in Shi’ite Islam and Christian-Muslim relations and affiliated with the Macdonald Center for the Study of Islam and Christian-Muslim Relations at Hartford Seminary.ii
All through his academic profession, Prof. Ayoub has awarded many distinguished awards and fellowships, both for his achievements and researches. Among others, he was a beneficiary of the Kent Doctoral Fellowship and the Canada Council Fellowship. In 1994-95, he took part in the Fulbright Exchange of Scholars program for Malaysia. In the Spring-Summer of 2000, he accepted a research project on Christian-Muslim relations in Egypt and Lebanon, as well on a Fulbright scholarship.
Prof. Ayoub is the author of numerous books including: Redemptive Suffering in Islam, The Qur’an and Its Interpreters (vol. 1 & 2), Dirasat fi al-‘Alaqat al-Masihiyyah al-Islamiyyah (Studies in Christian-Muslim Relations), Islam: Faith and History. His articles have published in books and journals, like, The Muslim World, Journal of the American Oriental Society, Bulletin of the Institute of Middle Eastern Studies (Tokyo, Japan) and Islamochristiana (Rome, Italy), also in many others. He has also served and is still serving as a member of many Advisory and Editorial Boards.iii
Mahmoud Ayoub's supremacy in both the scholarship and comparative study of Islam and Muslim-Christian relations, also in inter religious dialogue, is displayed by the national and international appreciation he has gotten. Since 1999, Dr. Ayoub has taken an interest in the United States' Department of State's program, serving as one of its ambassadors to different parts of the Middle East and S.E. Asia, remarking on American society and institutions, inter religious dialogue and Islam in America.iv
PROF. AYOUB ON MUSLIM CHRISTIAN RELATIONS Prof. Ayoub viewed that Islam and Christianity have extraordinary relationship and also the Prophet Muhammad and his early followers were aware to a continuation with the Islamic message on its Jewish and Christian ancestor, simultaneously with Islam's sharp contrasts with both of them, drove Islam and Muslims to adopt a doubtful position towards Christians and Jews. Definitely, this mentality was less ambivalent and more aggressive toward the Jews. It was because of certain political and economic conditions in the new Muslim state of Medina, where Jewish community was well-organized. It must be later noted that the confident confirmation of complete originality, basic and superiority of Islam over Christianity and Judaism was just a later development in Muslim law and religious thoughts, was not into the Qur'an and the traditions of the Prophet.v He says:

International Journal of Advance and Innovative Research Volume 5, Issue 4 (XIX): October - December, 2018
101
ISSN 2394 - 7780
“Islam saw itself from the beginning as yet another expression of the Abrahamic faith and obedient submission (islam) to God. This faith, moreover, was not limited to Abraham; rather, it was the faith of all the prophets before and after him, including Moses and Jesus. The early Islam of the Prophet and his immediate successors did not, in my view, require the people of the Book to abandon their religion as a price for living in amity and interacting positively with Muslims. Nor does the Qur'an claim that Islamic sacred law, the shari'ah, has abrogated the sacred Law of Moses and Christ. Why, then, it must be asked, did Muslims insist on these and other exc1usivist and supersessionist principles, and how were such principles made to abrogate all that was irenic and conciliatory in the Qur'an and early tradition? There are many and diverse answers to this important question. Among them is the fact that neither Christians nor Jews were prepared to accept a genuine religious tradition after their own final communication with heaven. Equally significant were the political and military circumstances that dominated the history of the near and Middle East before Islam and during the formative years of Muslim history”.vi
PROF. AYOUB’S APPROACH THROUGH QURAN The Prophet of Islam considered his message to be similar and complementary to the Torah and Gospel, is clear from the Qur'an's constant reference about the People of the Book and its truth and accuracy. Thus, the Quran says: “If you are in doubt concerning that which we have sent to you then enquire of those who have been reading the scriptures before you.”vii The Qur'an even guides its own hesitating followers to the people of former scriptures for knowledge and encouragement. It says: “Enquire of the people of remembrance (ahl al-dhikr) if you do not know.”viii In yet another occasion where the Prophet, amid the initial time of his mission in Mecca, was criticized by the men of the Quraysh for affirming that Hell is protected by nineteen holy angels, he discovered comfort in the way that the people of the Book and people of faith are sure of reality of God's revelation.ix These examples, according to Prof. Ayoub, show clearly the unity of faith and purpose which should exist among the three community of faith.
Acknowledgment of the priority of Judaism and Christianity as bearers of divine truth was completed in the Qur'an and early prophetic traditions in convenience and appreciation of the people of the Book and their sacred texts. In chapter Maida, revealed toward the end of the Prophet's mission in Medina, the Qur'an remove the two most critical social obstacles dividing the three community of faith, that is, food and marriage boundaries: "The food of the people of the Book is lawful for you and your food is lawful for them, and the chaste women of the people of the Book are (lawful for you to marry)."x Prof. Ayoub states:
“Free from the quibbling of later jurists, this verse clearly allows unrestricted social intercourse among the people of the three faiths. Accommodation, moreover, was not limited to social interaction but included intellectual and theological debate.”xi
The Qur'an urges Muslims to be rational and fair in their debate with the people of the Book:
“Do not dispute with the people of the Book except in the fairest manner, save with those of them who have committed wrong. Say, 'We have faith in that which was sent down to us and that which was sent down to you. Our God and your God is one God; to Him we are submitters (muslims)”xii
Prof. Ayoub explained that from the beginning Islamic attitude towards the people of the Book was both accommodation and confrontation. It must be noted that the Qur'an introduces these two perspectives at the same time. Moreover, the confrontation did not, in general, rotate around political or social rather strictly theological issues. Two fundamental religious issues have shaped definitely in both the Qur'an and Hadith. The first is mutual recognition and acceptance. With regard to the Jews, this was a call to surrender what the Qur'an sees as their arrogance in being the chosen people of God and thus their arrogant rejection of Islam and its Prophet. The Quran states that: “And they (Jews) say, the fire (Hell-fire) shall not touch us but for a few numbered days. Say (O Muhammad) ‘have you taken covenant from God, so that God will not break His covenant? Or is it that you say of God what you know not?xiii
The second issue, which continues to separate Muslims and Christians, is the nature and the task of Jesus Christ.
The first major and straight encounter between the Prophet and Christians was his alleged debate with the Christians of Najran, Yaman. This discussion is implied in the Qur'an in the well known verse of the mubahalah, the "invocation of God's curse" (Q. 3:61). The mubahalah was an old Arab tradition in which two parties making conflicting argue would ask with a pledge that God's revile is upon the liars of either party. Here in this case, the mubahalah was about the humanity and divinity nature of Jesus Christ. According to Muhammad Ayoub, no matter whether such debate ever took place or not, it is not our concern here. For us it is enough to watch that the men of Najran sensibly opted for peace, though at a cost, rather than the test of the

International Journal of Advance and Innovative Research Volume 5, Issue 4 (XIX): October - December, 2018
102
ISSN 2394 - 7780
mubahalah with its political and military outcomes. Of more prominent significance for our purpose, is the way that the verses identifying with this debate conclude with the appeasing call to the people of the Bookxiv:
“O people of the Book, come to a just word common between us and you: that we worship none other than God, that we associate nothing with Him, and that we do not take one another as lords instead of God." The verse ends: "But if they turn their backs, say, 'Bear witness then that we are Muslims”xv
The perfect relation imagined by the Qur'an between Muslims and Christians isn't just an accommodation and co-existence rather of friendship and mutual respect. The Qur'an pronounces:
“You shall find the nearest in amity to those who have faith to be those who say we are Christians. This is because there are among them learned men and monks, and they are not arrogant. When they listen to that which was sent down to the Messenger, you see their eyes well up with tears as they recognize the truth. They say, 'Our Lord, we do have faith! Inscribe us, therefore, among the witnesses.”xvi
The Qur'an recognizes the good intentions of the Christians even where it views their activities as in mistake. A clear example of this is the declaration that Christians have themselves developed monasticism, wanting by this God's great happiness. As it says:
“Then, We sent after them Our Messengers and We sent Jesus, son of Mary (as), and gave him the Gospel. And We ordained in the hearts of those who followed him compassion and mercy. But the monasticism which they invented for themselves, We did not prescribe for them, but they only aimed at pleasing Allah, but they did not observe it with the right observance. Therefore, We gave those among them who believed their reward; but many of them are disobedient to Allah”xvii
The Qur'an respects both the Torah and Gospel as source of direction and light. As they must be the sole arbiters in any differences or conflicts among the people of faith:
“And We sent, following in their footsteps, Jesus, the son of Mary, confirming that which came before him in the Torah; and We gave him the Gospel, in which was guidance and light and confirming that which preceded it of the Torah as guidance and instruction for the righteous… ... And let the People of the Gospel judge by what Allah has revealed therein. And whoever does not judge by what Allah has revealed - then it is those who are the defiantly disobedient.”xviii
According to Prof. Ayoub this call for mutual recognition depends on the Quranic thought of the unity of scriptures. And the acceptance of differences and affirmation of its value is the clearest indication of tolerance and adjustment.xix
However in spite of this basic unity of revelation, the Qur'an takes notice of the profound conflict between the two people of faith: “The Jews say Christians have nothing upon which to stand, and the Christians say the Jews have nothing upon which to stand, although they both recite the same scriptures.”xx
In this manner, the expectation for mutual recognition, which the Qur'an introduces as a great goal and a challenge, and which numerous Muslims and Christians keep on appreciating, turned into mutual exclusivism and rejection, conflict and competition. In this tough circumstance of response and counter response, several in all three communities were soon to ignore the real importance of their faiths and demand that their opponents follow their religion, if they want peace with them. Surrendering all expectations regarding to come toward a just word of common consent with the people of the Book, the Prophet addressed his companions in the expressions of the Qur'an, saying: “O you who have faith do not take the Jews and Christians as allies. They are allies of one another. Whosoever amongst you takes them as his allies, he shall be one of them”xxi
Prof, Ayoub remarks that these words, which actually referred to political groups in a particular time of war, became normative for various Muslims, regardless of various other Quranic orders of harmony and cooperation between Muslims and the people of the Book.xxii. In the sight of Prof. Ayoub the Qur'an significantly more than Muslims have ever done recognizes the pluralism of religions and asserts the unity of faith. The main things it demands are honest faith in God and works of goodness. In a verse comes twice almost word for word, in surah 2 and surah 5, this essential teaching is clearly expressed:
“Surely those who have faith, the Jews, Christians and Sabaeans: those (among them) who have faith in God and the last day and perform works of righteousness will have their reward with their Lord. No fear shall come upon them, nor will they grieve”xxiii
The Qur'an asserts to be a universal message addressed to all human being constantly. There is no compulsion whether one accepts the message or not. Convincing the opponent through debate is a later custom developed

International Journal of Advance and Innovative Research Volume 5, Issue 4 (XIX): October - December, 2018
103
ISSN 2394 - 7780
by the theologians and philosophers. The Qur'an teaches to invite others to God through good manner and wisdom. It orders Muslims to: “debate with them (the people of the Book) in the fairest manner.”xxiv But the Qur'an had in notice just theological not political and financial issues and conflicts.
Prof. Ayoub states frequently that Islam and Christianity as religions of the Book have much more in common than the theologians of either tradition have been willing to recognize or allow. This reality was recognized early in the contact between existing Christians and Muslims. In past St. John of Damascus proclaimed Islam to be a Christian heresy and the Qur'an viewed Christians as extremists in their faith. Extremism (ghulu) is the Quranic equivalent of heresy. The Qur'an states:
“O people of the Book do not go to extremes in your religion, nor should you say about God except the truth. Jesus Christ son of Mary is only the messenger of God, His word which He cast into Mary, and a spirit of Him. Accept faith, therefore, in God and His messengers, and do not say three. Desist! It shall be better for you. God is surely One God, glorified is He over having a child. To Him belongs all that is in the heavens and earth; sufficient indeed is God as guardian”xxv
Explaining the verse, Dr. Ayoub comments: “This reproach is not directed against Christianity but against Christians who may mistakenly think of God as three independent deities. The Qur'an does not offer theological arguments against the Trinity but counters anthropomorphism with absolute divine transcendence. Nor would Christian theologians, then or now, have disagreed with this Quranic assertion. Christians clearly do not believe the Trinity to be three gods. The appreciation of this point requires much patience, sensitivity, and openness on the part of Christians who would explain the Trinity as a mystery of faith, and of Muslims who would try to appreciate it as an expression of God's infinite compassion (rahmah), and not a divine exercise in obscurantist mathematics.”xxvi
As we have seen, the Qur'an talks not so much with specific rules and regulations about Muslim-Christian relations but rather shows some guidelines and general rules for the purpose. The unity of scriptures, from the Islamic perspective, promoted a unity of faith and destiny. The term ahl al-kitab (people of the Book) communicated a comprehensive identity not just among Jews, Christians, and Muslims but it includes (according to Ayoub) Zoroastrians Hindus and other communities having scriptures.xxvii
PROF. AYOUB’S APPROACH THROUGH THE TRADITIONS OF THE PROPHET This unity of faith and fate between Muslims and Christians is touchingly demonstrated in the Qur'an and the traditions of the Prophet. Prior to the Prophet's migration to Medina, the Byzantines were conquered by the Persians. The little group of Muslims felt dissatisfaction at the defeat of a people of the Book, like them. The Qur'an refers to this thrashing and its possible reversal thus:
“The Byzantine Empire (aI-Rum) has been defeated in the nearest regions of the land, but after their defeat they shall achieve victory in a few years ....On that day the people of the faith shall rejoice in God's support. God assists whomever He wills; He is the Almighty, the Compassionate”xxviii
Traditionalists reported that when the Byzantines were defeated, the unbelieving men of the Quraysh were happy because they have no scripture like the Persians. But when this verse was revealed, the Muslims were cheerful on the grounds that they and the Christians were people of the Book. At this cheerful time H. Abu Baker, the first caliph, came out the street of Makah announcing the verse. The men of the Quraysh challenged him to a bet on a Byzantine victory within five or six years. But they got the victory over the Persians seven years later. And thus H. Abu Baker lost his wager.xxix
Mahmoud Ayoub always argues that the Qur'an did not require the people of the Book to convert to Islam as a condition for religious acceptance and peaceful coexistence in Muslim region. In deed the Qur'an's most favorable is that faith in God must include approval to all His prophets and scriptures. This universal faith affirmed that good deeds and helping the poor is true righteousness, (Q.2:177). This view found in prophetic tradition too. The prophet says:
“Any man of the people of the Book who believes in his own prophet and in Muhammad shall have a double reward.”xxx
Prof. Ayoub also argued that the Qur'an considers faith alone and not religion as an obvious factor in founding good relations among the people of faith. The popular traditionalist Ibn 'Abbas narrated that when the Prophet sent his notable companion Mu'adh bin Jabal as a governor over the people of the Book of Yemen, he gave him the following guidelines:

International Journal of Advance and Innovative Research Volume 5, Issue 4 (XIX): October - December, 2018
104
ISSN 2394 - 7780
“You shall come to a people of the Book. Invite them to bear witness that there is no God but God and that I am the messenger of God. If they submit to this, then inform them that God has prescribed for them a free-will gift (Sadqah) which must be taken from the rich among them and distributed among the poor. If they obey you in all this, then beware that you touch their principal wealth. Beware the prayer of the oppressed for between it and God there is no veil.”xxxi
It might be challenged that this is a call to conversion. This, in any case, would be the situation just when later jurists and theologians reduced this and other such prophetic tradition to a framework that characterized and delimited the communities of faith. Prof. Mahmoud Ayoub states that:
“The term “people of the Book” as used in the Qur'an is a neutral term of faith identity. Even when used in a hostile context, it did not-again with the exception of the Sword Verse-denote a legal status. Although Muslim jurists applied the Sword Verse indiscriminately to all Jews and Christians, the text clearly refers to those among the people of the Book who are not bound by the imperatives of their own faith and morality. What jurists implied, in obvious contradiction of the general Qur'anic view and especially of this verse, was that all the people of the Book, simply because they were not Muslims, are subject to the harsh judgment of this verse. Indeed, this kind of generalization from the Qur'an and hadith became the dominant pattern for later Muslim jurists and theologians in their dealings with Christians and Jews. Generally, moreover, the neutral epithet “people of the Book” was replaced with the legal identification, ahl al-dhimmah, the people under the protection or covenant (dhimmah) of God, His Prophet, and the Muslims.”xxxii
The protection of the people of the Book is not only right to life and property under Muslim rule. It additionally gave them a quality of holiness and right conduct even in the style of their dress and general behavior. The Prophet, we are told, used to follow the people of the Book in keeping tall hair instead of separating it, as the people of Makah used to do. This type of thing the prophet did because of the fact that he wished to harmonize with the people of the Book in all things, “unless he was ordered to do something else.”xxxiii
The exceptional spiritual status of the people of the Book is clearly contrasted with that of all other communities in the following prophetic tradition. The Prophet starts by illustrating the immense delight of heaven and its special features. This tradition encourages the people in their faith and good deeds.
The Prophet was communicating to the people “what God had revealed him.” Thus God says:
“I created all my servants with pure faith. Then devils came to them and caused them to stray far from their faith. They made lawful for them things which I had made unlawful, and commanded them to associate with me things concerning which I revealed no authority.” The Prophet continued, “God looked at the inhabitants of the earth and despised them all, Arabs and non-Arabs, except for small remnants of the people of the Book.”xxxiv
Prof. Ayoub comments that these are the same ‘people of the Book’ whom later legal scholars viewed as impure and unholy.
One of the most respected and admirer of the Prophet's Companions has been Omar bin al-Khattab, the second caliph. In his last will, he advised the caliph after him:
“I enjoin him concerning the people of the dhimmah of God and His Messenger that he fulfills their covenant. He should fight in their defense (literally: behind them). Nor should they be charged beyond their capacity.”xxxv
It is generally reported that whenever the prophet sent any army to fight, he enjoined its commander to fear God and treat well with the men under his power. He at that point addressed to the people saying: “Fight in the name of God and in the way of God. Fight those who reject faith in God. But do not transgress. Do not commit treachery, mutilate (a slain fighter), or kill a child.”xxxvi
CONCLUSION According to Prof. Ayoub, if we cannot be united on the basis of faith and commitment, at that point we can at least try to know and understand that why our doctrines are extraordinary and different. We are different because it is God's wish. The Qur'an states, “Had your Lord so wished he would have made all of humanity one ummah” (Q. 11:118). The test is this: “Compete with each other in the performance of good works. To God will be your arrival and He will clarify you of the things concerning which you have differed.” So let us be thankful for our differences as they enhance our lives and also let us be humbly thankful for our similarities as members of one mankind.
Obviously, in his view, Muslims have not generally paid attention to this directive, as history clearly affirms. Indeed, Islam approved war as a human reality and set down strict principles directing it significantly; to the

International Journal of Advance and Innovative Research Volume 5, Issue 4 (XIX): October - December, 2018
105
ISSN 2394 - 7780
tolerance and cooperation that many Muslims have shown for the “people of the Book” in their locality. Along these lines, I conclude that the teachings of Quran and Sunnah or traditions of the Prophet (PBUH), as explained by Prof. Ayoub, may become the common bond that ties not only Christian and Muslims but all the people of different faiths together. It may help Jews, Christians and Muslims to become reconciled children of Abraham and one happy family.
REFERENCES i . Mahmoud M. Ayoub (2016), Faculty Associate in Islam and Christian-Muslim, (PDF), Hartsem.edu.
Hartford University, p.1 ii . "Resources on Faith, Ethics and Public Life; Mahmoud Ayoub" (2016), Berkley Center for Religion,
Peace and World Affairs. Georgetown University. iii . https://en.wikipedia.org/wiki/Mahmoud_M._Ayoub iv . Ibid, Siddiqui, Ataullah (1997). Christian-Muslim Dialogue in the Twentieth Century; Mahmoud Ayoub
(1935—). Palgrave Macmillan UK. p. 97 v . M. Ayoub (2007), A Muslim View Of Christianity: Essays on Dialogue, Edited by Irfan A. Omar, Orbis
Books, New York, p. 32 vi . Ibid. p.33 vii . Quran, 10:94 viii . Quran, 16:43 ix . Quran, 74:31 x . Quran, 5:5 xi . M. Ayoub (2007), A Muslim View Of Christianity, Essays on Dialogue, Edited by Irfan A. Omar, Orbis
Books, New York, p. 34 xii . Quran, 29:46 xiii . Quran, 2:80 xiv. M. Ayoub (2007), A Muslim View Of Christianity, Essays on Dialogue, Edited by Irfan A. Omar, Orbis
Books, New York, p. 35 xv. Quran, 3:64 xvi. Quran, 5:82,83 xvii. Quran, 57:27 xviii . Quran, 5:46, 47 xix. M. Ayoub (2007), A Muslim View Of Christianity, Essays on Dialogue, Edited by Irfan A. Omar, Orbis
Books, New York, p. 35 xx. Quran, 2:113 xxi. Quran, 5:31 xxii. Ibid. p.36 xxiii. Quran, 2:62 xxiv. Quran, 16:125 xxv. Quran, 4:171 xxvi. M. Ayoub (2007), A Muslim View Of Christianity, Essays on Dialogue, Edited by Irfan A. Omar, Orbis
Books, New York, p. 37 xxvii. Ibid. p.38 xxviii. Quran, 30:2-5

International Journal of Advance and Innovative Research Volume 5, Issue 4 (XIX): October - December, 2018
106
ISSN 2394 - 7780
xxix. Muhammad ibn 'Isa al- Tirmidhi, Sunan al-Tirmidhi, ed. 'Izzat 'Ubayd al Da'as. 10 vols. (Hims, Syria:
n.p., 1965-1969), 8:335-36. xxx. Muhammad ibn Yazid ibn Majah, Sunan ibn Majah, 2 vols., ed. M. F. 'Abd al-Baqi (Cairo: 'Isa al-Babi
al-Halabi, 1952-53), 1:629. xxxi. Ibn Majah, Sunan ibn Majah, 1:568. xxxii. M. Ayoub (2007), A Muslim View Of Christianity, Essays on Dialogue, Edited by Irfan A. Omar, Orbis
Books, New York, p. 39 xxxiii. Ibid. p. 40 xxxiv. Ibid. p. 40 xxxv. Muhammad ibn Isma'il al-Bukhari, al-Jami' al-sahih, 4 vols. (Cairo: n.p., A.H. 1343), 1:185. xxxvi. Tirmidhi, Sunan al-Tirmidhi, 5:338

MANUSCRIPT SUBMISSION
GUIDELINES FOR CONTRIBUTORS 1. Manuscripts should be submitted preferably through email and the research article / paper
should preferably not exceed 8 – 10 pages in all.
2. Book review must contain the name of the author and the book reviewed, the place of publication and publisher, date of publication, number of pages and price.
3. Manuscripts should be typed in 12 font-size, Times New Roman, single spaced with 1” margin on a standard A4 size paper. Manuscripts should be organized in the following order: title, name(s) of author(s) and his/her (their) complete affiliation(s) including zip code(s), Abstract (not exceeding 350 words), Introduction, Main body of paper, Conclusion and References.
4. The title of the paper should be in capital letters, bold, size 16” and centered at the top of the first page. The author(s) and affiliations(s) should be centered, bold, size 14” and single-spaced, beginning from the second line below the title.
First Author Name1, Second Author Name2, Third Author Name3 1Author Designation, Department, Organization, City, email id 2Author Designation, Department, Organization, City, email id 3Author Designation, Department, Organization, City, email id
5. The abstract should summarize the context, content and conclusions of the paper in less than 350 words in 12 points italic Times New Roman. The abstract should have about five key words in alphabetical order separated by comma of 12 points italic Times New Roman.
6. Figures and tables should be centered, separately numbered, self explained. Please note that table titles must be above the table and sources of data should be mentioned below the table. The authors should ensure that tables and figures are referred to from the main text.
EXAMPLES OF REFERENCES All references must be arranged first alphabetically and then it may be further sorted chronologically also.
Single author journal article: Fox, S. (1984). Empowerment as a catalyst for change: an example for the food industry. Supply Chain Management, 2(3), 29–33.
Bateson, C. D.,(2006), ‘Doing Business after the Fall: The Virtue of Moral Hypocrisy’, Journal of Business Ethics, 66: 321 – 335
Multiple author journal article: Khan, M. R., Islam, A. F. M. M., & Das, D. (1886). A Factor Analytic Study on the Validity of a Union Commitment Scale. Journal of Applied Psychology, 12(1), 129-136.
Liu, W.B, Wongcha A, & Peng, K.C. (2012), “Adopting Super-Efficiency And Tobit Model On Analyzing the Efficiency of Teacher’s Colleges In Thailand”, International Journal on New Trends In Education and Their Implications, Vol.3.3, 108 – 114.

Text Book: Simchi-Levi, D., Kaminsky, P., & Simchi-Levi, E. (2007). Designing and Managing the Supply Chain: Concepts, Strategies and Case Studies (3rd ed.). New York: McGraw-Hill.
S. Neelamegham," Marketing in India, Cases and Reading, Vikas Publishing House Pvt. Ltd, III Edition, 2000.
Edited book having one editor: Raine, A. (Ed.). (2006). Crime and schizophrenia: Causes and cures. New York: Nova Science.
Edited book having more than one editor: Greenspan, E. L., & Rosenberg, M. (Eds.). (2009). Martin’s annual criminal code:Student edition 2010. Aurora, ON: Canada Law Book.
Chapter in edited book having one editor: Bessley, M., & Wilson, P. (1984). Public policy and small firms in Britain. In Levicki, C. (Ed.), Small Business Theory and Policy (pp. 111–126). London: Croom Helm.
Chapter in edited book having more than one editor: Young, M. E., & Wasserman, E. A. (2005). Theories of learning. In K. Lamberts, & R. L. Goldstone (Eds.), Handbook of cognition (pp. 161-182). Thousand Oaks, CA: Sage.
Electronic sources should include the URL of the website at which they may be found, as shown:
Sillick, T. J., & Schutte, N. S. (2006). Emotional intelligence and self-esteem mediate between perceived early parental love and adult happiness. E-Journal of Applied Psychology, 2(2), 38-48. Retrieved from http://ojs.lib.swin.edu.au/index.php/ejap
Unpublished dissertation/ paper: Uddin, K. (2000). A Study of Corporate Governance in a Developing Country: A Case of Bangladesh (Unpublished Dissertation). Lingnan University, Hong Kong.
Article in newspaper: Yunus, M. (2005, March 23). Micro Credit and Poverty Alleviation in Bangladesh. The Bangladesh Observer, p. 9.
Article in magazine: Holloway, M. (2005, August 6). When extinct isn't. Scientific American, 293, 22-23.
Website of any institution: Central Bank of India (2005). Income Recognition Norms Definition of NPA. Retrieved August 10, 2005, from http://www.centralbankofindia.co.in/ home/index1.htm, viewed on 7. The submission implies that the work has not been published earlier elsewhere and is not
under consideration to be published anywhere else if selected for publication in the journal of Indian Academicians and Researchers Association.
8. Decision of the Editorial Board regarding selection/rejection of the articles will be final.