annual report 2018 - Advance Synergy Berhad
256
hotels and resorts ict property development ADVANCE SYNERGY BERHAD annual report 2018
-
Upload
khangminh22 -
Category
Documents
-
view
1 -
download
0
Transcript of annual report 2018 - Advance Synergy Berhad

ho
te
ls
an
d r
es
or
ts
ictpropertydevelopment
ADVANCE SYNERGY BERHAD
annualreport
2018


Contents 03
Five-Year Group Financial Highlights 04
Chairman’s Statement 06
Contents 49
Our Corporate Information 50
Our Board 51
Our Company Secretary 58
Our Key Management 59
Our Group Senior Management 60
Contents 89
Directors’ Report 90
Statements of Financial Position 99
Statements of Comprehensive Income 101
Statements of Changes in Equity 103
Contents 239
List of Properties 240
Statement on Directors’ Interests 242
Contents
Performance Review 08
Sustainability 26
Risk Management 39
Governance 67
Audit Commitee Report 74
Nomination Committee Report 78
Remuneration Committee Report 82
Directors’ Responsibility Statement 86
Additional Compliance Information 87
Statements of Cash Flows 106
Notes to the Financial Statements 110
Statement by Directors 232
Statutory Declaration 233
Independent Auditors’ Report 234
Statistics on Shareholdings 244
Notice of Annual General Meeting 246
Proxy Form Enclosed
STRATEGICREPORT
CORPORATEGOVERNANCE
FINANCIALSTATEMENTS
OTHERINFORMATION


03ADVANCE SYNERGY BERHAD | annual report 2018
STRATEGICREPORT
Contents
Five-Year Group Financial Highlights 04
Chairman’s Statement 06
Performance Review 08
Sustainability 26
Risk Management 39

04
Five-Year Group Financial Highlights
Year ended 31 December
2014 2015 2016 2017 2018RM’000 RM’000 RM’000 RM’000 RM’000
Statements of Comprehensive Income
Revenue 274,764 268,837 276,775 265,923 283,583 Gross Profit 93,400 93,944 97,476 89,832 83,879 Gross Profit Margin (%) 34.0 34.9 35.2 33.8 29.6EBITDA 25,995 16,688 21,691 21,841 13,640 Profit/(Loss) before tax 2,630 (842) 7,655 8,360 347 Profit/(Loss) after tax (2,534) (7,561) 8,739 3,751 (1,142)
Statements of Financial Position
Total assets 632,585 630,699 702,274 699,971 725,347 Total liabilities 152,806 151,545 190,784 203,902 238,456 Shareholders’ funds 443,281 439,999 447,727 432,856 422,186
Share Information
Per Ordinary Share
Earnings/(Loss) per share, basic (sen) (0.82) (1.75) (0.37) (0.10) (0.54)Net assets per share (sen) (Note1) 66.93 66.26 67.42 63.86 45.44
Financial Ratios
Return on equity (%) (0.53) (1.58) 1.71 0.76 (0.23)Current ratio 2.7 : 1 3.1 : 1 3.5 : 1 2.6 : 1 2.0 : 1Debt-Equity ratio (Note 2) 0.15 : 1 0.17 : 1 0.20 : 1 0.20 : 1 0.30 : 1
Note 1 : The lower net assets per share for 2018 is mainly due to the increase in the number of ordinary shares of the Company after all outstanding 2% 10- Year Irredeemable Convertible Unsecured Loan Stocks were compulsorily and automatically converted into fully paid new ordinary shares of the Company on 30 January 2018.
Note 2 : Debt comprises current and non-current borrowings.

05ADVANCE SYNERGY BERHAD | annual report 2018 Five-Year Group Financial Highlights
274,764
268,837
276,775
265,923
28
3,5
83
2014 2015 2016 2017 2018
REVENUE(RM’000)
8,459
4,994
12,299 14,431
4,3
53
OPERATING PROFIT/(LOSS)(RM’000)
2014 2015 2016 2017 2018
2,630
(842)
7,655
8,360
34
7
PROFIT/(LOSS) BEFORE TAX(RM’000)
2014 2015 2016 2017 2018
(0.53)
(1.58)
1.71
0.76
(0.23)2014 2015 2016 2017 2018
RETURN ON EQUITY(%)
(0.82)
(1.75)
(0.37)
(0.10)
(0.54)
EARNINGS/(LOSS) PER SHARE(Sen)
2014 2015 2016 2017 2018
443,281
439,999 447,727
432,856
42
2,1
86
SHAREHOLDERS' FUNDS(RM’000)
2014 2015 2016 2017 2018

06
Dear Shareholders
Group results for fiscal 2018 were mixed. Although revenue increased by RM17.7 million to RM283.6 million – a 6.7% increase on the RM265.9 million achieved in fiscal 2017 – gross profit was lower by RM6.0 million. The lower gross margin on revenue contributed to profit before tax, at RM0.3 million for this year.
The information and communications technology (“ICT”) and travel & tours divisions were the major contributors to Group revenue, recording turnover of RM94.2 million and RM123.0 million respectively. Compared to the year before, the ICT division improved its turnover results by RM16.8 million and travel & tours revenue was higher by RM10.9 million. Profit before tax increased to RM10.8 million in fiscal 2018 for the ICT division while the travel & tours division recorded a marginally lower result of RM2.0 million compared to the previous year. Continued progress is expected to be made by these two divisions in the coming year to drive further improvement in Group revenue and profitability.
The hospitality division’s total revenue for the year was lower at RM54.3 million, reflecting a significantly lower occupancy rate of 51% that had counteracted by the positive effect of higher average room rates achieved during the year. It was yet another challenging year for our hospitality division with numerous adverse developments to address: rising operating costs; a slowdown in government spending which impinged on the performance of hotels operating in Malaysia; and the economic impact of the continued diplomatic crisis in Qatar which significantly affected the performance of Holiday Villa Hotel & Residence Doha City Centre. All these factors contributed to this division’s profit before tax decreasing to RM3.4 million this year from the RM15.6 million achieved last year. Fiscal 2019 is expected to be a better year for our hospitality division with Holiday Villa Hotel & Residence Shanghai Jiading being fully operational and contribution starting to be made by other new additions to the division’s portfolio of managed and licensed hotels.
Most of the businesses grouped together under our “Others” division did not perform as well as expected in the current year. As a result, revenue for this division decreased to RM10.7 million from RM14.6 million achieved the year before. The card and payment services business was the only one in this division that produced a better result, delivering an
Chairman'sStatement

07ADVANCE SYNERGY BERHAD | annual report 2018 Chairman’s Statement
improvement in revenue which had in turn, improved its bottom-line performance. During the year, a major restructure and revamp of the bus-body fabrication (formerly coach-building) and education units were carried out while a new roadmap was developed and put into effect for our card and payment services business. Because of the lower revenue achieved and the further restructuring activities during the year, this division recorded a higher loss before tax of RM9.5 million compared to the loss before tax of RM8.6 million last year. I am hopeful, as are management of our Group, that the businesses in this division will show better performance in the year ahead.
Although fiscal 2018 was a difficult year, I am cautiously positive and confident of our Group’s prospects for the future. A strong foundation has been laid for the Group following the various restructuring and turnaround plans devised and implemented over recent years. A significant amount of time and effort has also been invested by both the Board and management of the Group to examine and strengthen our governance and sustainability frameworks and processes, all of which will put the Group in good stead not only to weather challenging industry and economic conditions but ultimately to prosper in the long term.
Following the succession planning initiative of 2017, efforts to recruit and further develop a strong team with the right balance of talents, skills and experience to lead and manage the Group’s businesses into their next phase of development were persisted in fiscal 2018. This effort will continue in the year ahead.
DIVIDEND
The Board recommends, for shareholders’ approval, a single-tier dividend of 0.25 sen per ordinary share, unchanged on the prior year, taking into account the Group’s current cash position and future capital expenditure requirements.
Subject to approval by shareholders at the Annual General Meeting to be held on 28 June 2019, the dividend will be paid on 15 August 2019 to shareholders on the record of depositors on 26 July 2019.
APPRECIATION
The Board and I would like to express our appreciation to shareholders, customers and associates for your unwavering confidence, trust and support. To the regulatory authorities, we say thank you for your continued guidance. To the management and staff of the Company and our various divisions whose commitment and dedication have been the source of the Group’s commendable performance, the Board and I are most grateful and we look forward to working closely with all of you for a better year ahead.
DATO’ AHMAD SEBI BAKARGroup Chairman

19%
33%43%
0% 4%
23%29%
42%
0% 6%
08
PerformanceReview
The Group recorded revenue of RM283.6 million for fiscal 2018 with profit from operations of RM4.4 million and profit before tax of RM347,000. The Group’s total assets was RM725.3 million as at 31 December 2018 and our shareholders’ funds stood at RM422.2 million.
REVENUE
The Group recorded higher revenue of RM283.6 million for fiscal 2018. The biggest contributor to Group revenue was the travel and tours division with revenue of RM123.0 million followed by the ICT division at RM94.2 million. Both divisions achieved higher revenue of RM10.9 million and RM16.8 million respectively compared to fiscal 2017.
Our hospitality division’s revenue was lower at RM54.3 million in fiscal 2018 compared to revenue of RM60.5 million in fiscal 2017. The property development division recorded a revenue of RM38,000 because Phase 2 of the Federal Park project which was anticipated to be launched during the year was delayed as the division is still awaiting the necessary approvals from the relevant authorities for the amended development plan to build townhouses. Revenue of the “Others” division also declined by RM3.9 million compared to fiscal 2017.
However, Group’s total revenue was RM17.7 million higher in fiscal 2018 at RM283.6 million from RM265.9 million in fiscal 2017, a 6.7% jump.
The contribution in revenue from each division for fiscal years 2018 and 2017 is illustrated as follows:
2018 REVENUE BY DIVISION
2017 REVENUE BY DIVISION

09ADVANCE SYNERGY BERHAD | annual report 2018 Performance Review
GROSS PROFIT
Due to the increase in cost of sales for fiscal 2018, gross profit for the Group dropped from RM89.8 million in fiscal 2017 to RM83.9 million in fiscal 2018, a reduction of RM5.9 million and the Group gross profit margin declined in tandem to 29.6% from 33.8% in fiscal 2017. The Group’s lower gross profit of RM83.9 million was mainly due to the lower gross profit margin at the ICT and travel and tours divisions. The bulk of the increase in revenue for ICT division for fiscal 2018 compared to prior year was from system sale contracts which generally deliver lower gross profit margin as a result of its typically higher third party costs while the travel and tours division’s increase in revenue was accompanied by lower gross margin.
OTHER OPERATING INCOMEAND EXPENSES
For the fiscal year 2018, the results of the Group included fair value gain on the Group’s investment in unquoted securities and gain in disposal of an associate company as compared to the higher insurance claims recorded in fiscal year 2017 resulting in the reduction in the Group’s other operating income from RM20.8 million in fiscal 2017 to RM19.7 million in fiscal 2018, a decline of RM1.1 million. Our Group’s operating expenses namely distribution and administration costs were lower by RM1.8 million from RM68.5 million in fiscal 2017 to RM66.7 million in fiscal 2018 as all divisions recorded lower operating expenses in fiscal 2018 compared to the prior year except for travel and tours and property development divisions which saw an increase in expenses totalling RM1.7 million. There was an increase in other
operating expenses from RM27.7 million in fiscal 2017 to RM32.5 million in fiscal 2018 mainly due to impairment loss in unquoted securities for travel and tours division and goodwill impairment loss for ICT division in fiscal 2018.
SHARE OF RESULTS OF ASSOCIATESAND JOINT VENTURES
The Group’s share of profit in associates in fiscal 2018 was RM2.2 million, higher compared to a share of loss in associates in fiscal 2017 of RM826,000, mainly due to thehigher share of profit from the Group’s 40% equity investment in Helenium Holdings Limited (“HHL”) which owns a serviced block of apartments in Kilburn, London NW6 5UA.
PROFIT BEFORE TAX
The Group made a profit before tax of RM347,000 in fiscal 2018 compared to a profit of RM8.4 million in the prior year. Our 4 major divisions, hospitality, ICT, property development and travel and tours, recorded a total profit of RM13.9 million, lower than the profit of RM26.6 million in fiscal 2017. The “Others” division continued to show losses at RM9.5 million in fiscal 2018 compared to losses of RM8.6 million in fiscal 2017. The fluctuations in the profits of the major divisions in fiscal years 2017 and 2018 were mainly due to the significant movements in other operating income and other operating expenses as explained above and the poor performance from the property development division in 2018 as Phase 2 of the Federal Park project was not launched as expected during the year. The higher loss recorded by the “Others” division in fiscal 2018 compared to fiscal 2017 was mainly due to the higher operating expenses recorded by the bus-body fabrication unit.

10 Performance Review
PROFIT BEFORE TAX (continued)
After providing for the profit attributable to non-controlling interests, there was a higher loss of RM4.9 million in fiscal 2018 compared to a loss of RM0.7 million in fiscal 2017 resulting in the Group’s gross loss per share of 0.54 sen in fiscal 2018 and 0.10 sen in fiscal 2017.
INCOME TAX
The income tax expense for fiscal 2018 was lower as compared to fiscal 2017 mainly due to the write-back of previous year tax expense recorded by the hospitality division. The bulk of the Group’s income tax expense for fiscal 2018 was attributable to the hospitality and ICT divisions.
ASSETS
Total assets of the Group increased by 3.6% to RM725.3 million as at 31 December 2018 (2017: RM700.0 million) at tributable mainly to the increase in non-current assets from RM353.3 million to RM398.1 million offset by the reduction in current assets to RM327.3 million from RM346.7 million. Trade and other receivables decreased from RM139.1 million as at 31 December 2017 to RM119.1 million as at 31 December 2018 mainly due to the reduction in the trade receivable from the ICT division as a result of collection during the year. However, cash and bank balances and short term deposits reduced to RM141.2 million in fiscal 2018 from RM158.0 million mainly due to the purchase of 2 investment properties in fiscal 2018. The increase in non-current assets was mainly due to the purchase of
investment properties. The increase in the investment securities from RM42.6 million in fiscal 2017 to RM47.0 million in fiscal 2018 was mainly from the ICT division which made further investments in unquoted shares during the year.
LIABILITIES
Total liabilities of the Group increased from RM203.9 million in fiscal 2017 to RM238.5 million in fiscal 2018. The increase was mainly due to the increase in ba n k bor row ing s of t he proper t y development division after its investment in 2 properties in Kuala Lumpur and Shah Alam, Selangor. However, trade payables and other payables reduced from RM96.8 million in fiscal 2017 to RM74.9 million in 2018 mainly due to the reduction in the trade payables from the ICT division as a result of payment during the year.
EQUITY
With the lower financial performance of the Group, total Group equity decreased by 1.9% to RM486.9 million as at 31 December 2018 (2017: RM496.1 million).
HOSPITALITY DIVISION
2018 has been a challenging year for the hotel industry. The continued uncertainty in the global economy, rising raw material prices, change of Government in Malaysia that resulted in a slowdown in Government spending have affected the industry significantly. The hospitality division achieved mixed results with better revenue contributed by the newly opened Holiday

11Performance Review ADVANCE SYNERGY BERHAD | annual report 2018
Villa Hotel & Residence Shanghai Jiading which was offset by the lower revenue from other local hotels namely, Holiday Villa City Centre Alor Setar which ceased operations in April 2018 and the lower management fees from Holiday Villa Hotel & Residence Doha City Centre (“Holiday Villa Doha”). The diplomatic crisis in Qatar where several gulf countries severed relations and imposed trade and travel restrictions on the Qatar State, without signs of a possible ending, that will continue to have an adverse effect on Holiday Villa Doha. The total fees received from this hotel reduced by almost 32.0% in year 2018. On a brighter note, Chinese tourist arrivals to Malaysia recorded an overwhelming increase from 2.2 million in 2017 to almost 3.0 million in 2018. Indian and Korean tourist arrivals have also increased by 9% and 24% respectively for the corresponding period. As a result, Holiday Villa Langkawi has benefited from these markets.
Our room average occupancy rate for fiscal 2018 was lower at 51.0% compared to 56.0% in fiscal 2017. But average room rate had increased by 6.4% over the same period. The division’s revenue was lower by RM6.2 million, a drop of 10.2% at RM54.3 million from 2017’s revenue of RM60.5 million. Manpower cost continued to rise as additional amount was provided for the minimum wage for the unionised employees in Langkawi and Alor Setar hotels.
The occupancy rate and average daily rate of the hotel industry worldwide for years 2008-2018 extracted from an online statistics portal compiled from certain participating hotels, majority of which are in the 5-star category, for indicative purposes only is illustrated below:
OCCUPANCY RATE OF THE HOTEL INDUSTRY WORLDWIDE for years 2008 - 2018
Asia Pacific: Central & South Asia, Northeastern Asia, Southeastern Asia and Australia & OceaniaAmericas: North America, Caribbean, Central America and South AmericaEurope: Eastern Europe, Northern Europe, Southern Europe and Western EuropeMiddle East/Africa: Middle East, Northern Africa and Southern Africa
55%
60%
65%
75%
70%
2010 2011 2012 2013 2014 2015 2016 2017 201850%
2008 2009
Year
Occ
up
ancy
Rat
e
Asia Paci�ic Americas Europe Middle East/Africa Holiday Villa Group

12 Performance Review
Hol iday Vi l la g a ined a new hot el ma nagement cont r ac t in Sha ng ha i , China in 2018 thereby increasing our room portfolio to 5,915 rooms. Since the Shanghai hotel commenced operations in July 2018, its performance has improved and the growth was ref lected in the revenue of the hospitality division for fiscal 2018.
Our top market segments last year were guests from e-booking at 26.4%, an improvement from last year, long-term guests at 20.8%, contract wholesale at 11.6%, Corporate at 10.5% and by Series at 8.8%. Hotels which contributed to the increase in e-Booking through Online Travel Agents (OTA) were Holiday Villa London, Holiday Villa Johor Bahru, Holiday Villa Subang, Holiday Villa Langkawi and Holiday Villa Kota Bharu. In the long-term segment, a drop to 20.8% from 24.2% in 2017 was largely from Holiday Villa Doha whereas there was a slight increase from Holiday Villa Subang. Contract wholesale was consistent in comparison with fiscal 2017
while Corporate sales had 1% growth and Series sales decreased marginally by 0.2%.
In terms of tourist arrivals by country of residence, Asia Pacific is our main market (64%) followed by Europe (23%) and the Middle East (8%). The Malaysian guests make up the highest contributor, contributing 28.1% and remain a strong market for Holiday Villa Johor Bahru, Holiday Villa Subang and Holiday Villa Langkawi. Another strong growth market for these 3 hotels is China contributing 14.1% and Singapore contributing 7%. The United Kingdom (“UK”) market is an important market not only for Holiday Villa London but also for other hotels contributing by 4.7%, India market contributes 4.1% and Netherlands contributes 3.8%. Europe, with economic uncertainty and Brexit will have an impact on long haul travels in 2019. Business from Asia Pacific, China and India particularly from third and fourth cities which remain largely untapped, are likely to remain strong. Domestic market will remain the main source of revenue for local hotels.
2010 2011 2012 2013 2014 2015 2016 2017 20182008 200950
90
110
130
70
150
170
Year
US
Dol
lars
Asia Paci�ic Americas Europe Middle East/Africa Holiday Villa Group
Asia Pacific: Central & South Asia, Northeastern Asia, Southeastern Asia and Australia & OceaniaAmericas: North America, Caribbean, Central America and South AmericaEurope: Eastern Europe, Northern Europe, Southern Europe and Western EuropeMiddle East/Africa: Middle East, Northern Africa and Southern Africa
AVERAGE DAILY RATE OF THE HOTEL INDUSTRY WORLDWIDEfor years 2008 - 2018
HOSPITALITY DIVISION (continued)

13Performance Review ADVANCE SYNERGY BERHAD | annual report 2018
HOSPITALITY DIVISION (continued)
The breakdown of the hotels and resorts division’s business by country of residence in fiscal 2018 is as illustrated below:
Our current operating inventory stood at 5,915 rooms with the opening of the managed Holiday Villa Hotel & Residence Shanghai Jiading in 2018. Holiday Villa is ranked No. 219 in the world by Hotels 325* in 2017 based on an inventory of 5,892 rooms.
The division’s gross operat ing prof it ( “ G OP ” ) w a s R M 23 .9 m i l l i o n o r a n operating margin of 44.0%. In fiscal 2017, the division’s GOP was RM24.3 million or
an operating margin of 40.2%. The GOP for fiscal 2018 was lower by 1.6% than the previous year.
The lower GOP was a result of lower gross margin for the fiscal year but robust cost-management strategy to mitigate the ever increasing manpower and other operating costs such as utilities, food & beverage, maintenance and property refurbishment costs has been positive.
In fiscal 2018, there was a gain on disposal of an associated company of RM5.2 million which was included in the other operating income for the division. However, in fiscal 2017, the other operating income included the additional insurance claim of RM12.1 million arising from the fire incident in our hotel in Arosa, Switzerland. These two main events contributed to the division recording a lower other operating income in fiscal 2018, from RM18.2 million (2017) to RM10.8 million (2018). Other operating expenses was higher by RM1.1 million, from RM39.4 million (2017) to RM40.5 million in fiscal 2018 mainly due to the other operating expenses from the newly opened Holiday Villa Hotel & Residence Shanghai Jiading.
As a result, the division made a profit before tax of RM3.4 million in fiscal 2018 compared to a profit of RM15.6 million in the prior year.
* Hotels 325 is a World Hotel ranking published by HOTELS magazine.
2018 HOTELS AND RESORTS’ BUSINESS by Country of Residence (%)
Asia Paci�ic Europe Middle East Others
23%
8%
5%
64%
14 Performance Review
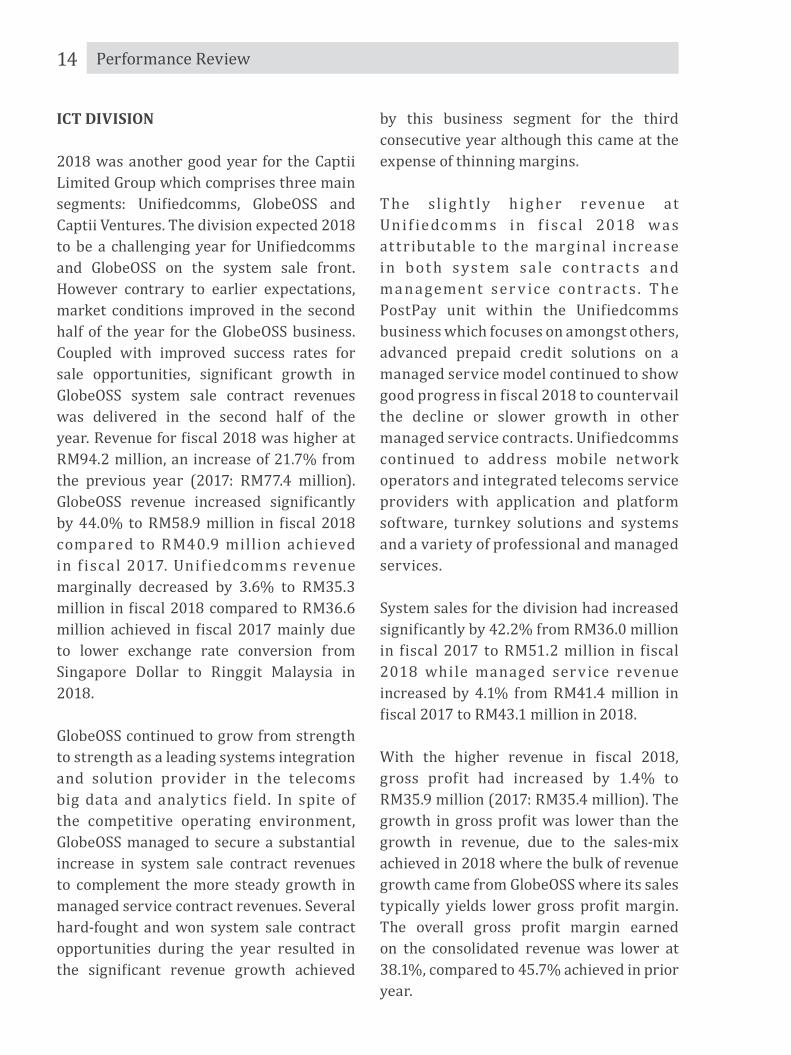
ICT DIVISION
2018 was another good year for the Captii Limited Group which comprises three main segments: Unifiedcomms, GlobeOSS and Captii Ventures. The division expected 2018 to be a challenging year for Unifiedcomms and GlobeOSS on the system sale front. However contrary to earlier expectations, market conditions improved in the second half of the year for the GlobeOSS business. Coupled with improved success rates for sale opportunities, significant growth in GlobeOSS system sale contract revenues was delivered in the second half of the year. Revenue for fiscal 2018 was higher at RM94.2 million, an increase of 21.7% from the previous year (2017: RM77.4 million). GlobeOSS revenue increased significantly by 44.0% to RM58.9 million in fiscal 2018 compared to RM40.9 million achieved in f iscal 2017. Unif iedcomms revenue marginally decreased by 3.6% to RM35.3 million in fiscal 2018 compared to RM36.6 million achieved in fiscal 2017 mainly due to lower exchange rate conversion from Singapore Dollar to Ringgit Malaysia in 2018.
GlobeOSS continued to grow from strength to strength as a leading systems integration and solution provider in the telecoms big data and analytics field. In spite of the competitive operating environment, GlobeOSS managed to secure a substantial increase in system sale contract revenues to complement the more steady growth in managed service contract revenues. Several hard-fought and won system sale contract opportunities during the year resulted in the significant revenue growth achieved
by this business segment for the third consecutive year although this came at the expense of thinning margins.
T he sl ig ht ly h ig her revenue at Uni f iedcomm s in f isc a l 2018 wa s at tributable to the marginal increase in bot h s ys t em sa le cont r ac t s a nd ma nagement ser v ice cont r ac t s . T he PostPay unit within the Unifiedcomms business which focuses on amongst others, advanced prepaid credit solutions on a managed service model continued to show good progress in fiscal 2018 to countervail the decline or slower growth in other managed service contracts. Unifiedcomms continued to address mobile network operators and integrated telecoms service providers with application and platform software, turnkey solutions and systems and a variety of professional and managed services.
System sales for the division had increased significantly by 42.2% from RM36.0 million in fiscal 2017 to RM51.2 million in fiscal 2018 while managed ser vice revenue increased by 4.1% from RM41.4 million in fiscal 2017 to RM43.1 million in 2018.
With the higher revenue in fiscal 2018, gross profit had increased by 1.4% to RM35.9 million (2017: RM35.4 million). The growth in gross profit was lower than the growth in revenue, due to the sales-mix achieved in 2018 where the bulk of revenue growth came from GlobeOSS where its sales typically yields lower gross profit margin. The overall gross profit margin earned on the consolidated revenue was lower at 38.1%, compared to 45.7% achieved in prior year.

Ticketing Outbound Travel Inbound Travel Others
2018
2017
71,888
67,924 41,327
2,490
432
49,316
1,540
302
15Performance Review ADVANCE SYNERGY BERHAD | annual report 2018
ICT DIVISION (continued)
Overall, our ICT division achieved another profitable year with profit before tax of RM10.8 million. The profit is 22.7% higher than in fiscal 2017 where its profit was at RM8.8 million. The substantial increase in profit is mainly due to the flow-down-effect of the better revenue and the fair value gain of RM2.7 million on investment that the division enjoyed in 2018 on the revaluation of the Captii Ventures’ investment portfolio which had increased in value during the year offset by the flow-down-effect of lower gross profit margin realised and impairment loss of goodwill and investment property of RM2.6 million. Compared to the fair value gain in fiscal 2018 of RM2.7 million, in fiscal 2017, the division had a fair value loss assessed on Captii Ventures’ investment of RM1.1 million, which is unrealised, as a result of the lower estimated fair valuation of the venture investment portfolio following the adoption of the most appropriate valuation technique. Captii Ventures, the venture investment arm of the ICT division, focuses primarily on the SEA market for start-up investment opportunities.
PROPERTY DEVELOPMENT DIVISION
It was a disappointing year for the property development division as their anticipated Phase 2, Federal Park Project, was not launched as expected as the approval for the amended development plans to build townhouses is still pending. Phase 2, Federal Park Project, was revised to be slated to commence in the third quarter of 2019. Consequently, the division recorded a significantly lower revenue of RM38,000 in fiscal 2018 compared to a revenue of RM1.1 million in fiscal 2017. The loss before tax from the division is at RM2.2 million for fiscal 2018. In fiscal 2017, the division made a profit before tax of RM134,000.
TRAVEL AND TOURS REVENUEby Business Units (RM’000)
TRAVEL AND TOURS DIVISION
2018 was also another good year for the travel and tours division. The division s u c c e s s f u l l y p o s i t i o n e d i t s e l f a s a corporate ticketing provider in the travel industry to cater to the needs of corporate companies in Klang Valley, Melaka and Kuantan. Revenue increased by RM10.8 million or 9.6% to RM123.0 million in fiscal 2018 from a revenue of RM112.2 million in fiscal 2017. Despite the improved revenue, the division’s profit before tax was lower at RM2.0 million compared to RM2.1 million in fiscal 2017 as gross profit margin was lower at the ticketing and outbound travel units coupled with the flow-down-effect of lower sales at our inbound travel unit resulting in a loss for the inbound travel. The ticketing unit generated the bulk of the ticketing sales from wholesale segment and “umrah” packages during the year which generally yielded lower gross profit margins which was however partly offset by higher other operating income such as incentives from airlines. The profit of this division was also affected by the impairment loss on investment securities of RM1.2 million in fiscal 2018.
The breakdown of the revenue by business units for fiscal years 2017 and 2018 is illustrated below:

16 Performance Review
OTHERS DIVISION
This division comprises the card and payment services, bus-body fabrication and education businesses. Total revenue for the division in fiscal 2018 was lower by RM3.9 million at RM10.7 million from RM14.6 million in fiscal 2017 as the division underwent major restructuring such as the winding down and eventual cessation of the TCM business in December 2017, the revamping of the operations for the bus-body fabrication unit and review of the courses and quality of services at the education unit. Consequently, both the bus-body fabrication and education units recorded lower revenues in 2018. This reduction was mitigated by a higher revenue from the card and payment services unit which registered a 16.7% growth in revenue to RM7.7 million.
Our bus-body fabrication unit recorded a lower revenue of RM1.9 million in fiscal 2018 compared to RM5.4 million in fiscal 2017. In 2018, the unit completed and exported 6 buses to Australia compared to 7 units exported in 2017. In 2017, the business unit completed fabrication and delivery of 69 Mass Rapid Transit KL (“MRT”) buses for SCANIA. The success for 2017 rides on the success of this division in completing the refurbishment of 100 Volvo buses owned by Rapid KL in 2014 and 2015. During the year, management focused on the review and revamp of the production processes with a view to improve cost control, manpower and material utilisation efficiency and quality control as part of the turnaround plan for the unit. More stringent payment terms were also imposed.
In 2018, our education unit focused on establishing The Language House (“TLH”) as a provider of high quality instruction in languages. This entailed a review of the different language courses provided and the qualit y of the teachers and teaching materials and methods. Resulting therefrom, TLH decided to limit the courses to English, Bahasa Melayu and Mandarin. This new focus was aimed at helping TLH maintain the quality of teaching and learning materials offered in the three main languages. With the review exercises which were completed in Q3 2018, the student recruitment and sales and marketing efforts were slowed down in 2018. As a result, our education unit recorded a decrease in its revenue from RM2.3 million in fiscal 2017 to RM1.1 million in fiscal 2018 mainly due to lower enrolment of foreign students and the cessation of a few foreign languages programmes in 2018.
Our card and payment services business recorded higher merchant sales volume in 2018, an increase of 22.7% from the sales volume in 2017 resulting in higher revenue of RM7.7 million in fiscal 2018 compared to RM6.6 million in the prior year, mainly due to a higher volume of transactions generated from the signing of new merchants and higher spending at the merchants.
With the lower revenue in 2018, the loss before tax for the “Others” division increased to RM9.5 million in fiscal 2018 as compared to a loss before tax of RM8.6 million in fiscal 2017.

17ADVANCE SYNERGY BERHAD | annual report 2018
The Year Ahead...
HOSPITALITY
2019 will be an exciting year for the Hotels and Resorts division with the opening of Holiday Villa managed properties in Madinah and Hail in the Middle East and in China after the soft opening of the 141 rooms Holiday Villa Jiading, Shanghai, China in July 2018.
In addition, a new LaVilla Boutique Hotel concept will be introduced in 2019 at Cherating, Langkawi and Penang. This LaVilla brand will better serve guests who demand more privacy, space and security in addition to the unique ambiance and facilities of the property.
Another D-Villa, namely, D-Villa Residence, Doha, Qatar is expected to open in 2019. D-Villa brand complements our established Holiday Villa brand as a long-stay option for
guests with family who prefer apartment-style facilities.
The division is optimistic that with both the LaVilla and D-Villa brands complementing the Holiday Villa brand, there will be more opportunities to grow our position regionally.
Ho l i d a y V i l l a w i l l a l s o e m b a r k o n private brand hotel/serviced apartment management with the opening of our first private brand management of 57-59 Philbeach Hotel Apartment in London by early 2020. This marks our first foray into a private brand management to target hotels/serviced apartments which prefer to have their own brand while tapping on our expertise in hotel management and the networking offered by our sales and marketing force and reservation system.
Whilst the Group has been resilient in meeting the challenges of 2018, we expect 2019 to be a year of opportunities amidst continuing uncertainty and challenges for certain market segments. Following our proven initiatives to improve on operational efficiencies, productivity and cost reduction coupled with strategies to nurture and grow established core businesses and explore attractive opportunities to expand operations, the coming year will see the Group being more nimble and in a good position to take on strategic priorities and accelerate growth of our core businesses.

18 The Year Ahead...
HOSPITALITY (continued)
Any financial impact will only be reflected in the operational results in late 2019 as we expect the opening of the two hotel apartments to be within 2019. The division will also invest in key markets and cities via ownership and/or long-term lease arrangement. The focus to grow the hotels and resorts businesses regionally will partly mitigate the adverse effects from anticipated continued weak local meetings, incentives, conferences and exhibitions (MICE) market for 2019 and the continuing diplomatic crisis in Qatar.
T he hot els a nd resor t s d iv is ion w i l l cont inue t o t a r get a l l major ma rket segments and at the same time to focus o n d e v e l o p i n g b u s i n e s s f r o m A s i a region, working with tour operators, local corporate business and securing more residential meetings. To cater for increase in online sales, the division is in the process of upgrading its website for enhanced features to meet the expectation of travellers particularly the Millennials and it is expected to complete by second-half of 2019.
The contract/wholesale market is still an important segment especially for the beach resort hotels, so we will enhance relationship with industry leaders from wholesalers, tour operators, B2B operators to online travel operators. Our very own online booking site is also providing digital marketing services for our hotels. The increase in tourist arrivals in the leisure market from China, India and Korea is expected to continue in 2019.
A recent trend in the travelling pattern is gaining a lot of traction worldwide. Travellers are spending more time in their desired destinations and with a propensity to booking through home-sharing operators like Airbnb, Home-Stay and other short term rentals. These non-traditional lodging operators are highly dependent on mobile internet technology and social media, a marketing infrastructure targeting mostly young people.
Holiday Villa brand however has the competitive advantage of 3 key benefits: Service, Consistency and Safety, over the home-sharing operations.
O u r v e r y ow n “ M a n j a” p r o g r a m m e , provides gracious personal attention to create a home atmosphere and comfort for our guests throughout their stay. Besides, we continuously review and upgrade our facilities and conducts regular inspection with particular attention to aspects of personal safety for our guests. Holiday Villa also provides 24-hour service so guests can be assured that we are there to assist them in emergencies. We also have competent staff and good facilities to provide assistance to the elderly or those with physical disabilities.
To strengthen brand recognition, our Villa Gold Card loyalty programme continues to receive good response as Villa Gold members enjoy privileges at participating Holiday Villa hotels worldwide.

19ADVANCE SYNERGY BERHAD | annual report 2018 The Year Ahead...
HOSPITALITY (continued)
Some of our key activities for 2019 are:
a) To renovate the new serviced apartment in London as the current lease on the property will expire in mid January 2020. UK is an important destination for our guests. It is also among the top-3 revenue generators.
b) As Singapore contributes to the list of tourist arrivals to Malaysia, we will cont inue t o t ap int o t he ma rket in Singapore through our sales office there which was established at the end of 2017.
c) Our quest to sign new management/licensed contracts to increase our room inventory is on-going.
d) We have also established a boutique-style LaVilla brand to better serve our guests who demand more privacy, peace and security. Federal Villa Langkawi and Eastern Pavilion Cherating will be rebranded as LaVilla Boutique Hotels from 2019. We have also signed up a LaVilla property in Penang scheduled to open in 2019.
ICT
Our ICT division comprises three main segments: (i) Unifiedcomms – segment for content-driven mobile value added services, messaging and signalling systems, solutions and managed services (ii) GlobeOSS – segment for mobile network operation support systems, solutions and managed services (iii) Captii Ventures – segment for
strategic investment in early and late-stage technology ventures.
The ICT division will continue to strengthen the managed service contract portfolio and continue to grow its venture investment por t fol io a s t he ba sis for del iver ing steady, if not, rapid yet sustainable future growth. Significant uncertainty and hence lumpiness is still to be expected in the contribution of system sales contracts hence the division’s managed service contract port folio continues to have emphasis in the 2019 business plan. Our ICT division will continue to work on means to better manage execution risk in respect of strategies and tactics to grow the revenue and profit. This includes maintaining if not growing the more mature managed service contracts in our portfolio and to more quickly translate secured contracts into substantial sources of recurrent revenue for the division.
The division expects GlobeOSS to continue to grow from strength to strength despite global economic uncertainty and hence lumpiness is still to be expected in the contribution of system sale contracts to the division’s future results. Apart from the contribution of existing long-standing managed service contracts, the bulk of the system sale revenues that are expected to be realised by the division’s businesses in 2019 are expected to be driven by new solution implementation for new and existing customers, as well as solution enhancement, system upgrade and system capacity expansion activities of existing customers within the SEA region. This same region is also expected to drive managed service contract revenue growth.
20
ICT (continued)
The ICT division’s strategic investment plan through its venture-investment subsidiary, Captii Ventures Pte Ltd (“Captii Ventures”), will continue to complement the growth plans of its existing businesses. Captii Ventures focuses primarily on the SEA market for start-up investment opportunities. Our venture investment business regularly interacts with other venture capital management companies in the region and participates in funding rounds as either lead investor or as a co-investor following the lead investor.
In l ine w it h t he d iv is ion’s vent u re investment portfolio, our ICT division also built our own fintech start-up, PostPay (formerly known as Mobilization) which has shown promising growth in terms of revenue and technology. PostPay now focused mainly on providing advanced solutions for prepaid credit on a managed-service model. The growing interest and opportunity in internet-driven application services for enterprises, fintech as well as internet and handset-app delivered digital media will guide the division’s venture investment activities. In the year ahead, our ICT division will continue to focus primarily in the growth businesses in the SEA region and will complement the organic growth strategy in place for our Unifiedcomms and GlobeOSS businesses.
TRAVEL AND TOURS
The travel and tours division is cautiously optimistic of their performance for 2019 as the division continues to remain focused on building its corporate client base for the ticketing business and developing and adapting its products to sustain growth in the leisure and corporate group markets for both inbound and outbound travel and tours. The division aims to capture all range of customers in Malaysia from small medium enterprises, medium size corporations and companies to individual travellers. The division will also emphasise on wholesale ticketing and custom travel packages and continue to maintain the good rapport and networking with all the relevant stakeholders, especially hotels, airlines and travel agents.
The industry is expected to be buoyant in the coming year even with the persistent uncertainty of the global economy and we expect footprints from both emerging and developed markets to increase.
The division expects a healthy rise in corporate travel which will augur well for the division as we are positioned strongly in the corporate ticketing services. In moving forward for the coming year, the division will engage the right people in the right place at the right time to ensure optimum growth and we intend to develop our team and provide opportunities to our staff to expand their knowledge, skills and abilities as the division grows and flourishes for a mutually beneficial relationship.
The Year Ahead...

21ADVANCE SYNERGY BERHAD | annual report 2018
TRAVEL AND TOURS (continued)
The division will focus on the market trends and products diversification in order to increase the yearly revenue and yield. Our ticketing and outbound units target to capture small and medium-sized organisations and individual travellers via the customisation of our travel products. We will also focus on wholesale ticketing and custom travel packages. For the inbound business which recorded weak performance, the division has revamped the inbound management team and will repackage their inbound products to target new markets besides their existing Europe market. In 2019, our inbound travel unit will emphasise on further developing its professional team to ensure that the unit has growth in different market segments. Besides our primary market in Europe, our inbound unit is developing products for market segments in the vibrant Asia Pacific region.
The division believes that there are huge growth opportunities in the local and global tourism business as the division is well-positioned with clear growth strategies focusing on market trends and product diversification.
PROPERTY DEVELOPMENT
The property development division’s main growth for the coming year will be from the development of Phase 2, Federal Park comprising mainly 152 units of townhouses,
41 units of single-storey terrace houses and 4 units of double-storey terrace houses which is now planned for commencement in third quarter 2019 as the division is optimistic that approvals for its amended development plan will be obtained. This property development project will put the division back on track on its earnings.
The division will focus on the sale of shophou ses u nder Pha se 1 a nd t he development of Phase 2 of its on-going Federal Park project, together with another 17 acres project in Jalan Sejijak comprising 80 units of townhouses, 96 units of double-storey terrace houses and 40 units of single-storey terrace houses and the development of 15 single-storey detached houses in Taman Sri Matang which construction is now about 90% completed, to drive this division’s performance for 2019. The showhouse for the Taman Sri Matang project is available and all the 15 units are expected to be sold during the first half of year 2019.
As a reputable niche player, the division will remain focused on its target market seg ment of med iu m t o med iu m-low properties. However, the division expects the property market in Kuching to remain soft coupled with stringent financing requirements. With the right pricing and affordability for its development properties, the division is confident of the marketability of its properties to provide a steady income stream. To ensure sustainabilit y, the division is continuously identifying suitable land banks for development.
The Year Ahead...

22
PROPERTY DEVELOPMENT (continued)
Moving forward, the division will expand its property development business to include property investment. As its first foray into property investment, the division invested in two properties in Jalan Yap Ah Shak, Kuala Lumpur and Temasya, Shah Alam, Selangor in 2018. The two properties will be renovated and refurbished to high quality serviced office buildings which are fully-equipped and will be rented out to a mixture of tenants on flexible rental terms for short and long-term stay. The division is optimistic that this business model will increase the yield of the buildings and add value to the properties.
BUS-BODY FABRICATION
Our bus-body fabrication unit, Quality Bus & Coach (M) Sdn Bhd (“QBC”) has gain substantial ground in the local and export markets since 2015 after years of effort to promote and established its presence culminating in the signing of two collaborative agreements with one of China’s leading electric bus manufacturer (“the Chinese Partner”) for the supply of electrical city buses for the local and ASEAN markets.
The Chinese Partner will supply the chassis together with the structures/components and the division will assemble the chassis and structures/components onto the chassis. The collaboration envisages that there will be technology transfer from the Chinese Partner to the division with regard to the electrical bus chassis.
Electric vehicles or EV, including electric buses with zero emission and therefore eco-friendly are being tried in many pilot projects in China, Europe and the USA. With various major world cities adopting plans to minimise or eliminate air pollution, electric-powered buses are seen as the preferred mode of public transportation of the future. There are also many factors which could propel the growth of electric buses in Malaysia such as lower operating and maintenance costs and no emission.
QBC buses are designed and fabricated in compliance with the internationally recognised safety standards known as the Australian Design Rules (“ADR”). The unit also has approval from Kementerian Perdagangan Dalam Negeri, Koperasi Dan Kepenggunaan to affix the “Barangan Buatan Malaysia” (“Product Made In Malaysia”) logo on our locally designed bus models Autobus (“Autobus”) LF 12250, Autobus LF 10200 and Autobus SD 12300. Autobus is designed and built to ADR specifications. The ADR certification is a major achievement acknowledging QBC’s technical know-how and competency. With ADR certification, Autobus can be exported to global markets. One major export market for the division is Australia. QBC has entered into an assembly contract with I-Bus Pty Ltd (“I-Bus”) for the design and manufacturing of bus bodies on the Isuzu Chassis supplied by I-Bus for the Australia market.
The Year Ahead...

23ADVANCE SYNERGY BERHAD | annual report 2018
BUS-BODY FABRICATION (continued)
2018 was a slow year for the unit as the focus of management was to review and revamp all aspects of the production processes with a view to improve the cost control, manpower and material utilisation efficiency together with quality control. With the various measures put in place QBC is cautiously optimistic that it is in a good position to grow its sales and manage the challenges in 2019.
EDUCATION
Our education unit, TLH believes education is a growth industry and TLH will thrive if it could build a strong academic reputation for itself. In year 2019, TLH will focus on monitoring the quality of all the language courses; review and improve all language courses making them more engaging and relevant to today’s learners; and improve teaching and learning materials with emphasis on language in communication, accuracy in grammar and growth in vocabulary. Our teaching professionals use an interactive communicative approach to engage learners, maximise learning oppor t u nit ies a nd promot e s t udent autonomy. Our professional teaching staff, engaging curricular and excellent teaching and learning facilities will differentiate TLH from the common pack.
Our General English Programme (“GEP”) is designed to help non-native English speakers progress at a comfortable pace taking their individual language skills into account in an engaging and encouraging environment. We benchmark our students’ progress against the global CEFR (Common European Framework of Reference for Languages) standards. We adopted the CEFR guidelines as our standard as it helps students to better gauge their language proficiency against a global yardstick.
In 2015 and 2016 we focused on improving the image and facilities: relocation of the school, the recruitment and training of teachers and appointment of new student recruitment agents for the overseas market. In 2018, we focused on establishing TLH as a provider of high quality instruction in languages. We reviewed the different language courses provided and decided to limit them to English, Bahasa Melayu and Mandarin.
This led to the cessation of other foreign languages programmes. This new focus was aimed at helping TLH maintain the quality of teaching and learning materials offered in the three main languages. TLH expects that its focus on improving the quality of its products and services will yield positive results in the near future although this has resulted in a reduction in the student intake in 2018. Management expects to achieve the targeted results of the review exercise only in 2019.
The Year Ahead...

24
EDUCATION (continued)
Mandarin courses were reviewed to make them more relevant to the communication needs of students. We prioritise speaking and listening in different everyday situations and language used by travellers.
This unit explored collaboration with partners who have established credentials in the teaching of Bahasa Melayu. In January 2019, TLH signed a memorandum of understanding with Dewan Bahasa Dan Pustaka (“DBP”) on 5 years’ collaboration to develop Bahasa Melayu language courses. DBP will provide teachers and teaching materials while TLH will advertise, promote and host various Bahasa Melayu courses.
Ou r cor por at e t r a ining prog r a mmes this year will concentrate on English, Ma nda r in a nd Ba ha sa Melay u . Such training programmes have achieved good response in the past and will continue to be the focus for 2019.
In the student market, TLH will focus on the needs of the local student market offering IELTS (International English Language Testing System) preparation courses, and English courses in general to assist local students achieve proficiency in the subject.
In addition to the Middle East where many of our foreign students come from, TLH is looking at developing a foothold in new markets in ASEAN and East Asia to increase our foreign students.
CARD AND PAYMENT SERVICES
Our card and payments business unit operates its business through the MasterCard and Visa global payment system net works regulated by Bank Negara Malaysia (“BNM”) under the Financial Ser vices Act , 2013. The operating environment will continue to face significant changes over the next few years with the initiative by BNM to encourage a cashless society. To achieve t he objec t ive of a c a sh less soc iet y, BNM mandated that the deployment of electronic data capture terminals shall increase three-fold by 2020; in addition to other forms of payment solutions being considered for approval by BNM. The entry of mobile payment providers such as AliPay and WeChat Pay has created more electronic payment channels using electronic wallets that enable consumers to make online payments v ia smart phone. This will continue to complement the use of Chip and Pin payment cards issued by Malaysian card issuers. The implementat ion of the Chip and Pin payment cards after 1 July 2017 had significantly reduced payment disputes and fraudulent use of payment cards as all Malaysian payment cards are now PIN-enabled. We are confident we can grow our business in line with the industry in the coming year.
The Year Ahead...
25ADVANCE SYNERGY BERHAD | annual report 2018 The Year Ahead...
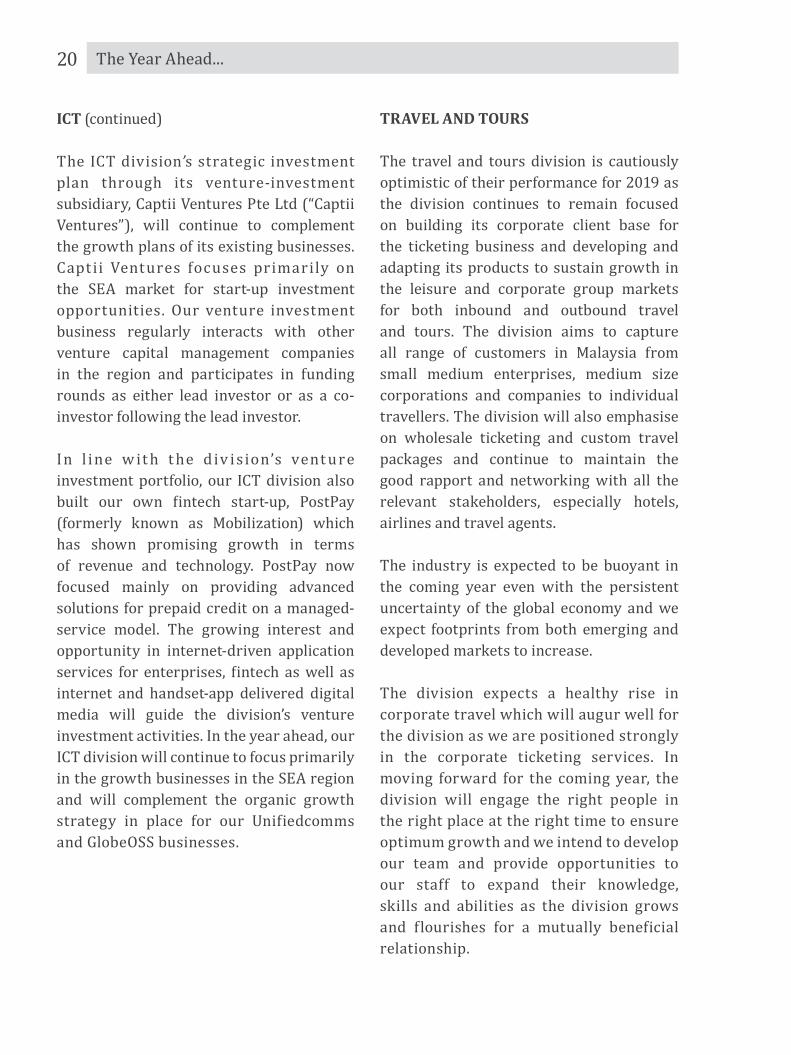
CARD AND PAYMENT SERVICES(continued)
With the completion of the roadmap for our card and payment services unit, management will now undertake the staff recruitment process and revamp of its technology platform to support the new products and services. In the meantime, our focus is to build the brand starting with the company name change to Paydee Sdn Bhd and through the acquisition of high consumer profile merchants by offering very competitive rates to them to create consumer awareness and to continue improving the acquiring business revenue by not just signing more merchants through our master merchants but also acquiring more active merchants and merchants with higher ticket size transactions. The process of appointing more master merchants is on-going. We target to implement E-Commerce Module in 2019, which will encourage more merchants to sign up with our cards and payment services unit. The business unit is also looking at the issuance of convenient payment card for commercial businesses in 2019. We also have plans to upgrade our processing systems to expand our electronic payment services (besides MasterCard and Visa) to include other payment service operators to provide a more comprehensive payment solution to our merchants.

26
Sustainability
The Group’s Board and Management are committed to establish and maintain an effective Sustainability Management System which is supported by underlying, internal controls, risk management practices, clear accountability and reporting process. The Board evaluates the Environmental, Social and Governance (“ESG”) risks and opportunities relevant to the Group during the formulation of their overall business strategy, objectives and performance measurements.
The Management identifies the type of relevant ESG topics caused by its day-to-day operations. Management then determines the Materiality of the ESG topics based on the level of significance of impact on, and influence on stakeholder values, and the achievement of the Group’s strategic objectives. The Board supports and approves the identification and assessment parameters of material ESG topics.
The key material ESG factors for Advance Sy ner g y Berhad (“A SB ” ) have been identified and reviewed by ASB’s Board and Management. The Board and Management shall continue to dedicate leadership and maintain a high standard of sustainability
governance to drive continuous and long-term growth for all of its stakeholders. The Group will work towards ensuring c o m p r e h e n s i v e d i s c l o s u r e s o n t he management and monitoring of our sustainability initiatives for continual improvement.
STRATEGIC APPROACH FOR SUSTAINABILITY
At ASB, we continue to ref ine our management approach to adapt to the changing business and sustainabilit y landscape. Aligning with the perspective of our stakeholders, the Senior Management Team (“SMT”) has, within the scope of our business operations, identified that the Environment, Employee Relations, Health & Safety, Product Excellence, Stakeholder Relations and Community constitute key sustainability aspects material to our business.
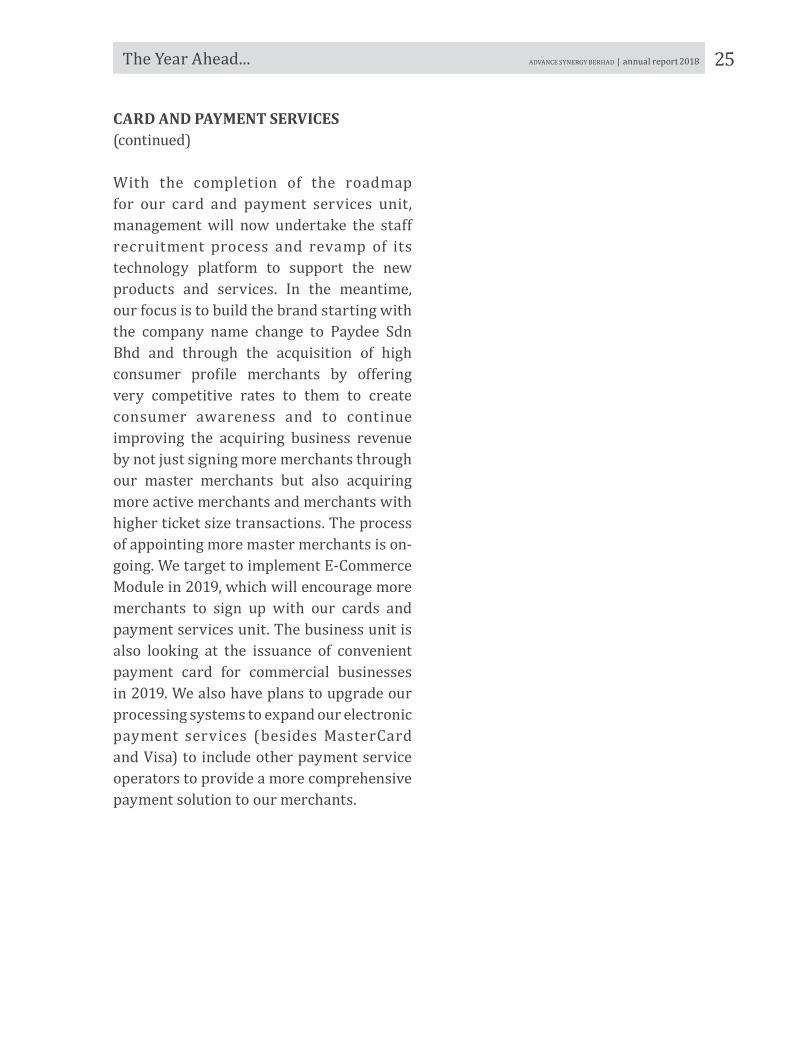
In t h is reg a rd , we have es t abl ished sustainability performance management framework (See Exhibit 1), and identified three (3) key pillars, to enhance the m o n i t o r i n g a n d r e p o r t i n g o f o u r sustainability performance.
Statement on
27ADVANCE SYNERGY BERHAD | annual report 2018
Sustainability
Sustainability
Exhibit 2 - Our Key Business Divisions
2. As Captii Limited (“Captii”) under ICT division is a subsidiary listed on the Singapore Exchange Securities Trading Limited (“SGX”), it has produced a detailed 2018 sustainability report that provides information on their sustainability p e r f o r m a n c e . P l e a s e r e f e r t o C a p t i i ’ s sustainability report in their 2018 annual report for further information.
3. The Other division refers to our card and payment services, bus-body fabrication and the education businesses.
1. Please refer to the Governance section of the annual report.
Hotels &Resorts ICTProperty
Development
Travel &Tours
OtherDivision³
Three (3) pillars of oursustainability performance
Supported by a systematic & interactiveprocess to identify, categorise and prioritise
material ESG topics
SustainingGrowth
EmpoweringLives
Nurturing Communities
EnvironmentalManagement Labour
Practices &HumanRights
Health &Safety
Management
CorporateSocial
ResponsibilitiesProduct Excellence
RegulatoryCompliance
CorporateGovernance
& RiskManagement¹
Supply ChainManagement
Our Materiality Assessment Process
IDENTIFYDe�ine a listof potential
materialESG topics
PRIORITISEEngage
stakeholdersfor feedback
and validationof each topics
based onimportance tointernal and
externalstakeholders
CATEGORISERe�ine the list
of topics byclusteringthem into
categories
STRATEGIC APPROACH FOR SUSTAINABILITY (continued)
Exhibit 1 - ASB Group’s Sustainability Performance Management Framework
REPORTING PRACTICE AND BOUNDARY
This sustainability report provides detailed disclosure of management of our key sustainability matters for the financial year ended 31 December 2018. The ASB Group comprises operating subsidiaries and associates that service business and consumer markets in a variety of industries. These operating companies are grouped under the several Key Business Divisions of the ASB Group (See Exhibit 2), which include:

28
UNDERSTANDING WHAT MATTERS TO US
We use a comprehensive materiality assessment to identify priority areas based on the business strategy outlined in our plan. Our materiality assessments were based on the AA1000 Account Ability Principles of Inclusivity and Materiality, as well as the Global Reporting Initiative (“GRI”) Principles for Defining Report Content – stakeholder inclusiveness, sustainability context, materiality and completeness. Materiality with respect to sustainability reporting, as defined by GRI Standards, includes topics and indicators that reflect the organisation’s significant ESG impacts; and would substantively influence the assessments and decisions of stakeholders.
In 2018, a robust process was undertaken to identify and prioritise the Group’s material ESG issues. The process was supported by an independent consultant and involved stakeholder consultations, workshops for senior management, an assessment of long-term global trends and an internal review of our businesses.
Through internal discussion and review with the independent consultants, Management have reviewed stakeholders across the Group’s value chain and identified these as key stakeholder groups for the respective business.
Hotels & Resorts ICT Property Development Travel & Tours
Other Division – Bus-Body Fabrication
1. Government & Regulators
2. Customers3. Channel/
Distribution Partners
4. Employees
1. Customers2. Employees3. Suppliers
1. Government & Regulators
2. Employees
1. Customers2. Channel/
Distribution Partners
3. Employees4. Media
1. Customers2. Government &
Regulators3. Channel/
Distribution Partners
4. Employees5. Media
Hotels & Resorts
1
1
3
3
2
2
4
4Importance to to internal Stakeholders
Impo
rtan
ce to
Exte
rnal
Sta
keho
lder
s
Legend:
High Medium Low
3
1 2
4 5
78
9
6 10
11
12
Sustainability
Our material issues are identified as those that are ranked as high and medium on the materiality matrix (See Exhibit 3). We therefore focus our sustainability efforts and reporting on these issues that are of the most concern to our business and stakeholders.
Exhibit 3 - ASB’s Materiality Matrix

29ADVANCE SYNERGY BERHAD | annual report 2018
Travel & Tours
1
1
3
3
2
2
4
4Importance to internal Stakeholders
Impo
rtan
ce to
Exte
rnal
Sta
keho
lder
s
Legend:
High Medium Low
5 78 12
13
1
2
3
4
610
911
ICT
1
1
3
3
2
2
4
4Importance to internal Stakeholders
Impo
rtan
ce to
Exte
rnal
Sta
keho
lder
s
Legend:
High Medium Low
1
4
9
6
5 78
1012
13
79
6
10
8
12
1
2
3 4 5
11
Property Development
Importance to internal Stakeholders
Impo
rtan
ce to
Exte
rnal
Sta
keho
lder
s
Legend:
High Medium Low
1
1
3
3
2
2
4
4
3
Other Division - Bus-Body Fabrication
Importance to internal Stakeholders
Impo
rtan
ce to
Exte
rnal
Sta
keho
lder
s
Legend:
High Medium Low
57
12
1
2
46
10
9
11
1
1
3
3
2
2
4
4
Impo
rtan
ce to
Exte
rnal
Sta
keho
lder
s
8
ESG Topics That Were Considered Topics Definition
Environmental
1. Energy Efficiency Efficiency of energy usage (i.e. electricity consumption).
2. Water & Effluents Water consumption and discharge.
3. Waste Management Hazardous and non-hazardous waste disposal treatment.4. Environmental Compliance Adherence to relevant environmental laws and guidelines.
Social &Governance
5. Labour Practices Commitment to fair employment practices, upholding of human rights principles, and investing in our people.6. Equality & Diversity
7. Product & Services Responsibility Aspects of our products & services that directly affect
customers, namely, quality, health and safety, wellbeing, information and labelling, marketing, and privacy. 8. Data Privacy & Protection
9. Health, Safety & Security
10. Supply Chain Management Resiliency and significant social impacts observed or assessed in our supply chain.
11. Corporate Responsibility Responsibility to environment and communities where we operate in.
12. Anti-Corruption & Anti-Fraud How we guard against corruption, bribery, and fraud.
13. Innovation Continual effort to improve product excellence through innovation and technology
The material ESG issues were also reviewed by ASB’s Board and deemed to remain relevant. Moving forward, to keep abreast of critical issues, we will review annually our material issues against the changing business environment, stakeholder opinions, and emerging global and local trends.
Sustainability
UNDERSTANDING WHAT MATTERS TO US (continued)
Exhibit 3 - ASB’s Materiality Matrix (continued)

30 Sustainability
SUSTAINING GROWTH
ENVIRONMENTAL MANAGEMENT
Environmental sustainability forms an integral part of the Group’s sustainability philosophy. We endeavour to integrate the best sustainability practices across business operations to reduce adverse environmental impact on the ecosystem. In our daily operations, the Group continues to be committed on recycling, energy-saving practices and undertaking measures to reduce wastages, pollution and harmful emissions.
ASB is committed and strive to improve resource efficiency and reduce our environmental impact. We continue to factor in environmental considerations in our businesses.
Our “Going Green @ Holiday Villa” campaign at all Holiday Villa hotels aims to contribute to the preser vat ion of natural resources and environment by focusing on energy conservation, waste management, responsible purchases and landscaping. Works with all stakeholders to promote and implement responsible environmental practices. Both Cherating Holiday Villa and Langkawi Holiday Villa performed environmental impact assessments before the hotels embarked on any development or improvement. We use renewable energy and garbage enzymes made out of fruit peels and vegetables as cleaning agent to reduce environmental impact. The hotels and resorts division also has its own environmental policy in place with the systems that set annual improvement targets to monitor energy consumption, water consumption and waste production.
Our bus-body fabrication division also has a built-in monitoring system on waste production and disposal. The Group ensures that waste materials are deposited at designated environmentally safe areas and disposed off periodically by authorised waste disposal agents.
Commitments & Targets
• Improve the environmental ma nagement s ys t em s of key business units to meet the requirements of the ISO 14001 standard.
• Continue to explore solutions that minimise environmental impact.
• Install or maintain energy-ef f icient equipment and dev ices at ou r f ac i l i t ies whenever possible, including LED lights and more energy-efficient cooling solutions.

31ADVANCE SYNERGY BERHAD | annual report 2018 Sustainability
ENVIRONMENTAL MANAGEMENT (continued)
Water Consumption
Water is a precious resource. The Group continues to strengthen its water conservation efforts through initiatives like promoting water-saving practices, adopting water-efficient technologies and equipment as well as implementing process improvements. Given that the business operations of most of our divisions are concentrated in normal office spaces, the level of water consumption is relatively limited, except for hotels and resorts division. In 2018, the total consumption by our hotels and resorts division were 258,663 cubic metres (m3) of water. As this is our first year in data collection, we are not able to provide 2017 data for comparison.
Environmental Compliance
ASB remains committed to comply with all applicable legal requirements enforced by local governing authorities and relevant enforcers. The Group’s operations continue to conform to local environmental laws and regulations. All employees of the Group and that of contractors and consultants are encouraged to be proactive and forthcoming in managing and reporting environmental related issues and complaints.
The environmental regulations that we comply include among others the requirements listed below in Table 1.
Compliance
Environmental Quality Act 1974 (and its Amendments)Environmental Quality (Scheduled Wastes) Regulations 2005Environmental Quality (Sewage) Regulations 2009Environmental Quality (Clean Air) Regulations 2014Environmental Quality (Prescribed Activities) (Environmental Impact Assessment) Order 2015Land Conservation Act 1960
Table 1. Environmental Compliance Requirements in Malaysia
Energy Efficiency
T h e G r o u p ’s e n e r g y d e m a n d comprises a mix of direct and ind irec t sou rces of ener g y. In 2018, the Group consumed a total 6,242,724 kWh of energy.
As this is our first year in data collect ion, we are not able to provide 2017 data for comparison. Others
Bus-Body FabricationICTProperty DevelopmentHotels & Resorts
Property Development
54,942kWh
ICT287,557kWh
Hotels & Resorts5,052,112kWh
Others779,101kWh
Bus-Body Fabrication69,012kWh

32
Environmental Compliance (continued)
During the reporting period, there were no incidents of non-compliance and penalties pertaining to environmental-related issues. To maintain the highest standard of environmental compliance and to prevent future occurrence of incidence, the Management will continue to review and improve current environmental management system and practices and ensure that all our activities and operations comply with existing regulatory requirements.
PRODUCT EXCELLENCE
We believe that our financial viability hinges on customer satisfaction and our ability to meet customer demand for our product and services. Our business divisions remain committed to execution excellence and building enduring relationships with not only our customers, but key stakeholders in our value chain.
Our card and payment services as well as bus-body fabrication divisions have all rated their customer satisfaction rates at above 80%.
Our ICT division has 24-hour customer careline for customers to lodge feedbacks on service issue.
The following are some of the existing commitments made by our hotels and resorts and ICT divisions:
In their quest to deliver superior quality products and services to their customers and comply with applicable legal requirements, the hotels and resorts division has in place its very own MANJA Programme, a qualit y management system focusing on the service standards, work processes, job instructions and the standard operating procedure for all aspects of the hotels’ operations.
It s M A NJA P romise P rog r a mme, Pha se 1, demonstrated the commitment by our hotel staff to deliver the superior quality products and services to their customers and comply with applicable legal requirements.
Our ICT division embraces the UN Global Compact and at present adopts a best-effort approach in observing the spirit and intent of the ten principles. Although its efforts to uphold the ten principles are not presently embedded in its operational policy and procedure documentation, the work culture of this division’s businesses is consistent with the principles.
Commitments & Targets
• Continue to improve product excellence through innovation and technology.
• Continue to maintain a high level of customer satisfaction across our businesses.
Sustainability

33ADVANCE SYNERGY BERHAD | annual report 2018
SUPPLY CHAIN MANAGEMENT
The Group continue to support local businesses by procuring from supplies and contracting services locally. We believe that a strong local supply chain through productive partnership is vital to the growth of our business.
By such support, we believe that we can positively contribute to the local economy. We select partners who share our work ethics and values and who are willing to provide quality products and services in a responsible manner.
In cases where local suppliers are not suitable, we will source internationally. Where outsourcing is practised, we will ensure that the products conform to our sustainable policies and are labelled with “good manufacturing practices”. We believe the Group’s long-term business is built mainly on the trust and confidence of customers. Therefore, feedbacks from customers such as customer satisfaction rates and customer complaints are documented for future improvement on development of products and services.
REGULATORY COMPLIANCE
Given the geographical diversity of our businesses, we closely monitor developments in the laws and regulations of countries where the Group operates to ensure that our businesses and operations comply with all relevant laws and regulations.
All our key employees af f irm their understanding of the code of business conduct annually. We regularly engage with local government authorities and agencies to keep abreast of changes to laws and regulations.
We recognise that non-compliance with laws and regulations not only has significant financial impact but potentially detrimental reputational impact on the Group. To manage and track compliance issues, the Group appoints compliance of f icers and conducts internal audits.
Commitments & Targets
We are fully committed to strengthening our regulatory compliance framework. Our emphasis is clear and consistently reiterated. We have zero tolerance for fraud, bribery, corruption and violation of laws and regulations.
The Audit Committee supports the Board in its oversight of regulatory compliance and is responsible for driving the Group’s focus on implementing effective compliance and governance systems. At an operational level, the respective business divisions and departments is responsible to identify, self-assess the adequacy and effectiveness of mitigating measures, and manage their financial, operational, compliance and reputational related risks.
Sustainability

34 Sustainability
REGULATORY COMPLIANCE (continued)
See Governance on pages 67 to 73 of the Annual Report.See Risk Management on pages 39 to 48 of the Annual Report.
In 2018, there were no incidents of regulatory non-compliance across the business divisions. The Group continues to work towards reinforcing a full compliance culture.
EMPOWERING LIVES
LABOUR PRACTICES & HUMAN RIGHTS
Our employees are one of our most valuable assets. We are committed to fair employment practices, uphold human rights principles and invest in developing and training our people. At the Group, we strive to foster an inclusive and performance driven work environment to attract, retain and develop our talents. We are an equal opportunity employer and have instituted a fair system to ensure equal opportunities and non-preferential treatment for all employees. There is no preference for any religion, age, ethnicity, race, physical disability or gender. Employees are required to observe and adhere all relevant Group policies and practices. As at 31 December 2018, the Group has a total number of 731 employees. The staff turnover has been maintained below the target rate.
We continue to engage our workforce and implement initiatives to achieve our long-term goal of improving collaboration and workplace innovation. Employee engagement initiatives are organised throughout the year to forge stronger bonds among employees and enhance communication between management and staff.
Commitments & Targets
• Continue to promote diversity and equal opportunity in the workplace.
• Further develop our workforce through tech-enabled and self-paced training programmes.
Learning & Development
To encourage and support our employees to develop their fullest potential and have a fulfilling career, the Group places priority on learning and development programmes. Our learning and development roadmap also accounts for future skills required to improve the efficiency of the business. We customise and design training and development activities based on employees’ training needs and work requirements. During the financial year ended 31 December 2018, the Group have spent close to RM217,316 (2017: RM277,094) on training across all our subsidiaries. The Group will continue to provide trainings and education opportunities through comprehensive development programmes going forward and promote a conducive corporate environment where everyone could achieve their potential.

35ADVANCE SYNERGY BERHAD | annual report 2018
Male Female
Bus-BodyFabrication
Travel &Tours
PropertyDevelopment
ICT
Hotels &Resorts
Others
59%
63%
69%
24%
93%
57%
41%
36%
31%
76%
7%
43%
Distribution by Divison & Gender (%)
The Group also believe that hiring from local communities enhances our ability to understand local needs and strengthen our capabilities on the ground. The Group offers graduate placement programmes, industrial training and internship in our hotels and resorts, bus-body fabrication as well as ICT divisions.
Our hotels and resorts division gives first preference to local workforce in the locat ion where it operates. Our hotels have been very supportive in providing industrial training experience to undergraduates from the colleges or higher institutions, both local and abroad, to undergo their internship programmes and is proud to note the overwhelming responses especially from the hospitality colleges/universities in wanting to send their top-notch undergraduates for the internship programme with Holiday Villa. The hotels and resorts division are also proactively engaged in the delivery of career counselling sessions to the school students especially on the opportunities available in the hotels and resorts industry and collaborated with the Polytechnics Education Division and Ministry of Higher Education in developing or assessing its community programmes.
Others 0.9%
Indian 4.1%
Bumiputera66%
Chinese29.1%
OthersIndianChineseBumiputera
Embracing Diversity In Workforce
60 Above40-59<40
Bus-BodyFabrication
Travel &Tours
PropertyDevelopment
ICT
Hotels &Resorts
Others
63% 33% 4%
21% 63% 16%
60% 35% 5%
31% 55% 14%
57% 36% 7%
68% 32%
Distribution by Divison & Age (%)
Workforce Diversity & Inclusion
We believe that people should have access to the same opportunities regardless of their ethnicity, religion, gender, marital status or age. We value diversity and inclusion and are commit ted to the principle of equal employment opportunity. Our hiring policies ensure equal employment opportunities for all. New hires are considered based on individual competencies as well a s or g a nisat iona l a nd job f it . Ou r employment statist ics illustrate the following diversity of our workforce. As at 31 December 2018, 36.7% of our employees are female.
Sustainability

36
Workforce Diversity & Inclusion (continued)
We believe in developing local talents to assume management positions. As of 31 December 2018, more than 90% of our senior management across our business divisions are local.
Code of Business Conduct and Ethics
We maintain a zero tolerance for unethical labour practices such as child labour, forced labour, slavery and human trafficking in all our operations. All employees are required to conduct business dealings in line with our Code of Business Conduct and Ethics Policy. We encourage declaration of conflict of interest on an annual basis as a preventive safeguard for fair dealings and transparent business relationships.
Compliance with Applicable Employment Laws & Regulations
During the period under review, there were no incidents of non-compliance with the applicable employment laws and legislations which include among others the requirements as set out in Table 2 below.
Compliance
Employment Act 1955Industrial Relations Act 1967
Table 2. Employment Compliance Requirements in Malaysia
The Group strive to continuously cultivate a transparent and inclusive environment for all employees, as well as ensure a top-down approach to promote fair and ethical business dealings. We also have an open-door policy whereby employees are encouraged to speak-up or report grievances directly to their superior, head of department, human resource department, chief executive officer and/or independent directors of the Company. This is to reinforce our commitment to our employees to provide them with a workplace that is healthy, safe and secure. Across our businesses worldwide, there were no grievance cases reported in 2018.
HEALTH & SAFETY MANAGEMENT
The Group remains committed to maintaining a safe and productive environment, free from harassment in which all individuals are treated with respect and dignity and we expect all our employees and individuals that work at our sites to follow our health and safety policies and procedures and be free from substance abuse at all times.
Sustainability

37ADVANCE SYNERGY BERHAD | annual report 2018
HEALTH & SAFETY MANAGEMENT (continued)
Our employees and partners are assured of a safe working environment through our Health & Safety and Environment Management system (“HSEMS”). While the HSEMS serves as a point of reference, additional measures have been taken to cultivate a safety-first culture through various initiatives.
Processes and systems are in place to identify, mitigate and report risks and communicate best practices across the Group, and we work with our contractors and subcontractors to ensure that they understand our requirements and expectations.
In 2018, there was no incident of fatalities across the Group’s operations.
Commitments & Targets
• Strive to raise awareness, maintain v igilance and foster a strong HSE-centric culture across the Group and part icularly at the ground level.
• Maintain a zero tolerance to health and safety.
• Leverage technology to drive improvements in safety performance.
We have a Health and Safety Committee to ensure that the Group complies with the Occupational Safety and Health Act, 1994.
Our hotels and resorts division has set a quantifiable target relating to employee occupational health and safety where it is compulsory for all its employees to attend occupational health and safety trainings. Since its implementation, at least 75% of workers of hotels and resorts division have undergone the safety and health training during the year.
To ensure construction safety at the project sites, our tender process and awarded contracts with contractors incorporates the required compliance to Malaysia’s safety-at-work legislation which include the Factories and Machinery (Building Operations and Works of Engineering Construction) (Safety) Regulations 1986. With regard to workers employed at the construction sites, our main contractors are obligated to comply with all safety, health and welfare regulations pertaining to them.
In 2018, both the Loss Term Injury and Loss Time Accidents at Group level were zero. The Group strives to continue maintain its health and safety standards and drive continuous improvement in our occupational, health and safety performance.
Sustainability

38
NURTURING COMMUNITIES
CORPORATE SOCIAL RESPONSIBILITY
Support initiatives to promote the social development of local communities where we operate
ASB is committed to uphold and to honour our social obligations by contributing to the economic and social wellbeing of every community in which we operate. We also believe in the importance of providing opportunities especially to the younger generation, for the betterment of our society.
The Group participates in the ACHIEVE Corporate Social Responsibility (“CSR”) Programme (“ACHIEVE”) which aims to pool and focus the efforts and resources of the Group with like-minded corporations that share the common desire to support and implement meaningful CSR activities. The ACHIEVE Committee was formed with representatives from various divisions of our Group participating as committee members, to spearhead CSR activities via synergy collaboration with identified organisations. In our yearly programmes, our hotels and resorts division also participate in various community projects for the unfortunate, such as, contributing either financially or in-kind to various non-profit organisations, orphanage homes and under-privileged families.
Remaining eco-friendly in our daily operations
We recognise the importance of good environmental management or preservation practices to minimise disruption to the environment in the communities we operate in to sustain growth. In our daily operations, the Group continues to be committed on recycling, energy-saving practices and undertaking measures to reduce wastages, pollution and harmful emissions. We shall continue to expand and adopt our sustainable environment management practices and efforts in our business operations and strive to influence that of stakeholders in our value chain.
Sustainability

39ADVANCE SYNERGY BERHAD | annual report 2018
Risk Management
The Board is responsible for creating the framework forthe Group’s Risk Management Committee (“RMC”) to operate effectively. This risk management framework includes risk assessment, response, communication and governance. All this is set in place to identify the optimum operating condition in order to achieve the Group’s strategic objective and to provide reasonable assurance that internal controlsare effective.
RISK MONITORING
RISKMANAGEMENT
PROCESSES
• Monitoring mitigation actions and their impact (so as to improve the effectiveness of controls and improve the residual risk rating)
• Monitoring changes to our business and the external environment, to ensure we have sight of and respond appropriately to emerging risks
RISK REPORTING
Reporting of the status of material risks up through the management chain to the next organisational level, to provide assurance that business risks are being appropriately managedand controls in place are effective from the nature
RISK PLANNING
Assigning responsibility for risk management implementation, planning the approach and capturing this information in a Risk Management Plan (RMP)
RISK MITIGATION
Identifying controls that will reduce material risks to a target risk rating aligned with our risk appetite, and implementing cost-effective mitigation and contingency actions that improve the effectiveness of controls
RISK ANALYSIS
Assessing the level of inherent and residual risk exposure, based on an assessment of the probability of an identi�ied risk materialising and the impact if it does using a standard risk scoring system, taking into account effectiveness of current controls
RISKIDENTIFICATION
Identifying risks associated with achievement of our business objectives. Includes potential risks from external factors arising from the environment with which we operate, and internal risks arising from the nature of our business
CORPORATE RISKREPORTING TOOL
OVERSIGHT &ACCOUNTABILITY
COMPLIANCEASSURANCE
IDENTIFYING AND MANAGING RISK
The management of risk is embedded in our culture and it is the responsibility of each employee to ensure that this culture is built into our working practices. Specifically day-to-day management of risk is delegated by the Board to senior executives across the firm, through appropriate committees, systems and controls.
Whilst encouraging an entrepreneurial and commercial culture that is focused on generating value for our clients, the Board actively seeks to ensure all relevant risk exposures are managed and mitigated. Note 38 to the Financial Statements describes how the Group manages the financial risks faced in the normal course of business. The Board receives input from other key committees along with the framework employed by the Group to manage the risks. The risk management framework covers 6 broad processes as illustrated in the chart with corporate risk reporting tool, oversight & accountability and compliance assurance.

40 Risk Management
IDENTIFYING AND MANAGING RISK (continued)
We are subject to the same general risks as many other businesses; for example, changes in general economic conditions, currency and interest rate f luctuations, changes in taxation legislation, cyber-security breaches, failure of our IT infrastructure, the cost of our raw materials, the impact of competition, political instability and the impact of natural disasters.
For the purpose of this Statement, the Group means the Company and its subsidiaries, excluding its joint ventures and associate companies. This Statement does not cover the joint ventures and associate companies as the Company does not have full control over the operations, management and internal control system of these companies. However, we may have Board representation on the Boards of these companies.
Our Risk Strategy
The Board is responsible for creating the framework for the Group’s RMC to operate effectively. This risk management framework includes risk assessment, response, communication and governance. The Board is also responsible for ensuring t hat appropr iat e a nd propor t ionat e resources are allocated to risk management activities.
Our Risk Management Framework
Under the RMC, we have a structured risk management framework throughout the Group.
This includes a standard set of r isk categories, generic risk descriptions and scoring methodology, together with a process to analyse and manage risk. All our subsidiaries use this framework to identify and document their specific risks.
We r a n k r isk s in a R isk Reg is t er by combining their economic, operational or environmental impact and the likelihood that they may occur. We do this both before and after we identify the controls we have in place to mitigate each risk. Those risks that pose the greatest threat to our business and score the highest, prior to mitigation, are identified as key risks. All our people are responsible for managing risk. By using a common framework, we are able to view risk from both a top-down and bottom-up perspective and so ensure it is considered and managed at every level of our business. Our safety, health, and environmental risks are reviewed and considered monthly by our respective Risk Management Unit.
Our Key Risks
Risks affect every area of our business. Their nature and potential impact changes constantly but through our regular reviews we identify risks that could impact our strategy and allow us to set up controls to mitigate their effects. We categorise our risks into the following areas:
• Strategic risks that could prevent us from achieving our strategic objectives.
• Operat iona l r isk s which, i f not successfully managed, would threaten our viability. These relate to our ability to operate a sustainable and safe business.

41ADVANCE SYNERGY BERHAD | annual report 2018 Risk Management
Our Key Risks (continued)
• Financial risks relating to the funding and fiscal security of the Group.
• Compliance risks which could affect our compliance with regulations and law, and/or our ‘licence to operate’ in society.
We have listed below the key risks that may affect our business, although there are other risks that may occur and impact the Group’s performance.
Strategic risks Strategy for risk management
Conditions in the global economy, economic fluctuations and volatility and cyclicality of say, the global travel and tours markets may adversely affect the results of the Group.
The Group maintains a balanced portfolio of products serving a wide range of end markets around the globe. Segment performance at business unit level is closely monitored and corrective actions are taken as necessary.
The markets in which the Group operates are highly competitive and the Group may lose market share to other competitors.
The Group continues to invest in existing and new products through research and development (“R&D”).
The Group continues to invest in new facilities to allow the Group to maintain its key market positions.
The Group strengthens its regional position and growth through alliances and collaborations.
T he Group oper at es qua l it y ma nagement systems, such as The International Organisation for Standardisation (“ISO”) and ADRs for our bus-body fabrication unit, to ensure products meet customers’ agreed standards.
The Group maintains a strong and good working relationship with our suppliers and customers to ensure support and regular customer feedback to enhance our products and services.

42
Our Key Risks (continued)
Strategic risks (continued) Strategy for risk management (continued)
The Group’s strategic plan involves significant change management, including cost-effective reforms, joint ventures and tie up with foreign parties to enhance market posit ions and provide new technologies.
Strategic projects are managed in a structured framework which includes formal identification of risks. The Group has extensive experience of change management and making use of external specialist advice as required.
The ability of the Group to compete is highly dependent on its ability to develop technological innovations, to introduce new products and to protect its intellectual property, trade secrets and know-how.
The Group continues to invest in existing and new technologies through R&D.
The ongoing success of the Group is dependent on attracting and retaining high quality senior management and staff who can effectively manage the Group’s operations.
The Group offers competitive compensation packages with annual bonus and long-term incentive arrangements for key employees. Appropriate notice periods and non-compete clauses are used to mitigate short-term risk for key positions.
As a multi-national enterprise, the Group could suffer losses of intellectual property and other assets through theft or fraud which could be significant.
The Group maintains controls both to detect and prevent theft and fraud as appropriate to the nature of the risk.
Risk Management

43ADVANCE SYNERGY BERHAD | annual report 2018
Our Key Risks (continued)
Operational risk (continued) Strategy for risk management (continued)
The failure of the Group to procure key raw materials may lead to production interruptions, and volatility in the prices of such raw materials and energy prices may adversely affect the profitability of the Group and its working capital position.
Sourcing strategies are in place Group-wide to access multiple sources for key raw materials and the Group works closely with key suppliers to ensure availability. The Group looks to identify alternative raw materials where possible.
The Group actively manages margins and recovers input cost increases from customers. The Group implements measures for proactive cost management, streamlining of production process and high impact cost and efficiency awareness for all its employees.
The failure or loss of a key production a s s e t , p r o c e s s , i n f o r m a t i o n o r commu nic at ion s ys t em, whet her temporarily or permanently could occur, directly or otherwise, through natural disasters, epidemic, industrial action, sabotage or the like, and would have an adverse impact on operations.
Crisis management procedures are in place for all subsidiaries. These are reviewed and updated regularly.
The Group invests in its infrastructure to ensure appropriate levels of resilience in the event of temporary failures in IT systems. Backups and disaster recovery plans are in place for critical systems and processes.
Compliance risk Strategy for risk management
The Group may be liable for damages based on product liability claims brought against its customers in end-use markets.
Technically qualified personnel and control systems are in place around the Group to ensure products meet certification standards.
C o m p l i a n c e w i t h e x t e n s i v e environmental, health and safety laws and regulations could require material expenditure, changes in the operations of the Group or site remediation.
Detailed safety, health and environmental processes are documented in operat ing guidance which is updated and communicated to staff on a regular basis.
Risk Management

44
Our Key Risks (continued)
Compliance risk (continued) Strategy for risk management (continued)
The Group could suffer substantial penalties, damage to reputation and other sanctions for any failure to control anti-competitive behaviour, such as bribery and corruption, or ineffective compliance with local and national legislation.
A l l o u r k e y e m p l o y e e s a f f i r m t h e i r understanding of the code of business conduct covering corrupt and anti-competitive business practices. Malpractice reporting is similarly covered in the Group policy on protecting our reputation. Training is provided regularly.
Our Group constantly monitors new laws and regulations and assess the impact to our Group businesses. To manage and track compliance issues, the Group appoints compliance officers and conducts internal audits.
Financial risks Strategy for risk management
A significant proportion of the Group’s turnover and assets are in currencies other than Ringgit Malaysia and fluctuations in currency exchange rates may significantly impact the results of the Group and may significantly affect the comparability of financial results between financial periods.
The Group has a policy of hedging all significant foreign exchange transactional exposure at operating company level. There is also a natural hedging process at operating subsidiaries as they source their resources locally in countries where they operate.
The Group’s balance sheet and cash flow, and also credit market conditions and credit ratings, may restrict the ability of the Group to obtain credit facilities or to refinance its existing debt facilities in the longer term. In addition, interest rate fluctuations and increases in bank lending margins may increase the Group’s costs of borrowing.
The Group closely monitors its operating cash flow and capital expenditure on a monthly basis and regularly reviews covenant compliance.
The Group has policy on leverage limits and has adequate headroom on a twelve month forecast basis.
Interest rate risk is managed through the use of interest rate hedging by a combination of loans with fixed and variable interest rates and the tenure of the loans.
Risk Management

45ADVANCE SYNERGY BERHAD | annual report 2018
Our Key Risks (continued)
Below are some key areas reviewed by the Group in 2018:
1. Business Strategy Gap
In maintaining its competitiveness and resilience in the diversified industries that it operates in, the Group focuses on the performance of its subsidiaries and investments by close monitoring and evaluation, allocation of resources and funding to meet its strategic goals. In the review, the Group examined and monitored the controls which are in place to ensure that they are robust to mitigate the risk.
2. Increased Costs and Inefficiencies
Increasing cost in 2018 is one major factor which may affect the Group’s business and operation and the Group regularly reviews its operations to address any inefficiency that may exist in pockets of the operations.
3. Revenue Gap
The Group reviewed factors which may affect the risk of revenue gap such as competition, economic slowdown and dependence on a few key customers and ensured that the controls put in place within the Group are effective. The assessment included whether to terminate the risk through cessation of business or discontinuation of non-performing product lines or market segments.
4. Non-Compliance
Non-compliance is another key risk area reviewed as the Group operates in many countries and in regulated industries.
5. Human Capital Gap
During the year, the Group focused on addressing the risk of capacity and competency gaps to meet the Group’s human capital requirements. Without addressing this risk, execution of plans and init iat ives towards achieving targets or goals may be impaired. Proper planning, skill development, relevant training and timely performance review are implemented periodically. This is an on-going effort to optimise the full potential of the Group’s biggest asset.
INTERNAL CONTROL SYSTEM
The internal control system focuses on key financial reporting, operational and compliance controls. The system encompasses the policies, processes and activities that contribute to the reliability of financial reporting, the effectiveness and efficiency of operations and compliance with laws and regulations. The internal audit function has operated independently since 2004 reporting to the Audit Committee.
Each year improvements are implemented to the internal audit reviews including its objectives, scope and procedures to enhance effectiveness.
Risk Management

46
INTERNAL CONTROL SYSTEM (continued)
The processes which the Board has applied in reviewing the adequacy and effectiveness of the Group’s system of internal control includes:
• Rigorous review of the quarterly financial results and reports and evaluat ing the reasons for unusual variances noted thereof by the Board and Audit Committee;
• The Group Managing Director closely monitors the business and operations of the Group and reports to the Board on significant changes in the business and external environment which affect the operations of the Group at large; and
• The Board has in place an organisational structure with formally defined lines of responsibility, proper segregation of duties and delegation of authority. A process of hierarchical reporting has been established which provides for a documented and auditable trail of accountability. The procedures include the establishment of limits of authority and policies on health and safet y, training and development, equality of opportunity, staff performance and serious misconduct. These procedures are implemented across the Group to provide continuous assurance to senior management and finally to the Board.
INTERNAL AUDIT FUNCTION
The internal audit adopts a risk-based approach in developing its audit plan based
on the Group’s key risks profile. Internal audit plan and the scope of the internal audit are presented and approved by the Audit Committee on a yearly basis.
The Group’s internal audit function is performed by the Internal Auditors (outsourced professional internal audit company) who are independent of the activities audited by them. The principal role of the internal audit function is to review the Group’s operations, evaluating their efficiency, effectiveness and compliance with corporate policies, procedures, laws and regulations.
In 2018, the Internal Auditors executed the approved audit plan and performed the following:
• Internal controls review on majority of the Group’s operating units for the functions of Cost Management, Credit and Cash Management as well as other operating processes such as Procurement and Production.
• Compliance review on operating units which are required to comply with guidelines and acts issued by external regulatory bodies.
• Reviewed the control procedures taken by the management on recurrent related party transactions.
• Followed-up on the implementation of corrective action plans agreed by management.
Risk Management

47ADVANCE SYNERGY BERHAD | annual report 2018
INTERNAL AUDIT FUNCTION(continued)
In 2018, the Internal Auditors executed the approved audit plan and performed the following: (continued)
• Issued reports on the results of the internal reviews, identifying weaknesses with suggested recommendations for improvements to management for further action.
• Tabled internal audit reports at the Audit Committee meeting on a quarterly basis.
The internal audit function provides assurance of the effectiveness of the internal control system within the Group to ensure that risks are adequately managed and controlled.
Internal audit performs risk assessment, operational and system review as part of the audit activities. The areas of audit coverage are based on areas of high risk that are independently assessed. All audit findings are deliberated and resolved with the management of the subsidiaries. Follow-up reviews will subsequently be performed to ascertain the effectiveness of the recommended mitigation efforts.
The Audit Committee reviews the internal audit issues identified and recommendations made by the Internal Auditors on a regular basis, in addition to the recommendations made by the external auditors during the annual statutory audit.
REVIEW OF ADEQUACY AND EFFECTIVENESS
The RMC has reviewed and reported to the Board the adequacy and effectiveness of the Group’s risk management system, including the Group’s risk tolerance and the enterprise-wide risk governance framework. The Audit Committee has reviewed and reported to the Board the adequacy and effectiveness of the system of internal controls operate d by the Group for the year 2018 and up to the date of its last meeting prior to the date of the Annual Report. The Board considers the system of internal controls described in this Statement to be satisfactory and the risks to be at an acceptable level within the context of the Group’s business environment. The Board has received assurance from the Group Managing Director and Senior Finance Manager of the Company that the Group’s risk management and internal control system for the current Group’s business environment is operating adequately and effectively, in all material aspects, based on the risk management framework adopted by the Group.
The Board and the management of the Group will continuously take measures to strengthen and monitor the internal control framework and environment implemented by the Group. For the financial year under review, the Board is satisfied that the system of internal controls is satisfactory and there are no material losses incurred during the current financial year as a result of weaknesses in internal control.
Risk Management

48
REVIEW OF THE STATEMENT BY EXTERNAL AUDITORS
The external auditors had reviewed this statement on risk management and internal control for inclusion in the Annual Report for the financial year ended 31 December 2018 and reported to the Board that nothing has come to their attention that caused them to believe that this Statement is not prepared in all materials aspects in accordance with the disclosures required under paragraphs 41 and 42 of the Statement on Risk Management and Internal Control (Guidelines for Directors of Listed Issuers) nor is it factually inaccurate.
AAPG 3, Guidance for Auditors on the Engagements to Report on the Statement on Risk Management and Internal Control included in the Annual Report issued by the Malaysian Institute of Accountants does not require the external auditors to consider whether the Directors’ statement on risk management and internal controls covers all risks and controls, or to form an opinion on the adequacy and effectiveness of the Group’s risk management and internal control procedures including the assessment and opinion by the Board and management thereon. They are also not required to consider whether the processes described to deal with material internal control aspects of any significant problems disclosed in the Annual Report will in fact remedy the problems.
Risk Management

49ADVANCE SYNERGY BERHAD | annual report 2018
CORPORATE GOVERNANCE
Contents
Our Corporate Information 50
Our Board 51
Our Company Secretary 58
Our Key Management 59
Our Group Senior Management 60
Governance 67
Audit Commitee Report 74
Nomination Committee Report 78
Remuneration Committee Report 82
Directors’ Responsibility Statement 86
Additional Compliance Information 87

50
Our Corporate InformationBOARD OF DIRECTORS
AUDIT COMMITTEE
NOMINATION COMMITTEE
REMUNERATION COMMITTEE
RISK MANAGEMENT COMMITTEE
COMPANY SECRETARY Ho Tsae Feng (MAICSA 7028522)
PRINCIPAL BANKERS Affin Bank Berhad CIMB Bank Berhad
STOCK EXCHANGE LISTING Main Market of Bursa Malaysia Securities Berhad WEBSITE www.asb.com.my
REGISTERED OFFICE SHARE REGISTRAR AUDITORS
Level 3, East Wing, Wisma SynergyNo. 72, Pesiaran Jubli PerakSeksyen 22, 40000 Shah AlamSelangor Darul EhsanTel : 03-5192 8822Fax : 03-5192 8811
Sectrars Management Sdn BhdLot 9-7 Menara Sentral VistaNo. 150 Jalan Sultan Abdul SamadBrickfields50470 Kuala LumpurTel : 03-2276 6138/ 6139/ 6130Fax : 03-2276 6131
Baker Tilly Monteiro Heng PLTChartered AccountantsBaker Tilly TowerLevel 10, Tower 1, Avenue 5Bangsar South City59200 Kuala LumpurTel : 03-2297 1000Fax : 03-2282 9980
Dato’ Ahmad Sebi BakarGroup Chairman
Anton Syazi Dato’ Ahmad SebiGroup Executive Deputy Chairman
Lee Su NieGroup Managing Director
Puan Sri Datin Masri Khaw AbdullahNon-Independent Non-Executive Director
Yong Teck MingIndependent Non-Executive Director
Rali Mohd NorIndependent Non-Executive Director
Aryati Sasya Dato’ Ahmad SebiNon-Independent Non-Executive Director
Kam Kin FoongIndependent Non-Executive Director
Yong Teck MingChairman
Rali Mohd NorMember
Kam Kin FoongMember
Yong Teck MingChairman
Aryati Sasya Dato’ Ahmad Sebi Member
Kam Kin FoongMember
Rali Mohd NorChairman
Puan Sri Datin Masri KhawAbdullah Member
Kam Kin FoongMember
Rali Mohd NorChairman
Puan Sri Datin Masri KhawAbdullah Member
Kam Kin FoongMember

51ADVANCE SYNERGY BERHAD | annual report 2018
Our Board
D a t o ’ A h m a d S e b i B a k a r i s a N o n -Independent Non-Executive Director and the Group Chairman of Advance Synergy Berhad. He was appointed to the Board on 9 April 1991 and redesignated from Executive Chairman to Group Executive Chairman on 28 September 2012. On 1 September 2017, he was redesignated to Non-Executive Group Chairman.
Dato’ Ahmad Sebi holds a Bachelor of Arts (Hons) from the University of Malaya, Kuala Lumpur, a Diploma in Journalism from the Thomson Foundation, United Kingdom and a Master of Arts from Michigan State University, United States of America.
He was the Editor of the Malay Mail, a member of the New Straits Times Press Group from 1976 to 1982 and subsequently the Group Editor of Berita Harian from 1983 to 1986. From 1986 to 1989, he was the Managing Director of Sistem Televisyen Malaysia Bhd and a director of the New Straits Times Press Group from 1988 to 1989.
He was also the Non-Executive Chairman of Unified Communications Holdings Limited (now known as Captii Limited), an indirect subsidiary of Advance Synergy Berhad which is listed on the Singapore Exchange Securities Trading Limited, from December 2003 to June 2006. Besides, he had held both the positions as Executive Chairman and Managing Director of Kumpulan Powernet Berhad from 12 January 2002 to 28 August 2015.
He was conferred the Ahli Mangku Negara (A.M.N.) by the Yang Di-Pertuan Agong, DYMM Tuanku Haji Ahmad Shah Al-Mustain Billah Ibni Almarhum Sultan Abu Bakar in 1983, the Justice of Peace (J.P.) by DYMM Sultan Azlan Muhibbuddin Shah Ibni Almarhum Sultan Yusoff Izzuddin Shah Ghafarullah, Sultan of Perak, in 1986 and the Dato’ Setia Diraja Kedah (D.S.D.K.) by DYMM Tuanku Alhaj Abdul Halim Mu’adzam Shah Ibni Almarhum Sultan Badlishah, Sultan of Kedah, in 1988.
Dato’ Ahmad Sebi Bakar Group Chairman (age 71)

52 Our Board
Dato’ Ahmad Sebi Bakar (continued)
He is ac t ively involved in soc ia l a nd charitable work and is the Chairman of several non-profit organisations, namely, the privately funded Orphanage Foundation of Malaysia (YATIM) and in the past the Bosnia Action Front, Malaysia. He was also the President of the Malaysian National Writers Association (PENA) from 1992 to 2008.
D a t o ’ A h m a d S e b i i s a s u b s t a n t i a l shareholder of Advance Synergy Berhad. He is also a substantial shareholder and a director of Suasana Dinamik Sdn Bhd and Bright Existence Sdn Bhd, companies that are also substantial shareholders of Advance Synergy Berhad.
Except for his daughter, Sasya who is a Non-Independent Non-Executive Director and his son, Anton, who is the Group Executive Deputy Chairman, Dato’ Ahmad Sebi does not have any family relationship with any other director or major shareholder of Advance Synergy Berhad. And he has no conflict of interest with Advance Synergy Berhad.
Dato’ Ahmad Sebi has not been convicted for any offences within the past 5 years and no public sanction or penalty has been imposed by the relevant regulatory bodies during the financial year.
Mr Anton Syazi Dato’ Ahmad Sebi, was appointed to the Board on 27 February 2017 and was subsequently redesignated as Executive Deputy Chairman on 1 September 2017.
Anton graduated from the London School of Economics, University of London, with a Bachelor of Science in Economics. He has a Master of Arts in Finance and holds an Investment Management Certificate awarded by the UK Society of Investment Professionals.
Anton is also Group Executive Director of Captii Limited (“Captii”), a 58.3%-owned subsidiary of Advance Synergy Berhad and Chairman of Captii Ventures Pte Ltd, a
Captii subsidiary. He has been a member of the Captii Board since 22 June 2006 and was previously Group Chief Executive Officer of Captii from 10 August 2010 to 31 August 2017 and Group Deputy Chief Executive Officer from December 2005 to 9 August 2010.
Anton sits on the Board of various other subsidiary, associate and joint venture companies of the Group and has been a Non-Executive Director of SJ Securities Sdn Bhd since 20 September 2005.
Prior to joining Advance Synergy Berhad in June 2001, Anton was with the South East Asia Investment Banking Division of Credit Suisse First Boston.
Anton Syazi Dato’ Ahmad SebiGroup Executive Deputy Chairman (age 41)

53ADVANCE SYNERGY BERHAD | annual report 2018 Our Board
Ms Lee Su Nie is a Non-Independent Director and the Group Managing Director of Advance Synergy Berhad. She was appointed to the Board on 9 July 2007 and redesignated from Executive Director/Chief Executive Officer to Group Managing Director on 28 September 2012.
Su Nie holds a Bachelor of Commerce (Accounting) degree from the University of Birmingham, United Kingdom and a Master of Science (Business Administration) from the University of Bath, United Kingdom. She is also a Fellow Member of The Association of Chartered Certified Accountants, United Kingdom.
In 1985, she joined Kassim Chan Management Consultants Sdn Bhd, where she provided management consultancy services. She joined the Corporate Finance Department of Rakyat Merchant Bankers Berhad in 1989. In 1991, she left Rakyat Merchant Bankers Berhad to join Perdana Merchant Bankers Berhad. She subsequently left her position
as First Vice President, Corporate Finance of the Bank to join Advance Synergy Berhad in 1995 as Assistant General Manager, Corporate Planning & Finance. She was subsequently appointed the Group General Manager, Operations of Advance Synergy Berhad prior to her appointment as Chief Executive Officer on 22 April 2004.
She is a Non-Independent Non-Executive Director of Captii Limited, an indirect subsidiary of Advance Synergy Berhad which is listed on the Singapore Exchange Securities Trading Limited. She also sits on the Board of other subsidiaries and associate companies of Advance Synergy Berhad.
She does not have any family relationship with any director and/or major shareholder of Advance Synergy Berhad nor has she any conflict of interest with Advance Synergy Berhad. She has no convictions for any offences within the past 5 years and no public sanct ion or penalt y imposed by the relevant regulatory bodies during the financial year.
Lee Su NieGroup Managing Director (age 58)
Anton Syazi Dato’ Ahmad Sebi (continued)
He does not have any family relationship with any director and/or major shareholder of Advance Synergy Berhad, nor has he any conflict of interest with Advance Synergy Berhad, except that his father, Dato’ Ahmad Sebi, is the Group Chairman and substantial shareholder of Advance Synergy Berhad. Anton is a director of Bright Existence Sdn Bhd and Suasana Dinamik Sdn Bhd,
subs t a nt ia l sha reholder s of Adv a nce Synergy Berhad. His father, Dato’ Ahmad Sebi, is also a substantial shareholder and director of Bright Existence Sdn Bhd and Suasana Dinamik Sdn Bhd. His sister, Sasya, is also a Non-Independent Non-Executive Director of Advance Synergy Berhad. Anton has had no convictions for any offences within the past 5 years and no public sanction or penalty imposed by the relevant regulatory bodies during the financial year.

54
Puan Sri Datin Masri Khaw Abdullah is a Non-Independent Non-Executive Director of Adv a nce Sy ner g y Berhad . She wa s appointed to the Board on 6 January 1995.
Puan Sri Datin Masri was one of the first Asians to complete the General Manager’s Programme at the Holiday Inn University in Memphis, USA in 1976. In 1982, she completed a summer course on Hotel Development & Design at Cornell University, USA and had undergone Hotel training in Singapore and Canada.
She was awarded the Best Marketing Person of the Year for Holiday Inn Hotels Asia Pacific in 1985. Puan Sri Datin Masri played a key role when Antara Holiday Villas Sdn Bhd garnered several awards namely, the Special Award for Quality Management in the Industry Excellence Award 1997 (organised by the Ministry of International Trade and Industr y and received this prestigious award from the former Prime Minister Tun Dr. Mahathir Mohamad on 18 December 1997), the National HR Excellence Award 2004 and the Industry Excellence Award 2005 – Export Excellence (Services). Her experience in the hotel industry dates
back to 1969 and she has since contributed significantly to the development of new hotels. She was the co-founder of Holiday Villa chain in 1987 with the opening of the 1st Holiday Villa Cherating.
She is presently the Managing Director and Chief Executive Off icer of Antara Holiday Villas Sdn Bhd and Holiday Villas International Limited, subsidiaries of Advance Synergy Berhad. She also sits on the Board of other subsidiaries and an associate company of Advance Synerg y Berhad, including Cherating Holiday Villa Berhad, which is a non-listed public company.
Puan Sri Datin Masri is a member of the Remuneration Committee and Nomination Committee of Advance Synergy Berhad.
She does not have any family relationship with any director and/or major shareholder of Advance Synergy Berhad, nor has she any conf lict of interest with Advance Synergy Berhad. She has no convictions for any offences within the past 5 years and no public sanction or penalty imposed by the relevant regulatory bodies during the financial year.
Our Board
Mr Yong Teck Ming was appointed to the Board on 9 July 2007. He is an Independent Non-Executive Director of Advance Synergy
Berhad. He also serves as Chairman of the Audit Committee and Risk Management Committee.
Yong Teck MingIndependent Non-Executive Director (age 65)
Puan Sri Datin Masri Khaw Abdullah Non-Independent Non-Executive Director (age 66)

55ADVANCE SYNERGY BERHAD | annual report 2018 Our Board
Yong Teck Ming (continued)
He holds a Bachelor of Commerce Degree from the University of Auckland, New Zealand. He is a member of Chartered Accountants Australia, New Zealand and a member of the Institute of Chartered Secretaries and Administrators, United Kingdom.
Teck Ming started his career in New Zealand in 1973 and worked in several accounting positions before returning to Malaysia in February 1979. From March 1979 to January 1995, he served in various positions in the
Berjaya Group of Companies including as Group Executive Director from February 1988 until January 1995. He currently sits on the Boards of several private limited companies.
He does not have any family relationship with any director and/or major shareholder of Advance Synergy Berhad, nor has he any conflict of interest with Advance Synergy Berhad. He has had no convictions for any offences within the past 5 years and no public sanction or penalty imposed by the relevant regulatory bodies during the financial year.
Rali Mohd NorIndependent Non-Executive Director (age 65)
Mr Rali Mohd Nor is an Independent Non-Executive Director of Advance Synergy Berhad. He was appointed to the Board on 10 March 2016.
R a l i h o l d s a M a s t e r o f B u s i n e s s Administrat ion (Finance) from Brunel Universit y, United Kingdom, Advance Post Graduate Diploma in Management Consultancy from Henley Business School, University of Reading, United Kingdom, Diploma in Management (Merit) from Malaysian Institute of Management, Kuala Lumpur and Diploma in Syariah (Merit) from University of Malaya, Kuala Lumpur.
He was formerly the Managing Director and Chief Executive Officer of Proton Parts Centre Sdn Bhd, a subsidiary of PROTON Hold ing s Berhad s ince 2003 u nt i l h is retirement in February 2015. Prior to that, he was the Chief Finance Officer of Proton Parts Centre Sdn Bhd for more than 10 years. He joined PROTON in 1985 as a Production Planning Manager and progressed to serve in International Business Division as a Senior Manager of Parts Business for 6 years. He started his career in Dunlop Malaysian Industries Berhad in 1977 as a Management Trainee and later on served as Planning Superintendent in the Planning Department. He has worked in Dunlop for 8 years before joining PROTON.

56 Our Board
Ms Aryati Sasya Dato’ Ahmad Sebi is a Non-Independent Non-Executive Director of Advance Synerg y Berhad. She was appointed to the Board on 7 March 2013.
Sasya holds a Bachelor of Commerce from Deakin University, Australia, a Diploma in Economics from La Trobe University, Melbourne and a Master of Finance from RMIT University, Melbourne.
She worked at SJ Securit ies Sdn Bhd, Malaysia as a Research Analyst before joining the retailing industry in 2002. F r o m l a t e 20 02 t o 20 0 5 , s h e e n t e r e d t he ret a i l indu s t r y a nd u nder t ook a c o n s u l t i n g p o s i t i o n w i t h a l o c a l specialised men’s retailer in Melbourne where she was responsible for the day-to-day management of the company as well as preparing sales and market forecasting
for the board of directors. Within the same period, she was appointed as a Director of Tantalum Australia NL, now known as ABM Resources NL, a public listed company in Australia. During her time at ABM Resources NL, she gained considerable knowledge of the mining sector as well as expanded her financial analysis skills to include some technical analysis of the commodities sector. She resigned from the Board in 2006.
Presently, she continues to be involved in the corporate industry in a consulting capacity. She has over 9 years’ experience in corporate management and finance in various companies ranging from hospitality, mining to manufacturing. She also sits on the board of various companies incorporated in Malaysia and overseas.
Aryati Sasya Dato’ Ahmad Sebi Non-Independent Non-Executive Director (age 44)
Rali Mohd Nor (continued)
He is a Fellow Member of the Institute of Leadership and Management, United Kingdom. He is also a member of the Chartered Institute of Marketing, United Kingdom, the Malaysian Inst itute of Management, Malaysia and the Harvard Business School Alumni Club of Malaysia. He ha s at t ended Senior Ma nagement Development Program at Havard Business School Alumni Club of Malaysia and Advance Management Program at Henley Business School.
Rali is a member of the Audit Committee. He is also the Chairman of the Nomination Committee and Remuneration Committee of Advance Synergy Berhad.
He does not have any family relationship with any director and/or major shareholder of Advance Synergy Berhad, nor has he any conf lict of interest with Advance Synergy Berhad. He has no convictions for any offences within the past 5 years and no public sanction or penalty imposed by the relevant regulatory bodies during the financial year.

57ADVANCE SYNERGY BERHAD | annual report 2018 Our Board
Aryati Sasya Dato’ Ahmad Sebi (continued)
Sasya is a member of the Risk Management Committee of Advance Synergy Berhad.
She does not have any family relationship with any director and/or major shareholder of Advance Synergy Berhad, nor has she any conf lict of interest with Advance Synergy Berhad, except that her father, Dato’ Ahmad Sebi, is the Group Chairman and substantial shareholder of Advance
Synergy Berhad. Her brother, Anton, is the Group Executive Deputy Chairman and also a director of Bright Existence Sdn Bhd and Suasana Dinamik Sdn Bhd, both companies are substantial shareholders of Advance Synergy Berhad. Her father, Dato’ Ahmad Sebi, is also a substantial shareholder and director of Bright Existence Sdn Bhd and Suasana Dinamik Sdn Bhd. She has had no convictions for any offences within the past 5 years and no public sanction or penalty imposed by the relevant regulatory bodies during the financial year.
Kam Kin FoongIndependent Non-Executive Director (age 52)
Ms Kam Kin Foong, is an Independent Non-Executive Director of Advance Synergy Berhad. She was appointed to the Board on 12 July 2018.
Kin Foong holds a Bachelor of Science degree in Business Administration majoring in Finance and a Master of Science in Industrial Management from the Central Missouri State University, United States of America.
From 1991 to 1995, she was the Assistant Manager in NJ Metal Stamping Sdn Bhd. She joined Powernet Industries Sdn Bhd in 1995 as a Personal Assistant to the Managing Director and was subsequently promoted to the post of Export Manager in 1997. In 1999, she was appointed as the Executive Director of Powernet Industries Sdn Bhd. Kin Foong was appointed as an Executive Director of Kumpulan Powernet Berhad ("KPB") on 12 January 2002. She left KPB in October 2005
and since then she has been self-employed in investment and management of properties and financial assets. She is presently a Director of Megalpha Sdn Bhd and Megalpha Limited.
Kin Foong is a member of the Audit Commit t ee, Nominat ion Commit t ee, Remu ner at ion Commit t ee a nd R isk Ma nagement Commit t ee of Adv a nce Synergy Berhad.
She does not have any family relationship with any director and/or major shareholder of Advance Synergy Berhad, nor has she any conflict of interest with Advance Synergy Berhad. She has no convictions for any offences within the past 5 years and no public sanction or penalty imposed by the relevant regulatory bodies during the financial year.
58
Ms Ho Tsae Feng, is the Company Secretary and Group Secretarial Manager of Advance Sy ner g y Berhad . She joined Adv a nce Synergy Berhad on 2 September 2003 as the Group Secretarial Manager and assumed an additional position as Company Secretary on 28 October 2003. Tsae Feng is an Associate Member of The Malaysian Inst itute of Chartered Secretaries and Administrators.
Prior to joining Advance Synergy Berhad, she was with The Malayan United Industries Berhad Group as an Assistant Company Secretary from March 2000 until August 2003. From April 1997 to March 2000, she was a Senior Secretarial Assistant with Corporatehouse Services Sdn Bhd, an affiliate to PricewaterhouseCoopers providing corporate secretarial services.
From September 1995 to April 1997, she was attached to Ekovest Berhad, a public listed company, as Assistant Company Secretary. She has more than 20 years’ experience in corporate secretarial services.
Tsae Feng does not hold any directorship in public company.
She does not have any family relationship with any director and/or major shareholder of Advance Synergy Berhad, nor has she any conflict of interest with Advance Synergy Berhad. She has had no convictions for any offences within the past 5 years and no public sanction or penalty imposed by the relevant regulatory bodies during the financial year.
Ho Tsae Feng Company Secretary and Group Secretarial Manager (age 49)
Our CompanySecretary

59ADVANCE SYNERGY BERHAD | annual report 2018
Our Key ManagementCORPORATE OFFICE
HEADS OF GROUP DIVISIONS
Dato’ Ahmad Sebi BakarGroup Chairman
Anton Syazi Dato’ Ahmad SebiGroup Executive Deputy Chairman
Lee Su NieGroup Managing Director
Sng Ngiap KoonChief Operating Officer – Asset Development
Yap Chee KongGeneral Manager – Corporate Services
Daniel Tan Wooi HooSenior Finance Manager
Ho Tsae FengGroup Secretarial Manager
HOTELS AND RESORTS
ALANGKA-SUKA HOTELS & RESORTS SDN BHD
Tan Sri Dato’ Azman Shah HaronChairman
Puan Sri Datin Masri Khaw AbdullahManaging Director & Chief Executive Officer
PROPERTY DEVELOPMENT
ADVANCE SYNERGY REALTY SDN BHD
Sng Ngiap KoonExecutive Director/Chief Operating Officer
INVESTMENT HOLDING
ADVANCE SYNERGY CAPITAL SDN BHD
Yap Chee KongFinancial Controller
TRAVEL & TOURS
ORIENT ESCAPE TRAVEL SDN BHD
Cheah Ping HueyExecutive Director
SYNERGY TOURS SDN BHD
Cheah Ping HueyChief Executive Officer
INFORMATION & COMMUNICATIONS TECHNOLOGY
CAPTII LIMITED
Wong Tze LengGroup Executive Chairman
Anton Syazi Dato’ Ahmad SebiGroup Executive Director
CARD & PAYMENT SERVICES
PAYDEE SDN BHD(formerly known as SYNERGY CARDS SDN BHD)
Low Kok KengChief Executive Officer
BUS-BODY FABRICATION
QUALITY BUS & COACH (M) SDN BHD
Yap Chee KongManaging Director
EDUCATION
THE LANGUAGE HOUSE
Patricia Mary Jayasuriya @ CeciliaPrincipal

60
Our Group
Tan Sri Dato’ Azman Shah Haron is the co-founder of Holiday Villa hotels and resorts and presently, the Chairman of Alangka-Suka Hotels and Resorts Sdn Bhd which owns and manages the Holiday Villa hotel chain operating in Malaysia and abroad. He was appointed the Chairman on 26 August 1996.
Tan Sri Dato’ Azman was educated in Japan and Australia and has received extensive training in general hotel management in the United States of America.
Ta n Sr i Dat o’ A zma n ha s held v a r iou s senior appointments in major hotels. Prior to this, he was the Managing Director and shareholder of Central Holdings Berhad, the company which owns and manages the three Holiday Inn hotels in the Klang Valley, namely Holiday Inn On The Park Kuala Lumpur, Holiday Inn City Centre Kuala Lumpur and Holiday Inn Shah Alam over two decades. His excellent leadership brought the three Holiday Inn hotels to great heights. During his tenure, he received numerous
awards and accolades, among them were Holiday Inn International Torchbearer’s Award (The Holiday Inn Systems Worldwide Performance Award for the Top 50 hotels), Gold Award for Inter-Hotel Performance and Productivity, Tourism Gold Award for Hotel Performance and Service – 1st Class Category by the Malaysian Ministry of Tourism.
He was the President of the Malaysian Association of Hotels for over a decade and a member of the Malaysia Tourism Board for over 12 years. He was also the President and board member of ASEANTA (Asean Tourism Association) and Asean Hotel & Restaurant Association (AHRA) and contributed a lot in the promotion and expansion of tourism activities in the ASEAN region. He was the Past President of International Organisation of Employers (IOE) Geneva and Asean Confederation o f E m p l o y e r s (AC E ) a n d a l s o a p a s t Board member of Malaysian Industrial Development Authority (MIDA).
Senior Management
Tan Sri Dato’ Azman Shah Haron (age 69) • Chairman of Alangka-Suka Hotels & Resorts Sdn Bhd

61ADVANCE SYNERGY BERHAD | annual report 2018
Tan Sri Dato’ Azman Shah Haron (continued) Tan Sri Dato’ Azman is currently the P resident of Ma laysia n Employer s Federation (MEF), and Chairman of the Consultative Panel for the Hospitality Industry at the Malaysia Productivity Corporat ion (MPC), Confederat ion of Asia Pacific Employers (CAPE), Industrial Advisor y Commit tee, Department of Polytechnic, Higher Education Department, as well as a Board Member of the Malaysia P roduc t iv it y Cor por at ion ( MPC ) a nd Employees Provident Fund (EPF).
Currently, he also serves as member of the Task Force (PEMUDAH), Substantive Member on National Labour Advisory Council (NLAC), as Council Member of the National Wages Consultative Committee (NWCC), Ministry of Human Resources and as Member of the Public Services Commission of Malaysia (Suruhanjaya Perk hid mat a n Awa m (SPA)) a nd a s Treasurer of Rumah Bakti Dato’ Harun Idris, Ulu Klang, Selangor (Orphanage).
In recognition of his immense contribution and excellent service, Tan Sri Dato’ Azman received awards of Ahli Mahkota Selangor (AMS) Award by His Highness, The Sultan of Selangor, Datuk Paduka Tuanku Jaafar (DPTJ) Award by His Highness, The Yang Di Pertuan Negeri Sembilan and Darjah Kebesaran Panglima Setia Mahkota (PSM) Award by His Majesty, The Yang Di Pertuan Agong XIV Tuanku Al-Haj Abdul Halim Mu’adzam Shah.
Tan Sri Dato’ Azman also sits on the Board of various subsidiaries of Advance Synergy Berhad, includ ing C her at ing Hol iday Villa Berhad, which is a non-listed public company.
He does not have any family relationship with any director and/or major shareholder of Advance Synergy Berhad, nor has he any conflict of interest with Advance Synergy Berhad, save for his spouse, Puan Sri Datin Masri, is a Non-Independent Non-Executive Director of Advance Synergy Berhad.
He has no convictions for any offences within the past 5 years and no public sanction or penalty imposed on him by the relevant regulatory bodies during the financial year.
Our Group Senior Management

62 Our Group Senior Management
Sng Ngiap Koon (age 71) • Chief Operating Officer – Asset Development of Advance Synergy Berhad• Executive Director/Chief Operating Officer of Advance Synergy Realty Sdn Bhd
Wong Tze Leng (age 54) • Group Executive Chairman of Captii Limited
Mr Wong Tze Leng was appointed the Group Executive Chairman of Captii Limited, a 58.3% – owned subsidiary of Advance Synergy Berhad which is listed on the Singapore Exchange Securities Trading Limited on 10 August 2010. He previously served as Group Chief Executive Officer of Captii Limited, a position he held since 22 December 2002 until his appointment as Executive Chairman.
Tze Leng has over 20 years’ experience in the information technology industry, with specific expertise in the telecommunications sector. He started his career in 1988 as an Engineer in the Singapore Institute of Standards & Industrial Research’s design and development centre. He gained specialised expertise in computer telephony t echnolog y when he joined Feder a l Computer Services Pte Ltd in 1990 as a Software Engineer and later progressed to the position of Software Manager.
In 1993, he joined Dialogic as an Applications Engineer and was later promoted to the position of Business Development Director for the Asia Pacific region. During his career
with Dialogic, he established a close rapport and working relationship with numerous IT companies and telcos in the Asia Pacific region. In 1998, he left Dialogic and founded the Captii Limited Group.
Tze Leng graduated from Monash University, Victoria, Australia, with a Bachelor ’s degree in Computer Science in 1985 and subsequently obtained a Bachelor’s degree in Electrical and Electronic Engineering in 1987 from the same university.
Tze Leng also sits on the Board of various pr iv at e l imit ed compa nies includ ing subsidiaries and associated company of Advance Synergy Berhad. He does not hold any directorship in other public companies.
He does not have any family relationship with any director and/or major shareholder of Advance Synergy Berhad, nor has he any conflict of interest with Advance Synergy Berhad, save for his substantial shareholding in Captii Limited. He has no convictions for any offences within the past 5 years and no public sanction or penalty imposed on him by the relevant regulatory bodies during the financial year.
Mr Sng Ngiap Koon was appointed the Executive Director/Chief Operating Officer of Advance Synergy Realty Sdn Bhd on 14 July 2007 and the Chief Operating Officer – Asset Development of Advance Synergy Berhad on 28 September 2012.
Ngiap Koon is an Associate Member of the Institute of Chartered Accountants in England and Wales.

63ADVANCE SYNERGY BERHAD | annual report 2018
Low Kok Keng (age 60) • Chief Executive Officer of Paydee Sdn Bhd (formerly known as Synergy Cards Sdn Bhd)
He later founded CardTrend Systems Sdn Bhd, a business providing Fuel Fleet and Loyalty-Rewards solutions to petrol, retail and banking operators in Asia Pacific.
Being one of the pioneer in the cards and payments industry in this region, especially in the fuel and loyalty-rewards space, Kok Keng has successfully developed and implemented a few firsts. In MBF Card Services, he implemented the first fuel card (the MBf Shell card) and the first Mastercard debit card (the Maestro debit card). He has also successfully delivered Fuel Fleet card programs for Petronas, Petron (Malaysia and the Philippines), Shell East Zone, and other fuel operators and banks in Asia Pacific, when he was with CardTrend Systems. CardTrend’s credibility and business grew to the point where it had several opportunities to compete for regional accounts and the company is too small to take any regional bidding competing against large MNC corporate, and Kok Keng decided to sell CardTrend in 2014 to a large French Fuel Fleet payment operator.
Our Group Senior Management
Sng Ngiap Koon (continued)
Prior to 1984, he was working in London, England. Between 1984 to 1985, he was the Group Accountant of Innovest Berhad. He joined Advance Synergy Berhad in 1986 as the Group Accountant. In 1987, he was appointed the Group Financial Controller of Advance Synergy Berhad. Prior to his appointment as the Executive Director of Advance Synergy Berhad in 2003 till 2006, he held the positions of Senior Group General Manager and Company Secretary. He was also a Director of Advance Synergy Berhad from 1988 to early 1991.
Ngiap Koon currently sits on the Board of various subsidiaries of Advance Synergy Berhad includ ing C her at ing Hol iday Villa Berhad, which is a non-listed public company.
He does not have any family relationship with any director and/or major shareholder of Advance Synergy Berhad, nor has he any conflict of interest with Advance Synergy Berhad. He has no convict ions for any offences within the past 5 years and no public sanction or penalty imposed on him by the relevant regulatory bodies during the financial year.
Mr Low Kok Keng was appointed as Chief Executive Officer of Paydee Sdn Bhd (formerly known as Synergy Cards Sdn Bhd) on 13 August 2018.
He began his career in 1984 with British Steel PLC Scotland as Operational Research Analyst. Kok Keng later moved back to Malaysia to serve as a General Manager with MBf Group Technology Division Malaysia, where he was responsible for supporting ICT needs of its finance, insurance and card businesses in Asia Pacific. He was later promoted as Vice President, MBf Card Services Division in 1989, where he built his passion in the cards and payments industry. In MBf Card Services he built and implemented the first Fuel payments card and launched the first Maestro debit card (a Mastercard product), amongst his other successful initiatives. In 1999, he moved on to join CardLink International Ltd to serve as Asia Pacific Regional Director responsible for business development and supports on Fuel Fleet payments services.

64 Our Group Senior Management
Yap Chee Kong (age 51) • General Manager – Corporate Services of Advance Synergy Berhad• Financial Controller of Advance Synergy Capital Sdn Bhd• Managing Director of Quality Bus & Coach (M) Sdn Bhd
Mr Yap Chee Kong was appointed as a Financial Controller of Advance Synergy Capital Sdn Bhd on October 2001 and General Manager � Corporate Services of Advance Synergy Berhad on 28 September 2012. He was appointed as the Managing Director of Quality Bus & Coach (M) Sdn Bhd on 27 March 2017.
He is a qualified accountant by training and prior to joining Advance Synergy Capital Sdn Bhd, he was an audit manager with PricewaterhouseCoopers. During his time with PricewaterhouseCoopers, he gained extensive experience in auditing where he held a portfolio of public listed companies involved in diverse range of industries, which included financial institutions and stock broking companies. He also has experience in financial advisory work and was actively involved in due diligence review, technical research, training and recruitment. He was also involved in special audit and special
business approval certification of stock broking companies.
He a lso s it s on t he Boa rd of v a r iou s subsidiaries and an associate company of Advance Synergy Berhad. He does not hold any directorship in public companies.
Chee Kong is a member of the Malaysian Inst itute of Accountants and a fellow member of the Association of Chartered Certified Accountants, England.
He does not have any family relationship with any director and/or major shareholder of Advance Synergy Berhad, nor has he any conflict of interest with Advance Synergy Berhad. He has no convictions for any offences within the past 5 years and no public sanction or penalty imposed on him by the relevant regulatory bodies during the financial year.
Low Kok Keng (continued)
Kok Keng possesses a BSc from East London University, UK and an MSc. in Operational Research from Lancaster & Strathclyde University, UK.
Kok Keng does not hold any directorship in public companies.
He does not have any family relationship with any director and/or major shareholder of Advance Synergy Berhad, nor has he any conflict of interest with Advance Synergy Berhad. He has no convictions for any offences within the past 5 years and no public sanction or penalty imposed on him by the relevant regulatory bodies during the financial year.

65ADVANCE SYNERGY BERHAD | annual report 2018 Our Group Senior Management
Cheah Ping Huey (age 47) • Executive Director of Orient Escape Travel Sdn Bhd• Chief Executive Officer of Synergy Tours Sdn Bhd
Ms Cheah Ping Huey joined the Travel and Tours Division of Advance Synergy Berhad in 2004 and was appointed the Executive Director of Orient Escape Travel Sdn Bhd on 12 April 2007. Since joining the Group, she has held several positions in the Group including the current positions.
With over 20 years’ working experience, Ping Huey has ser ved at management level in various international hotels including Guoman Hotels Group and Nikko Hotel.
Upon graduating from Stamford College with a Diploma in Business Administration in early 90’s, she began her career as a Banquet Sales Secretary in Istana Hotel. She accumulated her experience in sales as a Sales Executive and worked her way up the corporate ladder while studying Hotel Management Diploma Course. She was awarded the Youngest Director of Sales, Corporate Division by Nikko Hotel in 2000 and Most Outstanding Sales Achievement in 2001. Her ot her accompl ishment s include spearheading the hotels pre-opening Sales & Marketing Team of Guoman Hotels Group in Port Dickson and Hanoi.
In 2002, Ping Huey took on a new challenge and joined the travel industry. She was appointed as General Manager in a Japanese � owned travel agency, Intersect Travel and Tour Sdn Bhd. Her acute insight and quick execution was quickly noted and in 2004, she was appointed the General Manager of Orient Escape Travel Sdn Bhd, a subsidiary of Advance Synergy Berhad and has since grown the company into one of the leading travel agency in Malaysia. In 2007, she was promoted to her current position as the Executive Director of Orient Escape Travel Sdn Bhd. Ping Huey was appointed the Chief Executive Officer of Synergy Tours Sdn Bhd on 1 January 2016.
Ping Huey does not hold any directorship in public companies.
She does not have any family relationship with any director and/or major shareholder of Advance Synergy Berhad, nor has she any conflict of interest with Advance Synergy Berhad. She has no convictions for any offences within the past 5 years other than traffic offence (if any) and no public sanction or penalty imposed on her by the relevant regulatory bodies during the financial year.

66
Patricia Mary Jayasuriya @ Cecilia (age 62) • Principal The Language House
Ms Patricia Mary Jayasuriya @ Cecilia is the Principal of Pusat Bahasa The Language House (“TLH”), the education unit of Advance Synergy Berhad.
Patricia brings almost four decades of experience in education both in Malaysia and Hong Kong to TLH.
A psychology graduate of the University of Manchester, Patricia went on to take a postgraduate qualification in business administration from Cranfield University. She has both professional and academic qualifications in Teaching of English as a Second Language and is a Certified Hospitality Educator.
Patricia takes a hands-on approach in management and is passionate about maintaining quality in education especially in teaching standards and curricular.
Patricia does not hold any directorship in public companies.
She does not have any family relationship w i t h a n y d i r e c t o r a n d / o r m a j o r shareholder of Advance Synergy Berhad, nor has she any conflict of interest with Advance Synergy Berhad. She has no convictions for any offences within the past 5 years other than traffic offence (if any) and no public sanction or penalty imposed on her by the relevant regulatory bodies during the financial year.
Notes:
The above Key Senior Management are all Malaysian. The profiles of the following Key Senior Management who are also Directors of Advance Synergy Berhad are set out in the Directors’ Profile on pages 52, 53 and 54 of this Annual Report:
1. Puan Sri Datin Masri Khaw Abdullah• Managing Director & Chief Executive Officer of Alangka-Suka Hotels and Resorts Sdn Bhd
2. Mr Anton Syazi Dato’ Ahmad Sebi• Group Executive Deputy Chairman of Advance Synergy Berhad• Group Executive Director of Captii Limited
Our Group Senior Management

67ADVANCE SYNERGY BERHAD | annual report 2018
Governance
COMMITTED TO THE HIGHEST STANDARDS
Responsibility for good governance lies with the Board. The Board is accountable to shareholders and is committed to the highest standards of corporate governance as set out in the Malaysia Code on Corporate Governance (“the Code”). This Corporate Governance Overview Statement, describes how the Board has applied the main practices of good governance, as set out in the Code, during the year under review.
BOARD COMPOSITION AND SUCCESSION
T he Boa rd wa s made up of eig ht (8) members, comprising the Group Chairman, the Group Executive Deputy Chairman, the Group Managing Director, two (2) Non–Independent Non-Executive Directors and three (3) Independent Non-Executive Directors. All are Malaysian. The age of our Board members ranges from 41 to 71 years. The current Directors bring a wide range of business and financial experience, skills and knowledge necessary for the effective stewardship of the Group. Profiles of the Directors are set out on pages 51 to 57 of this Annual Report.
HOW WE GOVERN THE COMPANY
T h e B o a r d l e a d s t h e G r o u p ’s g o v e r n a n c e f r a m e w o r k ; i t i s responsible for setting the strategic targets for the Group, monitoring progress made, approving proposed actions and for ensuring that the appropriate internal controls are in place and that they are operating effectively.
T h e B o a r d i s a s s i s t e d b y f o u r (4) principal commit tees (Audit , Nominat ion, Remu ner at ion a nd Risk Management), each of which is responsible for reviewing and dealing with matters within its own terms of reference. At scheduled Board meetings, the minutes of all committee meetings are circulated. All the non-executive directors are members of all principal committees. Individual reports from each principal committee can be found on pages 74 to 85.
The roles and responsibilities of the Board and the Board Committees as well as the relationship with the management are clearly set out and with clear accountability.
The Board has included gender balance as one of the main criteria for appointment of new directors to promote the representation of women in the composition of the Board. Currently, we have four (4) women directors representing 50% of the Board of eight (8) members.

68 Governance
BOARD COMPOSITION AND SUCCESSION (continued)
Each of the Independent Non-Executive Directors is considered independent of management and free of any relationship that could materially interfere with the exercise of their independent judgement. The Board considers that each Independent Non-Executive Director brings their own senior level of experience, gained within their field.
Although the Group Chairman, Dato’ Ahmad Sebi Bakar, is also a major shareholder, the Board believes that the Group Chairman has always acted and will continue to act at all times in the best interest of shareholders as a whole and will strive to protect and enhance the long-term shareholder values and the financial performance of the Group.
Succession planning for the Board is an on-going process and certainly the recent appointment of Mr Anton Syazi Dato’ Ahmad Sebi as the Group Executive Deputy Chairman is one planned change to address succession planning. Succession planning is also viewed at executive management level, which at present is stable, on an on-going basis.
Diversity and gender balance
The Board recognises diversity in the boardroom as a cr it ical element for efficient functioning of the Board and good governance practices. The Board also believes that diversity leads to the consideration of all facets of an issue and, consequently, better decisions and performance. Hence, the appointment of Board members and senior management not only takes into consideration the objective criteria and merit but also gives due regard for diversity in skills, experience, age,
cultural background and gender.
The Board has included gender balance as one of the main criteria for appointment of new directors to promote the representation of women in the composition of the Board. Currently, we have four (4) women directors representing 50% of the Board of eight (8) members.
The remuneration for all Directors including Executive Directors is determined at levels so as to ensure that the Company attracts and retains the right calibre of Directors needed for the successful performance of the Group. The Remuneration Committee Report is set out on pages 82 to 85.
LEADERSHIP AND RESPONSIBILITIES
The Board is committed to ensuring that it provides leadership to the business as a whole, having regards to the interests and views of its shareholders and other stakeholders. It is also responsible for setting the Group’s strategy, value and standards.
The Board has a formal schedule of matters reserved for its decision as follows:
• Strategy and management• Communication• Board membership and other appointments• Remuneration• Financial reporting and controls• Delegation of authority• Internal controls• Corporate governance matters• Contracts/acquisitions/disposal• Dividend Policy• Capital structure• Other matters
69ADVANCE SYNERGY BERHAD | annual report 2018 Governance
LEADERSHIP AND RESPONSIBILITIES (continued)
T he Boa rd ack nowledges it s over a l l responsibility for maintaining a soundrisk management framework and internal control system to safeguard shareholders’ investments, the Company’s assets, and the need to review the adequacy and integrity of these systems regularly. The effectiveness of the Group’s risk management and internal controls framework is reviewed periodically by the RMC and Audit Committee. The Risk Management and Audit Committee reports can be found on pages 39 to 48 and pages 74 to 77 respectively.
The presence of three (3) Independent Non-Executive Directors making up more than one-third (1/3) of the total number of Directors fulfills a pivotal role in ensuring that there is balance of power and authority. Although all the Directors have an equal responsibility for the Group’s operations, the role of the Independent Non-Executive Directors is particularly important in ensuring that the strategies proposed by the executive management are fully deliberated upon, and take into account the long term interests of the shareholders, employees, c u s t omer s , suppl ier s a nd t he ma ny communities in which the Group conducts its business. Together, their representations on the Board fairly reflect the investment of the minority shareholders of the Company and in addition carry sufficient weight for decision making.
INDEPENDENCE OF DIRECTORS
T he Boa rd, t hroug h t he Nominat ion Committee, evaluates the independence of its independent directors annually in accordance with the criteria as prescribed by the Listing Requirements of Bursa Malaysia Securit ies Berhad (“Bursa
Securities”) and the Independent Directors are required to affirm their commitment to bring independent and objective judgement upon their appointments and annually thereafter.
During the f inancial year ended 31 December 2018, the Board, through the Nomination Committee, has conducted such assessment on all the Independent Directors and each Independent Director has confirmed his independence to the Nomination Committee. Based on the said assessment, the Board is satisfied with the level of independence demonstrated by all the Independent Directors and their ability to act in the best interest of the Company during deliberation at meetings of the Board and Committees.
The Code stipulates that the tenure of an Independent Director should not exceed a cumulat ive term of nine (9) years. Upon completion of the nine (9) years, an Independent Director may continue to serve on the Board subject to re-designation as a Non-Independent Director.
That notwithstanding, the Nomination Committee also is tasked by the Code, to assess and assist the Board in recommending and providing justification for shareholders’ consideration and approval in the event such an Independent Director is to remain independent after serving a cumulative nine-year term.
The shareholders of the Company had at the 94th Annual General Meeting (“AGM”) which was held on 7 June 2018 approved that Mr Yong Teck Ming who has served on the Board as an Independent Non-Executive Director of the Company for a cumulative term of more than nine (9) years on 9 July 2017 to continue to act as an Independent Non-Executive Director of the Company.

70
INDEPENDENCE OF DIRECTORS (continued)
On 12 April 2019, the Nomination Committee met and concluded that during Mr Yong Teck Ming’s long service to the Company, his performance as an Independent Non-Executive Director was excellent and there is no reason to believe that he will not continue to act independently and to contribute to the Company taking into consideration the following:
(a) he fulfilled the Independent Director criteria under the Listing Requirements of Bursa Securities and thus is able to function as a check and balance and to bring an element of objectivity to the Board;
(b) he is a member of the Chartered Accountants, Australia, New Zealand a n d a m e m b e r o f t h e I n s t i t u t e of C ha r t ered Sec ret a r ies a nd Administrators, United Kingdom. He has vast experience in accounting and a diverse range of business which will enable him to provide the Board with constructive opinion;
(c) he has been with the Company for more than nine (9) years and is familiar with the Company’s business operations which will enable him to contribute a c t i v e l y a n d e f f e c t i v e l y d u r i n g deliberation at meetings of the Board and Board Committees;
(d) he has exercised his objective and independent judgement on all Board deliberations;
(e) he has devoted sufficient time and attention to his professional obligations
for informed and balanced decision making;
(f) he has exercised due care during his tenure as Independent Non-Executive Director of the Company and carried out his professional duties in the best interest of the Company and shareholders; and
(g) he has been providing invaluable contributions to the Board in his role as an Independent Non-Executive Director and Chairman of the Audit Committee and RMC.
In v iew of the above, the Nomination Committee recommended to the Board that a resolution for the retention of Mr Yong Teck Ming as an Independent Non-Executive Director of the Company, be tabled for shareholders’ approval at the forthcoming 95th AGM of the Company. The Board is unanimous in supporting this recommendation.
SUFFICIENT PROVISIONS
The Company recognises that its Directors may be invited to become directors of other companies and the Directors are therefore at liberty to accept other Board appointments so long as such appointments are not in conflict with the business of the Group and do not adversely affect the Directors’ performance as a member of the Board. In maintaining and monitoring the limitation on directorship as required by the Listing Requirements of Bursa Securities, the Directors upon appointment, and from time to time during their tenure, will notify the Company Secretary of their directorship in other companies for disclosure to the Board at Board meetings.
Governance

71ADVANCE SYNERGY BERHAD | annual report 2018
SUFFICIENT PROVISIONS (continued)
The Board is of the opinion that the provisions of the Companies Act 2016 (“Act”) and Listing Requirements of Bursa Securities are sufficient to ensure adequate commitment given by the Directors to perform their duties without it being formally regulated.
To facilitate the Directors’ time planning, a planned annual meeting calendar is prepared and circulated to them before the beginning of each year. It provides the scheduled dates for meetings of the Board and Board Committees as well as the AGM.
The Board is satisfied with the level of time commitment given by the Directors towards fulfilling their roles and responsibilities and this is demonstrated by the attendance record of the Directors at the meetings of the Board and Board Committees for the financial year ended 31 December 2018 as set out below:
Name of Directors BoardAudit
CommitteeNomination Committee
Remuneration Committee
Risk Management
Committee
Dato’ Ahmad Sebi Bakar 6 / 6 - - - -
Anton Syazi Dato’ Ahmad Sebi 6 / 6 - - - -
Lee Su Nie 6 / 6 - - - -
Puan Sri Datin Masri Khaw Abdullah 6 / 6 - 3 / 3 2 / 2 -
Yong Teck Ming 6 / 6 5 / 5 - - 4 / 4
Rali Mohd Nor 6 / 6 5 / 5 3 / 3 3 / 3 *4 / 4
Aryati Sasya Dato’ Ahmad Sebi 6 / 6 *5 / 5 - 3 / 3 4 / 4
Kam Kin Foong(appointed on 12 July 2018)
2 / 2 2 / 2 1 / 1 1 / 1 2 / 2
* Attended the meetings by invitation.
CONTINUAL TRAINING FOR DIRECTORS
The Board acknowledges the importance of continual education and training to enhance its competencies, to broaden its perspectives, skills, knowledge and to keep abreast of the relevant changes in law, regulations and the business environment.
In addition to the relevant regulatory and governance updates provided by the Company Secretary and the Directors each updating themselves by attending relevant courses/ seminar, the Board also evaluates the training needs of its members on a continuous basis pursuant to the Listing Requirements of Bursa Securities and is updated on quarterly basis on the training programmes/courses/seminars attended by Directors.
Governance

72
CONTINUAL TRAINING FOR DIRECTORS(continued)
The Directors have also been regularly updated on developments in corporate governance, relevant laws, regulations and business practices as a continuing effort to train and equip themselves to effectively discharge their duties.
INTEGRITY IN CORPORATE REPORTING AND MEANINGFUL RELATIONSHIP WITH STAKEHOLDERS
For corporate reporting to our shareholders and stakeholders, our Board ensures that information are complete and accurate and are disseminated in a timely manner. The Company has established a dedicated section for investor on its website. This section provides information relating to corporate governance, annual reports, announcements to Bursa Securities and Board Charter. Contact details are provided on the Company’s website to address queries from its shareholders and stakeholders.
The Board acknowledges the importance of establishing a direct line of communication with shareholders and investors through timely dissemination of information on the Group’s performance and operations via distribution of annual reports and relevant circulars, and release of quarterly financial results, press releases and announcements.
The AGM is the principal forum for dialogue with shareholders. There is an open ‘question and answer’ session in which shareholders may pose questions regarding the resolutions being proposed at the meeting and also on matters relating to the Group’s businesses and affairs.
The Board members are in attendance at general meetings to provide explanations to all shareholders’ queries and shareholders are encouraged to participate in discussions and to give their views to the Directors. T he C ha ir of t he Aud it , Nominat ion, Remunerat ion and Risk Management Commit tees are also in at tendance to provide meaningful response to questions.
ACTIVITIES AND FOCUS OF THE BOARD DURING THE YEAR AND FOR THE COMING YEAR
Du r ing t he f ina nc ia l yea r ended 31 December 2018, six (6) Board meetings were held where the Board deliberated upon and considered a variety of matters including t he Group’s cor por at e development s , financial results, investments and reports on risk management and internal audits of the Group. The Directors receive meeting materials, which are complete and accurate within a reasonable period prior to the meeting. All proceedings from the Board meetings are minuted and signed by the Chairman of the meeting.
The Board, through the Nomination Committee, also conducted assessments on all the independent directors, reviewed the training programmes attended by the Directors to keep abreast with the current developments in laws, regulations and business practices to aid them in discharging their duties, and assessed the appointment of Ms Kam Kin Foong as an Independent Non-Executive Director to fill the vacancy following the resignation of Dato’ Ahmad Ghiti Mohd Daud as Independent Non-Executive Director of the Company on 3 May 2018 due to personal reasons.
Governance

73ADVANCE SYNERGY BERHAD | annual report 2018
ACTIVITIES AND FOCUS OF THE BOARD DURING THE YEAR AND FOR THE COMING YEAR (continued)
The Remuneration Committee met to review the annual fixed fee structure of members of the Board taking into consideration the increasing responsibilities and time commitment expected from the Directors and the remuneration packages of the Group Chairman, Group Executive Deputy Chairman, Group Managing Director and Chief Operating Officers of the Company and advised the Board accordingly.
During the financial year ended 31 December 2018, the Audit Committee met with the external auditors three (3) times without the presence of the Executive Directors to discuss the audit plan, audit findings and the Company’s audited financial statements.
The Board also focused on the Group Risk Management Framework assessing the risk registers, key risk areas and internal controls to ensure that the Group Risk
Management Framework was sufficiently robust in addressing and mitigating the various risks of the Group.
Fo r t h e c o m i n g y e a r, t h e r e w i l l b e continuous on-going assessment by the Boa rd of t he bu siness r isk s a nd t he effectiveness of the risk management frameworks and internal control systems to manage risks.
More emphasis was placed on sustainability reporting during the year under review, whereby the Board, w ith the suppor t b y a n i n d e p e n d e n t c o n s u l t a n t , h a s identified and reviewed key material ESG factors/issues, established sustainability performance management framework and identified three (3) key pillars to enhance the monitoring and reporting of the sustainability performance. Moving forward, the Board will review annually the material ESG issues against the changing bu s i ne s s env i r on ment , s t a keholder opinions, and emerging global and local trends to keep abreast of critical issues.
This report is to be read together with the Corporate Governance Report 2018 of the Company which is available on the Company's website. The Corporate Governance Report 2018 provides the details on how the Company has applied each practice as set out in the Code during the financial year 2018.
Governance

74
Audit
COMPOSITION
T he Aud it Commit t ee compr ises a Chairman, and t wo (2) members, all of whom are independent non-executive directors. Members of the Audit Committee are appointed by the Board following recommendations by the Nomination Commit t ee . T he Aud it Commit t ee’s membership is reviewed by the Nomination Committee and as part of the annual Board performance evaluation.
Each member of the Audit Committee brings an appropriate balance of senior level financial and commercial experience, combined with a good understanding of the Company’s business and is therefore considered by the Board to be competent. The Board considers that each member of the Audit Committee is independent within the definition set out in the Listing Requirements of Bursa Securities. The Audit Committee Chairman is considered by the Board to have significant, recent and relevant financial experience and to be competent in auditing and accounting.
Audit Committee members are expected to have an understanding of the principles of, and recent developments in, financial report ing , including the applicable accounting standards and statements, recommended practice, key aspects of the Company’s policies, financial, internal control mechanisms, and matters that requ ire t he u se of judgement in t he presentation of accounts and key figures as well as the role of internal and external auditors. Members of the Audit Committee undertake ongoing training as required.
OBJECTIVES
The Audit Committee’s key objectives are the provision of effective governance over the appropriateness of the Group’s financial reporting, including the adequacy of related disclosures, the performance of both the internal and external audit functions, and the management of the Group’s systems of internal control, business risks and related compliance activities.
Committee ReportKey objectives are the provision of effective governanceover the appropriateness of the Group’s financialreporting, including the adequacy of related disclosures, the performance of both the internal and external audit functions, and the management of the Group’s systems ofinternal control, business risks and related compliance activities.

75ADVANCE SYNERGY BERHAD | annual report 2018 Audit Committee Report
OBJECTIVES (continued)
The Audit Committee is responsible for the development, implementation and monitoring of the Company’s policy on external audit . The Audit Commit tee reser ves oversight responsibilit y for monitoring the auditor’s independence, objectivity and compliance with ethical, professional and regulatory requirements.
The Audit Committee is also responsible for the re-tendering selection process a nd recommend s t he appoint ment , r e a p p o i n t m e n t a n d r e m o v a l o f t h e Company’s external auditor, and considers the risks associated with the change of the external auditors in its risk evaluation and planning.
The Audit Committee also reviews and sets the terms, areas of responsibility and scope of the audit as set out in the external auditor’s engagement letter; the overall work plan for the forthcoming year, together with the associated fee proposal and cost effectiveness of the audit; the external auditors’ independence; any major issues which arise during the course of the audit and their resolution; key accounting and audit judgements; the level of errors identified during the audit; the recommendations made to management by the auditor and management’s response; and the auditor’s overall performance.
The duties and functions of the Audit Committee are set out in its Terms of Reference (“TOR”) which are available on the Company’s website at www.asb.com.my under Schedule 1 of the Board Charter.
MEETINGS AND ATTENDANCE
The Audit Committee met five (5) times during the year under review and members’ attendance at the meetings is set out in the table below:
Name of Directors Attended
Yong Teck MingChairman
5 / 5
Rali Mohd NorMember
5 / 5
Kam Kin FoongMember (Appointed on 12 July 2018)
2 / 2
Dato’ Ahmad Ghiti Mohd DaudMember (Resigned on 3 May 2018)
2 / 2
SUMMARY OF ACTIVITIES
Du r ing t he f ina nc ia l yea r ended 31 December 2018, the principal activities of the Audit Committee comprised:
Financial Reporting
(i) Reviewed the quarterly unaudited financial results and turnaround plan for non-performing subsidiaries prior to tabling of the same to the Board for approval.
(ii) Reviewed the draft announcements on quarterly and yearly unaudited financial results of the Group prior to tabling the same to the Board for approval.
(iii) Reviewed the annual audited financial statements for the financial year ended 31 December 2017 prior to submission to the Board for approval.

76 Audit Committee Report
SUMMARY OF ACTIVITIES (continued)
Financial Reporting (continued)
(iv) Reviewed the applicabilit y of the new accounting standards and new financial reporting regime issued by the Malaysian Accounting Standards Board.
Internal Audit
(i) Reviewed the objectives, adequacy and coverage of the internal audit (“IA”) activities of the proposed 2018 IA plan. A total of twenty one (21) internal audit assignments was approved for the 2018 internal audit plan.
(ii) Reviewed a total of twenty-one (21) IA reports (comprising one (1) from 2016 IA plan, seven (7) from 2017 IA plan and thirteen (13) from 2018 IA plan on the adequacy and effectiveness of internal control systems and risk management including audit recommendations and the management’s responses thereto.
(iii) Reviewed the resource requirements of the internal audit function.
(iv) R e v i e w e d t h e p r o c e s s e s o n implementation of Goods and Services Tax (“GST”) including GST accounting and related transactions.
(v) Reviewed compliance on Anti-Money Laundering and Counter Financing of Terrorism (“AML/CFT”) policies, process and procedures on AML/CFT’s Independent Assessments.
External Audit
(i) Convened meetings with the external auditors on 28 February 2018, 28 March 2018 and 28 November 2018 without the presence of the management to review and deliberate on various matters including the audit planning m e m o r a n d u m a n d au d i t r e v i e w memorandum prepared by the external auditors. These memorandum includes significant audit findings, auditing and accounting issues, adequacy of management’s response and other key matters arising from the statutory audit for the financial years ended 31 December 2017 and 2018, as well as the changes in regulatory environment following the enforcement of the new Act which came into effect on 31 January 2017.
(ii) Reviewed the audit fees payable to the external auditors.
(iii) Considered and recommended to the Board the re-appointment of external auditors.
Related Party Transactions and Recurrent Related Party Transactions
Reviewed the Group’s related part y transactions and recurrent related party transactions as well as conflict of interest situations that may arise within the Company or the Group and to ensure that the transactions are conducted in the best interest of the Company, on fair and reasonable as well as on normal commercial terms and are not detrimental to the interest of the minority shareholders.

77ADVANCE SYNERGY BERHAD | annual report 2018 Audit Committee Report
SUMMARY OF ACTIVITIES (continued)
Audit Committee Report
Reviewed the Audit Committee Report and recommended to the Board for inclusion in the Annual Report for the financial year ended 31 December 2017.
TOR of Audit Committee
The detailed information on the TOR of Audit Committee is accessible via the Company’s website at www.asb.com.my under Schedule 1 of the Board Charter.
INTERNAL AUDIT FUNCTION
The Audit Commit tee has adopted a top-down, r isk-based approach in the implementation and monitoring of internal controls of the Group. This approach was achieved through critical in-depth review and deliberation of the reports and relevant issues presented during the Audit Committee meetings. This top-down, risk-based approach has enabled the Audit Committee to identify any major breakdown in the risk management and internal controls of the Group and to make the necessary recommendations to address the issues.
The Audit Committee is assisted by the Internal Auditors (outsourced professional
internal audit company) to provide an independent appraisal and assurance to ensure the maintaining of a sound system of internal control to safeguard shareholders’ investment. The Internal Auditors conducts regular systematic reviews of the system of controls in accordance with the Internal Audit Plan approved by the Audit Committee and independently reports directly to the Audit Committee.
During the f inancial year ended 31 December 2018, the Internal Auditors carried out various operational, system and risk assessment reviews to review and appraise the effectiveness of the risk management and internal control processes within the Group. Follow-up audits were also performed by the Internal Auditors to ensure that audit recommendations and corrective action plans were implemented accordingly. A total of twenty-one (21) – IA reports was presented to the Audit Committee during the financial year ended 31 December 2018. The Internal Auditors also reviewed the related party transactions entered into by the Company and its subsidiaries to ensure that the transactions were carried out on an arm’s length basis.
The costs incurred for the internal audit function of the Group in respect of the financial year ended 31 December 2018 wasRM161,000.

78
Nomination
Committee in ensuring that the Board composition meets the needs of the Company.
With the establishment of the Nomination Committee, a formal transparent procedure is in place for the appointment of new Directors to the Board whereby the Nomination Committee will recommend to the Board candidates for directorships in the Company. This procedure involves identification of candidates for directorship, evaluation of suitability of candidates, deliberation by the Nomination Committee and recommendation to the Board.
Committee ReportThe Nomination Committee considers candidates for directorship proposed by the Executive Directors and, where practicable, by any other senior executive or any director or shareholder or any suitably qualified candidates from independent sources.
COMPOSITION
T he Commit t ee’s role is t o review the size and structure o f t h e B o a r d , c o n s i d e r s succession planning and makes recommendations to the Board on potential candidates for the Board. Its key objective is to ensure that the Board comprises individuals with the necessary skill, knowledge and experience to ensure that the Board is effective in discharging its responsibilities, to recommend proposed appoint ment s t o the Board for approval and to assess the contribution of each Director on an on-going basis.
The Chairman of our Nomination Committee is an Independent Non-Executive Director. The Board believes that the existing Chairman of the Nomination Committee is competent to chair the Nomination Committee by virtue of his vast experience and is capable to lead the Nomination
The Nomination Committee consists of three (3) Non-Executive Directors:
Rali Mohd NorChairman, Independent Non-Executive Director(appointed as Chairman on 12 July 2018)
Puan Sri Datin Masri Khaw AbdullahMember, Non-Independent Non-Executive Director
Kam Kin FoongMember, Independent Non-Executive Director (appointed on 12 July 2018)
Dato’ Ahmad Ghiti Mohd DaudChairman, Independent Non-Executive Director(resigned on 3 May 2018)

79ADVANCE SYNERGY BERHAD | annual report 2018 Nomination Committee Report
COMPOSITION (continued)
The Nomination Committee is responsible for making recommendations on any nomination to the Board and to Committees of the Board. The Nomination Committee considers candidates for directorship proposed by the Executive Directors and, where practicable, by any other senior executive or any director or shareholder or any suitably qualified candidates from independent sources.
Its key objective is to ensure that the Board comprises individuals with the necessary skill, knowledge and experience to ensure that the Board is effective in discharging its responsibilities, to recommend proposed appointments to the Board for approval and to assess the contribution of each Director on an on-going basis.
DUTIES AND FUNCTIONS
The duties and functions of the Nomination Committee are set out in its TOR which is reviewed annually by the Nomination Committee and approved by the Board before the same was uploaded to the Company’s website under Schedule 1 of the Board Charter.
The Nomination Committee will assess annually, the effectiveness of the Board as a whole, the Committees of the Board and the contribution of each individual Director including Independent Non-Executive Directors, as well as Executive Directors.
T he Boa rd, t hroug h t he Nominat ion Committee, reviews annually its required mix of skills and experience and other qualities, including core competencies, which Non-Executive Directors should bring to the Board.
In line with the recent amendments to the Listing Requirements of Bursa Securities,
the Nomination Committee will also review the term of office and performance of the Audit Committee and each of its members annually to ensure that the Audit Committee has carried out their duties in accordance with their TOR.
PRINCIPAL ACTIVITIES
The Committee’s focus during the year was overseeing the process for the appointment of Ms Kam Kin Foong as an Independent Non-Executive Director and filling the vacancy in the Board, Audit Committee, Nomination Committee and Remuneration Committee left by Dato’ Ahmad Ghiti Mohd Daud who resigned on 3 May 2018 to pursue his personal interest. The Board after having considered the mixed of skills, experience, qualification and other quality required to meet the Group’s needs and based on recommendation of the Nomination Commit tee, the Board appointed Ms Kam Kin Foong as Independent Non-Executive Director and member of the Audit Committee, Nomination Committee, R e mu n e r a t i o n C o m m i t t e e a n d R i s k Management Committee on 12 July 2018.
During the financial year ended 31 December 2018, the Committee also assisted the Board to assess the independence of independent director including a director who has served on the Board for a cumulative term of more than nine (9) years and to recommend to the Board for approval to retain the said director.
During the financial year ended 31 December 2018, the Nomination Committee reviewed the following training programmes/ courses/seminars attended by Directors and concluded that all Directors have attended programmes/courses/seminars to keep abreast with the current developments in laws, regulations, corporate governance and business practices to aid them in discharging their duties:

80 Nomination Committee Report
PRINCIPAL ACTIVITIES (continued)
Directors Date Programmes/courses/seminars/ conferences attended
Organiser
Dato’ Ahmad Sebi Bakar
23.11.2018 Sales Tax and Service Tax (“SST”)In-House Training
RSM Tax Consultants (Malaysia) Sdn Bhd (“RSM Tax”)
Anton Syazi Dato’ Ahmad Sebi
25.09.2018 Cryptocurrency, Blockchain& Beyond: A Cautionary Tale 2018
Securities Industry Development Corporation (“SIDC”)
Lee Su Nie 15.03.2018 Corporate Governance Briefing Sessions: MCCG Reporting & CG Guide
Bursa Malaysia
16.10.2018 Policing to Consulting workshopfor Chief Internal Auditor.
Bursa Malaysia
10.10.2018 Gearing up for Corporate Liability Malaysian Anti Corruption Academy (“MACA”)
23.10.2018 Directors Risk Management Programme: “I am Ready toManage Risks”
Bursa Malaysia
23.11.2018 Sustainability Reporting ProjectKick Off
Baker Tilly Monteiro Heng Governance Sdn Bhd(“BTMH Governance”)
SST In-House Training RSM Tax
Puan Sri Datin Masri Khaw Abdullah
15.03.2018 Corporate Governance Briefing Sessions: MCCG Reporting & CG Guide
Bursa Malaysia
10.10.2018 Gearing up for Corporate Liability MACA
Yong Teck Ming 02.03.2018 Corporate Governance Briefing Sessions: MCCG Reporting & CG Guide
Bursa Malaysia
26.03.2018 How Innovation is Changing Leadership
SIDC
05.09.2018 Case Study workshop for Independent Directors
SIDC
05.12.2018 Non-Financials-“Does it matter” The ICLIF Leadership and Governance Centre (“ICLIF”)

81ADVANCE SYNERGY BERHAD | annual report 2018
PRINCIPAL ACTIVITIES (continued)
Directors Date Programmes/courses/seminars/ conferences attended
Organiser
Rali Mohd Nor 05.07.2018 Sustainability Engagement Seriesfor Directors/CEOs
Bursa Malaysia
08.11.2018 Impact of AI on Shareholder Value & Market Performance, "What Every Listco Needs to Know”
MyFinB (M) Sdn. Bhd
23.11.2018 SST In-House Training RSM Tax
Aryati Sasya Dato’ Ahmad Sebi
23.11.2018 Sustainability Reporting ProjectKick Off
BTMH
SST In-House Training RSM Tax Sdn Bhd
04.12.2018 Companies of the Future: The Rolefor Boards
Institute of Corporate Directors Malaysia
Kam Kin Foong 05.09.2018 Case Study workshop for Independent Directors
SIDC
08.10.2018 -09.10.2018
Mandatory Accreditation Programme ICLIF
23.11.2018 SST In-House Training RSM Tax
DIVERSITY
The Committee and the Board have sought to ensure that the best candidates are appointed to promote the success of the Group and the appointments are based on merit, with due regard for the benefits of diversity on the Board.
Further information regarding Board diversity can be found on page 68 and gender diversity in the Group as a whole on page 68.
LOOKING AHEAD
In the year ahead, the Nomination Committee will continue to assess the Board composition and how it may be enhanced.
Nomination Committee Report

82
RemunerationCommittee Report
to be appropriate, on remuneration, tax, accounting and regulatory issues from external advisers and internally f r o m t h e H u m a n R e s o u r c e s , C o m p l i a n c e , R i s k a n d F i n a n c e departments.
REMUNERATION POLICY FOR EXECUTIVES
T he Remu ner at ion Commit t ee b e l i e v e s s t r o n g l y t h a t t o t a l remunerat ion should take into account the competition for talent in an industry where successful people are rewarded and mobile. The Group compensates employees through both fixed and variable compensation.
Fi xed compen sat ion compr ises principally base salaries and the Committee reviews these as part of their overall annual review taking into account the performance of the individual, comparisons with peer group companies within the industry, the experience of the individual and their level of responsibility. Other elements related to base salary include an employer’s contribution to the Employees Provident Fund.
The Remuneration Committee is responsible for setting the remuneration policy for all directors including the executive directors and other senior executives in the Group. The Remuneration Committee ensures that the Directors are fairly remunerated or rewarded for the contributions or individual level of responsibilities. Additionally, the Remuneration Committee is responsible for determining the overall Remuneration Policy applied to the Group, including the quantum of variable remuneration and the method of delivery. In carrying out its delegated responsibilities the Committee receives advice, when they consider it
The Remuneration Committee consists ofthree (3) Non-Executive Directors:
Rali Mohd NorChairman, Independent Non-Executive Director(appointed as Chairman on 12 July 2018)
Puan Sri Datin Masri Khaw AbdullahMember, Non-Independent Non-Executive Director
Kam Kin FoongMember, Independent Non-Executive Director (appointed on 12 July 2018)
Dato’ Ahmad Ghiti Mohd DaudChairman, Independent Non-Executive Director(resigned on 3 May 2018)
COMPOSITION
The policy for variable compensation is to recognisecorporate performance and individual achievement of objectives through discretionary bonus.

83ADVANCE SYNERGY BERHAD | annual report 2018 Remuneration Committee Report
REMUNERATION POLICY FOR EXECUTIVES (continued)
The policy for variable compensation is to recognise corporate performance and individual achievement of objectives through discretionary bonus. Discretionary variable compensation can be delivered in two main forms:
• Annual cash bonus; and• A long-term incentive award.
The executive directors and other senior executive assess individual performance through clearly defined objectives and structured process of review and feedback. In particular, the aggregate fixed and variable remuneration by individual is determined with regard to the performance of the individual, performance of the area or function of the business in which the individual works or for which the individual is responsible, the profitability of the Group and levels of reward for comparable roles in the external market.
Executive directors and members of the senior management team do not participate in decisions concerning their own remuneration.
REMUNERATION FOR THE YEAR The remuneration breakdown of individual Directors which includes fees, salary, bonus, benefits-in-kind and other emoluments for the financial year ended 31 December 2018 areas follows:
(a) Remuneration of Directors received from the Company:
Name of DirectorFees
RM
Salaries, Bonuses,
Allowances and other
emolumentsRM
Benefits-in-kind
RMTotal
RM
Executive
Anton Syazi Dato’ Ahmad Sebi - 789,080 - 789,080
Lee Su Nie - 1,002,000 42,200 1,044,200
Non-Executive
Dato’ Ahmad Sebi Bakar 150,000 80,000 65,500 295,500Puan Sri Datin Masri Khaw Abdullah - - - -Yong Teck Ming 47,000 - - 47,000Rali Mohd Nor 42,844 - - 42,844
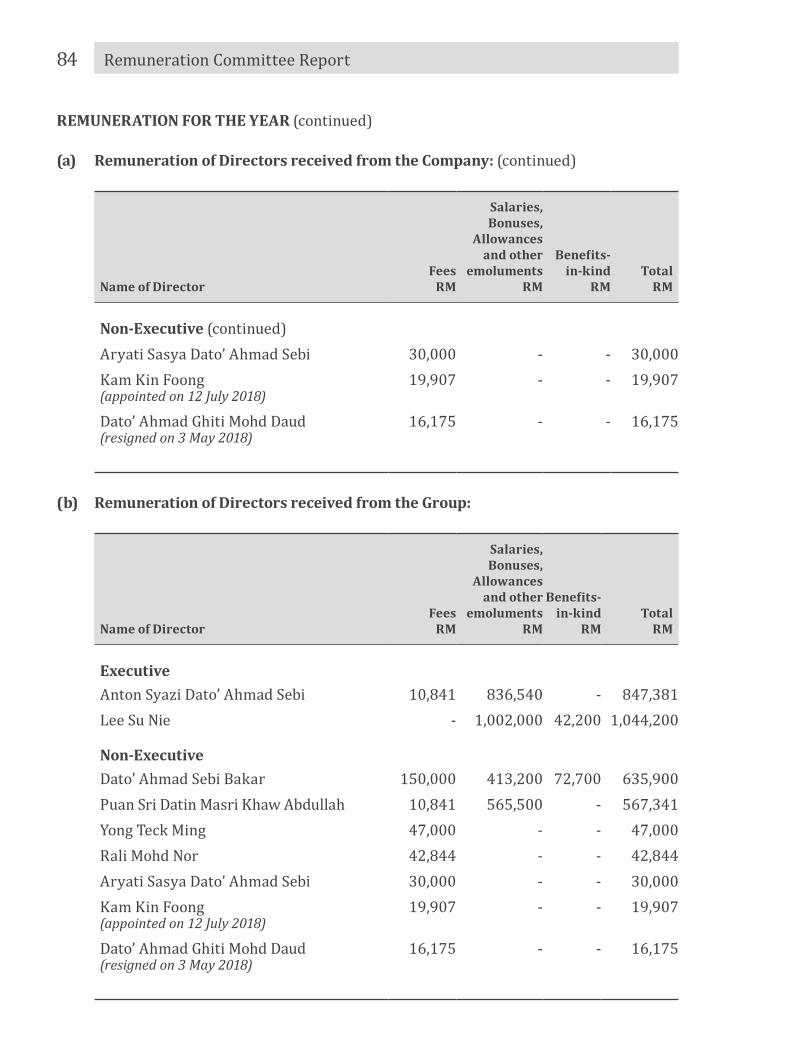
84 Remuneration Committee Report
REMUNERATION FOR THE YEAR (continued)
(a) Remuneration of Directors received from the Company: (continued)
Name of DirectorFees
RM
Salaries, Bonuses,
Allowances and other
emolumentsRM
Benefits-in-kind
RMTotal
RM
Non-Executive (continued)Aryati Sasya Dato’ Ahmad Sebi 30,000 - - 30,000Kam Kin Foong(appointed on 12 July 2018)
19,907 - - 19,907
Dato’ Ahmad Ghiti Mohd Daud(resigned on 3 May 2018)
16,175 - - 16,175
(b) Remuneration of Directors received from the Group:
Name of DirectorFees
RM
Salaries, Bonuses,
Allowances and other
emolumentsRM
Benefits-in-kind
RMTotal
RM
Executive
Anton Syazi Dato’ Ahmad Sebi 10,841 836,540 - 847,381Lee Su Nie - 1,002,000 42,200 1,044,200
Non-Executive
Dato’ Ahmad Sebi Bakar 150,000 413,200 72,700 635,900Puan Sri Datin Masri Khaw Abdullah 10,841 565,500 - 567,341Yong Teck Ming 47,000 - - 47,000Rali Mohd Nor 42,844 - - 42,844Aryati Sasya Dato’ Ahmad Sebi 30,000 - - 30,000Kam Kin Foong(appointed on 12 July 2018)
19,907 - - 19,907
Dato’ Ahmad Ghiti Mohd Daud(resigned on 3 May 2018)
16,175 - - 16,175

85ADVANCE SYNERGY BERHAD | annual report 2018 Remuneration Committee Report
REMUNERATION FOR THE YEAR (continued)
(c) Remuneration of top five (5) senior management:
In view of the competitive nature of the human resource market, the remuneration of the top five (5) senior management which includes salary, bonus, benefits in-kind and other emoluments for the financial year ended 31 December 2018 is disclosed in bands of RM50,000:
Remuneration Range Number of Senior Management staff
Between RM350,001 – RM400,000 1
Between RM400,001 – RM450,000 1
Between RM550,001 – RM600,000 1
Between RM600,001 – RM650,000 1
Between RM850,001 – RM900,000 1
86
Directors’responsibility statement
In presenting the annual financial statements and quarterly announcement of results, the Board aims to present a balanced and understandable assessment of the Group’s position and prospects. This also applies to other price sensitive public reports and reports to regulators. The Audit Committee assists the Board in scrutinising such reports to ensure accuracy and adequacy. The Audit Committee meets on a quarterly basis to review the integrity and reliability of the quarterly announcement of results. At least twice a year, the Audit Committee will meet to review the integrity and reliability of the Group’s annual financial results in the presence of the external auditors without the management, prior to recommending them for the Board’s approval and issuance to shareholders.
As part of the Directors’ responsibility for preparing financial statements, the Directors are required by the Act to prepare financial statements for each financial year which have been made out in accordance with applicable approved financial reporting standards in Malaysia and the Act so as to give a true and fair view of the financial position of the Group and the Company at the end of the financial year and of the financial performance and cash flows of the Group and the Company for the financial year. The Directors have the responsibility for ensuring that the Company keeps accounting records which disclose with reasonable accuracy the financial position of the Group and the Company and which enable them to ensure that the financial statements comply with the Act.
In preparing the financial statements, the Directors have:
• Selected suitable accounting policies and applied them consistently;
• Made judgments and estimates that are reasonable and prudent;
• Ensured that all applicable financial reporting standards have been followed; and
• Prepared financial statements on a going concern basis as the Directors have a reasonable expectation, having made enquiries, that the Group and the Company have adequate resources to continue in operational existence for the foreseeable future.
in respect of the auditedfinancial statements
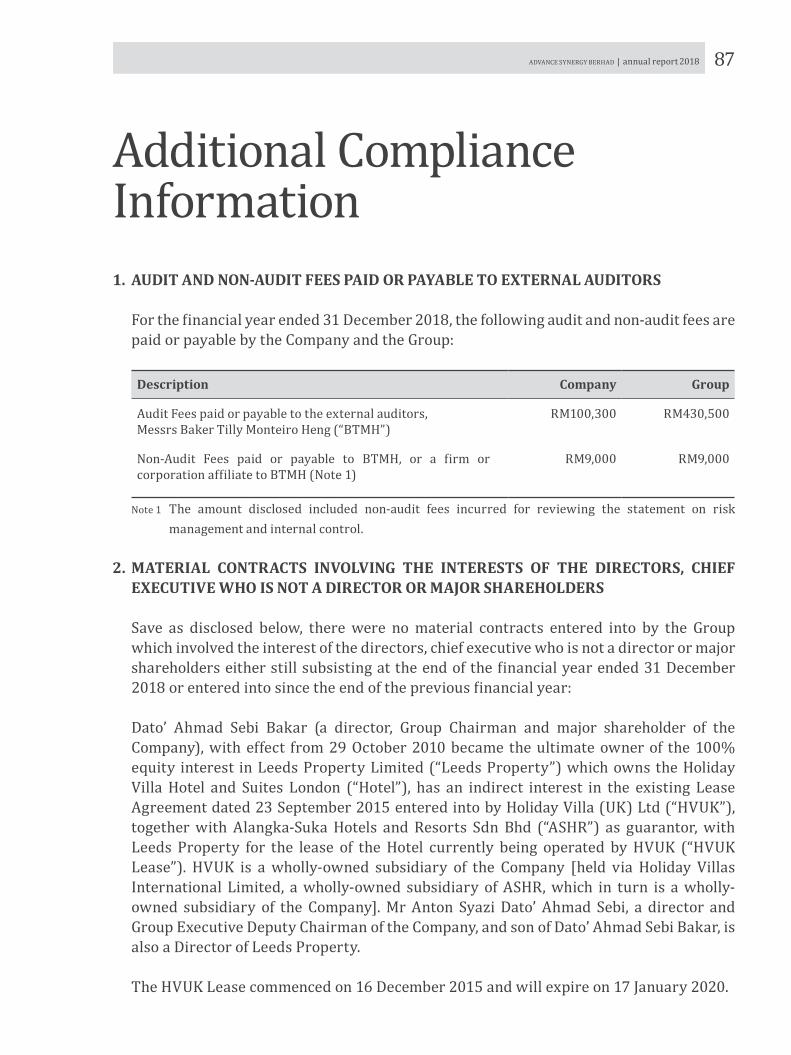
87ADVANCE SYNERGY BERHAD | annual report 2018
Additional ComplianceInformation1. AUDIT AND NON-AUDIT FEES PAID OR PAYABLE TO EXTERNAL AUDITORS
For the financial year ended 31 December 2018, the following audit and non-audit fees are paid or payable by the Company and the Group:
Description Company Group
Audit Fees paid or payable to the external auditors,Messrs Baker Tilly Monteiro Heng (“BTMH”)
RM100,300 RM430,500
Non-Audit Fees paid or payable to BTMH, or a firm or corporation affiliate to BTMH (Note 1)
RM9,000 RM9,000
Note 1 The amount disclosed included non-audit fees incurred for reviewing the statement on risk management and internal control.
2. MATERIAL CONTRACTS INVOLVING THE INTERESTS OF THE DIRECTORS, CHIEF EXECUTIVE WHO IS NOT A DIRECTOR OR MAJOR SHAREHOLDERS
Save as disclosed below, there were no material contracts entered into by the Group which involved the interest of the directors, chief executive who is not a director or major shareholders either still subsisting at the end of the financial year ended 31 December 2018 or entered into since the end of the previous financial year:
Dato’ Ahmad Sebi Bakar (a director, Group Chairman and major shareholder of the Company), with effect from 29 October 2010 became the ultimate owner of the 100% equity interest in Leeds Property Limited (“Leeds Property”) which owns the Holiday Villa Hotel and Suites London (“Hotel”), has an indirect interest in the existing Lease Agreement dated 23 September 2015 entered into by Holiday Villa (UK) Ltd (“HVUK”), together with Alangka-Suka Hotels and Resorts Sdn Bhd (“ASHR”) as guarantor, with Leeds Property for the lease of the Hotel currently being operated by HVUK (“HVUK Lease”). HVUK is a wholly-owned subsidiary of the Company [held via Holiday Villas International Limited, a wholly-owned subsidiary of ASHR, which in turn is a wholly-owned subsidiary of the Company]. Mr Anton Syazi Dato’ Ahmad Sebi, a director and Group Executive Deputy Chairman of the Company, and son of Dato’ Ahmad Sebi Bakar, is also a Director of Leeds Property.
The HVUK Lease commenced on 16 December 2015 and will expire on 17 January 2020.

88 Additional Compliance Information
3. OTHER INFORMATION
Synergy Realty Incorporated, an indirect wholly-owned subsidiary of the Company [held via Advance Synergy Properties Sdn Bhd] had provided funding via advances to and/or subscription of shares in HHL, a 40%-owned indirect associated company of the Company totaling GBP1,558,660 (equivalent RM8.83 million).
HHL owns a property in North London situated on Kilburn High Road comprising 38 serviced apartments and 12 residential apartments (“Kilburn Apartments”), ground floor retail unit and a basement unit. The above funding has been utilised for working capital and to refurbish and renovate the Kilburn Apartments and to convert the 50 existing units into a higher density configuration and such funding shall be unsecured, interest-free and to be repaid on demand.
Dato’ Ahmad Sebi Bakar, the Group Chairman and substantial shareholder of the Company, is a director of HHL and holds 35% equity interest in HHL.
His son, Mr Anton Syazi Dato’ Ahmad Sebi, who is the Group Executive Deputy Chairman of the Company and holds less than 5% equity interest in the Company, is a Director of HHL and owns 25% equity interest in HHL.

89ADVANCE SYNERGY BERHAD | annual report 2018
FINANCIALSTATEMENTS
Contents
Directors’ Report 90
Statements of Financial Position 99
Statements of Comprehensive Income 101
Statements of Changes in Equity 103
Statements of Cash Flows 106
Notes to the Financial Statements 110
Statement by Directors 232
Statutory Declaration 233
Independent Auditors’ Report 234

90
Directors’ Report
Company No. 1225 – D
1
ADVANCE SYNERGY BERHAD (Incorporated in Malaysia) DIRECTORS’ REPORT The directors hereby submit their report together with the audited financial statements of the Group and of the Company for the financial year ended 31 December 2018. PRINCIPAL ACTIVITIES The principal activities of the Company are that of investment holding and the provision of full corporate and financial support to its subsidiaries. The principal activities of the subsidiaries are stated in Note 9 to the financial statements. There have been no significant changes in the nature of these principal activities during the financial year. RESULTS
Group CompanyRM'000 RM'000
Net (loss)/profit for the financial year (1,142) 3,331
Attributable to:Owners of the parent (4,897) 3,331 Non-controlling interests 3,755 -
(1,142) 3,331 DIVIDENDS Since the end of the previous financial year, a first and final single tier dividend of 0.25 sen per ordinary share totalling RM2,322,982 in respect of the financial year ended 31 December 2017 was paid on 15 August 2018 after the approval from the shareholders of the Company was obtained at the Annual General Meeting held on 7 June 2018. At the forthcoming Annual General Meeting, a first and final single tier dividend of 0.25 sen per ordinary share in respect of the financial year ended 31 December 2018 will be proposed for shareholders’ approval. The financial statements for the current financial year do not reflect this proposed dividend. Such dividend, if approved by the shareholders, will be accounted for in equity as an appropriation of retained earnings in the financial year ending 31 December 2019. RESERVES AND PROVISIONS There were no material transfers to or from reserves or provisions during the financial year other than those disclosed in the financial statements.

91ADVANCE SYNERGY BERHAD | annual report 2018 Directors’ Report
Company No. 1225 – D
2
DIRECTORS’ REPORT (Continued) BAD AND DOUBTFUL DEBTS Before the financial statements of the Group and of the Company were prepared, the directors took reasonable steps to ascertain that action had been taken in relation to the writing off of bad debts and the making of allowance for doubtful debts, and had satisfied themselves that all known bad debts had been written off and adequate allowance had been made for doubtful debts. At the date of this report, the directors are not aware of any circumstances that would render the amount written off for bad debts or the amount of the allowance for doubtful debts in the financial statements of the Group and of the Company inadequate to any substantial extent. CURRENT ASSETS Before the financial statements of the Group and of the Company were prepared, the directors took reasonable steps to ensure that any current assets which were unlikely to be realised in the ordinary course of business including their values as shown in the accounting records of the Group and of the Company had been written down to an amount that they might be expected so to realise. At the date of this report, the directors are not aware of any circumstances which would render the values attributed to the current assets in the financial statements of the Group and of the Company misleading. VALUATION METHODS At the date of this report, the directors are not aware of any circumstances which have arisen which render adherence to the existing method of valuation of assets or liabilities of the Group and of the Company misleading or inappropriate. CONTINGENT AND OTHER LIABILITIES At the date of this report, there does not exist: (i) any charge on the assets of the Group or of the Company which has arisen since the end of the
financial year which secures the liabilities of any other person; and (ii) any contingent liabilities in respect of the Group or of the Company which has arisen since the end
of the financial year. In the opinion of the directors, no contingent or other liability of the Group and of the Company has become enforceable, or is likely to become enforceable within the period of twelve months after the end of the financial year which will or may affect the ability of the Group or of the Company to meet their obligations as and when they fall due. CHANGE OF CIRCUMSTANCES At the date of this report, the directors are not aware of any circumstances, not otherwise dealt with in this report or the financial statements of the Group and of the Company that would render any amount stated in the financial statements misleading.

92 Directors’ Report
Company No. 1225 – D
3
DIRECTORS’ REPORT (Continued) ITEMS OF MATERIAL AND UNUSUAL NATURE In the opinion of the directors, except as disclosed in the financial statements, (i) the results of the operations of the Group and of the Company for the financial year were not
substantially affected by any item, transaction or event of a material and unusual nature; and (ii) no item, transaction or event of a material and unusual nature has arisen in the interval between
the end of the financial year and the date of this report which is likely to affect substantially the results of the operations of the Group and of the Company for the financial year in which this report is made.
ISSUE OF SHARES AND DEBENTURES During the financial year, no new issue of shares or debentures were made by the Company. OPTIONS GRANTED OVER UNISSUED SHARES No options were granted to any person to take up unissued shares of the Company during the financial year. DIRECTORS The names of the directors of the Company in office during the financial year and during the period from the end of the financial year to the date of the report are: Dato’ Ahmad Sebi Bakar Anton Syazi Ahmad Sebi Lee Su Nie Puan Sri Datin Masri Khaw Abdullah Yong Teck Ming Rali Mohd Nor Aryati Sasya Ahmad Sebi Kam Kin Foong (Appointed on 12.07.2018) Dato’ Ahmad Ghiti Mohd Daud (Resigned on 03.05.2018) The names of the directors of the Company’s subsidiaries in office during the financial year and during the period from the end of the financial year to the date of this report are: Dato' Ahmad Sebi Bakar Anton Syazi Ahmad Sebi Lee Su Nie Tan Sri Dato’ Azman Shah Haron Puan Sri Datin Masri Khaw Abdullah Rali Mohd Nor Aryati Sasya Ahmad Sebi Ahmad Kamal Ali Merican Alain Cheseaux Ann Wan Kuan Armeda Haji Udin Chee Chong Fatt Chew Lee Fong

93ADVANCE SYNERGY BERHAD | annual report 2018 Directors’ Report
Company No. 1225 – D
4
DIRECTORS’ REPORT (Continued) DIRECTORS (Continued) The names of the directors of the Company’s subsidiaries in office during the financial year and during the period from the end of the financial year to the date of this report are (Continued): Chin Wei Li Chuah Seong Phaik Chye Kit Choong Cheah Foo Choong Dato’ Abdul Murad Khalid (Resigned on 03.09.2018) Datuk Hardew Kaur a/p Hazar Singh Frank Michael Turrisi Ho Ting Sai Hossam Ahmed Wahid Eldin Naguib Suwailem Ir. Haji Mansor Salleh @ Md Salleh Lee Chien Siong Lim Hong Hoo Md Nazri Mubin Julkiflee Ng Sai Kit Nina Karina Azman Shah Phang Deng Sheng Phuah Peng Hock Sng Ngiap Koon Triandi Putranta Soewando Wong Joon Hian Wong Kwai Yim, Woo Wong Tze Leng Yap Chee Kong Yap Wai Shoong Yong Choon Vooi Dato’ Ahmad Ghiti Mohd Daud (Resigned on 03.05.2018) REMUNERATION COMMITTEE The Remuneration Committee is responsible for setting the remuneration policy for all directors including the executive directors and other senior executives in the Group. The Remuneration Committee ensures that the Directors are fairly remunerated and rewarded for the contributions or individual level of responsibilities. Additionally the Remuneration Committee is responsible for determining the overall Remuneration Policy applied to the Group, including the quantum of variable remuneration and the method of delivery. The members of the Remuneration Committee during the financial year ended 31 December 2018 are as follows: • Rali Mohd Nor (Chairman, Independent Non-Executive Director)
(Appointed as Chairman on 12.07.2018) • Puan Sri Datin Masri Khaw Abdullah (Member, Non-Independent Non-Executive Director) • Kam Kin Foong (Member, Independent Non-Executive Director)
(Appointed on 12.07.2018) • Dato’ Ahmad Ghiti Mohd Daud (Chairman, Independent Non-Executive Director)
(Resigned on 03.05.2018)

94
Company No. 1225 – D
5
DIRECTORS’ REPORT (Continued) DIRECTORS’ INTERESTS According to the Register of Directors’ Shareholdings required to be kept by the Company under Section 59 of the Companies Act 2016 in Malaysia, the interests of the Directors in office at the end of the financial year in the securities of Advance Synergy Berhad (“ASB”) and shares of its related corporations during the financial year ended 31 December 2018 are as follows: Number of ASB ordinary shares At
1.1.2018 / Date of
Appointment
Bought
Sold
At 31.12.2018
Direct Interest Dato’ Ahmad Sebi Bakar # 76,810,009 - - 76,810,009 Kam Kin Foong 900,000 - - 900,000 Deemed Interest
Dato’ Ahmad Sebi Bakar # *192,338,936 47,052,917 - *1139,391,853 Anton Syazi Ahmad Sebi *230,467,000 - - *230,467,000 Lee Su Nie *3365,000 - - *3365,000 Puan Sri Datin Masri Khaw Abdullah *45,000,000 7,000,000 - *412,000,000 Number of ordinary shares At
1.1.2018 / Date of
Appointment
Bought
Sold
At 31.12.2018
Subsidiary Captii Limited (“Captii”) Direct Interest
Anton Syazi Ahmad Sebi 517,600 - - 517,600 Lee Su Nie 20,000 - - 20,000 Deemed Interest Kam Kin Foong *555,000 - - *555,000 Number of ordinary shares At
1.1.2018
Bought
Sold At
31.12.2018 Segi Koleksi Sdn. Bhd. (“SKSB”) Deemed Interest Dato’ Ahmad Sebi Bakar *6105,000 - - *6105,000 Anton Syazi Ahmad Sebi *7105,000 - - *7105,000 Aryati Sasya Ahmad Sebi *7105,000 - - *7105,000 Number of ordinary shares At
1.1.2018
Bought
Sold At
31.12.2018 Metroprime Corporation Sdn. Bhd. Deemed Interest Dato’ Ahmad Sebi Bakar *8350,000 - - *8350,000 Anton Syazi Ahmad Sebi *9350,000 - - *9350,000 Aryati Sasya Ahmad Sebi *9350,000 - - *9350,000
Directors’ Report
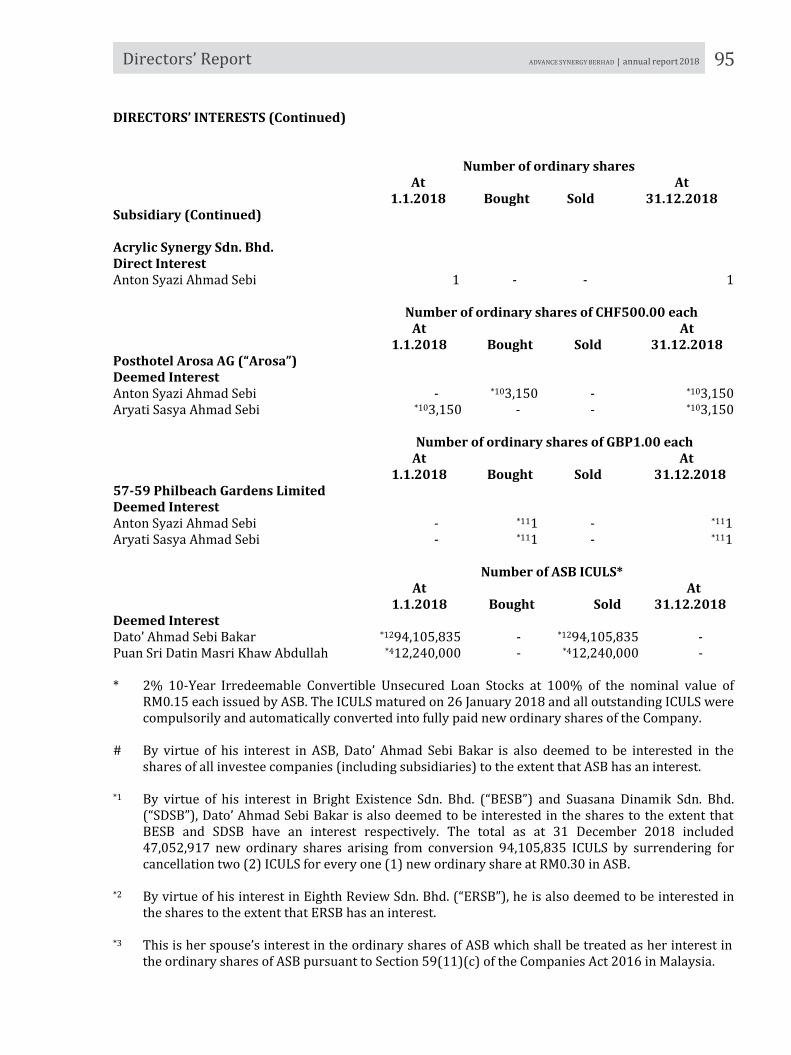
95ADVANCE SYNERGY BERHAD | annual report 2018 Directors’ Report
Company No. 1225 – D
6
DIRECTORS’ REPORT (Continued) DIRECTORS’ INTERESTS (Continued) Number of ordinary shares At
1.1.2018
Bought
Sold At
31.12.2018 Subsidiary (Continued) Acrylic Synergy Sdn. Bhd.
Direct Interest
Anton Syazi Ahmad Sebi 1 - - 1 Number of ordinary shares of CHF500.00 each At
1.1.2018
Bought
Sold At
31.12.2018 Posthotel Arosa AG (“Arosa”) Deemed Interest Anton Syazi Ahmad Sebi
-
*103,150
-
*103,150
Aryati Sasya Ahmad Sebi *103,150 - - *103,150 Number of ordinary shares of GBP1.00 each At
1.1.2018
Bought
Sold At
31.12.2018 57-59 Philbeach Gardens Limited Deemed Interest Anton Syazi Ahmad Sebi
-
*111
-
*111
Aryati Sasya Ahmad Sebi - *111 - *111 Number of ASB ICULS* At
1.1.2018
Bought
Sold At
31.12.2018 Deemed Interest Dato’ Ahmad Sebi Bakar *1294,105,835 - *1294,105,835 - Puan Sri Datin Masri Khaw Abdullah *412,240,000 - *412,240,000 - * 2% 10-Year Irredeemable Convertible Unsecured Loan Stocks at 100% of the nominal value of
RM0.15 each issued by ASB. The ICULS matured on 26 January 2018 and all outstanding ICULS were compulsorily and automatically converted into fully paid new ordinary shares of the Company.
# By virtue of his interest in ASB, Dato’ Ahmad Sebi Bakar is also deemed to be interested in the
shares of all investee companies (including subsidiaries) to the extent that ASB has an interest. *1 By virtue of his interest in Bright Existence Sdn. Bhd. (“BESB”) and Suasana Dinamik Sdn. Bhd.
(“SDSB”), Dato’ Ahmad Sebi Bakar is also deemed to be interested in the shares to the extent that BESB and SDSB have an interest respectively. The total as at 31 December 2018 included 47,052,917 new ordinary shares arising from conversion 94,105,835 ICULS by surrendering for cancellation two (2) ICULS for every one (1) new ordinary share at RM0.30 in ASB.
*2 By virtue of his interest in Eighth Review Sdn. Bhd. (“ERSB”), he is also deemed to be interested in
the shares to the extent that ERSB has an interest. *3 This is her spouse’s interest in the ordinary shares of ASB which shall be treated as her interest in
the ordinary shares of ASB pursuant to Section 59(11)(c) of the Companies Act 2016 in Malaysia.

96 Directors’ Report
Company No. 1225 – D
7
DIRECTORS’ REPORT (Continued) DIRECTORS’ INTERESTS (Continued) *4 By virtue of her interest in ASH Holdings Sdn. Bhd. (“ASH”), Puan Sri Datin Masri Khaw Abdullah is
deemed to be interested in the securities of ASB to the extent that ASH has an interest. The total as at 31 December 2018 included 6,120,000 new ordinary shares arising from conversion 12,240,000 ICULS by surrendering for cancellation two (2) ICULS for every one (1) new ordinary share at RM0.30 in ASB and 880,000 ordinary shares purchased in open market.
*5 This is her spouse’s interest in the ordinary shares of Captii which shall be treated as her interest in
the ordinary shares of Captii pursuant to Section 59(11)(c) of the Companies Act 2016 in Malaysia. *6 This is the interest of his children (Ms Aryati Sasya Ahmad Sebi and Mr Anton Syazi Ahmad Sebi) in
SKSB which shall be treated as his interest in the ordinary shares of SKSB pursuant to Section 59(11)(c) of the Companies Act 2016 in Malaysia.
*7 By virtue of their interest in Pacific Existence Sdn. Bhd. (“PESB”), Ms Aryati Sasya Ahmad Sebi and
Mr Anton Syazi Ahmad Sebi are also deemed to be interested in the shares to the extent that PESB has an interest.
*8 By virtue of his interest in SKSB pursuant to Section 8 of the Companies Act 2016 in Malaysia, Dato’
Ahmad Sebi Bakar is deemed to be interested in the shares to the extent that SKSB has an interest. *9 By virtue of their interest in SKSB via PESB, Ms Aryati Sasya Ahmad Sebi and Mr Anton Syazi Ahmad
Sebi are deemed to be interested in the shares to the extent that SKSB has an interest. *10 By virtue of their interest in Kibar Konsep Sdn. Bhd. (“KKSB”), Ms Aryati Sasya Ahmad Sebi and Mr
Anton Syazi Ahmad Sebi are also deemed to be interested in the shares to the extent that KKSB has an interest.
*11 By virtue of their interest in Arosa via KKSB, Ms Aryati Sasya Ahmad Sebi and Mr Anton Syazi
Ahmad Sebi are also deemed to be interested in the shares to the extent that Arosa has an interest. *12 By virtue of his interest in BESB, Dato’ Ahmad Sebi Bakar is deemed to be interested in the
securities of the Company to the extent that BESB has an interest. Other than as disclosed above, none of the other directors in office at the end of the financial year had any interest in the securities of the Company and shares of its related corporations during the financial year. DIRECTORS’ BENEFITS Since the end of the previous financial year, no director of the Company has received or become entitled to receive a benefit (other than benefits included in the aggregate amount of emoluments received or due and receivable by the directors shown in the Directors’ Remuneration and the financial statements) by reason of a contract made by the Company or a related corporation with the director or with a firm of which the director is a member, or with a company in which the director has a substantial financial interest, except as disclosed in Note 35 to the financial statements. Neither during, nor at the end of the financial year, was the Company a party to any arrangement where the object was to enable the directors to acquire benefits by means of the acquisition of ordinary shares in, or debentures of the Company or any other body corporate.

97ADVANCE SYNERGY BERHAD | annual report 2018 Directors’ Report
Company No. 1225 – D
8
DIRECTORS’ REPORT (Continued) INDEMNITY TO DIRECTORS AND OFFICERS During the financial year, the total amount of indemnity coverage and insurance premium paid for the directors and certain officers of the Company were RM30 million and RM34,310 respectively. DIRECTORS’ REMUNERATION
Group CompanyRM'000 RM'000
Directors' fees 328 306 Directors' other emoluments 2,817 1,791 Benefit-in-kind 115 108
SUBSIDIARIES The details of the Company’s subsidiaries are disclosed in Note 9 to the financial statements. The auditors’ reports on the accounts of the subsidiaries did not contain any qualification. SIGNIFICANT EVENTS DURING THE FINANCIAL YEAR Details of the significant events during the financial year are disclosed in Note 40 to the financial statements. SIGNIFICANT EVENTS SUBSEQUENT TO THE END OF THE FINANCIAL YEAR Details of the significant events subsequent to the end of the financial year are disclosed in Note 41 to the financial statements. AUDITORS’ REMUNERATION
Group CompanyRM'000 RM'000
Auditors' remuneration- statutory: - holding company 100 100 - subsidiaries 847 - - under/(over) accrual in prior years 2 (6) - non-statutory: - holding company 9 9

98 Directors’ Report
Company No. 1225 – D
9
DIRECTORS’ REPORT (Continued) AUDITORS The Company has agreed to indemnify the auditors of the Company as permitted under Section 289 of the Companies Act 2016 in Malaysia. The auditors, Messrs Baker Tilly Monteiro Heng PLT (converted from a conventional partnership, Baker Tilly Monteiro Heng on 5 March 2019), have expressed their willingness to continue in office. This report was approved and signed on behalf of the Board of Directors in accordance with a resolution of the directors: LEE SU NIE Director YONG TECK MING Director Selangor Darul Ehsan Date: 12 April 2019

99ADVANCE SYNERGY BERHAD | annual report 2018
Statements of Financial Positionas at 31 December 2018
Company No. 1225 – D
10
ADVANCE SYNERGY BERHAD (Incorporated in Malaysia) STATEMENTS OF FINANCIAL POSITION AS AT 31 DECEMBER 2018
2018 2017 2018 2017Note RM'000 RM'000 RM'000 RM'000
ASSETSNon-current assetsProperty, plant and equipment 5 158,965 156,848 23 30 Investment properties 6 49,789 8,060 - - Intangible assets 7 94,183 95,867 - - Investment in subsidiaries 9 - - 617,813 474,593 Investment in associates 10 43,781 46,742 - - Investment in joint venture 11 - - - - Investment securities 12 47,023 42,565 - - Deferred tax assets 13 4,341 3,191 - 9 Total non-current assets 398,082 353,273 617,836 474,632
Current assetsInventories 14 45,223 40,086 - - Trade and other receivables 15 119,059 139,125 144 141,559 Prepayments 8,623 6,674 - - Contract assets 16 7,321 - - - Tax recoverable 5,072 1,946 1,661 1,665 Investment securities 12 410 459 - - Financial assets held for trading 17 317 361 - - Cash and bank balances and short term deposits 18 141,240 158,047 6,808 4,093
Total current assets 327,265 346,698 8,613 147,317 TOTAL ASSETS 725,347 699,971 626,449 621,949
Group Company

100
Company No. 1225 – D
11
ADVANCE SYNERGY BERHAD (Incorporated in Malaysia)
STATEMENTS OF FINANCIAL POSITION AS AT 31 DECEMBER 2018 (Continued)
2018 2017 2018 2017Note RM'000 RM'000 RM'000 RM'000
EQUITY AND LIABILITIESEquity attributable to owners of the parent
Share capital 19 381,377 320,650 381,377 320,650 Other reserves 20 24,084 32,580 69 69 Retained earnings 20 16,725 18,902 12,763 11,755 ICULS - equity component 21 - 60,724 - 60,724 Shareholders' funds 422,186 432,856 394,209 393,198 Non-controlling interests 64,705 63,213 - - Total equity 486,891 496,069 394,209 393,198
Non-current liabilities
Borrowings 22 67,786 60,763 - - Deferred tax liabilities 13 4,521 5,362 - - Provision for retirement benefit obligations 23 1,666 1,747 - - ICULS - liability component 21 - 108 - 108 Total non-current liabilities 73,973 67,980 - 108
Current liabilitiesBorrowings 22 76,125 39,039 - - Tax payable 323 46 - - Trade and other payables 24 74,910 96,837 232,240 228,643 Contract liabilities 16 13,125 - - - Total current liabilities 164,483 135,922 232,240 228,643 Total liabilities 238,456 203,902 232,240 228,751
TOTAL EQUITY AND LIABILITIES 725,347 699,971 626,449 621,949
CompanyGroup
The accompanying notes form an integral part of these financial statements.
Statements of Financial Positionas at 31 December 2018 (continued)

101ADVANCE SYNERGY BERHAD | annual report 2018
Statements of Comprehensive Incomefor the financial year ended 31 December 2018
Company No. 1225 – D
12
ADVANCE SYNERGY BERHAD (Incorporated in Malaysia) STATEMENTS OF COMPREHENSIVE INCOMEFOR THE FINANCIAL YEAR ENDED 31 DECEMBER 2018
2018 2017 2018 2017Note RM'000 RM'000 RM'000 RM'000
Revenue 25 283,583 265,923 12,011 9,645
Cost of sales 26 (199,704) (176,091) - - Gross profit 83,879 89,832 12,011 9,645
Other operating income 19,685 20,762 - 1 Distribution costs (6,424) (6,202) - - Administrative expenses (60,294) (62,257) (4,594) (3,430) Other operating expenses (32,493) (27,704) (1,218) (870) Operating profit 27 4,353 14,431 6,199 5,346
Finance costs 28 (6,165) (5,245) (2,853) (2,340) Share of results of associates and joint ventures 2,159 (826) - - Profit before tax 347 8,360 3,346 3,006
Income tax expense 29 (1,489) (4,609) (15) (128) (Loss)/Profit for the financial year (1,142) 3,751 3,331 2,878
Other comprehensive income/(expenses) for the financial year, net of tax:Items that are or may be reclassified subsequently to profit or lossForeign currency translation differences for foreign operations (1,790) (7,798) - - Fair value gain on financial assets designated at fair value through other comprehensive income (3,135) - - - Fair value on available-for-sale financial assets - (2,170) - -
(4,925) (9,968) - - (4,925) (9,968) - -
Total comprehensive (loss)/income for the financial year (6,067) (6,217) 3,331 2,878
Group Company

102
Company No. 1225 – D
13
ADVANCE SYNERGY BERHAD (Incorporated in Malaysia) STATEMENTS OF COMPREHENSIVE INCOMEFOR THE FINANCIAL YEAR ENDED 31 DECEMBER 2018 (Continued)
2018 2017 2018 2017 Note RM'000 RM'000 RM'000 RM'000
(Loss)/Profit attributable to:Owners of the parent (4,897) (663) 3,331 2,878 Non-controlling interests 3,755 4,414 - -
(1,142) 3,751 3,331 2,878 Total comprehensive (loss)/income attributable to:Owners of the parent (8,350) (9,179) 3,331 2,878 Non-controlling interests 2,283 2,962 - -
(6,067) (6,217) 3,331 2,878
Loss per ordinary share attributable to owners of the parent (sen) -Basic 30 (0.54) (0.10) -Diluted 30 (0.54) (0.10)
Group Company
The accompanying notes form an integral part of these financial statements.
Statements of Comprehensive Incomefor the financial year ended 31 December 2018 (continued)

ADVANCE SYNERGY BERHAD | annual report 2018 103
Statements of Changes In Equityfor the financial year ended 31 December 2018
Shar
eCa
pita
lIC
ULS
-Equ
ity
Com
pone
ntR
eval
uati
onR
eser
ve
Exch
ange
T
ran
slat
ion
Res
erve
Fa
ir V
alue
Res
erve
Ret
aine
d Ea
rnin
gsTo
tal
Non
-Co
ntro
llin
g In
tere
sts
Tota
lEq
uity
RM’0
00RM
’000
RM’0
00RM
’000
RM’0
00RM
’000
RM’0
00RM
’000
RM’0
00G
roup
At 1
Janu
ary
2018
, 3
20,6
50
60,
724
23,
510
7,1
89
1,8
81
18,
902
432
,856
6
3,21
3 4
96,0
69
Net (
loss
)/pr
ofit
for t
he fi
nanc
ial y
ear
- -
- -
- (4
,897
) (4
,897
)3
,755
(1,1
42)
Fair
val
ue o
f fin
anci
al
asse
ts th
roug
h ot
her
com
preh
ensi
ve in
com
e -
- -
- (3
,135
) -
(3,1
35)
- (3
,135
)Re
alis
atio
n of
reva
luat
ion
rese
rve
- -
(5,0
43)
- -
5,0
43
- -
-Fo
reig
n cu
rren
cy
tra
nsla
tion
diffe
renc
es
for
fore
ign
oper
atio
ns -
- -
(318
) -
- (3
18)
(1,4
72)
(1,7
90)
Tota
l com
preh
ensi
ve (
loss
)/in
com
e fo
r the
f
inan
cial
yea
r -
- (5
,043
) (3
18)
(3,1
35)
146
(8,3
50)
2,2
83
(6,0
67)
Tra
nsa
ctio
ns
wit
h ow
ner
s:
Issu
e of
new
ord
inar
ysh
ares
pur
suan
t to
the
conv
ersi
on o
f ICU
LS 6
0,72
7 (6
0,72
4) -
- -
- 3
-
3Di
vide
nds p
aid
(Not
e 31
) -
- -
- -
(2,3
23)
(2,3
23)
- (2
,323
)Di
vide
nds p
aid
to n
on-
con
trol
ling
inte
rest
o
f a su
bsid
iary
- -
- -
- -
- (
791)
(79
1)To
tal t
rans
actio
nsw
ith o
wne
rs 6
0,72
7 (6
0,72
4) -
- -
(2,3
23)
(2,3
20)
(791
) (3
,111
)
At 3
1 De
cem
ber 2
018
381
,377
-
18,
467
6,8
71
(1,2
54)
16,
725
422
,186
6
4,70
5 4
86,8
91

104Sh
are
Capi
tal
ICU
LS-
Equi
tyCo
mpo
nent
Shar
e P
rem
ium
Rev
alua
tion
Res
erve
Exch
ange
T
ran
slat
ion
Res
erve
Fa
ir V
alue
Res
erve
Ret
aine
d Ea
rnin
gsTo
tal
Non
-Co
ntro
llin
g In
tere
sts
Tota
lEq
uity
Gro
upRM
’000
RM’0
00RM
’000
RM’0
00RM
’000
RM’0
00RM
’000
RM’0
00RM
’000
RM’0
00
At 1
Janu
ary
2017
, as
pre
viou
sly
repo
rted
199
,216
6
4,80
3 1
17,3
17
23,
510
13,
535
4,0
51
31,
591
454
,023
6
0,05
3 5
14,0
76
Effe
ct o
f com
plet
ion
of p
urch
ase
pric
e al
loca
tion
- -
- -
- -
(6,2
96)
(6,2
96)
3,7
10
(2,5
86)
At 1
Janu
ary
2017
, as
rest
ated
199
,216
6
4,80
3 1
17,3
17
23,
510
13,
535
4,0
51
25,
295
447
,727
6
3,76
3 5
11,4
90
Net (
loss
)/pr
ofit
for t
he fi
nanc
ial y
ear
- -
- -
- -
(663
) (6
63)
4,4
14
3,7
51
Fair
val
ue o
f fin
anci
al
asse
ts th
roug
h ot
her
com
preh
ensi
ve in
com
e -
- -
- -
(2,1
70)
- (2
,170
) -
(2,1
70)
Fore
ign
curr
ency
t
rans
latio
n di
ffere
nces
f
or fo
reig
n op
erat
ions
- -
- -
(6,3
46)
- -
(6,3
46)
(1,4
52)
(7,7
98)
Tota
l com
preh
ensi
ve (
loss
)/in
com
e fo
r the
f
inan
cial
yea
r -
- -
- (6
,346
) (2
,170
) (6
63)
(9,1
79)
2,9
62
(6,2
17)
Tra
nsa
ctio
ns
wit
h ow
ner
s:Ac
quis
ition
of a
dditi
onal
in
tere
st in
a su
bsid
iary
- -
- -
- -
(4,0
37)
(4,0
37)
(974
) (5
,011
)Is
sue
of n
ew o
rdin
ary
shar
es p
ursu
ant t
o th
eco
nver
sion
of I
CULS
4,1
17
(4,0
79)
- -
- -
- 3
8 -
38
Divi
dend
s pai
d (N
ote
31)
- -
- -
- -
(1,6
93)
(1,6
93)
- (1
,693
)Di
vide
nds p
aid
to n
on-
con
trol
ling
inte
rest
o
f a su
bsid
iary
- -
- -
- -
- -
(2,5
38)
(2,5
38)
Tota
l tra
nsac
tions
with
ow
ners
4,1
17
(4,0
79)
- -
- -
(5,7
30)
(5,6
92)
(3,5
12)
(9,2
04)
Tran
sitio
n to
no
par
valu
e re
gim
e 1
17,3
17
- (1
17,3
17)
- -
- -
- -
-
At 3
1 De
cem
ber 2
017
320
,650
6
0,72
4 -
23,
510
7,1
89
1,8
81
18,
902
432
,856
6
3,21
3 4
96,0
69
Statements of Changes In Equityfor the financial year ended 31 December 2018 (continued)

105ADVANCE SYNERGY BERHAD | annual report 2018 Statements of Changes In Equityfor the financial year ended 31 December 2018 (continued)
Company No. 1225 – D
16
ADVANCE SYNERGY BERHAD (Incorporated in Malaysia) STATEMENTS OF CHANGES IN EQUITYFOR THE FINANCIAL YEAR ENDED 31 DECEMBER 2018 (Continued)
ICULS-Share Equity Share Capital Retained
Capital Component Premium Reserve Earnings TotalCompany RM'000 RM'000 RM'000 RM'000 RM'000 RM'000
At 1 January 2017 199,216 64,803 117,317 69 10,570 391,975
Total comprehensive income for the financial year - - - - 2,878 2,878
Transactions with owners:Issue of new ordinary shares pursuant to the conversion of ICULS 4,117 (4,079) - - - 38 Dividends paid - - - - (1,693) (1,693) Total transactions with owners 4,117 (4,079) - - (1,693) (1,655)
Transition to no par value regime 117,317 - (117,317) - - - At 31 December 2017 320,650 60,724 - 69 11,755 393,198
Total comprehensive income for the financial year - - - - 3,331 3,331
Transactions with owners:Issue of new ordinary shares pursuant to the conversion of ICULS 60,727 (60,724) - - - 3 Dividends paid - - - - (2,323) (2,323) Total transactions with owners 60,727 (60,724) - - (2,323) (2,320) At 31 December 2018 381,377 - - 69 12,763 394,209
The accompanying notes form an integral part of these financial statements.

106
Statements of Cash Flowsfor the financial year ended 31 December 2018
Company No. 1225 – D
17
ADVANCE SYNERGY BERHAD (Incorporated in Malaysia) STATEMENTS OF CASH FLOWSFOR THE FINANCIAL YEAR ENDED 31 DECEMBER 2018
2018 2017 2018 2017Note RM'000 RM'000 RM'000 RM'000
CASH FLOWS FROM OPERATING ACTIVITIES:Profit before tax 347 8,360 3,346 3,006 Adjustments for: Write down of inventories 14 12 - - Amortisation of intangible assets 1,497 1,825 - - Bad debts written off 186 151 - - Depreciation 5,631 6,411 8 8 (Gain)/Loss on disposal of: - property, plant and equipment (23) 16 - - - an associate (5,239) - - - - fair value through profit or loss investment securities (231) - - - Gross dividend income (804) (5) - - Impairment loss on: - goodwill 1,497 540 - - - development expenditure 37 - - - Expected credit losses on receivables 1,210 637 - - Insurance claim compensation - (12,161) - - Interest expenses 6,165 5,245 2,853 2,340 Interest income (2,420) (3,015) (29) (24) Net unrealised loss on foreign exchange 426 1,828 - -
Property, plant and equipment written off 1,035 96 - - Provision for retirement benefits obligations 332 206 - - Share of results in associates and joint venture (2,159) 826 - -
Reversal of expected credit losses on receivables - (60) - - Fair value change in: - investment in associates 927 744 - - - foreign currency held for trading 2 8 - - - held for trading investments 49 2 - - - investment properties 1,060 - - - - fair value through profit or loss investment securities (5,852) 658 - - Write back of payables - (198) - -
Operating profit before working capital changes 3,687 12,126 6,178 5,330
Group Company

ADVANCE SYNERGY BERHAD | annual report 2018 107
Notes to the Financial Statements31 December 2018 (continued)
Statements of Cash Flowsfor the financial year ended 31 December 2018 (continued)
Company No. 1225 – D
18
ADVANCE SYNERGY BERHAD (Incorporated in Malaysia) STATEMENTS OF CASH FLOWSFOR THE FINANCIAL YEAR ENDED 31 DECEMBER 2018 (Continued)
2018 2017 2018 2017Note RM'000 RM'000 RM'000 RM'000
Changes in working capital: Inventories (5,150) 1,918 - - Receivables 9,399 6,117 (1,464) 2,990 Financial assets held for trading 42 60 - - Payables (7,767) 2,038 4,653 2
Net cash generated from operations 211 22,259 9,367 8,322
Retirement benefits paid (413) (68) - - Tax paid (6,317) (6,740) (2) (7)
Net cash (used in)/generated from operating activities (6,519) 15,451 9,365 8,315
CASH FLOWS FROM INVESTING ACTIVITIES:Acquisition of intangibles assets (1,298) (1,007) - - Acquisition of additional shares in an existing subsidiary - (5,010) - - Acquisition of fair value through profit or loss investment securities (3,415) (13,975) - - Acquisition of additional shares in an associate (1,991) (1,916) - - Dividend income received 804 5 - - Interest received 2,420 3,015 29 24 Proceeds from disposal of fair value through profit or loss investment securities 2,286 - - - Proceeds from disposal of property, plant and equipment 23 25 - - Proceeds from disposal an associate 11,630 - - - Capital repayment from investment securities - 1,320 - - Proceeds from insurance claim compensation - 52,822 - - Purchase of property, plant and equipment (a) (8,907) (11,990) (1) (2) Purchase of investment properties (42,789) - - -
Net cash (used in)/generated from investing activities (41,237) 23,289 28 22
Group Company

108
Notes to the Financial Statements31 December 2018 (continued)
Statements of Cash Flowsfor the financial year ended 31 December 2018 (continued)
Company No. 1225 – D
19
ADVANCE SYNERGY BERHAD (Incorporated in Malaysia) STATEMENTS OF CASH FLOWS FOR THE FINANCIAL YEAR ENDED 31 DECEMBER 2018 (Continued)
2018 2017 2018 2017Note RM'000 RM'000 RM'000 RM'000
CASH FLOWS FROM FINANCING ACTIVITIES: (b) Dividends paid to non-controlling interests of a subsidiary (791) (2,538) - - Dividends paid (2,323) (1,693) (2,323) (1,693) Banker acceptance 900 - - - Debtor financing 5,228 - - - Drawdown of term loans 33,074 - - - Drawdown of revolving credit 6,000 14,250 - - Interest paid (7,309) (6,757) (4,355) (3,860) Payments to hire purchase payables (59) (57) - - Placement of pledged deposits (2,366) (5,180) - - Repayment of term loans (1,711) (19,660) - - - - Net cash generated from/(used in) financing activities 30,643 (21,635) (6,678) (5,553)
Effects of exchange rate changes (3,169) (3,258) - -
NET CHANGE IN CASH AND CASH EQUIVALENTS (20,282) 13,847 2,715 2,784
CASH AND CASH EQUIVALENTS AT THE BEGINNING OF THE FINANCIAL YEARAs previously reported 114,289 102,998 4,093 1,309 Effect of exchange rate changes 431 (2,556) - -
114,720 100,442 4,093 1,309
CASH AND CASH EQUIVALENTS AT THE END OF THE FINANCIAL YEAR 94,438 114,289 6,808 4,093
ANALYSIS OF CASH AND CASH EQUIVALENTS: Cash and bank balances 18 67,368 79,392 258 243 Short term deposits 18 73,872 78,655 6,550 3,850 Bank overdrafts 22 (2,404) (1,728) - -
138,836 156,319 6,808 4,093 Less: Deposit placed with lease payables as security deposit for lease payments 18(c) (24,890) (24,745) - - Less: Deposit pledged to licensed banks 18(a) (18,886) (16,683) - - Less: Cash held under Housing Development Account 18(b) (622) (602) - -
94,438 114,289 6,808 4,093
Group Company

ADVANCE SYNERGY BERHAD | annual report 2018 109
Notes to the Financial Statements31 December 2018 (continued)
Statements of Cash Flowsfor the financial year ended 31 December 2018 (continued)
Company No. 1225 – D
20
ADVANCE SYNERGY BERHAD (Incorporated in Malaysia) STATEMENTS OF CASH FLOWSFOR THE FINANCIAL YEAR ENDED 31 DECEMBER 2018 (Continued)
(a) Purchase of property, plant and equipment
2018 2017 2018 2017RM'000 RM'000 RM'000 RM'000
Purchase of property, plant and equipment 8,907 11,990 1 2
(b) Reconciliation of liabilities arising from financial liabilitiesForeign
Cash exchange1.1.2018 flows movement 31.12.2018RM'000 RM'000 RM'000 RM'000
Revolving credit 35,000 6,000 - 41,000 Finance lease payable 23,017 - - 23,017 Hire purchase payables 193 (59) - 134 Term loans 39,864 31,364 - 71,228 Banker acceptance - 900 - 900 Debtor financing - 5,228 - 5,228
98,074 43,433 - 141,507
Cash Foreignflows exchange
1.1.2017 movement movement 31.12.2017RM'000 RM'000 RM'000 RM'000
Revolving credit 20,750 14,250 - 35,000 Finance lease payable 23,009 8 - 23,017 Hire purchase 250 (57) - 193 Term loans 59,235 (19,660) 289 39,864
103,244 (5,459) 289 98,074
Group Company
The accompanying notes form an integral part of these financial statements.

110
Notes to the Financial Statements31 December 2018
Company No. 1225 – D
21
ADVANCE SYNERGY BERHAD (Incorporated in Malaysia) NOTES TO THE FINANCIAL STATEMENTS 1. GENERAL INFORMATION
The principal activities of the Company during the financial year are that of investment holding and the provision of full corporate and financial support to its subsidiaries. The principal activities of the Company’s subsidiaries are stated in Note 9 to the financial statements. There have been no significant changes in the nature of these principal activities during the financial year. The Company is a public limited liability company, incorporated and domiciled in Malaysia and listed on the Main Market of Bursa Malaysia Securities Berhad (“Bursa Securities”).
The registered office of the Company is located at Level 3, East Wing, Wisma Synergy, No. 72, Pesiaran Jubli Perak, Seksyen 22, 40000 Shah Alam, Selangor Darul Ehsan.
The principal place of business of the Company is located at Level 3, West Wing, Wisma Synergy, No. 72, Pesiaran Jubli Perak, Seksyen 22, 40000 Shah Alam, Selangor Darul Ehsan.
The financial statements are expressed in Ringgit Malaysia (“RM”) and all values are rounded to
the nearest thousand (’000) except when otherwise stated.
The financial statements were approved and authorised for issue by the Board of Directors in accordance with a resolution of the directors on 12 April 2019.
2. BASIS OF PREPARATION
2.1 Statement of Compliance
The financial statements of the Group and the Company have been prepared in accordance with the Malaysian Financial Reporting Standards (“MFRSs”), International Financial Reporting Standards and the requirements of the Companies Act 2016 in Malaysia.
2.2 Adoption of new MFRSs, amendments/improvements to MFRSs and new IC
Interpretation (“IC Int”)
The Group and the Company have adopted the following new MFRSs, amendments/improvements to MFRSs and new IC Int that are mandatory for the current financial year: New MFRSs MFRS 9 Financial Instruments MFRS 15 Revenue from Contracts with Customers Amendments/Improvements to MFRSs MFRS 1 First-time adoption of MFRSs MFRS 2 Share-based Payment MFRS 4 Insurance Contracts MFRS 128 Investments in Associates and Joint Ventures MFRS 140 Investment Property New IC Int
IC Int 22 Foreign Currency Transactions and Advance Consideration

ADVANCE SYNERGY BERHAD | annual report 2018 Notes to the Financial Statements31 December 2018 (continued)
111 Company No. 1225 – D
22
2. BASIS OF PREPARATION (Continued)
2.2 Adoption of new MFRSs, amendments/improvements to MFRSs and new IC Interpretation (“IC Int”) (Continued)
The adoption of the above new MFRSs, amendments/improvements to MFRSs and new IC Int did not have any significant effect on the financial statements of the Group and of the Company, and did not result in significant changes to the Group’s and the Company’s existing accounting policies, except for those as discussed below.
MFRS 9 Financial Instruments MFRS 9 replaced the guidance of MFRS 139, Financial Instruments: Recognition and Measurement on the classification and measurement of financial assets and liabilities, on impairment of financial assets, and on hedge accounting. Key requirements of MFRS 9: MFRS 9 introduces an approach for classification and measurement of financial
assets which is driven by cash flow characteristics and the business model in which an asset is held.
In essence, if a financial asset is a simple debt instrument and the objective of the entity’s business model within which it is held is to collect its contractual cash flows, the financial asset is measured at amortised cost. In contrast, if that asset is held in a business model the objective of which is achieved by both collecting contractual cash flows and selling financial assets, then the financial asset is measured at fair value in the statements of financial position, and amortised cost information is provided through profit or loss. If the business model is neither of these, then fair value information is increasingly important, so it is provided both in the profit or loss and in the statements of financial position.
MFRS 9 introduces a new, expected-loss impairment model that will require more
timely recognition of expected credit losses which replaced the “incurred loss” model in MFRS 139. Specifically, this Standard requires entities to account for expected credit losses from when financial instruments are first recognised and to recognise full lifetime expected losses on a more timely basis. The model requires an entity to recognise expected credit losses at all times and to update the amount of expected credit losses recognised at each reporting date to reflect changes in the credit risk of financial instruments. This model eliminates the threshold for the recognition of expected credit losses, so that it is no longer necessary for a trigger event to have occurred before credit losses are recognised. Trade receivables and contract assets that do not contain a significant financing component shall always measure the loss allowance at an amount equal lifetime expected credit losses.
MFRS 9 introduces a substantially-reformed model for hedge accounting, with
enhanced disclosures about risk management activity. The new model represents a significant overhaul of hedge accounting that aligns the accounting treatment with risk management activities, enabling entities to better reflect these activities in their financial statements. In addition, as a result of these changes, users of the financial statements will be provided with better information about risk management and the effect of hedge accounting on the financial statements.

Notes to the Financial Statements31 December 2018 (continued)
112 Company No. 1225 – D
23
2. BASIS OF PREPARATION (Continued)
2.2 Adoption of new MFRSs, amendments/improvements to MFRSs and new IC Interpretation (“IC Int”) (Continued)
MFRS 9 Financial Instruments (Continued) The retrospective application of MFRS 9 does not require restatement of 2017 comparative financial statements. As such, the Group and the Company have not restated the comparative information, which continues to be reported under MFRS 139. The Group and the Company recognised any difference between the carrying amount of financial instruments under MFRS 139 and the restated carrying amount under MFRS 9 in the opening balance of retained earnings of the annual reporting period including the date of initial application i.e. 1 January 2018. Impact of the adoption of MFRS 9 The adoption of MFRS 9 resulted in changes in accounting policies and adjustments to the amounts recognised in the financial statements. Other than the enhanced new disclosures relating to financial instruments, which the Group and the Company have complied with in the current financial year, the adoption of this standard does not have any significant effect on the financial statements of the Group and the Company, except for those as discussed below. (i) Classification and measurement
The following is the changes in the classification of the Group’s and the Company’s financial assets: Trade and other receivables, including refundable deposits previously classified as Loans and Receivables under MFRS 139 as at 31 December 2017 are held to collect contractual cash flows and give rise to cash flows representing solely payments of principal and interest. Accordingly, these financial assets are classified and measured as debt instruments at amortised cost beginning 1 January 2018.

ADVANCE SYNERGY BERHAD | annual report 2018 Notes to the Financial Statements31 December 2018 (continued)
113 Company No. 1225 – D
24
2. BASIS OF PREPARATION (Continued)
2.2 Adoption of new MFRSs, amendments/improvements to MFRSs and new IC Interpretation (“IC Int”) (Continued)
MFRS 9 Financial Instruments (Continued)
Impact of the adoption of MFRS 9 (Continued)
(i) Classification and measurement (Continued)
In summary, upon the adoption of MFRS 9, the Group and the Company had the following reclassification as at 1 January 2018:
1 January 2018
Fair value through profit
or lossAmortised
cost
Fair value through other
comprehensive income
MFRS 139 measurement category RM'000 RM'000 RM'000 RM'000
Financial assetsGroupLoan and receivablesTrade and other receivables 139,125 - 139,125 - Cash and bank balances and short term deposits 158,047 - 158,047 - Available-for-salesQuoted securities 9,650 - - 9,650 Unquoted securities 4,036 - - 4,036 Fair value through profit or lossQuoted securities 459 459 - - Unquoted securities 28,879 28,879 - - Financial assets held for trading 361 361 - -
CompanyLoan and receivablesTrade and other receivables 141,559 - 141,559 - Cash and bank balances and short term deposits 4,093 - 4,093 -
MFRS 9 measurement category
(ii) Impairment In previous financial years, trade and other receivables are impaired if, and only if, there is objective evidence of impairment as a result of one or more events that occurred after initial recognition of the receivables (a ‘loss event’) and that loss event (or events) has an impact on the estimated future cash flows of the receivables (“incurred loss model”). Upon adoption of MFRS 9, the Group and the Company are recording expected credit losses on all its trade and other receivables, either on a 12-month or lifetime basis. Accordingly, the Group and Company do not recognise additional impairment losses on its trade and other receivables at the date of initial application arising from application of simplified approach and general approach respectively to reconcile the lifetime expected credit losses.

Notes to the Financial Statements31 December 2018 (continued)
114 Company No. 1225 – D
25
2. BASIS OF PREPARATION (Continued)
2.2 Adoption of new MFRSs, amendments/improvements to MFRSs and new IC Interpretation (“IC Int”) (Continued)
MFRS 15 Revenue from Contracts with Customers
The core principle of MFRS 15 is that an entity recognises revenue to depict the transfer of promised goods or services to customers in an amount that reflects the consideration to which the entity expects to be entitled in exchange for those goods or services. An entity recognises revenue in accordance with the core principle by applying the following steps:
(i) identify the contracts with a customer; (ii) identify the performance obligation in the contract; (iii) determine the transaction price; (iv) allocate the transaction price to the performance obligations in the contract; (v) recognise revenue when (or as) the entity satisfies a performance obligation. MFRS 15 also includes new disclosures that would result in an entity providing users of financial statements about the nature, amount, timing and uncertainty of revenue and cash flows from contracts with customers. The following MFRSs and IC Interpretations will be withdrawn on the application of MFRS 15: MFRS 111 Construction Contracts MFRS 118 Revenue IC Interpretation 13 Customer Loyalty Programmes IC Interpretation 15 Agreements for the Construction of Real Estate IC Interpretation 18 Transfers of Assets from Customers IC Interpretation 131 Revenue – Barter Transactions Involving Advertising Services The Group and the Company have applied MFRS 15 retrospectively with the cumulative effect of initial application recognised as an adjustment to the opening balance of retained earnings (or other components of equity) at the date of initial application of 1 January 2018. As such, the comparative information was not restated and continues to be reported under MFRS 111, MFRS 118 and related Interpretations. The Group and the Company have elected the practical expedient to apply the standard only to contracts that are not completed as at 1 January 2018. The Group and the Company also elected the practical expedient of not to retrospectively restate the contract for those modifications before the date of initial application, but instead, to reflect the aggregate effect of all past contract modifications when identifying the performance obligations, and determining and allocating the transaction price to the satisfied and unsatisfied performance obligations.

ADVANCE SYNERGY BERHAD | annual report 2018 Notes to the Financial Statements31 December 2018 (continued)
115 Company No. 1225 – D
26
2. BASIS OF PREPARATION (Continued)
2.2 Adoption of new MFRSs, amendments/improvements to MFRSs and new IC Interpretation (“IC Int”) (Continued)
MFRS 15 Revenue from Contracts with Customers (Continued) Impact of the adoption of MFRS 15 The adoption of MFRS 15 resulted in changes in accounting policies and adjustments to the amounts recognised in the financial statements. Other than the enhanced new disclosures relating to contracts with customers, which the Group and the Company have complied with in the current financial year, the adoption of this standard does not have any significant effect on the financial statements of the Group and the Company, except for those as discussed below. Presentation of contract assets and contract liabilities The Group and the Company have changed the presentation of certain amounts in the statements of financial position to reflect the terminology of MFRS 15.
Contract assets recognised in relation to property development contracts and system sales contracts which previously presented as accrued billing and amount owing from customers for contract work.
Contract liabilities recognised in relation to expected volume discounts and refunds to customers which were previously presented as provisions.
The effect of adoption of MFRS 15 as at 1 January 2018 is as follows:
Increase/ (Decrease)
Group RM'000AssetsCurrent assetsTrade and other receivables (15,056) Contract assets 15,056
LiabilitiesCurrent liabilitiesTrade and other payables (6,475) Contract liabilities 6,475

Notes to the Financial Statements31 December 2018 (continued)
116 Company No. 1225 – D
27
2. BASIS OF PREPARATION (Continued)
2.2 Adoption of new MFRSs, amendments/improvements to MFRSs and new IC Interpretation (“IC Int”) (Continued)
MFRS 15 Revenue from Contracts with Customers (Continued) The amounts by which each financial statement line item is affected as at and for the financial year ended 31 December 2018 as a result of the adoption of MFRS 15, including the reasons for the significant changes, are as follows: Statements of financial position
MFRS 15MFRS 111 / MFRS 118
Increase/ (Decrease)
Group RM'000 RM'000 RM'000AssetsCurrent assetsTrade and other receivables 119,059 126,380 (7,321) Contract assets - 7,321 7,321
LiabilitiesCurrent liabilitiesTrade and other payables 74,910 88,035 (13,125) Contract liabilities - 13,125 13,125
Reported under
The adoption of MFRS 9 and MFRS 15 did not have a material impact on the Group’s and the Company’s profit or loss, operating, investing and financing cash flows. Amendments to MFRS 128 Investments in Associates and Joint Ventures Amendments to MFRS 128 clarify that an entity, which is a venture capital organisation, or a mutual fund, unit trust or similar entities, has an investment-by-investment choice to measure its investments in associates or joint ventures at fair value through profit or loss. Amendments to MFRS 140 Investment Property Amendments to MFRS 140 clarify that to transfer to, or from, investment properties there must be evidence of a change in use. To conclude if a property has changed use there should be an assessment of whether the property meets the definition of investment property. A change in intention, in isolation, does not provide evidence of a change in use. The amendments also clarify that the list of circumstances that evidence a change in use is not exhaustive. IC Int 22 Foreign Currency Transactions and Advance Consideration IC Int 22 clarifies that the date of the transaction for the purpose of determining the exchange rate to use on initial recognition of the related asset, expense or income (or part of it) is the date on which an entity initially recognises the non-monetary asset or non-monetary liability arising from the payment or receipt of advance consideration.

ADVANCE SYNERGY BERHAD | annual report 2018 Notes to the Financial Statements31 December 2018 (continued)
117 Company No. 1225 – D
28
2. BASIS OF PREPARATION (Continued)
2.3 New MFRSs, amendments/improvements to MFRSs, new IC Interpretation (“IC Int”) and amendments to IC Int that have been issued, but yet to be effective
The Group and the Company have not adopted the following new MFRSs, amendments/improvements to MFRSs, new IC Int and amendments to IC Int that have been issued, but yet to be effective:
Effective for financial
periods beginning on
or after New MFRSs MFRS 16 Leases 1 January 2019 MFRS 17 Insurance Contracts 1 January 2021 Amendments/Improvements to MFRSs MFRS 1 First-time Adoption of Malaysian Financial Reporting
Standards 1 January 2021#
MFRS 2 Share-based Payment 1 January 2020* MFRS 3 Business Combinations 1 January 2019/ 1 January 2020* MFRS 5 Non-current Assets Held for Sale and Discontinued
Operations 1 January 2021#
MFRS 6 Exploration for and Evaluation of Mineral Resources 1 January 2020* MFRS 7 Financial Instruments: Disclosures 1 January 2021# MFRS 9 Financial Instruments 1 January 2019 MFRS 10 Consolidated Financial Statements Deferred MFRS 11 Joint Arrangements 1 January 2019 MFRS 14 Regulatory Deferral Accounts 1 January 2020* MFRS 15 Revenue from Contracts with Customers 1 January 2021# MFRS 101 Presentation of Financial Statements 1 January 2020* MFRS 107 Statements of Cash Flows 1 January 2021# MFRS 108 Accounting Policies, Changes in Accounting Estimates
and Errors 1 January 2020*
MFRS 112 Income Taxes 1 January 2019 MFRS 116 Property, Plant and Equipment 1 January 2021# MFRS 119 Employee Benefits 1 January 2019 MFRS 123 Borrowing Costs 1 January 2019 MFRS 128 Investments in Associates and Joint Ventures 1 January 2019/
Deferred MFRS 132 Financial instruments: Presentation 1 January 2021# MFRS 134 Interim Financial Reporting 1 January 2020* MFRS 136 Impairment of Assets 1 January 2021# MFRS 137 Provisions, Contingent Liabilities and Contingent
Assets 1 January 2020*
MFRS 138 Intangible Assets 1 January 2020* MFRS 140 Investment Property 1 January 2021#
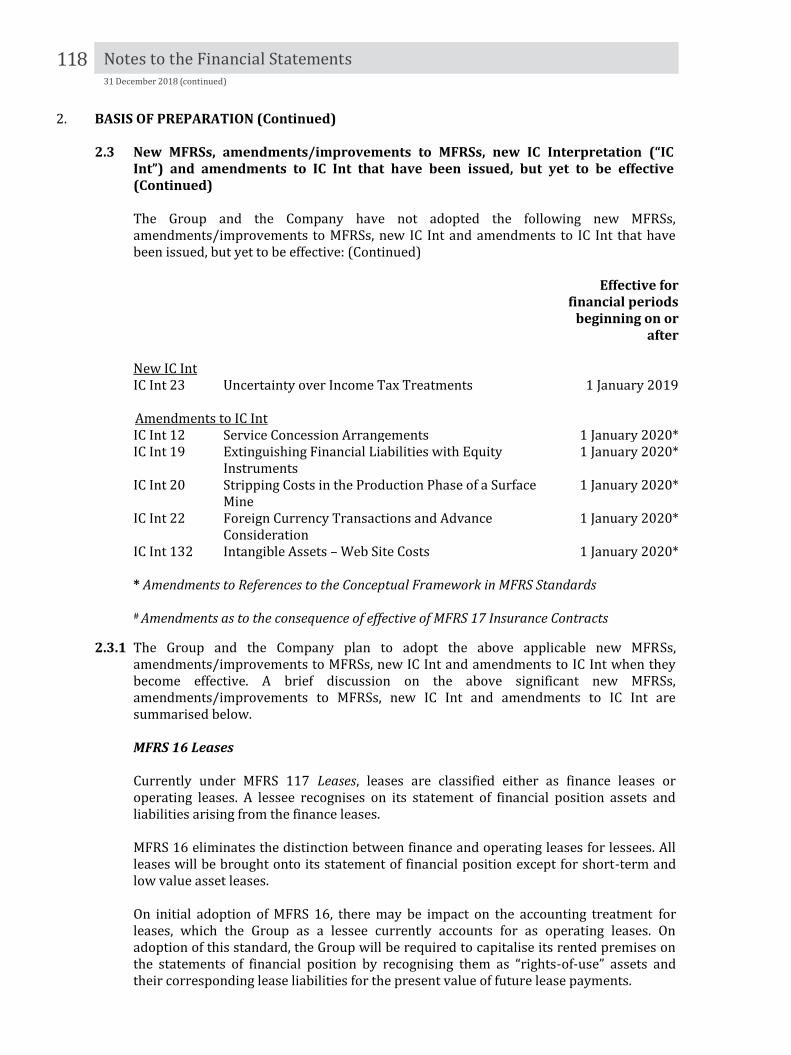
Notes to the Financial Statements31 December 2018 (continued)
118 Company No. 1225 – D
29
2. BASIS OF PREPARATION (Continued)
2.3 New MFRSs, amendments/improvements to MFRSs, new IC Interpretation (“IC Int”) and amendments to IC Int that have been issued, but yet to be effective (Continued) The Group and the Company have not adopted the following new MFRSs, amendments/improvements to MFRSs, new IC Int and amendments to IC Int that have been issued, but yet to be effective: (Continued) Effective for
financial periods beginning on or
after New IC Int IC Int 23 Uncertainty over Income Tax Treatments 1 January 2019 Amendments to IC Int IC Int 12 Service Concession Arrangements 1 January 2020* IC Int 19 Extinguishing Financial Liabilities with Equity
Instruments 1 January 2020*
IC Int 20 Stripping Costs in the Production Phase of a Surface Mine
1 January 2020*
IC Int 22 Foreign Currency Transactions and Advance Consideration
1 January 2020*
IC Int 132 Intangible Assets – Web Site Costs 1 January 2020*
* Amendments to References to the Conceptual Framework in MFRS Standards # Amendments as to the consequence of effective of MFRS 17 Insurance Contracts
2.3.1 The Group and the Company plan to adopt the above applicable new MFRSs, amendments/improvements to MFRSs, new IC Int and amendments to IC Int when they become effective. A brief discussion on the above significant new MFRSs, amendments/improvements to MFRSs, new IC Int and amendments to IC Int are summarised below.
MFRS 16 Leases Currently under MFRS 117 Leases, leases are classified either as finance leases or operating leases. A lessee recognises on its statement of financial position assets and liabilities arising from the finance leases. MFRS 16 eliminates the distinction between finance and operating leases for lessees. All leases will be brought onto its statement of financial position except for short-term and low value asset leases. On initial adoption of MFRS 16, there may be impact on the accounting treatment for leases, which the Group as a lessee currently accounts for as operating leases. On adoption of this standard, the Group will be required to capitalise its rented premises on the statements of financial position by recognising them as “rights-of-use” assets and their corresponding lease liabilities for the present value of future lease payments.

ADVANCE SYNERGY BERHAD | annual report 2018 Notes to the Financial Statements31 December 2018 (continued)
119 Company No. 1225 – D
30
2. BASIS OF PREPARATION (Continued)
2.3 New MFRSs, amendments/improvements to MFRSs, new IC Interpretation (“IC Int”) and amendments to IC Int that have been issued, but yet to be effective (Continued)
MFRS 16 Leases (Continued)
The Group and the Company plan to adopt this standard when it becomes effective in the financial year beginning 1 January 2019 by applying the transitional provisions and include the required additional disclosures in their financial statements of that year. The Group is likely electing the practical expedient not to reassess whether a contract contains a lease at the date of initial application. Accordingly, existing lease contracts that are still effective on 1 January 2019 will be accounted for as lease contracts under MFRS 16. Amendments to MFRS 3 Business Combinations and MFRS 11 Joint Arrangements Amendments to MFRS 3 clarify that when an entity obtains control of a business that is a joint operation, it remeasures previously held interests in that business. Amendments to MFRS 11 clarify that when an entity obtains joint control of a business that is a joint operation, the entity does not remeasure previously held interests in that business.
Amendments to MFRS 9 Financial Instruments Amendments to MFRS 9 allow companies to measure prepayable financial assets with negative compensation at amortised cost or at fair value through other comprehensive income if certain conditions are met. The amendments also clarify that when a financial liability measured at amortised cost is modified without this resulting in derecognition, a gain or loss should be recognised in profit or loss. Amendments to MFRS 10 Consolidated Financial Statements and MFRS 128 Investments in Associates and Joint Ventures These amendments address an acknowledged inconsistency between the requirements in MFRS 10 and those in MFRS 128, in dealing with the sale or contribution of assets between an investor and its associate or joint venture. The main consequence of the amendments is that a full gain or loss is recognised when a transaction involves a business, as defined in MFRS 3. A partial gain or loss is recognised when a transaction involves assets that do not constitute a business. Amendments to MFRS 112 Income Taxes Amendments to MFRS 112 clarify that an entity recognises the income tax consequences of dividends in profit or loss because income tax consequences of dividends are linked more directly to past transactions than to distributions to owners, except if the tax arises from a transaction which is a business combination or is recognised in other comprehensive income or directly in equity.

Notes to the Financial Statements31 December 2018 (continued)
120 Company No. 1225 – D
31
2. BASIS OF PREPARATION (Continued)
2.3 New MFRSs, amendments/improvements to MFRSs, new IC Interpretation (“IC Int”) and amendments to IC Int that have been issued, but yet to be effective (Continued) Amendments to MFRS 119 Employee Benefits Amendments to MFRS 119 require an entity to use updated actuarial assumptions to determine current service cost and net interest for the remainder of the annual reporting period after the plan amendment, curtailment or settlement when the entity remeasures its net defined benefit liability (asset). Amendments to MFRS 123 Borrowing Costs Amendments to MFRS 123 clarify that when a qualifying asset is ready for its intended use or sale, an entity treats any outstanding borrowing made specifically to obtain that qualifying asset as part of general borrowings. Amendments to MFRS 128 Investments in Associates and Joint Ventures Amendments to MFRS 128 clarify that companies shall apply MFRS 9, including its impairment requirements, to account for long-term interests in an associate or joint venture that, in substance, form part of the net investment in the associate or joint to which the equity method is not applied. IC Int 23 Uncertainty over Income Tax Treatments IC Int 23 clarifies that where there is uncertainty over income tax treatments, an entity shall: (i) assume that a taxation authority will examine amounts it has a right to examine and
have full knowledge of all related information when making those examinations. (ii) reflect the effect of uncertainty in determining the related tax position (using either
the most likely amount or the expected value method) if it concludes it is not probable that the taxation authority will accept an uncertain tax treatment.
Amendments to References to the Conceptual Framework in MFRS Standards The Malaysian Accounting Standards Board has issued a revised Conceptual Framework for Financial Reporting and amendments to fourteen Standards under the Malaysian Financial Reporting Standards Framework on 30 April 2018. The revised Conceptual Framework comprises a comprehensive set of concepts of financial reporting. It is built on the previous version of the Conceptual Framework issued in 2011. The changes to the chapters on the objective of financial reporting and qualitative characteristics of useful financial information are limited, but with improved wordings to give more prominence to the importance of providing information need to assess management’s stewardship of the entity’s economic resources.

ADVANCE SYNERGY BERHAD | annual report 2018 Notes to the Financial Statements31 December 2018 (continued)
121 Company No. 1225 – D
32
2. BASIS OF PREPARATION (Continued)
2.3 New MFRSs, amendments/improvements to MFRSs, new IC Interpretation (“IC Int”) and amendments to IC Int that have been issued, but yet to be effective (Continued)
Amendments to References to the Conceptual Framework in MFRS Standards (Continued) Other improvements of the revised Conceptual Framework include a new chapter on measurement, guidance on reporting financial performance, improved definitions and guidance – in particular the definition of a liability – and clarifications in important areas, such as the role of prudence and measurement uncertainty in financial reporting. The amendments to the fourteen Standards are to update the references and quotations in these Standards which include MFRS 2, MFRS 3, MFRS 6, MFRS 14, MFRS 101, MFRS 108, MFRS 134, MFRS 137, MFRS 138, IC Int 12, IC Int 19, IC Int 20, IC Int 22 and IC Int 132.
2.3.2 The Group and the Company is currently performing a detailed analysis to determine the election of the practical expedients and to quantify the financial effects arising from the adoption of the new MFRSs, amendments/improvements to MFRSs and new IC Int.
2.4 Functional and Presentation Currency
The individual financial statements of each entity in the Group are measured using the currency of the primary economic environment in which they operate (“the functional currency”). The consolidated financial statements are presented in Ringgit Malaysia (“RM”), which is also the Company’s functional currency.
2.5 Basis of Measurement The financial statements of the Group and the Company have been prepared on the historical cost basis, except as otherwise disclosed in Note 3 to the financial statements.
2.6 Use of Estimates and Judgement The preparation of financial statements in conformity with MFRSs requires the use of certain critical accounting estimates and assumptions that affect the reported amounts of assets and liabilities and disclosures of contingent assets and liabilities at the date of the financial statements, and the reported amounts of the revenue and expenses during the reported period. It also requires directors to exercise their judgement in the process of applying the Group’s and the Company’s accounting policies. Although these estimates and judgements are based on the directors’ best knowledge of current events and actions, actual results may differ. The areas involving a higher degree of judgement or complexity, or areas where assumptions and estimates are significant to the Group’s and the Company’s financial statements are disclosed in Note 4 to the financial statements.

Notes to the Financial Statements31 December 2018 (continued)
122 Company No. 1225 – D
33
3. SIGNIFICANT ACCOUNTING POLICIES
Unless otherwise stated, the following accounting policies have been applied consistently to all the financial years presented in the financial statements of the Group and of the Company.
3.1 Basis of consolidation
The consolidated financial statements comprise the financial statements of the Company and its subsidiaries. The financial statements of the subsidiaries and associates used in the preparation of the consolidated financial statements are prepared for the same reporting date as the Company. Consistent accounting policies are applied to like transactions and events in similar circumstances.
(a) Subsidiaries and business combination
Subsidiaries are entities over which the Group is exposed, or has rights, to variable returns from its involvement with the acquirees and has the ability to affect those returns through its power over the acquirees. The financial statements of subsidiaries are included in the consolidated financial statements from the date the Group obtains control of the acquirees until the date the Group loses control of the acquirees.
The Group applies the acquisition method to account for business combinations from the acquisition date. For a new acquisition, goodwill is initially measured at cost, being the excess of the following: the fair value of the consideration transferred, calculated as the sum of the
acquisition-date fair value of assets transferred (including contingent consideration), the liabilities incurred to former owners of the acquiree and the equity instruments issued by the Group. Any amounts that relate to pre-existing relationships or other arrangements before or during the negotiations for the business combination, that are not part of the exchange for the acquiree, will be excluded from the business combination accounting and be accounted for separately; plus
the recognised amount of any non-controlling interests in the acquiree either at fair value or at the proportionate share of the acquiree’s identifiable net assets at the acquisition date (the choice of measurement basis is made on an acquisition-by-acquisition basis); plus
if the business combination is achieved in stages, the acquisition-date fair value of the previously held equity interest in the acquiree; less
the net fair value of the identifiable assets acquired and the liabilities (including contingent liabilities) assumed at the acquisition date.
When the excess is negative, a bargain purchase gain is recognised immediately in profit or loss at the acquisition date.
Transaction costs, other than those associated with the issue of debt or equity securities, that the Group incurs in connection with a business combination are expensed as incurred.

ADVANCE SYNERGY BERHAD | annual report 2018 Notes to the Financial Statements31 December 2018 (continued)
123 Company No. 1225 – D
34
3. SIGNIFICANT ACCOUNTING POLICIES (Continued)
3.1 Basis of consolidation (Continued)
(a) Subsidiaries and business combination (Continued)
If the business combination is achieved in stages, the Group remeasures the previously held equity interest in the acquiree to its acquisition-date fair value, and recognises the resulting gain or loss, if any, in profit or loss. Amounts arising from interests in the acquiree prior to the acquisition date that have previously been recognised in other comprehensive income are reclassified to profit or loss or transferred directly to retained earnings on the same basis as would be required if the acquirer had disposed directly of the previously held equity interest. If the initial accounting for a business combination is incomplete by the end of the reporting period in which the business combination occurs, the Group uses provisional fair value amounts for the items for which the accounting is incomplete. The provisional amounts are adjusted to reflect new information obtained about facts and circumstances that existed as of the acquisition date, including additional assets or liabilities identified in the measurement period. The measurement period for completion of the initial accounting ends as soon as the Group receives the information it was seeking about facts and circumstances or learns that more information is not obtainable, subject to the measurement period not exceeding one year from the acquisition date. Upon the loss of control of subsidiary, the Group derecognises the assets and liabilities of the former subsidiary, any non-controlling interests and the other components of equity related to the former subsidiary from the consolidated statement of financial position. Any gain or loss arising on the loss of control is recognised in profit or loss. If the Group retains any interest in the former subsidiary, then such interest is measured at fair value at the date that control is lost. Subsequently, it is accounted for as an associate, joint venture, an available-for-sale financial asset or a held for trading financial asset. Changes in the Group’s ownership interest in a subsidiary that do not result in a loss of control are accounted for as equity transactions. The difference between the Group’s share of net assets before and after the change, and the fair value of the consideration received or paid, is recognised directly in equity.
(b) Associates
Associates are entities over which the Group has significant influence, but not control, to the financial and operating policies. Investment in associates are accounted for in the consolidated financial statements using the equity method. Under the equity method, the investment in associates are initially recognised at cost. The cost of investment includes transaction costs. Subsequently, the carrying amount is adjusted to recognise changes in the Group’s share of net assets of the associate. When the Group’s share of losses exceeds its interest in an associate, the carrying amount of that interest including any long-term investments is reduced to zero, and the recognition of further losses is discontinued except to the extent that the Group has an obligation or has made payments on behalf of the associate.
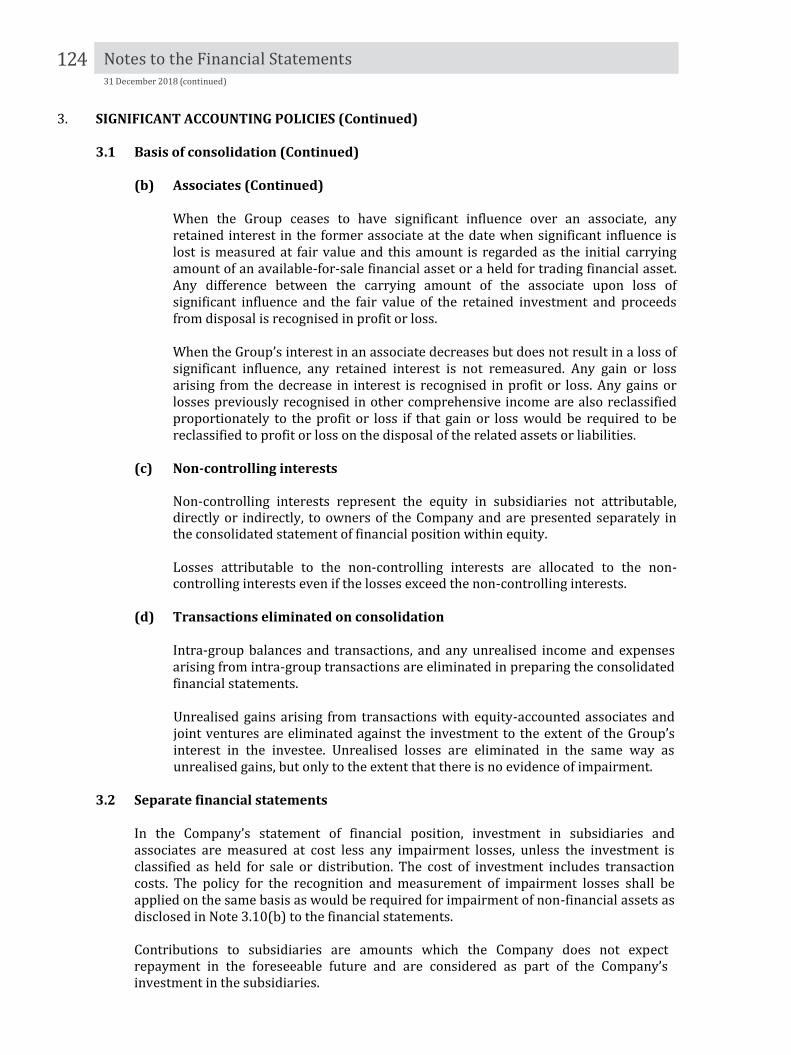
Notes to the Financial Statements31 December 2018 (continued)
124 Company No. 1225 – D
35
3. SIGNIFICANT ACCOUNTING POLICIES (Continued)
3.1 Basis of consolidation (Continued)
(b) Associates (Continued)
When the Group ceases to have significant influence over an associate, any retained interest in the former associate at the date when significant influence is lost is measured at fair value and this amount is regarded as the initial carrying amount of an available-for-sale financial asset or a held for trading financial asset. Any difference between the carrying amount of the associate upon loss of significant influence and the fair value of the retained investment and proceeds from disposal is recognised in profit or loss.
When the Group’s interest in an associate decreases but does not result in a loss of significant influence, any retained interest is not remeasured. Any gain or loss arising from the decrease in interest is recognised in profit or loss. Any gains or losses previously recognised in other comprehensive income are also reclassified proportionately to the profit or loss if that gain or loss would be required to be reclassified to profit or loss on the disposal of the related assets or liabilities.
(c) Non-controlling interests
Non-controlling interests represent the equity in subsidiaries not attributable, directly or indirectly, to owners of the Company and are presented separately in the consolidated statement of financial position within equity. Losses attributable to the non-controlling interests are allocated to the non-controlling interests even if the losses exceed the non-controlling interests.
(d) Transactions eliminated on consolidation Intra-group balances and transactions, and any unrealised income and expenses arising from intra-group transactions are eliminated in preparing the consolidated financial statements. Unrealised gains arising from transactions with equity-accounted associates and joint ventures are eliminated against the investment to the extent of the Group’s interest in the investee. Unrealised losses are eliminated in the same way as unrealised gains, but only to the extent that there is no evidence of impairment.
3.2 Separate financial statements
In the Company’s statement of financial position, investment in subsidiaries and associates are measured at cost less any impairment losses, unless the investment is classified as held for sale or distribution. The cost of investment includes transaction costs. The policy for the recognition and measurement of impairment losses shall be applied on the same basis as would be required for impairment of non-financial assets as disclosed in Note 3.10(b) to the financial statements.
Contributions to subsidiaries are amounts which the Company does not expect repayment in the foreseeable future and are considered as part of the Company’s investment in the subsidiaries.
ADVANCE SYNERGY BERHAD | annual report 2018 Notes to the Financial Statements31 December 2018 (continued)
125 Company No. 1225 – D
36
3. SIGNIFICANT ACCOUNTING POLICIES (Continued)
3.3 Foreign currency transactions (a) Translation of foreign currency transactions
Foreign currency transactions are translated to the respective functional currencies of the Group entities using the exchange rates prevailing at the transaction dates. At the end of each reporting date, monetary items denominated in foreign currencies are retranslated at the exchange rates prevailing at the reporting date. Non-monetary items denominated in foreign currencies that are measured at fair value are retranslated at the rates prevailing at the dates the fair values were determined. Non-monetary items denominated in foreign currencies that are measured at historical cost are translated at the historical rates as at the dates of the initial transactions. Foreign exchange differences arising on settlement or retranslation of monetary items are recognised in profit or loss except for monetary items that are designated as hedging instruments in either a cash flow hedge or a hedge of the Group’s net investment of a foreign operation. When settlement of a monetary item receivable from or payable to a foreign operation is neither planned nor likely to occur in the foreseeable future, exchange differences are recognised in profit or loss in the separate financial statements of the parent company or the individual financial statements of the foreign operation. In the consolidated financial statements, the exchange differences are considered to form part of a net investment in a foreign operation and are recognised initially in other comprehensive income until its disposal, at which time, the cumulative amount is reclassified to profit or loss. The gain or loss arising on translation of non-monetary items measured at fair value is treated in line with the recognition of the gain or loss on the change in fair value of the item (i.e. translation differences on items whose fair value gain or loss is recognised in other comprehensive income or profit or loss are also recognised in other comprehensive income or profit or loss, respectively).
(b) Translation of foreign operations
The assets and liabilities of foreign operations denominated in the functional currency different from the presentation currency, including goodwill and fair value adjustments arising on acquisition, are translated into the presentation currency at exchange rates prevailing at the reporting date. The income and expenses of foreign operations are translated at exchange rates at the dates of the transactions. Exchange differences arising on the translation are recognised in other comprehensive income. However, if the foreign operation is a non-wholly owned subsidiary, then the relevant proportionate share of the translation difference is allocated to the non-controlling interests.

Notes to the Financial Statements31 December 2018 (continued)
126 Company No. 1225 – D
37
3. SIGNIFICANT ACCOUNTING POLICIES (Continued)
3.3 Foreign currency transactions (Continued)
(b) Translation of foreign operations (Continued)
When a foreign operation is disposed of such that control, significant influence or joint control is lost, the cumulative amount in foreign exchange translation reserves related to that foreign operation is reclassified to profit or loss. For a partial disposal not involving loss of control of a subsidiary that includes a foreign operation, the proportionate share of cumulative amount in foreign exchange translation reserve is reattributed to non-controlling interests. For partial disposals of associates or joint ventures that do not result in the Group losing significant influence or joint control, the proportionate share of the cumulative amount in foreign exchange translation reserve is reclassified to profit or loss.
3.4 Financial instruments
Financial instruments are recognised in the statements of financial position when, and only when, the Group and the Company become a party to the contract provisions of the financial instrument.
Accounting policies applied from 1 January 2018 Except for the trade receivables that do not contain a significant financing component or for which the Group and the Company has applied the practical expedient, the financial instruments are recognised initially at its fair value plus or minus, in the case of a financial asset or financial liability not at fair value through profit or loss, transaction costs that are directly attributable to the acquisition or issue of the financial asset and financial liability. Transaction costs of financial assets carried at fair value through profit or loss are expensed in profit or loss. Trade receivables that do not contain a significant financing component or for which the Group and the Company have applied the practical expedient are measured at the transaction price determined under MFRS 15. An embedded derivative is recognised separately from the host contract and accounted for as a derivative if, and only if, it is not closely related to the economic characteristics and risks of the host contract and the host contract is not categorised as fair value through profit or loss. The host contract, in the event an embedded derivative is recognised separately, is accounted for in accordance with the policy applicable to the nature of the host contract. A derivative embedded within a hybrid contract containing a financial asset host is not accounted for separately. The financial asset host together with the embedded derivative is required to be classified in its entirety as a financial asset at fair value through profit or loss.

ADVANCE SYNERGY BERHAD | annual report 2018 Notes to the Financial Statements31 December 2018 (continued)
127 Company No. 1225 – D
38
3. SIGNIFICANT ACCOUNTING POLICIES (Continued)
3.4 Financial instruments (Continued)
Accounting policies applied from 1 January 2018 (Continued)
(a) Subsequent measurement
The Group and the Company categorise the financial instruments as follows:
(i) Financial assets
For the purposes of subsequent measurement, financial assets are classified in four categories: Financial assets at amortised cost Financial assets at fair value through other comprehensive income with
recycling of cumulative gains and losses upon derecognition Financial assets designated at fair value through other comprehensive
income with no recycling of cumulative gains and losses upon derecognition
Financial assets at fair value through profit or loss The classification depends on the entity’s business model for managing the financial assets and the contractual cash flows characteristics of the financial assets. The Group and the Company reclassify financial assets when and only when its business model for managing those assets change. Debt instruments Subsequent measurement of debt instruments depends on the Group’s and the Company’s business model for managing the asset and the cash flow characteristics of the asset. There are three measurement categories into which the Group and the Company classify their debt instruments: Amortised cost
Financial assets that are held for collection of contractual cash flows and those cash flows represent solely payments of principal and interest are measured at amortised cost. Financial assets at amortised cost are subsequently measured using the effective interest (EIR) method and are subject to impairment. The policy for the recognition and measurement of impairment losses is in accordance with Note 3.10(a) to the financial statements. Gains and losses are recognised in profit or loss when the financial asset is derecognised, modified or impaired.

Notes to the Financial Statements31 December 2018 (continued)
128 Company No. 1225 – D
39
3. SIGNIFICANT ACCOUNTING POLICIES (Continued)
3.4 Financial instruments (Continued)
Accounting policies applied from 1 January 2018 (Continued)
(a) Subsequent measurement (Continued)
The Group and the Company categorise the financial instruments as follows: (Continued)
(i) Financial assets (Continued)
Debt instruments (Continued)
Fair value through other comprehensive income (FVOCI)
Financial assets that are held for collection of contractual cash flows and for selling the financial assets, and the assets’ cash flows represent solely payments of principal and interest, are measured at FVOCI. For debt instruments at FVOCI, interest income, foreign exchange revaluation and impairment losses or reversals are recognised in profit or loss and computed in the same manner as for financial assets measured at amortised cost. The remaining fair value changes are recognised in other comprehensive income. The policy for the recognition and measurement of impairment losses is in accordance with Note 3.10(a) to the financial statements. Upon derecognition, the cumulative fair value change recognised in other comprehensive income is recycled to profit or loss.
Fair value through profit or loss (FVPL)
Financial assets at FVPL include financial assets held for trading, financial assets designated upon initial recognition at fair value through profit or loss, or financial assets mandatorily required to be measured at fair value. Financial assets are classified as held for trading if they are acquired for the purpose of selling or repurchasing in the near term. Derivatives, including separated embedded derivatives, are also classified as held for trading unless they are designated as effective hedging instruments. Financial assets with cash flows that are not solely payments of principal and interest are classified and measured at fair value through profit or loss, irrespective of the business model. Notwithstanding the criteria for debt instruments to be classified at amortised cost or at FVOCI, as described above, debt instruments may be designated at fair value through profit or loss on initial recognition if doing so eliminates, or significantly reduces, an accounting mismatch. Financial assets at fair value through profit or loss are carried in the statement of financial position at fair value with net changes in fair value recognised in the profit or loss.

ADVANCE SYNERGY BERHAD | annual report 2018 Notes to the Financial Statements31 December 2018 (continued)
129 Company No. 1225 – D
40
3. SIGNIFICANT ACCOUNTING POLICIES (Continued)
3.4 Financial instruments (Continued)
Accounting policies applied from 1 January 2018 (Continued)
(a) Subsequent measurement (Continued)
The Group and the Company categorise the financial instruments as follows: (Continued)
(i) Financial assets (Continued)
Equity instruments
The Group and the Company subsequently measure all equity investments at fair value. Upon initial recognition, the Group and the Company can make an irrevocable election to classify its equity investments that is not held for trading as equity instruments designated at FVOCI. The classification is determined on an instrument-by-instrument basis. Gains and losses on these financial assets are not recycled to profit or loss. Dividends are recognised as other income in the profit or loss when the right of payment has been established, except when the Group and the Company benefit from such proceeds as a recovery of part of the cost of the financial asset, in which case, such gains are recorded in other comprehensive income. Equity instruments designated at FVOCI are not subject to impairment assessment.
(ii) Financial liabilities
The Group and the Company classify their financial liabilities in the following measurement categories: Financial liabilities at fair value through profit or loss Financial liabilities at amortised cost
Financial liabilities at fair value through profit or loss
Financial liabilities at fair value through profit or loss include financial liabilities held for trading, including derivatives (except for a derivative that is a financial guarantee contract or a designated and effective hedging instrument) or financial liabilities designated into this category upon initial recognition. Subsequent to initial recognition, financial liabilities at fair value through profit or loss are measured at fair value with the gain or loss recognised in profit or loss. Financial liabilities designated upon initial recognition at fair value through profit or loss are designated at the initial date of recognition, and only if the criteria in MFRS 9 are satisfied. The Group and the Company have not designated any financial liability as at fair value through profit or loss.

Notes to the Financial Statements31 December 2018 (continued)
130 Company No. 1225 – D
41
3. SIGNIFICANT ACCOUNTING POLICIES (Continued)
3.4 Financial instruments (Continued)
Accounting policies applied from 1 January 2018 (Continued)
(a) Subsequent measurement (Continued)
The Group and the Company categorise the financial instruments as follows: (Continued)
(ii) Financial liabilities (Continued)
The Group and the Company classify their financial liabilities in the following measurement categories: (Continued) Financial liabilities at amortised cost Subsequent to initial recognition, other financial liabilities are measured at amortised cost using the effective interest method. Gains and losses are recognised in profit or loss through the amortisation process.
(b) Financial guarantee contracts
A financial guarantee contract is a contract that requires the issuer to make specified payments to reimburse the holder for a loss it incurs because a specified debtor fails to make payment when due in accordance with the original or modified terms of a debt instrument. Financial guarantee contracts are recognised initially as a liability at fair value, net of transaction costs that are directly attributable to the issuance of the guarantee. Subsequent to initial recognition, the liability is measured at the higher of the amount of the loss allowance determined in accordance with Section 5.5 of MFRS 9 and the amount initially recognised, when appropriate, the cumulative amount of income recognised in accordance with the principles of MFRS 15.
(c) Regular way purchase or sale of financial assets
A regular way purchase or sale is a purchase or sale of a financial asset under a contract whose terms require delivery of the asset within the time frame established generally by regulation or convention in the marketplace concerned. A regular way purchase or sale of financial assets shall be recognised and derecognised, as applicable, using trade date accounting (i.e. the date the Group and the Company commit themselves purchase or sell an asset). Trade date accounting refers to: (i) the recognition of an asset to be received and the liability to pay for it on the
trade date; and (ii) derecognition of an asset that is sold, recognition of any gain or loss on
disposal and the recognition of a receivable from the buyer for payment on the trade date.
Generally, interest does not start to accrue on the asset and corresponding liability until the settlement date when title passes.

ADVANCE SYNERGY BERHAD | annual report 2018 Notes to the Financial Statements31 December 2018 (continued)
131 Company No. 1225 – D
42
3. SIGNIFICANT ACCOUNTING POLICIES (Continued)
3.4 Financial instruments (Continued)
Accounting policies applied from 1 January 2018 (Continued)
(d) Derecognition
A financial asset or a part of it is derecognised when and only when: (i) the contractual rights to receive the cash flows from the financial asset expire,
or (ii) the Group and the Company have transferred their rights to receive cash flows
from the asset or have assumed an obligation to pay the received cash flows in full without material delay to a third party under a ‘pass-through’ arrangement; and either (a) the Group and the Company have transferred substantially all the risks and rewards of the asset, or (b) the Group and the Company have neither transferred nor retained substantially all the risks and rewards of the asset, but have transferred control of the asset.
The Group and the Company evaluate if, and to what extent, they have retained the risks and rewards of ownership. When they have neither transferred nor retained substantially all of the risks and rewards of the asset, nor transferred control of the asset, the Group and the Company continue to recognise the transferred asset to the extent of their continuing involvement. In that case, the Group and the Company also recognise an associated liability. The transferred asset and the associated liability are measured on a basis that reflects the rights and obligations that the Group and the Company have retained.
Continuing involvement that takes the form of a guarantee over the transferred asset is measured at the lower of the original carrying amount of the asset and the maximum amount of consideration that the Group and the Company could be required to repay. On derecognition of a financial asset, the difference between the carrying amount (measured at the date of derecognition) and the consideration received (including any new asset obtained less any new liability assumed) is recognised in profit or loss. A financial liability or a part of it is derecognised when, and only when, the obligation specified in the contract is discharged, cancelled or expired. On derecognition of a financial liability, the difference between the carrying amount and the consideration paid, including any non-cash assets transferred or liabilities assumed, is recognised in profit or loss.

Notes to the Financial Statements31 December 2018 (continued)
132 Company No. 1225 – D
43
3. SIGNIFICANT ACCOUNTING POLICIES (Continued)
3.4 Financial instruments (Continued)
Accounting policies applied from 1 January 2018 (Continued)
(e) Offsetting of financial instruments
Financial assets and financial liabilities are offset and the net amount is presented in the statements of financial position if there is a currently enforceable legal right to offset the recognised amounts and there is an intention to settle on a net basis, to realise the assets and settle the liabilities simultaneously. In accounting for a transfer of a financial asset that does not qualify for derecognition, the entity shall not offset the transferred asset and the associated liability.
Accounting policies applied until 31 December 2017 Financial instruments are recognised initially at fair value, except for financial instruments not measured at fair value through profit or loss, they are measured at fair value plus transaction costs that are directly attributable to the acquisition or issue of the financial instruments. An embedded derivative is recognised separately from the host contract and accounted for as a derivative if, and only if, it is not closely related to the economic characteristics and risks of the host contract and the host contract is not categorised as fair value through profit or loss. The host contract, in the event an embedded derivative is recognised separately, is accounted for in accordance with the policy applicable to the nature of the host contract. (a) Subsequent measurement
The Group and the Company categorise the financial instruments as follows: (i) Financial assets
Financial assets at fair value through profit or loss Financial assets are classified as fair value through profit or loss when the financial assets are either held for trading, including derivatives (except for a derivative that is a financial guarantee contract or a designated and effective hedging instrument) or are designated into this category upon initial recognition. Subsequent to initial recognition, financial assets at fair value through profit or loss are measured at fair value with the gain or loss recognised in profit or loss. Derivatives that are linked to and must be settled by delivery of unquoted equity instruments whose fair values cannot be reliably measured are measured at costs.

ADVANCE SYNERGY BERHAD | annual report 2018 Notes to the Financial Statements31 December 2018 (continued)
133 Company No. 1225 – D
44
3. SIGNIFICANT ACCOUNTING POLICIES (Continued)
3.4 Financial instruments (Continued)
Accounting policies applied until 31 December 2017 (Continued)
(a) Subsequent measurement (Continued)
The Group and the Company categorise the financial instruments as follows: (Continued) (i) Financial assets (Continued)
Loans and receivables Financial assets with fixed or determinable payments that are not quoted in an active market are classified as loans and receivables. Subsequent to initial recognition, loans and receivables are measured at amortised cost using the effective interest method less accumulated impairment losses, if any. The policy for the recognition and measurement of impairment losses is in accordance with Note 3.10(a) to the financial statements. Gains and losses are recognised in profit or loss through the amortisation process. Held-to-maturity investments Financial assets with fixed or determinable payments and fixed maturities are classified as held-to-maturity when the Group has the positive intention and ability to hold them to maturity. Subsequent to initial recognition, held-to-maturity investments are measured at amortised cost using the effective interest method less accumulated impairment losses, if any. The policy for the recognition and measurement of impairment losses is in accordance with Note 3.10(a) to the financial statements. Gains and losses are recognised in profit or loss through the amortisation process.

Notes to the Financial Statements31 December 2018 (continued)
134 Company No. 1225 – D
45
3. SIGNIFICANT ACCOUNTING POLICIES (Continued)
3.4 Financial instruments (Continued)
Accounting policies applied until 31 December 2017 (Continued)
(a) Subsequent measurement (Continued)
The Group and the Company categorise the financial instruments as follows: (Continued) (i) Financial assets (Continued)
Available-for-sale financial assets Available-for-sale financial assets comprise investment in equity and debt securities that are designated as available-for-sale or are not classified in any of the three preceding categories. Subsequent to initial recognition, available-for-sale financial assets are measured at fair value. Gains or losses from changes in fair value of the financial assets are recognised in other comprehensive income, except for impairment losses and foreign exchange gains and losses arising from monetary items and gains and losses of hedged items attributable to hedge risks of fair values hedges which are recognised in profit or loss. The cumulative gain or loss previously recognised in other comprehensive income is reclassified from equity to profit or loss as a reclassification adjustment when the financial asset is derecognised. Interest income calculated using the effective interest method is recognised in profit or loss. Dividends on an available-for-sale equity instrument are recognised in profit or loss when the Group’s and the Company’s right to receive payment is established. Unquoted equity instruments carried at cost Investments in equity instruments that do not have a quoted market price in an active market and whose fair value cannot be reliably measured are measured at cost less accumulated impairment losses, if any. The policy for the recognition and measurement of impairment losses is in accordance with Note 3.10(a) to the financial statements.
(ii) Financial liabilities
Same accounting policies applied in 31 December 2018 and 31 December 2017.
(b) Financial guarantee contracts
A financial guarantee contract is a contract that requires the issuer to make specified payments to reimburse the holder for a loss it incurs because a specified debtor fails to make payment when due in accordance with the original or modified terms of a debt instrument. Financial guarantee contracts are recognised initially as a liability at fair value, net of transaction costs that are directly attributable to the issuance of the guarantee. Subsequent to initial recognition, the liability is measured at the higher of the best estimate of the expenditure required to settle the present obligation at the reporting date and the amount initially recognised less cumulative amortisation.

ADVANCE SYNERGY BERHAD | annual report 2018 Notes to the Financial Statements31 December 2018 (continued)
135 Company No. 1225 – D
46
3. SIGNIFICANT ACCOUNTING POLICIES (Continued)
3.4 Financial instruments (Continued)
Accounting policies applied until 31 December 2017 (Continued)
(c) Regular way purchase or sale of financial assets
Same accounting policies applied in 31 December 2018 and 31 December 2017.
(d) Derecognition
A financial asset or a part of it is derecognised when, and only when, the contractual rights to receive the cash flows from the financial asset expire or control of the asset is not retained or substantially all of the risks and rewards of ownership of the financial asset are transferred to another party. On derecognition of a financial asset, the difference between the carrying amount and the sum of the consideration received (including any new asset obtained less any new liability assumed) and any cumulative gain or loss that had been recognised in other comprehensive income is recognised in profit or loss.
A financial liability or a part of it is derecognised when, and only when, the obligation specified in the contract is discharged, cancelled or expired. On derecognition of a financial liability, the difference between the carrying amount and the consideration paid, including any non-cash assets transferred or liabilities assumed, is recognised in profit or loss.
(e) Offsetting of financial instruments
Same accounting policies applied in 31 December 2018 and 31 December 2017.
3.5 Property, plant and equipment
(a) Recognition and measurement
Property, plant and equipment are measured at cost less accumulated depreciation and any accumulated impairment losses. The policy for the recognition of measurement of impairment losses is in accordance with Note 3.10(b) to the financial statements. Cost of assets includes expenditures that are directly attributable to the acquisition of the asset and any other costs that are directly attributable to bringing the asset to working condition for its intended use, and the costs of dismantling and removing the items and restoring the site on which they are located. The cost of self-constructed assets also includes cost of materials, direct labour, and any other direct attributable costs but excludes internal profits. For qualifying assets, borrowing costs are capitalised in accordance with the accounting policy on borrowing costs in Note 3.15 to the financial statements.

Notes to the Financial Statements31 December 2018 (continued)
136 Company No. 1225 – D
47
3. SIGNIFICANT ACCOUNTING POLICIES (Continued)
3.5 Property, plant and equipment (Continued)
(a) Recognition and measurement (Continued) Purchased software that is integral to the functionality of the related equipment is capitalised as part of that equipment. When significant parts of an item of property, plant and equipment have different useful lives, they are accounted for as separate items of property, plant and equipment.
(b) Subsequent cost
The cost of replacing a part of an item of property, plant and equipment is included in the asset’s carrying amount or recognised as a separate asset, as appropriate, only when it is probable that the future economic benefits associated with the part will flow to the Group or the Company and its cost can be measured reliably. The carrying amount of the replaced part is derecognised. All other repairs and maintenance are charged to the profit or loss as incurred.
(c) Depreciation
Leasehold land is depreciated on straight-line basis over the lease terms of 38 to 57 years. All other property, plant and equipment are depreciated on straight line basis over the estimated useful lives of the assets using the following annual rates:
Short term leasehold land 22 years Hotel properties (buildings) 30-50 years Buildings 0.5%-5% Plant and machinery 10%-20% Motor vehicles 15%-20% Furniture, fittings and equipment 2%-25% Renovation 2%-20% Computer equipment and software 20%-33.33% Crockeries, glassware, cutleries, linen and kitchen utensils 10% Telecommunications, research and development equipment 20%-33.33%
The residual values, useful lives and depreciation methods are reviewed at the end of each reporting period and adjusted as appropriate. Fully depreciated assets are retained in the accounts until the assets are no longer in use.
(d) Derecognition
An item of property, plant and equipment is derecognised upon disposal or when no future economic benefits are expected from its use or disposal. Any gain or loss arising on derecognition of the asset is recognised in profit or loss.

ADVANCE SYNERGY BERHAD | annual report 2018 Notes to the Financial Statements31 December 2018 (continued)
137 Company No. 1225 – D
48
3. SIGNIFICANT ACCOUNTING POLICIES (Continued)
3.6 Leases
The determination of whether an arrangement is, or contains, a lease is based on the substance of the arrangement at the inception of the lease. The arrangement is, or contains, a lease if fulfilment of the arrangement is dependent on the use of a specific asset or assets and the arrangement conveys a right to use the asset or assets. A lease is classified as a finance lease if it transfers substantially all the risks and rewards incidental to ownership. All other leases that do not meet this criterion are classified as operating leases.
(a) Lessee accounting
If an entity in the Group is a lessee in a finance lease, it capitalises the leased asset and recognises the related liability. The amount recognised at the inception date is the fair value of the underlying leased asset or, if lower, the present value of the minimum lease payments. Subsequent to initial recognition, the asset is accounted for in accordance with the accounting policy applicable to that asset. Minimum lease payments are apportioned between the finance charge and the reduction of the outstanding liability. The finance charge is allocated to each period during the lease term so as to produce a constant periodic rate of interest on the remaining balance of the liability. Contingent lease payments are charged as expenses in the periods in which they are incurred. The capitalised leased asset is classified by nature as property, plant and equipment or investment properties. For operating leases, the Group does not capitalise the leased asset or recognise the related liability. Instead lease payments under an operating lease are recognised as an expense on the straight-line basis over the lease term unless another systematic basis is more representative of the time pattern of the user’s benefit. Any upfront lease payments are classified as land use rights within intangible assets.
(b) Lessor accounting
If an entity in the Group is a lessor in a finance lease, it derecognises the underlying asset and recognises a lease receivable at an amount equal to the net investment in the lease. Finance income is recognised in profit or loss based on a pattern reflecting a constant periodic rate of return on the lessor’s net investment in the finance lease.
If an entity in the Group is a lessor in an operating lease, the underlying asset is not derecognised but is presented in the statements of financial position according to the nature of the asset. Lease income from operating leases is recognised in profit or loss on a straight-line basis over the lease term, unless another systematic basis is more representative of the time pattern in which use benefit derived from the leased asset is diminished.
Notes to the Financial Statements31 December 2018 (continued)
138 Company No. 1225 – D
49
3. SIGNIFICANT ACCOUNTING POLICIES (Continued)
3.7 Investment properties
Investment properties are properties held to earn rental income or for capital appreciation or both. Investment properties are initially measured at cost, including transaction costs. The Group uses the cost model to measure its investment properties after initial recognition. Accordingly, investment properties are stated at cost less accumulated depreciation and any accumulated impairment losses. The policy for the recognition and measurement of impairment losses is in accordance with Note 3.10(b) to the financial statements. Leasehold land is depreciated on a straight-line basis over the lease term of 38 years. Buildings are depreciated on a straight-line basis over their estimated useful lives of 15 years. Cost includes purchase price and any directly attributable costs incurred to bring the property to its present location and condition intended for use as an investment property. The cost of a self-constructed investment property includes the cost of material, direct labour and any other direct attributable costs. For qualifying assets, borrowing costs are capitalised in accordance with the accounting policy on borrowing costs in Note 3.15 to the financial statements. An investment property is derecognised on their disposal or when it is permanently withdrawn from use and no future economic benefits are expected from its disposals. Any gains and losses arising from derecognition of the asset is recognised in the profit or loss. Transfers are made to or from investment property only when there is a change in use. For a transfer from investment property carried at fair value to owner-occupied property, the deemed cost for subsequent accounting is the fair value at the date of change in use. For a transfer from owner-occupied property to investment property, any difference arising on the date of change in use between the carrying amount of the item immediately prior to the transfer and its fair value is recognised directly in equity as a revaluation of investment properties.
3.8 Inventories
Inventories of materials and goods are measured at the lower of cost (determined principally on the first-in first-out basis) and net realisable value. Cost consists of all costs of purchase, costs of conversion and other costs incurred in bringing the inventories to their present location and condition.
Net realisable value is the estimated selling price in the ordinary course of business, less the estimated costs of completion and the estimated costs necessary to make the sale.

ADVANCE SYNERGY BERHAD | annual report 2018 Notes to the Financial Statements31 December 2018 (continued)
139 Company No. 1225 – D
50
3. SIGNIFICANT ACCOUNTING POLICIES (Continued)
3.9 Cash and cash equivalents For the purpose of the statements of cash flows, cash and cash equivalents comprise cash on hand, bank balances and deposits and other short-term, highly liquid investments with a maturity of three months or less, that are readily convertible to known amount of cash and which are subject to an insignificant risk of changes in value. Cash and cash equivalents are presented net of bank overdrafts.
3.10 Impairment of assets
(a) Impairment of financial assets and contract assets
Accounting policies applied from 1 January 2018
Financial assets measured at amortised cost, financial assets measured at FVOCI, lease receivables, contract assets or a loan commitment and financial guarantee contracts will be subject to the impairment requirement in MFRS 9 which is related to the accounting for expected credit losses on the financial assets. Expected credit loss is the weighted average of credit losses with the respective risks of a default occurring as the weights. The Group and the Company measure loss allowance at an amount equal to lifetime expected credit loss, except for the following, which are measured as 12-month expected credit loss: debt securities that are determined to have low credit risk at the reporting
date; and other debt securities and bank balances for which credit risk (i.e. risk of
default occurring over the expected life of the financial instrument) has not increased significantly since initial recognition.
For trade receivables and contract assets, the Group and the Company apply the simplified approach permitted by MFRS 9 to measure the loss allowance at an amount equal to lifetime expected credit losses. When determining whether the credit risk of a financial asset has increased significantly since initial recognition and when estimating expected credit loss, the Group and the Company consider reasonable and supportable information that is relevant and available without undue cost or effort. This includes both quantitative and qualitative information and analysis, based on the Group’s and the Company’s historical experience and informed credit assessment and including forward-looking information. The Group and the Company assume that the credit risk on a financial asset has increased significantly if it is more than 30 to 90 days past due.

Notes to the Financial Statements31 December 2018 (continued)
140 Company No. 1225 – D
51
3. SIGNIFICANT ACCOUNTING POLICIES (Continued)
3.10 Impairment of assets (Continued)
(a) Impairment of financial assets and contract assets (Continued)
Accounting policies applied from 1 January 2018 (Continued)
The Group and the Company consider a financial asset to be in default when: the borrower is unable to pay its credit obligations to the Group and the
Company in full, without taking into account any credit enhancements held by the Group and the Company; or
the contractual payment of the financial asset is more than 90 days past due unless the Group and the Company have reasonable and supportable information to demonstrate that a more lagging default criterion is more appropriate.
Lifetime expected credit losses are the expected credit losses that result from all possible default events over the expected life of a financial instrument. 12-month expected credit losses are the portion of lifetime expected credit losses that represent the expected credit losses that result from default events on a financial instrument that are possible within the 12 months after the reporting date. The maximum period considered when estimating expected credit losses is the maximum contractual period over which the Group and the Company are exposed to credit risk. Expected credit losses are a probability-weighted estimate of credit losses (i.e. the present value of all cash shortfalls) over the expected life of the financial instrument. A cash shortfall is the difference between the cash flows that are due to an entity in accordance with the contract and the cash flows that the entity expects to receive. Expected credit losses are discounted at the effective interest rate of the financial assets. At each reporting date, the Group assesses whether financial assets carried at amortised cost and debt securities at FVOCI are credit-impaired. A financial asset is credit-impaired when one or more events that have a detrimental impact on the estimated future cash flows of that financial asset have occurred. Evidence that a financial asset is credit-impaired includes observable data about the following events: significant financial difficulty of the issuer or the borrower; a breach of contract, such as a default of past due event; the lender(s) of the borrower, for economic or contractual reasons relating to
the borrower’s financial difficulty, having granted to the borrower a concession(s) that the lender(s) would not otherwise consider;
it is becoming probable that the borrower will enter bankruptcy or other financial reorganisation;
the disappearance of an active market for that financial asset because of financial difficulties; or
the purchase or origination of a financial asset at a deep discount that reflects the incurred credit losses.

ADVANCE SYNERGY BERHAD | annual report 2018 Notes to the Financial Statements31 December 2018 (continued)
141 Company No. 1225 – D
52
3. SIGNIFICANT ACCOUNTING POLICIES (Continued)
3.10 Impairment of assets (Continued)
(a) Impairment of financial assets and contract assets (Continued)
Accounting policies applied from 1 January 2018 (Continued)
The amount of expected credit losses (or reversal) shall be recognised in profit or loss, as an impairment gain or loss. For financial assets measured at FVOCI, the loss allowance shall be recognised in other comprehensive income and shall not reduce the carrying amount of the financial asset in the statements of financial position. The gross carrying amount of a financial asset is written off (either partially or in full) to the extent that there is no realistic prospect of recovery. This is generally the case when the Group and the Company determine that the debtor does not have assets or source of income that could generate sufficient cash flows to repay the amounts subject to the write-off. However, financial assets that are written off could still be subject to enforcement activities in order to comply with the Group’s and the Company’s procedure for recovery of amounts due.
Accounting policies applied until 31 December 2017 At each reporting date, all financial assets (except for financial assets categorised as fair value through profit or loss and investment in subsidiaries and associates) are assessed whether there is any objective evidence of impairment as a result of one or more events having an impact on the estimated future cash flows of the financial asset that can be reliably estimated. Losses expected as a result of future events, no matter how likely, are not recognised. Evidence of impairment may include indications that the debtors or a group of debtors are experiencing significant financial difficulty, default or delinquency in interest or principal payments, the probability that they will enter bankruptcy or other financial reorganisation, and where observable data indicates that there is a measurable decrease in the estimated future cash flows, such as changes in arrears or economic conditions that correlate with defaults.
Loans and receivables and held-to-maturity investments The Group and the Company first assess whether objective evidence of impairment exists individually for financial assets that are individually significant, and individually or collectively for financial assets that are not individually significant. If there is no objective evidence for impairment exists for an individually assessed financial asset, whether significant or not, the Group and the Company include the financial asset in a group of financial assets with similar credit risk characteristics and collectively assess them for impairment. Financial assets that are individually assessed for impairment for which an impairment loss is or continues to be recognised are not included in a collective assessment of impairment.
The amount of impairment loss is measured as the difference between the financial asset’s carrying amount and the present value of estimated future cash flows discounted at the financial asset’s original effective interest rate. The carrying amount of the financial asset is reduced through the use of an allowance account and the loss is recognised in profit or loss.

Notes to the Financial Statements31 December 2018 (continued)
142 Company No. 1225 – D
53
3. SIGNIFICANT ACCOUNTING POLICIES (Continued)
3.10 Impairment of assets (Continued)
(a) Impairment of financial assets and contract assets (Continued)
Accounting policies applied until 31 December 2017 (Continued)
Loans and receivables and held-to-maturity investments (Continued) If, in a subsequent period, the amount of the impairment loss decreases due to an event occurring after the impairment that was recognised, the previously recognised impairment loss is then reversed by adjusting an allowance account to the extent that the carrying amount of the financial asset does not exceed what the amortised cost would have been had the impairment not been recognised. Loans together with the associated allowance are written off when there is no realistic prospect of future recovery and all collateral has been realised or has been transferred to the Group and the Company. If a write-off is later recovered, the recovery is credited to the profit or loss. Available-for-sale financial assets In the case of equity investments classified as available for sale, a significant or prolonged decline in the fair value below its cost is considered to be objective evidence of impairment. The Group and the Company use their judgement to determine what is considered as significant or prolonged decline, evaluating past volatility experiences and current market conditions. Where there is objective evidence that the asset is impaired, the decline in the fair value of an available-for-sale financial asset together with the cumulative loss recognised in other comprehensive income shall be reclassified from equity to profit or loss as a reclassification adjustment even though the financial asset has not been derecognised. The amount of cumulative loss that is reclassified from equity to profit or loss shall be the difference between its cost (net of any principal repayment and amortisation) and its current fair value, less any impairment loss previously recognised in profit or loss. Impairment losses on available-for-sale equity investments are not reversed through profit or loss in the subsequent periods. Increase in fair value, if any, subsequent to impairment loss, is recognised in other comprehensive income.
For available-for-sale debt investments, impairment losses are subsequently reversed through profit or loss if an increase in the fair value of the investment can be objectively related to a loss event occurring after the recognition of the impairment loss in profit or loss.
Unquoted equity instruments carried at cost In the case of unquoted equity instruments carried at cost, the amount of the impairment loss is measured as the difference between the carrying amount of the financial asset and the present value of estimated future cash flows discounted at the current market rate of return for a similar financial asset. Such impairment losses shall not be reversed.

ADVANCE SYNERGY BERHAD | annual report 2018 Notes to the Financial Statements31 December 2018 (continued)
143 Company No. 1225 – D
54
3. SIGNIFICANT ACCOUNTING POLICIES (Continued)
3.10 Impairment of assets (Continued)
(b) Impairment of non-financial assets
The carrying amounts of non-financial assets (except for inventories and deferred tax assets) are reviewed at the end of each reporting period to determine whether there is any indication of impairment. If any such indication exists, the Group and the Company make an estimate of the asset’s recoverable amount. For the purpose of impairment testing, assets are grouped together into the smallest group of assets that generates cash inflows from continuing use that are largely independent of the cash inflows of non-financial assets or cash-generating units (“CGUs”). The recoverable amount of an asset or a CGU is the higher of its fair value less costs of disposal and its value-in-use. In assessing value-in-use, the estimated future cash flows are discounted to their present value using a pre-tax discount rate that reflects current market assessments of the time value of money and the risks specific to the asset or CGU. In determining the fair value less costs of disposal, recent market transactions are taken into account. If no such transactions can be identified, an appropriate valuation model is used. Where the carrying amount of an asset exceeds its recoverable amount, the carrying amount of asset is reduced to its recoverable amount. Impairment losses are recognised in profit or loss.
For other assets, an assessment is made at each reporting date as to whether there is any indication that previously recognised impairment losses may no longer exist or may have decreased. An impairment loss is reversed only if there has been a change in the estimates used to determine the assets recoverable amount since the last impairment loss was recognised. Reversal of impairment loss is restricted by the asset’s carrying amount that would have been determined had no impairment loss been recognised for the asset in prior years. Such reversal is recognised in profit or loss unless the asset is measured at revalued amount, in which case the reversal is treated as a revaluation increase.
Notes to the Financial Statements31 December 2018 (continued)
144 Company No. 1225 – D
55
3. SIGNIFICANT ACCOUNTING POLICIES (Continued)
3.11 Share capital
(a) Ordinary shares Ordinary shares are equity instruments. An equity instrument is a contract that evidences a residual interest in the assets of the Company after deducting all of its liabilities. Ordinary shares are recorded at the proceeds received, net of directly attributable incremental transaction costs. Dividends on ordinary shares are recognised in equity in the period in which they are declared.
(b) Treasury shares
When share capital recognised as equity is repurchased, the amount of consideration paid is recognised directly in equity. Repurchased shares that have not been cancelled including any attributable transaction costs are classified as treasury shares and presented as a deduction from total equity. When treasury shares are sold or reissued subsequently, the difference between the sales consideration and the carrying amount is presented as a movement in equity.
3.12 Employee benefits
(a) Short-term employee benefits
Short-term employee benefit obligations in respect of wages, salaries, social security contributions, annual bonuses, paid annual leave, sick leave and non-monetary benefits are recognised as an expense in the financial year where the employees have rendered their services to the Group.
(b) Defined contribution plans
As required by law, the Group and the Company contribute to the Employees Provident Fund (“EPF”), the national defined contribution plan. The Group’s foreign subsidiaries make contributions to their respective countries’ statutory pension schemes. Such contributions are recognised as an expense in the profit or loss in the period in which the employees render their services.
3.13 Provisions
Provisions are recognised when the Group and the Company have a present obligation (legal or constructive) as a result of a past event, it is probable that an outflow of economic resources will be required to settle the obligation and the amount of the obligation can be estimated reliably. If the effect of the time value of money is material, provisions that are determined based on the expected future cash flows to settle the obligation are discounted using a current pre-tax rate that reflects current market assessments of the time value of money and the risks specific to the liability. When discounting is used, the increase in the provisions due to passage of time is recognised as finance costs. Provisions are reviewed at each reporting date and adjusted to reflect the current best estimate. If it is no longer probable that an outflow of economic resources will be required to settle the obligation, the provision is reversed.

ADVANCE SYNERGY BERHAD | annual report 2018 Notes to the Financial Statements31 December 2018 (continued)
145 Company No. 1225 – D
56
3. SIGNIFICANT ACCOUNTING POLICIES (Continued)
3.14 Revenue and other income Accounting policies applied from 1 January 2018 The Group and the Company recognise revenue that depicts the transfer of promised goods or services to customers in an amount that reflects the consideration to which the Group and the Company expect to be entitled in exchange for those goods or services. The Group and the Company measure revenue from sale of good or service at its transaction price, being the amount of consideration to which the Group and the Company expect to be entitled in exchange for transferring promised good or service to a customer, excluding amounts collected on behalf of third parties such as goods and service tax, adjusted for the effects of any variable consideration, constraining estimates of variable consideration, significant financing components, non-cash consideration and consideration payable to customer. If the transaction price includes variable consideration, the Group and the Company use the expected value method by estimating the sum of probability-weighted amounts in a range or possible consideration amounts, or the most likely outcome method, depending on which method the Group and the Company expect to better predict the amount of consideration to which it is entitled.
Revenue from contracts with customers Revenue from contracts with customers is measured based on the consideration specified in a contract with a customer in exchange for transferring goods or services to a customer net of sales and service tax, returns, rebates and discounts. The Group recognises revenue when (or as) it transfers control over a product or service to customer. An asset is transferred when (or as) the customer obtains control of the asset. Depending on the substance of the contract, revenue is recognised when the performance obligation is satisfied, which may be at a point in time or over time. Revenue from property development is recognised progressively when property development services are rendered and such services do not create an asset with an alternative’s use to the Group, and the Group has a present right to payment for services rendered to date. The progress towards complete satisfaction of the performance obligation is measured based on a method that best depicts the Group’s performance in satisfying the performance obligation of the contract. This is determined by reference to the property development costs incurred up to the end of the reporting period as a percentage of total estimated costs for complete satisfaction of the contract. Otherwise, revenue is recognised at a point in time upon delivery of property and customer’s acceptance, and the Group has a present right to payment for the property sold. A receivable is recognised when the development activities are carried out as this is the point in time that the consideration is unconditional because only the passage of time is required before the payment is due. When the services rendered exceed the billings to customers, a contract asset is recognised. If the billings exceed the services rendered, a contract liability is recognised. Sale of completed properties Revenue from sale of completed properties is recognised when significant risks and rewards of ownership of the completed properties have been transferred to the buyer and where the Group does not have continuing managerial involvement and effective control over the completed properties sold.

Notes to the Financial Statements31 December 2018 (continued)
146 Company No. 1225 – D
57
3. SIGNIFICANT ACCOUNTING POLICIES (Continued)
3.14 Revenue and other income (Continued) Accounting policies applied until 31 December 2017 Revenue is recognised to the extent that it is probable that the economic benefits will flow to the Group and the Company and revenue can be reliably measured. Revenue is measured at the fair value of the consideration received or receivable, net of discounts, rebates, returns and taxes. Revenue from sale of goods is recognised upon the transfer of significant risk and rewards of ownership of the goods to the customer. Revenue is not recognised to the extent where there are significant uncertainties regarding recovery of the consideration due, associated costs or the possible return of goods.
(a) Interest income
Interest income is recognised using the effective interest method.
(b) Dividend income
Dividend income is recognised when the right to receive payment is established.
(c) Rental income
Rental income from investment property is recognised on a straight-line basis over the term of the lease. Lease incentive granted is recognised as an integral part of the total rental income, over the term of the lease.
3.15 Borrowing costs
Borrowing costs are interests and other costs that the Group incurs in connection with borrowing of funds. Borrowing costs that are not directly attributable to the acquisition, construction or production of a qualifying asset are recognised in profit or loss using the effective interest method. Borrowing costs that are directly attributable to the acquisition, construction or production of qualifying assets, which are assets that necessarily take a substantial period of time to get ready for their intended use or sale, are capitalised as part of the cost of those assets, until such time as the assets are substantially ready for their intended use or sale. The Group begins capitalising borrowing costs when the Group has incurred the expenditures for the asset, incurred related borrowing costs and undertaken activities that are necessary to prepare the asset for its intended use or sale. Investment income earned on the temporary investment of specific borrowings pending their expenditure on qualifying assets is deducted from the borrowing costs eligible for capitalisation.

ADVANCE SYNERGY BERHAD | annual report 2018 Notes to the Financial Statements31 December 2018 (continued)
147 Company No. 1225 – D
58
3. SIGNIFICANT ACCOUNTING POLICIES (Continued)
3.16 Taxes
(a) Income tax
Income tax expense in profit or loss comprises current and deferred tax. Current and deferred tax are recognised in profit or loss except to the extent that it relates to a business combination or items recognised directly in equity or other comprehensive income.
(i) Current tax
Current tax is the expected taxes payable or receivable on the taxable income or loss for the financial year, using the tax rates that have been enacted or substantively enacted by the end of the reporting period, and any adjustment to tax payable in respect of previous financial years.
(ii) Deferred tax
Deferred tax is recognised using the liability method on temporary differences at the reporting date between the tax bases of assets and liabilities and their carrying amounts in the statements of financial position. Deferred tax liabilities are generally recognised for all taxable temporary differences. Deferred tax assets are generally recognised for all deductible temporary differences, unutilised tax losses and unused tax credits, to the extent that it is probable that future taxable profit will be available against which the deductible temporary differences, unused tax losses and unused tax credits can be utilised.
Deferred tax is not recognised if the temporary differences arise from the initial recognition of assets and liabilities in a transaction which is not a business combination and that affects neither the taxable profit nor the accounting profit. In addition, deferred tax liabilities are not recognised if the temporary difference arises from the initial recognition of goodwill. Deferred tax liabilities are recognised for taxable temporary differences associated with investments in subsidiaries, except where the Group is able to control the reversal timing of the temporary differences and it is probable that the temporary differences will not reverse in the foreseeable future. Deferred tax assets arising from deductible temporary differences associated with such investments and interests are only recognised to the extent that it is probable that there will be sufficient taxable profits against which to utilise the benefits of the temporary differences and they are expected to reverse in the foreseeable future. The carrying amount of deferred tax assets is reviewed at each reporting date and reduced to the extent that it is no longer probable that sufficient taxable profit will be available to allow the benefit of part or all of that deferred tax asset to be utilised. Unrecognised deferred tax assets are reassessed at each reporting date and are recognised to the extent that it has become probable that future taxable profit will allow the deferred tax assets to be utilised. Deferred tax is measured at the tax rates that are expected to apply in the period when the asset is realised or the liability is settled, based on tax rates and tax laws that have been enacted or substantively enacted at the reporting date.

Notes to the Financial Statements31 December 2018 (continued)
148 Company No. 1225 – D
59
3. SIGNIFICANT ACCOUNTING POLICIES (Continued)
3.16 Taxes (Continued)
(a) Income tax (Continued)
(ii) Deferred tax (Continued)
Deferred tax relating to items recognised outside profit or loss is recognised outside profit or loss. Deferred tax items are recognised in correlation to the underlying transaction either in other comprehensive income or directly in equity. Deferred tax assets and deferred tax liabilities are offset if there is a legally enforceable right to offset current tax assets against current tax liabilities and when they relate to income taxes levied by the same taxation authority on the same taxable entity, or on different tax entities, but they intend to settle their income tax recoverable and income tax payable on a net basis or their tax assets and liabilities will be realised simultaneously.
(b) Goods and services tax
Revenues, expenses and assets are recognised net of amount of goods and services tax (“GST”) except: where the GST incurred in a purchase of assets or services is not recoverable
from the taxation authority, in which case the GST is recognised as part of the cost of acquisition of the asset or as part of the expense item as applicable; and
receivables and payables that are stated with the amount of GST included. The net amount of GST recoverable from, or payable to, the taxation authority is included as part of receivables or payables in the statements of financial position.
3.17 Earnings per share
The Group presents basic and diluted earnings per share (“EPS”) data for its ordinary shares. Basic EPS is calculated by dividing the profit or loss attributable to ordinary shareholders of the Company by the weighted average number of ordinary shares outstanding during the period, adjusted for own shares held. Diluted EPS is determined by adjusting the profit or loss attributable to ordinary shareholders and the weighted average number of ordinary shares outstanding, adjusted for own shares held, for the effects of all dilutive potential ordinary shares.
3.18 Operating segment
Operating segments are reported in a manner consistent with the internal reporting provided to the chief operating decision-maker. The Chief Executive Officer of the Group, who is responsible for allocating resources and assessing performance of the operating segments, has been identified as the chief operating decision-maker that makes strategic decisions.

ADVANCE SYNERGY BERHAD | annual report 2018 Notes to the Financial Statements31 December 2018 (continued)
149 Company No. 1225 – D
60
3. SIGNIFICANT ACCOUNTING POLICIES (Continued)
3.19 Fair value measurements Fair value of an asset or a liability, except for share-based payment and lease transactions, is determined as the price that would be received to sell an asset or paid to transfer a liability in an orderly transaction between market participants at the measurement date. The measurement assumes that the transaction to sell the asset or transfer the liability takes place either in the principal market or in the absence of a principal market, in the most advantageous market. For a non-financial asset, the fair value measurement takes into account a market participant’s ability to generate economic benefits by using the asset in its highest and best use or by selling it to another market participant that would use the asset in its highest and best use. When measuring the fair value of an asset or a liability, the Group and the Company use observable market data as far as possible. Fair value is categorised into different levels in a fair value hierarchy based on the input used in the valuation technique as follows: Level 1: Quoted prices (unadjusted) in active markets for identical assets or
liabilities that the Group and the Company can access at the measurement date.
Level 2: Inputs other than quoted prices included within Level 1 that are observable for the asset or liability, either directly or indirectly.
Level 3: Unobservable inputs for the asset or liability. There were no transfers between levels of the fair value hierarchy as of the date of the event or change in circumstances.
3.20 Contingencies A contingent liability or asset is a possible obligation or asset that arises from past events and whose existence will be confirmed only by the occurrence or non-occurrence of uncertain future event(s) not wholly within the control of the Group and of the Company. Contingent liability is also referred as a present obligation that arises from past events but is not recognised because: (i) it is not probable that an outflow of resources embodying economic benefits will be
required to settle the obligation; or (ii) the amount of the obligation cannot be measured with sufficient reliability. Contingent liabilities and assets are not recognised in the statements of financial position.
3.21 Contract assets/(liabilities)
Contract asset is the right to consideration for goods or services transferred to the customers when that right is conditioned on something other than the passage of time (for example, the Company’s future performance). The policy for the recognition and measurement of impairment losses is in accordance with Note 3.11(a) to the financial statements.
Contract liability is the obligation to transfer goods or services to customer for which the Group has received the consideration or has billed the customer.

Notes to the Financial Statements31 December 2018 (continued)
150 Company No. 1225 – D
61
4. SIGNIFICANT ACCOUNTING ESTIMATES AND JUDGEMENTS
The preparation of the Group’s financial statements requires management to make judgements, estimates and assumptions that affect the reported amounts of revenues, expenses, assets and liabilities, and the disclosure of contingent liabilities at the reporting date. However, uncertainty about these assumptions and estimates could result in outcomes that could require a material adjustments to the carrying amount of the asset or liability affected in the future.
Key Source of Estimation Uncertainty (a) Impairment of Goodwill on Consolidation
The Group determines whether goodwill is impaired at least on an annual basis. This requires an estimation of the value-in-use of CGU to which the goodwill is allocated. Estimating a value-in-use amount requires management to make an estimation of the expected future cash flows from the CGU and also to choose a suitable discount rate in order to calculate the present value of those cash flows. Further details of the key assumptions applied in the impairment assessment of goodwill are disclosed in Note 8 to the financial statements.
The carrying amounts of the Group’s goodwill key assumptions used to determine the recoverable amount for different cash-generating units, including sensitivity analysis, are disclosed in Note 8 to the financial statements.
(b) Fair Value of Unquoted Investments
The financial asset is not traded in an active market or if the quoted price is not readily and regularly available, the fair value is established by using valuation techniques that are appropriate in circumstances and for which sufficient data are available to measure fair value, maximising the use of relevant observable inputs and minimising the use of unobservable inputs. The fair value measurement requires the selection among a range of different valuation methodologies, making estimates about expected future cash flows and discounted rates. The models are tested for validity by calibrating to prices from any observable current market transactions in the same instrument when available. Where cost is used as an estimate of fair value, significant judgement is required where management considers various indicators where cost might not be representative of fair value.

ADVANCE SYNERGY BERHAD | annual report 2018 Notes to the Financial Statements31 December 2018 (continued)
151
5.
PR
OP
ER
TY,
PL
AN
T A
ND
EQ
UIP
ME
NT
Grou
pFr
eeho
ldla
nd
Build
ings
Sho
rt
Ter
m
Lea
seho
ld
land
and
b
uild
ing
Hot
elpr
oper
ties
-Fre
ehol
dla
nds
Hot
elpr
oper
ties
-Bui
ldin
gs
Plan
t and
m
achi
nery
Furn
itur
e,
fitti
ngs
and
equi
pmen
tRe
nova
tion
Mot
orve
hicl
es
Com
pute
r eq
uipm
ent
and
soft
war
e
Croc
keri
es,
glas
swar
e,
cutl
erie
s,
linen
and
ki
tche
n ut
ensi
ls
Tele
com
-m
unic
-ti
ons
and
rese
arch
an
dde
velo
p -m
ent
equi
pmen
t
Cons
truc
-ti
on w
ork-
in-p
rogr
ess
Tot
al
2018
RM
’000
R
M’0
00
RM’0
00 R
M’0
00
RM
’000
R
M’0
00
RM
’000
R
M’0
00
RM
’000
R
M’0
00
RM
’000
R
M’0
00
RM
’000
R
M’0
00
Cost
/Val
uat
ion
At
1 Ja
nuar
y 20
18 2
7,16
8 1
8,86
6 1
,703
6
0,95
4 3
5,15
8 6
,969
4
2,09
4 1
6,83
6 3
,327
1
8,12
9 2
,974
3
0,61
4 7
,342
27
2,13
4 Ad
ditio
ns -
1,4
00
- -
- 1
74
1,8
41
2,1
30
33
305
2
25
1,9
81
818
8
,907
Di
spos
als
- -
- -
- -
(2)
- (5
6) -
- -
- (5
8)W
ritt
en o
ff -
- -
- -
- (6
,180
) (7
50)
(249
) (2
08)
(1,2
80)
(256
) -
(8,9
23)
Recl
assi
ficat
ion
- -
- -
122
-
(53)
7,4
03
- -
- 6
(7
,502
) (2
4)Fo
reig
n ex
chan
ge
tran
slat
ion
adju
stm
ent
- 1
7 (8
6) 2
78
- -
(201
) (4
82)
(4)
(7)
- (3
70)
(24)
(879
)
At 3
1 De
cem
ber 2
018
27,
168
20,
283
1,6
17
61,
232
35,
280
7,1
43
37,
499
25,
137
3,0
51
18,
219
1,9
19
31,
975
634
2
71,1
57
Repr
esen
ting:
Cost
27,
168
20,
283
1,6
17
- -
7,1
43
37,
499
25,
137
3,0
51
18,
219
1,9
19
31,
975
634
17
4,64
5 Va
luat
ion
- -
- 6
1,23
2 3
5,28
0 -
- -
- -
- -
- 9
6,51
2
Tota
l 2
7,16
8 2
0,28
3 1
,617
6
1,23
2 3
5,28
0 7
,143
3
7,49
9 2
5,13
7 3
,051
1
8,21
9 1
,919
3
1,97
5 6
34
271,
157
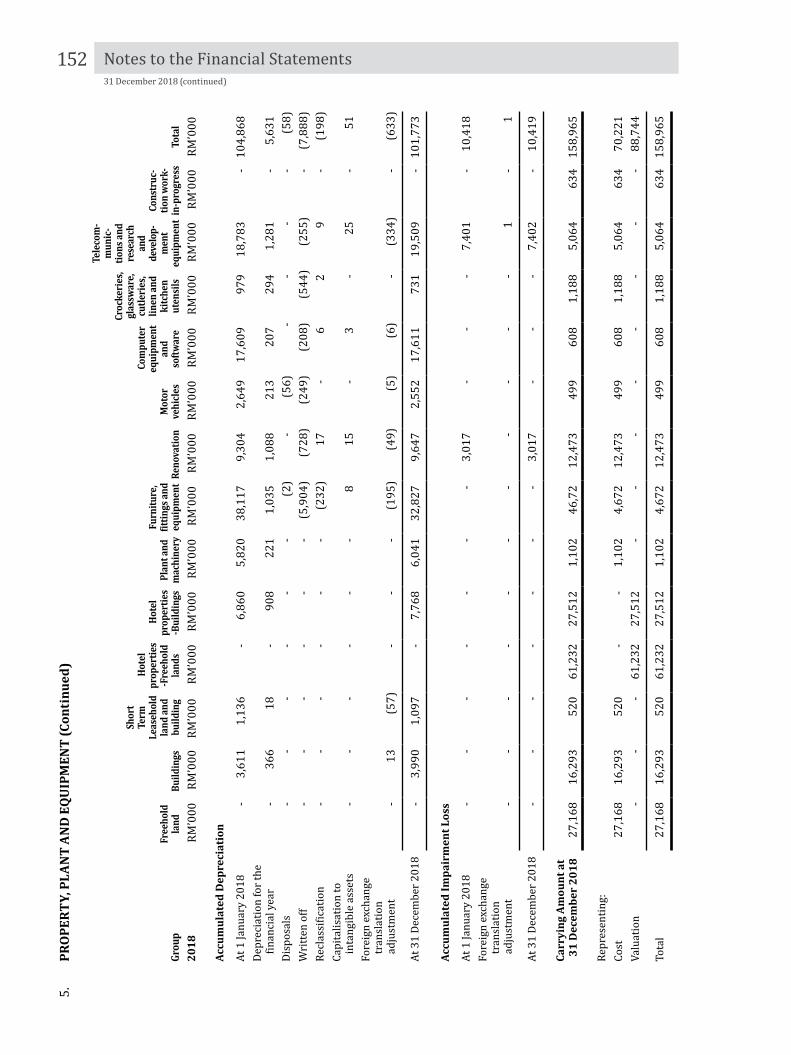
Notes to the Financial Statements31 December 2018 (continued)
1525.
P
RO
PER
TY,
PLA
NT
AN
D E
QU
IPM
ENT
(Con
tin
ued
)
Grou
pFr
eeho
ldla
nd
Build
ings
Sho
rt
Ter
m
Lea
seho
ld
land
and
b
uild
ing
Hot
elpr
oper
ties
-Fre
ehol
dla
nds
Hot
elpr
oper
ties
-Bui
ldin
gs
Plan
t and
m
achi
nery
Furn
itur
e,
fitti
ngs
and
equi
pmen
tRe
nova
tion
Mot
orve
hicl
es
Com
pute
r eq
uipm
ent
and
soft
war
e
Croc
keri
es,
glas
swar
e,
cutl
erie
s,
linen
and
ki
tche
n ut
ensi
ls
Tele
com
-m
unic
-ti
ons
and
rese
arch
an
dde
velo
p -m
ent
equi
pmen
t
Cons
truc
-ti
on w
ork-
in-p
rogr
ess
Tot
al
2018
R
M’0
00
RM
’000
RM
’000
RM
’000
R
M’0
00
RM
’000
R
M’0
00
RM
’000
R
M’0
00
RM
’000
R
M’0
00
RM
’000
R
M’0
00
RM
’000
Acc
um
ula
ted
Dep
reci
atio
n
At 1
Janu
ary
2018
- 3
,611
1
,136
-
6,8
60
5,8
20
38,
117
9,3
04
2,6
49
17,
609
979
1
8,78
3 -
104
,868
De
prec
iatio
n fo
r the
fin
anci
al y
ear
- 3
66
18
- 9
08
221
1
,035
1
,088
2
13
207
2
94
1,2
81
- 5
,631
Di
spos
als
- -
- -
- -
(2)
- (5
6) -
- -
- (5
8)W
ritt
en o
ff -
- -
- -
- (5
,904
) (7
28)
(249
) (2
08)
(544
) (2
55)
- (7
,888
)Re
clas
sific
atio
n -
- -
- -
- (2
32)
17
- 6
2
9
-
(198
)Ca
pita
lisat
ion
to
inta
ngib
le a
sset
s -
- -
- -
- 8
1
5 -
3
- 2
5 -
51
Fore
ign
exch
ange
tr
ansl
atio
n ad
just
men
t -
13
(57)
- -
- (1
95)
(49)
(5)
(6)
- (3
34)
- (6
33)
At 3
1 De
cem
ber 2
018
- 3
,990
1
,097
-
7,7
68
6,0
41
32,
827
9,6
47
2,5
52
17,
611
731
1
9,50
9 -
101
,773
Acc
um
ula
ted
Imp
airm
ent
Loss
At 1
Janu
ary
2018
- -
- -
- -
- 3
,017
-
- -
7,4
01
- 1
0,41
8 Fo
reig
n ex
chan
ge
tran
slat
ion
adju
stm
ent
- -
- -
- -
- -
- -
- 1
-
1
At 3
1 De
cem
ber 2
018
- -
- -
- -
- 3
,017
-
- -
7,4
02
- 1
0,41
9
Carr
yin
g A
mou
nt
at 3
1 D
ecem
ber
20
18
27,
168
16,
293
520
6
1,23
2 2
7,51
2 1
,102
4
6,72
1
2,47
3 4
99
608
1
,188
5
,064
6
34
158,
965
Repr
esen
ting:
Cost
27,
168
16,
293
520
-
- 1
,102
4
,672
1
2,47
3 4
99
608
1
,188
5
,064
6
34
70,
221
Valu
atio
n -
- -
61,
232
27,
512
- -
- -
- -
- -
88,
744
Tota
l 2
7,16
8 1
6,29
3 5
20
61,
232
27,
512
1,1
02 4
,672
1
2,47
3 4
99
608
1
,188
5
,064
6
34
158,
965

ADVANCE SYNERGY BERHAD | annual report 2018 Notes to the Financial Statements31 December 2018 (continued)
153
5.
PR
OP
ER
TY,
PL
AN
T A
ND
EQ
UIP
ME
NT
(Con
tin
ued
)
Grou
pFr
eeho
ldla
nd
Build
ings
Sho
rt
Ter
m
Lea
seho
ld
land
and
b
uild
ing
Hot
elpr
oper
ties
-Fre
ehol
dla
nds
Hot
elpr
oper
ties
-Bui
ldin
gs
Plan
t and
m
achi
nery
Furn
itur
e,
fitti
ngs
and
equi
pmen
tRe
nova
tion
Mot
orve
hicl
es
Com
pute
r eq
uipm
ent
and
soft
war
e
Croc
keri
es,
glas
swar
e,
cutl
erie
s,
linen
and
ki
tche
n ut
ensi
ls
Tele
com
-m
unic
-ti
ons
and
rese
arch
an
dde
velo
p -m
ent
equi
pmen
t
Cons
truc
-ti
on w
ork-
in-p
rogr
ess
Tot
al
2017
RM
’000
R
M’0
00
RM’0
00 R
M’0
00
RM
’000
R
M’0
00
RM
’000
R
M’0
00
RM
’000
R
M’0
00
RM
’000
R
M’0
00
RM
’000
R
M’0
00
Cost
/Val
uat
ion
At
1 Ja
nuar
y 20
17 2
7,16
8 1
9,08
2 1
,897
6
2,14
4 3
5,09
1 6
,843
4
1,89
0 1
7,05
9 3
,203
1
8,24
2 2
,149
2
9,02
8 -
263
,796
Ad
ditio
ns -
- -
- -
126
1
,266
2
30
128
2
09
52
2,4
47
7,5
32
11,
990
Disp
osal
s -
- -
- -
- (1
21)
(8)
- (8
4) -
- -
(213
)W
ritt
en o
ff -
- -
- -
- (4
3) (2
68)
- (2
06)
- -
- (5
17)
Recl
assi
ficat
ion
- -
- -
67
- (7
71)
- (3
) (1
) 7
73
(40)
(67)
(42)
Fore
ign
exch
ange
tr
ansl
atio
n ad
just
men
t -
(216
) (1
94)
(1,1
90)
- -
(127
) (1
77)
(1)
(31)
- (8
21)
(123
) (2
,880
)
At 3
1 De
cem
ber 2
017
27,
168
18,
866
1,7
03
60,
954
35,
158
6,9
69
42,
094
16,
836
3,3
27
18,
129
2,9
74
30,
614
7,3
42
272
,134
Re
pres
entin
g:Co
st 2
7,16
8 1
8,86
6 1
,703
-
- 6
,969
4
2,09
4 1
6,83
6 3
,327
1
8,12
9 2
,974
3
0,61
4 7
,342
17
6,02
2Va
luat
ion
- -
- 6
0,95
4 3
5,15
8 -
- -
- -
- -
- 9
6,11
2
Tota
l 2
7,16
8 1
8,86
6 1
,703
6
0,95
4 3
5,15
8 6
,969
4
2,09
4 1
6,83
6 3
,327
1
8,12
9 2
,974
3
0,61
4 7
,342
27
2,13
4

Notes to the Financial Statements31 December 2018 (continued)
1545.
P
RO
PER
TY,
PLA
NT
AN
D E
QU
IPM
ENT
(Co
nti
nu
ed)
Grou
pFr
eeho
ldla
nd
Build
ings
Sho
rt
Ter
m
Lea
seho
ld
land
and
b
uild
ing
Hot
elpr
oper
ties
-Fre
ehol
dla
nds
Hot
elpr
oper
ties
-Bui
ldin
gs
Plan
t and
m
achi
nery
Furn
itur
e,
fitti
ngs
and
equi
pmen
tRe
nova
tion
Mot
orve
hicl
es
Com
pute
r eq
uipm
ent
and
soft
war
e
Croc
keri
es,
glas
swar
e,
cutl
erie
s,
linen
and
ki
tche
n ut
ensi
ls
Tele
com
-m
unic
-ti
ons
and
rese
arch
an
dde
velo
p -m
ent
equi
pmen
t
Cons
truc
-ti
on w
ork-
in-p
rogr
ess
Tot
al
2017
RM
’000
R
M’0
00
RM’0
00 R
M’0
00
RM
’000
R
M’0
00
RM
’000
R
M’0
00
RM
’000
R
M’0
00
RM
’000
R
M’0
00
RM
’000
R
M’0
00
Acc
um
ula
ted
Dep
reci
atio
n
At 1
Janu
ary
2017
- 3
,340
1
,179
-
5,5
86
5,5
22
37,
143
8,6
95
2,5
24
17,
498
506
1
7,86
8 -
99,
861
Depr
ecia
tion
for t
he
finan
cial
yea
r -
360
8
3 -
1,2
74
298
1
,305
8
52
194
3
59
344
1
342
- 6
,411
Di
spos
als
- -
- -
- -
(90)
(4)
- (7
7) -
- -
(171
)W
ritt
en o
ff -
- -
- -
- (7
8) (2
00)
- (1
43)
- -
- (4
21)
Recl
assi
ficat
ion
- -
- -
- -
(48)
16
(68)
2
129
(3
0) -
1
Capi
talis
atio
n to
in
tang
ible
ass
ets
- -
- -
- -
10
19
- 2
-
29
- 6
0 Fo
reig
n ex
chan
ge
tran
slat
ion
adju
stm
ent
- (8
9) (1
26)
- -
- (1
25)
(74)
(1)
(32)
- (4
26)
- (8
73)
At 3
1 De
cem
ber 2
017
- 3
,611
1
,136
-
6,8
60
5,8
20
38,
117
9,3
04
2,6
49
17,
609
979
1
8,78
3 -
104
,868
Acc
um
ula
ted
Imp
airm
ent
Loss
At 1
Janu
ary
2017
- -
- -
- -
- 3
,017
-
- -
7,6
29
- 1
0,64
6 Fo
reig
n ex
chan
ge
tran
slat
ion
adju
stm
ent
- -
- -
- -
- -
- -
- (2
28)
- (2
28)
At 3
1 De
cem
ber 2
017
- -
- -
- -
- 3
,017
-
- -
7,4
01
- 1
0,41
8
Carr
yin
g A
mou
nt
at 3
1 D
ecem
ber
20
17
27,
168
15,
255
567
6
0,95
4 2
8,29
8 1
,149
3
,977
4
,515
6
78
520
1
,995
4
,430
7
,342
15
6,84
8
Repr
esen
ting:
Cost
27,
168
15,
255
567
-
- 1
,149
3
,977
4
,515
6
78
520
1
,995
4
,430
7
,342
6
7,59
6 Va
luat
ion
- -
- 6
0,95
4 2
8,29
8 -
- -
- -
- -
- 8
9,25
2
Tota
l 2
7,16
8 1
5,25
5 5
67
60,
954
28,
298
1,1
49
3,9
77
4,5
15
678
5
20
1,9
95
4,4
30
7,3
42
156,
848

ADVANCE SYNERGY BERHAD | annual report 2018 Notes to the Financial Statements31 December 2018 (continued)
155 Company No. 1225 – D
66
5. PROPERTY, PLANT AND EQUIPMENT (Continued)
Furniture,Computer Motor fittings andequipment vehicles equipment Total
Company RM'000 RM'000 RM'000 RM'0002018CostAt 1 January 2018 107 5 191 303 Additions 1 - - 1 At 31 December 2018 108 5 191 304
Accumulated DepreciationAt 1 January 2018 103 5 165 273 Depreciation for the financial year 2 - 6 8 At 31 December 2018 105 5 171 281 Carrying Amount at 31 December 2018 3 - 20 23
Company RM'000 RM'000 RM'000 RM'0002017
CostAt 1 January 2017 105 5 191 301 Additions 2 - - 2 At 31 December 2017 107 5 191 303
Accumulated DepreciationAt 1 January 2017 102 5 158 265 Depreciation for the financial year 1 - 7 8 At 31 December 2017 103 5 165 273 Carrying Amount at 31 December 2017 4 - 26 30
(a) Included in property, plant and equipment of the Group are assets acquired under hire
purchase instalment plans with the following carrying amounts:
2018 2017RM'000 RM'000
Motor vehicles 243 355
Group

Notes to the Financial Statements31 December 2018 (continued)
156 Company No. 1225 – D
67
5. PROPERTY, PLANT AND EQUIPMENT (Continued)
(b) Included in property, plant and equipment of the Group are assets pledged to the
licensed banks to secure credit facilities granted to the Company and its subsidiaries as disclosed in Note 22 to the financial statements with the following carrying amounts:
2018 2017RM'000 RM'000
Hotel properties 32,801 33,496 Buildings 39,346 39,617
72,147 73,113
Group
(c) Had the revalued assets been carried at cost less accumulated depreciation, the carrying amounts would have been as follows:
Accumulated Carrying
Group Cost depreciation amountRM'000 RM'000 RM'000
2018Hotel properties- lands 28,444 - 28,444 - buildings 30,468 (7,720) 22,748
58,912 (7,720) 51,192
2017Hotel properties- lands 28,325 - 28,325 - buildings 30,652 (7,127) 23,525
58,977 (7,127) 51,850
(d) Fair value information
Fair values of revalued properties are categorised as follows:
Group Level 1 Level 2 Level 3 Total2018 RM'000 RM'000 RM'000 RM'000Hotel properties- lands - 60,155 - 60,155 - buildings - 31,900 - 31,900
- 92,055 - 92,055 2017Hotel properties- lands - 59,547 - 59,547 - buildings - 31,900 - 31,900
- 91,447 - 91,447

ADVANCE SYNERGY BERHAD | annual report 2018 Notes to the Financial Statements31 December 2018 (continued)
157 Company No. 1225 – D
68
5. PROPERTY, PLANT AND EQUIPMENT (Continued)
(d) Fair value information (Continued)
The fair value of revalued properties has been determined based on the valuation report dated in April 2016 and May 2016 carried out by accredited independent valuers with recognised and relevant qualification and recent experience in the location and assets being valued. The valuation method used was Comparison Method that makes reference to recent transactions and sales evidences involving other similar properties in the vicinity. The most significant input to this valuation approach is price per square feet of comparable properties. Policy on transfer between levels The fair value of an asset to be transferred between levels is determined as of the date of the event or change in circumstances that caused the transfer. Fair value hierarchy Level 1 fair value Level 1 fair value is derived from quoted price (unadjusted) in active markets for identical properties that the entity can access at the measurement date. Level 2 fair value Level 2 fair value is estimated using inputs other than quoted prices included within Level 1 that are observable for the properties, either directly or indirectly. Level 3 fair value Level 3 fair value is estimated using unobservable input for the properties. The Group does not have non-financial assets measured at Level 1 and Level 3 hierarchy. Transfer between levels of fair value hierarchy There is no transfer between levels of fair values hierarchy during the financial year.
(e) Included in property, plant and equipment of the Group are assets under sale and finance
leaseback arrangements as follows:
2018 2017RM'000 RM'000
Hotel properties - Freehold land 27,077 27,077 Hotel properties - Buildings 9,846 9,937
36,923 37,014
Group
(f) The leasehold land and building has unexpired lease period of less than fifty (50) years.

Notes to the Financial Statements31 December 2018 (continued)
158 Company No. 1225 – D
69
6. INVESTMENT PROPERTIES
2018 2017RM'000 RM'000
At fair value:At 1 January 8,060 8,060 Additions 42,789 - Fair value change recognised to profit or loss (1,060) - At 31 December 49,789 8,060
Group
There are no restrictions on the realisability of investment properties or the remittance of income and proceeds on disposal. The fair value of the shop office was measured in December 2018 based on the highest and best use method to reflect the actual market state and circumstances as of the end of financial year. The fair value was based on a valuation made by C H William Talhar & Wong, a firm of independent professional valuers, which hold a recognised and relevant professional qualification with sufficient recent experience in the location and category of the investment property being valued. There has been no change to the valuation technique during the year. Management determined that the highest and best use of the assets is the current use and that it would provide maximum value to market participants principally through its use in combination with other assets. Strata title of the shop office has not been issued by Department of Director General of Lands and Mines in Malaysia as at 31 December 2018. Details of the Group’s investment properties are as follows: Descriptions Location Existing use Shop office Commercial building 1 Commercial building 2
Lot 3A-5-1, 5th floor, block 3A, Plaza Sentral, Kuala Lumpur, Malaysia. 9, Jalan Kajibumi U1/70, Seksyen U1, Temasya Glenmarie, Shah Alam, Selangor, Malaysia 17, Jalan Yap Ah Shak, Kuala Lumpur, Malaysia
Generate rental Income Generate rental Income Generate rental Income

ADVANCE SYNERGY BERHAD | annual report 2018 Notes to the Financial Statements31 December 2018 (continued)
159 Company No. 1225 – D
70
6. INVESTMENT PROPERTIES (Continued) The following amounts are recognised in the profit or loss:
2018 2017RM'000 RM'000
Rental income - - Direct operating expenses arising from investment properties that generate rental income (150) (150)
Group
Fair value information
Fair value of investment property is categorised as follows:
Level 1 Level 2 Level 3 TotalRM'000 RM'000 RM'000 RM'000
Group2018Building - 49,789 - 49,789
2017Building - 8,060 - 8,060
Valuation techniques and significant other observable inputs Shop office Valuation technique for recurring Comparison with market evidence of recently fair value measurements: transaction prices for similar properties Significant observable inputs: Price per square foot RM868 (2017: RM1,001) Sensitivity on management’s Impact-lower by RM700,000 (2017: RM806,000); estimates – 10% variation from higher by RM700,000 (2017: RM806,000) estimate: Commercial building 1 Valuation technique for recurring Comparison with market evidence of recently fair value measurements: transaction prices for similar properties Significant observable inputs: Price per square foot RM474 Sensitivity on management’s Impact-lower by RM3,150,000; estimates – 10% variation from higher by RM3.150,000 estimate:

Notes to the Financial Statements31 December 2018 (continued)
160 Company No. 1225 – D
71
6. INVESTMENT PROPERTIES (Continued) Valuation techniques and significant other observable inputs (Continued) Commercial building 2 Valuation technique for recurring Comparison with market evidence of recently fair value measurements: transaction prices for similar properties Significant observable inputs: Price per square foot RM852 Sensitivity on management’s Impact-lower by RM2,700,000; estimates – 10% variation from higher by RM2.700,000 estimate: Policy on transfer between levels The fair value of an asset to be transferred between levels is determined as of the date of the event or change in circumstances that caused the transfer. Fair value hierarchy Level 1 fair value Level 1 fair value is derived from quoted price (unadjusted) in active markets for identical investment properties that the entity can access at the measurement date. Level 2 fair value Level 2 fair value is estimated using inputs other than quoted prices included within Level 1 that are observable for the investment property, either directly or indirectly. Level 3 fair value Level 3 fair value is estimated using unobservable input for the investment property. The Group does not have non-financial assets measured at Level 1 and Level 3 hierarchy. Transfer between levels of fair value hierarchy There is no transfer between levels of fair values hierarchy during the financial year.
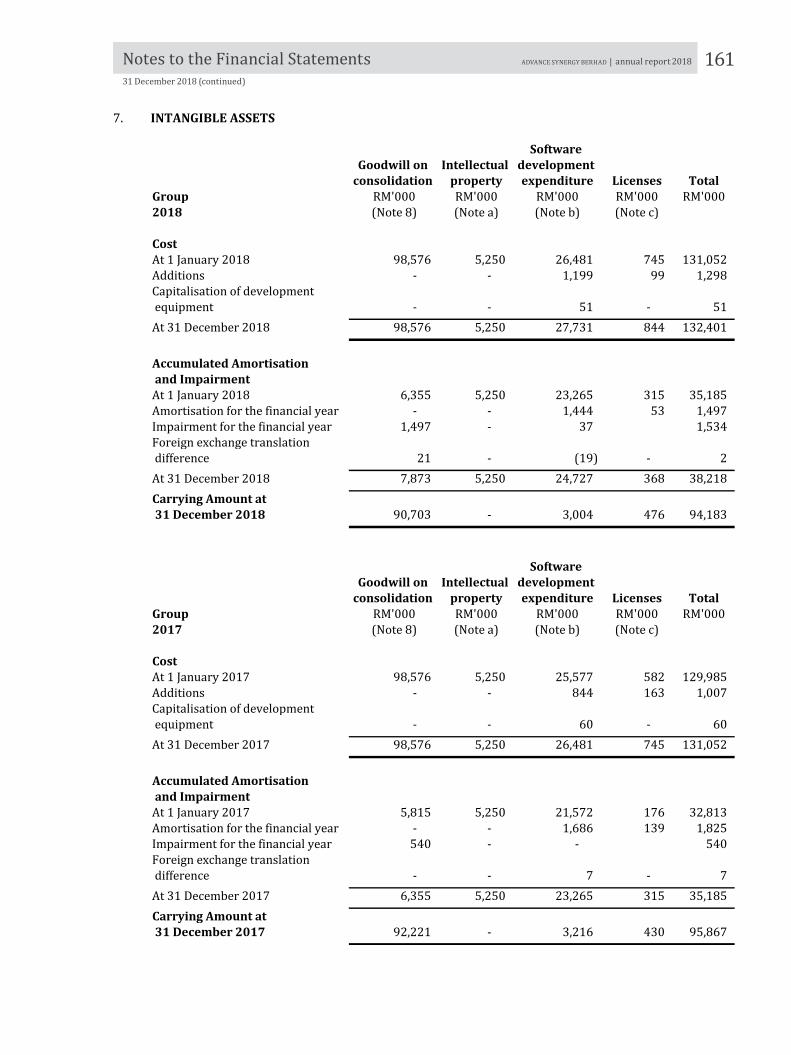
ADVANCE SYNERGY BERHAD | annual report 2018 Notes to the Financial Statements31 December 2018 (continued)
161 Company No. 1225 – D
72
7. INTANGIBLE ASSETS
Software Goodwill on Intellectual development
consolidation property expenditure Licenses TotalGroup RM'000 RM'000 RM'000 RM'000 RM'0002018 (Note 8) (Note a) (Note b) (Note c)
CostAt 1 January 2018 98,576 5,250 26,481 745 131,052 Additions - - 1,199 99 1,298 Capitalisation of development equipment - - 51 - 51 At 31 December 2018 98,576 5,250 27,731 844 132,401
Accumulated Amortisation and ImpairmentAt 1 January 2018 6,355 5,250 23,265 315 35,185 Amortisation for the financial year - - 1,444 53 1,497 Impairment for the financial year 1,497 - 37 1,534 Foreign exchange translation difference 21 - (19) - 2 At 31 December 2018 7,873 5,250 24,727 368 38,218 Carrying Amount at 31 December 2018 90,703 - 3,004 476 94,183
Software Goodwill on Intellectual development
consolidation property expenditure Licenses TotalGroup RM'000 RM'000 RM'000 RM'000 RM'0002017 (Note 8) (Note a) (Note b) (Note c)
CostAt 1 January 2017 98,576 5,250 25,577 582 129,985 Additions - - 844 163 1,007 Capitalisation of development equipment - - 60 - 60 At 31 December 2017 98,576 5,250 26,481 745 131,052
Accumulated Amortisation and ImpairmentAt 1 January 2017 5,815 5,250 21,572 176 32,813 Amortisation for the financial year - - 1,686 139 1,825 Impairment for the financial year 540 - - 540 Foreign exchange translation difference - - 7 - 7 At 31 December 2017 6,355 5,250 23,265 315 35,185 Carrying Amount at 31 December 2017 92,221 - 3,216 430 95,867

Notes to the Financial Statements31 December 2018 (continued)
162 Company No. 1225 – D
73
7. INTANGIBLE ASSETS (Continued)
(a) Intellectual property Intellectual property comprises rights and titles relating to mobile software. (b) Software development expenditure The software development expenditure mainly comprises staff costs, operating expenses
and depreciation expenses for the development of the Captii Group’s proprietary mobile software and has an average amortisation period of 3 years (2017: 3 years).
(c) Licenses The licenses comprise compliance and testing costs of bus models and have an average
amortisation period of 5 years. 8. GOODWILL ON CONSOLIDATION
2018 2017RM'000 RM'000
At 1 January 92,221 92,761 Impairment loss (1,497) (540) Foreign exchange translation adjustment (21) - At 31 December 90,703 92,221
Group
The carrying amounts of goodwill allocated to the Group’s CGU are as follows:
2018 2017RM'000 RM'000
Information and communications technology - CGU 1 83,684 85,202 Hotels and resorts - CGU 2 2,348 2,348 Travel and tours - CGU 3 3,659 3,659 Others 1,012 1,012
90,703 92,221
Group
Impairment loss Impairment loss of RM1,497,000 was recognised during the year, representing the impairment of a subsidiary of information and communication technology.

ADVANCE SYNERGY BERHAD | annual report 2018 Notes to the Financial Statements31 December 2018 (continued)
163 Company No. 1225 – D
74
8. GOODWILL ON CONSOLIDATION (Continued) CGU 1 The recoverable amount of the CGU was determined based on its value-in-use. Cash flow projections used in the value-in-use calculations were based on financial budgets and forecasts approved by management covering a five-year period using a discount rate of 14.5% (2017: 14.5%). The forecasted growth rate used to extrapolate cash flow projections beyond the five-year period is 2% (2017: 2%). The discount rate applied to the cash flow projections is pre-tax and reflects management’s estimate of the risks specific to the CGU at the date of assessment. Management determined the forecasted growth rate and budgeted gross margin based on past performance and its expectations of market developments. Based on the sensitivity analysis performed, management believe that no reasonably possible change in base case key assumptions would cause the carrying values of the CGU to exceed its recoverable amounts. The value in use was determined by management using discounted cash flow valuation technique. The key assumptions used for value in use calculations are as stated above. CGU 2 and CGU 3 The recoverable amount of the CGUs was determined based on its value-in-use. Cash flow projections used in the value-in-use calculations were based on financial budgets and forecasts approved by management covering a five-year period using a discount rate of 10% - 12.4% (2017: 10%). The forecasted growth rate used to extrapolate cash flow projections beyond the five-year period is 3% - 5% (2017: 3% - 5%). The discount rate applied to the cash flow projections is pre-tax and reflects management’s estimate of the risks specific to the CGUs at the date of assessment. Management determined the forecasted growth rate and budgeted gross margin based on past performance and its expectations of market developments. Based on the sensitivity analysis performed, management believe that no reasonably possible change in base case key assumptions would cause the carrying values of the CGUs to exceed its recoverable amounts. The value in use was determined by management using discounted cash flow valuation technique. The key assumptions used for value in use calculations are as stated above.
9. INVESTMENT IN SUBSIDIARIES
2018 2017RM'000 RM'000
Unquoted shares - at cost 700,874 700,874 Less: Impairment loss (226,281) (226,281)
474,593 474,593 Loans that are part of net investments 143,220 -
617,813 474,593
Company

Notes to the Financial Statements31 December 2018 (continued)
164
Name of Company
Country of
Incorporation
Effective Equity Interest
Principal Activities
2018 2017% %
Direct subsidiaries
Advance Synergy Capital Sdn. Bhd. Malaysia 100 100 Investment holding and provision of management services
Advance Synergy Properties Sdn. Bhd. Malaysia 100 100 Investment holding
* Advance Synergy Realty Sdn. Bhd. Malaysia 100 100 Property development
Advance Synergy Timber Sdn. Bhd. Malaysia 100 100 Dormant
Alam Samudera Corporation Sdn. Bhd. Malaysia 100 100 Investment holding
Alangka-Suka Hotels & Resorts Sdn. Bhd. Malaysia 100 100 Investment holding
* Ausborn Sawmill Sdn. Bhd. Malaysia 100 100 Inactive
* Bornion Sawmill Sdn. Bhd. Malaysia 100 100 Inactive
Calmford Incorporated British Virgin Islands
100 100 Investment holding
Diversified Gain Sdn. Bhd. Malaysia 100 100 Investment holding
Excellent Arch Sdn. Bhd. Malaysia 100 100 Investment holding
Excellent Display Sdn. Bhd. Malaysia 100 100 Property investment, management and rental of properties
iSynergy Sdn. Bhd. Malaysia 100 100 Inactive
Nagapura Management CorporationSdn. Bhd.
Malaysia 100 100 Provision of management services
Sadong Development Sdn. Bhd. Malaysia 100 100 Property development
Company No. 1225 – D
75
9. INVESTMENT IN SUBSIDIARIES (Continued) Loans that are part of net investments represent amount owing by subsidiary which is non-trade in nature, unsecured and non-interest bearing. The settlement of the amount is neither planned nor likely to occur in the foreseeable future as it is the intention of the Company to treat these amounts as long-term source of capital to the subsidiary. As the amount is, in substance, a part of the Company’s net investment in the subsidiary, it is stated at cost less accumulated impairment loss, if any. (a) Certain shares of subsidiaries in the Group have been charged to financial institutions for
credit facilities granted to the Group as disclosed in Note 22(e) to the financial statements.
(b) The details of the subsidiaries are as follows:
Country of 2018 2017Name of Company Incorporation % % Principal ActivitiesDirect subsidiariesAdvance Synergy Capital Sdn. Bhd. Malaysia 100 100 Investment holding and provision
of management services
Advance Synergy Properties Sdn. Bhd. Malaysia 100 100 Investment holding
* Advance Synergy Realty Sdn. Bhd. Malaysia 100 100 Property development
Advance Synergy Timber Sdn. Bhd. Malaysia 100 100 Dormant
Alam Samudera Corporation Sdn. Bhd. Malaysia 100 100 Investment holding
Alangka-Suka Hotels & Resorts Malaysia 100 100 Investment holding Sdn. Bhd.
* Ausborn Sawmill Sdn. Bhd. Malaysia 100 100 Inactive
* Bornion Sawmill Sdn. Bhd. Malaysia 100 100 Inactive
Calmford Incorporated British Virgin Islands 100 100 Investment holding
Diversified Gain Sdn. Bhd. Malaysia 100 100 Investment holding
Excellent Arch Sdn. Bhd. Malaysia 100 100 Investment holding
Excellent Display Sdn. Bhd. Malaysia 100 100 Property investment, management and rental of properties
iSynergy Sdn. Bhd. Malaysia 100 100 Inactive
Nagapura Management Corporation Malaysia 100 100 Provision of management services Sdn. Bhd.
Sadong Development Sdn. Bhd. Malaysia 100 100 Property development
Segi Koleksi Sdn. Bhd. Malaysia 70 70 Investment holding
Strategic Research & Consultancy Malaysia 100 100 Investment holding Sdn. Bhd.
Synergy Gold Incorporated British Virgin Islands 100 100 Inactive
Synergy Petroleum Incorporated British Virgin Islands 100 100 Investment holding
Worldwide Matrix Sdn. Bhd. Malaysia 100 100 Investment holding
Effective EquityInterest

ADVANCE SYNERGY BERHAD | annual report 2018 Notes to the Financial Statements31 December 2018 (continued)
165
9. INVESTMENT IN SUBSIDIARIES (Continued)
(b) The details of the subsidiaries are as follows (Continued):
Name of Company
Country of
Incorporation
Effective Equity Interest
Principal Activities
2018 2017% %
Direct subsidiaries (Continued)
Segi Koleksi Sdn. Bhd. Malaysia 70 70 Investment holding
Strategic Research & Consultancy Sdn. Bhd.
Malaysia 100 100 Investment holding
Synergy Gold Incorporated British Virgin Islands
100 100 Inactive
Synergy PetroleumIncorporated
British Virgin Islands
100 100 Investment holding
Worldwide Matrix Sdn. Bhd. Malaysia 100 100 Investment holding
Indirect subsidiaries held through Advance Synergy Capital Sdn. Bhd.
AESBI Power Systems Sdn. Bhd. Malaysia 100 100 Property investment and management services
ASC Credit Sdn. Bhd. Malaysia 100 100 Provision of credit and leasing
ASC Equities Sdn. Bhd. Malaysia 100 100 Investment holding and venture capital business
Paydee Sdn. Bhd.(formerly known as Synergy Cards Sdn. Bhd.)
Malaysia 100 100 Provision of payment card issuing and acquiring services
Quality Bus & Coach (M)Sdn. Bhd.
Malaysia 71 71 Designing, building and fabrication of coaches
Triton-K Sdn. Bhd. Malaysia 100 100 Provision of management services
Indirect subsidiary held through Quality Bus & Coach (M) Sdn. Bhd.
# Quality Bus & Coach Pty. Ltd. Australia 71 71 Designing, building and fabrication of coaches and coach certification and testing
Indirect subsidiary held through Quality Bus & Coach Pty. Ltd.
# Autobus Australia Pty. Ltd. Australia 71 71 Designing, building and fabrication of coaches and coach certification and testing

Notes to the Financial Statements31 December 2018 (continued)
166
9. INVESTMENT IN SUBSIDIARIES (Continued)
(b) The details of the subsidiaries are as follows (Continued):
Name of Company
Country of
Incorporation
Effective Equity Interest
Principal Activities
2018 2017% %
Indirect subsidiaries held through Alangka-Suka Hotels & Resorts Sdn. Bhd.
Alangka-Suka International Limited British Virgin Islands 100 100 Investment holding
Alor Setar Holiday VillaSdn. Bhd.
Malaysia 100 100 Operates Holiday Villa City Centre Alor Setar. Ceased operation since 22 June 2018.
Antara Holiday Villas Sdn. Bhd. Malaysia 100 100 Hotel management services
Asbina Hotel & PropertySdn. Bhd.
Malaysia 100 100 Inactive
Cherating Holiday Villa Berhad Malaysia 100 100 Operates Holiday Villa Beach Resort & Spa Cherating
Grand Hotel Sudan Limited British Virgin Islands 100 100 Inactive
Holiday Villa Assets Sdn. Bhd. Malaysia 100 100 Investment holding
Holiday Villa Travel & Tours Sdn. Bhd. Malaysia 100 100 Hiring of limousines
Holiday Villas International Limited British Virgin Islands 100 100 Hotel management services
Langkawi Holiday Villa Sdn. Bhd. Malaysia 100 100 Operates Holiday Villa Beach Resort & Spa Langkawi
Mayor Hotels Sdn. Bhd. Malaysia 100 100 Owns and operates City Villa Kuala Lumpur
Super Leisure Sdn. Bhd. Malaysia 100 100 Investment holding
Indirect subsidiaries held through Alangka-Suka International Limited
Asbina Shenzhen Limited British Virgin Islands 90 90 Dormant
Holiday Villa Makkah Limited British Virgin Islands 100 100 Inactive# Interwell Management Limited England and Wales 100 100 Dormant
Larkswood Assets Limited British Virgin Islands 100 100 Inactive
* P.T. Diwangkara Holiday Villa Bali Republic of Indonesia 94.81 94.81 Manages Wina Holiday Villa Kuta Bali

ADVANCE SYNERGY BERHAD | annual report 2018 Notes to the Financial Statements31 December 2018 (continued)
167
9. INVESTMENT IN SUBSIDIARIES (Continued)
(b) The details of the subsidiaries are as follows (Continued):
Name of Company
Country of
Incorporation
Effective Equity Interest
Principal Activities
2018 2017% %
Indirect subsidiary held through Asbina Hotel & Property Sdn. Bhd.
Asbina Hotel & Property (Cambodia) Pte. Ltd.
Kingdom of Cambodia 100 100 Inactive
Indirect subsidiary held through Holiday Villa Assets Sdn. Bhd.
* Posthotel Arosa AG Switzerland 65 65 Investment holding
Indirect subsidiary held through Posthotel Arosa AG
# 57-59 Philbeach Gardens Limited
England and Wales 65 - Investment holding
Indirect subsidiary held through Holiday Villas International Limited
Holiday Villa China International Limited
British Virgin Islands 95 95 Hotel management services
Holiday Villa Middle East Limited British Virgin Islands 100 100 Hotel management services
* Holiday Villa (UK) Ltd. England and Wales 100 100 Operates Holiday Villa Hotel & Suites London
Indirect subsidiary held through Holiday Villa China International Limited
* Changshu Holiday Villa Hotel Management Co. Ltd.
People’s Republic of China
95 95 Hotel management services
* Holiday Villa Hong Kong Company Limited
Hong Kong 95 - Hotel management services
Indirect subsidiary held through Changshu Holiday Villa Hotel Management Co. Ltd.
* Shanghai Holiday Villa Co. Ltd. People’s Republic of China
- 95 Hotel management services
Indirect subsidiary held through Holiday Villa Hong Kong Company Limited
* Shanghai Holiday Villa Co. Ltd. People’s Republic of China
95 - Hotel management services

Notes to the Financial Statements31 December 2018 (continued)
168
9. INVESTMENT IN SUBSIDIARIES (Continued)
(b) The details of the subsidiaries are as follows (Continued):
Name of Company
Country of
Incorporation
Effective Equity Interest
Principal Activities
2018 2017% %
Indirect subsidiaries held through Advance Synergy Properties Sdn. Bhd.
Synergy Realty Incorporated British Virgin Islands
100 100 Investment holding
Indirect subsidiary held through Segi Koleksi Sdn. Bhd.
Metroprime CorporationSdn. Bhd.
Malaysia 70 70 Managing and operating The Language House
Indirect subsidiary held through Synergy Realty Incorporated
* Builderworks Pty. Ltd. Australia 100 100 Inactive
Indirect subsidiaries held through Calmford Incorporated
Advansa Sdn. Bhd. Malaysia 100 100 Inactive
* Home Cinema Studio Pty. Ltd. Australia 100 100 Inactive
Indirect subsidiary held through Alam Samudera Corporation Sdn. Bhd.
Synergy Tours (Borneo) Sdn. Bhd. Malaysia 100 100 Tour operator
Indirect subsidiary held through Diversified Gain Sdn. Bhd.
Orient Escape Travel Sdn. Bhd. Malaysia 100 100 Travel and tour agent and the provision of travel related services
Indirect subsidiaries held through Orient Escape Travel Sdn. Bhd.
Motorsports Adventure Sdn. Bhd. Malaysia 100 100 Inactive
Qurex Sdn. Bhd.(formerly known as OET Money Service Sdn. Bhd.
Malaysia 100 100 Money services business
Orient Escape Travel (Penang) Sdn. Bhd. Malaysia 100 100 Inactive
Synergy Tours Sdn. Bhd. Malaysia 100 100 Tour operator
Indirect subsidiary held through Excellent Arch Sdn. Bhd.
Advance Synergy Furniture Sdn. Bhd. Malaysia 100 100 In liquidation

ADVANCE SYNERGY BERHAD | annual report 2018 Notes to the Financial Statements31 December 2018 (continued)
169
9. INVESTMENT IN SUBSIDIARIES (Continued)
(b) The details of the subsidiaries are as follows (Continued):
Name of Company
Country of
Incorporation
Effective Equity Interest
Principal Activities
2018 2017% %
Indirect subsidiary held through Excellent Display Sdn. Bhd.
Dama TCM Sdn. Bhd. Malaysia 100 100 Provision of traditional Chinese medicine consultation, products and services. Ceased operation since 1 January 2018.
Indirect subsidiaries held through iSynergy Sdn. Bhd.
Cosmocourt.com (Malaysia) Sdn. Bhd.
Malaysia 100 100 Inactive
Datakey Sdn. Bhd. Malaysia 100 100 Dormant
Rewardstreet.com (Malaysia) Sdn. Bhd.
Malaysia 100 100 Inactive
Indirect subsidiaries held through Nagapura Management Corporation Sdn. Bhd.
Acrylic Synergy Sdn. Bhd. Malaysia 81 81 Inactive
Syarikat Fit and Weld Engineering (M) Sdn. Bhd.
Malaysia 70 70 In liquidation
Xgo Technik Sdn. Bhd. Malaysia 100 100 Provision of management services
Indirect subsidiary held through Sadong Development Sdn. Bhd.
Hotel Golden Dragon Sdn. Bhd.
Malaysia 95 95 Inactive
Indirect subsidiary held through Hotel Golden Dragon Sdn. Bhd.
Simpang Tiga RealtySdn. Bhd.
Malaysia 95 95 Inactive
Indirect subsidiary held through Worldwide Matrix Sdn. Bhd
* Captii Limited Singapore 58.30 58.30 Investment holding and the provision of management services

Notes to the Financial Statements31 December 2018 (continued)
170
9. INVESTMENT IN SUBSIDIARIES (Continued)
(b) The details of the subsidiaries are as follows (Continued):
Name of Company
Country of
Incorporation
Effective Equity Interest
Principal Activities
2018 2017% %
Indirect subsidiaries held through Captii Limited
* Captii Ventures Pte. Ltd. Singapore 58.30 58.30 Undertake investment in technology companies
* Postpay Asia Sdn. Bhd. Malaysia 58.30 - Investment holding
* Postpay Sdn. Bhd.(formerly known as Mobilization Sdn. Bhd.)
Malaysia 58.30 58.30 Provision of telecomunnications products, technology and customised solutions to telecommunication operators, service providers and enterprises
* Unified Assets Sdn. Bhd. Malaysia 58.30 58.30 Investment holding
* Unified Communications (OHQ) Sdn. Bhd.
Malaysia 58.30 58.30 Provisions of management and operational headquarters ("OHQ") services to its related companies.
* Unified Communications (OSS) Sdn. Bhd.
Malaysia 58.30 58.30 Investment holding
* Unified Communications Pte. Ltd.
Singapore 58.30 58.30 Distribution of telecommunications products, the design and development of telecommunications solutions, project management, and maintenance and support services for the telecommunications industry
* Unified Communications Sdn. Bhd.
Malaysia 58.30 58.30 Research and development, software engineering, system integration, project management, and maintenance and support services for the telecommunications industry
Indirect subsidiary held through Unified Communications (OSS) Sdn. Bhd.
* GlobeOSS Sdn. Bhd. Malaysia 29.73 29.73 Provision of global roaming quality of service management solutions
Indirect subsidiary held through GlobeOSS Sdn. Bhd.
* GlobeOSS Pte. Ltd. Singapore 29.73 29.73 Provision of global roaming quality of service management solutions

ADVANCE SYNERGY BERHAD | annual report 2018 Notes to the Financial Statements31 December 2018 (continued)
171
9. INVESTMENT IN SUBSIDIARIES (Continued)
(b) The details of the subsidiaries are as follows (Continued):
Name of Company
Country of
Incorporation
Effective Equity Interest
Principal Activities
2018 2017% %
Indirect subsidiary held through GlobeOSS Pte. Ltd.
* GlobeOSS (Brunei) Sdn. Bhd. Brunei Darussalam
29.73 29.73 Provision of global roaming quality of services management solutions
Indirect subsidiaries held through Unified Communications Pte. Ltd.
* Adzentrum Sdn. Bhd. Malaysia 58.30 58.30 Dormant
* Postpay Technology Sdn. Bhd. (formerly known as Unified Communications (VAS) Sdn. Bhd.)
Malaysia 58.30 58.30 Provision of telecommunications products, technology and customised solutions to telecommunications operators, service providers and enterprises
* Unified Communications (Private) Limited
Pakistan 58.30 58.30 Provision of telecommunications products, technology and customised solutions to telecommunications operators, service providers and enterprises
Indirect subsidiaries held through Unified Communications Sdn. Bhd.
* Ahead Mobile Sdn. Bhd. Malaysia 58.30 58.30 Software engineering, system integration, project management, and maintenance and support services for the telecommunications industry
* Unified Communications(Tech) Pte. Ltd.
Singapore 58.30 58.30 Distribution of information technology and telecommunications products
* Companies audited by another firm of auditors other than Baker Tilly Monteiro Heng PLT.
# Companies not required to be audited in their countries of incorporation. The financial statements have been reviewed for consolidation purposes.

Notes to the Financial Statements31 December 2018 (continued)
172 Company No. 1225 – D
82
9. INVESTMENT IN SUBSIDIARIES (Continued)
(c) The Group’s subsidiaries that have material non-controlling interest (“NCI”) are as follows:
Captii Limited
Posthotel Arosa AG
Quality Bus & Coach (M)
Sdn. Bhd.
Other individually immaterial
subsidiaries TotalRM'000 RM'000 RM'000 RM'000 RM'000
NCI percentange of ownership interest and voting interest 41.7% 35% 29%Carrying amount of NCI 54,578 16,663 (6,306) (230) 64,705
Profit/(Loss) allocated to NCI 6,044 (379) (1,521) (389) 3,755
Summary financial information before intra-group eliminationAs at 31 DecemberNon-current assets 84,102 19,055 1,301 Current assets 85,316 40,080 12,547 Non-current liabilities (161) - - Current liabilities (38,374) (11,526) (45,333) Net assets/(liabilities) 130,883 47,609 (31,485)
Year ended 31 DecemberRevenue 94,232 - 1,937 Profit/(Loss) for the financial year 10,128 (1,083) (5,244) Total comprehensive income/(loss) 10,170 (1,083) (5,244)
Cash flows from/(used in) operating 5,018 (6,867) (1,775) activitiesCash flows used in investing activities (5,344) - (487) Cash flows from financing activities 2,814 - 1,261 Net increase/(decrease) in cash and cash equivalents 2,488 (6,867) (1,001)
Dividends paid to NCI 791 - -
2018

ADVANCE SYNERGY BERHAD | annual report 2018 Notes to the Financial Statements31 December 2018 (continued)
173 Company No. 1225 – D
83
9. INVESTMENT IN SUBSIDIARIES (Continued)
(c) The Group’s subsidiaries that have material NCI are as follows (Continued):
Captii Limited
Posthotel Arosa AG
Quality Bus & Coach (M)
Sdn. Bhd.
Other individually immaterial
subsidiaries TotalRM'000 RM'000 RM'000 RM'000 RM'000
NCI percentange of ownership interest and voting interest 41.7% 35% 29%Carrying amount of NCI 50,798 17,042 (4,785) 158 63,213
Profit/(Loss) allocated to NCI 5,059 144 (817) 28 4,414
Summary financial information before intra-group eliminationAs at 31 DecemberNon-current assets 79,481 18,778 748 Current assets 83,587 41,276 19,570 Non-current liabilities (923) (1,075) - Current liabilities (40,326) (10,288) (45,896) Net assets/(liabilities) 121,819 48,691 (25,578)
Year ended 31 DecemberRevenue 77,448 - 5,391 Profit/(Loss) for the financial year 7,184 10,994 (2,816) Total comprehensive income/(loss) 9,950 10,994 (2,816)
Cash flows from/(used in) operating 8,201 (610) 18 activitiesCash flows (used in)/from investing activities (11,913) 52,822 38 Cash flows (used in)/from financing activities (7,521) (16,942) 2,795 Net (decrease)/increase in cash and cash equivalents (11,233) 35,270 2,851
Dividends paid to NCI 2,538 - -
2017

Notes to the Financial Statements31 December 2018 (continued)
174 Company No. 1225 – D
84
10. INVESTMENT IN ASSOCIATES
2018 2017RM'000 RM'000
Unquoted shares, at cost 27,111 34,066 Unquoted shares, at fair value 6,218 4,228 Fair value change 1,813 2,597
35,142 40,891 Share of post-acquisition reserve, net of dividends received 8,972 6,394
44,114 47,285 Foreign exchange adjustments (333) (543)
43,781 46,742
Group
The summarised financial information of the associates is as follows:
2018 2017RM'000 RM'000
ResultsRevenue 8,817 5,183 Profit/(Loss) for the financial year 5,019 (1,444)
Assets and LiabilitiesTotal assets 178,527 204,811 Total liabilities 57,767 73,875
Group
The transactions involving associates during the financial year are as follows: On 13 December 2018, the proposed disposal by Alangka-Suka Hotels & Resorts Sdn. Bhd. (“ASHR”), a wholly-owned subsidiary of the Company, of its entire 6,811,628 ordinary shares representing 40% equity interest in Holiday Villa Kuala Lumpur Sdn. Bhd. (“HVKL”) to Ri-Yaz Assets (Kuala Lumpur) Sdn. Bhd. (formerly known as Aurora Arena Sdn. Bhd.) for a cash consideration of RM11,200,000 pursuant to a share sale agreement entered into on 1 November 2017 was completed. Consequential thereto, HVKL ceased to be a 40%-owned associated company of ASHR. The details of the associates are as follows:
Country of 2018 2017Name of Company Incorporation % % Principal ActivitiesIndirect associate held through Advance Synergy Capital Sdn. Bhd.
* SIBB Berhad Malaysia 20 20 Investment dealings
Indirect associate held through Synergy Realty Incorporated
* Helenium Holdings Limited British Virgin Islands 40 40 Property investment, managementand rental of property
Effective EquityInterest

ADVANCE SYNERGY BERHAD | annual report 2018 Notes to the Financial Statements31 December 2018 (continued)
175
10. INVESTMENT IN ASSOCIATES (Continued)
The details of the associates are as follows:
Name of Company
Country of
Incorporation
Effective Equity Interest
Principal Activities
2018 2017% %
Indirect associate held through Advance Synergy Capital Sdn. Bhd.
* SIBB Berhad Malaysia 20 20 Investment dealings
Indirect associate held through Synergy Realty Incorporated
* Helenium Holdings Limited British Virgin Islands
40 40 Property investment, management and rental of property
Indirect associates held through Alangka-Suka Hotels & Resorts Sdn. Bhd.
Holiday Villa Hotels & ResortsSdn. Bhd.
Malaysia 40 40 Dormant
Holiday Villa Kuala LumpurSdn. Bhd.
Malaysia - 40 Investment holding. Disposal completed on 13 December 2018.
Indirect associate held through Langkawi Holiday Villa Sdn. Bhd.
M OOD Perfumes Sdn. Bhd. Malaysia 30 30 Inactive
Indirect associate held through Super Leisure Sdn. Bhd.
Smile Integrated SolutionSdn. Bhd.
Malaysia 49 49 Provide total solution for hotelindustry which concentrate inmaintenance of software
Indirect associates held through Synergy Tours Sdn. Bhd.
* P.T. Panorama Synergy Indonesia
Republic of Indonesia
49 49 Inactive
* Synergy Holidays Company Limited
Republic of The Union of
Myanmar
50 50 Tour operator
Indirect associate held through Dama TCM Sdn. Bhd.
Medical Palace Sdn. Bhd. Malaysia 50 50 Dormant
Indirect associate held through Strategic Research & Consultancy Sdn. Bhd.
* Kopistop Sdn. Bhd. Malaysia 40 40 Food and beverage cafe, restaurant and consultancy
Indirect associate held through Captii Ventures Pte. Ltd.
* OOPA Pte. Ltd. Vietnam 27.06 23.21 Provision of mobile credits top-up services with loyalty rewards
* Companies audited by another firm of auditors other than Baker Tilly Monteiro Heng PLT.
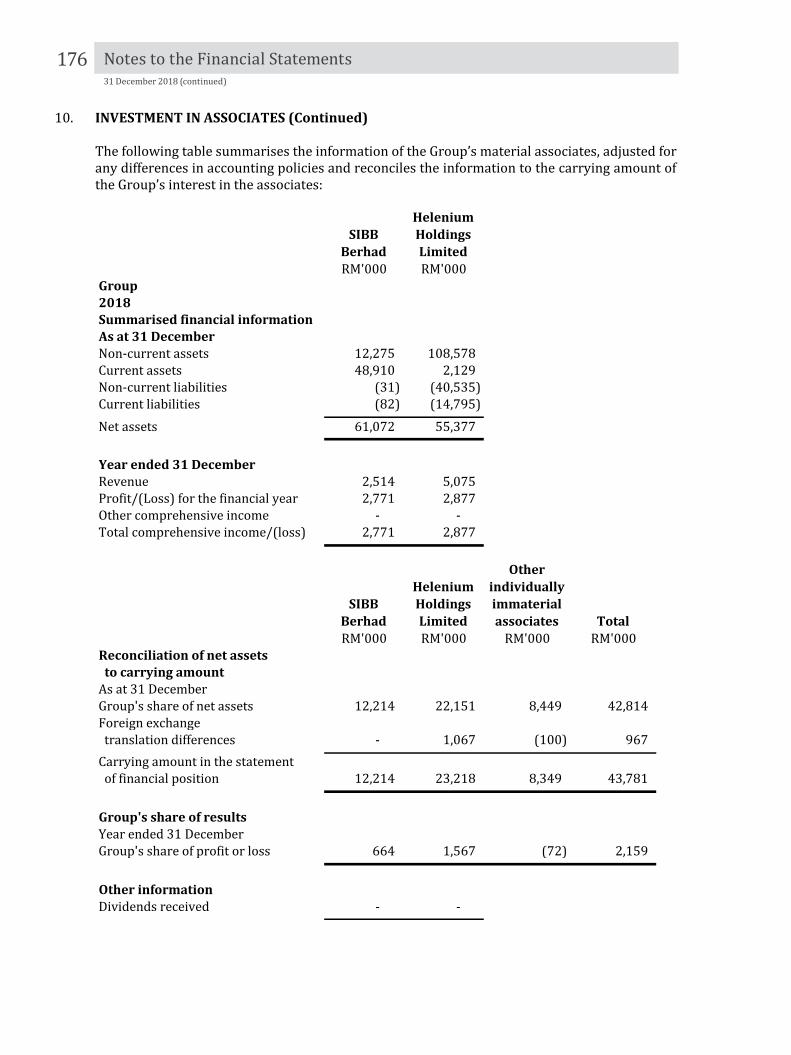
Notes to the Financial Statements31 December 2018 (continued)
176 Company No. 1225 – D
86
10. INVESTMENT IN ASSOCIATES (Continued)
The following table summarises the information of the Group’s material associates, adjusted for any differences in accounting policies and reconciles the information to the carrying amount of the Group’s interest in the associates:
SIBB Berhad
Helenium Holdings Limited
RM'000 RM'000Group2018Summarised financial informationAs at 31 DecemberNon-current assets 12,275 108,578 Current assets 48,910 2,129 Non-current liabilities (31) (40,535) Current liabilities (82) (14,795) Net assets 61,072 55,377
Year ended 31 DecemberRevenue 2,514 5,075 Profit/(Loss) for the financial year 2,771 2,877 Other comprehensive income - - Total comprehensive income/(loss) 2,771 2,877
SIBB Berhad
Helenium Holdings Limited
Other individually immaterial associates Total
RM'000 RM'000 RM'000 RM'000Reconciliation of net assets to carrying amountAs at 31 DecemberGroup's share of net assets 12,214 22,151 8,449 42,814 Foreign exchange translation differences - 1,067 (100) 967 Carrying amount in the statement of financial position 12,214 23,218 8,349 43,781
Group's share of resultsYear ended 31 DecemberGroup's share of profit or loss 664 1,567 (72) 2,159
Other informationDividends received - -
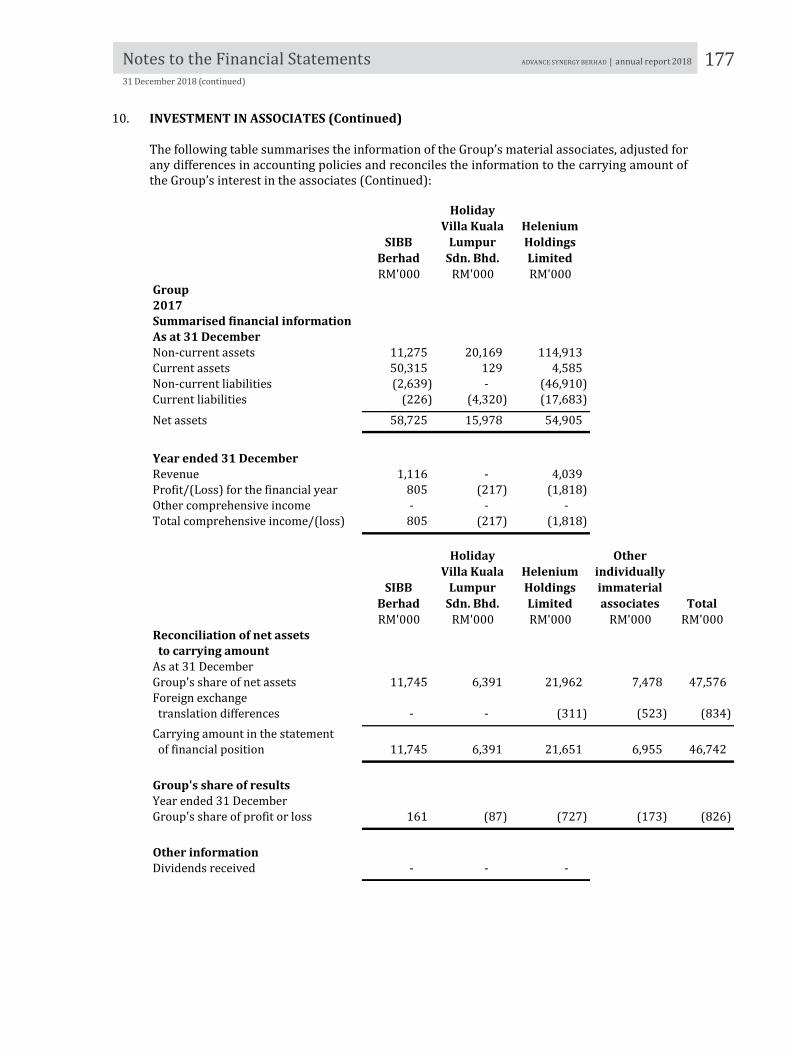
ADVANCE SYNERGY BERHAD | annual report 2018 Notes to the Financial Statements31 December 2018 (continued)
177 Company No. 1225 – D
87
10. INVESTMENT IN ASSOCIATES (Continued)
The following table summarises the information of the Group’s material associates, adjusted for any differences in accounting policies and reconciles the information to the carrying amount of the Group’s interest in the associates (Continued):
SIBB Berhad
Holiday Villa Kuala
Lumpur Sdn. Bhd.
Helenium Holdings Limited
RM'000 RM'000 RM'000Group2017Summarised financial informationAs at 31 DecemberNon-current assets 11,275 20,169 114,913 Current assets 50,315 129 4,585 Non-current liabilities (2,639) - (46,910) Current liabilities (226) (4,320) (17,683) Net assets 58,725 15,978 54,905
Year ended 31 DecemberRevenue 1,116 - 4,039 Profit/(Loss) for the financial year 805 (217) (1,818) Other comprehensive income - - - Total comprehensive income/(loss) 805 (217) (1,818)
SIBB Berhad
Holiday Villa Kuala
Lumpur Sdn. Bhd.
Helenium Holdings Limited
Other individually immaterial associates Total
RM'000 RM'000 RM'000 RM'000 RM'000Reconciliation of net assets to carrying amountAs at 31 DecemberGroup's share of net assets 11,745 6,391 21,962 7,478 47,576 Foreign exchange translation differences - - (311) (523) (834) Carrying amount in the statement of financial position 11,745 6,391 21,651 6,955 46,742
Group's share of resultsYear ended 31 DecemberGroup's share of profit or loss 161 (87) (727) (173) (826)
Other informationDividends received - - -

Notes to the Financial Statements31 December 2018 (continued)
178
The details of the joint venture are as follows:
Name of Company
Country of
Incorporation
Effective Equity Interest
Principal Activities
2018 2017% %
Indirect joint venture held through Unified Communications Pte. Ltd.
* Unified Telecom Private Limited India 29.15 29.15 Provision of telecomunnications products, services and customised solutions.
* Companies audited by another firm of auditors other than Baker Tilly Monteiro Heng PLT.
Company No. 1225 – D
88
11. INVESTMENT IN JOINT VENTURE
2018 2017RM'000 RM'000
At cost:At 1 January - - Share of post-acquisition reserve, net of dividends received - - Foreign exchange translation differences - - At 31 December - -
Group
The details of the joint venture are as follows:
Country of 2018 2017
Name of Company Incorporation % % Principal ActivitiesIndirect joint venture held through Unified Communications Pte. Ltd.
* Unified Telecom Private Limited India 29.15 29.15 Provision of telecommunications products, services andcustomised solutions
* Companies audited by another firm of auditors other than Baker Tilly Monteiro Heng PLT.
InterestEffective Equity
The statutory reporting year end of the joint venture is 31 March. The unaudited management financial statements for the period from 1 January 2018 to 31 December 2018 of the joint venture have been used for equity accounting since it is not significant to the Group. The financial statement of the joint venture is not material to the Group.
12. INVESTMENT SECURITIES
2018 2017RM'000 RM'000
Non-Current:Fair value through other comprehensive income financial assets:Designated as at fair value through other comprehensive incomeQuoted securitiesIn Malaysia- Equity instruments, at fair value 6,515 - Unquoted securitiesIn Malaysia- Equity instruments, at fair value 5 -
Outside Malaysia- Equity instruments, at fair value 2,867 -
2,872 -
Group

ADVANCE SYNERGY BERHAD | annual report 2018 Notes to the Financial Statements31 December 2018 (continued)
179 Company No. 1225 – D
89
12. INVESTMENT SECURITIES (Continued)
2018 2017RM'000 RM'000
Non-Current (Continued):Fair value through profit or loss financial assets:Designated as at fair value through profit or lossUnquoted securitiesIn Malaysia- Convertible preference shares, at fair value 1,351 860 - Convertible loan notes, at fair value 276 279 - Unit trust, at fair value 600 -
Outside Malaysia- Convertible preference shares, at fair value 24,424 17,757 - Convertible loan notes, at fair value 10,985 9,983
37,636 28,879 Available-for-sale financial assets Quoted securitiesIn Malaysia- Equity instruments, at fair value - 9,650 Unquoted securitiesIn Malaysia- Equity instruments, at fair value - 5
Outside Malaysia- Equity instruments, at fair value - 4,031
- 4,036 Total non-current investment securities 47,023 42,565
Current: Financial assets at fair value through profit or loss:Held for trading investmentsQuoted securitiesIn Malaysia- Equity instruments, at fair value 410 459 Total current investment securities 410 459
Total investment securities 47,433 43,024
Group

Notes to the Financial Statements31 December 2018 (continued)
180 Company No. 1225 – D
90
13. DEFERRED TAX (ASSETS)/LIABILITIES
(a) Deferred tax assets and liabilities are offset when there is a legally enforceable right to set off current tax assets against current tax liabilities and when the deferred taxes relate to the same tax authority. The amounts of deferred tax assets and liabilities, after appropriate offsetting, are as follows:
2018 2017 2018 2017Note RM'000 RM'000 RM'000 RM'000
At 1 January 2,171 4,076 (9) (139) Recognised in profit or loss 29 (1,979) (1,902) 9 126 Recognised directly in equity:- ICULS 21 - 4 - 4 Foreign exchange translation adjustment (12) (7) - - At 31 December 180 2,171 - (9)
Presented after appropriate offsetting:Deferred tax assets, net (4,341) (3,191) - (9) Deferred tax liabilities, net 4,521 5,362 - -
180 2,171 - (9)
CompanyGroup
The deferred tax assets of the Company are in relation to the ICULS. (b) The component and movements of deferred tax assets and liabilities during the financial
year prior to offsetting are as follows:
Deferred tax liabilities of the GroupProperty,Plant and
Equipment Others TotalRM'000 RM'000 RM'000
At 1 January 2018 4,455 907 5,362 Recognised in profit or loss (771) (70) (841) At 31 December 2018 3,684 837 4,521
At 1 January 2017 5,084 842 5,926 Recognised in profit or loss (629) 65 (564) At 31 December 2017 4,455 907 5,362

ADVANCE SYNERGY BERHAD | annual report 2018 Notes to the Financial Statements31 December 2018 (continued)
181 Company No. 1225 – D
91
13. DEFERRED TAX (ASSETS)/LIABILITIES (Continued)
(b) The component and movements of deferred tax assets and liabilities during the financial year prior to offsetting are as follows (Continued): Deferred tax assets of the Group
Unutilised tax losses and
unabsorbed capital
allowances Others TotalRM'000 RM'000 RM'000
At 1 January 2018 3,638 (447) 3,191 Recognised in profit or loss 1,159 - 1,159 Recognised in equity - (9) (9) At 31 December 2018 4,797 (456) 4,341
At 1 January 2017 2,168 (318) 1,850 Recognised in profit or loss 1,470 (125) 1,345 Recognised in equity - (4) (4) At 31 December 2017 3,638 (447) 3,191
(c) The amount of temporary differences for which no deferred tax assets have been
recognised are as follows:
2018 2017RM'000 RM'000
Deductible temporary differences 12,152 11,306 Unutilised tax losses 214,392 212,054 Unabsorbed capital allowances 25,197 25,067 251,741 248,427
Group
Pursuant to Section 11 of the Act 812, special provision relating to Section 43 and 44 of Income Tax Act 1967, a time limit has been imposed on the unutilised business losses, to be carried forward for a maximum of 7 consecutive years of assessment, this section has effect from the year of assessment 2019 and subsequent year of assessment.
Any unutilised business losses brought forward from year of assessment 2018 can be carried forward for another 7 years consecutive years of assessment (i.e. from year of assessments 2019 to 2025).

Notes to the Financial Statements31 December 2018 (continued)
182 Company No. 1225 – D
92
14. INVENTORIES
2018 2017RM'000 RM'000
At cost/net realisable value: Raw materials 43 43 Work-in-progress 2,008 1,342 Finished goods 1,482 140 Food and beverages 639 196 Operating supplies 5,426 7,416 Completed properties and properties under development 35,625 30,949
45,223 40,086
Group
Completed properties and properties under development consist of the following:
2018 2017RM'000 RM'000
Current assetsLeasehold land 10,970 10,970 Development costs 13,166 8,554
24,136 19,524 Completed properties 11,489 11,425
35,625 30,949
Group
Certain leasehold land held under development with carrying amount of RM5.19 million (2017: RM5.15 million) have been charged to financial institutions for credit facilities granted to a subsidiary as disclosed in Note 22 to the financial statements. The cost of inventories of the Group recognised as an expense in cost of sales during the financial year was RM6.58 million (2017: RM8.16 million).

ADVANCE SYNERGY BERHAD | annual report 2018 Notes to the Financial Statements31 December 2018 (continued)
183 Company No. 1225 – D
93
15. TRADE AND OTHER RECEIVABLES
2018 2017 2018 2017Note RM'000 RM'000 RM'000 RM'000
Current: Trade Trade receivables (a) 76,972 89,807 - - Amount owing from customers for contract work (b) - 9,169 - - Accrued billings - 5,887 - - 76,972 104,863 - -
Less : Expected credit losses Trade receivables (a) (2,211) (1,419) - -
74,761 103,444 - -
Non-Trade Other receivables (a) 33,032 26,320 139 130 Deposits 8,593 7,202 5 12 Amounts owing from associates (c) 4,534 3,673 - - Amounts owing from subsidiaries (d) - - - 141,417 46,159 37,195 144 141,559
Less : Expected credit losses Other receivables (a) (1,861) (1,514) - -
(1,861) (1,514) - - 44,298 35,681 144 141,559
Total current receivables 119,059 139,125 144 141,559
Total trade and other receivables 119,059 139,125 144 141,559
Add: Cash and bank balances and short term deposits 18 141,240 158,047 6,808 4,093 Total loan and receivables 260,299 297,172 6,952 145,652
Group Company
(a) Trade and other receivables
Trade receivables are non-interest bearing and normal credit terms offered by the Group range from 30 to 90 days (2017: 30 to 90 days). Other credit terms are assessed and approved on a case by case basis.
The ageing analysis of the Group’s trade receivables is as follows:
2018 2017RM'000 RM'000
Neither past due nor impaired 54,817 60,304 Past due 0 to 3 months 9,240 14,013 Past due 3 to 9 months 8,840 12,387 Past due over 9 months 1,864 1,684
19,944 28,084 Credit impaired 2,211 1,419
76,972 89,807
Group

Notes to the Financial Statements31 December 2018 (continued)
184 Company No. 1225 – D
94
15. TRADE AND OTHER RECEIVABLES (Continued)
(a) Trade and other receivables (Continued)
Receivables that are neither past due nor impaired Trade and other receivables that are neither past due nor impaired are creditworthy debtors with good payment records with the Group.
Receivables that are past due but not impaired Included in the Group’s trade and other receivable balances are receivables with carrying values of RM19.9 million (2017: RM28.1 million) which are past due but not impaired at the end of the financial year. The Group has not made any allowances for impairment for these receivables since there has not been a significant change in the credit quality of these receivables and the amounts owing are still considered as recoverable. In determining the recoverability of a trade receivable, the Group considers any change in the credit quality of the trade receivables from the date the credit was initially granted up to the reporting date. The Group has policies in place to ensure that credit is extended only to customers with acceptable credit history and/or payment track records. Allowances for impairment are made on specific trade receivables when there is objective evidence that the Group will not be able to collect all amounts due. Included in current year provisions are mainly specific allowances for impairment. Trade receivables that are past due but not impaired are unsecured in nature.
Receivables that are impaired The Group and the Company apply the simplified approach to trade receivables and general approach to other receivables measuring expected credit losses.
The movement of the expected credit losses of the trade and other receivables is as follows:
2018 2017 2018 2017RM'000 RM'000 RM'000 RM'000
At 1 January 1,419 1,479 1,514 877 Charge for expected credit losses 863 19 347 637 Written off (71) (78) - - Exchange differences - (1) - - At 31 December 2,211 1,419 1,861 1,514
GroupTrade receivables Other receivables

ADVANCE SYNERGY BERHAD | annual report 2018 Notes to the Financial Statements31 December 2018 (continued)
185 Company No. 1225 – D
95
15. TRADE AND OTHER RECEIVABLES (Continued)
(b) Amount owing from/(to) customers for contract work
2018 2017RM'000 RM'000
Aggregate costs incurred to date and attributable profits recognised to date - 19,550 Less: Progress billings - (12,439)
- 7,111
Analysed as follows: Amount owing to customers for contract work - (2,058) Amount owing from customers for contract work - 9,169
- 7,111
Group
The contract work relates to proprietary solution contracts undertaken by the Group for its customers. At the end of the financial year, amounts in trade and other receivables arising from service contracts are due for settlement within 12 months.
(c) Amount owing from associates The amount owing from associates are unsecured, interest-free and are repayable on
demand by cash. (d) Amount owing from subsidiaries
2018 2017RM'000 RM'000
Amount owing from subsidiaries 64,286 205,416 Less : Impairment loss (64,286) (63,999) - 141,417
Company
The amount owing from subsidiaries is unsecured, interest-free and is repayable on demand by cash.
16. CONTRACT ASSETS/(LIABILITIES)
2018 2017RM'000 RM'000
Contract assetsContract assets relating to property development contracts 1,417 - Contract assets relating to information technology contracts 5,904 -
7,321 -
Contract liabilitiesContract liabilities relating to information technology contracts (6,482) - Contract liabilities relating to travel & tour sales (6,643) -
(13,125) -
Group
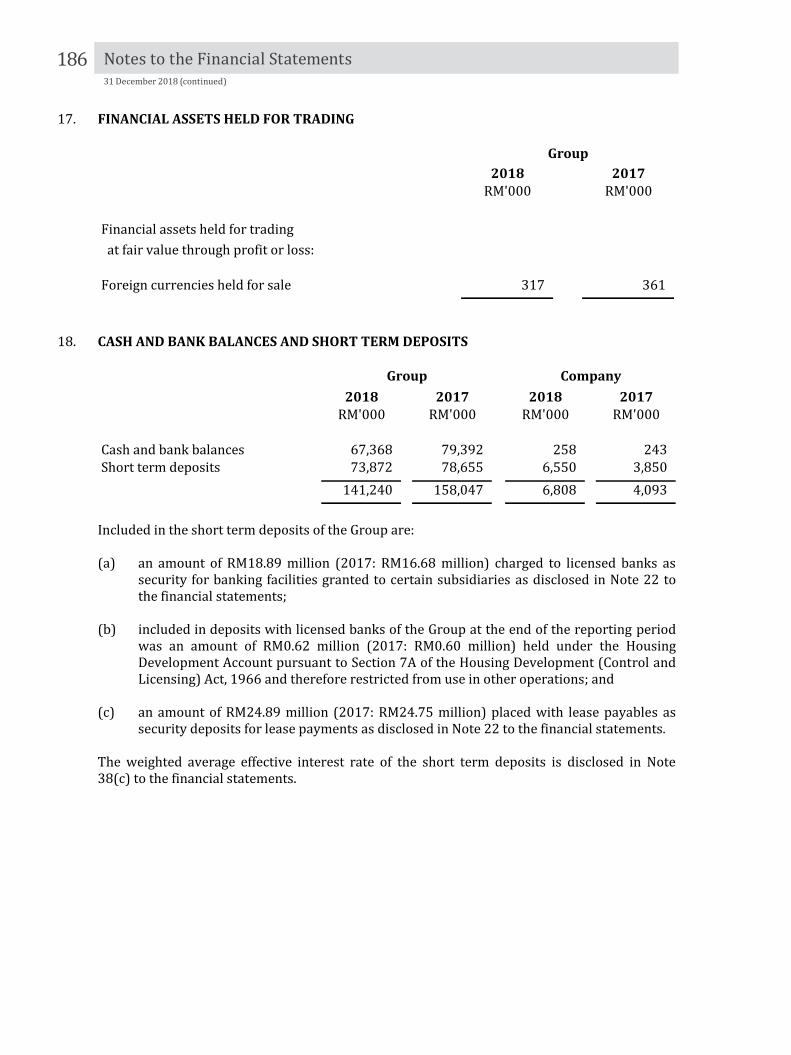
Notes to the Financial Statements31 December 2018 (continued)
186 Company No. 1225 – D
96
17. FINANCIAL ASSETS HELD FOR TRADING
2018 2017RM'000 RM'000
Financial assets held for trading at fair value through profit or loss:
Foreign currencies held for sale 317 361
Group
18. CASH AND BANK BALANCES AND SHORT TERM DEPOSITS
2018 2017 2018 2017RM'000 RM'000 RM'000 RM'000
Cash and bank balances 67,368 79,392 258 243 Short term deposits 73,872 78,655 6,550 3,850
141,240 158,047 6,808 4,093
Group Company
Included in the short term deposits of the Group are: (a) an amount of RM18.89 million (2017: RM16.68 million) charged to licensed banks as
security for banking facilities granted to certain subsidiaries as disclosed in Note 22 to the financial statements;
(b) included in deposits with licensed banks of the Group at the end of the reporting period
was an amount of RM0.62 million (2017: RM0.60 million) held under the Housing Development Account pursuant to Section 7A of the Housing Development (Control and Licensing) Act, 1966 and therefore restricted from use in other operations; and
(c) an amount of RM24.89 million (2017: RM24.75 million) placed with lease payables as
security deposits for lease payments as disclosed in Note 22 to the financial statements. The weighted average effective interest rate of the short term deposits is disclosed in Note 38(c) to the financial statements.

ADVANCE SYNERGY BERHAD | annual report 2018 Notes to the Financial Statements31 December 2018 (continued)
187 Company No. 1225 – D
97
19. SHARE CAPITAL
Number of Number ofShares Shares
'000 RM'000 '000 RM'000
Authorised:Ordinary shares At 1 January - - 3,000,000 900,000 Transition to no par value regime - - (3,000,000) (900,000) At 31 December - - - - Issued and fully paid:Ordinary shares At 1 January 677,776 320,650 664,052 199,216 Transition to no par value regime: - Share premium - - - 117,317 Arising from conversion of ICULS (Note 21) 251,419 60,727 13,724 4,117 At 31 December 929,195 381,377 677,776 320,650
2018 2017
The new Companies Act 2016 (the “Act”), which came into operation on 31 January 2017, abolished the concept of authorised share capital and par value of share capital. Consequently, the amount standing to the credit of the share premium account of RM117,317,000 becomes part of the Company’s share capital pursuant to the transitional provisions set out in Section 618(2) of the Act. Notwithstanding this provision, the Company may within 24 months from the commencement of the Act, use the amount standing to the credit of its share premium account of RM117,317,000 for the purposes as set out in Section 618(3) of the Act. There is no impact on the number of ordinary shares in issue or the relative entitlement of any of the members as a result of this transition. The holders of ordinary shares are entitled to receive dividends as declared from time to time and are entitled to one (1) vote per share at meetings of the Company. All ordinary shares rank equally with regard to the Company’s residual assets.

Notes to the Financial Statements31 December 2018 (continued)
188 Company No. 1225 – D
98
20. RESERVES
2018 2017 2018 2017Note RM'000 RM'000 RM'000 RM'000
Non-distributableFair value reserve (a) (1,254) 1,881 - - Capital reserve - - 69 69 Foreign exchange translation reserve (b) 6,871 7,189 - - Revaluation reserve (c) 18,467 23,510 - -
24,084 32,580 69 69 Distributable Retained earnings 16,725 18,902 12,763 11,755
40,809 51,482 12,832 11,824
Group Company
(a) Fair Value Reserve The fair value reserve represents the fair value reserve relating to the fair valuation of
financial assets categorised as fair value through other comprehensive income and share of fair value reserve of associates.
(b) Foreign Exchange Translation Reserve The foreign exchange translation reserve is used to record foreign currency exchange
differences arising from the translation of the financial statements of foreign operations whose functional currencies are different from that of the Group’s presentation currency. It is also used to record the exchange differences arising from monetary items which form part of the Group’s net investment in foreign operations, where the monetary item is denominated in either the functional currency of the reporting entity or the foreign operation and share of foreign exchange translation reserve of associates.
(c) Revaluation Reserve The revaluation reserve represents the surplus on the revaluation of certain hotel
properties of the Group and share of revaluation reserve of associates.
ADVANCE SYNERGY BERHAD | annual report 2018 Notes to the Financial Statements31 December 2018 (continued)
189 Company No. 1225 – D
99
21. ICULS
On 29 January 2008, the Company issued 1,182,277,666 ICULS. The ICULS are constituted by a Trust Deed dated 10 December 2007 as varied in the First Supplemental Trust Deed dated 4 August 2008, the Second Supplemental Trust Deed dated 20 July 2012 and the Third Supplemental Trust Deed dated 26 September 2013 (“Trust Deed”). The ICULS at the nominal amount of RM0.15 each issued by the Company have a tenure of ten (10) years from the date of issue and are not redeemable in cash. Unless converted, all outstanding ICULS will be mandatorily converted by the Company into new ordinary shares of the Company (“ASB Shares”) at the conversion price applicable on the maturity date (i.e. 26 January 2018). The ICULS may be converted into new ASB Shares by: (a) surrendering the ICULS with an aggregate nominal value equivalent to RM0.30 for every
one (1) new ASB Share (subject to adjustments in accordance with the provisions of the Trust Deed) (“Conversion Price”); or
(b) surrendering one (1) ICULS together with the necessary cash payment constituting the difference between the Conversion Price and the nominal value of the ICULS surrendered, for one (1) new ASB Share. For avoidance of doubt, for every one (1) ICULS surrendered together with the required cash payment, the holder will only be entitled to subscribe for one (1) new ASB Share.
The new ASB Shares to be issued upon conversion of the ICULS will, upon allotment and issuance, rank pari passu in all respects with the then existing issued ASB Shares save that they will not be entitled for any dividends, rights, allotments and/or other distributions, the entitlement date of which is before the date of allotment of the new ASB Shares pursuant to the conversion of the ICULS. The interest on the ICULS at the rate of 2% per annum on the nominal value of the outstanding ICULS is payable annually in arrears, on the last day of each of the ten (10) successive periods of twelve (12) months calculated from the issue date with the last interest payment date falling on the maturity date of the ICULS. The ICULS matured on 26 January 2018 and all outstanding ICULS were compulsorily and automatically converted into fully paid new ordinary shares of the Company. Following the conversion of all outstanding 502,151,541 ICULS, a total of 251,075,761 new ordinary shares in the Company were allotted on 30 January 2018.

Notes to the Financial Statements31 December 2018 (continued)
190 Company No. 1225 – D
100
21. ICULS (Continued)
The ICULS is recognised in the statements of financial position of the Group and of the Company as follows:
Equity LiabilityNote Component Component Total
2018 RM'000 RM'000 RM'000Nominal value
At 1 January 2018 60,724 16,102 76,826 Converted to ordinary shares during the financial year 19 (60,724) (1) (60,725) At 31 December 2018 - 16,101 16,101
Expense recognised in profit or lossAt 1 January 2018 - 8,171 8,171 Recognised during the financial year - ICULS interest - 4 4 At 31 December 2018 - 8,175 8,175
Interest paid/accrued:At 1 January 2018 - (24,165) (24,165) Paid/accrued during the financial year - (111) (111) At 31 December 2018 - (24,276) (24,276) \\
At 31 December 2018 - - -
Equity LiabilityNote Component Component Total
2017 RM'000 RM'000 RM'000Nominal value
At 1 January 2017 64,803 16,144 80,947 Deferred tax assets 13 - (4) (4) Converted to ordinary shares during the financial year 19 (4,079) (38) (4,117)
At 31 December 2017 60,724 16,102 76,826
Expense recognised in profit or lossAt 1 January 2017 - 8,100 8,100 Recognised during the financial year - ICULS interest - 71 71 At 31 December 2017 - 8,171 8,171
Interest paid/accrued:At 1 January 2017 - (22,651) (22,651) Paid/accrued during the financial year - (1,514) (1,514) At 31 December 2017 - (24,165) (24,165) \\
At 31 December 2017 60,724 108 60,832
Group and Company
Group and Company
Interest expense on the ICULS is calculated based on the effective yield by applying the effective interest rate of 7% (2017: 7%) for an equivalent non-convertible loan stock to the liability component of the ICULS.
Company No. 1225 – D
100
21. ICULS (Continued)
The ICULS is recognised in the statements of financial position of the Group and of the Company as follows:
Equity LiabilityNote Component Component Total
2018 RM'000 RM'000 RM'000Nominal value
At 1 January 2018 60,724 16,102 76,826 Converted to ordinary shares during the financial year 19 (60,724) (1) (60,725) At 31 December 2018 - 16,101 16,101
Expense recognised in profit or lossAt 1 January 2018 - 8,171 8,171 Recognised during the financial year - ICULS interest - 4 4 At 31 December 2018 - 8,175 8,175
Interest paid/accrued:At 1 January 2018 - (24,165) (24,165) Paid/accrued during the financial year - (111) (111) At 31 December 2018 - (24,276) (24,276) \\
At 31 December 2018 - - -
Equity LiabilityNote Component Component Total
2017 RM'000 RM'000 RM'000Nominal value
At 1 January 2017 64,803 16,144 80,947 Deferred tax assets 13 - (4) (4) Converted to ordinary shares during the financial year 19 (4,079) (38) (4,117)
At 31 December 2017 60,724 16,102 76,826
Expense recognised in profit or lossAt 1 January 2017 - 8,100 8,100 Recognised during the financial year - ICULS interest - 71 71 At 31 December 2017 - 8,171 8,171
Interest paid/accrued:At 1 January 2017 - (22,651) (22,651) Paid/accrued during the financial year - (1,514) (1,514) At 31 December 2017 - (24,165) (24,165) \\
At 31 December 2017 60,724 108 60,832
Group and Company
Group and Company
Interest expense on the ICULS is calculated based on the effective yield by applying the effective interest rate of 7% (2017: 7%) for an equivalent non-convertible loan stock to the liability component of the ICULS.

ADVANCE SYNERGY BERHAD | annual report 2018 Notes to the Financial Statements31 December 2018 (continued)
191 Company No. 1225 – D
101
22. BORROWINGS
2018 2017Note RM'000 RM'000
Current liabilitiesBank overdrafts (a) 2,404 1,728 Revolving credit (b) 41,000 35,000 Finance lease payable (c) 23,017 - Hire purchase payables (d) 63 59 Term loans (e) 3,513 2,252 Banker acceptance 900 - Debtor financing 5,228 - 76,125 39,039 Non-current liabilitiesFinance lease payable (c) - 23,017 Hire purchase payables (d) 71 134 Term loans (e) 67,715 37,612
67,786 60,763 143,911 99,802
Total liabilitiesBank overdrafts (a) 2,404 1,728 Revolving credit (b) 41,000 35,000 Finance lease payable (c) 23,017 23,017 Hire purchase payables (d) 134 193 Term loans (e) 71,228 39,864 Banker acceptance 900 - Debtor financing 5,228 -
143,911 99,802
Group
(a) Bank Overdrafts
2018 2017RM'000 RM'000
Bank overdrafts:- secured 2,404 1,728
Group
The bank overdrafts are secured by way of:
(i) a pledge of short term deposits; (ii) fixed and floating charges over the assets of certain subsidiaries as disclosed in
Note 14 and 18 to the financial statements; (iii) a guarantee and an indemnity from the Company and its subsidiaries.
The weighted average effective interest rate of the revolving credit is disclosed in Note 38(c) to the financial statements.
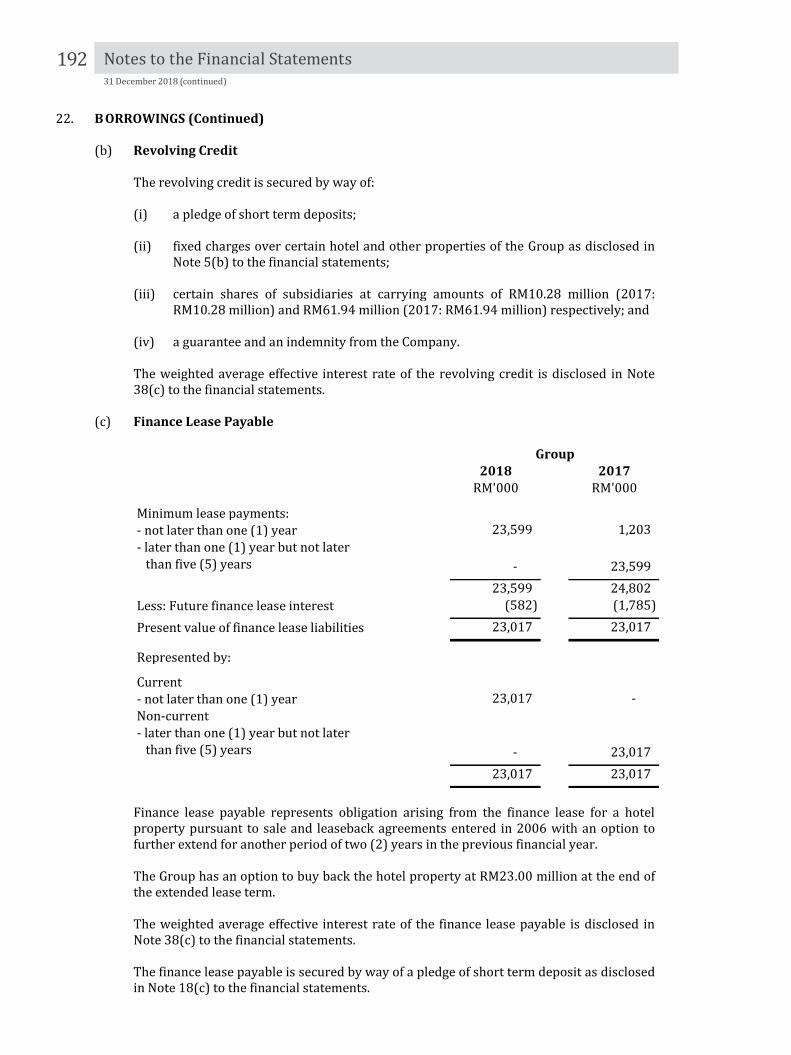
Notes to the Financial Statements31 December 2018 (continued)
192 Company No. 1225 – D
102
22. B ORROWINGS (Continued) (b) Revolving Credit
The revolving credit is secured by way of:
(i) a pledge of short term deposits; (ii) fixed charges over certain hotel and other properties of the Group as disclosed in
Note 5(b) to the financial statements; (iii) certain shares of subsidiaries at carrying amounts of RM10.28 million (2017:
RM10.28 million) and RM61.94 million (2017: RM61.94 million) respectively; and (iv) a guarantee and an indemnity from the Company. The weighted average effective interest rate of the revolving credit is disclosed in Note 38(c) to the financial statements.
(c) Finance Lease Payable
2018 2017RM'000 RM'000
Minimum lease payments:- not later than one (1) year 23,599 1,203
- 23,599 23,599 24,802
Less: Future finance lease interest (582) (1,785) Present value of finance lease liabilities 23,017 23,017
Represented by:Current - not later than one (1) year 23,017 - Non-current
- 23,017 23,017 23,017
than five (5) years
than five (5) years
Group
- later than one (1) year but not later
- later than one (1) year but not later
Finance lease payable represents obligation arising from the finance lease for a hotel property pursuant to sale and leaseback agreements entered in 2006 with an option to further extend for another period of two (2) years in the previous financial year. The Group has an option to buy back the hotel property at RM23.00 million at the end of the extended lease term. The weighted average effective interest rate of the finance lease payable is disclosed in Note 38(c) to the financial statements. The finance lease payable is secured by way of a pledge of short term deposit as disclosed in Note 18(c) to the financial statements.

ADVANCE SYNERGY BERHAD | annual report 2018 Notes to the Financial Statements31 December 2018 (continued)
193 Company No. 1225 – D
103
22. B ORROWINGS (Continued)
(d) Hire Purchase Payables
2018 2017RM'000 RM'000
Minimum hire purchase payments:- not later than one (1) year 68 68
74 142 142 210
Less: Future hire purchase interest (8) (17) Present value of hire purchase liabilities 134 193
Represented by:Current - not later than one (1) year 63 59 Non-current
71 134 134 193
than five (5) years
than five (5) years
Group
- later than one (1) year but not later
- later than one (1) year but not later
The weighted average effective interest rate of the hire purchase payable is disclosed in Note 38(c) to the financial statements.
(e) Term Loans
2018 2017RM'000 RM'000
Term loans-secured 71,228 39,864
Represented by:Current - not later than one (1) year 3,513 2,252 Non-current- later than one (1) year but not later five (5) years 16,357 8,874 - later than five (5) years 51,358 28,738
67,715 37,612 71,228 39,864
Group

Notes to the Financial Statements31 December 2018 (continued)
194 Company No. 1225 – D
104
22. BORROWINGS (Continued)
(e) Term Loans (Continued)
The term loans are secured by way of:
(i) fixed charges over certain hotel and other properties of the Group as disclosed in Note 5(b) to the financial statements;
(ii) the entire issued and paid up share capital of certain subsidiaries; (iii) certain shares of subsidiaries at carrying amounts of RM10.28 million (2017:
RM10.28 million) and RM61.94 million (2017: RM61.94 million) respectively; (iv) fixed and floating charges over the assets of certain subsidiaries as disclosed in
Notes 14 and 18(a) to the financial statements; and (v) a corporate guarantee by the Company and its subsidiaries.
The weighted average effective interest rate of the term loans is disclosed in Note 38(c) to the financial statements.
23. PROVISION FOR RETIREMENT BENEFIT OBLIGATIONS
The Group operates unfunded defined retirement benefit plans for some of its employees. The total amount recognised in the statements of financial position are as follows:
2018 2017RM'000 RM'000
Present value of unfunded defined benefits obligations 1,666 1,747
Group
The following table shows a reconciliation from the opening balance to the closing balancefor the retirement benefit plan:
2018 2017RM'000 RM'000
At 1 January 1,747 1,609 Include in the profit or loss: - Current service cost 332 108 - Interest cost - 98
332 206 Others:Paid during the financial year (413) (68)
At 31 December 1,666 1,747
Group
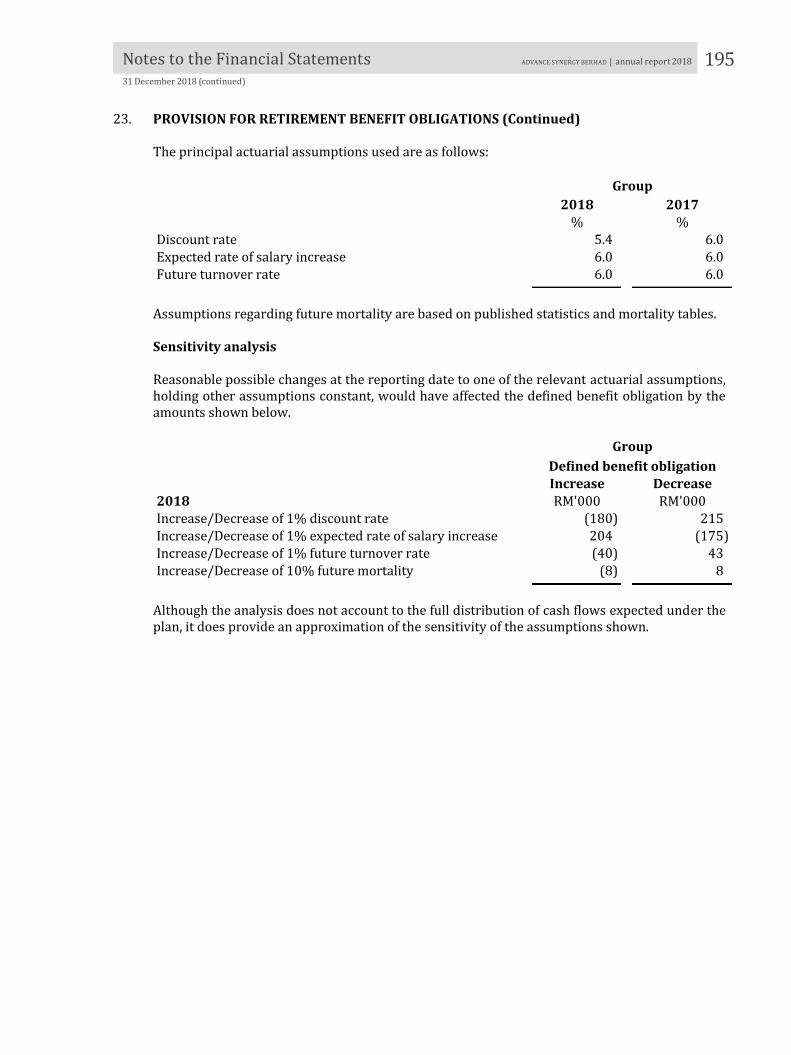
ADVANCE SYNERGY BERHAD | annual report 2018 Notes to the Financial Statements31 December 2018 (continued)
195 Company No. 1225 – D
105
23. PROVISION FOR RETIREMENT BENEFIT OBLIGATIONS (Continued)
The principal actuarial assumptions used are as follows:
2018 2017% %
Discount rate 5.4 6.0 Expected rate of salary increase 6.0 6.0 Future turnover rate 6.0 6.0
Group
Assumptions regarding future mortality are based on published statistics and mortality tables. Sensitivity analysis Reasonable possible changes at the reporting date to one of the relevant actuarial assumptions, holding other assumptions constant, would have affected the defined benefit obligation by the amounts shown below.
Increase Decrease2018 RM'000 RM'000Increase/Decrease of 1% discount rate (180) 215 Increase/Decrease of 1% expected rate of salary increase 204 (175) Increase/Decrease of 1% future turnover rate (40) 43 Increase/Decrease of 10% future mortality (8) 8
GroupDefined benefit obligation
Although the analysis does not account to the full distribution of cash flows expected under the plan, it does provide an approximation of the sensitivity of the assumptions shown.

Notes to the Financial Statements31 December 2018 (continued)
196 Company No. 1225 – D
106
24. TRADE AND OTHER PAYABLES
2018 2017 2018 2017Note RM'000 RM'000 RM'000 RM'000
Current:Trade Amount owing to customers for contract work 15(b) - 2,058 - - Trade payables (a) 19,757 38,444 - - Deferred revenue - 4,417 - -
19,757 44,919 - -
Current: Non-Trade Accruals 16,107 13,412 530 537 Accrued interest - 1,396 - 1,396 Amount owing to associates (b) 23 22 - - Amount owing to subsidiaries (c) - - 231,710 226,710 Deposits received 1,975 2,001 - - Other payables 37,048 35,087 - -
55,153 51,918 232,240 228,643
Total current payables 74,910 96,837 232,240 228,643
Total trade and other payables 74,910 96,837 232,240 228,643
Less: Deferred revenue - 4,417 - -
Add: Borrowings (Note 22) 143,911 99,802 - - Total financial liabilities carried at amortised cost 218,821 192,222 232,240 228,643
Group Company
(a) Trade payables Trade payables are non-interest bearing and the normal credit terms granted to the
Group range from 30 to 90 days (2017: 30 to 90 days). (b) Amount owing to associates The amount owing to associates is unsecured, interest-free and is repayable on demand
by cash. (c) Amount owing to subsidiaries The amount owing to subsidiaries is unsecured, interest-free and is repayable on demand
by cash.

ADVANCE SYNERGY BERHAD | annual report 2018 Notes to the Financial Statements31 December 2018 (continued)
197 Company No. 1225 – D
107
25. REVENUE
2018 2017 2018 2017RM'000 RM'000 RM'000 RM'000
Sales of goods 8,138 8,588 - - Education services 1,100 2,440 Hotels and resorts services 45,973 51,722 - - Coach building 1,937 5,391 - - Information, communications technology and related service 94,232 77,448 - - Ticketing 71,888 67,925 Travel and tours 50,856 43,681 - - Card and payment services 7,674 6,629 - - Interest and financing income 29 24 29 24 Property development 38 1,145 - - Rental income 914 930 - - Gross dividend income 804 - 11,982 9,621
283,583 265,923 12,011 9,645
Group Company
26. COST OF SALES
2018 2017 2018 2017RM'000 RM'000 RM'000 RM'000
Sales of goods 8,465 9,740 - - Hotels and resorts services 11,486 12,839 - - Coach building 2,450 2,982 - - Information, communications technology and related service 58,329 42,037 - - Ticketing, travel and tours 113,720 103,362 - - Card and payment services 5,226 4,615 - - Property development 28 516 - -
199,704 176,091 - -
Group Company

Notes to the Financial Statements31 December 2018 (continued)
198 Company No. 1225 – D
108
27. OPERATING PROFIT Operating profit has been arrived at:
2018 2017 2018 2017RM'000 RM'000 RM'000 RM'000
After charging:Amortisation of intangible assets 1,497 1,825 - - Auditors' remuneration- statutory: - holding company 100 100 100 100 - subsidiaries 847 836 - - - under/(over) accrual in prior years 2 32 (6) 3 - non-statutory: - holding company 9 15 9 15 Write down of inventories 14 12 - - Bad debts written off 186 151 - - Depreciation 5,631 6,411 8 8 Directors' remuneration: - fees 328 598 306 315 - other emoluments 2,817 2,315 1,791 1,104 Impairment loss on:- development expenditure 37 - - - - goodwill 1,497 540 - - Fair value change in:- held for trading investments 49 2 - - - fair value through profit or loss investment securities - 658 - - - foreign currency held for trading 2 8 - - - investment property 1,060 - - - - investment in associates 927 744 - - Loss on disposal of property, plant and equipment - 16 - - Lease rental 10,201 11,206 - - Net loss on foreign exchange:- unrealised 426 1,828 - - Property, plant and equipment written off 1,035 96 - - Provision for retirement benefits plan 332 206 - - Rental expenses:- equipment 196 221 - - - premises 1,629 1,149 170 170 - others 211 299 - - Staff cost:- salaries and wages 39,532 41,276 3,204 2,536 - defined contribution plan 5,257 5,323 453 370 - other employee benefits 4,297 4,141 39 22
Group Company

ADVANCE SYNERGY BERHAD | annual report 2018 Notes to the Financial Statements31 December 2018 (continued)
199 Company No. 1225 – D
109
27. OPERATING PROFIT (Continued)
Operating profit has been arrived at (Continued):
2018 2017 2018 2017RM'000 RM'000 RM'000 RM'000
And crediting:Insurance claim compensation - 12,161 - - Gain on disposal of:- property, plant and equipment 23 - - - - an associate 5,239 - - - - fair value through profit or loss investment securities 231 - - - Fair value change in fair value through profit or loss investment securities 5,852 - - - Net gain on foreign exchange:- realised 13 208 - - Gross dividend income from: - Malaysia: - quoted securities 804 - - - - unquoted securities - 5 - - Interest income:- Short term deposits 2,198 2,783 29 24 - Loan and receivables 222 232 - - Rental income 1,122 1,410 - - Write back of payables - 198 - -
Group Company
28. FINANCE COSTS
2018 2017 2018 2017RM'000 RM'000 RM'000 RM'000
Interest expenses- bank overdrafts 86 42 - - - finance lease 1,203 1,211 - - - hire purchases 9 12 - - - ICULS 4 71 4 71 - term loans 4,778 3,908 2,849 2,269 - others 85 1 - -
6,165 5,245 2,853 2,340
Group Company

Notes to the Financial Statements31 December 2018 (continued)
200 Company No. 1225 – D
110
29. INCOME TAX EXPENSE
2018 2017 2018 2017RM'000 RM'000 RM'000 RM'000
Income taxCurrent year- In Malaysia 4,834 5,859 6 7 - Outside Malaysia 308 44 - - Prior years (1,674) 608 - (5) Deferred tax (Note 13)Current year (1,969) (2,286) - - Prior years (10) 384 9 126
1,489 4,609 15 128
CompanyGroup
The income tax is calculated at the statutory rate of 24% (2017: 24%) of the estimated assessable profit for the year. Two indirect subsidiaries of the Company, GlobeOSS Sdn. Bhd. and Postpay Technology Sdn. Bhd. (formerly known as Unified Communications (VAS) Sdn. Bhd.), have been granted pioneer status as Multimedia Super Corridor (“MSC”) companies under the Malaysia Promotion of Investment Act, 1986. The benefits to a company having MSC status include a five (5) year pioneer status tax exemption on profits generated from the MSC qualifying activities during the same period. The MSC status of GlobeOSS Sdn. Bhd. after being extended once, expired on 14 January 2017. The MSC status of Postpay Technology Sdn. Bhd. (formerly known as Unified Communications (VAS) Sdn. Bhd.) commenced from 21 December 2015 and will expire on 20 December 2020. In addition, another subsidiary of the Company, Unified Communications (OHQ) Sdn. Bhd. received the Malaysian Industrial Development Authority’s approval in October 2009 of its Operational Headquarters (“OHQ”) status to provide certain approved OHQ services to the Group entities. The OHQ status is granted for ten (10) years with certain tax incentives.
A reconciliation of income tax expense applicable to profit before tax at the statutory income tax rate to income tax expense at the effective income tax rate of the Group and of the Company are as follows:
2018 2017 2018 2017% % % %
Applicable tax rate 24 24 24 24 Tax effects arising from- Non allowable expenses 1,767 59 62 53 - Non taxable income (685) (71) (86) (77) - Utilisation of previously unrecognised tax losses and capital allowances (956) (15) - - - Deferred tax assets not recognised in the year 1,295 43 - - - Different tax rate in foreign jurisdiction 249 5 - - - Crystalisation of deferred tax liabilities (16) - - - - Share of tax of associates included in share of profit of associates (149) 2 - - - Utilisation of group relief (456) (4) - -
1,073 43 - - - (over)/under accrual in prior years (644) 12 - 4 Average effective tax rate 429 55 - 4
Group Company

ADVANCE SYNERGY BERHAD | annual report 2018 Notes to the Financial Statements31 December 2018 (continued)
201 Company No. 1225 – D
111
30. LOSS PER ORDINARY SHARE
(a) Basic loss per ordinary share
2018 2017RM'000 RM'000
owners of the parent (4,897) (663)
2018 2017'000 '000
shares in issue 911,990 672,339 on issue
2018 2017Sen Sen
Basic loss per share (0.54) (0.10)
Weighted average number of ordinary
Group
Consolidated loss attributable to
(b) Diluted loss per ordinary share
Diluted loss per share of the Group is calculated by dividing the loss for the financial year attributable to owners of the parent by the adjusted weighted average number of ordinary shares in issue during the financial year. The adjusted weighted average number of ordinary shares in issue is arrived at assuming full conversion of the ICULS which represents the dilutive potential of the ordinary shares.
2018 2017RM'000 RM'000
owners of the parent (4,897) (663) Interest expenses on ICULS (net of tax) - 197 Loss after mandatory conversion of ICULS (4,897) (466)
2018 2017 '000 '000
in issue 911,990 672,339 Adjustment for ordinary shares deemed converted from ICULS - 256,856 Weighted average number of ordinary shares in issue after deemed conversion of ICULS 911,990 929,195
Weighted average number of ordinary shares
Consolidated loss attributable to
Group

Notes to the Financial Statements31 December 2018 (continued)
202 Company No. 1225 – D
112
30. LOSS PER ORDINARY SHARE (Continued)
(b) Diluted loss per ordinary share (Continued)
2018 2017Sen Sen
Diluted loss per share (0.54) (0.10)
Group
The diluted loss per share for previous financial year is equivalent to the basic loss per share as the effect arising from deemed conversion of ICULS is anti-dilutive.
31. DIVIDENDS
Dividends recognised by the Company are as follows:
Sen per share
Total Amount RM'000 Date of payment
2018Final 2017 ordinary share (single tier) 0.250 2,323 15 August 2018
2017Final 2016 ordinary share (single tier) 0.250 1,693 18 August 2017
32. CONTINGENT LIABILITIES
2012 2018 2017RM'000 RM'000 RM'000
Unsecured:Litigation 6,376 6,362
Group
On 19 November 2013, Unified Telecom Private Limited (“UTPL”), a joint venture entity in India of Unified Communications Pte. Ltd. (“UCPL”), a wholly-owned subsidiary of Captii Limited (“Captii”), which in turn an indirect 58.3%-owned subsidiary of the Company, filed a petition to the High Court of Delhi, New Delhi under Section 9 of India Arbitration and Conciliation Act, 1996 (“Act”) to obtain interim relief on the protection of assets currently under the custody of a former customer, a mobile telecoms network operator and service provider in India (“Telco”), and to deny the penalty claims by the Telco against UTPL.

ADVANCE SYNERGY BERHAD | annual report 2018 Notes to the Financial Statements31 December 2018 (continued)
203 Company No. 1225 – D
113
32. CONTINGENT LIABILITIES (Continued)
The Telco had via a letter issued in July 2013 alleged that UTPL is liable for a sum of INR 10.7 crore (approximately SGD2.1 million or RM6.3 million) for damages and expenditure incurred in connection with the said contract during its currency. Legal advice has been sought from reputable law firms in both India and Singapore with good credentials in handling contract litigation and dispute resolution, to review and advice on the merit of this claim by the Telco on UTPL. Based on the legal opinions obtained from the law firms concerned, management of Captii is of the view that UTPL has full rights and title to the assets and should be entitled to demand their return, and that the Telco’s claim against UTPL has no legal merit. Accordingly, external legal counsels in Singapore and India have been appointed to advise and represent UCPL and UTPL to pursue legal recourse. As announced by Captii on 16 January 2015, the hearing on the petition filed by UTPL which was originally scheduled to be heard on 23 April 2014, having been adjourned on several occasions, was dismissed by the High Court, as the Telco had initiated the arbitration proceedings before a tribunal. The High Court was of the view that the matter should be resolved through arbitration proceedings since the tribunal had already been constituted. During the reporting year 2015, UTPL commenced an application pursuant to Section 17 of the Indian Arbitration and Conciliation Act 1996 for, amongst others, the return of the Hardware. However, the learned Arbitrator dismissed the application, but directed Telco to ensure the safety of and protect the Hardware from any damage during the period the Hardware is lying in Telco’s premises. A number of procedural hearings have been held by the Arbitrator to cross examine the affidavits of the admissions and denial documents relating to the aforesaid claim and counterclaims throughout the years. The next hearing has tentatively been set on 18 April 2019. In the opinion of management of Captii, no material losses are expected to arise pertaining to the aforesaid contingent matter.
33. MATERIAL LITIGATION
The Company had announced that a legal proceeding was instituted against PT Diwangkara Holiday Villa Bali, an indirect subsidiary of the Company, arising from a claim dated 14 April 2015 made by PT Diwangkara Jaya Makmur (“Plaintiff” or “Jaya Makmur”) against PT Diwangkara (“Defendant I” or “PT Diwangkara Holiday Villa Bali”) and CV Telabah Nasional Traiding Company (“Defendant II”) which was read on 28 July 2015 at the Denpasar District Court, Indonesia. Defendant I has a lease agreement for the land and building which happened to be the building of Diwangkara Holiday Villa Beach Resort & Spa Bali (“Hotel”) including its licences and in the agreement, the owner also gives the right to operate and manage the Hotel to Defendant I.

Notes to the Financial Statements31 December 2018 (continued)
204 Company No. 1225 – D
114
33. MATERIAL LITIGATION (Continued)
The Plaintiff's claims principally included among others to invalidate the lease agreement between the Defendant I and Defendant II for Defendant I to lease the Hotel for a period of 22 years, and for Defendant I to pay actual and general losses suffered by the Plaintiff amounting to Rp114,600,000,000 (equivalent of approximately RM36.4 million) and default penalty in the amount of Rp10,000,000 (equivalent of approximately RM3,180) for each day commencing from the pronounce of the judgement and court fees. Mediation proceedings were not successful and the trial continued with Response of the Parties for the claim and Defendant I had responded by filing its counter claims to Denpasar District Court, Indonesia which principally included among others to declare the lease agreement legitimate and binding under the law, order for Plaintiff to pay actual and general losses and compensation for the loss of public trust, image and reputation of the Hotel that have been suffered by Defendant I amounting to Rp24,304,854,643 and USD1,313,860.13 (equivalent of approximately RM13.6 million), default penalty in the amount of Rp10,000,000 (equivalent of approximately RM3,180) for each day commencing from the date the judgement is enforceable and all costs incurred in this case. On 5 May 2016, the Company announced the Denpasar District Court’s judgment on 3 May 2016 which principally states that Jaya Makmur's lawsuit is declined by Denpasar District Court and Jaya Makmur has conducted an unlawful act by taking over the Hotel and office building and the management of the Hotel from PT Diwangkara Holiday Villa Bali prior to the expiry of the lease under Deed No. 38 and No. 39 and therefore Jaya Makmur shall return the operations of the Hotel to PT Diwangkara Holiday Villa Bali, and pay material and immaterial losses of PT Diwangkara Holiday Villa Bali in the amount of Rp5,384,507,763 (equivalent of approximately RM1.7 million) plus costs incurred in this case in the amount of Rp1,706,000 (equivalent of approximately RM530) (“Denpasar District Court's Judgment”). With regards to the Denpasar District Court's Judgement, both parties have submitted an appeal to the High Court of Denpasar, Indonesia, and judgement was given on 3 October 2017 which strengthen Denpasar District Court's Judgment dated 3 May 2016. Therefore Denpasar District Court's Judgement remains valid for both parties. In regards with High Court of Denpasar's judgement, both parties have submitted a cassation appeal to the Supreme Court and it is still under cassation process.
34. COMMITMENTS
The Group has lease commitments under non-cancellable operating leases, which are payable as follows:
2018 2017RM'000 RM'000
Not later than one (1) year 12,298 8,277 Later than one (1) year but not later than five (5) years 34,700 28,741 Later than five (5) years 43,459 52,576
90,457 89,594
Group
The Group leases a number of hotels and office premises under operating leases. The hotel leases typically run for the period of two to eighty years and the office premises leases run for average period of three years.
Acquisition of Beaver Hotels Limited is as disclosed in Note 41 to the financial statements.

ADVANCE SYNERGY BERHAD | annual report 2018 Notes to the Financial Statements31 December 2018 (continued)
205 Company No. 1225 – D
115
35. SIGNIFICANT RELATED PARTY DISCLOSURES
(a) Identification of related parties
Parties are considered to be related to the Company if the Company has the ability, directly or indirectly, to control the party or exercise significant influence over the party in making financial and operating decisions, or vice versa, or where the Company and the party are subject to common control or common significant influence. Related parties may be individuals or other entities.
Related parties also included key management personnel defined as those group of persons having authority and responsibility for planning, directing, and controlling the activities of the Group either directly or indirectly. The key management personnel include all the Directors of the Group, and certain members of senior management of the Group. The Group has related party relationship with its subsidiaries, associates, significant investors, Directors and key management personnel.
(b) Significant related party transactions and balances
Significant related party transactions other than those disclosed elsewhere in the financial statements are as follows:
2018 2017 2018 2017RM'000 RM'000 RM'000 RM'000
Income(i) Dividends receivable from subsidiaries
- Alangka-Suka Hotels & Resorts Sdn. Bhd. - - 7,346 5,076 - Worldwide Matrix Sdn. Bhd. - - 485 1,410 - Diversified Gain Sdn. Bhd. - - 2,700 1,320 - Advance Synergy Realty Sdn. Bhd. - - 1,451 1,815
(ii) Rental receivable from a company ofwhich a director has deemed interest:- SJ Securities Sdn. Bhd. 469 549 - - \
Group Company

Notes to the Financial Statements31 December 2018 (continued)
206 Company No. 1225 – D
116
35. SIGNIFICANT RELATED PARTY DISCLOSURES (Continued)
(b) Significant related party transactions and balances (Continued)
Significant related party transactions other than those disclosed elsewhere in the financial statements are as follows (Continued):
2018 2017 2018 2017RM'000 RM'000 RM'000 RM'000
Expenses(i) Rental payable to a subsidiary
- AESBI Power Systems Sdn. Bhd. - - 170 170
(ii) Purchase of goods and services from a subsidiary- Orient Escape Travel Sdn. Bhd. - - - 119
(iii) Lease rental payable to a company ofwhich a director has deemed interest:- Leeds Property Limited 4,734 4,904 - -
(iv) Directors' emoluments:- fees 328 598 306 315 - salaries and bonuses 2,817 2,315 1,791 1,104 - benefit-in-kind 115 115 108 108
Group Company
(c) Remuneration of key management personnel
The remuneration of Directors and other key management personnel during the financial year are as follows:
2018 2017 2018 2017RM'000 RM'000 RM'000 RM'000
Fees 707 609 306 315 Emoluments and benefits 4,874 4,643 2,124 1,445 Contributions to defined contribution plan 554 552 239 173
6,135 5,804 2,669 1,933
Benefit-in-kind 139 122 115 115
Group Company
The estimated monetary value of other benefits, not included in the above, received by Directors and other key management personnel of the Company and its subsidiaries were RM139,100 (2017: RM122,100) for the Company and RM114,900 (2017: RM114,900) for the Group. Included in the employee benefits of the Group and of the Company are Executive Directors’ remuneration amounting to RM2,817,240 (2017: RM2,315,211) and RM1,791,080 (2017: RM1,104,320) respectively.

ADVANCE SYNERGY BERHAD | annual report 2018 Notes to the Financial Statements31 December 2018 (continued)
207 Company No. 1225 – D
117
36. SEGMENT INFORMATION
The Group prepared the following segment information in accordance with MFRS 8 Operating Segments and on the basis of internal reports on the Group’s strategic business units which are regularly reviewed by the Group Managing Director in order to allocate resources to the segments and to assess their performances. The Group’s operating and reportable segments are business units engaged in providing different products or services and business units operating in different geographical locations. These businesses are managed and assessed separately as each requires a differentiated strategy focused on the specific products and services. The Group Managing Director reviews the internal management reports on a quarterly basis in order to assess their performance. There are varying levels of integration among Investment Holding segment and Travel and Tours segment with the other segments. This integration includes rental of properties, corporate support and provision of travel related service. Inter-segment pricing is determined on a negotiated basis. Segment results Segment performance is used to measure performance as Group Managing Director believes that such information is the most relevant in evaluating the results of certain segments relative to other entities that operate within these industries. Performance is evaluated based on operating profit or loss which is measured differently from operating profit or loss in the consolidated financial statements. Segment assets The total of segment asset is measured based on all assets (including goodwill) of a segment, as included in the internal management reports that are reviewed by the Group Managing Director. Segment total asset is used to measure the return on assets of each segment. Segment liabilities The total segment liability is measured based on all liabilities of a segment, as included in the internal management reports that are reviewed by the Group Managing Director. The Group’s operating segments are as follows: Investment holding : Investment holding and providing full corporate and financial
support to the Group.
Property development : Development of residential and commercial properties.
Hotels and resorts : Operate and manage hotels and resorts and other related services.
Information and
communications technology
: Design and development of telecommunications software applications and systems and the provision of solutions and services for the telecommunications industry.

Notes to the Financial Statements31 December 2018 (continued)
208 Company No. 1225 – D
118
36. SEGMENT INFORMATION (Continued)
The Group’s operating segments are as follows (Continued):
Travel and tours : Travel and tour agent, money services business and provision of travel related services.
Others : Businesses involving design, building and fabrication of coaches
and bus maintenance and related services, trading, payment card issuing and acquiring services and owns and operates language centre.
The following table provides an analysis of the Group’s revenue, results, assets, liabilities and other information by operating segment:
Information
and Invest- Property Hotels commu- Travelment develop- and nications and Elimi-
holding ment resorts technology tours Others nation Notes Total 2018 RM'000 RM'000 RM'000 RM'000 RM'000 RM'000 RM'000 RM'000
RevenueExternal 1,560 38 54,298 94,232 122,744 10,711 - 283,583 Inter-segment 13,622 - - - 302 - (13,924) (a) -
15,182 38 54,298 94,232 123,046 10,711 (13,924) 283,583
ResultsSegment results 4,540 (2,210) 3,354 10,795 2,081 (9,527) (10,845) (b) (1,812) Share of results of associates 2,230 - 4 - (75) - - 2,159 Consolidated profit/ (loss) before tax 6,770 (2,210) 3,358 10,795 2,006 (9,527) (10,845) 347 Income tax expense (15) - 128 (875) (756) 29 - (1,489) Net loss for the financial year (1,142)
Attributable to: Non-controlling interests 3,755 Owners of the parent (4,897)

ADVANCE SYNERGY BERHAD | annual report 2018 Notes to the Financial Statements31 December 2018 (continued)
209 Company No. 1225 – D
119
36. SEGMENT INFORMATION (Continued)
The following table provides an analysis of the Group’s revenue, results, assets, liabilities and other information by operating segment (Continued):
Information
and Invest- Property Hotels commu- Travelment develop- and nications and Elimi-
holding ment resorts technology tours Others nation Notes Total 2018 RM'000 RM'000 RM'000 RM'000 RM'000 RM'000 RM'000 RM'000
Other informationSegment assets 75,261 91,019 234,125 211,282 24,493 35,973 - 672,153 Investment in associates and joint venture 36,459 - 112 6,848 362 - - 43,781 Unallocated corporate assets 9,413 Total assets 725,347
Segment liabilities 32,530 38,532 102,798 37,827 8,501 13,424 - 233,612 Unallocated corporate liabilities 4,844 Total liabilities 238,456
Additions to non-current assets (other thanfinancial instruments and deferred tax assets)- Property, plant and equipment 41 3 6,305 2,116 174 268 - 8,907 - Software development expenditure - - - 1,199 - - - 1,199 - Licenses - - - - - 99 - 99
Income:Interest income 150 161 1,718 293 98 - - 2,420 Gain on disposal of: -an associate - - 5,239 - - - - 5,239 -fair value through profit or loss investments - - - 231 - - - 231 -property, plant and equipment 3 - 20 - - - - 23 Fair value change in: -fair value through profit or loss investments 3,524 - - 3,492 (1,164) - - 5,852
Expense:Amortisation of intangible assets - - - 1,444 - 53 - 1,497 Depreciation 669 25 2,840 1,577 105 415 - 5,631 Finance cost 4,716 - 1,281 82 86 - - 6,165

Notes to the Financial Statements31 December 2018 (continued)
210 Company No. 1225 – D
120
36. SEGMENT INFORMATION (Continued)
The following table provides an analysis of the Group’s revenue, results, assets, liabilities and other information by operating segment (Continued):
Information
and Invest- Property Hotels commu- Travelment develop- and nications and Elimi-
holding ment resorts technology tours Others nation Notes Total 2018 RM'000 RM'000 RM'000 RM'000 RM'000 RM'000 RM'000 RM'000
Other information (Continued)
Expense (Continued):Fair value change in: -held for trading investments - - 49 - - - - 49 -foreign currency held for trading - - - - 2 - - 2 -investment in associates 96 - - 831 - - - 927 -investment property - - - 1,060 - - - 1,060 Impairment loss on: -development expenditure - - - 37 - - - 37 -goodwill - - - 1,497 - - - 1,497 Expected credit loss on receivables - - 863 - - 347 - 1,210 Write down on inventories - - - 14 - - - 14 Bad debts written off - - 76 - 110 - - 186 Property, plant and equipment written off - - 1,035 - - - - 1,035 Lease rental - - 10,201 - - - - 10,201 Staff costs:
- salaries and wages 4,231 656 10,015 16,046 3,716 4,868 - 39,532 - defined contribution plan 619 79 1,371 2,171 490 527 - 5,257 - other employee benefits 206 21 1,158 1,826 754 332 - 4,297

ADVANCE SYNERGY BERHAD | annual report 2018 Notes to the Financial Statements31 December 2018 (continued)
211 Company No. 1225 – D
121
36. SEGMENT INFORMATION (Continued)
The following table provides an analysis of the Group’s revenue, results, assets, liabilities and other information by operating segment (Continued):
Information
and Invest- Property Hotels commu- Travelment develop- and nications and Elimi-
holding ment resorts technology tours Others nation Notes Total 2017 RM'000 RM'000 RM'000 RM'000 RM'000 RM'000 RM'000 RM'000
RevenueExternal 673 1,145 60,461 77,448 111,606 14,590 - 265,923 Inter-segment 11,348 - - - 567 - (11,915) (a) -
12,021 1,145 60,461 77,448 112,173 14,590 (11,915) 265,923
ResultsSegment results 641 134 15,711 8,783 2,088 (8,550) (9,621) (b) 9,186 Share of results of associates (726) - (79) - (21) - - (826) Consolidated profit/ (loss) before tax (85) 134 15,632 8,783 2,067 (8,550) (9,621) 8,360 Income tax expense (128) (47) (2,070) (1,607) (757) - - (4,609) Net profit for the financial year 3,751
Attributable to: Non-controlling interests 4,414 Owners of the parent (663)
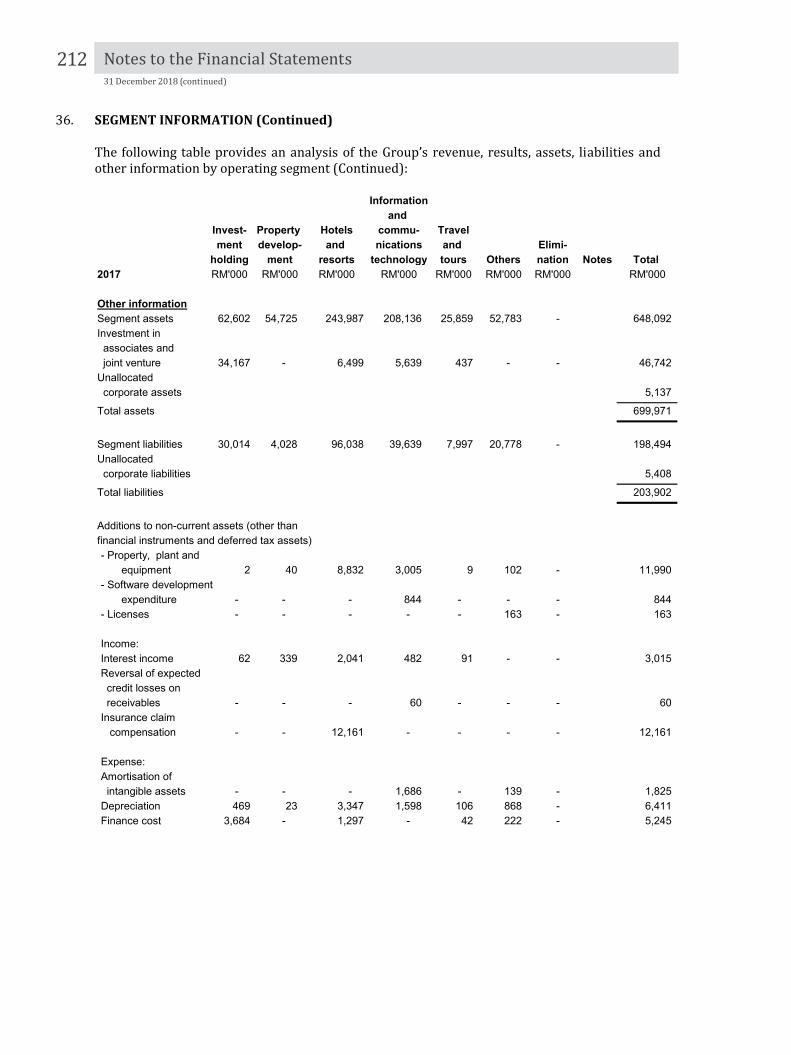
Notes to the Financial Statements31 December 2018 (continued)
212 Company No. 1225 – D
122
36. SEGMENT INFORMATION (Continued)
The following table provides an analysis of the Group’s revenue, results, assets, liabilities and other information by operating segment (Continued):
Information
and Invest- Property Hotels commu- Travelment develop- and nications and Elimi-
holding ment resorts technology tours Others nation Notes Total 2017 RM'000 RM'000 RM'000 RM'000 RM'000 RM'000 RM'000 RM'000
Other informationSegment assets 62,602 54,725 243,987 208,136 25,859 52,783 - 648,092 Investment in associates and joint venture 34,167 - 6,499 5,639 437 - - 46,742 Unallocated corporate assets 5,137
Total assets 699,971
Segment liabilities 30,014 4,028 96,038 39,639 7,997 20,778 - 198,494 Unallocated corporate liabilities 5,408
Total liabilities 203,902
Additions to non-current assets (other thanfinancial instruments and deferred tax assets)- Property, plant and equipment 2 40 8,832 3,005 9 102 - 11,990 - Software development expenditure - - - 844 - - - 844 - Licenses - - - - - 163 - 163
Income:Interest income 62 339 2,041 482 91 - - 3,015 Reversal of expected credit losses on receivables - - - 60 - - - 60 Insurance claim compensation - - 12,161 - - - - 12,161
Expense:Amortisation of intangible assets - - - 1,686 - 139 - 1,825 Depreciation 469 23 3,347 1,598 106 868 - 6,411 Finance cost 3,684 - 1,297 - 42 222 - 5,245
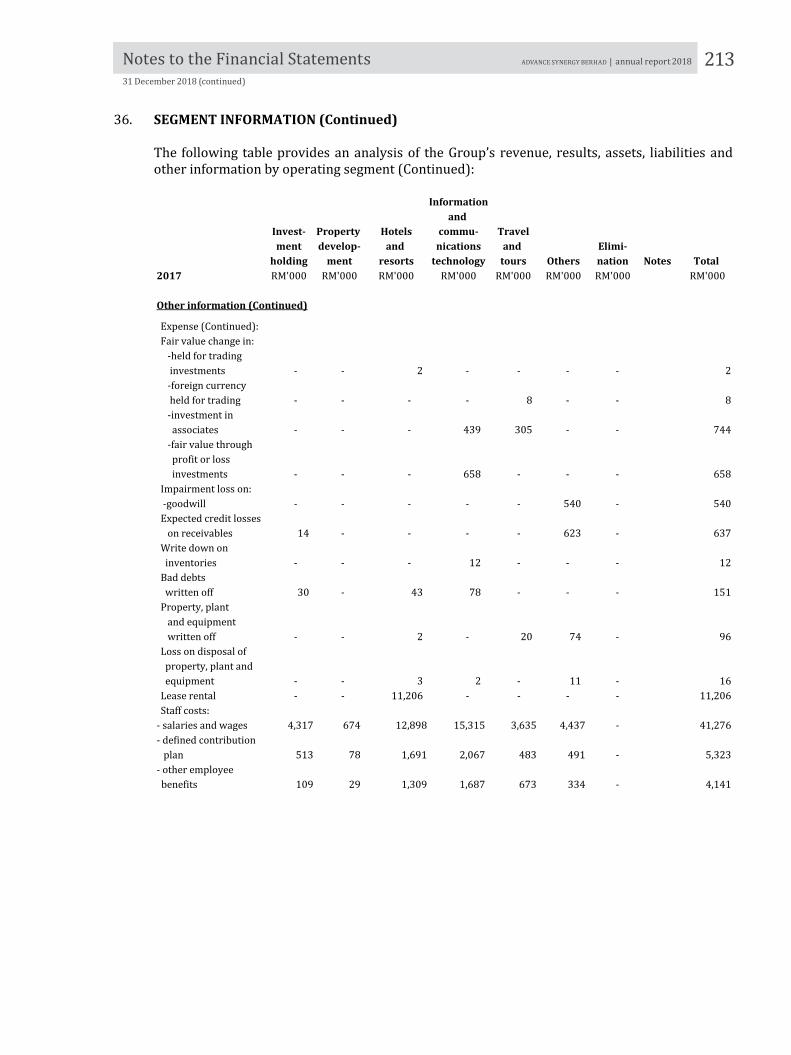
ADVANCE SYNERGY BERHAD | annual report 2018 Notes to the Financial Statements31 December 2018 (continued)
213 Company No. 1225 – D
123
36. SEGMENT INFORMATION (Continued)
The following table provides an analysis of the Group’s revenue, results, assets, liabilities and other information by operating segment (Continued):
Information
and Invest- Property Hotels commu- Travelment develop- and nications and Elimi-
holding ment resorts technology tours Others nation Notes Total 2017 RM'000 RM'000 RM'000 RM'000 RM'000 RM'000 RM'000 RM'000
Other information (Continued)
Expense (Continued):Fair value change in: -held for trading investments - - 2 - - - - 2 -foreign currency held for trading - - - - 8 - - 8 -investment in associates - - - 439 305 - - 744 -fair value through profit or loss investments - - - 658 - - - 658 Impairment loss on: -goodwill - - - - - 540 - 540 Expected credit losses on receivables 14 - - - - 623 - 637 Write down on inventories - - - 12 - - - 12 Bad debts written off 30 - 43 78 - - - 151 Property, plant and equipment written off - - 2 - 20 74 - 96 Loss on disposal of property, plant and equipment - - 3 2 - 11 - 16 Lease rental - - 11,206 - - - - 11,206 Staff costs:
- salaries and wages 4,317 674 12,898 15,315 3,635 4,437 - 41,276 - defined contribution plan 513 78 1,691 2,067 483 491 - 5,323 - other employee benefits 109 29 1,309 1,687 673 334 - 4,141

Notes to the Financial Statements31 December 2018 (continued)
214 Company No. 1225 – D
124
36. SEGMENT INFORMATION (Continued)
Notes Nature of elimination to arrive at amounts reported in the consolidated financial statements:
(a) Inter-segment revenues are eliminated on consolidation; (b) Inter-segment expenses are eliminated on consolidation; and
Geographical Information The Group operates mainly in Malaysia, Singapore, Africa and Middle East, Europe and Australia. In determining the geographical segments of the Group, revenue is based on the geographical locations of customers. Segment assets and capital expenditure are based on the geographical location of the assets. The composition of each geographical segment is as follows: Malaysia : Investment holding and providing full corporate and financial
support to the Group, property development, owner and operator of hotels and resorts, travel and tours related services, payment card issuing and acquiring services, design and development of telecommunications software applications and systems and the provision of solutions and services for the telecommunications industry, design, building and fabrication of coaches, and bus maintenance and related services and owns and operates language centre.
Singapore : Design and development of telecommunications software applications and systems and the provision of solutions and services for the telecommunications industry, provision of management and investment holdings.
Africa and Middle East : Operate and manage hotels and resorts, design and
development of telecommunications software applications and systems and the provision of solutions and services for the telecommunications industry.
Europe : Operate and manage hotels and resorts.
Others : Operate and manage hotels and resorts, design and development of telecommunications software applications and systems and the provision of solutions and services for the telecommunications industry.
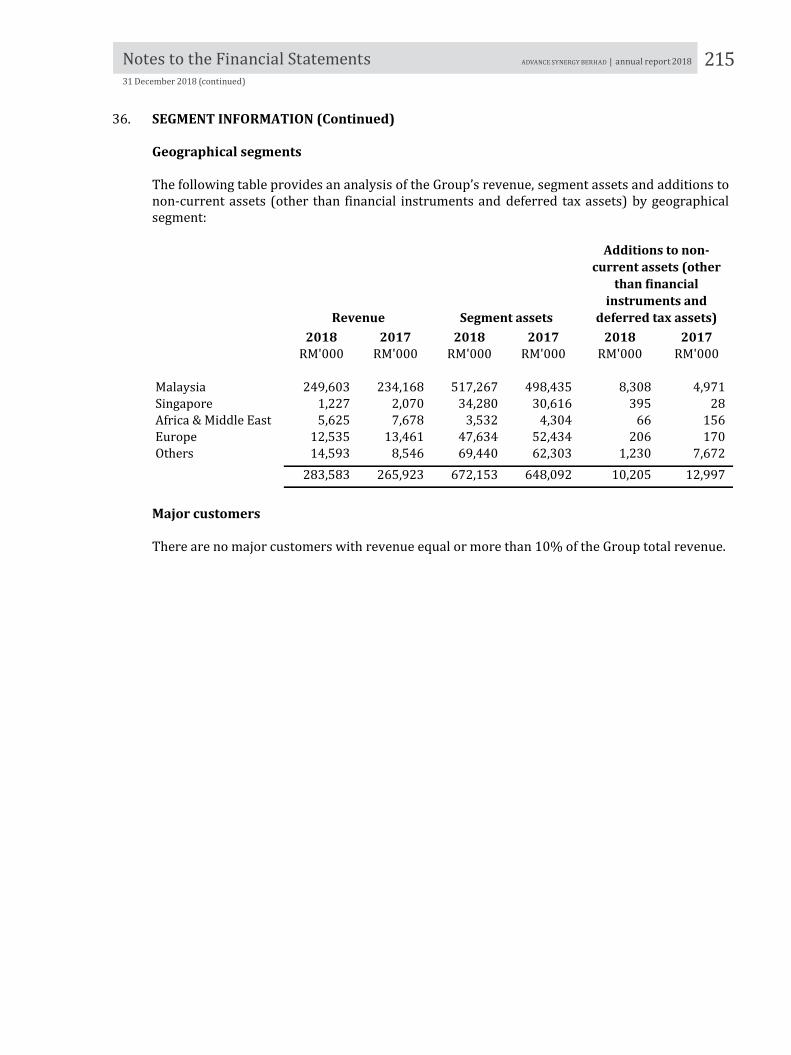
ADVANCE SYNERGY BERHAD | annual report 2018 Notes to the Financial Statements31 December 2018 (continued)
215 Company No. 1225 – D
125
36. SEGMENT INFORMATION (Continued)
Geographical segments
The following table provides an analysis of the Group’s revenue, segment assets and additions to non-current assets (other than financial instruments and deferred tax assets) by geographical segment:
2018 2017 2018 2017 2018 2017RM'000 RM'000 RM'000 RM'000 RM'000 RM'000
Malaysia 249,603 234,168 517,267 498,435 8,308 4,971 Singapore 1,227 2,070 34,280 30,616 395 28 Africa & Middle East 5,625 7,678 3,532 4,304 66 156 Europe 12,535 13,461 47,634 52,434 206 170 Others 14,593 8,546 69,440 62,303 1,230 7,672
283,583 265,923 672,153 648,092 10,205 12,997
Revenue Segment assets
Additions to non-current assets (other
than financial instruments and
deferred tax assets)
Major customers There are no major customers with revenue equal or more than 10% of the Group total revenue.

Notes to the Financial Statements31 December 2018 (continued)
216 Company No. 1225 – D
126
37. FAIR VALUE OF FINANCIAL INSTRUMENTS
(a) Financial instruments that are not carried at fair value and whose carrying amounts are reasonably approximated to fair value
The following are classes of financial instruments that are not carried at fair value and whose carrying amounts are reasonable approximation of fair value:
Note
Financial AssetsTrade and other receivables 15Cash and bank balances and short term deposits 18Financial LiabilitiesTrade and other payables 24Borrowings 22ICULS 21
The carrying amount of these financial assets and liabilities is reasonable approximation of fair values, either due to their short-term nature or that they are floating rate instruments that are re-priced to market interest rates on or near the reporting date. The carrying amount of the current portion of borrowings is reasonable approximation of fair values due to the insignificant impact of discounting. The carrying amount of long term floating rate loans approximate their fair value as the loans to be repaid to market interest rate on or near report date. The fair value of the liability component and the equity component were determined at the issuance of ICULS.
(b) Fair value hierarchy
The following are classes of financial instruments that are carried at fair value, by valuation method. The different levels have been defined as follows:
(i) Level 1 - Unadjusted quoted prices in active market for identical financial
instruments (ii) Level 2 - Inputs other than quoted prices include within Level 1 that are
observable either directly or indirectly (iii) Level 3 - Inputs that are not based on observable market data

ADVANCE SYNERGY BERHAD | annual report 2018 Notes to the Financial Statements31 December 2018 (continued)
217
Com
pany
No.
122
5 –
D
127
37.
FAIR
VAL
UE
OF
FIN
ANCI
AL IN
STRU
MEN
TS (C
onti
nued
)
(b)
Fair
val
ue h
iera
rchy
(Con
tinu
ed)
The f
ollo
wing
tabl
e pro
vide
s fair
valu
e mea
sure
men
t hier
arch
y of t
he G
roup
’s an
d the
Com
pany
’s fin
ancia
l instr
umen
ts:
Fair
Carr
ying
Leve
l 1Le
vel 2
Leve
l 3To
tal
Leve
l 1Le
vel 2
Leve
l 3To
tal
valu
eam
ount
Note
RM'0
00RM
'000
RM'0
00RM
'000
RM'0
00RM
'000
RM'0
00RM
'000
RM'0
00RM
'000
Grou
p20
18Fi
nanc
ial A
sset
sIn
vestm
ent s
ecur
ities
:12
- Fair
valu
e thr
ough
othe
r
com
preh
ensiv
e inc
ome
fin
ancia
l ass
ets
6,515
-
2,872
9,3
87
-
-
-
-
9,387
9,3
87
- F
air va
lue t
hrou
gh pr
ofit
or lo
ss
finan
cial a
sset
s-
-
37
,636
37
,636
-
-
-
-
37
,636
37
,636
- Held
for t
radi
ng in
vestm
ents
410
-
-
41
0
-
-
-
-
41
0
41
0
Fore
ign cu
rren
cy he
ld fo
r tra
ding
1731
7
-
-
317
-
-
-
-
317
317
Fina
ncia
l Lia
bilit
ies
Borr
owin
gs:
22- H
ire pu
rcha
se pa
yabl
e-
-
-
-
-
-
71
71
71
71
- Ter
m lo
ans
-
-
-
-
-
-
67,71
5
67,71
5
67,71
5
67,71
5
Fair
val
ue o
f fin
anci
al in
stru
men
ts
carr
ied
at fa
ir v
alue
Fair
val
ue o
f fin
anci
al in
stru
men
ts
not c
arri
ed a
t fai
r va
lue

Notes to the Financial Statements31 December 2018 (continued)
218 C
ompa
ny N
o. 1
225 –
D
128
37
. FA
IR V
ALU
E O
F FI
NAN
CIAL
INST
RUM
ENTS
(Con
tinu
ed)
(b
) Fa
ir v
alue
hie
rarc
hy (C
onti
nued
)
The f
ollo
wing
tabl
e pro
vide
s fair
valu
e mea
sure
men
t hier
arch
y of t
he G
roup
’s an
d the
Com
pany
’s fin
ancia
l instr
umen
ts (C
ontin
ued)
:
Fair
Carr
ying
Leve
l 1Le
vel 2
Leve
l 3To
tal
Leve
l 1Le
vel 2
Leve
l 3To
tal
valu
eam
ount
Note
RM'0
00RM
'000
RM'0
00RM
'000
RM'0
00RM
'000
RM'0
00RM
'000
RM'0
00RM
'000
Grou
p20
17
Fina
ncia
l Ass
ets
Inve
stmen
t sec
uriti
es:
12- A
vaila
ble-
for-s
ale
finan
cial a
sset
s9,6
50
-
4,0
36
13,68
6
-
-
-
-
13,68
6
13,68
6
- F
air va
lue t
hrou
gh pr
ofit
or lo
ss
finan
cial a
sset
s-
-
28
,879
28
,879
-
-
-
-
28
,879
28
,879
- Held
for t
radi
ng in
vestm
ents
459
-
-
45
9
-
-
-
-
45
9
45
9
Fore
ign cu
rren
cy he
ld fo
r tra
ding
1736
1
-
-
361
-
-
-
-
361
361
Fina
ncia
l Lia
bilit
ies
Borr
owin
gs:
22- F
inan
ce le
ase p
ayab
le-
-
-
-
-
-
23
,017
23
,017
23
,017
23
,017
- Hire
purc
hase
paya
ble
-
-
-
-
-
-
134
193
19
3
19
3
- Ter
m lo
ans
-
-
-
-
-
-
37,61
2
37,61
2
37,61
2
37,61
2
IC
ULS
21-
-
-
-
-
-
60
,832
60
,832
60
,832
60
,832
Com
pany
2017
Fina
ncia
l Lia
bilit
ies
ICUL
S21
-
-
-
-
-
-
60,83
2
60,83
2
60,83
2
60,83
2
Fair
val
ue o
f fin
anci
al in
stru
men
ts
carr
ied
at fa
ir v
alue
Fair
val
ue o
f fin
anci
al in
stru
men
ts
not c
arri
ed a
t fai
r va
lue

ADVANCE SYNERGY BERHAD | annual report 2018 Notes to the Financial Statements31 December 2018 (continued)
219 Company No. 1225 – D
129
37. FAIR VALUE OF FINANCIAL INSTRUMENTS (Continued)
(b) Fair value hierarchy (Continued)
Policy on transfer between levels The fair value of an asset to be transferred between levels is determined as of the date of the event or change in circumstances that caused the transfer. Fair value hierarchy Level 1 fair value Level 1 fair value is derived from quoted price (unadjusted) in active markets for identical financial assets or liabilities that the entity can access at the measurement date. Level 2 fair value Level 2 fair value is estimated using inputs other than quoted prices included within Level 1 that are observable for the financial assets or liabilities, either directly or indirectly. Level 3 fair value Level 3 fair value is estimated using unobservable input for the ICULS. The reconciliation of Level 3 fair value of ICULS is as disclosed in Note 21 to the financial statements.
The Group adopted the following valuation methodologies in estimating the fair values of the financial assets designated at fair value through profit or loss:
(i) Cost approach: This is applied to estimate fair value of companies in very
preliminary development stage where revenue forecast is difficult to estimate with any degree of certainty, and assumes the book value or cost of an asset approximates its fair value. Adjustments, such as impairment allowance, are made to assets on a case-by-case basis if this assumption does not hold true.
(ii) Option Pricing Model (“OPM”): The OPM, which applies the Black-Scholes formula for
option pricing, is a generally accepted valuation methodology used in estimating fair values of early stage companies, in particular those with different classes of shares. In applying the OPM to determine the fair value of an investee, management considers terms such as level of seniority among the securities, dividend policy, conversion ratios, and cash allocations of the various stockholders’ agreements with the investee that would affect the distributions to each class of equity upon a liquidity event. In addition, the method implicitly considers the effect of the liquidation preference as of the future liquidation date, not as of the valuation date.
The key assumptions used in applying the Black-Scholes formula which are unobservable inputs, are as follows: Unobservable inputs
2018
2017
Sensitivity of inputs to fair value
Risk free rates (range) 1.9%–8.16% 1.69%–6.12% Increase (decrease)
of the inputs would result in decrease (increase) in fair values
Asset volatility (range) 51.46%–60.34% 38.0%–60.0% Expected terms (years) 3 to 5 5 to 5.38

Notes to the Financial Statements31 December 2018 (continued)
220 Company No. 1225 – D
130
37. FAIR VALUE OF FINANCIAL INSTRUMENTS (Continued)
(b) Fair value hierarchy (Continued)
Level 3 fair value (Continued) The group has the policy to regularly assess and evaluate the appropriate valuation methodologies in ascertaining the fair value of the investments.
The valuation techniques used in the determination of fair values within Level 3, as well as the key unobservable inputs used in the valuation models. Financial instruments not carried at fair value The fair value of the revolving credit, hire purchase payable, term loans and finance lease payable are determined using the discounted cash flows method based on discount rates that reflects the issuer’s borrowing rate as at the end of the reporting period. Transfer between levels of fair values hierarchy There is no transfer between levels of fair values hierarchy during the financial year.
38. FINANCIAL RISK MANAGEMENT OBJECTIVES AND POLICIES
The operations of the Group and of the Company are subject to a variety of financial risks, including credit risk, liquidity risk, interest rate risk, foreign currency risk and market price risk. The Group and the Company have formulated a financial risk management framework whose principal objective is to minimise the Group’s and the Company’s exposure to risks and/or costs associated with the financing, investing and operating activities of the Group and of the Company. The following sections provide details regarding the Group’s and the Company’s exposure to the above-mentioned financial risks and the objectives, policies and processes for the management of these risks.
(a) Credit Risk
Credit risk is the risk of loss that may arise on outstanding financial instruments should a counter party default on its obligation. The Group’s and the Company’s exposure to credit risk arises primarily from trade and other receivables. It is the Group’s and the Company’s policy to monitor the financial standing of these receivables on an ongoing basis to ensure that the Group and the Company is exposed to minimal credit risk. Cash deposits and trade receivables may give rise to credit risk which requires the loss to be recognised if a counter party fails to perform as contracted.

ADVANCE SYNERGY BERHAD | annual report 2018 Notes to the Financial Statements31 December 2018 (continued)
221 Company No. 1225 – D
131
38. FINANCIAL RISK MANAGEMENT OBJECTIVES AND POLICIES (Continued)
(a) Credit Risk (Continued)
Exposure to credit risk As at end of financial year, the Group has no significant concentration of credit risk other than an amount owing from a debtor of RM3.68 million (2017: RM9.28 million). The Group does not anticipate the carrying amounts as at the end of financial year to be significantly different from the values that would eventually be received. The maximum exposures to credit risk are represented by the carrying amounts of the financial assets in the statement of financial position. Credit risk concentration profile
The Group determines concentrations of credit risk by industry sector profile of its trade receivables on an ongoing basis. The credit risk concentration profile of the Group’s and the Company’s trade receivables at the reporting date are as follows:
RM'000 % of total RM'000 % of totalBy industry sectors:Investment holding 34 0.0% 33 0.0%Property development 1 0.0% 699 0.8%Hotels and resorts 6,245 8.4% 8,384 9.5%Information and communications technology 44,271 59.2% 45,964 52.0%Travel and tours 8,726 11.7% 13,675 15.5%Others 15,484 20.7% 19,633 22.2%
74,761 100.0% 88,388 100.0%
Group20172018
Financial assets that are neither past due nor impaired Information regarding trade receivables that are neither past due nor impaired is disclosed in Note 15 to the financial statements. Deposits with banks and other financial institutions, investment securities and derivatives are placed with or entered into with reputable financial institutions or companies with high credit ratings and no history of default. Financial assets that are either past due or impaired Information regarding financial assets that are past due or impaired is disclosed in Note 15 to the financial statements. Financial guarantees The Company provides unsecured financial guarantees to banks in respect of banking facilities granted to certain subsidiaries. The Company monitors on an ongoing basis the results of the subsidiaries and repayments made by the subsidiaries. The maximum exposure to credit risk amounts to RM114.26 million (2017: RM78.24 million) representing the outstanding banking facilities of the subsidiaries as at the end of the reporting period.

Notes to the Financial Statements31 December 2018 (continued)
222 Company No. 1225 – D
132
38. FINANCIAL RISK MANAGEMENT OBJECTIVES AND POLICIES (Continued)
(a) Credit Risk (Continued)
Financial guarantees (Continued) As at the end of the reporting period, it was not probable that the counter party to the financial guarantee contract will claim under the contract. Consequently, the fair value for the corporate guarantee is NIL. As at the end of the reporting period, there was no indication that any subsidiary would default on repayment. The financial guarantees have not been recognised since the fair value on initial recognition was not material.
(b) Liquidity Risk
Liquidity risk is the risk that the Group and the Company will not be able to meet its financial obligations as they fall due. The Group’s and the Company’s exposure to liquidity risk arises principally from its various payables, loans and borrowings. The Group and the Company maintain a level of cash and cash equivalents and bank facilities deemed adequate by the management to ensure, as far as possible, that it will have sufficient liquidity to meet its liabilities when they fall due. Maturity analysis The table below summarises the maturity profile of the Group’s and the Company’s liabilities at the reporting date based on contractual undiscounted repayment obligations:
Contractual MoreCarrying interest Within 1 - 5 thanAmount rate 1 Year Years 5 Years Total
2018 RM'000 % RM'000 RM'000 RM'000 RM'000
GroupFinancial LiabilitiesTrade and other payables 74,910 - 74,910 - - 74,910 Revolving credit 41,000 5.77-5.80 41,000 - - 41,000 Finance lease payable 23,017 5.50 23,599 - - 23,599 Hire purchase payables 134 2.70 68 74 - 142 Bank overdrafts 2,404 8.57 2,404 - - 2,404 Term loans 71,228 4.55-7.96 7,580 29,255 66,496 103,331 Banker acceptance 900 3.66 900 900 Debtor financing 5,228 8.50 5,228 5,228
CompanyOther payables 232,240 - 232,240 - - 232,240
Contractual cash flows

ADVANCE SYNERGY BERHAD | annual report 2018 Notes to the Financial Statements31 December 2018 (continued)
223 Company No. 1225 – D
133
38. FINANCIAL RISK MANAGEMENT OBJECTIVES AND POLICIES (Continued)
(b) Liquidity Risk (Continued)
Maturity analysis (Continued)
The table below summarises the maturity profile of the Group’s and the Company’s liabilities at the reporting date based on contractual undiscounted repayment obligations (Continued):
Contractual MoreCarrying interest Within 1 - 5 thanAmount rate 1 Year Years 5 Years Total
2017 RM'000 % RM'000 RM'000 RM'000 RM'000
GroupFinancial LiabilitiesTrade and other payables 92,420 - 92,420 - - 92,420 Revolving credit 35,000 5.55 35,000 - - 35,000 Finance lease payable 23,017 5.50 1,203 23,599 - 24,802 Hire purchase payables 193 2.70 68 142 - 210 Bank overdrafts 1,728 7.44 1,728 - - 1,728 Term loans 39,864 4.65-7.71 4,049 15,670 37,600 57,319 ICULS 60,832 2.00 75,426 - - 75,426
CompanyOther payables 228,643 - 228,643 - - 228,643 ICULS 60,832 2.00 75,426 - - 75,426
Contractual cash flows
(c) Interest Rate Risk
Interest rate risk is the risk that the fair value or future cash flows of the Group’s and the Company’s financial instruments will fluctuate because of changes in market interest rates. The Group’s income and operating cash flows are substantially independent of changes in market interest rates. Interest rate exposure arises from the Group’s borrowings and is managed through the use of fixed and floating rate debts. The Group does not use derivative financial instruments to hedge its risk. The Company manages the net exposure to interest rate risks by maintaining sufficient lines of credit to obtain acceptable lending costs and by monitoring the exposure to such risks on an ongoing basis. Management does not enter into interest rate hedging transactions since it considers that the cost of such instruments outweigh the potential risk of interest rate fluctuation.

Notes to the Financial Statements31 December 2018 (continued)
224 Company No. 1225 – D
134
38. FINANCIAL RISK MANAGEMENT OBJECTIVES AND POLICIES (Continued)
(c) Interest Rate Risk (Continued) The interest rate profile of the Group’s and the Company’s significant interest-bearing financial instruments, based on carrying amounts as at the end of the reporting period were:
Weighted WeightedAverage AverageEffective EffectiveInterest Carrying Interest Carrying
Rate Amount Rate AmountNote % RM'000 % RM'000
Fixed Rate Group Financial LiabilitiesFinance lease payable 22(c) 5.50 23,017 5.50 23,017 Hire purchase payables 22(d) 5.10 134 5.10 193 Banker acceptance 3.66 900 - - Debtor financing 8.50 5,228 - -
29,279 23,210 ICULS 21 - - 7.00 60,832
29,279 84,042
CompanyICULS 21 - - 7.00 60,832
Floating Rate
GroupFinancial AssetsShort term deposits 18 3.16 73,872 3.14 78,655
Financial LiabilitiesBank overdrafts 22(a) 8.57 2,404 7.44 1,728 Revolving credit 22(b) 5.80 41,000 5.55 35,000 Term loans 22(e) 5.46 71,228 5.16 39,864
114,632 76,592
CompanyFinancial AssetsShort term deposits 18 2.70 6,550 2.70 3,850
2018 2017
Sensitivity analysis for interest rate risk
(i) Fair value sensitivity analysis for fixed rate instruments
The Group and the Company do not account for any fixed rate financial assets at fair value through profit or loss and equity. Therefore a change in interest rates at the reporting date would not affect profit or loss and equity.

ADVANCE SYNERGY BERHAD | annual report 2018 Notes to the Financial Statements31 December 2018 (continued)
225 Company No. 1225 – D
135
38. FINANCIAL RISK MANAGEMENT OBJECTIVES AND POLICIES (Continued)
(c) Interest Rate Risk (Continued)
Sensitivity analysis for interest rate risk (Continued)
(ii) Cash flow sensitivity analysis for variable rate instruments
At the reporting date, if interest rates had been 100 basis points lower/higher, with all other variables held constant, the Group’s and the Company’s profit net of tax would have been RM0.31 million and RM0.05 million higher/lower respectively, arising mainly as a result of lower/higher interest expense on floating rate loans and borrowings and higher/lower interest income from floating rate fixed deposits. The assumed movement in basis points for interest rate sensitivity analysis is based on a prudent estimate of the current market environment.
(d) Foreign Currency Risk
Foreign currency risk is the risk that the fair value or future cash flows of a financial instrument will fluctuate because of changes in foreign exchange rates. The Group has transactional currency exposures arising from sales or purchases that are denominated in a currency other than the respective functional currencies of Group entities, primarily RM, Singapore Dollar (“SGD”) and US Dollar (“USD”). The foreign currencies in which these transactions mainly denominated in US Dollar (“USD”), Chinese Renminbi (“RMB”) and European Euro (“Euro”). The Group and the Company ensure that the net exposure to this risk is kept to an acceptable level by buying or selling foreign currencies at spot rates where necessary to address short-term imbalances. Management does not enter into currency hedging transactions since it considers that the cost of such instruments outweigh the potential risk of exchange rate fluctuations. The unhedged financial assets and liabilities of the Group that are not denominated in their functional currencies are as follows:
Ringgit US Singapore PoundGroup Malaysia Dollar Dollar Sterling Total 2018 RM'000 RM'000 RM'000 RM'000 RM'000Financial assets and liabilities not held in functional currencyInvestment securitiesRenminbi - 1,693 - - 1,693 Trade receivables US Dollar 7,381 - 905 - 8,286 Australia Dollar 673 - - - 673 Others 43 - - - 43
8,097 - 905 - 9,002
Other receivablesUS Dollar 6 - 82 - 88
Functional currencies

Notes to the Financial Statements31 December 2018 (continued)
226 Company No. 1225 – D
136
38. FINANCIAL RISK MANAGEMENT OBJECTIVES AND POLICIES (Continued)
(d) Foreign Currency Risk (Continued)
The unhedged financial assets and liabilities of the Group that are not denominated in their functional currencies are as follows (Continued):
Ringgit US Singapore PoundGroup Malaysia Dollar Dollar Sterling Total 2018 RM'000 RM'000 RM'000 RM'000 RM'000Financial assets and liabilities not held in functional currency
Financial assets held for tradingAustralia Dollar 17 - - - 17 Euro 23 - - - 23 Hong Kong Dollar 11 - - - 11 Pound Sterling 12 - - - 12 Singapore Dollar 19 - - - 19 US Dollar 104 - - - 104 Others 132 - - - 132
318 - - - 318
Cash and bank balancesAustralia Dollar 3 - - - 3 Euro 34 5 - - 39 Pound Sterling 3 - - - 3 Singapore Dollar - 289 - - 289 US Dollar 5,198 - 3,522 13 8,733 Others 5 - - - 5
5,243 294 3,522 13 9,072
Trade payablesUS Dollar 1,671 - 319 - 1,990 Euro 380 - - - 380 Others 373 - - - 373
2,424 - 319 - 2,743
Functional currencies

ADVANCE SYNERGY BERHAD | annual report 2018 Notes to the Financial Statements31 December 2018 (continued)
227 Company No. 1225 – D
137
38. FINANCIAL RISK MANAGEMENT OBJECTIVES AND POLICIES (Continued)
(d) Foreign Currency Risk (Continued)
The unhedged financial assets and liabilities of the Group that are not denominated in their functional currencies are as follows (Continued):
Ringgit US Singapore PoundGroup Malaysia Dollar Dollar Sterling Total 2017 RM'000 RM'000 RM'000 RM'000 RM'000Financial assets and liabilities not held in functional currencyInvestment securitiesRenminbi - 1,693 - - 1,693 Trade receivables US Dollar 9,476 - 975 - 10,451 Australia Dollar 7,893 - - - 7,893 Euro 15 - - - 15 Others 791 - 9 - 800
18,175 - 984 - 19,159
Other receivablesUS Dollar 9 - 12 - 21
Functional currencies

Notes to the Financial Statements31 December 2018 (continued)
228 Company No. 1225 – D
138
38. FINANCIAL RISK MANAGEMENT OBJECTIVES AND POLICIES (Continued)
(d) Foreign Currency Risk (Continued)
The unhedged financial assets and liabilities of the Group that are not denominated in their functional currencies are as follows (Continued):
Ringgit US Singapore PoundGroup Malaysia Dollar Dollar Sterling Total 2017 RM'000 RM'000 RM'000 RM'000 RM'000Financial assets and liabilities not held in functional currency
Financial assets held for tradingAustralia Dollar 12 - - - 12 Euro 16 - - - 16 Hong Kong Dollar 22 - - - 22 Pound Sterling 40 - - - 40 Singapore Dollar 23 - - - 23 US Dollar 83 - - - 83 Others 156 - - - 156
352 - - - 352
Cash and bank balancesAustralia Dollar 3 - - - 3 Euro 92 6 - - 98 Pound Sterling 4 - - - 4 Singapore Dollar 15 728 - - 743 US Dollar 5,573 - 1,033 16 6,622 Others 5 - - - 5
5,692 734 1,033 16 7,475
Trade payablesUS Dollar 9,810 - 270 - 10,080 Euro 667 - - - 667 Others 376 - 36 - 412
10,853 - 306 - 11,159
Functional currencies

ADVANCE SYNERGY BERHAD | annual report 2018 Notes to the Financial Statements31 December 2018 (continued)
229 Company No. 1225 – D
139
38. FINANCIAL RISK MANAGEMENT OBJECTIVES AND POLICIES (Continued)
(d) Foreign Currency Risk (Continued)
Sensitivity analysis for foreign currency risk The following table demonstrates the sensitivity of the Group’s post tax profit to a reasonably possible change in the USD, SGD and RMB exchange rate against the respective functional currencies of the Group entities, with all other variables held constant.
Group2018
RM'000Profit/loss for the year
RMB/USD - strengthened 10% 169 - weakened 10% (169)
USD/SGD - strengthened 10% 419 - weakened 10% (419)
USD/RM - strengthened 10% 1,102 - weakened 10% (1,102)
(e) Market Price Risk
Market price risk is the risk that the fair value or future cash flows of the Group’s financial instruments will fluctuate because of changes in market prices (other than interest or exchange rates).
The Group is exposed to equity price risk arising from its investment in quoted equity instruments. The quoted equity instruments in Malaysia are listed on Bursa Securities. These instruments are classified as held for trading or available-for-sale financial assets. The Group does not have exposure to commodity price risk.
Sensitivity analysis for equity price risk This analysis assumes that all other variables remain constant and the Group’s equity investments moved in correlation with FTSE Bursa Malaysia KLCI (“FBMKLCI”).
A 10 percent strengthening in FBMKLCI at the end of the reporting period would have increased equity by RM0.65 million and post tax profit or loss by RM0.04 million. A 10 percent weakening in FBMKLCI would have had equal but opposite effect on equity and profit or loss respectively.

Notes to the Financial Statements31 December 2018 (continued)
230 Company No. 1225 – D
140
39. CAPITAL MANAGEMENT
The Group actively and regularly reviews and manages its capital structure with the objectives of ensuring that the Group will be able to continue as a going concern while maximising the return to stakeholders. These reviews take into consideration future capital requirements of the Group, prevailing and projected profitability, projected operating cash flows, projected capital expenditures and strategic investment opportunities. The capital structure of the Group consists of debt which includes borrowings (Note 22 to the financial statements), cash and cash equivalents (Statements of Cash Flows), and equity attributable to equity holders of the Company. The Group’s overall capital management strategy remains unchanged from 2017 and this includes maintaining a healthy gearing ratio taking into consideration the objectives of the Group. As at reporting date, the gearing ratio calculated as total borrowings divided by total equity is as follows:
2018 2017RM'000 RM'000
Total borrowings 143,911 99,802 Less : Cash and cash equivalents (94,438) (114,289) Subtotal 49,473 (14,487)
Total equity 486,889 496,069
Debt-to-equity ratio 0.10 *
Group
* Not applicable There were no changes in the Group’s approach to capital management during the year. Certain subsidiaries are required to comply with the necessary capital requirements as prescribed in the rules & regulations of Bank Negara Malaysia and the Mainboard listing requirements of Singapore Exchange Securities Trading Limited.
40. SIGNIFICANT EVENTS DURING THE FINANCIAL YEAR
The significant events during the financial year are as follows: (a) The ICULS matured on 26 January 2018 and all outstanding ICULS were compulsorily
and automatically converted into fully paid new ordinary shares of the Company. Following the conversion of all outstanding 502,151,541 ICULS, a total of 251,075,761 new ordinary shares in the Company were allotted on 30 January 2018.

ADVANCE SYNERGY BERHAD | annual report 2018 Notes to the Financial Statements31 December 2018 (continued)
231 Company No. 1225 – D
141
40. SIGNIFICANT EVENTS DURING THE FINANCIAL YEAR (Continued) The significant events during the financial year are as follows (Continued):
(b) On 30 November 2018, Advance Synergy Realty Sdn. Bhd. (“ASR”), a wholly-owned
subsidiary of the Company, completed the proposed acquisitions pursuant to the following two (2) Sale and Purchase Agreements entered into on 16 January 2018:
(i) Sale and Purchase Agreement with Petaling Garden Sdn. Bhd. for the proposed
acquisition of 70% interest in a detached commercial 5-storey building block with car park bearing postal address No. 17, Jalan Yap Ah Shak, 50300 Kuala Lumpur for a cash purchase consideration of RM18.90 million; and
(ii) Sale and Purchase Agreement with Temasya Development Co. Sdn. Bhd. for the
proposed acquisition of 70% interest in a detached commercial 4-storey building block bearing postal address No. 9, Jalan Kajibumi U1/70, Seksyen U1, Temasya Glenmarie, 40150 Shah Alam, Selangor Darul Ehsan for a cash purchase consideration of RM22.05 million.
(c) On 13 December 2018, the proposed disposal by ASHR, a wholly-owned subsidiary of the
Company, of its entire 6,811,628 ordinary shares representing 40% equity interest in HVKL to Ri-Yaz Assets (Kuala Lumpur) Sdn. Bhd. (formerly known as Aurora Arena Sdn. Bhd.) for a cash consideration of RM11.20 million pursuant to a share sale agreement entered into on 1 November 2017 was completed. Consequential thereto, HVKL will ceased to be a 40%-owned associated company of ASHR.
41. SIGNIFICANT EVENTS SUBSEQUENT TO THE END OF THE FINANCIAL YEAR
On 21 December 2018, 57-59 Philbeach Gardens Limited (“PGL”), a wholly-owned subsidiary incorporated in United Kingdom, of Arosa, a 65%-owned indirect subsidiary of the Company, entered into a Share Sale Agreement to acquire 100% equity interest (represented by 1,100 ordinary shares of GBP1.00 each) in Beaver Hotels Limited (“Beaver”) for a cash consideration of GBP10.25 million (equivalent to approximately RM55.63 million). Upon completion of the proposed acquisition on 21 February 2019, Beaver became an indirect 65%-owned subsidiary of the Company held via PGL.

232
Statement By DirectorsPursuant to Section 251(2) of the Companies Act 2016
Company No. 1225 – D
142
ADVANCE SYNERGY BERHAD (Incorporated in Malaysia) STATEMENT BY DIRECTORS (Pursuant to Section 251(2) of the Companies Act 2016) We, LEE SU NIE and YONG TECK MING, being two of the directors of ADVANCE SYNERGY BERHAD, do hereby state that in the opinion of the directors, the accompanying financial statements set out on pages 99 to 231 are drawn up in accordance with Malaysian Financial Reporting Standards, International Financial Reporting Standards and the requirements of the Companies Act 2016 in Malaysia so as to give a true and fair view of the financial position of the Group and of the Company as at 31 December 2018 and their financial performance and cash flows for the financial year then ended. Signed on behalf of the Board of Directors in accordance with a resolution of the directors: LEE SU NIE Director YONG TECK MING Director Selangor Darul Ehsan Date: 12 April 2019

ADVANCE SYNERGY BERHAD | annual report 2018 233
Company No. 1225 – D
143
ADVANCE SYNERGY BERHAD (Incorporated in Malaysia) STATUTORY DECLARATION (Pursuant to Section 251(1) of the Companies Act 2016) I, LEE SU NIE, being the director primarily responsible for the financial management of ADVANCE SYNERGY BERHAD, do solemnly and sincerely declare that to the best of my knowledge and belief, the financial statements set out on pages 99 to 231 are correct, and I make this solemn declaration conscientiously believing the same to be true, and by virtue of the provisions of the Statutory Declarations Act, 1960. LEE SU NIE Subscribed and solemnly declared by the abovenamed at Kuala Lumpur, Wilayah Persekutuan on 12 April 2019. Before me, HADINUR MOHD SYARIF No.: W761 Commissioner for Oaths Malaysia
Statutory DeclarationPursuant to Section 251(1) of the Companies Act 2016

234
Independent Auditors’ Reportto the Members of Advance Synergy Berhad
144
Company No. 1225 - D INDEPENDENT AUDITORS’ REPORT TO THE MEMBERS OF ADVANCE SYNERGY BERHAD (Incorporated in Malaysia) Report on the Audited Financial Statements Opinion We have audited the financial statements of Advance Synergy Berhad, which comprise the statements of financial position as at 31 December 2018 of the Group and of the Company, and the statements of comprehensive income, statements of changes in equity and statements of cash flows of the Group and of the Company for the financial year then ended, and a summary of significant accounting policies, as set out on pages 99 to 231. In our opinion, the accompanying financial statements give a true and fair view of the financial position of the Group and of the Company as at 31 December 2018 and of their financial performance and cash flows for the financial year then ended in accordance with the Malaysian Financial Reporting Standards, International Financial Reporting Standards and the requirements of the Companies Act 2016 in Malaysia. Basis for Opinion We conducted our audit in accordance with approved standards on auditing in Malaysia and International Standards on Auditing. Our responsibilities under those standards are further described in the Auditors’ Responsibilities for the Audit of the Financial Statements section of our report. We are independent of the Group and of the Company in accordance with the By-Laws (on Professional Ethics, Conduct and Practice) of the Malaysian Institute of Accountants (“By-Laws”) and the International Ethics Standards Board for Accountants’ Code of Ethics for Professional Accountants (“IESBA Code”), and we have fulfilled our other ethical responsibilities in accordance with the By-Laws and the IESBA Code. We believe that the audit evidence we have obtained is sufficient and appropriate to provide a basis for our opinion. Key Audit Matters Key audit matters are those matters that, in our professional judgement, were of most significance in our audit of the financial statements of the Group and of the Company of the current financial year. These matters were addressed in the context of our audit of the financial statements of the Group and the Company as a whole, and in forming our opinion thereon, and we do not provide a separate opinion on these matters.

ADVANCE SYNERGY BERHAD | annual report 2018 235 Company No. 1225 – D
145
Impairment of goodwill (Notes 4(a) and 8 to the financial statements) Risk: The carrying amount of the goodwill relating to the information and communications technology (“ICT”) cash generating unit (“CGU”) amounted to RM83,684,000. The recoverable amount of the CGU was determined based on its value in use (“VIU”). Cash flow projections used in the VIU calculation were based on financial budgets and forecasts approved by management covering a five years period using a discount rate and forecasted growth rate. Significant judgements arise over the discount rates applied in the recoverable amount calculation and assumptions supporting the underlying cash flow projections, including forecast growth rates and gross profit margins. Our audit response: Our audit procedures focus on evaluating the cash flow projections and the Group’s projection procedures which included, among others: assessing the methodology adopted by the Group; comparing the actual results with previous cash flow projections to assess the performance of the
business and historical accuracy of the projections; testing the mathematical accuracy of the impairment assessment; and performing a sensitivity analysis around the key inputs that are expected to be most sensitive to
the recoverable amount. comparing the Group’s assumptions to externally derived data as well as our assessments in
relation to key inputs such as discount rates, forecast growth rates and gross profit margins. Fair value of unquoted investment (Notes 4(b), 10 and 12 to the financial statements) Risk: The financial asset is not traded in an active market or if the quoted price is not readily and regularly available, the fair value is established by using valuation techniques that are appropriate in circumstances and for which sufficient data are available to measure fair value, maximising the use of relevant observable inputs and minimising the use of unobservable inputs. The fair value measurement requires the selection among a range of different valuation methodologies, making estimates about expected future cash flows and discounted rates. Our audit response: As the unquoted investments are held in a component where we are not the auditors, we performed our review of the work of the component auditors in accordance with ISA 600 Special Considerations – Audits of Group Financial Statements (including the Work of Component Auditors) and their audit procedures performed included, among others: discussing with management the basis used in determining the fair values; reviewing work of in-house specialist, especially in determining whether such valuation
methodology is consistent with market practice; ensuring that the assumptions used and key inputs used has been assessed by the component
auditors: testing the mathematical accuracy of the valuation methodology used; and reviewing the adequacy of the disclosures made in the financial statements in compliance with
MFRS 9 Financial Instruments.
Independent Auditors’ Reportto the Members of Advance Synergy Berhad

236 Independent Auditors’ Reportto the Members of Advance Synergy Berhad
Company No. 1225 – D
146
Information Other than the Financial Statements and Auditors’ Report Thereon The directors of the Company are responsible for the other information. The other information comprises the information included in the annual report, but does not include the financial statements of the Group and of the Company and our auditors’ report thereon. Our opinion on the financial statements of the Group and of the Company does not cover the other information and we do not express any form of assurance conclusion thereon. In connection with our audit of the financial statements of the Group and of the Company, our responsibility is to read the other information and, in doing so, consider whether the other information is materially inconsistent with the financial statements of the Group and of the Company or our knowledge obtained in the audit, or otherwise appears to be materially misstated. If, based on the work we have performed, we conclude that there is a material misstatement of this other information, we are required to report that fact. We have nothing to report in this regard. Responsibilities of the Directors for the Financial Statements The directors of the Company are responsible for the preparation of financial statements of the Group and of the Company that give a true and fair view in accordance with the Malaysian Financial Reporting Standards, International Financial Reporting Standards and the requirements of the Companies Act 2016 in Malaysia. The directors are also responsible for such internal control as the directors determine is necessary to enable the preparation of financial statements of the Group and of the Company that are free from material misstatement, whether due to fraud or error. In preparing the financial statements of the Group and of the Company, the directors are responsible for assessing the Group’s and the Company’s ability to continue as a going concern, disclosing, as applicable, matters related to going concern and using the going concern basis of accounting unless the directors either intend to liquidate the Group or the Company or to cease operations, or have no realistic alternative but to do so. The directors of the Company are responsible for overseeing the Group’s financial reporting process.
ADVANCE SYNERGY BERHAD | annual report 2018 237Independent Auditors’ Reportto the Members of Advance Synergy Berhad
Company No. 1225 – D
147
Auditors’ Responsibilities for the Audit of the Financial Statements Our objectives are to obtain reasonable assurance about whether the financial statements of the Group and of the Company as a whole are free from material misstatement, whether due to fraud or error, and to issue an auditors’ report that includes our opinion. Reasonable assurance is a high level of assurance, but is not a guarantee that an audit conducted in accordance with approved standards on auditing in Malaysia and International Standards on Auditing will always detect a material misstatement when it exists. Misstatements can arise from fraud or error and are considered material if, individually or in the aggregate, they could reasonably be expected to influence the economic decisions of users taken on the basis of these financial statements. As part of an audit in accordance with approved standards on auditing in Malaysia and International Standards on Auditing, we exercise professional judgement and maintain professional scepticism throughout the audit. We also: identify and assess the risks of material misstatement of the financial statements of the Group
and of the Company, whether due to fraud or error, design and perform audit procedures responsive to those risks, and obtain audit evidence that is sufficient and appropriate to provide a basis for our opinion. The risk of not detecting a material misstatement resulting from fraud is higher than for one resulting from error, as fraud may involve collusion, forgery, intentional omissions, misrepresentations, or the override of internal control.
obtain an understanding of internal control relevant to the audit in order to design audit procedures that are appropriate in the circumstances, but not for the purpose of expressing an opinion on the effectiveness of the Group’s and the Company’s internal control.
evaluate the appropriateness of accounting policies used and the reasonableness of accounting estimates and related disclosures made by the directors.
conclude on the appropriateness of the directors’ use of the going concern basis of accounting and, based on the audit evidence obtained, whether a material uncertainty exists related to events or conditions that may cast significant doubt on the Group’s or the Company’s ability to continue as a going concern. If we conclude that a material uncertainty exists, we are required to draw attention in our auditors’ report to the related disclosures in the financial statements of the Group and of the Company or, if such disclosures are inadequate, to modify our opinion. Our conclusions are based on the audit evidence obtained up to the date of our auditors’ report. However, future events or conditions may cause the Group or the Company to cease to continue as a going concern.
evaluate the overall presentation, structure and content of the financial statements of the Group and of the Company, including the disclosures, and whether the financial statements of the Group and of the Company represent the underlying transactions and events in a manner that achieves fair presentation.
obtain sufficient appropriate audit evidence regarding the financial information of the entities or business activities within the Group to express an opinion on the financial statements of the Group. We are responsible for the direction, supervision and performance of the group audit. We remain solely responsible for our audit opinion.

238 Independent Auditors’ Reportto the Members of Advance Synergy Berhad
Company No. 1225 – D
148
We communicate with the directors regarding, among other matters, the planned scope and timing of the audit and significant audit findings, including any significant deficiencies in internal control that we identify during our audit. We also provide the directors with a statement that we have complied with relevant ethical requirements regarding independence, and to communicate with them all relationships and other matters that may reasonably be thought to bear on our independence, and where applicable, related safeguards. From the matters communicated with the directors, we determine those matters that were of most significance in the audit of the financial statements of the Group and of the Company for the current financial year and are therefore the key audit matters. We describe these matters in our auditors’ report unless law or regulation precludes public disclosure about the matter or when, in extremely rare circumstances, we determine that a matter should not be communicated in our report because the adverse consequences of doing so would reasonably be expected to outweigh the public interest benefits of such communication. Report on Other Legal and Regulatory Requirements In accordance with the requirements of the Companies Act 2016 in Malaysia, we report that the subsidiaries of which we have not acted as auditors, are disclosed in Note 9 to the financial statements. Other Matters This report is made solely to the members of the Company, as a body, in accordance with Section 266 of the Companies Act 2016 in Malaysia and for no other purpose. We do not assume responsibility to any other person for the contents of this report. Baker Tilly Monteiro Heng PLT Heng Fu Joe No. LLP0019411-LCA & AF 0117 No. 02966/11/2020 J Chartered Accountants Chartered Accountant Kuala Lumpur Date: 12 April 2019

239ADVANCE SYNERGY BERHAD | annual report 2018
OTHERINFORMATION
Contents
List of Properties 240
Statement on Directors’ Interests 242
Statistics on Shareholdings 244
Notice of Annual General Meeting 246
Proxy Form Enclosed

240
The top 10 properties of the Group as at 31 December 2018 are as follows:
Location Description Approx. land area
Approx. age of
building (Years)
Tenure Carrying Amount
(RM’000)
Date of last revaluation /
acquisition
* GM1126 Lot 1301,GM424 Lot 1302, GM857 Lot 1303, GM405 Lot 1305, HS(M) 1096 PT 1300 &HS(M) 1082 PT 1303 Mukim Sungai Karang CheratingPahang Darul Makmur
Land with hotel building, recreationalfacilities, restaurantsand apartmentblock
15 acres 25.5 - 31 Freehold 36,916 15.04.2016
Geran 85, Lot 203469, Jalan Haji Hussein50300 Kuala Lumpur
18 storey hotel building
3,214sq. m.
43 Freehold 32,801 04.05.2016
72, Pesiaran Jubli Perak Seksyen 2240000 Shah AlamSelangor Darul Ehsan
Industrial land and buildings
61,492 sq. m.
25 Freehold 31,191 03.06.2003
9, Jalan Kajibumi U1/70Seksyen U1Temasya Glenmarie40150 Shah AlamSelangor Darul Ehsan
Four storey commercial building
3,314sq. m.
1 Freehold 23,030 30.11.2018
17, Jalan Yap Ah Shak50300 Kuala Lumpur
Five storey commercial building
722sq. m.
1 Freehold 19,759 30.11.2018
List of Properties
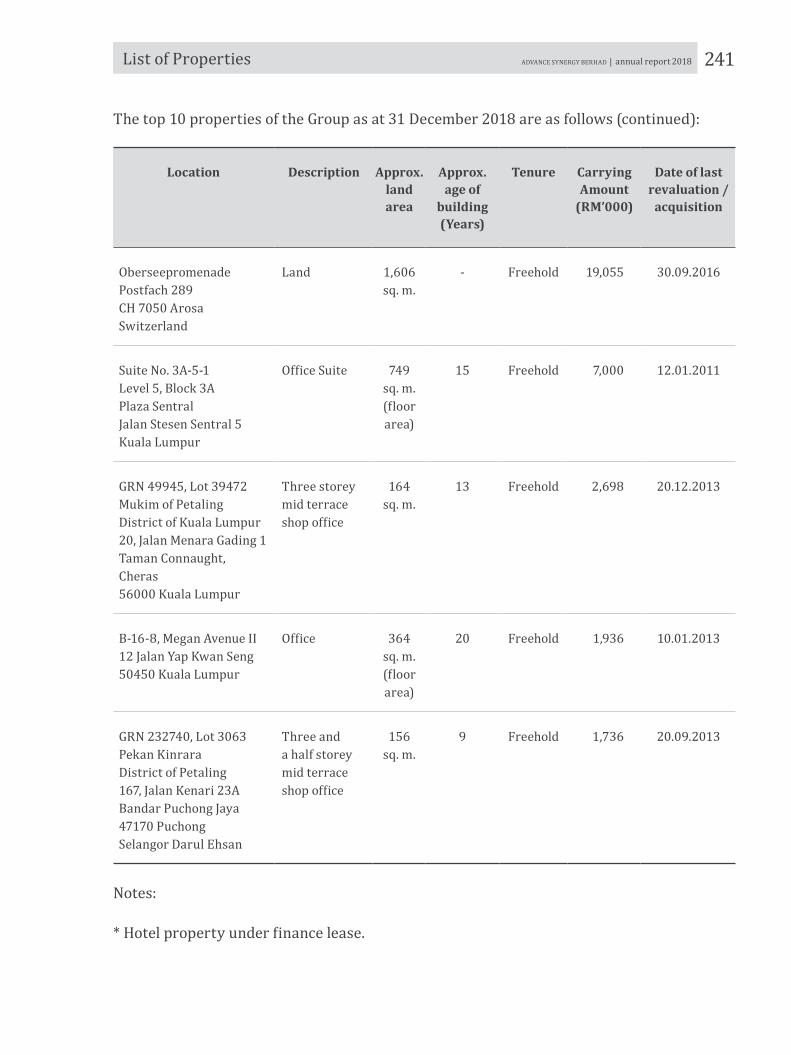
241ADVANCE SYNERGY BERHAD | annual report 2018 List of Properties
The top 10 properties of the Group as at 31 December 2018 are as follows (continued):
Location Description Approx. land area
Approx.age of
building (Years)
Tenure Carrying Amount
(RM’000)
Date of last revaluation /
acquisition
OberseepromenadePostfach 289CH 7050 ArosaSwitzerland
Land 1,606sq. m.
- Freehold 19,055 30.09.2016
Suite No. 3A-5-1Level 5, Block 3APlaza SentralJalan Stesen Sentral 5Kuala Lumpur
Office Suite 749sq. m.(floor area)
15 Freehold 7,000 12.01.2011
GRN 49945, Lot 39472Mukim of PetalingDistrict of Kuala Lumpur20, Jalan Menara Gading 1Taman Connaught,Cheras56000 Kuala Lumpur
Three storey mid terraceshop office
164sq. m.
13 Freehold 2,698 20.12.2013
B-16-8, Megan Avenue II12 Jalan Yap Kwan Seng50450 Kuala Lumpur
Office 364sq. m.(floor area)
20 Freehold 1,936 10.01.2013
GRN 232740, Lot 3063Pekan KinraraDistrict of Petaling167, Jalan Kenari 23ABandar Puchong Jaya47170 PuchongSelangor Darul Ehsan
Three anda half storey mid terraceshop office
156sq. m.
9 Freehold 1,736 20.09.2013
Notes:
* Hotel property under finance lease.

242
Ordinary shares
Number PercentageDirect Interest in the Company
Dato’ Ahmad Sebi Bakar * 76,810,009 8.27Kam Kin Foong 900,000 0.10
Deemed Interest in the CompanyDato’ Ahmad Sebi Bakar * 139,391,853 15.00Anton Syazi Dato’ Ahmad Sebi 30,467,000 3.28Lee Su Nie 365,000 0.04Puan Sri Datin Masri Khaw Abdullah 12,000,000 1.20
Direct Interest in related corporationCaptii LimitedAnton Syazi Dato’ Ahmad Sebi 517,600 1.62Lee Su Nie 20,000 0.06
Arcylic Synergy Sdn BhdAnton Syazi Dato’ Ahmad Sebi 1 negligible
Deemed Interest in related corporationCaptii LimitedKam Kin Foong 55,000 0.17
Segi Koleksi Sdn BhdDato’ Ahmad Sebi Bakar 105,000 30.00Anton Syazi Dato’ Ahmad Sebi 105,000 30.00Aryati Sasya Dato’ Ahmad Sebi 105,000 30.00
Metroprime Corporation Sdn BhdDato’ Ahmad Sebi Bakar 350,000 100.00Anton Syazi Dato’ Ahmad Sebi 350,000 100.00Aryati Sasya Dato’ Ahmad Sebi 350,000 100.00
Ordinary shares of CHF500.00 eachPosthotel Arosa AGAnton Syazi Dato’ Ahmad Sebi 3,150 35.00Aryati Sasya Dato’ Ahmad Sebi 3,150 35.00
Ordinary shares GBP1.00 each57-59 Philbeach Gardens LimitedAnton Syazi Dato’ Ahmad Sebi 1 100.00Aryati Sasya Dato’ Ahmad Sebi 1 100.00
Beaver Hotels LimitedAnton Syazi Dato’ Ahmad Sebi 1,100 100.00Aryati Sasya Dato’ Ahmad Sebi 1,100 100.00
Statement on Directors’ Interestsin the Companyand related corporations as at 28 March 2019

243ADVANCE SYNERGY BERHAD | annual report 2018 Statement on Director' Interests in the Companyand related corporations as at 28 March 2019 (continued)
Notes:
* By virtue of his interest in the Company, Dato’ Ahmad Sebi Bakar is also deemed to be interested in the shares of all investee companies (including subsidiaries) to the extent that the Company has an interest.
By virtue of his interest in Bright Existence Sdn Bhd (“BESB”) and Suasana Dinamik Sdn Bhd (“SDSB”), Dato’ Ahmad Sebi Bakar is also deemed to be interested in the shares to the extent that BESB and SDSB have an interest respectively.
By virtue of his interest in Eighth Review (M) Sdn Bhd (“ERSB”), Mr Anton Syazi Dato’ Ahmad Sebi is also deemed to be interested in the shares that ERSB has an interest.
This is her spouse’s interest in the ordinary shares of the Company which shall be treated as her interest in the ordinary shares of the Company pursuant to Section 59(11)(c) of the Companies Act 2016.
By virtue of her interest in ASH Holdings Sdn Bhd (“ASH”), Puan Sri Datin Masri Khaw Abdullah is deemed to be interested in the shares that ASH has an interest.
This is her spouse's interest in the ordinary shares of Captii Limited which shall be treated as her interest in the ordinary shares of Captii Limited pursuant to Section 59(11)(c) of the Companies Act 2016.
This is the interest of his children (Ms Aryati Sasya Dato’ Ahmad Sebi and Mr Anton Syazi Dato’ Ahmad Sebi) in Segi Koleksi Sdn Bhd (“SKSB”) which shall be treated as his interest in the ordinary shares of SKSB pursuant to Section 59(11)(c) of the Companies Act 2016.
By virtue of their interest in Pacific Existence Sdn Bhd (“PESB”), Ms Aryati Sasya Dato’ Ahmad Sebi and Mr Anton Syazi Dato’ Ahmad Sebi are also deemed to be interested in the shares to the extent that PESB has an interest in SKSB.
By virtue of his interest in SKSB pursuant to Section 8 of the Companies Act 2016, Dato’ Ahmad Sebi Bakar is deemed to be interested in the shares to the extent that SKSB has an interest in its wholly-owned subsidiary, Metroprime Corporation Sdn Bhd (“MCSB”).
By virtue of their interest in SKSB via PESB, Ms Aryati Sasya Dato’ Ahmad Sebi and Mr Anton Syazi Dato’ Ahmad Sebi are deemed to be interested in the shares to the extent that SKSB has an interest in MCSB.
By virtue of their interest in Kibar Konsep Sdn Bhd (“KKSB”), Ms Aryati Sasya Dato’ Ahmad Sebi and Mr Anton Syazi Dato' Ahmad Sebi are also deemed to be interested in the shares to the extent that KKSB has an interest in Posthotel Arosa AG (“Arosa”).
By virtue of their interest in Arosa via KKSB, Ms Aryati Sasya Dato’ Ahmad Sebi and Mr Anton Syazi Dato' Ahmad Sebi are deemed to be interested in the shares to the extent Arosa has an interest in 57-59 Philbeach Gardens Limited (“PGL”).
By virtue of their interest in PGL via Arosa, Ms Aryati Sasya Dato’ Ahmad Sebi and Mr Anton Syazi Dato' Ahmad Sebi are deemed to be interested in the shares to the extent that PGL has an interest in Beaver Hotels Limited.

244
Statistics on Shareholdingsas at 28 March 2019
TOTAL NUMBER OF ISSUED SHARES : 929,194,943ISSUED SHARE CAPITAL : RM381,376,644.99CLASS OF SHARE : Ordinary SharesVOTING RIGHT : 1 vote per ordinary share
ANALYSIS OF SHAREHOLDINGS
Size of shareholdings No. ofshareholders
% ofshareholders
No. ofshares held
% of issuedshares
Less than 100 shares 328 1.74 9,765 negligible100 - 1,000 shares 4,266 22.61 3,827,813 0.411,001 - 10,000 shares 9,278 49.18 40,962,988 4.4110,001 - 100,000 shares 4,166 22.08 148,211,999 15.95100,001 - less than 5% of issued shares 825 4.37 519,980,516 55.965% and above of issued shares 3 0.02 216,601,862 23.27
18,866 100.00 929,194,943 100.00
LIST OF TOP 30 SHAREHOLDERS
No. Name No. of shares held Percentage
1. SJ Sec Nominees (Tempatan) Sdn BhdSuasana Dinamik Sdn Bhd
80,799,926 8.70
2. Dato’ Ahmad Sebi Bakar 76,810,009 8.27
3. SJ Sec Nominees (Tempatan) Sdn BhdBright Existence Sdn Bhd
58,591,927 6.31
4. SJ Sec Nominees (Tempatan) Sdn BhdEighth Review (M) Sdn Bhd
30,467,000 3.28
5. Lim Hong Liang 27,690,850 2.98
6. HSBC Nominees (Asing) Sdn BhdExempt an for Bank Julius Baer & Co. Ltd.
25,605,400 2.75
7. Chew Lee Hwa 19,856,000 2.14
8. SJ Sec Nominees (Tempatan) Sdn BhdPledged Securities Account for Chan Sai Kim
13,472,000 1.45
9. ASH Holdings Sdn Bhd 12,000,000 1.29
10. Malpac Capital Sdn Bhd 11,269,150 1.21
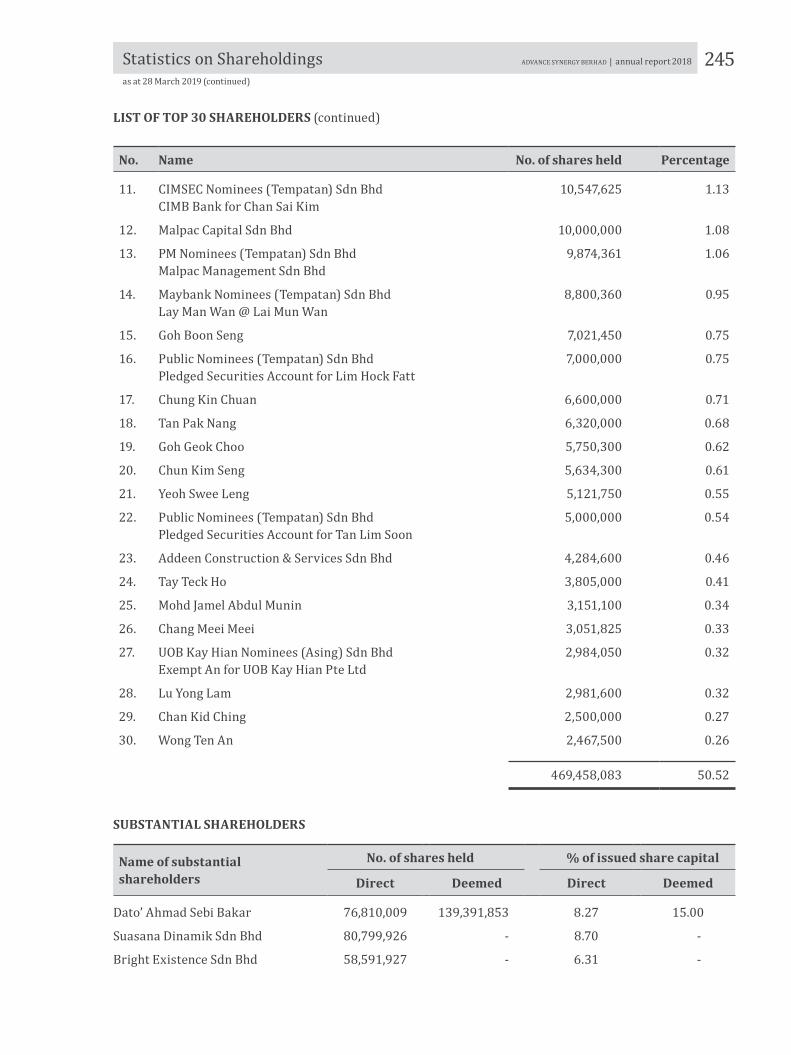
245ADVANCE SYNERGY BERHAD | annual report 2018 Statistics on Shareholdingsas at 28 March 2019 (continued)
LIST OF TOP 30 SHAREHOLDERS (continued)
No. Name No. of shares held Percentage
11. CIMSEC Nominees (Tempatan) Sdn BhdCIMB Bank for Chan Sai Kim
10,547,625 1.13
12. Malpac Capital Sdn Bhd 10,000,000 1.08
13. PM Nominees (Tempatan) Sdn BhdMalpac Management Sdn Bhd
9,874,361 1.06
14. Maybank Nominees (Tempatan) Sdn Bhd Lay Man Wan @ Lai Mun Wan
8,800,360 0.95
15. Goh Boon Seng 7,021,450 0.75
16. Public Nominees (Tempatan) Sdn BhdPledged Securities Account for Lim Hock Fatt
7,000,000 0.75
17. Chung Kin Chuan 6,600,000 0.71
18. Tan Pak Nang 6,320,000 0.68
19. Goh Geok Choo 5,750,300 0.62
20. Chun Kim Seng 5,634,300 0.61
21. Yeoh Swee Leng 5,121,750 0.55
22. Public Nominees (Tempatan) Sdn BhdPledged Securities Account for Tan Lim Soon
5,000,000 0.54
23. Addeen Construction & Services Sdn Bhd 4,284,600 0.46
24. Tay Teck Ho 3,805,000 0.41
25. Mohd Jamel Abdul Munin 3,151,100 0.34
26. Chang Meei Meei 3,051,825 0.33
27. UOB Kay Hian Nominees (Asing) Sdn BhdExempt An for UOB Kay Hian Pte Ltd
2,984,050 0.32
28. Lu Yong Lam 2,981,600 0.32
29. Chan Kid Ching 2,500,000 0.27
30. Wong Ten An 2,467,500 0.26
469,458,083 50.52
SUBSTANTIAL SHAREHOLDERS
Name of substantial shareholders
No. of shares held % of issued share capital
Direct Deemed Direct Deemed
Dato’ Ahmad Sebi Bakar 76,810,009 139,391,853 8.27 15.00
Suasana Dinamik Sdn Bhd 80,799,926 - 8.70 -
Bright Existence Sdn Bhd 58,591,927 - 6.31 -

246
Notice of Annual General Meeting
NOTICE IS HEREBY GIVEN that the Ninety-fifth ANNUAL GENERAL MEETING (“95th AGM”) of Advance Synergy Berhad will be held at the Auditorium, Level 4, The Podium, Wisma Synergy, No. 72, Pesiaran Jubli Perak, Seksyen 22, 40000 Shah Alam, Selangor Darul Ehsan on Friday, 28 June 2019 at 9.00 a.m. for the following purposes:
1. To receive the audited financial statements for the financial year ended 31 December 2018 and the Directors’ and Auditors’ reports thereon.
Please refer toExplanatory Note
2. To declare a single tier dividend of 0.25 sen per ordinary share in respect of the financial year ended 31 December 2018.
Resolution 1
3. To approve the payment of Directors’ fees for the financial year ended 31 December 2018.
Resolution 2
4. To approve the payment of benefits to the Directors from 29 June 2019 until the conclusion of the next annual general meeting of the Company.
Resolution 3
5. To re-elect the following Directors:5.1 Dato’ Ahmad Sebi Bakar5.2 Ms Lee Su Nie5.3 Puan Sri Datin Masri Khaw Abdullah
Resolution 4Resolution 5Resolution 6
6. To elect Ms Kam Kin Foong as Director. Resolution 7
7. To re-appoint Messrs Baker Tilly Monteiro Heng PLT as auditors of the Company and to authorise the Directors to fix their remuneration.
Resolution 8
SPECIAL BUSINESSTo consider and, if thought fit, pass with or without modifications the following resolutions:
8. Ordinary Resolution 1 – Retention of Independent Non-Executive Director
“THAT authority be and is hereby given for Mr Yong Teck Ming who has served as an Independent Non-Executive Director of the Company for a cumulative term of more than nine (9) years to continue to act as an Independent Non-Executive Director of the Company until the conclusion of the next Annual General Meeting in accordance with the Malaysian Code on Corporate Governance.”
Resolution 9

247ADVANCE SYNERGY BERHAD | annual report 2018 Notice of Annual General Meeting
9. Ordinary Resolution 2 – Authority to allot and issue securities
“THAT subject always to the Companies Act 2016, Articles of Association of the Company and/or approvals of the relevant governmental/regulatory authorities, the Directors be and are hereby authorised and empowered pursuant to Section 75(1) and Section 76(1) of the Companies Act 2016 to allot and issue new shares or convertible securities in the Company, from time to time at such price and upon such terms and conditions, for such purpose and to such person or persons whomsoever as the Directors may, in their absolute discretion deem fit, provided that the aggregate number of shares or convertible securities to be issued pursuant to this resolution does not exceed ten per centum (10%) of the total number of issued shares (excluding any treasury shares) of the Company for the time being AND THAT the Directors be and are hereby empowered to obtain the approval for the listing of and quotation for the additional shares or convertible securities so issued from Bursa Malaysia Securities Berhad AND THAT such authority shall continue to be in force until the conclusion of the next annual general meeting of the Company.”
Resolution 10
10. To transact any other ordinary business of which due notice shall have been given.
NOTICE OF DIVIDEND ENTITLEMENT AND PAYMENT
NOTICE IS ALSO HEREBY GIVEN that subject to the approval of the shareholders at the 95th AGM, a first and final single tier dividend of 0.25 sen per ordinary share in respect of the financial year ended 31 December 2018 will be paid on 15 August 2019 to the shareholders whose names appear in the Record of Depositors on 26 July 2019.
A depositor shall qualify for entitlement only in respect of:
a. Shares transferred to the Depositor’s Securities Account before 4.30 p.m. on 26 July 2019 in respect of transfer; and
b. Shares bought on the Bursa Malaysia Securities Berhad on a cum entitlement basis according to the Rules of Bursa Malaysia Securities Berhad.
BY ORDER OF THE BOARD
HO TSAE FENGSecretary
Selangor Darul Ehsan30 April 2019
Notes:
1. In respect of deposited securities, only members whose names appear in the Record of Depositors on 4 June 2019 (General Meeting Record of Depositors) shall be entitled to attend, speak and vote at this meeting.
2. A member of the Company entitled to attend and vote at the general meeting is entitled to appoint at least one (1) proxy but not more than two (2) proxies to attend and vote in his/her stead. There shall be no restriction as to the qualification of the proxy. A proxy appointed to attend and vote at a meeting of the Company shall have the same rights as the member to speak at the meeting.
3. A member of the Company who is an authorised nominee as defined under the Securities Industry (Central Depositories) Act, 1991 may appoint at least one (1) proxy but not more than two (2) proxies in respect of each securities account it holds with shares of the Company standing to the credit of the said securities account.
248 Notice of Annual General Meeting
4. Where a member of the Company is an exempt authorised nominee as defined under the Securities Industry (Central Depositories) Act 1991, which holds ordinary shares in the Company for multiple beneficial owners in one securities account (“omnibus account”), there is no limit to the number of proxies which the exempt authorised nominee may appoint in respect of each omnibus account it holds.
5. The instrument appointing a proxy in the case of an individual shall be signed by the appointer or his/her attorney duly authorised in writing and in the case of a corporation, the instrument appointing a proxy must be under its common seal or under the hand of an officer or attorney duly authorised.
6. The instrument appointing a proxy and the power of attorney or other authority, if any, under which it is signed (or a notarially certified copy of such power or authority) shall be deposited at the Registered Office of the Company at Level 3, East Wing, Wisma Synergy, No. 72, Pesiaran Jubli Perak, Seksyen 22, 40000 Shah Alam, Selangor Darul Ehsan not less than 48 hours before the time appointed for holding the meeting or any other adjournment thereof.
PERSONAL DATA PRIVACY
By submitting an instrument appointing a proxy(ies) and/or representative(s) to attend, speak and vote at the 95th AGM and/or any adjournment thereof, a member of the Company (i) consents to the collection, use and disclosure of the member’s personal data by the Company (or its agents) for the purpose of the processing and administration by the Company (or its agents) of proxies and representatives appointed for the 95th AGM (including any adjournment thereof) and the preparation and compilation of the attendance lists, minutes and other documents relating to the 95th AGM (including any adjournment thereof), and in order for the Company (or its agents) to comply with any applicable laws, listing rules, regulations and/or guidelines (collectively, the “Purposes”), (ii) warrants that where the member discloses the personal data of the member’s proxy(ies) and/or representative(s) to the Company (or its agents), the member has obtained the prior consent of such proxy(ies) and/or representative(s) for the collection, use and disclosure by the Company (or its agents) of the personal data of such proxy(ies) and/or representative(s) for the Purposes, and (iii) agrees that the member will indemnify the Company in respect of any penalties, liabilities, claims, demands, losses and damages as a result of the member’s breach of warranty.
EXPLANATORY NOTES ON ORDINARY BUSINESS
Agenda 1 – Audited Financial Statements for financial year ended 31 December 2018
The audited financial statements for the financial year ended 31 December 2018 are laid in accordance with Section 340(1)(a) of the Companies Act (“CA”) 2016 for discussion only under Agenda 1. They do not require shareholders’ approval and hence, will not be put for voting
Resolution 2 – Directors’ Fees Resolution 3 – Directors’ Benefits
Following the enforcement of Section 230(1) of the CA 2016 effective 31 January 2017, it provides amongst others, that “the fees” of the directors and “any benefits” payable to the directors of a listed company and its subsidiaries shall be approved at a general meeting.
The proposed Resolution 2, if passed, will authorise the payment of Directors’ fees for the financial year ended 31 December 2018 amounting to RM306,000 (2017: RM315,000).
The proposed Resolution 3, if passed, will authorise the payment of benefits to the Directors if any from 29 June 2019 until the conclusion of the next annual general meeting of the Company as and when incurred. The Board is of the view that it is just and equitable for these benefits to be paid as and when incurred, particularly after they have discharged their responsibilities and rendered their services to the Company throughout the said period.
Resolutions 4, 5 and 6 – Re-election of Directors
Details of the Directors standing for re-election under proposed Resolutions 4, 5 and 6 are stated in Directors’ profile on pages 51 to 54 of this Annual Report. Their securities holdings in the Company and its subsidiaries are stated on page 242 of this Annual Report.

249ADVANCE SYNERGY BERHAD | annual report 2018 Notice of Annual General Meeting
EXPLANATORY NOTES ON SPECIAL BUSINESS
Resolution 9 – Retention of Independent Non-Executive Director
The Nomination Committee had assessed the independence of Mr Yong Teck Ming, who has served on the Board as an Independent Non-Executive Director of the Company for a cumulative term of more than nine (9) years, and the Board had discussed and agreed with the recommendation of the Nomination Committee that in his long service to the Company, he has performed very well as an Independent Non-Executive Director and there is no reason to believe that he would not continue to act independently and to contribute to the Company taking into consideration the following:
(a) he fulfilled the Independent Director criteria under the Main Market Listing Requirements of Bursa Malaysia Securities Berhad and thus is able to function as a check and balance and to bring an element of objectivity to the Board;
(b) he is a member of the Institute of Chartered Accountants, Australia, New Zealand and a member of the Institute of Chartered Secretaries and Administrators, United Kingdom. He has vast experience in accounting and a diverse range of business which would enable him to provide the Board with constructive opinion.
(c) he has been with the Company for more than nine (9) years and is familiar with the Company’s business operations which will enable him to contribute actively and effectively during deliberation at meetings of the Board and Board Committees;
(d) he has exercised his objective and independent judgement on all Board deliberations;
(e) he has devoted sufficient time and attention to his professional obligations for informed and balanced decision making;
(f) he has exercised due care during his tenure as Independent Non-Executive Director of the Company and carried out his professional duties in the best interest of the Company and shareholders; and
(g) he has been providing invaluable contributions to the Board in his role as an Independent Non-Executive Director and Chairman of the Audit Committee and Risk Management Committee.
Resolution 10 – Authority to allot and issue securities
The proposed Resolution 10 is the renewal of the mandate obtained from the members at the last Annual General Meeting. As at the date of this Notice, the Company did not allot any shares pursuant to the mandate granted to the Directors at the Ninety-Fourth Annual General Meeting held on 7 June 2018 as there were no requirements for such fund raising activities.
The proposed Resolution 10, if passed, would provide flexibility to the Directors to undertake fund raising activities, including but not limited to further placement of shares or convertible securities for the purpose of funding the Company’s future investment project(s), working capital and/ or acquisition(s), by the issuance of shares or convertible securities in the Company to such persons at any time as the Directors may deem fit provided that the aggregate number of shares or convertible securities issued pursuant to the mandate does not exceed 10% of the total number of issued shares of the Company for the time being, without having to convene a general meeting. This authority, unless revoked or varied by the Company in a general meeting, will expire at the conclusion of the next Annual General Meeting of the Company.
At this juncture, there is no decision to issue new shares or convertible securities. If there should be a decision to issue new shares or convertible securities after the general mandate is obtained, the Company will make an announcement in respect of the purpose and utilisation of proceeds arising from such issue.

250 Notice of Annual General Meeting
ADMINISTRATIVE DETAILS
Registration
1. Registration will start at 8.00 a.m. at Ground Floor, The Podium, Wisma Synergy, No. 72, Pesiaran Jubli Perak, Seksyen 22, 40000 Shah Alam, Selangor Darul Ehsan.
2. Please read the signage to ascertain where you should register yourself for the meeting and join the queue accordingly.
3. Please produce your ORIGINAL Identification Document at the registration counter for verification.
4. You will be given an identification wristband and will only be allowed to enter the Auditorium if you are wearing the identification wristband.
5. After registration and signing on the Attendance List, please proceed to the Auditorium, Level 4, The Podium, Wisma Synergy, No. 72, Pesiaran Jubli Perak, Seksyen 22, 40000 Shah Alam, Selangor Darul Ehsan.
Parking
6. Please register at the Guardhouse and park your vehicle at the designated visitor parking bays.
Refreshment
7. Light refreshment will be provided after the conclusion of the AGM.
Voting procedure
8. Pursuant to Paragraph 8.29A(1) of the Main Market Listing Requirements of Bursa Malaysia Securities Berhad, all the resolutions set out in the Notice of AGM will be put to vote by poll.
Statement Accompanying Notice of Annual General Meeting(Pursuant to Paragraph 8.27(2) of the Listing Requirements of Bursa Malaysia Securities Berhad)
Details of individuals who are standing for election as Director
Details of the Director standing for election under the proposed Resolution 7 are as stated in the Directors’ Profile on page 57 of this Annual Report. Her securities holdings in the Company and its subsidiaries are stated on page 242 of this Annual Report.

I/We Contact No. (full name in block letters) NRIC/Company No. or CDS Account No. (for nominee companies only)
of (full address)
being a shareholder/shareholders of ADVANCE SYNERGY BERHAD, hereby appoint
NRIC No. (full name in block letters)
of (full address)
or failing him/her, NRIC No. (full name in block letters)
of (full address)
or failing him/her, THE CHAIRMAN OF THE MEETING as my/our proxy to vote for me/us and on my/our behalf at the Ninety-fourth Annual General Meeting of the Company to be held at the Auditorium, Level 4, The Podium, Wisma Synergy, No. 72, Pesiaran Jubli Perak, Seksyen 22, 40000 Shah Alam, Selangor Darul Ehsan on Friday, 28 June 2019 at 9.00 a.m. and at any adjournment thereof and thereat to vote as indicated below:
Please indicate with (P) how you wish to cast your vote. If neither “FOR” nor “AGAINST” is indicated, the proxy will vote or abstain from voting at his/her discretion.
NO. RESOLUTION FOR AGAINST1. Declaration of dividend.2. Approval of the payment of Directors’ fees.3. Approval of the payment of benefits to the Directors from 29 June 2019 until the
next annual general meeting of the Company.4. Re-election of Dato’ Ahmad Sebi Bakar as Director.5. Re-election of Ms Lee Su Nie as Director.6. Re-election of Puan Sri Datin Masri Khaw Abdullah as Director.7. Election of Ms Kam Kin Foong as Director.8. Re-appointment of Messrs Baker Tilly Monteiro Heng PLT as auditors of the
Company and authorisation for the Directors to fix their remuneration. 9. Retention of Mr Yong Teck Ming as Independent Non-Executive Director.10. Authorisation for Directors to allot and issue new securities pursuant to
Sections 75(1) and 76(1) of the Companies Act 2016.
Dated this day of 2019
Number of shares held SignatureNotes:
1. In respect of deposited securities, only members whose names appear in the Record of Depositors on 4 June 2019 (General Meeting Record of Depositors) shall be entitled to attend, speak and vote at this meeting.
2. A member of the Company entitled to attend and vote at the general meeting is entitled to appoint at least one (1) proxy but not more than two (2) proxies to attend and vote in his/her stead. There shall be no restriction as to the qualification of the proxy. A proxy appointed to attend and vote at a meeting of the Company shall have the same rights as the member to speak at the meeting.
3. A member of the Company who is an authorised nominee as defined under the Securities Industry (Central Depositories) Act 1991 may appoint at least one (1) proxy but not more than two (2) proxies in respect of each securities account it holds with shares of the Company standing to the credit of the said securities account.
4. Where a member of the Company is an exempt authorised nominee as defined under the Securities Industry (Central Depositories) Act 1991, which holds ordinary shares in the Company for multiple beneficial owners in one securities account (“omnibus account”), there is no limit to the number of proxies which the exempt authorised nominee may appoint in respect of each omnibus account it holds.
5. The instrument appointing a proxy in the case of an individual shall be signed by the appointer or his/her attorney duly authorised in writing and in the case of a corporation, the instrument appointing a proxy must be under its common seal or under the hand of an officer or attorney duly authorised.
6. The instrument appointing a proxy and the power of attorney or other authority, if any, under which it is signed (or a notarially certified copy of such power or authority) shall be deposited at the Registered Office of the Company at Level 3, East Wing, Wisma Synergy, No. 72, Pesiaran Jubli Perak, Seksyen 22, 40000 Shah Alam, Selangor Darul Ehsan not less than 48 hours before the time appointed for holding the meeting or any other adjournment thereof.
Personal Data Privacy: By submitting an instrument appointing a proxy(ies) and /or representative(s), the member accepts and agrees to the personal data privacy terms set out in the Notice of Annual General Meeting dated 30 April 2019.
ADVANCE SYNERGY BERHAD (Company No: 1225-D) Proxy Form
Please fold here
Please fold here
AFFIXSTAMP
Fold this flap for sealing
THE SECRETARY
ADVANCE SYNERGY BERHADLevel 3, East Wing, Wisma SynergyNo. 72, Pesiaran Jubli PerakSeksyen 2240000 Shah AlamSelangor Darul Ehsan


ADVANCE SYNERGY BERHAD (1225-D)
Level 3, East Wing, Wisma Synergy, 72 Pesiaran Jubli Perak, Seksyen 2240000 Shah Alam, Selangor Darul Ehsan, Malaysia