Sunway Berhad Q42019_xlsx - ChartNexus
31
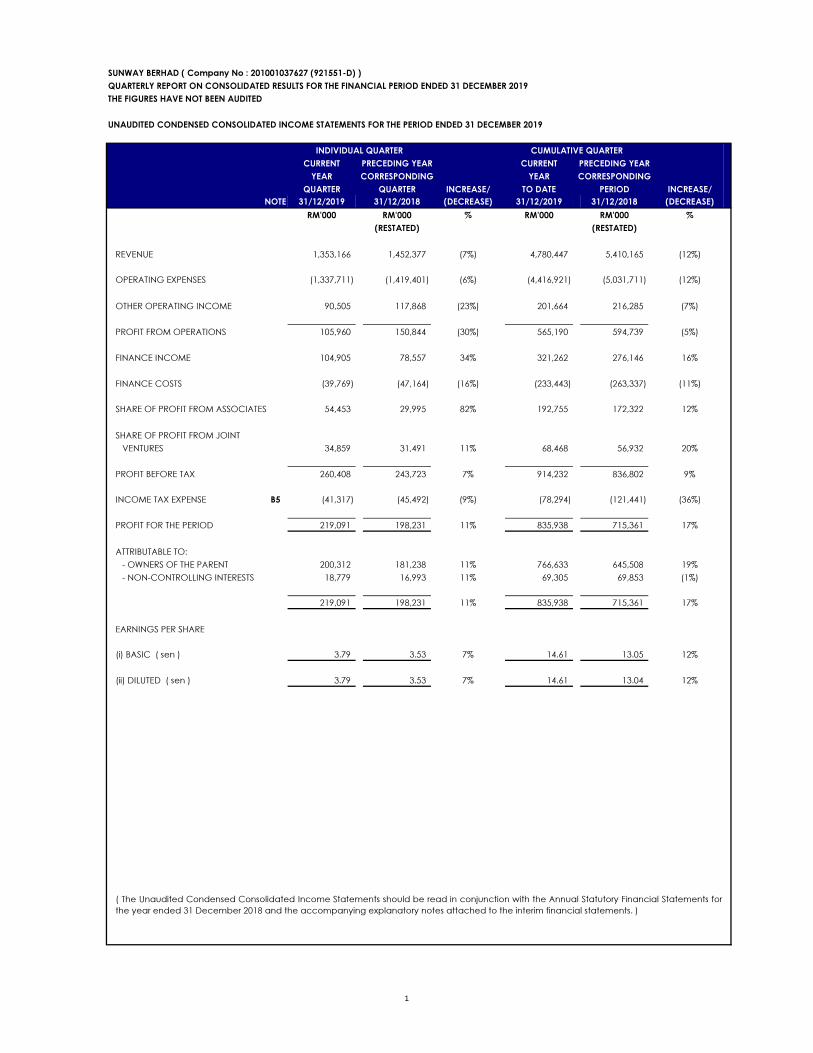
SUNWAY BERHAD ( Company No : 201001037627 (921551-D) ) QUARTERLY REPORT ON CONSOLIDATED RESULTS FOR THE FINANCIAL PERIOD ENDED 31 DECEMBER 2019 THE FIGURES HAVE NOT BEEN AUDITED UNAUDITED CONDENSED CONSOLIDATED INCOME STATEMENTS FOR THE PERIOD ENDED 31 DECEMBER 2019 CURRENT PRECEDING YEAR CURRENT PRECEDING YEAR YEAR CORRESPONDING YEAR CORRESPONDING QUARTER QUARTER INCREASE/ TO DATE PERIOD INCREASE/ NOTE 31/12/2019 31/12/2018 (DECREASE) 31/12/2019 31/12/2018 (DECREASE) RM'000 RM'000 % RM'000 RM'000 % (RESTATED) (RESTATED) REVENUE 1,353,166 1,452,377 (7%) 4,780,447 5,410,165 (12%) OPERATING EXPENSES (1,337,711) (1,419,401) (6%) (4,416,921) (5,031,711) (12%) OTHER OPERATING INCOME 90,505 117,868 (23%) 201,664 216,285 (7%) PROFIT FROM OPERATIONS 105,960 150,844 (30%) 565,190 594,739 (5%) FINANCE INCOME 104,905 78,557 34% 321,262 276,146 16% FINANCE COSTS (39,769) (47,164) (16%) (233,443) (263,337) (11%) SHARE OF PROFIT FROM ASSOCIATES 54,453 29,995 82% 192,755 172,322 12% SHARE OF PROFIT FROM JOINT VENTURES 34,859 31,491 11% 68,468 56,932 20% PROFIT BEFORE TAX 260,408 243,723 7% 914,232 836,802 9% INCOME TAX EXPENSE B5 (41,317) (45,492) (9%) (78,294) (121,441) (36%) PROFIT FOR THE PERIOD 219,091 198,231 11% 835,938 715,361 17% ATTRIBUTABLE TO: - OWNERS OF THE PARENT 200,312 181,238 11% 766,633 645,508 19% - NON-CONTROLLING INTERESTS 18,779 16,993 11% 69,305 69,853 (1%) 219,091 198,231 11% 835,938 715,361 17% EARNINGS PER SHARE (i) BASIC ( sen ) 3.79 3.53 7% 14.61 13.05 12% (ii) DILUTED ( sen ) 3.79 3.53 7% 14.61 13.04 12% INDIVIDUAL QUARTER CUMULATIVE QUARTER ( The Unaudited Condensed Consolidated Income Statements should be read in conjunction with the Annual Statutory Financial Statements for the year ended 31 December 2018 and the accompanying explanatory notes attached to the interim financial statements. ) 1
-
Upload
khangminh22 -
Category
Documents
-
view
1 -
download
0
Transcript of Sunway Berhad Q42019_xlsx - ChartNexus
SUNWAY BERHAD ( Company No : 201001037627 (921551-D) )QUARTERLY REPORT ON CONSOLIDATED RESULTS FOR THE FINANCIAL PERIOD ENDED 31 DECEMBER 2019THE FIGURES HAVE NOT BEEN AUDITED
UNAUDITED CONDENSED CONSOLIDATED INCOME STATEMENTS FOR THE PERIOD ENDED 31 DECEMBER 2019
CURRENT PRECEDING YEAR CURRENT PRECEDING YEARYEAR CORRESPONDING YEAR CORRESPONDING
QUARTER QUARTER INCREASE/ TO DATE PERIOD INCREASE/NOTE 31/12/2019 31/12/2018 (DECREASE) 31/12/2019 31/12/2018 (DECREASE)
RM'000 RM'000 % RM'000 RM'000 %(RESTATED) (RESTATED)
REVENUE 1,353,166 1,452,377 (7%) 4,780,447 5,410,165 (12%)
OPERATING EXPENSES (1,337,711) (1,419,401) (6%) (4,416,921) (5,031,711) (12%)
OTHER OPERATING INCOME 90,505 117,868 (23%) 201,664 216,285 (7%)
PROFIT FROM OPERATIONS 105,960 150,844 (30%) 565,190 594,739 (5%)
FINANCE INCOME 104,905 78,557 34% 321,262 276,146 16%
FINANCE COSTS (39,769) (47,164) (16%) (233,443) (263,337) (11%)
SHARE OF PROFIT FROM ASSOCIATES 54,453 29,995 82% 192,755 172,322 12%
SHARE OF PROFIT FROM JOINTVENTURES 34,859 31,491 11% 68,468 56,932 20%
PROFIT BEFORE TAX 260,408 243,723 7% 914,232 836,802 9%
INCOME TAX EXPENSE B5 (41,317) (45,492) (9%) (78,294) (121,441) (36%)
PROFIT FOR THE PERIOD 219,091 198,231 11% 835,938 715,361 17%
ATTRIBUTABLE TO:- OWNERS OF THE PARENT 200,312 181,238 11% 766,633 645,508 19%- NON-CONTROLLING INTERESTS 18,779 16,993 11% 69,305 69,853 (1%)
219,091 198,231 11% 835,938 715,361 17%
EARNINGS PER SHARE
(i) BASIC ( sen ) 3.79 3.53 7% 14.61 13.05 12%
(ii) DILUTED ( sen ) 3.79 3.53 7% 14.61 13.04 12%
INDIVIDUAL QUARTER CUMULATIVE QUARTER
( The Unaudited Condensed Consolidated Income Statements should be read in conjunction with the Annual Statutory Financial Statements forthe year ended 31 December 2018 and the accompanying explanatory notes attached to the interim financial statements. )
1

SUNWAY BERHAD ( Company No : 201001037627 (921551-D) )QUARTERLY REPORT ON CONSOLIDATED RESULTS FOR THE FINANCIAL PERIOD ENDED 31 DECEMBER 2019THE FIGURES HAVE NOT BEEN AUDITED
UNAUDITED CONDENSED CONSOLIDATED STATEMENTS OF COMPREHENSIVE INCOME FOR THE PERIOD ENDED 31 DECEMBER 2019
CURRENT PRECEDING YEAR CURRENT PRECEDING YEARYEAR CORRESPONDING YEAR CORRESPONDING
QUARTER QUARTER TO DATE PERIOD31/12/2019 31/12/2018 31/12/2019 31/12/2018RM'000 RM'000 RM'000 RM'000
(RESTATED) (RESTATED)
PROFIT FOR THE PERIOD 219,091 198,231 835,938 715,361
OTHER COMPREHENSIVE INCOME TO BERECLASSIFIED TO PROFIT AND LOSS INSUBSEQUENT PERIODS
FOREIGN CURRENCY TRANSLATIONDIFFERENCES FOR FOREIGN OPERATION 8,529 (7,407) 24 (69,844)
REVALUATION OF PROPERTY, PLANT AND EQUIPMENT - - 3,451 -
CASH FLOW HEDGE RESERVE - FAIR VALUE GAINS- FAIR VALUE OF DERIVATIVES 16,752 78,638 30,820 37,202 - AMOUNT RECYCLED TO PROFIT OR LOSS (17,529) (76,325) (29,674) (37,029)
OTHER COMPREHENSIVE INCOME NOT TO BERECLASSIFIED TO PROFIT AND LOSS INSUBSEQUENT PERIODS
REVALUATION OF OTHER INVESTMENT - (8,906) 37,045 (8,906)
OTHER COMPREHENSIVE INCOMEFOR THE PERIOD 7,752 (14,000) 41,666 (78,577)
TOTAL COMPREHENSIVE INCOME FOR THE PERIOD 226,843 184,231 877,604 636,784
ATTRIBUTABLE TO:- OWNERS OF THE PARENT 208,550 167,928 809,102 567,020 - NON-CONTROLLING INTERESTS 18,293 16,303 68,502 69,764
226,843 184,231 877,604 636,784
INDIVIDUAL QUARTER CUMULATIVE QUARTER
( The Unaudited Condensed Consolidated Statement of Comprehensive Income should be read in conjunction with the Annual StatutoryFinancial Statements for the year ended 31 December 2018 and the accompanying explanatory notes attached to the interim financialstatements.)
2

SUNWAY BERHAD ( Company No : 201001037627 (921551-D) )QUARTERLY REPORT ON CONSOLIDATED RESULTS FOR THE FINANCIAL PERIOD ENDED 31 DECEMBER 2019THE FIGURES HAVE NOT BEEN AUDITED
FINANCIAL REVIEW FOR CURRENT QUARTER COMPARED WITH IMMEDIATE PRECEDING QUARTER
IMMEDIATECURRENT PRECEDINGQUARTER QUARTER INCREASE/31/12/2019 30/9/2019 (DECREASE)RM'000 RM'000 %
REVENUE 1,353,166 1,226,494 10%
OPERATING EXPENSES (1,337,711) (1,066,582) 25%
OTHER OPERATING INCOME 90,505 14,280 534%
PROFIT FROM OPERATIONS 105,960 174,192 (39%)
FINANCE INCOME 104,905 67,044 56%
FINANCE COSTS (39,769) (65,974) (40%)
SHARE OF PROFIT FROM ASSOCIATES 54,453 37,424 46%
SHARE OF PROFIT FROM JOINTVENTURES 34,859 10,631 228%
PROFIT BEFORE TAX 260,408 223,317 17%
INCOME TAX EXPENSE (41,317) (21,058) 96%
PROFIT FOR THE PERIOD 219,091 202,259 8%
ATTRIBUTABLE TO:- OWNERS OF THE PARENT 200,312 183,418 9%- NON-CONTROLLING INTERESTS 18,779 18,841 (0%)
219,091 202,259 8%
EARNINGS PER SHARE
(i) BASIC ( sen ) 3.79 3.43 11%
(ii) DILUTED ( sen ) 3.79 3.43 11%
( The Unaudited Condensed Consolidated Income Statements should be read in conjunction with the Annual Statutory FinancialStatements for the year ended 31 December 2018 and the accompanying explanatory notes attached to the interim financialstatements. )
3

SUNWAY BERHAD ( Company No : 201001037627 (921551-D) )QUARTERLY REPORT ON CONSOLIDATED RESULTS FOR THE FINANCIAL PERIOD ENDED 31 DECEMBER 2019THE FIGURES HAVE NOT BEEN AUDITED
FINANCIAL REVIEW FOR CURRENT QUARTER COMPARED WITH IMMEDIATE PRECEDING QUARTER
IMMEDIATECURRENT PRECEDINGQUARTER QUARTER31/12/2019 30/9/2019RM'000 RM'000
PROFIT FOR THE PERIOD 219,091 202,259
OTHER COMPREHENSIVE INCOME TO BERECLASSIFIED TO PROFIT AND LOSS INSUBSEQUENT PERIODS
FOREIGN CURRENCY TRANSLATIONDIFFERENCES FOR FOREIGN OPERATION 8,529 (19,254)
CASH FLOW HEDGE RESERVE - FAIR VALUE GAINS- FAIR VALUE OF DERIVATIVES 16,752 (4,517) - AMOUNT RECYCLED TO PROFIT OR LOSS (17,529) 4,469
OTHER COMPREHENSIVE INCOMEFOR THE PERIOD 7,752 (19,302)
TOTAL COMPREHENSIVE INCOME FOR THE PERIOD 226,843 182,957
ATTRIBUTABLE TO:- OWNERS OF THE PARENT 208,550 164,372 - NON-CONTROLLING INTERESTS 18,293 18,585
226,843 182,957
( The Unaudited Condensed Consolidated Income Statements should be read in conjunction with the Annual StatutoryFinancial Statements for the year ended 31 December 2018 and the accompanying explanatory notes attached to theinterim financial statements. )
4

SUNWAY BERHAD ( Company No : 201001037627 (921551-D) )QUARTERLY REPORT ON CONSOLIDATED RESULTS FOR THE FINANCIAL PERIOD ENDED 31 DECEMBER 2019THE FIGURES HAVE NOT BEEN AUDITED
UNAUDITED CONDENSED CONSOLIDATED STATEMENTS OF FINANCIAL POSITION AS AT 31 DECEMBER 2019
AS AT END OFCURRENT QUARTER
31/12/2019 31/12/2018 1/1/2018RM'000 RM'000 RM'000
(RESTATED) (RESTATED)ASSETS
Non-current assetsProperty, plant and equipment 2,753,404 2,627,664 2,247,264 Intangible assets 19,833 17,748 15,333 Investment properties 2,320,492 1,942,744 2,066,760 Inventories 1,674,009 1,671,311 1,682,127 Investment in associates 2,123,889 2,084,029 1,886,876 Investment in joint ventures 1,627,947 1,306,632 1,741,727 Goodwill 311,666 313,893 311,814 Deferred tax assets 66,727 110,342 102,066 Receivables 2,378,322 1,916,715 1,304,832 Derivative assets - - 34,181 Rock reserves 5,607 5,868 6,131 Other investments 5,023 122,397 813 Biological assets 121 234 616
13,287,040 12,119,577 11,400,540 Current assets
Contract assets 76,230 100,765 104,660 Inventories 2,100,946 1,857,935 1,788,430 Receivables, deposits & prepayments 2,122,019 1,946,459 2,098,815 Cash and bank balances, and placement in funds 5,888,764 5,136,032 4,418,604 Tax recoverable 81,043 68,792 57,474 Derivative assets 1,925 64,629 68,378
10,270,927 9,174,612 8,536,361
Assets of disposal group classified as held for sale - 486,128 294,283
TOTAL ASSETS 23,557,967 21,780,317 20,231,184
EQUITY AND LIABILITIES
Current liabilitiesPayables, accruals & other current liabilities 2,653,132 2,671,907 2,712,274 Contract liabilities 43,529 33,772 34,669 Bank borrowings 7,416,821 6,337,460 4,911,049 Lease liabilities 68,841 80,932 67,969 Taxation 7,143 33,555 26,662 Derivative liabilities 17,882 17,227 48,315
10,207,348 9,174,853 7,800,938
Non-current liabilitiesLong term bank borrowings 2,153,739 2,535,754 2,868,344 Lease liabilities 764,791 809,861 763,061 Other long term liabilities 128,652 128,993 258,013 Derivative liabilities 35 36 4,496 Deferred taxation 129,862 146,907 121,331
3,177,079 3,621,551 4,015,245
Total liabilities 13,384,427 12,796,404 11,816,183
Equity attributable to Owners of the ParentShare capital 5,393,666 5,379,437 5,370,606 Treasury shares (53,324) (140,299) (63,817) Reserves 3,051,858 2,725,668 2,487,247
8,392,200 7,964,806 7,794,036 PERPETUAL SUKUK 1,150,000 400,000 - NON-CONTROLLING INTERESTS 631,340 619,107 620,965 Total equity 10,173,540 8,983,913 8,415,001
TOTAL EQUITY AND LIABILITIES 23,557,967 21,780,317 20,231,184
Number of ordinary shares ('000) 4,933,931 4,924,402 4,918,491
1.70 1.62 1.58 Net Assets Per Share Attributable To Owners Of The Parent (RM)
AS AT PRECEDINGFINANCIAL PERIOD END
(The Unaudited Condensed Consolidated Statements of Financial Position should be read in conjunction with the Annual Statutory Financial Statements forthe year ended 31 December 2018 and the accompanying explanatory notes attached to the interim financial statements.)
5

SUNWAY BERHAD ( Company No : 201001037627 (921551-D) )QUARTERLY REPORT ON CONSOLIDATED RESULTS FOR THE FINANCIAL PERIOD ENDED 31 DECEMBER 2019THE FIGURES HAVE NOT BEEN AUDITED
UNAUDITED CONDENSED CONSOLIDATED STATEMENTS OF CHANGES IN EQUITY FOR THE PERIOD ENDED 31 DECEMBER 2019
DISTRIBUTABLE TOTALEQUITY
ATTRIBUTABLENEGATIVE FOREIGN SHARE CASH FLOW FURNITURE TO OWNERS NON-
SHARE TREASURY MERGER EXCHANGE OPTION HEDGE & FITTINGS OTHER RETAINED TOTAL OF THE PERPETUAL CONTROLLING TOTALCAPITAL SHARES RESERVE RESERVE RESERVE RESERVE RESERVE RESERVES PROFITS RESERVES PARENT SUKUK INTERESTS EQUITYRM'000 RM'000 RM'000 RM'000 RM'000 RM'000 RM'000 RM'000 RM'000 RM'000 RM'000 RM'000 RM'000 RM'000
PERIOD ENDED 31 DECEMBER 2019At 1 January 2019 5,379,437 (140,299) (1,192,040) 130,421 7,632 (17,681) 16,233 182,306 3,708,354 2,835,225 8,074,363 400,000 619,826 9,094,189 Effects of adopting MFRS 128 - - - - - - - - (132) (132) (132) - - (132) Effects of adopting MFRS 16 - - - - - - - - (109,557) (109,557) (109,557) - (719) (110,276) At 1 January 2019 5,379,437 (140,299) (1,192,040) 130,421 7,632 (17,681) 16,233 182,306 3,598,665 2,725,536 7,964,674 400,000 619,107 8,983,781
Profit for the year - - - - - - - - 766,633 766,633 766,633 - 69,305 835,938 Other comprehensive income - - - 590 - 1,146 - 40,733 - 42,469 42,469 - (803) 41,666 Total comprehensive income - - - 590 - 1,146 - 40,733 766,633 809,102 809,102 - 68,502 877,604
Issuance of perpetual sukuk - - - - - - - - - - - 750,000 - 750,000 Issuance of ordinary shares pursuant to- exercise of ESOS 14,211 - - - (2,857) - - - - (2,857) 11,354 - - 11,354 - exercise of warrants 18 - - - - - - - - - 18 - - 18 Reversal of share options granted under ESOS - - - - (4,775) - - - 3,170 (1,605) (1,605) - - (1,605) Share buy back by a subsidiary - - - - - - - - (2,357) (2,357) (2,357) - (3,337) (5,694) Purchase of treasury shares during the year - (91,926) - - - - - - - - (91,926) - - (91,926) Dividends declared - 178,901 - - - - - - (421,759) (421,759) (242,858) - - (242,858) Dividends paid to non-controlling interests - - - - - - - - - - - - (65,023) (65,023) Acquisition of subsidiary - - - - - - - - - - - - 14,200 14,200 Shares acquired by non-controlling interest - - - - - - - - (427) (427) (427) - 3,204 2,777 Acquisition of equity interest from non-controlling interest - - - - - - - - 836 836 836 - (5,436) (4,600) Transfer to statutory reserve - - - - - - - 305 (428) (123) (123) - 123 - Transfer to furniture & fittings reserve - - - - - - 4,336 - (4,336) - - - - - Distribution paid to holders of perpetual sukuk - - - - - - - - (54,488) (54,488) (54,488) - - (54,488) Effect of disposal of other investment fair valuedthrough other comprehensive income - - - - - - - (28,139) 28,139 - - - - - At 31 December 2019 5,393,666 (53,324) (1,192,040) 131,011 - (16,535) 20,569 195,205 3,913,648 3,051,858 8,392,200 1,150,000 631,340 10,173,540
PERIOD ENDED 31 DECEMBER 2018At 1 January 2018 5,370,606 (63,817) (1,192,040) 200,176 10,596 (17,854) 12,536 190,873 3,379,642 2,583,929 7,890,718 - 621,526 8,512,244 Effects of adopting MFRS 16 - - - - - - - (96,682) (96,682) (96,682) - (561) (97,243) At 1 January 2018 5,370,606 (63,817) (1,192,040) 200,176 10,596 (17,854) 12,536 190,873 3,282,960 2,487,247 7,794,036 - 620,965 8,415,001
Profit for the year - - - - - - - - 645,508 645,508 645,508 - 69,853 715,361 Other comprehensive income - - - (69,755) - 173 - (8,906) - (78,488) (78,488) - (89) (78,577) Total comprehensive income - - - (69,755) - 173 - (8,906) 645,508 567,020 567,020 - 69,764 636,784
Issuance of ordinary shares pursuant to- exercise of ESOS 8,831 - - - (1,897) - - - - (1,897) 6,934 - - 6,934 - exercise of warrants - ^ - - - - - - - - - - ^ - - - ^Reversal of share options granted under ESOS - - - - (1,067) - - - - (1,067) (1,067) - - (1,067) Purchase of treasury shares during the year - (76,482) - - - - - - - - (76,482) - - (76,482) Dividends declared - - - - - - - - (316,493) (316,493) (316,493) - - (316,493) Dividends paid to non-controlling interests - - - - - - - - - - - - (65,780) (65,780) Share acquired by non-controlling interests - - - - - - - - (210) (210) (210) - 2,604 2,394 Acquisition of equity interest from non-controlling interest - - - - - - - (14) 874 860 860 - (8,443) (7,583) Distribution paid to holders of perpetual sukuk - - - - - - - - (9,795) (9,795) (9,795) - - (9,795) Issuance of perpetual sukuk - - - - - - - - - - - 400,000 - 400,000 Transfer to statutory reserve - - - - - - - 353 (350) 3 3 - (3) - Transfer to furniture & fittings reserve - - - - - - 3,697 - (3,697) - - - - - At 31 December 2018 5,379,437 (140,299) (1,192,040) 130,421 7,632 (17,681) 16,233 182,306 3,598,797 2,725,668 7,964,806 400,000 619,107 8,983,913
^ Represents 202 warrants amounting to RM376.
l------------------------------------------ATTRIBUTABLE TO OWNERS OF THE PARENT---------------------------------------------------l
RESERVESl--------------------------------NON-DISTRIBUTABLE-------------------------------------l
( The Unaudited Condensed Consolidated Statements of Changes in Equity should be read in conjunction with the Annual Statutory Financial Statements for the year ended 31 December 2018 and the accompanying explanatory notes attached to the interim financialstatements.)
6

SUNWAY BERHAD ( Company No : 201001037627 (921551-D) )QUARTERLY REPORT ON CONSOLIDATED RESULTS FOR THE FINANCIAL PERIOD ENDED 31 DECEMBER 2019THE FIGURES HAVE NOT BEEN AUDITED
UNAUDITED CONDENSED CONSOLIDATED STATEMENT OF CASH FLOWS FOR THE PERIOD ENDED 31 DECEMBER 2019
FOR THE FOR THE12 MONTHS 12 MONTHSPERIOD PERIODENDED ENDED
31/12/2019 31/12/2018RM'000 RM'000
(RESTATED)CASH FLOWS FROM OPERATING ACTIVITIESProfit before tax 914,232 836,802 Adjustments for:- non-cash items (102,029) (62,009) - finance costs 233,443 263,337 - finance income (321,262) (276,146) Operating cash flows before working capital changes 724,384 761,984 Changes in working capital (176,807) (181,641) Cash flow generated from operations 547,577 580,343 Interest received 321,262 277,212 Dividend received from joint ventures, associates and other investments 147,170 178,051 Tax refunded 33,969 - Tax paid (124,690) (109,186) Net cash flow generated from operating activities 925,288 926,420
CASH FLOWS FROM INVESTING ACTIVITIESProceeds from disposal of property, plant and equipment and biological assets 30,765 3,583 Proceeds from disposal of intangible assets 18 7 Proceeds from disposal of non-current assets held for sale 496,420 394,308 Proceeds from disposal of joint venture - 122,832 Proceeds from disposal of shares to non-controlling interest 2,777 2,394 Proceeds from disposal of other investments 162,114 - Net cash flow from disposal of subsidiaries 3 5,372 Acquisition of other investment (9,952) (130,490) Acquisition of land (146,807) (274,285) Acquisition of property, plant and equipment, and biological assets (335,901) (464,091) Acquisition of intangible assets (10,063) (10,655) Acquisition of goodwill - (2,079) Acquisition of subsidiaries (73,653) 15 Acquisition and subsequent expenditure of investment properties (344,566) (64,103) Acquisition of equity interest from non-controlling interest (4,600) (7,583) Investment in joint ventures (4,233) (52,563) Investment in associates (200) (191,388) Advances to associates and joint ventures (401,070) (619,081) Quasi-equity loan repaid by/(advanced to) joint venture (285,468) 353,115 Proceeds on liquidation of subsidiary 254 - Net cash generated used in investing activities (924,162) (934,692)
CASH FLOWS FROM FINANCING ACTIVITIESNet bank borrowings 667,142 651,891 Net lease liabilities (78,005) (30,560) Issue of ordinary shares pursuant to exercise of warrants 18 - Interest paid (233,443) (263,337) Proceeds from issue of shares from exercise of ESOS 11,354 6,934 Shares buyback (97,620) (76,482) Dividend paid to shareholders (242,858) (316,493) Dividend paid to non-controlling interests of subsidiaries (65,023) (65,780) Repayment from non-controlling interests of subsidiaries 1,222 - Issuance of perpetual bonds 750,000 400,000 Distribution paid to holders of perpetual sukuk (54,488) (9,795) Net cash generated from financing activities 658,299 296,378
NET INCREASE IN CASH AND CASH EQUIVALENTS 659,425 288,106 EFFECTS OF EXCHANGE RATE CHANGES 3,413 (17,124) CASH AND CASH EQUIVALENTS AT BEGINNING OF PERIOD 2,507,882 2,236,900 CASH AND CASH EQUIVALENTS AT END OF FINANCIAL PERIOD 3,170,720 2,507,882
Bank overdrafts 191,340 101,446 Short-term investments 2,526,704 2,526,704 Cash and bank balances, and placement in funds 5,888,764 5,136,032
(The Unaudited Condensed Consolidated Statements of Cash Flow should be read in conjunction with the Annual Statutory FinancialStatements for the year ended 31 December 2018 and the accompanying explanatory notes attached to the interim financial statements.)
7

NOTES TO FINANCIAL STATEMENTS
A1 Accounting Policies and Basis of Preparation
MFRS 16 LeasesIC Interpretation 23 Uncertainty over Income Tax TreatmentsAmendments to MFRS 128 Long-term Interests in Associates and Joint VenturesAmendments to MFRS 9 Prepayment Features with Negative CompensationAmendments to MFRS 3 Annual Improvements to MFRS Standards 2015-2017 CycleAmendments to MFRS 11 Annual Improvements to MFRS Standards 2015-2017 CycleAmendments to MFRS 112 Annual Improvements to MFRS Standards 2015-2017 CycleAmendments to MFRS 123 Annual Improvements to MFRS Standards 2015-2017 CycleAmendments to MFRS 119 Plan Amendment, Curtailment or SettlementAmendments to MFRS 9, MFRS 139 Interest Rate Benchmark Reform
and MFRS 7
MFRS 16 - Leases
Lease liabilities arising from the premises and equipment are recognised and discounted using the weighted averageincremental borrowing rate of the Group of 5.41% - 5.71%. Subsequent to initial recognition, the Group measure the leaseliabilities by increasing the carrying amount to reflect the interest on the lease liabilities, reducing the carrying amount toreflect lease payments made and remeasuring the carrying amount to reflect any reassessment or lease modifications.
The accounting policies and methods of computation adopted by the Group in this interim financial report are consistentwith those adopted in the annual financial statements for the financial year ended 31 December 2018 except for theadoption of the following new MFRSs, amendments to MFRSs and IC Interpretations that are effective for financialstatements effective from 1 January 2019, as disclosed below:
The interim financial report is unaudited and is prepared in accordance with MFRS134 "Interim Financial Reporting" andparagraph 9.22 of the Bursa Malaysia Securities Berhad Listing Requirements.
The Group has prepared its financial statements using the Malaysian Financial Reporting Standards ("MFRS") for thefinancial period ending 31 December 2019.
The adoption of the above pronouncements does not have any significant impact to the Group except for the following:
As a result of the adoption of MFRS 16, the existing requirements for a lessee to distinguish between finance leases andoperating leases under the MFRS 117 are no longer required. This Standard introduces a single accounting model,requiring the lessee to recognise the right-of-use of the underlying lease asset and the future lease payments liabilities inthe statements of financial position. For a lessor, MFRS 16 continues to allow the lessor to classify leases as eitheroperating leases or finance leases and to account for these two types of leases differently.
Right-of-use assets comprise premises and equipment. Subsequent to initial recognition, the right-of-use assets aremeasured at cost less any accumulated depreciation, accumulated impairment losses and adjusted for any remeasurementof lease liabilities. The right-of-use assets are measured at an amount equal to the lease liabilities.
The interim financial statements should be read in conjunction with the audited financial statements for the year ended 31December 2018. These explanatory notes attached to the interim financial statements provide an explanation of eventsand transactions that are significant to an understanding of the changes in the financial position and performance of theGroup since the year ended 31 December 2018.
8
NOTES TO FINANCIAL STATEMENTS
A1 Accounting Policies and Basis of Preparation (contd.)
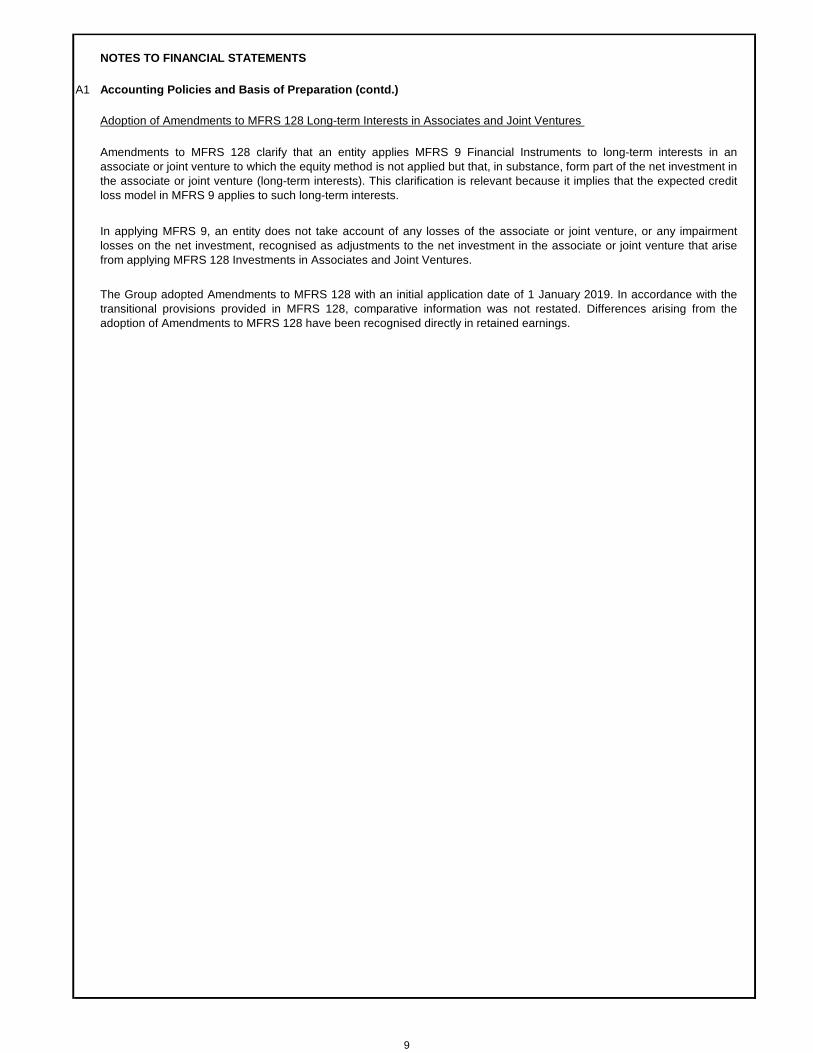
Adoption of Amendments to MFRS 128 Long-term Interests in Associates and Joint Ventures
Amendments to MFRS 128 clarify that an entity applies MFRS 9 Financial Instruments to long-term interests in anassociate or joint venture to which the equity method is not applied but that, in substance, form part of the net investment inthe associate or joint venture (long-term interests). This clarification is relevant because it implies that the expected creditloss model in MFRS 9 applies to such long-term interests.
In applying MFRS 9, an entity does not take account of any losses of the associate or joint venture, or any impairmentlosses on the net investment, recognised as adjustments to the net investment in the associate or joint venture that arisefrom applying MFRS 128 Investments in Associates and Joint Ventures.
The Group adopted Amendments to MFRS 128 with an initial application date of 1 January 2019. In accordance with thetransitional provisions provided in MFRS 128, comparative information was not restated. Differences arising from theadoption of Amendments to MFRS 128 have been recognised directly in retained earnings.
9

(i) Reconciliation of profit of loss
As As
previously Prior year Effects of previously Prior year Effects of
stated restatements MFRS 16 Restated stated restatements MFRS 16 Restated
RM'000 RM'000 RM'000 RM'000 RM'000 RM'000 RM'000 RM'000
Revenue 1,370,082 82,295 - 1,452,377 5,410,165 - - 5,410,165
Operating expenses (1,383,671) (44,696) 8,966 (1,419,401) (5,067,247) - 35,536 (5,031,711)
Other operating income 117,027 841 - 117,868 216,285 - - 216,285
Profit from operations 103,438 38,440 8,966 150,844 559,203 - 35,536 594,739
Finance income 98,432 (19,875) - 78,557 276,146 - - 276,146
Finance cost (12,984) (21,675) (12,505) (47,164) (214,560) - (48,777) (263,337)
Share of profit from associates 29,995 - - 29,995 172,322 - - 172,322
Share of profit from joint ventures 34,101 (2,610) - 31,491 56,932 - - 56,932
Profit before tax 252,982 (5,720) (3,539) 243,723 850,043 - (13,241) 836,802
Income tax expense (44,737) - (755) (45,492) (121,649) - 208 (121,441)
Profit after tax 208,245 (5,720) (4,294) 198,231 728,394 - (13,033) 715,361
Attributable to:
- Owners of the parent 191,714 (6,208) (4,268) 181,238 658,383 - (12,875) 645,508
- Non-controlling interests 16,531 488 (26) 16,993 70,011 - (158) 69,853
208,245 (5,720) (4,294) 198,231 728,394 - (13,033) 715,361
Earnings per share:
- Basic 3.75 3.53 13.32 13.05
- Diluted 3.75 3.53 13.30 13.04
Individual quarter ended31 December 2018
Cumulative quarter ended31 December 2018
10

(ii) Reconciliation of comprehensive income
As As
previously Prior year Effects of previously Prior year Effects of
stated restatements MFRS 16 Restated stated restatements MFRS 16 Restated
RM'000 RM'000 RM'000 RM'000 RM'000 RM'000 RM'000 RM'000
Profit for the period 208,245 (5,720) (4,294) 198,231 728,394 - (13,033) 715,361
Other comprehensive income to be
reclassified to profit and loss in
subsequent periods
Foreign currency translation
differences for foreign operation (7,407) - - (7,407) (69,844) - - (69,844)
Cash flow hedge reserve- fair value gains -
- Fair value of derivatives 78,638 - - 78,638 37,202 - - 37,202
- Amount recycled to profit or loss (76,325) - - (76,325) (37,029) - - (37,029)
Other comprehensive income not to be
reclassified to profit and loss in
subsequent periods
Revaluation of other investment (8,906) - - (8,906) (8,906) - - (8,906)
(14,000) - - (14,000) (78,577) - - (78,577)
Total comprehensive income for
the period 194,245 (5,720) (4,294) 184,231 649,817 - (13,033) 636,784
Attributable to:
- Owners of the parent 178,404 (6,208) (4,268) 167,928 579,895 - (12,875) 567,020
- Non-controlling interests 15,841 488 (26) 16,303 69,922 - (158) 69,764
194,245 (5,720) (4,294) 184,231 649,817 - (13,033) 636,784
Individual quarter ended31 December 2018
Cumulative quarter ended31 December 2018
11

(iii) Reconciliation of financial position and equity
As As
previously Effects of previously Effects of
stated MFRS 16 Restated stated MFRS 16 Restated
RM'000 RM'000 RM'000 RM'000 RM'000 RM'000
Non-current assetsProperty, plant and equipment 1,522,895 724,369 2,247,264 1,856,860 770,804 2,627,664
Investment in joint venture 1,741,727 - 1,741,727 1,306,632 - 1,306,632
Deferred tax assets 100,828 1,238 102,066 108,896 1,446 110,342
Other non-current assets 7,309,483 - 7,309,483 8,074,939 - 8,074,939
10,674,933 725,607 11,400,540 11,347,327 772,250 12,119,577
Current assets 8,536,361 - 8,536,361 9,174,612 - 9,174,612
Assets of disposal group
classified as held for sale 294,283 - 294,283 486,128 - 486,128
TOTAL ASSETS 19,505,577 725,607 20,231,184 21,008,067 772,250 21,780,317
Current liabilitiesPayables, accruals &
other current liabilities 2,720,454 (8,180) 2,712,274 2,680,174 (8,267) 2,671,907
Lease liabilities - 67,969 67,969 - 80,932 80,932
Other current liabilities 5,020,695 - 5,020,695 6,422,014 - 6,422,014
7,741,149 59,789 7,800,938 9,102,188 72,665 9,174,853
Non-current laitiesLease liabilities - 763,061 763,061 - 809,861 809,861
Other non-current liabilities 3,252,184 - 3,252,184 2,811,690 - 2,811,690
Non-current liabilities 3,252,184 763,061 4,015,245 2,811,690 809,861 3,621,551
Total liabilities 10,993,333 822,850 11,816,183 11,913,878 882,526 12,796,404
Equity attributable to Ownersof the ParentShare capital 5,370,606 - 5,370,606 5,379,437 - 5,379,437
Treasury shares (63,817) - (63,817) (140,299) - (140,299)
Reserves 2,583,929 (96,682) 2,487,247 2,835,225 (109,557) 2,725,668
7,890,718 (96,682) 7,794,036 8,074,363 (109,557) 7,964,806
Perpetual sukuk - - - 400,000 - 400,000
Non-controlling interest 621,526 (561) 620,965 619,826 (719) 619,107
Total equity 8,512,244 (97,243) 8,415,001 9,094,189 (110,276) 8,983,913
TOTAL LIABILITIES AND EQUITY 19,505,577 725,607 20,231,184 21,008,067 772,250 21,780,317
Net Assets Per ShareAttributable To Owners OfThe Parent (RM) 1.60 1.58 1.64 1.62
As at 1 January 2018 As at 31 December 2018
12

A2 Report of the Auditors
A3 Seasonal or Cyclical Factors
A4 Unusual Items
A5 Changes in Estimates
A6 Issuances, Cancellations, Repurchases, Resale and Repayments of Debts and Equity Securities
(a)
(b) the repurchase of equity securities of 55,042,100 ordinary shares, at an average price of RM1.67 per share.
A7 Dividend Paid
(a)
(b)
(c)
(d)
RM145,980,202 was paid on 17 October 2019 as first interim dividend of 3 sen per ordinary share for the financial year ended31 December 2019.
A share dividend distribution of approximately 48.6 million shares was distributed on 17 October 2019 on the basis of 1 treasuryshare for every 100 existing ordinary shares held.
A share dividend distribution of approximately 48.4 million shares was distributed on 18 April 2019 on the basis of 1 treasuryshare for every 100 existing ordinary shares held.
RM96,878,406 was paid on 18 April 2019 as second interim dividend of 2 sen per ordinary share for the financial year ended 31December 2018.
Dividend payments made since the last financial year end are as follows:
Save for the above, there was no issuance, cancellations, repurchases, resale and repayments of debt and equity securities for thecurrent period under review.
issuance of 9,518,465 ordinary shares pursuant to the exercise of the Employees' Share Option Scheme; and
The report of the auditors of preceding annual financial statements was not subject to any qualification.
There were no material unusual items affecting the amounts reported for the current quarter ended 31 December 2019.
The results for the current quarter under review were not materially affected by seasonal or cyclical factors except for the leisure and hospitality segments which normally peaks during major festive seasons and holidays.
There were no changes in estimates that have a material effect on the amounts reported for the current quarter ended 31 December2019.
During the financial period ended 31 December 2019, the Company increased its issued and paid up ordinary share capital by wayof:
13

A8 Segmental ReportingSegmental results for the financial period ended 31 December 2019 are as follows:
Property Property Trading and Investment Adjustments/
Development Investment Construction Manufacturing Quarry Healthcare Holdings Others eliminations Consolidated
Division
RM'000 RM'000 RM'000 RM'000 RM'000 RM'000 RM'000 RM'000 RM'000 RM'000
BY BUSINESS SEGMENTS
REVENUE AND EXPENSES
RevenueSales to external customers 545,852 803,468 1,273,269 959,762 348,114 584,833 5,187 259,962 - 4,780,447
Inter-segment revenue 52,872 220,675 1,394,806 135,857 26,340 3,807 936,801 75,568 (2,846,726) -
Total revenue 598,724 1,024,143 2,668,075 1,095,619 374,454 588,640 941,988 335,530 (2,846,726) 4,780,447
Results
Operating segment results 163,331 239,331 144,461 41,053 12,644 59,227 (73,419) (21,438) - 565,190
Finance income 52,806 50,086 26,204 10,874 6,781 22,242 172,979 11,543 (32,253) 321,262
Finance costs (21,231) (157,584) (13,235) (20,504) (2,696) (19,654) (19,704) (11,088) 32,253 (233,443)
Share of results of:
- associated companies 4 187,527 4,802 - - - - 422 - 192,755
- joint ventures 51,401 16,968 99 - - - - - - 68,468
Profit before taxation 246,311 336,328 162,331 31,423 16,729 61,815 79,856 (20,561) - 914,232
Taxation (42,698) 4,168 (25,519) (6,102) (1,632) (31) (1,454) (5,026) - (78,294)
Profit for the period 203,613 340,496 136,812 25,321 15,097 61,784 78,402 (25,587) - 835,938
Non controlling interests (5,474) (3,185) (57,541) (2,539) (1,092) (567) (18) 1,111 - (69,305)
Attributable to owners of the parent 198,139 337,311 79,271 22,782 14,005 61,217 78,384 (24,476) - 766,633
RevenueProfit before
taxProfit after tax
Attributable to owners of the
parentRM'000 RM'000 RM'000 RM'000
BY GEOGRAPHICAL SEGMENTS
Malaysia 4,299,579 833,852 760,105 690,362
Singapore 197,389 (7,284) (6,427) (5,688)
China 150,458 61,098 60,164 59,849
Australia 29,152 (402) (3,937) (4,328)
Indonesia 50,209 1,345 1,284 1,284
Other countries 53,660 25,623 24,749 25,154
4,780,447 914,232 835,938 766,633
14

Segmental results by foreign currency for the financial period ended 31 December 2019 are as follows:
PROPERTY DEVELOPMENT SEGMENT:
Revenue Profit before tax Profit after taxAttributable to owners of the
parentRevenue Profit before tax Profit after tax
Attributable to owners of the
parent
Malaysia Ringgit (RM'000) 534,192 189,764 147,395 142,323 534,192 189,764 147,395 142,323
Australian Dollar (AUD'000) - 366 253 114 - 1,059 732 329
Hong Kong Dollar (HKD'000) - (1,808) (1,808) (1,808) - (957) (957) (957)
India Rupee (INR'000) - (51) (51) (51) - (3) (3) (3)
China Yuan Renminbi (RMB'000) 19,401 98,003 98,003 98,003 11,660 58,900 58,900 58,900
Singapore Dollar (SGD'000) - (802) (803) (803) - (2,443) (2,445) (2,445)
US Dollar (USD'000) - (2) (2) (2) - (9) (9) (8)
545,852 246,311 203,613 198,139
PROPERTY INVESTMENT DIVISION SEGMENT:
Malaysia Ringgit (RM'000) 780,183 315,218 319,521 316,554 780,183 315,218 319,521 316,554
Hong Kong Dollar (HKD'000) - 8 8 8 - 4 4 4
US Dollar (USD'000) 3,267 114 104 55 13,547 472 433 227
Vietnam Dong (VND'000,000) 42,530 4,051 4,051 4,051 7,591 723 723 723
803,468 336,328 340,496 337,311
CONSTRUCTION SEGMENT:
Malaysia Ringgit (RM'000) 1,122,613 166,292 139,803 80,902 1,122,613 166,292 139,803 80,902
United Arab Emirates Dirham (AED'000) - 4,501 4,501 2,456 - 5,093 5,093 2,779
India Rupee (INR'000) 14,325 (106,865) (109,737) (59,864) 843 (6,289) (6,458) (3,523)
Singapore Dollar (SGD'000) 49,201 (908) (534) (291) 149,813 (2,765) (1,626) (887)
1,273,269 162,331 136,812 79,271
TRADING & MANUFACTURING SEGMENT:
Malaysia Ringgit (RM'000) 700,179 20,962 19,900 17,883 700,179 20,962 19,900 17,883
Australian Dollar (AUD'000) 10,088 (499) (1,608) (1,608) 29,152 (1,443) (4,648) (4,648)
Indonesia Rupiah (IDR'000,000) 170,924 4,579 4,371 4,371 50,209 1,345 1,284 1,284
China Yuan Renminbi (RMB'000) 171,644 8,314 6,775 5,907 103,158 4,997 4,072 3,550
Singapore Dollar (SGD'000) 15,610 1,035 942 942 47,531 3,150 2,869 2,869
Thai Baht (THB'000) 214,172 22,356 18,119 18,119 28,711 2,997 2,429 2,429
Vietnam Dong (VND'000,000) 4,605 (3,278) (3,278) (3,278) 822 (585) (585) (585)
959,762 31,423 25,321 22,782
QUARRY SEGMENT:
Malaysia Ringgit (RM'000) 348,114 16,692 15,060 13,968 348,114 16,692 15,060 13,968 Trinidad & Tobago Dollar (TTD'000) - 60 60 60 - 37 37 37
348,114 16,752 15,120 14,028 348,114 16,729 15,097 14,005
HEALTHCARE SEGMENT:
Malaysia Ringgit (RM'000) 584,788 63,770 63,739 63,172 584,788 63,770 63,739 63,172
Singapore Dollar (SGD'000) 15 (642) (642) (642) 45 (1,955) (1,955) (1,955)
584,833 61,815 61,784 61,217
INVESTMENT HOLDING SEGMENT:
Malaysia Ringgit (RM'000) 3,272 78,308 76,863 76,845 3,272 78,308 76,863 76,845
Hong Kong Dollar (HKD'000) - 1,088 1,071 1,071 - 576 567 567
China Yuan Renminbi (RMB'000) 3,186 1,617 1,617 1,617 1,915 972 972 972
5,187 79,856 78,402 78,384
OTHERS SEGMENT:
Malaysia Ringgit (RM'000) 226,237 (17,176) (22,202) (21,299) 226,237 (17,176) (22,202) (21,299)
China Yuan Renminbi (RMB'000) 56,115 (5,632) (5,632) (5,286) 33,725 (3,385) (3,385) (3,177)
259,962 (20,561) (25,587) (24,476)
RM'000Foreign currency
15

Segmental assets and liabilities for the financial period ended 31 December 2019 are as follows:
Property Property Trading and Investment Adjustments/
Development Investment Construction Manufacturing Quarry Healthcare Holdings Others eliminations Consolidated
Division
RM'000 RM'000 RM'000 RM'000 RM'000 RM'000 RM'000 RM'000 RM'000 RM'000
AssetsSegment assets 5,666,369 3,371,855 2,106,932 923,538 352,221 1,751,340 16,475,685 765,403 (11,754,982) 19,658,361
Investment in associates - 1,942,477 - - - - - 181,412 - 2,123,889
Investment in joint ventures 1,436,117 147,568 44,262 - - - - - - 1,627,947
Unallocated assets 147,770
Total assets 23,557,967
LiabilitiesSegment liabilities 4,565,336 3,852,748 1,534,218 642,879 238,447 737,773 12,380,144 612,366 (11,316,489) 13,247,422
Unallocated liabilities 137,005
Total liabilities 13,384,427
16

A9 Foreign Currency Rates
The foreign currency exchange rates used are as follows:
Denomination Closing rate Average rate
United Arab Emirates Dirham 1.1191 1.1316Australian Dollar 2.8798 2.8898Hong Kong Dollar 0.5275 0.5293Indonesia Rupiah ('000) 0.2950 0.2938India Rupee 0.0576 0.0589Macau Pataca 0.5123 0.5145China Yuan Renminbi 0.5881 0.6010Singapore Dollar 3.0508 3.0449Thai Baht 0.1370 0.1341US Dollar 4.1070 4.1465Vietnam Dong ('000) 0.1773 0.1785
Income and expenses are translated at the average rate whereas the assets and liabilities are translated at the closing rate.
A10 Valuation of Property, Plant and Equipment and Investment Properties
A11 Material events
A12 Changes in the Composition of the Group
A13 Contingent Liabilities and Assets
Details of contingent liabilities of the Group as at the date of issue of the report are as follows:
31/12/2019 31/12/2018RM'000 RM'000
Guarantees given to third parties in respect of contracts and tradeperformance 944,912 797,281
There were no other material changes in contingent liabilities since the last annual reporting date.There were no contingent assets.
A14 Commitments
(a) Capital commitment not provided for in the financial year as at 31 December 2019 is as follows:
31/12/2019 31/12/2018RM'000 RM'000
Amount authorised and contracted for 191,650 73,288 Amount authorised but not contracted for 249,060 503,547
440,710 576,835
(b) Operating lease commitment not provided for in the financial year as at 31 December 2019 is as follows:
31/12/2019 31/12/2018RM'000 RM'000
Future minimum lease receipts: (Restated)- not later than 1 year 54,880 52,937 - later than 1 year and not later than 5 years 220,614 213,618 - later than 5 years 121,479 344,047
396,973 610,602
There were no material changes in the composition of the Group for the current quarter ended 31 December 2019.
The Group adopts the fair value model for its investment properties. There is no significant and indicative change in value of the saidinvestment properties since the last balance sheet date, except for the total net fair value gain of RM39,252,000 recognised during the yearbased on a professional valuer's opinion.
There were no material changes in the composition of the Group for the current quarter ended 31 December 2019.
17

B1 Review of Performance
Revenue and profit before tax of the respective operating business segments for the current quarter are analysed as follows:
For the quarter
Increase/ 31/12/2019 31/12/2018 Decrease
RM'000 RM'000 (%) (Restated)
RevenueProperty Development 218,180 203,828 7.0%Property Investment 220,940 222,636 -0.8%Construction 318,047 489,116 -35.0%Trading and Manufacturing 232,161 241,795 -4.0%Quarry 136,418 59,188 130.5%Healthcare 162,873 132,770 22.7%Others 64,547 103,044 -37.4%
1,353,166 1,452,377 -6.8%
Profit before taxProperty Development 117,190 51,006 129.8%Property Investment 89,635 84,283 6.3%Construction 38,134 48,390 -21.2%Trading and Manufacturing 4,522 10,073 -55.1%Quarry 8,003 3,592 122.8%Healthcare 11,358 16,911 -32.8%Others (8,434) 29,468 -128.6%
260,408 243,723 6.8%
The trading and manufacturing segment recorded revenue of RM232.2 million and profit before tax of RM4.5 million in the current quartercompared to revenue of RM241.8 million and profit before tax of RM10.1 million in the corresponding quarter of the previous financial year,representing a decrease in revenue of 4.0% and profit before tax of 55.1%. The financial performance was lower in the current quartermainly due to lower overseas sales as well as lower performance from the local business operations.
Quarter ended
The Group recorded revenue of RM1,353.2 million and profit before tax of RM260.4 million for the current quarter ended 31 December 2019compared to revenue of RM1,452.4 million and profit before tax of RM243.7 million in the corresponding quarter of the previous financialyear, representing a decrease in revenue of 6.8% and increase in profit before tax of 6.8%. Revenue was lower in the current quarter due tolower contributions from most business segments except property development, quarry and healthcare. Profit before tax was higher mainlydue to higher contributions from property development, quarry and property investment. It should be noted that profit before tax of the Groupis impacted by the adoption of MFRS 15 on one of the Group’s Singapore and China property development projects, for which the Group canonly recognise the development profits upon completion. The full recognition of the balance of the development profit of approximatelyRM160 million for the projects will be done upon Vacant Possession delivery in 2020.
The property development segment reported revenue of RM218.2 million and profit before tax of RM117.2 million in the current quartercompared to revenue of RM203.8 million and profit before tax of RM51.0 million in the corresponding quarter of the previous financial year,representing an increase in revenue of 7.0% and profit before tax of 129.8%. Revenue was higher due to higher sales and progress billingsfrom local development projects. Profit before tax for the current quarter was higher mainly due to higher progressive profit recognition fromlocal development projects and recognition of a portion of the development profit for the China property development project.
The property investment segment reported revenue of RM220.9 million and profit before tax of RM89.6 million in the current quartercompared to revenue of RM222.6 million and profit before tax of RM84.3 million in the corresponding quarter of the previous financial year,representing a decrease in revenue of 0.8% and increase in profit before tax of 6.3%. Revenue in the current quarter was largely flat asimproved occupancy rates at the Group’s hospitality properties were able to partly offset the lower rental income after the disposal ofSunway University assets to Sunway REIT, which was completed on 15 April 2019. However, profit before tax was higher mainly due tohigher share of profits from Sunway REIT and higher fair value gains.
The construction segment recorded revenue of RM318.0 million and profit before tax of RM38.1 million in the current quarter compared torevenue of RM489.1 million and profit before tax of RM48.4 million in the corresponding quarter of the previous financial year, representing adecrease in revenue of 35.0% and profit before tax of 21.2%. Revenue in the current quarter was lower mainly due to lower progress billingsfrom local construction projects and higher intra-group eliminations which resulted in lower profit contribution to the current quarter profitbefore tax.
18

For 12 months period
Increase/ 31/12/2019 31/12/2018 Decrease
RM'000 RM'000 (%) (Restated)
RevenueProperty Development 545,852 619,587 -11.9%Property Investment 803,468 814,806 -1.4%Construction 1,273,269 1,847,872 -31.1%Trading and Manufacturing 959,762 1,103,353 -13.0%Quarry 348,114 223,355 55.9%Healthcare 584,833 459,723 27.2%Others 265,149 341,469 -22.4%
4,780,447 5,410,165 -11.6%
Profit before taxProperty Development 246,311 173,194 42.2%Property Investment 336,328 298,638 12.6%Construction 162,331 180,874 -10.3%Trading and Manufacturing 31,423 53,122 -40.8%Quarry 16,729 13,623 22.8%Healthcare 61,815 54,419 13.6%Others 59,295 62,932 -5.8%
914,232 836,802 9.3%
The quarry segment reported revenue of RM136.4 million and profit before tax of RM8.0 million in the current quarter compared to revenueof RM59.2 million and profit before tax of RM3.6 million in the corresponding quarter of the previous financial year, representing an increasein revenue of 130.5% and profit before tax of 122.8%. The financial performance in the current quarter was higher primarily due to highersales from the completion of acquisition of Blacktop and expansion of new premix plant in Sungai Buloh, which boosted the sales volume forpremix.
The healthcare segment reported revenue of RM162.9 million and profit before tax of RM11.4 million in the current quarter compared torevenue of RM132.8 million and profit before tax of RM16.9 million in the corresponding quarter of the previous financial year, representingan increase in revenue of 22.7% and a decrease in profit before tax of 32.8%. The revenue in the current quarter was higher primarily due tohigher occupancy from increased number of new beds and higher admissions and outpatient treatments. The strong performance from theflagship hospital, Sunway Medical Centre was, however, partly offset by the operating loss from the newly opened Sunway Medical CentreVelocity which amounted to RM11.7 million in the current quarter.
The other segments recorded revenue of RM64.5 million and loss before tax of RM8.4 million in the current quarter compared to revenue ofRM103.0 million and profit before tax of RM29.5 million in the corresponding quarter of the previous financial year, representing a decreasein revenue of 37.4% and profit before tax of 128.6%. The financial performance in the current quarter was lower mainly due to the provisionfor impairment of assets of RM39.6 million for spun pile operation under the building materials segment. However, the contribution from theGroup’s treasury functions was better.
For 12 months period ended
The Group recorded revenue of RM4,780.4 million and profit before tax of RM914.2 million for the current 12 months period ended 31December 2019 compared to revenue of RM5,410.2 million and profit before tax of RM836.8 million in the corresponding 12 months periodended 31 December 2018, representing a decrease in revenue of 11.6% and increase in profit before tax of 9.3%. Revenue was lower in thecurrent period due to lower contributions from most business segments except quarry and healthcare. Current period profit before tax washigher mainly due to higher profit contributions from most business segments except construction and trading and manufacturing. Aspreviously mentioned, profit contribution from the property development segment was also impacted by the adoption of MFRS 15 on one ofthe Group’s Singapore and China property development projects. The full recognition of the balance of the development profit ofapproximately RM160 million for the projects will be done upon Vacant Possession delivery in 2020.
The property development segment reported revenue of RM545.9 million and profit before tax of RM246.3 million for the current 12 monthsperiod ended 31 December 2019 compared to revenue of RM619.6 million and profit before tax of RM173.2 million in the corresponding 12months period ended 31 December 2018, representing a decrease in revenue of 11.9% and increase in profit before tax of 42.2%. The lowerrevenue for the current period in comparison, was mainly due to the higher revenue from the completion and handover of a localdevelopment project in the corresponding period of the previous year. Profit before tax for the current period was higher due to higherprogressive profit recognition from local development projects and recognition of a portion of the development profit for the China propertydevelopment project.
19

B2 Material Changes in the Quarterly Results
Increase/ 31/12/2019 30/9/2019 Decrease
RM'000 RM'000 (%) RevenueProperty Development 218,180 126,232 72.8%Property Investment 220,940 209,715 5.4%Construction 318,047 315,581 0.8%Trading and Manufacturing 232,161 246,225 -5.7%Quarry 136,418 114,864 18.8%Healthcare 162,873 154,375 5.5%Others 64,547 59,502 8.5%
1,353,166 1,226,494 10.3%
Profit before taxProperty Development 117,190 59,006 98.6%Property Investment 89,635 66,968 33.8%Construction 38,134 33,126 15.1%Trading and Manufacturing 4,522 13,760 -67.1%Quarry 8,003 4,866 64.5%Healthcare 11,358 15,788 -28.1%Others (8,434) 29,803 -128.3%
260,408 223,317 16.6%
The quarry segment reported revenue of RM348.1 million and profit before tax of RM16.7 million for the current 12 months period ended 31December 2019 compared to revenue of RM223.4 million and profit before tax of RM13.6 million in the corresponding 12 months periodended 31 December 2018, representing an increase in revenue of 55.9% and profit before tax of 22.8%. Revenue in the current period washigher primarily due to higher sales from the completion of acquisition of Blacktop and higher average selling price of premix.
The healthcare segment reported revenue of RM584.8 million and profit before tax of RM61.8 million for the current 12 months period ended31 December 2019 compared to revenue of RM459.7 million and profit before tax of RM54.4 million in the corresponding 12 months periodended 31 December 2018, representing an increase in revenue of 27.2% and profit before tax of 13.6%. The financial performance in thecurrent period was better mainly due to the strong performance of Sunway Medical Centre. However, the overall healthcare performancewas partly offset by the operating loss of RM17.8 million from Sunway Medical Centre Velocity.
The other segments recorded revenue of RM265.1 million and profit before tax of RM59.3 million for the current 12 months period ended 31December 2019 compared to revenue of RM341.5 million and profit before tax of RM62.9 million in the corresponding 12 months periodended 31 December 2018, representing a decrease in revenue of 22.4% and profit before tax of 5.8%. The financial performance in thecurrent period was lower mainly due to the provision for impairment of assets of RM39.6 million for spun pile operation under the buildingmaterials segment. However, the contribution from the Group’s treasury functions was better.
Quarter ended
The property investment segment reported revenue of RM803.5 million and profit before tax of RM336.3 million for the current 12 monthsperiod ended 31 December 2019 compared to revenue of RM814.8 million and profit before tax of RM298.6 million in the corresponding 12months period ended 31 December 2018, representing a decrease in revenue of 1.4% and increase in profit before tax of 12.6%. Revenuein the current period was lower mainly due to lower rental income after the disposal of Sunway University assets to Sunway REIT, which wascompleted on 15 April 2019. However, profit before tax in the current period was higher mainly boosted by disposal gain on SunwayUniversity, which offset the lower contributions from the Group’s hospitality properties and theme parks in the current period.
The construction segment recorded revenue of RM1,273.3 million and profit before tax of RM162.3 million for the current 12 months periodended 31 December 2019 compared to revenue of RM1,847.9 million and profit before tax of RM180.9 million in the corresponding 12months period ended 31 December 2018, representing a decrease in revenue of 31.1% and profit before tax of 10.3%. Revenue was lowerin the current period due to lower progress billings from local construction projects and higher intra-group eliminations, which led to lowerprofit for the current period.
The trading and manufacturing segment recorded revenue of RM959.8 million and profit before tax of RM31.4 million for the current 12months period ended 31 December 2019 compared to revenue of RM1,103.4 million and profit before tax of RM53.1 million in thecorresponding 12 months period ended 31 December 2018, representing a decrease in revenue of 13.0% and profit before tax of 40.8%.The financial performance of the segment in the current period was impacted by lower sales from subdued local and overseas marketconditions and lower operating margins.
20

B3 Prospects
The Group recorded revenue of RM1,353.2 million and profit before tax of RM260.4 million for the current quarter compared to revenue ofRM1,226.5 million and profit before tax of RM223.3 million in the preceding quarter, representing an increase in revenue of 10.3% and profitbefore tax of 16.6%. Revenue was higher in the current quarter mainly due to higher contributions from most business segments excepttrading and manufacturing. Profit before tax was higher in the current quarter due to higher contributions from most business segmentsexcept trading and manufacturing, healthcare and others segments.
The property development segment reported revenue of RM218.2 million and profit before tax of RM117.2 million for the current quartercompared to revenue of RM126.2 million and profit before tax of RM59.0 million in the preceding quarter, representing an increase inrevenue of 72.8% and profit before tax of 98.6%. The financial performance in the current quarter was higher primarily due to higher salesand progress billings from local development projects. Profit before tax for the current quarter was also boosted by recognition of a portion ofthe development profit for the China property development project.
The property investment segment reported revenue of RM220.9 million and profit before tax of RM89.6 million for the current quartercompared to revenue of RM209.7 million and profit before tax of RM67.0 million in the preceding quarter, representing an increase inrevenue of 5.4% and profit before tax of 33.8%. Revenue in the current quarter was higher mainly due to higher contributions from theGroup’s theme parks and hospitality segment arising from the higher visitorship during the festive months and school holidays. Profit beforetax was further boosted by fair value gains from revaluation of the investment properties of RM35.5 million in the current quarter. However,contribution from the hospitality segment was lower.
The construction segment recorded revenue of RM318.0 million and profit before tax of RM38.1 million for the current quarter compared torevenue of RM315.6 million and profit before tax of RM33.1 million in the preceding quarter, representing an increase in revenue of 0.8%and profit before tax of 15.1%. Revenue in the current quarter was marginally higher mainly due to higher progress billings from localconstruction projects which offset the higher intra-group eliminations. As a result, profit was higher for the current quarter.
The trading and manufacturing segment recorded revenue of RM232.2 million and profit before tax of RM4.5 million for the current quartercompared to revenue of RM246.2 million and profit before tax of RM13.8 million in the preceding quarter, representing a decrease inrevenue of 5.7% and profit before tax of 67.1%. The financial performance was lower in the current quarter due to subdued local demand.Further, profit before tax in the preceding quarter was boosted by a disposal gain on one of its subsidiaries’ factory of RM6.3 million.
The quarry segment reported revenue of RM136.4 million and profit before tax of RM8.0 million for the current quarter compared to revenueof RM114.9 million and profit before tax of RM4.9 million in the preceding quarter, representing an increase in revenue of 18.8% and profitbefore tax of 64.5%. The financial performance in the current quarter was higher mainly due to higher average selling price of aggregatesand premix and higher sales volume for premix.
The healthcare segment reported revenue of RM162.9 million and profit before tax of RM11.4 million for the current quarter compared torevenue of RM154.4 million and profit before tax of RM15.8 million in the preceding quarter, representing an increase in revenue of 5.5%and a decrease in profit before tax of 28.1%. The revenue in the current quarter was higher mainly due to higher contribution from SunwayMedical Centre Velocity. However, profit before tax was lower due to the higher operating loss from Sunway Medical Centre Velocity whichincreased to RM11.7 million from RM6.8 million in the preceding quarter.
The other segments recorded revenue of RM64.5 million and loss before tax of RM8.4 million for the current quarter compared to revenue ofRM59.5 million and profit before tax of RM29.8 million in the preceding quarter, representing an increase in revenue of 8.5% and decrease inprofit before tax of 128.3%. Revenue in the current quarter was higher mainly due to higher contribution from the building materials segment.The loss before tax was due to provision for impairment of assets of RM39.6 million for spun pile operation under the building materialssegment. However, the contribution from the Group’s treasury functions was better.
The Malaysian economy grew by 3.6% in the fourth quarter of 2019, the lowest level since the Global Financial Crisis in 2009. In anticipationof a more challenging economic outlook, Bank Negara proactively reduced the Overnight Policy Rate (OPR) by 25 basis points from 3% to2.75% on 22 January 2020.
This augurs well for the local economy as lower borrowing cost will help to underpin household spending and support private investmentprojects. Nevertheless, there are downside risks to growth, especially from the impact of the outbreak of the Covid-19.
In view of the above, the Group will continue with its prudent business strategy, while charting its expansion plan based on its resilientdiversified business model. Barring any prolonged economic slowdown, the Group will continue to perform satisfactorily in 2020.
21

B4 Variance of Actual Profit from Profit Forecast
B5 Taxation
Current Quarter CumulativeEnded Year To Date
31/12/2019 31/12/2019RM'000 RM'000
Current taxation (7,779) (55,337) Deferred taxation (33,538) (22,957)
(41,317) (78,294)
B6 Profit/(Loss) before Taxation
Current Cumulative Quarter Ended Year To Date
31/12/2019 31/12/2019RM'000 RM'000
(61,060) (235,106)
(220) (2,563) (41) (272)
- Inventories (1,382) (3,416) - Advances to joint venture (1,231) (5,304)
(51,985) (55,878)
(926) (2,135) - Other receivables (82) (82)
(1,309) (2,149)(6,010) (7,742)
- (62)
2,931 11,638 - non-current asset held for sale - 37,676
(1,288) (4,355) 17,529 29,674
(17,529) (29,674) (248) 3,793
B7 Status of Corporate Proposal Announced
B7.1 Sales and Purchase Agreements between Sunway Subang Sdn. Bhd. with Sunway Serene Sdn. Bhd., View2pick Sdn. Bhd. andChen Yew Plastics Sdn. Bhd. and Shareholders Agreement between Sunway City Sdn. Bhd. and View2pick Sdn. Bhd.
Cash flow hedge reserve recycled to profit or loss
Net foreign exchange gain/(loss):- Others- Unrealised for hedged items
- property, plant and equipment
- Trade receivables
Net reversal/(provision) of impairment for:- Trade receivables
The current taxation does not include the tax payable for the share of profit from associates and share of profit from joint ventures as theshare of profit is recognised on an after tax basis.
- Other receivables
Net gain/(loss) on disposal of:
- Inventories- Property, plant and equipment
There were no new corporate proposals announced but not completed as at the date of this report, except for the following:
- Property, plant and equipment
Sunway Subang Sdn. Bhd. (“JVCo”), a wholly-owned subsidiary of Sunway City Sdn. Bhd. (“SunCity”), which in turn is a wholly-ownedsubsidiary of the Company, had on 19 February 2016, entered into the following Sale and Purchase Agreements (“SPAs”) for the acquisitionof the undermentioned parcels of leasehold land (60 years tenure) free from encumbrances for a total purchase consideration ofRM32,725,000 (excluding Goods and Services Tax) (“Proposed Property Acquisition”):
The following amounts have been included in arriving at profit/(loss) before taxation:
Depreciation and amortisation
The Company did not issue any profit forecast or profit guarantee during the current year under review.
Write off:
Net gain/(loss) on derivatives
- Intangible assets
22

B7 Status of Corporate Proposal Announced (contd.)
B7.1
Purchase Consideration
Vendors Details of the lands RM'000Sunway Serene Sdn. Bhd. ("SSSB") Hakmilik H.S.(D) 182796, PT 7 in Pekan Subang, Daerah Petaling, 12,500
Negeri Selangor measuring approximately 8,523 square metres (“PT 7”)
View2pick Sdn. Bhd. (“V2P”) Hakmilik H.S.(D) 113417, PT 8 in Pekan Subang, Daerah Petaling, 9,000 Negeri Selangor measuring approximately 0.9105 hectares(“PT 8”)
Chen Yew Plastics Sdn. Bhd. (“CYP”) Hakmilik H.S.(M) 6476, PT 2049 in Mukim Sungai Buluh, Daerah 11,225 Petaling, Negeri Selangor measuring approximately 2 acrestogether with buildings erected thereon (“PT 2049”)
TOTAL 32,725
PT 7, PT 8 and PT 2049 shall collectively be referred to as “the Lands”.
Salient terms of the SPAs include, inter-alia, the following:
The SPAs for PT 7 and PT 8 shall become unconditional when the following conditions have been fulfilled:
(a)
(b) the execution and fulfilment of the conditions precedent set out for PT 7 and PT 8;
(c)
(d) V2P having procured the registration of the discharge of the charge created over PT 8.
Salient terms of the SA include, inter-alia, the following:
(a)
Shareholders Number of shares Shareholding Ratio
SunCity 79,000 80% *V2P 20,000 20%
SunCity had on even date, entered into a Shareholders Agreement (“SA”) with V2P for the purpose of establishing a joint venture via theJVCo to develop industrial properties on the Lands (“Development”) as well as to regulate the relationship between SunCity and V2P withrespect to the joint venture (“Proposed Joint Venture”).
Pursuant to the SPAs, the JVCo would acquire the Lands from SSSB, V2P and CYP free from encumbrances for a total purchaseconsideration of RM32,725,000 (excluding Goods and Services Tax).
Under the Proposed Joint Venture, SunCity and V2P shall subscribe for the following ordinary shares of RM1 each for cash in the sharecapital of the JVCo:
SSSB and V2P having obtained the State Authority’s approval in accordance with the relevant provisions of the National Land Code inrespect of the application for (i) amalgamation or (ii) surrender and re-alienation of PT 7, PT 8 and PT 2049 into one single issuedocument of title with a leasehold period of 99 years commencing from the date of issuance of the relevant new issue document of title;and
The completion of the acquisition of PT 7 and PT 8 are inter-conditional with one another while PT 2049 would be acquired independent ofthe acquisition of PT 7 and PT 8.
The SPA for PT 2049 is conditional upon, amongst others, CYP having obtained the State Authority's approval whether unconditionally orsubject to conditions acceptable to the JVCo and the discharge of the charge over PT 2049.
SSSB and CYP having obtained the State Authority’s approval, whether unconditionally or subject to conditions acceptable to the JVCo;
Sales and Purchase Agreements between Sunway Subang Sdn. Bhd. with Sunway Serene Sdn. Bhd., View2pick Sdn. Bhd. andChen Yew Plastics Sdn. Bhd. and Shareholders Agreement between Sunway City Sdn. Bhd. and View2pick Sdn. Bhd. (contd.)
23

B7 Status of Corporate Proposal Announced (contd.)
B7.1
Salient terms of the SA include, inter-alia, the following:
* Included 1,000 ordinary shares currently held by SunCity in the JVCo.
(b) SunCity and V2P shall be entitled to nominate and appoint 3 directors and 1 director respectively in the JVCo.
(c) SunCity shall nominate the Chairman of the Board.
(d)
The SA shall become unconditional when the following conditions have been fulfilled:
(a) Execution of the SPAs and fulfilment of the conditions precedent of the SPAs in relation to PT 7, PT 8 and PT 2049; and
(b)
B7.2 Proposed acquisition of residential units by Sunway Avila Sdn. Bhd. (formerly known as Sunglobal Resources Sdn. Bhd.)
The Contract Price shall be satisfied by Sunglobal in the following manner:
(a)
(b)
(c)
The Proposed Acquisition has been completed as at the date of this report.
B7.3 Proposed acquisition of Dolomite Granite Quarry Sdn. Bhd.
a) RM100.00 for the Sale Shares; andb) RM125,000,000.00 towards payment for the Lands and the Plant and Machinery.
The JVCo to enter into a management agreement with Sunway Integrated Properties Sdn. Bhd., a wholly-owned subsidiary of SunCity toundertake the tasks stipulated in the SA at a management fee equivalent to 1% of gross development value (“GDV”) of theDevelopment.
The Proposed Property Acquisition of PT2049 and the Proposed Joint Venture were completed on 29 June 2016 and 24 May 2017respectively. The remainder of the Proposed Property Acquisition has not been completed as at the date of this report.
Approval of the relevant authorities granted to the JVCo for the amalgamation or surrender and re-alienation of the Lands and theextension of the leasehold period of the Lands to 99 years.
On 3 June 2019, Sunway Holdings Sdn. Bhd. (“SunHoldings”), a wholly-owned subsidiary of the Company, entered into a Share SaleAgreement (“SSA”) with Dolomite Industries Company Sdn. Bhd. (“the Vendor”), a subsidiary of Dolomite Corporation Berhad, to acquire 100ordinary shares in Dolomite Granite Quarry Sdn. Bhd. (“Dolomite Quarry”) (“Sale Shares”) representing 100% of the total issued and paid-upshare capital of Dolomite Quarry together with 4 parcels of leasehold lands measuring approximately 784 acres (“Lands”) and the plants andmachinery located on the Lands but excluding premix plant and mobile machinery and equipment and stocks located on the Lands as listedin the SSA (“Plant and Machinery”), free from all charges and encumbrances in the following manner (“Proposed Acquisition”):
Sales and Purchase Agreements between Sunway Subang Sdn. Bhd. with Sunway Serene Sdn. Bhd., View2pick Sdn. Bhd. andChen Yew Plastics Sdn. Bhd. and Shareholders Agreement between Sunway City Sdn. Bhd. and View2pick Sdn. Bhd. (contd.)
On 25 May 2018, Sunway Avila Sdn. Bhd. (formerly known as Sunglobal Resources Sdn. Bhd.) (“Sunglobal”) entered into a Master Sale andPurchase Agreement (“SPA”) with Setapak Heights Development Sdn. Bhd. (“Setapak Heights”) for the acquisition of 47 completedindividual residential units of Residensi Infiniti 3 (“Parcels”) developed by Setapak Heights on a leasehold land of 99 years expiring on 24February 2109 held under Pajakan Negeri 50980 Lot 200649 Mukim Setapak, Daerah Kuala Lumpur, Negeri Wilayah Persekutuan (“Land”)on an “as is where is” basis and free from encumbrances and with vacant possession (“Proposed Acquisition”) for a total purchaseconsideration of RM45,795,860 ("Contract Price").
A sum of RM4,579,586 (“Initial Payment”) paid to Setapak Heights upon execution of the SPA as part payment of the Contract Price;
Payment of RM20,608,137 shall be paid to Setapak Heights within 12 months from the date of the SPA towards part payment of theContract Price; and
Payment of the remaining balance of the Contract Price of RM20,608,137 shall be paid to Setapak Heights within 18 months from thedate the SPA.
The SPA is conditional upon the discharge of the assignment of the Parcels in favour of Al-Rajhi Banking & Investment Corporation(Malaysia) Berhad within one month from the date of the SPA or such further period as may be granted by Sunglobal (“Cut-Off Period”).Setapak Heights and Sunglobal shall treat the sale and purchase of the Parcels as being completed on the date this condition is fulfillednotwithstanding that the Contract Price has yet to be paid in full. If the condition is not fulfilled by the expiry of the Cut-Off Period, SetapakHeights is to refund the Initial Payment to Sunglobal and Sunglobal shall have the right to terminate the SPA.
24

B7 Status of Corporate Proposal Announced (contd.)
B7.3 Proposed acquisition of Dolomite Granite Quarry Sdn. Bhd. (contd.)
The Lands are held under the following titles:
a) Pajakan Negeri 113181, Lot 53066 Mukim Ulu Langat, Daerah Ulu Langat, Negeri Selangor;b) Pajakan Negeri 113182, Lot 53068 Mukim Ulu Langat, Daerah Ulu Langat, Negeri Selangor;c) Pajakan Negeri 113183, Lot 53065 Mukim Ulu Langat, Daerah Ulu Langat, Negeri Selangor; andd) Pajakan Negeri 113184, Lot 53069 Mukim Ulu Langat, Daerah Ulu Langat, Negeri Selangor.
a)
b) The Vendor having obtained and delivered the following documents to SunHoldings:(i)
(ii)
c)
d)
The SSA shall become unconditional on the date when all the conditions precedent have been obtained/fulfilled or waived.
The Proposed Acquisition has not been completed as at the date of this report.
B7.4 Establishment of private trust in Singapore and proposed acquisition of purpose-built student accommodations
(i)
(ii)
(iii)
The Proposed Acquisition has been completed as at the date of this report.
Contract for Sale of Freehold Land with Colston Property Developments LLP (“Colston”) as vendor and MG Markey Group Limited asguarantor for the acquisition of a freehold property known as The Colston, 8 Colston Avenue, Bristol, BS1 4ST, United Kingdom (“UK”)(“Colston Property”) at a total purchase consideration of £9,122,300 which is equivalent to approximately RM49.2 million;
Contract for Sale of Freehold Land with Marboot Centregate Ltd (“Marboot”) as vendor and Henry Boot Developments Limited asguarantor for the acquisition of a freehold property known as Centregate, Colston Avenue, Bristol, BS1 4TR, UK (“Centregate Property”)at a total consideration of £9,526,300 which is equivalent to approximately RM51.3 million; and
Agreement for Sale with Make Space Redvers Limited (“Make Space”) as vendor, Redvers Development Limited as developer as wellas Mr Anthony Leonard Harris, Mr Andrew Simon Clarfield, Baby Chicken Limited, Mr Ivor Spiro, Mr Max David Miller, Mr Mark HowardGershinson, Mr Max William Simon Ashton, Mr Peter David Needleman and Mr Robin Julian Alvarez as guarantors to acquire a freeholdproperty at Redvers House, Union Street, Sheffield S1 2JQ, UK (“Redvers Property”) at a total consideration of £18,976,300 which isequivalent to approximately RM102.3 million.
Sunway RE Capital Advisors (SG) Pte Ltd (“SG Fund Manager”) and the UK Fund Manager have on even date, entered into a Shareholders’Agreement (“SHA”) with Mansion Property Management Limited (“MPML”) to regulate the rights of the SG Fund Manager and MPML inrelation to the UK Fund Manager which is established solely for the purpose of providing investment advisory and management services toSRG pertaining to investments in purpose-built student accommodation (“Proposed Joint Venture”).
a written confirmation from Maybank International Labuan Branch (“Maybank Labuan”) confirming the redemption sum payable toMayBank Labuan to fully redeem and discharge the Lands (“Redemption Sum”); and
The Vendor having procured the issuance of new issue documents of title for the Lands with a leasehold tenure of not less than 58years.
An establishment of a private trust known as Sunway Residence Trust (“Trust”) in Singapore and incorporation of Sunway Residence(Guernsey) Limited (“SRG”) and Sunway RE Capital Advisors (UK) Limited (“UK Fund Manager”) respectively.
The Vendor having procured the approval of the shareholders of Dolomite Corporation Berhad, its ultimate holding company andDolomite Quarry, in a general meeting, for the sale of the Sale Shares;
a written undertaking from Maybank Labuan to release its security interest created over the Sale Shares, the Lands as well as thePlant and Machinery subject to payment to Maybank Labuan of the Redemption Sum.
Dolomite Quarry having completed the SPA in accordance with its terms including the transfer and registration of the Lands as well asPlant and Machinery in favour of Dolomite Quarry; and
On 30 October 2019, SRG entered into 3 agreements with the following parties to acquire purpose-built student accommodations as statedbelow (“Proposed Acquisition”):
The Proposed Acquisition is conditional upon the fulfilment of the following conditions precedent within 3 months from the date of the SSA orsuch other date as may be mutually agreed by SunHoldings and the Vendor:-
25

B8 Group Borrowings and Debt Securities
The Group borrowings as at 31 December 2019 are as follows:Current Non-current TotalRM'000 RM'000
Secured borrowingsIslamic:Term loan 308,025 - 308,025 Bankers' acceptance 1,000 - 1,000 Revolving credits 410,700 - 410,700
719,725 - 719,725
Conventional:Bank overdrafts 191,340 - 191,340 Term loan 880,269 172,563 1,052,832 Revolving credits 682,621 - 682,621 Bankers' acceptances 14,957 - 14,957 Hire purchase 1,914 1,176 3,090
1,771,101 173,739 1,944,840 Total secured borrowings 2,490,826 173,739 2,664,565
Unsecured borrowingsIslamic:Medium term notes 1,430,000 1,370,000 2,800,000 Bankers' acceptances 5,200 - 5,200 Commercial papers 1,665,000 - 1,665,000
3,100,200 1,370,000 4,470,200 Conventional:Term loan 514,127 - 514,127 Revolving credits 739,772 - 739,772 Medium term notes - 610,000 610,000 Bankers' acceptances 221,008 - 221,008 Commercial papers 186,000 - 186,000 Bills discounting 164,888 - 164,888
1,825,795 610,000 2,435,795 Total unsecured borrowings 4,925,995 1,980,000 6,905,995 Total borrowings 7,416,821 2,153,739 9,570,560
Islamic borrowings 3,819,925 1,370,000 5,189,925 Conventional borrowings 3,596,896 783,739 4,380,635 Total borrowings 7,416,821 2,153,739 9,570,560
RM'000
26

B8 Group Borrowings and Debt Securities (contd.)
Included in the Group borrowings as at 31 December 2019 are amounts denominated in foreign currency as follows:
Current Non-current Current Non-current TotalSecuredUS Dollar (USD’000) *- Term loan 116,000 - 476,412 - 476,412 - Revolving credits 267,000 - 1,096,569 - 1,096,569
Singapore Dollar (SGD’000) #- Term loan 25,000 17,260 76,270 52,657 128,927
Indonesian Rupiah (RP’000) **- Term loan 4,122,000 - 1,216 - 1,216 - Bills discounting 26,315,630 - 7,763 - 7,763
Australia Dollar (AUD’000) *- Revolving credits 88,578 - 255,087 - 255,087 - Bankers' acceptance 720 - 2,073
UnsecuredSingapore Dollar (SGD’000) **- Revolving credits 90,000 - 274,572 - 274,572
2,189,962 52,657 2,240,546
The Group borrowings as at 31 December 2018 are as follows:Current Non-current TotalRM'000 RM'000
Secured borrowingsIslamic:Term loan 601,895 - 601,895 Revolving credits 415,100 - 415,100
1,016,995 - 1,016,995
Conventional:Bank overdrafts 101,446 - 101,446 Term loan 1,003,629 445,226 1,448,855 Revolving credits 454,115 - 454,115 Hire purchase 357 528 885
1,559,547 445,754 2,005,301 Total secured borrowings 2,576,542 445,754 3,022,296
Unsecured borrowingsIslamic:Medium term notes 560,000 1,480,000 2,040,000 Revolving credits 80,000 - 80,000 Commercial papers 1,160,000 - 1,160,000
1,800,000 1,480,000 3,280,000 Conventional:Term loan 155,568 - 155,568 Revolving credits 342,269 - 342,269 Medium term notes - 610,000 610,000 Bankers' acceptances 182,013 - 182,013 Commercial papers 1,166,000 - 1,166,000 Bills discounting 115,068 - 115,068
1,960,918 610,000 2,570,918
Total unsecured borrowings 3,760,918 2,090,000 5,850,918 Total borrowings 6,337,460 2,535,754 8,873,214
Islamic borrowings 2,816,995 1,480,000 4,296,995 Conventional borrowings 3,520,465 1,055,754 4,576,219 Total borrowings 6,337,460 2,535,754 8,873,214
RM'000
RM'000
Foreign currency
27

B8 Group Borrowings and Debt Securities (contd.)
Included in the Group borrowings as at 31 December 2018 are amounts denominated in foreign currency as follows:
Secured Current Non-current Current Non-current Total
US Dollar (USD’000) *- Term loan 200,000 100,000 830,200 415,100 1,245,300 - Revolving credits 207,000 - 859,257 - 859,257
Singapore Dollar (SGD’000) #- Term loan 90,000 - 273,915 - 273,915
Indonesian Rupiah (RP'000) **- Term loan 13,993,770 - 3,988 - 3,988
Australia Dollar (AUD’000) *- Term loan 90,848 - 266,239 - 266,239 - Revolving credits 42,000 - 123,085 - 123,085
2,356,684 415,100 2,771,784
Notes:***#
B9 Derivative Financial Instruments
The Group's outstanding derivatives as at 31 December 2019 were as follows:Type of Derivatives Contract/ Fair Cash Flow
Notional Value Value Hedge ReserveRM'000 RM'000 RM'000
Foreign currency forward contracts- Less than 1 year 38,630 (953) 222 - - 1 year to 3 years 3,262 (35) 1 -
Cross currency swap contracts #
- Less than 1 year 1,210,532 (15,004) 3,570 (1,146)
Total derivatives (15,992) 3,793 (1,146)
# Include contracts which have not been drawn down during the period.
Foreign currency forward contracts
Borrowings partially obtained by overseas subsidiaries. Those obtained by local subsidiaries have entered into cross currency swapcontracts.
Borrowings in which cross currency swap contracts have been entered into.Borrowings obtained by overseas subsidiaries.
RM'000Foreign currency
for the periodGains/(Losses)
The increase in Group's borrowing is mainly to fund the development cost of its on-going projects in Sunway Velocity, Sunway Iskandar,Sunway Serene and Sunway Geolake Residences, expansion cost in the healthcare segment and landbank acquisition.
The weighted average interest rate of borrowings as at 31 December 2019 is 3.85%. 65% of the Group's total borrowing are fixed rateinstruments, whereas 35% are floating rate instruments.
The Group entered into foreign currency forward contracts to minimise its exposure to foreign currency risks as a results of transactionsdenominated in currencies other than its functional currency, arising from normal business activities. These are done in accordance with theGroup's foreign currency hedging policy and are executed with credit-worthy financial institutions which are governed by appropriate policiesand procedures.
RM'000
Overall, the total borrowing of the Group has increased by RM0.70 billion, from RM8.87 billion as at 31 December 2018 to RM9.57 billion asat 31 December 2019.
Out of the total borrowings of RM9.57 billion, RM2.24 billion (Current: RM2.19 billion ; Non-current: RM0.05 billion) are denominated inforeign currencies. The group entered into cross currency swap contracts to manage its exposure in foreign currency risk arising fromforeign currency borrowings, which was entered into for minimising the interest cost. The average exchange rate entered for USDborrowings is 4.161, AUD borrowings is 2.863 and SGD borrowings is 3.050.
28

B9 Derivative Financial Instruments (contd.)
Cross currency swap contracts
B10 Ageing Analysis of Trade Receivables
The aging analysis of the Group's trade receivables are as follows:
31/12/2019 31/12/2018RM'000 RM'000
Current 1,275,406 1,092,389 1 to 30 days past due 229,371 153,139 31 to 60 days past due 106,356 104,044 61 to 90 days past due 63,610 84,770 91 to 120 days past due 38,567 48,634 More than 120 days past due 152,287 184,010
590,191 574,597 Gross trade receivables 1,865,597 1,666,986 Impaired (87,121) (88,624)Total trade receivables 1,778,476 1,578,362 Other receivables 357,350 311,948 Amounts due from associates 35,141 45,577 Amounts due from joint ventures 2,329,374 1,927,287 Total receivables 4,500,341 3,863,174
Non-current receivables 2,378,322 1,916,715 Current receivables 2,122,019 1,946,459 Total receivables 4,500,341 3,863,174
B11 Changes in Material Litigation
(a)
The Claimant has failed to carry out its obligations under the work order and SunCon has terminated the work order and cashed theBank Guarantees. The Claimant had filed an application in the Supreme Court of India for the appointment of an arbitrator to arbitrateupon the disputes between the parties. The Supreme Court had appointed the late Mr H.L. Agarwal as the sole arbitrator. The Claimantthen filed its Statement of Claim on 4 September 2008.
The Statement of Claim was raised in respect of various claims (including claiming the refund of the amount cashed on the BankGuarantees) and the total amount claimed is Rs89,14,55,047.83 (approximately equivalent to RM51 million) in addition to interest andcost.
The derivatives arising from the foreign currency forward contracts are stated at fair value, using the prevailing market rates. Derivatives withpositive market values are included under current assets and derivatives with negative market values are included under current liabilities.Any changes in fair value of derivatives during the period are taken directly to the income statement.
Except for the following claims, there was no pending material litigation.
Cash flow hedge accounting could not be applied where the hedge instruments were entered into prior to the loan drawdown. Changes in fairvalue of these hedge instruments are therefore recognised in the income statement.
The Group entered into cross currency swap contracts to manage its exposure in foreign currency risk arising from foreign currencyborrowings which was entered to minimise the interest cost . The Group uses cash flow hedges to mitigate the risk of variability of futurecash flows attributable to foreign currency and interest rate fluctuations over the hedging period on the foreign currency borrowings. Where acash flow hedge qualifies for hedge accounting, the effective portion of gains or losses on remeasuring the fair value of the hedginginstrument are recognised directly in other comprehensive income until such time as the hedged item affects profit or loss, then the gains orlosses are transferred to the income statement. Gains or losses on any portion of the hedge determined to be ineffective are recognisedimmediately in the income statement.
On 4 September 2008, the solicitors of Sunway Construction Sdn. Bhd. (“SunCon”) had been served with a Statement of Claim(“Statement of Claim”) by Shristi Infrastructure Development Corporation Ltd (“Claimant”). The Statement of Claim was received bySunCon’s office in Malaysia on 8 September 2008.
Pursuant to an agreement signed between SunCon and the National Highway Authority of India for the rehabilitation and upgrading ofNH-25 to a four-lane configuration in the state of Uttar Pradesh being a part of the East-West Corridor Project, SunCon had entered intoa work order with the Claimant for the upgrading and rehabilitation of the stretch of NH-25 from 143.6 km to 170.0 km, of which theClaimant has provided two bank guarantees (“Bank Guarantees”) to SunCon.
29

B11 Changes in Material Litigation (contd.)
On 11 January 2013, the arbitrator that presided over the case passed away and 75 hearings had been held.
(b)
(i)
(ii)(iii)
(iv)
B12 Dividend
On 10 February 2020, the Honorable Court has directed SunCon to deposit, on a without prejudice basis, the decretal amount with up to date interest with the Registrar General of the High Court of Delhi within 6 weeks from 10 February 2020. Subject to compliance ofthe said direction, the Honorable Court has been pleased to stay the Arbitral Award dated 9 April 2019. The matter has now been re-notified for 17 April 2020.
In light of the above order, the Honorable Court was please to dispose of the enforcement petition filed by Shristi as non maintainable atthis stage in as much as the Arbitral Award has been stayed.
PNSB Acmar Sdn Bhd (“Plaintiff”) has on 14 November 2019 served a Writ of Summon and a Statement of Claim both dated 8November 2019 on Prasarana Malaysia Berhad (“Prasarana”) (1st Defendant) and Sunway Construction Sdn Bhd (“SunCon”) (2ndDefendant).
The Plaintiff is claiming that all the construction works in relation to the project known as “Construction and Completion of Light RailTransit Line 3 (LRT3) from Bandar Utama to Johan Setia” (“Project”) and the structures such as the Project’s poles, bars, and LRTstations had trespassed and/or encroached into the Plaintiff’s own development project area and has resulted in losses and damagestowards the Plaintiff.
Prasarana is the owner of the Project and SunCon is the awarded Works Package Contractor for the contract known as “Contract No.Prasarana/GSC/CTT/2.06080/2017: Construction and Completion of Guideway, Stations Iconic Bridge, Park and Rides, AncillaryBuildings and other Associated Works for Package GS07-08 for Light Rail Transit 3 (LRT3) from Bandar Utama to Johan Setia” inrelation to the Project.
The Plaintiff is claiming, amongst other, for the following:-
The Court has scheduled a further case management on 23 January 2020 to provide further pre-trial on case management directions.The solicitors acting for SunCon, after taking into consideration the evidence available, a review of the Statement of Claim, documentswith client and a review of the law, are of the considered opinion that the Plaintiff’s claim for the sum of RM711,367,434.46 is likely to bedismissed.
The next case management is scheduled on 5 March 2020.
Special damages of RM711,367,434.46 and/or to be determined by the Senior Assistant Registrar or Deputy Registrar of the High Court of Malaya;The costs between the solicitor and client amounts to RM400,000.00 or cost to be determined by the Honorable Court;Interest rate of 5% per year from the date of trespass i.e. 30 April 2018 until the date of filing of the writ and from the date of the Honorable Court’s order until the full settlement; and Court’s declarations, injunctions, orders and other reliefs that the Honorable Court deems fit and proper.
The board has determined that the Dividend Reinvestment Scheme (DRS) as approved by the shareholders will apply to the entire portion ofsecond interim dividend, of which the details will be provided in the separate announcement today.
SunCon has filed an appeal with the High Court of New Delhi in early July 2019 to set aside the arbitral award. Shristi has also filed anexecution application against SunCon for enforcement of the arbitral award. The hearing fixed on 31 October 2019 is postponed to 10February 2020.
Other than the dividend as disclosed in note A7, the Board of Directors have declared a second interim dividend of 4.5 sen per ordinaryshare in respect of financial year ended 31 December 2019.
At the hearing on 2 February 2009, the arbitrator recorded SunCon’s filing of the Statement of Defence and Counterclaim. In thecounterclaim, SunCon is seeking for Rs78,13,94,628.61 (approximately equivalent to RM45 million) for inter alia, additional costsincurred by SunCon to complete the works, recovery of mobilisation advance and interest charges, loss of reputation and loss of profits.
SunCon was notified by its solicitors that an arbitration petition has been filed by Shristi on 7 January 2016 in the Supreme Court of Indiafor the appointment of a new arbitrator. The Supreme Court of India by an order dated 5 January 2017 appointed Hon'ble Mr JusticeVikramajit Sen (a former Judge of the Supreme Court of India) as arbitrator in place of the late Justice H.L Agrawal (Retd.) foradjudication of the disputes and differences between the Parties. The first hearing before Mr Justice Vikramajit Sen was held on 24February 2017 and cross examination has been completed on 7 October 2017.
The proceedings had advanced for final arguments on 6 March 2018 to 9 March 2018. Further final and rejoinder argument was heardon 12, 13 and 14 April 2018. The Arbitrator published his award on 9 April 2019 and awarded the Claimant Rs. 12,84,41,929.37(approximately equivalent to RM7.4 million).
30

B13 Earnings per share
CumulativeYear To Date31/12/2019
RM'000
Basic/Diluted earnings per share
Profit attributable to members of the Company 200,312 766,633 Distribution to holders of perpetual sukuk (16,510) (54,488) Net earnings for the period 183,802 712,145
Weighted Average Number of Ordinary Shares 4,845,968 4,873,747
Earnings per share (Basic/Diluted) (sen) 3.79 14.61
By Order of the Board
Tan Kim AunChin Lee Chin
Secretaries
RM'000
Current QuarterEnded
31/12/2019
The calculation of the earnings per share for the Group is based on profit after taxation and non-controlling interests on the weightedaverage number of ordinary shares in issue during the period.
31