IR Presentation_Oct2021.pdf - Sime Darby Berhad
38
0 STRICTLY PRIVATE & CONFIDENTIAL Investor Relations Discussion October 2021 SIME DARBY BERHAD
-
Upload
khangminh22 -
Category
Documents
-
view
0 -
download
0
Transcript of IR Presentation_Oct2021.pdf - Sime Darby Berhad

0
STRICTLY PRIVATE & CONFIDENTIAL
Investor Relations Discussion
October 2021
SIME DARBY BERHAD

1
STRICTLY PRIVATE & CONFIDENTIAL
Disclaimer
This document is strictly confidential to the recipient. It is being supplied to you solely for your information and may not be reproduced, redistributed or passedon, directly or indirectly, to any other person or published, in whole or in part, for any purpose. Upon request, you shall promptly return this document allother information made available in connection with this document, without retaining any copies. The distribution of this document in other jurisdictions maybe restricted by law, and persons into whose possession this document comes should inform themselves about, and observe, any such restrictions.
This document does not constitute and is not an offer or invitation to sell, or any solicitation of any offer to subscribe for or purchase any securities of anycompany referred to in this document in any jurisdiction. The companies referred to herein have not registered and do not intend to register any securitiesunder the US Securities Act of 1933, as amended (the “Securities Act”), and any securities may not be offered or sold in the United States absent registrationunder the Securities Act or an exemption from registration under the Securities Act. By attending the presentation you will be deemed to represent, warrantand agree that to the extent that you purchase any securities in any of the companies referred to in the presentation, you either (i) are a “qualifiedinstitutional buyer” within the meaning of Rule 144A under the Securities Act, or (ii) you will do so in an “offshore transaction” within the meaning ofRegulation S under the Securities Act.
By attending this presentation and accepting a copy of this document, you represent and warrant that (i) you have read and agreed to comply with thecontents of this notice; (ii) you will maintain absolute confidentiality regarding the information contained in this document including information presentedorally or otherwise in accordance with your confidentiality obligation; and (iii) you are lawfully able to receive this document and attend this presentationunder the laws of other jurisdiction in which you are subjected and other applicable laws.
This document is for the purposes of information only and is not intended to form the basis of any investment decision. This presentation may contain forward-looking statements by Sime Darby Berhad that reflect management’s current expectations, beliefs, intentions or strategies regarding the future andassumptions in light of currently available information. These statements are based on various assumptions and made subject to a number of risks,uncertainties and contingencies and accordingly, actual results, performance or achievements may differ materially and significantly from those discussed inthe forward-looking statements. Such statements are not and should not be construed as a representation, warranty or undertaking as to the futureperformance or achievements of Sime Darby Berhad and Sime Darby Berhad assumes no obligation or responsibility to update any such statements.
No representation or warranty, express or implied, is given by or on behalf of Sime Darby Berhad or its related corporations (including without limitation, theirrespective shareholders, directors, officers, employees, agents, partners, associates and advisers) (collectively, the “Parties”) as to the quality, accuracy,reliability, fairness or completeness of the information contained in this presentation or its contents or any oral or written communication in connection withthe contents contained in this presentation (collectively, the “Information”), or that reasonable care has been taken in compiling or preparing theInformation. None of the Parties shall be liable or responsible for any budget, forecast or forward-looking statements or other projections of any nature or anyopinion which may have been expressed or otherwise contained or referred to in the Information.
The Information is and shall remain the exclusive property of Sime Darby Berhad and nothing herein shall give, or shall be construed as giving, to anyrecipient(s) or party any right, title, ownership, interest, license or any other right whatsoever in or to the Information herein. The recipient(s) acknowledgesand agrees that this presentation and the Information are confidential and shall be held in complete confidence by the recipient(s).
All the images, pictures and photos including design drawings in relation to the company’s property development projects contained in this document are artistimpression only and are subject to variation, modifications and substitution as may be recommended by the company’s consultants and/or relevant authorities.
1

2
STRICTLY PRIVATE & CONFIDENTIAL
Table of Contents
Section Page
1. Sime Darby Berhad 3
2. Industrial Division 17
3. Motors Division 22
4. Healthcare Division 28
2

3
STRICTLY PRIVATE & CONFIDENTIAL
Sime Darby Berhad
3

4
STRICTLY PRIVATE & CONFIDENTIAL
Sime Darby BerhadLeading trading company in Asia Pacific with strong partnerships with Premium Brands
China
South Korea
Hong Kong
Macau
Australia
New Zealand
Thailand
Vietnam
Maldives
Christmas Island
Malaysia
Singapore
Indonesia
Papua New Guinea
New Caledonia
Brunei
Taiwan
(1) Geographical footprint defined as locations in which Sime Darby Berhad has assets or employees, and includes JV’s operations (i.e. Ramsay Sime Darby Health Care operates in Indonesia); (2) As at June 2021. Includes Group Head Office, Industrial, Motors, Logistics and other businesses. Excludes employees of RSDH; (3) Contribution as of FY21 preliminary
19 Countries & Territories(1)
21,941 Employees(2)
One of the largest BMW dealers in the World and the World’s largest Rolls Royce dealer
Second largest CAT dealer globally
7 hospitals acrossMalaysia & Indonesia
FY21 Financials
RevenueRM44.5bn
PATAMIRM1,425mn
PBITRM2,181mn
Shareholder’s Funds
RM15.8bn
Industrial Motors Logistics Healthcare
Japan
Solomon Islands
4

5
STRICTLY PRIVATE & CONFIDENTIAL
Brands that we carry
“Partner of Choice” for many of the World’s Leading Brands
Industrial Powerhouse Automotive Specialist
MOTORSINDUSTRIAL
5
5

6
STRICTLY PRIVATE & CONFIDENTIAL
“Sime Darby
Berhad is a
multinational
company
whereby
~88%
of revenue
comes from
outside
Malaysia”
China is the largestregion, contributing~40% of our revenue
Our second largestregion is Australia,contributing~30% of our revenue,largely from the miningindustry
Notes:
1) Based on FY21 Revenue
2) China consists of China, Hong Kong, Macau & Taiwan
3) Australasia consists of Australia, New Zealand, Papua New Guinea & Solomon Islands
4) SEA consists of Singapore, Thailand, Indonesia
12%
13%
43%
32%
China(1)
Australasia(2)
SEA(3)
Malaysia
6Sime Darby: Revenue by Geography
>80% of our Revenue is generated outside Malaysia; China & Australia are Key Markets
6

7
STRICTLY PRIVATE & CONFIDENTIAL
Motors
Retail, distribution,
rental & assembly
9 markets,
203
branches
More than 30 brands
from luxury to mass
market
One of the
largest BMW
dealers globally
50 years
experience
Equipment &
after-sales services
152 branches
across 16 countries &
territories
Supply to mining &
construction
sectors, among
others
92 years
experience with CAT
Industrial
50:50 JV with
Ramsay
Healthcare
Healthcare Others
Sime Darby: Operations Overview
Retail & Aftersales for Motors & Industrial equipment, valuable Healthcare business
Owns ~8,800 acres of land in the MVV region
Seaport operations in Eastern China –
loading/unloading & storage of bulk cargo, liquid chemicals and
containers
Owns 60% of
Sime Darby Lockton Insurance Brokers Sdn Bhd
7
internationally
accredited
hospitals in
Malaysia and
Indonesia
Partnered with
premium
healthcare
operator
World-class
services with state-
of-art medical
technologies
7
One of the largest CAT
dealers globally

8
STRICTLY PRIVATE & CONFIDENTIAL
Broad footprint across Asia Pacific and strong relationship with World Class principals
Broad capabilities across our value chain
• Our capabilities extend across the value chain of our businesses, resulting in a wide spectrum of opportunities to capitalize on
Good understanding of Asia
• Established network and strong “know how” in the APAC region
• Our wide footprint across Asia Pacific gives us the ability to leverage on different markets to gain exposure to a broader earnings base
• Good proxy to China’s luxury play
Dry Powder to Deploy
• Low gearing & strong Cash Flows
• Ample debt headroom for strategic expansion & M&As
0.23xDebt to equity ratio
As of 30 June 2021
The Sime Darby Advantage
Expansion Driven
• Expansion is in our DNA, with strong expertise in M&A, Organic growth and brownfield expansion
• Some notable M&As:
• Acquisition of CAT NZ
• Acquisition of Trivett dealerships to expand BMW in Sydney
Strong Partnership with World Class Brands
• Partner of choice for world leading brandswho want to expand in Asia
• Strong standards of governance andprofessionalism
since
1929
since
1972
8

9
STRICTLY PRIVATE & CONFIDENTIAL
FY2021 Financial Results
Reported Profit: Financial year ended 30 June 2021
In RM Million FY2021 FY2020 YoY %
Revenue 44,483 36,934 20.4
PBIT 2,181 1,407 55.0
Finance income 46 51
Finance costs (122) (183)
Profit before tax 2,105 1,275 65.1
Taxation (575) (402)
Profit after tax 1,530 873 75.3
Non-controlling interests (105) (53)
Net profit attributable to owners of the Company 1,425 820 73.8
9

10
STRICTLY PRIVATE & CONFIDENTIAL
FY2021 Financial Results
Core Profit: Financial year ended 30 June 2021
In RM Million FY2021 FY2020 YoY %
Reported PBIT 2,181 1,407 55.0
Adjustments
• Fair value loss on financial assets (MES) 2 72
• Logistics & Land impairments 1761 1532
• Gain on disposal (332)3 (18)4
• Singapore Motors GST refund (39) -
• Share of results / loss on disposal of E&O (33) 58
• Others 135 (54)6
Core PBIT 1,968 1,618 21.6
Net finance costs (76) (132)
Taxation (539)7 (393)7
Non controlling interests (105)7 (53)7
Core Net Profit 1,248 1,040 20.0
Adjustments :
1. Motors impairment of leasehold land RM 89m, Logistics impairment RM 85m and Loss on disposal of Jining Ports RM 2m
2. Motors impairment of leasehold land RM 26m and Logistics impairment RM 127m
3. Gain on disposal of Tesco RM 294m, Gain on disposal of Motors properties RM 38m
4. Gain on disposal of Logistics sea-use-rights (SUR)
5. Forex loss on settlement of net investment RM 13m
6. Forex gain on settlement of net investment RM 7m, Reversal of impairment on PNG assets RM 32m and QP legal case settlement RM 15m
7. Adjusted for tax and non-controlling interest (NCI) effects of one-off items 10

11
STRICTLY PRIVATE & CONFIDENTIAL
FY2021 Financial Results
Strong cash flows and low gearing contributed to a net cash position as of 30 June 2021
RM 2.7 bnOperating Cash Flow
0.23xDebt/Equity Ratio
RM 0.6 bnNet Cash
D i v i d e n d & C a s h F l o wG e a r i n gC a s h P o s i t i o n v s D e b t
16,260
Equity
1,908
1,827
Total Debt
Leases
Borrowings
3,735
1,351
3,0122,753
FY19 FY20 FY21
11
0.14 0.150.18
0.10 0.10
0.15
72%83%
72%
0%
10%
20%
30%
40%
50%
60%
70%
80%
0.00
0.05
0.10
0.15
0.20
0.25
FY19 FY20 FY21
Core EPS DPS Dividend Payout %RM
Operating Cash Flow
2,473
1,827
Cash Debtexcl.
leases
RM, Million RM, Million
RM, Million

12
STRICTLY PRIVATE & CONFIDENTIAL
618
948
820
0
200
400
600
800
1000
1200
1400
1600
FY18 FY19 FY20 FY21 (f)
Revenue (RM million) Reported PBIT (RM million)
PATAMI (RM million) ROIC (%)
Covid-19 impact
Key Financial Highlights: Post DemergerRevenue and earnings growing consistently, post-demerger
6.3%
8.2%7.4%
11.6%
0.0%
2.0%
4.0%
6.0%
8.0%
10.0%
12.0%
FY18 FY19 FY20 FY21 (f)
1,074
1,383 1,407
2,181
FY18 FY19 FY20 1HFY21
9M FY21
Gain on Tesco disposal &China Motors rebound
1,425Higher margins &
improved working capital
12
FY21
FY21
FY21
33,82836,156
36,934
44,483
FY18 FY19 FY20 FY21

13
Business Expansion & Portfolio Rationalisation
We have been active in business expansion; rationalisation of large assets are ongoing
Accomplished Business Development and Corporate Finance teams to execute our Corporate Transactions
Shanghai Chengdu Changsha
QujingKunmingBalakong
Dongguan MINI
ShenzhenKunming
GuangzhouAra Damansara
Brisbane
Changsha
Brisbane
Obtained franchise for Hyster Yale forklifts for
Malaysia & Brunei
Dealerships Assembly
Inokom AssemblyPorsche and Kia
Assembly
Organic Expansion
Mergers & Acquisition
Price: RM 574mn
Price: RM 177mn
Price: RM 440mn
EV: RM 370 mn
Price: RM 327 mn
Weifang Water
Nissan NZ
Proceeds: RM300mn
Proceeds: NZD 3.3mn
Proceeds: RM 275mn
Proceeds: USD 6mn
Proceeds: RM 93.5 mn
Jining PortsProceeds: RM 300mnMonetisation Of
Non-Core Assets
Industrial
Proceeds: RM 3.6mn
Strategic Investments
13

14
Sime Darby: Corporate Strategy Blueprint
Focus on Transformational M&A, with expansion in China Auto and Mining Services
Strategy Blueprint FY2022
Operational ExcellenceGrowth & Business Expansion
Monetization of non-core assets
Revenue Enhancement
• Grow Volumes & Market share• Aftersales growth
Inventory & BS Management
Embed New Acquisitions• Integration plan and synergies
Motors• Luxury dealerships in China • Used Car & Aftersales • Implement Assembly Strategy
Industrial
• Develop capabilities as an integrated service provider
Explore Opportunities in India & Indonesia
Disposal of Identified Non-core Assets & Business
Implement Growth Plans via greenfield/ M&A
Productivity & Efficiency
Healthcare
EV & Mobility Strategy
Cost Optimization
• Motors Business TransformationProgram
People Development
Technology & Innovation
Sustainability
Safety & HealthEnablers
• China EV OEMs• Build competencies along EV
ecosystem (battery, equipment)
• Working Capital Optimization
Weifang Port
Transformational M&A
14

15
Sime Darby: Our China Journey
China is our core market (40% revenue); looking to massively expand
Growth Strategies
• We entered into China in 1962 throughChina Engineers Limited (IndustrialDivision) and expanded business to includeMotors & Ports.
• Now, China is our largest revenuecontributor (40% group revenue).
• Our Operations in China:
• Tier 1 BMW dealer with over 40,000unit sales
• Large CAT dealer for Southern China
• Seaport in Weifang Province
Our China Operations
-
100
200
300
400
500
600
-
5,000
10,000
15,000
20,000
2010 2011 2012 2013 2014 2015 2016 2017 2018 2019 2020 2021
China: Revenue & PBIT Growth 2010 -2021
Revenue Total PBIT Total
15
Riding on China’s strong organic GDP growth forconstruction and luxury goods
Acquisition of large and transformative autodealership to expand sales network
Continuous greenfield expansion for BMW andluxury marques in Tier 3 and 4 cities
Looking to enter other emerging markets insearch of the “Next China” (India & Indonesia)

16
Mining will Remain Relevant
With the energy transition & regional development, demand for mining is resilient
Mining remains globally relevant
Metals (lithium, cobalt etc.) are essential components for the Energy Transition; and mining is needed for extraction
MET Coal: India demand will drive growth
India and SE Asia lead the long-term demand due to low base of urbanization and steel intensity
$78.2b
$8.4b
$148.2b
$37.7b
$7.3b
$1b
$7.1b
Mining Revenue By State
WA represents 41% of mining project pipeline
QLD & NTrepresents 32% of mining project pipeline
Huge opportunity in Western Australia
Energy Transition
Metals & commodities are an essential component of the Energy Transition journey
Western Australia has substantial growth opportunities, and reinforces the need for a non-CAT presence
155 Mt net import demand growth by 2050
MET coal is a crucial component for steelmaking, and there is no commercially-viable alternative.
Less environmental impact as compared to thermal coal.
16

17
Dealers Play a Crucial Role in Automotive Sales
Luxury customers prefer physical touchpoints for test drive & service
Physical interaction remains central especially for luxury segment (90% prefer physical visit)
Regardless of new formats (agency model), physical sites are needed for test drive, deliveryand after sales
With EVs, authoriseddealers could play a more important role as sophisticated computerized systems could push customers to the official channels
01
02
03
Reason for importance We will enhance:
Emerging business
Omnichannel capabilities
New car
Used car
Aftersales
F&I
9
8
7
6
5
4
3
2
1
Selective geographicexpansion
Selective brandportfolio expansion
Independent Used Carbusiness outside offranchise
Multi-brand aftersalesworkshop outsidefranchise
Retentionimprovement withinthe franchise
Expand F&I offeringsbeyond principal
Build fleet servicing;rental and chaufferbusiness
Digital and analyticscapabilities
Core business
Network & formatoptimization
To focus on Omnichannel, Used Car andAftersales, which are the highest value segments 17
18
STRICTLY PRIVATE & CONFIDENTIAL
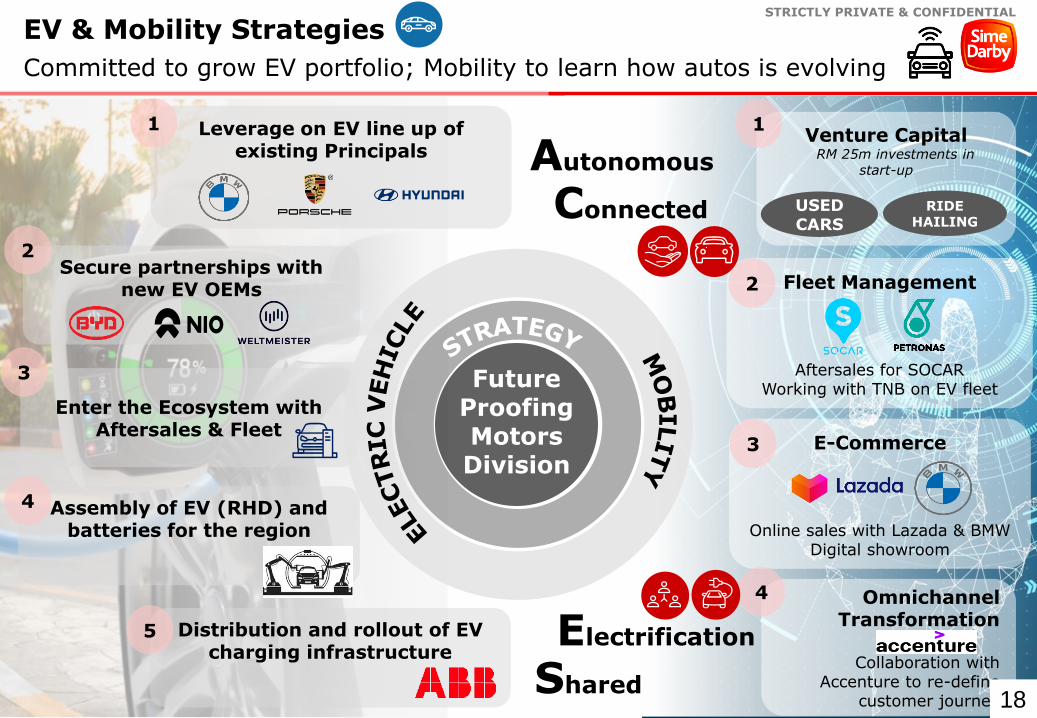
EV & Mobility Strategies
Committed to grow EV portfolio; Mobility to learn how autos is evolving
Leverage on EV line up of existing Principals
1
Secure partnerships with new EV OEMs
2
Assembly of EV (RHD) and batteries for the region
Distribution and rollout of EV charging infrastructure
5
Enter the Ecosystem with Aftersales & Fleet
4
3
Fleet Management
Aftersales for SOCARWorking with TNB on EV fleet
Omnichannel Transformation
Collaboration with Accenture to re-define
customer journey
Venture Capital RM 25m investments in
start-up
2
Future Proofing MotorsDivision
19
E-Commerce
Online sales with Lazada & BMW Digital showroom
3
4
Shared
Electrification
Connected
Autonomous
1
18
USED CARS
RIDE HAILING
19
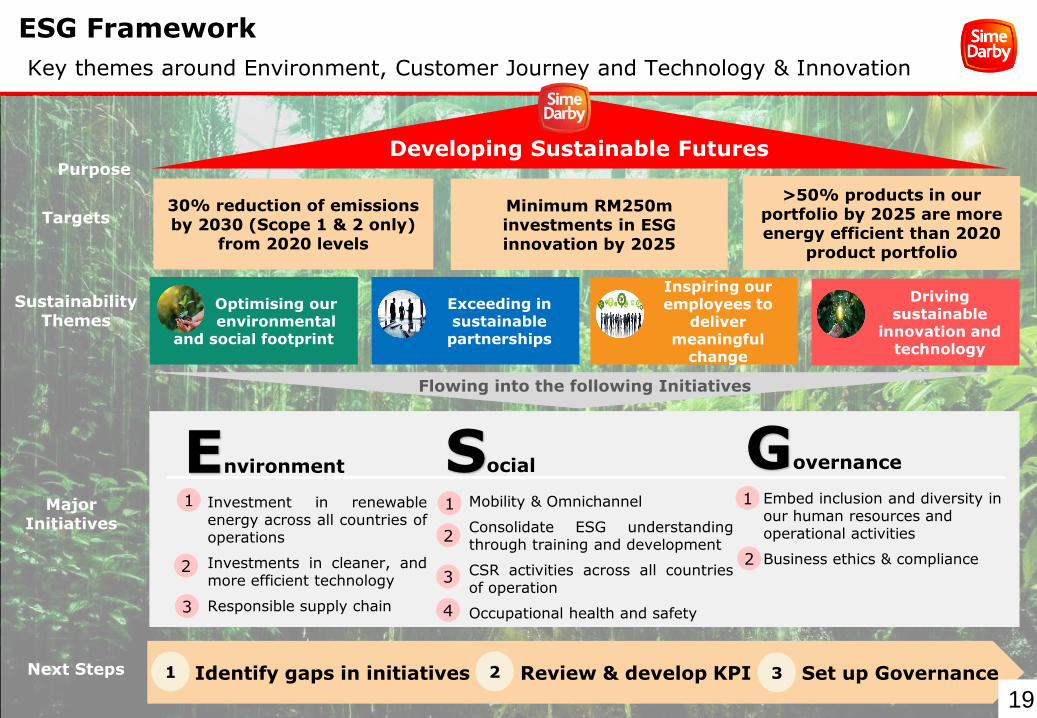
ESG Framework
Key themes around Environment, Customer Journey and Technology & Innovation
Developing Sustainable Futures
30% reduction of emissions by 2030 (Scope 1 & 2 only)
from 2020 levels
Minimum RM250m investments in ESG innovation by 2025
>50% products in our portfolio by 2025 are more energy efficient than 2020
product portfolio
Sustainability Themes
Targets
Purpose
Major Initiatives
Inspiring our employees to
deliver meaningful
change
Exceeding in sustainable
partnerships
Optimising our environmental
and social footprint
Driving sustainable
innovation and technology
Next Steps
Flowing into the following Initiatives
Environment
1. Investment in renewableenergy across all countries ofoperations
2. Investments in cleaner, andmore efficient technology
3. Responsible supply chain
Governance
• Embed inclusion and diversity in our human resources and operational activities
• Business ethics & compliance
Social
• Mobility & Omnichannel
• Consolidate ESG understandingthrough training and development
• CSR activities across all countriesof operation
• Occupational health and safety
Identify gaps in initiatives Review & develop KPI Set up Governance
2
3
1
2
1 1
2 31
19
3 4
2
20
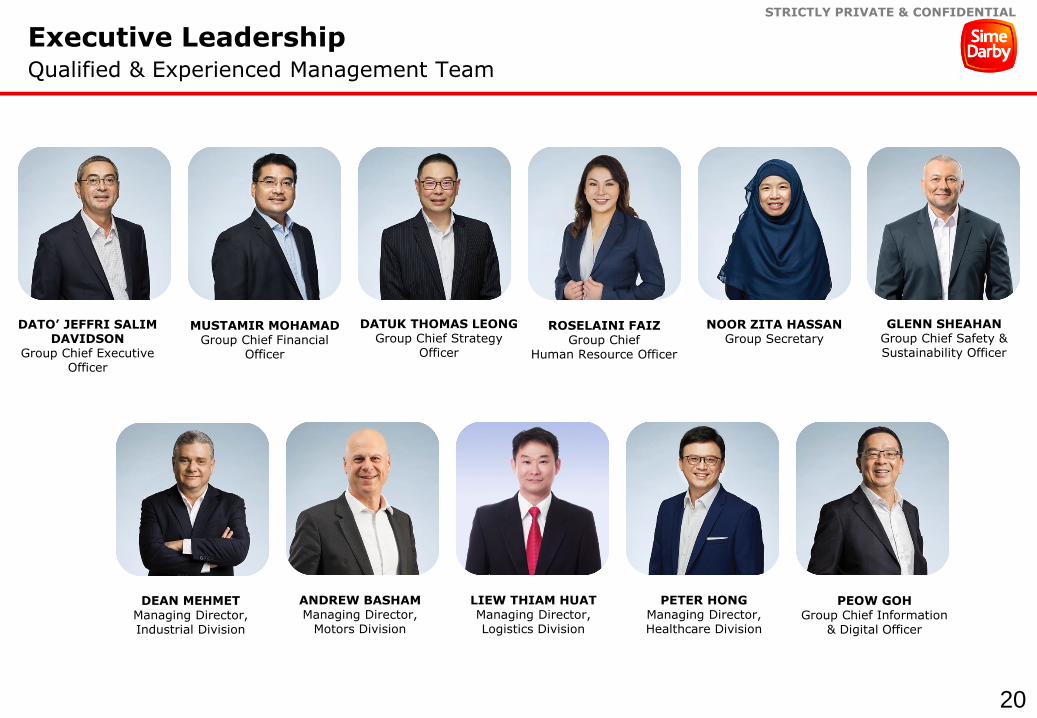
STRICTLY PRIVATE & CONFIDENTIAL
Executive LeadershipQualified & Experienced Management Team
DATO’ JEFFRI SALIM DAVIDSON
Group Chief Executive Officer
MUSTAMIR MOHAMADGroup Chief Financial
Officer
DATUK THOMAS LEONGGroup Chief Strategy
Officer
ROSELAINI FAIZGroup Chief
Human Resource Officer
NOOR ZITA HASSANGroup Secretary
GLENN SHEAHANGroup Chief Safety & Sustainability Officer
DEAN MEHMETManaging Director, Industrial Division
ANDREW BASHAMManaging Director,
Motors Division
LIEW THIAM HUATManaging Director, Logistics Division
PETER HONGManaging Director, Healthcare Division
PEOW GOHGroup Chief Information
& Digital Officer
20

21
STRICTLY PRIVATE & CONFIDENTIAL
Industrial Division
21

22
STRICTLY PRIVATE & CONFIDENTIAL
Our Operations
Product Support
Power Systems Sales
Industrial Solutions
Heavy Equipment Sales (New and Used)
Equipment Rental
Industrial has a large presence across 18 countries in Asia Pacific, representing seven well known industrial brands, including the second largest Caterpillar dealership group globally.
Revenue RM16.0bn
PBIT RM909m
PATAMI RM551m
Construction,
48%
Mining, 36%
Marine / Oil &
Gas, 9%
Other, 7%
Revenue By Segment
Met coal represents 20% of total revenue, thermal 9%, and other resources 7%.
RM6.4bn
RM9.6bn
Asia
Australasia
22

23
STRICTLY PRIVATE & CONFIDENTIAL
Division Business Profile and Portfolio
Diversified Products and Markets
Dragline
Skid Steer
Mine Truck SEM Wheel Loader
Hydraulic Excavator
Diesel Engine 23
24
STRICTLY PRIVATE & CONFIDENTIAL
967909
PBIT
Jun-20
Jun-21
15,794 16,004
Revenue
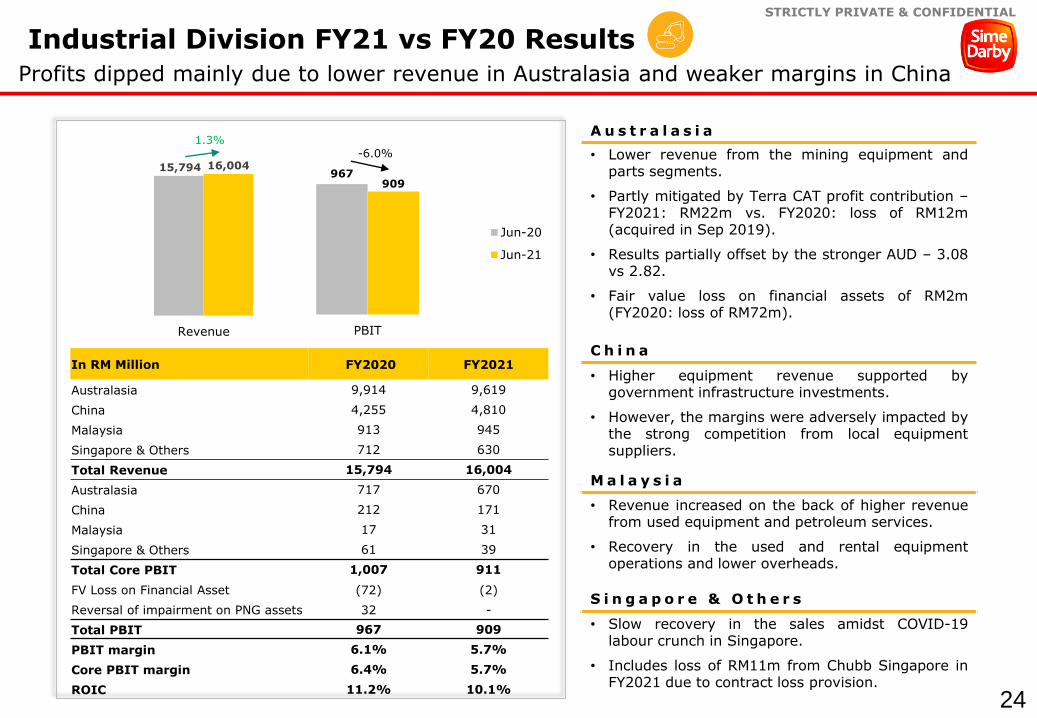
Industrial Division FY21 vs FY20 Results
Profits dipped mainly due to lower revenue in Australasia and weaker margins in China
A u s t r a l a s i a
• Lower revenue from the mining equipment andparts segments.
• Partly mitigated by Terra CAT profit contribution –FY2021: RM22m vs. FY2020: loss of RM12m(acquired in Sep 2019).
• Results partially offset by the stronger AUD – 3.08vs 2.82.
• Fair value loss on financial assets of RM2m(FY2020: loss of RM72m).
C h i n a
• Higher equipment revenue supported bygovernment infrastructure investments.
• However, the margins were adversely impacted bythe strong competition from local equipmentsuppliers.
M a l a y s i a
• Revenue increased on the back of higher revenuefrom used equipment and petroleum services.
• Recovery in the used and rental equipmentoperations and lower overheads.
S i n g a p o r e & O t h e r s
• Slow recovery in the sales amidst COVID-19labour crunch in Singapore.
• Includes loss of RM11m from Chubb Singapore inFY2021 due to contract loss provision.
-6.0%
In RM Million FY2020 FY2021
Australasia 9,914 9,619
China 4,255 4,810
Malaysia 913 945
Singapore & Others 712 630
Total Revenue 15,794 16,004
Australasia 717 670
China 212 171
Malaysia 17 31
Singapore & Others 61 39
Total Core PBIT 1,007 911
FV Loss on Financial Asset (72) (2)
Reversal of impairment on PNG assets 32 -
Total PBIT 967 909
PBIT margin 6.1% 5.7%
Core PBIT margin 6.4% 5.7%
ROIC 11.2% 10.1%
1.3%
24
25
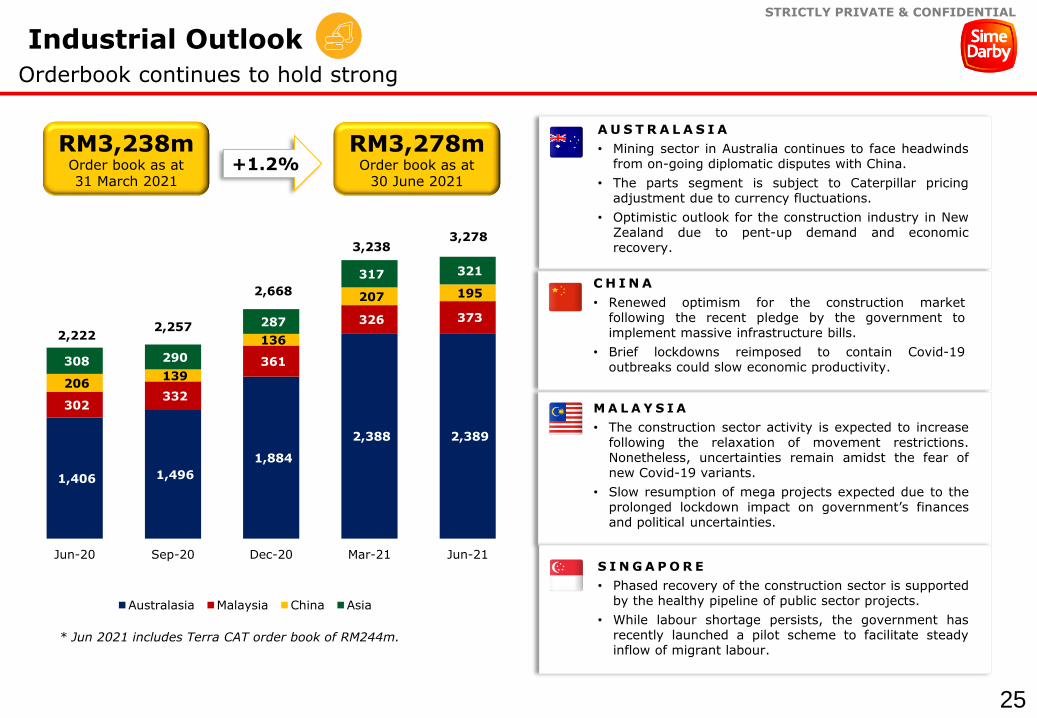
STRICTLY PRIVATE & CONFIDENTIAL
Industrial Outlook
Orderbook continues to hold strong
RM3,278mOrder book as at
30 June 2021+1.2%
A U S T R A L A S I A
• Mining sector in Australia continues to face headwindsfrom on-going diplomatic disputes with China.
• The parts segment is subject to Caterpillar pricingadjustment due to currency fluctuations.
• Optimistic outlook for the construction industry in NewZealand due to pent-up demand and economicrecovery.
M A L A Y S I A
• The construction sector activity is expected to increasefollowing the relaxation of movement restrictions.Nonetheless, uncertainties remain amidst the fear ofnew Covid-19 variants.
• Slow resumption of mega projects expected due to theprolonged lockdown impact on government’s financesand political uncertainties.
C H I N A
• Renewed optimism for the construction marketfollowing the recent pledge by the government toimplement massive infrastructure bills.
• Brief lockdowns reimposed to contain Covid-19outbreaks could slow economic productivity.
S I N G A P O R E
• Phased recovery of the construction sector is supportedby the healthy pipeline of public sector projects.
• While labour shortage persists, the government hasrecently launched a pilot scheme to facilitate steadyinflow of migrant labour.
RM3,238mOrder book as at 31 March 2021
* Jun 2021 includes Terra CAT order book of RM244m.
1,406 1,496
1,884
2,388 2,389
302 332
361
326 373
206 139
136
207 195
308 290
287
317 321
2,2222,257
2,668
3,2383,278
Jun-20 Sep-20 Dec-20 Mar-21 Jun-21
Australasia Malaysia China Asia
25

26
STRICTLY PRIVATE & CONFIDENTIAL
Motors Division
26

27
STRICTLY PRIVATE & CONFIDENTIAL
New Zealand
We represent >30 brands and operate >200 outlets in 9 markets across APAC with 43% of revenue from China
Taiwan
Australia
China
Footprint
43%
3%
15%
16%
8%
8%
6%
1%
Singapore
Malaysia
Thailand
HK & Macau
19,800Cars Assembled
FY21 Financials
85,000New Cars
28,000Used Cars
1.1 mnThroughput
5,000Rental Fleet Size
FY21 Achievements
11,700
People
Revenue RM28.2bn
+35%
PBIT RM1.0bn
+83%
Long standing partnerships
40years
40years
23years
18years
12years
49years
16years
27

28
STRICTLY PRIVATE & CONFIDENTIAL
574
1,050
PBIT
Jun-20
Jun-21
20,852
28,235
Revenue
C h i n a
• Revenge spending due to border closures
S i n g a p o r e
• Improved used car and rental vehicle margins
M a l a y s i a
• Sales tax exemption
A u s t r a l i a a n d N e w Z e a l a n d
• Revenge spending due to border closures
• Contribution from new acquisitions
In RM Million FY2020 FY2021
China, HK, Macau & Taiwan 10,308 14,057
Singapore & Thailand 3,885 5,295
Malaysia 3,256 4,129
Australia and New Zealand 3,403 4,754
Total Revenue 20,852 28,235
China, HK, Macau & Taiwan 277 551
Singapore & Thailand 21 51
Malaysia 212 252
Australia and New Zealand 90 208
Total Core PBIT 600 1,062
GST refund (Singapore) - 39
Leasehold land impairment (Hong Kong) (26) (89)
Property disposals (Malaysia) - 38
Total PBIT 574 1,050
PBIT margin 2.8% 3.7%
Core PBIT margin 2.9% 3.8%
ROIC 7.5% 14.3%
82.9%35.4%
20.3 21.6 20.9
28.3
0.5 0.6 0.6
1.0
-
0.2m
0.4m
0.6m
0.8m
1.0m
1.2m
1.4m
12m
14m
16m
18m
20m
22m
24m
26m
28m
30m
FY2018 FY2019 FY2020 FY2021
Financial performance post-demerger
Revenue PBIT RM (‘bn)
Profits doubled post-demerger on the back of investments and supportive macroeconomic trends
28

29
STRICTLY PRIVATE & CONFIDENTIAL
10,748
42,452
13,477
12,564
Units Sold FY2020
Motors Outlook
Mixed outlook amidst Covid-19 restrictions and global chip shortage
103,417Units Sold
(FY2020: 79,241)
17,141Units Assembled(FY2020: 23,831)
C H I N A
• Consumption upgrade continues to sustain thegrowth momentum for luxury cars.
• Nonetheless, government mobility restrictions causedby Delta outbreak might curtail consumption activity.
M A L A Y S I A• TIV is expected to decrease from 2020 due to
disruptions caused by the prolonged MovementControl Order (MCO).
• Sales and aftersales facilities are now allowed tooperate under all phases of the National RecoveryPlan (NRP), however consumer sentiment remainsweak on the back of economic uncertainty.
A U S T R A L A S I A
• Sales growth in both passenger and commercialvehicles are spurred by recovering economy andstronger consumer sentiment.
• However, the industry continues to be challengedby global chips shortage.
S E A S I A
• The EV industry in Singapore is envisaged tobenefit from tax incentives and stricter emissionregulations.
• The automotive industry in Thailand is expected torecover in line with an improving global anddomestic economic outlook.
15,708
54,849
16,324
16,536
Australasia China Malaysia SE Asia
Units Sold FY2021
29

30
STRICTLY PRIVATE & CONFIDENTIAL
Motors Outlook
Upcoming model launches expected in FY2022
B M W i X 3 L C IC h i n a – Q 4 2 0 2 1 / Q 1 2 0 2 2
B M W X 3 L C IM a l a y s i a – Q 4 2 0 2 1 / Q 1 2 0 2 2
B M W i XC h i n a / M a l a y s i a – Q 1 2 0 2 2
B M W i 4M a l a y s i a – Q 1 2 0 2 2 30

31
STRICTLY PRIVATE & CONFIDENTIAL
Healthcare Division
31

32
STRICTLY PRIVATE & CONFIDENTIAL
Operational Footprints
Premium tertiary hospitals with world class parentage
Note: 1. Manipal Hospitals Klang (MHK) was acquired by RSDH in May 2021.
SJMC
◼ Since 1985◼ 444 licensed beds◼ Top 2 COEs:
Haematology-oncology and neuro spine;
◼ Since 2012◼ 117 licensed beds◼ Top 2 COEs:
Orthopaedic and Cardiology
ADMC PMC
◼ Since 2012◼ 150 licensed beds◼ Top 2 COEs:
Women & children and geriatric health
MHK1
◼ Since 2016◼ 171 licensed◼ Top 2 COEs:
O&G and aesthetic surgery
RS Premier Bintaro
◼ Since 1988◼ 205 licensed beds ◼ Top 2 COEs:
Vascular Surgery and Orthopaedics Centre
RS Premier Jatinegara
◼ Since 1999◼ 280 licensed beds◼ Top 2 COEs:
Cardiac Surgery and Neurosurgery
RS Premier Surabaya
◼ Since 1998◼ 200 licensed beds◼ Top 2 COEs:
Heart Centre and Intensive Care Services
Klang Valley
Cluster Hospital in
Klang Valley
Cluster Hospital in Jakarta & Surabaya
1
1
3
24
2 3 4
Jakarta
Surabaya
5
6
7
Java Island 5 6 7
Located at heart of economic centresand affluent regions.
Indonesia’s two largest metropolitan cities with over
12mm inhabitants combined
Malaysia’s capital region with over 7mm inhabitants
1,210 operational beds
Circa 1.3 m annual outpatient visits
Circa 1K+ specialists Provides a wide range of healthcare services to premium & non-premium private & public patients.
7 hospitals
Key Highlights
32

33
STRICTLY PRIVATE & CONFIDENTIAL
FY20 data unless otherwise stated M’sia only
FACILITIES
# of hospitals 6 16 32 25
# of beds (operational) 1,210 2,696 3,410 3,105
INPATIENT
Avg. revenue per inpatient admission RM9,835 RM8,428 RM6,147 RM3,511
Revenue per bed RM0.56mn RM0.50mn RM0.44mn RM0.21mn
Inpatient ALOS (avg. length of stay) 3.7 days 2.9 days 2.6 days 3.2 days
Bed occupancy rate (%)
OUTPATIENT
Avg. revenue per outpatient RM242 Not available RM253 RM166
Operational Highlights
Operational capabilities comparable with key regional healthcare operators
Source: RSD management report, company annual reports and investors presentation. Note: (a) FYE for all peers: 31 Dec. (b) Rates as of 22 July 2021. RM/ Thai Baht : 7.78, RM/IDR = 3,433
62% 57% 70%49% 60%
45% 60% 53%
FY19 FY20 FY19 FY20 FY19 FY20 FY19 FY20
33

34
STRICTLY PRIVATE & CONFIDENTIAL
Healthcare Strategy Blueprint
Focused on growing its core business within the healthcare space
Organic Growth Brownfield
development Optimisation
StrategiesInorganic Growth
▪ Continue to drive clinical excellence, prioritize patient safety and service quality
▪ Enhance total customer experience
▪ Expansion and upgrading plan for mature hospitals to maximise existing hospital footprint
▪ Replacement of existing strategic assets to maximize value
▪ Capitalize on trend towards prevention and well being
▪ Accelerate growth and diversify geographic footprint through acquisitions
Vision: To develop a regional tertiary healthcare platform with a
core focus on tertiary care services.
Organizational Structure
Availability of Capital
Medical expertise
Key Enablers:
Remains focused on delivering as a regional premium healthcare operator and a “provider system of choice” in the markets in which RSDH operates, as well as new areas of growth in adjacent businesses related to healthcare.
34

35
STRICTLY PRIVATE & CONFIDENTIAL
Targ
et
Overvie
wT
ran
sacti
on
H
igh
lig
hts
RM 247 million
Equity Value
RM 370 million
Enterprise Value
Deal Update
▪ Deal: In May 2021, RSDH acquired 100% equity stake of MHK for RM 370mn Enterprise Value (EV).
▪ Financial implication: RSDH internally funded the acquisition. The acquisition resulted in pro forma net debt/ EBITDA of 1.9x (still manageable).
Investment Rationale
▪ Strategic expansion enables RSDH to establish presence in Klang with favorable demographics trends and underpenetrated healthcare infra.
▪ Synergy benefits include cross-referrals, procurement savings from drug and medical supplies.
▪ Transaction adds scale and contributes to approximately 10% of total RSDH group revenue.
Manipal Hospitals Klang(MHK) is a 220-bed capacity(165 licensed beds), MSQHaccredited tertiary carehospital in Klang, Selangorwith 5 operating theatres and15 ICU beds. Commencedoperation in 2016.
Recent Transaction
Note:1. MHK’s FYE 31 March
Scale up through acquisitions – Manipal Hospitals Klang
35

36
STRICTLY PRIVATE & CONFIDENTIAL
Healthcare FY21 vs FY20
61% drop due to tax adjustments, asset impairment and dividend withholding tax
39
15
Healthcare PBIT
Jun-20 Jun-21
Healthcare
In RM Million
FY2020 FY2021
Healthcare PAT
39 15
Healthcare ROIC
6.0% 2.3%
• Results included write-down ofdeferred tax assets, impairmentof assets and dividend withholdingtax
-61.5%
Healthcare PAT(Share of Profit)
644
705
781
828
885
966
969
1,0
78
97 114 137 163 185 205 215 241
15%16%
17%
20%21% 21%
22% 22%
0%
5%
10%
15%
20%
0
200
400
600
800
1,000
1,200
FY14 FY15 FY16 FY17 FY18 FY19 FY20 FY21
Historical Financials RM Mn
Revenue EBITDA EBITDA Margin
(15 months)
▪ Pre-Covid (FY14-19) Revenue CAGR : 8%▪ Pre-Covid (FY14-19) EBITDA CAGR : 16%
• RSDH Group Revenue stood at RM 1,078 m (increase of 11 YoY from
2020) mainly due to delivery of COVID related cases services as well as
higher acuity case mix which resulted in higher net revenue per patient
day
• Solid recovery in YTD EBIT with 33 YoY growth on the back of strong
rebound across all hospitals, especially in Indonesia. However, the EBIT
was impacted by one off impairment charges of RM 139 m for operations
in Hong Kong
• Improved margins attributed to solid recovery in revenue which more
than offset the higher supplies costs mainly due to increase usage of PPE
as well as higher proportion of acuity cases across both Malaysia &
Indonesia
36

37
STRICTLY PRIVATE & CONFIDENTIAL
THANK YOU
2637