Sapura Energy Berhad
210
2022
-
Upload
khangminh22 -
Category
Documents
-
view
1 -
download
0
Transcript of Sapura Energy Berhad

2022

CONTENTS• Provides a comprehensive overview of the Group’s
performance for FY2022 and the outlook for FY2023
REGULATIONS COMPLIED• Companies Act, 2016• Bursa Malaysia Main Market Listing Requirements• Malaysian Code on Corporate Governance
O U R R E P O R T I N G S U I T E
This Annual Report is available atwww.sapuraenergy.com

What’s
Inside
STRATEGIC REPORT (MANAGEMENT DISCUSSION AND ANALYSIS)
8 Joint Review by Chairman and Group
Chief Executive Officer
18 Key Risks and Mitigation
23 Five-Year Financial Highlights
24 Five-Year Financial Summary
25 Sustainability at Sapura Energy
GROUP OVERVIEW
2 Overview of Sapura Energy Berhad
– Who We Are | Our Vision | Our Core Values
3 Our Value Chain
3 Group Corporate Structure
4 What We Do: Core Business Segments
6 Our Global Footprint
CORPORATE GOVERNANCE
28 Corporate Governance Overview Statement
44 Group Organisation Structure
45 Corporate Information
46 Profile of Board of Directors
56 Board Composition & Board Committee
57 Executive Committee Profiles
61 Statement on Risk Management and Internal Control
64 Report of Board Audit Committee
69 Additional Compliance Information
70 Statement of Directors Responsibility
71 Analysis of Shareholdings
FINANCIAL STATEMENTS
80 Directors’ Report
86 Statement by Directors
86 Statutory Declaration
87 Independent Auditors’ Report
92 Consolidated and Separate Statements of
Profit or Loss
93 Consolidated and Separate Statements of
Comprehensive Income
94 Consolidated and Separate Statements of
Financial Position
96 Consolidated Statement of Changes in Equity
97 Company Statement of Changes in Equity
98 Consolidated Statement of Cash Flows
100 Company Statement of Cash Flows
101 Notes to the Financial Statements

who we areSapura Energy Berhad is a global integrated energy services and solutions provider operating across the entire upstream value chain, including renewables. The Group’s spectrum of capabilities covers exploration, development, production, rejuvenation, decommissioning, and abandonment.
With a highly skilled and technically capable workforce, versatile strategic assets, and strong project management capabilities, the Group today delivers its integrated solutions and expertise to clients in over 20 countries.
our visionTo be a trusted and sustainable global energy and solutions company.
our core values
Safe
Honest
Accountable Respectful
Prof
essi
onal
S.
H.A.R.P BUILDS TRUST
Global footprint across
5 continents
10 key global operating centres
2
Group Overview
OVERVIEW OF SAPURA ENERGY BERHAD

EXPLORATION&
PRODUCTION
OPERATIONS&
MAINTENANCE
ENGINEERING&
CONSTRUCTIONCORPORATEDRILLING
Exploration Development Production Rejuvenation Decommissioning & Abandonment
Sap
ura
En
erg
y B
erh
ad
An
nu
al R
ep
ort
20
22
3
Group Overview
OURVALUE CHAIN
GROUP CORPORATE STRUCTURE

ENGINEERING & CONSTRUCTIONSapura Energy ’ s Eng ineer ing and
Construction business provides end-to-end
turnkey Engineer ing, Procurement,
Construction, Installation, and Commissioning
(“EPCIC”) solutions for the energy industry,
including renewables. Supported by a highly
capable and technically competent in-house
engineering team, versatile strategic assets,
and project management expertise, we
deliver services across the full EPCIC
spectrum and adjacent markets.
Major Fabrication Yard1 Pipe-lay Vessels6
Remotely Operated Vehicles41
Subsea Diving Construction Vessel1
Floatover Launch Barge1
Derrick Lay Vessels & Barges5
Subsea Construction Support Vessels3
OPERATIONS & MAINTENANCESapura Energy’s Operations & Maintenance
business offers an extensive one-tiered
service suite for the onshore plant
maintenance and offshore support, by
combining the capabilities of Hook-up &
Commissioning, Offshore Service Vessel,
and Geoscience services. It includes
expertise from our Technology Service
business for Telecommunications, Crane,
and Rotating Equipment services. Supported
by our strategic assets, we aim to provide
clients with seamless operations and
maintenance services under one contract.
Accommodation Boats & Barges4Fabrication Yards2 Anchor Handling Tug
Supply Vessels2
Survey Vessel1 Turbine Maintenance Centre1
4
Group Overview
WHAT WE DO: CORE BUSINESS SEGMENTS

EXPLORATION & PRODUCTIONCombining creativity, technical expertise,
and entrepreneurial focus, our Exploration
and Production business provides the
exploration, development, and production
solutions to extract returns from even
the smallest and most challenging fields.
Production Sharing Contracts4 Exploration
Permits9
DRILLINGWith close to five decades of experience
in tender-assist drilling operations, Sapura
Energy’s Drilling business is the owner
and operator of the world’s largest fleet
of tender-assist drilling rigs. As the
pioneer, our mission is to provide the
safest operations paired with sustainable
technical solutions for the most efficient
and cost-effective delivery for our clients’
development and production drilling
programmes.
Semi-Tender units6 Tender-Barge
units8
Sap
ura
En
erg
y B
erh
ad
An
nu
al R
ep
ort
20
22
5
Group Overview

United Statesof America
Bangkok
Houston
Ciudaddel Carmen
Rio de Janeiro
Mexico City
London
Luanda
Al Khobar Dubai
Mumbai
Abu Dhabi
Rotterdam
Perth
Jakarta
LumutKuala Lumpur Brunei
Vũng Tàu
Australia
Vietnam
Singapore
Indonesia
Malaysia
Mexico
BrazilAngola
NetherlandsUnited Kingdom
IvoryCoast
United ArabEmirates
IndiaSaudi Arabia
Thailand
Our
GlobalFootprint
This global footprint is based on the United Nations’ issued map.
The designations employed and the presentations of the material on this map do not imply the expression of any opinion whatsoever on the part of Sapura Energy Berhad or its subsidiaries (the “Group”) concerning the legal status of any country, territory, city or area or of its authorities, or concerning the delimitation of its frontiers or boundaries.
6
Group Overview

United Statesof America
Bangkok
Houston
Ciudaddel Carmen
Rio de Janeiro
Mexico City
London
Luanda
Al Khobar Dubai
Mumbai
Abu Dhabi
Rotterdam
Perth
Jakarta
LumutKuala Lumpur Brunei
Vũng Tàu
Australia
Vietnam
Singapore
Indonesia
Malaysia
Mexico
BrazilAngola
NetherlandsUnited Kingdom
IvoryCoast
United ArabEmirates
IndiaSaudi Arabia
Thailand
Sap
ura
En
erg
y B
erh
ad
An
nu
al R
ep
ort
20
22
7
Group Overview
Dear Shareholders,
FY2022 was one of the most challenging years in Sapura Energy’s
history. Following the protracted downturn in new investments
in the oil and gas sector and the COVID-19 pandemic, Sapura
Energy faced severe financial constraints in the year under
review.
8
Strategic Report (Management Discussion and Analysis)
JOINT REVIEW BY CHAIRMAN AND GROUP CHIEF EXECUTIVE OFFICER

Financial Year 2022 (“FY2022”) was one of the most challenging years in Sapura Energy Berhad’s (“Sapura Energy” or the “Group”) history. Following the protracted downturn in new investments in the oil and gas sector and the COVID-19 pandemic, Sapura Energy faced severe financial constraints in the year under review.
On 31 May 2022, Sapura Energy made an announcement to Bursa Malaysia stating that it has triggered the prescribed criteria pursuant to the Listing Requirements under Practice Note 17 (“PN17”). The Group has taken steps to regularise its business through a Reset Plan, launched in FY2022.
As a matter of urgency, this means reducing our unsustainable debt burden; reaching an amicable resolution with our vendors on outstanding payments; and fixing operational issues that were mainly the result of unfavourable contracts signed before the pandemic.
Sapura Energy’s Board of Directors (the “Board”) created a Board Restructuring Task Force (“BRTF”) in December 2021, to strengthen our management and governance functions.
We also took a major step towards restructuring our debts in a fair and orderly manner through negotiations with our creditors, when we obtained court orders to begin the Scheme of Arrangement (“SOA”) process in March 2022.
These orders provided us the necessary space and framework to execute our Reset Plan and the Board is determined to use this opportunity to establish a clear path towards the Group’s recovery.
It is important to stress that, despite the current financial difficulties, Sapura Energy maintained competitiveness in the global energy services market; and continued to win work in Malaysia and internationally.
Building on this capability, the Board is confident the Reset Plan is on track to deliver improved results in Financial Year 2023 (“FY2023”), placing us on the right path towards financial and operational stability.
OPERATING ENVIRONMENT
The operating environment during the year remained highly challenging for oil and gas services companies. Globally, the oil and gas sector has seen chronic underinvestment for nearly a decade, with worldwide upstream investment falling from USD779 billion in 2014 to USD328 billion in 2020. Following a collapse in oil prices in 2014, the subsequent years saw a “lower-for-longer” oil price environment that took a heavy toll on capital spending in the oil and gas sector. Exploration and Production (“E&P”) companies worldwide slashed capex by about half in 2015 and 2016, and industrywide spending has continued to remain muted.
The ultra-competitive business environment forced many oil and gas services companies, including Sapura Energy, to adopt aggressive competitive strategies and assume disproportionate risks when bidding for contracts. The lump sum, or Engineering, Procurement, Construction, Installation, and Commissioning (“EPCIC”) contracts, that became the norm, came with high risks and compressed margins, which offered little in the way of a safety net for contractors in the face of adverse events.
Consequently, these factors had a devastating impact on oil and gas services companies during the pandemic, forcing some of the leading global players to undertake corporate restructuring. Clients and service contractors are also still grappling with the legal and contractual implications of COVID-19 expenses, for which there were no provisions in pre COVID-19 contracts. Service contractors like Sapura Energy have faced difficulties in recovering COVID-19 claims that have been expensed up-front. In turn, these companies have been struggling to meet their debt obligations and mounting payables to their subcontractors.
The rebound in energy prices that began in the first quarter of 2021 has yet to translate into sustained capital spending, as oil and gas producers maintain a cautious approach to the volatile energy prices. Our clients generally take an average of 12 to 18 months to sanction new projects after assessing its feasibility, followed by a tender process. This has led to a lagged effect for service providers, despite the rising energy price.
Additionally, the transition towards cleaner forms of energy continues to accelerate, driven by a combination of public demand, regulatory changes, and growing financial returns, resulting in a growing proportion of new energy investment being directed towards renewables, rather than traditional oil and gas.
Notwithstanding the continued uncertainties, the prospect for the oil and gas services industry going forward is expected to be better in the coming years. A rebound in global economic activity and the fallout from the Russia-Ukraine conflict support the need for additional investment in hydrocarbons, especially gas.
Sap
ura
En
erg
y B
erh
ad
An
nu
al R
ep
ort
20
22
9
Strategic Report (Management Discussion and Analysis)

The BRTF has already made early progress in the implementation of these plans.
We have improved our financial management by focusing on cash generation and profitability, rather than headline revenue. Working with independent advisors, we have also rebuilt our financial infrastructure to give us better visibility into our cash flow, even down to the project level, and to provide better insight into where our costs are.
Additionally, in March 2022, the High Court of Malaya (“the Court”) granted Sapura Energy and 22 of its wholly-owned subsidiaries Orders under Sections 366 and 368 of the Companies Act 2016. With these orders in place, the Group is negotiating with creditors, to consider and approve a proposed SOA as part of its debt restructuring plan.
The Court also granted Sapura Energy a Restraining Order (“RO”) to stay legal proceedings against us, which will help the Group engage with creditors without disruption to operations. Additionally, our lenders also agreed to a standstill during the period of the RO.
The proposed SOA, if approved by the creditors and sanctioned by the Court, will enable the Group to carry out its proposed debt restructuring and provide a firm framework for fair and equitable resolution to our creditors.
As part of the standstill agreement with our creditors, Cosimo Borrelli joined the Board as a court-appointed Non-Independent Non-Executive Director to represent the interests of our creditors on 25 March 2022. Cosimo’s extensive experience in cash flow management will be a major help to the Group’s pursuit of financial stability.
At the same time, the Group has also embarked on a series of negotiations with clients on legacy contracts to recover or limit project losses. In February 2022, the Group terminated the contract for the transportation and installation of monopiles at the Yunlin offshore wind farm in Taiwan. The decision was taken after exhausting avenues for an amicable solution.
On the operational side, we strived to maintain profit margins and reduce risks in projects by adopting the mantra “Bid Right, Execute with Discipline” for all new prospects. This means focusing our bidding on contracts in markets where we are highly competitive; at the right cost; and with clear visibility on risks we are assuming. Going forward, our focus will be on project profit margins rather than headline revenue.
Our increasingly-selective approach to tenders saw the total value of our bid book decline from RM54 billion at the start of FY2022 to RM28 billion by the end of FY2022. Our new approach will see us focus on the Asia-Pacific and Atlantic regions, where we have extensive project experience and existing assets.
ADDRESSING OUR OPERATIONAL AND FINANCIAL CHALLENGES
The challenge for our project teams is to deliver on promises to clients, while maintaining profitability in these projects. In FY2022, this has not always been possible.
Almost all our loss-making projects were from contracts won prior to the pandemic, which imposed onerous terms and did not include unforeseeable costs brought about by COVID-19 restrictions. Pandemic-related project delays, higher material and implementation costs, and global supply chain disruptions have resulted in Sapura Energy incurring operating losses in the financial year under review.
Cash flow constraints were made worse following our lenders’ decision to severely curtail the use of our working capital facilities since October 2021. This has forced Sapura Energy to utilise internal resources to finance projects. Cash flow constraints have resulted in missed payments to vendors, with overdue payables amounting to more than RM1 billion by end FY2022. Addressing these financial and operational issues is our key priority as we move forward.
OUR STRATEGIC RESET PLAN
In December 2021, the Board announced the establishment of BRTF to provide oversight and support to the Management Team as they embarked on its Reset Plan. The Reset Plan aims to restructure Sapura Energy and overcome immediate financial and operational challenges.
The BRTF, and various workstreams under the taskforce, reviewed the Group’s capital structure and financial framework, as well as its operating model and future business direction. The Reset Plan sets out these objectives:
• Rebuild our balance sheet by improving the Group’s capital structure and financial framework, including reducing unsustainable debt and resolving aged payables;
• Enhance Operational Excellence through the principle of “Bid Right, Execute with Discipline”. This entails refocusing our bid funnel based on capabilities and risk appetite, improving productivity and project execution discipline, and implementing a more robust risk management framework;
• Renegotiate contracts with key clients to ensure projects are at minimum cash neutral or better; and
• Chart future business direction by reviewing the Group’s portfolio and organisation, to rationalise core businesses in line with energy transition plans.
10
Strategic Report (Management Discussion and Analysis)
JOINT REVIEW BY CHAIRMAN AND GROUP CHIEF EXECUTIVE OFFICER

At the same time, we have tightened discipline in project implementation and execution, to ensure that the contracts we undertake are executed safely and efficiently. The Group’s Enterprise Risk Management Framework, with appropriate risk appetites across our value chain, will be a key enabler to sustained performance.
Sapura Energy will also be divesting assets that are not core to our business plan, in order to sharpen our operational focus and free up capital. The Group is also seeking sources of new funds to finance its business plan as it restructures its business and streamlines its operations.
Strategic Priorities for Sapura Energy in FY2022
Our commitment to cost optimisation and productivity extended to all levels of the organisation. The Group reorganised its Engineering and Construction (“E&C”), Operations and Maintenance (“O&M”), and Finance divisions to improve efficiency. Similarly, the Board undertook a composition review, in terms of size and skillsets, to match the Group’s current and future requirements in executing its Reset Plan. The Board will also propose a significant reduction in their remuneration at the upcoming Annual General Meeting, in solidarity with senior management, which has maintained a 30 to 40 percent reduction in their pay since 2020, with no bonuses paid out.
Challenges
Priorities
Uncertain recovery in capex spending
Turnaround to profitability
Keep our people safe & mitigate risks
Strategic portfolio rationalisation
COVID-19 still a threat
Rebuild balance sheet
Cash generation through "Bid Right, Execute with Discipline"
Sap
ura
En
erg
y B
erh
ad
An
nu
al R
ep
ort
20
22
11
Strategic Report (Management Discussion and Analysis)

OUR FINANCIAL PERFORMANCE
In what has been an extremely challenging year, Sapura Energy recorded revenue of RM4.1 billion in FY2022, 23 percent lower than the RM5.3 billion recorded in FY2021, primarily due to the lower contribution from our E&C segment. The lower revenue for the year reflected the challenges in the operating environment and our increasingly selective approach to tendering for contracts.
The Group posted a loss after taxation and minority interests (“LATAMI”) of RM9.1 billion for FY2022, compared to a LATAMI of RM160.9 million in the previous financial year. Our loss in FY2022 comprised an operating loss of RM2.2 billion and RM5.6 billion in provision for impairment. The Group recognised a RM3.3 billion provision for impairment on goodwill and a RM2.3 billion provision for impairment on property, plant, and equipment in FY2022.
Key drivers behind the impairment assessment include lower projected income and cash flow from our Drilling, E&C, and O&M businesses.
Tender-assist drilling rigs in the development drilling sub-segment is expected to see slower recovery compared to the exploration drilling sub-segment, and lower market rates than anticipated. The recent requirement to reduce the age of rigs from 35 to 30 years for technical and safety reasons also reduces the projected income and cash flow of each of our rigs.
Meanwhile, the E&C and O&M sectors have rebalanced their business focus from long-term and high risk EPCIC contracts, to short-term and low risk transportation and installation (“T&I”) contracts. This is reflected in lower projected net earnings to the Group. Sapura Energy is also planning to divest its non-core assets, which may result in lower cash generation.
The COVID-19 pandemic continued to have a major impact on the Group’s financial performance in FY2022. Almost all of the RM2.2 billion operating losses resulted from legacy contracts that we signed before FY2021, which did not include COVID-19 provisions.
The Group incurred about RM570 million in direct costs from COVID-19 since the start of the pandemic. These direct costs include vessel standby expenses, as well as testing and quarantine costs for crew and employees, and the cost of deploying the Group’s own vaccination programme. Apart from the direct costs incurred, the pandemic also resulted in additional expenses due to procurement delays and changes to project schedules. These consequential costs, which can be much higher than direct costs, severely eroded the profitability of certain projects. As yet, Sapura Energy has recovered only a small portion of these additional costs and is in the process of negotiating with clients to reimburse these costs.
Our exposure to pre-pandemic contracts is expected to be reduced in FY2023. Such legacy contracts account for about half of our revenue composition in the first quarter of FY2023 and we expect to reduce this portion to about 27 percent by the end of FY2023.
Almost all of the operating losses resulted from legacy contracts that we signed before FY2021, which did not include COVID-19 provisions.
E&C AND O&M SECTORS HAVE REBALANCED THEIR BUSINESS FOCUS FROM LONG-TERM AND HIGH RISK EPCIC, TO SHORT-TERM AND LOW RISK T&I CONTRACTS.
12
Strategic Report (Management Discussion and Analysis)
JOINT REVIEW BY CHAIRMAN AND GROUP CHIEF EXECUTIVE OFFICER

1. Safety Performance
2. Financial Performance (Amounts in RM million)
Description FY2021 FY2022
Lost Time Injury Frequency (LTIF) 0.20 0.63
Fatality 0 0
Total Recordable Injury Frequency (TRIF)
0.99 2.16
Year on Year
Description FY2021 FY2022
Revenue 5,348 4,100
EBITDA/(LBITDA) 810 (2,276)
LATAMI (161) (9,051)
257Perfect Safe Days
PATAMIReported
AssetImpairments
GoodwillImpairments
Others PATAMINormalised
(3,397)483,290
2,316
(9,051)
257/365 (70 percent) Perfect Safe Days in 2021
3. Delivery 4. Projected Revenue Composition from Secured Projects in FY2023
Total Bids by Regions Orderbook (RM billion)
RM28 billion
APAC30%
Atlantic58%
MiddleEast12%
Rec
og
nit
ion
by
Div
isio
nR
eco
gn
itio
n b
y FY
Middle EastAtlantic
APAC
Total E&C Drilling O&M
Group FY2023 FY2024 FY2025
5.7 4.3
0.30.2
4.0
0.30.2
0.7
0.60.90.1
1.2
0.4
0.5
0.2
5.7
0.70.2
6.6
6.6
4.5
5.0
1.0
1.6
0.5
0.6
Q1 FY23 Q2 FY23 Q3 FY23 Q4 FY23
Contract based:
Legacy
Contract based:
New Contract
Day-rate revenue
• Less exposure to pre COVID-19 contracts
• Execute with discipline
• 16% – 26% stable day rate margin
18% 26% 16% 18%
28%
38% 58% 55%
54%
36% 26% 27%
Note: FY2023 expected revenue from current Order Book (~RM5 billion)
PERFORMANCE AT A GLANCE
Completed 36 globally in FY2022,
continued to execute 59 projects
3 Group Bid Book and Order Book as of January 2022
Sap
ura
En
erg
y B
erh
ad
An
nu
al R
ep
ort
20
22
13
Strategic Report (Management Discussion and Analysis)

SEGMENTAL PERFORMANCE
Our four core business segments continued to adapt to the difficult operating environment by focusing on its core strengths and enhancing operational efficiencies. However, their overall financial performance was negatively impacted by the large impairment charges recorded, and by loss-making projects.
Our Engineering & Construction segment recorded revenue of RM2,818.4 million in FY2022, which was 28 percent lower than the RM3,940.0 million recorded the previous year. The decline was primarily due to the lower percentage of completion recognised in the current year.
The segment recorded a loss of RM4,328.6 million in FY2022, compared to a profit of RM246.9 million in the previous financial year. E&C has made provision for impairment on goodwill of RM1,621.5 million (FY2021: RM Nil) and provision for impairment on property, plant, and equipment of RM284.5 million (FY2021: RM Nil) in the current year. The E&C segment’s loss before impairment for FY2022 stood at RM2,422.7 million, compared to a profit before impairment of RM246.9 million in FY2021, mainly due to provision for foreseeable losses and higher project costs.
The operating environment for the E&C business remained challenging in FY2022 and we continued to maintain stringent cash management policies. We took measures to mitigate the impact of the COVID-19 pandemic on our performance by including pandemic clauses in our new and ongoing tenders and negotiating the recovery of pandemic claims from legacy contracts. The E&C segment has also adopted a more focused approach to growth, simplifying our operating structure, and concentrating on our operations in the Asia-Pacific and Atlantic Regions, where we have strategic assets. This has resulted in a smaller order book with better risk management.
Our Operations and Maintenance segment achieved revenue of RM406.1 million in FY2022, while continuing to maintain and deliver on all long-term contracts to our clients, despite the challenges of the year. The deferral of numerous brownfield projects during the pandemic has also opened stronger growth prospects for us as we move forward, with an increase in tenders for FY2023. With several of our multi-year contracts in Malaysia coming up for renewal in FY2024, O&M continues to expand and strengthen its range of services and quality of delivery to ensure that we remain competitive in bidding.
Moving forward, we will focus on expanding our client base and moving into non-traditional market segments as we seek to diversify our income streams and pursue new growth areas. We aim to provide a differentiated service offering to our clients, by combining the capabilities of hook-up & commissioning, offshore support vessel, and geoscience, as well as the expertise from our technology service business, which includes telecommunications, crane, and rotating equipment services.
Our Drilling segment delivered revenue of RM1,033.4 million for FY2022, a 42 percent rise on the RM728.4 million recorded in the previous year. The rise was driven by an increase in rig activities, commencement of integrated drilling services, and higher effective day rates achieved in the current year. Nonetheless, the segment recorded a loss of RM3,630.0 million, compared to a profit of RM4.5 million in FY2021. The higher loss reflected an impairment on goodwill of RM1,668.4 million and provision for impairment on property, plant, and equipment of RM2,030.4 million. On an operational basis, the segment recorded a loss before impairment of RM68.8 million, which was a marked improvement on the RM4.5 million profit in FY2021.
The outlook for the Drilling segment is significantly stronger as we move forward, with multi-year contracts secured in Malaysia, Thailand, and Africa, as clients sought to lock-in our drilling rigs in advance of further price hikes. We now have 11 drilling rigs contracted to start or continue work in FY2023, which will see our rig utilisation rate rise from 57 percent in the current year to 78 percent in FY2023.
14
Strategic Report (Management Discussion and Analysis)
JOINT REVIEW BY CHAIRMAN AND GROUP CHIEF EXECUTIVE OFFICER

Our Exploration & Production segment, operated through associate company SapuraOMV Upstream Sdn. Bhd. (“SapuraOMV”) recorded a share of loss, net of tax amounting to RM142.1 million. This is higher than the share of loss, net of tax of RM38.5 million in the previous year, and is mainly due to impairment and write off for certain wells and goodwill recognised, offset with lower share of loss and contributed by higher gas production following SK408 being fully on stream in 2021. During the year, we continued to shift our focus towards gas production, disposing of all our oil producing assets in Peninsular Malaysia and reaching a final investment decision with our partners on the Jerun Gas Development Project. In partnership with Santos Ltd. and Neptune Energy, we were also awarded three exploration permits in Western Australia.
The business environment has grown increasingly favourable for SapuraOMV as energy prices rebound due to rising demand. However, the energy industry has also seen a rise in operating costs, which we will continue to monitor as we assess the commercial viability of projects. SapuraOMV will continue providing stable gas supply to Malaysia LNG, from Blocks SK408 and SK310, while its Jerun Gas development project on SK408 is progressing safely, on time, and on budget. The strategic partnership is self-funding in FY2023.
Moving forward, SapuraOMV aims to capitalise on the improved outlook by reinvigorating our exploration activities in Malaysia through new acreage awards and participating in bid rounds and farm-in opportunities.
OUR ACCOUNTABILITY TO THE MALAYSIAN ENERGY INDUSTRY
While we implement commercial solutions to our financial and operational issues, we are also cognisant of our responsibility towards Malaysia’s energy industry ecosystem. Our effort to turn around Sapura Energy is driven by a sense of accountability to our stakeholders, the majority of whom are Malaysians. We hope that by preserving Sapura Energy’s capabilities, we will enable our Malaysian employees, shareholders, lenders, and vendors to continue contributing to the country’s energy ecosystem.
Sapura Energy has endeavoured to make a positive impact on Malaysia’s energy industry. We directly contribute about RM800 million to the country’s economy annually, in addition to spending approximately RM1.6 billion on local suppliers each year. Our domestic operations also contribute directly to the efficiency of E&P companies in Malaysia, with analysts estimating that such E&P companies could see their production costs rise by RM760 million per year if they were forced to use foreign service providers.
Even more vital are the human and intellectual capital that we contribute to the nation. Sapura Energy directly employs more than 8,000 people and sustains an estimated 20,000 jobs for workers hired by our local subcontractors. Additionally, the capabilities that Sapura Energy has built would be difficult for other local companies to replace. If we cease to operate, the country’s energy industry will lose vital capacity in the areas of EPCIC project implementation, engineering, fabrication, drilling, offshore transportation and installation, as well as decommissioning and disposal. This, in turn, will result in reduced market access and business opportunities for the Malaysian vendors with whom we collaborate on both local and international projects.
Sapura Energy is acutely aware of our obligations to diverse stakeholders – our people, our vendors and partners, our creditors, and the nation. We are determined to take all necessary actions to ensure we meet these obligations and continue to support the energy industry and the communities where we operate.
OUR PEOPLE
Our people are at the core of our business and we continue to invest in their wellbeing and training, and inculcate in them the Sapura Energy Values, which form the foundation of everything we do.
During the year, we spent a total of 21,179 man-hours on training. As part of our cost savings initiative and corporate culture, the Group prioritised training with the help of 27 internal subject matter experts. The training sessions covered a wide range of technical, financial, and business modules geared towards the evolving needs of our company. We also introduced the professional development series, which covers behavioural and proficiency toolkits for our professional-level employees. As part of our commitment to maintain the highest levels of integrity across our business, we continued to provide online training on compliance, with an 85 percent participation rate across our company.
To ensure business continuity and strengthen the talent pipeline across our Group, the Board also reviewed our Succession Plan, identifying critical roles within the organisation as our business continues to evolve. We identified potential successors with proven track records to assume senior roles; and continued to assess our middle-management pool to identify top talents for future leadership.
Sap
ura
En
erg
y B
erh
ad
An
nu
al R
ep
ort
20
22
15
Strategic Report (Management Discussion and Analysis)

OUR COMMITMENT TO ETHICS, GOOD GOVERNANCE, AND SUSTAINABILITY
Sapura Energy and its Board strive to adhere to the highest ethical standards in discharging responsibilities and continue to promote integrity and ethical conduct among employees in all aspects of the Group’s business operations.
The Group has in place a Code of Ethical Conduct and an Anti-Bribery and Corruption Policy Statement, which compels Sapura Energy and all its employees to act responsibly, accountably, and with transparency, in all areas of operation. Sapura Energy adopts a zero-tolerance approach to bribery and corruption and is committed to acting professionally, fairly and with integrity in all its business dealings and relationships, upholding all laws in Malaysia and all other jurisdictions in which it operates. The Group also maintains a Whistleblowing helpline, which is accessible to employees or other stakeholders at www.sapuraenergy.ethicspoint.com; as part of its commitment to an open working environment, where honest communication is the expectation and not the exception.
Sapura Energy is committed to developing a sustainable growth model and we recognise our responsibility to reduce carbon footprint, enhance energy efficiency, and reduce waste. To deliver these outcomes, our company is actively developing internal policies and processes that will deliver continued improvements in these areas; and ensure our full compliance with environmental regulations. Our commitment to sustainability extends beyond our own operations. We are also improving our supply chain screening process to ensure that we comply with social and environmental standards across our value chain.
We have also continued to strengthen our sustainability governance framework. During the year, we worked to incorporate the requirements and recommendations of Bursa Malaysia’s Sustainability Reporting Guide and the Security Commission’s 2021 update of the Malaysian Code on Corporate Governance into our sustainability framework. Additionally, we undertook an assessment of the recommendations from of the Taskforce on Climate-related Financial Disclosures as a framework to inform Sapura Energy’s future reporting of climate-related risks and opportunities. However, these initiatives are currently on-hold as the Group focuses on resolving its financial condition as a matter of immediate priority.
The Board together with the management had also put in place a Labour & Human Rights Policy, as part of its commitment to protect our people; and provide a workplace that is safe, open, and conducive to developing employee potential. The Group does not condone any form of forced labour including child labour, or any form of discrimination that is against the values we believe in.
Sapura Energy also fully supports the government’s minimum wage policy, with 100 percent implementation of the minimum wage to ensure our full-time employees – permanent and on contract – can earn a living wage for their families.
ENSURING HEALTH AND SAFETY
The nature of the business in which we operate inherently carries a degree of safety risk and Sapura Energy maintains a robust and comprehensive Health, Safety, and Environment (“HSE”) Management System that helps to identify and manage these potential risks. This includes providing our employees with the necessary training to recognise and respond to job-related risks, as well as routinely conducting HSE audits. Our commitment to our people’s wellbeing is paramount and we are proud to share that the effective implementation of these policies ensured that our company recorded zero workplace fatalities during the year.
The COVID-19 pandemic remained a pervasive factor in FY2022 and Sapura Energy continued to refine and implement a range of standard operating procedures (“SOP”) to safeguard the health and safety of our people. Our various operating units also continued to ensure the robustness of their Business Continuity Plans, which have been tailored for scenarios specific to their business operations.
In collaboration with the local health authorities, Sapura Energy rolled out its own vaccination programme in Lumut Fabrication Yard, administering over 4,000 doses of vaccines to protect our people. Following the successful implementation, we expanded our vaccination programme across operating offices and assets in Malaysia, including our crew onboard offshore vessels, and coordinated with our international offices to run their own vaccination programme aligned to local regulations.
To-date, over 95 percent of employees across the Group have achieved fully vaccinated status.
The HSE systems, SOPs, and Business Continuity Plans ultimately serve one simple aim: to ensure our people can safely go home to their families.
16
Strategic Report (Management Discussion and Analysis)
JOINT REVIEW BY CHAIRMAN AND GROUP CHIEF EXECUTIVE OFFICER

ACKNOWLEDGEMENTS
On behalf of Sapura Energy, we would like to thank our shareholders for their continued support and confidence in our company.
We would also like to thank the Board of Directors for their efforts and dedication as we work to return our company to growth. In particular, we wish to express our utmost gratitude to our past chairman, Tan Sri Dato’ Seri Shamsul Azhar Abbas, for his guidance as we navigated the challenges of the last year. We also would like to record our sincere appreciation to outgoing senior independent director Tan Sri Dato’ Megat Zaharuddin Megat Mohd Nor his role in setting the foundation for the operational Reset of our organisation. These gentlemen rolled up their sleeves to ensure we put in place the right framework from which we may create a stable platform and grow in the future.
We are also grateful for the engagement and support that we have received from our clients, vendors, lenders, and regulators in helping us move forward and in facilitating our corporate turnaround.
Above all, we wish to sincerely thank everyone in the Sapura Energy team, for consistently delivering to the best of their abilities, and for surmounting enormous challenges with resourcefulness. With your help, we will Reset Sapura Energy and rebuild our path to the future.
Dato’ Mohammad Azlan AbdullahChairman
Datuk Mohd Anuar TaibGroup Chief Executive Officer
MOVING FORWARD
Sapura Energy expects an improved operating environment for our company in the year ahead. The continued global economic recovery and geo-political tensions centred on Eastern Europe will be supportive of the oil price and are driving energy importing countries to look for new sources of supply. These factors and the sharply higher oil prices that we have seen so far in FY2023 will underpin renewed investment in the oil and gas sector, driving demand for our services.
Capitalising on these opportunities will require us to retain laser focus on the effective financial and operational restructuring of our company. As a key part of our restructuring, Sapura Energy is actively working to secure new funding sources to ensure that we have the necessary capital to execute our turnaround plan, including through divesting non-core assets.
Alongside this, we will continue to engage with our lenders on the best way forward to address our debt burden. The Board is optimistic about the prospects of reaching an agreement that recognises the claims of our lenders while ensuring the continued financial viability of Sapura Energy. We will also continue to negotiate with our trade creditors under the framework of the SOA in order to reach a mutually acceptable agreement on our outstanding payments to them.
On the business front, Sapura Energy will continue renegotiating legacy contracts with our clients, to reflect the radically changed environment in which we now operate. Through these renegotiations, we hope to moderate or recover the losses that we have incurred as a result of the pandemic. Critically, as we move forward, we will maintain discipline in our bidding and execution of projects under our “Bid Right, Execute with Discipline” principle.
Creating a stable platform is crucial to the Group’s turnaround. Sapura Energy is clear-eyed about the scale of the challenge that we face, but we are optimistic that we are now on the right path to recovery.
Sap
ura
En
erg
y B
erh
ad
An
nu
al R
ep
ort
20
22
17
Strategic Report (Management Discussion and Analysis)

UNSUSTAINABLE FINANCIAL CONDITION
This year has been challenging for Sapura Energy Berhad (“Sapura Energy” or the “Group”) as several of our principal risks have materialised and overwhelmed our risk management processes. The collective impact of these developments was reflected in the business performance and financial position of the Group. The Statement on Risk Management and Internal Control included in this Annual Report provides the details on how certain external and internal factors had accelerated such risks and the key steps undertaken by the Board to strengthen our Enterprise Risk Management Framework.
Sapura Energy’s Board of Directors (the “Board”) acknowledges that the unsustainable financial condition currently experienced by the Group is the key risk that could threaten the Group as a going concern, as described below:
RISK DESCRIPTION MITIGATION STRATEGY
The Group’s financial condition has significantly deteriorated to an unsustainable level as the Group suffered severe losses and faced an unprecedented liquidity crunch. As a result, the Group is unable to service its debt obligations and make prompt payments to its trade and other creditors.
Our existing operations and projects are impacted, and the Group may not be successful in our bids for new projects.
We may not be the employer of choice due to our inability to retain or attract the right talents and this may impact our ability to mobilise resources effectively.
The overall reputation of the Group has been adversely impacted.
These could have a material adverse impact to our future earnings, cash flows and financial condition, which could threaten the Group as a going concern if mitigation strategies and regularisation plans fail to materialise.
The sustainability of the Group is dependent on significantly improving its liquidity position.
To this effect, the Board and the Management have undertaken and continue to undertake the necessary steps to regularise the operations and the financial conditions of the Group.
These steps include:
1. Established a Board Restructuring Task Force to steer and provide oversight on the regularisation plan;
2. Appointed financial and legal advisors to assist in the debt restructuring exercise;
3. Applied and obtained for Sapura Energy and 22 of its wholly owned subsidiaries Orders under Sections 366 and 368 of the Companies Act 2016 from the High Court of Malaya. The Order under Section 366 of the Act will enable each Applicant to summon meetings with its creditors, to consider and approve a proposed scheme of arrangement and compromise as part of the debt restructuring plan. The applicants were also granted a Restraining Order pursuant to Section 368 of the Act to restrain and stay legal proceedings against them;
4. Restructuring Sapura Energy’s business through a Reset Plan to divest non-core businesses and assets, improve bidding and project delivery capabilities and implement a robust financial framework to ensure financial discipline; and
5. Engage lenders on debt restructuring.
18
Strategic Report (Management Discussion and Analysis)
KEY RISKS AND MITIGATION

STRATEGIC RISKS
RISK DESCRIPTION MITIGATION STRATEGY
Oil and Gas Prices
Our business and financial performance is exposed to fluctuating oil and gas prices. A low and volatile price environment would reduce the likelihood for new upstream oil and gas projects to be sanctioned, resulting in fewer opportunities to replenish our order book.
This could have a material adverse effect on our earnings, cash flows and financial condition.
We actively monitor the oil and gas price trends to inform us of the necessary responses during our annual business planning.
We seek diversification of revenue through participation in offshore windfarm projects and venturing into adjacent markets from where we operate.
While we intend to grow our exposure to renewable projects over time and also actively continue in the oil & gas segment, we will seek to re-balance our risk-taking in bids to ensure we are operating within our risk appetites.
Order Book Replenishment
Our ability to replenish the order book and deliver competitive returns depends in part on the accuracy and completeness of our costing based on the work scope and terms of the contract. If our assumptions proved to be incorrect, it could have a material adverse effect on our earnings, cash flows and financial condition.
We will be targeted in our bids to focus on preferred regions, namely Asia Pacific and the Atlantic, where we have a competitive advantage. We will be shifting the balance of our project portfolio in the short to medium term towards transportation and installation; and anchor our construction activities at the Lumut fabrication yard.
Improvement initiatives are being implemented to strengthen our bidding capabilities and processes by streamlining the organisation and incorporating robust risk assessments throughout the tender process.
Competition
We face competition in all our businesses. Failure to react to competitive forces by managing our costs and operational performance could result in a material adverse effect on our earnings, cash flows and financial condition.
We are addressing our cost and efficiency challenges through the Reset Plan.
We benchmark our performance against our key competitors and constantly seek ways to prepare robust and competitive bids for projects globally which are innovative and technology-driven.
We seek to diversify into adjacent market from where we operate to provide complementary solutions to new clients.
Climate Change and Energy Transition
Rising climate change concerns and the effects of the energy transition could lead to a decrease in demand for fossil fuels, thus suppressing oil and gas projects. This may also lead to additional regulatory measures and compliance obligations, which could lead to higher project or operating cost, or prevent market access.
If we were unable to keep pace with society’s demands with regard to the energy transition to a low-carbon future, we could fail in sustaining and growing our business.
Our strategy is to grow gas and renewables projects. We had created a dedicated team to build and concentrate our capabilities to address sustainability risks and opportunities, including to rapidly improve our governance and management frameworks over climate change and energy transition. However, except for health, safety and environmental initiatives which remain as key materiality matters to our organisation, we are deprioritising some of our other sustainability initiatives until the organisation finds a stable financial platform to sustain future business operations.
The following section provides a list of the Group’s other principal risks and their mitigation strategies:
Sap
ura
En
erg
y B
erh
ad
An
nu
al R
ep
ort
20
22
19
Strategic Report (Management Discussion and Analysis)

OPERATIONAL RISKS
RISK DESCRIPTION MITIGATION STRATEGY
Safety
The nature of our operations exposes us, and the communities in which we work, to a wide range of safety risks. If a major risk materialises, such as an explosion or an asset loss, this could result in injuries, loss of life, environmental harm or disruption to business activities. Accordingly, this could have a material adverse effect on our earnings, cash flows and financial condition.
We strive for a safety-first culture led by senior leadership throughout the organisation and among our clients, partners, and vendors. We have amplified and exemplified the “Safety Starts with Me” culture across the Group, with increased engagement delivered by senior leadership. The restructuring exercise brought a more structured and consistent approach to safety, with aligned performance indicators and clear safety targets and goals. Our safety policy statements were updated to be in line with this approach.
COVID-19 Pandemic
The prolonged period of COVID-19 pandemic has caused and continue to cause disruptions to our operations across our business locations globally. It poses significant physical and possibly mental health risks to our employees and contractors who work for us, as well as their families. As a result, we saw a significant impact to our project schedules, movement of crews, and supply chain deliveries which ultimately affected our ability to deliver projects within the original basis of our contracts. The pandemic has resulted in lower demand of energy globally, leading to deferment or cancellation of projects in the oil and gas sector.
Consequently, this pandemic has had a significant adverse effect on our earnings, cash flows and financial position.
As a Group, we adopted various approaches to effectively mitigate the COVID-19 impact on our people and operations. We introduced a remote work arrangement in line with the Ministry of Health’s standard operating procedures (“SOP”). Mandatory testing regimes and strict SOPs were enforced on our employees and visitors at all offices, yards, and offshore assets. As a result of our proactive COVID-19 vaccination campaign, we achieved a 95 percent vaccination level by the end of 2021.
The readiness of our IT infrastructure and support allowed working-from-home arrangements to be put in place swiftly and smoothly. It supports a noticeable increase in virtual meetings and trainings, and round-the-clock monitoring for cybersecurity threats.
We managed our project execution vigorously to minimise the related impacts and actively worked with our clients and business partners to collectively manage the financial impact caused by the pandemic, including negotiation for compensation under the contracts.
We ensured COVID-19 risks under the new contracts are explicit and priced accordingly. This includes limiting our exposure to COVID-19 uncertainties as a result of changing government regulations/laws where we do businesses, or of stricter SOPs imposed by clients on our assets which may affect the continuity and cost of operations.
20
Strategic Report (Management Discussion and Analysis)
KEY RISKS AND MITIGATION

OPERATIONAL RISKS (CONT’D.)
RISK DESCRIPTION MITIGATION STRATEGY
Project Execution
Our ability to remain competitive and profitable depends in a large part on the efficient execution and timely delivery of projects to our clients.
This year, we experienced a higher level of difficulty in our project execution. The dynamics of operating in a liquidity-constrained condition, the impact arising from a pandemic, coupled with managing complex contractual risks, have weakened our project delivery. The result was a combination of events including deferred collections, unapproved claims, or cost and schedule overruns which in turn impacted our financial position and reputation.
Through the “Reset Plan” we sought to introduce a greater discipline in our project execution and delivery performance. Some of these efforts include streamlining our organisation with a regional focus, strengthening the risk-based approach for bids and project execution, and enhancing contract management and cost discipline. Training programmes are in place for project execution and delivery through our Project Management Control Operating Mode to further enhance the competency of our project organisation.
We are collaborating closely with our clients and vendors and sub-contractors to ensure adequate liquidity is available to progress on-going project activities.
Retention of talents and skilled employees
Building a high-performing workforce to deliver our strategic objectives depends greatly on our ability to attract, develop, and retain competent and skilled employees. The financial situation of the company has increased the risk of retaining employees with the skillset and competency required to perform the work.
We adopted a balanced approach to Build, Borrow, and Buy talents to ensure business sustainability and affordability. Efforts to broaden our talent pool within the Company are supported with enhanced performance management, and assessment on technical and behavioural competencies for promotion opportunities. Skill matrix were developed for critical groups to facilitate a more structured development.
With the current situation against the market, a more robust approach in talent retention is being developed (with the guiding principles of affordability, sustainability, pay for performance, fair & equitable) and is required to ensure we are ready for a business turnaround plan in FY2023 and longer term.
Cybersecurity
Our operations are heavily dependent on our information technology infrastructure and applications. A serious cybersecurity incident could cripple our ability to operate or operate safely. This could have an adverse impact on our reputation, earnings, cashflows and financial position.
We follow cybersecurity practices and processes baselined against industry best practices (NIST, ISO27001) and use various detection and prevention technologies to safeguard our IT systems against internal and external threats.
We continuously monitor and review our security posture to ensure effectiveness against evolving cybersecurity risks and threats. We do this by keeping abreast with updates of the cybersecurity threat landscape and business environment.
We also engage external cybersecurity experts to perform various types of security assessments on our IT systems.
Sap
ura
En
erg
y B
erh
ad
An
nu
al R
ep
ort
20
22
21
Strategic Report (Management Discussion and Analysis)

CONDUCT RISKS
RISK DESCRIPTION MITIGATION STRATEGY
Compliance to Anti-Bribery & Corruption, Anti-Competition and Data Privacy Laws
Violations of these laws by any of our employees or contractor staff working for us could lead to heavy fines and other criminal penalties to be imposed on the individual(s) concerned, and/or the Group and/or the Directors of our parent or subsidiary companies. This could also result in suspension of licence to operate and could have an adverse effect on our reputation.
We provide mandatory trainings on Code of Ethical Conduct and Anti-Corruption to our new joiners and existing staff, to be repeated every 2 years. We practice a zero-tolerance policy for non-compliance and have strict guidelines on gift policies. We select our vendors after conducting check by recognised external compliance trackers.
We practice an open-door policy but also have an external Whistleblowing system to allow for anonymous reporting.
Reputation
An erosion of our business reputation could have adverse effects on our brand and credibility, upon which we build trusted partnerships with our key stakeholders. This could lead to adverse effect on our license to operate and our ability to compete in global markets.
In the immediate term, our unsustainable financial condition described above has cast a negative light on the Group, its past and present Management and the Board, as well as our major shareholders.
In the longer term, societal expectations of businesses are increasing, with a focus on environmental, social and governance (“ESG”) matters. Real or perceived failures of governance or a perceived lack of understanding of how our operations affect surrounding communities and environment could harm our reputation.
Reputational risk management is part of the Board’s oversight at Sapura Energy. The Board limits the risk of reputational damage by ensuring the Group conducts itself with the highest standards of good governance, sustainability, and integrity. The Board and senior management also regularly discuss potential issues that may impact the Group’s standing and plan strategic steps to mitigate them.
To prevent the possibility of reputational damage through our own actions, we continuously embed the Sapura Energy culture within our workforce, guiding them to build trust with stakeholders by behaving ethically; and embodying the qualities of safe, honest, accountable, respectful, and professional.
Our Code of Ethical Conduct (“Code”) set the behaviours expected of our employees and contract staff.
Stakeholder management is also a component in senior leaders’ KPIs, which in turn are cascaded to the relevant teams in the organisation. Our ability to create constructive interactions with stakeholders can develop strong relationships that will be crucial in resolving reputational issues. Part of the efforts includes transparent and balanced reporting of our performance through regular engagements with investors, market analysts, and the media.
To identify emerging reputational threats, Sapura Energy implements daily media monitoring to review news coverage and social media posts commenting on the Group, selected peers and the energy industry.
We also continuously enhance our crisis communications preparedness through emergency response procedures, drills, and trainings.
22
Strategic Report (Management Discussion and Analysis)
KEY RISKS AND MITIGATION

FY2018RM’million
FY2019*RM’million
FY2020RM’million
FY2021RM’million
FY2022RM’million
OPERATING RESULTS
Revenue 5,895 5,504 6,449 5,348 4,100
Profit/(loss) before tax and impairment (191) 1,922 (1,267) (32) (3,326)
Profit/(loss) before tax (2,324) 401 (4,552) (32) (8,932)
Profit/(loss) after tax (2,505) 203 (4,565) (160) (9,061)
KEY STATEMENT OF FINANCIAL POSITION DATA
Cash and cash equivalents 1,716 8,098 772 489 718
Total assets 29,993 33,576 22,748 22,665 16,069
Borrowings 16,415 16,986 10,256 10,332 10,658
Total liabilities 20,542 19,705 13,574 13,728 15,991
Shareholders fund 9,450 13,875 9,183 8,946 85
Basic earning per share (sen) (42.10) 3.43 (28.60) (1.01) (56.67)
Net assets per share (RM) 1.59 0.87 0.57 0.56 0.01
Net debt to equity (times) 1.56 0.64 1.03 1.10 116.94
Net debt 14,699 8,888 9,484 9,843 9,940
* Includes discontinued operations
Sap
ura
En
erg
y B
erh
ad
An
nu
al R
ep
ort
20
22
23
Strategic Report (Management Discussion and Analysis)
FIVE-YEAR FINANCIAL HIGHLIGHTS

REVENUE(RM’mil)
SHAREHOLDERS’ FUND(RM’mil)
PROFIT/(LOSS) BEFORE TAX AND IMPAIRMENTS(RM’mil)
TOTAL ASSETS(RM’mil)
PROFIT/(LOSS) AFTER TAX(RM’mil)
NET DEBT(RM’mil)
9,450 13,875 9,183 8,946 255
5,8
95
FY2018
5,5
04
FY2019*
6,4
49
FY2020
5,3
48
FY2021
4,1
00
FY2022
9,4
50
FY2018
13,8
75
FY2019
9,1
83
FY2020
8,9
46
FY2021
85
FY2022
29
,99
3
FY2018
33
,576
FY2019
22
,74
8
FY2020
22
,66
5
FY2021 1
6,0
69
FY2022
14,6
99
FY2018
8,8
88
FY2019
9,4
84
FY2020
9,8
43
FY2021
9,9
40
FY2022
(19
1)
(1,2
67)
(3
,32
6)
(32
)
1,9
22
FY2018 FY2019* FY2020 FY2021 FY2022
(2,5
05
)
(4,5
65
)
(9
,06
1)
(16
0)
20
3
FY2018 FY2019* FY2020 FY2021 FY2022
* Includes discontinued operations
24
Strategic Report (Management Discussion and Analysis)
FIVE-YEAR FINANCIAL SUMMARY

THIS REPORT PROVIDES A BROAD OVERVIEW OF SAPURA ENERGY’S SUSTAINABILITY PERFORMANCE. GIVEN THE NATURE OF THE OIL AND GAS INDUSTRY, SAPURA ENERGY HAS ALWAYS BEEN COGNISANT OF OUR DUTY TO OPERATE IN A MANNER THAT IS RESPONSIBLE AND RESPONSIVE TO ENVIRONMENTAL, ECONOMIC, AND SOCIAL IMPERATIVES. SUSTAINABILITY TO US IS ABOUT INTEGRATING RESPONSIBLE PRACTICES INTO OUR OPERATIONS SO AS TO CREATE VALUE FOR OUR SHAREHOLDERS, EMPLOYEES, BUSINESS PARTNERS, CLIENTS, SUPPLIERS, AND THE COMMUNITY AT LARGE.
Due to the present financial condition of Sapura Energy Berhad (“Sapura Energy” or the “Group”), we have had to re-evaluate our sustainability agenda to focus on issues that are critical to Sapura Energy’s own business sustainability. These include managing the risks that are inherent to our operations and encompass looking into our people’s well-being and safety, while enhancing their skills via talent development. At the same time, we will maintain all efforts to minimise our impact on the environment and continue to prioritise community initiatives via our deeply ingrained sense of corporate social responsibility.
Our core values of S.H.A.R.P – which stand for Safe, Honest, Accountable, Respectful, and Professional – form the foundation for incorporating sustainability into our strategies, business processes, decision-making, and operations. These values not only signify how we wish to conduct ourselves as a company, but also describe what our employees, clients, shareholders, and the larger community may expect from us.
In developing our sustainability strategy, we have been guided by various frameworks including the United Nations’ Sustainable Development Goals (“SDGs”). We see the SDGs as presenting clearly defined objectives towards shaping a more socially equitable and environmentally sustainable future, and remain committed to contributing towards the achievement of various SDG targets once we have established a stable financial platform and are in a position to resume our broader sustainability initiatives.
The scope of our Sustainability Report shall cover our key business segments: Engineering and Construction (“E&C”), Operations and Maintenance (“O&M”), and Drilling.
OUR SUSTAINABILITY FRAMEWORK
Our Sustainability Governance
........... ......................................
...................................................................... .....................................................................
.........................................
.........................
........
.......
....
....
BOARD RISK MANAGEMENT COMMITTEE
(Sustainability Risk & Control)
GROUP CEO(Strategy & Supervision)
EXECUTIVE COMMITTEE(Plan & Development Oversight)
BOARD OF DIRECTORS(Direction & Strategic Inputs)
RISK MANAGEMENT DEPARTMENT
(Sustainability Reporting)
BUSINESS & FUNCTIONAL UNIT(Implementation)
BUSINESS & FUNCTIONAL UNIT(Implementation)
BUSINESS & FUNCTIONAL UNIT(Implementation)
SUSTAINABILITY GOVERNANCE
Sap
ura
En
erg
y B
erh
ad
An
nu
al R
ep
ort
20
22
25
Strategic Report (Management Discussion and Analysis)
SUSTAINABILITYAT SAPURA ENERGY

Sustainability governance at Sapura Energy underlines our commitment to making sustainability an integral part of our strategic management and business planning. It also ensures efficient implementation of sustainable practices across all our operations to positively influence the economic, environmental, and social ecosystem surrounding our Company; and the communities we work in.
Ultimate accountability for sustainability at Sapura Energy rests with our Board of Directors (the “Board”). On behalf of the Board, the Board Risk Management Committee (“BRMC”) provides oversight on sustainability matters of the Group, including strategies, communication plans, and decisions involving the Group in compliance with the relevant standards, governance, and regulatory requirements. With a view to create value for our stakeholders, the BRMC discusses sustainability-related matters, identifies challenges, and reviews measures to ensure these challenges are adequately addressed by our Management.
The Group Chief Executive Officer (“GCEO”) is responsible for developing strategies and plans to ensure all aspects of the Group’s business are aligned with the direction set by the Board. The GCEO is supported by the Executive Committee and our Chief Risk Officer, who is the designated person within management to provide dedicated focus to manage sustainability strategically, including the integration of sustainability considerations into the Company’s operations.
Our three Economic, Environmental, Social (EES) goals – Ensuring Business Sustainability, Ensuring No Harm to Our People and Environment, and Nurturing People and Developing Talent – impact various stakeholders as depicted below:
These goals are inextricably intertwined. Business sustainability relies on our ability to comply with regulations to protect the environment and staff. Damage from spills, and Health, Safety, and Environment (“HSE”) issues have serious consequences for the business and our industry, both from a regulatory and reputational standpoint. One of the most significant ways in which we can manage our impacts directly is through our network of people. Our responsibility towards them goes beyond the provision of learning and development opportunities to include caring for their overall well-being, which in turn has a positive correlation with the Group’s performance.
In FY2022, as the world continued to fight the COVID-19 pandemic, we took additional steps and adopted various approaches to mitigate its impact on our people and operations.
A key adaptation was to implement a remote work arrangement in line with the Ministry of Health’s standard operating procedures (“SOPs”) to protect employees’ well-being. To ensure continued productivity, guidelines were introduced to preserve operational dynamics in the highly flexible work environment whilst protecting employee work-life balance within defined boundaries. These guidelines were also aimed towards driving accountability, teamwork, and respect for one another.
To ensure workplace safety, mandatory testing regimes and strict SOPs were enforced on those working from the office. We also collaborated with local authorities and private healthcare facilities to initiate our own early COVID-19 vaccination campaign for both onshore and offshore employees. This sped up the Group’s vaccination coverage, enabling us to achieve a 95 percent vaccination level by year end, effectively mitigating the impact of COVID-19 on our people’s health.
Meanwhile, our Emergency Control Centre continued to monitor the situation daily to ensure effective response to the ever-changing situation. Regular communication with local authorities was maintained at locations where we operate, while prevention and mitigation processes were continuously adjusted to always keep our people’s health at the forefront as we maintain compliance with local regulations.
Ensuring Business Sustainability
Ensuring No Harm toOur People and Environment
Nurturing People andDeveloping Talent
External Relationships
• Investor & Analyst• Shareholders• Customers• Suppliers• JV Partners
Safety, Health, and Well-being
• Government• Regulators• Employees• Clients• Subcontractors
People
• Employees• Communities
26
Strategic Report (Management Discussion and Analysis)
SUSTAINABILITY AT SAPURA ENERGY

OUR THREE (3) SUSTAINABILITY PILLARS
Our Sustainability Journey
During the financial year, the Group reviewed Bursa Malaysia’s Sustainability Reporting Guide (2nd edition) issued in 2018, and the Malaysian Code on Corporate Governance (updated) published by the Securities Commission in April 2021. The Group’s sustainability framework has been and continues to be enhanced to take into account the requirements and recommendations of these publications. Further, the Group has undertaken an assessment of the recommendations of the Taskforce on Climate-related Financial Disclosures (“TCFD”) to inform the Group for future reporting of climate-related risks and opportunities. However, these initiatives are currently on hold as the Group focuses on resolving its financial condition as a matter of immediate priority.
Economic Environment Social
Ensuring Business Sustainability
Sapura Energy aims to deliver positive economic benefits to our
stakeholders by continuously stimulating economic growth in
Malaysia through the energy sector. In our operations, we support
initiatives that strengthen our local supply chain and meet the
expectations of our customers, while upholding ethical norms.
Ensuring No Harm to Our People and Environment
We recognise the important role that Sapura Energy has in reducing
carbon footprint, enhancing energy efficiency as well as reducing waste. We are developing internal strategies,
policies, and processes that will ensure continued improvements in
these areas as well as full compliance with environmental
regulations. We are also improving our supply chain screening process to ensure compliance with social
and environmental standards.
The health and safety of our employees and communities we
work in, as well as the protection of our assets, are our highest priority.
Our HSE Policy defines the Company’s guiding principle in
managing risks and hazards relevant to business operations.
Nurturing People and Developing Talent
Our employees are the key driver of all that we do. Therefore, all
investments in talent development programmes are investments in
Sapura Energy’s sustainable future. We also acknowledge the importance of employee
engagement in retaining a sustainable pipeline of talents by ensuring a highly engaged and
fulfilled workforce.
Our values and principles are also reflected in the selection and implementation of community development programmes that
contribute to the well-being of the people and the communities in areas where we operate. Corporate Social
Responsibility is an important platform through which we are able to give back to communities and to
nation-building.
Sap
ura
En
erg
y B
erh
ad
An
nu
al R
ep
ort
20
22
27
Strategic Report (Management Discussion and Analysis)
Dear Shareholders,
As a Board, we place great emphasis on ensuring that the Group has in place a robust and transparent corporate governance framework, appropriate for its size, operations, and organisational structure. It is our strong belief that corporate governance plays a key role in delivering long-term success to the Group and its shareholders.
The Board continues to develop and enhance suitable and appropriate corporate governance practices and policies to match the dynamic landscape of our business.
This report aims to give shareholders and other stakeholders insight into the approach that the Board takes for corporate governance during financial year ended 31 January 2022 (“FY2022”), including the manner in which it implements the principles of the Malaysian Code on Corporate Governance 2021 (“MCCG 2021”). This report should be read together with our Corporate Governance Report FY2022 (“CG Report FY2022”), which is available on our corporate website.
28
Corporate Governance
CORPORATE GOVERNANCEOVERVIEW STATEMENT

PRINCIPLE A: BOARD LEADERSHIP AND EFFECTIVENESSThe Board has the collective responsibility for the overall conduct and performance of the Group’s business by maintaining full and effective control over strategic, financial, operational, compliance, and governance issues. The Board Charter provides guidance to the Board in discharging its roles, duties and responsibilities in line with the principles of good governance.
The Board is committed to ensuring that there is a strong and effective system of corporate governance in place to support the successful execution of the Group strategy. In order to ensure orderly and effective discharge of the functions and responsibilities of the Board, the Board has in place a Governance Framework for the Group, where specific powers of the Board are delegated to the relevant Board Committees and the Group Chief Executive Officer (“GCEO”), as depicted below:
The principal responsibilities of the Board, amongst others, are as follows:
1) Review and adopt strategic business development plans for the Group;
2) Oversee the conduct of the Group’s businesses;
3) Identify principal risks and ensure the implementation of appropriate systems to manage these risks;
4) Succession planning of the GCEO (and Senior Leadership);
5) Oversee the development and implementation of investor relations programmes or the shareholders communication policy for the Group; and
6) Review the adequacy and integrity of the Group’s internal control systems and management information systems, including systems for compliance with applicable laws, regulations, rules, directives, and guidelines.
BOARD OFDIRECTORS
GROUP COMPANYSECRETARY
GROUPINTERNAL AUDIT
BOARD RISK MANAGEMENT
COMMITTEE(BRMC)
BOARD NOMINATION AND REMUNERATION
COMMITTEE(BNRC)
BOARD AUDIT COMMITTEE
(BAC)
GROUP CHIEF EXECUTIVE OFFICER (GCEO/EXECUTIVE DIRECTOR)
EXECUTIVE COMMITTEE
The following are amongst the regular annual matters that are tabled to the Board for approval and/or notation:
• strategic issues and planning, including performance reviews
• appointment of the GCEO and review of his performance
• significant acquisition and disposal of shares (quoted and unquoted), businesses, mergers, and acquisitions
• material service expenditure
• financial performance report
• write-off of significant bad debts and assets
• disposal of significant assets
• Quality, health, safety, and environment
• Governance
Sap
ura
En
erg
y B
erh
ad
An
nu
al R
ep
ort
20
22
29
Corporate Governance

In addition to the matters reserved for the Board under the Board Charter, the Limits of Authority (“LOA”) covers both operations (tender/bidding, project management, capital expenditure, and project procurement) and corporate related matters (Finance, Human Resources, Legal, and other corporate matters) for the Group that require Board’s approval and delegation of powers to its Board Committees, the GCEO as well as management.
Division of Roles and Responsibilities between the Chairman and the GCEO
The positions of Chairman and GCEO of the Company are held by different individuals. The distinct and separate roles of the Chairman, who heads the Board and GCEO leading the Senior Management and operations, ensure a balance of power and authority, which in turn ensures that no one individual can influence board’s discussions and decision-making. The Chairman carries out a leadership role in the conduct of the Board and its relations to shareholders and other stakeholders. The Chairman’s main responsibilities are clearly listed in the Board Charter of the Company, who is to ensure effective conduct of the Board through the execution of the following key roles:
(i) to build a high-performance Board by leading the evaluation of the Board’s performance and ensuring that succession planning is considered on an on-going basis;
(ii) to manage Board meetings in order to achieve robust decision making by ensuring that accurate, timely, and clear information is provided to all Directors. The Chairman encourages participation and deliberation by the Board to tap the wisdom of all members and to promote consensus building as much as possible; and
(iii) to facilitate the Board and Management interface as the conduit between the two parties.
The Chairman, who is a Non-Independent Non-Executive Director, is supported by the Senior Independent Director to ensure objective and independent deliberation, review, and decision-making by the Board and to have more effective oversight of management. The Chairman does not assumed any executive position in the Group.
The GCEO has the overall responsibility for the Group’s operational, business units and support services, organisational effectiveness and implementation of the Board’s policies, directives, strategies, and decisions. In addition, the GCEO also functions as the intermediary between the Board and Management.
Tan Sri Dato’ Seri Shamsul Azhar Abbas was the Chairman of the Company from 30 July 2020 until his retirement on 7 May 2022. He was succeeded by Dato’ Mohammad Azlan Abdullah as new Chairman of the Company, effective 7 May 2022.
THE BOARD COMMITTEES
The Board, where appropriate, delegates specific responsibilities to its Board Committees with clearly defined Terms of Reference (“TOR”) primarily to assist in discharging its responsibilities. Although the Board has granted such discretionary authorities to these Committees to deliberate and decide on certain key and operational matters, the ultimate responsibility for the final decision on all matters lies with the entire Board.
The Board has established the following three Committees whose compositions and key functions are set out below:
1) Board Audit Committee (“BAC”);
2) Board Nomination and Remuneration Committee (“BNRC”); and
3) Board Risk Management Committee (“BRMC”).
30
Corporate Governance
CORPORATE GOVERNANCE OVERVIEW STATEMENT

Board Audit Committee
Chairman
Lim Tiang SiewIndependent Non-Executive Director
Members
Datuk Muhamad Noor Bin Hamid Independent Non-Executive Director(Redesignated from Chairman to Member on 1 October 2021)
Dato’ Azmi Mohd AliIndependent Non-Executive Director
Bernard Rene Francois Di TullioNon-Independent Non-Executive Director (Appointed on 1 October 2021)
Dato’ Mohammad Azlan AbdullahNon-Independent Non-Executive Director(Resigned on 1 October 2021)
Composition and Size
At least three (3) members
All of whom are Non-Executive Directors
Majority being Independent Directors
Chairman is an Independent Director pursuant to Paragraph 15.10 of MMLR
Key Functions
The primary objective of the BAC is to assist the Board in fulfilling its fiduciary and statutory duties relating to corporate accounting and reporting practices of the Company and Group; and enhancing internal control, risk management and corporate governance.
The summary of key activities of the BAC during FY2022 are set out in the Report of the BAC on pages 66 to 67 of this Annual Report.
The BAC is governed by a written TOR which ensures it deals clearly within its authority and duties, which is available on the Company’s website at www.sapuraenergy.com. In line with MCCG 2021, the TOR of BAC was revised and approved by the Board on 28 September 2021.
Board Nomination and Remuneration Committee
(Established upon merger of Board Nomination Committee, Board Remuneration Committee and Long Term Incentive Plan Committee on 18 August 2020)
Chairman
Tan Sri Dato’ Megat Zaharuddin Megat Mohd Nor Senior Independent Non-Executive Director(Ceased as Chairman on 7 May 2022)
Members
Datuk Muhamad Noor HamidIndependent Non-Executive Director
Datuk Ramlan Abdul RashidIndependent Non-Executive Director
Datuk Iain John LoIndependent Non-Executive Director (Appointed on 1 October 2021)
Composition and Size
At least three (3) members and a maximum of four (4) members
All are Non-Executive Directors with majority being Independent Directors
Chairman shall be an Independent Director
Key Functions
The BNRC carries out the duties and responsibilities delegated to it by the Board. The key responsibilities of BNRC are as follows:
• Address business continuity of the Company and the Group by having in place a succession plan for the Board and Senior Management;
• Consider potential candidates and nominate suitable persons to the Board;
• Recommend on the appointment of Board members and Board Committee members;
• Assess the performance of the Board members as a whole and as individuals as well as Board Committees;
• Responsible for recommending to the Board the remuneration and reward framework for Executive Directors and Senior Management to allow the Company to attract and retain its Executive Directors and Senior Management giving due regard to the financial situation and performance of the Company;
Sap
ura
En
erg
y B
erh
ad
An
nu
al R
ep
ort
20
22
31
Corporate Governance

Board Nomination and Remuneration Committee (cont’d.)
Key Functions (cont’d.)
• Assess and recommend the remuneration packages of the Group Chief Executive Officer (“GCEO”), Executive Directors, and Non-Executive Directors of the Company;
• Assist in reviewing and recommending the annual bonus payment rate and increment range to all employees of the Company and its subsidiaries (collectively the “Group”) based on the Group’s policy; and
• Administer the Share Issuance Scheme, the Share Bonus Scheme, and Executive Share Option Scheme (“ESOS”) in accordance with the By-Laws and the Guidelines, respectively.
The BNRC is governed by a written TOR which ensures it deals clearly within its authority and duties, which is available on the Company’s website at www.sapuraenergy.com.
FY2022 Key Activities
During the FY2022, seven (7) BNRC meetings were held.
The summary of key activities performed by the BNRC are as follows:
• Assist in reviewing readjustment of salary for employees impacted by salary cut;
• Review and make recommendation on the appointment of Group Chief Executive Officer;
• Review and assesses the performance and effectiveness of the Board as a whole and the Board Committees as well as individual Directors including competency matrix, Independent Directors, and Board Improvement Plan;
• Review and make recommendations on the proposed appointment of Independent, Non-Independent Directors, and Board Committee members;
• Assist in reviewing bonus for employees of the Group and proposed salary readjustment;
• Review succession planning for key leadership roles; and
• Assist in reviewing mid-year performance for FY2022.
Board Risk Management Committee
Chairman
Datuk Iain John LoIndependent Non-Executive Director (Appointed as Member on 1 May 2021)(Redesignated from Member to Chairman on 1 October 2021)
Datuk Ramlan Abdul Rashid Independent Non-Executive Director(Resigned on 1 October 2021)
Members
Lim Tiang SiewIndependent Non-Executive Director
Bernard Rene Francois Di TullioNon-Independent Non-Executive Director (Appointed on 1 May 2021)
Dato’ Mohammad Azlan AbdullahNon-Independent Non-Executive Director(Appointed on 1 October 2021)
Composition and Size
At least three (3) members
Majority being Non-Executive Directors
Chairman shall be an Independent Director
Key Functions
The key responsibilities of the BRMC are to focus on the Group’s principal risks as well as to ensure the implementation of appropriate systems to identify and manage the risks that may threaten the business. Whilst these risks may be strategic in nature, the BRMC shall ensure that appropriate controls encompassing operational and compliance matters are in place and working as intended.
The BRMC is governed by a written TOR which ensures it deals clearly within its authority and duties, which is available on the Company’s website at www.sapuraenergy.com.
FY2022 Key Activities
During the FY2022, four (4) BRMC meetings were held.
The summary of key activities performed by the BRMC are as follows:
• Reviewed distressed contracts being executed and tender submission of contracts with material impact;
32
Corporate Governance
CORPORATE GOVERNANCE OVERVIEW STATEMENT

procedures, and regulations affecting the Board and the Group, as well as the best practices of governance. She is also responsible for advising the Board of their obligations and duties to disclose their interests in securities, any conflict of interests in transactions involving the Group, guidance in dealing in securities and restrictions on disclosure of price-sensitive information.
The Board has unhindered access to the advice and services of the Group Company Secretary.
Board and Board Committee Meetings
To enable Directors to plan and accommodate the year’s meetings into their schedules, and to devote sufficient time to effectively discharge their duties as well as to endeavour to attend meetings, Board meetings are scheduled in advance before the commencement of the new financial year.
With regards to urgent proposals or matters that require expeditious decisions or deliberations by the Board and/or the Board Committees, additional/special Board meetings and Board Committees meetings were convened between the scheduled meetings.
Information in an appropriate form is furnished to the Board in a timely manner to enable it to discharge its duties relating to all matters that require its attention and decision-making. Proposals comprising comprehensive and balanced financial and non-financial information are encapsulated in the Board papers to enable the Board to examine both the quantitative and qualitative aspects of the business. Board meetings are convened immediately following the finalisation of the Company’s quarterly and annual results for the Board’s review and approval, prior to announcement to Bursa Malaysia Securities Berhad (“Bursa Securities”).
The agenda and supporting papers for Board and Board Committees are distributed in advance to all Board and Board Committees respectively, in order to allow adequate time for appropriate review to facilitate full discussion at the meetings.
Proper minutes of Board and Board Committee meetings covering issues raised, discussions, deliberations, decisions, and conclusions, including dissenting views made at Board and Board Committees meetings, along with clear actions to be taken by parties responsible were produced and the duly confirmed minutes were kept as statutory records by the Company. Any director who has an interest in any matters related to the Company must immediately disclose the nature of his/her interest and abstain from participating in any discussion or decision making on the subject matter.
In addition to the Board, Senior Management, and/or external advisors are invited to attend Board and Board Committees meetings to provide clarification, more information, and advice on agenda items whenever necessary. The Board also practices direct communication and guidance to Senior Management in ensuring all important aspects in relation to proposals and agenda items be taken into account and well analysed to enable the Board and/or the Board Committees to arrive at informed decisions.
Board Risk Management Committee (cont’d.)
FY2022 Key Activities (cont’d.)
• Reviewed Risk Appetite Statement;
• Reviewed quarterly update on Health, Safety, and Environment (“HSE”);
• Reviewed the revision to the TOR of BRMC;
• Reviewed update on Group Risks;
• Reviewed update on Sustainability Activities;
• Reviewed Risk Management Framework;
• Reviewed update on Group Insurance Risks;
• Reviewed Statement on Risk Management and Internal Control for inclusion in 2021 Annual Report;
• Reviewed Health, Safety, and Environment Statement for inclusion in 2021 Annual Report;
• Reviewed Key Risks and Mitigation Report for inclusion in 2021 Annual Report; and
• Reviewed Sustainability Report for inclusion in 2021 Annual Report.
Board Reset Taskforce
During the financial year under review, the GCEO escalated to the Board and all critical stakeholders of the impending financial challenges that Group will likely be facing post its Q2 FY2022 results. In response, the Board and Management set up a joint committee referred to as Board Reset Taskforce (“BRTF”) that supports the GCEO in designing specific workstreams to execute and deliver on the strategic initiatives to restructure and achieve long-term sustainability.
Six (6) workstreams were created to oversee critical areas in restructuring which include Balance Sheet Restructuring, Divestment, NewCo Strategy, Finance Reset, Engineering & Construction Reset, and Communications & Transition.
Senior Independent Non-Executive Director
Tan Sri Dato’ Megat Zaharuddin Megat Mohd Nor was the Senior Independent Non-Executive Director of the Company from 18 September 2020 until 7 May 2022.
The Senior Independent Non-Executive Director was committed in discharging his roles and responsibilities as recommended under the Corporate Governance Guide of Bursa Malaysia. The roles and responsibilities of the Senior Independent Director are stipulated in the CG Report FY2022 of the Company.
Company Secretary
The Group Company Secretary is responsible for advising the Board on issues relating to compliance with relevant laws, rules, Sap
ura
En
erg
y B
erh
ad
An
nu
al R
ep
ort
20
22
33
Corporate Governance

Attendance of Meetings
Directors had shown full commitment to their duties and responsibilities and this was reflected by their attendance at Board meetings held during the financial year. The Board met 12 times during FY2022. Details of attendance of the Directors are as follows:
Directors Designation Attendance Percentage
Tan Sri Dato' Seri Shamsul Azhar Bin Abbas(Retired as Chairman on 7 May 2022)
Chairman, Non-Independent Non-Executive Director
12/12 100%
Dato’ Mohammad Azlan Abdullah(Appointed as Chairman on 7 May 2022)
Chairman, Non-Independent Non-Executive Director
12/12 100%
Datuk Mohd Anuar Taib(Appointed on 1 May 2021)
Group Chief Executive Officer Executive Director
9/9 100%
Tuan Syed Ali Bin Syed Salem Alsagoff(Resigned on 30 April 2021)
Non-Independent and Non-Executive 3/3 100%
Tan Sri Dato' Seri Shahril Bin Shamsuddin(Retired as President and Group Chief Executive Officer on 22 March 2022, Resigned as Director on 30 April 2022)
President and Group Chief Executive Officer Non-Independent and Non-Executive
3/3 100%
Tan Sri Dato' Megat Zaharuddin Megat Mohd Nor(Resigned on 7 May 2022)
Senior Independent Non-Executive Director 12/12 100%
Dato' Shahriman Shamsuddin Non-Independent Non-Executive Director 12/12 100%
Datuk Muhamad Noor Hamid Independent Non-Executive Director 12/12 100%
Datuk Ramlan Abdul Rashid Independent Non-Executive Director 12/12 100%
Lim Tiang Siew Independent Non-Executive Director 12/12 100%
Dato’ Azmi Mohd Ali Independent Non-Executive Director 12/12 100%
Datuk Iain John Lo (Appointed on 1 May 2021)
Independent Non-Executive Director 8/9 89%
Bernard Rene Francois Di Tullio (Appointed on 1 May 2021)
Non-Independent Non-Executive Director 9/9 100%
Cosimo Borrelli (Appointed on 25 March 2022)
Non-Independent Non-Executive Director N/A N/A
The attendance of members at the Board Committee meetings held during FY2022 is as detailed below:
Director BAC BRMC BNRC
Non-Independent Directors Attendance
Tan Sri Dato’ Seri Shamsul Azhar Abbas1 – – 7/7
Dato’ Mohammad Azlan Abdullah2 8/8 1/1 –
Bernard Rene Francois Di Tullio3 3/3 2/2 –
Tuan Syed Ali Bin Syed Salem Alsagoff4 – 2/2 –
Independent Non-Executive Attendance
Datuk Muhamad Noor Hamid5 11/11 – 7/7
Datuk Ramlan Abdul Rashid6 – 2/2 7/7
Datuk Iain John Lo7 – 2/2 –
Lim Tiang Siew8 11/11 4/4 –
Tan Sri Dato’ Megat Zaharuddin Megat Mohd Nor9 – – 7/7
Dato’ Azmi Mohd Ali 11/11 – –
Number of meetings held in FY2022 11 4 7
Notes:1 Resigned as Member of BNRC on 1 October
2021.2 Appointed as Member of BRMC on 1 October
2021 and resigned as Member of BAC on
1 October 2021.3 Appointed as Member of BRMC on 1 May 2021
and appointed as Member of BAC on 1 October
2021.4 Resigned as Member of BRMC on 30 April 2021.5 Redesignated as Member of BAC on 1 October
2021.6 Resigned as Chairman of BRMC on 1 October
2021.7 Appointed as Member of BRMC on 1 May 2021
and redesignated as Chairman of BRMC on
1 October 2021 and appointed as Member of
BNRC on 1 October 2021.8 Redesignated as Chairman of BAC on 1 October
2021.9 Ceased as Chairman of BNRC on 7 May 2022.
34
Corporate Governance
CORPORATE GOVERNANCE OVERVIEW STATEMENT

Continuous Professional Development
All Board members attended the Mandatory Accreditation Programme (MAP) as Directors of listed issuers. In addition, the Directors are advised on their legal obligations and other duties as directors of a listed issuer upon their appointment. The Group Company Secretary will provide the relevant corporate governance information of the Company to new Directors upon their appointment. The newly appointed Directors will receive an induction briefing designed to provide a general understanding of the Group’s businesses and operations, including the major risks faced within the environment of the Company’s business.
The Board is encouraged to attend education programmes, talks, seminars, workshops, and conferences to enhance their skills and knowledge on a regular basis and to keep abreast with new developments in the business environment. The Board identifies the training needs of the Board as a whole while the individual Directors are given a free hand to identify their own training needs, taking into consideration their memberships on the boards of other companies as well.
The training programmes attended by members of the Board during FY2022 are as follows:
Director Training
Dato’ Mohammad Azlan Abdullah • Understanding Board Decision Progress• Dawn Raid: Don’t Be Caught Unprepared• Introduction to Oil & Gas (Upstream Overview)• Audit Committee Conference• Board’s Role in Change World of Work• MIA Conference• Rising Above COVID-19: Reimaging Work in Malaysia and Beyond• Reimage Leadership & Governance, Not Capitalism• PNB Climate Change Forum 2021• Leading Organisation & Change
Dato’ Azmi Mohd Ali • Islamic Finance for Board of Directors (IF4BOD) – Value Proposition of Islamic Finance– Shariah Governance Framework– Syariah Risk in Business– Unique Risk in Islamic Finance
• How the World has changed: the world onwards
• FIDE Programme (Module B)• Recovery & Resolution Planning• Integrated Reporting
• FIDE Programme (Module B)– Board Dynamics in Controlled CompaniesCase Study: Taubman vs Simon– M&A Case: The Chemical and Chase Manhattan Merger
• FIDE Programme (Module B)– Governance Culture vs Compliance Case study: Volkswagen– Ethics in Finance
• FIDE Programme (Module B)– Board Effectiveness: The Role of Evaluation & Success Planning– Compensation
• FIDE Programme (Module B)– Return on Compliance– Emerging Risks & Future Boards
• FIDE Programme (Module B)– Overview of Fintech– Fintech Impact on Banking Payments: How the Tail Wagged the Dog
Sap
ura
En
erg
y B
erh
ad
An
nu
al R
ep
ort
20
22
35
Corporate Governance
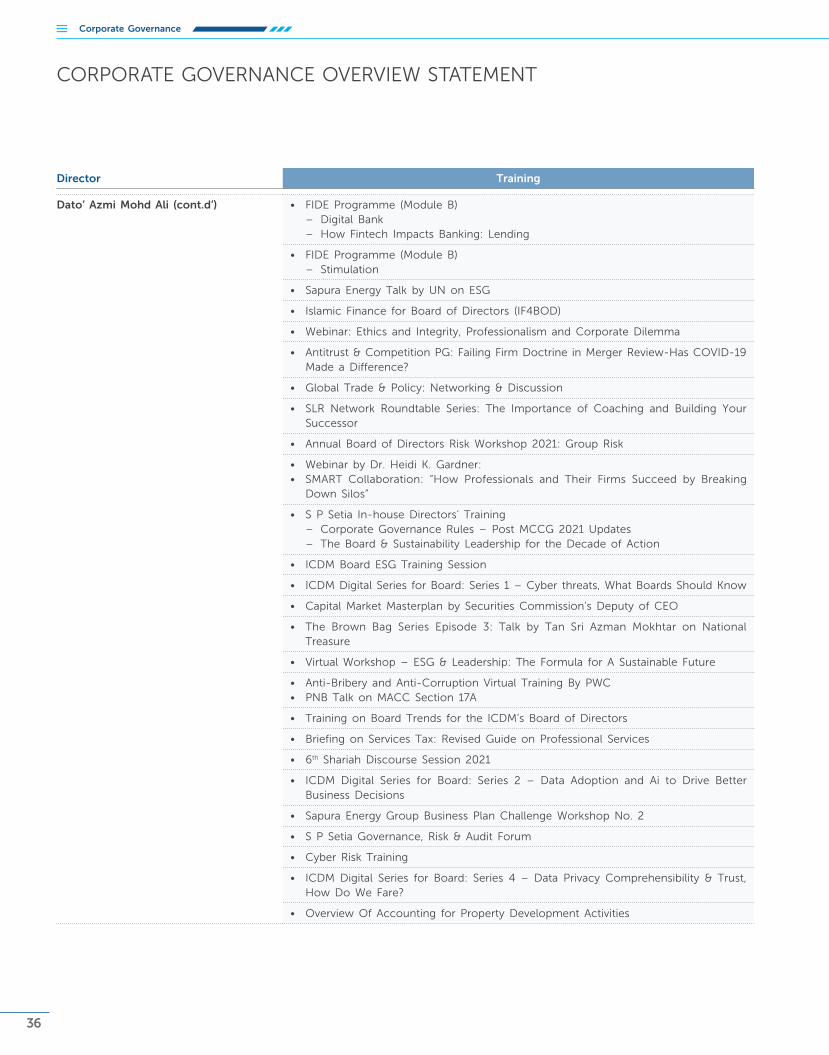
Director Training
Dato’ Azmi Mohd Ali (cont.d’) • FIDE Programme (Module B)– Digital Bank– How Fintech Impacts Banking: Lending
• FIDE Programme (Module B)– Stimulation
• Sapura Energy Talk by UN on ESG
• Islamic Finance for Board of Directors (IF4BOD)
• Webinar: Ethics and Integrity, Professionalism and Corporate Dilemma
• Antitrust & Competition PG: Failing Firm Doctrine in Merger Review-Has COVID-19 Made a Difference?
• Global Trade & Policy: Networking & Discussion
• SLR Network Roundtable Series: The Importance of Coaching and Building Your Successor
• Annual Board of Directors Risk Workshop 2021: Group Risk
• Webinar by Dr. Heidi K. Gardner:• SMART Collaboration: “How Professionals and Their Firms Succeed by Breaking
Down Silos”
• S P Setia In-house Directors’ Training– Corporate Governance Rules – Post MCCG 2021 Updates– The Board & Sustainability Leadership for the Decade of Action
• ICDM Board ESG Training Session
• ICDM Digital Series for Board: Series 1 – Cyber threats, What Boards Should Know
• Capital Market Masterplan by Securities Commission’s Deputy of CEO
• The Brown Bag Series Episode 3: Talk by Tan Sri Azman Mokhtar on National Treasure
• Virtual Workshop – ESG & Leadership: The Formula for A Sustainable Future
• Anti-Bribery and Anti-Corruption Virtual Training By PWC• PNB Talk on MACC Section 17A
• Training on Board Trends for the ICDM’s Board of Directors
• Briefing on Services Tax: Revised Guide on Professional Services
• 6th Shariah Discourse Session 2021
• ICDM Digital Series for Board: Series 2 – Data Adoption and Ai to Drive Better Business Decisions
• Sapura Energy Group Business Plan Challenge Workshop No. 2
• S P Setia Governance, Risk & Audit Forum
• Cyber Risk Training
• ICDM Digital Series for Board: Series 4 – Data Privacy Comprehensibility & Trust, How Do We Fare?
• Overview Of Accounting for Property Development Activities
36
Corporate Governance
CORPORATE GOVERNANCE OVERVIEW STATEMENT

Director Training
Lim Tiang Siew • Corporate Liability for Corruption Offences Section 17A MACC Act, Adequate Procedures and ISO 37001 Anti-bribery Management Systems
• Board Effectiveness Evaluation Industry Briefing (Session 2)• BNM-FIDE FORUM-MASB Dialogue on MFRS17 Insurance Contracts: What Every
Director Must Know • Board & AC Priorities 2021 • Malaysian Code on Corporate Governance • Dialogue on The Role of Independent Director • Dialogue on The Future of Malaysia’s Financial Sector • JC3 Flagship Conference 2021: Finance for Change • Dialogue on RMiT Implementation • PNB Knowledge Forum 2021: Rising Above COVID-19 – Reimaging Work in Malaysia
and Beyond • MSIG x CIAP Webinar on Protecting biodiversity – the insurance for a sustainable
future • The Rise of Govcoins & What’s next for Crypto • The Board’s role and responsibilities in Crisis Communication• FIDE FORUM’s Engagement Session on Board Leadership Framework (Session A)
– “Shaping the future of FI Board Leadership”• BNM-FIDE FORUM Dialogue: Risk-Based Capital Framework for Insurers and Takaful
Operators• ESG & Leadership: The formula for a sustainable future• The Inuention of Tomorrow: Crafting Our New Collective Narrative• Keynote presentation & fireside chat with international speaker and Guinness World
Record holder: Chris Bertish• Bursa-FIDE FORUM Dialogue on Sustainability• The 2050 Net Zero Carbon Emissions Target: Finance’s Role• SC-FIDE FORUM Dialogue on Capital Market Plan 3• Annual Dialogue with Governor of Bank Negara Malaysia• AOB Conversation with Audit Committees
Datuk Iain John Lo • Financial Institution Directors Education• MACC Section 17A and Adequate Procedures• Capital Markets Training Modules 1-4• MFRS17 Insurance Contracts, Ernst & Young • Implementing changes in MCCG• Defending your company and keeping up with key Cybersecurity risks• Risk Management Committee – Banking Sector• The tree, the sky, the sun – a pathway towards Malaysia’s carbon neutral future• Internal Capital Adequacy Assessment Process by Stamford Academy Ng Ngai Kins • ESG & Leadership, Formula for a Sustainable Future• Task Force on Climate-Related Financial Disclosures Annex• Audit Oversight Board conversation with audit committee• The Business of 5G – today and tomorrow
Datuk Ramlan Abdul Rashid • PNB Rising above COVID-19; Reimagining work in Malaysia and Beyond• PNB ESG at the Forefront• Virtual Workshop – ESG & Leadership: The Formula for A Sustainable Future
Datuk Muhamad Noor Hamid • Virtual Workshop – ESG & Leadership: The Formula for A Sustainable Future
Datuk Mohd Anuar Taib • PNB Knowledge Forum 2022 – Sustainable Investing ESG at the Forefront • PNB Rising above COVID-19; Reimagining work in Malaysia and Beyond• Virtual Workshop – ESG & Leadership: The Formula for A Sustainable Future
Dato’ Shahriman Shamsuddin • Virtual Workshop – ESG & Leadership: The Formula for A Sustainable Future
Sap
ura
En
erg
y B
erh
ad
An
nu
al R
ep
ort
20
22
37
Corporate Governance

OUR COMPLIANCE UNIVERSE
Integrity and Ethics
The Board strives to adhere to the highest ethical standards in discharging its responsibilities and continues to promote integrity and ethical conduct among its employees in all aspects of the Group’s business operations, including confidentiality of information, conflicts of interest, as well as Health, Safety and Environment (“HSE”) performance, amongst others.
Code of Ethical Conduct
The Group has in place a Code of Ethical Conduct that sets the tone on how the Group’s business is conducted globally that applies to all members of the organisation. The Group aims to act responsibly, accountably, and with transparency in all areas of operations. The areas covered by the Code of Ethical Conduct are anti-corruption and bribery, gifts and hospitality, conflict of interest, fair competition, whistleblowing, and sanctions for violations.
The Code of Ethical Conduct is available at www.sapuraenergy.com/corporate/compliance/.
Anti-Bribery and Corruption Policy Statement
The Group conducts all its business in an honest and ethical manner and takes a zero-tolerance approach to bribery and corruption and is committed to acting professionally, fairly and with integrity in all its business dealings and relationships. The Group is also committed in upholding all laws relevant to countering bribery and corruption in Malaysia and all other jurisdictions in which it operates. This is accessible to the employees or other stakeholders at www.sapuraenergy.com/corporate/compliance/.
Whistleblowing Policy
The Group is committed to maintaining an open working environment, honest communication is the expectation and not the exception. The Group has launched a Whistleblowing helpline, which is accessible to the employees or other stakeholders at www.sapuraenergy.ethicspoint.com.
Insider Trading
The Board, key management personnel and principal officers of the Group are prohibited from trading in securities or any kind of properties based on price-sensitive information and knowledge which have not been publicly announced.
Notice on closed periods for trading in shares of Sapura Energy are circulated to the Board, key management personnel and principal officers who are deemed privy to any price-sensitive information and knowledge in advance of, whenever the closed period is applicable.
BOARD COMPOSITION
Independent Director and its Tenure
For FY2022, the Board comprised six (6) Independent Directors during the financial year under review.
The Board has a set of criteria in assessing the independence and performance of Directors. The BNRC annually reviews and assesses the level of independence of the Independent Directors of the Board in line with the MMLR. The BNRC will also consider the individual Director’s ability to exercise independent judgement and to demonstrate the values and principles associated with independence such as impartiality, objectivity and consideration of all stakeholders’ interests.
For the financial year under review, none of the six (6) Independent Directors have served the Board for more than nine (9) years and BNRC has assessed and concluded that all the Independent Directors continue to demonstrate, conduct and behave in a manner indicative of independence, and that each of them is independent of the Company’s management and free from any business or other relationship which could materially interfere with the exercise of independent judgement, objectivity or the ability to act in the best interest of the Company.
Diversity
Diversity in the Board’s composition is essential to facilitate good decision-making as this enables different insights and perspectives to be harnessed. This diversity criteria may include competencies, skills, knowledge, experience, ethnicity, gender, age and educational background. The Group’s Board Diversity Policy seeks to be inclusive and eradicate any form of discrimination, may it be on the basis of gender, age, ethnicity or other factors. The Board Diversity Policy is accessible on the Company’s official website at www.sapuraenergy.com.
In terms of diversity in skills, experience and competencies, the Board comprises members with various professional backgrounds and expertise from the fields of oil & gas, engineering, financial, investment, insurance, information technology, accounting, management, economics, business and public administration, all of whom bring in-depth and diverse experiences, expertise and perspectives to the Group’s operations to ultimately enhance shareholders’ value for the long-term. The Board’s composition is further strengthened with the appointment of two new board members namely Datuk Iain John Lo and Mr Bernard Rene Francois Di Tullio with expertise and skills in the oil & gas industry. Datuk Iain John Lo joined the Board as an Independent Non-Executive Director, while Mr Bernard Rene Francois Di Tullio joined as Non-Independent Non-Executive Director on 1 May 2021. On 1 April 2021, Tan Sri Shahril Shamsuddin, the President and GCEO/Founder of the Company retired after leading the Group for more than 25 years. Tan Sri Shahril was succeeded by Datuk Mohd Anuar Taib, who took over on 23 March 2021.
38
Corporate Governance
CORPORATE GOVERNANCE OVERVIEW STATEMENT

The Board through the BNRC will source suitable candidates with the right skills and experiences to complement and support the existing Board composition based on business needs, strategic direction of the Company and good governance.
During financial year under review, the BNRC had established a pool of potential candidates to fill up the gap for women directors and independent directors with techno-commercial as well as oil and gas skills and experiences.
All shortlisted candidates would be assessed by BNRC which includes assessment on skills competency matrix (relating to skills and experience), independence test for independent directors and integrity test under Malaysia Anti-Corruption Commission (“MACC”) for all candidates.
The BNRC or one or more representatives of the BNRC would also have an interaction session with the potential candidates to review the suitability of the candidates against the Values of the Company namely Trust, Honesty, Respect, Safe, Agile and Professional before recommending for approval on the appointment to the Board.
On 1 May 2021, Datuk Mohd Anuar Taib was appointed as Executive Director of the Company. On 25 March 2022, Mr Cosimo Borrelli, a restructuring specialist, was appointed as Non-Independent Non-Executive Director of the Company.
During the FY2022, the BNRC had reviewed the competency matrix of Board members to determine their level of skills and experiences based on 3 categories namely Competency, Practice and Awareness.
Board Appointment Process
The appointment of a new Board member is subject to the following process:
BoardAppointment
Process
Sourcing ofCandidates
Selection ofCandidates
Assessment on Candidates
BNRCDeliberation
Interactionwith Candidates
Recommendationfor Board’s Approval
Identification of Skills& Experiences1
2
3
4
5
6
7
Sap
ura
En
erg
y B
erh
ad
An
nu
al R
ep
ort
20
22
39
Corporate Governance

Board Assessment
The results of the assessments conducted for FY2022 indicated that the Board, Board Committees and the individual Directors had performed within expectations and were able to discharge their functions and duties effectively.
From the assessment conducted, the key strengths of the Board are:
Board Remuneration Policies and Procedures
The level of Directors’ remuneration is comparable in order to attract and retain Directors of such calibre to provide the necessary skills and experience as required and to commensurate with the responsibilities for the effective management and operations of the Group. All Non-Executive Directors are paid additional fees for added responsibilities undertaken such as a Director acting as Chairman of a Board Committee and membership of Board Committees.
The remuneration of the Non-Executive Directors, which is subject to the approval of the shareholders at the annual general meetings, is recommended by BNRC to the Board as a whole to ensure that it is aligned to the market and to the Directors’ duties and responsibilities. With the consideration of the current financial distress of the Group, the Board is proposing to shareholders to reduce by half the fees for the period from 29 July 2022 until the conclusion of the next Annual General Meeting.
The Board, through the BNRC, annually reviews the performance of the Executive Director as a prelude to determining his annual remuneration, bonus, and other benefits. In discharging this duty, the BNRC evaluates the performance of the Executive Director against the objectives and KPIs approved by the Board, thereby linking their remuneration to performance.
The basic salary of the Executive Director is fixed for the duration of his contract. Any revision to the basic salary will be reviewed and recommended by the BNRC for the approval of the Board, taking into consideration, amongst others, individual performance, inflation price index, and information from independent sources on the rates of salary of similar positions in other comparable companies within the industry. The Executive Director is not entitled to Directors’ fees.
The Board is also satisfied with the results of the assessment on the Independent Directors and is of the view that all Independent Directors are independent of management and free of any interest, position, association or other relationship that might materially influence the Independent Director’s capacity to bring an independent judgement and to act in the best interest of the Group and its stakeholders.
Re-election
The BNRC is also responsible for recommending Directors for re-election at the Eleventh Annual General Meeting. In accordance with the Constitution of the Company, all newly appointed Directors are subject to re-election by the shareholders at the first annual general meeting following their appointments. Additionally, at least one-third (1/3) of the Directors for the time being, or if their number is not three (3) or a multiple of three (3), then the number nearest to one-third (1/3), shall be subject to retirement by rotation at least once every three (3) years, and shall be eligible for re-election. The retiring Directors would be those who have been longest in office since their last election. This provides shareholders the opportunity to evaluate the performance of the Directors and promote effective Board members.
Directors subject to retirement by rotation pursuant to the Constitution are initially considered by the BNRC, taking into consideration their required mix of skills, competencies, experience and other qualities required before they are recommended for re-election by shareholders.
An effective Board that provides adequate oversight and keeps
the organisation moving in the right direction with proper
leadership;
1A Board with a majority
of Independent Directors that brought expertise
and objectivity; and
2A Board with diversity of
skills and industry knowledge/experience.
3
Moving forward, the key focus areas will cover the following:
Improve on quality of Information and Decision Making;
Review the Board’s Responsibilities;
Review the Board Structure;
Review the Directors’ Development and
Succession Planning; and
Review Environmental, Social and Governance (ESG) Issues pertinent
to the Group.
40
Corporate Governance
CORPORATE GOVERNANCE OVERVIEW STATEMENT

Details of the Directors’ remuneration (both Executive and Non-Executive) for FY2022 are as follows:
Company Subsidiary
Group
Salariesand other
emolumentsRM’000
FeesRM’000
Bonus RM’000
Defined contribution
planRM’000
Benefits-in-kind
RM’000Meeting
AllowancesFees
RM’000Total
RM’000
Executive Directors
Tan Sri Dato’ Seri Shahril Shamsuddin1 800 31 – 86 30 2 – 949
Datuk Mohd Anuar Taib2 1,408 – – 170 11 – – 1,589
Total 2,208 31 – 256 41 2 – 2,538
Non-Executive Directors
Tan Sri Dato’ Seri Shamsul Azhar Abbas3 64 614 – – 13 22 – 713
Dato’ Mohammad Azlan Abdullah4 – 352 – – – 24 – 376
Bernard Rene Francois Di Tullio – 278 – – – 16 – 294
Tuan Syed Ali Bin Syed Salem Alsagoff5 – 85 – – – 7 – 92
Datuk Muhamad Noor Hamid – 453 – – – 32 – 485
Datuk Ramlan Abdul Rashid – 412 – – – 27 – 439
Datuk Iain John Lo – 291 – – – 14 – 305
Lim Tiang Siew – 430 – – – 31 – 461
Tan Sri Dato’ Megat Zaharuddin Megat Mohd Nor6 24 399 – – – 22 – 445
Dato’ Azmi Mohd Ali – 358 – – – 24 – 382
Dato’ Shahriman Shamsuddin – 291 – – – 14 – 305
Total 88 3,963 – – 13 233 – 4,297
Notes:1 Resigned as Non-Independent Non-Executive Director on 30 April 2021.2 Appointed as Group Chief Executive Officer on 23 March 2021 and Executive Director on 1 May 2021.3 Retired as Chairman, Non-Independent Non-Executive Director on 7 May 2022.4 Appointed as Chairman, Non-Independent Non-Executive Director on 7 May 2022.5 Resigned as Non-Independent Non-Executive Director on 30 April 2021.6 Resigned as Senior Independent Non-Executive Director on 7 May 2022.
Long-Term Incentive Programme (LTIP) scheme
No LTIP shares were granted for FY2022 and no amount vested to a Director during period under review.
Options granted to Executive Director under the Executive Share Option Scheme
Pursuant to the Extraordinary General Meeting (“EGM”) held on 29 November 2018, the shareholders of the Company approved the establishment of the Executive Share Option Scheme (“ESOS”) and the offer and grant to Tan Sri Dato’ Seri Shahril Shamsuddin, being the Executive Director and President and Group Chief Executive Officer (“PGCEO”) of the Company, options to subscribe for up to five percent (5%) of the issued ordinary shares of the Company from time to time during the ESOS period.
On 14 December 2018, Tan Sri Dato’ Seri Shahril Shamsuddin was offered and granted 299,607,754 options, being five percent (5%) of the then issued ordinary shares of the Company, at the exercise price of RM0.31.
Sap
ura
En
erg
y B
erh
ad
An
nu
al R
ep
ort
20
22
41
Corporate Governance

By-Laws Adjustments to Granted ESOS
Pursuant to the completion of the Rights Issue exercise on 29 January 2019, this resulted in increase in the number of issued ordinary shares of Sapura Energy from 5,992,155,087 to 15,979,080,232, and thus the total number of options granted on 14 December 2018 and its exercise price have been adjusted in accordance with the By-Laws governing the ESOS. The adjustment resulted in an additional 132,853,591 options being granted to Tan Sri Dato’ Seri Shahril Shamsuddin, and the exercise price of the options was revised to RM0.22.
Further ESOS Grant Resulting from Enlarged Number of Issued Ordinary Shares Post-Rights Issue
Pursuant to the shareholders’ approval to grant up to ten percent (10%) of the total number of Sapura Energy ordinary shares in issue and to grant Tan Sri Dato’ Seri Shahril Shamsuddin to subscribe for up to five percent (5%) of the total number of Sapura Energy ordinary shares in issue, as a consequence of the enlarged number of issued ordinary shares post the Rights Issue,
a further offer of 366,492,667 options had been made to Tan Sri Dato’ Seri Shahril Shamsuddin on 12 April 2019 at an exercise price of RM0.39.
Weighted Average Price of All Options Granted
Following the further grant of options on 12 April 2019, the weighted average exercise price of the options granted to-date is RM0.30.
ESOS Conditions
As part of the ESOS conditions, Tan Sri Dato’ Seri Shahril Shamsuddin is prohibited from selling, transferring or assigning any new ordinary shares in the Company obtained through the exercise of the ESOS within three (3) years from the date of offer.
Details of the options granted to Executive Director/PGCEO, Tan Sri Dato’ Seri Shahril Shamsuddin under the ESOS as at the date of Annual Report are set out under the Additional Compliance Information on page 69 of this Annual Report.
PRINCIPLE B: EFFECTIVE AUDIT AND RISK MANAGEMENT
Effectiveness of Audit Committee
The Board is assisted by the BAC in reviewing the information on annual audited financial statements and announcements on unaudited quarterly financial results to be disclosed to shareholders. This ensures the accuracy, adequacy, and completeness of the information thereof as well as compliance with the applicable financial reporting standards.
The Board takes responsibility for presenting balanced and meaningful assessments of the financial performance and prospects of the Group. The financial statements are drawn up in accordance with the provisions of the Companies Act 2016 and the applicable approved Financial Reporting Standards in Malaysia which give a true and fair view of the affairs of the Company and the Group.
Group Internal Audit
The Group Internal Audit (“GIA”) functionally reports to the BAC, and the GIA has the principal responsibility for undertaking a regular and systematic review of the systems and internal controls so as to provide reasonable assurance that such systems continue to operate satisfactorily and effectively within the Group.
The internal audit function of the Company is premised on the requirements of an independent and objective function. The GIA’s direct reporting line to the BAC enables it to be independent of Management so as to exercise objectivity.
Both internal audit and the external auditors provide integral support to the BAC by acting as a sounding board.
External Auditors
The external auditors, Ernst & Young PLT, report to the BAC their findings each year. In doing so, the Group has established a transparent arrangement to meet the professional requirements by the auditors. The BAC also reviews the results of the annual audit, the audit report and management letters, including Management’s responses thereon with the auditors. Three (3) private sessions between the auditors and the BAC, in the absence of the Management team, were held during the financial year under review.
The suitability and independence of external auditors are annually reviewed and monitored by the BAC. The BAC has a set of criteria in assessing the suitability and independence of the external auditors. Written assurance from the external auditors is also sought in confirming that they are, and have been, independent throughout the conduct of the audit engagement in accordance with the terms of all relevant professional and regulatory requirements.
RISK MANAGEMENT AND INTERNAL CONTROL FRAMEWORK
The details of the Risk Management and Internal Control Framework are set out in the Statement on Risk Management and Internal Control on pages 61 to 63 of this report.
42
Corporate Governance
CORPORATE GOVERNANCE OVERVIEW STATEMENT

PRINCIPLE C: INTEGRITY IN CORPORATE REPORTING AND MEANINGFUL RELATIONSHIP WITH STAKEHOLDERS
Communication with Stakeholders
The Board recognises the importance of an effective communication channel between the Board, stakeholders, institutional investors and the investing public at large, both locally and internationally, with the objective of providing as much as possible a clear and complete picture of the Group’s performance and position. The Company’s Annual Report remains the primary channel of communication with the stakeholders.
In this respect, the Group is fully committed to maintaining a high standard for the dissemination of relevant and material information relating to developments within the Group. In the absence of a Group Corporate Disclosure Policy, there are, however, proper internal procedures and processes established to govern the release of information to the public. Evaluation of the timeliness, accuracy, and quality of the information to be disclosed is guided by the Corporate Disclosure Guide issued by Bursa Securities.
Analyst Briefings on Quarterly Results
Sapura Energy conducts media and analyst briefings and/or conferences on quarterly results chaired by the GCEO immediately after announcement of the quarterly results to Bursa Securities. The briefings provide a platform for analysts and media to receive a balanced and complete view of the Group’s performance and the issues faced.
Investor Meetings
The Investor Relations Department of the Group has frequent one-on-one and group meetings with analysts, investors, and potential investors throughout the year to provide constant communication with the investment community. Reasonable access to the Senior Management ensures analysts and investors are able to engage with key executives within the Group. Dissemination of information during the briefings is confined to permissible disclosure within the MMLR that will further enhance the understanding of the Group’s operations and activities.
Corporate Website
The corporate website of the Company at www.sapuraenergy.com provides quick access to information on the Group. Information on the website includes amongst others, the Group’s corporate profile, Board profiles, announcements to Bursa Securities, press releases, share information, financial results, TOR of Board Committees, and corporate news. The Company’s website is regularly updated to provide current and comprehensive information about the Group.
Annual Report
The Company’s Annual Report provides comprehensive coverage of the Group’s operations and financial performance. An online version of the Annual Report is available on the Company’s website.
Media Coverage
Media coverage of the Group and its business activities is initiated proactively at regular intervals to provide wider publicity and to improve the general understanding of the Group’s business among investors and the public.
Conduct of General Meetings
General meetings are the principal platform gathering of shareholders and the board of directors of a company. During general meetings, the question and answer session is open to all shareholders who participated. The Board, Senior Management of the Group, as well as the Group’s auditors are present to respond to issues raised during general meetings.
Notice of the Tenth Annual General Meeting (“AGM”), a fully virtual meeting was issued to all shareholders 30 days before the meeting to provide sufficient time for shareholders to consider the resolutions that will be discussed and decided at the annual general meeting.
A comprehensive Administrative Notes companying the AGM Notice is essential to ensure shareholders are able to participate, engage the Board and Senior Management effectively and make informed voting decisions at General Meetings.
This Corporate Governance Overview Statement is made in accordance with a resolution passed by the Board on 30 May 2022.
Sap
ura
En
erg
y B
erh
ad
An
nu
al R
ep
ort
20
22
43
Corporate Governance

BOARD OF DIRECTORS
Group InternalAudit
Chief ExecutiveOfficer,
Engineering &Construction
Chief PeopleOfficer,
People & Culture
Chief ExecutiveOfficer,
Operations & Maintenance
Chief StrategyOfficer,
Group Strategy
Chief Executive Officer, Drilling
Senior Vice President, Group
QHSE
Group ChiefFinancial Officer
Chief ExecutiveOfficer,
Exploration & Production
Group GeneralCounsel,
Group Legal &Compliance
GROUP CHIEFEXECUTIVE
OFFICER
Group CompanySecretary
Board Risk ManagementCommittee
Board Nomination and Remuneration
Committee
Board Audit Committee
44
Corporate Governance
GROUP ORGANISATION STRUCTURE

BOARD OF DIRECTORS
Dato’ Mohammad Azlan AbdullahChairmanNon-Independent Non-Executive Director
Datuk Mohd Anuar TaibGroup Chief Executive OfficerExecutive Director
Dato’ Shahriman ShamsuddinNon-Independent Non-Executive Director
Datuk Muhamad Noor HamidIndependent Non-Executive Director
Datuk Ramlan Abdul RashidIndependent Non-Executive Director
Lim Tiang SiewIndependent Non-Executive Director
Dato’ Azmi Mohd AliIndependent Non-Executive Director
Datuk Iain John LoIndependent Non-Executive Director
Bernard Rene Francois Di TullioNon-Independent Non-Executive Director
Cosimo BorrelliNon-Independent Non-Executive Director
BOARD AUDIT COMMITTEE Lim Tiang Siew (Chairman) Datuk Muhamad Noor Hamid Dato’ Azmi Mohd Ali Bernard Rene Francois Di Tullio
BOARD NOMINATION AND REMUNERATION COMMITTEE
Datuk Muhamad Noor Hamid Datuk Ramlan Abdul Rashid Datuk Iain John Lo
BOARD RISK MANAGEMENT COMMITTEE Datuk Iain John Lo (Chairman) Lim Tiang Siew Dato’ Mohammad Azlan Abdullah Bernard Rene Francois Di Tullio
COMPANY SECRETARIES Tai Yit Chan
(SSM Practising Certificate No. 202008001023)(MAICSA 7009143)
Tan Seiw Ling(SSM Practising Certificate No. 202008000791)(MAICSA 7002302)
AUDITORS Ernst & Young PLT
202006000003 (LLP0022760-LCA) & AF 0039Chartered AccountantsLevel 23A, Menara MileniumJalan Damanlela, Pusat Bandar Damansara50490 Kuala Lumpur, Malaysia
Tel : +603-7495 8000Fax : +603-2095 9076/78
COMPANY WEBSITEwww.sapuraenergy.com
SHARE REGISTRAR Boardroom Share Registrars Sdn Bhd
11th Floor, Menara SymphonyNo. 5, Jalan Prof. Khoo Kay KimSeksyen 13, 46200 Petaling JayaSelangor, Malaysia
Tel : +603-7890 4700Fax : +603-7890 4670Website : www.boardroomlimited.com
REGISTERED OFFICE Sapura@Mines
No. 7, Jalan TasikThe Mines Resort City43300 Seri KembanganSelangor Darul Ehsan, Malaysia
Tel : +603-8659 8800Fax : +603-8659 8848
STOCK EXCHANGE LISTING Main Market of Bursa Malaysia Securities Berhad
Stock Name : SAPNRGStock Code : 5218Listing Date : 17 May 2012
PRINCIPAL BANKERS ABN AMRO Bank AmBank Berhad CIMB Bank Berhad Citibank Export-Import Bank of Malaysia Berhad ING Bank Malayan Banking Berhad Mizuho Bank First Abu Dhabi Bank RHB Bank Berhad Standard Chartered Bank Sumitomo Mitsui Banking Corporation MUFG Bank, Ltd United Overseas Bank
CORPORATEINFORMATION
Sap
ura
En
erg
y B
erh
ad
An
nu
al R
ep
ort
20
22
45
Corporate Governance

PROFILE OF BOARD OF DIRECTORS
DATO’ MOHAMMAD AZLAN ABDULLAH
Chairman, Non-Independent Non-Executive Director
Board Committee Memberships:
• Member, Board Risk Management Committee
Directorship in Other Public Companies and Listed Issuers:
• Nil
Experience/Achievement and Occupation:
• Presently the Group Chief Executive Officer of Projek Lintasan Kota Holdings Sdn Bhd (PROLINTAS) Group of Companies.
• Chief Executive Officer (“CEO”) of The New Straits Times Press (Malaysia) Berhad (“NSTP”) (2012-2017).
• Chief Operating Officer of NSTP (2011).• Attended the Asean Senior Management Development Programme by
Harvard Business School Alumni Club Malaysia (2009). • General Manager and CEO of Big Tree Outdoor Sdn. Bhd., the Malaysia’s
leading outdoor advertising company (2001-2011).• Senior Manager, President’s Office of Renong Group (Property Division)
(1999-2001).• Involved in the pre and post construction of the development of the
North-South Expressway privatisation project under Projek Lebuhraya Utara Selatan Bhd (“PLUS”) (1992-1999).
• Started his career with Coopers and Lybrand, a public accounting firm (1991-1992).
Academic/Professional Qualifications:
• Bachelor of Business Degree (Accountancy), University of Tasmania, Australia.
• Fellow of the Certified Practising Accountant (CPA) Australia.• Chartered Accountant, Malaysia Institute of Accountants (MIA).
Declarations:
• Dato’ Mohammad Azlan has no family relationship with any Director and/or major shareholder of Sapura Energy Berhad.
• Nominee Director of Permodalan Nasional Berhad.• Dato’ Mohammad Azlan has no conflict of interest with Sapura Energy
Berhad.• Dato’ Mohammad Azlan has neither been convicted of any offence, other
than traffic offences (if any), within the past five years nor has he been imposed any public sanction or penalty by the relevant regulatory bodies during the financial year ended 31 January 2022.
Date of appointment 1 October 2019
Age
Nationality
Gender
Length of tenure as Director
Board Meeting Attendancein FY2022
54 years old
Malaysian
Male
2 years 8 months
12/12
46
Corporate Governance

DATUK MOHD ANUAR TAIB
Group Chief Executive OfficerNon-Independent Executive Director
Board Committee Memberships:
• Nil
Directorship in Other Public Companies and Listed Issuers:
• Nil
Experience/Achievement and Occupation:
• Non-Executive Chairman of PETRONAS Gas Berhad (2016-2019).• Executive Vice President, Upstream, PETRONAS (2016-2019).• Chief Executive Officer of PETRONAS Carigali Sdn Bhd (2012-2016).• Vice President of Development and Production of PETRONAS (2012-2014).• Chairman of Shell Companies in Malaysia (2010-2012).• Non-Executive Chairman of Shell Refining Company (FOM) Berhad (2010-
2012).• Held various key positions at Shell with accountabilities in technical, finance,
supply chain and procurement, commercial and leadership roles in exploration and production, LNG and gas-to-liquid, refining and retail business, in Malaysia, the US and the Asia-Pacific region (1990-2010).
Academic/Professional Qualifications:
• MBA, International Management, RMIT University, Melbourne, Australia.• BSc, Engineering (Mechanical), Case Western Reserve University, Cleveland,
Ohio.
Declarations:
• Datuk Mohd Anuar Taib has no family relationship with any Director and/or major shareholder of Sapura Energy.
• Datuk Mohd Anuar Taib has no conflict of interest with Sapura Energy.• Datuk Mohd Anuar Taib has neither been convicted of any offence, other
than traffic offences (if any), within the past five years nor has he been imposed any public sanction or penalty by the relevant regulatory bodies during the financial year ended 31 January 2022.
Date of appointment
27 August 2020 – 1 October 2020(Independent Non-Executive Director)
1 October 2020 – 22 March 2021(Chief Operating Officer and CEO Designate)
23 March 2021(Group Chief Executive Officer)
1 May 2021(Executive Director)
Age
Nationality
Gender
54 years old
Malaysian
Male
Length of tenure as Director
Board Meeting Attendancein FY2022
1 year
9/9
Sap
ura
En
erg
y B
erh
ad
An
nu
al R
ep
ort
20
22
47
Corporate Governance

BERNARD RENE FRANCOIS DI TULLIO
Non-Independent Non-Executive Director
Board Committee Memberships:
• Member, Board Audit Committee • Member, Board Risk Management Committee
Directorship in Other Public Companies and Listed Issuers:
• Nil
Experience/Achievement and Occupation:
• Director of Malaysia Marine and Heavy Engineering Berhad (2012-2020)• Advisor to Group Chairman and CEO of Technip SA, Kuala Lumpur (2011-
2018).• President and Chief Operating Officer of Technip SA, Paris, Ille de France
(2005-2011).• President and CEO Asia Pacific of Technip Group, Kuala Lumpur (1998-
2005).• President and CEO of Technip Geoproduction (MSDN BHD), Kuala Lmpur
(1982-2005).• Engineer, Senior Engineer and Project Manager of Technip Group, Paris,
Ille de France (1975-1982).
Academic/Professional Qualifications:
• DESS in Management: Company Management from the Institut D’Administration des Entreprises (I.A.E), Paris.
• Graduate Engineering Mechanical and Electrical: Engineering from Ecole Speciale de Mecanique et D’Electricite, ESME, Paris.
Declarations:
• Bernard Rene Francois Di Tullio has no family relationship with any Director and/or major shareholder of Sapura Energy.
• Bernard Rene Francois Di Tullio has no conflict of interest with Sapura Energy.
• Bernard Rene Francois Di Tullio has neither been convicted of any offence, other than traffic offences (if any), within the past five years nor has he been imposed any public sanction or penalty by the relevant regulatory bodies during the financial year ended 31 January 2022.
Date of appointment 1 May 2021
Age
Nationality
Gender
Length of tenure as Director
Board Meeting Attendancein FY2022
73 years old
French
Male
1 year
9/9
48
Corporate Governance
PROFILE OF BOARD OF DIRECTORS

DATO’ SHAHRIMAN SHAMSUDDIN
Non-Independent Non-Executive Director
Board Committee Memberships:
• Nil
Directorship in Other Public Companies and Listed Issuers:
• Managing Director, Sapura Resources Berhad• Executive Director, Sapura Industrial Berhad
Experience/Achievement and Occupation:
• Director of Sapura Technology Sdn. Bhd. and Sapura Holdings Sdn. Bhd. • Director of SapuraCrest Petroleum prior to the merger between SapuraCrest
Petroleum Group and Kencana Petroleum Group (2008-2012).• Started his career with Sapura Group since 1991 and has held several key
senior positions within the Group. He manages a diversified portfolio which includes aviation and property investment.
Academic/Professional Qualifications:
• Master of Science in Engineering Business Management from Warwick University, United Kingdom.
• Bachelor of Science in Industrial Technology from Purdue University, United States of America.
Declarations:
• Dato’ Shahriman Shamsuddin and Tan Sri Dato’ Seri Shahril Shamsuddin, a Non-Independent Non-Executive Director, are brothers and they are also major shareholders of Sapura Energy Berhad.
• Dato’ Shahriman has no conflict of interest with Sapura Energy Berhad.• Dato’ Shahriman has neither been convicted of any offence, other than
traffic offences (if any), within the past five years nor has he been imposed any public sanction or penalty by the relevant regulatory bodies during the financial year ended 31 January 2022.
Date of appointment 9 December 2011
Age
Nationality
Gender
Length of tenure as Director
Board Meeting Attendancein FY2022
53 years old
Malaysian
Male
10 years 6 months
12/12
Sap
ura
En
erg
y B
erh
ad
An
nu
al R
ep
ort
20
22
49
Corporate Governance

DATUK MUHAMAD NOOR HAMID
Independent Non-Executive Director
Board Committee Memberships:
• Member, Board Nomination and Remuneration Committee
Directorship in Other Public Companies and Listed Issuers:
• Nil
Experience/Achievement and Occupation:
• Has more than 30 years of direct working experience in the energy industry ranging from project planning and implementation, operations, consultation and contracts, out of which 20 years of service was in PETRONAS and PETRONAS Gas Sdn Bhd.
• Chief Operating Officer, Chief Executive Officer and Managing Director of Gas Malaysia Berhad (2003-2013).
• Chief Operating Officer of Projass Engineering Sdn Bhd, a Class A Bumiputera construction company involved in oil and gas, power, and infrastructure works (2000-2003).
• General Manager of Pipeline Division in OGP Technical Services Sdn Bhd, a joint venture company between PETRONAS and Nova Corporation of Canada (1993-1999).
• Head of the Pipeline Operation Division and Penisular Gas Utilisation II project team of PETRONAS (1989-1992).
Academic/Professional Qualifications:
• Bachelor of Science (Honours) Degree in Mechanical Engineering, Sunderland Polytechnic, United Kingdom.
• Post Graduate Diploma in Natural Gas Engineering, Institute of Gas Technology in Chicago, Illinois, United States of America.
• Management Programme, Wharton Business School of Management, University of Pennsylvania, United States of America.
Declarations:
• Datuk Muhamad Noor Hamid has no family relationship with any Director and/or major shareholder of Sapura Energy.
• Datuk Muhamad Noor Hamid has no conflict of interest with Sapura Energy.
• Datuk Muhamad Noor Hamid has neither been convicted of any offence, other than traffic offences (if any), within the past five years nor has he been imposed any public sanction or penalty by the relevant regulatory bodies during the financial year ended 31 January 2022.
Date of appointment 14 April 2015
Age
Nationality
Gender
Length of tenure as Director
Board Meeting Attendancein FY2022
70 years old
Malaysian
Male
7 years 1 month
12/12
50
Corporate Governance
PROFILE OF BOARD OF DIRECTORS

DATUK RAMLAN ABDUL RASHID
Independent Non-Executive Director
Board Committee Memberships:
• Member, Board Nomination and Remuneration Committee
Directorship in Other Public Companies and Listed Issuers:
• Nil
Experience/Achievement and Occupation:
• Director of NCB Holdings Berhad (2015-2016).• Group Chief Operating Officer of MNRB Holdings Berhad (“MNRB”) (2011-
2014).• Deputy Chief Executive Officer/Executive Vice President of MNRB Retakaful
(2010-2011).• Director of the Malaysian Insurance Institute and Malaysian Life Reinsurance
Group Berhad (2006-2007).• Chief Executive Officer/Executive Director of Malaysian Assurance Alliance
Berhad (“MAA”) (now known as Zurich Insurance Malaysia) (2002-2007).• Held various key positions in MAA (1985-2002).
Academic/Professional Qualifications:
• Master of Arts in Actuarial Science, Ball State University, Indiana, United States of America.
• Bachelor of Science (Honours) in Mathematics, Universiti Sains Malaysia.• Qualified Risk Director Programme, Institute of Enterprise Risk Practitioners
(IERP).• Global Leadership Development Programme, International Centre for
Leadership in Finance (IClif).
Declarations:
• Datuk Ramlan has no family relationship with any Director and/or major shareholder of Sapura Energy Berhad.
• Datuk Ramlan has no conflict of interest with Sapura Energy Berhad.• Datuk Ramlan has neither been convicted of any offence, other than traffic
offences (if any), within the past five years nor has he been imposed any public sanction or penalty by the relevant regulatory bodies during the financial year ended 31 January 2022.
Date of appointment 23 September 2016
Age
Nationality
Gender
Length of tenure as Director
Board Meeting Attendancein FY2022
63 years old
Malaysian
Male
5 years 8 months
12/12
Sap
ura
En
erg
y B
erh
ad
An
nu
al R
ep
ort
20
22
51
Corporate Governance

Board Committee Memberships:
• Member, Board Audit Committee• Member, Board Risk Management Committee
Directorship in Other Public Companies and Listed Issuers:
• MSIG Insurance (Malaysia) Berhad
Experience/Achievement and Occupation:
• Retired as the Group Chief Internal Auditor of CIMB Group, after serving 27 years in CIMB (1991-2018).
• Chairman of the Audit Committee of MSIG Insurance (Malaysia) Berhad (2019-present).
• An examiner for the Malaysian Institute of Certified Public Accountants professional examinations in respect of a particular subject before being appointed as a reviewer for the same subject (1990-present).
• Member of CIMB’s top management team, and a member of all its major risk committees (2006-2018).
• Has more than 40 years of experience covering internal and external auditing, accounting, corporate finance and advisory, corporate governance and compliance.
Academic/Professional Qualifications:
• Member, Malaysian Institute of Certified Public Accountants.• Chartered Accountant, Malaysian Institute of Accountants.
Declarations:
• Lim Tiang Siew has no family relationship with any Director and/or major shareholder of Sapura Energy Berhad.
• Lim Tiang Siew has no conflict of interest with Sapura Energy Berhad.• Lim Tiang Siew has neither been convicted of any offence, other than
traffic offences (if any), within the past five years nor has he been imposed any public sanction or penalty by the relevant regulatory bodies during the financial year ended 31 January 2022.
Date of appointment 3 June 2020
Age
Nationality
Gender
Length of tenure as Director
Board Meeting Attendancein FY2022
66 years old
Malaysian
Male
1 year
12/12
LIM TIANG SIEW
Independent Non-Executive Director
52
Corporate Governance
PROFILE OF BOARD OF DIRECTORS

DATO’ AZMI MOHD ALI
Independent Non-Executive Director
Board Committee Memberships:
• Member, Board Audit Committee
Directorship in Other Public Companies and Listed Issuers:
• Director, S P Setia Berhad• Director, UMW Holdings Berhad• Director, Worldwide Holdings Berhad• Director, Maybank Islamic Berhad
Experience/Achievement and Occupation:
• Dato’ Azmi is the Senior Partner of Azmi & Associates, a full service corporate and commercial law firm of more than 80 lawyers, based in Kuala Lumpur, Malaysia. The firm, Azmi & Associates under his leadership is recognised as one of the largest law firms (by size) in Malaysia.
• He is an experienced and is one of the leading corporate lawyers in Malaysia with expertise in the areas of mergers and acquisitions, joint ventures, cross-border transactions, project finance, privatisation, energy, oil and gas, and foreign investments.
• Prior to his endeavour in private practice, Dato’ Azmi had spent 61/2 years as an in-house counsel of PETRONAS. He was involved in projects of national importance for Malaysia and negotiated and concluded the NGPSA, a major gas development project for Malaysia, in 1990. His accomplishments as a corporate lawyer are well noted and have earned him numerous awards, accolades and recognitions from reputed international legal publications. He won the prestigious Legal 500 Hall of Fame for M&A/Corporate for three consecutive years, 2020-2022, Distinquished M&A Practitioner for AsiaLaw 2020, International Law Office 2016 Clients Choice Award for Malaysia in Mergers & Acquisitions, and other international publications.
• Currently, he serves as a Director of Terralex, a Florida-based world-wide network of 155 law firms with 20,000 lawyers within its member firms spanning across 100 jurisdictions world-wide. He is also a Director of the Institute of Corporate Directors Malaysia.
Academic/Professional Qualifications:
• Master of Laws (LLM) in the United States of America & Global Business Law, University of Suffolk, Boston Massachusetts, United States of America
• Bachelor of Law LLB (Hons), Universiti Malaya
Declarations:
• Dato’ Azmi Mohd Ali has no family relationship with any Director and/or major shareholder of Sapura Energy Berhad.
• Dato’ Azmi Mohd Ali also sits as a director on Maybank Islamic Bank’s board. As Maybank is one of the bank lenders in Sapura Energy Berhad’s Multi-Currency Facility loan agreement (“MCF”), Dato’ Azmi Mohd Ali has declared a conflict of interest position to the Sapura Energy Berhad’s Board in the current debt restructuring exercise involving negotiations with the MCF lenders and has abstained from joining and voting in board deliberations where such conflict is present. Apart from this, Dato’ Azmi Mohd Ali has no other conflict of interest with Sapura Energy.
• Dato’ Azmi Mohd Ali has neither been convicted of any offence, other than traffic offences (if any), within the past five years nor has he been imposed any public sanction or penalty by the relevant regulatory bodies during the financial year ended 31 January 2022.
Date of appointment 1 October 2020
Age
Nationality
Gender
Length of tenure as Director
Board Meeting Attendancein FY2022
62 years old
Malaysian
Male
1 year 8 months
12/12
Sap
ura
En
erg
y B
erh
ad
An
nu
al R
ep
ort
20
22
53
Corporate Governance

DATUK IAIN JOHN LO
Independent Non-Executive Director
Board Committee Memberships:• Chairman, Board Risk Management Committee• Member, Board Nomination and Remuneration Committee
Directorship in Other Public Companies and Listed Issuers:• RHB Bank Berhad • RHB Investment Bank Berhad• Digi.Com Berhad
Experience/Achievement and Occupation:• Vice President (“VP”) Commercial & New Business Development Asia of
Shell International (2016-31 March 2021).• Country Chairman of Shell Malaysia Ltd, Kuala Lumpur (“Shell Malaysia”)
(2012-31 March 2021).• Chairman of Shell Middle Distillate Synthesis Co Sdn Bhd (2012-31 March 2021).• Director of MLNG Dua and MLNG Tiga (2012-2015/2018).• Chairman of Shell Refining Co (FOM) (2012-2016).• Chairman of Shell Malaysia Timor Sdn Bhd (2012-2016).• Chairman of Kebabangan Petroleum Operations Co Sdn Bhd (2012-2016).• VP Upstream Malaysia & Philippines of Shell Malaysia Ltd (2012-2016).• Director of Singapore Economic Development Board (2009-2012).• Director of CNOOC Shell Petrochemical Co (2006-2012).• Director of Saudi Petrochemical Co (2006-2012).• Director of Petrochemical Company Singapore Pte Ltd (2006-2012).• VP New Business Development & Joint Ventures of Shell Chemical Ltd,
Singapore (2006-2012).• Senior Regional Advisor, Asia Pacific of Shell International, The Hague
(2004-2006).• General Manager (“GM”) Sakhalin LNG Project of Shell Gas & Power,
Singapore (2002-2004).• GM LNG Business of Shell Malaysia Ltd (1998-2002).• Opportunity Coordinator, New Business Development of Shell International
Exploration, The Hague (1996-1998).• Field Engineer, Front End Engineer, Restructuring Consultant of Sarawak
Shell Berhad, Miri (1990-1996).• Civil Engineer of Konsortium Malaysia, Kuching (1988-1990).• Design Engineer of S B Barnes and Associates, Los Angeles (1986-1988).
Academic/Professional Qualifications:• Master of Science in Civil Engineering, University of California, Los Angeles.• Bachelor of Science in Civil Engineering, University of California, Los Angeles.
Declarations:• Datuk Iain John Lo has no family relationship with any Director and/or
major shareholder of Sapura Energy Berhad.• Datuk Iain John Lo also sits as a director on RHB Bank’s board. As RHB
Bank is one of the bank lenders in Sapura Energy’s Multi-Currency Facility loan agreement (“MCF”), Datuk Iain has declared a conflict of interest position to the Sapura Energy’s Board in the current debt restructuring exercise involving negotiations with the MCF lenders and has abstained from joining and voting in board deliberations where such conflict is present. Apart from this, Datuk Iain John Lo has no other conflict of interest with Sapura Energy Berhad.
• Datuk Iain John Lo has neither been convicted of any offence, other than traffic offences (if any), within the past five years nor has he been imposed any public sanction or penalty by the relevant regulatory bodies during the financial year ended 31 January 2022.
Date of appointment 1 May 2021
Age
Nationality
Gender
Length of tenure as Director
Board Meeting Attendancein FY2022
60 years old
Malaysian
Male
1 year
8/9
54
Corporate Governance
PROFILE OF BOARD OF DIRECTORS

COSIMO BORRELLI
Nominated Director
Board Committee Memberships:
• Nil
Directorship in Other Public Companies and Listed Issuers:
• Director, Global Invacom Limited (SGX listed)
Experience/Achievement and Occupation:
• Leader of the Asia Pacific and the Caribbean restructuring practice of Kroll.
• Leading restructuring and insolvency practitioner in Asia having worked exclusively in this area since 1980.
• Cosimo Borrelli’s assignments often have a cross border focus including work in Hong Kong, PRC, Singapore, India, Taiwan, Malaysia, Australia, United States, United Kingdom, Europe, Bermuda, British Virgin Islands, Cayman Islands and Africa.
• Cosimo Borrelli is also well regarded for his work as an independent director to listed companies internally, especially those undergoing or targeting turnarounds, mergers and acquisitions, divestments and special situations.
Academic/Professional Qualifications:
• Licensed Insolvency Practitioner, Singapore.• Registered Appointment Taker with the Official Receiver’s Office in Hong
Kong.• Awarded the Hong Kong Institute of Certified Public Accountants’ specialist
designation in insolvency, SD (Insolvency).• Fellow of the Hong Kong Institute of Certified Public Accountants.• Member of the Institute of Chartered Accountants in Australia and New
Zealand.• Member of the Restructuring and Insolvency Faculty of the Hong Kong
Institute of Certified Public Accountants.• Member of the Australian Restructuring Insolvency and Turnaround
Association (ARITA).• Bachelor of Arts in Economics, University of Adelaide, Australia.
Declarations:
• Cosimo Borrelli has no family relationship with any Director and/or major shareholder of Sapura Energy Berhad.
• Cosimo Borrelli has no conflict of interest with Sapura Energy Berhad.• Cosimo Borrelli has neither been convicted of any offence, other than
traffic offences (if any), within the past five years nor has he been imposed any public sanction or penalty by the relevant regulatory bodies during the financial year ended 31 January 2022.
Date of appointment 25 March 2022
Age
Nationality
Gender
Length of tenure as Director
Board Meeting Attendancein FY2022
55 years old
Australian
Male
> 1 year
N/A
Sap
ura
En
erg
y B
erh
ad
An
nu
al R
ep
ort
20
22
55
Corporate Governance

BOARD COMPOSITION & BOARD COMMITTEE
Non-Executive Directors
• Leads the business and is
responsible for its day-to-day
management
• The roles of the Chairman and the
Group CEO/Executive Director
are held by different individuals.
Summaries of the roles of the
Chairman, the Group CEO/
Executive Director, and
Non-Executive Directors are as
follows:
• Responsible for the overall
management of the
Group,ensuring that strategies,
policies and matters set by the
Board are effectively implemented.
• Regularly reviews the performance
of the heads of divisions and
departments who are responsible
for all functions contributing to
the success of the Group.
• Ensure that business and
investment proposals presented
by Management are fully
deliberated and examined.
• Play a key role by providing
unbiased and independent views,
advice and judgment, which take
into account the interests of the
Group and all its stakeholders
including shareholders,
employees, customers, business
associates and the community as
a whole.
Chairman
• Conducts meetings of the Board
and shareholders and ensures
all Directors are properly briefed
during Board discussions.
• Facilitates meetings of the Board
and ensures that no Board
member, whether executive or
non-executive, dominates the
discussion, and that healthy
debate takes place.
BOARD COMPOSITION
Currently, the Board comprises ten (10) directors, namely:
(a) one Chairman who is a Non-Independent Non-Executive Director;
(b) one Group CEO/Executive Director;
(c) three Non-Independent Non-Executive Directors; and
(d) five Independent Non-Executive Directors.
Audit Committee (“AC”)
Finance And Investment Committee (“FIC”)
Executive Committee (“ExCo”)
Nomination And Remuneration Committee (“NRC”)
Risk Management Committee (“RMC”)
Monitors and reviews the integrity of
financial statements, the relationship
with the external auditors, and the
Reviews investment and divestment
proposals including fund raising
exercises.
Oversees implementation of
management decision as well as
approval of contracts based on
approved limits of authority.
Reviews the composition and
balance of the Board to ensure the
right structure and skills are in place
to deliver the Group’s strategy.
Reviews overall remuneration policy
and strategy implementation of the
Board and Senior Management.
Reviews the effectiveness of the
Group’s risk management framework
to identify, assess, manage and
monitor risks.
Group Chief Executive Officer (“Group CEO”) / Executive Director
Board
ROLES AND RESPONSIBILITIES
56
Corporate Governance

Date of Appointment:
1 October 2020
Directorship in Other Public Companies and Listed Issuers:
• Nil
Experience/Achievement and Occupation:
Datuk Anuar, the Group Chief Executive Officer of Sapura Energy Berhad since March 2021, joined the Group as a non-executive board member in August 2020, and in October 2020 redesignated as Group Chief Operating Officer.
Datuk Anuar has more than 30 years of experience in oil and gas industry with Shell, PETRONAS, and Sapura Energy Berhad in various technical, commercial, and leadership positions covering upstream regulatory functions, exploration and production, refinery, gas, and LNG, downstream marketing commercial functions, and integrated service company with national, regional and global coverage.
Academic/Professional Qualifications:
• MBA, International Management, RMIT University, Melbourne, Australia
• BSc, Engineering (Mechanical), Case Western Reserve University, Cleveland, Ohio
DATUK MOHD ANUAR TAIBGroup Chief Executive Officer
54 / Male / Malaysian
01
Date of Appointment:
1 December 2021
Directorship in Other Public Companies and Listed Issuers:
• Nil
Working Experience:
Andy Chew is currently the Group Chief Financial Officer of Sapura Energy. He was appointed to the role of Group Chief Financial Officer, effective 1 December 2021 after serving as Acting Group Chief Financial Officer since 1 October 2021. Andy Chew first began his journey here in Sapura Energy as VP, Group Controller on 19 April 2021.
Andy is a senior finance professional with 30 years of broad experience in the energy sector working for Royal Dutch Shell (“RDS”) Group. He started his career in 1991 with Shell companies in Malaysia and held the Finance Director position before moving to the RDS head-office in 2013 based in The Hague for 7 years as the Head of Reporting. Prior to moving to The Hague, he held both country and regional roles responsible for Malaysia, Singapore, Brunei, Philippines, Thailand, China, India, New Zealand, and Australia.
Academic/Professional Qualifications:
• Bachelor’s Degree (Hons.) in Accounting, University of Malaya (1991)
• Chartered Accountant, Malaysian Institute of Accountants (1996)
• Harvard Business School Senior Management Development Programme (2000)
• INSEAD Group Business Leadership Programme (2002)
• Mandatory Accreditation Programme for Directors of Public Listed Companies (2013)
ANDY CHEW SENG HENGGroup Chief Financial Officer
56 / Male / Malaysian
02
Sap
ura
En
erg
y B
erh
ad
An
nu
al R
ep
ort
20
22
57
Corporate Governance
EXECUTIVE COMMITTEE PROFILES

Date of Appointment:
1 May 2013
Directorship in Other Public Companies and Listed Issuers:
• Nil
Working Experience:
Raphael Siri is currently the Chief Executive Officer, Drilling and SVP of Group QHSE. He was appointed as the SVP of Sapura Drilling on 1 May 2013 following the acquisition of Seadrill Limited’s Tender Rig business by Sapura Energy.
Raphael Siri joined Seadrill Limited in 2011 after 16 years of operational and management experience in Drilling from major oil and gas services companies like Schlumberger (Sedco Forex) and Pride International. His extensive experience covers different locations in Africa (including Algeria, Angola, Cameroon, Congo, Nigeria, South Africa), the USA (Houston, Texas) as well as Asia (Singapore, Kuala Lumpur).
He previously held the position of Director of Operations Preparations in 2011 before assuming the role of SVP, Asia Pacific of Seadrill Limited in 2013.
Academic/Professional Qualifications:
• Engineering Diploma in Applied Mathematics, Ecole Nationale Supérieure de Techniques Avancées, Paris, France
• Master in Applied Mathematic, Université de Nice Sophia Antipolis, Nice, France
RAPHAEL SIRIChief Executive Officer, Drilling Business Senior Vice President, Group QHSE
52 / Male / French
04
Date of Appointment:
1 April 2021
Directorship in Other Public Companies and Listed Issuers:
• Nil
Working Experience:
Nasri Mehat is currently the Chief Executive Officer, Operations & Maintenance of Sapura Energy Berhad.
In 2010, Nasri joined Kencana Pinewell Sdn Bhd (now known as Sapura Pinewell Sdn Bhd) as General Manager, Topside Major Maintenance and was promoted to Senior General Manager in 2014. Prior to his current position, he was the Head of Hook-up & Commissioning Division at Sapura Energy since 2018.
Before joining Sapura Energy, Nasri was the General Manager of Operations for Nam Fatt Corporation Bhd, overseeing the company’s operation in Sudan. He has 30 years of experience in construction industry, predominantly in the oil & gas sector and has worked in Malaysia, North Africa, and Europe. He has held leadership and managerial positions specialising in operations, project management, and cont rac t management in ma jo r construct ion companies cover ing infrastructure projects, power plant, pipelines, pumping and heating stations, onshore plant construction, fabrication works, offshore hook-up & commissioning, facilities upgrading and modification, brownfield rejuvenation and topside major maintenance works.
Academic/Professional Qualifications:
• BSc in Civil Engineering Technology, Southern Illinois University, United States of America
• Diploma in Contract Law, University of Wolverhampton, United Kingdom
MOHAMAD NASRI BIN MEHATChief Executive Officer,Operations & Maintenance
55 / Male / Malaysian
05
Date of Appointment:
1 January 2014
Directorship in Other Public Companies and Listed Issuers:
• Nil
Working Experience:
Ahmad Zakiruddin Mohamed is the Chief Execut ive Off icer , Engineer ing & Construction (“E&C”) in Sapura Energy. He joined Sapura Energy in 2012 as VP, Strategic Business Support, overseeing technical and operational strategic initiatives in the President and Group Chief Executive Officer’s office. He has since been appointed to several positions, including VP Fabrication, Senior Vice President (“SVP”) Fabrication and Hook-up & Commissioning, SVP E&C Malaysia, and SVP Operations, E&C and Group Supply Chain. In his role within Sapura Energy, he has led the delivery of large-scale projects in Asia Pacific, Middle East, and the Americas.
Zakiruddin started his career at Ranhill Bersekutu Sdn Bhd before moving to WS Atkins Consultants Limited, United Kingdom (UK) in 1999. He also worked in Detmarovice, Czech Republic under RMC Group PLC, UK before returning to Malaysia to rejoin the Ranhill group in 2002.
Zakiruddin has 27 years of experience working within a range of industries and sectors with exposure in Engineering, Procurement, Construction, Installation, and Commissioning.
Academic/Professional Qualifications:
• Chartered Engineer (Engineering Council), United Kingdom
• Member of the Institute of Mechanical Engineers (IMechE), United Kingdom
• Bachelor of Engineering (Honours) in Mechanical Engineering, University of Warwick, United Kingdom
AHMAD ZAKIRUDDIN MOHAMEDChief Executive Officer, Engineering & Construction
50 / Male / Malaysian
03
58
Corporate Governance
EXECUTIVE COMMITTEE PROFILES

Date of Appointment:
17 September 2019
Directorship in Other Public Companies and Listed Issuers:
• Nil
Working Experience:
Puspa Hanita Abd Aziz is currently the Chief People Officer, People & Culture of Sapura Energy Berhad. She joined Sapura in 2019 as the SVP, Group Human Resource.
Puspa started her career with PETRONAS in 1991. She progressed through various managerial and leadership roles in Human Resources (“HR”), Group Corporate St rategy , Bus iness Development , Leadership and Capability Development and finally was appointed as the HR Director for Prince Court Medical Centre, Kuala Lumpur. Subsequently in 2010, Puspa set up and led her own independent HR Consultancy firm designing solutions and delivering projects on HR Strategy, Leadership Assessment, Capabil ity Development, Performance, and Rewards Management. Within this context, she has worked with public listed companies, government agencies as well as local and international clients across various industries. Puspa is a Certified Coach and an experienced leadership assessor.
Academic/Professional Qualifications:
• Bachelor of Science in Economics from Salford University, United Kingdom
• Master of Business Administration from the Strathclyde Graduate Business School, University of Strathclyde, Scotland
• Certified Solution-Focused Coach, Canadian Council of Professional Certification (“CCPC Global”)
PUSPA HANITA ABD AZIZChief People Officer,People & Culture
54 / Female / Malaysia
07
Date of Appointment:
16 July 2019
Directorship in Other Public Companies and Listed Issuers:
• Nil
Working Experience:
Muhammad Zamri Jusoh is currently the Chief Executive Officer at SapuraOMVUpstream. He assumed this position in July 2019 and provides overall leadership and direction in the development and implementation of the Company’s strategic plans and policies. He is also responsible for directing and controlling different aspects of business operations and their global portfolios. He is accountable to the Board for the achievement of SapuraOMV Upstream’s goals and objectives.
Zamri is also a member of SapuraOMV Upstream’s Executive Management Committee and sits on the Board of various SapuraOMV Upstream subsidiaries. Prior to joining SapuraOMV Upstream, Zamri was the Vice President of Malaysia Petroleum Management, PETRONAS with oversight of the overall policy and management of the domestic petroleum resources and development of the local oil & gas industry to ensure energy security for the country.
Zamri currently sits on SPE Asia Pacific Regional Advisory Council, OTC Asia 2022 Advisory Committee and IPTC 2021 Executive Committee.
Academic/Professional Qualifications:
• Bachelor of Science, Mechanical Engineering from Polytechnic University, New York
MUHAMMAD ZAMRI JUSOHChief Executive Officer,SapuraOMV Upstream
55 / Male / Malaysian
06
Sap
ura
En
erg
y B
erh
ad
An
nu
al R
ep
ort
20
22
59
Corporate Governance

Date of Appointment:
1 February 2022
Directorship in Other Public Companies and Listed Issuers:
• Nil
Working Experience:
Melissa subsumed the role of Chief Strategy Officer in Sapura Energy in 2022 having joined the Group in 2015. She now leads the Reset initiatives for the Group, driving the restructuring initiatives to achieve a sustainable business model moving forward. She and her team acts as the secretariat for the Board Reset Task Force (“BRTF”).
In 2019, she was the General Manager for People Strategy and Development of Group Human Resources Department (later renamed the People & Culture Office). The role enabled transformation initiatives to take place for management of people within the Group by enhancing controls, focusing on talent development, and improving efficiencies through automation. Prior to this role, she worked in the PGCEO Office to provide support to the leadership team on various strategic initiatives for the Group which includes new market expansion and large-scale reorganisation.
Before joining Sapura Energy, Melissa began her career at Credit Suisse in London, as a derivatives trader. Subsequently, she joined Boston Consulting Group (BCG) in Kuala Lumpur as a Consultant with experience across heavy industries, retail banking, and the public sector in the region.
Academic/Professional Qualifications:
• BA (Hons)/MEng, Engineering (2005), Cambridge University, United Kingdom
MELISSA LOKMANChief Strategy Officer,Group Strategy
40 / Female / Malaysia
10
Date of Appointment:
6 December 2021
Directorship in Other Public Companies and Listed Issuers:
• Nil
Working Experience:
Dominique de Soras is the Deputy CEO, Engineering & Construction in Sapura Energy. He joined Sapura Energy in 1 July 2021 as VP, Engineering & Construction.
He has more than 30 years of vast leadership and working experience covering areas of transformation, petroleum engineering, operations management, business development and acquisitions, and major projects delivery. He was formerly the Managing Director and Chief Executive Officer of Malaysia Marine and Heavy Engineering Holdings Berhad (MMHE) and SVP – Subsea Division of Technip SA. He was also the Executive Vice President for Oil and Gas Division and VP for Asset Management prior becoming the SVP for Technip’s Subsea Division. Prior to Technip, he was with Coflexip based in France, Norway, Scotland, UK and Netherlands for different positions and projects.
Whi le in MMHE, Dominique had successfully delivered major projects to PETRONAS, Shell, and other international oil companies. He was also in charge of driving transformational changes that helped MMHE to remain competitive and robust in its business performance.
Academic/Professional Qualifications:
• Master’s of Science in Mechanical, Ecole catholique d’Arts et Métiers de Lyon
DOMINIQUE DE SORASDeputy Chief Executive Officer,Engineering & Construction
66 / Male / French
09
Date of Appointment:
1 April 2021
Directorship in Other Public Companies and Listed Issuers:
• Nil
Working Experience:Nik Azli was first appointed as the Group Legal Head of Sapura Energy in 2012. In October 2015, he left Sapura Energy and joined Malaysia Airlines Berhad as the Chief Corporate Services Officer until October 2019, where he rejoined Sapura Energy as VP, Group Legal, Contracts & Corporate Secretarial. Nik Azli was the Head of Legal of SapuraCrest Petroleum prior to the merger with Kencana Petroleum Group.
Nik Azli was in private practice in two leading law firms, Zaid Ibrahim & Co (“ZICo”) and Zul Rafique & Partners between 1999 to 2010. Apart from experience in mergers & acquisitions and financing transactions, he has had vast experience in project finance transactions both in Malaysia, Asia, and the Middle East.
Academic/Professional Qualifications:• Member of the Malaysian Bar from 1997
to 2010• Certificate in Legal Practice, University
Malaya, 1996• Bachelor of Law (LLB) (Honours),
University of Newcastle Upon Tyne, United Kingdom
NIK AZLI ABU ZAHARGroup General Counsel,Group Legal & Compliance
52 / Male / Malaysian
08
60
Corporate Governance
EXECUTIVE COMMITTEE PROFILES

BOARD STATEMENT
Sapura Energy Berhad (“Sapura Energy”) and its subsidiaries (the “Group”) are exposed to a variety of risks that can have an impact on its businesses, prospects, future performance, financial position, liquidity, asset values, growth potential, sustainable development, and reputation.
Risk management is one of the core responsibilities of the Sapura Energy Board (the “Board”) and is central to its decision-making process. The Board acknowledges its responsibilities in establishing a sound risk management framework and internal control system as well as reviewing its adequacy and effectiveness within the Group.
An effective risk management and internal control system are essential to the operations, governance, and processes of the Group. This helps the Group anticipate risk exposures and introduce controls to mitigate threats and maximise opportunities. This is achieved by ensuring that the risk management framework and related internal control systems are in place to address and manage the Group’s key risks so that appropriate risk appetites are established with acceptable risk thresholds in order to deliver on the Group’s business objectives.
The key responsibility of the BRMC is to ensure the Management is managing the Group’s key risks with integrity and transparency with the objective of safeguarding the interest of shareholders and other stakeholders.
The BRMC reviews risk management initiatives, actions, and measures implemented by the Management to ensure that the Group’s risks are identified and assessed, and control measures are put in place and functioning as intended in addressing these risks.
Board Risk Management Committee:
BOARD RESPONSIBILITY
The Board acknowledges its responsibilities in establishing a sound risk management framework and internal control system as well as reviewing its adequacy and effectiveness within the Group. The Board is assisted by the Board Risk Management Committee (“BRMC”) and the Board Audit Committee (“BAC”), which have been delegated with oversight responsibilities over the Group’s risk management and internal control system. The Board remains responsible for the governance of risk management and internal control, and all the actions of the Board Committees with regards to the execution of the delegated oversight responsibilities. The risk management and internal control system is designed to manage risk exposures within the appropriate risk appetites to achieve the Group’s business objectives.
The risk governance structure facilitates the flow of information and effective oversight on the implementation of risk management practices in the Group.
The disclosures in this statement, however, do not cover joint venture and associate companies which the Group does not have any direct operational control. Nevertheless, the Group’s board representation in these joint ventures and the associate companies provide the appropriate governance and influence necessary for the safeguarding of the Group’s interest in those companies.
Business Unit
Executive Committee
BRMCBAC
Periodic Update and ReviewMonthly Update and Review
BoardReporting Flow
Governance Flow
Sap
ura
En
erg
y B
erh
ad
An
nu
al R
ep
ort
20
22
61
Corporate Governance
STATEMENT ON RISK MANAGEMENT AND INTERNAL CONTROL

The key responsibilities of the BAC is to ensure the effectiveness of internal controls and governance over financial reporting and risk management to ensure published financial statements and related disclosures are free from material errors or misstatements.
The BAC achieves this objective by:
1. Assessing the internal control environment
• determine whether the Management has implemented policies ensuring that controls in place are adequate and functioning as intended;
• determine the adequacy and effectiveness of risk management framework and its implementation; and
• review the adequacy and integrity of the Group’s internal control and management information systems.
2. Overseeing financial reporting by reviewing the quarterly results and year-end financial statements.
3. Discussing significant audit matters with external auditor.
4. Assessing the suitability, objectivity, and independence of the external auditor.
5. Ensuring the internal audit function is effective and able to function independently.
6. Reviewing conflict of interest situations and related party transactions.
Board Audit Committee (“BAC”):
MANAGEMENT RESPONSIBILITY
All members of the Sapura Energy Executive Committee (“ExCo”), inclusive of the Group Chief Executive Officer and Group Chief Financial Officer, are accountable for providing assurance to the respective Board Committees, and ultimately the Board, that risk management policies and internal control systems are implemented effectively and monitored adequately.
RISK MANAGEMENT
In pursuing its business objectives, the Group is exposed to a variety of risks at different degrees. The Board and the Management continually identify and assess these risks within the defined risk appetites. Key Risk Indicators (“KRI”) are established to monitor these risks and interventions through mitigating measures that are taken to ensure the Group is operating within the boundaries of risk thresholds.
Risk management occurs at all levels within the organisation. Every employee and contractor staff is responsible for effective identification, evaluation, control, and reporting of the risks in their area of activity and managing them in accordance with approved risk guidelines and tolerance levels. The evaluations of those risks are incorporated into the decision-making process.
The Group is committed to maintain and continuously improve enterprise-wide risk management systems and processes to ensure its strategic goals and corporate governance responsibilities are met.
Commentary Section on the adequacy and effectiveness of the risk management and internal control system
This year has been challenging for the Group as several of our principal risks have materialised and overwhelmed our risk management processes. The collective impact of these developments was reflected in the business performance and financial position of the Group.
The COVID-19 pandemic has significantly impacted our operations, particularly offshore construction activities, where stringent and unpredictable quarantine measures and movement controls implemented by the authorities across multiple jurisdictions have severely disrupted our operations. This has resulted in crippling financial impacts for the Group as most of the additional costs incurred, either directly or indirectly, were not compensated under the legacy contracts with our clients.
Further, as a result of a very competitive landscape in the offshore construction service sector, largely due to prolonged low oil prices since 2014, like many of its peers, the Group has secured jobs that had higher risk profiles and compressed margins. This proved to be unsustainable and resulted in significant financial losses.
Amidst the challenging operating conditions, in the second half of the financial year, the Group lost access to most of its working capital facilities as it failed to meet its loan covenants under the multi-currencies facilities (“MCF”) and Sukuk programme.
62
Corporate Governance
STATEMENT ON RISK MANAGEMENT AND INTERNAL CONTROL

The foregoing events have led to an unprecedented severe liquidity constraint, which has impacted the Group’s ability to make prompt payments to its vendors and sub-contractors, which in turn has disrupted our operations as some of these impacted vendors and sub-contractors were unable to continue supplying us due to the delayed payments.
The Group as a going concern is under threat from the circumstances mentioned above. In responding to these threats, the Board and the Management have undertaken and continue to undertake the necessary steps to regularise the operation and the financial conditions of the Group. These steps include:
1. Established a Board Restructuring Task Force to steer and provide oversight on the regularisation plan;
2. Appointed financial and legal advisors to assist in our debt restructuring exercise;
3. Applied and obtained for Sapura Energy and 22 of its wholly owned subsidiaries Orders under Sections 366 and 368 of the Companies Act 2016 from the High Court of Malaya. The Orders under Section 366 of the Act enable each Applicant to summon meetings with its creditors, to consider and approve a proposed scheme of arrangement and compromise as part of the debt restructuring plan. The applicants were also granted a Restraining Order pursuant to Section 368 of the Act to restrain and stay legal proceedings against them; and
4. Restructuring the Group’s business through a Reset Plan to divest non-core business and assets, improve bidding and project delivery capabilities, and implementing a robust financial framework to ensure financial discipline.
The Board and the Management are committed to achieving the goal to return the Group to a sound financial position.
The Board has also taken several significant steps in strengthening our Enterprise Risk Management foundation and its implementation:
• Several composition changes have been made to the Board Risk Management Committee;
• Strengthening the Enterprise Risk Management framework by incorporating learnings from this year’s financial performance;
• Strengthening the Chief Risk Officer role to jointly work with the Executive Management team in identifying, evaluating, and managing the principal risks; and
• Strengthening business accountabilities to ensure appropriate risk appetites/tolerances are proactively monitored and managed.
GROUP INTERNAL AUDIT
Reporting functionally to the BAC, the main objective of the Group Internal Audit (“GIA”) is to provide an independent assurance over the internal control framework of the Group to ensure it is functioning as intended. GIA discharged its responsibilities with a risk-based and disciplined approach to review and evaluate the effectiveness of governance, risk management, and internal control processes.
During the financial year, audits were performed on the Group, projects, and corporate support functions. The scope, timing, and frequency of such audits were based on the Annual Internal Audit Plan approved by the BAC.
On periodic basis, internal audit reports and Management’s agreed action plans were tabled at the BAC for review. Audit findings and action plans were deliberated to ensure appropriate improvement to the internal control framework was implemented by the Management accordingly.
All the GIA processes and activities were guided by the approved Internal Audit Charter and Internal Audit Manual which are aligned with the International Professional Practice Framework issued by the Institute of Internal Auditors.
Further activities of the GIA are outlined in the Report of the BAC on page 68 of this Annual Report.
REVIEW OF STATEMENT BY EXTERNAL AUDITORS
As required by Paragraph 15.23 of the Main Market Listing Requirements of Bursa Malaysia Securities Berhad, the external auditors have reviewed this Statement on Risk Management and Internal Control (“Statement”) and reported to the Board that nothing has come to their attention that causes them to believe that the Statement is not prepared, in all material aspects, in accordance with the disclosures required by Paragraphs 41 and 42 of the Statement on Risk Management and Internal Control: Guidelines for Directors of Listed Issuer, nor is the Statement factually inaccurate.
The Statement is made in accordance with a resolution passed by the Board on 30 May 2022.
Sap
ura
En
erg
y B
erh
ad
An
nu
al R
ep
ort
20
22
63
Corporate Governance

REPORT OF BOARD AUDIT COMMITTEE (“BAC”)
The board of directors of Sapura Energy Berhad (“Sapura Energy”) is pleased to present the report of the Board Audit Committee (“BAC”) (“Report”) including a summary of the activities of the BAC and the internal audit function for the financial year ended 31 January 2022 (“FY2022”).
COMPOSITION
As at 31 January 2022, the BAC comprised of four (4) members, of which one (1) is Non-Independent Non-Executive Director and the other three (3) are Independent Non-Executive Directors. The members of the BAC during FY2022 are as follows:
Members Designation
Lim Tiang Siew (Chairman)(Redesignated with effect from 1 October 2021)
Independent Non-Executive Director
Datuk Muhamad Noor Hamid(Redesignated with effect from 1 October 2021)
Independent Non-Executive Director
Dato’ Mohammad Azlan Abdullah(Resigned with effect from 1 October 2021)
Non-Independent Non-Executive Director
Dato’ Azmi Mohd Ali Independent Non-Executive Director
Bernard Rene Francois Di Tullio(Appointed with effect from 1 October 2021)
Non-Independent Non-Executive Director
The composition of the BAC fulfilled the requirements of Paragraphs 15.09(1)(a) and 15.09(1)(b) of the Main Market Listing Requirements of Bursa Malaysia Securities Berhad (“Bursa Securities”) (“MMLR”).
The BAC Chairman, Lim Tiang Siew, is a member of the Malaysian Institute of Accountants and an Independent Non-Executive Director. Accordingly, Paragraphs 15.09(c)(i) and 15.10 of the MMLR have been complied with.
TERMS OF REFERENCE OF THE BOARD AUDIT COMMITTEE
In performing its duties and discharging its responsibilities, the BAC is guided by a Terms of Reference (“TOR”). The BAC TOR is available on the website of Sapura Energy at www.sapuraenergy.com.
On 18 April 2022, the Board, through the Board Nomination and Remuneration Committee, reviewed the performance of the BAC and its members for FY2022. The Board is satisfied that the BAC and its members discharged their functions, duties, and responsibilities in accordance with the BAC’s TOR, and that Sapura Energy complies with the requirements of Paragraph 15.20 of the MMLR.
64
Corporate Governance
REPORT OF BOARD AUDIT COMMITTEE

MEETINGS
A total of eleven (11) meetings were held during FY2022. The details of attendance of each member are as follows:
Members Attendance Percentage
Lim Tiang Siew (Chairman)(Redesignated with effect from 1 October 2021)
11/11 100%
Datuk Muhamad Noor Hamid(Redesignated with effect from 1 October 2021)
11/11 100%
Dato’ Mohammad Azlan Abdullah(Resigned with effect from 1 October 2021)
8/8 100%
Dato’ Azmi Mohd Ali 11/11 100%
Bernard Rene Francois Di Tullio(Appointed with effect from 1 October 2021)
3/3 100%
The Group Chief Executive Officer and the Group Chief Financial Officer are invited to all BAC meetings to facilitate direct communication, and to deliberate the financial results and audit reports submitted by Group Internal Audit (“GIA”) of Sapura Energy and its subsidiaries (“Group”). The Group Chief Internal Auditor is invited for deliberation of internal control and governance matters arising from internal audit reports while the attendance of other Management staff are by invitation depending on the matters deliberated by the BAC. This provides a platform for direct interaction between members of the BAC and Management. Discussions at the BAC have generally been robust and detailed, with the members of the BAC focused on improving internal controls, risk management, and governance.
The external auditors were engaged to conduct a limited review of quarterly financial results of the Group before these were presented to the BAC for review and recommendation for the Board’s approval and adoption.
The Chairman of the BAC presented reports to the Board highlighting key issues discussed in BAC meetings.
The Secretary of the BAC meetings records the deliberations by the members at the meetings with regard to issues discussed and the outcome of these discussions. The minutes of each BAC meeting are tabled for confirmation at the subsequent BAC meeting and thereafter be presented to the Board for notation.
ATTENDANCE OF PROFESSIONAL DEVELOPMENT COURSES
All BAC members are aware of the need to continuously develop and increase their knowledge in the areas of accounting and auditing standards, practices, and rules, given the changes and developments in these areas from time to time. In line with this and Practice 9.5 under Principle B of Malaysian Code on Corporate Governance (“MCCG 2021”), the BAC members have made continuous efforts in keeping themselves abreast of relevant developments by attending courses and other programmes related to financial reporting standards, practices, and rules during the financial year.
The trainings attended by members of the BAC during the financial year are disclosed in the Corporate Governance Overview Statement included in this Annual Report.
Sap
ura
En
erg
y B
erh
ad
An
nu
al R
ep
ort
20
22
65
Corporate Governance

SUMMARY OF ACTIVITIES OF THE BAC
Over the course of FY2022, the BAC undertook the following activities:
Financial Reporting
Reviewed and discussed the unaudited quarterly consolidated financial results and the annual audited consolidated financial statements, as well as the performance of the Group before recommending the same for approval by the Board. In reviewing the financial reporting of the Group, the BAC discussed and made enquiries on, amongst others:
(i) Changes in or implementation of significant accounting policies;
(ii) Compliance with accounting standards and other regulatory and legal requirements; and
(iii) Significant matters highlighted including financial reporting issues, significant judgement made by Management, significant and unusual events or transactions, and how these matters be addressed. Some of the key items discussed are as follows:
Significant matters highlighted Resolution
i. Going concern
The Group is managing an unprecedented severe liquidity constraint mainly due to poor financial and business performance, lack of access to working capital facilities, and carrying an unsustainable level of debts. These are threatening the Group as a going concern.
Please refer to page 101 to 102 of the Annual Report
for details.
The BAC recognises that the situation is still in a flux with a number of significant factors, and events that could impact the Group’s going concern being still in progress. In view of this, the BAC recommends the Group Consolidated Financial Statements are to be prepared on a going concern basis, taking into consideration the following factors:
1. A Board Restructuring Taskforce has been established to steer and provide oversight on the proposed regularisation plan;
2. Financial and legal advisors have been appointed to assist in debt restructuring exercise;
3. Applied for and obtained by Sapura Energy and 22 of its wholly owned subsidiaries (“Applicants”) Orders under Sections 366 and 368 of the Companies Act 2016 from the High Court of Malaya. The Order under Section 366 of the Act enable each Applicant to summon meetings with its creditors, to consider and approve a proposed scheme of arrangement and compromise as part of the debt restructuring plan. The Applicants were also granted a Restraining Order pursuant to Section 368 of the Act to restrain and stay legal proceedings against them; and
4. Restructuring Sapura Energy’s business through a Reset Plan to divest non-core business and assets, improve bidding and project delivery capabilities, and implementing a robust financial framework to ensure financial discipline.
The BAC has taken note of the audit opinion expressed by the Group’s external auditors, Messrs. Ernst & Young, and recognises that the Group has now triggered a Practice Note 17 criteria under 8.04 (2) of the MMLR.
ii. Revenue recognition
The treatment for contract claims against clients under the contract with customer policy was not clearly defined, leading to inconsistent and overly aggressive recognition of revenue.
The BAC deliberated and approved the proposed changes from the Management to enhance the revenue recognition policy.
iii. Provision for onerous contracts
Costs to complete a number of contracts with customers were escalating due to a variety of reasons, including impacts from the COVID-19 pandemic, higher project execution cost, liquidated damages, and a contract termination.
The BAC reviewed and deliberated the Management’s judgements and accounting estimates related to a number of contracts with customers, leading to recognition of foreseeable losses and onerous contract provisions under these contracts. This also included the termination of the Yunlin offshore windfarm project.
66
Corporate Governance
REPORT OF BOARD AUDIT COMMITTEE

Significant matters highlighted Resolution
iv. Impairments
Owing to deteriorating business conditions and outlook, the recoverable amounts of the assets, including intangible assets, could no longer sustain the carrying amounts of these assets.
The BAC reviewed and deliberated the business outlook and future cash flows of the business segments according to the approved business plan, critically assessing the key assumptions including discount rates applied, and seeking the external auditors views and input. The BAC concurred with the management’s impairment assessment, leading to a recognition of RM5,606 million of impairment charges for the financial year.
v. Project Bidding and Execution
Weaknesses in bidding or execution have resulted in unbudgeted costs resulting in either lower profits or losses due to inability to recover such cost.
The BAC deliberated the control weaknesses around bidding and project execution processes and recommended Management to review and improve these processes.
Internal Audit
• Reviewed and approved revision on Group Internal Audit Charter (“Internal Audit Charter”);
• Reviewed and approved the Group Internal Audit Plan (“Audit Plan”) presented by the Group Chief Internal Auditor to ensure adequate scope and coverage, in particular, on the appropriateness of the risk assessment for purpose of determining areas to be audited;
• Deliberated audit findings including Management’s response and remedial actions, root cause and extent of the non-compliances, mitigation action plans, and deadlines for closures presented in the internal audit reports;
• Reviewed the implementation status of agreed action plans to ensure all key risks and controls have been adequately addressed; and
• Assessed the resource requirements of internal audit and evaluate the adequacy and effectiveness of the internal audit function.
External Audit
• Discussed with the external auditors before the audit commences, the Audit Plan, nature, and scope of the audit;
• Held three (3) private discussions with the external auditors on 26 April 2021, 27 May 2021, and 27 September 2021 without the presence of Management (including the Group Company Secretary) to discuss any areas of concern;
• Discussed the external auditor’s reviews of the quarterly financial results and the financial statements of the Group;
• Discussed and deliberated on significant audit and accounting matters identified during interim review of interim financial statements and annual statutory audit of the Group;
• Reviewed the independence, suitability, objectivity, and effectiveness of the external auditors, and services provided. In this respect, the BAC has received written assurance from the external auditors that in accordance with the requirements of all professional and regulatory requirements, they remained
independent throughout the conduct of the audit engagement for FY2022;
• Reviewed and approved the External Auditors Independent Policy to set out guidelines for engaging external auditors in non-audit services within the Group to ensure independence of the external auditors; and
• Considered and recommended to the Board for re-appointment of the external auditors and the fees payable to them in respect of the Board’s submission to the shareholders for approval at the Company’s Annual General Meeting.
Related Party Transactions
Reviewed and deliberated on related party transactions to be entered into by the Group and subsequently made its recommendations for the Board’s consideration.
In forming its recommendation, the BAC takes into consideration whether the proposed related party transactions are:
(i) in the best interests of the Group;
(ii) fair, reasonable, and on normal commercial terms; and
(iii) not detrimental to the interests of our minority shareholders.
Capital Management
The Group’s objectives in managing capital is to safeguard the Group’s ability to continue as a going concern. The Group aims to achieve a sustainable capital structure by strengthening the balance sheet through restructuring of debts and maintaining an acceptable range of gearing levels.
During FY2022, the BAC reviewed the Group’s capital structure and discussed options available to achieve a sustainable debt level. This includes reviewing proposed debt restructuring plans and schemes of arrangements with its creditors. This matter is still work-in-progress and being discussed and negotiated with the Group’s lenders and other relevant stakeholders as part of the Group’s Reset Plan.
Sap
ura
En
erg
y B
erh
ad
An
nu
al R
ep
ort
20
22
67
Corporate Governance

Annual Report
Reviewed the Report of the BAC, Statement on Risk Management and Internal Control, Additional Compliance Information, Corporate Governance disclosures, and the Audited Financial Statements of the Group for inclusion in the Annual Report prior to recommending the same for consideration and approval of the Board.
Other matters
• Reviewed and deliberated the proposed revision to the Limits of Authority (“LOA”);
• Reviewed and revised the TOR of BAC;
• Conflict of interest review; and
• Reviewed adoption of the TOR for the Complaints Investigation Committee.
INTERNAL AUDIT FUNCTION
Internal auditing is an independent and objective assurance activity designed to provide independent assurance over the internal control framework of the Group to ensure it is functioning as intended. GIA discharged its responsibilities with a risk-based and disciplined approach to review and evaluate the effectiveness of governance, management, and internal control processes.
The purpose, authority and responsibility of Group Internal Audit (“GIA”) are formally defined in the Internal Audit Charter, as approved by the BAC, which establishes the framework for the effective and efficient functioning of GIA. The standards and practices adopted by GIA are aligned to the International Professional Practices Framework issued by the Institute of Internal Auditors.
The internal audit function of the Group was carried out in-house and is headed by Mohd Khairel Nizam Alias, a Certified Internal Auditor and Chartered Member of The Institute of Internal Auditors Malaysia. As at 31 January 2022, GIA has a headcount of eighteen (18) full time internal auditors (FY2021:15) with relevant experience and qualifications i.e. certified internal auditors, certified information systems auditor, certified fraud examiner, professional accountants, engineers, quantity surveyors, and postgraduate.
Further information on the resources, objectivity, and independence of the internal auditors are provided in the Corporate Governance Report in accordance with Practice 11.2 of the MCCG 2021.
During FY2022, the following activities were carried out:
(i) Reviewed and presented revision on Internal Audit Charter for the review and approval by the BAC;
(ii) Reviewed and revised Group Internal Audit Manual;
(iii) Prepared and presented the Audit Plan which included budget and human capital planning for the review and approval by the BAC;
(iv) GIA adopted a risk-based approach by identifying and assessing significant risk areas in the Group to prepare the Audit Plan for the Group, taking into account the adequacy or need for additional resources;
(v) Based on the Audit Plan which had been approved by the BAC:
• Performed compliance review on policies and procedures, LOA, and other statutory and regulatory requirements within the Group; and
• Reviewed the adequacy and effectiveness of policies and procedures, internal controls, risk management, and governance activities, and provide suitable recommendations to Management for implementation within the Group.
• Obtained BAC’s approval for deviations from the Audit Plan after satisfying the BAC as to the reasons for the deviations.
(vi) Prepared audit reports and sought Management’s responses including action plan(s) with specific timeline in regard to rectification of deficiencies identified in the existing internal control systems and thereafter, incorporated the pertinent information into the final reports which were then circulated to the BAC;
(vii) Presented audit reports during the BAC meetings for deliberation;
(viii) Followed-up on the implementation status of Management’s agreed action plans and thereafter report the status to the BAC; and
(ix) Performed special reviews.
During FY2022, GIA conducted audit reviews on the following areas:
(i) Project management over selected high risk projects;
(ii) Regional office operations and support functions;
(iii) Crewing management;
(iv) Cyber security management;
(v) Related party transactions and recurrent related party transactions;
(vi) Bidding, proposal, and estimation for projects; and
(vii) Follow-up on implementation status of agreed Management action plans.
For FY2022, GIA utilised 2,677 man-days (FY2021: 2,620), which was 102% of total man-days available (FY2021: 103%). The total direct cost incurred by GIA in discharging its function and responsibilities during FY2022 was approximately RM2.47 million (FY2021: RM2.44 million).
68
Corporate Governance
REPORT OF BOARD AUDIT COMMITTEE

1. AUDIT AND NON-AUDIT FEES
The amount of audit and non-audit fees paid or payable to the external auditors, Ernst & Young PLT and its affiliated companies for the services rendered to Sapura Energy Berhad (“Sapura Energy” or the “Company”) and the Group for the financial year ended 31 January 2022 (“FY2022”) are as follows:
CompanyRM’000
GroupRM’000
Audit fees 185 3,750
Non-Audit Fees– Review of interim financial statements, review of Production Sharing Contracts,
tax related, and Statement on Risk Management and Internal Control786 1,449
Total 971 5,199
2. LIST OF PROPERTIES
The Company does not own any material properties during FY2022 as defined in the MMLR.
3. MATERIAL CONTRACTS
There were no material contracts entered into by the Company and/or its subsidiaries involving the interest of the Directors of the Company and/or its major shareholders during FY2022.
4. UTILISATION OF PROCEEDS
There was no corporate proposal entered during the financial year ended 31 January 2022.
5. EXECUTIVE SHARE OPTION SCHEME (“ESOS”)
(a) Brief details on the total number of options granted, exercised and outstanding since the establishment of the ESOS on 13 December 2018 and up to the financial year ended 31 January 2022 are set out below:
Number of options
DescriptionGrand Total Former Executive Director/
PGCEO
Granted as at 31 January 2021 1,193,637,294 798,954,012
Lapsed as at 31 January 2022 (169,378,251) –
Exercised – –
Outstanding 1,024,259,043 798,954,012
(b) Pursuant to the Company’s ESOS By-Laws, the maximum allowable allocation to the Executive Director and Senior Management is up to 10 percent of the total number of issued ordinary shares of the Company. No share options were granted to Executive Director and Senior Management during FY2022. The actual share options granted to Executive Director and Senior Management since the commencement of the ESOS up to 31 January 2022 is 64 percent of the maximum allowable allocation after deducting the share option lapsed during FY2022.
(c) The lapsed of share option during FY2022 reflect the lapses of share options granted to three Senior Management who have ceased employment in FY2021, where a 12-month extension to exercise the option was granted upon last date of employment. As at 31 January 2022, no options were exercised within the extension period.
(d) As at 31 January 2022, there was no ESOS granted to Non-Executive Directors as they are not entitled to any options pursuant to the ESOS By-Laws.
(e) Tan Sri Dato’ Seri Shahril Shamsuddin, the former Executive Director retired as President and Group Chief Executive Officer (“PGCEO”) on 22 March 2021. Thereafter, he was a Non-Executive Director from 23 March 2021 until 30 April 2021. Upon fulfilment of the requirements under the ESOS By-Laws, he continues to be entitled to exercise the ESOS granted to him whilst he was the PGCEO/Executive Director until the expiry of the ESOS period.
Sap
ura
En
erg
y B
erh
ad
An
nu
al R
ep
ort
20
22
69
Corporate Governance
ADDITIONAL COMPLIANCE INFORMATIONPursuant to Paragraph 9.25 of the main market listing requirements of Bursa Malaysia Securities Berhad (“MMLR”)

The Companies Act 2016 (“Act”) requires the Board of Directors (“Board”) to prepare financial statements for each financial year in accordance with the Malaysian Financial Reporting Standards issued by the Malaysian Accounting Standards Board, and the provisions of the Act and the Main Market Listing Requirements of Bursa Malaysia, and to lay these before the Company at its Annual General Meeting.
The Board is responsible for ensuring that the audited financial statements provide a true and fair view of the financial position of the Group and the Company as at 31 January 2022 and of their financial performance and cash flows for the financial year ended 31 January 2022.
In preparing the audited financial statements for FY2022 set out on pages 80 to 207 of this Annual Report, the Board has ensured that, the appropriate accounting policies were adopted and consistently applied, reasonable and prudent judgment and estimates were exercised and the going concern used is appropriate as disclosed in Note 2.1 in the audited financial statements.
The Board is responsible for ensuring that the Group and the Company maintain accounting records that disclose the financial position of the Group and the Company with reasonable accuracy which enable them to ensure that the financial statements are in compliance with the Act.
The Board also has the overall responsibility to take such steps that are reasonably available for them to safeguard the assets of the Group and the Company as well as to prevent and detect fraud in addition to other irregularities.
This Statement of Directors’ Responsibility is made in accordance with a resolution passed by the Board on 31 May 2022.
70
Corporate Governance
STATEMENT OFDIRECTORS RESPONSIBILITYfor the Audited Financial Statements

ORDINARY SHARES
Total Number of Issued Shares : 15,979,080,232 Ordinary Shares Class of Security : Ordinary Shares Voting Rights : One vote per Ordinary Share Number of Shareholders : 69,388
DISTRIBUTION BY SIZE OF SHAREHOLDINGS BASED ON RECORD OF DEPOSITORS
Size of ShareholdingsNo. of
Shareholders % of
Shareholders No. of
Shares % of
Shares
Less than 100 2,398 3.46 84,529 0.00
100 – 1,000 6,881 9.92 4,433,556 0.03
1,001 – 10,000 24,802 35.74 133,947,196 0.84
10,001 – 100,000 26,287 37.88 1,050,326,310 6.57
100,001 – to less than 5% of issued shares 9,017 13.00 8,588,188,427 53.75
5% and above of issued shares 3 0.00 6,202,100,214 38.81
Total 69,388 100.00 15,979,080,232 100.00
THIRTY (30) LARGEST SHAREHOLDERS BASED ON RECORD OF DEPOSITORS
No. Shareholders No. of
Shares % of
Shares
1. AMANAHRAYA TRUSTEES BERHADAMANAH SAHAM BUMIPUTERA
4,515,762,406 28.26
2. MAYBANK NOMINEES (TEMPATAN) SDN BHDPLEDGED SECURITIES ACCOUNT FOR SAPURA TECHNOLOGY SND BHD (420284)
848,679,021 5.31
3. SAPURA TECHNOLOGY SDN BHD 837,658,787 5.24
4. AMANAHRAYA TRUSTEES BERHADAMANAH SAHAM MALAYSIA
638,409,866 4.00
5. AMANAHRAYA TRUSTEES BERHADAMANAH SAHAM MALAYSIA 2 – WAWASAN
550,133333 3.44
6. AMANAHRAYA TRUSTEES BERHADAMANAH SAHAM MALAYSIA 3
348,675,200 2.18
7. CIMSEC NOMINEES (TEMPATAN) SDN BHDCIMB FOR JURUDATA SDN BHD (PB)
332,569,600 2.08
8. AMANAHRAYA TRUSTEES BERHADAMANAH SAHAM BUMIPUTERA 3 – DIDIK
219,270,940 1.37
9. MAYBANK NOMINEES (TEMPATAN) SDN BHDMAYBANK PRIVATE WEALTH MANAGEMENT FOR SHAHRIL BIN SHAMSUDDIN (12020671)(430412)
152,808,688 0.96
10. HSBC NOMINEES (ASING) SDN BHDJPMCB NA FOR VANGUARD TOTAL INTERNATIONAL STOCK INDEX FUND
112,369,968 0.70
11. HSBC NOMINEES (ASING) SDN BHDJPMCB NA FOR VANGUARD EMERGING MARKETS STOCK INDEX FUND
106,024,022 0.66
Corporate Governance
Sap
ura
En
erg
y B
erh
ad
An
nu
al R
ep
ort
20
22
71
ANALYSIS OF SHAREHOLDINGSas at 29 April 2022

No. Shareholders No. of
Shares % of
Shares
12. CARTABAN NOMINEES (ASING) SDN BHDSS LUXEMBOURG FUND B11K FOR BLACKROCK STRATEGY FUNDS-BLACKROCK EMERGING MARKETS EQUITY STRATEGIES FUND
91,507,500 0.57
13. CHAN KIN LOONG 85,061,900 0.53
14. CHOONG KEAN LEANG 60,900,000 0.38
15. LEE BENG SENG 57,600,000 0.36
16. AMANAHRAYA TRUSTEES BERHADAMANAH SAHAM BUMIPUTERA 2
54,000,000 0.34
17. SEE TO CHOONG 48,000,000 0.30
18. CIMSEC NOMINEES (TEMPATAN) SDN BHDCIMB FOR SAPURA CAPITAL SDN BHD (PB)
46,387,227 0.29
19. CIMSEC NOMINEES (TEMPATAN) SDN BHDCIMB FOR BOEY TZE NIN (PB)
45,989,400 0.27
20. QUECK HAN TIONG 624,000 0.03
21. HSBC NOMINEES (ASING) SDN BHDEXEMPT AN FOR THE HONGKONG AND SHANGHAI BANKING CORPORATION LIMITED (GLOBAL MARKETS)
42,945,700 0.27
22. DB MALAYSIA NOMINEE (ASING) SDN BHDTHE BANK OF NEW YORK MELLON FOR VANGUARD FTSE ALL-WORLD EX-US SMALL-CAP INDEX FUND
39,640,900 0.25
23. PUBLIC NOMINEES (TEMPATAN) SDN BHDPLEDGED SECURITIES ACCOUNT FLR LIEW JUN KUAN (E-PDG)
36,506,800 0.23
24. HSBC NOMINEES (ASING) SDN BHDJPMCB NA FOR VANGUARD FIDUCIARY TRUST COMPANY INSTITUTIONAL TOTAL INTERNATIONAL STOCK MARKET INDEX TRUST II
34,000,000 0.21
25. VM TEAM ENGINEERING SDN BHD 31,115,478 0.19
26. CITIGROUP NOMINEES (ASING) SDN BHDCNBY FOR EMERGING MARKET CORE EQUITY PORTFOLIO DFA INVESTMENT DIMENSIONS GROUP INC
346,100 0.01
27. LIM FONG PENG @ LIM FUNG FENG 30,300,000 0.19
28. SOUTHERN REALTY RESOURCE SDN BHD 30,000,000 0.19
29. CITIGROUP NOMINEES (ASING) SDN BHDCBNY FOR DFA EMERGING MARKETS SMALL CAP SERIES
27,301,300 0.17
30. LEMBAGA TABUNG ANGKATAN TENTERA 24,931,200 0.16
Total 9,532,955,736 59.64
72
Corporate Governance
ANALYSIS OF SHAREHOLDINGSas at 29 April 2022

SUBSTANTIAL SHAREHOLDERS BASED ON REGISTER OF SUBSTANTIAL SHAREHOLDERS
Direct Interest Indirect Interest
Substantial ShareholdersNo. of Share
Held % No. of Share
Held %
AmanahRaya Trustees Berhad– Amanah Saham Bumiputera 4,515,762,406 28.26 – –
Sapura Technology Sdn Bhd 1,686,337,808 10.55 332,569,600(1) 2.08
Sapura Holdings Sdn Bhd – – 2,067,297,390(2) 12.94
Tan Sri Dato’ Seri Shahril Shamsuddin 174,811,600 1.09 2,067,297,390(2) 12.94
Dato’ Shahriman Shamsuddin 506,385 0.00* 2,067,297,390(2) 12.94
Brothers Capital Sdn Bhd – – 2,067,297,390(2) 12.94
* Negligible
Notes:(1) Deemed interested by virtue of its shareholding in Jurudata Sdn Bhd pursuant to Section 8 of the Companies Act 2016 (“the Act”).(2) Deemed interested by virtue of being a substantial shareholder of Sapura Technology Sdn Bhd, Sapura Resources Berhad, Sapura Capital Sdn Bhd, Indera
Permai Sdn Bhd and Jurudata Sdn Bhd pursuant to Section 8 of the Act.
DIRECTORS’ SHAREHOLDINGS BASED ON REGISTER OF DIRECTORS’ SHAREHOLDNGS, AND OPTIONS HELD UNDER THE COMPANY’S EXECUTIVE SHARE OPTION SCHEME
Direct Interest Indirect Interest
DirectorsNo. of Share
Held % No. of Share
Held % No. of
Options Held
Tan Sri Dato’ Seri Shamsul Azhar bin Abbas 2,455,000 0.02 6,774,100(1) 0.14 –
Datuk Mohd Anuar Taib 1,200,000 0.01 – – –
Tan Sri Dato’ Megat Zaharuddin Megat Mohd Nor 509,786 0.00* 12,570(1) 0.00* –
Dato’ Mohammad Azlan Abdullah – – – – –
Dato’ Shahriman Shamsuddin 506,385 0.00* 2,067,297,390(2) 12.94 –
Bernard Rene Francois Di Tullio – – – – –
Datuk Muhamad Noor Hamid – – – – –
Datuk Ramlan Abdul Rashid – – – – –
Lim Tiang Siew – – – – –
Dato’ Azmi Mohd Ali – – – – –
Datuk Iain John Lo – – 250,000(1) 0.00* –
* Negligible
Notes:(1) Deemed interested by virtue of the shareholding held by his spouse pursuant to Section 59(11)(c) of the Act.(2) Deemed interested by virtue of being a substantial shareholder of Sapura Holdings Sdn Bhd (“Sapura Holdings”) pursuant to Section 8 of the Act. Sapura
Holdings is a substantial shareholder of Sapura Technology Sdn Bhd, Sapura Resources Berhad, Sapura Capital Sdn Bhd, Indera Permai Sdn Bhd and Jurudata Sdn Bhd.
Corporate Governance
Sap
ura
En
erg
y B
erh
ad
An
nu
al R
ep
ort
20
22
73

ISLAMIC REDEEMABLE CONVERTIBLE PREFERENCE SHARES (“RCPS-I”)
Total Number of Issued Shares : 2,396,862,035 RCPS-iClass of Security : RCPS-iVoting Rights : The RCPS-i holders shall not be entitled to vote or approve any shareholders’ resolutions or
vote at any general meeting of the Company, save and except in respect of any resolution made: i. when the preferential dividends or any part thereof is in arrears and unpaid for more than
six (6) months;ii. on a proposal to reduce the Company’s share capital;iii. on a proposal for the disposal of substantially the whole of the Company’s property, business
and undertaking;iv. on a proposal to wind-up the Company;v. during the winding-up of the Company; orvi. on any proposal that affects the rights and privileges attached to the RCPS-i.
Number of Shareholders : 1,163
DISTRIBUTION BY SIZE OF RCPS-I HOLDINGS BASED ON RECORD OF DEPOSITORS
Size of RCPS-i Holdings
No. of RCPS-i
Holders
% of RCPS-i
Holders No. of
RCPS-i % of
RCPS-i
Less than 100 35 3.01 1,506 0.00
100 - 1,000 241 20.72 141,287 0.01
1,001 - 10,000 542 46.60 2,273,374 0.09
10,001 - 100,000 282 24.25 8,542,837 0.36
100,001 - to less than 5% of issued Shares 61 5.25 171,454,131 7.15
5% and above of issued shares 2 0.17 2,214,448,900 92.39
Total 1,163 100.00 2,396,862,035 100.00
THIRTY (30) LARGEST RCPS-I HOLDERS BASED ON RECORD OF DEPOSITORS
No. Name of RCPS-i Holders No. of
RCPS-i % of
RCPS-i
1. AMANAHRAYA TRUSTEES BERHAD AMANAH SAHAM BUMIPUTERA
2,088,165,500 87.12
2. PERMODALAN NASIONAL BERHAD 126,283,400 5.27
3. AMANAHRAYA TRUSTEES BERHADAMANAH SAHAM MALAYSIA
37,261,480 1.55
4. AMANAHRAYA TRUSTEES BERHADAMANAH SAHAM MALAYSIA 2 - WAWASAN
33,200,000 1.39
5. AMANAHRAYA TRUSTEES BERHADAMANAH SAHAM MALAYSIA 3
26,182,560 1.09
6. AMANAHRAYA TRUSTEES BERHADASN UMBRELLA FOR IMBANG (MIXED ASSET BALANCED) 2
20,000,000 0.83
7. AMANAHRAYA TRUSTEES BERHADAMANAH SAHAM BUMIPUTERA 3 - DIDIK
15,021,696 0.63
74
Corporate Governance
ANALYSIS OF SHAREHOLDINGSas at 29 April 2022

No. Name of RCPS-i Holders No. of
RCPS-i % of
RCPS-i
8. AMANAHRAYA TRUSTEES BERHADASN UMBRELLA FOR ASN EQUITY 3
10,000,000 0.42
9. AMANAHRAYA TRUSTEES BERHADAMANAH SAHAM BUMIPUTERA 2
3,600,000 0.15
10. AMANAHRAYA TRUSTEES BERHADAMANAH SAHAM NASIONAL
3,096,378 0.13
11. AMANAHRAYA TRUSTEES BERHADASN IMBANG (MIXED ASSET BALANCED) 1
2,955,871 0.12
12. MOHD JAMEL BIN ABDUL MUNIN 2,090,000 0.09
13. MUHAMAD ALOYSIUS HENG 1,540,160 0.06
14. HSBC NOMINEES (ASING) SDN BHDEXEMPT AN FOR MORGANT STANLEY & CO. INTERNATIONAL PLC (CLIENT)
1,500,000 0.06
15. AMANHRAYA TRUSTEES BERHADASN EQUITY 2
1,469,640 0.06
16. PERMODALAN NASIONAL BERHADBUMIPUTERA WEALTH FUND
1,300,000 0.05
17. HLB NOMINEES (TEMPATAN) SDN BHDPLEDGED SECURITIES ACCOUNT FOR LEE CHIAH CHEANG
1,003,100 0.04
18. RHB CAPITAL NOMINEES (TEMPATAN) SDN BHDPLEDGEG SECURITIES ACCOUNT FOR LEE CHIAH CHEANG
1,000,000 0.04
19. RAZMAN BIN ARIFFIN 744,200 0.03
20. ZAINAL ABIDIN BIN MOHD KASSIM 624,000 0.03
21. LIM GAIK BWAY @ LIM CHIEW AH 615,900 0.03
22. TAN CHIA CHIN 588,000 0.02
23. LAU CHUAN CHAI 448,800 0.02
24. CARTABAN NOMINEES (ASING) SDN BHDEXEMPT AN FOR BARCLAYS CAPITAL SECURITIES LTD (SBL/PB)
438,000 0.02
25. TOB WENG KIN 400,000 0.02
26. CHAI KIM SIN 346,100 0.01
27. CIMSEC NOMINEES (TEMPATAN) SDN BHDCIMB FOR AZIZAN BIN ABD RAHMAN (PB)
280,000 0.01
28. LIM CHOW SEN @ LIM CHOW SOON 280,000 0.01
29. MOHD JAMEL BIN ABDUL MUNIN 280,000 0.01
30. PUBLIC NOMINEES (TEMPATAN) SDN BHDPLEDGED SECURITIES ACCOUNT FOR CHONG JEE SIANG (E-PPG)
246,600 0.01
Total 2,380,961,385 99.32
Corporate Governance
Sap
ura
En
erg
y B
erh
ad
An
nu
al R
ep
ort
20
22
75

DIRECTORS’ RCPS-I HOLDINGS BASED ON REGISTER OF DIRECTORS’ RCPS-I HOLDINGS
Direct Interest Indirect Interest
DirectorsNo. of RCPS-i
Held % No. of RCPS-i
Held %
Tan Sri Dato’ Seri Shamsul Azhar bin Abbas – – – –
Datuk Mohd Anuar Taib – – – –
Tan Sri Dato’ Megat Zaharuddin Megat Mohd Nor – – – –
Dato’ Mohammad Azlan Abdullah – – – –
Dato’ Shahriman Shamsuddin – – – –
Bernard Rene Francois Di Tullio – – – –
Datuk Muhamad Noor Hamid – – – –
Datuk Ramlan Abdul Rashid – – – –
Lim Tiang Siew – – – –
Dato’ Azmi Mohd Ali – – – –
Datuk Iain John Lo – – – –
WARRANTS 2019/2026
Class of Security : Warrants 2019/2026 Number of Warrants Not Exercised : 998,692,020 WarrantsNumber of Warrant Holders : 5,462
DISTRIBUTION BY SIZE OF WARRANT HOLDINGS BASED ON RECORD OF DEPOSITORS
Size of RCPS-i Holdings
No. of Warrant Holders
% of Total Warrant
Holders
No. of Warrant Holders
% of Warrant Holders
Less than 100 181 3.31 8,561 0.00
100 - 1,000 797 14.59 426,910 0.04
1,001 - 10,000 1,436 26.29 7,548,419 0.76
10,001 - 100,000 2,038 37.31 92,315,031 9.24
100,001 - to less than 5% of Warrants 1,008 18.46 715,059,766 71.60
5% and above of Warrants 2 0.04 183,333,333 18.36
Total 5,462 100.00 998,692,020 100.00
76
Corporate Governance
ANALYSIS OF SHAREHOLDINGSas at 29 April 2022

THIRTY (30) LARGEST WARRANT HOLDERS BASED ON RECORD OF DEPOSITORS
No. Name of Warrant HoldersNo. of
Warrants %
1. SAPURA TECHNOLOGY SDN BHD 133,333,333 13.35
2. AMANAHRAYA TRUSTEES BERHADAMANAH SAHAM BUMIPUTERA
50,000,000 5.01
3. CIMSEC NOMINEES (TEMPATAN) SDN BHDCIMB FOR JURUDATA SDN BHD (PB)
30,700,000 3.07
4. CGS-CIMB NOMINEES (TEMPATAN) SDN BHDPLEDGED SECURITIES ACCOUNT FOR TAY SEANG WAH (MP0471)
24,200,000 2.42
5. LIM TSUI PHENG 23,030,066 2.31
6. MD NOR BIN MANSOR 14,330,000 1.43
7. TNAY MENG CHON 12,382,100 1.24
8. MAYBANK NOMINEES (TEMPATAN SDN BHDPLEDGED SECURITIES ACCOUNT FOR CHI KAIN SANG
11,840,000 1.19
9. MAYBANK NOMINEES (TEMPATAN) SDN BHDMAYBANK PRIVATE WEALTH MANAGEMETN FOR SHAHRIL BIN SHAMSUDDIN (1202671)(430412)
11,822,608 1.18
10. RAVI A/L PULLAIYAR 10,900,000 1.09
11. MAYBANK NOMINEES (TEMPATAN) SDN BHDPLEDGED SECURITIES ACCOUNT FOR YEO ENG TEE
10,000,100 1.00
12. AMSEC NOMINEES (TEMPATAN) SDN BHDPLEDGED SECURITIES ACCOUNT FOR QUEK SEE KUI
9,000,000 0.90
13. QUECK CHIN HUI 8,238,000 0.82
14. RHB CAPITAL NOMINEES (TEMPATAN) SDN BHDPLEDGED SECURITIES ACCOUNT FOR CHI KAIN SANG (LBU)
7,700,000 0.77
15. MAYBANK NOMINEES (TEMPATAN) SDN BHDAB RAZAK BIN ALI
7,234,500 0.72
16. MAYBANK NOMINEES (TEMPATAN) SDN BHDPLEDGED SECURITIES ACCOUNT FOR CHAI KOH HIUNG
7,200,000 0.72
17. CHOO KWANG WAH 6,500,000 0.65
18. CITIGROUP NOMINEES (ASING) SDN BHDEXEMPT AN FOR BANK OF SINGAPORE LIMITED (FOREIGN)
6,031,535 0.60
19. MURRUGESU A/L A. SIVAPERUMAL 6,000,000 0.60
20. SU SONG UNG 6,000,000 0.60
21. PUBLIC NOMINEES (TEMPATAN) SDN BHDPLEDGED SECURITIES ACCOUNT FOR LIM KHEK KENG (E-TAI)
5,900,000 0.59
22. MUAMMAD SYAFIQ BIN ISHAK 5,597,000 0.56
23. LIEW FONG CHAI 5,539,900 0.55
24. HAM YEAN MING 5,229,000 0.52
Corporate Governance
Sap
ura
En
erg
y B
erh
ad
An
nu
al R
ep
ort
20
22
77

No. Name of Warrant HoldersNo. of
Warrants %
25. MAYBANK NOMINEES (TEMPATAN) SDN BHDMOHD ALIM BIN HARON
5,156,300 0.52
26. CITIGROUP NOMINEES (TEMPATAN) SDN BHDEXEMPT AN FOR OCBC SECURITIES PRIVATE LIMITED (CLIENT A/C-R ES)
5,000,000 0.50
27. PUBLIC NOMINEES (TEMPATAN) SDN BHDPLEDGED SECURITIES ACCOUNT FOR POH SENG KIAN (TJJ/KEN)
5,000,000 0.50
28. SJ SEC NOMINEES (TEMPATAN) SDN BHDPLEDGED SECURITIES ACCOUNT FOR FATEH MOHAMED (SMT)
5,000,000 0.49
29. KENANGA NOMINEES (ASING) SDN BHDEXEMPT AN FOR PHILLIP SECURITIES PTE LTD (CLIENT ACCOUNT)
4,919,833 0.49
30. TEE YONG 4,500,000 0.45
Total 448,284,275 44.85
DIRECTORS’ WARRANT HOLDINGS BASED ON REGISTER OF DIRECTORS’ WARRANT HOLDNGS
Direct Interest Indirect Interest
DirectorsNo. of
Warrants Held % No. of
Warrants Held %
Tan Sri Dato’ Seri Shamsul Azhar bin Abbas – – – –
Datuk Mohd Anuar Taib – – – –
Tan Sri Dato’ Megat Zaharuddin Megat Mohd Nor – – – –
Dato’ Mohammad Azlan Abdullah – – – –
Dato’ Shahriman Shamsuddin – – – –
Bernard Rene Francois Di Tullio – – – –
Datuk Muhamad Noor Hamid – – – –
Datuk Ramlan Abdul Rashid – – – –
Lim Tiang Siew – – – –
Dato’ Azmi Mohd Ali – – – –
Datuk Iain John Lo – – – –
78
Corporate Governance
ANALYSIS OF SHAREHOLDINGSas at 29 April 2022

Sap
ura
En
erg
y B
erh
ad
An
nu
al R
ep
ort
20
22
79
Financial Statements
FINANCIALSTATEMENTS
80 Directors’ Report
86 Statement by Directors
86 Statutory Declaration
87 Independent Auditors’ Report
92 Consolidated and Separate Statements of Profit or Loss
93 Consolidated and Separate Statements of Comprehensive Income
94 Consolidated and Separate Statements of Financial Position
96 Consolidated Statement of Changes in Equity
97 Company Statement of Changes in Equity
98 Consolidated Statement of Cash Flows
100 Company Statement of Cash Flows
101 Notes to the Financial Statements

The directors hereby present their report together with the audited financial statements of the Group and of the Company for the financial year ended 31 January 2022.
PRINCIPAL ACTIVITIES
The principal activities of the Company are that of investment holding and provision of management services to its subsidiaries.
The principal activities of the subsidiaries are as described in Note 44 to the financial statements.
RESULTS
GroupRM’000
CompanyRM’000
Loss for the financial year, net of tax (9,060,859) (8,898,432)
Loss attributable to:
Owners of the Parent (9,050,634) (8,898,432)
Non-controlling interests (10,225) –
(9,060,859) (8,898,432)
There were no material transfers to or from reserves or provisions during the financial year other than as disclosed in the financial statements.
In the opinion of the directors, the results of the operations of the Group and of the Company during the financial year were not substantially affected by any item, transaction or event of a material and unusual nature, other than as disclosed in the financial statements.
DIRECTORS
The names of the directors of the Company in office since the beginning of the financial year to the date of this report are:
Dato’ Mohammad Azlan bin Abdullah (Appointed as Chairman on 7 May 2022) Datuk Mohd Anuar bin Taib^Dato’ Shahriman bin ShamsuddinDatuk Muhamad Noor bin HamidDatuk Ramlan bin Abdul RashidLim Tiang SiewDato’ Azmi bin Mohd AliDatuk Iain John Lo (Appointed on 1 May 2021) Bernard Rene Francois Di Tullio (Appointed on 1 May 2021) Cosimo Borrelli^ (Appointed on 25 March 2022) Tan Sri Dato’ Seri Shamsul Azhar bin Abbas (Resigned on 7 May 2022) Tan Sri Dato’ Megat Zaharuddin bin Megat Mohd Nor (Resigned on 7 May 2022) Tan Sri Dato’ Seri Shahril bin Shamsuddin* (Resigned on 30 April 2021) Syed Ali bin Syed Salem Alsagoff (Resigned on 30 April 2021)
^ Director of the Company and certain subsidiaries.
* Director of the Company and certain subsidiaries up to the date of resignation or retirement.
80
Financial Statements
DIRECTORS’ REPORT

DIRECTORS (CONT’D.)
The list of the directors of the Company’s subsidiary/(ies) since the beginning of the financial year to the date of this report, excluding directors who are also directors of the Company:
Ahmad Zakiruddin bin MohamedAnthony James WillisAwang Mohammad bin Haji BrahimBenoit Marie, CarayolBiren Kumar DashBruno PicozziBundit KittitanaruxChiang Wai MingGiselle Patricia RoweJohannes Franciscus Maria StinenboschJohn Michael GoldenLouay Louis LahamMelson Barry-Gene DaleMetis Wong Kuan LeeMohamad Nasri bin MehatMohammad Nazmi bin KamaruddinMohd Saiman bin AbdullahMuhd Nazif bin MuhamadNa’imah binti Mohd NoorNelson Anderson Cheong Boon GuanNew Cheng SweeNik Aisyah Amirah binti MansorNik Azli bin Abu ZaharNoordin bin SulaimanPaul Standon ColleyPaulette LopesPhanindhar ChivukulaRaphael Michel Francois Yves SiriRavisankar Venkata MamidannaRichard Rowland LeethamRita Lydia HartonoSirlene Santos Brêtas de NoronhaSuhaimi bin Ismail
Appointed since the beginning of the financial year to the date of this report:
Amar Bheenick (Appointed on 1 April 2022) Ashit Jain (Appointed on 19 February 2021) Chew Seng Heng (Appointed on 30 September 2021) Chow Wai Harn (Appointed on 22 February 2021) Chung Chun Fui (Appointed on 1 December 2021) Dharmesh Naik (Appointed on 1 April 2022) Kuang bin Sitim (Appointed on 20 November 2021) Maxim D’Souza (Appointed on 8 March 2021) Puspa Hanita binti Abd Aziz (Appointed on 30 March 2021) Richard Faria Ferreira (Appointed on 27 February 2021) Sim Kim Siong (Appointed on 27 April 2021) Sofia binti Zakaria (Appointed on 1 December 2021)
Sap
ura
En
erg
y B
erh
ad
An
nu
al R
ep
ort
20
22
81
Financial Statements

DIRECTORS (CONT’D.)
Resigned since the beginning of the financial year to the date of this report:
Abbas bin Ariff (Resigned on 25 February 2022) Bruno Picozzi (Resigned on 6 April 2022) Chow Mei Mei (Resigned on 31 March 2021) Datuk Kris Azman bin Abdullah (Resigned on 31 March 2021) Kedar Lagvankar (Resigned on 19 March 2021) Mariah binti Mohamad Said (Resigned on 30 September 2021) Md Yusoff bin Mohamad Noor (Resigned on 13 January 2022) Reza bin Abdul Rahim (Resigned on 1 January 2022) Vivek Arora (Resigned on 19 March 2021)
Deceased since the beginning of the financial year to the date of this report:
Ungku Suleiman bin Ungku Abdul Aziz (Deceased on 24 February 2021)
DIRECTORS’ BENEFITS
Neither at the end of the financial year, nor at any time during the year, did there subsist any arrangement to which the Company was a party, whereby the directors might acquire benefits by means of the acquisition of shares in or debentures of the Company or any other body corporate, other than those arising from the Long Term Incentive Plan (“LTIP”) and the Executive Share Option Scheme (“ESOS”), as disclosed in Note 28 and Note 36 to the financial statements.
Since the end of the previous financial year, no director of the Company has received or become entitled to receive a benefit (other than benefits included in the aggregate amount of emoluments received or due and receivable by the directors or the fixed salary of a full-time employee of the Company as shown in Note 10 to the financial statements) by reason of a contract made by the Company or a related corporation with any director or with a firm of which the director is a member, or with a company in which the director has a substantial financial interest, except as disclosed in Note 39 to the financial statements.
The directors and officers of the Group and of the Company are covered by Directors and Officers Liability Insurance for any liability incurred in the discharge of their duties, provided that they have not acted fraudulently or dishonestly or derived any personal profit or advantage. The total insured limit for the Directors and Officers Liability Insurance effected for the Directors and Officers of the Group was RM200 million. The insurance premium charged during the financial year amounted to RM555,202.
DIRECTORS’ INTERESTS
According to the register of directors’ shareholdings, the interests of directors of the Company in office at the end of the financial year in shares in the Company and its related corporations during the financial year were as follows:
Number of ordinary shares
As at1.2.2021
‘000Acquired
‘000Sold‘000
As at31.1.2022
‘000
The Company
Indirect interestDato’ Shahriman bin Shamsuddin1 2,048,150 19,048 – 2,067,198
Tan Sri Dato’ Seri Shamsul Azhar bin Abbas2 6,774 – – 6,774
Tan Sri Dato’ Megat Zaharuddin bin Megat Mohd Nor2 13 – – 13
Datuk Iain John Lo2 200 50 – 250
82
Financial Statements
DIRECTORS’ REPORT

DIRECTORS’ INTERESTS (CONT’D.)
According to the register of directors’ shareholdings, the interests of directors of the Company in office at the end of the financial year in shares in the Company and its related corporations during the financial year were as follows (cont’d.):
Number of ordinary shares
As at1.2.2021
‘000Acquired
‘000Sold‘000
As at31.1.2022
‘000
The Company
Direct interestTan Sri Dato’ Seri Shamsul Azhar bin Abbas 2,455 – – 2,455
Datuk Mohd Anuar bin Taib 1,200 – – 1,200
Tan Sri Dato’ Megat Zaharuddin bin Megat Mohd Nor 510 – – 510
Dato’ Shahriman bin Shamsuddin 506 – – 506
Number of warrants
As at1.2.2021
‘000Acquired
‘000Sold‘000
As at31.1.2022
‘000
The Company
Indirect interestDato’ Shahriman bin Shamsuddin1 164,061 – – 164,061
1 Deemed interested by virtue of being a substantial shareholder of Sapura Holdings Sdn. Bhd. (“Sapura Holdings”) pursuant to Section 8 of the Companies Act 2016. Sapura Holdings is a substantial shareholder of Sapura Technology Sdn. Bhd., Sapura Resources Berhad, Sapura Capital Sdn. Bhd., Indera Permai Sdn. Bhd. and Jurudata Sdn. Bhd..
2 Interest by virtue of shares held by spouse.
Other than as disclosed above, none of the other directors in office at the end of the financial year had any interest in shares in the Company or its related corporations during the financial year.
Sap
ura
En
erg
y B
erh
ad
An
nu
al R
ep
ort
20
22
83
Financial Statements

SHARES HELD UNDER TRUST
As at 31 January 2022, a total undistributed balance of 7,276,000 units of the Company’s issued ordinary shares were held under trust at carrying amount of RM11,587,000. Further details are disclosed in Note 28 to the financial statements.
EXECUTIVE SHARE OPTION SCHEME
During the Extraordinary General Meeting held on 29 November 2018, shareholders approved the establishment of the ESOS and the By-Laws for the granting of options to eligible executive directors and senior management to subscribe for new ordinary shares of the Company.
The Board Nomination and Remuneration Committee (“BNRC”) which governs the ESOS, comprises directors appointed and duly authorised by the Board in accordance with the By-Laws.
The ESOS comprises of Tranche 1 and Tranche 2 granted in the previous years, where these options will expire on 12 December 2025 and 10 April 2026 respectively. The salient features and other terms of the ESOS are disclosed in Note 36 to the financial statements.
OTHER STATUTORY INFORMATION
(a) Before the statements of profit or loss, statements of comprehensive income and statements of financial position of the Group and of the Company were made out, the directors took reasonable steps:
(i) to ascertain that proper action had been taken in relation to the writing off of bad debts and the making of allowance for expected credit losses on receivables and satisfied themselves that there were no known bad debts and that adequate allowance for expected credit losses had been made for receivables; and
(ii) to ensure that any current assets which were unlikely to realise their values as shown in the accounting records in the ordinary course of business had been written down to an amount which they might be expected so to realise.
(b) At the date of this report, the directors are not aware of any circumstances which would render:
(i) it necessary to write off any bad debts or the amount of the allowance for expected credit losses on receivables in the financial statements of the Group and of the Company inadequate to any substantial extent; and
(ii) the values attributed to the current assets in the financial statements of the Group and of the Company misleading.
(c) At the date of this report, the directors are not aware of any circumstances which have arisen which would render adherence to the existing method of valuation of assets or liabilities of the Group and of the Company misleading or inappropriate.
(d) At the date of this report, the directors are not aware of any circumstances not otherwise dealt with in this report or financial statements of the Group and of the Company which would render any amount stated in the financial statements misleading.
(e) At the date of this report, there does not exist:
(i) any charge on the assets of the Group or of the Company which has arisen since the end of the financial year which secures the liabilities of any other person, or
(ii) any contingent liability of the Group or of the Company which has arisen since the end of the financial year, except for those disclosed in Note 38 to the financial statements.
84
Financial Statements
DIRECTORS’ REPORT

OTHER STATUTORY INFORMATION (CONT’D.)
(f) In the opinion of the directors:
(i) no contingent or other liability has become enforceable or is likely to become enforceable within the period of twelve months after the end of the financial year; as the plan to address the Group’s liquidity constraints, set out in Note 2.1 to the financial statements, is expected to be achievable; which may affect the ability of the Group or the Company to meet their obligations when they fall due; and
(ii) no item, transaction or event of a material and unusual nature has arisen in the interval between the end of the financial year and the date of this report which is likely to affect substantially the results of the operations of the Group or of the Company for the financial year in which this report is made.
SUBSEQUENT EVENTS
Other than the matters discussed in Notes 2.1(iii)(a), Note 2.1(iii)(b) and Note 31(d) to the financial statements, there was no material event subsequent to the financial year ended 31 January 2022.
AUDITORS AND AUDITORS’ REMUNERATION
The auditors, Ernst & Young PLT, have expressed their willingness to continue in office.
Auditors’ remuneration are disclosed in Note 8 to the financial statements.
To the extent permitted by law, the Company has agreed to indemnify its auditors, Ernst & Young PLT, as part of the terms of its audit engagement against claims by third parties arising from the audit. No payment has been made to indemnify Ernst & Young PLT during or since the financial year.
Signed on behalf of the Board in accordance with a resolution of the directors dated 31 May 2022.
Dato’ Mohammad Azlan bin Abdullah Datuk Mohd Anuar bin Taib
Sap
ura
En
erg
y B
erh
ad
An
nu
al R
ep
ort
20
22
85
Financial Statements

We, Dato’ Mohammad Azlan bin Abdullah and Datuk Mohd Anuar bin Taib, being two of the directors of Sapura Energy Berhad, do hereby state that, in the opinion of the directors, the accompanying financial statements set out on pages 92 to 207 are drawn up in accordance with Malaysian Financial Reporting Standards, International Financial Reporting Standards and the requirements of the Companies Act 2016 in Malaysia so as to give a true and fair view of the financial position of the Group and of the Company as at 31 January 2022 and of their financial performance and cash flows for the year then ended.
Signed on behalf of the Board in accordance with a resolution of the directors dated 31 May 2022.
Dato’ Mohammad Azlan bin Abdullah Datuk Mohd Anuar bin Taib
I, Chew Seng Heng, being the officer primarily responsible for the financial management of Sapura Energy Berhad, do solemnly and sincerely declare that the accompanying financial statements set out on pages 92 to 207 are, to the best of my knowledge and belief, correct, and I make this solemn declaration conscientiously believing the same to be true and by virtue of the provisions of the Statutory Declarations Act, 1960.
Subscribed and solemnly declared by ) the abovenamed Chew Seng Heng ) at Kuala Lumpur in the Federal Territory ) on 31 May 2022 ) Chew Seng Heng MIA 10344
Before me,
Kapt (B) Jasni bin YusoffNo: W465Lot 1.08, Tingkat 1Bangunan KWSP, Jalan Raja Laut50350 Kuala Lumpur
86
Financial Statements
STATEMENT BY DIRECTORSPursuant to Section 251(2) of the Companies Act 2016
STATUTORY DECLARATIONPursuant to Section 251(1)(b) of the Companies Act 2016

REPORT ON THE AUDIT OF THE FINANCIAL STATEMENTS
Opinion
We have audited the financial statements of Sapura Energy Berhad, which comprise the statements of financial position as at 31 January 2022 of the Group and of the Company, statements of profit or loss, statements of comprehensive income, statements of changes in equity and statements of cash flows of the Group and of the Company for the year then ended, and notes to the financial statements, including a summary of significant accounting policies as set out on pages 92 to 207.
In our opinion, the accompanying financial statements give a true and fair view of the financial position of the Group and of the Company as at 31 January 2022, and of their financial performance and cash flows for the year then ended in accordance with Malaysian Financial Reporting Standards (“MFRS”), International Financial Reporting Standards (“IFRS”) and the requirements of the Companies Act 2016 in Malaysia.
Basis for Opinion
We conducted our audit in accordance with approved standards on auditing in Malaysia and International Standards on Auditing. Our responsibilities under those standards are further described in the Auditors’ responsibilities for the audit of the financial statements section of our report. We believe that the audit evidence we have obtained is sufficient and appropriate to provide a basis for our audit opinion.
Material Uncertainty Related to Going Concern
We draw attention to Note 2.1 to the financial statements, which indicates that the Group and the Company reported a net loss of RM9,060.9 million and RM8,898.4 million respectively for the year ended 31 January 2022, and as of that date, the Group’s and the Company’s current liabilities exceeded their current assets by RM12,450.8 million and RM1,331.3 million respectively, and that the Group is facing severe liquidity constraints. The Company and 22 of its subsidiaries (“the Applicants”) have obtained restraining orders under Section 368 of the Companies Act 2016 in Malaysia (“the Act”) as well as separate contractual standstill arrangements with the lenders (“Standstill Arrangements”) will expire on 10 June 2022 and 6 June 2022 respectively and is in the process of undertaking scheme of arrangements (“SOA”) and compromise under Section 366 of the Act.
These events or conditions, along with other matters as set forth in Note 2.1 to the financial statements, indicate the existence of material uncertainties that may cast significant doubt on the Group’s and the Company’s ability to continue as a going concern. Nevertheless, the financial statements of the Group and of the Company have been prepared on a going concern basis, the validity of which is highly dependent on obtaining extensions of the Restraining Orders and Standstill Arrangements and; the successful and timely implementation of the proposed SOA which requires that the Applicants to secure approvals from at least 75% of the scheme creditors in the court convened meetings.
Should the going concern basis for the preparation of the financial statement be no longer appropriate, adjustments would have to be made in the financial statements relating to the amounts and classification of the assets and liabilities. No such adjustments have been made to these financial statements.
Our opinion is not qualified in respect of this matter.
Independence and other ethical responsibilities
We are independent of the Group and of the Company in accordance with the By-Laws (on Professional Ethics, Conduct and Practice) of the Malaysian Institute of Accountants (“By-Laws”) and the International Code of Ethics for Professional Accountants (including International Independence Standards) (“IESBA Code”), and we have fulfilled our other ethical responsibilities in accordance with the By-Laws and the IESBA Code.
Sap
ura
En
erg
y B
erh
ad
An
nu
al R
ep
ort
20
22
87
Financial Statements
INDEPENDENT AUDITORS’ REPORTto the members of Sapura Energy Berhad (Incorporated in Malaysia)

REPORT ON THE AUDIT OF THE FINANCIAL STATEMENTS (CONT’D.)
Key Audit Matters
Key audit matters are those matters that, in our professional judgement, were of most significance in our audit of the financial statements of the Group and of the Company for the current year. In addition to the matters described in the Material Uncertainty Related to Going Concern section, we have determined the matters described below to be the key audit matters for the audit of the financial statements of the Group to be communicated in our report. We have determined that there are no further key audit matters to communicate in our report on the financial statements of the Company. These matters were addressed in the context of our audit of the financial statements of the Group and of the Company as a whole, and in forming our opinion thereon, and we do not provide a separate opinion on these matters. For each matter below, our description of how our audit addressed the matter is provided in that context.
We have fulfilled the responsibilities described in the Auditors’ responsibilities for the audit of the financial statements section of our report, including in relation to these matters. Accordingly, our audit included the performance of procedures designed to respond to our assessment of the risks of material misstatement of the financial statements. The results of our audit procedures, including the procedures performed to address the matters below, provide the basis of our audit opinion on the accompanying financial statements.
(a) Impairment assessment of goodwill on consolidation and property, plant and equipment (“PPE”) (Refer to Notes 2.33(b)(i), Note 13 and Note 14 to the financial statements)
As at 31 January 2022, the carrying values of the Group’s goodwill and property, plant and equipment (“PPE”) amounted to RM1,697.1 million and RM6,437.0 million respectively, which collectively represents 51% of the Group’s total assets.
In accordance with MFRS 136: Impairment of Assets, the Group is required to perform annual impairment test of cash generating units (“CGUs”) or groups of CGUs to which goodwill has been allocated and whenever there is an indication that the PPE may be impaired by comparing the carrying amount with its recoverable amount. Recoverable amount is defined as the higher of fair value less costs of disposal (“FVLCD”) and value-in-use (“VIU”).
The Group has allocated its goodwill to the Engineering & Construction (“E&C”) and Drilling business segments. In relation to PPE (including vessels), management has identified them to be tested for impairment in view of the Group’s loss-making position and continued challenges within the oil and gas industry.
The Group estimated the recoverable amounts of its CGUs or groups of CGUs to which the goodwill and PPE are allocated, based on the VIU method. For the individual vessel which does not belong to a CGU or group of CGUs, management has estimated the recoverable amount based on the FVLCD method where management has engaged independent valuers to estimate the fair value of the vessels.
Due to the significance of the carrying values of goodwill and PPE, and the complexity and subjectivity involved in the impairment assessment, we considered this as an area of audit focus.
In addressing the matters above, we have performed amongst others the following audit procedures:
• For the recoverable amounts of CGUs or groups of CGUs determined using VIU, we have:
(i) Obtained an understanding of the relevant processes and internal controls over estimating the recoverable amount of the CGUs or groups of CGUs.
(ii) Evaluated the key assumptions used by management in the cash flow projections on whether they are reasonable by comparing to past actual outcomes and by corroborating with industry analysts’ views, management’s plans, existing contracts and upcoming bidding opportunities, where applicable.
(iii) Evaluated the discount rates, terminal growth rates and the methodology used in deriving the present value of the cash flows, with the support of our internal valuation specialists.
(iv) For CGUs or groups of CGUs to which goodwill and PPE are allocated, we have performed sensitivity analysis on the key inputs to understand the impact that alternative assumptions would have had on the recoverable amounts.
(v) Assessed the adequacy of the disclosures made in the financial statements.
88
Financial Statements
INDEPENDENT AUDITORS’ REPORTto the members of Sapura Energy Berhad (Incorporated in Malaysia)

REPORT ON THE AUDIT OF THE FINANCIAL STATEMENTS (CONT’D.)
Key Audit Matters (cont’d.)
(a) Impairment assessment of goodwill on consolidation and property, plant and equipment (“PPE”) (cont’d.)(Refer to Notes 2.33(b)(i), Note 13 and Note 14 to the financial statements) (cont’d.)
In addressing the matters above, we have performed amongst others the following audit procedures: (cont’d.)
• For the recoverable amounts of the vessels determined using FVLCD, we have:
(i) Considered the independence, reputation and expertise of the independent valuers.
(ii) Obtained an understanding of the methodology adopted by the independent valuers in estimating the fair value of vessels and assessed whether such methodology is consistent with those used in the industry.
(iii) Discussed with the independent valuers to obtain an understanding of the assumptions and related data used as input to the valuation models.
(b) Revenue from construction contracts recognised on percentage of completion method(Refer to Notes 2.22(i)(a) and Note 3 to the financial statements)
Revenue from construction contracts contributed approximately 50% of the Group’s total revenue for the year ended 31 January 2022. To measure progress over time, the Group applied the input method which is based on the percentage-of-completion (“POC”). POC is determined by the proportion of cost incurred for work performed to date over the estimated total contract cost. The use of POC requires management to exercise significant judgement in estimating the costs to complete. Accordingly, we considered this as an area of audit focus.
In estimating the costs to complete, management considered the completeness and accuracy of its costs estimation including its obligations in respect of contract variations, claims and cost contingencies. It also involved appropriately identifying, estimating and providing for contracts with foreseeable losses. The costs to complete can vary with market conditions and unforeseen events during the contract period.
In addressing the matter above, we have performed amongst others the following audit procedures:
(i) Obtained an understanding of the processes and internal controls over the accuracy and timing of revenue and profit recognised in the financial statements, including the process and controls performed by management to estimate the total contract cost, profit margin and POC of the projects.
(ii) Discussed with management on the basis for estimating total contract cost of significant projects.
(iii) Evaluated the assumptions applied in determining the estimated total contract cost of significant projects, by comparing the estimated costs to complete with documentary evidence such as original signed contracts and variation orders. We also considered the historical accuracy of management’s budgets.
(iv) Assessed the adequacy of provision for foreseeable losses made for ongoing contracts, where applicable.
(v) Assessed the reasonableness of the project’s estimated profit margin, by comparing it to management’s initial budget and past actual outcomes.
(vi) Agreed the contract sum used in management’s calculations of revenue to the original contracts and approved variation orders where applicable, on a sampling basis.
(vii) Tested management’s calculations of POC and revenue.
Sap
ura
En
erg
y B
erh
ad
An
nu
al R
ep
ort
20
22
89
Financial Statements

REPORT ON THE AUDIT OF THE FINANCIAL STATEMENTS (CONT’D.)
Information other than the financial statements and auditors’ report thereon
The directors of the Company are responsible for the other information. The other information comprises the information included in the Group’s 2022 Annual Report and the Directors’ Report, but does not include the financial statements of the Group and of the Company and our auditors’ report thereon.
Our opinion on the financial statements of the Group and of the Company does not cover the other information and we do not express any form of assurance conclusion thereon.
In connection with our audit of the financial statements of the Group and of the Company, our responsibility is to read the other information identified above when it becomes available and, in doing so, consider whether the other information is materially inconsistent with the financial statements of the Group and of the Company or our knowledge obtained in the audit or otherwise appears to be materially misstated.
If, based on the work we have performed, we conclude that there is a material misstatement of this other information, we are required to report that fact. We have nothing to report in this regard.
Responsibilities of the directors for the financial statements
The directors of the Company are responsible for the preparation of financial statements of the Group and of the Company that give a true and fair view in accordance with MFRS, IFRS and the requirements of the Companies Act 2016 in Malaysia. The directors are also responsible for such internal control as the directors determine is necessary to enable the preparation of financial statements of the Group and of the Company that are free from material misstatement, whether due to fraud or error.
In preparing the financial statements of the Group and of the Company, management is responsible for assessing the Group’s and the Company’s ability to continue as a going concern, disclosing, as applicable, matters related to going concern and using the going concern basis of accounting unless management either intends to liquidate the Group or the Company or to cease operations, or have no realistic but alternative to do so.
Auditors’ responsibilities for the audit of the financial statements
Our objectives are to obtain reasonable assurance about whether the financial statements of the Group and of the Company, as a whole are free from material misstatement, whether due to fraud or error, and to issue an auditors’ report that includes our opinion. Reasonable assurance is a high level of assurance, but is not a guarantee that an audit conducted in accordance with approved standards on auditing in Malaysia and International Standards on Auditing will always detect a material misstatement when it exists. Misstatements can arise from fraud or error and are considered material if, individually or in the aggregate, they could reasonably be expected to influence the economic decisions of users taken on the basis of these financial statements.
As part of an audit in accordance with approved standards on auditing in Malaysia and International Standards in Auditing (“ISA”), we exercise professional judgement and maintain professional skepticism throughout the audit. We also:
(a) Identify and assess the risks of material misstatement of the financial statements of the Group and of the Company, whether due to fraud or error, design and perform audit procedures responsive to those risks, and obtain audit evidence that is sufficient and appropriate to provide a basis for our opinion. The risk of not detecting a material misstatement resulting from fraud is higher than for one resulting from error, as fraud may involve collusion, forgery, intentional omissions, misrepresentations, or the override of internal control.
(b) Obtain an understanding of internal control relevant to the audit in order to design audit procedures that are appropriate in the circumstances, but not for the purpose of expressing an opinion on the effectiveness of the Group’s and the Company’s internal control.
(c) Evaluate the appropriateness of accounting policies used and the reasonableness of accounting estimates and related disclosures made by directors.
90
Financial Statements
INDEPENDENT AUDITORS’ REPORTto the members of Sapura Energy Berhad (Incorporated in Malaysia)

REPORT ON THE AUDIT OF THE FINANCIAL STATEMENTS (CONT’D.)
Auditors’ responsibilities for the audit of the financial statements (cont’d.)
As part of an audit in accordance with approved standards on auditing in Malaysia and International Standards in Auditing (“ISA”), we exercise professional judgement and maintain professional skepticism throughout the audit. We also (cont’d.):
(d) Conclude on the appropriateness of management’s use of the going concern basis of accounting and, based on the audit evidence obtained, whether a material uncertainty exists related to events or conditions that may cast significant doubt on the Group’s or the Company’s ability to continue as a going concern. If we conclude that a material uncertainty exists, we are required to draw attention in our auditors’ report to the related disclosures in the financial statements of the Group and of the Company or, if such disclosures are inadequate, to modify our opinion. Our conclusions are based on the audit evidence obtained up to the date of our auditors’ report. However, future events or conditions may cause the Group or the Company to cease to continue as a going concern.
(e) Evaluate the overall presentation, structure and content of the financial statements of the Group and of the Company, including the disclosures, and whether the financial statements of the Group and of the Company represent the underlying transactions and events in a manner that achieves fair presentation.
(f) Obtain sufficient appropriate audit evidence regarding the financial information of the entities and business activities within the Group to express an opinion on the financial statements of the Group. We are responsible for the direction, supervision and performance of the group audit. We remain solely responsible for our audit opinion.
We communicate with the directors regarding, among other matters, the planned scope and timing of the audit and significant audit findings, including any significant deficiencies in internal control that we identify during our audit.
We also provide the directors with a statement that we have complied with relevant ethical requirements regarding independence, and to communicate with them all relationships and other matters that may reasonably be thought to bear on our independence, and where applicable, actions taken to eliminate threats or safeguards applied.
From the matters communicated with those charged with governance, we determine those matters that were of most significance in the audit of the financial statements of the Group and of the Company for the current year and are therefore the key audit matters. We describe these matters in our auditors’ report unless law or regulation precludes public disclosure about the matter or when, in extremely rare circumstances, we determine that a matter should not be communicated in our report because the adverse consequences of doing so would reasonably be expected to outweigh the public interest benefits of such communication.
Other matters
This report is made solely to the members of the Company, as a body, in accordance with Section 266 of the Companies Act 2016 in Malaysia and for no other purpose. We do not assume responsibility to any other person for the content of this report.
Ernst & Young PLT Ahmad Zahirudin bin Abdul Rahim202006000003 (LLP0022760-LCA) & AF 0039 No. 02607/12/2022 JChartered Accountants Chartered Accountant
Kuala Lumpur, Malaysia31 May 2022
Sap
ura
En
erg
y B
erh
ad
An
nu
al R
ep
ort
20
22
91
Financial Statements

Note
Group Company
2022RM’000
2021RM’000
2022RM’000
2021RM’000
Revenue 3 4,100,229 5,347,822 114,651 113,919
Cost of sales 4 (6,264,046) (4,730,486) – –
Gross (loss)/profit (2,163,817) 617,336 114,651 113,919
Other income 5 76,319 183,717 24,399 59,412
Administrative expenses (384,368) (333,156) (191,677) (106,816)
Other expenses (306,460) (166,085) – –
(2,778,326) 301,812 (52,627) 66,515
Provision for impairment 6 (5,605,721) – (8,611,968) (61,714)
Finance costs 7 (527,865) (492,364) (212,470) (231,066)
Share of (loss)/profit from associates and joint ventures (19,941) 158,827 – –
Loss before taxation 8 (8,931,853) (31,725) (8,877,065) (226,265)
Income tax (expense)/credit 11 (129,006) (128,527) (21,367) 2,697
Loss after taxation (9,060,859) (160,252) (8,898,432) (223,568)
(Loss)/profit attributable to:Owners of the Parent (9,050,634) (160,870) (8,898,432) (223,568)
Non-controlling interests (10,225) 618 - –
(9,060,859) (160,252) (8,898,432) (223,568)
Loss per share attributable to owners of the Parent (sen per share)
Basic/Diluted 12 (56.67) (1.01) – –
The accompanying accounting policies and explanatory notes form an integral part of the financial statements.
92
Financial Statements
CONSOLIDATED AND SEPARATE STATEMENTS OF PROFIT OR LOSSFor the financial year ended 31 January 2022

Group Company
2022RM’000
2021RM’000
2022RM’000
2021RM’000
Loss after taxation (9,060,859) (160,252) (8,898,432) (223,568)
Other comprehensive income/(loss):
Items that may be reclassified to profit or loss in subsequent periods:
Foreign currency translation differences 36,431 (88,253) – –
Net changes in cash flow hedge (3,917) 17,443 – –
Share of other comprehensive income/(loss) of associates and joint ventures:
– Foreign currency translation differences 136,774 (7,465) – –
– Net changes in cash flow hedge 13,855 (15,823) – –
Item that has been reclassified to profit or loss in current year:Amortisation of cumulative changes in relation to hedge
instruments 18,952 16,432 – –
Total other comprehensive income/(loss) 202,095 (77,666) – –
Total comprehensive loss for the year (8,858,764) (237,918) (8,898,432) (223,568)
Total comprehensive (loss)/income attributable to:
Owners of the Parent (8,860,597) (236,951) (8,898,432) (223,568)
Non-controlling interests 1,833 (967) – –
(8,858,764) (237,918) (8,898,432) (223,568)
The accompanying accounting policies and explanatory notes form an integral part of the financial statements.
Sap
ura
En
erg
y B
erh
ad
An
nu
al R
ep
ort
20
22
93
Financial Statements
CONSOLIDATED AND SEPARATE STATEMENTS OF COMPREHENSIVE INCOMEFor the financial year ended 31 January 2022

Note
Group Company
2022RM’000
2021RM’000
2022RM’000
2021RM’000
ASSETS
Non-current assetsProperty, plant and equipment 13 6,437,033 9,218,612 12,202 14,098
Intangible assets 14 1,705,376 4,927,743 – –
Investment in subsidiaries 15 – – 5,002,277 12,705,308
Investment in associates 16 2,035,721 2,103,820 – –
Investment in joint ventures 17 2,168,609 2,005,591 – –
Deferred tax assets 18 103,657 120,336 – 16,318
Derivative assets 19 – 55,083 – –
Trade and other receivables 22 227,560 44,126 – –
Amounts due from subsidiaries 21 – – 10,992 460,616
12,677,956 18,475,311 5,025,471 13,196,340
Current assetsInventories 20 428,841 423,251 – –
Amounts due from subsidiaries 21 – – 81,571 452,949
Trade and other receivables 22 1,139,186 1,434,328 22,782 48,368
Contract assets 23 727,044 1,752,716 – –
Tax recoverable 82,473 90,537 12,831 17,111
Cash, deposits and bank balances 24 717,751 488,966 1,219 5,231
3,095,295 4,189,798 118,403 523,659
Non-current asset classified as held for sale 25 295,499 – – –
3,390,794 4,189,798 118,403 523,659
Total assets 16,068,750 22,665,109 5,143,874 13,719,999
94
Financial Statements
CONSOLIDATED AND SEPARATE STATEMENTS OF FINANCIAL POSITIONAs at 31 January 2022

Note
Group Company
2022RM’000
2021RM’000
2022RM’000
2021RM’000
EQUITY AND LIABILITIES
Equity attributable to equity holders of the Company Share capital 26 10,872,078 10,872,078 10,872,078 10,872,078
Islamic redeemable convertible preference shares ("RCPS-i") 27 982,713 982,713 982,713 982,713
Shares held under trust 28 (11,587) (11,587) (11,587) (11,587)
Warrants reserve 29 109,110 109,110 109,110 109,110
Other reserves 30 1,791,355 1,618,671 104,934 122,287
Accumulated losses (13,658,696) (4,625,415) (12,130,641) (3,249,562)
84,973 8,945,570 (73,393) 8,825,039
Non-controlling interests (6,987) (8,820) – –
Total equity 77,986 8,936,750 (73,393) 8,825,039
Non-current liabilitiesBorrowings 31 – 7,068,725 – –
Amount due to a subsidiary 32 – – 3,767,595 3,767,595
Derivative liabilities 19 24,644 – – –
Contract liabilities 23 10,584 37,790 – –
Other payable 33 19,082 30,243 – –
Lease liabilities 35 8,745 9,631 – –
Deferred tax liabilities 18 86,089 102,747 – –
149,144 7,249,136 3,767,595 3,767,595
Current liabilitiesAmounts due to subsidiaries 32 – – 1,301,626 1,052,379
Borrowings 31 10,658,021 3,263,457 – –
Trade and other payables 33 3,670,461 2,669,045 103,346 74,986
Contract liabilities 23 817,139 239,572 – –
Provisions 34 609,356 152,251 44,700 –
Lease liabilities 35 7,976 11,123 – –
Provision for tax 78,667 143,775 – –
15,841,620 6,479,223 1,449,672 1,127,365
Total liabilities 15,990,764 13,728,359 5,217,267 4,894,960
Total equity and liabilities 16,068,750 22,665,109 5,143,874 13,719,999
The accompanying accounting policies and explanatory notes form an integral part of the financial statements.
Sap
ura
En
erg
y B
erh
ad
An
nu
al R
ep
ort
20
22
95
Financial Statements

<-------------------------- Attributable to the owners of the Parent -------------------------->
Non-controlling
interestsRM’000
Totalequity
RM’000
<----------------------- Non-distributable -----------------------> DistributableTotal equityattributable
to ownersof theParent
RM’000
Sharecapital
RM’000RCPS-i
RM’000
Sharesheld
undertrust
RM’000
WarrantsreserveRM’000
OtherreservesRM’000
Accumulatedlosses
RM’000
At 1 February 2021 10,872,078 982,713 (11,587) 109,110 1,618,671 (4,625,415) 8,945,570 (8,820) 8,936,750Total comprehensive income/
(loss) – – – – 190,037 (9,050,634) (8,860,597) 1,833 (8,858,764)
10,872,078 982,713 (11,587) 109,110 1,808,708 (13,676,049) 84,973 (6,987) 77,986
Transactions with owners:
Lapse of certain ESOS, representing total transaction with owners – – – – (17,353) 17,353 – – –
Total transactions with owners – – – – (17,353) 17,353 – – –
At 31 January 2022 10,872,078 982,713 (11,587) 109,110 1,791,355 (13,658,696) 84,973 (6,987) 77,986
At 1 February 2020 10,872,078 982,713 (11,587) 109,110 1,703,428 (4,473,221) 9,182,521 (7,853) 9,174,668
Total comprehensive loss – – – – (76,081) (160,870) (236,951) (967) (237,918)
10,872,078 982,713 (11,587) 109,110 1,627,347 (4,634,091) 8,945,570 (8,820) 8,936,750
Transactions with owners:
Lapse of certain ESOS, representing total transaction with owners – – – – (8,676) 8,676 – – –
Total transactions with owners – – – – (8,676) 8,676 – – –
At 31 January 2021 10,872,078 982,713 (11,587) 109,110 1,618,671 (4,625,415) 8,945,570 (8,820) 8,936,750
The accompanying accounting policies and explanatory notes form an integral part of the financial statements.
96
Financial Statements
CONSOLIDATED STATEMENT OF CHANGES IN EQUITYFor the financial year ended 31 January 2022

<-------------------------- Non-distributable --------------------------> Distributable
Sharecapital
RM’000RCPS-i
RM’000
Sharesheld under
trustRM’000
WarrantsreserveRM’000
OtherreservesRM’000
Accumulatedlosses
RM’000
Totalequity
RM’000
At 1 February 2021 10,872,078 982,713 (11,587) 109,110 122,287 (3,249,562) 8,825,039Total comprehensive loss – – – – – (8,898,432) (8,898,432)
10,872,078 982,713 (11,587) 109,110 122,287 (12,147,994) (73,393)
Transactions with owners:
Lapse of certain ESOS, representing total transaction with owners – – – – (17,353) 17,353 –
Total transactions with owners – – – – (17,353) 17,353 –
At 31 January 2022 10,872,078 982,713 (11,587) 109,110 104,934 (12,130,641) (73,393)
At 1 February 2020 10,872,078 982,713 (11,587) 109,110 130,963 (3,034,670) 9,048,607
Total comprehensive loss – – – – – (223,568) (223,568)
10,872,078 982,713 (11,587) 109,110 130,963 (3,258,238) 8,825,039
Transactions with owners:Lapse of certain ESOS,
representing total transaction with owners – – – – (8,676) 8,676 –
Total transactions with owners – – – – (8,676) 8,676 –
At 31 January 2021 10,872,078 982,713 (11,587) 109,110 122,287 (3,249,562) 8,825,039
The accompanying accounting policies and explanatory notes form an integral part of the financial statements.
Sap
ura
En
erg
y B
erh
ad
An
nu
al R
ep
ort
20
22
97
Financial Statements
COMPANY STATEMENT OF CHANGES IN EQUITYFor the financial year ended 31 January 2022

2022RM’000
2021RM’000
CASH FLOWS FROM OPERATING ACTIVITIES
Loss before taxation (8,931,853) (31,725)
Adjustments for:
Amortisation of intangible assets (Note 14) 2,711 3,092
Depreciation of property, plant and equipment (Note 13) 519,909 540,437
Net gain on disposal of property, plant and equipment (6,953) (287)
Share of loss/(profit) from associates and joint ventures 19,941 (158,827)
Provision for impairment on:
– Goodwill (Note 6) 3,289,934 –
– Property, plant and equipment (Note 6) 2,315,787 –
Restructuring expenses (Note 9) – 33,658
Inventories written down (Note 20) 38,937 80
Reversal of provision for inventory obsolescence – (2,299)
Property, plant and equipment written off 12,238 454
Net additional income from previous disposal of 50% equity stake in a former subsidiary (Note 5) – (50,055)
Net unrealised foreign exchange loss (Note 5 and 8) 20,733 6,217
Finance costs (Note 7) 527,865 492,364
Interest income (Note 5) (20,656) (35,659)
Provision for expected credit loss (Note 22) 50,980 38,690
Provision for a contract asset (Note 23) 49,819Net provisions (Note 34) 457,105 (196,003)
Net gain on disposal of an associate and a joint venture (Note 5) (3,579) –
(1,657,082) 640,137
Increase in inventories (35,293) (36,917)
Decrease/(increase) in trade and other receivables 1,141,338 (280,624)
Increase/(decrease) in trade and other payables 1,160,759 (30,341)
Changes in balances with joint ventures and associates (5,213) (145,661)
Cash generated from operating activities 604,509 146,594
Taxes (paid)/refunded (100,569) 18,189
Net cash generated from operating activities 503,940 164,783
98
Financial Statements
CONSOLIDATED STATEMENT OF CASH FLOWSFor the financial year ended 31 January 2022

2022RM’000
2021RM’000
CASH FLOWS FROM INVESTING ACTIVITIES
Purchase of property, plant and equipment (Note 13) (154,447) (164,151)
Proceeds from disposal of property, plant and equipment 20,594 2,006
Purchase of intangible asset (Note 14) (104) (151)
Repayment of advances from a joint venture 44,467 23,532
Net additional income from previous disposal of 50% equity stake in a former subsidiary (Note 5) – 50,055
Interest received 5,930 11,990
Dividends received from a joint venture 16,119 6,364
Proceeds for disposal of an associate and a joint venture 6,397 –
Net cash used in investing activities (61,044) (70,355)
CASH FLOWS FROM FINANCING ACTIVITIES
Net drawdown of revolving credit, trade financing, term loans, Islamic Facility and Sukuk Programme (Note 31(c)) 235,965 71,479
Repayment of lease liabilities (Note 35) (26,817) (14,682)
Finance costs paid (425,316) (422,414)
(Placement)/withdrawal of cash pledged with bank (restricted) (145,030) 37,969
Payment for settlement of derivative assets – (2,550)
Net cash used in financing activities (361,198) (330,198)
Net decrease in cash and cash equivalents 81,698 (235,770)
Effects of exchange rate changes 2,057 (9,669)
Cash and cash equivalents at beginning of the year 358,459 603,898
Cash and cash equivalents at end of the year 442,214 358,459
Cash and cash equivalents comprise:Cash, deposits and bank balances (Note 24) 717,751 488,966
Less: Cash pledged with bank (restricted) (275,537) (130,507)
Cash and cash equivalents 442,214 358,459
The accompanying accounting policies and explanatory notes form an integral part of the financial statements.
Sap
ura
En
erg
y B
erh
ad
An
nu
al R
ep
ort
20
22
99
Financial Statements

2022RM’000
2021RM’000
CASH FLOWS FROM OPERATING ACTIVITIES
Loss before taxation (8,877,065) (226,265)
Adjustments for:
Depreciation of plant and equipment (Note 13) 7,332 11,996
Net additional income from previous disposal of 50% equity stake in a former subsidiary (Note 5) – (50,055)
Net unrealised foreign exchange (gain)/loss (15,558) 9,059
Provision for impairment on investment in subsidiaries, amounts due from subsidiaries and amount due from joint ventures and associates (Note 15, Note 21 and Note 22) 8,602,333 61,714
Restructuring expenses (Note 9) - 5,465
Finance costs (Note 7) 212,470 231,066
Interest income (Note 5) (8,841) (9,111)
Provision (Note 34) 44,700 –
(34,629) 33,869
Net changes in balances with related companies 5,606 (58,481)
Decrease/(increase) in other receivables 3,104 (1,327)
Increase/(decrease) in other payables 28,112 (38,890)
Cash generated from/(used in) operating activities 2,193 (64,829)
Taxes (paid)/refunded (769) 6,929
Net cash generated from/(used in) operating activities 1,424 (57,900)
CASH FLOWS FROM INVESTING ACTIVITIES
Net additional income from previous disposal of 50% equity stake in a former subsidiary (Note 5) – 50,055
Purchase of plant and equipment (Note 13) (5,436) (6,541)
Proceeds from disposal of plant and equipment – 1,484
Net cash (used in)/generated from investing activities (5,436) 44,998
Net decrease in cash and cash equivalents (4,012) (12,902)
Cash, deposits and bank balances at beginning of the year 5,231 18,133
Cash, deposits and bank balances at end of the year (Note 24) 1,219 5,231
The accompanying accounting policies and explanatory notes form an integral part of the financial statements.
100
Financial Statements
COMPANY STATEMENT OF CASH FLOWSFor the financial year ended 31 January 2022

1. CORPORATE INFORMATION
Sapura Energy Berhad (“the Company”) is a public limited liability company, incorporated and domiciled in Malaysia, and is listed on the Main Market of Bursa Malaysia Securities Berhad. The registered office is located at Sapura@Mines, No.7, Jalan Tasik, The Mines Resort City, 43300 Seri Kembangan, Selangor Darul Ehsan.
The principal activities of the Company are that of investment holding and provision of management services to its subsidiaries. The principal activities of the subsidiaries are as described in Note 44.
The financial statements were authorised for issue by the Board of Directors in accordance with a resolution of the directors on 31 May 2022.
2. SUMMARY OF SIGNIFICANT ACCOUNTING POLICIES
2.1 Basis of preparation
The Consolidated Financial Statements of the Group and of the Company have been prepared in accordance with Malaysian Financial Reporting Standards (“MFRS”), International Financial Reporting Standards (“IFRS”) and the requirements of the Companies Act 2016 in Malaysia.
The Consolidated Financial Statements are presented in Ringgit Malaysia (“RM”) and all values are rounded to the nearest thousand (RM’000), except when otherwise indicated.
The Consolidated Financial Statements have been prepared on the historical cost basis unless otherwise disclosed in the financial statements.
The Group and the Company incurred a net loss of RM9,060.9 million and RM8,898.4 million respectively (2021: RM160.3 million and RM223.6 million respectively) during the year ended 31 January 2022 and, as of that date, the Group’s and the Company’s current liabilities exceeded its current assets by RM12,450.8 million billion and RM1,331.3 million respectively (2021: RM2,289.4 million and RM603.7 million respectively).
The Consolidated Financial Statements have been prepared on a going concern basis. In arriving at that conclusion, the Board of Directors have considered the following:
(i) The Group is faced with a severe liquidity constraint mainly due to its financial losses, lack of access to working capital facilities and an unsustainable level of debts, the combined effect of which is threatening the Group and the Company as a going concern.
(ii) A Board Restructuring Taskforce was established to provide oversight and steer the proposed regularisation plan to improve the financial condition of the Group.
(iii) The Company and 22 of its wholly owned subsidiaries (“the Applicants”) had applied for and obtained an order from the High Court of Malaya pursuant to:
(a) Section 366 of the Companies Act 2016 which allows each Applicant to summon meetings with its identified classes of creditors (“scheme creditors”), to consider and approve a proposed Scheme Of Arrangement (“SOA”) and compromise as part of the debt restructuring plan. The SOA being contemplated would include, inter alia, the following:
– Partial relief of debts for outstanding liabilities owing to certain creditors.– Deferment of payments owing to certain creditors, up to a period of 5 years.– Issuance of certain types of convertible instruments as a partial mode of settlement to creditors.
Currently, the proof of debt exercise is on-going and management is in the midst of finalising the proposed SOA where the scheme will only be approved through a majority of 75% of the total value of the scheme creditors present and voting in the court convened meetings (“CCM”). The date of CCM has not been fixed.
Sap
ura
En
erg
y B
erh
ad
An
nu
al R
ep
ort
20
22
101
Financial Statements
NOTES TO THE FINANCIAL STATEMENTS– 31 January 2022

2. SUMMARY OF SIGNIFICANT ACCOUNTING POLICIES (CONT’D.)
2.1 Basis of preparation (cont’d.)
(b) Section 368 of the Companies Act 2016 which grants a restraining order (“RO”) to restrain and stay all legal proceedings (including present, intended and future proceedings) in favour of each applicant for a period of 3 months from 10 March 2022. In addition, the Group has entered into separate contractual arrangements with the lenders (“standstill arrangements”) for inter alia, a standstill on claims. The RO and the standstill arrangements will expire on 10 June 2022 and 6 June 2022 respectively and an application will be made to the High Court of Malaya and the lenders respectively for extensions of time.
(iv) Financial and legal advisors have been appointed to develop, negotiate and implement a debt restructuring scheme to attain a sustainable level of debt for the Group. This includes amongst others, securing new sources of funding to finance existing and future business operations. The Group has recently secured additional sources of funds amounting to RM300 million for its operational needs.
(v) Restructuring Sapura Energy business through a Reset Plan to divest non-core businesses and assets, improve bidding and project delivery capabilities, continue to secure contracts with acceptable margins, and implementing a robust financial framework to ensure financial discipline.
Premised on the above, the Board expects that the extensions on the RO and standstill arrangements will be obtained and a mutually beneficial SOA is likely to be agreed with the scheme creditors by achieving majority support in the CCM within the stipulated timeframe, on the basis that the Group is able to offer higher recovery under the proposed SOA as compared to the recovery under liquidation, and that the Group has sufficient funds to sustain its operations until such a scheme is concluded.
Accordingly, whilst the above conditions indicate the existence of material uncertainties which may cast significant doubt about the ability of the Group and of the Company to continue as a going concern, the Board is of the opinion that the going concern basis used in the preparation of financial statements is appropriate and no adjustments was necessary to be made to the financial statements relating to the recoverability and classification of the carrying amount of assets or the amount and classification of liabilities. Should the going concern basis for the preparation of the financial statements be no longer appropriate, adjustments will have to be made to state the assets at their realisable values and to provide for further liabilities which may arise.
2.2 Changes in accounting policies
The accounting policies adopted by the Group and the Company are consistent with those of the previous financial year except as follows:
On 1 February 2021, the Group and the Company adopted the following new and amended MFRSs:
Description
Effective forannual periods
beginningon or after
Amendments to MFRS 9, MFRS 139, MFRS 7, MFRS 4 and MFRS 16: Interest Rate Benchmark Reform – Phase 2 1 January 2021
Adoption of the above amended standards did not have material effect on the financial performance or position of the Group and of the Company.
102
Financial Statements
NOTES TO THE FINANCIAL STATEMENTS– 31 January 2022

2. SUMMARY OF SIGNIFICANT ACCOUNTING POLICIES (CONT’D.)
2.3 Standards issued but not yet effective
The standards and interpretations that are issued but not yet effective up to the date of issuance of the Group’s and the Company’s financial statements are disclosed below. The Group and the Company intend to adopt these standards, if applicable, when they become effective.
Description
Effective forannual periods
beginningon or after
Amendment to MFRS 16, COVID-19-Related Rent Concessions beyond 30 June 2021 1 April 2021
Annual Improvement to MFRSs 2018 – 2020 Cycle – MFRS 1 First-time Adoption of Malaysian Financial Reporting Standards (Subsidiary as a first-time adopter) 1 January 2022
Amendments to MFRS 3: Business Combinations (Reference to the Conceptual Framework) 1 January 2022
Annual Improvements to MFRS Standards 2018-2020 Cycle – MFRS 9 Financial Instruments (Fees in the ‘10 percent’ Test for Derecognition of Financial Liabilities) 1 January 2022
Amendments to MFRS 116: Property, Plant and Equipment (Proceeds before Intended Use) 1 January 2022
Amendments to MFRS 137: Provisions, Contingent Liabilities and Contingent Assets – Onerous Contracts (Cost of Fulfilling a Contract) 1 January 2022
Annual Improvements to MFRS Standards 2018-2020 Cycle – MFRS 141 Agriculture (Taxation in Fair Value Measurements) 1 January 2022
MFRS 17: Insurance Contracts 1 January 2023
Amendments to MFRS 101: Presentation of Financial Statements (Classification of liabilities as Current or Non-current) 1 January 2023
Amendments to MFRS 101: Presentation of Financial Statements (Disclosure of Accounting Policies) 1 January 2023
Amendments to MFRS 108: Accounting Policies, Changes in Accounting Estimates and Errors (Definition of Accounting Estimates) 1 January 2023
Amendments to MFRS 112: Income Taxes (Deferred Tax related to Assets and Liabilities arising from a Single Transaction) 1 January 2023
Amendments to MFRS 17: Insurance Contracts (Initial Application of MFRS 17 and MFRS 9 Comparative Information) 1 January 2023
Amendments to MFRS 10 and MFRS 128: Investments in Associates and Joint Venture (Sale or Contribution of Assets between an Investor and its Associate or Joint Venture) Deferred
The adoption of the above standards and interpretations are not expected to have material impact on the financial statements in the period of application.
Sap
ura
En
erg
y B
erh
ad
An
nu
al R
ep
ort
20
22
103
Financial Statements

2. SUMMARY OF SIGNIFICANT ACCOUNTING POLICIES (CONT’D.)
2.4 Basis of consolidation
The consolidated financial statements comprise the financial statements of the Company and its subsidiaries as at the reporting date. The financial statements of the subsidiaries used in the preparation of the consolidated financial statements are prepared for the same reporting date as the Company. Consistent accounting policies are applied to like transactions and events in similar circumstances.
The Company controls an investee if and only if the Company has all the following:
(i) Power over the investee (i.e., existing rights that give it the current ability to direct the relevant activities of the investee);
(ii) Exposure, or rights, to variable returns from its investment with the investee; and
(iii) The ability to use its power over the investee to affect its returns.
When the Company has less than a majority of the voting rights of an investee, the Company considers the following in assessing whether or not the Company’s voting rights in an investee are sufficient to give it power over the investee:
(i) The size of the Company’s holding of voting rights relative to the size and dispersion of holdings of the other vote holders;
(ii) Potential voting rights held by the Company, other vote holders or other parties;
(iii) Rights arising from other contractual arrangements; and
(iv) Any additional facts and circumstances that indicate that the Company has, or does not have, the current ability to direct the relevant activities at the time that decisions need to be made, including voting patterns at previous shareholders’ meetings.
Subsidiaries are consolidated when the Company obtains control over the subsidiary and ceases when the Company loses control of the subsidiary. All intra-group balances, income and expenses and unrealised gains and losses resulting from intra-group transactions are eliminated in full.
Losses within a subsidiary are attributed to the non-controlling interests even if that results in a deficit balance.
Changes in the Group’s ownership interests in subsidiaries that do not result in the Group losing control over the subsidiaries are accounted for as equity transactions. The carrying amounts of the Group’s interest and the non-controlling interests are adjusted to reflect the changes in their relative interests in the subsidiaries. The resulting difference is recognised directly in equity and attributed to owners of the Company.
When the Group loses control of a subsidiary, a gain or loss calculated as the difference between:
(i) The aggregate of the fair value of the consideration received and the fair value of any retained interest; and
(ii) The previous carrying amount of the assets and liabilities of the subsidiary and any non-controlling interests, are recognised in statement of profit or loss.
The subsidiary’s cumulative gain or loss which has been recognised in other comprehensive income (“OCI”) and accumulated in equity are reclassified to statement of profit or loss or where applicable, transferred directly to retained profit. The fair value of any investment retained in the former subsidiary at the date control is lost is regarded as the cost on initial recognition of an investment.
104
Financial Statements
NOTES TO THE FINANCIAL STATEMENTS– 31 January 2022

2. SUMMARY OF SIGNIFICANT ACCOUNTING POLICIES (CONT’D.)
2.4 Basis of consolidation (cont’d.)
Business Combinations
Acquisitions of subsidiaries are accounted for using the acquisition method. The cost of an acquisition is measured as the aggregate of the consideration transferred, measured at acquisition date fair value and the amount of any non-controlling interests in the acquiree. The Group elects on a transaction-by-transaction basis whether to measure the non-controlling interests in the acquiree either at fair value or at the proportionate share of the acquiree’s identifiable net assets. Transaction costs incurred are expensed and included in administrative expenses.
Business combinations under common control are accounted for using the pooling of interests method, where the results of entities or businesses under common control are accounted for as if the combination had been effected throughout the current and previous financial periods. The assets, liabilities and reserves of these entities are recorded at their pre-combination carrying amounts or existing carrying amounts are accounted for from the perspective of the common shareholder. No adjustments are made to reflect fair values, or recognise any new assets or liabilities, at the date of the combination that would otherwise be done under the acquisition method. No new goodwill is recognised as a result of the combination. Any difference between the consideration paid/transferred and the equity acquired is reflected within equity as reserve on acquisition arising from common control.
Any contingent consideration to be transferred by the acquirer will be recognised at fair value at the acquisition date. Subsequent changes in the fair value of the contingent consideration which is deemed to be an asset or liability, will be recognised in accordance with MFRS 9 in statement of profit or loss. If the contingent consideration is classified as equity, it will not be remeasured. Subsequent settlement is accounted for within equity. In instances where the contingent consideration does not fall within the scope of MFRS 9, it is measured in accordance with the appropriate MFRS.
When the Group acquires a business, it assesses the financial assets and liabilities assumed for appropriate classification and designation in accordance with the contractual terms, economic circumstances and pertinent conditions as at acquisition date. This includes the separation of embedded derivatives in host contracts by the acquiree.
If the business combination is achieved in stages, the acquisition date fair value of the acquirer’s previously held equity interest in the acquiree is remeasured to fair value at the acquisition date through profit or loss.
Goodwill is initially measured at cost, being the excess of the aggregate of the consideration transferred and the amount recognised for non-controlling interests over the net identifiable assets acquired and liabilities assumed. If the fair value of the net assets acquired is in excess of the aggregate consideration transferred, the Group re-assesses whether it has correctly identified all of the assets acquired and all of the liabilities assumed and reviews the procedures used to measure the amounts to be recognised at the acquisition date. If the reassessment still results in an excess of the fair value of net assets acquired over the aggregate consideration transferred, then the gain is recognised in the profit or loss.
2.5 Subsidiaries
In the Company’s separate financial statements, investments in subsidiaries are accounted for at cost less impairment losses. The method of assessing impairment of the investment in subsidiary companies is as disclosed in Note 2.12.
On disposal of such investments, the difference between net disposal proceeds and their carrying amounts is included in the profit or loss.
Sap
ura
En
erg
y B
erh
ad
An
nu
al R
ep
ort
20
22
105
Financial Statements

2. SUMMARY OF SIGNIFICANT ACCOUNTING POLICIES (CONT’D.)
2.6 Investments in associates and joint ventures
An associate is an entity in which the Group has significant influence. Significant influence is the power to participate in the financial and operating policy decisions of the investee, but is not control or joint control over those policies.
A joint venture is a joint arrangement whereby the parties that have joint control of the arrangement have rights to the net assets of the joint venture. Joint control is the contractually agreed sharing of control of an arrangement, which exists only when decisions about the relevant activities require unanimous consent of the parties sharing control.
On acquisition of an investment in associate or joint venture, any excess of the cost of investment over the Group’s share of the net fair value of the identifiable assets and liabilities of the investee is recognised as goodwill and included in the carrying amount of the investment. Any excess of the Group’s share of the net fair value of the identifiable assets and liabilities of the investee over the cost of investment is excluded from the carrying amount of the investment and is instead included as income in the determination of the Group’s share of associate’s or joint venture’s profit or loss for the period in which the investment is acquired.
An associate or a joint venture is equity accounted for from the date on which the investee becomes an associate or a joint venture.
Under the equity method, the investment in an associate or a joint venture is initially recognised at cost. The carrying amount is adjusted to recognise changes in the Group’s share of net assets of the associate or joint venture since the acquisition date. Goodwill relating to the associate or joint venture is included in the carrying amount of the investment and is not tested for impairment separately.
The statement of profit or loss reflects the Group’s share of the results of operations of the associate or joint venture. Any change in OCI of those investees is presented as part of the Group’s OCI. In addition, when there has been a change recognised directly in the equity of the associate or joint venture, the Group recognises its share of any changes, when applicable, in the statement of changes in equity. Unrealised gains and losses resulting from transactions between the Group and the associate or joint venture are eliminated to the extent of the interest in the associate or joint venture.
The aggregate of the Group’s share of profit or loss of an associate or joint venture is shown on the face of the statement of profit or loss outside operating profit and represents the profit or loss after tax and non-controlling interests in the subsidiaries of the associate or joint venture. When the Group’s share of losses in an associate or joint venture equals or exceeds its interest in the associate or joint venture, the Group does not recognise further losses, unless it has incurred obligations or made payments on behalf of the associate or joint venture.
The financial statements of the associates and joint ventures are prepared for the same reporting date as the Group. Where necessary, adjustments are made to bring the accounting policies in line with those of the Group.
After application of the equity method, the Group applies MFRS 9: Financial Instruments to determine whether it is necessary to recognise any additional impairment loss with respect to its net investment in the associate or joint venture. When necessary, the entire carrying amount of the investment is tested for impairment in accordance with MFRS 136: Impairment of Assets as a single asset, by comparing its recoverable amount (higher of value-in-use or fair value less costs of disposal) with its carrying amount. Any impairment loss is recognised in the statement of profit or loss. Reversal of an impairment loss is recognised to the extent that the recoverable amount of the investment subsequently increases.
When the Group ceases to have significant influence over an associate, any retained interest in the former associate is recognised at fair value on the date when significant influence is lost. Any gain or loss arising from the loss of significant influence over an associate is recognised in the profit or loss.
106
Financial Statements
NOTES TO THE FINANCIAL STATEMENTS– 31 January 2022

2. SUMMARY OF SIGNIFICANT ACCOUNTING POLICIES (CONT’D.)
2.7 Investments in joint operations
A joint operation is a joint arrangement whereby the parties that have joint control of the arrangement have rights to the assets, and obligations for the liabilities, relating to the arrangement. Joint control is the contractually agreed sharing of control of an arrangement, which exists only when decisions about the relevant activities require the unanimous consent of the parties sharing control.
The Group accounts for the assets, liabilities, revenues and expenses relating to its interest in a joint operation in accordance with the MFRS applicable to the particular assets, liabilities, revenues and expenses.
2.8 Transaction with non-controlling interests
Non-controlling interests represent the equity in subsidiaries not attributable, directly or indirectly, to owners of the Company, and is presented separately in the consolidated statement of comprehensive income and within equity in the consolidated statement of financial position, separately from equity attributable to owners of the Company. Total comprehensive income is attributed to the non-controlling interests based on their respective interests in a subsidiary, even if this results in the non-controlling interests having a deficit balance.
2.9 Foreign currency
(a) Functional and presentation currency
Functional currency is the currency of the primary economic environment in which an entity operates.
The financial statements of each entity within the Group are measured using their respective functional currency. The consolidated financial statements are presented in RM, which is also the Company’s functional currency.
(b) Transactions and balances in foreign currencies
Transactions in currencies other than the functional currency (“foreign currencies”) are recognised at their respective functional currency spot rates on the date of the transaction. Monetary assets and liabilities denominated in foreign currencies are translated at the functional currency spot rates of exchange at the reporting date. Non-monetary items which are measured at historical costs denominated in foreign currencies are translated using the exchange rates as at the dates of the initial transactions. Non-monetary items which are measured at fair values denominated in foreign currencies are translated using the exchange rates at the date when the fair value was determined.
Exchange differences arising on the settlement of monetary items or on translating monetary items at the reporting date are recognised in statement of profit or loss except for exchange differences arising on monetary items that form part of the Group’s net investment in foreign operations, which are recognised initially in OCI and accumulated under foreign currency translation reserve in equity. The foreign currency translation reserve is reclassified from equity to statement of profit or loss of the Group on disposal of the foreign operation.
When an entity’s ownership interest in an associate or a joint venture is reduced, but the entity continues to apply the equity method, the entity reclassifies to profit or loss the proportion of gain or loss that has been previously recognised in OCI relating to that reduction in ownership interest if that gain or loss would be required to be reclassified to profit and loss upon the disposal of the related assets or liabilities.
Exchange differences arising on the translation of non-monetary items carried at fair value are included in profit or loss for the period except for the differences arising on the translation of non-monetary items in respect of which gains and losses are recognised directly in equity. Exchange differences arising from such non-monetary items are also recognised directly in equity.
Sap
ura
En
erg
y B
erh
ad
An
nu
al R
ep
ort
20
22
107
Financial Statements

2. SUMMARY OF SIGNIFICANT ACCOUNTING POLICIES (CONT’D.)
2.9 Foreign currency (cont’d.)
(c) Translation of foreign operations
For consolidation purposes, all assets and liabilities of foreign operations that have a functional currency other than RM (including goodwill and fair value adjustments arising from the acquisition of the foreign operations) are translated at the exchange rates ruling at the reporting date. Income and expenses are translated at exchange rates at the dates of the transactions. The exchange differences arising on the translation are recognised in OCI. On disposal of a foreign operation, the cumulative amount recognised in OCI and accumulated in equity under foreign currency translation reserve relating to that particular foreign operation is recognised in the profit or loss.
Goodwill and fair value adjustments arising on the acquisition of foreign operations are treated as assets and liabilities of the foreign operations and are recorded in the functional currency of the foreign operations and translated at the closing rate at the reporting date.
2.10 Property, plant and equipment
Property, plant and equipment are initially recorded at cost. The cost of an item of property, plant and equipment is recognised as an asset if, and only if, it is probable that future economic benefits associated with the item will flow to the Group and the Company and the cost of the item can be measured reliably.
Subsequent to recognition, property, plant and equipment are measured at cost less accumulated depreciation and accumulated impairment losses. When significant parts of property, plant and equipment are required to be replaced in intervals, the Group and the Company recognise such parts as individual assets with specific useful lives and depreciation, respectively. Likewise, when a major inspection is performed, its cost is recognised in the carrying amount of the property, plant and equipment as a replacement if the recognition criteria are satisfied. All other repair and maintenance costs are recognised in statement of profit or loss as incurred.
Dry docking costs which enhance the useful lives of the assets are capitalised when incurred and the remaining carrying amount of the cost during the previous dry docking, if any, is derecognised. The costs capitalised is amortised over a period of 60 months or the period until the next dry docking date, whichever is shorter.
Depreciation is computed on a straight-line basis over the estimated useful life of the assets as follows:
Leasehold land 1% – 2% Buildings and structures 2% Vessels and related dry docking, remotely operated vehicles (“ROVs”) and saturation diving system (“SAT system”) 4% – 20% Tender assisted drilling rigs and related dry docking 3% – 20% Plant and machinery, tools and implements 10% – 50% Equipment, furniture and motor vehicles 10% – 50% Right-of-use assets Depends on lease term
Freehold land has an unlimited useful life and therefore is not depreciated.
Assets under construction included in property, plant and equipment are not depreciated as these assets are not yet available for use.
The carrying values of property, plant and equipment are reviewed for impairment when events or changes in circumstances indicate that the carrying value may not be recoverable.
The residual value, useful life and depreciation method are reviewed at each financial year-end, and adjusted prospectively, if appropriate.
Property, plant and equipment are derecognised upon disposal or when no future economic benefits are expected from its use or disposal. Any gain or loss on derecognition of the asset (difference between the net disposal proceeds and the carrying amount of the asset) is included in the statement of profit or loss in the year the asset is derecognised.
108
Financial Statements
NOTES TO THE FINANCIAL STATEMENTS– 31 January 2022

2. SUMMARY OF SIGNIFICANT ACCOUNTING POLICIES (CONT’D.)
2.10 Property, plant and equipment (cont’d.)
Right-of-use (“ROU”) assets
ROU assets are measured at cost, less any accumulated depreciation and impairment losses, and adjusted for any remeasurement of lease liabilities.
The cost of ROU assets includes the following:
– The amount of lease liabilities recognised;– Any initial direct costs; and– Any lease payments made at or before the commencement date less any lease incentive received.
The Group presents ROU assets as part of property, plant and equipment.
The ROU assets are generally depreciated over the shorter of the asset’s useful life and the lease term on a straight-line basis.
2.11 Intangible assets
(a) Goodwill
Goodwill is initially measured at cost. Following initial recognition, goodwill is measured at cost less accumulated impairment losses.
For the purpose of impairment testing, goodwill acquired is allocated, from the acquisition date, to each of the Group’s Cash Generating Unit (“CGU”) that are expected to benefit from the synergies of the combination.
The CGU to which goodwill has been allocated is tested for impairment annually and whenever there is an indication that the CGU may be impaired, by comparing the carrying amount of the CGU, including the allocated goodwill, with the recoverable amount of the CGU. Where the recoverable amount of the CGU is less than the carrying amount, an impairment loss is recognised in the profit or loss. Impairment losses recognised for goodwill are not reversed in subsequent periods.
Where goodwill forms part of a CGU and part of the operation within that CGU is disposed of, the goodwill associated with the operation disposed of is included in the carrying amount of the operation when determining the gain or loss on disposal of the operation. Goodwill disposed off in this circumstance is measured based on the relative fair values of the operations disposed off and the portion of the CGU retained.
(b) Other intangible assets
Intangible assets acquired separately are measured initially at cost. The cost of intangible assets acquired in a business combination is their fair value as at the date of acquisition. Following initial acquisition, intangible assets are measured at cost less any accumulated amortisation and accumulated impairment losses.
Intangible assets with finite useful lives are amortised over the estimated useful lives and assessed for impairment whenever there is an indication that the intangible asset may be impaired. The amortisation period and the amortisation method are reviewed at least at each financial year-end. Changes in the expected useful life or the expected pattern of consumption of future economic benefits embodied in the asset is accounted for by changing the amortisation period or method, as appropriate, and are treated as changes in accounting estimates. The amortisation expense on intangible assets with finite lives is recognised in profit or loss.
Gains or losses arising from derecognition of an intangible asset are measured as the difference between the net disposal proceeds and the carrying amount of the asset and are recognised in profit or loss when the asset is derecognised.
Amortisation is computed on a straight-line basis over the estimated useful life of the assets as follows:
Software development costs 3 years
Other development cost is amortised over the period of expected sales from the related projects on a straight-line basis.
Sap
ura
En
erg
y B
erh
ad
An
nu
al R
ep
ort
20
22
109
Financial Statements

2. SUMMARY OF SIGNIFICANT ACCOUNTING POLICIES (CONT’D.)
2.12 Impairment of non-financial assets
The Group assesses at each reporting date whether there is an indication that an asset that has a finite economic useful life may be impaired. If any such indication exists, or when an annual impairment assessment for an asset is required, the Group makes an estimate of the asset’s recoverable amount.
An asset’s recoverable amount is the higher of an asset’s fair value less costs of disposal or its value-in-use. For the purpose of assessing impairment, assets are grouped at the lowest levels for which there are separately identifiable CGU.
In assessing value-in-use, the estimated future cash flows expected to be generated by the asset are discounted to their present value using a pre-tax discount rate that reflects current market assessments of the time value of money and the risks specific to the asset. Where the carrying amount of an asset exceeds its recoverable amount, the asset is written down to its recoverable amount. Impairment losses recognised in respect of a CGU or groups of CGUs are allocated first to reduce the carrying amount of any goodwill allocated to those units or groups of units and then, to reduce the carrying amount of the other assets in the unit or groups of units on a pro-rata basis.
Impairment losses are recognised in statement of profit or loss in expense categories consistent with the function of the impaired asset.
An assessment is made at each reporting date as to whether there is any indication that previously recognised impairment losses may no longer exist or may have decreased. A previously recognised impairment loss is reversed only if there has been a change in the estimates used to determine the asset’s recoverable amount since the last impairment loss was recognised. The reversal is limited so that the carrying amount of the asset does not exceed its recoverable amount, nor exceed the carrying amount that would have been determined, net of depreciation, had no impairment loss been recognised previously. Such reversal is recognised in the statement of profit or loss. Impairment loss recognised on goodwill is not reversed in a subsequent period.
2.13 Financial assets
Financial assets are recognised in the statements of financial position when, and only when, the Group and the Company become a party to the contractual provisions of the financial instrument.
Initial recognition and measurement
The classification of financial assets at initial recognition depends on the financial asset’s contractual cash flow characteristics and the Group’s and the Company’s business model for managing them. With the exception of trade receivables that do not contain a significant financing component or for which the Group and the Company have applied the practical expedient, the Group and the Company initially measure a financial asset at its fair value plus, in the case of a financial asset not at fair value through profit or loss, transaction costs. Trade receivables that do not contain a significant financing component or for which the Group and the Company have applied the practical expedient are measured at the transaction price determined under MFRS 15. Refer to the accounting policies in revenue from contracts with customers in Note 2.22 (i).
In order for a financial asset to be classified and measured at amortised cost or fair value through OCI, it needs to give rise to cash flows that are ‘solely payments of principal and interest’ (“SPPI”) on the principal amount outstanding. This assessment is referred to as the SPPI test and is performed at an instrument level.
The Group’s and the Company’s business model for managing financial assets refers to how it manages its financial assets in order to generate cash flows. The business model determines whether cash flows will result from collecting contractual cash flows, selling the financial assets, or both.
Purchases or sales of financial assets that require delivery of assets within a time frame established by regulation or convention in the market place (regular way trades) are recognised on the trade date, i.e., the date that the Group and the Company commit to purchase or sell the asset.
110
Financial Statements
NOTES TO THE FINANCIAL STATEMENTS– 31 January 2022

2. SUMMARY OF SIGNIFICANT ACCOUNTING POLICIES (CONT’D.)
2.13 Financial assets (cont’d.)
Subsequent measurement
For purposes of subsequent measurement, financial assets are classified in the following categories:
– Financial assets at amortised cost (debt instruments) – Financial assets at fair value through OCI with recycling of cumulative gains and losses (debt instruments) – Financial assets designated at fair value through OCI with no recycling of cumulative gains and losses upon
derecognition (equity instruments) – Financial assets at fair value through profit or loss
(a) Financial assets at amortised cost (debt instruments)
The Group and the Company measure financial assets at amortised cost if both of the following conditions are met:
(i) The financial asset is held within a business model with the objective to hold financial assets in order to collect contractual cash flows; and
(ii) The contractual terms of the financial asset give rise on specified dates to cash flows that are SPPI on the principal amount outstanding.
Financial assets at amortised cost are subsequently measured using the effective interest (“EIR”) method and are subject to impairment. Gains and losses are recognised in profit or loss when the asset is derecognised, modified or impaired.
The Group’s and the Company’s financial assets at amortised cost includes trade and other receivables (excluding prepayment), amounts due from subsidiaries and cash and cash equivalents.
(b) Financial assets at fair value through OCI (debt instruments)
For debt instruments at fair value through OCI, interest income, foreign exchange revaluation and impairment losses or reversals are recognised in the statement of profit or loss and computed in the same manner as for financial assets measured at amortised cost. The remaining fair value changes are recognised in OCI. Upon derecognition, the cumulative fair value change recognised in OCI is recycled to profit or loss.
(c) Financial assets designated at fair value through OCI (equity instruments)
Upon initial recognition, the Group and the Company can elect to classify irrevocably its equity investments as equity instruments designated at fair value through OCI when they meet the definition of equity under MFRS 132 Financial Instruments: Presentation and are not held for trading. The classification is determined on an instrument-by-instrument basis.
Gains and losses on these financial assets are never recycled to profit or loss. Dividends are recognised as other income in the statement of profit or loss when the right of payment has been established, except when the Group and the Company benefit from such proceeds as a recovery of part of the cost of the financial asset, in which case, such gains are recorded in OCI. Equity instruments designated at fair value through OCI are not subject to impairment assessment.
(d) Financial assets at fair value through profit or loss
Financial assets at fair value through profit or loss include financial assets held for trading, financial assets designated upon initial recognition at fair value through profit or loss, or financial assets mandatorily required to be measured at fair value. Financial assets are classified as held for trading if they are acquired for the purpose of selling or repurchasing in the near term. Derivatives, including separated embedded derivatives, are also classified as held for trading unless they are designated as effective hedging instruments. Financial assets with cash flows that are not SPPI are classified and measured at fair value through profit or loss, irrespective of the business model. Notwithstanding the criteria for debt instruments to be classified at amortised cost or at fair value through OCI, as described above, debt instruments may be designated at fair value through profit or loss on initial recognition if doing so eliminates, or significantly reduces, an accounting mismatch.
Sap
ura
En
erg
y B
erh
ad
An
nu
al R
ep
ort
20
22
111
Financial Statements

2. SUMMARY OF SIGNIFICANT ACCOUNTING POLICIES (CONT’D.)
2.13 Financial assets (cont’d.)
(d) Financial assets at fair value through profit or loss (cont’d.)
Financial assets at fair value through profit or loss are carried in the statement of financial position at fair value with net changes in fair value recognised in the statement of profit or loss.
This category includes derivative instruments which the Group and the Company had not irrevocably elected to classify at fair value through OCI.
A derivative embedded in a hybrid contract, with a financial liability or non-financial host, is separated from the host and accounted for as a separate derivative if: the economic characteristics and risks are not closely related to the host; a separate instrument with the same terms as the embedded derivative would meet the definition of a derivative; and the hybrid contract is not measured at fair value through profit or loss. Embedded derivatives are measured at fair value with changes in fair value recognised in profit or loss. Reassessment only occurs if there is either a change in the terms of the contract that significantly modifies the cash flows that would otherwise be required or a reclassification of a financial asset out of the fair value through profit or loss category.
Derecognition
A financial asset (or, where applicable, a part of a financial asset or part of a group of similar financial assets) is primarily derecognised (i.e. removed from the Group’s and the Company’s statement of financial position) when:
(a) The rights to receive cash flows from the asset have expired; or
(b) The Group and the Company have transferred their rights to receive cash flows from the asset or has assumed an obligation to pay the received cash flows in full without material delay to a third party under a ‘pass-through’ arrangement, and either:
(i) The Group and the Company have transferred substantially all the risks and rewards of the asset, or
(ii) The Group and the Company have neither transferred nor retained substantially all the risks and rewards of the asset, but has transferred control of the asset.
On derecognition of a financial asset in its entirety, the difference between the carrying amount and the sum of the consideration received and any cumulative gain or loss that had been recognised in OCI for debt instruments is recognised in profit or loss.
Where the Group or the Company has transferred its rights to receive cash flows from an asset or has entered into a pass-through arrangement, it evaluates if, and to what extent, it has retained the risks and rewards of ownership. When it has neither transferred nor retained substantially all of the risks and rewards of the asset, nor transferred control of the asset, the Group or the Company continue to recognise the transferred asset to the extent of its continuing involvement.
Continuing involvement that takes the form of a guarantee over the transferred asset is measured at the lower of the original carrying amount of the asset and the maximum amount of consideration that the Group and the Company could be required to repay.
112
Financial Statements
NOTES TO THE FINANCIAL STATEMENTS– 31 January 2022

2. SUMMARY OF SIGNIFICANT ACCOUNTING POLICIES (CONT’D.)
2.14 Impairment of financial assets
The Group and the Company recognise a provision for expected credit losses (“ECLs”) for all debt instruments not held at fair value through profit or loss. ECLs are based on the difference between the contractual cash flows due in accordance with the contract and all the cash flows that the Group and the Company expect to receive, discounted at an approximation of the original effective interest rate. The expected cash flows will include cash flows from the sale of collateral held or other credit enhancements that are integral to the contractual terms.
ECLs are recognised in two stages. For credit exposures for which there has not been a significant increase in credit risk since initial recognition, ECLs are provided for credit losses that result from default events that are possible within the next 12-months (a 12-month ECL). For those credit exposures for which there has been a significant increase in credit risk since initial recognition, a provision for impairment is required for credit losses expected over the remaining life of the exposure, irrespective of the timing of the default (a lifetime ECL).
For trade receivables, amount due from subsidiaries and contract assets, the Group and the Company apply a simplified approach in calculating ECLs. Therefore, the Group and the Company do not track changes in credit risk, but instead recognises a provision for impairment based on lifetime ECLs at each reporting date. The Group and the Company have established a process to monitor the recoverability of the receivables, based on its historical credit loss experience and adjusted for forward-looking factors specific to the debtors and the economic environment, if any.
The Group and the Company consider whether a financial asset is in default when contractual payments are more than 90 days past due. In certain cases, the Group and the Company may consider a financial asset to be in default when internal or external information indicate that the Group and the Company are unlikely to receive the outstanding contractual amounts in full before taking into account any credit enhancements held by the Group and the Company. A financial asset is written off when there is no reasonable expectation of recovering the contractual cash flows.
2.15 Cash, deposits and bank balances
Cash, deposits and bank balances comprise cash at banks and on hand, short-term deposits with licensed banks, short-term and highly liquid investments that are readily convertible to known amounts of cash and which are subject to an insignificant risk of changes in value.
2.16 Inventories
Inventories are stated at lower of cost and net realisable value.
Cost is determined using the first-in-first-out basis. The cost of inventories includes expenditure incurred in acquiring the inventories and bringing them to their existing location and condition.
Net realisable value is the estimated selling price in the ordinary course of business less the estimated costs of completion and the estimated costs necessary to make the sale.
2.17 Provisions
(a) Onerous contract
An onerous contract is a contract under which the unavoidable costs (i.e. the costs that the Group and the Company cannot avoid because it has the contract) of meeting the obligations under the contract exceed the economic benefits expected to be received under it. The unavoidable costs under a contract reflect the least net cost of exiting from the contract, which is the lower of the cost of fulfilling it and any compensation or penalties arising from failure to fulfil it. The cost of fulfilling a contract comprises the costs that relate directly to the contract (i.e. both incremental costs and an allocation of costs directly related to contract activities).
If the Group and the Company have a contract that is onerous, the present obligation under the contract is recognised and measured as a provision. However, before a separate provision for an onerous contract is established, the Group and the Company recognise any impairment loss that has occurred on assets dedicated to that contract.
Sap
ura
En
erg
y B
erh
ad
An
nu
al R
ep
ort
20
22
113
Financial Statements

2. SUMMARY OF SIGNIFICANT ACCOUNTING POLICIES (CONT’D.)
2.17 Provisions (cont’d.)
(b) Other provisions
Provisions are recognised when the Group has a present obligation (legal or constructive) as a result of a past event, it is probable that an outflow of economic resources will be required to settle the obligation and the amount of the obligation can be estimated reliably.
Provisions are reviewed at each reporting date and adjusted to reflect the current best estimate. If it is no longer probable that an outflow of economic resources will be required to settle the obligation, the provision is reversed. If the effect of the time value of money is material, provisions are discounted using a current pre tax rate that reflects, where appropriate, the risks specific to the liability. When discounting is used, the increase in the provision due to the passage of time is recognised as a finance cost.
2.18 Financial liabilities
Initial recognition and measurement
Financial liabilities are classified, at initial recognition, as financial liabilities at fair value through profit or loss, payables, loans and borrowings.
All financial liabilities are recognised initially at fair value and, in the case of loans and borrowings and payables, net of directly attributable transaction costs.
The Group’s and the Company’s financial liabilities include trade and other payables, lease liabilities, loans and borrowings and amounts due to subsidiaries.
Subsequent measurement
The measurement of financial liabilities depends on their classification, as described below:
(a) Financial liabilities at fair value through profit or loss
Financial liabilities at fair value through profit or loss include financial liabilities held for trading and financial liabilities designated upon initial recognition as at fair value through profit or loss.
Financial liabilities are classified as held for trading if they are incurred for the purpose of repurchasing in the near term. This category also includes derivative financial instruments entered into by the Group and the Company that are not designated as hedging instruments in hedge relationships as defined by MFRS 9. Separated embedded derivatives are also classified as held for trading unless they are designated as effective hedging instruments.
Gains or losses on liabilities held for trading are recognised in profit or loss.
Financial liabilities designated upon initial recognition at fair value through profit or loss are designated at the initial date of recognition, and only if the criteria in MFRS 9 are satisfied. The Group and the Company have not designated any financial liability as at fair value through profit or loss.
(b) Financial liabilities at amortised cost
After initial recognition, the financial liabilities are subsequently measured at amortised cost using the EIR method. Gains and losses are recognised in statement of profit or loss when the liabilities are derecognised as well as through the EIR amortisation process.
Amortised cost is calculated by taking into account any discount or premium on acquisition and fees or costs that are an integral part of the EIR. The EIR amortisation is included as finance costs in the statement of profit or loss.
This category generally applies to interest-bearing borrowings, trade and other payables, and amounts due to subsidiaries.
114
Financial Statements
NOTES TO THE FINANCIAL STATEMENTS– 31 January 2022

2. SUMMARY OF SIGNIFICANT ACCOUNTING POLICIES (CONT’D.)
2.18 Financial liabilities
Subsequent measurement (cont’d.)
(c) Financial guarantee contracts
A financial guarantee contract is a contract that requires the issuer to make specified payments to reimburse the holder for a loss it incurs because a specified debtors fails to make payment when due in accordance with the terms of a debt instrument.
Financial guarantee contracts are recognised initially as a liability at fair value, adjusted for transaction costs that are directly attributable to the issuance of the guarantee. Subsequent to initial recognition, financial guarantee contracts are measured at the higher of the amount of ECL determined in accordance with the policy set out in Note 2.14 and the amount initially recognised less, when appropriate, the cumulative amount of income recognised over the period of the guarantee.
Derecognition
A financial liability is derecognised when the obligation under the liability is discharged or cancelled or expires. On derecognition, the difference between the carrying amounts and the consideration paid is recognised in statement of profit or loss.
When an existing financial liability is replaced by another from the same lender on substantially different terms, or the terms of an existing liability are substantially modified, such an exchange or modification is treated as the derecognition of the original liability and the recognition of a new liability. The difference in the respective carrying amounts is recognised in the statement of profit or loss.
Offsetting of financial instruments
Financial assets and financial liabilities are offset and the net amount is reported in the statement of financial position if there is a currently enforceable legal right to offset the recognised amounts and there is an intention to settle on a net basis, to realise the assets and settle the liabilities simultaneously.
2.19 Borrowing costs
Borrowing costs directly attributable to the acquisition, construction or production of an asset that necessarily takes a substantial period of time to get ready for its intended use or sale are capitalised as part of the cost of the asset. Capitalisation of borrowing costs commences when the Group undertakes activities that are necessary to prepare the asset for its intended use or sale and the expenditures and borrowing costs are incurred. Borrowing costs are capitalised until the assets are substantially completed for their intended use or sale.
All other borrowing costs are recognised in statement of profit or loss in the period they are incurred. Borrowing costs consist of interest and other costs that the Group and the Company incurred in connection with the borrowing of funds.
2.20 Employee benefits
(a) Short term benefit
Wages, salaries and bonuses and social security contributions are recognised as an expense in the year in which the associated services are rendered by employees. Short term accumulating compensated absences such as paid annual leave are recognised when services are rendered by employees that increase their entitlement to future compensated leave. Short term non-accumulating compensated leave such as sick leave are recognised when the absences occur.
Sap
ura
En
erg
y B
erh
ad
An
nu
al R
ep
ort
20
22
115
Financial Statements

2. SUMMARY OF SIGNIFICANT ACCOUNTING POLICIES (CONT’D.)
2.20 Employee benefits (cont’d.)
(b) Defined contribution plans
Defined contribution plans are post-employment benefit plans under which the Group and the Company pay fixed contributions into separate entities or funds and will have no legal or constructive obligation to pay further contributions if any of the funds do not hold sufficient assets to pay all employee benefits relating to employee services in the current and preceding financial years. Such contributions are recognised as an expense in the statement of profit or loss as incurred. As required by law, companies in Malaysia make such contributions to the Employees Provident Fund (“EPF”). Some of the Group’s foreign subsidiaries also make contributions to their respective countries’ statutory pension schemes.
(c) Long Term Incentive Plan
Eligible executive directors and employees of the Group and of the Company receive remuneration in the form of shares as consideration for services rendered, subject to the approval of the BNRC. The cost of these equity-settled share-based payment transactions with employees is measured by reference to the fair value of the shares at the date on which the shares are vested. This cost is recognised in profit or loss over the vesting period. The cumulative expense recognised at each reporting date until the vesting date reflects the extent to which the vesting period has expired.
(d) Termination benefits
Termination benefits are payable when employment is terminated before the normal retirement date or whenever an employee accepts voluntary redundancy in exchange for these benefits. The Group recognises termination benefits when it is demonstrably committed to either terminate the employment of current employees according to a detailed plan without possibility of withdrawal; or providing termination benefits as a result of an offer made to encourage voluntary redundancy.
(e) Executive Share Option Scheme
ESOS, an equity-settled, share-based compensation plan, allows the Company’s eligible executive directors and senior management (“Executives”) to acquire ordinary shares of the Company. The total fair value of share options granted to Executives of the Company is recognised as an employee cost with a corresponding increase in the ESOS reserve within equity.
The equity amount is recognised in the ESOS reserve until the option is exercised, or until the option expires.
When the share options are exercised, the ESOS reserve relating to the exercised options is transferred to retained earnings. When the share options or share awards are lapsed, the ESOS reserve relating to the lapsed share options is transferred to retained earnings.
116
Financial Statements
NOTES TO THE FINANCIAL STATEMENTS– 31 January 2022

2. SUMMARY OF SIGNIFICANT ACCOUNTING POLICIES (CONT’D.)
2.21 Leases
The Group and the Company assess at contract inception whether a contract is, or contains, a lease. That is, if the contract conveys the right to control the use of an identified asset for a period of time in exchange for consideration.
(a) As lessee
The Group and the Company apply a single recognition and measurement approach for all leases, except for short-term leases and leases of low-value assets. The Group recognises lease liabilities to make lease payments and right-of-use assets as disclosed in Note 2.10 representing the right to use the underlying assets.
(i) Lease liabilities
At the commencement date of the lease, the Group recognises lease liabilities measured at the present value of lease payments to be made over the lease term. The lease payments include fixed payments (including in-substance fixed payments) less any lease incentives receivable, variable lease payments that depend on an index or a rate, and amounts expected to be paid under residual value guarantees. The lease payments also include the exercise price of a purchase option reasonably certain to be exercised by the Group and payments of penalties for terminating the lease, if the lease term reflects the Group exercising the option to terminate. Variable lease payments that do not depend on an index or a rate are recognised as expenses (unless they are incurred to produce inventories) in the period in which the event or condition that triggers the payment occurs.
In calculating the present value of lease payments, the Group uses its incremental borrowing rate at the lease commencement date because the interest rate implicit in the lease is not readily determinable. After the commencement date, the amount of lease liabilities is increased to reflect the accretion of interest and reduced for the lease payments made. In addition, the carrying amount of lease liabilities is remeasured if there is a modification, a change in the lease term, a change in the lease payments (e.g. changes to future payments resulting from a change in an index or rate used to determine such lease payments) or a change in the assessment of an option to purchase the underlying asset.
(ii) Short-term leases and leases of low-value assets
The Group and the Company apply the short-term lease recognition exemption to their short-term leases (i.e. those leases that have a lease term of 12 months or less from the commencement date and do not contain a purchase option). It also applies the lease of low-value assets recognition exemption to leases of office equipment that are considered to be low value. Lease payments on short-term leases and leases of low value assets are recognised as expense on a straight-line basis over the lease term.
(b) As lessor
Leases where the Group retains substantially all the risks and rewards of ownership of the asset are classified as operating leases. Initial direct costs incurred in negotiating an operating lease are added to the carrying amount of the leased asset and recognised over the lease term on the same bases as lease income.
When the assets are leased out under an operating lease, the assets are included in the statement of financial position based on the nature of the assets. Lease income is recognised over the term of the lease on a straight-line basis.
Identifying and separating of lease and non-lease components of a contract and allocating contract consideration
For a contract that is, or contains, a lease, an entity shall account for each lease component within the contract as a lease separately from non-lease components of the contract.
When applying MFRS 16, lessors are required to apply of MFRS 15 to allocate the consideration in the contract between the lease and non-lease components on a relative stand-alone selling price basis. In addition, lessors are required to apply MFRS 15 to allocate any subsequent changes in the consideration of the contract between the lease and non-lease components. The stand-alone selling price is the price at which the Group would sell a promised good or service separately to a customer. When stand-alone selling prices are not directly observable, the lessor must estimate the stand-alone selling price.
Sap
ura
En
erg
y B
erh
ad
An
nu
al R
ep
ort
20
22
117
Financial Statements

2. SUMMARY OF SIGNIFICANT ACCOUNTING POLICIES (CONT’D.)
2.22 Revenue
(i) Revenue from contracts with customers
Revenue is measured based on the consideration to which the Group or the Company expects to be entitled in exchange for transferring promised goods or services to a customer.
Revenue is recognised when the Group or the Company satisfies a performance obligation by transferring a promised good or services to the customer, which is when the customer obtains control of the good or service. A performance obligation may be satisfied at a point in time or over time. The amount of revenue recognised is the amount allocated to the satisfied performance obligation.
(a) Construction contracts
The Group’s construction contracts include engineering, procurement, construction, installation and commissioning services (“EPCIC”), transportation and installation (“T&I”), fabrication and hook-up and commissioning works, which may last several years.
The Group determined that contracts of this nature have generally one performance obligation. In these contracts, the final product is highly customised to the specifications of the field and the customer’s requirements as the customised products do not have an alternative use. The Group has an enforceable right to payment plus reasonable profit for performance completed to date.
Therefore, the customer obtains control of the asset over time, and thus revenue is recognised over time using an input measure (i.e., costs incurred to date relative to total estimated costs at completion) to measure progress. Under this method, the extent of progress towards completion is measured based on the ratio of costs incurred to date to the total estimated costs at completion of the performance obligation. Revenues, including estimated fees or profits, are recorded proportionally as costs are incurred.
Contracts are often modified to account for changes in contract specifications and requirements. The Group considers contract modifications to exist when the modification either creates new, or changes the existing, enforceable rights and obligations. Most of the Group’s contract modifications are for goods or services that are not distinct from the existing contract due to the significant integration service provided in the context of the contract and are accounted for as if they were part of that existing contract.
The effect of a contract modification on the transaction price and the Group measures of progress for the performance obligation to which it relates is recognised as an adjustment to revenue (either as an increase in or a reduction of revenue) on a cumulative catch-up basis.
Certain contracts with the customer include performance bonuses, liquidated damages and provisional sums. These amounts which will be included in the transaction price of the contract provided they can be reasonably estimated and will not result in a significant reversal in the future.
Should the customer terminate a contract early, the Group may be entitled to shortfall commitment revenue on the contract. The Group recognises shortfall commitment revenue when payment from the customer is certain. At the inception of a contract, an estimate for shortfall commitment revenue is not recognised, as the Group expects the customer to use its services for the full term of the contract. As a result, determining when to recognise shortfall commitment revenue requires judgment to ensure that revenue is recognised when the performance obligation has been satisfied and collectability assured.
Foreseeable losses for construction contracts
The requirements of MFRS 137 prescribe that a provision for onerous contract must be calculated on a least net cost basis, which includes unavoidable costs only and comparing these costs to the cost of cancelling a contract including any termination fees. The policy on provision for onerous contracts is in Note 2.17(a).
118
Financial Statements
NOTES TO THE FINANCIAL STATEMENTS– 31 January 2022

2. SUMMARY OF SIGNIFICANT ACCOUNTING POLICIES (CONT’D.)
2.22 Revenue (cont’d.)
(i) Revenue from contracts with customers (cont’d.)
(a) Construction contracts (cont’d.)
Contracts with significant procurement
In circumstances where there is significant procurement of materials for that contract, the Group assessed whether the procurement of items are specifically designed for the project and if so, would include the costs of such materials in the percentage-of-completion calculation. Non-customised procurement are excluded from percentage-of-completion calculation.
(b) Revenue from other services
Revenue from other services includes offshore support, subsea services, geotechnical, maintenance and consultation services.
Revenue from contracts with customers is recognised when or as the Group satisfies a performance obligation by transferring services to a customer, which is when the customer obtains control of the services. The Group principally satisfies its performance obligations over time.
The right-to-invoice practical expedient can be applied to a performance obligation satisfied over time by recognising revenue in the amount that the Group has a right to invoice the customer, which corresponds directly with the value transferred to the customer for the performance completed to date.
The Group has elected to use the right-to-invoice practical expedient in certain service contracts where the Group invoices its customers on a per day basis that directly corresponds with the value received by the customer. As days are worked on the customer’s contract, the Group satisfies its performance obligation to the customer and recognises revenue on a per day basis. When this practical expedient is used, the Group does not estimate variable consideration at the inception of the contract to determine the transaction price or for disclosure purposes.
(c) Drilling related services
Revenue is measured based on the consideration to which the Group expects to be entitled in exchange for transferring promised goods or services to a customer.
Revenue from contracts with customers is recognised when or as the Group satisfies a performance obligation by transferring goods or services to a customer, which is when the customer obtains control of the goods or services. A performance obligation may be satisfied at a point in time or over time. The amount of revenue recognised is the amount allocated to the satisfied performance obligation. The Group principally satisfies its performance obligations over time.
Revenue from drilling related services include supply of manpower, mobilisation costs, demobilisation fees and performance bonuses.
If the consideration in a contract includes a variable amount, the Group estimates the amount of consideration to which it will be entitled in exchange for transferring the goods to the customer. The variable consideration is estimated at contract inception and constrained until it is highly probable that a significant revenue reversal in the amount of cumulative revenue recognised will not occur when the associated uncertainty with the variable consideration is subsequently resolved.
Sap
ura
En
erg
y B
erh
ad
An
nu
al R
ep
ort
20
22
119
Financial Statements

2. SUMMARY OF SIGNIFICANT ACCOUNTING POLICIES (CONT’D.)
2.22 Revenue (cont’d.)
(i) Revenue from contracts with customers (cont’d.)
(c) Drilling related services (cont’d.)
In relation to mobilisation services, the Group makes payments to vendor or related companies for the mobilisation of rigs prior to commencement of drilling services. Mobilisation cost are recognised as contract costs capitalised to fulfil a contract, and recognised on a straight-line basis over the period that the related drilling services are performed. Correspondingly, mobilisation fees are deferred and recognised on a straight-line basis over the period that the related drilling services are performed.
Demobilisation fees are recognised as and when the services are rendered, or at a point when it becomes known and certain that demobilisation fee can be charged to the customer.
The right-to-invoice practical expedient can be applied to a performance obligation satisfied over time by recognising revenue in the amount that the Group has a right to invoice the customer for, which corresponds directly with the value transferred to the customer for the performance completed to date.
The Group has elected to use the right-to-invoice practical expedient in certain service contracts where the Group invoices its customers on a per day basis that directly corresponds with the value received by the customer. As days are worked on the customer’s contract, the Group satisfies its performance obligation to the customer and recognises revenue on a per day basis. When this practical expedient is used, the Group does not estimate variable consideration at the inception of the contract to determine the transaction price or for disclosure purposes.
(d) Contract balances
The timing of revenue recognition, billings and cash collections results in billed accounts receivable, costs and estimated earnings in excess of billings on uncompleted contracts (contract assets), and billings in excess of costs and estimated earnings on uncompleted contracts (contract liabilities) on the consolidated statements of financial position.
A contract asset is the right to consideration in exchange for goods or services transferred to the customer. If the Group performs by transferring goods or services to a customer before the customer pays consideration or before payment is due, a contract asset is recognised for the earned consideration that is conditional.
A receivable represents the Group’s right to an amount of consideration that is unconditional (i.e., only the passage of time is required before payment of the consideration is due). Refer to the accounting policies on financial assets in Note 2.13.
A contract liability is the obligation to transfer goods or services to a customer for which the Group has received consideration (or an amount of consideration is due) from the customer. If a customer pays consideration before the Group transfers goods or services to the customer, a contract liability is recognised when the payment is made or the payment is due (whichever is earlier). Contract liabilities are recognised as revenue when the Group performs the obligation under the contract.
(ii) Other revenue
(a) Leases
Lease income is recognised over the term of the lease on a straight-line basis.
(b) Interest income
Interest income is recognised on the accrual basis using the effective interest method.
120
Financial Statements
NOTES TO THE FINANCIAL STATEMENTS– 31 January 2022

2. SUMMARY OF SIGNIFICANT ACCOUNTING POLICIES (CONT’D.)
2.22 Revenue (cont’d.)
(ii) Other revenue (cont’d.)
(c) Dividend income
Dividend income is recognised when the Group’s or the Company’s right to receive payment is established.
(d) Intellectual property rights, trademarks and branding fees
Intellectual property rights, trademarks and branding fees are charged by the Company to subsidiaries for the use of the Company’s intellectual property rights, trademarks and brand where the revenue is recognised on the accrual basis.
2.23 Income taxes
(a) Current tax
Current tax assets and liabilities are measured at the amount expected to be recovered from or paid to the taxation authorities. The tax rates and tax laws used to compute the amount are those that are enacted or substantively enacted at the reporting date in the countries where the Group and the Company operates and generates taxable income.
Current taxes are recognised in profit or loss except to the extent that the tax relates to items recognised outside statement of profit or loss, either in OCI or directly in equity. Management periodically evaluates positions taken in the tax returns with respect to situations in which applicable tax regulations are subject to interpretation and establishes provisions where appropriate.
(b) Deferred tax
Deferred tax is provided using the liability method on temporary differences between the tax bases of assets and liabilities and their carrying amounts for financial reporting purposes at the reporting date.
Deferred tax liabilities are recognised for all temporary differences, except:
– where the deferred tax liability arises from the initial recognition of goodwill or an asset or liability in a transaction that is not a business combination and, at the time of the transaction, affects neither the accounting profit nor taxable profit or loss; and
– in respect of taxable temporary differences associated with investments in subsidiaries, associates and interests in joint arrangements, when the timing of the reversal of the temporary differences can be controlled and it is probable that the temporary differences will not reverse in the foreseeable future.
Deferred tax assets are recognised for all deductible temporary differences, the carry forward of unused tax credits and any unused tax losses, to the extent that it is probable that taxable profit will be available against which the deductible temporary differences, and the carry forward of unused tax credits and unused tax losses can be utilised except:
– where the deferred tax asset relating to the deductible temporary difference arises from the initial recognition of an asset or liability in a transaction that is not a business combination and, at the time of the transaction, affects neither the accounting profit nor taxable profit or loss; and
– in respect of deductible temporary differences associated with investments in subsidiaries, associates and interests in joint arrangements, deferred tax assets are recognised only to the extent that it is probable that the temporary differences will reverse in the foreseeable future and taxable profit will be available against which the temporary differences can be utilised.
Sap
ura
En
erg
y B
erh
ad
An
nu
al R
ep
ort
20
22
121
Financial Statements

2. SUMMARY OF SIGNIFICANT ACCOUNTING POLICIES (CONT’D.)
2.23 Income taxes (cont’d.)
(b) Deferred tax (cont’d.)
The carrying amount of deferred tax assets is reviewed at each reporting date and reduced to the extent that it is no longer probable that sufficient taxable profit will be available to allow all or part of the deferred tax asset to be utilised. Unrecognised deferred tax assets are reassessed at each reporting date and are recognised to the extent that it has become probable that future taxable profit will allow the deferred tax assets to be utilised.
Deferred tax assets and liabilities are measured at the tax rates that are expected to apply in the year when the asset is realised or the liability is settled, based on tax rates (and tax laws) that have been enacted or substantively enacted at the reporting date.
Deferred tax relating to items recognised outside statement of profit or loss is recognised outside statement of profit or loss. Deferred tax items are recognised in correlation to the underlying transaction either in OCI or directly in equity and deferred tax arising from a business combination is adjusted against goodwill on acquisition.
Deferred tax assets and deferred tax liabilities are offset, if a legally enforceable right exists to set off current tax assets against current tax liabilities and the deferred taxes relate to the same taxable entity and the same taxation authority.
2.24 Segment reporting
Segment reporting in the financial statements is presented on the same basis as that used by management internally for evaluating operating segment performance and in deciding on the allocation of resources to each operating segment. Operating segments are distinguishable components of the Group that engage in business activities from which they may earn revenues and incur expenses, including revenues and expenses that relate to transactions with any of the Group’s other components. An operating segment’s results are reviewed regularly by the chief operating decision-maker to decide on the allocation of resources to the segment and assess its performance, and for which discrete financial information is available.
Segment revenue, expenses, assets and liabilities are those amounts resulting from operating activities of a segment that are directly attributable to the segment and a relevant portion that can be reasonably allocated to the segment.
Segment revenue, expenses, assets and liabilities are determined before intra-group balances and intra-group transactions are eliminated as part of the consolidation process, except to the extent that such intra-group balances and transactions are between group entities within a single segment.
2.25 Share capital
An equity instrument is any contract that evidences a residual interest in the assets of the Group and the Company after deducting all of its liabilities. Ordinary shares are equity instruments.
Ordinary shares are recorded at the proceeds received, net of directly attributable incremental transaction costs. Ordinary shares are classified as equity. Dividends on ordinary shares are recognised in equity in the period in which they are declared.
2.26 Shares held under trust
When shares of the Company, that have not been cancelled, recognised as equity are purchased by the Company, the amount of consideration paid is recognised directly in equity. Purchased shares are classified as shares held under trust and presented as a deduction from total equity.
Shares transferred to the recipient under the LTIP scheme is measured at the weighted average cost of the shares on the date of transfer. The difference between the weighted average cost and the fair value of the shares transferred is recognised in equity.
122
Financial Statements
NOTES TO THE FINANCIAL STATEMENTS– 31 January 2022

2. SUMMARY OF SIGNIFICANT ACCOUNTING POLICIES (CONT’D.)
2.27 Warrants
Warrants are classified as equity instrument and the value is allocated based on the closing price of the first trading day, if the warrant is listed, or estimated using option pricing models, if the warrant is not listed, and recognised in the warrant reserves.
The issuance of ordinary shares upon exercise of the warrants is treated as new subscription of ordinary shares for the consideration equivalent to the exercise price of the warrants.
2.28 Contingencies
A contingent liability or asset is a possible obligation or asset that arises from past events and whose existence will be confirmed only by the occurrence or non-occurrence of uncertain future event(s) not wholly within the control of the Group or of the Company.
Contingent liabilities and assets are not recognised in the statements of financial position of the Group and of the Company.
2.29 Derivatives financial instruments and hedge accounting
Initial recognition and measurement
The Group uses derivative financial instruments, such as Islamic cross-currency swaps, to hedge its foreign currency risks. Such derivative financial instruments are initially recognised at fair value on the date on which a derivative contract is entered into and are subsequently remeasured at fair value. Derivatives are carried as financial assets when the fair value is positive and as financial liabilities when the fair value is negative.
For the purpose of hedge accounting, hedges are classified as:
– Fair value hedges when hedging the exposure to changes in the fair value of a recognised asset or liability or an unrecognised firm commitment;
– Cash flow hedges when hedging the exposure to variability in cash flows that is either attributable to a particular risk associated with a recognised asset or liability or a highly probable forecast transaction or the foreign currency risk in an unrecognised firm commitment; and
– Hedges of a net investment in a foreign operation.
At the inception of a hedge relationship, the Group formally designates and documents the hedge relationship to which it wishes to apply hedge accounting and the risk management objective and strategy for undertaking the hedge.
The documentation includes identification of the hedging instrument, the hedged item, the nature of the risk being hedged and how the Group will assess whether the hedging relationship meets the hedge effectiveness requirements (including the analysis of sources of hedge ineffectiveness and how the hedge ratio is determined). A hedging relationship qualifies for hedge accounting if it meets all of the following effectiveness requirements:
– There is ‘an economic relationship’ between the hedged item and the hedging instrument;
– The effect of credit risk does not ‘dominate the value changes’ that result from that economic relationship; and
– The hedge ratio of the hedging relationship is the same as that resulting from the quantity of the hedged item that the Group actually hedges and the quantity of the hedging instrument that the Group actually uses to hedge that quantity of hedged item.
Sap
ura
En
erg
y B
erh
ad
An
nu
al R
ep
ort
20
22
123
Financial Statements

2. SUMMARY OF SIGNIFICANT ACCOUNTING POLICIES (CONT’D.)
2.29 Derivatives financial instruments and hedge accounting (cont’d.)
Hedges that meet all the qualifying criteria for hedge accounting are accounted for, as described below:
Cash flows hedges
The effective portion of the gain or loss on the hedging instrument is recognised in OCI in the cash flow hedge reserve, while any ineffective portion is recognised immediately in the statement of profit or loss. The cash flow hedge reserve is adjusted to the lower of the cumulative gain or loss on the hedging instrument and the cumulative change in fair value of the hedged item.
The Group uses Islamic cross-currency swap contracts as hedges of its exposure to foreign currency risk in forecast transactions and firm commitments. The ineffective portion relating to the derivative contracts is recognised in other operating income or expenses.
The Group designated all of the Islamic cross-currency swap contracts as hedging instrument. Any gains or losses arising from changes in the fair value of derivatives were taken directly to profit or loss, except for the effective portion of cash flow hedges, which were recognised in OCI and later reclassified to profit or loss when the hedge item affects profit or loss.
The amounts accumulated in OCI are accounted for, depending on the nature of the underlying hedged transaction. If the hedged transaction subsequently results in the recognition of a non-financial item, the amount accumulated in equity is removed from the separate component of equity and included in the initial cost or other carrying amount of the hedged asset or liability. This is not a reclassification adjustment and will not be recognised in OCI for the period. For any other cash flow hedges, the amount accumulated in OCI is reclassified to profit or loss as a reclassification adjustment in the same period or periods during which the hedged cash flows affect profit or loss.
If cash flow hedge accounting is discontinued, the amount that has been accumulated in OCI must remain in accumulated OCI if the hedged future cash flows are still expected to occur. Otherwise, the amount will be immediately reclassified to profit or loss as a reclassification adjustment. After discontinuation, once the hedged cash flow occurs, any amount remaining in accumulated OCI must be accounted for depending on the nature of the underlying transaction as described above.
2.30 Current and non-current classification
The Group and the Company present assets and liabilities in statements of financial position based on current and non-current classification.
An asset is classified as current when it is:
i) Expected to be realised or intended to sold or consumed in normal operating cycle;
ii) Held primarily for the purpose of trading;
iii) Expected to be realised within 12 months after the reporting period; or
iv) Cash and cash equivalents unless restricted from being exchanged or used to settle a liability for at least 12 months after the reporting period.
All other assets are classified as non-current.
A liability is classified as current when:
i) It is expected to be settled in normal operating cycle;
ii) It is held primarily for the purpose of trading;
iii) It is due to be settled within 12 months after reporting period; or
iv) There is unconditional right to defer the settlement of the liability for at least 12 months after the reporting period.
All other liabilities are classified as non-current.
Deferred tax assets and liabilities are classified as non-current assets and liabilities respectively.
124
Financial Statements
NOTES TO THE FINANCIAL STATEMENTS– 31 January 2022

2. SUMMARY OF SIGNIFICANT ACCOUNTING POLICIES (CONT’D.)
2.31 Fair value measurement
The Group and the Company measure financial instruments such as derivative at fair value at each reporting date.
Fair value is the price that would be received to sell an asset or paid to transfer a liability in an orderly transaction between market participants at the measurement date. The fair value measurement is based on the presumption that the transaction to sell the asset or transfer the liability takes place either:
a) In the principal market for the asset or liability, or
b) In the absence of a principal market, in the most advantageous market for the asset or liability.
The principal market or the most advantageous market must be accessible to by the Group and the Company.
The fair value of an asset or a liability is measured using the assumptions that market participants would use when pricing the asset or liability, assuming that market participants act in their economic best interest.
A fair value measurement of a non-financial asset takes into account a market participant’s ability to generate economic benefits by using the asset in its highest and best use or by selling it to another market participant that would use the asset in its highest and best use.
The Group and the Company use valuation techniques that are appropriate in the circumstances and for which sufficient data are available to measure fair value, maximising the use of relevant observable inputs and minimising the use of unobservable inputs.
All assets and liabilities for which fair value is measured or disclosed in the financial statements are categorised within the fair value hierarchy, described as follows, based on the lowest level input that is significant to the fair value measurement as a whole:
a) Level 1 – Quoted (unadjusted) market prices in active markets for identical assets or liabilities.
b) Level 2 – Valuation techniques for which the lowest level input that is significant to the fair value measurement is directly or indirectly observable.
c) Level 3 – Valuation techniques for which the lowest level input that is significant to the fair value measurement is unobservable.
For assets and liabilities that are recognised in the financial statements at fair value on a recurring basis, the Group and the Company determine whether transfers have occurred between Levels in the hierarchy by re-assessing categorisation (based on the lowest level input that is significant to the fair value measurement as a whole) at the end of each reporting period.
The Group’s management determines the policies and procedures for both recurring fair value measurement and for non-recurring measurement.
External valuers are involved for valuation of significant assets. Selection criteria of external valuers include market knowledge, reputation, independence and whether professional standards are maintained. The management decides, after discussions with the Group’s and the Company’s external valuers, which valuation techniques and inputs to use for each case.
At each reporting date, the management analyses the movements in the values of assets and liabilities which are required to be re-measured or re-assessed as per the Group’s accounting policies. For this analysis, the management verifies the major inputs applied in the latest valuation by agreeing the information in the valuation computation to contracts and other relevant documents.
Sap
ura
En
erg
y B
erh
ad
An
nu
al R
ep
ort
20
22
125
Financial Statements

2. SUMMARY OF SIGNIFICANT ACCOUNTING POLICIES (CONT’D.)
2.31 Fair value measurement (cont’d.)
The management present the valuation results to the audit committee and the Group’s independent auditors. This includes a discussion of the major assumptions used in the valuations.
For the purpose of fair value disclosures, the Group and the Company have determined classes of assets and liabilities on the basis of the nature, characteristics and risks of the asset or liability and the level of the fair value hierarchy as explained above.
2.32 Non-current assets held for sale
The Group classifies non-current assets as held for sale if their carrying amounts will be recovered principally through a sale transaction rather than through continuing use. Non-current assets classified as held for sale are measured at the lower of their carrying amount and fair value less costs to sell. Costs to sell are the incremental costs directly attributable to the disposal of an asset, excluding finance costs and income tax expense.
The criteria for held for sale classification is regarded as met only when the sale is highly probable, and the asset or disposal group is available for immediate sale in its present condition. Actions required to complete the sale should indicate that it is unlikely that significant changes to the sale will be made or that the decision to sell will be withdrawn. Management must be committed to the plan to sell the asset and the sale expected to be completed within one year from the date of the classification.
Property, plant and equipment are not depreciated or amortised once classified as held for sale.
Assets classified as held for sale are presented separately as current items in the statement of financial position.
2.33 Significant accounting judgements and estimates
The preparation of the Group’s and the Company’s financial statements requires management to make judgements, estimates and assumptions that affect the reported amounts of revenues, expenses, assets and liabilities, and the disclosure of contingent liabilities at the reporting date. However, uncertainty about these assumptions and estimates could result in outcomes that could require a material adjustment to the carrying amount of the asset or liability affected in the future.
(a) Judgements made in applying accounting policies
In the process of applying the Group’s accounting policies, management has made the following judgements, apart from those involving estimations, which have the most significant effect on the amounts recognised in the financial statements.
The Group and the Company make estimates and assumptions concerning the future. The resulting accounting estimates will, by definition, rarely equal the related actual results. To enhance the information content of the estimates, certain key variables that are anticipated to have material impact on the Group’s and the Company’s results and financial position are tested for sensitivity to changes in the underlying parameters. The estimates and assumptions that have a significant risk of causing a material adjustment to the carrying amounts of assets and liabilities within the next financial year are outlined below:
Treatment of contract variation
Included in the financial statements are values of contract claims that have not yet been approved which are at various stages of process with the customers. In this respect, the values are estimated based on management’s assessment and judgement as to the realisable amount.
The complexity of estimation process, risks and uncertainties will affect the amounts reported in the financial statements. Depending on the outcome of negotiations with customers, this could result in reduction/increase in attributable profits/losses.
Management is of the opinion that the contract claims recognised in the financial statements represents the best estimate, with justifiable grounds for the claims submitted and favourable progress of discussions with the customers.
126
Financial Statements
NOTES TO THE FINANCIAL STATEMENTS– 31 January 2022

2. SUMMARY OF SIGNIFICANT ACCOUNTING POLICIES (CONT’D.)
2.33 Significant accounting judgements and estimates (cont’d.)
(b) Key sources of estimation uncertainty
The key assumptions concerning the future and other key sources of estimation uncertainty at the statement of financial position date, that have a significant risk of causing a material adjustment to the carrying amounts of assets and liabilities within the next financial year are discussed below:
(i) Impairment
(a) Goodwill
The Group determines whether goodwill is impaired at least on an annual basis. This requires an estimation of the value-in-use of the CGU to which goodwill is allocated. Estimating a value-in-use amount requires management to make an estimate of the expected future cash flows from the CGU and also to choose a suitable discount rate in order to calculate the present value of those cash flows. Further details are disclosed in Note 14.
(b) Property, plant and equipment
Impairment test has been carried out based on variety of estimations, including value-in-use of the CGU of which the specific property, plant and equipment is allocated or fair value less costs of disposal. Estimating the value-in-use requires the Group to make an estimate of the expected future cash flows and also to determine the appropriate discount rate to calculate the present value of those cash flows.
The future cash flows are subject to change as new information become available and the changes may eventually affect the statement of profit or loss through impairment charges or reversal of impairment.
In establishing the recoverable amount that is based on fair value less costs of disposal, the Group engaged independent external valuers to assess the fair value of the property, plant and equipment, adjusted for the condition of the specific assets. Further details are disclosed in Note 13.
(ii) Construction contracts
Where the performance obligations are satisfied over time, the Group recognises contract revenue in statement of profit or loss by using the input method which is based on cost incurred to-date relative to the total expected cost to the satisfaction of that performance obligation.
Significant estimate is required in determining the extent of the contract costs incurred, the estimated total contract revenue and costs, the recoverability of the contract costs as well as assessing potential deductions to revenue due to delays in delivery or other contractual penalties. In making these judgements, the Group evaluates based on past experience and historical information. Further details are disclosed in Note 22 and Note 23.
(iii) Provision for impairment of receivables and contract assets
For major oil and gas customers and national oil companies, the Group undertakes a specific review of the receivables and contract assets through an analysis of the customer’s credit risk and the ageing of the receivable balances. Further details of how the credit risk is determined and managed is described in Note 40(d).
The information about the provision for impairment on the Group’s receivables is disclosed in Note 22 and Note 23.
(iv) Income taxes
Significant estimation is involved in determining the provision for income taxes. There are certain transactions and computations for which the ultimate tax determination is uncertain during the ordinary course of business. The Group and the Company recognise liabilities for expected tax issues based on estimates of whether additional taxes will be due. Where the final outcome of these matters are different from the amounts initially recognised, such differences will impact the income tax and deferred tax provisions in the period in which such determination is made. Details of income tax expense are disclosed in Note 11.
Sap
ura
En
erg
y B
erh
ad
An
nu
al R
ep
ort
20
22
127
Financial Statements

3. REVENUE
Disaggregation of revenue
The Group disaggregates revenue by type of services, geographic location and timing of transfer of services.
3.1 Type of services
The following tables represent revenue by type of services:
Group
2022
RM’000
2021RestatedRM’000
(i) Revenue from contracts with customers:
Engineering and Construction Construction contracts 1,879,433 3,106,801
Offshore support and subsea services 800,960 700,249
Operations and Maintenance Construction contracts 167,464 581,825
Geotechnical, maintenance and consultation services 80,988 97,512
Drilling Drilling related services 617,241 419,280
3,546,086 4,905,667
(ii) Lease:
Drilling Charter of rigs 416,133 309,164
Engineering and Construction Charter of vessels and other assets 138,010 132,991
554,143 442,155
4,100,229 5,347,822
Company
2022RM’000
2021RM’000
(i) Revenue from contracts with customers:
Management fees from subsidiaries 114,651 96,999
(ii) Other revenue:Intellectual property rights, trademarks and branding fees from subsidiaries – 10,000
Dividend income – 6,920
– 16,920
114,651 113,919
128
Financial Statements
NOTES TO THE FINANCIAL STATEMENTS– 31 January 2022

3. REVENUE (CONT’D.)
3.2 Geographic location
The following tables represent revenue by geographic location:
Group
Engineeringand
ConstructionRM’000
Operationsand
MaintenanceRM’000
DrillingRM’000
TotalRM’000
31 January 2022Malaysia 1,027,179 243,549 344,163 1,614,891 Asia* 801,370 4,903 347,623 1,153,896 Americas 412,104 – – 412,104Africa 2,522 – 341,588 344,110Australia 200,008 – – 200,008Middle East 267,569 – – 267,569Others 107,651 – – 107,651
Total revenue 2,818,403 248,452 1,033,374 4,100,229
31 January 2021Asia* 1,976,952 383 378,575 2,355,910
Malaysia 1,095,896 676,612 267,916 2,040,424
Americas 651,777 – – 651,777
Australia 147,453 – – 147,453
Africa 10,436 – 81,953 92,389
Middle East 53,912 – – 53,912
Others 3,615 2,342 – 5,957
Total revenue 3,940,041 679,337 728,444 5,347,822
* Excluding Malaysia and Middle East
3.3 Timing of transfer of services
The Group recognises its revenue from contracts with customers predominantly over time.
3.4 Transaction price allocated to the remaining unsatisfied performance obligations
Remaining unsatisfied performance obligations (“RUPO”) represent the transaction price for goods and services for which the Group has a material right but work has not been performed. Transaction price of the RUPO includes the base transaction price, variable consideration and changes in transaction price. As a practical expedient, the RUPO does not include contracts for which the Group has recognised revenue at the amount to which the Group has the right to invoice for services performed or the performance obligation is part of a contract that has an original expected duration of one year or less.
As of 31 January 2022, the aggregate amounts of the transaction price allocated to the remaining unsatisfied performance obligations of the Group is RM3,527.2 million (2021: RM4,268.7 million). The Group is expecting to recognise the revenue over the next 36 months.
Sap
ura
En
erg
y B
erh
ad
An
nu
al R
ep
ort
20
22
129
Financial Statements

4. COST OF SALES
Cost of sales comprise costs related to construction contracts, geotechnical, maintenance services and related drilling services and other services recognised.
5. OTHER INCOME
Group Company
2022RM’000
2021RM’000
2022RM’000
2021RM’000
Interest income:
– third parties 4,172 9,464 – –
– joint ventures 16,484 26,195 – –
– subsidiaries – – 8,841 9,111
Net gain on disposal of property, plant and equipment 6,953 287 – –
Foreign exchange differences:
– net realised exchange gain – – – 246
– net unrealised exchange gain – – 15,558 –
Net additional income from previous disposal of 50% equity stake in a former subsidiary – 50,055 – 50,055
Technical and management fees charged to joint ventures 18,336 71,020 – –
Net gain on disposal of an associate and a joint venture 3,579 – – –
Miscellaneous income 26,795 26,696 – –
76,319 183,717 24,399 59,412
(a) In the previous financial year, the Company and OMV Aktiengesellschaft (“OMV AG”) had agreed on the closing settlement with additional receipt of USD12.0 million comprises mainly purchase consideration adjustment, oil prices additional consideration and tax indemnity claim by SapuraOMV Sdn. Bhd., in relation to the previous disposal of 50% equity stake in Sapura Upstream Sdn. Bhd. and its subsidiaries on 31 January 2019. The USD12.0 million (equivalent to RM50.1 million) was received and recognised as other income.
6. PROVISION FOR IMPAIRMENT
Group Company
2022RM’000
2021RM’000
2022RM’000
2021RM’000
Provision for impairment on:
– property, plant and equipment (Note 13) 2,315,787 – – –
– goodwill (Note 14) 3,289,934 – – –
– investment in subsidiaries (Note 15(b)) – – 7,712,666 –
– amount due from subsidiaries (Note 21) – – 878,736 61,714
– amount due from associate and related parties (Note 22) – – 20,566 –
5,605,721 – 8,611,968 61,714
130
Financial Statements
NOTES TO THE FINANCIAL STATEMENTS– 31 January 2022

7. FINANCE COSTS
Group Company
2022RM’000
2021RM’000
2022RM’000
2021RM’000
Interest expense on borrowings 76,637 100,789 – –
Profit sharing on Islamic financing 431,609 373,947 – –
Interest on lease liabilities (Note 35) 667 1,196 – –
Amortisation of cumulative changes in relation to previous hedge instruments 18,952 16,432 – –
Interest expense on amount due to a subsidiary – – 212,470 231,066
527,865 492,364 212,470 231,066
8. LOSS BEFORE TAXATION
Group Company
2022RM’000
2021RM’000
2022RM’000
2021RM’000
This is arrived at after charging/(crediting):
Employee benefits expense (Note 9) 1,215,409 1,176,341 36,871 (3,806)
Non-executive directors’ remuneration (Note 10) 4,284 4,452 4,284 4,436
Auditors’ remuneration:
– Statutory audits:
– Group auditors 3,750 3,750 185 185
– Other services:
– Group auditors 1,449 850 786 786
Charter of vessels, barges and rigs and hire of equipment* 342,769 338,012 – –
Depreciation of property, plant and equipment (Note 13) 519,909 540,437 7,332 11,996
Property, plant and equipment written off 12,238 454 – –
Amortisation of intangible assets (Note 14) 2,711 3,092 – –
Inventories written off (Note 20) 38,937 80 – –
Rental of premises* 10,855 29,673 5,517 7,403
Foreign exchange differences:
– net unrealised exchange loss 20,733 6,217 – 9,059
– net realised exchange loss 21,405 2,773 – –
Provision for foreseeable losses (Note 34) 1,119,887 192,920 44,700 –
Provision for expected credit losses (Note 22) 50,980 38,690 – –
Provision for contract asset (Note 23) 49,819 – – –
Intellectual property rights, trademarks and branding fees (Note 39(a)) – 10,000 – 10,000
* As allowed under MFRS 16, the Group and the Company had elected not to recognise the right-of-use assets and lease liabilities in relation to short-term lease.
Sap
ura
En
erg
y B
erh
ad
An
nu
al R
ep
ort
20
22
131
Financial Statements

9. EMPLOYEE BENEFITS EXPENSE
Group Company
2022RM’000
2021RM’000
2022RM’000
2021RM’000
Wages and salaries 1,080,341 1,063,524 25,926 23,530
Restructuring expenses* – 33,658 – 5,465
Social security contributions 12,282 14,051 104 104
Contributions to defined contribution plan 50,257 48,757 3,004 3,984
Other benefits 72,529 56,546 7,837 3,306
1,215,409 1,216,536 36,871 36,389
Overprovision in prior year – (40,195) – (40,195)
1,215,409 1,176,341 36,871 (3,806)
Included in employee benefits expense of the Group and of the Company are executive directors’ remuneration as disclosed in Note 10.
* In the previous financial year, the Group undertook a restructuring exercise to reduce manpower cost in response to the COVID-19 pandemic and the cyclical nature of the industry.
10. DIRECTORS’ REMUNERATION
Group Company
2022RM’000
2021RM’000
2022RM’000
2021RM’000
Directors of the Company
Executive:
Salaries and other emoluments 2,497 5,702 2,497 5,702
Benefits-in-kind 41 352 41 352
2,538 6,054 2,538 6,054
Non-Executive:
Fees^ 3,963 4,415 3,963 4,399
Other emoluments 321 37 321 37
Total remuneration (Note 8) 4,284 4,452 4,284 4,436
Benefits-in-kind 13 51 13 51
4,297 4,503 4,297 4,487
6,835 10,557 6,835 10,541
Analysis excluding benefits-in-kind:
Total executive directors’ remuneration 2,497 5,702 2,497 5,702
Total non-executive directors’ remuneration 4,284 4,452 4,284 4,436
Total directors’ remuneration 6,781 10,154 6,781 10,138
No ESOS has been exercised by the director in the current and previous financial year.
^ In the previous financial year, the fees for certain directors were paid to the organisation that the directors represent.
132
Financial Statements
NOTES TO THE FINANCIAL STATEMENTS– 31 January 2022

11. INCOME TAX EXPENSE/(CREDIT)
Group Company
2022RM’000
2021RM’000
2022RM’000
2021RM’000
Income tax:
Malaysian income tax 39,932 39,639 972 316
Foreign tax 73,851 53,872 – –
113,783 93,511 972 316
Under/(over) provision in prior years:
Malaysian income tax 19,436 2,721 4,077 –
Foreign tax (2,360) (4,009) – –
17,076 (1,288) 4,077 –
130,859 92,223 5,049 316
Deferred tax:
Relating to origination of temporary differences (1,642) 49,428 17,225 (6)
Over provision in prior years (211) (13,124) (907) (3,007)
(1,853) 36,304 16,318 (3,013)
Total income tax expense/(credit) 129,006 128,527 21,367 (2,697)
Domestic income tax is calculated at the Malaysian statutory tax rate of 24% (2021: 24%) of the estimated assessable profit for the year.
Taxation for other jurisdictions is calculated at the rates prevailing in the respective jurisdictions.
A reconciliation of income tax expense applicable to loss before taxation at the statutory income tax rate expense to income tax expense, at the effective income tax rates of the Group and of the Company are as follows:
Group
2022RM’000
2021RM’000
Loss before taxation (8,931,853) (31,725)
Taxation at Malaysian statutory tax rate of 24% (2021: 24%) (2,143,644) (7,614)
Effect of different tax rates in other countries and jurisdictions 936,109 89,824
Effect of income not subject to tax (49,584) (78,460)
Effect of double deduction of expenses and tax incentive – (1,074)
Effect of expenses not deductible for tax purposes 864,242 153,146
Effect of share of results of associates and joint ventures (24,734) (41,368)
Effect of utilisation of previously unrecognised tax losses and unabsorbed capital allowances 5,682 (21,201)
Deferred tax assets not recognised in respect of tax losses and unabsorbed capital allowances 524,070 49,686
Over provision of income tax in prior years 17,076 (1,288)
Over provision of deferred tax in prior years (211) (13,124)
Total income tax expense for the year 129,006 128,527 Sap
ura
En
erg
y B
erh
ad
An
nu
al R
ep
ort
20
22
133
Financial Statements

11. INCOME TAX EXPENSE/(CREDIT) (CONT’D.)
Company
2022RM’000
2021RM’000
Loss before taxation (8,877,065) (226,265)
Taxation at Malaysian statutory tax rate of 24% (2021: 24%) (2,130,496) (54,304)
Effect of income not subject to tax – (14,164)
Effect of expenses not deductible for tax purposes 2,125,592 68,778
Deferred tax assets not recognised in respect of tax losses and unabsorbed capital allowances 23,101 –
Over provision of income tax in prior years 4,077 –
Over provision of deferred tax in prior years (907) (3,007)
Income tax expense/(credit) for the year 21,367 (2,697)
12. LOSS PER SHARE
Basic/diluted loss per share are calculated by dividing loss for the year attributable to owners of the Parent by the weighted average number of ordinary shares in issue during the financial year is as follows:
Group
2022 2021
In respect of financial year:
Loss for the year attributable to owners of the Parent (RM’000) (9,050,634) (160,870)
Weighted average number of ordinary shares in issue (‘000) *
– Basic/Diluted* 15,971,804 15,971,804
Loss per share from continuing operations (sen)
– Basic/Diluted* (56.67) (1.01)
* Rights issue of RCPS-i and warrants of 2,396,862,035 units and 998,692,020 units respectively, as well as 691,938,153 and 586,388,264 options under the ESOS granted have not been included in the calculation of diluted earnings per share because they are anti-dilutive.
134
Financial Statements
NOTES TO THE FINANCIAL STATEMENTS– 31 January 2022

13. PROPERTY, PLANT AND EQUIPMENT
Group
Freeholdland
RM’000
Buildingsand
structuresRM’000
Vessels andrelated dry
docking,ROVs, and
SAT systemRM’000
Tenderassisteddrilling
rigs andrelated dry
dockingRM’000
Plant andmachinery,
tools andimplements
RM’000
Equipment,furniture
and motorvehiclesRM’000
Assetsunder
constructionRM’000
Right-of-use assets*
RM’000Total
RM’000
At 31 January 2022
CostAt 1 February 2021 4,520 424,487 5,435,176 11,378,192 763,137 336,812 1,387,936 182,892 19,913,152Additions^ – 4,456 77,486 72,296 1,017 7,926 11,805 1,228 176,214Disposals – – (33,019) (8,766) (1,503) (269) – – (43,557) Write-off – – (25,895) (4,313) (750) (4,892) – – (35,850) Reclassification – 11,721 – – 10,330 1,163 (38,590) 15,376 –Transfer to assets held
for sale (Note 25) – – (620,819) – – – – – (620,819) Exchange differences – (904) 133,789 243,491 (55,063) 2,222 18,981 (2,054) 340,462
At 31 January 2022 4,520 439,760 4,966,718 11,680,900 717,168 342,962 1,380,132 197,442 19,729,602
Accumulated depreciation and impairment
At 1 February 2021 – 99,655 2,275,037 6,740,460 601,847 295,871 635,416 46,254 10,694,540Depreciation charge
for the year (Note 8) – 7,308 161,612 289,019 33,372 18,745 – 9,853 519,909Impairment (Note 6) – – 285,401 1,319,165 – – 711,221 – 2,315,787Transfer to assets held
for sale (Note 25) – – (325,321) – – – – – (325,321) Disposals – – (25,130) (2,717) (1,849) (220) – – (29,916) Write-off – – (14,108) (4,077) (747) (4,680) – – (23,612) Exchange differences – 95 42,051 82,529 (4,497) 2,634 21,887 (3,517) 141,182
At 31 January 2022 - 107,058 2,399,542 8,424,379 628,126 312,350 1,368,524 52,590 13,292,569
Net carrying amountAt 31 January 2022 4,520 332,702 2,567,176 3,256,521 89,042 30,612 11,608 144,852 6,437,033
* Represents leasehold land and buildings^ Additions consist of cash additions of RM154.4 million and accruals of RM20.5 million.
Sap
ura
En
erg
y B
erh
ad
An
nu
al R
ep
ort
20
22
135
Financial Statements

13. PROPERTY, PLANT AND EQUIPMENT (CONT’D.)
Group
Freeholdland
RM’000
Buildingsand
structuresRM’000
Vessels andrelated dry
docking,ROVs, andSAT system
RM’000
Tenderassisteddrilling
rigs andrelated dry
dockingRM’000
Plant andmachinery,
tools andimplements
RM’000
Equipment,furniture
and motorvehiclesRM’000
Assetsunder
constructionRM’000
Right-of-use assets*
RM’000Total
RM’000
At 31 January 2021
CostAt 1 February 2020 4,520 424,129 5,470,564 11,361,222 758,161 329,683 1,357,427 171,051 19,876,757
Additions^ – 370 40,241 58,239 4,398 12,291 49,813 11,633 176,985
Disposals – – – – – (3,239) – – (3,239)
Write-off – – – – (18,881) (1,212) – – (20,093)
Reclassification – – – – 16,189 – (16,189) – –
Exchange differences – (12) (75,629) (41,269) 3,270 (711) (3,115) 208 (117,258)
At 31 January 2021 4,520 424,487 5,435,176 11,378,192 763,137 336,812 1,387,936 182,892 19,913,152
Accumulated depreciation and impairment
At 1 February 2020 – 91,884 2,164,645 6,466,201 578,329 272,967 634,880 28,920 10,237,826
Depreciation charge for the year (Note 8) – 7,782 160,369 290,945 38,400 26,047 – 16,894 540,437
Disposals – – – – – (1,520) – – (1,520)
Write-off – – – – (18,486) (1,153) – – (19,639)
Exchange differences – (11) (49,977) (16,686) 3,604 (470) 536 440 (62,564)
At 31 January 2021 – 99,655 2,275,037 6,740,460 601,847 295,871 635,416 46,254 10,694,540
Net carrying amountAt 31 January 2021 4,520 324,832 3,160,139 4,637,732 161,290 40,941 752,520 136,638 9,218,612
* Represents leasehold land and buildings^ Additions consists of cash additions of RM164.2 million and accruals of RM1.2 million.
136
Financial Statements
NOTES TO THE FINANCIAL STATEMENTS– 31 January 2022

13. PROPERTY, PLANT AND EQUIPMENT (CONT’D.)
Company
Equipment,furniture
and motorvehiclesRM’000
At 31 January 2022
CostAt 1 February 2021 113,957Additions 5,436
At 31 January 2022 119,393
Accumulated depreciationAt 1 February 2021 99,859Depreciation charge for the year (Note 8) 7,332
At 31 January 2022 107,191
Net carrying amountAt 31 January 2022 12,202
At 31 January 2021
CostAt 1 February 2020 109,230
Additions 6,541
Disposal (1,814)
At 31 January 2021 113,957
Accumulated depreciationAt 1 February 2020 88,193
Depreciation charge for the year (Note 8) 11,996
Disposal (330)
At 31 January 2021 99,859
Net carrying amountAt 31 January 2021 14,098
Sap
ura
En
erg
y B
erh
ad
An
nu
al R
ep
ort
20
22
137
Financial Statements

13. PROPERTY, PLANT AND EQUIPMENT (CONT’D.)
(a) The Group has estimated the recoverable amount of its property, plant and equipment that are subject to impairment assessment during the financial year. The assessment has led to the recognition of impairment of RM2,315.8 million (2021: RM Nil) as disclosed in Note 6.
Included in the current year total impairments are impairment loss of:
i) RM2,030.4 million on 11 drilling rigs, with a recoverable amount of RM2,118.6 million, based on value-in-use. In determining the value-in-use of these assets, the future cash flows were discounted at a post-tax rate of 10.0%.
ii) RM285.4 million on 6 vessels, with recoverable amounts of RM453.6 million. The recoverable amounts are determined based on fair value less cost of disposal. The fair values are based on valuations performed by an independent valuer, based on comparable vessels adjusted for the current condition of the assets. The fair value measurement derived based on level 3 of the fair value hierarchy. Further details of fair value hierarchy are disclosed in Note 2.31.
(b) Included in the Group’s accumulated depreciation and impairment of property, plant and equipment are impairment losses carried forward of RM6,988.5 million (2021: RM4,672.7 million).
14. INTANGIBLE ASSETS
Group
Softwaredevelopment
costsRM’000
Otherdevelopment
costsRM’000
GoodwillRM’000
TotalRM’000
At 31 January 2022
CostAt 1 February 2021 37,505 26,010 8,051,729 8,115,244Additions 104 – – 104Exchange differences 818 – 135,423 136,241
At 31 January 2022 38,427 26,010 8,187,152 8,251,589
Accumulated amortisation and impairmentAt 1 February 2021 36,501 16,079 3,134,921 3,187,501Charge for the year (Note 8) 16 2,695 – 2,711Impairment (Note 6) – – 3,289,934 3,289,934Exchange differences 1,203 (316) 65,180 66,067
At 31 January 2022 37,720 18,458 6,490,035 6,546,213
Net carrying amountAt 31 January 2022 707 7,552 1,697,117 1,705,376
138
Financial Statements
NOTES TO THE FINANCIAL STATEMENTS– 31 January 2022

14. INTANGIBLE ASSETS (CONT’D.)
Group
Softwaredevelopment
costsRM’000
Otherdevelopment
costsRM’000
GoodwillRM’000
TotalRM’000
At 31 January 2021
CostAt 1 February 2020 37,559 26,234 8,085,595 8,149,388
Additions 151 – – 151
Exchange differences (205) (224) (33,866) (34,295)
At 31 January 2021 37,505 26,010 8,051,729 8,115,244
Accumulated amortisation and impairmentAt 1 February 2020 36,243 13,553 3,151,804 3,201,600
Charge for the year (Note 8) 355 2,737 – 3,092
Exchange differences (97) (211) (16,883) (17,191)
At 31 January 2021 36,501 16,079 3,134,921 3,187,501
Net carrying amountAt 31 January 2021 1,004 9,931 4,916,808 4,927,743
Included in the Group’s intangible assets are accumulated impairment of RM6,441.7 million (2021: RM3,151.8 million).
Impairment tests for goodwill
Goodwill has been allocated to the Group’s CGUs identified according to business segments as follows:
Group
2022RM’000
2021RM’000
Engineering and Construction (“E&C”) 1,290,450 2,908,579
Drilling 406,667 2,008,229
1,697,117 4,916,808
In the current financial year, the Group recognised an impairment loss on goodwill in Drilling segment of RM1,668.4 million (2021: RM Nil) and E&C segment of RM1,621.5 million (2021: RM Nil).
In the previous financial year, there was no impairment was made in respect of goodwill as the recoverable amount were higher than the carrying amount of the respective CGUs.
Sap
ura
En
erg
y B
erh
ad
An
nu
al R
ep
ort
20
22
139
Financial Statements

14. INTANGIBLE ASSETS (CONT’D.)
Key assumptions used in value-in-use calculations
The recoverable amounts of the CGUs have been determined based on the remaining useful life for the Drilling CGU and a 10-year period for the E&C CGUs, representing the foreseeable period based on the cyclical nature of the industry.
The following describes each key assumption on which management has based its cash flow projections to undertake impairment testing of goodwill:
(i) Revenue projection
Management has taken into consideration the order book, the likelihood of securing work within the bid book and expectations of the day rates and utilisation rates in determining the revenue projection for the respective CGUs.
(ii) Margin forecast
Gross margins are based on margin forecast of the order book, customer contract, management’s expectation and past experience for new work. Impact of expected prolonged recovery to the industry has been considered.
(iii) Discount rate
The discount rate reflect specific risks relating to the relevant CGU. The post-tax discount rate used by the E&C is 10% (2021: 9.5%) and Drilling is 8.5% (2021: 8.5%) respectively.
(iv) Terminal growth rate
Cash flow beyond the terminal period is extrapolated using the growth rate of 3.0% for E&C segment and 3.5% for Drilling segment (2021: 3.0% for both segments) respectively.
140
Financial Statements
NOTES TO THE FINANCIAL STATEMENTS– 31 January 2022

15. INVESTMENT IN SUBSIDIARIES
Company
2022RM’000
2021RM’000
Unquoted shares, at cost 11,393,077 11,393,077
Capitalisation of amounts due from subsidiaries 6,325,856 6,296,226
Total 17,718,933 17,689,303
Less: Accumulated impairment losses (12,716,656) (4,983,995)
5,002,277 12,705,308
The details of the subsidiaries are set out in Note 44.
(a) The Company increased its investment in certain subsidiaries amounting to RM29.6 million (2021: RM475.8 million) by way of capitalisation of certain amounts due from subsidiaries. The amounts are unsecured, non-interest bearing and treated as deemed investment. Included in current year capitalisation, RM20.0 million has been impaired.
(b) As at 31 January 2022, certain subsidiaries have reported continuing operating losses and/or depleting shareholders’ funds. These are indicators that the investment in these subsidiaries may be impaired. This resulted in impairment losses on its investment in subsidiaries of RM7,712.6 million (2021: RM116.2 million).
16. INVESTMENT IN ASSOCIATES
Group
2022RM’000
2021RM’000
Unquoted shares, at cost 2,265,501 2,265,681
Share of post-acquisition reserves (229,780) (161,861)
2,035,721 2,103,820
Sap
ura
En
erg
y B
erh
ad
An
nu
al R
ep
ort
20
22
141
Financial Statements

16. INVESTMENT IN ASSOCIATES (CONT’D.)
(i) Details of the associates are as follows:
Name of CompanyCountry of
Incorporation Principal Activities
Proportion ofOwnership Interest
2022%
2021%
(a) Held through Sapura Technology Solutions Sdn. Bhd.
Geowell Sdn. Bhd. Malaysia Wireline and well completion services
30 30
Subang Properties Sdn. Bhd. Malaysia Dormant 36.2 36.2
(b) Held through SapuraCrest Ventures Sdn. Bhd.
Labuan Shipyard & Engineering Sdn. Bhd.
Malaysia Shipbuilding, ship repair, naval craft maintenance and oil and gas fabrication
50 50
(c) Held through Sapura Engineering Sdn. Bhd.
*Best Wide Engineering (M) Sdn. Bhd.
Malaysia Undertakes engineering and technical works
– 30
Matrix Maintenance Sdn. Bhd. Malaysia Maintenance contractors for petrol chemical plants and general industries
30 30
(d) Held through Sapura Upstream Assets Sdn. Bhd.
SapuraOMV Upstream Sdn. Bhd. and its subsidiaries
Malaysia Investment holding, exploration, development and production of crude, oil and natural gas
50 50
(e) Held through Sapura Energy Ghana Limited
^Intesoll Sapura Offshore Limited Ghana Dormant 49 –
The financial statements of the associates that are not coterminous with those of the Company are as follows:
Financial year end
(i) Geowell Sdn. Bhd. 31 December
(ii) Labuan Shipyard & Engineering Sdn. Bhd. 31 December
(iii) Matrix Maintenance Sdn. Bhd. 31 December
(iv) Best Wide Engineering (M) Sdn. Bhd. 30 November
(v) SapuraOMV Upstream Sdn. Bhd. 31 December
(vi) Intesoll Sapura Offshore Limited 31 December
For the purpose of applying the equity method of accounting, the 12 months ended 31 January 2022 management accounts have been used.
* Disposed on 1 November 2021^ Acquired on 5 May 2021
142
Financial Statements
NOTES TO THE FINANCIAL STATEMENTS– 31 January 2022

16. INVESTMENT IN ASSOCIATES (CONT’D.)
(ii) Information relating to the associates:
Summarised financial information of the Group’s material associates comprising SapuraOMV Upstream and its subsidiaries (“SapuraOMV Group”) is set out below.
(a) Summarised statement of financial position and reconciliation to the carrying amount of the Group’s interest in associates:
2022RM’000
2021RM’000
Current assets
Cash and cash equivalents 356,421 181,901
Other current assets 489,522 139,172
Total current assets 845,943 321,073
Non-current assets held for sale* – 402,998
845,943 724,071
Non-current assets
Other non-current assets 6,853,732 7,422,742
Total assets 7,699,675 8,146,813
Current liabilities
Other current liabilities 661,290 191,744
Liabilities directly associated to assets held for sale* – 354,350
661,290 546,094
Non-current liabilities
Borrowings 52,400 1,716,869
Other non-current liabilities 2,973,663 1,729,173
Total non-current liabilities 3,026,063 3,446,042
Total liabilities 3,687,353 3,992,136
Net assets 4,012,322 4,154,677
Interest in associates 50% 50%
Carrying value of interest in the associates 2,006,161 2,077,339
* During the previous financial year, certain assets and liabilities have been classified as held for sale. The sale has been completed in the current financial year.
Sap
ura
En
erg
y B
erh
ad
An
nu
al R
ep
ort
20
22
143
Financial Statements

16. INVESTMENT IN ASSOCIATES (CONT’D.)
(ii) Information relating to the associates (cont’d.):
(b) Summarised statement of comprehensive income:
2022RM’000
2021RM’000
Revenue 1,212,115 1,051,606
Operating expenses (487,681) (422,889)
Depletion, depreciation and amortisation (610,180) (491,432)
Provision for impairment (281,720) (47,481)
Interest income 756 6,433
Interest expense (54,901) (86,076)
(Loss)/profit before tax (221,611) 10,161
Income tax expense (59,718) (86,359)
Loss after tax (281,329) (76,198)
Other comprehensive income/(loss) 138,974 (33,341)
Total comprehensive loss (142,355) (109,539)
(c) Aggregate information of other associates that are not individually material:
2022RM’000
2021RM’000
Carrying value of interest in associates 29,560 26,481
Share of profit before tax 3,259 10,654
Share of total comprehensive income 3,259 10,654
17. INVESTMENT IN JOINT VENTURES
Group
2022RM’000
2021RM’000
Unquoted shares, at cost 192,531 196,211
Share of post-acquisition reserves 1,689,896 1,496,490
1,882,427 1,692,701
Shareholders’ advances to joint ventures * 286,182 312,890
2,168,609 2,005,591
* The shareholders’ advances are unsecured, non-interest bearing and treated as deemed investment.
144
Financial Statements
NOTES TO THE FINANCIAL STATEMENTS– 31 January 2022

17. INVESTMENT IN JOINT VENTURES (CONT’D.)
Details of the joint ventures are as follows:
Name of CompanyCountry of
Incorporation Principal Activities
Proportion ofOwnership Interest
2022%
2021%
(a) Held through Sapura Drilling Probadi Sdn. Bhd.
~Uzmal Oil Inc. Uzbekistan Oilfield production – 50
(b) Held through Sapura Nautical Essence Sdn. Bhd.
SapuraAcergy Sdn. Bhd. Malaysia Dormant 50 50
SapuraAcergy Assets Pte. Ltd. Federal Territory of Labuan,
Malaysia
Dormant 49 49
(c) Held through SapuraAcergy Sdn. Bhd.*SapuraAcergy (Australia) Pty. Ltd. Australia Dormant 50 50
(d) Held through Sapura Nautical Power Pte. Ltd.L&T Sapura Shipping Private Limited India Vessel owner and chartering 40 40
L&T Sapura Offshore Private Limited India Provision of engineering and installation services
40 40
(e) Held through Sapura Offshore Sdn. Bhd.Seabras Sapura Participações S.A. Brazil Investment holding 50 50
Seabras Sapura Holding, GmbH Austria Investment holding 50 50
(f) Held through Seabras Sapura Participações S.A.Sapura Navegação Maritima S.A. Brazil Vessel owner and chartering 50 50
(g) Held through Seabras Sapura Holding, GmbHSeabras Sapura PLSV Holding GmbH Austria Investment holding 50 50
~ Disposed on 24 December 2021* Commenced liquidation since 1 February 2018
Sap
ura
En
erg
y B
erh
ad
An
nu
al R
ep
ort
20
22
145
Financial Statements

17. INVESTMENT IN JOINT VENTURES (CONT’D.)
Details of the joint ventures are as follows (cont’d.):
Name of CompanyCountry of
Incorporation Principal Activities
Proportion ofOwnership Interest
2022%
2021%
(h) Held through Seabras Sapura PLSV Holding GmbH
Seabras Sapura Holdco Ltd. Bermuda Investment holding 50 50
Sapura Diamante GmbH Austria Vessel owner and chartering 50 50
Sapura Topazio GmbH Austria Vessel owner and chartering 50 50
Sapura Onix GmbH Austria Vessel owner and chartering 50 50
Sapura Jade GmbH Austria Vessel owner and chartering 50 50
Sapura Rubi GmbH Austria Vessel owner and chartering 50 50
(i) Held through Seabras Sapura Holdco Ltd.
Seabras Sapura Talent Ltd. Bermuda Provision for manpower services 50 50
TL Offshore PLSV1 Ltd. Bermuda Dormant 50 50
TL Offshore PLSV2 Ltd. Bermuda Dormant 50 50
TL Offshore PLSV3 Ltd. Bermuda Dormant 50 50
TL Offshore PLSV4 Ltd. Bermuda Dormant 50 50
TL Offshore PLSV5 Ltd. Bermuda Dormant 50 50
(j) Held through Sapura Navegação Maritima S.A.
Let’s Log Serviços Intergrados de Logística Ltda.
Brazil Management of general warehouses and deposits
50 50
(k) Held through Sapura Services Sdn. Bhd.
Sapura Baker Hughes TPS Sdn. Bhd. Malaysia Provision of repair and maintenance services and sales of parts to the energy sector
51 51
(l) Held through Sapura Saudi Arabia Company
^Rawabi Sapura Limited Company Saudi Arabia Dormant 50 –
^ Acquired on 1 November 2021
146
Financial Statements
NOTES TO THE FINANCIAL STATEMENTS– 31 January 2022

17. INVESTMENT IN JOINT VENTURES (CONT’D.)
Details of the joint ventures are as follows (cont’d.):
The annual financial statements of the joint ventures that are not coterminous with those of the Company are as follows:
Financial year end
(i) L&T Sapura Shipping Private Limited 31 March
(ii) L&T Sapura Offshore Private Limited 31 March
(iii) Seabras Sapura Holding, GmbH 31 December
(iv) Seabras Sapura Participações S.A. 31 December
(v) Seabras Sapura Talent Ltd. 31 December
(vi) Sapura Navegação Maritima S.A. 31 December
(vii) Seabras Sapura PLSV Holding GmbH 31 December
(viii) Sapura Diamante GmbH 31 December
(ix) Sapura Topazio GmbH 31 December
(x) Seabras Sapura Holdco Ltd. 31 December
(xi) Sapura Onix GmbH 31 December
(xii) Sapura Jade GmbH 31 December
(xiii) Sapura Rubi GmbH 31 December
(xiv) Rawabi Sapura Limited Company 31 December
For the purpose of applying the equity method of accounting, the 12 months ended 31 January 2022 management accounts have been used.
Information relating to the joint ventures:
(a) Summarised financial information of the Group’s material joint ventures is set out below. The Group’s material joint venture consist of the Brazilian E&C operation held through Seabras Sapura Holding, GmbH and Seabras Sapura Participações S.A. and its subsidiaries.
(i) Summarised statements of financial position and reconciliation to the carrying amount of the Group’s interest in material joint venture:
2022RM’000
2021RM’000
Current assets
Cash and cash equivalents^ 355,716 511,421
Other current assets 427,926 359,801
Total current assets 783,642 871,222
Non-current assets
Cash and cash equivalents^ 158,439 166,703
Other non-current assets 5,975,860 5,799,726
Total non-current assets 6,134,299 5,966,429
Total assets 6,917,941 6,837,651
^ Included in the cash and cash equivalents are RM397.1 million (2021: RM378.4 million), pledged as security over the borrowings as at 31 January 2022.
Sap
ura
En
erg
y B
erh
ad
An
nu
al R
ep
ort
20
22
147
Financial Statements

17. INVESTMENT IN JOINT VENTURES (CONT’D.)
Information relating to the joint ventures (cont’d.):
(a) (i) Summarised statements of financial position and reconciliation to the carrying amount of the Group’s interest in material joint venture (cont’d.):
2022RM’000
2021RM’000
Current liabilities
Borrowings# 370,703 345,882
Other current liabilities 1,917,994 1,849,763
Total current liabilities 2,288,697 2,195,645
Non-current liabilities
Borrowings# 1,115,485 1,632,561
Other non-current liabilities 172,066 61,163
Total non-current liabilities 1,287,551 1,693,724
Total liabilities 3,576,248 3,889,369
Net assets 3,341,693 2,948,282
Interest in joint ventures 50% 50%
Carrying value of interest in joint ventures 1,670,847 1,474,141
Shareholders’ advances 286,182 312,890
Net carrying value of interest in joint ventures 1,957,029 1,787,031
# The borrowings are secured by the joint ventures’ vessels.
(ii) Summarised statements of comprehensive income:
2022RM’000
2021RM’000
Revenue 1,423,792 1,485,981
Operating expenses (704,449) (740,000)
Depreciation and amortisation (323,019) (313,621)
Interest income 4,124 16,334
Interest expense (153,146) (151,268)
Profit before tax 247,302 297,426
Income tax (expense)/credit (1,494) 10,595
Profit after tax 245,808 308,021
Other comprehensive income/(loss) 147,604 (135,267)
Total comprehensive income 393,412 172,754
148
Financial Statements
NOTES TO THE FINANCIAL STATEMENTS– 31 January 2022

17. INVESTMENT IN JOINT VENTURES (CONT’D.)
Information relating to the joint ventures (cont’d.):
(b) Aggregate information of joint ventures that are not individually material:
2022RM’000
2021RM’000
Carrying value of interest in joint ventures 211,580 218,560
Share of (loss)/profit after tax (4,087) 32,261
Share of total comprehensive income 12,819 95,850
Dividends paid during the year to the Group 16,119 6,364
18. DEFERRED TAX
Group Company
2022RM’000
2021RM’000
2022RM’000
2021RM’000
At 1 February 2021/2020 (17,589) (53,573) (16,318) (13,305)
Recognised in the profit or loss (1,853) 36,304 16,318 (3,013)
Exchange differences 1,874 (320) – –
At 31 January (17,568) (17,589) – (16,318)
Presented after appropriate offsetting as follows:
Deferred tax assets (103,657) (120,336) – (16,318)
Deferred tax liabilities 86,089 102,747 – –
(17,568) (17,589) – (16,318)
The components and movements of deferred tax liabilities and assets during the financial year prior to offsetting are as follows:
Deferred tax liabilities of the Group:
Acceleratedcapital
allowancesRM’000
OthersRM’000
TotalRM’000
At 1 February 2021 156,011 38,826 194,837Recognised in the profit or loss (51,339) 33,371 (17,968) Exchange differences 2,688 1,948 4,637
At 31 January 2022 107,360 74,145 181,506
At 1 February 2020 138,733 37,763 176,496
Recognised in the profit or loss 17,386 1,769 19,155
Exchange differences (108) (706) (814)
At 31 January 2021 156,011 38,826 194,837
Sap
ura
En
erg
y B
erh
ad
An
nu
al R
ep
ort
20
22
149
Financial Statements

18. DEFERRED TAX (CONT’D.)
Deferred tax assets of the Group:
Unutilised taxlosses and
unabsorbedcapital
allowancesRM’000
Provisionsfor
liabilitiesRM’000
OthersRM’000
TotalRM’000
At 1 February 2021 (173,781) (31,603) (7,042) (212,426) Recognised in the profit or loss 35,949 (17,633) (2,201) 16,115 Exchange differences 17 – (2,780) (2,763)
At 31 January 2022 (137,815) (49,236) (12,023) (199,074)
At 1 February 2020 (200,034) (17,654) (12,381) (230,069)
Recognised in the profit or loss 25,892 (14,283) 5,540 17,149
Exchange differences 361 334 (201) 494
At 31 January 2021 (173,781) (31,603) (7,042) (212,426)
Deferred tax assets of the Company:
Unutilised taxlosses and
unabsorbedcapital
allowancesRM’000
Provisionsfor
liabilitiesRM’000
TotalRM’000
At 1 February 2021 (14,622) (1,696) (16,318) Recognised in the profit or loss 16,318 – 16,318
At 31 January 2022 1,696 (1,696) –
At 1 February 2020 (8,261) (5,044) (13,305)
Recognised in the profit or loss (6,361) 3,348 (3,013)
At 31 January 2021 (14,622) (1,696) (16,318)
During the financial year, the unutilised tax losses, unabsorbed capital allowances and other deductible temporary differences of the Group that have not been recognised as deferred tax assets amounted to RM4,664.7 million (2021: RM3,468.4 million).
The unutilised tax losses of the entities in the Group are available for offsetting against future taxable profits, subject to no substantial changes in shareholdings under Income Tax Act, 1967 and guidelines issued by the tax authority. Deferred tax asset has not been recognised in respect of these items as the entities in the Group does not foresee its ability to utilise the business losses in near future.
In accordance with the provision of Finance Act 2021 of Malaysia, the utilisation of unused tax losses will be limited to ten years (2021: seven years) with effect from year of assessment 2019.
150
Financial Statements
NOTES TO THE FINANCIAL STATEMENTS– 31 January 2022

19. DERIVATIVES
The Group has entered into Islamic Cross-Currency Swap (“ICRCS”) contracts with various banks to hedge part of the Group’s borrowings.
Details of the derivatives amount at reporting date are as follows:
Group
2022 2021
NotionalValue
RM’000
LiabilitiesFair Value
RM’000
NotionalValue
RM’000
AssetsFair Value
RM’000
Islamic Cross-Currency Swap 2,528,606 (24,644) 2,528,606 55,083
The Group treats the derivatives as cash flow hedges. Prior to the refinancing exercise, the Group uses cash flow hedges to mitigate the risk of variability of future cash flows attributable to foreign currency fluctuation over the hedging period on its borrowings.
Upon completion of the refinancing on 31 March 2021, the cumulative amount in the cash flow hedge has been reclassified to profit or loss due to discontinuance of hedge accounting. Thereafter any changes in fair baler of the ICRCS are recognised in profit or loss.
On 7 March 2022, the 5 years ICRCS matured and in accordance to the ICRCS contracts, the 5 years ICRCS was settled. The financial impact of this settlement will be recognised in the financial year ending 31 January 2023.
20. INVENTORIES
Group
2022RM’000
2021RM’000
At costConsumables, materials and spares 397,051 385,109
Work-in-progress 31,790 38,142
428,841 423,251
The cost of inventories recognised as an expense during the financial year amounted to RM63.6 million (2021: RM91.9 million).
During the year, the Group has written down inventories totalling RM38.9 million (2021: RM0.1 million).Sa
pu
ra E
ner
gy
Ber
had
A
nn
ual
Re
po
rt 2
02
2
151
Financial Statements

21. AMOUNTS DUE FROM SUBSIDIARIES
Company
2022RM’000
2021RM’000
Non-current assetsAmounts due from subsidiaries 550,080 558,279
Less: Provision for expected credit loss (539,088) (97,663)
10,992 460,616
Current assetsAmounts due from subsidiaries 1,352,813 1,302,657
Less: Provision for expected credit loss (1,271,242) (849,708)
81,571 452,949
Amounts due from subsidiaries are unsecured, interest free and repayable on demand except for RM125.9 million (2021: RM123.6 million) which is subject to interest rates ranging from 3.43% to 8.00% (2021: 3.43% to 8.00%) per annum.
The Company recognised a net provision for expected credit loss on amounts due from its subsidiaries of RM878.7 million (2021: net reversal of RM54.5 million) in the current financial year.
The movements in provision for expected credit loss amounting to RM862.9 million, represents:
(a) RM858.4 million being the current year impairment movement and;
(b) RM4.5 million of reversal made in the current year arising from changes in intercompanies balances.
Further details on related party transactions are disclosed in Note 39.
Other information on financial risks are disclosed in Note 40.
152
Financial Statements
NOTES TO THE FINANCIAL STATEMENTS– 31 January 2022

22. TRADE AND OTHER RECEIVABLES
Group Company
2022RM’000
2021RM’000
2022RM’000
2021RM’000
Non-current assets
Trade receivablesThird parties 13,790 2,513 – –
Retention sums 31,828 22,331 – –
45,618 24,844 – –
Less: Provision for expected credit loss (10,360) – – –
35,258 24,844 – –
Other receivablesAmounts due from joint ventures 192,302 19,282 – –
Total non-current trade and other receivables 227,560 44,126 – –
Current assets
Trade receivablesThird parties 623,975 716,207 – –
Less: Provision for expected credit loss (78,478) (39,175) – –
545,497 677,032 – –
Other receivablesAmounts due from:
Related parties 2,838 2,838 2,838 2,838
Joint ventures and associates 240,840 435,484 17,728 17,781
243,678 438,322 20,566 20,619
Deposits and prepayments 76,587 76,890 9,714 15,160
Sundry receivables 313,431 280,774 13,068 12,589
390,018 357,664 22,782 27,749
Less: Provision for expected credit loss (40,007) (38,690) (20,566) –
Other receivables 348,582 318,974 2,216 27,749
Total current trade and other receivables 1,139,186 1,434,328 22,782 48,368Sa
pu
ra E
ner
gy
Ber
had
A
nn
ual
Re
po
rt 2
02
2
153
Financial Statements

22. TRADE AND OTHER RECEIVABLES (CONT'D.)
(a) Trade receivables
Trade receivables are non-interest bearing. The Group's normal trade credit term ranges from 30 to 90 days (2021: 30 to 90 days). Other credit terms are assessed and approved on a case-by-case basis. Overdue balances are reviewed regularly by senior management. Trade receivables are recognised at original invoice amounts which represent their fair values on initial recognition.
Included in trade receivables of the Group are retention sums from contract customers of RM31.8 million (2021: RM22.3 million). These retention sums from contract customers are unsecured, interest free and are expected to be collected in accordance with the terms of the respective contract agreements.
Movement in provision for impairment of trade receivables based on lifetime ECL are as follows:
Group
2022RM’000
2021RM’000
At 1 February 2021/2020 39,175 39,880
Charge for the year 50,207 –
Exchange differences (544) (705)
At 31 January 88,838 39,175
(b) Sundry receivables
Sundry receivables, which include GST and VAT receivables, are unsecured, interest free and repayable on demand.
Movement in provision for impairment of other receivables based on lifetime ECL are as follows:
Group
2022RM’000
2021RM’000
At 1 February 2021/2020 38,690 –Charge for the year (Note 8) – 38,690
Exchange differences 1,317 –
At 31 January 40,007 38,690
Details of how the credit risk is determined and managed is described in Note 40(d).
(c) Amounts due from joint ventures
Non-current assets
Amounts due from joint ventures are unsecured and interest free.
Current assets
Amounts due from joint ventures are unsecured, interest free and repayable on demand, except for RM201.1 million (2021: RM194.8 million) provided to certain joint ventures which is subject to interest rates ranging from 3.0% to 4.5% (2021: 3.0% to 5.5%) per annum.
154
Financial Statements
NOTES TO THE FINANCIAL STATEMENTS– 31 January 2022

23. CONTRACT ASSETS/(LIABILITIES)
Group
2022RM’000
2021RM’000
Contract assetsCurrent 776,863 1,752,716
Provision for expected credit loss (49,819) –
727,044 1,752,716
Contract liabilitiesNon-current (10,584) (37,790)
Current (817,139) (239,572)
(827,723) (277,362)
Group
2022RM’000
2021RM’000
Revenue recognised which was included in construction contract liabilities at the beginning of the financial year 239,572 199,436
Revenue recognised from performance obligations satisfied in the previous periods 102,219 –
The Group receives payments from customers based on a billing schedule, as established in the contracts. The contract asset relates the rights to consideration in exchange for goods or services transferred to the customer before the customer pays the consideration or before payment is due. The contract liability relates to payments received in advance of performance under the contract. Changes in the contract asset and liabilities are due to the progress billings during the year and Group's performance under the contract.
24. CASH, DEPOSITS AND BANK BALANCES
Group Company
2022RM’000
2021RM’000
2022RM’000
2021RM’000
Cash on hand and at banks 394,422 331,733 1,219 5,231
Deposits with licensed banks 47,792 26,726 – –
Cash pledged with bank (restricted) 275,537 130,507 – –
Cash, deposits and bank balances 717,751 488,966 1,219 5,231
Included in cash, deposits and bank balances of the Group is amounts of RM275.5 million (2021: RM130.5 million) which are restricted for use due the loan covenants and business requirements.
Other information on financial risks of cash and cash equivalents are disclosed in Note 40.
Sap
ura
En
erg
y B
erh
ad
An
nu
al R
ep
ort
20
22
155
Financial Statements

24. CASH, DEPOSITS AND BANK BALANCES (CONT’D.)
The range of the interest rate on deposit with licensed banks (per annum) and the range of remaining maturities as at the reporting date are as follows:
Group Company
2022RM’000
2021RM’000
2022RM’000
2021RM’000
Interest rate (%) 0.01–2.60 0.10–2.60 – –
Maturities (days) 1–90 1–90 – –
25. NON-CURRENT ASSET CLASSIFIED AS HELD FOR SALE
During the financial year, a non-current asset within the Group has been identified for disposal as part of the Group’s Reset Plan to divest assets. Efforts to sell the asset have commenced, and a sale is expected to be completed within a year from the reporting date. Consequently, the asset has been reclassified from property, plant and equipment to non-current asset held for sale. Impairment to the asset prior to the reclassification is disclosed in Note 13.
The carrying value of this asset is the same as its carrying value before it was being reclassified from property, plant and equipment.
26. SHARE CAPITAL
Group and Company
Number of shares Amount
2022‘000
2021‘000
2022RM’000
2021RM’000
Issued and fully paid:
Ordinary shares
At 31 January 15,979,080 15,979,080 10,872,078 10,872,078
The holders of the ordinary shares are entitled to receive dividends as declared from time to time and are entitled to one vote per share at meetings of the Company. All ordinary shares rank equally with regards to the Group's and the Company’s assets.
27. ISLAMIC REDEEMABLE CONVERTIBLE PREFERENCE SHARES ("RCPS-i")
Group and Company
Number of shares Amount
2022‘000
2021‘000
2022RM’000
2021RM’000
RCPS-i
At 31 January 2,396,862 2,396,862 982,713 982,713
156
Financial Statements
NOTES TO THE FINANCIAL STATEMENTS– 31 January 2022

27. ISLAMIC REDEEMABLE CONVERTIBLE PREFERENCE SHARES (“RCPS-i”) (CONT’D.)
The key features of the RCPS-i are as follows:
(i) The RCPS-i shall be converted into new ordinary shares of the Company on the maturity date (i.e. 29 January 2024) without the payment of any consideration (cash or otherwise) and in accordance with the conversion ratio.
(ii) The conversion ratio of the RCPS-i is one new ordinary share of the Company for every one RCPS-i held.
(iii) The RCPS-i shall carry the right to receive preferential dividends, out of the distributable profits of the Company earned from the first day of the calendar month following the issue date, when declared and approved by the Board of the Company, at the expected preferential dividend rate of five percent (5%) per annum.
(iv) The Company may at any time after the issue date, at its discretion, redeem wholly or in part on a pro rata basis the outstanding RCPS-i by giving not less than thirty (30) days’ notice in writing to the RCPS-i holders of its intention to do so, subject to compliance with the Companies Act 2016. The redemption price, payable in cash, shall be the aggregate of:
(a) The issue price of RCPS-i;
(b) Any preferential dividends declared but unpaid as at the redemption date;
(c) Any deferred dividends as at the redemption date; and
(d) A redemption adjustment that yields an effective return of ten percent (10%) per annum, computed based on the internal rate of return formula, from the issue date (i.e. 29 January 2019) and up to the redemption date, out of the distributable profits of the Company and after taking into account (a), (b) and (c) above and all preferential dividend declared and paid up to the redemption date.
(v) The RCPS-i shall rank equally amongst themselves, and will rank ahead in point of priority to the holders of the ordinary shares of the Company and all other classes of shares (if any) in the Company, in respect of payment of dividends and payment out of the assets of the Company upon any liquidation, dissolution or winding up of the Company, provided always that the Board of the Company approves such payment of dividends and payment out of the assets of the Company on this basis and further affirms the priority of payment to the holders of the RCPS-i.
28. SHARES HELD UNDER TRUST
Group and Company
Number of shares Amount
2022‘000
2021‘000
2022RM’000
2021RM’000
At 31 January 7,276 7,276 11,587 11,587
The trustee appointed by the Company purchased its issued ordinary shares from the open market for the purpose of the share bonus scheme in relation to LTIP through its internally generated funds. The LTIP scheme which have been fully vested in the previous financial year had the following features:
(a) The LTIP scheme is intended for eligible executive directors and employees of the Group of which annual grants may be made to attract, retain and incentivise such key employees and executive directors for the long-term success and growth of the Group as well as to enhance shareholders' value.
(b) The selected executive directors and employees must elect in writing to participate in the scheme.
(c) The vesting of the new shares is over a period of 2 years (subsequent to grant date), provided that the recipient remains in the Group’s employment.
Sap
ura
En
erg
y B
erh
ad
An
nu
al R
ep
ort
20
22
157
Financial Statements

29. WARRANTS RESERVE
The warrants reserve represents the cumulative fair value of the warrants yet to be exercised.
The warrants are valid to be exercised for a period of 7 years from its issue date and ending on 23 January 2026 ("Exercise Period"). During the Exercise Period, each warrant shall entitle the registered holder to subscribe for one new ordinary share of the Company at an exercise price of RM0.49 per warrant in accordance with the provisions of the Deed Poll dated 6 December 2018. Any warrants not exercised will lapse thereafter and cease to be valid.
As at 31 January 2022, the entire 998,692,020 warrants remain unexercised.
30. OTHER RESERVES
Group Company
2022RM’000
2021RM’000
2022RM’000
2021RM’000
Foreign currency translation reserve 1,647,737 1,486,591 – –
Hedge reserve (13,305) (42,196) – –
Merger reserve 51,989 51,989 – –
ESOS reserve 104,934 122,287 104,934 122,287
1,791,355 1,618,671 104,934 122,287
Group
2022RM’000
2021RM’000
The movements in the reserves are as follows:
Foreign currency translation reserve
At 1 February 2021/2020 1,486,591 1,582,309
Exchange differences on translation of foreign subsidiaries, joint ventures and associates 161,146 (95,718)
At 31 January 1,647,737 1,486,591
158
Financial Statements
NOTES TO THE FINANCIAL STATEMENTS– 31 January 2022

30. OTHER RESERVES (CONT'D.)
Group
2022RM’000
2021RM’000
Hedge reserve
At 1 February 2021/2020 (42,196) (60,248)
Changes in fair value of derivatives held by a subsidiary and joint ventures 28,891 19,374
Foreign exchange impact on hedged items (18,952) (17,754)
Amount reclassified to profit or loss 18,952 16,432
At 31 January (13,305) (42,196)
Group Company
2022RM’000
2021RM’000
2022RM’000
2021RM’000
ESOS reserve
At 1 February 2021/2020 122,287 130,963 122,287 130,963
Lapsed of certain ESOS (17,353) (8,676) (17,353) (8,676)
At 31 January 104,934 122,287 104,934 122,287
The nature and purpose of each category of reserve are as follows:
(a) Foreign currency translation reserve
The foreign currency translation reserve is used to record exchange differences arising from the translation of the financial statements of foreign operations whose functional currencies are different from that of the Group’s presentation currency. It is also used to record the exchange differences arising from monetary items which form part of the Group’s net investment in foreign operations, where the monetary item is denominated in either the functional currency of the reporting entity or the foreign operation.
(b) Hedge reserve
The hedge reserve comprises the effective portion of the cumulative net change in the fair value of the cash flow hedge instruments related to hedged transactions. The hedge reserve includes the share of hedge reserve of a subsidiary and joint ventures.
The cumulative amount in the hedge reserve attributable to ICRCS contracts of a subsidiary has been reclassified to profit or loss due to discontinuance of hedge accounting, upon completion of the refinancing on 31 March 2021. The ICRCS contracts remain in effect as at 31 January 2022. The remaining hedge reserve relates to the Group’s share of the hedge reserve of a joint venture.
(c) Merger reserve
The merger reserve relates to the excess of the consideration paid over the share capital and reserves of Sapura Drilling Probadi Sdn. Bhd. in previous years.
The difference between the recorded carrying value of the investment in Sapura Drilling Probadi Sdn. Bhd. (that is the value of the shares of the Company issued as consideration) and the value of Sapura Drilling Probadi Sdn. Bhd.’s shares transferred to the Company had been reflected within equity as merger reserve in the consolidated financial statements.
Sap
ura
En
erg
y B
erh
ad
An
nu
al R
ep
ort
20
22
159
Financial Statements

30. OTHER RESERVES (CONT’D.)
The nature and purpose of each category of reserve are as follows (cont’d.):
(d) ESOS reserve
The ESOS reserve represents the equity-settled share options granted to the eligible executive directors and senior management as further discussed in Note 36.
The reserve is made up of the cumulative value of services received from the eligible executive directors and senior management recorded from the grant date of equity-settled share options, and is reduced by the expiry, exercise or lapsed of the share options.
31. BORROWINGS
Group
2022RM’000
2021RM’000
Short term borrowings
Unsecured:
Conventional borrowingsRevolving credits 357,263 1,762,856
Trade financing 89,436 93,251
Term loans 2,997,035 86,780
3,443,734 1,942,887
Islamic financingsIslamic Facility – 1,157,643
Sukuk Programme 7,214,287 162,927
7,214,287 1,320,570
10,658,021 3,263,457
Long term borrowings
Unsecured:
Islamic financingsSukuk Programme – 4,402,290
Conventional borrowingsTerm loans – 2,666,435
– 7,068,725
160
Financial Statements
NOTES TO THE FINANCIAL STATEMENTS– 31 January 2022

31. BORROWINGS (CONT'D.)
Group
2022RM’000
2021RM’000
Total borrowings
Islamic financingsIslamic Facility – 1,157,643
Sukuk Programme 7,214,287 4,565,217
7,214,287 5,722,860
Conventional borrowingsTerm loans 2,997,035 2,753,215
Trade financing 89,436 93,251
Revolving credits 357,263 1,762,856
3,443,734 4,609,322
10,658,021 10,332,182
Maturity of borrowings:
Within one year* 10,658,021 3,263,457
More than 1 year and less than 2 years – 2,999,290
More than 2 years and less than 5 years – 4,069,435
10,658,021 10,332,182
* Included under short-term borrowings are Term loans and Sukuk Programme amount to RM10,658.0 million due that has been classified as current liabilities due to breach of loan covenant as further described in the Note 31(d)(ii).
(a) The range of the interest rates and profit sharing (per annum) during the financial year for borrowings was as follows:
Group
2022%
2021%
Term loans, Islamic Facility and Sukuk Programme 2.11 to 6.40 2.11 to 6.52
Revolving credits and Trade financing 1.61 to 4.49 1.60 to 4.46
Sa
pu
ra E
ner
gy
Ber
had
A
nn
ual
Re
po
rt 2
02
2
161
Financial Statements

31. BORROWINGS (CONT’D.)
(b) Included in the Group’s borrowings are as follows:
Short term borrowings Long term borrowings Total borrowings
USDdenomination
RM’000
RM denomination
RM’000
USDdenomination
RM’000
RM denomination
RM’000
USDdenomination
RM’000
RM denomination
RM’000
As at 31 January 2022
UnsecuredRevolving credits – 357,263 – – – 357,263Trade financing – 89,436 – – – 89,436Term loans 2,164,428 832,607 – – 2,164,428 832,607Sukuk Programme 834,084 6,380,203 – – 834,084 6,380,203
2,998,512 7,659,509 – – 2,998,512 7,659,509
Total 10,658,021 – 10,658,021
As at 31 January 2021
UnsecuredRevolving credits 721,888 1,040,968 – – 721,888 1,040,968
Trade financing – 93,251 – – – 93,251
Term loans 86,780 – 2,666,435 – 2,753,215 –
Islamic Facility 635,063 522,580 – – 635,063 522,580
Sukuk Programme – 162,927 1,113,078 3,289,212 1,113,078 3,452,139
1,443,731 1,819,726 3,779,513 3,289,212 5,223,244 5,108,938
Total 3,263,457 7,068,725 10,332,182
(c) Liabilities arising from financing activities are liabilities for which cash flows were, or future cash flows will be, classified in the statements of cash flows as cash flows from financing activities.
A reconciliation of liabilities arising from financing activities is as follows:
At1.2.2021RM’000
Net cash changes
RM’000
Non-cash changes
At31.1.2022
RM’000
Amortisationof borrowing
cost^RM’000
Foreign exchangemovement
RM’000
Borrowings* 10,332,182 235,965 63,422 26,452 10,658,021
162
Financial Statements
NOTES TO THE FINANCIAL STATEMENTS– 31 January 2022

31. BORROWINGS (CONT’D.)
(c) Liabilities arising from financing activities are liabilities for which cash flows were, or future cash flows will be, classified in the statements of cash flows as cash flows from financing activities (cont’d.).
A reconciliation of liabilities arising from financing activities is as follows (cont’d.):
At1.2.2020RM’000
Net cash changes
RM’000
Non-cash changes
At31.1.2021
RM’000
Amortisationof borrowing
cost^RM’000
Foreign exchangemovement
RM’000
Borrowings* 10,256,094 71,479 49,517 (44,908) 10,332,182
* Term loans, revolving credits, trade financing, Islamic Facility and Sukuk Programme^ Charged to profit or loss
(d) Other information relating to borrowings:
(i) On 26 February 2021, the Company through its wholly-owned subsidiary, Sapura TMC Sdn. Bhd. (“Sapura TMC”), had signed an agreement for its additional working capital facilities of up to RM700 million with Maybank Islamic Berhad (“Maybank Islamic Facility”).
With the acceptance of the Maybank Islamic Facility, the total facilities available for working capital purposes is now approximately RM1.2 billion being the combined value with the existing Multi-Option line under Trade Financing of up to USD135 million secured from CIMB Bank Berhad in November 2019, through its wholly-owned subsidiary, Sapura Fabrication Sdn. Bhd..
On 29 April 2022, Sapura TMC entered into a supplemental letter of offer for the utilisation of a revolving credit facility of zrm300 million under the Mybank Islamic Facility (the “RCF”). The RCF is secured by a mortagage over an asset.
(ii) On 29 March 2021, Sapura TMC had executed multi-currency financing facilities agreements (collectively, the “MCF 2021”) consisting of:
(a) the Conventional Facilities Agreement 2021; and
(b) the Sukuk Murabahah Issuance 2021 under the Multi-Currency Sukuk Programme (as described in the Company’s announcement dated 8 September 2015)
with a consortium of Malaysian banks for the Sukuk Murabahah Issuance 2021 and Malaysian, regional and international banks for the Conventional Facilities Agreement 2021.
The relevant participating banks have made available and Sapura TMC has drawn down the USD term loan facility of approximately USD602.1 million and the RM term loan facility of RM906.0 million under the Conventional Facilities Agreement 2021. In addition, Sapura TMC has also made further issuance of Sukuk Murabahah amounting to RM6,380.2 million and USD124.5 million in nominal value under the Multi-Currency Sukuk Programme.
The proceeds from the MCF 2021 have been utilised towards full settlement of all amounts payable and outstanding by Sapura TMC under a 2014 conventional facility, a 2015 Islamic facility, a 2017 conventional facility and the existing outstanding Sukuk Murabahah under the Multi-Currency Sukuk Programme.
The MCF 2021 has a tenure of 7 years and is guaranteed by the Company and material subsidiaries within the Group. The security package and restrictions for the MCF 2021, comprise, among others, a negative pledge over all assets of the Group (save for certain permitted security), debenture over Sapura TMC and assignments and charges over certain bank accounts. Sa
pu
ra E
ner
gy
Ber
had
A
nn
ual
Re
po
rt 2
02
2
163
Financial Statements

31. BORROWINGS (CONT’D.)
(d) Other information relating to borrowings (cont’d.):
(ii) On 29 March 2021, Sapura TMC had executed multi-currency financing facilities agreements (collectively, the “MCF 2021”) consisting of (cont’d.):
In March 2022, the Sapura TMC and the Obligors requested the Financiers under the MCF 2021 to waive any event of default which may arise as a result of:
(a) failure by the Sapura TMC and the Obligors, to comply with certain financial covenants under the MCF 2021;
(b) Restraining Order in relation to Sapura TMC and the Obligors, and the filing of any documents in connection with that Restraining Order; and
(c) failure by Sapura TMC or any of the Obligor of the MCF 2021 to pay certain amounts due and payable under the MCF 2021 during the 90-day period commencing from 7 March 2022.
In relation to (a) and (b) above, the requisite majority of the Financiers under the MCF 2021 have consented to these request and agreed not to take any Enforcement Action (as defined in the MCF 2021) in relation to any default which may arise as a result of:
(a) the failure by Sapura TMC and the Obligors to comply with certain financial covenants under the MCF 2021; and
(b) the restraining order in relation to Sapura TMC and the Obligors and the filing of any documents in connection with the restraining order.
In relation to (c) above, the Financiers under the MCF 2021 have unanimously consented and agreed not to take any Enforcement Action (as defined in the MCF 2021) in relation to any default that may arise as a result of Sapura TMC or any of the Obligors failure to pay amounts due and payable under the MCF 2021 during the 90 days period commencing 7 March 2022. Accordingly, no Enforcement Action (including any acceleration of the amounts due under the MCF 2021) may be taken as a result of the occurrence of the foregoing events of default.
(iii) On 22 June 2021, the Company through its wholly-owned subsidiary, Sapura TMC had;
(a) made a lodgement to the Securities Commission Malaysia (“SC”) for the purpose of effecting the upsized and revised terms of the existing Multi-Currency Sukuk Programme, from up to RM7.0 billion in nominal value to up to RM10.0 billion in nominal value, established by Sapura TMC (“Sukuk Upsize”) under the SC’s new Guidelines on Unlisted Capital Market Products under the Lodge and Launch Framework; and
(b) duly executed the transaction documents for the Multi-Currency Sukuk Programme to reflect the Sukuk Upsize.
Upon lodgement with SC on 22 June 2021, the Multi-Currency Sukuk Programme has been upsized to up to RM10.0 billion in nominal value (or the equivalent of USD, converted at a notional exchange rate of USD1.00 = MYR4.15), and will continue to be guaranteed by the Company and the identified material subsidiaries within the Group. The existing security package for the Multi-Currency Sukuk Programme which comprise a debenture over Sapura TMC and assignments and charges over certain bank accounts, shall remain unchanged.
The Sukuk Upsize is part of the Group’s long-term capital management programme whereby the upsizing the limit of the Multi-Currency Sukuk Programme to up to RM10.0 billion in nominal value would provide additional headroom for lenders to participate in the Multi-Currency Sukuk Programme as an alternative funding platform for the Group moving forward.
(e) As required under MFRS 101: Presentation of Financial Statements, in the event of a breach of loan covenants on or before the end of reporting date, before the end of the reporting date which gives lender the rights to demand for immediate repayment, an entity is required to classify a liability as current as it no longer has the unconditional right to defer its settlement for at least twelve months after that date.
As at 31 January 2022, the Group breached certain financial covenants pursuant to the MCF 2021. As a result, the borrowings have been classified as current liabilities.
164
Financial Statements
NOTES TO THE FINANCIAL STATEMENTS– 31 January 2022

32. AMOUNTS DUE TO SUBSIDIARIES
Company
2022RM’000
2021RM’000
Non-current liabilityAmount due to a subsidiary 3,767,595 3,767,595
Current liabilitiesAmounts due to subsidiaries 1,301,626 1,052,379
Amounts due to subsidiaries are unsecured, interest free and repayable on demand, except for a loan of RM3,767.6 million (2021: RM3,767.6 million) which is subject to interest rate of 2% (2021: 2%) per annum above the cost of funds and with final payment due on 11 March 2026.
Further details on related party transactions are disclosed in Note 39.
Other information on financial risks of amounts due to subsidiaries are disclosed in Note 40.
33. TRADE AND OTHER PAYABLES
Group Company
2022RM’000
2021RM’000
2022RM’000
2021RM’000
Non-current liabilitiesOther payables 19,082 30,243 – –
Current liabilities
Trade payablesThird parties 2,264,536 1,940,546 – –
Other payablesStaff costs 54,539 41,509 7,709 2,205
Accruals 855,536 381,499 637 20,733
Sundry payables 369,209 193,246 94,156 51,240
1,279,284 616,254 102,502 74,178
Amounts due to: Joint ventures 104,857 87,824 – –
Associated companies 20,304 23,075 809 784
Related parties 1,480 1,346 35 24
126,641 112,245 844 808
3,670,461 2,669,045 103,346 74,986
Sap
ura
En
erg
y B
erh
ad
An
nu
al R
ep
ort
20
22
165
Financial Statements

33. TRADE AND OTHER PAYABLES (CONT’D.)
(a) Trade payables – Third parties
Trade payables are non-interest bearing and trade credit terms granted to the Group range from 30 days to 90 days (2021: 30 days to 90 days).
(b) Amounts due to joint ventures, associate companies and related parties
These amounts are unsecured, non-interest bearing and are repayable on demand.
34. PROVISION
The movement of provisions during the financial year are as follows:
Group Company
2022RM’000
2021RM’000
2022RM’000
2021RM’000
At 1 February 2021/2020 152,251 348,254 – –
Recognised during the year (Note 8) 1,307,101 255,462 44,700 –
Utilised during the year (662,782) (388,923) – –
Reversal during the year (Note 8) (187,214) (62,542) – –
At 31 January 609,356 152,251 44,700 –
The provision recognised in the Group represents the foreseeable losses arising from certain construction contracts.
Included in the provision of the Company is provision in relation to the breach of a tenancy agreement with a related party amounting to RM44.7 million (2021: RM Nil).
35. LEASE LIABILITIES
Group
2022RM’000
2021RM’000
Non-currentLease liabilities 8,745 9,631
CurrentLease liabilities 7,976 11,123
Total lease liabilities 16,721 20,754
166
Financial Statements
NOTES TO THE FINANCIAL STATEMENTS– 31 January 2022

35. LEASE LIABILITIES (CONT’D.)
The movement of lease liabilities during the year is as follows:
Group
2022RM’000
2021RM’000
As at 1 February 2021/2020 20,754 22,919
Additions 16,371 11,445
Payments (26,817) (14,682)
Interest expense (Note 7) 667 1,196
Exchange differences 5,746 (124)
As at 31 January 16,721 20,754
As allowed under MFRS 16, the Group and the Company had elected not to recognise the right-of-use assets and lease liabilities in relation to short-term lease.
The Group has total cash outflows for lease liabilities and short-term leases of RM417.5 million (2021: RM382.4 million).
The maturities of the lease liabilities as at 31 January 2022 are as follows:
Group
2022RM’000
2021RM’000
Within one year 7,976 11,123
More than 1 year but not later than 2 years 8,464 7,499
More than 2 years but not later than 5 years 281 2,132
16,721 20,754
Sap
ura
En
erg
y B
erh
ad
An
nu
al R
ep
ort
20
22
167
Financial Statements

36. EXECUTIVE SHARE OPTION SCHEME
The ESOS has been implemented effective from 13 December 2018.
Options are granted to the eligible executive directors and senior management employed on a full time basis at the discretion of the Board Nomination and Remuneration Committee (“BNRC”).
The key features of the ESOS are as follows:
(a) The maximum number of new ordinary shares of the Company which may be allotted and issued pursuant to the options that may be granted under the ESOS shall not in aggregate exceed ten percent (10%) of the total number of issued ordinary shares of the Company (excluding shares held under trust);
(b) The maximum number of options that may be granted under the ESOS to any one eligible person shall be at the sole and absolute discretion of the BNRC after taking into consideration the position, performance and length of service of the eligible person in the Group, or such other factors which the BNRC may in its absolute discretion deem fit, subject to the following:
(i) the eligible executive directors and senior management do not participate in the deliberation or discussion in respect of his/her own allocation; and
(ii) the number of new ordinary shares of the Company to be allocated to any eligible person who, either singly or collectively through persons connected with such eligible person, holds twenty percent (20%) or more of the total issued ordinary shares of the Company (excluding shares held under trust), does not exceed ten percent (10%) (or such percentage as allowable by the relevant authorities) of the total number of new ordinary shares of the Company to be issued under the ESOS.
(c) The option exercise price shall be determined by the Board upon recommendation of the BNRC to be the five (5) days weighted average market price of the ordinary shares of the Company, as quoted on Bursa Securities, immediately preceding the date of offer or with a premium or discount. In the event of a discount, the discount shall not be more than ten percent (10%) or such other percentage of discount as may be permitted by Bursa Securities or any other relevant authorities from time to time during the duration of the ESOS;
(d) The ESOS shall be in force for a duration of seven (7) years from the effective date of implementation of the ESOS. The BNRC may terminate the ESOS at any time during the duration of the ESOS subject to a notice period of at least thirty days being provided; and
(e) The ESOS is immediately exercisable upon granting. However, the grantee must not sell, transfer or assign any new ordinary shares of the Company obtained through the exercise of the options offered to the person under the ESOS within three (3) years from the date of offer.
168
Financial Statements
NOTES TO THE FINANCIAL STATEMENTS– 31 January 2022

36. EXECUTIVE SHARE OPTION SCHEME (CONT’D.)
Movement of share options
The following table illustrates the number of, and movements in, share options during the financial year:
Group and Company Number
2022’000
2021’000
Outstanding and exercisable at 1 February 2021/2020 1,193,637 1,278,326
Lapsed during the year (169,378) (84,689)
Outstanding and exercisable at 31 January 1,024,259 1,193,637
The remaining contractual life and expiry date for these options are as follows:
Group and Company
Tranche 1 Tranche 2
Remaining contractual life 5.96 years 6.19 years
Exercise price RM0.31 RM0.39
Granted date 14 December 2018 12 April 2019
Expiry date 12 December 2025 10 April 2026
Following the grant of options on 12 April 2019, the weighted average exercise price of the options granted to date was RM0.30.
Fair value of share options granted
The fair value of the share options granted under the ESOS is estimated at the grant date using a trinomial option pricing model, taking into account the terms and conditions upon which the instruments were granted.
The following table lists the inputs to the option pricing models are as follows:
Group and Company
Tranche 1 Tranche 2
Dividend yield 1.52% 1.52%
Expected volatility 35.5% 37.8%
Risk-free interest rate (per annum) 3.80% 3.80%
Expected life of option 7 years 7 years
The expected life of the options is based on the ESOS duration and is not necessarily indicative of exercise patterns that may occur. The expected volatility reflects the assumption that the historical volatility over a period, similar to the life of the options is indicative of future trends.
Sap
ura
En
erg
y B
erh
ad
An
nu
al R
ep
ort
20
22
169
Financial Statements

37. COMMITMENTS
Group
2022RM’000
2021RM’000
Capital expenditure
Approved and contracted for:
Property, plant and equipment 281,664 396,142
38. FINANCIAL GUARANTEE CONTRACTS AND CONTINGENT LIABILITIES
The nominal value of the financial guarantee contracts given by the Group and the Company are as follows:
Group Company
2022RM’000
2021RM’000
2022RM’000
2021RM’000
SecuredFinancial guarantee contracts given to financial institutions
for credit facilities and performance bonds granted to joint ventures and associate 606,251 722,233 – –
606,251 722,233 – –
UnsecuredFinancial guarantee contracts given on behalf of subsidiaries – – 1,021,090 1,181,744
606,251 722,233 1,021,090 1,181,744
The fair value of the financial guarantee contracts given to financial institutions for credit facilities granted to joint ventures are deemed immaterial as the value of the underlying collateral provided by the respective joint ventures is sufficient to cover the outstanding loan amounts. The credit facilities are secured by way of deposit pledged and legal charges over the vessels of the joint ventures.
Other contingent liabilities:
(a) On 31 January 2019, SapuraOMV (an associate company of the Group) entered into a facility agreement with OMV E&P for the OMV financing amounting to USD350.0 million (RM1,431.2 million). As security for this, Sapura Upstream Assets Sdn. Bhd. (a subsidiary of the Group) has pledged shares of SapuraOMV with a value of USD175.0 million (RM715.6 million) in favour of OMV E&P.
(b) On 1 October 2020 and 18 November 2020, the Inland Revenue Board of Malaysia (“IRB”) has raised assessments to Sapura TMC Sdn. Bhd. (“Sapura TMC”), for the years of assessment 2014 to 2019 in respect of the technical interpretation of tax laws in connection to its Treasury Management Centre status, deemed interest income on non-interest bearing intercompany balances and the tax treatment of interest income earned from year of assessment 2019. On 28 October 2020 and 3 December 2020, Sapura TMC has lodged the Notices of Appeal (“Forms Q”) against the assessments raised for the years of assessments 2014 to 2019 outlining the relevant grounds of appeal. Based on valid justifications and merits to appeal against the assessments, Sapura TMC is currently in formal discussion with the Dispute Resolution Department to resolve the matter at the earliest. On 25 April 2022, Sapura TMC has submitted a proposed settlement to Dispute Resolution Department for their consideration.
170
Financial Statements
NOTES TO THE FINANCIAL STATEMENTS– 31 January 2022

38. FINANCIAL GUARANTEE CONTRACTS AND CONTINGENT LIABILITIES (CONT’D.)
Other contingent liabilities (cont’d.):
(c) On 17 November 2019, PETRONAS approved a 2-year extension to the Exploration Period for SB331 and SB332 Production Sharing Contracts to Sapura Energy Ventures Sdn. Bhd. (“SEV”) subject to the fulfilment of certain minimum work commitments, failure of which there is a sum payable to PETRONAS. On 29 December 2021, PETRONAS approved a further extension for 3 years allowing SEV to complete its commitments by 19 November 2024. SEV is currently reviewing the terms and conditions stipulated in the extension.
(d) Other than as described above and Note 46(ii) and (iii), there were no other changes in contingent liabilities in the current financial year.
39. RELATED PARTY DISCLOSURES
(a) Related party transactions
In addition to the transactions detailed elsewhere in the financial statements, the Group and the Company had the following significant transactions with related parties during the financial year:
(Income)/expense
2022RM’000
2021RM’000
Group
(i) Transactions with companies connected to directors and current substantial shareholders(a) Intellectual property rights, trademarks and branding fees paid and
payable (Note 8) Sapura Holdings Sdn. Bhd. – 10,000
(b) Rental of office premises paid and payable Sapura Resources Berhad* 60,702 17,548
Company
(i) Transactions with companies connected to directors and current substantial shareholders(a) Intellectual property rights, trademarks and branding fees paid and
payable (Note 8) Sapura Holdings Sdn. Bhd. – 10,000
(b) Rental of office premises paid and payable Sapura Resources Berhad* 50,217 7,403
(ii) Transactions with subsidiaries
(a) Management fees from subsidiaries (114,651) (96,999) (b) Intellectual property rights, trademarks and branding fees from subsidiaries – (10,000) (c) Interest charged to subsidiaries (8,841) (9,111) (d) Interest charged by a subsidiary 212,470 231,066(e) Shared service fees charged by a subsidiary 11,085 8,984
(iii) Transactions with Permodalan Nasional Berhad’s related entities
(a) Utilities charges paid and payable 1,460 –
The transactions above have been entered into in the normal course of business and on a negotiated basis.
Other than as disclosed above, there were no material contracts subsisting as at 31 January 2022 or if not then subsisting, entered into since the end of the financial year by the Company or its subsidiaries which involved the interests of substantial shareholders.
* Included in the rental of office premises is a provision for breach of tenancy agreement as disclosed in Note 34.
Sap
ura
En
erg
y B
erh
ad
An
nu
al R
ep
ort
20
22
171
Financial Statements

39. RELATED PARTY DISCLOSURES (CONT’D.)
(b) Compensation of key management personnel
The remuneration of the key management personnel, including directors, during the financial year are as follows:
Group Company
2022RM’000
2021RM’000
2022RM’000
2021RM’000
Employee benefits and other emoluments 16,686 27,999 7,441 13,424
Contributions to defined contribution plan 981 1,876 634 1,613
17,667 29,875 8,075 15,037
40. FINANCIAL RISK MANAGEMENT OBJECTIVES AND POLICIES
The Group and the Company are exposed to financial risks arising from their operations and the use of financial instruments. The key financial risks include interest rate risk, foreign currency risk, liquidity risk and credit risk.
The Group’s financial risk management policy seeks to ensure that adequate financial resources are available for the development of the Group’s businesses whilst managing its interest rate, foreign currencies, liquidity and credit risks. The Group operates within clearly defined guidelines approved by the Board and the Group’s policy is not to engage in speculative transactions.
It is, and has been throughout the current and previous financial year, the Group’s policy that no derivatives shall be undertaken except for the use as hedging instruments where appropriate and cost efficient.
The following sections provide details regarding the Group’s and the Company’s exposure to the above-mentioned financial risks and the objectives, policies and processes for the management of these risks.
(a) Interest rate risk
Interest rate risk is the risk that the fair value or future cash flows of the Group and of the Company will fluctuate because of changes in market interest rates.
The Group’s and the Company’s earnings are affected by changes in interest rates due to the changes in interest bearing financial assets and liabilities. The Group’s exposure to interest rate risk arises primarily from its borrowings, whereas the Company’s exposure to interest rate arises mainly from its amount due to a subsidiary which is subject to floating interest rates.
At the reporting date, approximately 99% (2021: 87%) of the Group’s borrowings are at floating interest rates. The Group actively reviews its debt portfolio, taking into account the investment holding period and nature of its assets. This strategy allows to capitalise on cheaper funding in a low interest rate environment and achieve a certain level of protection against rate hikes.
172
Financial Statements
NOTES TO THE FINANCIAL STATEMENTS– 31 January 2022

40. FINANCIAL RISK MANAGEMENT OBJECTIVES AND POLICIES (CONT’D.)
(a) Interest rate risk (cont’d.)
Sensitivity analysis for interest rate risk
The following table demonstrates the sensitivity to a reasonably possible change in interest rates with all other variables held constant, of the Group’s and of the Company’s loss before tax (through the impact on interest expense and profit sharing on floating rate loans and borrowings).
2022 2021
Increase/ decrease
in basis points
Effect on loss
before taxRM’000
Increase/ decrease
in basis points
Effect on loss
before taxRM’000
Group– Ringgit Malaysia +25 (15,772) +25 (5,599)
– US Dollar +25 (6,417) +25 (17,211)
– Ringgit Malaysia -25 15,772 -25 5,599
– US Dollar -25 6,417 -25 17,211
Company– Ringgit Malaysia +25 (5,406) +25 (5,421)
– Ringgit Malaysia -25 5,406 -25 5,421
(b) Foreign currency risk
Foreign currency (a currency which is other than the functional currency of the Group entities) risk is the risk that the fair value or future cash flows of the Group’s and of the Company’s financial instrument will fluctuate because of the changes in foreign exchange rates.
The Group has transactional currency exposures arising mainly from revenue or costs and advances that are denominated in a currency other than the respective functional currencies of the Group entities, primarily RM and US Dollar (“USD”). The foreign currencies in which these transactions are denominated are mainly USD and RM respectively.
The Group maintains a natural hedge, whenever possible, by borrowing in the currency of the country in which the assets or investment is located or by borrowing in the currencies that match the future revenue stream to be generated from its investments. Where possible, the strategy is to match the payments for foreign currency payables against receivables denominated in the same foreign currency.
Sap
ura
En
erg
y B
erh
ad
An
nu
al R
ep
ort
20
22
173
Financial Statements

40. FINANCIAL RISK MANAGEMENT OBJECTIVES AND POLICIES (CONT’D.)
(b) Foreign currency risk (cont’d.)
Sensitivity analysis for foreign currency risk
The following table demonstrates the sensitivity of the Group’s and of the Company’s loss before tax to a reasonably possible change in the USD exchange rates against the respective functional currencies of the Group entities, with all other variables held constant.
Loss before taxGroup
Increase/(decrease)
Loss before taxCompany
Increase/(decrease)
2022RM’000
2021RM’000
2022RM’000
2021RM’000
USD/RM – strengthened 5% (54,360) 27,671 21,862 20,444
– weakened 5% 54,360 (27,671) (21,862) (20,444)
(c) Liquidity risk
Liquidity risk is the risk that the Group or the Company may encounter difficulty in meeting financial obligations due to shortage of funds. The Group’s and the Company’s exposure to liquidity risk arises primarily from its various payables, loans and borrowings.
The Group actively manages its debt maturity profile, operating cash flows and the availability of funding so as to ensure that all refinancing, repayment and funding needs are met. As part of its overall prudent liquidity management, the Group maintains sufficient levels of cash or cash convertible investments to meet its working capital requirements.
As of 31 January 2022, the Group and the Company’s current liabilities exceeded their current assets by RM12,450.8 million and RM1,331.3 million respectively. This may cast significant doubt on the ability of the Group and the Company to meet their obligations as and when they fall due.
The ability of the Group and the Company to meet their obligations is dependent on the successful implementation of those initiatives as disclosed in Note 2.1.
174
Financial Statements
NOTES TO THE FINANCIAL STATEMENTS– 31 January 2022

40. FINANCIAL RISK MANAGEMENT OBJECTIVES AND POLICIES (CONT’D.)
(c) Liquidity risk (cont’d.)
Analysis of financial instruments by remaining contractual maturities
The table below summarises the maturity profile of the Group’s and of the Company’s liabilities at the reporting date based on contractual undiscounted repayment obligations.
On demand or within one year
RM’000
One to five years
RM’000
More than five years
RM’000Total
RM’000
Group
At 31 January 2022Financial liabilities:
Trade and other payables 3,670,461 – – 3,670,461Lease liabilities 7,976 8,745 – 16,721Borrowings 13,641,020 – – 13,641,020
17,319,457 8,745 – 17,328,202 Financial guarantee contracts 45,646 252,493 308,112 606,251
Total undiscounted financial liabilities 17,365,103 261,238 308,112 17,934,453
Group
At 31 January 2021Financial liabilities:
Trade and other payables 2,669,045 – – 2,669,045
Lease liabilities 11,123 9,631 – 20,754
Borrowings 3,481,179 7,435,732 – 10,916,911
6,161,347 7,445,363 – 13,606,710
Financial guarantee contracts 41,627 357,998 322,608 722,233
Total undiscounted financial liabilities 6,202,974 7,803,361 322,608 14,328,943
At the reporting date, 100% (2021: approximately 32%) of the Group’s borrowings (Note 31), excluding lease liabilities, will mature in less than one year based on the carrying amount reflected in the financial statements respectively.
Sap
ura
En
erg
y B
erh
ad
An
nu
al R
ep
ort
20
22
175
Financial Statements

40. FINANCIAL RISK MANAGEMENT OBJECTIVES AND POLICIES (CONT’D.)
(c) Liquidity risk (cont’d.)
Analysis of financial instruments by remaining contractual maturities (cont’d.)
On demand or within one year
RM’000
One to five years
RM’000Total
RM’000
Company
At 31 January 2022Financial liabilities:
Amounts due to subsidiaries 1,502,816 4,387,930 5,890,746 Other payables 103,346 – 103,346
1,606,162 4,387,930 5,994,092 Financial guarantee contracts 1,021,090 – 1,021,090
Total undiscounted financial liabilities 2,627,252 4,387,930 7,015,182
At 31 January 2021Financial liabilities:
Amounts due to subsidiaries 1,298,087 4,770,903 6,068,990
Other payables 74,986 – 74,986
1,373,073 4,770,903 6,143,976
Financial guarantee contracts 1,181,744 – 1,181,744
Total undiscounted financial liabilities 2,554,817 4,770,903 7,325,720
(d) Credit risk
Credit risk is the risk of loss that may arise on outstanding financial instruments should a counterparty default on its obligation. The Group’s and the Company’s exposure to credit risk arises primarily from trade receivables, contract assets and financial guarantee contracts.
Credit risks are minimised and monitored via strictly limiting the Group’s associations to business partners with high creditworthiness. Credit approvals are performed in accordance to approved limits of authority. Trade receivables are monitored on an ongoing basis via Group management reporting procedures.
For trade receivables and contract assets, the Group apply a simplified approach in calculating ECLs. Therefore, the Group do not track changes in credit risk, but instead recognises a provision for impairment based on lifetime ECLs at each reporting date. Management monitors the recoverability of the receivables based on its historical credit loss experience and also considers available forward-looking information, which could indicate whether a customer is experiencing significant financial difficulty or it becomes probable that a customer will enter into bankruptcy or other financial reorganisation.
The Group categorises a receivable for potential impairment when the customer fails to make contractual payments beyond the agreed credit terms. The receivable is impaired if there is no reasonable expectation of recovery, such as the customer failing to engage in a repayment plan with the Group.
176
Financial Statements
NOTES TO THE FINANCIAL STATEMENTS– 31 January 2022

40. FINANCIAL RISK MANAGEMENT OBJECTIVES AND POLICIES (CONT’D.)
(d) Credit risk (cont’d.)
Exposure to credit risk
At the reporting date, the Group’s and the Company’s maximum exposure to credit risk is represented by:
– The carrying amount of each class of financial assets recognised in the statements of financial position as disclosed in Note 41.
– The carrying amount of contract assets as disclosed in Note 23.
Credit risk concentration profile
The Group determines concentrations of credit risk by monitoring the country profile of its trade receivables on an ongoing basis. The credit risk concentration profile of the Group’s net trade receivables at the reporting date are as follows:
Group
2022 2021
RM’000 % of total RM’000 % of total
By country/regionAsia 225,221 39% 244,256 35%
Malaysia 170,312 29% 301,019 43%
Americas 87,214 15% 46,349 6%
Africa 60,904 10% 53,653 8%
Australia 30,601 5% 36,947 5%
Middle East 239 0% 14,395 2%
Others 7,693 2% 5,257 1%
582,184 100% 701,876 100%
Exposure to expected credit losses increases with concentrations of credit risk which may exist when a number of counterparties are involved in similar activities or operate in the same industry sector or geographical area, which may result in their ability to meet contractual obligations being impacted by changes in economic, political or other conditions.
The Group’s principal customers with which it conducts business are diversified and there is no significant concentration of credit risk to any single customer or a group of customers at the reporting date.
Deposits with banks and other financial institutions are placed with or entered into with reputable financial institutions or companies with high credit ratings and no history of default.
Sap
ura
En
erg
y B
erh
ad
An
nu
al R
ep
ort
20
22
177
Financial Statements

41. FINANCIAL INSTRUMENTS
(a) Classification of financial instruments
The accounting policies in Note 2.13 and Note 2.18 describe how the categories of financial instruments are measured, and how income and expenses, including changes in fair value, are recognised.
The table below reflects the financial assets and liabilities in the statement of financial position by the categories of financial instrument to which they are assigned:
Note
Debt instrumentsat amortised
cost RM’000
Financial assetsat fair value
through other comprehensive
incomeRM’000
Financial liabilities
at amortisedcost
RM’000Total
RM’000
As at 31 January 2022
Group
AssetsTrade and other receivables* 1,254,273 – – 1,254,273Cash and cash equivalents 24 717,751 – – 717,751
Total financial assets 1,972,024 – – 1,972,024Total non-financial assets 14,096,726
Total assets 16,068,750
LiabilitiesBorrowings 31 – – 10,658,021 10,658,021 Trade and other payables* – – 3,580,996 3,580,996 Lease liabilities 35 – – 16,721 16,721 Derivative liabilities – 24,644 – 24,644
Total financial liabilities – 24,644 14,255,738 14,280,382 Total non-financial liabilities 1,710,382
Total liabilities 15,990,764
* These balances exclude non-financial instrument balances which are not within the scope of MFRS 9: Financial Instruments.
178
Financial Statements
NOTES TO THE FINANCIAL STATEMENTS– 31 January 2022

41. FINANCIAL INSTRUMENTS (CONT’D.)
(a) Classification of financial instruments (cont’d.)
The table below reflects the financial assets and liabilities in the statement of financial position by the categories of financial instrument to which they are assigned (cont’d.):
Note
Debt instrumentsat amortised
cost RM’000
Financialinstrumentsat fair value
through other comprehensive
incomeRM’000
Financial liabilities
at amortisedcost
RM’000Total
RM’000
As at 31 January 2021
Group
AssetsTrade and other receivables* 1,331,601 – – 1,331,601
Cash and cash equivalents 24 488,966 – – 488,966
Derivative assets 19 – 55,083 – 55,083
Total financial assets 1,820,567 55,083 – 1,875,650
Total non-financial assets 20,789,459
Total assets 22,665,109
LiabilitiesBorrowings 31 – – 10,332,182 10,332,182
Trade and other payables* – – 2,648,423 2,648,423
Lease liabilities 35 – – 20,754 20,754
Total financial liabilities – – 13,001,359 13,001,359
Total non-financial liabilities 727,000
Total liabilities 13,728,359
* These balances exclude non-financial instrument balances which are not within the scope of MFRS 9: Financial Instruments.
Sap
ura
En
erg
y B
erh
ad
An
nu
al R
ep
ort
20
22
179
Financial Statements

41. FINANCIAL INSTRUMENTS (CONT’D.)
(a) Classification of financial instruments (cont’d.)
The table below reflects the financial assets and liabilities in the statement of financial position by the categories of financial instrument to which they are assigned (cont’d.):
Note
Debt instrumentsat amortised
cost RM’000
Financial liabilities
at amortisedcost
RM’000Total
RM’000
As at 31 January 2022
Company
AssetsAmounts due from subsidiaries 21 92,563 – 92,563 Other receivables* – – – Cash and cash equivalents 24 1,219 – 1,219
Total financial assets 93,782 – 93,782 Total non-financial assets 5,050,092
Total assets 5,143,874
LiabilitiesAmounts due to subsidiaries 32 – 5,069,221 5,069,221 Other payables 33 – 103,346 103,346
Total financial liabilities – 5,172,567 5,172,567 Total non-financial liabilities 44,700
Total liabilities 5,217,267
* These balances exclude non-financial instrument balances which are not within the scope of MFRS 9: Financial Instruments.
180
Financial Statements
NOTES TO THE FINANCIAL STATEMENTS– 31 January 2022

41. FINANCIAL INSTRUMENTS (CONT’D.)
(a) Classification of financial instruments (cont’d.)
The table below reflects the financial assets and liabilities in the statement of financial position by the categories of financial instrument to which they are assigned (cont’d.):
Note
Debt instrumentsat amortised
cost RM’000
Financial liabilities
at amortisedcost
RM’000Total
RM’000
As at 31 January 2021
Company
AssetsAmounts due from subsidiaries 21 913,565 – 913,565
Other receivables* 44,163 – 44,163
Cash and cash equivalents 24 5,231 – 5,231
Total financial assets 962,959 – 962,959
Total non-financial assets 12,757,040
Total assets 13,719,999
LiabilitiesAmounts due to subsidiaries 32 – 4,819,974 4,819,974
Other payables 33 – 74,986 74,986
Total financial liabilities – 4,894,960 4,894,960
Total non-financial liabilities –
Total liabilities 4,894,960
* These balances exclude non-financial instrument balances which are not within the scope of MFRS 9: Financial Instruments.
(b) Financial instruments that are not carried at fair value and whose carrying amounts are reasonable approximation of fair value
The following are classes of financial instruments that are not carried at fair value and whose carrying amounts are reasonable approximation of fair value:
Note
Trade and other receivables 22
Trade and other payables 33
Borrowings 31
Amounts due from subsidiaries 21
Amounts due to subsidiaries 32
The carrying amounts of the financial assets and liabilities (except for the fixed rate borrowings) are reasonable approximation of fair values either due to their short-term nature or that they are floating rate instruments that are re-priced to the market interest rates on or near reporting date.
The carrying amounts of the fixed rate borrowings are reasonable approximations of fair values due to the insignificant impact of incremental market rate.
Sap
ura
En
erg
y B
erh
ad
An
nu
al R
ep
ort
20
22
181
Financial Statements

41. FINANCIAL INSTRUMENTS (CONT’D.)
(c) Fair value hierarchy
The Group’s and the Company’s financial instruments are analysed in a three level fair value hierarchy based on the significance of inputs as disclosed in Note 2.31.
The following are descriptions of the valuation techniques and inputs used in the fair value measurement for assets and liabilities that are categorised within Level 2 of the fair value hierarchy:
Derivatives
Cross currency swap contracts are valued using a valuation technique with market observable inputs. The most frequently applied valuation techniques include forward pricing and swap models, using present value calculations. The models incorporate various inputs including the credit quality of counterparties, foreign exchange spot and forward rates, interest rate curves and forward rate curves.
42. CAPITAL MANAGEMENT
Capital management refers to implementing measures to maintain sufficient capital to support the Group’s business and growth plans. The Group’s capital management objectives are to ensure the Group’s ability to continue as a going concern and maximise shareholders’ value.
One of the key considerations in this regard is to maintain ready access to capital markets and to preserve the Group’s ability to repay and service debt obligations over time.
The Group manages its capital structure and monitors capital using a gearing ratio, which is net debt divided by total capital. The Group endeavours to maintain a healthy gearing ratio and regularly monitors its gearing level.
The Group endeavours to maintain an optimal gearing ratio and regularly monitors its gearing level.
Note
Group
2022RM’000
2021RM’000
Borrowings 31 10,658,021 10,332,182
Add: Unamortised transaction cost 120,910 46,477
Less: Cash and cash equivalents 24 (717,751) (488,966)
Net debt 10,061,180 9,889,693
Total equity 77,986 8,936,750
Add: Non-controlling interests 6,987 8,820
Total capital 84,973 8,945,570
Net gearing ratio 118.40 1.11
As at the end of the financial year, the Group’s operating losses and provision for impairment made have resulted in significant increase in net gearing ratio. A debt restructuring scheme is being developed and negotiated as described in Note 2.1 (iv).
182
Financial Statements
NOTES TO THE FINANCIAL STATEMENTS– 31 January 2022

43. SEGMENT INFORMATION
(a) Operating segments
The Group previously organised its business activities into four major segments as
(i) Engineering and Construction (“E&C”);(ii) Drilling;(iii) Exploration and Production (“E&P”); and(iv) Corporate.
Effective from Financial Year 2022, the Group organised its businesses as follows:
(i) Engineering and Construction (“E&C”);(ii) Operations and Maintenance (“O&M”);(iii) Drilling;(iv) Exploration and Production (“E&P”); and(v) Corporate
Major activities of the E&C business segment are:
– Offshore Construction and Subsea Services which provide complete offshore construction and installation works for offshore platforms, submarine pipelines and Subsea facilities, Umbilicals, Risers and Flowlines (SURF).
– Engineering, Procurement, Construction (EPC) which provide end-to-end, turnkey EPCIC solutions for the energy industry.
– Hook-up & Commissioning (HUC) which provide services for new and existing facilities in the oil and gas industry.
Operations and Maintenance works ranging from major upgrading, modification and rejuvenation, to topside life extension preventive and corrective maintenance works.
The Drilling segment is involved in the charter of oil drilling rigs and provision of drilling related services.
Sapura Exploration & Production (Sabah) Inc. remains in E&P segment. The share of profit from SapuraOMV is recorded under the E&P segment.
Management monitors the operating results of its business units separately for the purpose of making decisions about resource allocation and performance assessment. Segment performance is evaluated based on operating profit or loss which, in certain respects as explained in the table below, is measured differently from operating profit or loss in the consolidated financial statements. Corporate assets, group financing (including finance costs) and income taxes are managed on a group basis and are not allocated to operating segments.
Transfer prices between operating segments are on a negotiated basis in a manner similar to transactions with third parties.
Sap
ura
En
erg
y B
erh
ad
An
nu
al R
ep
ort
20
22
183
Financial Statements

43. SEGMENT INFORMATION (CONT’D.)
(a) Operating segments (cont’d.)
Engineering and
Construction RM’000
Operations and
MaintenanceRM’000
Drilling RM’000
Exploration and
ProductionRM’000
CorporateRM’000
Eliminations*RM’000
ConsolidatedRM’000
31 January 2022
RevenueExternal sales 2,813,798 253,057 1,033,374 – – – 4,100,229Inter-segment sales 4,605 153,048 – – 157,348 (315,001) –
Total revenue 2,818,403 406,105 1,033,374 – 157,348 (315,001) 4,100,229
ResultsSegment loss (4,328,587) (276,444) (3,630,036) (501) (8,700,119) 8,530,984 (8,404,703) Finance costs (527,865) Interest income 20,656Share of profit/(loss) from associates
and joint ventures 102,379 15,095 – (141,565) 4,150 – (19,941)
Loss before tax (8,931,853) Income tax expense (129,006)
Loss net of tax (9,060,859) Non-controlling interests 10,225
Loss for the year attributable to owners of the Parent (9,050,634)
AssetsSegment assets 5,593,288 529,685 3,781,133 – 480,900 (321,360) 10,063,646Investment in associates and joint
ventures 2,152,355 32,459 – 2,006,160 13,356 – 4,204,330Goodwill on consolidation 1,290,450 – 406,667 – – – 1,697,117Deferred tax assets 82,138 18,243 3,276 – – – 103,657
Consolidated total assets 16,068,750
LiabilitiesSegment liabilities 4,519,375 384,963 721,703 16 372,977 (752,380) 5,246,654Borrowings 10,658,021Deferred tax liabilities 26,864 2,972 56,253 – – – 86,089
Consolidated total liabilities 15,990,764
Other InformationCapital expenditure 87,735 14,826 68,056 – 5,597 – 176,214Depreciation of property, plant and
equipment 201,975 30,317 280,141 – 7,362 114 519,909Amortisation of intangible assets 2,689 22 – – – – 2,711Provision for impairment on property,
plant and equipment 284,450 951 2,030,386 – – – 2,315,787Provision for impairment on goodwill 1,621,487 – 1,668,447 – – – 3,289,934
* Inter-segment transactions are eliminated on consolidation
184
Financial Statements
NOTES TO THE FINANCIAL STATEMENTS– 31 January 2022

43. SEGMENT INFORMATION (CONT’D.)
Following change in composition of operating segments, corresponding reclassifications have been made to the prior year’s results for fair comparison of operational performance.
(a) Operating segments (cont’d.)
Engineering and
Construction RM’000
Operations and
MaintenanceRM’000
Drilling RM’000
Exploration and
ProductionRM’000
CorporateRM’000
Eliminations*RM’000
ConsolidatedRM’000
31 January 2021
RevenueExternal sales 3,921,205 698,173 728,444 – – – 5,347,822
Inter-segment sales 18,836 108,283 – – 164,620 (291,739) –
Total revenue 3,940,041 806,456 728,444 – 164,620 (291,739) 5,347,822
ResultsSegment (loss)/profit 246,918 70,770 4,540 (436) 12,992 (68,631) 266,153
Finance costs (492,364)
Interest income 35,659
Share of profit/(loss) from associates and joint ventures 166,196 21,526 – (38,099) 9,204 – 158,827
Loss before tax (31,725)
Income tax expense (128,527)
Loss net of tax (160,252)
Non-controlling interests (618)
Loss for the year attributable to owners of the Parent (160,870)
AssetsSegment assets 6,461,028 860,056 5,792,928 – 411,125 (6,583) 13,518,554
Investment in associates and joint ventures 1,989,385 33,484 – 2,077,339 9,203 – 4,109,411
Goodwill on consolidation 2,908,579 – 2,008,229 – – – 4,916,808
Deferred tax assets 83,518 18,590 1,910 – 16,318 – 120,336
Consolidated total assets 22,665,109
LiabilitiesSegment liabilities 2,320,652 360,369 562,595 16 123,416 (73,618) 3,293,430
Borrowings 10,332,182
Deferred tax liabilities 65,296 2,972 34,479 – – – 102,747
Consolidated total liabilities 13,728,359
Other InformationCapital expenditure 95,795 13,860 60,706 – 6,624 – 176,985
Depreciation of property, plant and equipment 210,978 28,649 286,307 – 12,019 2,484 540,437
Amortisation of intangible assets 3,070 22 – – – – 3,092
* Inter-segment transactions are eliminated on consolidation
Sap
ura
En
erg
y B
erh
ad
An
nu
al R
ep
ort
20
22
185
Financial Statements

43. SEGMENT INFORMATION (CONT’D.)
(b) Geographical information
The Group operates in various geographical areas in the world. In Malaysia, its home country, the Group’s areas of operation are installation of pipelines and facilities, engineering, procurement, construction and commissioning, offshore oil and gas drilling services, subsea and offshore support services and geotechnical and maintenance services. Malaysia is also the main country of operation for exploration and production business that involved in exploration, development and production of crude oil and natural gas. Other operations in Malaysia include oilfield development and production, investment holding and provision of management services.
The Group also operates in other countries/regions:
(i) Asia (excluding Malaysia and Middle East) – installation of pipelines and facilities, provision of engineering, procurement, construction and commissioning, provision for drilling rigs and services, provision of geotechnical and geophysical services to the oil and gas industry and vessel chartering.
(ii) Australia – installation of pipelines and facilities and development of marine technology and marine chartering, specialising on remotely operated underwater vehicle (“ROV”).
(iii) Americas – installation of pipelines and facilities, provision of technical consulting, advising to oil and gas companies and provision of offshore oil and gas drilling services.
(iv) Middle East – provision of offshore and onshore engineering, procurement, construction (fabrication), transportation, installation, hook-up, commissioning and maintenance of fixed and floating oil and gas facilities, brownfield rejuvenation, marine construction, marine conversion, marine repair and infrastructure and construction.
(v) Africa – provision of offshore oil and gas drilling services and installation of pipelines and facilities.
(vi) Others – provision of advanced subsea and floating systems engineering and project management services to offshore projects.
Further details of revenue from external customers by geographical areas are disclosed in Note 3.2.
Majority of the Group’s segment assets are highly mobile and moves from one geographical area to another in order to maximise revenue generation opportunities. Consequently, segment assets by geographical area are not presented.
186
Financial Statements
NOTES TO THE FINANCIAL STATEMENTS– 31 January 2022

44. SUBSIDIARIES AND ACTIVITIES
(i) Details of the subsidiaries are as follows:
Name of Subsidiaries
Country of Incorporation/Principal Place
of Business Principal Activities
Proportion ofOwnership Interest
2022%
2021%
(a) Subsidiaries of Sapura Energy Berhad
Total Marine Technology (Malaysia) Sdn. Bhd.
Malaysia Act as agent and service provider for oil and gas industry
100 100
Sapura Deepwater Pte. Ltd. Bermuda Chartering and hiring out of vessels and barges
100 100
Sapura GeoSciences Sdn. Bhd. Malaysia Provision of offshore geotechnical and geophysical services
100 100
Sapura Technology Solutions Sdn. Bhd.
Malaysia Investment holding, provision of operation and maintenance services and provision of management services
100 100
*Petcon (Malaysia) Sdn. Bhd. Malaysia Dormant 100 100
SapuraCrest Ventures Sdn. Bhd. Malaysia Investment holding 100 100
Crest Hidayat (L) Ltd. Federal Territory of Labuan,
Malaysia
Dormant 100 100
Sapura Perdana Sdn. Bhd. Malaysia Dormant 100 100
Sapura Dana SPV Pte. Ltd. Federal Territory of Labuan,
Malaysia
Chartering and hiring out of vessels and barges
100 100
SapuraCrest Petroleum Berhad Malaysia Dormant 100 100
Sapura Management Services Sdn. Bhd.
Malaysia Management services 100 100
Sapura Nautical Essence Sdn. Bhd. Malaysia Investment holding 100 100
Sapura Offshore Sdn. Bhd. Malaysia/Taiwan/Singapore
Front-end engineering design (FEED), detailed design engineering (DDE), procurement, construction, offshore transportation and installation, hook-up, commissioning and maintenance of fixed and floating oil and gas facilities, diving and subsea services, flexible and rigid pipelay, installation of subsea umbilicals, risers and flowlines and cables, and decommissioning of offshore structures, and pipeline and chartering of vessels
100 100
* Dissolved effective 9 March 2022 Sap
ura
En
erg
y B
erh
ad
An
nu
al R
ep
ort
20
22
187
Financial Statements

44. SUBSIDIARIES AND ACTIVITIES (CONT’D.)
(i) Details of the subsidiaries are as follows (cont’d.):
Name of Subsidiaries
Country of Incorporation/Principal Place
of Business Principal Activities
Proportion ofOwnership Interest
2022 %
2021 %
(a) Subsidiaries of Sapura Energy Berhad (cont’d.)
Sapura Marine Engineering Sdn. Bhd.
Malaysia Provision of offshore construction and diving equipment
100 100
Geomark Sdn. Bhd. Malaysia Investment holding 100 100
Sapura Energy Ventures Sdn. Bhd.
Malaysia Development and production of petroleum resources
100 100
Sapura Petroleum Sdn. Bhd. Malaysia Investment holding 100 100
Momentum Energy Sdn. Bhd. Malaysia Investment holding 100 100
Sapura Fabrication Sdn. Bhd. Malaysia/Qatar/Abu Dhabi and
Brunei
Provision of offshore and onshore engineering, procurement, construction (fabrication), transportation, installation, hook-up, commissioning and maintenance of fixed and floating oil and gas facilities, brownfield rejuvenation, marine construction, marine conversion marine repair and infrastructure construction
100 100
Sapura Onshore Sdn. Bhd. Malaysia Provision of engineering, fabrication and construction services
100 100
Sapura Engineering Sdn. Bhd. Malaysia Provision of front-end engineering design (FEED) and detailed design engineering (DDE)
100 100
SE Petroleum Berhad Malaysia Dormant 100 100
Sapura Pinewell Sdn. Bhd. Malaysia Hook-up, commissioning, maintenance brownfield rejuvenation and onshore construction
100 100
Sapura Petroleum Ventures Sdn. Bhd.
Malaysia Investment holding 100 100
SEB Energy Sdn. Bhd. Malaysia Development and production of petroleum resources
100 100
Sapura Subsea Services Sdn. Bhd. Malaysia Provision of offshore diving and related services and the provision of diving equipment for rental
100 100
Sapura Drilling Probadi Sdn. Bhd. Malaysia Investment holding 100 100
188
Financial Statements
NOTES TO THE FINANCIAL STATEMENTS– 31 January 2022

44. SUBSIDIARIES AND ACTIVITIES (CONT’D.)
(i) Details of the subsidiaries are as follows (cont’d.):
Name of Subsidiaries
Country of Incorporation/Principal Place
of Business Principal Activities
Proportion ofOwnership Interest
2022%
2021%
(a) Subsidiaries of Sapura Energy Berhad (cont’d.)
Sapura TMC Sdn. Bhd. Malaysia Provision of treasury management services
100 100
Sapura Drilling Pte. Ltd. Federal Territory of Labuan,
Malaysia
Investment holding 100 100
Sapura 900 Pte. Ltd. Federal Territory of Labuan,
Malaysia
Vessel owner and chartering 100 100
*SapuraKencana 1200 Pte. Ltd. Federal Territory of Labuan,
Malaysia
Dormant 100 100
Sapura 3000 Pte. Ltd. Federal Territory of Labuan,
Malaysia
Vessel owner and chartering 100 100
*SapuraKencana FLB-1 Pte. Ltd. Federal Territory of Labuan,
Malaysia
Dormant 100 100
Sapura Energy Services Sdn. Bhd.
Malaysia Investment holding 100 100
Sapura Upstream Assets Sdn. Bhd.
Malaysia Investment holding 100 100
Sapura Global Services Sdn. Bhd. Malaysia Dormant 100 100
(b) Held through Sapura Drilling Probadi Sdn. Bhd. and Sapura Drilling Asia Limited
Sapura Drilling Asia Sdn. Bhd. Malaysia Provision of oil drilling services 100 100
Varia Perdana Sdn. Bhd. Malaysia Investment holding and oil drilling management
100 100
(c) Held through Varia Perdana Sdn. Bhd.
^Crest Tender Rigs Pte. Ltd. Federal Territory of Labuan,
Malaysia
Leasing and chartering of offshore oil and gas rigs
– 100
* Dissolved effective 16 February 2021^ Transferred to Sapura Drilling Pte Ltd on 30 November 2021 and in the process of alternative voluntary winding-up.
Sap
ura
En
erg
y B
erh
ad
An
nu
al R
ep
ort
20
22
189
Financial Statements

44. SUBSIDIARIES AND ACTIVITIES (CONT’D.)
(i) Details of the subsidiaries are as follows (cont’d.):
Name of Subsidiaries
Country of Incorporation/Principal Place
of Business Principal Activities
Proportion ofOwnership Interest
2022%
2021%
(d) Held through Sapura Offshore Sdn. Bhd.
Sapura Talent Ltd. Bermuda/Mexico Provision of manpower services 100 100
Sapura 1200 Ltd. Bermuda Vessel owner and chartering 100 100
Sapura 3500 Ltd. Bermuda Vessel owner and chartering 100 100
Sapura FLB-1 Ltd. Bermuda Vessel owner and chartering 100 100
Sapura Saudi Arabia Company Saudi Arabia Engineering, procurement, construction, offshore transportation and installation, hook up and commissioning of offshore structures, pipelines and cables
100 100
Sapura Energy DMCC Dubai, United Arab Emirates
Onshore and offshore oil and gas field services
100 100
Sapura Energy B.V. Amsterdam, the Netherlands and
Azerbaijan
Design, fabricate, install, commission and maintenance of marine offshore facilities
100 100
Sapura Energy (UK) Limited England and Wales
Dormant 100 100
Sapura Energy, (EG) S.L. Republic of Equatorial Guinea
Dormant 65 65
*Sapura Energy (Thailand) Limited Thailand Provision of offshore diving and related services
49 –
(e) Held through Sapura Offshore Sdn. Bhd. and Sapura Energy DMCC
Sapura Energy Do Brasil Ltda. Brazil Maintenance and installation of offshore/submarine platforms and marine pipelines
100 100
(f) Held through Sapura GeoSciences Sdn. Bhd.
Sapura Jaya Sdn. Bhd. Malaysia Chartering of vessels 100 100
(g) Held through Sapura Jaya Sdn. Bhd.
Sapura GeoSurvey Sdn. Bhd. Malaysia Hydrographic surveys and related services
100 100
Sapura GeoTechnics Sdn. Bhd. Malaysia Soil investigation and geotechnical services
100 100
* Transferred from Sapura Subsea Services Sdn. Bhd., Sapura Marine Services Sdn. Bhd. and Sapura Subsea Corporation on 1 April 2021
190
Financial Statements
NOTES TO THE FINANCIAL STATEMENTS– 31 January 2022

44. SUBSIDIARIES AND ACTIVITIES (CONT’D.)
(i) Details of the subsidiaries are as follows (cont’d.):
Name of Subsidiaries
Country of Incorporation/Principal Place
of Business Principal Activities
Proportion ofOwnership Interest
2022%
2021%
(h) Held through Sapura GeoTechnics Sdn. Bhd.
Sapura GeoTechnics (S) Pte. Ltd. Singapore Soil investigation and geotechnical services
100 100
Sapura Oilserve Sdn. Bhd. Malaysia Provision of marine vessel transportation services
100 100
(i) Held through Sapura GeoSurvey Sdn. Bhd.
Sapura GeoSurvey Pte. Ltd. Singapore Hydrographic surveys and related services
100 100
(j) Held through Sapura Oilserve Sdn. Bhd.
Sapura Oilserve Labuan Pte. Ltd. Federal Territory of Labuan,
Malaysia
Dormant 100 100
(k) Held through Sapura Technology Solutions Sdn. Bhd.
Sapura Digital Solutions Sdn. Bhd.
Malaysia Retail automation systems and maintenance services
100 100
Sapura Project Services Sdn. Bhd.
Malaysia Systems integration, software development, general engineering, maintenance and related activities
100 100
Sapura Power Services Sdn. Bhd. Malaysia Provision of maintenance services to the power utility and oil and gas industries
94.4 94.4
Sapura Diving Services Sdn. Bhd. Malaysia Provision of rental equipment 100 100
Sapura Maintenance Services Sdn. Bhd.
Malaysia Provision of maintenance services to the power, utility and oil and gas industries
100 100
Sapura Petroleum Technologies Sdn. Bhd.
Malaysia Provision of trading and maintenance services
99.7 99.7
Sapura Energy Infinite Sdn. Bhd. Malaysia Investment holding and provision of operations and maintenance services to the oil and gas industry
100 100
Sapura Vessels Pte. Ltd. Federal Territory of Labuan,
Malaysia
Dormant 100 100
Sapura Services Sdn. Bhd. Malaysia Investment holding 100 100
Sap
ura
En
erg
y B
erh
ad
An
nu
al R
ep
ort
20
22
191
Financial Statements

44. SUBSIDIARIES AND ACTIVITIES (CONT’D.)
(i) Details of the subsidiaries are as follows (cont’d.):
Name of Subsidiaries
Country of Incorporation/Principal Place
of Business Principal Activities
Proportion ofOwnership Interest
2022%
2021%
(l) Held through Sapura Energy Infinite Sdn. Bhd.
Sapura Energy Resources Sdn. Bhd.
Malaysia Investment holding 100 100
(m) Held through Sapura Energy Resources Sdn. Bhd.
Sarku Engineering Services Sdn. Bhd.
Malaysia Provision of offshore engineering services and marine support and logistic assistance for the oil and gas industry
100 100
Sapura Marine Ventures Sdn. Bhd. Malaysia Provision of crew, chartering and hiring out of barges
100 100
Sapura Engineering (Offshore) Sdn. Bhd.
Malaysia Chartering and hiring out of barges, vessels and operational equipment including provision of crew
100 100
*Sapura Prominent Energy Sdn. Bhd.
Malaysia Dormant 100 100
(n) Held through Sapura Petroleum Sdn. Bhd.
Sapura Nautical Bay Pte. Ltd. Singapore Investment holding 100 100
Sapura Petroleum Inc. The State of Texas, United
States of America
Regional Office for business development and marketing
100 100
SapuraMex Pte. Ltd. Singapore Investment holding 100 100
SapuraKencana Enerji Çözümleri Anonim Şirketi
Turkey Engineering, procurement, construction, installation and commissioning of offshore facilities and cables
100 100
(o) Held through Sapura Nautical Bay Pte. Ltd.
Sapura Nautical Power Pte. Ltd. Singapore Investment holding 100 100
(p) Held through Sapura Offshore Sdn. Bhd. and SapuraMex Pte. Ltd.
Sapura Energy Mexicana, S.A.P.I. de C.V.
Mexico Engineering, procurement, construction, installation and commissioning of offshore facilities and pipelines
100 100
* Dissolved effective 2 July 2021
192
Financial Statements
NOTES TO THE FINANCIAL STATEMENTS– 31 January 2022

44. SUBSIDIARIES AND ACTIVITIES (CONT’D.)
(i) Details of the subsidiaries are as follows (cont’d.):
Name of Subsidiaries
Country of Incorporation/Principal Place
of Business Principal Activities
Proportion ofOwnership Interest
2022%
2021%
(q) Held through SapuraMex Pte. Ltd.
Sapura 3500 (S) Pte. Ltd. Singapore Chartering and hiring out of vessel 100 100
(r) Held through Momentum Energy Sdn. Bhd.
Sapura Australia (Holdings) Pty. Ltd.
Australia Investment holding 100 100
(s) Held through Sapura Australia (Holdings) Pty. Ltd.
Sapura USA Holdings Incorporated State of Delaware,
United States of America
Investment holding 100 100
Sapura Australia Pty. Ltd. Australia Investment holding 100 100
Peritus International Limited United Kingdom Provision of advanced subsea and floating systems engineering and project management services to oil and gas offshore projects and developments in remote, hostile and deepwater environments
100 100
Peritus International Pty. Ltd. Australia Provision of advanced subsea and floating systems engineering and project management services to offshore projects
100 100
(t) Held through Sapura Australia Pty. Ltd.
Sapura Petroleum (Australia) Pty. Ltd.
Australia Investment holding 100 100
Sapura Projects Pty. Ltd. Australia Investment holding 100 100
SC Projects Australia Pty. Ltd. Australia Investment holding 100 100
Sapura Constructor Pte. Ltd. Singapore Vessel owner and chartering 100 100
Sapura Assets Pty. Ltd. Australia Owner and operator of marine assets
100 100
Normand Sapura Pty. Ltd. Australia Sub-charter and provision of project delivery capabilities, technology and proprietary offshore assets
100 100
Sap
ura
En
erg
y B
erh
ad
An
nu
al R
ep
ort
20
22
193
Financial Statements

44. SUBSIDIARIES AND ACTIVITIES (CONT’D.)
(i) Details of the subsidiaries are as follows (cont’d.):
Name of Subsidiaries
Country of Incorporation/Principal Place
of Business Principal Activities
Proportion ofOwnership Interest
2022%
2021%
(u) Held through Sapura USA Holdings Incorporated
Ocean Flow International LLC The State of Texas, United
States of America
Provision of technical consulting and advising to oil and gas operating companies
100 100
Peritus International Inc. The State of Texas, United
States of America
Provision of advanced subsea and floating systems engineering and project management services to offshore projects
100 100
(v) Held through Peritus International Pty. Ltd.
Peritus International Sdn. Bhd. Malaysia Provision of engineering consultancy services for the oil and gas industry
100 100
(w) Held through Sapura Constructor Pte. Ltd.
Sapura Projects Singapore Pte. Ltd.
Singapore Dormant 100 100
(x) Held through Geomark Sdn. Bhd.
Quippo Prakash Pte. Ltd. Singapore Dormant 100 100
(y) Held through Sapura Fabrication Sdn. Bhd.
Sapura Marine Sdn. Bhd. Malaysia Operation and management of fabrication yard
100 100
~Sapura Infrastructure Sdn. Bhd. Malaysia Dormant 100 100
^Sapura Metering Sdn. Bhd. Malaysia Dormant 100 100
Sapura Energy Vietnam Limited Vietnam Dormant 100 100
(z) Held through Sapura Fabrication Sdn. Bhd. and Sapura Petroleum Sdn. Bhd.
Sapura Engineering & Construction (India) Private Limited
India Engineering, procurement, construction, installation and commissioning of offshore facilities and pipelines
100 100
~ Dissolved effective 15 October 2021^ Dissolved effective 4 May 2021
194
Financial Statements
NOTES TO THE FINANCIAL STATEMENTS– 31 January 2022

44. SUBSIDIARIES AND ACTIVITIES (CONT’D.)
(i) Details of the subsidiaries are as follows (cont’d.):
Name of Subsidiaries
Country of Incorporation/Principal Place
of Business Principal Activities
Proportion ofOwnership Interest
2022%
2021%
(aa) Held through Sapura Energy Services Sdn. Bhd.
*Sapura Fabricators Sdn. Bhd. Malaysia Dormant 100 100
Total Marine Technology Pty. Ltd. Australia Development of marine technology and marine chartering, specialising on ROVs
94 94
(ab) Held through Total Marine Technology Pty. Ltd.
Sapura Excersize Pty. Ltd. Australia Owner and operator of ROVs for the offshore oil and gas industries
94 94
Sapura Babalon Pty. Ltd. Australia Owner and operator of ROVs for the offshore oil and gas industries
94 94
(ac) Held through Total Marine Technology Pty. Ltd. and Sapura Babalon Pty. Ltd.
ROV TMT Nigeria Limited Federal Republic of Nigeria
Lease equipment and subcontract manpower services
94 94
(ad) Held through Sapura Fabrication Sdn. Bhd. and Sapura Petroleum Ventures Sdn. Bhd.
Sapura Energy (B) Sdn. Bhd. Brunei Investment holding 100 100
(ae) Held through Sapura Energy (B) Sdn. Bhd.
Sapura Energy Services (B) Sdn. Bhd.
Brunei Service provider for oil and gas industry
70 70
(af) Held through Sapura Onshore Sdn. Bhd.
Sapura Subsea Sdn. Bhd. Malaysia Provision of engineering, fabrication and construction works
100 100
Sapura Assets Sdn. Bhd. Malaysia Property investment 100 100
* Dissolved effective 2 July 2021
Sa
pu
ra E
ner
gy
Ber
had
A
nn
ual
Re
po
rt 2
02
2
195
Financial Statements

44. SUBSIDIARIES AND ACTIVITIES (CONT’D.)
(i) Details of the subsidiaries are as follows (cont’d.):
Name of Subsidiaries
Country of Incorporation/Principal Place
of Business Principal Activities
Proportion ofOwnership Interest
2022%
2021%
(ag) Held through Sapura Petroleum Ventures Sdn. Bhd.
^Sapura Marine Drilling Sdn. Bhd. Malaysia Dormant 100 100
Sapura Nautilus Sdn. Bhd. Malaysia Service provider for offshore support vessels
100 100
(ah) Held through Sapura Nautilus Sdn. Bhd.
Sapura Gemia (Labuan) Pte. Ltd. Federal Territory of Labuan,
Malaysia
Provision of offshore support vessels for oil and gas industry
100 100
Sapura Teras Ventures Sdn. Bhd. Malaysia Provision of offshore support vessels for oil and gas industry
100 100
Sapura Redang (Labuan) Pte. Ltd. Federal Territory of Labuan,
Malaysia
Provision of offshore support vessels for oil and gas industry
100 100
(ai) Held through Sapura Subsea Services Sdn. Bhd.
Sapura Marine Services Sdn. Bhd. Malaysia Provision of vessel related management services
100 100
Sapura Subsea Corporation Federal Territory of Labuan,
Malaysia
Leasing of vessels and related equipment
100 100
Maju Hydro Sdn. Bhd. Malaysia Dormant 100 100
*Sapura SS Corporation Federal Territory of Labuan,
Malaysia
Dormant 100 100
Sapura Subsea Robotics Corporation
Federal Territory of Labuan,
Malaysia
Leasing of ROV and Hyperbaric and Hyperbaric
100 100
(aj) Held through Sapura Subsea Services Sdn. Bhd., Sapura Marine Services Sdn. Bhd. and Sapura Subsea Corporation
~Sapura Energy (Thailand) Limited Thailand Provision of offshore diving and related services
– 100
^ In the midst of members’ voluntary winding-up* In the process of alternative voluntary winding-up~ Transferred to Sapura Offshore Sdn Bhd on 1 April 2021
196
Financial Statements
NOTES TO THE FINANCIAL STATEMENTS– 31 January 2022

44. SUBSIDIARIES AND ACTIVITIES (CONT’D.)
(i) Details of the subsidiaries are as follows (cont’d.):
Name of Subsidiaries
Country of Incorporation/Principal Place
of Business Principal Activities
Proportion ofOwnership Interest
2022%
2021%
(ak) Held through Sapura Drilling Pte. Ltd.
Sapura Drilling (S) Pte. Ltd. Singapore Leasing of offshore oil and gas drilling rigs and providing management services
100 100
Sapura Drilling (Bermuda) Ltd. Bermuda Investment holding 100 100
Sapura Drilling Resources Ltd. Bermuda Provision of crew services 100 100
Sapura Drilling Labuan Leasing Ltd.
Federal Territory of Labuan, Malaysia
Hire and charter of the oil drilling rigs
100 100
^Crest Tender Rigs Pte. Ltd. Federal Territory of Labuan, Malaysia
Leasing and chartering of offshore oil and gas rigs
100 –
*Sapura Drilling T-17 Ltd. Mauritius Leasing of offshore oil and gas drilling rig
100 –
*Sapura Drilling T-18 Ltd. Mauritius Leasing of offshore oil and gas drilling rig
100 –
(al) Held through Sapura Drilling (Bermuda) Ltd.
Sapura Drilling T-10 Ltd. Bermuda Leasing of offshore oil and gas drilling rig
100 100
Sapura Drilling T-19 Ltd. Bermuda Leasing of offshore oil and gas drilling rig
100 100
#Sapura Drilling T-9 Ltd. Bermuda Dormant 100 100
Sapura Drilling T-20 Ltd. Bermuda Dormant 100 100
Sapura Drilling T-11 Ltd. Bermuda Leasing of offshore oil and gas drilling rig
100 100
Sapura Drilling T-12 Ltd. Bermuda Leasing of offshore oil and gas drilling rig
100 100
Sapura Drilling T-17 Ltd. Bermuda Leasing of offshore oil and gas drilling rig
100 100
Sapura Drilling T-18 Ltd. Bermuda Leasing of offshore oil and gas drilling rig
100 100
~Sapura Drilling Menang Ltd. Bermuda Leasing of offshore oil and gas drilling rig
100 100
^ Transferred from Varia Perdana Sdn Bhd on 30 November 2021* Incorporated on 1 April 2022# Dissolved effective 7 May 2021~ Dissolved effective 7 December 2021
Sap
ura
En
erg
y B
erh
ad
An
nu
al R
ep
ort
20
22
197
Financial Statements

44. SUBSIDIARIES AND ACTIVITIES (CONT’D.)
(i) Details of the subsidiaries are as follows (cont’d.):
Name of Subsidiaries
Country of Incorporation/Principal Place
of Business Principal Activities
Proportion ofOwnership Interest
2022%
2021%
(al) Held through Sapura Drilling (Bermuda) Ltd. (cont'd.)
Sapura Drilling Berani Ltd. Bermuda/Indonesia/ Ivory Coast
Leasing of offshore oil and gas drilling rig
100 100
Sapura Drilling Alliance Ltd. Bermuda Leasing of offshore oil and gas drilling rig
100 100
*Sapura Drilling Pelaut Ltd. Bermuda Leasing of offshore oil and gas drilling rig
100 100
Sapura Drilling Setia Ltd. Bermuda Leasing of drilling rig and providing drilling service to offshore oil and gas industry
100 100
Sapura Drilling Esperanza Ltd. Bermuda Leasing of drilling rig and providing drilling services to offshore oil and gas industry
100 100
Sapura Drilling Jaya Ltd. Bermuda/ Republic of Trinidad &
Tobago
Leasing of drilling rig and providing drilling services to offshore oil and gas industry
100 100
Sapura Drilling Raiqa Ltd. Bermuda Leasing of offshore oil and gas drilling rig
100 100
Sapura Drilling Asia Limited Hong Kong/Thailand
Investment holding and provision of oil drilling services
100 100
Sapura Drilling Services Sdn. Bhd. Malaysia Provision of management services for tender rig business
100 100
Sapura Drilling Holdings (Panama) Inc.
Panama Investment holding 100 100
^Sapura Drilling T-19 Pte. Ltd. Federal Territory of Labuan,
Malaysia
Dormant – 100
^Sapura Drilling T-20 Pte. Ltd. Federal Territory of Labuan,
Malaysia
Dormant – 100
~Sapura Drilling Kinabalu Pte. Ltd. Federal Territory of Labuan,
Malaysia
Dormant 100 100
* Dissolved effective 7 May 2021^ Dissolved effective 26 November 2021~ In the process of alternative voluntary winding-up
198
Financial Statements
NOTES TO THE FINANCIAL STATEMENTS– 31 January 2022

44. SUBSIDIARIES AND ACTIVITIES (CONT’D.)
(i) Details of the subsidiaries are as follows (cont’d.):
Name of Subsidiaries
Country of Incorporation/Principal Place
of Business Principal Activities
Proportion ofOwnership Interest
2022%
2021%
(am) Held through Sapura Drilling Asia Limited
Sapura Drilling Holdings Limited Hong Kong/Ivory Coast
Investment holding and provision of oil drilling services
100 100
(an) Held through Sapura Drilling Holdings (Panama) Inc. and Sapura Drilling Asia Limited
^Sapura Drilling Sdn. Bhd. Brunei Offshore drilling, workover and development of oil and gas wells
– 100
(ao) Held through Sapura Drilling Asia Limited and Sapura Drilling Holdings Limited
Sapura Energy Angola, LDA Republic of Angola
Provision of drilling services to offshore oil and gas industry
100 100
(ap) Held through Sapura Drilling Pte. Ltd. and Sapura Drilling Asia Limited
^Sapura Drilling Sdn. Bhd. Brunei Offshore drilling, workover and development of oil and gas wells
100 –
PT Sapura Nordrill Indonesia Indonesia Offshore oil and gas construction and drilling services
95 95
(aq) Held through SapuraCrest Ventures Sdn. Bhd.
Sapura Exploration and Production (RSC) Sdn. Bhd.
Malaysia Dormant 100 100
(ar) Held through Sapura Exploration and Production (RSC) Sdn. Bhd.
Sapura Sambang Sdn. Bhd. Malaysia Dormant 100 100
(as) Held through Sapura Energy Ventures Sdn. Bhd.
Sapura Exploration and Production (Sabah) Inc.
Bahamas/ Malaysia
Exploration, development and production of crude oil and natural gas
100 100
(at) Held through Sapura Management Services Sdn. Bhd.
Sapura Talent Pte. Ltd. Singapore Manpower contracting service. Manage crews, seafares including marine crews
100 100
^ Sapura Drilling Holdings (Panama) Inc. transferred its shareholding of 99.9% to Sapura Drilling Pte Ltd effective 27 September 2021.
Sap
ura
En
erg
y B
erh
ad
An
nu
al R
ep
ort
20
22
199
Financial Statements

44. SUBSIDIARIES AND ACTIVITIES (CONT’D.)
(i) Details of the subsidiaries are as follows (cont’d.):
Name of Subsidiaries
Country of Incorporation/Principal Place
of Business Principal Activities
Proportion ofOwnership Interest
2022%
2021%
(au) Held through Sapura Energy (UK) Limited
Sapura Energy Ghana Limited Ghana Engineering, procurement, construction, installation, commissioning, maintenance and decommissioning fixed and floating oil and gas facilities, marine construction, marine conversion, marine repair, infrastructure construction, construction and installation of offshore renewable facilities
100 100
(av) Held through Sapura Offshore Sdn. Bhd. and Sapura Fabrication Sdn. Bhd.
Sapura Energy Engineering & Construction, LDA
Angola Providing drilling services to offshore oil and gas industry in Angola
100 100
(aw) Held through Sapura Energy DMCC
^Alta Navegación de México, S. de. R.L. de C.V.
Mexico The acquisition, lease, chartering, flagging, administration, matriculation and operation of vessels
49 49
^ Transferred from Sapura Energy DMCC on 11 February 2021
45. JOINT OPERATION ARRANGEMENTS
Details of the joint operation arrangements are as follows:
ParticipatingInterest
2022%
2021%
Production Sharing Contracts:
Sabah
SB331 70 70
SB332 70 70
200
Financial Statements
NOTES TO THE FINANCIAL STATEMENTS– 31 January 2022

46. MATERIAL LITIGATION
(i) Sarku Engineering Services Sdn. Bhd.
On 20 February 2006, Sarku Engineering Services Sdn. Bhd. (“SESSB”), a wholly owned subsidiary of the Company entered into a contract with Oil and Natural Gas Corporation Limited (“ONGC”) for the performance of works by SESSB to revamp 26 well platforms located in Mumbai High South field offshore site (“Contract”).
On 21 September 2012, SESSB commenced arbitration proceedings by filing a statement of claim against ONGC in relation to disputes pursuant to the Contract for a sum of Indian Rupee (“INR”) 1,063,759,201 and USD123,819,632 (including interest, costs, losses and damages).
On 17 December 2012, ONGC has filed their reply to the Statement of Claim. No counter claims have been filed by ONGC. Documents and witness statements have been filed.
Examination in chief took place in January 2014 whereby revised list of documents were exchanged and recorded.
The cross examination of ONGC’s witness were on 22 to 24 December 2014 and 5 to 6 January 2015.
In January 2018 and February 2018 sittings, SESSB have concluded its arguments on each of the claims filed before the tribunal. On 5 February 2018, submissions were made by SESSB’s external counsel and thereafter arguments were closed.
ONGC counsel commenced their arguments in defence on 6 February 2018 and continued on the 2 to 4 May 2018. They concluded their arguments in the said sittings and handed over written note of their arguments.
Proceedings continued on the 21, 22 and 23 November 2018 with submissions from SESSB’s counsel. The tribunal heard ONGC’s counsel present its submissions on 12 and 13 February 2019. Final written submission has been submitted to arbitrators on 15 April 2019. ONGC presented its submissions on 31 July 2019. SESSB was awarded the sum of USD3,009,789 by the arbitral tribunal, comprised of work done of USD1,983,521 (subject to 4.368% withholding tax to be deducted by ONGC) and interest of USD1,026,267 (subject to income tax of 43.68%).
SESSB has instructed its solicitors to file an appeal against the Award dated 30 November 2019.
SESSB has been advised by its solicitors, that SESSB has reasonably strong grounds to appeal against the arbitral tribunal’s decision. The following are reasons provided by its solicitors as grounds of appeal against the arbitral tribunal’s award.
(a) The arbitral tribunal had failed to consider the record and detailed written and oral submissions on behalf of SESSB in arriving at its findings while rejecting most of SESSB’s claims and that they had made an error in rejecting the claims; and
(b) There were instances of procedural irregularities in the arbitration in favour of ONGC which may lead to a successful challenge of the award in the courts.
ONGC has since filed an application to the tribunal disputing the computation of the award and seeking a correction of the amounts awarded in respect of the interest portion of the award.
The application of ONGC for correction of the errors in the award was allowed by the tribunal on 29 August 2020. The total amount payable by ONGC as per the Final Award is USD413,037 (“Final Award”). The tribunal initially awarded SESSB a sum of USD3,009,789 (“First Award”). The difference between the First Award and the Final award is in the sum of USD2,596,752. Parties will have 90 days from the date of the Final Award to file an appeal to the courts.
SESSB’s solicitor has accordingly advised that the Tribunal’s decision will not affect SESSB’s position in respect of its challenge to the Final Award and as such, SESSB has instructed the counsel in charge for this matter to file an appeal against the Final Award dated 29 August 2020. The Appeal was duly filed on 8 December 2020. The matter is now pending admission stage where it is to be listed for hearing upon filing of the Petition.
Sap
ura
En
erg
y B
erh
ad
An
nu
al R
ep
ort
20
22
201
Financial Statements

46. MATERIAL LITIGATION (CONT’D.)
(i) Sarku Engineering Services Sdn. Bhd. (cont’d.)
For the sums awarded to SESSB under the Final Award which are not being appealed against, a Letter of Demand was issued to ONGC on 7 May 2021 to demand for the sum of INR19,693,815 and USD146,904.
In relation to SESSB’s letter of demand dated 7 May 2021, ONGC responded on 12 May 2021, acknowledging SESSB’s demand and requested for information on SESSB’s Withholding Tax Order and GST registration details. A response has been issued by SESSB to ONGC on 16 November 2021 appending the documents requested by ONGC i.e. the Withholding Tax Order and Invoices for the sums demand. ONGC then responded on 16 December 2021 by requesting for further information relating to SESSB’s GST Registration and SESSB’s account to which SESSB has reverted with the requested information. ONGC’s latest response on 17 January 2022 is also seeking for further information in relation to the tax component of the awarded sum under the Final Award. SESSB has responded on 11 April 2022 with the requested information and a stern demand for the outstanding awarded sum.
As of 26 May 2022, with regards to the appeal in the Mumbai High Court filed by SESSB on 8 December 2020 against the Final Award, the matter has yet to be listed for hearing.
(ii) Sapura Fabrication Sdn. Bhd.
On 18 March 2011, Sapura Fabrication Sdn. Bhd. (“SFSB”), a wholly-owned subsidiary of the Company entered into a contract with Petrofac (Malaysia) Limited (“PML”) to provide works for the engineering, procurement and construction of well head platforms for the Cendor Phase 2 Development Project and the Cendor field is located in Block PM 304 in the Malaysian sector of the South China Sea (“Contract”).
On 26 March 2018, SFSB received a commencement request from PML to formally initiate a claim by way of arbitration proceedings at the Asian International Arbitration Centre for damages amounting to a sum of USD9,558,003 and RM16,785,227 vide its Re-amended Point of Claims in relation to disputes arising from the Contract. PML has alleged breach of riser height requirements and preservation obligations by SFSB. The claim by PML was made separately in two currencies as the claim is based on the rates and currencies prescribed in the Contract.
On 26 April 2018, SFSB responded to PML’s claim and made a counter claim for a total amount of RM13,521,495.
The arbitrators have been appointed and parties had attended the first arbitration meeting on 21 July 2018. PML has filed their Points of Claim on 21 September 2018 and SFSB has filed its Defence and Counterclaim on 3 December 2018. Subsequently, PML submitted their Points of Reply and Defence to Counterclaim on 4 February 2019. PML has requested to amend their Point of Claim and the same was filed on 8 March 2019. SFSB’s rejoinder is due on 18 March 2019 and the same was filed on the said date. The deadline for parties to exchange bundle of documents was on 5 April 2019 and any request for discovery/disclosure has been filed on 9 May 2019. The documents ordered to be produced by SFSB was produced on 12 September 2019. On the other hand, the documents ordered to be produced by PML were partially tendered on 23 September 2019. Witness Statements have been filed on 15 November 2019 and the rebuttal witness statements are to be filed by 15 December 2019.
The hearing proceeded on 26, 27 and 28 April 2021 as scheduled with 2 of PML’s witnesses giving their evidences. The hearing will continue on the following dates:
(a) 26, 27, 28 & 31 April 2021;
(b) 3, 4, 5, 6, 7 & 10 May 2021.
(c) 20 September 2021 to 24 September 2021;
(d) 27 September 2021 to 1 October 2021; and
(e) 4 October 2021 to 6 October 2021.
During the case management fixed on 6 April 2021, the tribunal has vacated May 2021 dates as two of the PML’s witnesses are unable to attend the upcoming April 2021 and May 2021 tranche of hearing dates due to their work arrangement.
202
Financial Statements
NOTES TO THE FINANCIAL STATEMENTS– 31 January 2022

46. MATERIAL LITIGATION (CONT’D.)
(ii) Sapura Fabrication Sdn. Bhd. (cont’d.)
The hearing proceeded on the following dates as scheduled:
(i) 20 September 2021 to 24 September 2021;
(ii) 27 September 2021 to 1 October 2021;
(iii) 4, 6, 7 and 8 October 2021; and
(iv) 13 November 2021.
The hearing dates scheduled in January and February 2022 were vacated and the Tribunal has fixed the following dates for continued hearing:
(i) 25 April 2022 to 29 April 2022;
(ii) 17 May 2022 to 20 May 2022;
(iii) 8 August 2022 to 12 August 2022; and
(iv) 15 August 2022 to 19 August 2022.
The matter was scheduled for case management on 22 April 2022 and the Tribunal decided to vacate the following hearing dates fixed earlier with PML’s agreement, which was due to the effect of the High Court Order (the Restraining Order).
(i) 25 April 2022 to 29 April 2022;
(ii) 17 May 2022 to 20 May 2022; and
(iii) 8 August 2022.
PML has indicated that they are currently awaiting to receive the applicable notice from Sapura to allow them to proceed with the filing of proof of debt exercise. Subject to the outcome of the proof of debt exercise, they will then consider whether or not to seek leave to proceed with the arbitration pursuant to the terms of the High Court Order.
A case management conference is scheduled to be conducted on 11 August 2022 for the parties to update the Tribunal vis-à-vis the status/outcome of the scheme and for the Tribunal to chart the course of the arbitration moving forward.
Sap
ura
En
erg
y B
erh
ad
An
nu
al R
ep
ort
20
22
203
Financial Statements

46. MATERIAL LITIGATION (CONT’D.)
(iii) Sapura Energy do Brasil Ltda
On 5 January 2020, Sapura Energy Berhad’s subsidiary, Sapura Energy do Brasil Ltda. (“SE Brasil”), commenced arbitration proceedings against Centrais Elétricas de Sergipe S.A. (“CELSE”) of Brazil. The arbitration is to resolve disputes arising out of an Engineering, Procurement, Construction and Installation Contract (“Contract”) dated 20 November 2017.
SE Brasil had completed the works under the Contract in November 2019.
Due to unresolved disputes such as non-payment of milestone payments and non-payment of variation orders, SE Brasil commenced the arbitration proceedings against CELSE, which is conducted at the International Court of Arbitration in Sao Paulo, Brazil, under the International Chamber of Commerce (ICC) Arbitration Rules. The arbitration tribunal comprises of 3 arbitrators. Chairman for the arbitration proceeding has been appointed.
(a) SE Brasil filed their Statement of Claims for the sum of USD84,606,035 on 29 March 2021.
(b) Celse filed Respondent’s Statement of Claims for the sum of USD89,799,186.10 on 29 March 2021.
(c) SE Brasil filed Claimant’s and Additional Party’s Statement of Defense against Respondent’s Statement of Claim on 28 May 2021.
(d) Celse filed Respondent’s Statement of Defense against Claimant’s Statement of Claim on 28 May 2021.
(e) SE Brasil filed Claimant’s Reply on 28 June 2021.
(f) Celse filed Respondent’s Reply on 28 June 2021.
(g) SE Brasil filed Claimant’s and Additional Party’s Rejoinder on 28 July 2021.
(h) Celse filed Respondent’s Rejoinder on 28 July 2021.
Issues to be determined by the Arbitral Tribunal, witness statements and request for additional evidence was submitted on 27 September 2021.
(a) On 30 September 2021, SE Brasil requested for leave to file expert rebuttal.
(b) On 10 November 2021, leave for SE Brasil to file expert rebuttal was granted.
(c) SE Brasil filed rebuttal to Technomar report on 10 December 2021.
The arbitral tribunal is now fully constituted following the ICC’s confirmation of CELSE’s third nominee. Evidentiary hearing was conducted on 26 January 2022.
(a) 28 March 2022, Parties submitted their application for document production by the counterparty in the form of a Redfern Schedule;
(b) 12 April 2022 – SE Brasil and Sapura Energy Berhad (“Sapura Energy”) informed they did not object against the production of the documents requested by CELSE;
(c) 12 April 2022 – CELSE objected to the prodcution of the documents requested by SE Brasil and Sapura Energy (Answer to the Redfern Schedule)
(d) April 2022 – SE Brasil and Sapura Energy submitted their answer to the objections presented by CELSE to the production of the requested documents (Reply to the Redfern Schedule);
(e) 27 April 2022 – CELSE submitted a motion to the Arbitral Tribunal requesting that SE Brasil and Sapura Energy produced the non-objected documents immediately;
(f) 28 April 2022 – SE Brasil and Sapura Energy presented a submission to the Arbitral Tribunal in attention to CELSE’s submission dated 27 April 2022;
(g) 3 May 2022 – The Arbitral Tribunal determined, via email, that SE Brasil and Sapura Energy provide the non-objected documents to CELSE by 10 May 2022;
(h) 10 May 2022 – SE Brasil and Sapura Energy produced the non-objected documents to CELSE.
CELSE’s counter claim against SE Brasil amounted to USD89,799,186 are in respect of delay penalties, damages and/or expenses due to failure to perform the contract, breach of warranty provision and claim for warranty extension items which CELSE had or will have to perform correction given SE Brasil’s inaction.
204
Financial Statements
NOTES TO THE FINANCIAL STATEMENTS– 31 January 2022

46. MATERIAL LITIGATION (CONT’D.)
(iv) Winding up petitions
The following are the list and status of the Winding Petitions served to the Group and its subsidiaries. On 10 March 2022, in view of the Restraining Order obtained by the Group, the case management and hearing of the Petitions will be vacated as the winding up proceedings will be stayed for three months.
(a) Sun Hardware Enterprise Sdn Bhd vs Sapura Fabrication Sdn. Bhd. – Shah Alam High Court (BA-28NCC-634-12/2021)
i) Winding up petition date – 15 December 2021
ii) Case management and hearing dates – 17 January 2022 and 10 March 2022
Notice of discontinuance has been filed on 4 March 2022 and the winding up petition has been withdrawn.
(b) Hycotech Sdn Bhd vs Sapura Offshore Sdn. Bhd. – Shah Alam High Court (BA-28NCC-638-12/2021)
i) Winding up petition date – 17 December 2021
ii) Case management and hearing dates – 17 February 2022 and 9 March 2022
Court has scheduled 22 April 2022 for the hearing of the Order 14A and Striking Out Application, and for the hearing of the Petition itself.
(c) Perdana Nautika Sdn Bhd vs Sapura Offshore Sdn. Bhd. – Kuala Lumpur High Court (WA-28NCC-920-12/2021)
i) Winding up petition date – 20 December 2021
ii) Case management and hearing dates – 22 February 2022 and 27 April 2022
(d) Perdana Nautika Sdn Bhd vs Sapura Pinewell Sdn. Bhd. – Kuala Lumpur High Court (WA-28NCC-921-12/2021)
i) Winding up petition date – 20 December 2021
ii) Case management and hearing dates – 23 February 2022 and 26 April 2022
(e) Hycotech Sdn Bhd vs Sapura Pinewell Sdn. Bhd. – Shah Alam High Court (BA-28NCC-639-12/2021)
i) Winding up petition date – 20 December 2021
ii) Case management and hearing dates – 28 February 2022 and 9 March 2022
Petitioner informed the Court during the hearing on 9 March 2022 the Petitioner wishes to withdraw the petition.
However, another creditor has appeared as a supporting creditor during the hearing on 9 March 2022, and the Court directed the creditor to file its formal application to be substituted as the petitioner within 14 days.
(f) Fast Global Link Services vs Sapura Subsea Services Sdn. Bhd. – Shah Alam High Court (BA-28NCC-27-01/2022)
i) Winding up petition date – 13 January 2022
ii) Case management and hearing dates – 14 February 2022 and 12 April 2022
(g) Mectra Synergy (M) Sdn Bhd vs Sapura Subsea Services Sdn. Bhd. – Shah Alam High Court (BA-28NCC-31-01/2022)
i) Winding up petition date – 25 January 2022
ii) Case management and hearing dates – 17 February 2022 and 20 April 2022
Sap
ura
En
erg
y B
erh
ad
An
nu
al R
ep
ort
20
22
205
Financial Statements

46. MATERIAL LITIGATION (CONT’D.)
(iv) Winding up petitions (cont’d.)
The following are the list and status of the Winding Petitions served to the Group and its subsidiaries. On 10 March 2022, in view of the Restraining Order obtained by the Group, the case management and hearing of the Petitions will be vacated as the winding up proceedings will be stayed for three months (cont’d.).
(h) Equatorial Marine Fuel Management vs Sapura Offshore Sdn. Bhd. – Shah Alam High Court (BA-28NCC-68-01/2022)
i) Winding up petition date – 25 January 2022
ii) Case management and hearing dates – 28 February 2022 and 25 April 2022
(i) DTEC Engineering and Construction Sdn Bhd vs Sapura Project Services Sdn. Bhd. – Shah Alam High Court (BA-28NCC-72-01/2022)
i) Winding up petition date – 27 January 2022
ii) Case management and hearing dates – 28 February 2022 and 25 April 2022
On 21 April 2022 Sapura Energy Berhad, Sapura Digital Solutions Sdn. Bhd., Sapura Diving Services Sdn. Bhd., Sapura Maintenance Services Sdn. Bhd., Sapura Fabrication Sdn. Bhd., Sapura Pinewell Sdn. Bhd., Sapura Onshore Sdn. Bhd., Sapura Subsea Services Sdn. Bhd., Sapura Services Sdn. Bhd., Sapura Management Services Sdn. Bhd., Sapura Marine Sdn. Bhd., Sapura Drilling Services Sdn. Bhd., Sapura Power Services Sdn. Bhd., Sapura Offshore Sdn. Bhd., and Sapura 3000 Pte Ltd as Creditors to Sapura Project Services Sdn. Bhd. filed an application to appoint Liquidator for the Respondent (Sapura Project Services Sdn. Bhd.).
On 17 May 2022 DTEC Engineering and Construction Sdn Bhd filed an application to appoint two liquidators.
The matter is now fixed for case management on 13 June 2022.
(j) Dura International Sdn Bhd vs Sapura Fabrication Sdn. Bhd. – Shah Alam High Court (BA-28NCC-83-02/2022)
i) Winding up petition date – 7 February 2022
ii) Case management and hearing dates – 10 March 2022 and 18 May 2022
(k) Astro Offshore Pte Ltd vs Sapura Fabrication Sdn. Bhd. – Shah Alam High Court (BA-28NCC-87-02/2022)
i) Winding up petition date – 7 February 2022
ii) Case management and hearing dates – 14 March 2022 and 19 May 2022
(l) Public Crane Heavy Equipment Sdn Bhd vs Sapura Fabrication Sdn. Bhd. – Shah Alam High Court (BA-28NCC-92-02/2022)
i) Winding up petition date – 9 February 2022
ii) Case management and hearing dates – 14 March 2022 and 19 May 2022
(m) MMA Offshore Malaysia Sdn Bhd vs Sapura Pinewell Sdn. Bhd. – Kuala Lumpur High Court (WA-28NCC-111-02/2022)
i) Winding up petition date – 14 February 2022
ii) Case management and hearing dates – 15 March 2022 and 8 June 2022
(n) Icon Offshore Group Sdn Bhd vs Sapura Offshore Sdn. Bhd. – Shah Alam High Court (BA-28NCC-119-02/2022)
i) Winding up petition date – 25 February 2022
ii) Case management and hearing dates – 17 March 2022 and 24 May 2022
206
Financial Statements
NOTES TO THE FINANCIAL STATEMENTS– 31 January 2022

46. MATERIAL LITIGATION (CONT’D.)
(iv) Winding up petitions (cont’d.)
The following are the list and status of the Winding Petitions served to the Group and its subsidiaries. On 10 March 2022, in view of the Restraining Order obtained by the Group, the case management and hearing of the Petitions will be vacated as the winding up proceedings will be stayed for three months (cont’d.).
(o) Posh Subsea Pte Ltd vs Sapura Fabrication Sdn. Bhd. – Shah Alam High Court (BA28NCC-145-03/2022)
i) Winding up petition date – 3 March 2022
ii) Case management and hearing dates – 6 April 2022 and 7 June 2022
(p) Lincoln Energy Sdn Bhd vs Sapura Offshore Sdn. Bhd. – Shah Alam High Court (BA-28NCC-146-03/2022)
i) Winding up petition date – 4 March 2022
ii) Case management and hearing dates – 6 April 2022 and 7 June 2022
(q) Semco Salvage (V) Pte Ltd vs Sapura Offshore Sdn. Bhd. – Shah Alam High Court (BA28NCC-144-03/2022)
i) Winding up petition date – 3 March 2022
ii) Case management and hearing dates – 6 April 2022 and 7 June 2022
(r) Danamin (M) Sdn Bhd vs Sapura Project Services Sdn. Bhd. – Shah Alam High Court (BA-28NCC-139-02/2022)
i) Winding up petition date – 28 February 2022
ii) Case management and hearing dates – 31 March 2022 and 30 May 2022
On 13 May 2022 Sapura Energy Berhad, Sapura Digital Solutions Sdn. Bhd., Sapura Diving Services Sdn. Bhd., Sapura Maintenance Services Sdn. Bhd., Sapura Fabrication Sdn. Bhd., Sapura Pinewell Sdn. Bhd., Sapura Onshore Sdn. Bhd., Sapura Subsea Services Sdn. Bhd., Sapura Services Sdn. Bhd., Sapura Management Services Sdn. Bhd., Sapura Marine Sdn. Bhd., Sapura Drilling Services Sdn. Bhd., Sapura Power Services Sdn. Bhd., Sapura Offshore Sdn. Bhd., and Sapura 3000 Pte Ltd as Creditors to Sapura Project Services Sdn. Bhd. filed applications.
(a) to appoint Liquidator for the Respondent (Sapura Project Services Sdn. Bhd.).
(b) to appoint Interim Liquidator for the Respondent (Sapura Project Services Sdn. Bhd.). This is pending the hearing for appointment of Liquidator.
The matter was fixed for case management on 30 May 2022.
(s) VKI Marketing Sdn Bhd vs Sapura Offshore Sdn. Bhd. – Shah Alam High Court (BA-28NCC-159-03/2022)
i) Winding up petition date – 22 February 2022
ii) Case management and hearing dates – 11 April 2022 and 13 June 2022
(t) Tumpuan Megah Development Sdn Bhd vs Sapura Geosciences Sdn. Bhd. – Shah Alam High Court (BA-28NCC-181-03/2022)
i) Winding up petition date – 17 March 2022
ii) Case management and hearing dates – 14 April 2022 and 20 June 2022
Sap
ura
En
erg
y B
erh
ad
An
nu
al R
ep
ort
20
22
207
Financial Statements