Asia Glovemakers - Supermax Corporation Berhad
78
Latex prices continue to fall – earnings upside Short-term upside from ongoing decline in NRL, medium-term upside from Chinese demand We update our TPs for lower near-term input costs – the latex price is down 20% since April 2011 due to increasing rubber inventories. Should a slowdown occur, industrial glovemaker revenues should be solid, whilst there is weaker bargaining power for medical glovemakers. In addition, we believe there is potential for medium- term revenue upside from ongoing hospital expansion in China. We believe the risk-reward picture is favourable for Supermax (BUY) and Ansell (BUY from Neutral). We downgrade Top Glove (REDUCE from Neutral) and Kossan Rubber (NEUTRAL from Buy). Key analysis in this anchor report includes: • We expect earnings rebounds in 2012 of c10% to 56% for the Malaysian glovemakers under coverage due to the latex price easing. • Medical glove market demand has grown by 8-10% pa over the past decade, in contrast to aggregate capacity growth of 23% pa. • In China, we believe glove use in hospitals is low despite their critical role in infection control. As the standard of living and quality of healthcare in China increases, we believe this will lead to increased demand for better quality gloves. EQUITY RESEARCH ANCHOR REPORT See Appendix A-1 for analyst certification and important disclosures. Analysts employed by non-US affiliates are not registered or qualified as research analysts with FINRA in the US. September 27, 2011 Research analysts Australia Health Care & Pharmaceuticals Zara Lyons - NAL [email protected] +61 2 8062 8407 Dr David Stanton - NAL [email protected] +61 2 8062 8410 Malaysia Health Care & Pharmaceuticals Jacinda Loh - NSM j[email protected] +60 3 2027 6889 Raashi Gupta - NSFSPL [email protected] +91 22 4053 3779 China Health Care & Pharmaceuticals Gideon Lo, CFA - NIHK [email protected] +852 2252 6190 Asia Glovemakers
-
Upload
khangminh22 -
Category
Documents
-
view
0 -
download
0
Transcript of Asia Glovemakers - Supermax Corporation Berhad

Latex prices continue to fall – earnings upside
Short-term upside from ongoing decline in NRL, medium-term upside from Chinese demand
We update our TPs for lower near-term input costs – the latex price is down 20% since April 2011 due to increasing rubber inventories.
Should a slowdown occur, industrial glovemaker revenues should be solid, whilst there is weaker bargaining power for medical glovemakers. In addition, we believe there is potential for medium-term revenue upside from ongoing hospital expansion in China.
We believe the risk-reward picture is favourable for Supermax (BUY) and Ansell (BUY from Neutral). We downgrade Top Glove (REDUCE from Neutral) and Kossan Rubber (NEUTRAL from Buy).
Key analysis in this anchor report includes:
• We expect earnings rebounds in 2012 of c10% to 56% for the Malaysian glovemakers under coverage due to the latex price easing.
• Medical glove market demand has grown by 8-10% pa over the past decade, in contrast to aggregate capacity growth of 23% pa.
• In China, we believe glove use in hospitals is low despite their critical role in infection control. As the standard of living and quality of healthcare in China increases, we believe this will lead to increased demand for better quality gloves.
EQUITY RESEARCH
AN
CH
OR
RE
PO
RT
See Appendix A-1 for analyst certification and important disclosures. Analysts employed by non-US affiliates are not registered or qualified as research analysts with FINRA in the US.
September 27, 2011
Research analysts
Australia Health Care & Pharmaceuticals
Zara Lyons - NAL [email protected] +61 2 8062 8407
Dr David Stanton - NAL [email protected] +61 2 8062 8410
Malaysia Health Care & Pharmaceuticals
Jacinda Loh - NSM [email protected] +60 3 2027 6889
Raashi Gupta - NSFSPL [email protected] +91 22 4053 3779
China Health Care & Pharmaceuticals
Gideon Lo, CFA - NIHK [email protected] +852 2252 6190
Asia Glovemakers

Rating: See report end for details of Nomura’s rating system.
Asia Glovemakers
HEALTH CARE & PHARMACEUTICALS
EQUITY RESEARCH
Latex prices continue to fall – earnings upside
Short-term upside from ongoing decline in NRL, medium-term upside from Chinese demand
September 27, 2011
Action: Lower input costs – NRL price down 20% since April 2011 Post easing of Natural Rubber Latex (NRL) prices off their highs due to increasing industry inventories, from MYR10.9/kg to MYR8.73/kg currently, we have updated our FY12F NRL price to MYR8.50/kg (from MYR8-9/kg across the glovemakers). Hence, FY12F earnings expected to increase by 10-56% for the Asian names under our coverage.
Catalyst: Should a slowdown occur, industrial glove revenue likely to be solid, with weaker bargaining power for medical glovemakers The majority of ANN’s earnings come from the Industrial gloves segment (51% of FY12F EBIT). Even with our lower industrial growth forecast (which correlates with its Industrial division revenue growth) in FY12 compared to pcp, we believe industrial glove growth for ANN should be solid, as Nomura expects an increase in emerging economies’ manufacturing in from low US inventory levels. Also, ANN’s bargaining power as a net examination glove purchaser is likely to remain strong vs the listed Malaysian examination glovemakers, given the latter’s FY12F capacity growth of 15%, versus current output growth of 2-3%.
In addition, medium-term revenue upside from China In line with recent government reforms, China is increasing the breadth and quality of medical services, while we believe glove use in hospitals is low in spite of glove use being critical for infection control. As the standard of living and quality of healthcare in China increases, we believe this will lead to an increased demand for better quality gloves, i.e., away from easily ruptured vinyl gloves to higher-quality latex/nitrile gloves, which the Asian glove providers can supply. Malaysian glovemakers’ sales to Asia remain c10% of total sales (China estimated at <5% of total). We think this has the potential to increase over the medium-term.
Valuation: We update our forecasts and recommendations At current share prices, we believe the risk-reward picture is favourable for Supermax (BUY reiterated) and Ansell (BUY from Neutral). We move to a REDUCE (from Neutral) on Top Glove given: 1) unfavourable valuation despite our earnings growth rebound forecast in 2012F; and 2) lower visibility, given Top Glove has a higher latex product mix than peers.
Fig. 1: Stocks for Action
Priced as at 23 September 2011. TOPG, SUCB, KRI quoted in MYR, ANN in AUD. * based on actual reporting earnings Source: Nomura research, Bloomberg
Anchor themes
Easing costs are likely to remove earnings pressure on medical glovemakers, but near-term demand visibility remains limited on continued capacity expansions. However, we believe there is potential for medium-term revenue upside from ongoing hospital expansion in China.
Nomura vs consensus
We are c5% above consensus for ANN, given our new FY12F NRL price. We are in line for Malaysia.
Research analysts
Australia Health Care & Pharmaceuticals
Zara Lyons - NAL [email protected] +61 2 8062 8407
Dr David Stanton - NAL [email protected] +61 2 8062 8410
Malaysia Health Care & Pharmaceuticals
Jacinda Loh - NSM [email protected] +60 3 2027 6889
Raashi Gupta - NSFSPL [email protected]
+91 22 4053 3779
China Health Care & Pharmaceuticals
Gideon Lo, CFA - NIHK [email protected] +852 2252 6190
Company Code Rating PricePrice
target
Up/downside
(%)P/E
FY11FP/E
FY12F
Ansell ANN AU Buy 12.99 15.25 17.4 14.0* 12.6Kossan KRI MK Neutral 2.60 2.51 (3.5) 7.4 6.7Supermax SUCB MK Buy 2.37 2.88 21.5 7.4 5.3Top Glove TOPG MK Reduce 4.00 3.42 (14.5) 22.0 14.1
See Appendix A-1 for analyst certification and important disclosures. Analysts employed by non US affiliates are not registered or qualified as research analysts with FINRA in the US.

Nomura | Asia Glovemakers September 27, 2011
2
Contents
3 Executive summary
4 Updating our near-term input price assumptions
8 Near-term demand for examination gloves – solid
13 Medium-term revenue upside? A review of the Chinese opportunity
22 The current state of the Chinese glove market
26 Asian glovemakers already in China
28 Could the Chinese glovemakers enter the NRL glove market?
34 Comparative company valuations
39 Ansell
48 Kossan Rubber Industries
54 Supermax Corp Bhd
60 Top Glove Corp
66 Scenario analysis: What if the US and Europe slip back into recession?
71 Appendix A-1

Nomura | Asia Glovemakers September 27, 2011
3
Executive summary We believe that near- and medium-term demand for gloves should be solid.
Short-term opportunity: input costs lower, change in MYR/USD assumptions Malaysian glovemaker stocks have underperformed over the past 12 months, with glove players such as Top Glove, Supermax and Kossan Rubber falling an average of 27% in the past 52 weeks on the back of lower FY10 earnings growth and record-high latex prices. This is compared to a 4% downside move in the market. Post easing of latex prices off its highs (of MYR10.9/kg) to MYR8.73/kg currently, we expect an earnings rebound in 2012 of c10% to 56% for the Malaysian glovemakers under our coverage.
Fig. 2: Change in key assumptions
Source: Nomura estimates
Medium-term revenue upside from Chinese opportunity The healthcare community requires medical gloves, both for examination and surgery, in order to provide a barrier that prevents transmission of micro-organisms to and from patients. In line with recent government reforms, China is increasing the breadth and quality of medical services. In China, we believe glove use in hospitals is low despite their use of gloves being critical for infection control. As the standard of living and quality of healthcare in China increases, we believe this will lead to an increased demand for better quality gloves, i.e. away from easily ruptured vinyl gloves to higher-quality latex and nitrile gloves, which the Asian glove providers can supply. As a result of our analysis, we believe that on a medium-term view, there is an increased opportunity for more latex and nitrile gloves from the Asian glove providers to be sold into China.
Risk-reward increasingly favourable for some of the Asian glovemakers Despite delayed expansion plans, most Malaysian glovemakers have not actually scrapped expansions and are in fact continuing with plans to switch capacity to nitrile gloves to balance their product mix. We believe consolidation has some ways to go, as most major glove manufacturers still have healthy balance sheets and low gearing ratios, and remain unwilling to risk ceding market share. For the Malaysian glovemakers under our coverage, we see a slower improvement in bargaining power given FY12F capacity expansions of 15% versus current output growth of 2-3% y-y (companies like Top Glove are currently seeing single-digit output growth over 2009).
However, at current share prices, the risk-reward picture is favourable for Supermax (BUY reiterated) as P/E valuations have corrected to single-digit valuations of upstream rubber names (which typically command lower multiples) and are at trough levels last seen during the 2008 period. Although Kossan is also at single-digit P/E valuations, it has the highest exposure to Western countries (c. 80%) versus peers, where minor consumables growth is forecast to moderate. Hence, we are downgrading the shares from Buy to NEUTRAL at these levels. ROEs for these companies are expected to stay in the high teens into 2012, owing to a more balanced product mix and slightly better demand visibility. Top Glove is a REDUCE given its unfavourable valuation despite our view of an earnings growth rebound into 2012, while visibility remains less certain as it still has a higher latex product mix than its peers.
For ANN, the majority of its earnings come from the Industrial gloves segment (51% of FY12F EBIT). ANN’s industrial division revenue growth has tracked closely to industrial production. Even though we forecast lower industrial growth in FY12 compared to pcp, we believe industrial glove growth for ANN should be solid. We believe economic recovery is underway in the advanced economies, albeit driven by Japan, and would argue that this will continue to underpin ANN’s Industrial division’s earnings over the medium term. Growth in emerging economies is forecast to be relatively strong, where Nomura expects an increase in manufacturing activity in response to low US inventory levels. While we have made no changes to our revenue forecasts, the impact of changes to raw material costs has increased our EPS forecasts by 6.2% for FY12 and by 6.4% to for FY13.
old new old new old new
RM / USD 3.3 2.90 3.3 2.77 na 2.68
Latex assumption (RM/kg) 8.5-8.8 9.2 8 8.5 na 7.5
2011F 2012F 2013F
In China, we believe the use of gloves in hospitals is low despite their critical role in infection control
Nomura | Asia Glovemakers September 27, 2011
4
Updating our near-term input price assumptions Latex costs form the bulk of input costs for the Asian glovemakers.
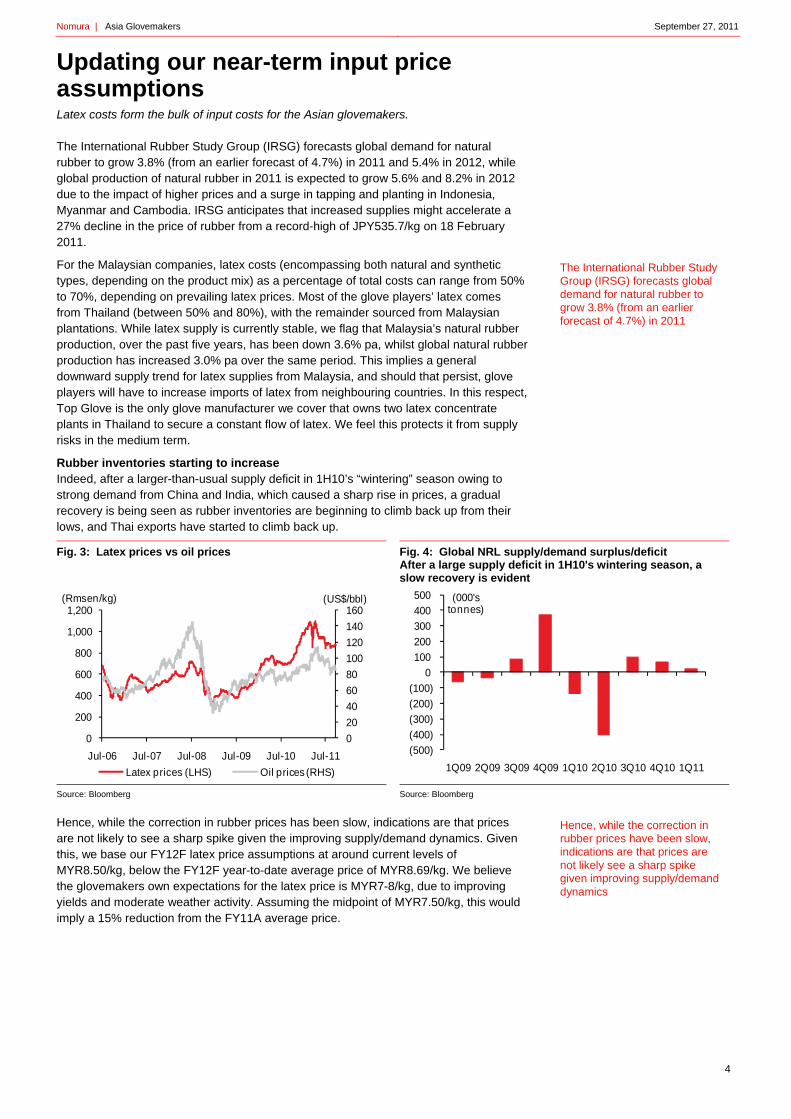
The International Rubber Study Group (IRSG) forecasts global demand for natural rubber to grow 3.8% (from an earlier forecast of 4.7%) in 2011 and 5.4% in 2012, while global production of natural rubber in 2011 is expected to grow 5.6% and 8.2% in 2012 due to the impact of higher prices and a surge in tapping and planting in Indonesia, Myanmar and Cambodia. IRSG anticipates that increased supplies might accelerate a 27% decline in the price of rubber from a record-high of JPY535.7/kg on 18 February 2011.
For the Malaysian companies, latex costs (encompassing both natural and synthetic types, depending on the product mix) as a percentage of total costs can range from 50% to 70%, depending on prevailing latex prices. Most of the glove players’ latex comes from Thailand (between 50% and 80%), with the remainder sourced from Malaysian plantations. While latex supply is currently stable, we flag that Malaysia’s natural rubber production, over the past five years, has been down 3.6% pa, whilst global natural rubber production has increased 3.0% pa over the same period. This implies a general downward supply trend for latex supplies from Malaysia, and should that persist, glove players will have to increase imports of latex from neighbouring countries. In this respect, Top Glove is the only glove manufacturer we cover that owns two latex concentrate plants in Thailand to secure a constant flow of latex. We feel this protects it from supply risks in the medium term.
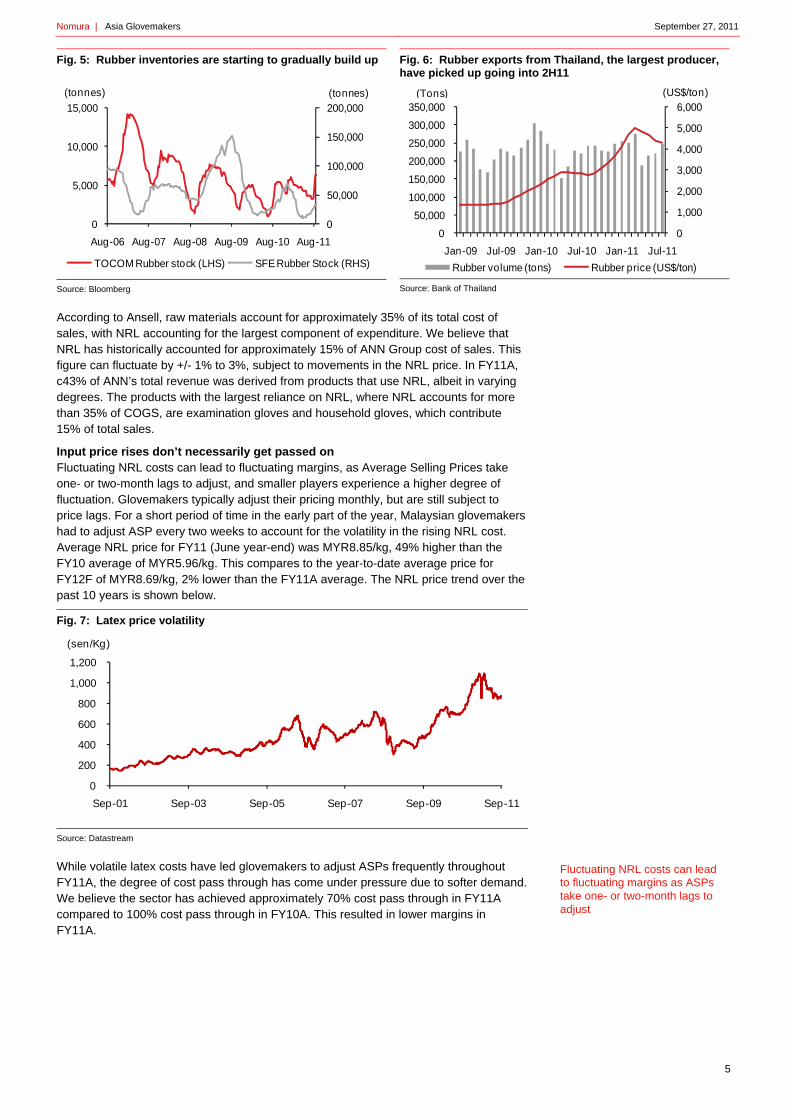
Rubber inventories starting to increase Indeed, after a larger-than-usual supply deficit in 1H10’s “wintering” season owing to strong demand from China and India, which caused a sharp rise in prices, a gradual recovery is being seen as rubber inventories are beginning to climb back up from their lows, and Thai exports have started to climb back up.
Fig. 3: Latex prices vs oil prices
Source: Bloomberg
Fig. 4: Global NRL supply/demand surplus/deficit After a large supply deficit in 1H10's wintering season, a slow recovery is evident
Source: Bloomberg
Hence, while the correction in rubber prices has been slow, indications are that prices are not likely to see a sharp spike given the improving supply/demand dynamics. Given this, we base our FY12F latex price assumptions at around current levels of MYR8.50/kg, below the FY12F year-to-date average price of MYR8.69/kg. We believe the glovemakers own expectations for the latex price is MYR7-8/kg, due to improving yields and moderate weather activity. Assuming the midpoint of MYR7.50/kg, this would imply a 15% reduction from the FY11A average price.
0
20
40
60
80
100
120
140
160
0
200
400
600
800
1,000
1,200
Jul-06 Jul-07 Jul-08 Jul-09 Jul-10 Jul-11
(US$/bbl)(Rmsen/kg)
Latex prices (LHS) Oil prices (RHS)
(500)
(400)
(300)
(200)
(100)
0
100
200
300
400
500
1Q09 2Q09 3Q09 4Q09 1Q10 2Q10 3Q10 4Q10 1Q11
(000's tonnes)
The International Rubber Study Group (IRSG) forecasts global demand for natural rubber to grow 3.8% (from an earlier forecast of 4.7%) in 2011
Hence, while the correction in rubber prices have been slow, indications are that prices are not likely see a sharp spike given improving supply/demand dynamics
Nomura | Asia Glovemakers September 27, 2011
5
Fig. 5: Rubber inventories are starting to gradually build up
Source: Bloomberg
Fig. 6: Rubber exports from Thailand, the largest producer, have picked up going into 2H11
Source: Bank of Thailand
According to Ansell, raw materials account for approximately 35% of its total cost of sales, with NRL accounting for the largest component of expenditure. We believe that NRL has historically accounted for approximately 15% of ANN Group cost of sales. This figure can fluctuate by +/- 1% to 3%, subject to movements in the NRL price. In FY11A, c43% of ANN’s total revenue was derived from products that use NRL, albeit in varying degrees. The products with the largest reliance on NRL, where NRL accounts for more than 35% of COGS, are examination gloves and household gloves, which contribute 15% of total sales.
Input price rises don’t necessarily get passed on Fluctuating NRL costs can lead to fluctuating margins, as Average Selling Prices take one- or two-month lags to adjust, and smaller players experience a higher degree of fluctuation. Glovemakers typically adjust their pricing monthly, but are still subject to price lags. For a short period of time in the early part of the year, Malaysian glovemakers had to adjust ASP every two weeks to account for the volatility in the rising NRL cost. Average NRL price for FY11 (June year-end) was MYR8.85/kg, 49% higher than the FY10 average of MYR5.96/kg. This compares to the year-to-date average price for FY12F of MYR8.69/kg, 2% lower than the FY11A average. The NRL price trend over the past 10 years is shown below.
Fig. 7: Latex price volatility
Source: Datastream
While volatile latex costs have led glovemakers to adjust ASPs frequently throughout FY11A, the degree of cost pass through has come under pressure due to softer demand. We believe the sector has achieved approximately 70% cost pass through in FY11A compared to 100% cost pass through in FY10A. This resulted in lower margins in FY11A.
0
50,000
100,000
150,000
200,000
0
5,000
10,000
15,000
Aug-06 Aug-07 Aug-08 Aug-09 Aug-10 Aug-11
(tonnes)(tonnes)
TOCOM Rubber stock (LHS) SFE Rubber Stock (RHS)
0
1,000
2,000
3,000
4,000
5,000
6,000
0
50,000
100,000
150,000
200,000
250,000
300,000
350,000
Jan-09 Jul-09 Jan-10 Jul-10 Jan-11 Jul-11
Rubber volume (tons) Rubber price (US$/ton)
(Tons) (US$/ton)
0
200
400
600
800
1,000
1,200
Sep-01 Sep-03 Sep-05 Sep-07 Sep-09 Sep-11
(sen/Kg)
Fluctuating NRL costs can lead to fluctuating margins as ASPs take one- or two-month lags to adjust

Nomura | Asia Glovemakers September 27, 2011
6
Fig. 8: Average Annual input prices
Source: Datastream
Should latex costs undergo sharp corrections amid normalising demand and increasing capacity, supplier power could moderate faster, in our view.
Fig. 9: Change in average annual input cost prices (%)
Source: Datastream
Foreign currency movements Natural rubber latex is traded mainly in US dollars. We believe an appreciation in the currencies of natural rubber exporting countries against the US dollar aids natural rubber prices to increase in US dollar terms:
• Thai baht: we have analysed whether there is a correlation between the Thai baht and the price of Thai natural rubber. Using daily prices over the last two years, we found the R2 was 0.6244, which indicates a moderate co-variance of the Thai baht with the Thai natural rubber price;
• Malaysian ringgit: we have analysed whether there is a correlation between the Malaysian ringgit and the price of Malaysian natural rubber. Using daily prices over the last two years, we found the R2 was 0.6701, which indicates a moderate co-variance of the Malaysian ringgit with the Malaysian natural rubber price;
• Japanese yen: The value of the Japanese yen has a negative influence on the natural rubber price. During periods when the yen has depreciated, speculators invest in commodities, driving up prices such as the Tokyo Commodity Exchange (TOCOM) rubber futures. Using continuous daily prices over the last two years, we found the correlation coefficient was R2=0.2513, which indicates a low co-variance of the Japanese yen to the TOCOM rubber price.
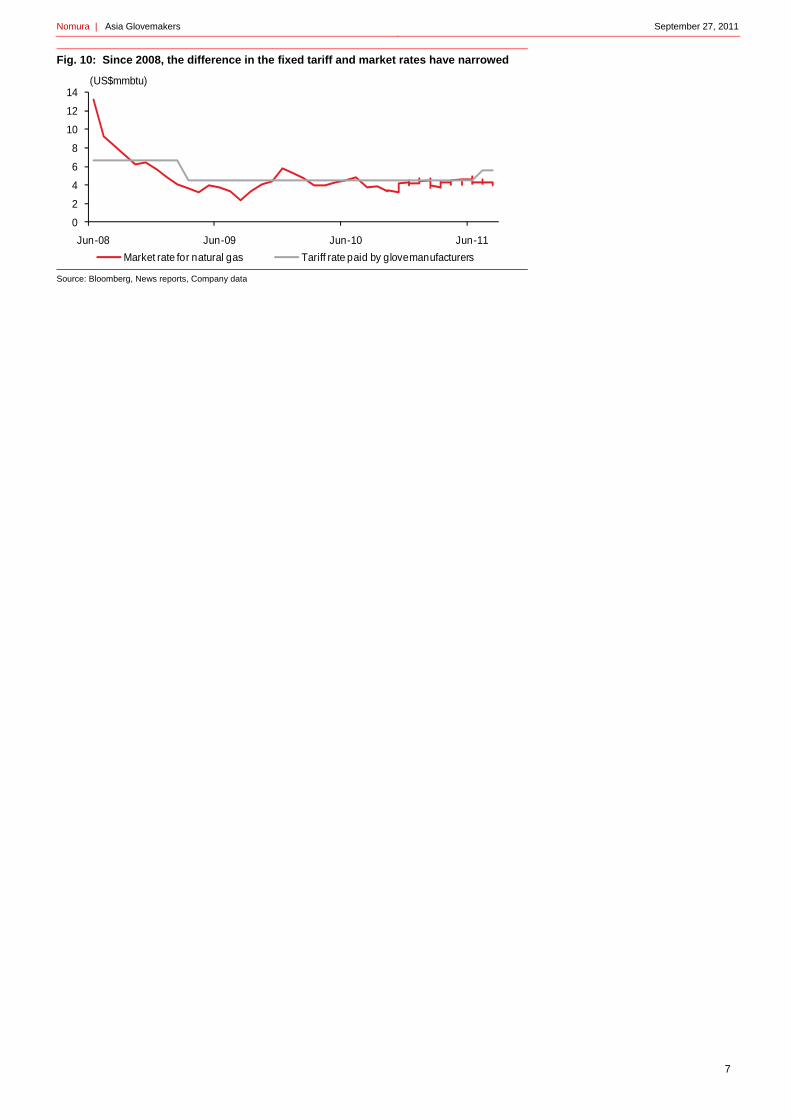
Gas costs Other costs are split fairly equally amongst labour, packaging and gas costs, typically comprising no more than 10% of costs. While tariff hikes have been announced recently for Malaysian manufacturers, we highlight that the current market price paid now is close to the market rate for natural gas.
0.0
0.5
1.0
1.5
2.0
2.5
3.0
3.5
0
500
1,000
1,500
2,000
2,500
2003 2004 2005 2006 2007 2008 2009 2010 2011
(US$/Kg)(US$/MT)
PVC (LHS) Acrylonitrile (LHS) Latex (RHS)
(30)(20)(10)
0 10 20 30 40 50 60 70
2003 2004 2005 2006 2007 2008 2009 2010 2011
(%)
Latex US$/Kg PVC US$/MT Acrylonitrile US$/MT
There is moderate co-variance of the Malaysian ringgit with the Malaysian natural rubber price
Nomura | Asia Glovemakers September 27, 2011
7
Fig. 10: Since 2008, the difference in the fixed tariff and market rates have narrowed
Source: Bloomberg, News reports, Company data
0
2
4
6
8
10
12
14
Jun-08 Jun-09 Jun-10 Jun-11
(US$mmbtu)
Market rate for natural gas Tariff rate paid by glove manufacturers

Nomura | Asia Glovemakers September 27, 2011
8
Near-term demand for examination gloves – solid We explore whether potential supply demand exceeds current demand.
We conclude that, due to a series of recent expansions in capacity by the major players, demand for gloves is c6-8% lower than current potential supply. However, the reason for capacity expansion is readiness for a potential global threat that would require increased numbers of gloves, namely another outbreak of SARS or avian influenza.
In this section, we:
• Highlight the current state of global glove demand;
• Compare this with current and potential future supply of gloves;
• Evaluate whether excess capacity in the industry will erode company margins; and
Global demand for gloves
There are two drivers of the global glove market: 1) the use of protective gloves within industry; and 2) the use of gloves within the healthcare space. We believe industrial glove use is related to the economy. Emerging from a mid-2010 “soft-patch,” the US economy appears to be entering a more secure phase of recovery. Nonetheless, powerful headwinds are likely to keep the pace of growth quite moderate in 2012. First, the sweeping reforms of the health care and financial services industries could impede hiring and investment. Second, household deleveraging should restrain consumption and put downward pressure on real estate prices. Third, fiscal policy is expected to be less favourable for growth. The positive impulse from the 2009 Recovery Act has now turned into drag, while state and local government budget pressures should weigh on outlays and employment. Finally, while we see some improvement in the housing sector, sales volumes and home-building are likely to remain depressed compared to pre-recession levels. We believe hospital glove use is related to the ongoing need for barrier protection for healthcare workers. The last few years has witnessed a rapid expansion of the medical gloves market globally, as awareness increases of the benefits of gloves in providing effective protection.
Fig. 11: Global annual demand for examination/surgical gloves
Source: Top Glove annual data
Global annual demand for examination gloves was estimated at 150bn pcs pa in 2011. Historically, the market has grown by 8-10% pa over the last decade. We expect these rates of growth to continue. For instance, every year, 3mn of 35mn healthcare workers are exposed to blood-borne pathogens (Hepatitis B, C and HIV). With the cancer diagnosis rate increasing exponentially (by 50% in 2020, according to WHO), more and more hazardous cytotoxics are being handled.
The US and EU27 accounted for 11% of world population but used 68% of glove manufactured on a global basis in 2009. In contrast, the rest of the world (ROW) accounted for 89% of the population and used only 32% of gloves produced globally.
0
5
10
15
20
25
30
35
40
1999 2000 2001 2002 2003 2004 2005 2006 2007 2008 2009 2010 2011
(No. of gloves, bn)
Due to a series of recent expansions in capacity by the major players, demand for gloves is c6-8% lower than current potential supply. However, the reason for capacity expansion is readiness for a potential global threat that would require increased numbers of gloves, namely another outbreak of SARS or avian influenza

Nomura | Asia Glovemakers September 27, 2011
9
Over time, we believe emerging markets will demand an increasing proportion of the total market for exam gloves.
Fig. 12: Global examination/surgical glove usage by region
Source: Malaysian rubber export promotion council and company
Going forward, we believe the key healthcare industry drivers of increasing glove use include:
• Barrier protection: Medical glove use is essential in the healthcare industry to serve as a protective barrier against infection and disease;
• Emerging markets: Increasing healthcare and hygiene awareness in developing countries;
• Ageing population: A greater proportion of population is living longer and therefore requiring more healthcare services;
• Healthcare regulations: Healthcare reform in the US and China. Application of healthcare regulations such as OSHA in US, EU-27 and SESI in Brazil; and
• Emergence of health threats: H1N1, SARS, bird flu, bio-terrorism threats such as Anthrax.
Global supply of gloves
We believe the Malaysian glovemakers account for c60% of the global capacity for gloves. This position has been achieved through a combination of proximity to key raw materials, infrastructure, R&D, development of supporting industries and support from government agencies. This has been two decades in the making, has led to a competitive advantage for the Malaysian glovemakers, given their early headstart in the sector, in our view.
Capacity analysis Top Glove, Supermax, Kossan and others have all progressively increased capacity over the past decade.
In particular:
• Top Glove: Top Glove is the market leader in Malaysia in terms of natural rubber glove capacity. It currently has 18 factories producing 35.25bn pcs, and is building three new factories (6.3bn pcs), which are scheduled to come on stream by May 2012. Expansions have been delayed for a third time owing to weak demand rebounds off 2010 highs, and the company is not planning any further expansions following these existing plans as yet;
• Supermax: The company only added 174mn pcs of capacity in 2011 owing to refurbishment of old lines, instead of adding new lines. The bulk of that increase in capacity has been focused mainly on surgical gloves. However for 2012, 2.6bn pcs of capacity are in the works, representing a 15% increase in capacity. According to the company, that remains on track.
32.3%35.7%
12.6%7.5%4.8%
0
10
20
30
40
50
2000 2001 2002 2003 2004 2005 2006 2007 2008 2009
(%)
EU USA Other Asia Latin America Japan ROW
We believe the Malaysian glovemakers account for c60% of the global capacity for gloves

Nomura | Asia Glovemakers September 27, 2011
10
• Kossan: The company is adding a total of c1.5-1.8bn pcs of capacity this year for both surgical and nitrile gloves, representing a 20% increase. However, we note that Kossan’s expansions historically have been fairly slow and measured.
Fig. 13: Estimated production capacity for examination/surgical gloves (bn pcs)
Source: Company data, Nomura estimates
Nomura viewpoint Over the last decade, industry aggregate capacity has grown by a CAGR of 23% pa. In FY12, we forecast capacity to increase by 27bn pcs, or 16% on the prior year based on an aggregation of the glovemakers’ announced expansion plans. Should FY12 demand continue to grow within its historical range of 8-10%, then we believe the market may continue to face a situation of excess supply, with glovemakers currently remaining unwilling to cede market share and still currently sporting fairly robust balance sheets and gearing levels. This could ensure that consolidation in the industry would have some ways to go. As seen in the following figure, growth in production capacity for examination/surgical gloves in forecast at 16% for FY12F.
Fig. 14: Growth in production capacity for examination/surgical gloves (%)
Source: Nomura estimates
However, the threat of oversupply remains
However, should demand repeat its FY10 performance and be flat on pcp, then the potential oversupply of gloves could be in the order of c15%. We view this as the potential worst-case scenario for the Asian glovemakers – although we have also highlighted potential extreme case scenarios at the end of the report should macro conditions deteriorate further.
Will excess capacity in the industry erode company margins? Inevitably, excess capacity has the potential to erode company margins. However, we believe that the established larger producers may be less susceptible to margin erosion compared to their smaller competitors, given their scale, long presence in the industry and experience in dealing with the brunt of idle capacity situations. A prolonged period of excess capacity could force rationalisation of smaller, less profitable operators over the medium term.
0
20
40
60
80
100
120
140
160
180
2003 2004 2005 2006 2007 2008 2009 2010 2011 2012
(bn pcs)
Top Glove Supermax Kossan Rubber Latexx Partners Other
0
10
20
30
40
50
60
2003 2004 2005 2006 2007 2008 2009 2010 2011 2012
(%)
We believe the Malaysian glovemakers currently remain unwilling to cede market share given robust balance sheets, hence capacity growth in FY12F is still 16% over historical demand growth of 8-10%

Nomura | Asia Glovemakers September 27, 2011
11
As a consequence of this threat, we have analysed company EBIT margins and free cashflow per share for the Asian glove manufacturers, to better understand who would be best placed to survive a potential prolonged downturn in volume growth of global glove sales. This is shown in the following figures.
Fig. 15: Last reported annual EBIT margins (%)
Source: Company data
We note that Hartalega (HART MK, unrated) has higher EBIT margins than its listed comparables, while Ansell has the highest free cashflow per share in USD terms. We believe strong cashflow, and room to compete on margin, will auger well for these companies should a downturn occur.
Fig. 16: Last reported free cashflow (USD per share)
Source: Company data
The other consideration is the companies’ utilisation rates and its position relative to their respective breakeven levels. We believe that Top Glove has the lowest estimated FY12F breakeven utilisation rate of 26%, and is expected to be the least sensitive to any output declines. This is shown in the following figure, and compares to higher breakeven utilisation rates for Supermax and Kossan Rubber. Hence, Top Glove is most likely to be able to withstand any expanded downturn in volume growth for glove products.
0
5
10
15
20
25
30
35
Hartalega Latexx Partners
Supermax Top Glove Kossan Rubber
Ansell
(0.05)
0.00
0.05
0.10
0.15
0.20
0.25
0.30
Ansell Kossan Rubber
Latexx Partners
Hartalega Top Glove Supermax
We believe have strong cashflow, and room to compete on margin, will auger well for these companies should a downturn occur
We believe the reason for capacity expansion is the Asian glove manufacturers’ willingness to be ready for a potential global threat that would require an increased numbers of gloves

Nomura | Asia Glovemakers September 27, 2011
12
Fig. 17: Estimated utilisation rates across the glovemakers (%)
Source: Company data, Nomura estimates
Why do the larger players continue to increase potential production? We believe the reason for capacity expansion is the Asian glove manufacturers’ willingness to be ready for a potential global threat that would require increased numbers of gloves, namely another outbreak of H1N1, SARS or avian influenza. In the event of a future outbreak, global regulatory bodies are likely to require large number of gloves as part of barrier protection campaigns.
Potential consolidation in the market – in spite of capacity utilisation Over the last six months, listed Latexx Partners (LTX MK, unrated) has had two failed M&A bids for its businesses. While Latexx Partners remains open to further M&A activity, it has also completed expansion of its annual capacity from 6bn pcs to 9bn pcs and is currently working towards 12bn pcs in the next two years. By 2015, Latexx plans to have annual maximum output reach 15bn pcs. Should a worldwide downturn in glove volume growth occur, we believe the global glove manufacturing business could become more consolidated.
0
20
40
60
80
100
Top glove Supermax Kossan rubber
(%)
Estimated utilisation Estimated break even utilisation

Nomura | Asia Glovemakers September 27, 2011
13
Medium-term revenue upside? A review of the Chinese opportunity New demand will likely drive the growth in the use of medical gloves.
To improve the balance of resource allocation between wealthy cities and the poor rural regions, we expect increasing government financial support to expand and improve facilities in the county hospitals. This new demand will likely drive the growth in the use of medical gloves, in our view.
In this section of the report, we:
• Describe the market opportunity by outlining the medical services market in China and the rate and type of glove use in China;
• Explain whether Chinese vinyl glove manufacturers can switch to producing NRL or nitrile gloves; and
• Outline the current state of the market for gloves in China.
A disproportionate amount of China’s healthcare resources has traditionally been concentrated on larger hospitals, particularly those in urban areas. More than 80% of health expenditures are allocated to urban areas, even though 70% of the total population resides in rural areas.
For example, the average number of outpatients per doctor in Ministry of Health (MOH)-owned hospitals is 7.3; in the next largest group, province-owned hospitals, the average is 6.2; and it is 4.4 in the smallest, city-owned hospitals. This is particularly problematic because larger hospitals are more expensive: average cost per outpatient in MOH hospitals is CNY234.8(USD28.36), as compared to CNY174.5 (USD21.08) at province hospitals and CNY77.2 (USD9.32) at city hospitals at the county level.
Fig. 18: Healthcare institutional structure in China
Note: all estimates are based on 2009 MOH statistics
Source: MOH, Nomura research
Reforms in train – will lead to increased volume growth for hospitals We think hospitals are a key marketplace for glovemakers in China, accounting for over 30% of total sales. While the large hospitals in major cities remain the core market for many market players, we believe the country-level hospitals enjoy a faster growth outlook, given unparalleled support from the government's hospital system reform. The government has enacted a number of recent reforms, which should lead to more of the
1,233 class-three hospitals
6,523 class-two hospitals
5,110 class-one and 7,425 non-classified hospitals
Basic healthcare institutions, including 27,308 community healthcare centers, 39,627
township healtcare centers
>500 patient beds; comprehensive clinic sections; advanced equipment; located mainly at national and
provincal level; estimated average unit revenue >Rmb250m in 2009
100-500 patient beds; medium clinic sections and equipment set-up; located mainly in second-tier cities or counties;
estimated average unit revenue >Rmb50m in 2009
<100 beds; basic facilities, located in small counties
and towns, estimated average unit revenue
>Rmb10m in 2009
Very basic facilities mainly for out-patient or check-up services; estimated annual unit revenue <Rmb3m in
2009
Focus market of MNCs
Focus market of domestic market leaders
Major market of other small domestic producers
China is rolling out a large number of hospitals. As the standard of living and quality of healthcare demanded increases, we believe hospital staff will demand better quality gloves

Nomura | Asia Glovemakers September 27, 2011
14
large Chinese population visiting hospitals. In turn, this should lead to increased demand for medical examination and surgical gloves. We begin with a background on the need for ongoing reform in hospitals in China.
Background Since the mid-1980s—with the collapse of the previous era's commune-based health system—the main impetus behind hospital reform in China has been to reduce the financial burden that hospital care places on government budgets.
In 1992, the Ministry of Health granted substantial financial autonomy to hospitals, allowing them to charge for their services and to sell drugs at a profit. They are now permitted to keep the surpluses that they generate, and they are responsible for their debts and operating losses. Reforms have encouraged growth in the number of hospitals and the volume of their activity. Though still a low number by international standards, there were 19,712 hospitals nationwide by 2008, an average of 2.2 hospital beds per 1,000 population and 1.2 township health centre beds per 1,000 rural population. About 20% of hospitals are private and for-profit (handling about 5% of total outpatient and inpatient services, though only about 1.5% of emergency cases). In addition, the 2003 SARS outbreak spurred a review of the public health functions of medical facilities.
Starting in 2000, medical institutions were classified as either for-profit or non-profit, depending on whether net income from operations is returned to investors. Non-profit medical institutions are operated for social and public benefit. Net income from operations can only be used for improving medical services, introducing technologies, and launching new medical projects. For-profit institutions return gains to investors. Based on their differing purposes and underlying character, the two kinds of institutions have different fiscal, taxation, and pricing policies.
In 2008, about 20% of hospitals (4,038) were classified as for-profit. Half of the for-profit hospitals are sponsored by either society groups or individuals. Outpatient departments and clinics are mostly for-profit (60% and 76%) and have non-government owners (94% and 96%). Community health service centres are mostly non-profit (92%) and have non-government owners (65%). Health centres are almost all non-profit (99%) with government owners (97%). Relative to their numbers, for-profit hospitals do not account for a proportionate quantity of services. About 20% of hospitals are for-profit, yet they provide only about 5% of total outpatient and inpatient services.
In 2008, more than half the clinical visits (in-hospital outpatient wards and emergency departments), observation cases, and physical check-ups were provided by hospitals.
Hospitals provided about two-thirds of inpatient admissions and discharges and more than 90% of inpatient surgeries and severe cases.
Fig. 19: China – number of health institutions by type
Source: China National Health Yearbook (2009)
Public hospitals can purchase drugs, medical consumables, and small-scale medical equipment with full autonomy. The government does not directly intervene in internal finances and operations. However, it monitors and audits the financial status of public hospitals to maintain or increase the values of state-owned assets, and it supervises
Hospitals7%
Nursing homes0%
Health centres15%
Outpatient clinics66%
Community Health centres
9%
Maternity/child care1%
Centres for disease control
1%
Others1%
Relative to their numbers, for-profit hospitals do not account for a proportionate quantity of services
China has an average of 2.2 hospital beds per 1,000 population

Nom
merea
WhhenAnmoCuproby cityowcarlev
TheBumaunfallo
Ho
In CinshosglodisforeprocomCh
Givcitiuni
Fig
Sou
Althtota
Theins
mura | Asia Glov
edical behavioasonable cost.
hat is the authnce glove acqother factor co
onitoring the qrrently, there
ovision and rega multitude of
y governmentswn hospitals. Tre across the h
vel of care.
e Ministry of Hreau of Heath
ay formulate nafunded mandaocate the fund
ospital sys
China, over 20titutions are thspital structure
oves directly totributors to reaeign-owned g
ovince to provimpanies eitheinese compan
ven uneven ales and rural aiform, which in
g. 20: Hierarch
rce: MOH, number
hough rural real healthcare s
e insufficient ftitutions in rur
Urban
14,180hosp
centracounty
city-lethree
rem
The burba
23,000 12,00other
mat
vemakers
ur and service.
hority of the quisition? ontributing to tuality level of is a lack of intgulation of heaf different staks, military, andhis decentralizhealthcare sys
Health has limh or its associaational policieates for the lowding needed to
stem in ru
0,000 hospitalhe key final sae and complexo hospitals. Maach the complovemakers soince – genera
er need to sell ny, or incorpor
location of govareas, the distrn turn affects t
hy of hospital
r of institutions are f
egions host sospending in C
financial resoural regions. Ho
hospital sys
city-level hospitalspitals), which are cll-level, provincial, m
y-level city hospitalsevel hospitals, 1,23e, 6,523 are class-tmaining are class-o
classificaiton
basic healthcare insn areas mainly comcommunity health
00 township health csmaller institutionsernal and child care
e quality to en
Ministry of H
the lack of higcare within Ch
tegrated healthalth service de
keholders, incld even large szation not onlystem, it also m
ited authority ated Centers fos, but these pwer levels of go support their
ural and ur
ls and many thales channel foxity in distributanufacturers ulicated hospitao far has beenlly, direct sellivia a local dis
rate a local ve
vernment resoribution of heathe competitiv
system in Ch
figures at the end o
ome 70% of thChina.
urces limit the owever, the sm
stem
s (70% of total assified as
municipal and s. Among the 33 are class-two and the one or no .
stitutions in mprise over centers, over centers and
s like clinics, e stations.
sure that med
ealth regardi
gh-quality patiehina’s very coh policies thatelivery is largeuding the Min
state enterprisey creates grea
makes it difficu
within any paror Disease Co
policies serve mgovernment, wr implementati
rban areas
housands of oor medical glotion system, gusually go throal system. Then operating meng by foreign
stributor, estabenture.
ources and difalthcare facilitive landscape.
hina
of 2009
e total popula
affordability omaller rural ho
Rural
6,111 ctotal hoclass-o
The basarea
townshcomm
smaller
dical services a
ing infection
ent care is themplex healthct apply to all hoely decentraliznistry of Healthes that continuat variation in tult to consisten
rticular provincontrol. The Minmerely as guid
which must geon.
s
other basic heaoves. Given thglove manufacough two to foe main barrierethods that cafirms is not al
blish a joint ve
fferent affordaes is not bala
ation, they get
of hospitals anospitals can aff
hospital sys
county-level hospitaospitals), which areone or non-classifie
ic healthcare institumainly comprise ovhip health centers, unity health centersinstitutions like clinand child care stati
are provided a
control and
e difficulty in care system. ospitals. The
zed and manah, provincial anue to operate terms of qualitntly monitor th
ce outside thenistry of Healtdelines or nerate and
althcare e fragmented
cturers seldomur layers of
r to entry for a an differ from lowed, and for
enture with a
ability betweennced and not
less than 30%
nd basic healthford gloves an
stem
als (30% of e mainly the d hospitals.
utions in rural ver 27,000 over 3,600 s and other ics, maternal ions.
at a
ged nd their ty of e
e th
m sell
reign
n
% of
hcare nd
In anbatheme
Foto esChinc
China, over 20d many thousa
asic healthcare e key final saleedical gloves
oreign companisell via a local tablish a joint v
hinese compancorporate a loc
September 27,
0,000 hospitalsands of other institutions are
es channel for
es either needdistributor,
venture with a ny, or al venture
2011
15
s
e
d

Nomura | Asia Glovemakers September 27, 2011
16
low-end consumables. The growth in the number of outpatient facilities is shown in Figure 21.
Hospitals in urban areas typically have more money to spend. Nearly 70% of total hospitals in China are in cities, and most are the larger class-three and class-two hospitals. The concentration of more large hospitals means that major cities are the primary markets for the larger glove manufacturing companies.
Fig. 21: China - number of outpatient facilities (2008)
Source: China National Health Yearbook (2009)
Segregated demand between different tiers of healthcare institutions The major healthcare institution system in China can be broadly classified according to scale (class-three to class-one) and status in relation to the rural or urban governments. From bottom to top of the hierarchy, the major healthcare institutions for urban areas are community health centres, district hospitals, municipal hospitals, provincial hospitals and central level hospitals. The township health centres and county-level hospitals are the two major tiers of healthcare institutions in rural regions.
Fig. 22: Distribution of healthcare expenditure
Source: MOH
Fig. 23: Distribution of number of hospitals
Source: MOH
At the top of China's hospital system hierarchy, there are over 1,200 class-3 hospitals, of which over 760 are class-3A, which are the largest hospitals located mainly in the capital or first-tier cities of all provinces in China. These 1,200 class-3 hospitals, of the over 900,000 healthcare institutions (hospitals + non-hospital healthcare institutions), generate circa 30% of total revenue for all healthcare institutions in China.
0
50,000
100,000
150,000
200,000
250,000
300,000
1970 1980 1990 2000 2008
Rural 23%
Urban 77%
Healthcare expenditure was RMB1,720bn in 2009
County hospitals
30%
City hospitals
70%
China had 20,291 hospitals at end of 2009
At the top of China's hospital system hierarchy, there are over 1,200 class-3 hospitals, of which over 760 are class-3A

Nomura | Asia Glovemakers September 27, 2011
17
Fig. 24: Distribution in number of hospitals based on three-class system (2009) China had 20,291 hospitals by the end of 2009
Source: MOH
Fig. 25: Distribution of revenue by institution (2009) Total revenue was CNY1,131bn in 2009
Source: MOH
In the second layer of the hospital hierarchy are over 6,500 class-two hospitals, mainly comprising the provincial and municipal-level hospitals. We estimate the class-two hospitals account for c35% of total revenue for all healthcare institutions in China. The domestic glove companies most likely have stronger sales and marketing platforms in the class-two hospitals due to their stronger connections with domestic distributors in the second-tier cities. Hospitals have been growing strongly, as shown in the following figures.
Further down the value chain of the hospital system are over 5,100 class-one hospitals and over 7,400 hospitals without classification, which mainly comprise the smallest hospitals located in the small counties and towns. We believe they account for 10-15% of overall healthcare institutions' revenue in China. Based on the 2009 statistics from the MOH, we estimate the average annual revenue of a class-one / non-classified hospital was only circa CNY10mn, which is only one fifth the amount of the average CNY50mn for class-two hospitals or 4% the amount of the average CNY250mn for class-three hospitals.
Fig. 26: China – number of health institutions
Source: China National Health Yearbook (2009)
Fig. 27: China – number of hospitals
Source: China National Health Yearbook (2009)
At the bottom of the healthcare system are many thousands of basic healthcare institutions, comprising mainly the 27,000-plus community health centres, 39,000 township health centres and a large number of clinics, maternal and child care centres and diseases control centres. The annual budgets of some of these basic healthcare institutions are very limited and some are in remote and poor regions.
Opportunities in county-level hospitals Reform of the public hospital system is one of the major policy targets of ongoing healthcare reform in China.
Class one 25%
Class two 32%
Class three 6%
No classification
37%
Township health
centres 9%
Hospitals 76%
Community health
centres 4%
Others 11%
0
50,000
100,000
150,000
200,000
250,000
300,000
350,000
1960 1970 1980 1990 2000 2008
0
5,000
10,000
15,000
20,000
25,000
1960 1970 1980 1990 2000 2008
Hospitals have been growing strongly

Nomura | Asia Glovemakers September 27, 2011
18
Fig. 28: China – Government building projects for county hospitals and health centres
Source: MOH, Nomura research
To improve resource allocation and narrow the income gap between urban and rural regions, the central government has provided unparalleled financial support to county hospitals and health centres over the past few years, leading to higher growth in total revenues for state-owned county-level general hospitals than the total average state-owned general hospitals from 2005 to 2009.
China targets to invest approximately CNY850bn to reform the healthcare system from 2009 to 2011, of which about CNY100bn could be used to invest in the expansion of hospitals and basic healthcare institutions in rural areas. From 2009 to date, the central government has already invested CNY40bn to fulfill its target of building over 2,000 county hospitals, over 5,100 township health centres, over 2,400 community health centres and over 11,000 village clinics. Compared with the year-end number of institutions, we forecast the number of country-hospitals, township health centres and community health centres to increase by 33%, 9% and 13% by 2013. Current outpatient visits (a proxy for basic healthcare services) by medical institution are shown below.
Fig. 29: China - Outpatient clinical visits by medical institution (2008A)
Source: China National Health Yearbook (2009)
As MOH targets to spend a total CNY100bn for the completion of these building projects, we expect the remaining CNY60bn budget to be spent by end 2013. As a high proportion of this budget could be spent on the purchasing of high and low level medical equipment including gloves in the later building stage, we thus expect not less than 50% of the remaining CNY60bn budget could be spent on purchasing of medical equipment in 2011-13. Moreover, the Ministry of Finance has also set aside CNY13bn to help the healthcare institutions in counties, towns and villages to purchase basic medical equipment since 2009.
0
5
10
15
20
25
30
35
0
5,000
10,000
15,000
20,000
25,000
30,000
35,000
40,000
45,000
50,000
County-hospitals Community health centers Township health centers
2009 (LHS) 2013 (LHS) Growth % (RHS)(no of centers) (%)
Hospitals50%
Community health services
7%Health centres
24%
Outpatient departments
2%
Clinics12%
Maternity4%
Specialty disease prevention
1%
China targets to invest cCNY850bn to reform the healthcare system from 2009 to 2011

Nomura | Asia Glovemakers September 27, 2011
19
Escalating government financial support – should lead to volume of growth in hospitals
With the government’s strong commitment shown by healthcare reform launched in 2009, we see a reduction in the private payment percentage of total healthcare expenditure in the country. This is mainly due to the government's escalating direct financial support to expand the national medical insurance coverage and increase in the minimum reimbursement ratio to lower people's co-payment burden.
According to the MOH's annual working report, the country's national medical insurance coverage ratio substantially increased from 30% in 2005 to over 90% by the end of 2010. Currently, there are over 850mn people enrolled in the New Rural Cooperative Medical Scheme (NRCMS) and over 400mn people enrolled in the two urban Basic Medical Insurance Schemes (BMIS), compared with only 179mn and 138mn in 2005.
We note significant growth in coverage rates, and that the per capita direct annual subsidies from the government to NRCMS increased to CNY126 in 2010. Annual average per capita fund raising is targeted to increase to CNY200 in 2011 and to CNY300 in the 12th Five-Year Plan period. Moreover, the MOH reformed the payment mechanism to shorten the reimbursement period and reduce the cash flow burden to patients for hospitalization services.
Fig. 30: Increase in coverage rate of two Basic Medical Insurance Schemes
Source: MOH, Nomura estimates
Fig. 31: China’s healthcare expenditure breakdown by contributors
Source: MOH, Nomura estimates
Given the divergent financial position of different regions in China, the in-patient reimbursement ratio and maximum limit is generally lower in the rural and inland regions than in the urban and coastal regions. As a result, the relatively poor need to bear a higher co-payment burden than insured employees in urban areas. The actual reimbursement ratio is generally less than 50% for the farmers in NRCMS compared with c70% for enrolled employees under BMIS.
Given the co-payment burden of 30-50% of the total in-patient cost, some members of the general public have not been able to afford costly treatment and surgery. With the increase in direct government subsidies, many local and provincial governments have started to increase the reimbursement ratio and lifted the maximum reimbursement amount for major and chronic diseases. According to the MOH, the in-patient service reimbursement ratio has increased by 5ppt and the maximum reimbursement limit increased to six times a farmer’s average annual income in 2010.
For 2011, we expect the market to benefit from the following major policy targets of the NDRC and MOH: 1) the increase of two BMIS coverage ratios to over 90%; 2) increase in per capital contribution in NRCMS to CNY200 a year; 3) increase in minimum reimbursement ratio for in-patient treatment of not less than 70%; and 4) increase in the maximum reimbursement amount equivalent to about 6x the average annual salary/disposal income/ farmer income in the respective cities or counties. All this should lead to volume growth in Chinese hospitals.
0
20
40
60
80
100
120
0 100 200 300 400 500 600 700 800 900
2005
2006
2007
2008
2009
2010
E
2011
E
2012
E
2013
E
(%)(mn)
No. of enrolment (LHS) Enrolment rate (RHS)
0 200 400 600 800
1,000 1,200 1,400 1,600 1,800 2,000
2000
2001
2002
2003
2004
2005
2006
2007
2008
2009
(RMB bn)
Govt Social Private
CAGR 10.4%
CAGR 19.8%
CAGR 23.3%
According to the MOH's annual working report, the country's national medical insurance coverage ratio has substantially increased from 30% in 2005 to over 90% by the end of 2010

Nomura | Asia Glovemakers September 27, 2011
20
Fig. 32: Government's healthcare expenditure and as % of total expenditure
Source: CEIC, Nomura research
Fig. 33: Reduction in individual expenditure as % of total healthcare expenditure
Source: CEIC, Nomura research
Intact long-term supportive economic and demographic trend After consecutive years of rapid growth, China still has a very positive economic trend and demographic structure to support the long-term high growth of the country's medical device industry and market over the next decade. These important macroeconomic growth drivers include the continuous process of urbanization, healthy GDP growth, increase in disposable income and an aging population.
Fig. 34: Trend of urbanization in China
Source: CEIC, Nomura research
China's growing urbanization is the key driver behind the GDP growth and increase in disposable income, which in turn supports the industry upgrade of the medical market in China. We note a solid trend of urbanization in China, with its urban population rising at c4% CAGR from c33% of total population in 1998 to c50% in 2010. The urban population is likely to increase to over 60% of the total population by the end of 2020, based on the current trend of development.
With over 660mn people living in urban areas, we see rapid growth for the middle class in China, with rising disposable income. This will likely drive the change in higher spending patterns and rising demand for more medical services. Currently, the average reimbursement ratio remains higher in the large cities than the rural areas due to the different financial supports between different regions.
Urbanization, in our view, will continue to improve consumer disposable income and support volume growth of markets in China. We expect this trend to continue and believe this will be a positive for medical glove maker companies operating in China. In addition to urbanization, the aging population will be another strong long-term push for the fast growth of healthcare expenditure in China. At present, the nation has nearly 116mn
0
1
2
3
4
5
6
0 50
100 150 200 250 300 350 400 450 500
2000
2001
2002
2003
2004
2005
2006
2007
2008
2009
2010
(%)Gov't healthcare exp. (LHS)
Gov't healthcare exp. / total exp. (RHS)
(RMBbn)
0%10%20%30%40%50%60%70%80%90%
100%
1990
1992
1994
1996
1998
2000
2002
2004
2006
2008
Government non individual social individual
0
10
20
30
40
50
60
0
200
400
600
800
1,000
1,200
1,400
1,600
1998
1999
2000
2001
2002
2003
2004
2005
2006
2007
2008
2009
2010
Urban population (LHS)Rural population (LHS)Urban population ratio (RHS)
CAGR 3.99%
CAGR -1.73%
(%)(Population bn)
We note a solid trend of urbanization in China, with its urban population rising at c4% CAGR from c33% of total population in 1998 to c50% in 2010
Nomura | Asia Glovemakers September 27, 2011
21
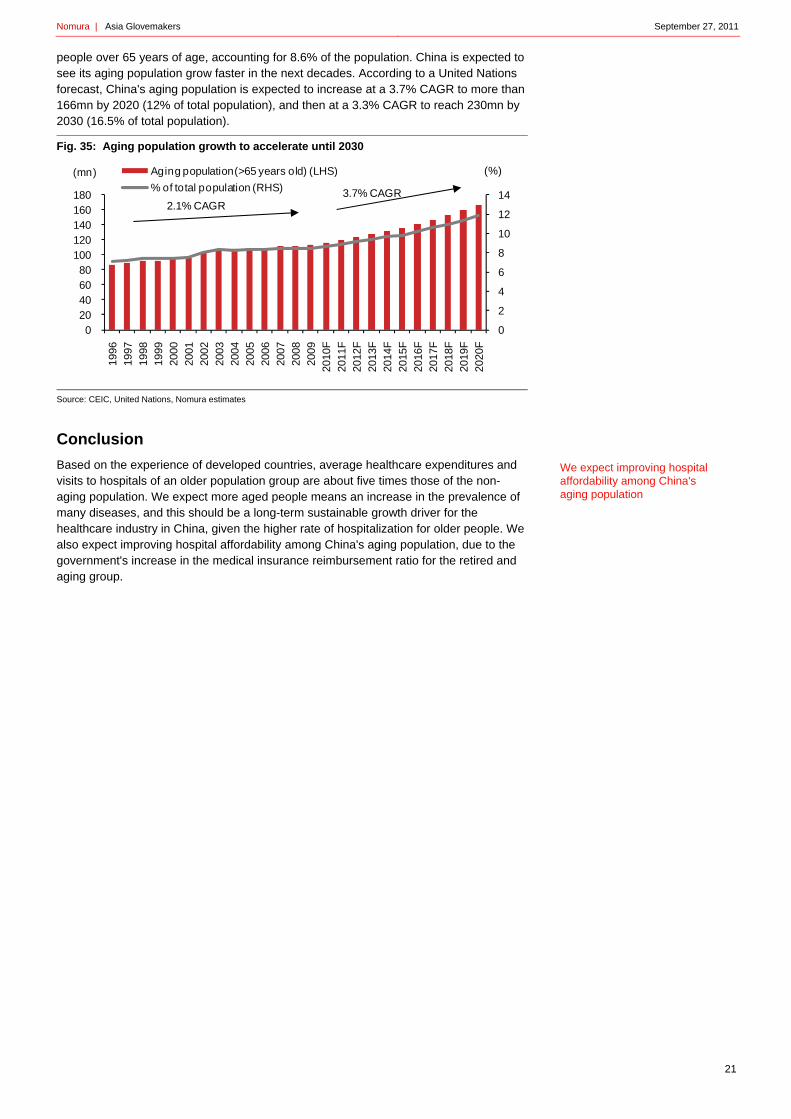
people over 65 years of age, accounting for 8.6% of the population. China is expected to see its aging population grow faster in the next decades. According to a United Nations forecast, China's aging population is expected to increase at a 3.7% CAGR to more than 166mn by 2020 (12% of total population), and then at a 3.3% CAGR to reach 230mn by 2030 (16.5% of total population).
Fig. 35: Aging population growth to accelerate until 2030
Source: CEIC, United Nations, Nomura estimates
Conclusion
Based on the experience of developed countries, average healthcare expenditures and visits to hospitals of an older population group are about five times those of the non-aging population. We expect more aged people means an increase in the prevalence of many diseases, and this should be a long-term sustainable growth driver for the healthcare industry in China, given the higher rate of hospitalization for older people. We also expect improving hospital affordability among China's aging population, due to the government's increase in the medical insurance reimbursement ratio for the retired and aging group.
0
2
4
6
8
10
12
14
0 20 40 60 80
100 120 140 160 180
1996
1997
1998
1999
2000
2001
2002
2003
2004
2005
2006
2007
2008
2009
2010
F
2011
F20
12F
2013
F20
14F
2015
F
2016
F20
17F
2018
F20
19F
2020
F
(mn) Aging population (>65 years old) (LHS)
% of total population (RHS)
2.1% CAGR3.7% CAGR
(%)
We expect improving hospital affordability among China's aging population

Nomura | Asia Glovemakers September 27, 2011
22
The current state of the Chinese glove market Medical glove use is relatively low amongst Chinese physicians, and should improve over the medium term, in our view.
The primary function of gloves is to provide a competent barrier to protect against infections for both healthcare professionals and the patients. Gloves used by healthcare workers need to be single-use for each patient contact and treatment, although it is recommended that prolonged and indiscriminate use should be avoided to minimize the risk of sensitization. They are required in various situations such as invasive procedures and contact with non-intact skin, mucous membranes or sterile sites. As such, leakage must be minimal, even when apparently undamaged, and various standards have been developed in order that all gloves perform adequately regardless of material. They should be easy to put on, comfortable to wear and provide adequate, durable protection.
Chinese doctors don’t use gloves to the same extent as in other countries By some estimates, >70% of the health care visits in China occur at village-level clinics. These clinics are staffed by village-level rural doctors and doctors of traditional medicine.
There have been significant improvements in raising the quality of healthcare personnel. However, quality has to be further enhanced to increase the level of patient care. Notably, there are challenges because no uniform definition exists to document the required qualifications of healthcare personnel. In addition, current training and experience of healthcare personnel is relatively weak. The inconsistent and low quality of healthcare workers is a particular issue in rural areas. A 2001 study of 46 counties and 781 village doctors in 9 Western provinces found that 70% of village doctors had no more than a high school education, and had received an average of only 20 months of medical training. Not only are there fewer personnel in rural areas, it is very difficult to attract and retain skilled personnel to work in less developed regions of China.
A cross-section of physicians from a large teaching hospital in Shijiazhuang City, Hebei Province has been studied. Of the respondents, 54.1% said they never wore protective gloves whilst taking blood samples. Regular glove usage during gastric lavage, endotracheal intubation and indwelling urinary catheter insertion or removal was reported to be 65.6%, 63.5% and 95.8%, respectively.
Fig. 36: Chinese doctors – use of gloves during certain medical procedures
Source: PubMed
Overall, the study suggests that infection control practices may be suboptimal among Chinese physicians. Hence, a large opportunity exists for the development of increased glove use via the education of doctors of the importance of barrier protection and infection control through the use of gloves.
0102030405060708090
100
Taking blood Intubation of the airway
Stomach washout Urinary catheter insertion
(%)
A large opportunity exists for the development of increased glove use via the education of Chinese doctors

Nomura | Asia Glovemakers September 27, 2011
23
The SARS/Bird flu epidemics – highlights the need for ongoing infection control in China
Background to the epidemic In 1978, China began fiscal decentralization from the national level to the provinces and from the provinces to the counties. The new approach of “every tub on its own bottom” shifted major financing for province-level government operations and services to the provinces themselves and substantially reduced centralized transfers. Unfunded mandates (directives and policies) are set at the level of the central government, but financing depends on local resources, allocation, and priority setting.
However, with privatization of the health care system that began in the early 1980s and the focus on economic investment in infrastructure and industry, local governments, especially poor ones, have greatly reduced investment in social sectors. Although the government owns health care facilities, government contributions for health at the local level are scant, and sometimes the only funds provided are for partial salary support, with nothing allocated for public health programs. As a result, the focus of the delivery of health care services in China is almost exclusively on the provision of curative services. User payment as a percentage of health care spending has been rising steadily for 20 years, from 20% to 54%.
The SARS outbreak of 2003 raised the need for a better national disease prevention and surveillance system. The central government has allocated CNY2.9bn (USD350mn) to help every province, city and county set up its own disease control and prevention centre. Since 2002, the government has allocated most of its additional funding to rural areas. Some initiatives include allocating special funds to Central and Western China, and funding graduates of medical colleges to serve in rural hospitals for one or two years.
All in all, the severe acute respiratory syndrome crisis exposed deficiencies in China's public health system. The threat of an avian influenza pandemic began with the severe acute respiratory syndrome (SARS) epidemic. The government is attempting to address this, but should there be another outbreak of avian flu, this would likely lead to increased use of glove as a part of infection control measures.
Will there be a move to NRL from vinyl gloves in China?
The global market size of PVC gloves is estimated at 90bn pcs per annum. We believe Chinese examination glove use is predominantly vinyl gloves. Major vinyl or PVC glove competitors include Rubberex, Precious Mountain, Hong Ray and Top Glove, all of which manufacture in China. Almost all PVC glove lines are in China due to the availability of cheap coal, resins and plasticiser in China.
That said, at present, global consumption of latex gloves is 150bn pcs of gloves pa. China's latex glove output is only about 4bn pcs a year, and China's latex glove export volume is less than 25% of Malaysia's export volume and accounts for less than 10% of the international market. Malaysia is currently the world's largest producer and exporter of latex gloves and has a latex glove capacity of more than 80bn pcs a year. Southeast Asian countries such as Vietnam, Thailand and Indonesia have large tracts of rubber tree plantations. The total latex glove export volume of Vietnam, Thailand and Indonesia accounts for about 10-12% of the international market.
Latex gloves (made by the Malaysian and Australian glovemakers) have preferable fit and comfort relative to the vinyl (made by local China suppliers) equivalent. Many factors are involved in the choice of materials for the production of medical gloves, which relate to both the protective effect as well as ease and comfort of use. For a large number of global healthcare practitioners, we believe NRL continues to be the glove material of choice.
We believe Chinese examination glove use is predominantly vinyl gloves
The SARS outbreak of 2003 raised the need for a better national disease prevention and surveillance system
Nomura | Asia Glovemakers September 27, 2011
24
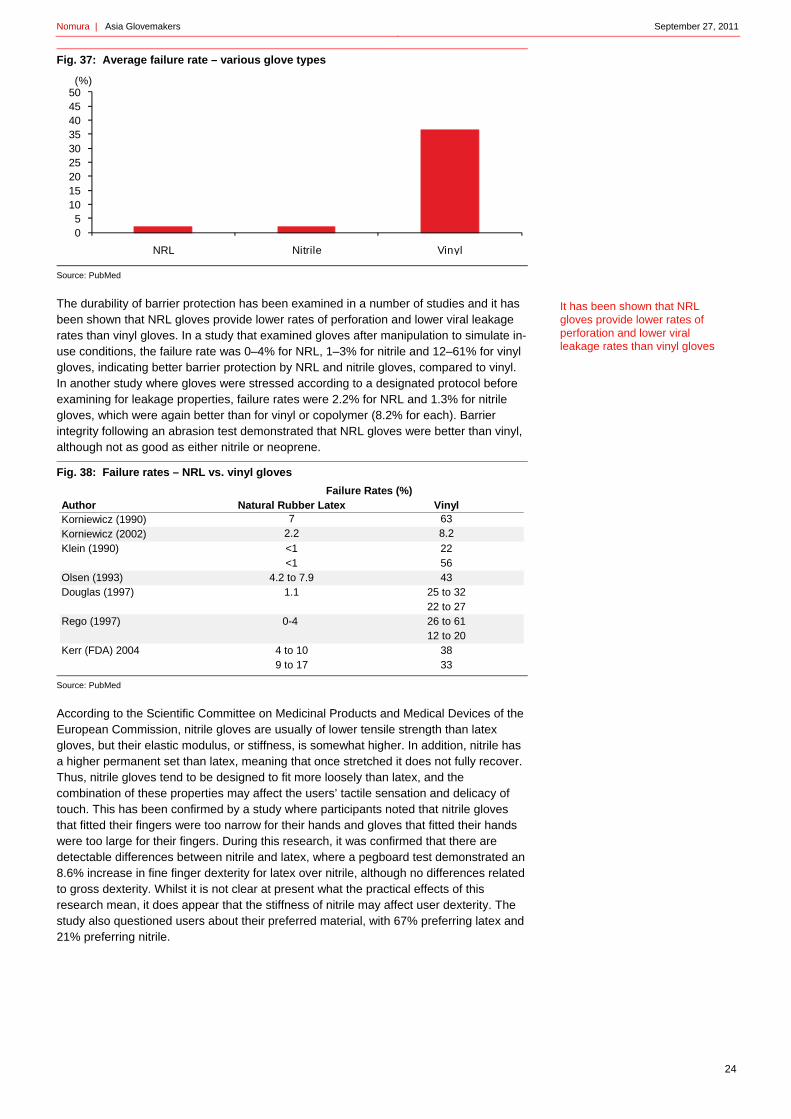
Fig. 37: Average failure rate – various glove types
Source: PubMed
The durability of barrier protection has been examined in a number of studies and it has been shown that NRL gloves provide lower rates of perforation and lower viral leakage rates than vinyl gloves. In a study that examined gloves after manipulation to simulate in-use conditions, the failure rate was 0–4% for NRL, 1–3% for nitrile and 12–61% for vinyl gloves, indicating better barrier protection by NRL and nitrile gloves, compared to vinyl. In another study where gloves were stressed according to a designated protocol before examining for leakage properties, failure rates were 2.2% for NRL and 1.3% for nitrile gloves, which were again better than for vinyl or copolymer (8.2% for each). Barrier integrity following an abrasion test demonstrated that NRL gloves were better than vinyl, although not as good as either nitrile or neoprene.
Fig. 38: Failure rates – NRL vs. vinyl gloves
Source: PubMed
According to the Scientific Committee on Medicinal Products and Medical Devices of the European Commission, nitrile gloves are usually of lower tensile strength than latex gloves, but their elastic modulus, or stiffness, is somewhat higher. In addition, nitrile has a higher permanent set than latex, meaning that once stretched it does not fully recover. Thus, nitrile gloves tend to be designed to fit more loosely than latex, and the combination of these properties may affect the users’ tactile sensation and delicacy of touch. This has been confirmed by a study where participants noted that nitrile gloves that fitted their fingers were too narrow for their hands and gloves that fitted their hands were too large for their fingers. During this research, it was confirmed that there are detectable differences between nitrile and latex, where a pegboard test demonstrated an 8.6% increase in fine finger dexterity for latex over nitrile, although no differences related to gross dexterity. Whilst it is not clear at present what the practical effects of this research mean, it does appear that the stiffness of nitrile may affect user dexterity. The study also questioned users about their preferred material, with 67% preferring latex and 21% preferring nitrile.
05
101520253035404550
NRL Nitrile Vinyl
(%)
Author Natural Rubber Latex VinylKorniewicz (1990) 7 63
Korniewicz (2002) 2.2 8.2
Klein (1990) <1 22<1 56
Olsen (1993) 4.2 to 7.9 43Douglas (1997) 1.1 25 to 32
22 to 27Rego (1997) 0-4 26 to 61
12 to 20Kerr (FDA) 2004 4 to 10 38
9 to 17 33
Failure Rates (%)
It has been shown that NRL gloves provide lower rates of perforation and lower viral leakage rates than vinyl gloves

Nomura | Asia Glovemakers September 27, 2011
25
Price differences between NRL and vinyl gloves
We believe there is the potential for the selling prices for latex gloves compared to vinyl glove to be an issue in the widespread adoption of latex glove use amongst Chinese healthcare professionals. However, as can be seen below, latex powdered gloves are c20% more expensive than vinyl powdered gloves. This combined with the lower failure rate for latex gloves, means that the value proposition for latex gloves is high when compared to vinyl gloves.
Fig. 39: Retail price of different types of examination gloves (same brand)
Source: Medshop
Conclusion
Hence, we believe latent demand from China exists given a growing middle-income segment and increasing healthcare awareness. Currently, Malaysian and Australian glove players have little exposure to countries in the Asia region (some 6-10% exposure by sales).
This is despite a wealth of untapped demand for medical consumables forecast to come on-line over the next three years following healthcare reforms in India, China and Japan (please see the Nomura Healthcare report, Asia-Pacific Anchor Report — Asia’s vital signs, 9 December, 2009). This has not been factored into our assumptions, and we believe increased demand from the region would be a source of positive upside for the Malaysian and Australian glove companies. Among the glove players, we see Top Glove as being the best positioned to benefit, since it already has two plants in China and 81% of its product mix comprises lower-end latex examination gloves targeted at developing markets.
4
5
6
7
8
9
10
11
12
Vinyl Powdered
VinylPowder-free
Latex Powdered
LatexPowder-free
NitrilePowder-free
Latex Polymer coated
(A$/100 pack)
Latex powdered gloves are c20% more expensive than vinyl powdered gloves

Nomura | Asia Glovemakers September 27, 2011
26
Asian glovemakers already in China We believe Malaysian glove companies can capitalize on existing strong positioning should China market demand heat up.
Malaysian glovemakers – Top Glove, Supermax, Kossan
Sales to Asia remain c10% of Malaysian glovemakers total glove sales, with sales to China estimated at no more than 5% of total sales. This is illustrated in the following figure. Although the lion’s share of China’s glove imports comes from Malaysia, in an absolute sense, China only imports roughly the equivalent amount as New Zealand does from Malaysia, implying scope for the Malaysian players to capitalize on their strong market share on any increased market demand. Some societal and language similarities between companies in these two countries allow Malaysian companies some form of advantage over other international peers.
Fig. 40: Asian sales account for less than 10% of total sales for Malaysian glovemakers
* Ansell data for whole company, data not available for medical glove division
Source: Company data
The potential for increased demand from China has certainly not escaped the attention of most Malaysian glovemakers – Top Glove already has two factories in China (manufacturing mostly vinyl gloves), while Hartalega and Kossan have acquired stakes in trading and manufacturing companies incorporated in China and HK respectively.
On 26 May 2011, Hartalega acquired 70% of YanCheng Pharmatex Medical Equipment Co. Ltd., a trading company incorporated in China for cash consideration of MYR319,410. Hartalega acquired YanCheng to promote its own Pharmatex brand into China. Kossan, on the other hand, had in July 2011 completed its acquisition of a 51% stake in Cleanera (HK), a manufacturer of principally cleanroom products like masks, wipes and gloves.
Fig. 41: Currently, China imports few gloves
Source: Espicom 2009 data
0102030405060708090
100
Top Glove Hartalega Kossan Supermax Siam Sempermed
Ansell
(%)
Asia North America Europe Latin America Middle East RoW
Total glove imports (USD
'000)
Imports from Malaysia
(USD '000)Malaysian market
share (%)
Japan 38,782 22,507 58.0Australia 13,267 9,917 74.7Hong Kong 10,642 9,094 85.5China 8,333 6,550 78.6New Zealand 7,892 6,204 78.6South Korea 10,571 5,940 56.2Indonesia 5,472 4,746 86.7Thailand 4,224 3,847 91.1India 5,870 2,872 48.9Philippines 3,785 2,026 53.5Vietnam 1,355 1,154 85.2
Top Glove already has 2 factories in China
Direct selling by foreign firms is not allowed, and foreign companies either need to sell via a local distributor, establish a JV with a Chinese company, or incorporate a local venture

Nomura | Asia Glovemakers September 27, 2011
27
The main barrier to entry so far has been from a fairly fragmented and divided market where operating methods can differ from province to province – generally, direct selling by foreign firms is not allowed, and foreign companies either need to sell via a local distributor, establish a JV with a Chinese company, or incorporate a local venture. Top Glove has opted for the latter option, which allows the most management control and provides it experience in navigating the Chinese market.
China only imports the same amount of exam gloves as New Zealand from Malaysia, despite the difference in population (1.3bn vs 4.5mn). This can be seen in the figure above.
Ansell (ANN AU)
The most relevant division for ANN is ANN’s Medical division We enclose an outline of EBIT by product in ANN’s medical division.
Fig. 42: ANN – FY12F EBIT by division
Source: Nomura estimates
Fig. 43: ANN Medical division – FY12F revenue by product
Source: Nomura estimates
Ansell Medical manufactures and markets a range of surgical and examination gloves. ANN has No. 1 global market share in surgical gloves and No. 2 market share in examination gloves. The last few years have witnessed a rapid expansion of the medical gloves market globally, as awareness increases of the benefits of gloves in providing effective protection. According to the US FDA, every year, 3mn of 35mn healthcare workers are exposed to blood-borne pathogens (Hepatitis B, C and HIV).
With the cancer diagnosis rate increasing exponentially (by 50% in 2020, according to WHO), more and more hazardous cytotoxics are being handled. In hospitals, healthcare professionals use:
• Standard and speciality surgical gloves;
• Examination gloves during various routine hospital procedures;
• Specialty gloves offering extra protection for cytotoxic handling; and
• In non-hospital settings, the same medical gloves are used by dentists, vets, independent nursing professionals, general practitioners and laboratory staff.
Divisional strategy ANN management have stated that they aim to continue to move this division into latex-free surgical gloves at the expense of latex examination gloves. ANN management believe that, given the strength of the surgical glove brands, their competitive advantage lies within the value-added surgical glove category.
Outline of products Major products in this division include: 1) Gammex surgical gloves – the highest-selling ANN product in the surgical glove category; 2) DermaPrene latex-free surgical gloves; 3) Encore latex-free surgical gloves – which are claimed to be easier for those surgeons and wearers who wish to double glove; 4) Medi-Grip – aimed at users in emerging countries; and 4) Micro-touch examination gloves.
Industrial51%
Medical31%
New verticals
1%
Sexual health17%
Surgeons (Synthetic)
11%
Surgeons (Powder
Free - NRL)34%Surgeons
(Powdered -NRL)18%
Exam (Synthetic)
15%
Exam (Powder
Free - NRL)19%
Exam (Powdered -
NRL)0%
Exam (Other)
3%
ANN has No. 1 global market share in surgical gloves and No. 2 market share in examination gloves

Nomura | Asia Glovemakers September 27, 2011
28
Could the Chinese glovemakers enter the NRL glove market? We believe it may be problematic for Chinese glovemakers to source and produce NRL and nitrile gloves in the short to medium term.
Issues with latex glove manufacturing in China There are a number of issues with latex glove manufacturing in China. These include: 1) China's medical latex glove and examination latex glove industry production is scattered and is not conducive to centralized supply; 2) its product structure is single, dominated by powdered gloves, which need to be sterilized before use; 3) its output of powder-free, sterile and smooth medical gloves and examination gloves is relatively small and cannot meet domestic market demand; and 4) its product quality varies largely. In summary:
• Chinese manufacturers can’t get access to the raw latex product, as optimal growing conditions are relatively rare in China compared to other Southeast Asian nations;
• Wet latex is expensive to transport and to store in China;
• Labour to produce gloves is cheaper in Malaysia and Thailand;
• Malaysian and Australian glove producers have scale, technical expertise and are further down the cost curve;
• There is the argument that Malaysian gloves are safer – based on an analysis of FDA glove import refusals data;
We explore this in more detail below, and begin this section with an explanation of how are gloves sourced and made with comments regarding potential difficulties for Chinese manufacturers to make latex gloves.
Chinese glovemakers may find it difficult to produce NRL gloves
Extraction of Natural Rubber Latex and the trees NRL is produced when trees are tapped for latex by cutting a spiral groove in the bark and placing a spout and collection cup at the base.
The rubber trees The rubber tree is deciduous, losing all of its leaves in January during a hot dry spell. With the new leaves come the flowers, and then the fruit. The green fruit slowly turns brown. Because seeds rapidly lose their viability if exposed to sun and rain, the seeds are collected and put into a cold store or into a germination bed. The life cycle of a rubber tree is as follows:
• Latex seed germination: Seed germination takes 7-10 days.
• Grafting the rubber tree: When the seedling is 3 months old, using the standard grafting technique a small patch is removed from the seedling and a green bud is grafted on and bandaged.
• Extraction of latex from trees: This starts when the tree is 4-5 years old.
• Development of tapping cycle: Tappers generally change sides of the tree every 5 years. The rubber trees have a life span of 25-30 years.
The climatic conditions for optimum growth of rubber trees consist of: 1) rainfall of around 250cm evenly distributed without any marked dry season and with at least 100 rainy days per year; 2) temperature range of about 20°C to 34°C with a monthly mean of 25°C to 28°C; 3) high atmospheric humidity of around 80%, 4) bright sunshine amounting to about 2000 hours per year at the rate of 6 hours per day throughout the year; and 5) absence of strong winds.
Tapping is done early in the morning as long as it is not raining or the trees are not wet. Hence, in tropical areas, this is likely to occur approximately 100 days a year. A tapper can tap c500 trees in about 3 hours, and then collects the latex 4-5 hours after tapping.
We believe that given the climatic conditions in China, there is not the same geographic spread of areas suitable for the planting of rubber trees as in the rest of the Southeast Asia region

Nomura | Asia Glovemakers September 27, 2011
29
After 4-5 hours post tapping, the latex vessels become blocked and the latex coagulates, leaving a white strip of latex on the tree. This is known as "Tree lace".
Nomura comment We believe that given the climatic conditions in China, there is not the same geographic spread of areas suitable for the planting of rubber trees as in the rest of the Southeast Asian region. In addition, we believe the labour to collect the rubber sap is relatively cheaper in Thailand and Malaysia (the two largest producers of NRL) compared to Chinese labour. In summary, China produces 7% of total rubber produced in Asia, with the majority of rubber being used for products other than rubber.
Fig. 44: Asian Producers of rubber (by volume) – 2010A
Source: Association of Natural Rubber Producing Countries
Processing the rubber – production When processing latex, the aim is to extract the rubber and leave the water and non-rubber components behind. Fresh latex coagulates fairly quickly.
Latex is generally either 1) processed into latex concentrate for manufacture of dipped goods or, 2) coagulated under controlled conditions using formic acid. Concentration is achieved by three methods:
• Centrifugation: This is the more common method. In both processes, the content of non-rubber components, including proteins, is reduced as the water is removed. This process is then carried out repeatedly;
• Creaming: in which case the rubber globules float to the top of a still liquid;
• Evaporation: in this method, non-rubber components are not removed. This method is hardly used nowadays. A large portion of the raw rubber is produced via coagulation. The non-rubber components are largely left behind in the aqueous phase and are removed further in the following stages of the process. The stabilized latex is concentrated to yield approximately 60% dry matter. Coagulation can be prevented by adding a stabilizer, generally ammonia. The latex thus kept in a liquid state can be processed at a later time.
Coagulated latex be processed into the higher-grade technically specified block rubbers such as TSR3L or TSRCV, or used to produce Ribbed Smoke Sheet grades. The dried material is then baled and palletized for shipment.
Naturally coagulated rubber is used in the manufacture of grade rubbers. The processing of the rubber for these grades is basically a size reduction and cleaning process to remove contamination and prepare the material for the final-stage drying.
Latex storage Natural rubber latex concentrate is delivered to the consuming factory either in bulk, i.e. 9,000-14,000 litre tanker loads, or in 200 kg drums. Storage is important, as natural latex has the tendency to cream. When left undisturbed, the rubber particles move upwards and tend to concentrate at the surface. Therefore, the latex must be stirred by means of large diameter rotor blades at relative low speeds. The duration and frequency of stirring depends on temperature. The required storage tank capacity is clearly dependent on the consumption.
Thailand32%
Indonesia25%
Malaysia10%
India8%
Vietnam7%
China7%
Sri Lanka1%
Philippines1%
Other9%
We believe it is relatively difficult to transport wet latex, and wet latex is required of optimal glove making
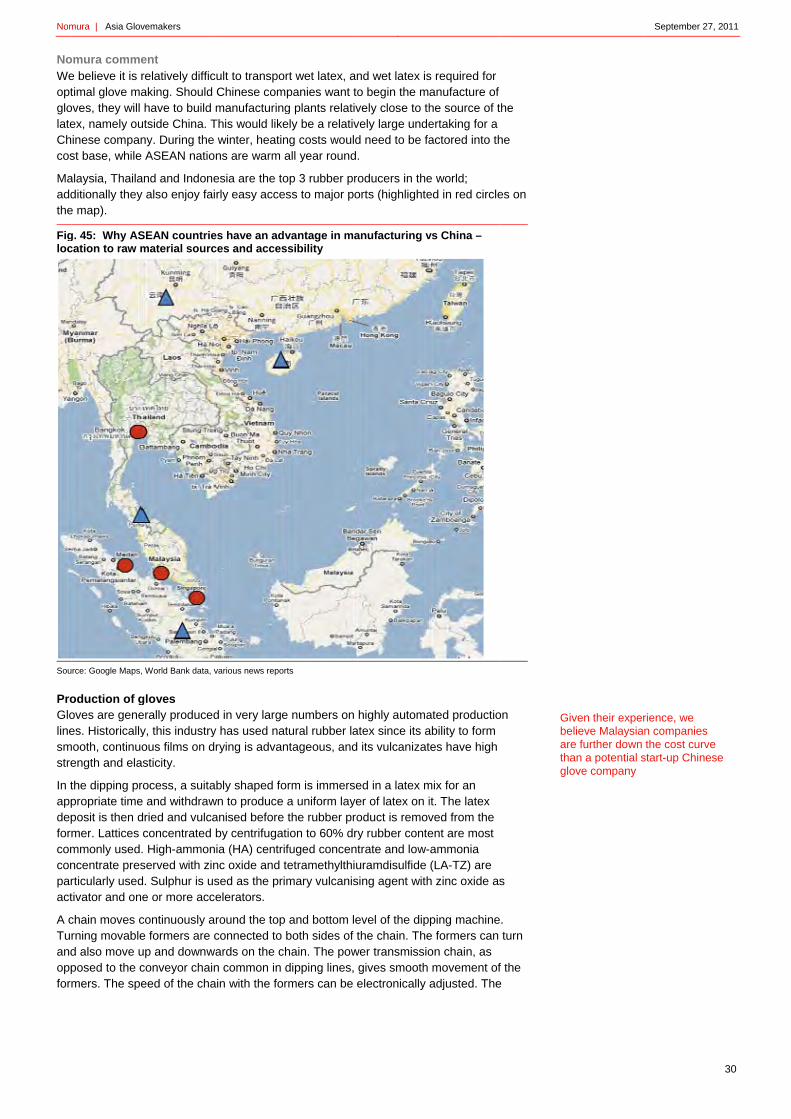
Nom
NoWeoptglolateChcos
Maaddthe
Figloc
Sou
ProGlolinesmstre
In tappdepformcomconparact
A cTurandoppform
mura | Asia Glov
omura commee believe it is rtimal glove ma
oves, they will ex, namely ouinese companst base, while
alaysia, Thailaditionally they e map).
g. 45: Why AScation to raw m
rce: Google Maps,
oduction of goves are genees. Historically
mooth, continuoength and elas
the dipping propropriate timeposit is then dmer. Lattices cmmonly used.ncentrate presrticularly usedtivator and one
chain moves crning movabled also move uposed to the cmers. The spe
vemakers
ent relatively difficaking. Should have to build tside China. T
ny. During the ASEAN natio
nd and Indonealso enjoy fai
SEAN countriematerial sourc
World Bank data, v
gloves erally producedy, this industryous films on dsticity.
ocess, a suita and withdrawried and vulcaconcentrated High-ammon
served with zin. Sulphur is use or more acc
continuously ae formers are cup and downwconveyor chaineed of the cha
cult to transporChinese commanufacturing
This would likewinter, heatin
ons are warm a
esia are the toirly easy acces
es have an advces and acces
various news repor
d in very largey has used natrying is advan
ably shaped fown to produce anised before by centrifugat
nia (HA) centrifnc oxide and tsed as the pri
celerators.
around the top connected to
wards on the chn common in dain with the for
rt wet latex, anpanies want tog plants relatively be a relativng costs wouldall year round
op 3 rubber prss to major po
vantage in massibility
rts
e numbers on tural rubber lantageous, and
orm is immersea uniform layethe rubber pro
tion to 60% drfuged concenttetramethylthiumary vulcanis
and bottom leboth sides of thain. The powdipping lines, rmers can be e
nd wet latex iso begin the mvely close to thvely large unded need to be fa.
oducers in theorts (highlighte
anufacturing v
highly automaatex since its a its vulcanizat
ed in a latex mer of latex on ioduct is removy rubber contetrate and low-uramdisulfide sing agent with
evel of the dipthe chain. The
wer transmissiogives smooth electronically
s required for anufacture of he source of tertaking for a actored into th
e world; ed in red circle
vs China –
ated productioability to form tes have high
mix for an it. The latex ved from the ent are most -ammonia (LA-TZ) are
h zinc oxide as
ping machinee formers can on chain, as movement ofadjusted. The
he
he
es on
on
s
. turn
f the e
Givbearethaglo
ven their experelieve Malaysiae further down an a potential sove company
September 27,
rience, we n companies the cost curve
start-up Chines
2011
30
e se

Nomura | Asia Glovemakers September 27, 2011
31
formers pass several stations and at the end of the cycle stripping can be done manually or automatically. After being stripped, the formers are lowered into a weak acid solution, conveyed through and then withdrawn. The acid dissolves any deposits remaining on the formers.
Quality control For quality assurance, the products (for example, surgical gloves) will be inspected by lot when are they are stripped. They will be classified by size, weight and batch number, and random samples will be taken from each lot. The gloves will be inflated, and a visual inspection performed for major/minor defects and cosmetic faults. A surgical glove is packed in a paper bag, left and right hand glove. This is done by an inner-wrapping machine. This bag with the pair of surgical gloves is put on a conveyor belt to the outer wrapping machine. After packing, the complete set is sterilised.
Nomura comment Given their experience, we believe Malaysian companies are further down the cost curve than a potential start-up Chinese glove company would be. In addition, we believe that Malaysian-owned glove companies own proprietary glove making technology, which would again make it likely that they could make gloves faster and cheaper than their Chinese competitors. Finally, in terms of quality control, we believe that failure rates are higher for Chinese glove companies than for others. This makes it likely that a Malaysian glove manufacturer would be seen positively, even within the domestic Chinese market. FDA glove failure rates can be seen in the following exhibit.
Fig. 46: FDA glove batch failure rates – sold into the US
Source: FDA.gov
In terms of batches of gloves failed by the US FDA since January 2009, China has the majority of batch failures at 56%. This is shown in the following figure.
Fig. 47: % FDA failure rates – China, Malaysia and Thailand (since 2009)
Source: FDA.gov
Latex allergy – unlikely to be an issue The amounts of protein (the cause of Type I allergic reactions) and various chemical additives (some of which may cause Type IV allergic reactions) vary throughout the
0
5
10
15
20
25
Jan-09 Apr-09 Jul-09 Oct-09 Jan-10 Apr-10 Jul-10 Oct-10 Jan-11 Apr-11 Jul-11
(Batches rejected by FDA)
Malaysia China Thailand
Malaysia31%
China64%
Thailand 5%
China has had the majority of batch failures at 56%

Nomura | Asia Glovemakers September 27, 2011
32
manufacturing process, and can be controlled by careful processing. The quantity of protein in a product made of natural rubber or natural rubber latex is highly dependent on the process being used. This ability to control the levels of latex protein is advantageous, as levels of latex protein are correlated with severity of latex allergy.
It has been demonstrated that a number of the many proteins present in natural rubber latex are capable of inducing type 1 allergy. Allergenicity varies from "no" to "high" per protein. Hypersensitivity to these proteins has increased considerably in the last 15 years. Figures that pertain to North America, as do most data published on this topic, show that less than 3% of hospital personnel and approximately 4% of dentists were hypersensitive to these types of proteins in 1980, whereas these figures had risen to nearly 17% and 30% by 1995.
Malaysia has introduced the Standard Malaysian Glove Program as a result. Developed in consultation with the Food and Drug Association (FDA) and other relevant authorities, the program ensures the manufacture of quality-assured latex gloves that provide maximum barrier protection and minimum latex-protein allergy risk.
Synthetic Rubber Synthetic rubber is a white material that can be processed and vulcanized in the same way as natural rubber latex.
Synthetic rubbers are artificially produced materials with properties similar to natural rubber. Most are obtained by polymerization or polycondensation of unsaturated monomers. A wide range of different synthetic rubbers have emerged, reflecting the various different applications and the chemical and mechanical properties they require. Co-polymerisation of different monomers allows the material properties to be varied across a wide range. Polymerisation can take place under hot or cold conditions, which result in hot polymers (hot rubber) or cold polymers (cold rubber).
Synthetic rubbers are marketed as compressed bales and square blocks. They are also produced in the form of powder rubber, talcum-coated chips, granules and as latex concentrates in liquid form. Synthetic rubber has better oil and temperature resistance and constant quality. The following list indicates some of the most important synthetic rubbers.
Nitrile rubber Nitrile rubber (NBR) is a synthetic rubber copolymer of acrylonitrile (ACN) and butadiene. Although its physical and chemical properties vary depending on the polymer’s composition of nitrile, this form of synthetic rubber is generally resistant to oil, fuel, and other chemicals. Nitrile butadiene is used to create moulded goods, footwear, adhesives, sealants, sponges, expanded foams, and floor mats. Its resilience makes NBR a useful material for disposable lab, cleaning, and examination gloves. Nitrile rubber is more resistant than natural rubber to oils and acids, but has inferior strength and flexibility. Nitrile gloves are nonetheless three times more puncture-resistant than natural rubber gloves.
Isoprene Isoprene was first isolated by the thermal decomposition of natural rubber. It is most readily available industrially as a by-product of the thermal cracking of naphtha or oil, as a side product in the production of ethylene. About 95% of isoprene production is used to produce cis-1,4-polyisoprene—a synthetic version of natural rubber. Natural rubber is a polymer of isoprene, most often cis-1,4-polyisoprene. Typically, a small percentage of other materials, such as proteins, fatty acids, resins, and inorganic materials, are found in high-quality natural rubber.
In terms of batches of gloves failed by the US FDA since January 2009, China has the majority of batch failures at 56%
Synthetic rubbers are artificially produced materials with properties similar to natural rubber

Nomura | Asia Glovemakers September 27, 2011
33
Could Chinese vinyl glovemakers switch to manufacturing NRL/nitrile gloves?
Whilst we believe the Chinese glovemakers (which predominantly make vinyl gloves) may find it difficult to switch to making NRL or nitrile gloves, we have analysed why these companies might see a switch as an attractive business opportunity.
This includes:
• Access to capital: We believe that access to capital might be relatively cheap at present in China, compared to some parts of Southeast Asia. Foreign capital tends to flow to economies that offer superior fundamentals, stronger growth potential and higher interest rates. China has been a favoured destination for hot money flows for years given its strong growth outlook, and will likely remain so in the future, placing continued strong appreciation pressure on the renminbi. In comparison to Australia, we believe it is relatively cheap to invest in factories in China.
• Substantial growth in home market: Given the low rates of glove use amongst medical professionals in China, we believe a large opportunity exists for substantial growth in glove use in the Chinese market;
• Government protectionism in China: We believe government protectionism in China is larger than in other Southeast Asian countries, as well as Australia.
Who are the Chinese vinyl glovemakers? We enclose a list of prominent vinyl glove producers in China below.
Fig. 48: Prominent vinyl glove producers - China
Source: Nomura research
Our examination of the latex glove market in China suggests that the latex glove suppliers in China are relatively new to the market. Examples of companies in the industry include: Qingdao Double Butterfly Group Co., Ltd., Shenyang Latex Products Factory, Shanghai Latex Products Factory, Guilin Latex Products Factory, and Beijing Latex Products Factory. Hence, given their experience, we believe Malaysian and Australian companies are further down the cost curve than a potential start-up Chinese glove company. In addition, we believe that Malaysian and Australian-owned glove companies own proprietary glove making technology, which would again make it likely that they could make gloves faster and cheaper than their Chinese competitors.
Batra Group ChinaBoen HealthcareDongguan Gaofu Clothes and HatsForte Medical InstrumentsHangzhou Flourishing Age Machinery & ToolsHangzhou Pushi IndustrialHospital & HomecareHubei Woohoo HealthcareHubei-Wuhan Light Industrial ProductsMedtrue EnterpriseQingdao New Oriental Car AccessoriesShanghai Wellkind MedicalSuqian Green GloveSuzhou Industrial Park WinwinSuzhou SunmedTop Glove (Zhangjiagang)Wenzhou Pishon International TradeYiwu Tengsheng

Nomura | Asia Glovemakers September 27, 2011
34
Comparative company valuations Buy defensive distributors and manufacturers at trough valuations.
Following the deterioration in macro outlook leading to possible market multiple compression in Malaysia, we have lowered our target prices for all the Malaysian glove manufacturers, but have increased our target price for ANN AU. This is upon imputing: 1) our revised (and stronger) MYR/USD assumptions; 2) the assumption that current latex prices do not correct into 2012 (although 2012 average prices will likely be below the highs reached in late 2010 and early 2011); and 3) downward revision of target P/E multiples for FY12F to reflect a weaker macroeconomic outlook and the corresponding impact on the overall market.
Most manufacturers have mostly delayed their expansions instead of scrapping them. We believe consolidation has a ways to go, as most major glove manufacturers still have healthy balance sheets and low gearing ratios, and remain unwilling to risk ceding market share should they be the first to completely halt expansions. We acknowledge, however, that EPS rebounds of 10-56% in 2012 will likely still be seen given the recent 10% easing in latex prices, despite our revenue growth assumptions remaining below average levels of <10%.
Despite the anticipated rebound in earnings, valuations for market leader Top Glove still appear unattractive in current capital markets conditions, in our view, trading at 13.8x FY12F revised forward earnings, at a premium to the Malaysian market. While operations appear to have stabilized, we think the current share price may still be expecting a much stronger rebound (versus our expectations of a few flat quarters ahead and lower visibility) – hence, we downgrade our rating to REDUCE from Neutral.
Top Glove is a REDUCE also given its unfavourable valuation despite our view of an earnings growth rebound into 2012, while visibility remains less certain as it still has a higher latex product mix than its peers.
ROEs are expected to remain lower than its other Malaysian-listed peers going into 2012 on lower growth and while it works on balancing out its product mix to increase exposure to nitrile gloves. The risk-reward picture is favourable for Supermax (BUY reiterated), as P/E valuations have corrected to single-digit valuations of upstream rubber names (which typically command lower multiples). Although Kossan is also at single-digit P/E valuations, it has the highest exposure to Western countries (c. 80%) versus peers, where minor consumables growth is forecast to moderate; hence our downgrade (from Buy to NEUTRAL). We expect ROEs to stay in the high teens into 2012, owing to a more balanced product mix and slightly better demand visibility.
Fig. 49: Change in key assumptions
Source: Nomura estimates
We enclose the Asian glovemakers 1 year forward P/E compared to their respective markets’ 1 year forward P/E.
old new old new old new
RM / USD 3.3 2.90 3.3 2.77 na 2.68
Latex assumption (RM/kg) 8.5-8.8 9.2 8 8.5 na 7.5
2011F 2012F 2013F

Nomura | Asia Glovemakers September 27, 2011
35
Fig. 50: ANN: Discount to market
Source: Nomura estimates
Fig. 51: TOPG: Discount to market
Source: Bloomberg, Nomura estimates
Fig. 52: SUCB: Discount to market
Source: Bloomberg, Nomura estimates
Fig. 53: KRI: Discount to market
Source: Bloomberg, Nomura estimates
ANN – operates in a different part of the value chain Looking across the value chain, we believe that purchasers’ bargaining power is stronger – benefiting major customers of the Malaysian OEM manufacturers such as Kimberley-Clark (KMB US, Not Rated), Cardinal Health (CAH US, Not Rated), and Ansell (ANN AU, Buy). Earnings are also less sensitive to fluctuations in rubber prices (for every 1% move in rubber prices, we calculate that the OEM manufacturers’ earnings move between 5% and 6% whilst Ansell’s moves by 1.1%) We upgrade our rating on Ansell to BUY from Neutral due to the earnings upgrade resulting from our lower FY12F latex price forecast.
For further details, please refer to the respective company sections within this report.
0.0
5.0
10.0
15.0
20.0
Jan-06 Jan-07 Jan-08 Jan-09 Jan-10 Jan-11
(x) Australian market 1year forward PEANN 1 year forward PE
0.0
5.0
10.0
15.0
20.0
25.0
30.0
35.0
Jan-06 Jan-07 Jan-08 Jan-09 Jan-10 Jan-11
(x) Malaysian market 1 year forward PETOPG 1 year forward PE
0.0
5.0
10.0
15.0
20.0
Jan-06 Jan-07 Jan-08 Jan-09 Jan-10 Jan-11
(x) Malaysian market 1 year forward PESUCB 1 year forward PE
0.0
5.0
10.0
15.0
20.0
Jan-06 Jan-07 Jan-08 Jan-09 Jan-10 Jan-11
(x) Malaysian market 1 year forward PEKRI 1 year forward PE
We believe that purchasers’ bargaining power is stronger – benefiting major customers of the Malaysian OEM manufacturers

Nomura | Asia Glovemakers September 27, 2011
36
Fig. 54: Glovemaker comparables
* Priced as at 23 September 2011. NR = Not Rated. Note: ANN AU FY11 figures are based on actual reporting earnings
Source: Nomura, Bloomberg for non-rated stocks
Companies Ticker Curr. Rating 2011F 2012F 2011F 2012F 2011F 2012F 2011F 2012F
Top Glove TOPG MK 775 RM 4.00 REDUCE 10.9 15.6 -53.1 56.3 2.3 2.0 22.0 14.1
Supermax SUCB MK 253 RM 2.37 BUY 14.8 17.8 -36.1 38.1 1.0 0.9 7.4 5.3
Kossan KRI MK 261 RM 2.60 NEUTRAL 23.0 21.2 -1.8 10.2 1.6 1.3 7.4 6.7
Hartalega HART MK 649 RM 5.69 NR 44.3 37.4 37.0 11.5 4.3 3.4 11.1 10.0
Latexx Partners LTX MK 87 RM 1.25 NR 25.3 21.6 -15.0 3.3 na na 4.2 4.0
Adventa ADV MK 73 RM 1.53 NR 8.0 10.1 -45.8 42.3 1.0 0.9 11.8 8.3
Ansell ANN AU 1,730 AUD 12.99 BUY 19.3 19.7 15.0 19.4 2.4 2.4 14.0 12.6
Riverstone Holdings SP 95 SGD 0.39 NR 18.6 19.5 -17.3 9.1 na na 3.5 3.3
3M Company MMM US 52,499 USD 74.0 NR 27.0 26.1 7.8 9.5 3.0 2.6 12.0 10.9
Honeywell Int'l HON US 33,198 USD 42.4 NR 26.9 24.9 32.3 12.3 2.6 2.2 10.7 9.5
Reckitt Benckiser RB LN 35,440 GBP 3,155 BUY 32.0 25.2 7.3 2.5 4.0 3.4 13.0 12.7
Kimberley-Clark Corp KMB US 27,414 USD 70.0 NR 32.4 35.9 4.3 8.7 4.9 4.6 14.4 13.3
Cardinal Health CAH US 14,377 USD 41.7 NR 17.2 18.1 20.3 18.8 2.7 2.3 15.6 13.2
Church & Dwight Co CHD US 6,137 USD 42.8 NR 15.9 16.0 9.8 9.9 3.0 2.8 19.5 17.7
Semperit AG SEM AV 813 EUR 29.4 NR 14.2 15.3 16.8 13.6 1.7 1.5 11.9 10.5
B&B Tools AB BBTOB SS 213 SEK 52.0 NR 11.2 11.1 38.6 11.8 0.7 0.7 6.7 6.0
Upstream
Sri Trang Agro STA TB 813 THB 29.4 BUY 25.8% 19.6% -17.3% 9.9% 1.8 1.5 9.2 8.4
GMG Global GGL SP 213 SGD 52 NR 11.2% 11.1% 38.6% 11.8% 0.73 0.71 6.7 6.0
Malaysia OEM glove manufacturers
International Glove Brands
P/E (x) Mkt cap (US$mn)
Price (Loc)
ROE (%) EPS growth (%) P/BV (x)

Nomura | Asia Glovemakers September 27, 2011
37
Next, we enclose P/E band charts for the Asian glovemakers in our coverage universe.
Fig. 55: Top Glove – P/E Band
Source: Bloomberg, Nomura ^y-axis denotes share price in MYR
Fig. 56: Top Glove – P/E Chart
Source: Bloomberg, Nomura ^y-axis denotes multiple P/E multiple
Fig. 57: Supermax – P/E Band
Source: Bloomberg, Nomura ^y-axis denotes share price in MYR
Fig. 58: Supermax – P/E Chart
Source: Bloomberg, Nomura ^y-axis denotes multiple P/E multiple
Fig. 59: Kossan – P/E Band
Source: Bloomberg, Nomura ^y-axis denotes share price in MYR
Fig. 60: Kossan – P/E Chart
Source: Bloomberg, Nomura ^y-axis denotes multiple P/E multiple
0
2
4
6
8
Jan
-06
May
-06
Sep
-06
Jan
-07
May
-07
Sep
-07
Jan
-08
May
-08
Sep
-08
Jan
-09
May
-09
Sep
-09
Jan
-10
May
-10
Sep
-10
Jan
-11
May
-11
Sep
-11
Price 2x5x 8x11x 14x
0
10
20
30
40
Oct
-05
Mar
-06
Aug
-06
Jan
-07
Jun
-07
No
v-07
Ap
r-08
Sep
-08
Feb
-09
Jul-
09
Dec
-09
May
-10
Oct
-10
Mar
-11
Au g
-11
TOPG 1 year forward P/EAverage=15.4+1SD=21.4-1SD=9.4
0
2
4
6
8
Jan
-06
May
-06
Sep
-06
Jan
-07
May
-07
Sep
-07
Jan
-08
May
-08
Sep
-08
Jan
-09
May
-09
Sep
-09
Jan
-10
May
-10
Sep
-10
Jan
-11
May
-11
Sep
-11
Price 2x5x 8x11x 14x
0
5
10
15
20
Jan
-06
May
-06
Sep
-06
Jan
-07
May
-07
Sep
-07
Jan
-08
May
-08
Sep
-08
Jan
-09
May
-09
Sep
-09
Jan
-10
May
-10
Sep
-10
Jan
-11
May
-11
Se p
-11
SUCB 1 year forward P/E
Average=6.5
+1SD=10.3
-1SD=2.7
0
1
2
3
4
5
6
Jan
-06
May
-06
Sep
-06
Jan
-07
May
-07
Sep
-07
Jan
-08
May
-08
Sep
-08
Jan
-09
May
-09
Sep
-09
Jan
-10
May
-10
Sep
-10
Jan
-11
May
-11
Se p
-11
Price 2x5x 8x11x 14x
0
5
10
15
20
Jan
-06
May
-06
Sep
-06
Jan
-07
May
-07
Sep
-07
Jan
-08
May
-08
Sep
-08
Jan
-09
May
-09
Sep
-09
Jan
-10
May
-10
Sep
-10
Jan
-11
May
-11
Se p
-11
KRI 1 year forward P/E Average=8.2
+1SD=11.1 -1SD=5.3

Nomura | Asia Glovemakers September 27, 2011
38
Fig. 61: ANN: 12-month forward P/E multiple Based on actual EPS (12months forward)
Source: Nomura estimates, FactSet share price
How does the 12-month forward P/E compare with historical levels? Using our new EPS assumptions, on a 12-month-forward P/E basis, ANN is trading at 12.4x. This is 4.1% below its mean 9-year historical 12-month-forward P/E of 12.9x.
Summary of valuation methodologies
• Ansell - We use a blend of three valuation methodologies to derive a valuation for ANN: these are discounted cashflow analysis (DCF), a capitalisation of EV/EBITDA, and normalised P/E multiples. We have also updated our healthcare comparables. As a result, our target price has increased by 5.5% to AUD15.25 (from AUD14.46).
• Top Glove - We peg our FY12E diluted EPS of MYR0.28 at 12x target multiple, below the stock’s seven-year average of 15.6x owing to the current macro conditions, to arrive at a target price of MYR3.42.
• Supermax - We peg Supermax’s target P/E at 6.5x from 11.5x previously following market multiple compressions. Applying this to FY12F EPS of MYR0.44, we derive our target price of MYR2.88.
• Kossan - We peg Kossan’s target price to a 6.5x FY12F P/E multiple. Applied to our FY11F EPS of MYR0.39, we arrive at our target price of MYR2.51.
Summary of risks
• Ansell - Upside risks include higher-than-expected volume growth driven by emerging market growth and an increase in industrial production activity; an announcement of further earnings-accretive acquisitions. Downside risks include pressure on costs from rising prices of raw material inputs; and a slowdown in the global economic recovery.
• Top Glove - Upside risks: 1) sharp easing of latex prices; 2) appreciable demand rebound from FY12E, and; 3) Top Glove making a value-enhancing acquisition.
• Supermax - Downside risks to our target price include industry-related factors similar to those facing Top Glove, as well as adverse and rapid currency movements that could affect income from the company's overseas distribution arms.
• Kossan - Potential downside to our view includes delays / hiccups to the new product launch, which could affect Kossan’s strategy to gain market share from other nitrile players and the higher-end segment. Upside risks include sharp easing of latex prices and appreciable demand rebound from FY12F.
Mean: 12.9x
Lower: 10.7x
Upper: 15.0x
Current: 12.4x
0
5
10
15
20
25
30
Jun-02 Jun-04 Jun-06 Jun-08 Jun-10 Jun-12 Jun-14
ANN AU: Price (A$/share)
We enclose a review of each of the companies in our universe

Key company data: See page 2 for company data and detailed price/index chart. Rating: See report end for details of Nomura’s rating system.
Ansell ANN.AX ANN AU
HEALTH CARE & PHARMACEUTICALS
EQUITY RESEARCH
Upgrade to BUY on easing cost pressure
Easing latex prices leads to FY12F earnings upgrade
September 27, 2011
Rating Up from Neutral
Buy
Target price Increased from 14.46
AUD 15.25
Closing price September 23, 2011
AUD 12.99
Potential upside +17.4%
Action: We forecast NRL cost headwind to ease in FY12F The natural rubber latex (NRL) price has fallen by 20% since April. Given NRL accounted for c.18% of FY11A group cost of sales, ANN has significant earnings leverage to movements in the NRL price. We estimate ANN’s FY12 earnings sensitivity at +AUD1.6mn for a 1% decrease in the annual average NRL price. In this note, we adopt Nomura’s new FY12F NRL house price forecast of MYR8.50/wet kg, leading to earnings uplift.
Catalyst: Differentiated forecasts compared with guidance Our new forecasts deviate from the company’s guidance for FY12F EPS of USD0.97-1.03, which includes a deferred tax asset adjustment of USD0.07-0.10 per share (vs. Nomura at USD1.09). We note ANN’s guidance 1) excludes its USD65mn share buyback, and 2) assumes that latex prices will increase in FY12F.
Changes to forecasts: FY12F and FY13F EPS rises by 6.2% and 6.4% We have reduced our FY12F NRL forecast to MYR8.50/wet kg, from MYR9.29/wet kg, and increased our FY12F nitrile forecast to USD2,600/MT from USD2,460/MT, in line with market movements. While we’ve made no change to our revenue forecasts, the impact of changes to raw material costs has increased our EPS forecasts by 6.2% for FY12 and by 6.4% for FY13.
Valuation: TP rises to AUD15.25; upgrade to BUY rating We have updated our healthcare comparables. As a result, our target price rises by 5.5% to AUD15.25. Using our new EPS assumptions, on a 12-month-forward P/E basis, ANN is trading at 12.4x. This is 4.1% below its mean 9-year historical 12-month-forward P/E of 12.9x. Upgrade to BUY.
30 Jun FY11 FY12F FY13F FY14F
Currency (USD) Actual Old New Old New Old New
Revenue (mn) 1,207 1,329 1,329 1,422 1,422 1,510 1,510
Reported net profit (mn) 122 135 143 152 161 166 177
Normalised net profit (mn) 122 135 143 152 161 166 177
Normalised EPS 91.64c 1.03 1.09 1.18 1.26 1.29 1.38
Norm. EPS growth (%) 15.0 12.4 19.4 14.8 15.0 9.4 10.0
Norm. P/E (x) 14.0 N/A 12.6 N/A 10.8 N/A 9.9
EV/EBITDA (x) 10.3 9.9 9.4 7.8 7.4 6.8 6.4
Price/book (x) 2.4 N/A 2.4 N/A 2.1 N/A 1.8
Dividend yield (%) 2.5 N/A 2.6 N/A 3.0 N/A 3.4
ROE (%) 19.3 18.7 19.7 19.3 20.3 18.6 19.6
Net debt/equity (%) net cash 0.8 net cash net cash net cash net cash net cash
Source: Nomura estimates
Anchor themes
ANN has had a long history of new product development and strong market share, which we believe positions it well to continue to generate solid revenue growth.
Nomura vs consensus
Relative to FactSet consensus estimates for normalised EPS, our ANN forecasts are above consensus by 8% for FY12F due to our forecasts for raw material inputs and the major currencies to which ANN is exposed.
Research analysts
Australia Health Care & Pharmaceuticals
Zara Lyons - NAL [email protected] +61 2 8062 8407
Dr David Stanton - NAL [email protected] +61 2 8062 8410
See Appendix A-1 for analyst certification and important disclosures. Analysts employed by non US affiliates are not registered or qualified as research analysts with FINRA in the US.

Nomura | Ansell September 27, 2011
40
Key data on Ansell Income statement (USDmn) Year-end 30 Jun FY10 FY11 FY12F FY13F FY14FRevenue 1,086 1,207 1,329 1,422 1,510Cost of goods sold -633 -734 -833 -899 -969Gross profit 454 473 496 523 541SG&A -326 -336 -332 -337 -339Employee share expense
Operating profit 127 137 164 186 203
EBITDA 150 159 188 224 242Depreciation -20 -19 -21 -23 -24Amortisation -3 -3 -3 -15 -16EBIT 127 137 164 186 203Net interest expense -9 -4 -3 -3 1Associates & JCEs
Other income 0 0 0 0 0Earnings before tax 119 133 161 184 204Income tax -10 -8 -14 -18 -22Net profit after tax 109 125 146 165 182Minority interests -3 -3 -4 -4 -5Other items
Preferred dividends
Normalised NPAT 106 122 143 161 177Extraordinary items 0 0 0 0 0Reported NPAT 106 122 143 161 177Dividends -34 -40 -47 -53 -59Transfer to reserves 72 82 96 108 119
Valuation and ratio analysis
FD normalised P/E (x) 14.5 14.0 12.6 10.8 9.9FD normalised P/E at price target (x) 17.0 16.5 14.8 12.7 11.6Reported P/E (x) 14.4 14.0 12.6 10.8 9.9Dividend yield (%) 2.3 2.5 2.6 3.0 3.4Price/cashflow (x) 9.6 13.8 12.1 9.4 8.5Price/book (x) 2.7 2.4 2.4 2.1 1.8EV/EBITDA (x) 10.1 10.3 9.4 7.4 6.4EV/EBIT (x) 11.9 11.9 10.8 8.9 7.6Gross margin (%) 41.8 39.1 37.3 36.8 35.8EBITDA margin (%) 13.8 13.2 14.2 15.7 16.0EBIT margin (%) 11.7 11.3 12.4 13.1 13.4Net margin (%) 9.8 10.1 10.7 11.3 11.7Effective tax rate (%) 8.1 6.1 8.9 10.0 10.7Dividend payout (%) 32.4 33.0 33.0 33.0 33.0Capex to sales (%) 2.6 3.7 3.0 3.0 3.0Capex to depreciation (x) 1.4 2.3 1.9 1.9 1.9ROE (%) 20.1 19.3 19.7 20.3 19.6ROA (pretax %) 14.6 14.1 15.3 16.5 17.5
Growth (%)
Revenue 8.3 11.1 10.1 7.0 6.2EBITDA 13.7 6.1 18.6 18.7 8.4EBIT 18.6 7.5 20.0 13.4 8.8Normalised EPS 20.2 15.0 19.4 15.0 10.0Normalised FDEPS 20.8 15.9 19.4 15.0 10.0
Per share
Reported EPS (USD) 79.69c 91.64c 1.09 1.26 1.38Norm EPS (USD) 79.69c 91.64c 1.09 1.26 1.38Fully diluted norm EPS (USD) 78.99c 91.57c 1.09 1.26 1.38Book value per share (USD) 4.20 5.32 5.77 6.62 7.54DPS (USD) 0.27 0.33 0.36 0.41 0.46Source: Nomura estimates
Notes
ANN guidance for FY12F EPS is USD0.97-USD1.03, including USD0.07- USD0.10 for DTA
Price and price relative chart (one year)
(%) 1M 3M 12M
Absolute (AUD) -2.8 -5.7 -0.5
Absolute (USD) -10.3 -12.6 1.9
Relative to index 3.9 8.0 16.3
Market cap (USDmn) 1,614.7
Estimated free float (%)
100.0
52-week range (AUD) 14.7/11.82
3-mth avg daily turnover (USDmn)
10.81
Major shareholders (%) M&G Group 18.0
Perpetual 6.6
12
12.5
13
13.5
14
14.5
15
90
95
100
105
110
115
120
Oct
10
Nov
10
Dec
10
Jan
11
Feb
11
Mar
11
Apr
11
May
11
Jun
11
Jul 1
1
Aug
11
Sep
11
PriceRel MSCI Australia(AUD)

Nomura | Ansell September 27, 2011
41
Cashflow (USDmn) Year-end 30 Jun FY10 FY11 FY12F FY13F FY14FEBITDA 150 159 188 224 242Change in working capital 17 -7 -20 -13 -13Other operating cashflow -7 -28 -19 -24 -23Cashflow from operations 160 124 149 186 206Capital expenditure -28 -45 -40 -43 -45Free cashflow 132 80 109 144 161Reduction in investments 0 0 0 0 0Net acquisitions -13 2 -14 0 0Reduction in other LT assets 0 0 0 0 0Addition in other LT liabilities 0 0 0 0 0Adjustments 0 0 0 0 0Cashflow after investing acts 118 81 96 144 161Cash dividends -37 -42 -45 -50 -56Equity issue -45 4 -65 0 0Debt issue -63 -19 65 0 0Convertible debt issue
Others 7 35 0 0 0Cashflow from financial acts -138 -22 -45 -50 -56Net cashflow -20 59 50 94 104Beginning cash 220 200 259 309 403Ending cash 200 259 309 403 507Ending net debt 49 -16 -1 -95 -200Source: Nomura estimates
Balance sheet (USDmn) As at 30 Jun FY10 FY11 FY12F FY13F FY14FCash & equivalents 200 259 309 403 507Marketable securities 0 0 0 0 0Accounts receivable 165 193 212 227 241Inventories 178 198 218 233 248Other current assets 8 11 11 11 11Total current assets 551 660 750 874 1,007LT investments 0 0 0 0 0Fixed assets 140 150 163 177 192Goodwill 282 282 282 282 282Other intangible assets 23 80 83 75 65Other LT assets 107 125 139 139 139Total assets 1,102 1,298 1,417 1,546 1,685Short-term debt 48 198 211 211 211Accounts payable 154 179 197 210 223Other current liabilities 58 77 79 82 84Total current liabilities 260 453 486 503 518Long-term debt 201 45 97 97 97Convertible debt
Other LT liabilities 77 77 77 77 77Total liabilities 538 575 660 677 692Minority interest 12 15 18 22 27Preferred stock 0 0 0 0 0Common stock 756 954 889 889 889Retained earnings -176 -134 -38 70 189Proposed dividends
Other equity and reserves -27 -112 -112 -112 -112Total shareholders' equity 553 709 739 847 966Total equity & liabilities 1,102 1,298 1,417 1,546 1,685
Liquidity (x)
Current ratio 2.12 1.46 1.54 1.74 1.94Interest cover 14.8 34.2 47.1 74.4 na
Leverage
Net debt/EBITDA (x) 0.33 net cash net cash net cash net cashNet debt/equity (%) 8.9 net cash net cash net cash net cash
Activity (days)
Days receivable 52.5 54.0 55.7 56.4 56.6Days inventory 95.5 93.5 91.3 91.6 90.5Days payable 77.1 82.7 82.4 82.6 81.7Cash cycle 70.9 64.9 64.7 65.3 65.4Source: Nomura estimates
Notes
Our forecasts assume completion of 5mn share buyback for USD65mn
Notes
ANN had a net cash balance in FY11

Nomura | Ansell September 27, 2011
42
ANN – Upgrade to BUY Over the past six months, the latex price has fallen by 20%. Although its latex exposure has declined over the last five years, Ansell still has significant earnings leverage to movements in the latex price. Our new latex forecasts have resulted in earnings and valuation upgrades. Accordingly, we have changed our rating from Neutral to BUY.
Over the past six months, the natural rubber latex (NRL) price has fallen by 18%. Given that NRL is the largest component of ANN’s raw material costs and accounted for 18% of group cost of sales, the company has earnings leverage to movements in the NRL price. We estimate ANN’s FY12 earnings sensitivity at +AUD1.6mn for a 1% decrease in NRL. Adoption of Nomura’s house view on FY12F NRL forecast to MYR8.50/wet kg, from our previous forecast of MYR9.29/wet kg, has resulted in significant forecast earnings uplift. However, we have also increased our FY12F nitrile forecast to USD2,600/MT from our previous forecast of USD2,460/MT, in line with market movements, which has tempered the full impact of the potential earnings uplift from the lower NRL price.
While we have made no changes to our revenue forecasts, the impact of changes to raw material costs has increased our EPS forecasts by 6.2% for FY12 and by 6.4% for FY13. This is shown below. As a result of changes to our forecasts and updated health comparable multiples, our target price has increased by 5.5% to AUD15.25 (from AUD14.46), and we have changed our rating from Neutral to BUY.
Fig. 62: ANN: Changes to forecasts
Source: Nomura estimates
In this note, we
• Analyse the relationship between ANN’s revenue growth in the Industrial division and global industrial production as it is a key earnings driver;
• Highlight Nomura’s house view on the potential for global economic recovery;
• Update for recent movements in the natural rubber latex price; and
• Explain what this means for ANN.
1. Link between global industrial and employment growth and growth in ANN’s Industrial division
Given the Industrial division’s strong links to the auto, metal fabrication, and oil and gas industries, should evidence of a global recovery continue, then ANN has the potential to continue to realise solid revenue growth in those products that are used in these industries. Overall, the majority of ANN EBIT is derived from the Industrial division.
FY12F FY13F FY14FPrev Rev Diff (%) Prev Rev Diff (%) Prev Rev Diff (%)
EBIT (US$mn) 154.1 164.2 6.6 174.8 186.2 6.5 190.0 202.5 6.6 NPAT (US$mn) 134.5 142.8 6.2 151.5 161.2 6.4 165.8 177.3 6.9 EPS (c) 103.0 109.4 6.2 118.3 125.8 6.4 129.5 138.4 6.9 DPS (c) 34.0 36.0 5.9 38.0 41.0 7.9 43.0 46.0 7.0 Net op cashflow (US$mn) 140.6 149.1 6.0 176.6 186.5 5.6 194.4 206.1 6.0

Nomura | Ansell September 27, 2011
43
Fig. 63: ANN – FY12F EBIT by division
Source: Nomura estimates
IMF industrial production data We note that industrial production activity is a useful lead indicator for potential revenue growth in ANN’s Industrial division. To that end, we have compiled the following chart using International Monetary Fund (IMF) industrial production data, using a three-month moving average. In addition, we overlay ANN’s historical industrial division annual revenue growth for each fiscal year.
Fig. 64: Relationship of IMF production data to ANN industrial division revenue growth (Annualized percent change of three-month moving average over previous three-month moving average)
Source: IMF data, company data
We believe this analysis shows that, apart from the last result:
• Relationship between industrial production and ANN industrial divisional growth: ANN’s industrial division revenue growth has tracked closely to industrial production. In our view, it also highlights a period of destocking in 2008.
• Fledgling global economic recovery is underway, lead by China and Japan’s recovery: We believe economic recovery is underway in the advanced economies, albeit driven by Japan, and would argue that this will continue to underpin ANN’s Industrial division’s earnings over the medium term. Growth in emerging economies is forecast to be relatively strong, where Nomura expects an increase in manufacturing activity in response to low US inventory levels. Our economist’s forecasts for China’s industrial production are 14.1% in 2011F and at 13.9% in 2012F.
Industrial51%
Medical31%
New verticals1%
Sexual health17%
-40
-30
-20
-10
0
10
20
30
2005m1 2006m1 2007m1 2008m1 2009m1 2010m1 2011m1
(%)
World
Advanced economies
Emerging economies
Advanced economies excluding Japan
ANN Industrial revenue growth
Industrial production activity is a useful lead indicator for ANN’s industrial glove sales
Recovery in industrial production activity since 2009 has also been reflected in ANN’s FY10A and FY11A industrial revenue growth

Nomura | Ansell September 27, 2011
44
2. Global economic viewpoints by Nomura’s chief economist
In FY11A, ANN generated 59% of its EBIT from North America and EMEA. Revenue and EBIT by geography are shown below.
Fig. 65: ANN – FY11A revenue by geography
Source: Company data
Fig. 66: ANN – FY11A EBIT by geography
Source: Company data
Given that ANN’s business is exposed to several economies, we have compiled the global economic viewpoints of Nomura’s chief economists for key regions.
United States • We expect the high level of household debt to restrain growth, as it has in recoveries
after previous financial crises.
• Concerns about long-term deficits will make it difficult, but not impossible, to enact some of the president’s proposed jobs bill.
• An erosion of confidence will likely suppress economic growth in 2H11.
• Ample unused capacity – evident in the high jobless rate – should restrain core inflation and contain inflation expectations.
• We expect the Fed in September to ease by changing the size and/or duration of its portfolio and by bolstering its “guidance.”
Europe • We see the euro staying intact, with fiscal consolidation and debt restructuring, aided
by official financing, restoring solvency.
• We expect euro-area activity to grow well below trend for the rest of 2011 before returning to just above trend growth in 2012.
• We expect a continued gradual recovery in UK growth despite the damping effect of deleveraging and fiscal consolidation.
• Inflation will likely stay over double the target during 2011 in the UK and peak about 1ppt above the 2% target in the euro area.
• We expect the ECB to delay its next rate hike until July 2012, and the BoE to delay its first hike until August 2012.
Japan • We expect a rapid recovery to continue, driven by reconstruction demand, with
momentum tapering off in H2 2012.
• We expect a supplementary budget of JPY13trn to be passed in November, which should mitigate downside risks to growth.
• We expect the BOJ to increase its asset purchase program by a further JPY3-5trn in September 2011.
• The main risks relate to the nuclear plant and power shortages, a US/China slowdown and sharp appreciation of the yen.
Asia ex Japan • In a market meltdown Asia would be hit hard, save China and Indonesia, but the region
should be the first to bounce back.
Asia Pacific20%
Europe, Middle East
& Africa39%
Latin America
6%
North America
35% Asia Pacific34%
Europe, Middle East
& Africa32%
Latin America
7%
North America
27%

Nomura | Ansell September 27, 2011
45
• China: We expect growth to remain strong, as the economy is increasingly driven by domestic demand.
3. NRL price pressure easing
There are a number of raw material input costs for ANN, including NRL, synthetic rubber, cotton and polyester. According to ANN, raw materials account for approximately 35% of total cost of goods sold, with NRL accounting for the largest component of expenditure.
We believe that NRL has historically accounted for approximately 15% of ANN Group cost of sales. This figure can fluctuate by +/- 1% to 3%, subject to movements in the natural rubber latex price. In FY11A, we believe NRL was closer to 18% of cost of sales, given the NRL price was at a record high. As a result, ANN has significant leverage to movements in the NRL price, although the company’s strategy is to actively move away from selling products where NRL is the main cost driver.
Approximately 43% of ANN’s total revenue in FY11A was derived from products that use NRL albeit in varying degrees. This was down from 48% in FY08. The products with the largest reliance on NRL, where NRL accounts for more than 35% of COGS, are examination gloves and household gloves, which contributed circa 15% of total sales.
Fig. 67: Segment analysis of ANN’s FY12F cost base
Source: Nomura estimates
The NRL price has increased by over 50% per annum over the past two financial years, acting as a significant headwind to ANN’s earnings growth. This is shown in the following figure, where we illustrate the price of latex and components of synthetic rubber (PVC and acrylonitrile).
Fig. 68: Prices of latex, PVC and acrylonitrile
Source: Datastream
We note that over the past two years, stock levels and exports declined, driving raw material prices to record highs. This was compounded by reviving automobile demand in China. Hence, we note that very low levels of stock may be an indicator of an impending rise in prices. NRL prices began to increase significantly in 2009.
Natural rubber latex16%
Synthetic rubber12%
Other45%
SGA27%
0
200
400
600
800
1,000
1,200
0
500
1,000
1,500
2,000
2,500
3,000
3,500
2000 2001 2002 2003 2004 2005 2006 2007 2008 2009 2010 2011
(RMSen/Kg)(US$/MT)
PVC (LHS) Acrylonitrile (LHS) Latex (RHS)
Raw materials account for approximately 35% of total cost of goods sold, with natural rubber latex accounting for the largest component of expenditure
Average natural rubber latex prices have increased over 50% per annum over the past two years
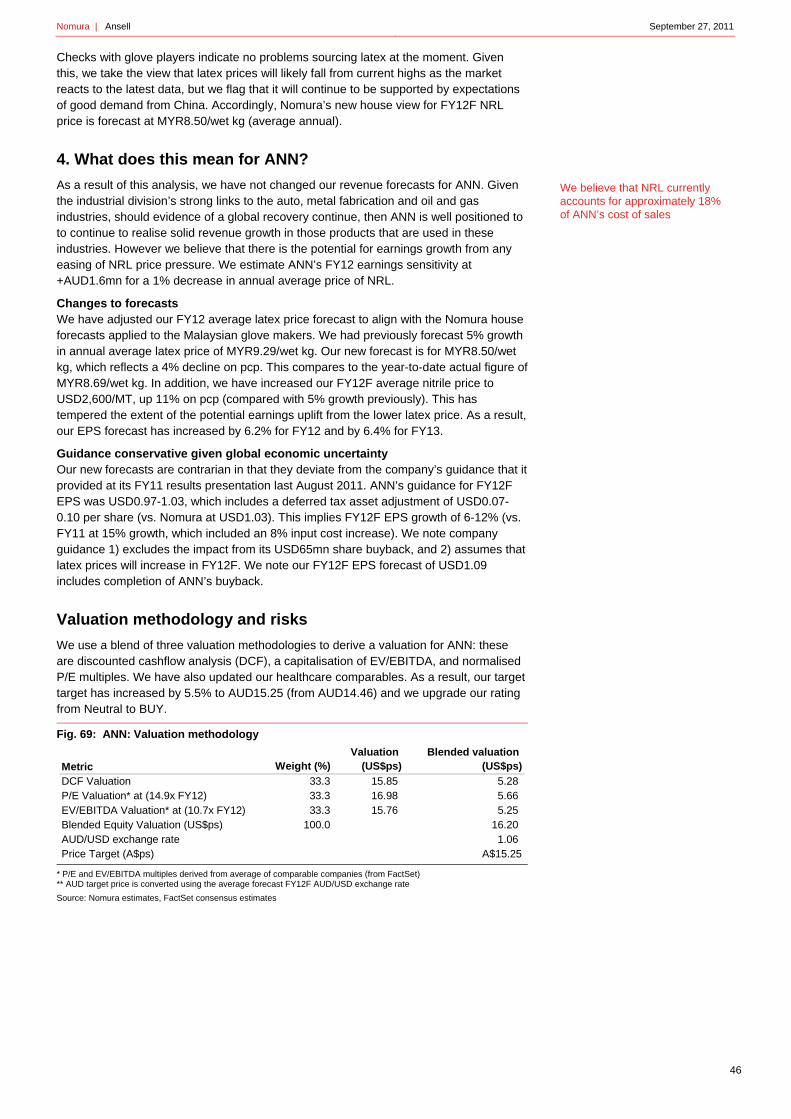
Nomura | Ansell September 27, 2011
46
Checks with glove players indicate no problems sourcing latex at the moment. Given this, we take the view that latex prices will likely fall from current highs as the market reacts to the latest data, but we flag that it will continue to be supported by expectations of good demand from China. Accordingly, Nomura’s new house view for FY12F NRL price is forecast at MYR8.50/wet kg (average annual).
4. What does this mean for ANN?
As a result of this analysis, we have not changed our revenue forecasts for ANN. Given the industrial division’s strong links to the auto, metal fabrication and oil and gas industries, should evidence of a global recovery continue, then ANN is well positioned to to continue to realise solid revenue growth in those products that are used in these industries. However we believe that there is the potential for earnings growth from any easing of NRL price pressure. We estimate ANN’s FY12 earnings sensitivity at +AUD1.6mn for a 1% decrease in annual average price of NRL.
Changes to forecasts We have adjusted our FY12 average latex price forecast to align with the Nomura house forecasts applied to the Malaysian glove makers. We had previously forecast 5% growth in annual average latex price of MYR9.29/wet kg. Our new forecast is for MYR8.50/wet kg, which reflects a 4% decline on pcp. This compares to the year-to-date actual figure of MYR8.69/wet kg. In addition, we have increased our FY12F average nitrile price to USD2,600/MT, up 11% on pcp (compared with 5% growth previously). This has tempered the extent of the potential earnings uplift from the lower latex price. As a result, our EPS forecast has increased by 6.2% for FY12 and by 6.4% for FY13.
Guidance conservative given global economic uncertainty Our new forecasts are contrarian in that they deviate from the company’s guidance that it provided at its FY11 results presentation last August 2011. ANN’s guidance for FY12F EPS was USD0.97-1.03, which includes a deferred tax asset adjustment of USD0.07-0.10 per share (vs. Nomura at USD1.03). This implies FY12F EPS growth of 6-12% (vs. FY11 at 15% growth, which included an 8% input cost increase). We note company guidance 1) excludes the impact from its USD65mn share buyback, and 2) assumes that latex prices will increase in FY12F. We note our FY12F EPS forecast of USD1.09 includes completion of ANN’s buyback.
Valuation methodology and risks
We use a blend of three valuation methodologies to derive a valuation for ANN: these are discounted cashflow analysis (DCF), a capitalisation of EV/EBITDA, and normalised P/E multiples. We have also updated our healthcare comparables. As a result, our target target has increased by 5.5% to AUD15.25 (from AUD14.46) and we upgrade our rating from Neutral to BUY.
Fig. 69: ANN: Valuation methodology
* P/E and EV/EBITDA multiples derived from average of comparable companies (from FactSet) ** AUD target price is converted using the average forecast FY12F AUD/USD exchange rate
Source: Nomura estimates, FactSet consensus estimates
Metric Weight (%)Valuation
(US$ps)Blended valuation
(US$ps)
DCF Valuation 33.3 15.85 5.28P/E Valuation* at (14.9x FY12) 33.3 16.98 5.66EV/EBITDA Valuation* at (10.7x FY12) 33.3 15.76 5.25Blended Equity Valuation (US$ps) 100.0 16.20AUD/USD exchange rate 1.06Price Target (A$ps) A$15.25
We believe that NRL currently accounts for approximately 18% of ANN’s cost of sales

Nomura | Ansell September 27, 2011
47
Risks to our investment view Upside risks include higher-than-expected volume growth driven by emerging market growth and an increase in industrial production activity; an announcement of further earnings-accretive acquisitions. Downside risks include pressure on costs from rising prices of raw material inputs; and a slowdown in the global economic recovery.
How does the 12-month forward P/E compare with historical levels? Using our new EPS assumptions, on a 12-month-forward P/E basis, ANN is trading at 12.4x. This is 4.1% below its mean 9-year historical 12-month-forward P/E of 12.9x.
Fig. 70: ANN: 12-month forward P/E multiple Based on actual EPS (12months forward)
Source: Nomura estimates, FactSet share price
Mean: 12.9x
Lower: 10.7x
Upper: 15.0x
Current: 12.4x
0
5
10
15
20
25
30
Jun-02 Jun-04 Jun-06 Jun-08 Jun-10 Jun-12 Jun-14
ANN AU: Price (A$/share)
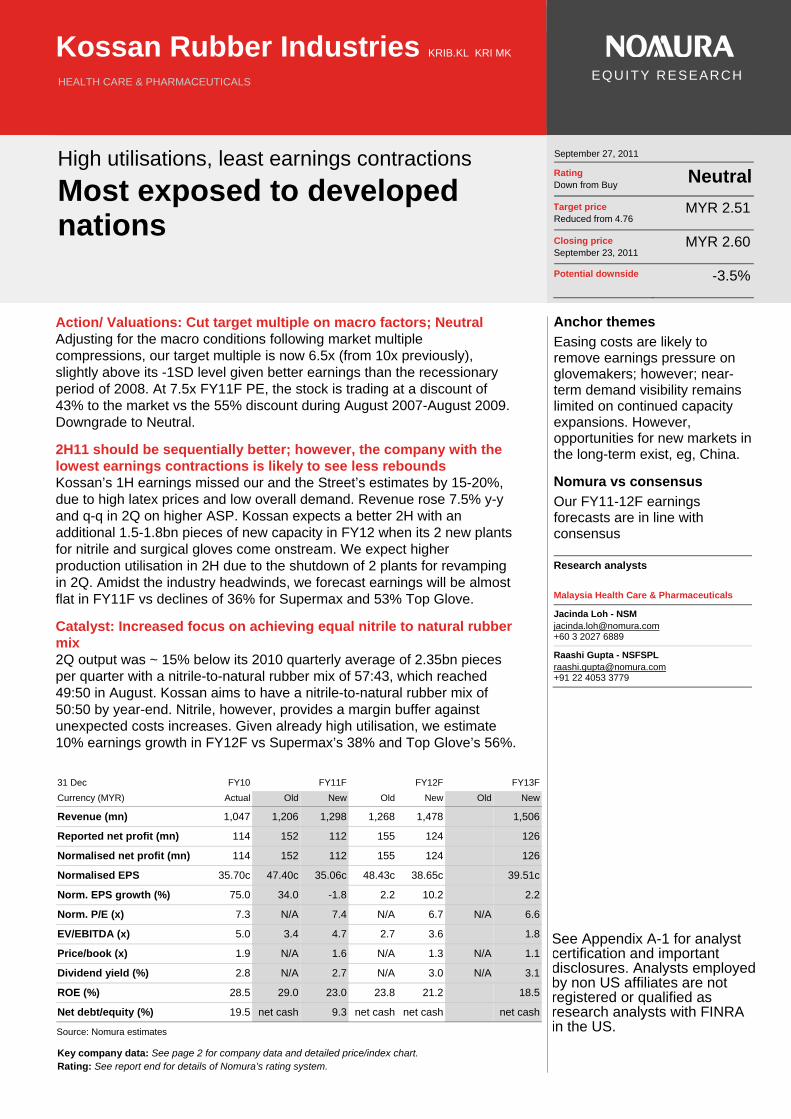
Key company data: See page 2 for company data and detailed price/index chart. Rating: See report end for details of Nomura’s rating system.
Kossan Rubber Industries KRIB.KL KRI MK
HEALTH CARE & PHARMACEUTICALS
EQUITY RESEARCH
High utilisations, least earnings contractions
Most exposed to developed nations
September 27, 2011
Rating Down from Buy
Neutral
Target price Reduced from 4.76
MYR 2.51
Closing price September 23, 2011
MYR 2.60
Potential downside -3.5%
Action/ Valuations: Cut target multiple on macro factors; Neutral Adjusting for the macro conditions following market multiple compressions, our target multiple is now 6.5x (from 10x previously), slightly above its -1SD level given better earnings than the recessionary period of 2008. At 7.5x FY11F PE, the stock is trading at a discount of 43% to the market vs the 55% discount during August 2007-August 2009. Downgrade to Neutral.
2H11 should be sequentially better; however, the company with the lowest earnings contractions is likely to see less rebounds Kossan’s 1H earnings missed our and the Street’s estimates by 15-20%, due to high latex prices and low overall demand. Revenue rose 7.5% y-y and q-q in 2Q on higher ASP. Kossan expects a better 2H with an additional 1.5-1.8bn pieces of new capacity in FY12 when its 2 new plants for nitrile and surgical gloves come onstream. We expect higher production utilisation in 2H due to the shutdown of 2 plants for revamping in 2Q. Amidst the industry headwinds, we forecast earnings will be almost flat in FY11F vs declines of 36% for Supermax and 53% Top Glove.
Catalyst: Increased focus on achieving equal nitrile to natural rubber mix 2Q output was ~ 15% below its 2010 quarterly average of 2.35bn pieces per quarter with a nitrile-to-natural rubber mix of 57:43, which reached 49:50 in August. Kossan aims to have a nitrile-to-natural rubber mix of 50:50 by year-end. Nitrile, however, provides a margin buffer against unexpected costs increases. Given already high utilisation, we estimate 10% earnings growth in FY12F vs Supermax’s 38% and Top Glove’s 56%.
31 Dec FY10 FY11F FY12F FY13F
Currency (MYR) Actual Old New Old New Old New
Revenue (mn) 1,047 1,206 1,298 1,268 1,478 1,506
Reported net profit (mn) 114 152 112 155 124 126
Normalised net profit (mn) 114 152 112 155 124 126
Normalised EPS 35.70c 47.40c 35.06c 48.43c 38.65c 39.51c
Norm. EPS growth (%) 75.0 34.0 -1.8 2.2 10.2 2.2
Norm. P/E (x) 7.3 N/A 7.4 N/A 6.7 N/A 6.6
EV/EBITDA (x) 5.0 3.4 4.7 2.7 3.6 1.8
Price/book (x) 1.9 N/A 1.6 N/A 1.3 N/A 1.1
Dividend yield (%) 2.8 N/A 2.7 N/A 3.0 N/A 3.1
ROE (%) 28.5 29.0 23.0 23.8 21.2 18.5
Net debt/equity (%) 19.5 net cash 9.3 net cash net cash net cash
Source: Nomura estimates
Anchor themes
Easing costs are likely to remove earnings pressure on glovemakers; however; near-term demand visibility remains limited on continued capacity expansions. However, opportunities for new markets in the long-term exist, eg, China.
Nomura vs consensus
Our FY11-12F earnings forecasts are in line with consensus
Research analysts
Malaysia Health Care & Pharmaceuticals
Jacinda Loh - NSM [email protected] +60 3 2027 6889
Raashi Gupta - NSFSPL [email protected] +91 22 4053 3779
See Appendix A-1 for analyst certification and important disclosures. Analysts employed by non US affiliates are not registered or qualified as research analysts with FINRA in the US.

Nomura | Kossan Rubber Industries September 27, 2011
49
Key data on Kossan Rubber Industries Income statement (MYRmn) Year-end 31 Dec FY09 FY10 FY11F FY12F FY13FRevenue 842 1,047 1,298 1,478 1,506Cost of goods sold -496 -659 -925 -1,066 -1,083Gross profit 346 388 373 412 423SG&A -251 -240 -224 -235 -243Employee share expense 0 0 0 0 0Operating profit 95 148 148 176 180
EBITDA 129 182 188 217 222Depreciation -34 -34 -40 -41 -42Amortisation 0 0 0 0 0EBIT 95 148 148 176 180Net interest expense -9 -7 -10 -11 -11Associates & JCEs 0 0 0 0 0Other income 0 0 0 0 0Earnings before tax 86 141 138 165 169Income tax -20 -27 -26 -41 -42Net profit after tax 66 114 112 124 126Minority interests 0 0 0 0 0Other items 0 0 0 0 0Preferred dividends 0 0 0 0 0Normalised NPAT 65 114 112 124 126Extraordinary items -53 0 0 0 0Reported NPAT 12 114 112 124 126Dividends -3 -23 -23 -25 -26Transfer to reserves 10 91 89 98 101
Valuation and ratio analysis
FD normalised P/E (x) 12.7 7.3 7.4 6.7 6.6FD normalised P/E at price target (x) 12.3 7.0 7.2 6.5 6.4Reported P/E (x) 67.8 7.3 7.4 6.7 6.6Dividend yield (%) 0.3 2.8 2.7 3.0 3.1Price/cashflow (x) 10.5 5.8 na 7.4 2.1Price/book (x) 2.3 1.9 1.6 1.3 1.1EV/EBITDA (x) 7.9 5.0 4.7 3.6 1.8EV/EBIT (x) 10.7 6.2 5.9 4.5 2.3Gross margin (%) 41.1 37.0 28.7 27.9 28.1EBITDA margin (%) 15.3 17.4 14.5 14.7 14.8EBIT margin (%) 11.3 14.1 11.4 11.9 12.0Net margin (%) 1.5 10.9 8.6 8.4 8.4Effective tax rate (%) 23.4 19.1 18.8 25.0 25.0Dividend payout (%) 21.9 20.1 20.4 20.4 20.3Capex to sales (%) 4.8 8.1 3.1 1.4 1.3Capex to depreciation (x) 1.2 2.5 1.0 0.5 0.5ROE (%) 3.7 28.5 23.0 21.2 18.5ROA (pretax %) 14.6 21.8 20.1 22.0 30.8
Growth (%)
Revenue -6.1 24.3 24.0 13.9 1.8EBITDA 19.2 41.4 3.5 15.5 2.2EBIT 15.4 55.5 0.6 18.9 2.0Normalised EPS 11.2 75.0 -1.8 10.2 2.2Normalised FDEPS 11.2 75.0 -1.8 10.2 2.2
Per share
Reported EPS (MYR) 3.83c 35.70c 35.06c 38.65c 39.51cNorm EPS (MYR) 20.40c 35.70c 35.06c 38.65c 39.51cFully diluted norm EPS (MYR) 20.40c 35.70c 35.06c 38.65c 39.51cBook value per share (MYR) 1.12 1.38 1.66 1.98 2.30DPS (MYR) 0.01 0.07 0.07 0.08 0.08Source: Nomura estimates
Notes
Given Kossan’s already high utilisation and low demand visibility owing to high exposure to western countries, we estimate only 10% earnings growth in FY12F
Price and price relative chart (one year)
(%) 1M 3M 12M
Absolute (MYR) -6.5 -19.8 -13.3
Absolute (USD) -12.6 -23.0 -15.3
Relative to index 0.9 -7.2 -7.7
Market cap (USDmn) 262.0
Estimated free float (%)
44.0
52-week range (MYR)
3.47/2.48
3-mth avg daily turnover (USDmn)
0.21
Major shareholders (%) Kossan Holdings Sdn Bhd
51.8
2.4
2.6
2.8
3
3.2
3.4
3.6
85
90
95
100
105
110
115
Oct
10
Nov
10
Dec
10
Jan
11
Feb
11
Mar
11
Apr
11
May
11
Jun
11
Jul 1
1
Aug
11
Sep
11
PriceRel MSCI Malaysia(MYR)

Nomura | Kossan Rubber Industries September 27, 2011
50
Cashflow (MYRmn) Year-end 31 Dec FY09 FY10 FY11F FY12F FY13FEBITDA 129 182 188 217 222Change in working capital -67 50 -66 -30 258Other operating cashflow 18 -90 -223 -75 -79Cashflow from operations 79 143 -101 112 401Capital expenditure -41 -85 -40 -20 -20Free cashflow 39 57 -141 92 381Reduction in investments 0 0 0 0 0Net acquisitions 4 46 0 0 0Reduction in other LT assets 0 0 0 0 0Addition in other LT liabilities 11 11 0 0 0Adjustments -11 -11 0 0 0Cashflow after investing acts 43 103 -141 92 381Cash dividends -8 -14 -23 -23 -25Equity issue 0 0 0 0 0Debt issue -32 -35 211 20 0Convertible debt issue 0 0 0 0 0Others 4 14 23 23 25Cashflow from financial acts -36 -35 211 20 0Net cashflow 8 68 70 112 381Beginning cash 16 24 92 161 273Ending cash 23 92 161 273 654Ending net debt 183 86 50 -42 -423Source: Nomura estimates
Balance sheet (MYRmn) As at 31 Dec FY09 FY10 FY11F FY12F FY13FCash & equivalents 24 92 161 273 654Marketable securities 0 0 0 0 0Accounts receivable 193 151 213 243 0Inventories 110 124 182 192 0Other current assets 1 1 1 1 1Total current assets 328 367 557 709 655LT investments 0 0 0 0 0Fixed assets 359 410 396 375 353Goodwill 1 1 1 1 1Other intangible assets 0 0 0 0 0Other LT assets 0 0 0 0 0Total assets 689 777 955 1,086 1,010Short-term debt 159 150 131 151 151Accounts payable 97 113 168 178 0Other current liabilities 4 10 10 10 10Total current liabilities 261 273 309 338 161Long-term debt 47 28 80 80 80Convertible debt 0 0 0 0 0Other LT liabilities 21 32 32 32 32Total liabilities 330 333 421 450 273Minority interest 2 2 2 2 2Preferred stock 0 0 0 0 0Common stock 80 160 160 160 160Retained earnings 276 285 374 475 577Proposed dividends 0 0 0 0 0Other equity and reserves 1 -2 -2 -2 -2Total shareholders' equity 357 443 532 633 735Total equity & liabilities 689 777 955 1,086 1,010
Liquidity (x)
Current ratio 1.26 1.34 1.81 2.10 4.07Interest cover 10.5 21.5 14.8 15.5 15.9
Leverage
Net debt/EBITDA (x) 1.43 0.47 0.26 net cash net cashNet debt/equity (%) 51.3 19.5 9.3 net cash net cash
Activity (days)
Days receivable 76.8 60.0 51.2 56.5 29.5Days inventory 81.7 64.7 60.3 64.2 32.4Days payable 86.0 58.3 55.4 59.3 29.9Cash cycle 72.5 66.3 56.0 61.4 31.9Source: Nomura estimates
Notes
We expect strong free cashflow from FY13F
Notes
Solid balance sheet with net cash position expected from FY13F

Nomura | Kossan Rubber Industries September 27, 2011
51
Highest nitrile exposure, but most exposed to developed countries So far in 2011, Kossan has experienced lesser earnings contractions than its peers (30% y-y in 2Q11 vs Top Glove’s 60% and Supermax’s 42%), owing to a higher nitrile glove mix (which has not seen as volatile cost increases as natural rubber latex this year). Kossan’s earnings growth has also remained above 2008 recessionary levels.
Its capacity shift to nitrile gloves occurred long before the demand switch from natural latex gloves to nitrile ones, which was seen last year; Kossan has started branching into nitrile gloves since 2007.
Kossan’s capacity expansions continue to remain fairly within its peer ranges; it expects to add another 1.5-1.8bn pieces of capacity (translating into growth of 13% pa) via two new plants in 2012 to cater to nitrile and surgical glove production.
Fig. 71: Shifted its production mix to nitrile since 2007
Source: Company data
Fig. 72: Capacity expansion growth between Top Glove’s and Supermax
Source: Company data *Data denotes y-y growth
Fig. 73: Earnings still above 2008 recessionary levels despite recent cost spikes
Source: Company data, Bloomberg
Despite a high nitrile mix, and the easing in natural latex costs to help drive an earnings rebound in 2012F, we expect lower demand visibility to affect players such as Kossan, as most major players have mostly deferred their capacity expansion plans to 2012. In addition, the company exports the bulk of its products to Western countries, where, despite better healthcare expenditures vs undeveloped countries, we expect growth in minor medical consumables to be moderate from over 10% CAGR historically to c. 6% over the next five years.
2007 2008 2009 2010 Current
Powdered Medical 25% 25% 15% 15% 10%
Powder free medical 57% 50% 50% 45% 40%
Nitrile Medical 18% 25% 35% 40% 50%
0%
5%
10%
15%
20%
25%
30%
35%
40%
45%
50%
2007 2008 2009 2010 2011 2012
Top Glove
Supermax
Kossan
2.02.22.42.62.83.03.23.43.63.84.0
0
5
10
15
20
25
30
35
Jun
-04
Oct
-04
Feb
-05
Jun
-05
Oct
-05
Feb
-06
Jun
-06
Oct
-06
Feb
-07
Jun
-07
Oct
-07
Feb
-08
Jun
-08
Oct
-08
Feb
-09
Jun
-09
Oct
-09
Feb
-10
Jun
-10
Oct
-10
Feb
-11
Jun
-11
Net profit (LHS)
Qtrly average (RHS)
(MYR/USD)(MYR mn)

Nomura | Kossan Rubber Industries September 27, 2011
52
Fig. 74: Comparison of exposure to Western developed countries
Source: Respective companies’ data
Fig. 75: US market – minor consumables growth forecast to moderate
Source: Espicom
We think this (moderating growth expectations in minor medical consumables in Western countries) has not gone unrecognised by the company. In June 2011, it acquired a 51% stake in Cleanera (HK), a company specialising in cleanroom products to target the Chinese / Japanese markets representing its first direct presence in the Hong Kong market.
We adjust earnings to impute the average YTD latex price and introduce our revised latex forecast of MYR8.50/kg for 2012F. We also take into account our revised in-house MYR/USD estimates. Our revised FY12F EPS is now pegged to 6.5x, slightly above its –1SD level of 5x given we expect its earnings growth to remain above 2008 levels. Consequently, we cut our call from Buy to NEUTRAL, despite Kossan’s more balanced product mix than peers, and highest exposure to Western countries amongst peers, which we forecast will see moderating growth rates in demand over the next few years.
Fig. 76: KRI: P/E bands
Source: Bloomberg, Nomura Research
Fig. 77: KRI: Forward P/E
Source: Bloomberg, Nomura Research
0%
10%
20%
30%
40%
50%
60%
70%
80%
90%
Top Glove Supermax Kossan
-2%0%2%4%6%8%
10%12%14%16%18%
2007
2008
2009
2010
2011
F
2012
F
2013
F
2014
F
2015
F
2016
F
CA
GR
06
-10
CA
GR
11
-16
Growth in minor consumables market (gloves, reagents)
0
1
2
3
4
5
6
Jan
-06
May
-06
Sep
-06
Jan
-07
May
-07
Sep
-07
Jan
-08
May
-08
Sep
-08
Jan
-09
May
-09
Sep
-09
Jan
-10
May
-10
Sep
-10
Jan
-11
May
-11
Sep
-11
(Price)
14x
11x
8x
5x
2x0
5
10
15
20
Jan
-06
May
-06
Sep
-06
Jan
-07
May
-07
Sep
-07
Jan
-08
May
-08
Sep
-08
Jan
-09
May
-09
Sep
-09
Jan
-10
May
-10
Sep
-10
Jan
-11
May
-11
Sep
-11
KRI 1 year forward P/EAverage=8.2+1SD=11.1-1SD=5.3
(x)

Nomura | Kossan Rubber Industries September 27, 2011
53
Fig. 78: KRI: Historical discount to market
Source: Bloomberg, Nomura Research
Fig. 79: Changes in assumptions
Source: Nomura estimates
Valuation methodology
We peg Kossan’s target price to a 6.5x FY12F P/E multiple (from 10x FY11F previously). Applied to our FY11F EPS of MYR0.39, we arrive at our target price of MYR2.51.
Risks
Potential downside to our view includes delays / hiccups to the new product launch, which could affect Kossan’s strategy to gain market share from other nitrile players and the higher-end segment. Upside risks include sharp easing of latex prices and appreciable demand rebound from FY12F.
0
2
4
6
8
10
12
14
16
18
Jan
-06
Ap
r-06
Jul-
06
Oct
-06
Jan
-07
Ap
r-07
Jul-
07
Oct
-07
Jan
-08
Ap
r-08
Jul-
08
Oct
-08
Jan
-09
Ap
r-09
Jul-
09
Oct
-09
Jan
-10
Ap
r-10
Jul-
10
Oct
-10
Jan
-11
Ap
r-11
Jul-
11
Malaysia market 1 year forward PE KRI 1 year forward PE(x)
FY11F FY12F FY11F FY12FLatex price (MYR/kg) 9.5 8.5 8.8 8.0MYR/USD 2.9 2.77 3.0 3.0Revenue growth (%) 24.0 13.9 15.1 5.2Earnings growth (%) (1.8) 10.2 150.4 6.5EBITDA margin (%) 14.5 14.7 34.9 35.1Net margin (%) 8.6 8.4 24.9 25.2
New assumptions Old assumptions

Key company data: See page 2 for company data and detailed price/index chart. Rating: See report end for details of Nomura’s rating system.
Supermax Corp Bhd SUPM.KL SUCB MK
HEALTH CARE & PHARMACEUTICALS
EQUITY RESEARCH
Deep value for nitrile exposure
Familiar industry risks well baked into valuations
September 27, 2011
Rating Remains
Buy
Target price Reduced from 7.00
MYR 2.88
Closing price September 23, 2011
MYR 2.37
Potential upside +21.5%
Action: Value, given lower earnings contractions, better product mix We see deep value in Supermax’s current share price; it has seen lower y-y earnings contractions than peers owing to a higher (ie, 34%) nitrile product mix (vs. c.13% for TOPG and 50% for KRI), while its own-brand distribution arm provides an alternative earnings source. We forecast that earnings will be down 36% for FY11F versus Top Glove’s 53%. On a y-y basis, 1H11 output is c. 4% higher, again in a comparatively better position than peers who have reported y-y lower output.
Catalysts: Yield support on increased dividend policy; easing costs Management has announced an increase in its payout ratio to 30% from FY12F (from 20%), bringing FY12F yield to 5.6%. Given the c. 4% earnings sensitivity to every 1% change in rubber prices, we expect the 36% earnings growth in FY12F to be driven primarily by the 10% easing in rubber prices so far. Demand visibility is marginally better than peers given its 34% exposure to nitrile (3 months ahead, vs. peers’ 1.5 months); however, most glovemakers are focusing on switching capacity to nitrile gloves now – our FY12F revenue growth assumptions remain below average levels of 5% to reflect lower industry demand visibility.
Valuation: At 5.4x FY12F PE, trading at APLI write-off levels We have adjusted our TP to incorporate macro conditions and a muted short-term outlook for the industry – our target multiple is now 6.5x from 11.5x (implying a wider discount to market of 52% from 26%). Post-APLI, PE valuations have ranged from 6x to 16x. During the ’08 downturn, valuations bottomed at 2-3x; however, we believe those bear-case valuations do not reflect the better operations post-APLI.
31 Dec FY10 FY11F FY12F FY13F
Currency (MYR) Actual Old New Old New Old New
Revenue (mn) 977 1,172 1,133 1,373 1,190 1,304
Reported net profit (mn) 169 204 108 215 149 170
Normalised net profit (mn) 169 204 108 215 149 170
Normalised EPS 50.39c 60.83c 32.18c 64.27c 44.44c 50.80c
Norm. EPS growth (%) 36.4 20.7 -36.1 5.6 38.1 14.3
Norm. P/E (x) 4.7 N/A 7.4 N/A 5.3 N/A 4.7
EV/EBITDA (x) 4.3 3.0 5.1 2.6 3.6 3.0
Price/book (x) 1.1 N/A 1.0 N/A 0.9 N/A 0.8
Dividend yield (%) 4.0 N/A 2.7 N/A 5.6 N/A 6.4
ROE (%) 27.0 25.8 14.8 22.4 17.8 17.7
Net debt/equity (%) 28.7 8.1 16.7 0.6 5.5 net cash
Source: Nomura estimates
Anchor themes
Easing costs are likely to remove earnings pressure on glovemakers, however near-term demand visibility remains limited on continued capacity expansions. However, opportunities for new markets in the long term exist, eg, in China.
Nomura vs consensus
We are broadly in line with consensus on earnings; however, we differ in that we have stronger in-house RM appreciation forecasts.
Research analysts
Malaysia Health Care & Pharmaceuticals
Jacinda Loh - NSM [email protected] +60 3 2027 6889
Raashi Gupta - NSFSPL [email protected] +91 22 4053 3779
See Appendix A-1 for analyst certification and important disclosures. Analysts employed by non US affiliates are not registered or qualified as research analysts with FINRA in the US.

Nomura | Supermax Corp Bhd September 27, 2011
55
Key data on Supermax Corp Bhd Income statement (MYRmn) Year-end 31 Dec FY09 FY10 FY11F FY12F FY13FRevenue 804 977 1,133 1,190 1,304Cost of goods sold -579 -685 -899 -907 -999Gross profit 224 292 234 283 304SG&A -103 -126 -129 -133 -133Employee share expense 0 0 0 0 0Operating profit 121 166 105 150 171
EBITDA 152 192 141 188 211Depreciation -31 -26 -37 -38 -40Amortisation 0 0 0 0 0EBIT 121 166 105 150 171Net interest expense -17 -14 -19 -20 -21Associates & JCEs 42 42 42 47 51Other income 0 0 0 0 0Earnings before tax 146 194 128 176 201Income tax -22 -25 -20 -27 -31Net profit after tax 124 169 108 149 170Minority interests 0 0 0 0 0Other items 0 0 0 0 0Preferred dividends 0 0 0 0 0Normalised NPAT 124 169 108 149 170Extraordinary items -5 0 0 0 0Reported NPAT 119 169 108 149 170Dividends -24 -32 -22 -45 -51Transfer to reserves 95 137 86 104 119
Valuation and ratio analysis
FD normalised P/E (x) 6.4 4.7 7.4 5.3 4.7FD normalised P/E at price target (x) 7.8 5.7 8.9 6.5 5.7Reported P/E (x) 6.7 4.7 7.4 5.3 4.7Dividend yield (%) 3.0 4.0 2.7 5.6 6.4Price/cashflow (x) 3.4 12.9 5.5 5.3 4.9Price/book (x) 1.4 1.1 1.0 0.9 0.8EV/EBITDA (x) 5.1 4.3 5.1 3.6 3.0EV/EBIT (x) 6.0 4.8 6.4 4.4 3.5Gross margin (%) 27.9 29.9 20.6 23.8 23.3EBITDA margin (%) 19.0 19.6 12.5 15.8 16.2EBIT margin (%) 15.1 17.0 9.2 12.6 13.1Net margin (%) 14.8 17.3 9.5 12.5 13.1Effective tax rate (%) 15.3 12.8 15.4 15.4 15.4Dividend payout (%) 20.0 18.8 20.0 30.0 30.0Capex to sales (%) 2.8 4.8 5.1 2.5 2.3Capex to depreciation (x) 0.7 1.8 1.6 0.8 0.7ROE (%) 24.2 27.0 14.8 17.8 17.7ROA (pretax %) 18.8 23.3 14.1 17.3 18.6
Growth (%)
Revenue -1.0 21.6 15.9 5.1 9.6EBITDA 19.4 25.8 -26.4 33.2 12.3EBIT 22.6 36.8 -37.0 43.3 14.3Normalised EPS 34.0 36.4 -36.1 38.1 14.3Normalised FDEPS 34.0 36.4 -36.1 38.1 14.3
Per share
Reported EPS (MYR) 35.36c 50.39c 32.18c 44.44c 50.80cNorm EPS (MYR) 36.96c 50.39c 32.18c 44.44c 50.80cFully diluted norm EPS (MYR) 36.96c 50.39c 32.18c 44.44c 50.80cBook value per share (MYR) 1.66 2.06 2.30 2.68 3.06DPS (MYR) 0.07 0.09 0.06 0.13 0.15Source: Nomura estimates
Notes
2012 earnings rebound solely on current decrease in natural latex prices by 10%, still conservative on 2012 revenue growth, in our view
Price and price relative chart (one year)
(%) 1M 3M 12M
Absolute (MYR) -20.2 -37.5 -41.2
Absolute (USD) -26.1 -40.6 -43.1
Relative to index -11.3 -23.5 -34.1
Market cap (USDmn) 251.7
Estimated free float (%)
58.0
52-week range (MYR)
4.86/2.26
3-mth avg daily turnover (USDmn)
0.84
Major shareholders (%) Dato Seri Stanley Thai
20.7
Datin Seri Cheryl Tan 15.3
2
2.5
3
3.5
4
4.5
5
40
60
80
100
120
Oct
10
Nov
10
Dec
10
Jan
11
Feb
11
Mar
11
Apr
11
May
11
Jun
11
Jul 1
1
Aug
11
Sep
11
PriceRel MSCI Malaysia(MYR)

Nomura | Supermax Corp Bhd September 27, 2011
56
Cashflow (MYRmn) Year-end 31 Dec FY09 FY10 FY11F FY12F FY13FEBITDA 152 192 141 188 211Change in working capital 91 -110 49 -9 -13Other operating cashflow -8 -20 -46 -29 -35Cashflow from operations 236 61 144 150 163Capital expenditure -23 -47 -58 -30 -30Free cashflow 213 15 87 120 133Reduction in investments -39 -42 -42 -47 -51Net acquisitions 0 0 0 0 0Reduction in other LT assets 0 6 -1 -1 -1Addition in other LT liabilities 1 5 0 0 0Adjustments 29 32 44 49 54Cashflow after investing acts 203 15 88 121 135Cash dividends -19 -32 -32 -22 -45Equity issue 4 6 0 0 0Debt issue 0 6 0 0 0Convertible debt issue 0 0 0 0 0Others -100 -17 38 -5 -5Cashflow from financial acts -115 -37 6 -27 -50Net cashflow 88 -22 94 95 85Beginning cash 31 119 97 192 286Ending cash 119 97 192 286 371Ending net debt 176 198 129 49 -20Source: Nomura estimates
Balance sheet (MYRmn) As at 31 Dec FY09 FY10 FY11F FY12F FY13FCash & equivalents 119 97 192 286 371Marketable securities 0 0 0 0 0Accounts receivable 140 215 233 244 268Inventories 106 133 197 190 206Other current assets 0 0 0 0 0Total current assets 365 445 621 721 845LT investments 155 198 240 286 337Fixed assets 374 388 405 396 386Goodwill 29 29 29 29 29Other intangible assets 0 0 0 0 0Other LT assets 11 6 7 8 9Total assets 934 1,065 1,301 1,440 1,606Short-term debt 129 155 129 129 129Accounts payable 61 60 192 188 214Other current liabilities 12 4 4 4 4Total current liabilities 202 220 324 320 346Long-term debt 165 141 192 207 222Convertible debt 0 0 0 0 0Other LT liabilities 9 14 14 14 14Total liabilities 376 374 529 541 581Minority interest 0 0 0 0 0Preferred stock 0 0 0 0 0Common stock 134 170 170 170 170Retained earnings 317 446 522 649 775Proposed dividends 0 0 4 4 4Other equity and reserves 107 76 76 76 76Total shareholders' equity 558 691 772 899 1,025Total equity & liabilities 934 1,065 1,301 1,440 1,606
Liquidity (x)
Current ratio 1.80 2.03 1.92 2.25 2.44Interest cover 7.2 11.6 5.4 7.4 8.1
Leverage
Net debt/EBITDA (x) 1.15 1.03 0.91 0.26 net cashNet debt/equity (%) 31.5 28.7 16.7 5.5 net cash
Activity (days)
Days receivable 86.4 66.2 72.1 73.4 71.7Days inventory 76.0 63.6 67.0 78.1 72.3Days payable 53.6 32.3 51.1 76.6 73.4Cash cycle 108.9 97.5 88.0 74.9 70.7Source: Nomura estimates
Notes
Still positive operating cashflow despite earnings contractions
Notes
Gearing still below its max levels of 0.5 to 0.7x (net)

Nomura | Supermax Corp Bhd September 27, 2011
57
Deep value; operations continue to improve post-APLI write-off Unlike peers that have reported y-y volume declines off 2010 highs, Supermax shipped 4% more gloves in 1H11 than in 1H10. Post its write-off of an unprofitable investment in APLI (a glovemaker) in 2009, its focus has continued to be on growing the Supermax’s own-brand manufacturing and distribution as an alternative revenue source to contract manufacturing (its own-brand arm now comprises 68% of the sales mix vs. 64% last year). Its own distribution centres are located in countries where it sees opportunities to increase its export share (see figure titled “Has a direct presence in countries where it sees opportunities to increase market share” below) of gloves, allowing it to maintain on-the-ground ties with customers and capitalize on any opportunities quickly.
Fig. 80: Malaysian glovemakers’ nitrile gloves exposure
Source: Respective company data
Fig. 81: Unlike Top Glove, Supermax output is showing 4% growth y-y
Source: Company data
Fig. 82: Own-brand manufacturing continues to be focus – now 68% of sales mix versus 64% last year
Source: Company data
Fig. 83: Has a direct presence in countries where it sees opportunities to increase market share
Note: Market share represents total imports of each respective country from Malaysia Source: Espicom
Owing to the demand switch from natural latex to nitrile gloves last year on the back of extreme increases in the cost of natural latex, Supermax responded by shifting its production mix towards nitrile gloves beginning 2H10. As such, volumes shipped y-y are still showing 4% growth versus the peers, such as Top Glove, that have a higher natural latex product mix and that are seeing y-y declines in output.
0%
10%
20%
30%
40%
50%
60%
Top Glove Supermax Kossan
Nitrile gloves as proportion of total product mix
0
1
2
3
4
5
6
7
8
4Q09 1Q10 2Q10 3Q10 4Q10 1Q11 2Q11 1H11 1H10
Gloves shipped (bn pcs)
0%
10%
20%
30%
40%
50%
60%
70%
80%
90%
100%
April 2010 August 2011
Own Brand Contract / OEM manufacturing
0%
10%
20%
30%
40%
50%
60%
70%
80%
Germany USA Australia Belgium Canada
Malaysia export share of gloves (%) (based on USD value)

Nomura | Supermax Corp Bhd September 27, 2011
58
Fig. 84: Shift to nitrile started in 2H10
Source: Company data
We adjusted our assumptions to impute the high ytd latex price, our revised in-house foreign-exchange forecasts as well as the revised in-house assumptions of RM8.50/kg (for rationale, please see our sector report above) for 2012.
Given that Supermax’s operational and managerial resources were heavily involved in dealing with its APLI acquisition prior to end-09, we think a more relevant valuation benchmark would be the post-2009 period – average PE was 10x, -1SD level was 7x from 4Q09 to present. We note, however, that during the ’08 recession, PE valuations bottomed at 2-3x (-1SD was 3x). Given much better operations currently, and after accounting for the current macro and industry conditions, we think a fair and reasonable target PE multiple would be 6.5x.
Post its 2Q11 results briefing, Supermax also announced an increase in dividend policy from 20% to 30% next year – based on current share-price levels, this boosts dividend yields to 5.6%, which provides additional support to the share price.
On pegging our revised FY12F EPS to a target multiple of 6.5x we derive a TP of RM2.88, and maintain our BUY rating; we continue to see value in Supermax post-APLI, on its ability to maintain growth in output (albeit minor) beyond 2010, and an alternative earnings source via selling its own-brand gloves.
Fig. 85: SUCB: PE bands
Source: Bloomberg, Nomura Research
Fig. 86: SUCB: Forward PE
Source: Bloomberg, Nomura Research
As a % of total 1Q10 2Q10 3Q10 4Q10 1Q11 2Q11
Surgical 3 3 3 3 3 3
Nitrile gloves (powdered and powder free) 20 20 25 31 34 34
Natural latex (powdered and powder free) 77 77 72 66 63 63
0
2
4
6
8
Jan
-06
May
-06
Sep
-06
Jan
-07
May
-07
Sep
-07
Jan
-08
May
-08
Sep
-08
Jan
-09
May
-09
Sep
-09
Jan
-10
May
-10
Sep
-10
Jan
-11
May
-11
Sep
-11
(Price)
14x
11x
8x
5x
2x0
5
10
15
20
Jan
-06
May
-06
Sep
-06
Jan
-07
May
-07
Sep
-07
Jan
-08
May
-08
Sep
-08
Jan
-09
May
-09
Sep
-09
Jan
-10
May
-10
Sep
-10
Jan
-11
May
-11
Sep
-11
SUCB 1 year forward P/E
Average=6.5
+1SD=10.3
-1SD=2.7
(x)

Nomura | Supermax Corp Bhd September 27, 2011
59
Fig. 87: Historical discount to market
Source: Bloomberg, Nomura
Fig. 88: Assumptions
Source: Nomura research
Valuation Methodology
We peg Supermax’s target P/E at 6.5x, from 11.5x previously, following market-multiple compressions. Applying this to FY12F EPS of RM0.44, we derive our target price of RM2.88.
Risks
Downside risks to our target price include industry-related factors similar to those facing Top Glove, as well as adverse and rapid currency movements that could affect income from the company's overseas distribution arms.
0
2
4
6
8
10
12
14
16
18Ja
n-0
6A
pr-
06Ju
l-06
Oct
-06
Jan
-07
Ap
r-07
Jul-
07O
ct-0
7Ja
n-0
8A
pr-
08Ju
l-08
Oct
-08
Jan
-09
Ap
r-09
Jul-
09O
ct-0
9Ja
n-1
0A
pr-
10Ju
l-10
Oct
-10
Jan
-11
Ap
r-11
Jul-
11
Malaysia market 1 year forward PE
SUCB 1 year forward PE
(x)
FY11F FY12F FY11F FY12F
Latex price (MYR/kg) 9.5 8.5 8.5 8
MYR/ USD 2.9 2.77 3.0 3.0
Revenue growth (%) 15.9 5.1 10.5 17.1
Earnings growth (%) (36.1) 38.1 20.7 5.6
EBITDA margin (%) 12.5 15.8 20.0 17.2
Net margin (%) 9.5 12.5 17.4 15.7
New assumptions Old assumptions

Key company data: See page 2 for company data and detailed price/index chart. Rating: See report end for details of Nomura’s rating system.
Top Glove Corp TPGC.KL TOPG MK
HEALTH CARE & PHARMACEUTICALS
EQUITY RESEARCH
Still low visibility, valuation compression
Market may punish demand uncertainty
September 27, 2011
Rating Down from Neutral
Reduce
Target price Reduced from 5.00
MYR 3.42
Closing price September 23, 2011
MYR 4.00
Potential downside -14.5%
Action: Unchanged low visibility could be disappointment in these markets Our company visit this month revealed 1) a slower rebound in output (only 2-3% above normal 2009 levels) and 2) continued delays in factory expansions (for the third time now). The relatively unchanged operations sequentially lead us to believe that 4Q11 (results out October 11) could be a flat quarter at best. Earnings have bottomed, in our view, but visibility remains poor, and macro and demand-side risks could impede the extent of any rebound in 2012.
Catalysts: 2012 to improve from easing costs, but demand visibility uncertain We see the easing and stabilization of latex prices improving the bottom line in FY12F from FY11F (Nomura assumption: RM8.50/kg for 2012). While most players have delayed (but not cancelled) expansion plans, the resulting capacity increase in FY12F may lead to continued lower sales volume visibility in 2012. To incrementally boost output, Top Glove is planning to cultivate more orders from MNCs, which previously had not been given much focus before.
Valuation: Macro conditions / market multiple compression necessitate lowering of target multiple to 12x Uncertain macro conditions and low visibility lead us to apply FY12F EPS to a base-case target multiple of 12x, midway between its mean and +1SD level. An extreme bear case scenario (similar to 2008) could see valuations compress further, e.g., down to 9x. Despite expecting a 50%-plus earnings rebound in FY12F on lower costs, valuations are c. on par with the market at 14x vs the historical market discount of 38% (Aug ’07-Aug ’09).
31 Aug FY10 FY11F FY12F FY13F
Currency (MYR) Actual Old New Old New Old New
Revenue (mn) 2,079 2,292 2,263 2,500 2,475 2,590 2,518
Reported net profit (mn) 245 202 115 224 180 237 199
Normalised net profit (mn) 245 202 115 224 180 237 199
Normalised EPS 39.65c 32.64c 18.60c 36.25c 29.06c 38.28c 32.23c
Norm. EPS growth (%) 38.7 -17.7 -53.1 11.1 56.3 5.6 10.9
Norm. P/E (x) 10.3 N/A 22.0 N/A 14.1 N/A 12.7
EV/EBITDA (x) 6.0 6.7 10.7 5.7 7.1 4.9 5.9
Price/book (x) 2.4 N/A 2.3 N/A 2.0 N/A 1.9
Dividend yield (%) 4.0 N/A 1.8 N/A 2.9 N/A 3.2
ROE (%) 26.5 18.6 10.9 18.4 15.6 17.3 15.7
Net debt/equity (%) net cash net cash net cash net cash net cash net cash net cash
Source: Nomura estimates
Anchor themes
Easing costs are likely to remove earnings pressure on glovemakers, however near-term demand visibility remains limited on continued capacity expansions. However, opportunities for new markets in the long term exist, e.g., China.
Nomura vs consensus
We are broadly in line with consensus.
Research analysts
Malaysia Health Care & Pharmaceuticals
Jacinda Loh - NSM [email protected] +60 3 2027 6889
Raashi Gupta - NSFSPL [email protected] +91 22 4053 3779
See Appendix A-1 for analyst certification and important disclosures. Analysts employed by non US affiliates are not registered or qualified as research analysts with FINRA in the US.

Nomura | Top Glove Corp September 27, 2011
61
Key data on Top Glove Corp Income statement (MYRmn) Year-end 31 Aug FY09 FY10 FY11F FY12F FY13FRevenue 1,529 2,079 2,263 2,475 2,518Cost of goods sold -1,156 -1,630 -1,972 -2,093 -2,104Gross profit 373 449 291 382 414SG&A -142 -142 -157 -161 -166Employee share expense 0 0 0 0 0Operating profit 231 307 135 220 248
EBITDA 288 366 201 292 324Depreciation -57 -59 -66 -72 -77Amortisation 0 0 0 0 0EBIT 231 307 135 220 248Net interest expense -9 -1 -1 -1 -1Associates & JCEs -1 -1 -1 -1 -1Other income 0 0 16 18 18Earnings before tax 222 306 149 236 264Income tax -54 -56 -33 -55 -61Net profit after tax 168 250 116 182 203Minority interests 1 -5 -2 -4 -4Other items 0 0 1 2 0Preferred dividends 0 0 0 0 0Normalised NPAT 169 245 115 180 199Extraordinary items 0 0 0 0 0Reported NPAT 169 245 115 180 199Dividends -76 -99 -46 -71 -80Transfer to reserves 92 146 69 108 119
Valuation and ratio analysis
FD normalised P/E (x) 14.0 10.3 22.0 14.1 12.7FD normalised P/E at price target (x) 11.8 8.7 18.4 11.8 10.6Reported P/E (x) 14.0 10.1 21.5 13.8 12.4Dividend yield (%) 3.2 4.0 1.8 2.9 3.2Price/cashflow (x) 7.1 9.4 38.0 16.4 10.0Price/book (x) 2.9 2.4 2.3 2.0 1.9EV/EBITDA (x) 8.0 6.0 10.7 7.1 5.9EV/EBIT (x) 10.0 7.1 16.0 9.4 7.8Gross margin (%) 24.4 21.6 12.9 15.4 16.4EBITDA margin (%) 18.8 17.6 8.9 11.8 12.9EBIT margin (%) 15.1 14.8 6.0 8.9 9.8Net margin (%) 11.0 11.8 5.1 7.3 7.9Effective tax rate (%) 24.3 18.2 22.4 23.2 23.0Dividend payout (%) 45.3 40.3 39.6 39.6 40.2Capex to sales (%) 4.4 3.4 3.1 2.9 2.9Capex to depreciation (x) 1.2 1.2 1.1 1.0 0.9ROE (%) 22.6 26.5 10.9 15.6 15.7ROA (pretax %) 23.8 29.1 11.2 17.5 19.4
Growth (%)
Revenue 11.0 36.0 8.8 9.3 1.8EBITDA 46.3 27.2 -45.1 45.1 11.0EBIT 60.6 33.0 -56.2 63.6 12.3Normalised EPS 59.5 38.7 -53.1 56.3 10.9Normalised FDEPS 59.5 35.8 -53.1 56.3 10.9
Per share
Reported EPS (MYR) 28.59c 39.65c 18.60c 29.06c 32.23cNorm EPS (MYR) 28.59c 39.65c 18.60c 29.06c 32.23cFully diluted norm EPS (MYR) 28.59c 38.82c 18.21c 28.46c 31.56cBook value per share (MYR) 1.40 1.65 1.77 1.96 2.16DPS (MYR) 0.13 0.16 0.07 0.12 0.13Source: Nomura estimates
Notes
FY12F earnings rebound expected on mostly lower costs (assumptions are that current latex prices of RM8.50/kg or so stabilize and hold)
Price and price relative chart (one year)
(%) 1M 3M 12M
Absolute (MYR) -18.7 -23.4 -21.6
Absolute (USD) -24.0 -26.5 -23.4
Relative to index -11.3 -10.8 -16.0
Market cap (USDmn) 779.4
Estimated free float (%)
55.0
52-week range (MYR)
5.88/3.85
3-mth avg daily turnover (USDmn)
1.27
Major shareholders (%) Tan Sri Dato Seri Lim Wee Chai
39.5
3.5
4
4.5
5
5.5
6
75
80
85
90
95
100
105
110
Oct
10
Nov
10
Dec
10
Jan
11
Feb
11
Mar
11
Apr
11
May
11
Jun
11
Jul 1
1
Aug
11
Sep
11
PriceRel MSCI Malaysia(MYR)

Nomura | Top Glove Corp September 27, 2011
62
Cashflow (MYRmn) Year-end 31 Aug FY09 FY10 FY11F FY12F FY13FEBITDA 288 366 201 292 324Change in working capital 87 -63 -38 -31 16Other operating cashflow -44 -35 -97 -108 -87Cashflow from operations 331 268 66 154 253Capital expenditure -67 -70 -70 -72 -72Free cashflow 264 198 -4 82 181Reduction in investments 1 1 1 1 1Net acquisitions
Reduction in other LT assets -15 -3 -3 -4 -5Addition in other LT liabilities 3 0 0 0 0Adjustments 1 -3 42 73 38Cashflow after investing acts 254 194 36 151 216Cash dividends -32 -98 -46 -71 -80Equity issue 11 0 0 0 0Debt issue -165 -12 -6 0 -3Convertible debt issue 0 0 0 0 0Others -4 34 42 3 10Cashflow from financial acts -190 -75 -9 -69 -73Net cashflow 64 118 27 83 142Beginning cash 122 186 304 330 413Ending cash 185 304 331 413 556Ending net debt -165 -295 -327 -410 -556Source: Nomura estimates
Balance sheet (MYRmn) As at 31 Aug FY09 FY10 FY11F FY12F FY13FCash & equivalents 186 304 330 413 556Marketable securities 0 0 0 0 0Accounts receivable 207 301 339 373 370Inventories 119 226 248 264 256Other current assets 0 0 0 0 1Total current assets 511 831 917 1,050 1,182LT investments 9 8 7 7 6Fixed assets 564 573 576 577 572Goodwill 20 20 20 20 20Other intangible assets 0 0 0 0 0Other LT assets 27 30 33 37 42Total assets 1,132 1,462 1,554 1,691 1,823Short-term debt 12 6 0 0 0Accounts payable 197 335 357 376 383Other current liabilities 36 36 36 36 36Total current liabilities 244 376 393 412 418Long-term debt 9 3 3 3 0Convertible debt 0 0 0 0 0Other LT liabilities 33 33 33 33 33Total liabilities 286 413 429 448 452Minority interest 21 27 29 33 37Preferred stock 0 0 0 0 0Common stock 152 162 165 168 168Retained earnings 445 597 668 778 902Proposed dividends 0 0 0 0 0Other equity and reserves 227 264 264 264 264Total shareholders' equity 825 1,023 1,096 1,210 1,334Total equity & liabilities 1,132 1,462 1,554 1,691 1,823
Liquidity (x)
Current ratio 2.10 2.21 2.33 2.55 2.83Interest cover 27.1 481.9 211.1 345.4 388.0
Leverage
Net debt/EBITDA (x) net cash net cash net cash net cash net cashNet debt/equity (%) net cash net cash net cash net cash net cash
Activity (days)
Days receivable 51.9 44.5 51.6 52.6 53.8Days inventory 43.7 38.6 43.9 44.8 45.1Days payable 60.8 59.5 64.0 64.1 65.8Cash cycle 34.9 23.6 31.4 33.3 33.1Source: Nomura estimates
Notes
Operating cashflows to improve into FY12F on the back of an earnings improvement and steadier costs
Notes
Balance sheet fairly well positioned to ride any downturn

Nomura | Top Glove Corp September 27, 2011
63
Demand visibility still low, valuations unjustified Despite the easing in latex prices year to date, we believe Top Glove will likely continue to underperform into 2012, owing to the following:
• Delays in expansions evidencing weak demand visibility
• Unjustified valuations despite an anticipated earnings rebound from current cost easing ytd
Fig. 89: Expansions have been delayed 3 times
Source: Company data
While we believe the worst of the cost headwinds are likely over given the recent correction of rubber prices on the back of easing tight supply, (and we do expect Top Glove to recover the earnings contractions experienced by FY12F on easing costs), demand visibility for its main product line – natural latex gloves – remains weak, with output still down y-y and only marginally (2-3%) above 2009 levels. This implies output growth below market of high single digits on average.
Evidencing this still uninspiring outlook is the delay in the company’s expansion plans for the third time this financial year by another two months, on average, while no new expansions are planned beyond Factory 23. While management highlights that these new expansions are mostly for nitrile gloves (in which it is trying to expand and gain share), this nevertheless implies capacity expansion growth in 2012 of 18%, its highest expansion since 2007.
Fig. 90: 9M11 vs 9M10
Source: Company data
Fig. 91: Given earnings are now back to old historical levels
Source: Nomura, company data
The company is moving to cultivate more business relationships and expanding its clientele base with international majors like Kimberly Clark, which previously had not been given focus before due to an inclination to avoid having too large exposure to a single customer during previous years when Top Glove was a much smaller size. Any upside to output could provide some upside support to the share price, but until that happens, we think in light of current macro conditions as well as the recent market contraction, we do not think valuations should continue to trade at a premium to the market.
Factory LocationNo. of additional
lines Capacity p.aTarget completion
(announced in 1Q11)Target completion
(announced in 2Q11)Target completion
(announced in 3Q11)
Target completion (per Sept 13 management
visit)
Factory 21 Klang, Malaysia 16 1.5 billion pcs Mar-11 Apr-11 Operational in May 2011 Operational in May 2011
Factory 7 Sadao, Thailand 16 1.5 billion pcs Apr-11 Aug-11 Aug-11 Nov-11
Factory 22 Klang, Malaysia 16 1.5 billion pcs Jun-11 Aug-11 Oct-11 Dec-11
Factory 23 Ipoh, Malaysia 32 3.3 billion pcs Aug-11 Aug-11Phase 1 in Aug 2011,
Phase 2 in March 2011Phase 1 in Nov 2011, Phase
2 in May 2012
Total 80 7.7 billion pcs
2.02.22.42.62.83.03.23.43.63.84.0
0
10
20
30
40
50
60
70
80
No
v-03
…
May
-04
No
v-04
…
May
-05
No
v-05
…
May
-06
No
v-06
…
May
-07
No
v-07
…
May
-08
No
v-08
…
May
-09
No
v-09
…
May
-10
No
v-10
Ma y
-11
Net profit (LHS)
Qtrly average (RHS)
(MYR mn) (MYR/USD)

Nomura | Top Glove Corp September 27, 2011
64
China continues to remain on the radar of most glovemakers, given growth rates in the minor consumables market of c. 17-18% for the next five years is forecasted to exceed overall market growth. Top Glove is the first Malaysian glovemaker under our coverage to venture into China, and has two factories there manufacturing mostly vinyl gloves. Profitability continues to fluctuate given most Chinese manufacturers are in vinyl gloves (high competition), however we think the years of experience in China accords it some degree of familiarity in the market and positions it to benefit should a shift in demand to natural rubber gloves occur (where Chinese manufacturers do not have the advantage).
Fig. 92: China : Operating profit trend
Source: Company data
Fig. 93: China : Growth rate of minor consumables like gloves are expected to grow above other markets
Source: Espicom
Fig. 94: China : Minor consumables expenditure per capita
Source: Espicom
Despite the long-term demand from China angle, we move our call from Neutral to REDUCE in the near term on the back of continued weak visibility despite some relief in cost pressures contributing to a rebound in earnings in 2012F, also as fundamentals do not justify the valuations currently, in our view, with Top Glove trading at a premium to the Malaysian market on the back of a recent decline in the market multiple. We have reduced our FY12F earnings-based target price to RM3.42 from RM5.00 on the back a cut in earnings arising from the delayed expansions at a utilization rate of 65% (below the company’s current 70%) and pegging our revised FY12F EPS to a new target multiple of 12x versus the previous assumption of 15.4x, its average historical P/E multiple.
(10,000)
(8,000)
(6,000)
(4,000)
(2,000)
0
2,000
4,000
6,000
8,000
10,000
12,000
2005 2006 2007 2008 2009 2010 3Q11
(MYR'000)
5
7
9
11
13
15
17
19
21
2009 2010 2011F 2012F 2013F 2014F 2015F
Growth rate (%) of consumables (gloves, appliances, reagents)
(%)
0123456789
Ger
man
y
Jap
an
US
A
Th
aila
nd
Ch
ina
Ind
ia
Ind
ones
ia
(USD per capita)

Nomura | Top Glove Corp September 27, 2011
65
Fig. 95: We do not think trading at a premium to the market is justified
Source: Bloomberg, Nomura
Fig. 96: Change in assumptions
Source: Bloomberg, Nomura estimates
Fig. 97: Top Glove – P/E Band
Source: Bloomberg, Nomura ^y-axis denotes share price in RM
Fig. 98: Top Glove – P/E Chart
Source: Bloomberg, Nomura ^y-axis denotes P/E multiple
Valuation Methodology and Risks We peg our FY12F diluted EPS of RM0.28 at a 12x target multiple, below the stock’s seven-year average of 15.6x owing to current macro conditions, to arrive at our target price of RM3.42. Upside risks include: 1) a sharp easing of latex prices; 2) an appreciable demand rebound from FY12F, and; 3) Top Glove making a value-enhancing acquisition.
0
5
10
15
20
25
30
35
Jan
-06
Ap
r-06
Jul-
06O
ct-0
6Ja
n-0
7A
pr-
07Ju
l-07
Oct
-07
Jan
-08
Ap
r-08
Jul-
08O
ct-0
8Ja
n-0
9A
pr-
09Ju
l-09
Oct
-09
Jan
-10
Ap
r-10
Jul-
10O
ct-1
0Ja
n-1
1A
pr-
11Ju
l-11
Malaysia market 1 year forward PE
TOPG 1 year forward PE
(x)FY11F FY12F FY11F FY12F
Latex price (MYR/ kg) 9.5 8.5 9.0 8.0
MYR/ USD 2.9 2.77 3.3 3.3
Revenue growth (%) 8.8 9.3 10.2 9.1
Earnings growth (%) (53.1) 56.3 (17.7) 11.1
EBITDA margin (%) 8.9 11.8 13.7 14.0
Net margin (%) 5.1 7.3 8.8 9.0
New assumptions Old assumptions
0
2
4
6
8
10
Oct
-05
Mar
-06
Aug
-06
Jan
-07
Jun
-07
No
v-07
Ap
r-08
Sep
-08
Feb
-09
Jul-
09
Dec
-09
May
-10
Oct
-10
Mar
-11
Aug
-11
25x
20x
(Price)
15x
10x
5x
0
10
20
30
40
Oct
-05
Mar
-06
Aug
-06
Jan
-07
Jun
-07
No
v-07
Ap
r-08
Sep
-08
Feb
-09
Jul-
09
Dec
-09
May
-10
Oct
-10
Mar
-11
Aug
-11
TOPG 1 year forward P/EAverage=15.4+1SD=21.4-1SD=9.4
(x)

Nomura | Asia Glovemakers September 27, 2011
Scenario analysis: What if the US and Europe slip back into recession? As the markets have been signaling that risks to our baseline forecasts are on the downside, our global economics team have considered a bear case economic scenario.
This is most obviously triggered by a market meltdown, but the fragile state of the advanced economies leaves them vulnerable to unforeseen shocks or policy errors. For details, see Global Weekly Economic Monitor, 12 August 2011, and Global market turbulence: Implications for Asia, 9 August 2011. The bear case scenario assumes:
• The US and Euro area slip back into recession, with US GDP averaging -1% saar in 2H11 and Euro GDP averaging -3% before recovering to around 2% growth in 2012.
• The CRB commodity price index falls 15% between now and year-end, but starts rising back again through 2012 reaching current levels by end-2012.
If there is a market meltdown and recessions in the US and Euro area, we have no doubt that initially many economies in the region would be hit hard again in an echo of the global financial crisis, as non-linear effects start to kick in, notably financial decelerator effects, multiplier effects of weakening exports on domestic capex and jobs, and capital flight. However, less disturbing this time around are the two factors that there is less leverage in the financial system (less room for capital flight) and less chance of Asian trade finance drying up, as the world’s central banks have most likely learnt the need to provide ample USD liquidity through FX swap arrangements.
In this scenario, we find Hong Kong, Singapore, Malaysia and Taiwan to be among the most vulnerable. But, as in 2009, we would expect that, over time, powerful tailwinds would develop, allowing Asia to bounce back before other regions. These tailwinds include a likely further decline in commodity prices and the ample room Asia has to ease monetary and fiscal policies – more so than any other region. In our bear case scenario, we would expect the Fed to resort to further quantitative easing, which once again would likely precipitate strong net capital inflows into Asia, attracted by stronger growth, superior fundamentals and higher interest rates relative to other regions.
What if things get even worse than we can foresee? Although our global economics team does not see such a situation as plausible at the moment, they have run an extreme-case scenario analysis to provide some perspective. This extreme scenario assumes:
• US GDP averaging about -4% saar in 2H11 and Euro GDP averaging -6.5% before recovering to around 1% growth in 2012.
• CRB commodity price index falls 40% between now and year-end, and stays at the lower level through 2012.
Fig. 99: Real GDP growth forecasts: baseline and downside scenarios
Source: CEIC and Nomura Global Economics. Units: % y-y
Base Bear Extreme Base Bear Extremecase case case case case case
Australia 2.2 1.5 0.9 4.6 3.5 3.3
China 9.5 9.0 8.5 8.6 8.8 6.0Hong Kong 5.4 4.4 3.4 4.5 4.0 1.2India 7.7 7.0 6.5 7.9 7.6 7.0Indonesia 6.5 6.0 4.8 7.0 6.8 4.0Malaysia 4.7 4.0 1.0 5.1 4.8 (0.4)New Zealand 2.2 1.8 1.4 3.5 3.5 3.3Philippines 5.1 4.7 3.3 5.7 5.3 2.4Singapore 5.6 4.3 1.5 5.3 5.1 (1.8)South Korea 3.5 2.5 1.5 5.0 5.0 2.5Taiwan 4.5 3.6 2.4 5.0 4.9 0.9Thailand 4.1 3.5 0.6 4.7 4.5 (0.5)Vietnam 6.4 6.0 4.5 6.9 6.5 4.2Asia ex Japan, Aus, NZ 7.9 7.2 6.4 7.6 7.6 5.1
2011F 2012F
The global bear case does not look bad for much of Asia and in fact is marginally better than the base case for China in 2012 because we would expect a V-shape rebound for the region thanks to the likely decline in commodity prices and the ample room Asia has to ease monetary and fiscal policies. We would also expect the Fed to resort to further quantitative easing, which once again would likely precipitate strong net capital inflows into Asia. In the extreme case, however, even these strengths will be tested.
Less disturbing this time around are the two factors that there is less leverage in the financial system
66

Nomura | Asia Glovemakers September 27, 2011
What does this mean for Ansell?
Over the six months from November 2008 to April 2009, Ansell’s share price fell by 40.5%, in anticipation of softening industrial demand. ANN’s key exposure to the global economic crisis was through softening demand for its industrial gloves, which are sold to a wide range of manufacturing industries across over 100 countries. During this time ANN’s industrial division, which is forecast to contribute approximately half of ANN’s FY12F EBIT, experienced a period of inventory de-stocking. Interestingly the financial impact to ANN’s earnings only really emerged in the second half of the 2009 financial accounts, and was not evident in FY10. We believe the stimulus packages of various governments around the world had a positive impact in FY10.
Fig. 100: ANN price vs EPS during GFC
Source: Nomura estimates, FactSet share price data
We have conducted a scenario analysis to assess the possible impact on Ansell’s earnings and target price in the bear and extreme cases, all other things being constant. Given that ANN’s earnings are geographically dispersed, we have focussed on the sales volume growth in the industrials division. In order to do this, we have assumed the industrials volume growth falls to FY08 levels in the bear case and FY09 levels in the extreme case. The earnings and target price sensitivity is shown in the figure below.
Fig. : Earnings and target price sensitivity for Ansell
Note: Base case represents our current forecasts and TP
Source: Nomura estimates
What does this mean for the Malaysian glovemakers – Top Glove, Supermax, Kossan?
The 2-year 2008-09 period happened to coincide with a sharp rise in latex prices to hit a historical peak (back then) of MYR7.20/kg (c5% above its past peak in 2006 of MYR6.85/kg) in 1H08, followed by a quick and steep fall back down to levels of MYR3+/kg in a span of a few months and stayed under MYR4/kg for most of 2009, as the global financial crisis took firm hold. Customers took opportunity to stock up on cheaper glove inventories arising from cheaper costs, given also zero to minimal capacity expansions as the glovemakers’ held back capex plans during that period, most glove players experienced growing NPATs during the recession.
For the next 12 months, we think given what appears to be an easing (so far) of latex prices on the back of a commodities’ correction, the driver that could have the most possible impact on EPS will likely be the demand topline impact. With capacity expansions of c15% still on track for FY12F versus single digit output growth currently, we run scenario analyses to illustrate a bear case scenario where output growth is zero
0.60
0.70
0.80
0.90
1.00
1.10
4
6
8
10
12
14
16
Jul-06 Jan-07 Jul-07 Jan-08 Jul-08 Jan-09 Jul-09 Jan-10 Jul-10 Jan-11 Jul-11
Price (A$) EPS (A$)
Base case Bear case Downside (%)
Extreme case
Downside (%)
2012F EPS (US cps) 109.4 103.5 (5.4) 95.4 (12.8)2013F EPS (US cps) 125.8 118.8 (5.6) 109.1 (13.3)12-m target price $15.25 $14.47 (5.1) $13.40 (12.1)
The financial impact to ANN’s earnings only really emerged in the second half of the 2009 financial accounts, and was not evident in FY10
67
101

Nomura | Asia Glovemakers September 27, 2011
(ie revenue growth flat), and an extreme case where volumes are down 10% - as shown below (revenue down 10%).
Fig. 102: Earnings and target price sensitivity for Top Glove
Note: Base case represents our current forecasts and TP. TP base d on 2012F EPS given only 2 quarters left to end 2011
Source: Nomura estimates
Fig. 103: Earnings and target price sensitivity for Supermax
Note: Base case represents our current forecasts and TP. TP base d on 2012F EPS given only 2 quarters left to end 2011
Source: Nomura estimates
Fig. : Earnings and target price sensitivity for Kossan Rubber
Note: Base case represents our current forecasts and TP. TP base d on 2012F EPS given only 2 quarters left to end 2011
Source: Nomura estimates
(Currency) Base case Bear case Downside % Extreme case Downside %2012F EPS (RM cts / shr) 28.46 26.16 (8) 23.55 (17)2013F EPS (RM cts / shr) 31.56 30.97 (2) 27.87 (12)12-m target price 3.42 3.14 (8) 2.83 (17)
(Currency) Base case Bear case Downside % Extreme case Downside %2012F EPS (RM cts / shr) 44.44 42.24 (5) 38.01 (14)2013F EPS (RM cts / shr) 50.80 46.49 (8) 41.84 (18)12-m target price 2.88 2.75 (5) 2.47 (14)
(Currency) Base case Bear case Downside % Extreme case Downside %2012F EPS (RM cts / shr) 38.65 34.10 (12) 30.69 (21)2013F EPS (RM cts / shr) 39.51 38.83 (2) 34.95 (12)12-m target price 2.51 2.22 (12) 1.99 (21)
68
104

Nomura | Asia Glovemakers September 27, 2011
69

Nomura | Asia Glovemakers September 27, 2011
70

Nomura | Asia Glovemakers September 27, 2011
Appendix A-1
Analyst Certification
We, Zara Lyons, David Stanton and Jacinda Ee Wenn Loh, hereby certify (1) that the views expressed in this Research report accurately reflect our personal views about any or all of the subject securities or issuers referred to in this Research report, (2) no part of our compensation was, is or will be directly or indirectly related to the specific recommendations or views expressed in this Research report and (3) no part of our compensation is tied to any specific investment banking transactions performed by Nomura Securities International, Inc., Nomura International plc or any other Nomura Group company.
Issuer Specific Regulatory Disclosures Mentioned companies Issuer name Ticker Price Price date Stock rating Sector rating Disclosures Ansell ANN AU AUD 12.99 26-Sep-2011 Buy Not rated Kossan Rubber Industries KRI MK MYR 2.56 26-Sep-2011 Neutral Not rated Supermax Corp Bhd SUCB MK MYR 2.36 26-Sep-2011 Buy Not rated Top Glove Corp TOPG MK MYR 4.01 26-Sep-2011 Reduce Not rated
Previous Rating Issuer name Previous Rating Date of change Ansell Neutral 27-Sep-2011 Kossan Rubber Industries Buy 27-Sep-2011 Supermax Corp Bhd Not Rated 10-Mar-2010 Top Glove Corp Neutral 27-Sep-2011
Rating and target price changes
Ticker Old stock rating New stock rating Old target price New target price
Ansell ANN AU Neutral Buy AUD 14.46 AUD 15.25
Kossan Rubber Industries KRI MK Buy Neutral MYR 4.76 MYR 2.51
Supermax Corp Bhd SUCB MK Buy Buy MYR 7.00 MYR 2.88
Top Glove Corp TOPG MK Neutral Reduce MYR 5.00 MYR 3.42
Ansell (ANN AU) AUD 12.99 (26-Sep-2011) Rating and target price chart (three year history)
Buy (Sector rating: Not rated)
Date Rating Target price Closing price 15-Aug-2011 14.46 13.68 04-Jul-2011 14.19 14.01 05-Apr-2011 14.67 13.93 05-Apr-2011 Neutral 13.93
For explanation of ratings refer to the stock rating keys located after chart(s)
Valuation Methodology We use a blend of three valuation methodologies to derive our AUD15.25 valuation for ANN: discounted cashflow analysis (DCF), a capitalisation of EV/EBITDA (10.7x FY12F) and normalised P/E multiples (14.9x FY12F). We believe this approach is appropriate for ANN because it has a number of listed competitors. As a result, each division’s
71

Nomura | Asia Glovemakers September 27, 2011
relative value in the market can be readily ascertained. We use a P/E valuation, as it is a market standard, and an EV/EBITDA valuation metric, as this is frequently used in the global healthcare sector. Risks that may impede the achievement of the target price Upside risks include higher-than-expected volume growth driven by emerging markets and an increase in industrial production activity; an announcement of an earnings-accretive acquisition. Downside risks include pressure on costs from rising prices of raw material inputs and a slowdown in the global economic recovery.
Kossan Rubber Industries (KRI MK) MYR 2.56 (26-Sep-2011) Rating and target price chart (three year history)
Neutral (Sector rating: Not rated)
Date Rating Target price Closing price 12-Mar-2010 4.76 3.74 10-Mar-2010 9.51 3.80 10-Mar-2010 Buy 3.80
For explanation of ratings refer to the stock rating keys located after chart(s)
Valuation Methodology We peg Kossan’s target price to a 6.5x FY12F P/E multiple. Applied to our FY11F EPS of RM0.39, we arrive at our target price of RM2.51. Risks that may impede the achievement of the target price Potential downside to our view includes delays / hiccups to the new product launch, which could affect Kossan’s strategy to gain market share from other nitrile players and the higher-end segment.Upside risks include sharp easing of latex prices and appreciable demand rebound from FY12E.
Supermax Corp Bhd (SUCB MK) MYR 2.36 (26-Sep-2011) Rating and target price chart (three year history)
Buy (Sector rating: Not rated)
Date Rating Target price Closing price 12-Mar-2010 7.00 4.59 10-Mar-2010 8.74 4.84 10-Mar-2010 Buy 4.84
For explanation of ratings refer to the stock rating keys located after chart(s)
Valuation Methodology We peg Supermax’s target P/E at 6.5x following market-multiple compressions. Post-APLI, P/E valuations have ranged from 6x to 16x. Applying this to FY12F EPS of RM0.44, we derive our target price of RM2.88.
72

Nomura | Asia Glovemakers September 27, 2011
Risks that may impede the achievement of the target price Downside risks to our target price include industry-related factors similar to those facing Top Glove, as well as adverse and rapid currency movements that could affect income from the company's overseas distribution arms.
Top Glove Corp (TOPG MK) MYR 4.01 (26-Sep-2011) Rating and target price chart (three year history)
Reduce (Sector rating: Not rated)
Date Rating Target price Closing price 09-Mar-2011 5.00 4.89 13-Dec-2010 5.80 5.56 13-Dec-2010 Neutral 5.56 06-Oct-2010 6.82 5.69 27-Apr-2010 7.71 6.48 26-Apr-2010 15.42 6.49 10-Mar-2010 15.16 6.07 10-Mar-2010 Buy 6.07
For explanation of ratings refer to the stock rating keys located after chart(s)
Valuation Methodology We peg our FY12F diluted EPS of RM0.28 at 12x target multiple, below the stock’s seven-year average of 15.6x owing to the current macro conditions, to arrive at the target price of RM3.42. Risks that may impede the achievement of the target price Upside risks: 1) sharp easing of latex prices; 2) appreciable demand rebound from FY12F, and; 3) Top Glove making a value-enhancing acquisition.
73

Nomura | Asia Glovemakers September 27, 2011
Important Disclosures Online availability of research and additional conflict-of-interest disclosures Nomura Japanese Equity Research is available electronically for clients in the US on NOMURA.COM, REUTERS, BLOOMBERG and THOMSON ONE ANALYTICS. For clients in Europe, Japan and elsewhere in Asia it is available on NOMURA.COM, REUTERS and BLOOMBERG. Important disclosures may be accessed through the left hand side of the Nomura Disclosure web page http://go.nomuranow.com/research/globalresearchportal or requested from Nomura Securities International, Inc., on 1-877-865-5752. If you have any difficulties with the website, please email [email protected] for technical assistance. The analysts responsible for preparing this report have received compensation based upon various factors including the firm's total revenues, a portion of which is generated by Investment Banking activities. Unless otherwise noted, the non-US analysts listed at the front of this report are not registered/qualified as research analysts under FINRA/NYSE rules, may not be associated persons of NSI, and may not be subject to FINRA Rule 2711 and NYSE Rule 472 restrictions on communications with covered companies, public appearances, and trading securities held by a research analyst account. Industry Specialists identified in some Nomura International plc research reports are employees within the Firm who are responsible for the sales and trading effort in the sector for which they have coverage. Industry Specialists do not contribute in any manner to the content of research reports in which their names appear. Marketing Analysts identified in some Nomura research reports are research analysts employed by Nomura International plc who are primarily responsible for marketing Nomura’s Equity Research product in the sector for which they have coverage. Marketing Analysts may also contribute to research reports in which their names appear and publish research on their sector. Distribution of ratings (US) The distribution of all ratings published by Nomura US Equity Research is as follows: 40% have been assigned a Buy rating which, for purposes of mandatory disclosures, are classified as a Buy rating; 10% of companies with this rating are investment banking clients of the Nomura Group*. 53% have been assigned a Neutral rating which, for purposes of mandatory disclosures, is classified as a Hold rating; 3% of companies with this rating are investment banking clients of the Nomura Group*. 7% have been assigned a Reduce rating which, for purposes of mandatory disclosures, are classified as a Sell rating; 0% of companies with this rating are investment banking clients of the Nomura Group*. As at 30 June 2011. *The Nomura Group as defined in the Disclaimer section at the end of this report. Distribution of ratings (Global) The distribution of all ratings published by Nomura Global Equity Research is as follows: 49% have been assigned a Buy rating which, for purposes of mandatory disclosures, are classified as a Buy rating; 41% of companies with this rating are investment banking clients of the Nomura Group*. 40% have been assigned a Neutral rating which, for purposes of mandatory disclosures, is classified as a Hold rating; 46% of companies with this rating are investment banking clients of the Nomura Group*. 11% have been assigned a Reduce rating which, for purposes of mandatory disclosures, are classified as a Sell rating; 14% of companies with this rating are investment banking clients of the Nomura Group*. As at 30 June 2011. *The Nomura Group as defined in the Disclaimer section at the end of this report. Explanation of Nomura's equity research rating system in Europe, Middle East and Africa, US and Latin America for ratings published from 27 October 2008 The rating system is a relative system indicating expected performance against a specific benchmark identified for each individual stock. Analysts may also indicate absolute upside to target price defined as (fair value - current price)/current price, subject to limited management discretion. In most cases, the fair value will equal the analyst's assessment of the current intrinsic fair value of the stock using an appropriate valuation methodology such as discounted cash flow or multiple analysis, etc. STOCKS A rating of 'Buy', indicates that the analyst expects the stock to outperform the Benchmark over the next 12 months. A rating of 'Neutral', indicates that the analyst expects the stock to perform in line with the Benchmark over the next 12 months. A rating of 'Reduce', indicates that the analyst expects the stock to underperform the Benchmark over the next 12 months. A rating of 'Suspended', indicates that the rating, target price and estimates have been suspended temporarily to comply with applicable regulations and/or firm policies in certain circumstances including, but not limited to, when Nomura is acting in an advisory capacity in a merger or strategic transaction involving the company. Benchmarks are as follows: United States/Europe: Please see valuation methodologies for explanations of relevant benchmarks for stocks (accessible through the left hand side of the Nomura Disclosure web page: http://go.nomuranow.com/research/globalresearchportal);Global Emerging Markets (ex-Asia): MSCI Emerging Markets ex-Asia, unless otherwise stated in the valuation methodology. SECTORS A 'Bullish' stance, indicates that the analyst expects the sector to outperform the Benchmark during the next 12 months. A 'Neutral' stance, indicates that the analyst expects the sector to perform in line with the Benchmark during the next 12 months. A 'Bearish' stance, indicates that the analyst expects the sector to underperform the Benchmark during the next 12 months. Benchmarks are as follows: United States: S&P 500; Europe: Dow Jones STOXX 600; Global Emerging Markets (ex-Asia): MSCI Emerging Markets ex-Asia. Explanation of Nomura's equity research rating system for Asian companies under coverage ex Japan published from 30 October 2008 and in Japan from 6 January 2009 STOCKS
74

Nomura | Asia Glovemakers September 27, 2011
Stock recommendations are based on absolute valuation upside (downside), which is defined as (Target Price - Current Price) / Current Price, subject to limited management discretion. In most cases, the Target Price will equal the analyst's 12-month intrinsic valuation of the stock, based on an appropriate valuation methodology such as discounted cash flow, multiple analysis, etc. A 'Buy' recommendation indicates that potential upside is 15% or more. A 'Neutral' recommendation indicates that potential upside is less than 15% or downside is less than 5%. A 'Reduce' recommendation indicates that potential downside is 5% or more. A rating of 'Suspended' indicates that the rating and target price have been suspended temporarily to comply with applicable regulations and/or firm policies in certain circumstances including when Nomura is acting in an advisory capacity in a merger or strategic transaction involving the subject company. Securities and/or companies that are labelled as 'Not rated' or shown as 'No rating' are not in regular research coverage of the Nomura entity identified in the top banner. Investors should not expect continuing or additional information from Nomura relating to such securities and/or companies. SECTORS A 'Bullish' rating means most stocks in the sector have (or the weighted average recommendation of the stocks under coverage is) a positive absolute recommendation. A 'Neutral' rating means most stocks in the sector have (or the weighted average recommendation of the stocks under coverage is) a neutral absolute recommendation. A 'Bearish' rating means most stocks in the sector have (or the weighted average recommendation of the stocks under coverage is) a negative absolute recommendation. Explanation of Nomura's equity research rating system in Japan published prior to 6 January 2009 (and ratings in Europe, Middle East and Africa, US and Latin America published prior to 27 October 2008) STOCKS A rating of '1' or 'Strong buy', indicates that the analyst expects the stock to outperform the Benchmark by 15% or more over the next six months. A rating of '2' or 'Buy', indicates that the analyst expects the stock to outperform the Benchmark by 5% or more but less than 15% over the next six months. A rating of '3' or 'Neutral', indicates that the analyst expects the stock to either outperform or underperform the Benchmark by less than 5% over the next six months. A rating of '4' or 'Reduce', indicates that the analyst expects the stock to underperform the Benchmark by 5% or more but less than 15% over the next six months. A rating of '5' or 'Sell', indicates that the analyst expects the stock to underperform the Benchmark by 15% or more over the next six months. Stocks labeled 'Not rated' or shown as 'No rating' are not in Nomura's regular research coverage. Nomura might not publish additional research reports concerning this company, and it undertakes no obligation to update the analysis, estimates, projections, conclusions or other information contained herein. SECTORS A 'Bullish' stance, indicates that the analyst expects the sector to outperform the Benchmark during the next six months. A 'Neutral' stance, indicates that the analyst expects the sector to perform in line with the Benchmark during the next six months. A 'Bearish' stance, indicates that the analyst expects the sector to underperform the Benchmark during the next six months. Benchmarks are as follows: Japan: TOPIX; United States: S&P 500, MSCI World Technology Hardware & Equipment; Europe, by sector - Hardware/Semiconductors: FTSE W Europe IT Hardware; Telecoms: FTSE W Europe Business Services; Business Services: FTSE W Europe; Auto & Components: FTSE W Europe Auto & Parts; Communications equipment: FTSE W Europe IT Hardware; Ecology Focus: Bloomberg World Energy Alternate Sources; Global Emerging Markets: MSCI Emerging Markets ex-Asia. Explanation of Nomura's equity research rating system for Asian companies under coverage ex Japan published prior to 30 October 2008 STOCKS Stock recommendations are based on absolute valuation upside (downside), which is defined as (Fair Value - Current Price)/Current Price, subject to limited management discretion. In most cases, the Fair Value will equal the analyst's assessment of the current intrinsic fair value of the stock using an appropriate valuation methodology such as Discounted Cash Flow or Multiple analysis etc. However, if the analyst doesn't think the market will revalue the stock over the specified time horizon due to a lack of events or catalysts, then the fair value may differ from the intrinsic fair value. In most cases, therefore, our recommendation is an assessment of the difference between current market price and our estimate of current intrinsic fair value. Recommendations are set with a 6-12 month horizon unless specified otherwise. Accordingly, within this horizon, price volatility may cause the actual upside or downside based on the prevailing market price to differ from the upside or downside implied by the recommendation. A 'Strong buy' recommendation indicates that upside is more than 20%. A 'Buy' recommendation indicates that upside is between 10% and 20%. A 'Neutral' recommendation indicates that upside or downside is less than 10%. A 'Reduce' recommendation indicates that downside is between 10% and 20%. A 'Sell' recommendation indicates that downside is more than 20%. SECTORS A 'Bullish' rating means most stocks in the sector have (or the weighted average recommendation of the stocks under coverage is) a positive absolute recommendation. A 'Neutral' rating means most stocks in the sector have (or the weighted average recommendation of the stocks under coverage is) a neutral absolute recommendation. A 'Bearish' rating means most stocks in the sector have (or the weighted average recommendation of the stocks under coverage is) a negative absolute recommendation. Target Price A Target Price, if discussed, reflect in part the analyst's estimates for the company's earnings. The achievement of any target price may be impeded by general market and macroeconomic trends, and by other risks related to the company or the market, and may not occur if the company's earnings differ from estimates.
75

Nomura | Asia Glovemakers September 27, 2011
Disclaimers This publication contains material that has been prepared by the Nomura entity identified at the top or bottom of page 1 herein, if any, and/or, with the sole or joint contributions of one or more Nomura entities whose employees and their respective affiliations are specified on page 1 herein or elsewhere identified in the publication. Affiliates and subsidiaries of Nomura Holdings, Inc. (collectively, the 'Nomura Group'), include: Nomura Securities Co., Ltd. ('NSC') Tokyo, Japan; Nomura International plc ('NIplc'), United Kingdom; Nomura Securities International, Inc. ('NSI'), New York, NY; Nomura International (Hong Kong) Ltd. (‘NIHK’), Hong Kong; Nomura Financial Investment (Korea) Co., Ltd. (‘NFIK’), Korea (Information on Nomura analysts registered with the Korea Financial Investment Association ('KOFIA') can be found on the KOFIA Intranet at http://dis.kofia.or.kr ); Nomura Singapore Ltd. (‘NSL’), Singapore (Registration number 197201440E, regulated by the Monetary Authority of Singapore); Capital Nomura Securities Public Company Limited (‘CNS’), Thailand; Nomura Australia Ltd. (‘NAL’), Australia (ABN 48 003 032 513), regulated by the Australian Securities and Investment Commission ('ASIC') and holder of an Australian financial services licence number 246412; P.T. Nomura Indonesia (‘PTNI’), Indonesia; Nomura Securities Malaysia Sdn. Bhd. (‘NSM’), Malaysia; Nomura International (Hong Kong) Ltd., Taipei Branch (‘NITB’), Taiwan; Nomura Financial Advisory and Securities (India) Private Limited (‘NFASL’), Mumbai, India (Registered Address: Ceejay House, Level 11, Plot F, Shivsagar Estate, Dr. Annie Besant Road, Worli, Mumbai- 400 018, India; SEBI Registration No: BSE INB011299030, NSE INB231299034, INF231299034, INE 231299034); Banque Nomura France (‘BNF’); NIplc, Dubai Branch (‘NIplc, Dubai’); NIplc, Madrid Branch (‘NIplc, Madrid’) and OOO Nomura, Moscow (‘OOO Nomura’). THIS MATERIAL IS: (I) FOR YOUR PRIVATE INFORMATION, AND WE ARE NOT SOLICITING ANY ACTION BASED UPON IT; (II) NOT TO BE CONSTRUED AS AN OFFER TO SELL OR A SOLICITATION OF AN OFFER TO BUY ANY SECURITY IN ANY JURISDICTION WHERE SUCH OFFER OR SOLICITATION WOULD BE ILLEGAL; AND (III) BASED UPON INFORMATION THAT WE CONSIDER RELIABLE. NOMURA GROUP DOES NOT WARRANT OR REPRESENT THAT THE PUBLICATION IS ACCURATE, COMPLETE, RELIABLE, FIT FOR ANY PARTICULAR PURPOSE OR MERCHANTABLE AND DOES NOT ACCEPT LIABILITY FOR ANY ACT (OR DECISION NOT TO ACT) RESULTING FROM USE OF THIS PUBLICATION AND RELATED DATA. TO THE MAXIMUM EXTENT PERMISSIBLE ALL WARRANTIES AND OTHER ASSURANCES BY NOMURA GROUP ARE HEREBY EXCLUDED AND NOMURA GROUP SHALL HAVE NO LIABILITY FOR THE USE, MISUSE, OR DISTRIBUTION OF THIS INFORMATION. Opinions expressed are current opinions as of the original publication date appearing on this material only and the information, including the opinions contained herein, are subject to change without notice. Nomura is under no duty to update this publication. If and as applicable, NSI's investment banking relationships, investment banking and non-investment banking compensation and securities ownership (identified in this report as 'Disclosures Required in the United States'), if any, are specified in disclaimers and related disclosures in this report. In addition, other members of the Nomura Group may from time to time perform investment banking or other services (including acting as advisor, manager or lender) for, or solicit investment banking or other business from, companies mentioned herein. Furthermore, the Nomura Group, and/or its officers, directors and employees, including persons, without limitation, involved in the preparation or issuance of this material may, to the extent permitted by applicable law and/or regulation, have long or short positions in, and buy or sell, the securities (including ownership by NSI, referenced above), or derivatives (including options) thereof, of companies mentioned herein, or related securities or derivatives. For financial instruments admitted to trading on an EU regulated market, Nomura Holdings Inc's affiliate or its subsidiary companies may act as market maker or liquidity provider (in accordance with the interpretation of these definitions under FSA rules in the UK) in the financial instruments of the issuer. Where the activity of liquidity provider is carried out in accordance with the definition given to it by specific laws and regulations of other EU jurisdictions, this will be separately disclosed within this report. Furthermore, the Nomura Group may buy and sell certain of the securities of companies mentioned herein, as agent for its clients. Investors should consider this report as only a single factor in making their investment decision and, as such, the report should not be viewed as identifying or suggesting all risks, direct or indirect, that may be associated with any investment decision. Please see the further disclaimers in the disclosure information on companies covered by Nomura analysts available at http://go.nomuranow.com/research/globalresearchportal under the 'Disclosure' tab. Nomura Group produces a number of different types of research product including, among others, fundamental analysis, quantitative analysis and short term trading ideas; recommendations contained in one type of research product may differ from recommendations contained in other types of research product, whether as a result of differing time horizons, methodologies or otherwise; it is possible that individual employees of Nomura may have different perspectives to this publication. NSC and other non-US members of the Nomura Group (i.e. excluding NSI), their officers, directors and employees may, to the extent it relates to non-US issuers and is permitted by applicable law, have acted upon or used this material prior to, or immediately following, its publication. Foreign-currency-denominated securities are subject to fluctuations in exchange rates that could have an adverse effect on the value or price of, or income derived from, the investment. In addition, investors in securities such as ADRs, the values of which are influenced by foreign currencies, effectively assume currency risk. The securities described herein may not have been registered under the US Securities Act of 1933, and, in such case, may not be offered or sold in the United States or to US persons unless they have been registered under such Act, or except in compliance with an exemption from the registration requirements of such Act. Unless governing law permits otherwise, you must contact a Nomura entity in your home jurisdiction if you want to use our services in effecting a transaction in the securities mentioned in this material. This publication has been approved for distribution in the United Kingdom and European Union as investment research by NIplc, which is authorized and regulated by the UK Financial Services Authority ('FSA') and is a member of the London Stock Exchange. It does not constitute a personal recommendation, as defined by the FSA, or take into account the particular investment objectives, financial situations, or needs of individual investors. It is intended only for investors who are 'eligible counterparties' or 'professional clients' as defined by the FSA, and may not, therefore, be redistributed to retail clients as defined by the FSA. This publication may be distributed in Germany via Nomura Bank (Deutschland) GmbH, which is authorized and regulated in Germany by the Federal Financial Supervisory Authority ('BaFin'). This publication has been approved by NIHK, which is regulated by the Hong Kong Securities and Futures Commission, for distribution in Hong Kong by NIHK. This publication has been approved for distribution in Australia by NAL, which is authorized and regulated in Australia by the ASIC. This publication has also been approved for distribution in Malaysia by NSM. In Singapore, this publication has been distributed by NSL. NSL accepts legal responsibility for the content of this publication, where it concerns securities, futures and foreign exchange, issued by their foreign affiliates in respect of recipients who are not accredited, expert or institutional investors as defined by the Securities and Futures Act (Chapter 289). Recipients of this publication should contact NSL in respect of matters arising from, or in connection with, this publication. Unless prohibited by the provisions of Regulation S of the U.S. Securities Act of 1933, this material is distributed in the United States, by NSI, a US-registered broker-dealer, which accepts responsibility for its contents in accordance with the provisions of Rule 15a-6, under the US Securities Exchange Act of 1934. This publication has not been approved for distribution in the Kingdom of Saudi Arabia or to clients other than 'professional clients' in the United Arab Emirates by Nomura Saudi Arabia, NIplc or any other member of the Nomura Group, as the case may be. Neither this publication nor any copy thereof may be taken or transmitted or distributed, directly or indirectly, by any person other than those authorised to do so into the Kingdom of Saudi Arabia or in the United Arab Emirates or to any person located in the Kingdom of Saudi Arabia or to clients other than 'professional clients' in the United Arab Emirates. By accepting to receive this publication, you represent that you are not located in the Kingdom of Saudi Arabia or that you are a 'professional client' in the United Arab Emirates and agree to comply with these restrictions. Any failure to comply with these restrictions may constitute a violation of the laws of the Kingdom of Saudi Arabia or the United Arab Emirates. No part of this material may be (i) copied, photocopied, or duplicated in any form, by any means; or (ii) redistributed without the prior written consent of the Nomura Group member identified in the banner on page 1 of this report. Further information on any of the securities mentioned herein may be obtained upon request. If this publication has been distributed by electronic transmission, such as e-mail, then such transmission cannot be guaranteed to be secure or error-free as information could be intercepted, corrupted, lost, destroyed, arrive late or incomplete, or contain viruses. The sender therefore does not accept liability for any errors or omissions in the contents of this publication, which may arise as a result of electronic transmission. If verification is required, please request a hard-copy version. Additional information available upon request NIPlc and other Nomura Group entities manage conflicts identified through the following: their Chinese Wall, confidentiality and independence policies, maintenance of a Restricted List and a Watch List, personal account dealing rules, policies and procedures for managing conflicts of interest arising from the allocation and pricing of securities and impartial investment research and disclosure to clients via client documentation. Disclosure information is available at the Nomura Disclosure web page: http://go.nomuranow.com/research/globalresearchportal/pages/disclosures/disclosures.aspx
76

Nomura Asian Equity Research Group
Hong Kong Nomura International (Hong Kong) Limited 30/F Two International Finance Centre, 8 Finance Street, Central, Hong Kong Tel: +852 2536 1111 Fax: +852 2536 1820
Singapore
Nomura Singapore Limited 10 Marina Boulevard Marina Bay Financial Centre Tower 2, #36-01, Singapore 018983, Singapore Tel: +65 6433 6288 Fax: +65 6433 6169
Taipei Nomura International (Hong Kong) Limited, Taipei Branch 17th Floor, Walsin Lihwa Xinyi Building, No.1, Songzhi Road, Taipei 11047, Taiwan, R.O.C. Tel: +886 2 2176 9999 Fax: +886 2 2176 9900
Seoul Nomura Financial Investment (Korea) Co., Ltd. 17th floor, Seoul Finance Center, 84 Taepyeongno 1-ga, Jung-gu, Seoul 100-768, Korea Tel: +82 2 3783 2000 Fax: +82 2 3783 2500
Kuala Lumpur Nomura Securities Malaysia Sdn. Bhd. Suite No 16.5, Level 16, Menara IMC, 8 Jalan Sultan Ismail, 50250 Kuala Lumpur, Malaysia Tel: +60 3 2027 6811 Fax: +60 3 2027 6888
India Nomura Financial Advisory and Securities (India) Private Limited Ceejay House, Level 11, Plot F, Shivsagar Estate, Dr. Annie Besant Road, Worli, Mumbai- 400 018, India Tel: +91 22 4037 4037 Fax: +91 22 4037 4111
Indonesia PT Nomura Indonesia Suite 209A, 9th Floor, Sentral Senayan II Building Jl. Asia Afrika No. 8, Gelora Bung Karno, Jakarta 10270, Indonesia Tel: +62 21 2991 3300 Fax: +62 21 2991 3333
Sydney Nomura Australia Ltd. Level 25, Governor Phillip Tower, 1 Farrer Place, Sydney NSW 2000 Tel: +61 2 8062 8000 Fax: +61 2 8062 8362
Tokyo Equity Research Department Financial & Economic Research Center Nomura Securities Co., Ltd. 17/F Urbannet Building, 2-2, Otemachi 2-chome Chiyoda-ku, Tokyo 100-8130, Japan Tel: +81 3 5255 1658 Fax: +81 3 5255 1747, 3272 0869
Caring for the environment: to receive only the electronic versions of our research, please contact your sales representative.