ITOCHU Advance Logistics Investment Corporation
38
0 Sixth Fiscal Period (Ended July 2021) Investor Presentation Material (September 15, 2021) Ticker Symbol: 3493 ITOCHU Advance Logistics Investment Corporation
-
Upload
khangminh22 -
Category
Documents
-
view
1 -
download
0
Transcript of ITOCHU Advance Logistics Investment Corporation

0
Sixth Fiscal Period (Ended July 2021)
Investor Presentation Material(September 15, 2021)
Ticker Symbol: 3493
ITOCHU Advance Logistics Investment Corporation

1
In the 6th fiscal period (ending July 2021), IAL acquired two properties, IMP Tokyo-Adachi and IMP Miyoshi in April from the sponsor group
as previously planned at the public offering implemented in November last year. As a result, IAL’s asset size has expanded to 111.4 billion
yen from the previous 98.1 billion yen. I believe that the success of the deal is largely thanks to the generous support we receive from ourinvestors and stakeholders, for which I am truly grateful.
We have announced our distributions per unit (DPU) of 2,492 yen (up from the latest forecast of 2,464 yen). DPU has increased from the
initial forecast due to the increase in revenue from property acquisitions and internal growth such as reduction of operating expenses of the
Investment Corporation including property management costs and interest expenses. As disclosed, we expect further DPU growth for the
7th fiscal periods (ending January 2022), forecasting 2,724 yen (up from the initial forecast of 2,557 yen) due to the revision of the
distribution policy and other factors. We hope that you will understand that this revision of the distribution policy to increase the total amount
of distribution is a measure to show our stance of aiming to become a REIT that is evaluated by our investors furthermore while maintainingour conservative cash management policy reflecting the steady expansion of our asset size.
In addition to above external growth and revision of the distribution policy, in terms of internal growth we have achieved the longer-term
lease agreements and rent increases with the occupancy rate remaining high at 99.9% (as of September 15th, 2021). We have also worked
for improvement of NOI such as income increase from roof rental for solar panels etc. and initiatives for ESG. Please refer the followingpages of this presentation material for the details.
The logistics real estate market, although in the middle of the fifth wave of the COVID-19 pandemic, has not suffered any significant impact.
Instead, the robust demand for logistics operators is becoming apparent mainly due to the change in consumption structure owing to
consumers’ increase use of online shopping. As of September 15th, 2021, we have not received any incident reports from our tenants
relating to COVID-19 that would have caused damage on their operation, and our business is also going well. However, we will continue
forward with external and internal growth, ESG initiatives, solid cash management. Additionally, in furtherance of our commitment to be the
J-REIT that is valued by our stakeholders, IAL will continue to work hard for reinforcing governance and other management systems with anawareness of its social responsibilities and public missions.
We are fully aware of our mission to meet the expectation of our investors and stakeholders. We will remain committed to makingaggressive moves in order to be the J-REIT of your choice. We respectfully ask for your continued and long-lasting support.
September 15, 2021
Junichi Shoji
Representative Director, President & CEOITOCHU REIT Management Co., Ltd.
President Message

2
Table of Contents
Response to COVID-19 P.3
Highlights P.4
Financial Results P.5
Change of Distribution Policy P.7
Growth Strategies P.10
Portfolio P.23
Market Overview P.25
Appendix P.28

3
Response to COVID-19
IAL portfolio of tenant industry and goods can expect stable Cash Flow despite COVID-19
Tenant Industry and Goods Composition
Tenant
Asset
Management
Company
Preventive measures are taken by tenants such as measuring employees’ body temperature, keeping social
distancing at offices and employees’ lounges, or placing division panels, best for its own workplace management.
Operations are being carried out without any major problems.
・Received approval from the Tokyo Metropolitan Government to practice “Telework Tokyo Rules”.
・Asset management is operated without delay under remote works and sliding commuting hours.
(As of July 31, 2021)
No significant impact of COVID-19 on the tenants and our asset management
Major goods handled by Tenant(based on annual rent)
Breakdown of retailors:
・Discount supermarket
・ITOCHU Group (Casual
Clothing)
Primarily consumer related goods shows stable demands
despite economic environment
Consumer
related goods
96.9%
Sportswear
30.0%
Foods &
Beverages
14.5%
Various
Everyday
Sundries
48.7%
Others
3.1%
Casual
Clothing
3.7%
High Ratio of E-commerce and Major 3PL tenants shows resilience
in recession and stable Cash flow
Retail 5.5%
E-commerce
38.6%3PL
54.0%
Manufacturer 1.8%
Tenant industry
E-commerce
+ major 3PL
77.6%
Major 3PL
39.0%
(based on annual rent)
※ Ratios are rounded to the first decimal place. The same shall apply hereinafter unless otherwise stated.
※ 3PL stands for third party logistics, which is an organization’s use of third party business to outsource elements of its distribution, warehousing ,and fulfillment services.
※ Major 3PLs mean 3PLs with consolidated sales exceeding 100 billion yen including such 3PLs.
※ The calculation of goods are based on hearings from tenants. Accordingly, different types of goods may be handled at some parts of space
4
Highlights
※ Please refer to page 7 and the following pages for the definitions of terms and calculation methods described on this page.
※ IMP is abbreviation for “i Missions Park”, logistic facility developed by ITOCHU Group.
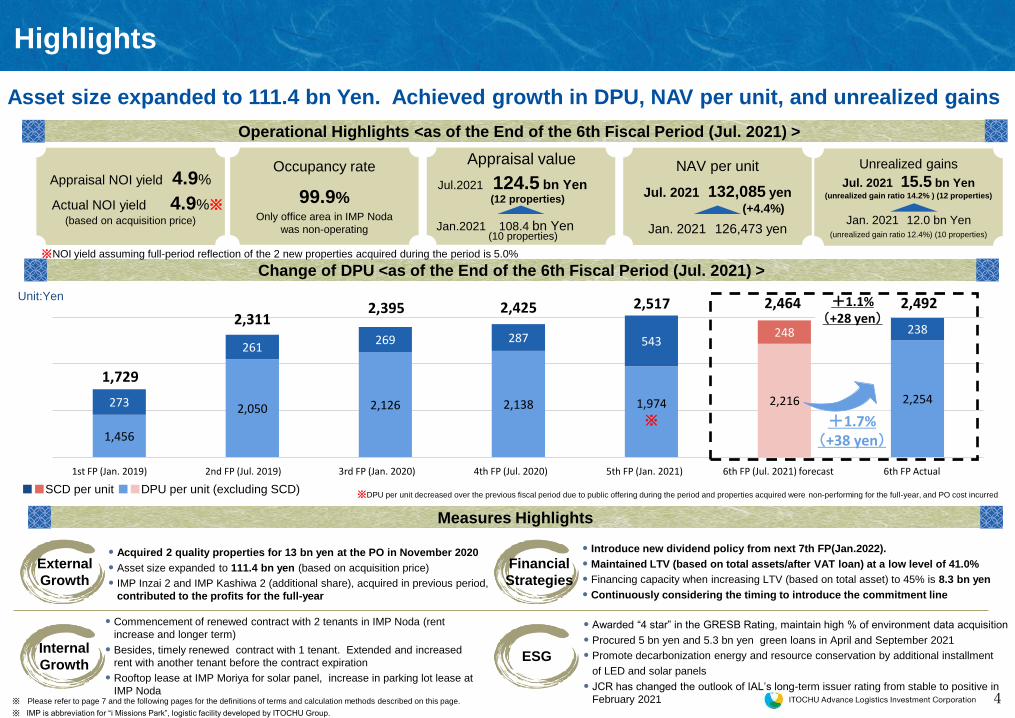
Acquired 2 quality properties for 13 bn yen at the PO in November 2020
Asset size expanded to 111.4 bn yen (based on acquisition price)
IMP Inzai 2 and IMP Kashiwa 2 (additional share), acquired in previous period,
contributed to the profits for the full-year
Introduce new dividend policy from next 7th FP(Jan.2022).
Maintained LTV (based on total assets/after VAT loan) at a low level of 41.0%
Financing capacity when increasing LTV (based on total asset) to 45% is 8.3 bn yen
Continuously considering the timing to introduce the commitment line
Commencement of renewed contract with 2 tenants in IMP Noda (rent
increase and longer term)
Besides, timely renewed contract with 1 tenant. Extended and increased
rent with another tenant before the contract expiration
Rooftop lease at IMP Moriya for solar panel, increase in parking lot lease at
IMP Noda
Awarded “4 star” in the GRESB Rating, maintain high % of environment data acquisition
Procured 5 bn yen and 5.3 bn yen green loans in April and September 2021
Promote decarbonization energy and resource conservation by additional installment
of LED and solar panels
JCR has changed the outlook of IAL’s long-term issuer rating from stable to positive in
February 2021
Operational Highlights <as of the End of the 6th Fiscal Period (Jul. 2021) >
Measures Highlights
Change of DPU <as of the End of the 6th Fiscal Period (Jul. 2021) >
Asset size expanded to 111.4 bn Yen. Achieved growth in DPU, NAV per unit, and unrealized gains
Internal
Growth
External
Growth
Financial
Strategies
ESG
※NOI yield assuming full-period reflection of the 2 new properties acquired during the period is 5.0%
Unrealized gains
Jul. 2021 15.5 bn Yen(unrealized gain ratio 14.2% ) (12 properties)
Jan. 2021 12.0 bn Yen(unrealized gain ratio 12.4%) (10 properties)
NAV per unit
Jul. 2021 132,085 yen
Jan. 2021 126,473 yen
Appraisal NOI yield 4.9%
Actual NOI yield 4.9%(based on acquisition price)
Occupancy rate
99.9%Only office area in IMP Noda
was non-operating
(+4.4%)※
1,456
2,050 2,126 2,138 1,974
※
2,216 2,254273
261 269 287 543
248 238
第1期(2019/1期) 第2期(2019/7期) 第3期(2020/1期) 第4期(2020/7期) 第5期(2021/1期) 第6期(2021/7期)予想 第6期実績
1,729
2,3952,311
2,425 2,517 2,464 2,492
+1.7%(+38 yen)
+1.1%(+28 yen)
1st FP (Jan. 2019) 2nd FP (Jul. 2019) 3rd FP (Jan. 2020) 4th FP (Jul. 2020) 5th FP (Jan. 2021) 6th FP (Jul. 2021) forecast 6th FP Actual
Appraisal value
Jul.2021 124.5 bn Yen (12 properties)
Jan.2021 108.4 bn Yen (10 properties)
■■SCD per unit ■■DPU per unit (excluding SCD)
Unit:Yen
※DPU per unit decreased over the previous fiscal period due to public offering during the period and properties acquired were non-performing for the full-year, and PO cost incurred

5
Financial Results

6
Financial Results of the 6th Fiscal Period (Jul.2021)
※ FFO is calculated by adding depreciation costs for the applicable fiscal period to net income (excluding gain or loss on the s ale of real estate).
AFFO is calculated by deducting capital expenditure from FFO F
FFO (AFFO) payout ratio is calculated by dividing the sum of total distributions and total surplus cash distributions by FFO (AFFO), rounded to the first decimal place. 5th FP ratio exceeds 70% of the guideline due to PO during the FP and additional cost incurred
5th FP(Jan. 2021)
6th FP(Jul. 2021)
ActualForecast
(announced onMar. 17, 2021) (A)
Actual(B)
Difference(B) − (A)
Operating revenues 2,606 3,062 3,059 -2
Operating income 1,323 1,469 1,489 +20
Ordinary income 1,185 1,330 1,353 +23
Net income 1,184 1,329 1,352 +23
DPU(including surplus cash distribution (SCD))
2,517 yen 2,464 yen 2,492 yen +28 yen
DPU (excluding SCD) 1,974 yen 2,216 yen 2,254 yen +38 yen
SCD per unit 543 yen 248 yen 238 yen -10 yen
FFO 1,886 2,111 2,135 +23
FFO payout ratio※1 80.1% 70.0% 70.0% -
Ratio of SCD to depreciation 46.4% 19.0% 18.2% -0.8 pt
FFO per unit 3,144 yen 3,519 yen 3,558 yen +39 yen
AFFO※2 1,886 2,078 2,112 +33
AFFO payout ratio 80.1% 71.2% 70.8% -0.3 pt
AFFO per unit 3,144 yen 3,463 yen 3,519 yen +56 yen
Total number of investment units outstanding
600,127 600,127 600,127 -
【Operating revenues】
Decrease in utility revenues -2
【Operating income】Decrease in utility expenses +3
Decrease in repair expenses +7
Decrease in city planning taxes +4
Increase in asset management fees -6
Decrease in other expenses +12
【Ordinary income】
Decrease in interest expenses +3
Breakdown of Difference
(6th FP forecast vs 6th FP actual)(MN Yen)
6th FP (Jul. 2021) 2,492 yenvs forecast +28 yen ( + 1.1%)
6th FP (Jul. 2021) 3,558 yenvs forecast + 39 yen ( + 1.1%)
DPU FFO per Unit
Achieved increase in Net Income by full-year contribution of the acquisitions in previous FP(Jan.2021) and 2 additional acquisitions in current FP(Jul. 2021)
7
Change of Distribution Policy (1)
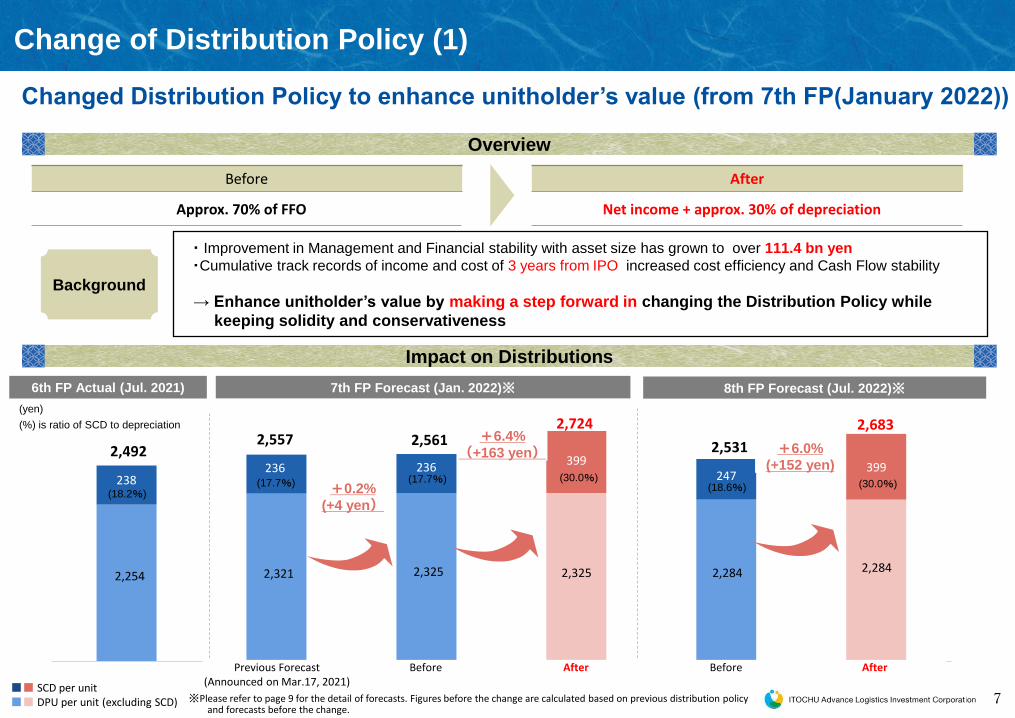
Overview
Impact on Distributions
Before After
Approx. 70% of FFO Net income + approx. 30% of depreciation
Background
・ Improvement in Management and Financial stability with asset size has grown to over 111.4 bn yen
・Cumulative track records of income and cost of 3 years from IPO increased cost efficiency and Cash Flow stability
→ Enhance unitholder’s value by making a step forward in changing the Distribution Policy while
keeping solidity and conservativeness
Changed Distribution Policy to enhance unitholder’s value (from 7th FP(January 2022))
238236 236
399247
399
前回予想
(2021/3/17発表)
変更前 変更後 変更前 変更後
2,325
2,683
2,531
2,7242,561
2,492
2,2842,325 2,2842,254
変更後 変更後
2,557
2,321
+6.0%
(+152 yen)
+6.4%
(+163 yen)
7th FP Forecast (Jan. 2022)※ 8th FP Forecast (Jul. 2022)※6th FP Actual (Jul. 2021)
(yen)
(%) is ratio of SCD to depreciation
(17.7%) (30.0%)(30.0%)(18.6%)
(18.2%)(17.7%)
※Please refer to page 9 for the detail of forecasts. Figures before the change are calculated based on previous distribution policy and forecasts before the change.
Previous Forecast(Announced on Mar.17, 2021)
Before After Before After
■■ SCD per unit ■■ DPU per unit (excluding SCD)
+0.2%
(+4 yen)

8
Change of Distribution Policy (2)
Secure Retained Earnings to keep Financial Stability
Continue conservative Cash Management with Financial Stability
✓Achieve Increase in Surplus Cash Distribution (SCD) while keeping solid Financial position
✓Continue conservative Cash Management operations
✓Aim to increase surplus cash distribution while remaining financial stability
The 1st FP ~ The 6th FP Actual (accumulated) The 7th FP (Jan. 2022) Forecast
Retainedearnings
647
Retainedearnings
549
Totalamount ofdistribution
1,536
Totalamount ofdistribution
1,634
(After)(Before)
FFO
FFO×70%
NetIncome5,595
Depreciation3,378
Retainedearnings
1,194Repayment of
Interest-bearingdebt380
Propertyacquisition
funds868
Totalamount ofdistribution
6,482
The 8th FP (Jul. 2022) Forecast
Depreciation×30% Depreciation
×30%
(After)(Before)
NetIncome1,370
Retainedearnings
632
Retainedearnings
541
Totalamount ofdistribution
1,518
Totalamount ofdistribution
1,610
FFO
FFO×70%
(MN yen)
FFO×74.5% FFO×74.2%
※Figures are rounded down to the nearest unit.
Depreciation×17.7%
Depreciation×18.6%
Depreciation799
NetIncome1,395
Depreciation798
Capital expenditure Capital expenditure Capital expenditure10 10 17 1747

9
Forecasts for the 7th Fiscal Period (Jan. 2022) andthe 8th Fiscal Period (Jul. 2022)
6th fiscal period(Jul. 2021)
7th fiscal period(Jan. 2022)
8th fiscal period(Jul. 2022)
Actual(A)
Forecast(announced on
Mar. 17, 2021) (A)
Forecast(B)
Difference(B-A)
Forecast
Operating revenues 3,059 3,173 3,172 +112 3,171
Operating income 1,489 1,542 1,532 +42 1,509
Ordinary income 1,353 1,393 1,396 +42 1,371
Net income 1,352 1,392 1,395 +42 1,370
DPU(including surplus cash distribution (SCD))
2,492 yen 2,557 yen 2,724 yen +232 2,683 yen
DPU (excluding SCD) 2,254 yen 2,321 yen 2,325 yen +71 2,284 yen
SCD per unit 238 yen 236 yen 399 yen +161 399 yen
FFO 2,135 2,191 2,194 +58 2,169
FFO payout ratio 70.0% 70.0% 74.5% +4.5 pt 74.2%
Ratio of SCD to depreciation 18.2% 17.7% 30.0% +11.7 pt 30.0%
FFO per unit 3,558 yen 3,651 yen 3,657 yen +99 yen 3,615 yen
AFFO※ 2,112 2,151 2,184 +78 2,152
AFFO payout ratio 70.8% 71.3% 74.6% +4.0 pt 74.8%
AFFO per unit 3,519 yen 3,585 yen 3,639 yen +131 yen 3,586 yen
Total number of investment units outstanding
600,127 600,127 600,127 - 600,127
【Operating revenues】
・IMP Miyoshi and IMP Tokyo-Adachi contributes
to full 7th FP・Increased rents of IMP Noda
Increase in rent revenues +110Increase in utility revenues +1
【Operating income】
・IMP Miyoshi and IMP Tokyo adachi contributes
to full 7th FP
Increase in utility expenses -1
Increase in building management
expenses -5
Increase in repair expenses -2
Increase in asset management fees -22Increase in administrative service
fees -2
Increase in depreciation -16
Increase in attorneys’ and accountants
fees -4Increase in other expenses -18
【Ordinary income】Increase in interest expenses -9
Decrease in borrowing
related expenses +9
Breakdown of Difference
(6th FP actual vs 7th FP forecast)
(MN yen)
Maintain Stable Portfolio to increase Net Income

10
Growth Strategies

11
ITOCHU Group’s business platforms
strengthened through IAL
IAL’s growth utilizing the ITOCHU Group’s
business platforms
Basic Strategies – Collaborative Growth Relationships (1) –
ITOCHU Advance Logistics Investment Corporation
Ownership / Management
ITOCHU Corporation/ITOCHU Property Development
Development / LeasingCollaborative
Growth
Relationships
53.8 bn yen7 Properties
IAL’s Portfolio
12 Properties / 111.4 bn yen
Sponsor’s owned/developed properties
7 Properties/ about 248,503m2
Continued growth supported by ITOCHU Group’s business platforms
Focus mainly on acquisition of sponsor pipelines to grow
1st FP
58.8 bn yen8 Properties
58.8 bn yen8 Properties
84.1 bn yen9 Properties
98.1 bn yen10 Properties
111.4 bn yen12 Properties
Aiming for continuous
growthutilizing
sponsor’s pipeline
2nd FP 3rd FP 4th FP 5th FP 6th FP Future
Acquisition during the periodusing borrowings
1st Follow on Offering
2nd Follow on Offering
Build growth spiral based on Collaborative Growth Relationships with ITOCHU Group
By taking advantage of extensive experience of development & acquisition of logistics facilities and wide network of 100,000 clients of sponsor group.
12
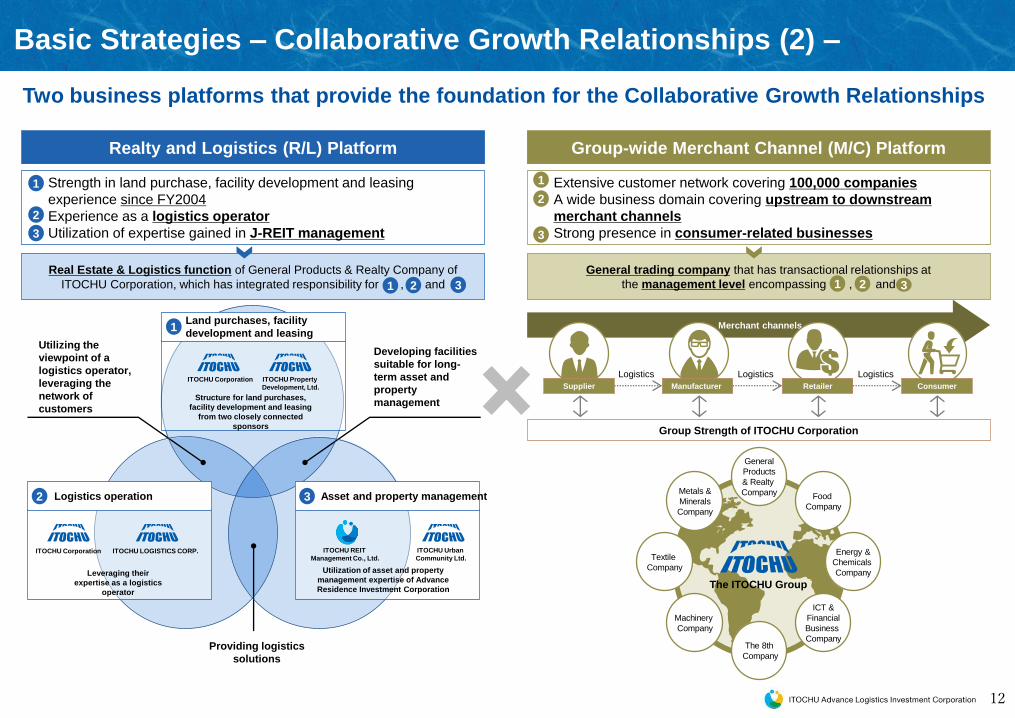
Two business platforms that provide the foundation for the Collaborative Growth Relationships
Realty and Logistics (R/L) Platform
Real Estate & Logistics function of General Products & Realty Company of
ITOCHU Corporation, which has integrated responsibility for , and
Strength in land purchase, facility development and leasing
experience since FY2004
Experience as a logistics operator
Utilization of expertise gained in J-REIT management
1
2
3
1 2 3
Utilizing the
viewpoint of a
logistics operator,
leveraging the
network of
customers
Developing facilities
suitable for long-
term asset and
property
management
Providing logistics
solutions
Asset and property management3
Utilization of asset and property
management expertise of Advance
Residence Investment Corporation
ITOCHU REIT
Management Co., Ltd.
ITOCHU Urban
Community Ltd.
Logistics operation2
Leveraging their
expertise as a logistics
operator
ITOCHU Corporation ITOCHU LOGISTICS CORP.
Structure for land purchases,
facility development and leasing
from two closely connected
sponsors
Land purchases, facility
development and leasing1
ITOCHU Corporation ITOCHU Property
Development, Ltd.
Merchant channels
Group-wide Merchant Channel (M/C) Platform
General trading company that has transactional relationships at
the management level encompassing , and
Extensive customer network covering 100,000 companies
A wide business domain covering upstream to downstream
merchant channels
Strong presence in consumer-related businesses
1
2
3
1 2 3
General
Products
& Realty
Company Food
Company
Metals &
Minerals
Company
ICT &
Financial
Business
Company
Machinery
Company
Textile
Company
Energy &
Chemicals
Company
Group Strength of ITOCHU Corporation
The ITOCHU Group
Supplier Manufacturer Retailer Consumer
Logistics Logistics Logistics
The 8th
Company
Basic Strategies – Collaborative Growth Relationships (2) –

13
Deal Sourcing and value added works utilizing wide network and group power of Sogo shosha
◼ Currently developing a logistic facility
exclusively for a major home center
operator, Cainz Corporation.
◼ Aiming to provide wide function and
synergies as Sogo shosha by offering
products/materials or logistics services
in addition to development of facilities.
◼ Acquired land through strong regional
relationship build by Chubu branch of
ITOCHU Corporation.
IMP Kasugai
◼ The property is located in the area where
Fujita Corporation, a major constructor
carry redevelopment.
◼ Acquired land from Fujita Corporation,
who had strong relationship with ITOCHU
Corporation built through past joint
development projects.IMP Atsugi2
Deal Sourcing from ITOCHU Group Network Value Added by ITOCHU Group business
◼ Acquired land information from a major
constructor by ITOCHU’s high reputation
of past project in the same area.
◼ Acquired land through smooth
negotiation with landowner, Mizuma
Kyuhai, who was a client of an ITOCHU
Group company.IMP Mino IMP Kuwana
IMP Ichikawashiohama
◼ Creating CO2-free clean energy by
installing solar panels provided by VPP
Japan, Inc., an investee of ITOCHU, on
the roof of the facility
◼ VPP Japan is also working to clean
logistics mobility, such as supplying
electric power to EV trucks using solar
power.
Future-oriented Business of ITOCHU
◼ ITOCHU and Mercuria Investment Co., Ltd. formed a fund "Mercuria
Biztech" to invest in the innovation field in the real estate and logistics fields.
◼ Aiming to provide tenants with solutions by offering advanced and labor-
saving services in logistics or logistics facilities born from this fund.
Case works – Collaborative Growth Relationships (3) –

14
CRE strategy (3rd-party Properties, Land) / Warehousing by Sponsors & Bridge scheme / M&A works
Aim to maximize unitholder value and long-term solid management by implementing steady measures
Strategic Roadmap
Forecast
2,724 yenActual
2,492 yen
Forecast
2,683 yen4-5% DPU growth
through external,
internal growth
and various measures
・Aiming inclusion in major indices
・Consider acquiring properties using loans
12 properties
111.4 bn yen
Focus on external assessment, GRESB etc (DBJGB and BELS acquisition increase)
Initiatives for Green loans / Green bonds
Increase of green lease with tenants (install LED light / reduce electricity cost at BTS facilities)
Advancement of AM Company’s internal control
Disclosure of Annual Report (from the 6th FP)
Change Distribution Policy (from 7th FP) FFO 70% → SCD 30% of depreciationContinuous EPU
(DPU) growth by
external/ internal
growth with
LTV control
Current Target:
200 bn yen
Liquidity
improvement
(steady growth)
Continuous
initiatives for ESG
with guide of
Ratings
Flexibly Funding while observing
COVID-19 impact / market environment
Collaborate with ITOCHU in renewal and retenant aiming longer term & rent increase
Continuous dialogue with rating agencies aiming further improvement Long term issuer Rating (JCR) A+ (Positive)
Install LED lights / Roof rental for solar panels, improvement of tenant satisfaction, reduction in insurance expenses
Fixed interest rate by swap
Renewed contract with longer term Continuous work on
rent/NOI increase
and cost reduction
LTV below 45% for a period
Actual
41.0%Forecast
41.0%
(Total asset)
LTV
Forecast
41.0%
Mid/long-term limit:
50% LTV
Solid cash
management
Redevelopment study of older properties
Consider Commitment line introduction
Strengthen lender formation
Borrowing Green Loans
Introduced cumulative investment for directors/investment program for employees Introduce investment program for directors
Actual Future
9th FP (Jan. 2023) and future8th FP
(Jul. 2022)
7th FP
(Jan. 2022)
6th FP
(Jul. 2021)
Portfolio for
stable
mid/long-
term
management
Ex
tern
al
gro
wth
Sound
financial
management
for stable long-
term
operations
Fin
an
cia
l
str
ate
gie
s
Steady DPU
growthDP
U
(In
clu
din
g S
CD
)
Initiatives for
sustainabilityES
G
Pursue Tenant
stickiness /
NOI
improvementInte
rna
l
gro
wth
*after VAT loan

15
Backed by sponsor support, continue to acquire properties at appropriate level of NOI yield in each area
Properties owned / developed by the ITOCHU Group: 7 properties with total floor area of about 248,503m2
External Growth StrategiesSteady Expansion of Asset Size through Selective Investment in Quality Properties
Properties developed by Sponsor
Third-party Properties
Work together with lenders to explore the CRE needs of general
companies
Acquisition of Third-party Properties in Alliance with ITOCHU Corporation and ITOCHU Property Development (IPD)
Acquire property information through IAL’ own route
Disclosed pipeline (as of the end of the 5th FP) New pipeline
IMP Yoshikawa Minami
About 17,848m2
1
2
3Identify the needs for securitizing properties owned by ITOCHU Group
IMP Minoh
About 41,520m2
Kansai
IMP Kuwana
About 90,378m2
Chubu
IMP Kazo
About 11,055m2
IMP Atsugi 2
About 15,482m2
Study other properties, such as plants or land with limited proprietary right in addition to logistics facilities4
IMP Kasugai
About 14,496m2
Acquire selective quality properties to maintain/improve profitability of portfolio at appropriate level of NOI yield in the area
Preferential
negotiation rightKanto/Bay
57,724m2
IMP Ichikawa Shiohama
Preferential
negotiation right
Proactively utilize bridge scheme or warehousing by sponsors taking advantage of quality properties with stable cash flow
While keeping solid profit despite COVID-19, aiming further strong portfolio by tenants with stable cash flow and competitive location
Kanto
Kanto
Kanto
Chubu
Preferential
negotiation right
*red frame is properties of which preferential
negotiation right is newly acquired
16
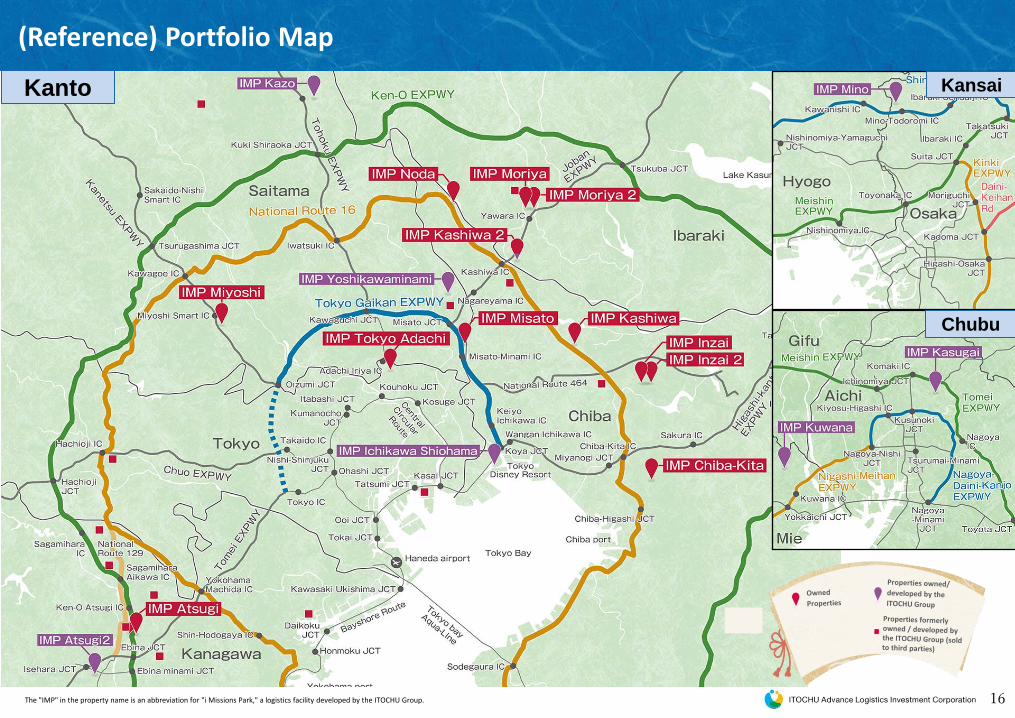
(Reference) Portfolio Map
The "IMP" in the property name is an abbreviation for "i Missions Park," a logistics facility developed by the ITOCHU Group.
伊藤忠グループ開発物件(本投資法人パイプライン物件)
伊藤忠グループの過去開発・取得実績物件(外部売却済)
Kanto Kansai
Chubu

17
Retail 5.5%
E-commerce
38.6%3PL
54.0%
Manufacturer 1.8%
Major 3PL
39.0%
Maintain a stable cash flow
with an occupancy rate of
over 99.9% since IPO
Securing long-term stable profitability by exclusive contracts of whole facility with quality tenants on long-term basis, by timely capturing customers location strategy and facility needs through ITOCHU Group’s network.
Internal Growth Strategies Long term Stable Cash Flow based on ITOCHU Corporation’s Leasing Capabilities
Implemented measures for increasing revenue
(As of July 31, 2021)
✓ Longer term contracts / Rent Increase
・Commencement of renewed contract with 2 tenants in
IMP Noda (Rent increase and longer term)
・Renewed contract with another tenant
・Extended the term and increased rent with another tenant
before contract expiration
・Continue focus on leasing activities for the vacant office
space in IMP Noda
✓ Discussion started for renewal expiring in 9thFP(2023/1)
Approach 1 year before expiration and positively
negotiating with the tenants hearing their needs.
✓ Increase income from rooftop and parking lots
・Started roof rental for solar panel at IMP Moriya
・Increased rent from parking lots at IMP Noda
✓ Cost-cut efforts
・Increase LED lights to reduce utility expenses while
improving tenant satisfaction
・Reviewing cost for property management with quality
Long-term lease contracts with quality tenants that are reliable
E-commerce
+ major 3PL ratio
75.4%
(End of the 5th FP)
77.6%
Average
6.2 years(5th FP)
5.7years
Remaining lease term(based on annual rent)
Tenant industry(based on annual rent)
3 years or more
to less than 5 years
18.6%
1 year or more
to less than 3 years
13.9%
5 years or more
to less than 7 years
33.5%
7 years or more
33.9%
4.6%
9.3%
1.0%
5.4%
2.6%
11.3%
3.1% 3.7%
25.0% 24.4%
5.0%
2.1% 2.5%
0.0%
5.0%
10.0%
15.0%
20.0%
25.0%
30.0%
1月期 7月期 1月期 7月期 1月期 7月期 1月期 7月期 1月期 7月期 1月期 7月期 1月期 7月期 1月期 7月期 1月期 7月期 1月期 7月期 1月期 7月期 1月期 7月期 1月期
Extended with one tenant
(1.8% portion of annual rents)
Timing of Lease Expiration (based on annual rent)
20342022 2023 2024 2025 2026 2027 2028 2029 2030 2031 2032 2033
(As of July 31, 2021)
Jan. Jul. Jan. Jul. Jan. Jul. Jan. Jul. Jan. Jul. Jan. Jul. Jan. Jul. Jan. Jul. Jan. Jul. Jan. Jul. Jan. Jul. Jan. Jul. Jan.

18
0 433
7,050
0 0 0
6,620
3,950
5,000
0
5,500 5,020 5,000
4,000
1,500
2,650
1,000
0 0
1,000
2,000
3,000
4,000
5,000
6,000
7,000
8,000
9,000
1月期 7月期 1月期 7月期 1月期 7月期 1月期 7月期 1月期 7月期 1月期 7月期 1月期 7月期 1月期 7月期 1月期 7月期
Rating outlook upgraded to A+(Positive) by built up track recordsConsidering capacities while promoting maturity extension and rates fix
Financial StrategiesEstablishment of strong Financial Base durable to long-term management
Maturity Ladder (all loans are unsecured and non-guaranteed)
(MN yen)
2023 2024 2025 2026 2027 2028 2029 2030
Existing loans Investment corporation bonds
2022
New loans
1,500
Green loans
Financial Highlights
Interest-bearing debt
47bn Yen
Long-term debt / Fixed
interest ratio
99.1%
(Total asset)LTV
41.0%(after VAT loans)
Average debt cost
0.46%(annual basis)
Average time to maturity
4.4 years
Borrowing capacity
(with LTV at45%)bn
8.3bn Yen(after VAT loans)
Long-term issuer rating
(JCR)
A+(Positive)
(As of July 31, 2021)
5,300
(As of September 7,2021)
(As of July 31, 2021)
Diversified Interest-bearing Debt
Sumitomo Mitsui Banking Corporation
26.6%
Sumitomo Mitsui Trust Bank, Ltd. 19.8%
Mizuho Bank, Ltd. 18.3%
MUFG Bank, Ltd 14.9%
Mizuho Trust & Banking Co., Ltd. 5.2%
Development Bank of Japan Inc. 2.9%
The Norinchukin Bank 2.7%
The Bank of Fukuoka 2.5%
Nippon Life Insurance Company 2.1%
Shinsei Bank, Ltd. 1.9%
Investment Corporation bonds 3.1%
VAT loans
Green bonds
Green loans
Jan. Jul. Jan. Jul. Jan. Jul. Jan. Jul. Jan. Jul. Jan. Jul. Jan. Jul. Jan. Jul. Jan. Jul.
✓ Completed refinancing 5.3 billion yen in
the 7th FP (Jan. 2022)(maturity in
September 2021) in advance and
borrowed as a green loan
✓ Aiming further strengthen financial
stability by spreading maturity period at
asset size expansion (including new
financing)
✓ Discussing loans with several new banks
✓ Considering introduction timing of
commitment line
19
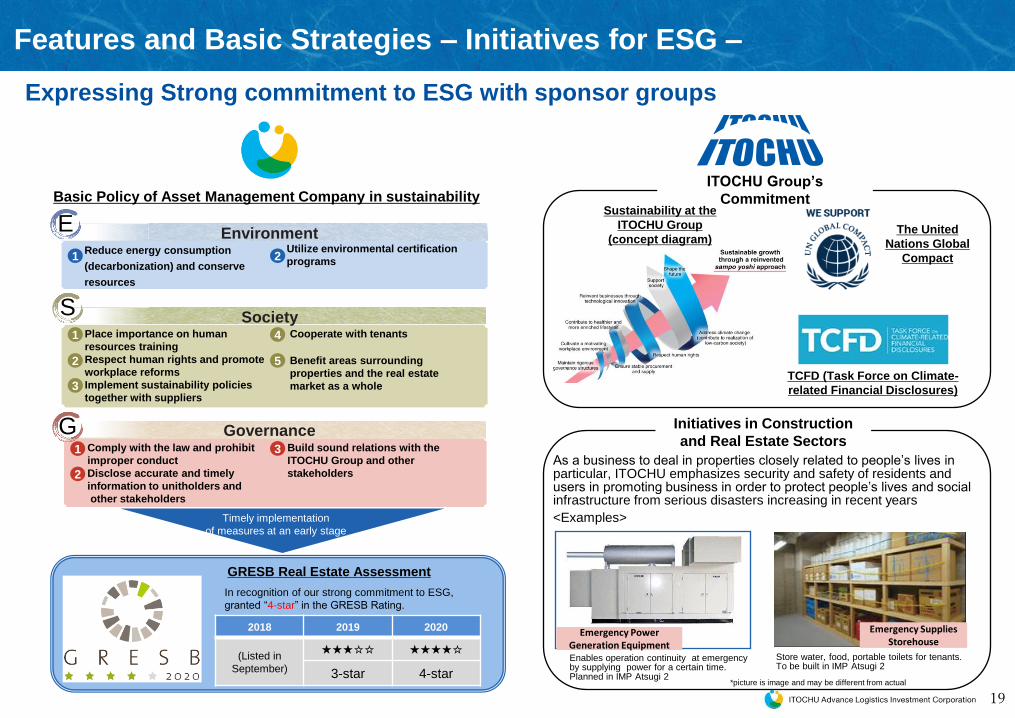
Features and Basic Strategies – Initiatives for ESG –
Expressing Strong commitment to ESG with sponsor groups
GRESB Real Estate Assessment
In recognition of our strong commitment to ESG,
granted “4-star” in the GRESB Rating.
Basic Policy of Asset Management Company in sustainability
Place importance on human
resources training
Respect human rights and promote
workplace reforms
Implement sustainability policies
together with suppliers
Cooperate with tenants
Benefit areas surrounding
properties and the real estate
market as a whole
Comply with the law and prohibit
improper conduct
Disclose accurate and timely
information to unitholders and
other stakeholders
Build sound relations with the
ITOCHU Group and other
stakeholders
Reduce energy consumption
(decarbonization) and conserve
resources
Utilize environmental certification
programs1 2
1
1
2
Environment
Society
Governance
S
E
G
2
3
4
5
3
Timely implementation
of measures at an early stage
ITOCHU Group’s
CommitmentSustainability at the
ITOCHU Group
(concept diagram)The United
Nations Global
Compact
TCFD (Task Force on Climate-
related Financial Disclosures)
As a business to deal in properties closely related to people’s lives in particular, ITOCHU emphasizes security and safety of residents and users in promoting business in order to protect people’s lives and social infrastructure from serious disasters increasing in recent years
<Examples>
Initiatives in Construction
and Real Estate Sectors
Enables operation continuity at emergency by supplying power for a certain time. Planned in IMP Atsugi 2
Store water, food, portable toilets for tenants. To be built in IMP Atsugi 2
Emergency PowerGeneration Equipment
Emergency Supplies Storehouse
2018 2019 2020
(Listed in
September)
★★★☆☆ ★★★★☆
3-star 4-star*picture is image and may be different from actual

20
Initiatives for ESG (E) Environmental Initiatives
• Had the framework evaluated by a third-party institution, JCR, and received the highest “Green 1 (F)” status in the “JCR Green Finance Framework Evaluation”
• Used green loans partially for the public offering made in April 2021 and refinancing in September 2021
Awarded “Green Star” Status with “4-Star” Rating
Active Acquisition of Environmental Certification
Energy Consumption Reduction and Resource Saving
<Energy consumption reduction>
LED lighting
<Renewable energy generation>
Solar panels
<Water consumption reduction>
Installing water-saving toilet system
<CO2 emissions reduction>
Promoting CO2 emissions reduction in cooperation among tenants based on applicable law
<Greening>
Greening parking lots
<Green lease agreements>
Installing LED based on green lease
agreements
Initiatives to Green Financing
Having been highly evaluated by GRESB for its
proactive implementation of initiatives, such as
disclosure of environmental data, acquisition of
DBJ Green Building certification, improvement in
the working environment, and participation in
community services, IAL was awarded "Green
Star“ status and granted “ 4-star ” in the GRESB
Rating, in 2020 which is a five level rating system
(the highest level is “five star”)
Continuous Acquisition of Environmental Data
Property Total floor area
(㎡)DBJ assessment
(★~★★★★★)BELS assessment
(★~★★★★★)
L-1 IMP Atsugi 19,297.60 Under consideration Under consideration
L-2 IMP Kashiwa 31,976.44 ★★★★ 2018 Under consideration
L-3 IMP Noda 62,750.90 ★★★★ 2018 Under consideration
L-4 IMP Moriya 18,680.16 ★★★★ 2018 ★★★★★ 2019
L-5 IMP Misato 22,506.53 ★★★★ 2018 ★★★★ 2019
L-6 IMP Chiba-Kita 9,841.24 Under consideration ★★★★★ 2019
L-7 IMP Inzai 110,022.51 ★★★★★ 2018 ★★★★★ 2019
L-8 IMP Moriya 2 6,779.95 - -
L-9 IMP Kashiwa 2 117,435.21 ★★★★ 2020 ★★★★★ 2020
L-10 IMP Inzai 2 26,938.75 In preparation In preparation
L-11 IMP Tokyo-Adachi 27,872.43 In preparation In preparation
L-12 IMP Miyoshi 10,300.66 In preparation In preparation
Total 464,402.38 363,371.75 278,485.65
Percentage of properties certified 78.2% 60.0%
Categories FY2018 FY2019 FY2020
Energy consumption 100% 100% 100%
CO2 emissions 100% 100% 100%
Water consumption 92% 95% 95%
Waste amount 44% 80% 89%
Achieved high environmental data acquisition coverage rate and promote
environmental measures with the cooperation of tenant companies

21
ESG Initiatives with Suppliers
Initiatives for ESG (S) Social Contribution
Participate in donation campaigns by ITOCHU
Foundation which aims for fostering the healthy
development of children
Purchase from the ITOCHU group company that
hires people with disabilities
• Distribute sustainability guidebooks to major business partners, including
property management companies.
• Conduct annual survey to business partners on their sustainability-related
initiatives
The ITOCHU
FoundationEthical
Purchasing
Statement of ESG-related clauses in lease agreement (Green lease clause)
• Revision of lease agreement format
• Enhancement of the system to pursue ESG initiatives in cooperation with tenants,
such as management and sharing of environmental performance data.
Coexistence with Local Communities
Cooperation with Tenant Companies
Initiatives for Employees
Support for acquiring expertise
In collaboration with the ITOCHU Group, actively support for study session / correspondence
course for employees• Study session for obtaining the
qualification of real estate transaction
agent
The ITOCHU Group holds a study session
every week inviting outside lecturers and
employees of the Asset Management
Company participate in it
TOKYO Work-Style Reform Declaration
・ Hourly paid leave
Allowing employees to take leaves
on an hourly basis
・Sliding working hours
Allowing employees to adjust
starting and finishing times of daily
working hours
Improve work environment
Improve paid holidays
Approved as a company committed to “TOKYO Work-
Style Reform Declaration,” a program promoted by the
Tokyo Metropolitan Government
Helping people with disabilitiesSupport for education
• Implemented since 2020. In addition to facility, management questions are newly added.
• Understand tenants use of current facilities and utilize it for our operation and facility
improvement
Ensuring employee safety
An individual specification was adopted
whereby employees are able to enter the
building via elevator access to the second floor
directly from the parking lot. This ensures
safety by creating separate lines of movement
for pedestrians and trucks
Tenant satisfaction survey
Logistics Continuity at Emergencies
Enables operation continuity at emergency by supplying power for a certain time. Planned in IMP Atsugi 2
Store water, food, portable toilets for tenants. To be built in IMP Atsugi 2
Emergency PowerGeneration Equipment
Emergency Supplies Storehouse
*picture is image and may be different from actual
Declaration of practice of
“Telework TOKYO rule”
the Asset Management Company received approval
from the Tokyo Metropolitan Government for a system
to declare companies that practice the "Telework Tokyo
Rules and declared below.
• promote the establishment and revision of systems
for the realization of diverse work styles
• Increase productivity by improving work efficiency.
• introduce telework environment when infectious
diseases (coronavirus, influenza, etc.) spread.

22
Initiatives for ESG (G) Governance
• Cumulative unit investment program is introduced to full time directors of Asset Management Company
• investment unit ownership program has been introduced to non director employee
Personnel structure of asset management companies
TotalOf which, employees
secondedfrom the Sponsor
Full time Director 2 0
Employees 17 1
Total 19 1
(As of Jul. 31, 2021)
• Representative director, president & CEO has resigned from sponsor and joined the Asset
Management Company. All general managers or above are those not seconded from
sponsor.
• One employee is seconded from ITOCHU Corporation.
ITOCHU Corporation's same-boat investment
Personnel structure consisting ofthose not seconded from sponsors
Management Fees Align interests with unitholders
Managementfee I
Total assets × 0.1% (upper limit)
Managementfee II
NOI of rental business × 5.0% (upper limit)
Managementfee III
Income before income taxes ×Adjusted EPU
× 0.005% (upper limit)
Assetdisposition fee
Disposition price ×0.5% (upper limit)(0% when loss on asset disposition incurred)
・Amended the management fee structure to further align
interests with unitholder
・Applied new percentage from the 5th FP (Jan. 2021)
Facilitate the alignment of interests of unitholders with directors and employees of Asset Management Company
ITOCHU Corporation continues “same-boat investment”
since IPO of IAL
(as of IPO)(as of the end
of Jul. 2019)
Acquired
additional units
in the marketAfter 2nd PO
• External experts are appointed to consider global money
laundering and terrorist financing measures (company-wide
control / business process control) required by the Financial
Services Agency, etc.
• In-house training on money laundering and terrorist financing
measures has been completed. Aim for further understanding
and penetration within the company
Expansion of compliance rules
(as of the end
of Jan. 2021)
5.0% 7.0% 5.6% 5.6%
(as of the end
of Jul. 2021)
Current
23
Portfolio

24
ITOCHU Group
customers
63.7%
ITOCHU
Group
6.2%
Others
30.1%
77.9%(End of the 5th FP)
69.9%
1 year or more
to less than 3
years
13.9%
7 years or more
33.9%
Around National
Route 16
80.0%
Ken-O EXPWY 4.8%
Around Tokyo
Gaikan EXPWY
15.3%National
Route 16 and Tokyo
Gaikan EXPWY
94.6%
(End of the 5th FP)
95.2%
Portfolio Characteristics
Further improves the stability of Portfolio through selective investment,
tenant stickiness, and strong sponsor support
Strong Sponsor Support Competitive Property Quality Contract
Realty & Logistics
platform
Group-wide
Merchant ChannelCompetitive
LocationYoung Property Long term Quality Tenant
Location(based on acquisition price)
※1 Ratios are rounded to the first decimal place.
※2 3PL stands for third party logistics, which is defined as a firm or a third party that offers a comprehensive logistics innovation to shippers from product orders and inventory management, and is entrusted with comprehensive logistics services.
※3 Major 3PLs mean 3PLs with consolidated sales exceeding 100 billion yen including such 3PLs.
Remaining lease term(based on annual rent)
ITOCHU Group and
Group customer tenant
(based on acquisition price)
Properties developed by sponsor
(based on annual rent)
Developed by sponsor
99.3%
Others 0.7%
99.2%(End of the 5th FP)
99.3%
Number of
“ITOCHU Group and
group customer
tenants” remains
unchanged
Retail 5.5%
E-commerce
38.6%3PL
54.0%
Manufacturer 1.8%
More than 1 year
to 3 years or less
32.3%
More than 3 years
to 5 years or less
45.4%
More than 7 years 5.4%
Average
3.7year(End of the 5th FP)
4.1year
3 years or more
to less than
5 years
18.6%
5 years or more
to less than 7 years
33.5%
Average period
6.2year(End of the 5th FP)
5.7year
(based on acquisition price)
Property age
More than 5 years
to 7 years or less
16.8%
Tenant industry
E-commerce
+ major 3PL
75.4%(End of the 5th FP)
77.6%
Major 3PL
39.0%
(based on annual rent)
(As of July 31, 2021)

25
Market Overview

26
0
5
10
15
0
500
1,000
1,500
2009 2010 2011 2012 2013 2014 2015 2016 2017 2018 2019 2020 2021 2022 (year)
(%)(Thousands of m2)
新規供給(左軸) 新規需要(左軸) 空室率(右軸)
0
5
10
15
0
1,000
2,000
3,000
4,000
2009 2010 2011 2012 2013 2014 2015 2016 2017 2018 2019 2020 2021 2022(year)
(%)(Thousands of m2)
新規供給(左軸) 新規需要(左軸) 空室率(右軸)
Vacancy rate remains at a record low, supported by strong demand despite COVID-19
Market Overview(1) Supply/ Demand Balance of Logistics Facilities
Vacancy
rate
0.4%(End of Oct 2020)
■Vacancy rate remains low backed by strong demand in Kanto. Strong supply ahead is still expected to be absorbed.
Vacancy Rate and Supply and Demand Balance in Kanto Area
Estimate
Source: K.K. Ichigo Real Estate Service
■ Vacancy rate in inland is particularly low in Kansai, making coastal area decreasing steadily. The trend will continue.
Vacancy Rate and Supply and Demand Balance in Kansai Area
Vacancy
rate
2.5%(End of Oct 2020)
Estimate
New supply (left axis) New demand (left axis) Vacancy rate (right axis)
New supply (left axis) New demand (left axis) Vacancy rate (right axis)

27
(TN Yen)
■3PL expansion boosts advanced facilities demand ■Older/conventional shift to advanced logistics facilities
Source: Compiled by K.K. Ichigo Real Estate Service based on Statistics on Building Starts
(Ministry of Land, Infrastructure, Transport and Tourism)
and Summary Report on Prices of Fixed Assets (Ministry of Internal Affairs and Communications)
Changes of the 3PL Market in Japan Ratio of Advanced Logistics Facilities
出所:月刊ロジスティクス・ビジネス(株式会社ライノス・パブリケーションズ)
Expansion of e-commerce and 3PL markets boosts logistics real estate market
Market Overview(2) E-commerce・3PL market trend
Source: Compiled by our company based on data from the 2020 "Market Survey on Electronic Commerce" (Ministry of
Economy, Trade and Industry) and "IT Navigator 2020" by Nomura Research Institute, Ltd.
0
5
10
15
20
25
30
2014 2015 2016 2017 2018 2019 2020 2021 2022 2023 2024 2025
(TN Yen)
E-commerce Market size (Merchandise sector)
■COVID-19 accelerated spread of e-commerce which is expected to grow further going forward
Forecast of E-commerce Market (Merchandise &Services)
0
2
4
6
8
10
0
4
8
12
2013 2014 2015 2016 2017 2018 2019 2020
売上高 EC化率
(%)Forecast
0
5
10
15
20
25
0
10,000
20,000
30,000
2010 2011 2012 2013 2014 2015 2016 2017 2018 2019 2020
3PL市場規模 前年比
(year) (year)
(FY)
Source: LOGI-BIZ (Rhinos Publications, Inc.)
Sales
Source: Outline of the E-Commerce Market Survey (Ministry of Economy, Trade and Industry)
E-commerce ratioSales
3PL Market Size Year-on-Year
(%)(100 MN Yen)
Advanced
Logistics Facilities
36 MN ㎡6.7% Large/Middle
Logistics Facilities
191 MN ㎡
35.3%Other Logistics
Facilities
312 MN ㎡
58.0%
※Calculated as below, as of December, 2020・Logistics facility:All logistics facility in Japan(incl. lease,non-lease)・large/middle: Amongst above, gross floor area from 5,000㎡ and less 10,000㎡・advanced: Amongst above, gross floor area 10,000㎡ or more, younger than 20yeras, lease only

28
Appendix

29
0
5,000
10,000
15,000
20,000
25,000
30,000
60,000
80,000
100,000
120,000
140,000
160,000
180,000
200,000
2018/9 2018/11 2019/1 2019/3 2019/5 2019/7 2019/9 2019/11 2020/1 2020/3 2020/5 2020/7 2020/9 2020/11 2021/1 2021/3 2021/5 2021/7
本投資法人(左軸)
物流特化型REIT(左軸)
東証REIT指数(左軸)
Implemented Initiatives and Unit Price Trend
(yen) (units)
1
2
3
4
Trading Volume of IAL (right axis)
※ Changes in TSE REIT Index and J-REITs specializing in logistics facilities are indexed based on IAL’s initial public offering price, 103,000 yen, with IAL’s listing day as the start date. J-REITs specializing in logistics facilities
are weighted for market capitalization.
The end of the 1st FP (Jan. 2019)NAV per unit:109,848 yenPrice / NAV:0.80x
5
6
7
Launched the 1st follow-on offeringat a premium on NAV
The end of the 2nd FP (Jul. 2019)NAV per unit:113,026 yenPrice / NAV:0.91x
The end of the 3rd FP (Jan. 2020)NAV per unit:116,026 yenPrice / NAV:1.09x
The end of the 6th FP (Jul. 2021)NAV per unit:132,085 yenPrice / NAV:1.21x
8
Launched the 2nd follow-on offering(second time in 2020)
The end of the 4th FP (Jul. 2020)NAV per unit:118,511 yenPrice / NAV:1.36x
The end of the 5th FP (Jan. 2021)NAV per unit:126,473 yenPrice / NAV:1.03x
Announcedacquisition of two
new properties(March 14, 2019)
Acquiredcredit rating
(March 15, 2019)
Announced secondary
additional acquisitionof investment units by ITOCHU corporation
(March 26, 2019)
Analyst coveragestarted
(June 14, 2019)
1 2 3Awarded the “Green Star”
(with GRESB rating being “three stars”)
(September 10, 2019)
4
Issued green bonds(December 12, 2019)
5Announcedinclusion in MSCI Japan
Small Cap Index(May 12, 2020)
6 7 JCR changed the outlook of IAL’s
long-term issuer rating to A+(positive) from A+(stable)
(February 1, 2021)
8
Unit price of IAL (left axis)
J-REITs specializing in logistics facilities (left axis)
TSE REIT Index (left axis)
30
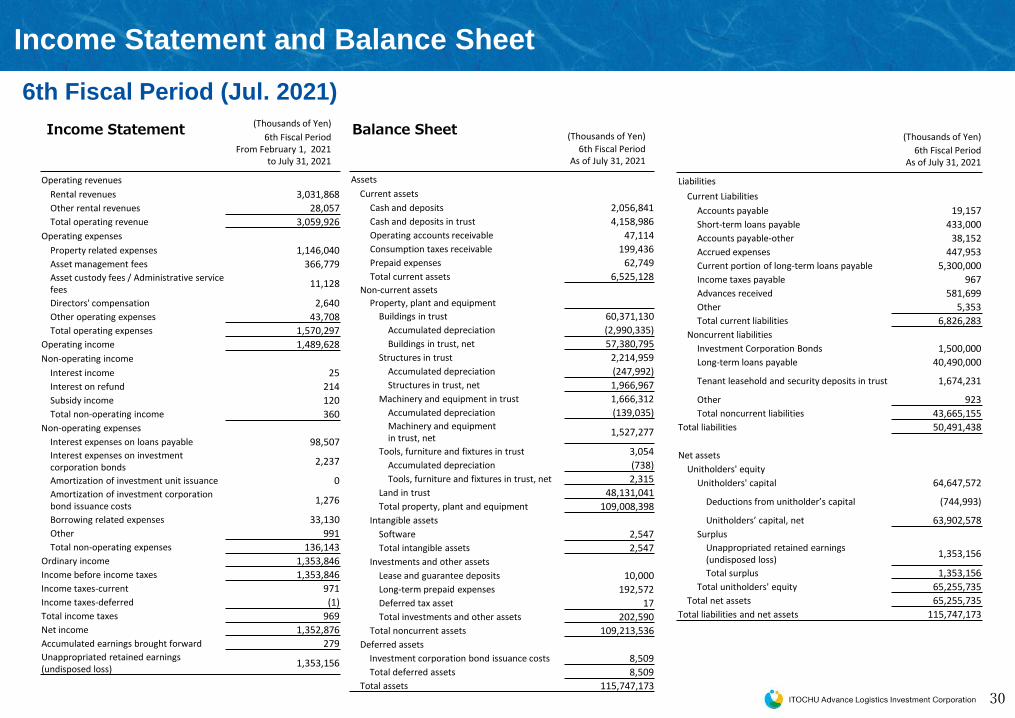
(Thousands of Yen)
6th Fiscal Period From February 1, 2021
to July 31, 2021
Operating revenues
Rental revenues 3,031,868
Other rental revenues 28,057
Total operating revenue 3,059,926
Operating expenses
Property related expenses 1,146,040
Asset management fees 366,779 Asset custody fees / Administrative service fees
11,128
Directors' compensation 2,640
Other operating expenses 43,708
Total operating expenses 1,570,297
Operating income 1,489,628
Non-operating income
Interest income 25
Interest on refund 214
Subsidy income 120
Total non-operating income 360
Non-operating expenses
Interest expenses on loans payable 98,507 Interest expenses on investment corporation bonds
2,237
Amortization of investment unit issuance 0 Amortization of investment corporation bond issuance costs
1,276
Borrowing related expenses 33,130
Other 991
Total non-operating expenses 136,143
Ordinary income 1,353,846
Income before income taxes 1,353,846
Income taxes-current 971
Income taxes-deferred (1)
Total income taxes 969
Net income 1,352,876
Accumulated earnings brought forward 279 Unappropriated retained earnings (undisposed loss)
1,353,156
(Thousands of Yen)
6th Fiscal Period As of July 31, 2021
Assets
Current assets
Cash and deposits 2,056,841
Cash and deposits in trust 4,158,986
Operating accounts receivable 47,114
Consumption taxes receivable 199,436
Prepaid expenses 62,749
Total current assets 6,525,128 Non-current assets
Property, plant and equipment
Buildings in trust 60,371,130
Accumulated depreciation (2,990,335)
Buildings in trust, net 57,380,795
Structures in trust 2,214,959
Accumulated depreciation (247,992)
Structures in trust, net 1,966,967
Machinery and equipment in trust 1,666,312
Accumulated depreciation (139,035)Machinery and equipment in trust, net
1,527,277
Tools, furniture and fixtures in trust 3,054
Accumulated depreciation (738)
Tools, furniture and fixtures in trust, net 2,315
Land in trust 48,131,041
Total property, plant and equipment 109,008,398
Intangible assets
Software 2,547
Total intangible assets 2,547
Investments and other assets
Lease and guarantee deposits 10,000
Long-term prepaid expenses 192,572
Deferred tax asset 17
Total investments and other assets 202,590
Total noncurrent assets 109,213,536
Deferred assets
Investment corporation bond issuance costs 8,509
Total deferred assets 8,509
Total assets 115,747,173
Income Statement and Balance Sheet
6th Fiscal Period (Jul. 2021)
Income Statement Balance Sheet(Thousands of Yen)
6th Fiscal Period As of July 31, 2021
Liabilities
Current Liabilities
Accounts payable 19,157
Short-term loans payable 433,000
Accounts payable-other 38,152
Accrued expenses 447,953
Current portion of long-term loans payable 5,300,000
Income taxes payable 967
Advances received 581,699
Other 5,353
Total current liabilities 6,826,283
Noncurrent liabilities
Investment Corporation Bonds 1,500,000
Long-term loans payable 40,490,000
Tenant leasehold and security deposits in trust 1,674,231
Other 923
Total noncurrent liabilities 43,665,155
Total liabilities 50,491,438
Net assets
Unitholders' equity
Unitholders' capital 64,647,572
Deductions from unitholder’s capital (744,993)
Unitholders’ capital, net 63,902,578
Surplus
Unappropriated retained earnings (undisposed loss)
1,353,156
Total surplus 1,353,156
Total unitholders' equity 65,255,735
Total net assets 65,255,735
Total liabilities and net assets 115,747,173

31
About the Investment Corporation and the Asset Management Company
Overview of the Asset Management Company
Asset Management Company
ITOCHU REIT Management Co., Ltd.
Master Lease and Property Management Company
ITOCHU Urban Community Ltd.
Investment Corporation
ITOCHU Advance Logistics Investment Corporation
Accounting Auditor
Board of Directors
Executive Director: Junichi ShojiSupervisory Director: Soichi ToyamaSupervisory Director: Tsuyoshi Dai
PricewaterhouseCoopers Arata LLC
General Unitholders Meeting
Company name ITOCHU REIT Management Co., Ltd.
Established February 15, 2017
Capital 150 million yen
ShareholdersITOCHU Corporation 80%
ITOCHU Property Development, Ltd. 20%
Main business Investment management
Licenses and registrations
Financial Instruments Business License, Director of the Kanto Finance Bureau, (Kinsho) Registration No. 3027
Building Lots and Building Transactions Business License, Governor of Tokyo (1) No. 100434
Discretionary Transaction Agent License, Minister of Land, Infrastructure, Transport and Tourism, Registration No. 121
Transfer Agent
Mizuho Trust & Banking Co., Ltd.
Custodian / General Administrative Agent (for institutional administration / calculation / accounting)
Sumitomo Mitsui Trust Bank, Limited
General Administrative Agent(for tax payment)
Deloitte Tohmatsu Tax Co.
Sponsors
ITOCHU Corporation
ITOCHU Property Development, Ltd.
① Sponsor Support Agreement / Leasing Management Agreement
② Sponsor Support Agreement
Structure
As of Jul. 31, 2021
General Administrative Agent(for Investment Corporation Bonds)
Sumitomo Mitsui Trust Bank, Limited
Shareholder’s Meeting
Board of Directors
President
Investment Committee
Internal Audit Department
Compliance Committee
Corporate Auditors
Compliance Officer
Compliance & Risk Management Department
①
②
Investment & Asset Management Department
Finance & Planning Department
General Affairs & Human Resources Department
Officer in charge (Planning and Administration)
Accounting Department

32
CategoryProperty
No.Property name Location
Acquisition price
(MN Yen)
Book valueat the end of
the period(MN Yen)
Appraisalvalue
(MN Yen)
Unrealizedgains
(MN Yen)
AppraisalNOI yield
(%)
Total floorarea(m2)
Propertyage
(years)
OccupancyRate(%)
AcquiredProperties
L-1 IMP AtsugiAtsugi City, Kanagawa
5,300 5,180 6,140 959 5.0
A: 3,909.97
8.9 100.0
B:15,387.63
L-2 IMP Kashiwa Kashiwa City, Chiba 6,140 5,922 6,980 1,057 5.1 31,976.44 6.4 100.0
L-3 IMP Noda Noda City, Chiba 12,600 12,147 14,500 2,352 4.9 62,750.90 5.5 99.5
L-4 IMP MoriyaTsukuba Mirai City,Ibaraki
3,200 3,054 3,660 605 5.3 18,680.16 4.3 100.0
L-5 IMP MisatoMisato City, Saitama
6,100 5,916 7,100 1,183 5.0 22,506.53 4.0 100.0
L-6 IMP Chiba-Kita Chiba City, Chiba 2,600 2,531 2,970 438 5.3 9,841.24 3.7 100.0
L-7 IMP Inzai Inzai City, Chiba 27,810 26,766 31,200 4,433 5.1 110,022.51 3.4 100.0
L-8 IMP Moriya 2Tsukuba Mirai City,Ibaraki
750 745 896 150 6.7 6,779.95 26.6 100.0
L-9 IMP Kashiwa 2 Kashiwa City, Chiba 28,320 28,069 31,400 3,330 4.7 117,435.21 3.0 100.0
L-10 IMP Inzai 2 Inzai City, Chiba 5,367 5,354 5,820 465 5.0 26,938.75 2.4 100.0
L-11 IMP Tokyo-Adachi Adachi ward, Tokyo 10,915 10,982 11,300 317 4.2 27,872.43 3.2 100.0
L-12 IMP MiyoshiMiyoshi Town, Iruma County, Saitama
2,320 2,336 2,550 213 5.0 10,300.66 1.9 100.0
Total / Average (6th fiscal period (Jul. 2021)) 111,422 109,008 124,516 15,507 4.9 464,402.38 4.1 99.9
※1 Book value at the end of the fiscal period and unrealized gains are rounded down to the nearest unit.
※2 Appraisal NOI yield is based on acquisition price. Figures are rounded to the first decimal place.
※3 Property age rounded to the first decimal place.
※4 Occupancy rate indicates the ratio of leased area to leasable area, rounded to the first decimal place.
Incorporation of Quality Properties toward More Solid Portfolio
Continue to build a long-term stable portfolio by additionally acquiring new assets(As of Jul 31, 2021)

33
(Thousands of Yen)
Property No. L-1 L-2 L-3 L-4 L-5 L-6 L-7 L-8 L-9 L-10 L-11 L-12
Property nameIMP
AtsugiIMP
KashiwaIMP
NodaIMP
MoriyaIMP
MisatoIMP
Chiba-KitaIMP Inzai
IMP Moriya 2
IMP Kashiwa 2
IMP Inzai 2
IMP Tokyo-Adachi
IMP Miyoshi
Total
Number of operating daysin the 6th fiscal period
181days 181days 181days 181days 181days 181days 181days 181days 181days 181days 122days 122days -
(A) Total revenues from property leasing
- -
406,579
- - - - - - - - -
3,059,926
Rental revenues 393,151 3,031,868
Other rental revenues 13,428 28,057
(B) Total property-related expenses
177,555 1,146,040
Taxes and public dues 39,736 276,622
Property management fees
20,194 45,053
Utility expenses 12,018 23,155
Repair expenses 5,838 7,069
Insurance expenses 1,247 8,783
Trust fees 250 2,584
Others 57 124
Depreciation 27,893 45,461 98,213 29,813 39,064 16,554 249,282 7,958 202,794 32,507 24,026 9,076 782,647
(C) Income from property leasing (=(A) - (B))
105,188 107,993 229,024 63,962 113,658 52,390 462,190 19,471 478,186 103,712 144,309 33,797 1,913,885
(D) NOI (= (C) + depreciation) 133,082 153,454 327,237 93,776 152,722 68,944 711,473 27,430 680,981 136,219 168,336 42,874 2,696,533
Revenue and Expenditure for Each Properties
※ For properties other than IMP Noda, items other than depreciation, leasing business gains and losses, and leasing business NOI are undisclosed as IAL was not able to obtain the tenant’s consent.
Figures are rounded down to the nearest thousand yen.
6th Fiscal Period (Jul. 2021)
34
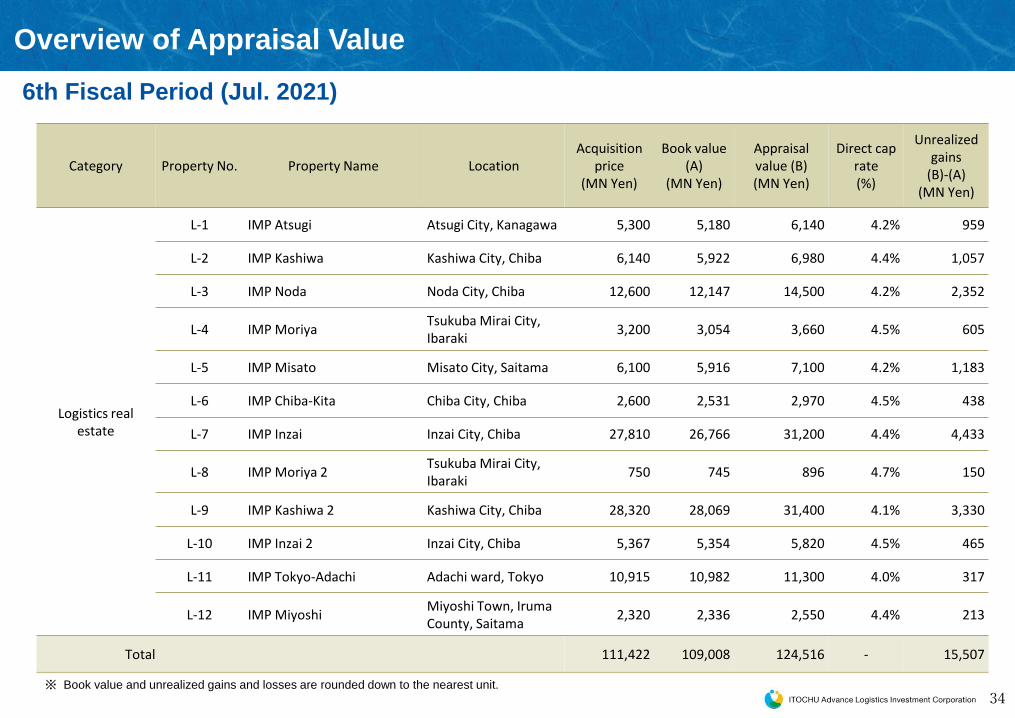
Overview of Appraisal Value
※ Book value and unrealized gains and losses are rounded down to the nearest unit.
Category Property No. Property Name LocationAcquisition
price(MN Yen)
Book value(A)
(MN Yen)
Appraisal value (B)(MN Yen)
Direct cap rate(%)
Unrealized gains
(B)-(A)(MN Yen)
Logistics real estate
L-1 IMP Atsugi Atsugi City, Kanagawa 5,300 5,180 6,140 4.2% 959
L-2 IMP Kashiwa Kashiwa City, Chiba 6,140 5,922 6,980 4.4% 1,057
L-3 IMP Noda Noda City, Chiba 12,600 12,147 14,500 4.2% 2,352
L-4 IMP MoriyaTsukuba Mirai City,Ibaraki
3,200 3,054 3,660 4.5% 605
L-5 IMP Misato Misato City, Saitama 6,100 5,916 7,100 4.2% 1,183
L-6 IMP Chiba-Kita Chiba City, Chiba 2,600 2,531 2,970 4.5% 438
L-7 IMP Inzai Inzai City, Chiba 27,810 26,766 31,200 4.4% 4,433
L-8 IMP Moriya 2Tsukuba Mirai City,Ibaraki
750 745 896 4.7% 150
L-9 IMP Kashiwa 2 Kashiwa City, Chiba 28,320 28,069 31,400 4.1% 3,330
L-10 IMP Inzai 2 Inzai City, Chiba 5,367 5,354 5,820 4.5% 465
L-11 IMP Tokyo-Adachi Adachi ward, Tokyo 10,915 10,982 11,300 4.0% 317
L-12 IMP MiyoshiMiyoshi Town, IrumaCounty, Saitama
2,320 2,336 2,550 4.4% 213
Total 111,422 109,008 124,516 - 15,507
6th Fiscal Period (Jul. 2021)
35
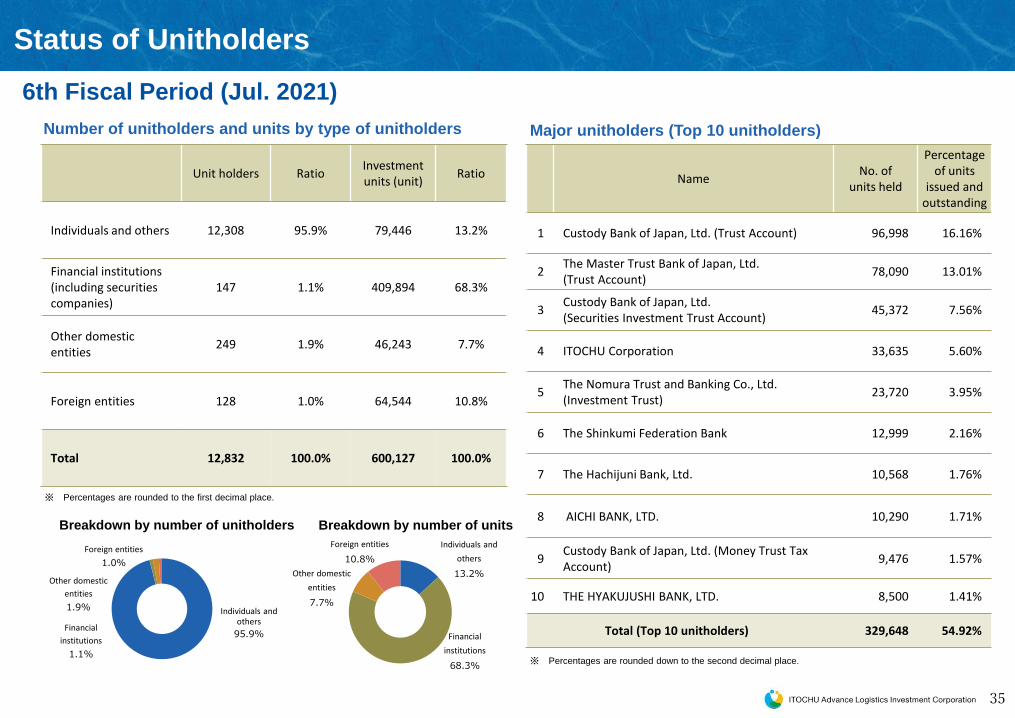
※ Percentages are rounded to the first decimal place.
Number of unitholders and units by type of unitholders Major unitholders (Top 10 unitholders)
Status of Unitholders
Individuals and others
95.9%Financial
institutions
1.1%
Other domestic
entities
1.9%
Foreign entities
1.0%
Unit holders RatioInvestmentunits (unit)
Ratio
Individuals and others 12,308 95.9% 79,446 13.2%
Financial institutions(including securities companies)
147 1.1% 409,894 68.3%
Other domestic entities
249 1.9% 46,243 7.7%
Foreign entities 128 1.0% 64,544 10.8%
Total 12,832 100.0% 600,127 100.0%
NameNo. of
units held
Percentage of units
issued and outstanding
1 Custody Bank of Japan, Ltd. (Trust Account) 96,998 16.16%
2The Master Trust Bank of Japan, Ltd. (Trust Account)
78,090 13.01%
3Custody Bank of Japan, Ltd. (Securities Investment Trust Account)
45,372 7.56%
4 ITOCHU Corporation 33,635 5.60%
5The Nomura Trust and Banking Co., Ltd.(Investment Trust)
23,720 3.95%
6 The Shinkumi Federation Bank 12,999 2.16%
7 The Hachijuni Bank, Ltd. 10,568 1.76%
8 AICHI BANK, LTD. 10,290 1.71%
9Custody Bank of Japan, Ltd. (Money Trust Tax Account)
9,476 1.57%
10 THE HYAKUJUSHI BANK, LTD. 8,500 1.41%
Total (Top 10 unitholders) 329,648 54.92%
Individuals and
others
13.2%
Financial
institutions
68.3%
Other domestic
entities
7.7%
Foreign entities
10.8%
Breakdown by number of unitholders Breakdown by number of units
※ Percentages are rounded down to the second decimal place.
6th Fiscal Period (Jul. 2021)
36
Disclaimer
This material is for informational purpose only, and is not intended to solicit, or recommend the purchase or sale of specific securities, financial instruments, or transactions.
This document is not a disclosure document based on the Financial Instruments and Exchange Act, the Act on Investment Trusts and Investment Corporations, or the listing rules of the Tokyo Stock Exchange.
This document contains information on ITOCHU Advanced Logistics Investment Corporation (hereinafter referred to as "the Investment Corporation".), as well as tables and data prepared by ITOCHU REIT MANAGEMENT CORPORATION (hereinafter referred to as "Asset Management Company".) based on data and indicators published by third parties. It also includes statementsregarding the Asset Management Company's current analysis, judgment, and other views on these matters.
Given that the content of this document is unaudited, there are no guarantees provided with respect to its accuracy, completeness, fairness or reliability. In addition, anything other than the analysis and judgment of the Asset Management Company and any other past or current facts indicates assumptions or judgments based on the information obtained by the Asset Management Company at the time of preparation of this document, and descriptions of these future projections include known and unknown risks anduncertainties. As a result, the actual results, operating results, and financial position of the Investment Corporation may differ from those forecasted by the Investment Corporation and the Asset Management Company.
Figures may not correspond to those of other disclosed information due to differences in rounding.
All efforts have been made to ensure that the information included in this document is accurate, but errors may have occurred and may be corrected or modified without a prior notice.
The Investment Corporation and the Asset Management Company are not in any way liable for the accuracy or completeness of any data or indicators used in this document based on disclosures from third parties.
These materials include statements regarding future policies of the Investment Corporation, but provide no guarantees of the future policies.
For convenience of preparation of charts and data by the Asset Management Company, dates indicated in this document may not be business days.
37
Ticker Symbol: 3493
ITOCHU Advance Logistics Investment Corporation
Contact
Asset management company
ITOCHU REIT Management Co., Ltd.Finance & Planning Department
TEL 0120-300-780
Business hours
11:00 - 15:30 (Excluding weekends, national holidays, and days off at the end and beginning of the year)*11:00 - 15:00 on December 29 and 30 (In the case of business day)*We are currently adopting staggered working hours to deal with the COVID-19, so our business hours will be shortened.
Address 3-6-5 Kojimachi, Chiyoda-ku, Tokyo 102-0083, Japan